11 VISION 01 Towards a Sustainable Future S CAG has prepared and adopted Regional Transportation Plans (RTPs) since 1976. Throughout this history, SCAG has considered the RTP primarily as an investment in the six-county (Imperial, Los Angeles, Orange, Riverside, San Bernardino and Ventura) region’s mobility. The RTP identifies infrastructure projects and improvements in order to reduce traffic and generally make it easier to get around. As the process has evolved and RTPs have been updated, we have gradually broadened our viewpoint, particularly by elevating air quality considerations in the plan. This evolution has now culminated in the 2012 Regional Transportation Plan/Sustainable Communities Strategy (RTP/SCS), which has mobility as an important component of a much larger picture that incorporates added emphasis on sustainability and integrated planning. The vision for the 2012 RTP/SCS encompasses three principles as the key to our region’s future: mobility, economy, and sustainability. The RTP/SCS is an investment in the region’s future well-being through 2035. It contains projects, policies, and strategies that will achieve a range of positive outcomes when implemented. In one sense, the RTP is an accounting of revenues and expenditures. It identifies our available and reasonably foreseeable sources of funding, and directs that funding to multi-modal transportation projects that benefit our communities. The RTP/ SCS strategies and policies are designed to assure that, to the greatest extent possible, the money we invest has the best chance of achieving our shared objectives. In a broader sense, the RTP/SCS is a blueprint for improving the quality of life for our residents by making the best transportation and land-use choices for the future and supporting those choices with wise investments. The RTP/SCS will result in more and better travel choices as well as safe, secure, and efficient transportation systems that provide improved access to opportunities, such as jobs, education, and healthcare for our residents. Furthermore, the RTP/SCS will create jobs, ensure our region’s economic com- petitiveness through strategic investments in our goods movement system, and improve environmental and health outcomes for 22 million residents by 2035. Our Vision – Mobility, Economy, Sustainability Our vision is built upon themes regional leaders discussed at the 2011 General Assembly. The vision has been further shaped by an unprecedented level of outreach and direct Image courtesy of Metro © 2011 LACMTA

Welcome message from author
This document is posted to help you gain knowledge. Please leave a comment to let me know what you think about it! Share it to your friends and learn new things together.
Transcript

11
01. Vision01Towards a sustainable Future
SCAG has prepared and adopted Regional Transportation Plans (RTPs) since 1976. Throughout this history, SCAG has considered the RTP primarily as an investment in the six-county (Imperial, Los Angeles, Orange, Riverside, San Bernardino and
Ventura) region’s mobility. The RTP identifies infrastructure projects and improvements in order to reduce traffic and generally make it easier to get around. As the process has evolved and RTPs have been updated, we have gradually broadened our viewpoint, particularly by elevating air quality considerations in the plan. This evolution has now culminated in the 2012 Regional Transportation Plan/Sustainable Communities Strategy (RTP/SCS), which has mobility as an important component of a much larger picture that incorporates added emphasis on sustainability and integrated planning. The vision for the 2012 RTP/SCS encompasses three principles as the key to our region’s future: mobility, economy, and sustainability.
The RTP/SCS is an investment in the region’s future well-being through 2035. It contains projects, policies, and strategies that will achieve a range of positive outcomes when implemented. In one sense, the RTP is an accounting of revenues and expenditures. It identifies our available and reasonably foreseeable sources of funding, and directs that funding to multi-modal transportation projects that benefit our communities. The RTP/SCS strategies and policies are designed to assure that, to the greatest extent possible, the money we invest has the best chance of achieving our shared objectives.
In a broader sense, the RTP/SCS is a blueprint for improving the quality of life for our residents by making the best transportation and land-use choices for the future and supporting those choices with wise investments. The RTP/SCS will result in more and better travel choices as well as safe, secure, and efficient transportation systems that provide improved access to opportunities, such as jobs, education, and healthcare for our residents. Furthermore, the RTP/SCS will create jobs, ensure our region’s economic com-petitiveness through strategic investments in our goods movement system, and improve environmental and health outcomes for 22 million residents by 2035.
our Vision – Mobility, Economy, sustainabilityOur vision is built upon themes regional leaders discussed at the 2011 General Assembly. The vision has been further shaped by an unprecedented level of outreach and direct Image courtesy of Metro © 2011 LACMTA
12 2012 Regional Transportation Plan | Vision
engagement with stakeholders. For example, the public workshops held through the summer of 2011 gathered distinct feedback from a wide range of stakeholders on objec-tives for this plan. Taking all input into account, the 2012 RTP/SCS sets forth a vision to advance Southern California’s mobility, economy and sustainability through 2035.
MobiliTy
A successful transportation plan allows the residents of the region to access daily needs, including work, school, shopping, and recreation, without undue burdens of cost, time, or physical danger. This includes the pressing need to preserve and maintain our infrastruc-ture at adequate levels. Residents should be able to rely on their ability to get from one place in the region to another in a safe and timely manner. They should be able to choose from a variety of transportation modes that suit their preferences and needs, including active, non-motorized modes such as biking and walking that allow for physical activity and greater health.
EconoMy
A successful RTP creates opportunities for business, investment, and employment in Southern California. This plan does so by proposing over $500 billion of investment in the next 25 years. This constitutes the largest regional-scale infrastructure jobs program in Southern California’s history. This will put thousands of Southern Californians back to work in much needed jobs, not only in construction, but also in a broad cross-section of industry clusters. Over the twenty-five year period, the plan will generate 4.2 million jobs in the six county region. This represents the direct economic effect of designing, building and maintaining projects, as well as the indirect and induced benefits of the investments.
Moreover, the economic benefits of the RTP/SCS are likely far broader and greater. The recommended investments and strategies in the draft RTP/SCS set the conditions for economic activity in the region by improving mobility and reducing congestion and com-mute times, allowing businesses in the region to operate more efficiently and maintain their competitiveness. The plan does so by addressing the needs for logistics, shipping,
distribution, and goods movement in the region—a key component of the Southern California Economic Recovery and Job Creation Strategy adopted by the Regional Council in June 2011. These investments not only serve local businesses, but allow the region to further capitalize on its unique position as a center for international trade. Also, through the integration of regional housing policy, residents will have better access to afford-able housing in all communities, and residents will have lower overall combined costs for housing and transportation. In more subtle ways, the RTP/SCS encourages continued investment and job creation by ensuring a more livable, efficient, desirable, and competi-tive region where employers want and are able to do business over the long-term.
susTainabiliTy
The RTP/SCS is subject to specific requirements for environmental performance. The strategies and projects identified in the following chapters satisfy those requirements. However, this RTP will only be successful if we define sustainability in the broadest man-ner possible. A successful RTP/SCS allows future residents to enjoy a better quality of life than we do today, including the ability to lead a healthy lifestyle enjoying clean air and water and ample opportunities for recreation and physical activity. It will have direct and substantial benefits to public health by reducing pollutant emissions and expanding the opportunities for active transportation. It also demonstrates how we can transition from things we know to be unsustainable—such as reliance on fossil fuels—to new technolo-gies for the future. Finally, a successful RTP establishes how we preserve what makes the region special, including our stable and successful neighborhoods and our array of open spaces for future generations to enjoy.
2012 Regional Transportation Plan | Vision 13
Realizing the Vision – Goals and objectivesDeveloping the RTP/SCS is no simple task, particularly given the economic struggles we are facing today. Transportation funds are limited for sustaining our existing system and the regional initiatives that reduce pollution and congestion while increasing mobility and economic development require more money. Cities, businesses and taxpayers are coping with an acute economic struggle. We are also a large region with a diversity of views and a diffuse decision-making structure. Nevertheless, the RTP/SCS provides an opportunity to set a course for 2035 that not only accomplishes what we are required to do, but also delivers a future that benefits residents, cities, and businesses.
In crafting a plan to address these challenges, SCAG and the region have several advan-tages. These include our local commitments to dramatically increase the reach of transit, on-going progress in creating new voluntary templates for growth and development, and our existing rich and vibrant neighborhoods. Our ability to succeed will also be the result of layering projects, programs, and strategies that leverage each other to achieve better results.
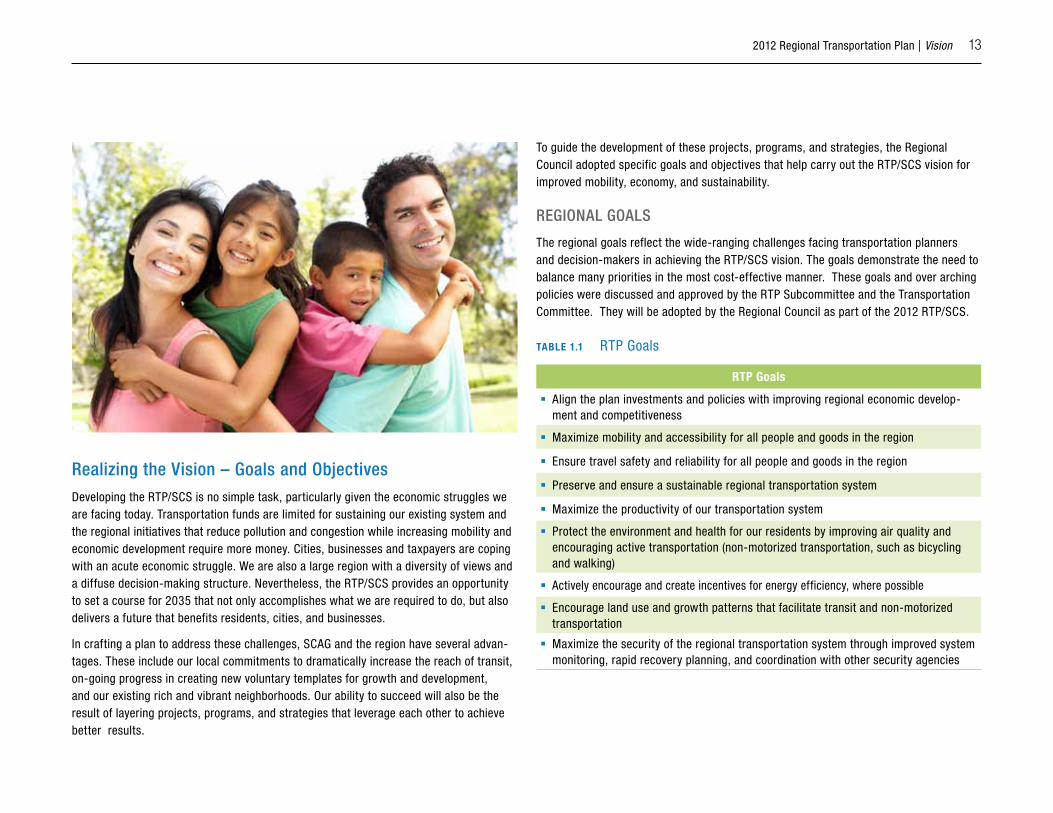
To guide the development of these projects, programs, and strategies, the Regional Council adopted specific goals and objectives that help carry out the RTP/SCS vision for improved mobility, economy, and sustainability.
REGional Goals
The regional goals reflect the wide-ranging challenges facing transportation planners and decision-makers in achieving the RTP/SCS vision. The goals demonstrate the need to balance many priorities in the most cost-effective manner. These goals and over arching policies were discussed and approved by the RTP Subcommittee and the Transportation Committee. They will be adopted by the Regional Council as part of the 2012 RTP/SCS.
Table 1.1 RTP Goals
RTP Goals
Align the plan investments and policies with improving regional economic develop-ment and competitiveness
Maximize mobility and accessibility for all people and goods in the region
Ensure travel safety and reliability for all people and goods in the region
Preserve and ensure a sustainable regional transportation system
Maximize the productivity of our transportation system
Protect the environment and health for our residents by improving air quality and encouraging active transportation (non-motorized transportation, such as bicycling and walking)
Actively encourage and create incentives for energy efficiency, where possible
Encourage land use and growth patterns that facilitate transit and non-motorized transportation
Maximize the security of the regional transportation system through improved system monitoring, rapid recovery planning, and coordination with other security agencies

14
exhibiT 1.1 SCAG Region
2012 Regional Transportation Plan | Vision 15
RTP GuidinG PoliciEs
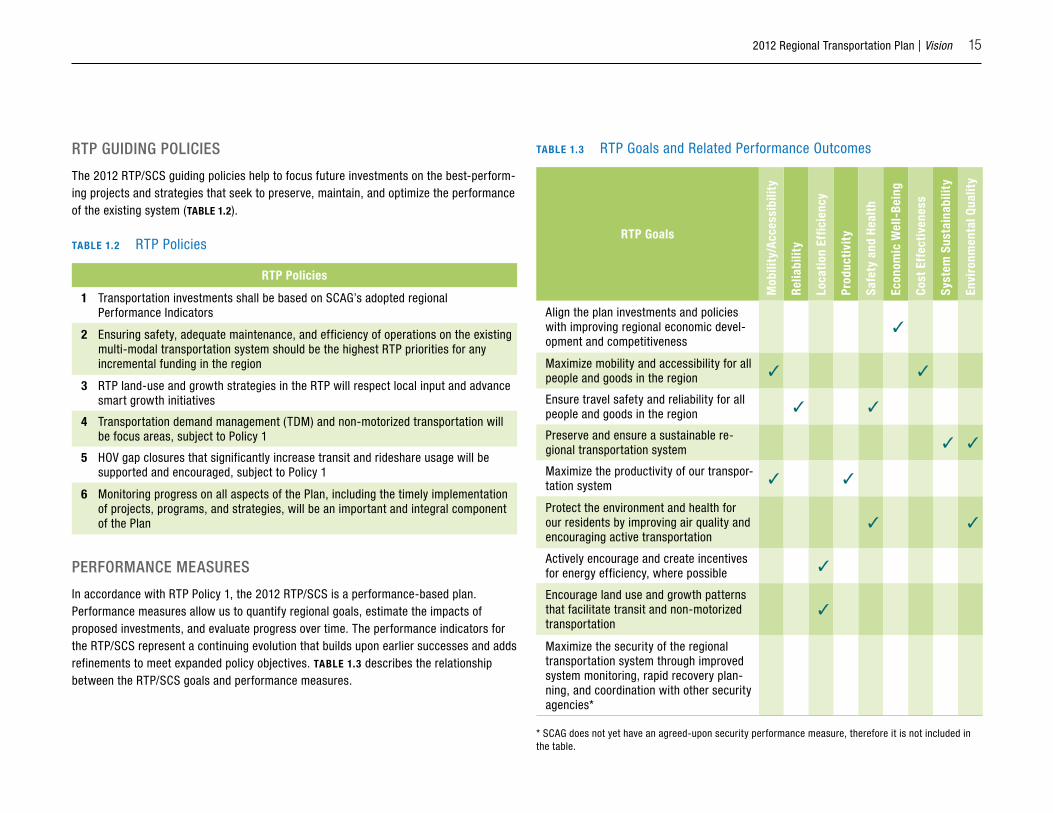
The 2012 RTP/SCS guiding policies help to focus future investments on the best-perform-ing projects and strategies that seek to preserve, maintain, and optimize the performance of the existing system (Table 1.2).
Table 1.2 RTP Policies
RTP Policies
1 Transportation investments shall be based on SCAG’s adopted regional Performance Indicators
2
Ensuring safety, adequate maintenance, and efficiency of operations on the existing multi-modal transportation system should be the highest RTP priorities for any incremental funding in the region
3 RTP land-use and growth strategies in the RTP will respect local input and advance smart growth initiatives
4 Transportation demand management (TDM) and non-motorized transportation will be focus areas, subject to Policy 1
5 HOV gap closures that significantly increase transit and rideshare usage will be supported and encouraged, subject to Policy 1
6
Monitoring progress on all aspects of the Plan, including the timely implementation of projects, programs, and strategies, will be an important and integral component of the Plan
PERFoRMancE MEasuREs
In accordance with RTP Policy 1, the 2012 RTP/SCS is a performance-based plan. Performance measures allow us to quantify regional goals, estimate the impacts of proposed investments, and evaluate progress over time. The performance indicators for the RTP/SCS represent a continuing evolution that builds upon earlier successes and adds refinements to meet expanded policy objectives. Table 1.3 describes the relationship between the RTP/SCS goals and performance measures.
Table 1.3 RTP Goals and Related Performance Outcomes
RTP Goals
Mob
ility
/acc
essi
bilit
y
Relia
bilit
y
loca
tion
eff
icie
ncy
Prod
ucti
vity
Safe
ty a
nd h
ealt
h
econ
omic
Wel
l-be
ing
Cost
eff
ecti
vene
ss
Syst
em S
usta
inab
ility
envi
ronm
enta
l Qua
lity
Align the plan investments and policies with improving regional economic devel-opment and competitiveness
✓
Maximize mobility and accessibility for all people and goods in the region ✓ ✓
Ensure travel safety and reliability for all people and goods in the region ✓ ✓
Preserve and ensure a sustainable re-gional transportation system ✓ ✓
Maximize the productivity of our transpor-tation system ✓ ✓
Protect the environment and health for our residents by improving air quality and encouraging active transportation
✓ ✓
Actively encourage and create incentives for energy efficiency, where possible ✓
Encourage land use and growth patterns that facilitate transit and non-motorized transportation
✓
Maximize the security of the regional transportation system through improved system monitoring, rapid recovery plan-ning, and coordination with other security agencies*
* SCAG does not yet have an agreed-upon security performance measure, therefore it is not included in the table.
16 2012 Regional Transportation Plan | Vision
The settingThe 2012 RTP/SCS vision was developed by taking into account recent events and long-term trends. This includes the Great Recession and its aftermath, continuing growth in population and demand on the transportation system, and a growing expectation by planners, policy-makers, and the general public that a comprehensive and integrated approach to addressing the region’s transportation issues is needed. This setting provides the backdrop for the challenges and opportunities facing the region.
Economic RecessionApproximately 800,000 jobs have been lost in the region due to the continuing economic downturn. This could have a long-term effect on where and how people choose to live, work, and play. It could also impact people’s travel behavior, including mode choice and travel patterns, potentially requiring different types of transportation solutions. This downturn may also provide an opportunity to plan a more comprehensive approach for leveraging our infrastructure investments to improve the region’s economic competitive-ness and to create much-needed jobs by expediting project delivery through innovative financing. This is an opportunity to put more people to work sooner.
Without the projects and strategies in the RTP/SCS, the region would fail to meet critical investment needs, increasing congestion and travel time delay to the detriment of our economy. By doing nothing, the SCAG region would forego approximately $580 billion in Gross Regional Product (GRP) through 2035. To compete effectively in the global economy, we must invest strategically in our transportation infrastructure, while ensuring that we obtain the maximum return on investment. SCAG’s analysis also indicates that every 10 percent decrease in congestion is associated with an employment increase of approximately 132,000 jobs. Congestion relief will be a major contributing factor to our future employment growth.
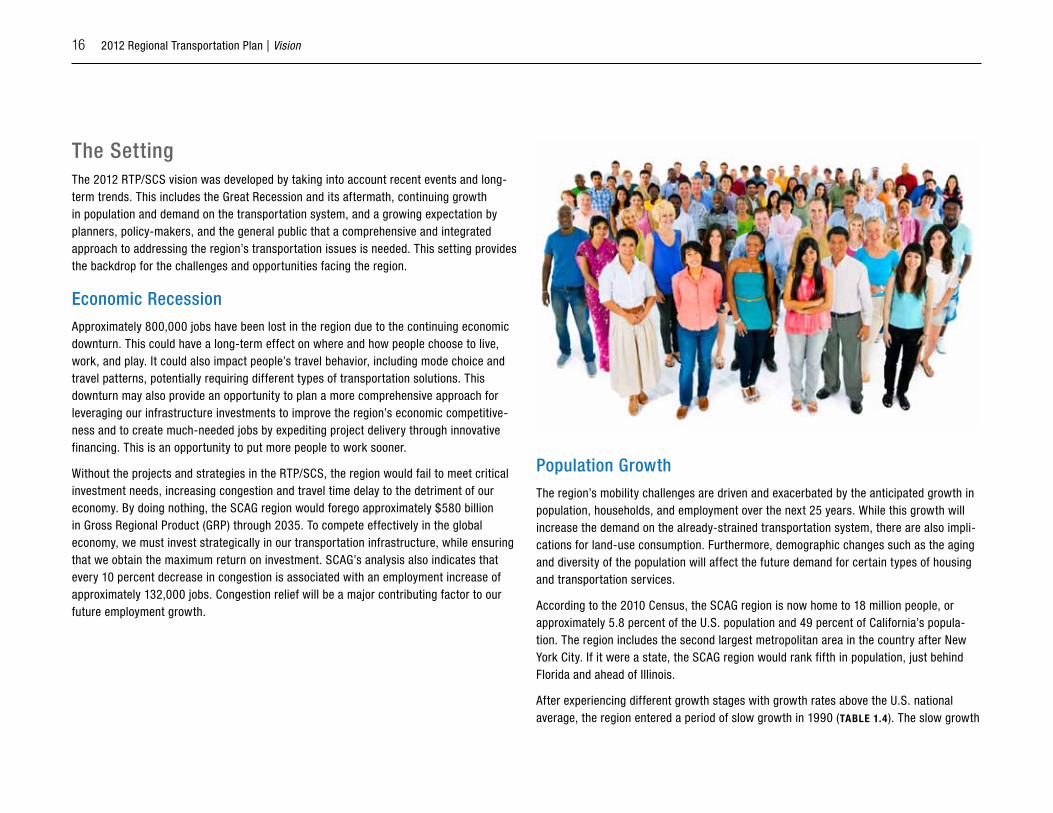
Population GrowthThe region’s mobility challenges are driven and exacerbated by the anticipated growth in population, households, and employment over the next 25 years. While this growth will increase the demand on the already-strained transportation system, there are also impli-cations for land-use consumption. Furthermore, demographic changes such as the aging and diversity of the population will affect the future demand for certain types of housing and transportation services.
According to the 2010 Census, the SCAG region is now home to 18 million people, or approximately 5.8 percent of the U.S. population and 49 percent of California’s popula-tion. The region includes the second largest metropolitan area in the country after New York City. If it were a state, the SCAG region would rank fifth in population, just behind Florida and ahead of Illinois.
After experiencing different growth stages with growth rates above the U.S. national average, the region entered a period of slow growth in 1990 (Table 1.4). The slow growth

2012 Regional Transportation Plan | Vision 17
period (1990–2010) represents the mature stage of regional growth and urbanization, during which the region added 3.4 million people and grew at a rate comparable to that for both the state and the nation. The growth was a result of natural increase (adding 3.56 million) and net migration (subtracting 130,000).
Table 1.4 Annual Average Growth Rate of the SCAG Region During Growth Periods (1850–2010)
Very Rapid Growth
1850–1910
Rapid Growth
1910–1960
average Growth
1960–1990
Slow Growth
1990–2010
SCAG region 311.0% 21.6% 2.9% 1.2%
California 41.1% 11.2% 3.0% 1.3%
United States 5.0% 1.9% 1.3% 1.2%
Source: U.S. Census, 1850–2010
Migration and population growth is affected by the economy. While economic growth is typically a major source of net domestic and international migration, in a similar fashion, economic downturns can also have a serious impact on the region’s growth. Although the Great Recession officially ended in 2009, the region is still struggling to get back to pre-recession levels. The stability of future growth depends in part on how the region successfully addresses these economic challenges.
Although the rate of regional growth has stabilized in the last 20 years, urbanization and suburbanization of the region has continued (Table 1.5). The suburban inland counties of Riverside and San Bernardino together accounted for 23.4 percent of the region’s popula-tion in 2010, up from 17.7 percent in 1990. Over this same period, Los Angeles County grew more slowly and its share of the region’s population declined from 60.5 percent in 1990 to 54.4 percent in 2010. The fast growth of population relative to employment in Riverside and San Bernardino Counties highlights the imbalance of jobs and housing in
the region. It also poses a serious transportation and air quality challenge to local and regional planners.
Table 1.5 County Share of Regional Population (1990–2010)
County 1990 2000 2010
Imperial 109 0.7% 142 0.9% 175 1.0%
Los Angeles 8,863 60.5% 9,519 57.6% 9,819 54.4%
Orange 2,411 16.5% 2,846 17.2% 3,010 16.7%
Riverside 1,170 8.0% 1,545 9.4% 2,190 12.1%
San Bernardino 1,418 9.7% 1,709 10.4% 2,035 11.3%
Ventura 669 4.6% 753 4.6% 823 4.6%
SCaG Total 14,641 100.0% 16,516 100.0% 18,052 100.0%
Population in thousands; numbers may not add due to rounding.Source: SCAG

18 2012 Regional Transportation Plan | Vision
Although the latest 2010 Census data indicates slower growth in population, households and employment than forecasted in the 2008 RTP, the region is still expected to grow over the RTP planning period—adding four million new residents by 2035 (FiGuRe 1.1). The projected annual growth rate is only 0.9 percent, lower than the past 20-year growth rate. Most of this growth is through natural increase.
The aging of the population is one of the major demographic changes expected in the region. With the aging of the Baby Boomer generation (those born between 1946 and 1964), the median age of the population will increase from 34.2 years in 2010 to 36.6 years in 2035. The share of the population 65 years or older will increase from 11 percent in 2010 to 18 percent in 2035. Meanwhile, the working-age population (ages 16 to 64 years) will sharply decline, implying a future shortage in the regional labor force and a sharp increase in the old-age dependency ratio from 17 percent in 2010 to 30 percent in 2035.
FiGuRe 1.1 Projection of Population, Household, and Employment Growth (2008–2035)
0
5
10
15
20
25
Population Employment Households
Millions
2008 2035
Source: SCAG
Another major demographic trend is the growing racial and ethnic diversity of the popula-tion. The region’s diversity was already high in 2010, with 45 percent of the population Hispanic, 34 percent non-Hispanic White, 14 percent non-Hispanic Asian, and 7 percent non-Hispanic Black. By 2035, there will be a majority Hispanic population (56 percent) while the non-Hispanic White population will drop to 22 percent.
Economic recessions and globalization of the economy were major factors contributing to slow growth in the region over the past 20 years. However, employment in the region is still expected to increase over the RTP period from 7.2 million jobs in 2010 to 9.4 million in 2035. This is an annual rate of over 1 percent. From a longer term perspective, the region is expected to recover fully from the recession and return to reasonable labor force participation rates and unemployment levels. But, the region’s industrial mix will experi-ence continuous change over time due to globalization. The region will also transform its industrial structure from a manufacturing-oriented industry to a service-oriented industry.
safetyThe safety of people and goods is one of the most important considerations in develop-ing, maintaining and operating our multi-modal transportation system. This section briefly describes the trends in accidents on our transportation system.
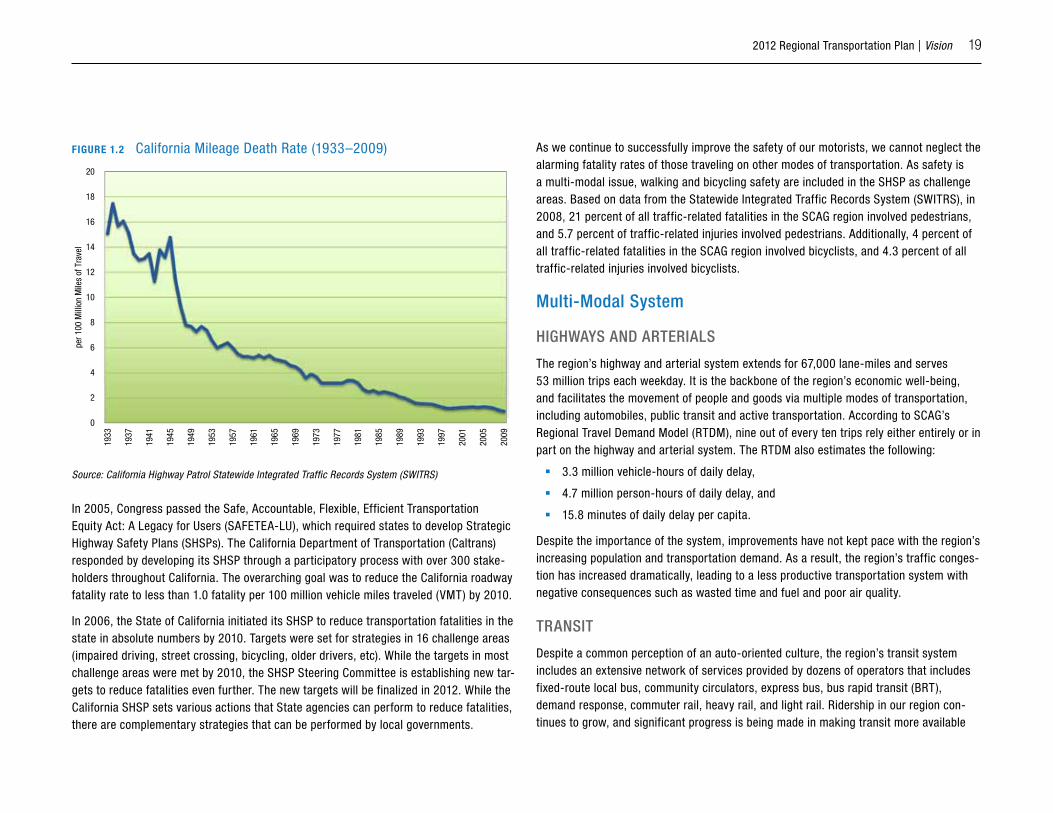
The rate of fatal and injury collisions on California’s highways has declined dramatically since the California Highway Patrol began keeping such data in the 1930s (FiGuRe 1.2). California has led the nation in roadway safety for much of the past 20 years. Only recently have roadways nationally become as safe as those in California. California’s 2008 Mileage Death Rate (MDR) – fatalities per 100 million vehicle miles traveled (VMT) – is 1.05, much lower than the national MDR of 1.25.
The SCAG region has an extensive transportation system with about 67,000 freeway and arterial lane-miles. The region had 11.1 million licensed drivers and 13.4 million regis-tered vehicles in 2008. The same year, over two million people rode public transit daily. Unfortunately, 1,533 people died and 124,975 were injured in traffic collisions in the SCAG region.
2012 Regional Transportation Plan | Vision 19
FiGuRe 1.2 California Mileage Death Rate (1933–2009)
0
2
4
6
8
10
12
14
16
18
20
1933
1937
1941
1945
1949
1953
1957
1961
1965
1969
1973
1977
1981
1985
1989
1993
1997
2001
2005
2009
per 1
00 M
illio
n M
iles
of T
rave
l
Source: California Highway Patrol Statewide Integrated Traffic Records System (SWITRS)
In 2005, Congress passed the Safe, Accountable, Flexible, Efficient Transportation Equity Act: A Legacy for Users (SAFETEA-LU), which required states to develop Strategic Highway Safety Plans (SHSPs). The California Department of Transportation (Caltrans) responded by developing its SHSP through a participatory process with over 300 stake-holders throughout California. The overarching goal was to reduce the California roadway fatality rate to less than 1.0 fatality per 100 million vehicle miles traveled (VMT) by 2010.
In 2006, the State of California initiated its SHSP to reduce transportation fatalities in the state in absolute numbers by 2010. Targets were set for strategies in 16 challenge areas (impaired driving, street crossing, bicycling, older drivers, etc). While the targets in most challenge areas were met by 2010, the SHSP Steering Committee is establishing new tar-gets to reduce fatalities even further. The new targets will be finalized in 2012. While the California SHSP sets various actions that State agencies can perform to reduce fatalities, there are complementary strategies that can be performed by local governments.
As we continue to successfully improve the safety of our motorists, we cannot neglect the alarming fatality rates of those traveling on other modes of transportation. As safety is a multi-modal issue, walking and bicycling safety are included in the SHSP as challenge areas. Based on data from the Statewide Integrated Traffic Records System (SWITRS), in 2008, 21 percent of all traffic-related fatalities in the SCAG region involved pedestrians, and 5.7 percent of traffic-related injuries involved pedestrians. Additionally, 4 percent of all traffic-related fatalities in the SCAG region involved bicyclists, and 4.3 percent of all traffic-related injuries involved bicyclists.
Multi-Modal system
HiGHWays and aRTERials
The region’s highway and arterial system extends for 67,000 lane-miles and serves 53 million trips each weekday. It is the backbone of the region’s economic well-being, and facilitates the movement of people and goods via multiple modes of transportation, including automobiles, public transit and active transportation. According to SCAG’s Regional Travel Demand Model (RTDM), nine out of every ten trips rely either entirely or in part on the highway and arterial system. The RTDM also estimates the following:
3.3 million vehicle-hours of daily delay,
4.7 million person-hours of daily delay, and
15.8 minutes of daily delay per capita.
Despite the importance of the system, improvements have not kept pace with the region’s increasing population and transportation demand. As a result, the region’s traffic conges-tion has increased dramatically, leading to a less productive transportation system with negative consequences such as wasted time and fuel and poor air quality.
TRansiT
Despite a common perception of an auto-oriented culture, the region’s transit system includes an extensive network of services provided by dozens of operators that includes fixed-route local bus, community circulators, express bus, bus rapid transit (BRT), demand response, commuter rail, heavy rail, and light rail. Ridership in our region con-tinues to grow, and significant progress is being made in making transit more available
20 2012 Regional Transportation Plan | Vision
and attractive by virtue of a burgeoning rail network, transit-oriented development (TOD), and other service improvements. Between 2000 and 2008, bus ridership increased by 17 percent, and urban rail ridership increased by 50 percent. Furthermore, there was an 81 percent growth in Metrolink ridership. Table 1.6 depicts rail ridership by passenger boardings and passenger miles for 2000 and 2008.
Table 1.6 Urban Rail Ridership
urban Rail Operators 2000 2008 Difference
Metro Subway
Passenger Boardings 27,957,650 43,584,566 56%
Passenger Miles 74,729,093 217,964,955 192%
Metro light Rail
Passenger Boardings 29,859,558 43,122,565 44%
Passenger Miles 208,824,385 306,848,462 47%
Metrolink
Passenger Boardings 6,978,588 12,680,973 82%
Passenger Miles 256,386,730 436,565,493 70% Source: 2000 & 2008 National Transit Database
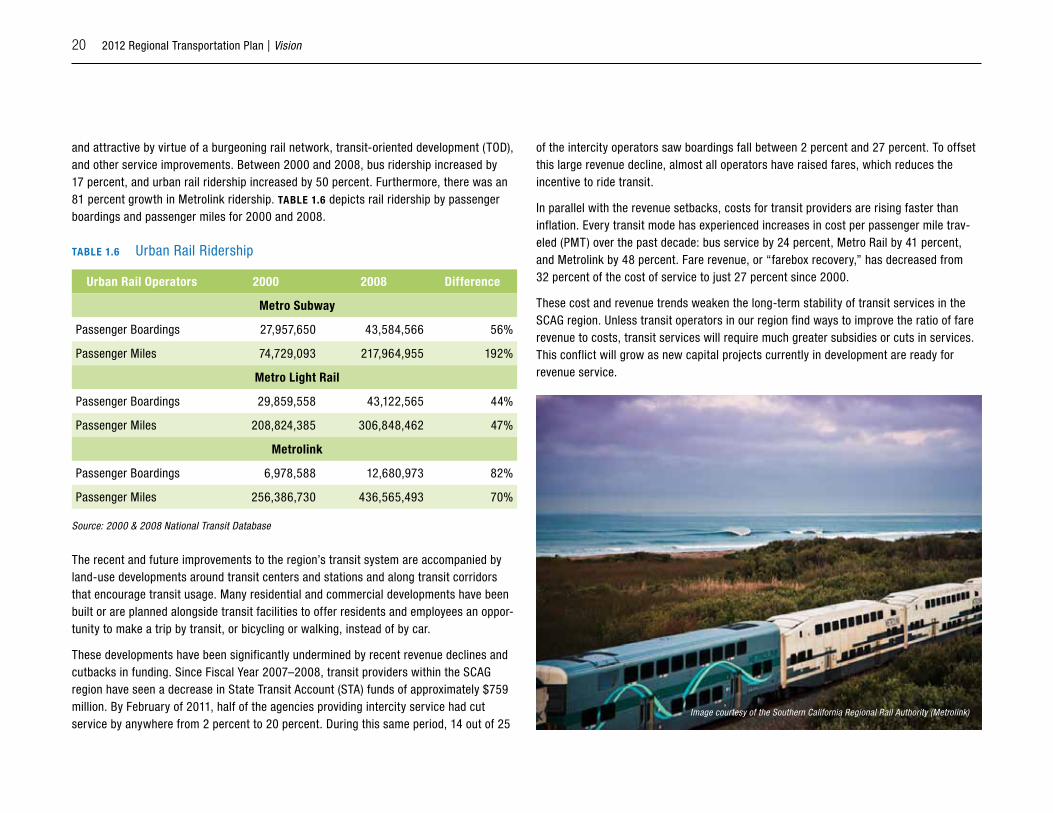
The recent and future improvements to the region’s transit system are accompanied by land-use developments around transit centers and stations and along transit corridors that encourage transit usage. Many residential and commercial developments have been built or are planned alongside transit facilities to offer residents and employees an oppor-tunity to make a trip by transit, or bicycling or walking, instead of by car.
These developments have been significantly undermined by recent revenue declines and cutbacks in funding. Since Fiscal Year 2007–2008, transit providers within the SCAG region have seen a decrease in State Transit Account (STA) funds of approximately $759 million. By February of 2011, half of the agencies providing intercity service had cut service by anywhere from 2 percent to 20 percent. During this same period, 14 out of 25
of the intercity operators saw boardings fall between 2 percent and 27 percent. To offset this large revenue decline, almost all operators have raised fares, which reduces the incentive to ride transit.
In parallel with the revenue setbacks, costs for transit providers are rising faster than inflation. Every transit mode has experienced increases in cost per passenger mile trav-eled (PMT) over the past decade: bus service by 24 percent, Metro Rail by 41 percent, and Metrolink by 48 percent. Fare revenue, or “farebox recovery,” has decreased from 32 percent of the cost of service to just 27 percent since 2000.
These cost and revenue trends weaken the long-term stability of transit services in the SCAG region. Unless transit operators in our region find ways to improve the ratio of fare revenue to costs, transit services will require much greater subsidies or cuts in services. This conflict will grow as new capital projects currently in development are ready for revenue service.
Image courtesy of the Southern California Regional Rail Authority (Metrolink)
2012 Regional Transportation Plan | Vision 21
PassEnGER and HiGH sPEEd Rail
The SCAG region is served by a network of intercity passenger and commuter rail ser-vices which operate on the region’s rail network, often sharing facilities with freight rail. They operate at higher speeds and have less frequent station stops than traditional transit services, and are more likely to serve intercity and interregional trips.
Amtrak operates interregional and intercity passenger rail service. Four of Amtrak’s fifteen long distance routes serve our region, and of these, only two offer daily service. Amtrak provides much more frequent intercity passenger rail service via the Pacific Surfliner. This 351-mile-long service traverses the Los Angeles-San Diego-San Luis Obispo (LOSSAN) corridor. Amtrak’s Pacific Surfliner is the second most-used service in Amtrak’s national fleet, moving nearly 9 percent of the system’s total national ridership. Pacific Surfliner ridership is growing at a rate over 8 percent a year.
The Southern California Regional Rail Authority (Metrolink) is the sole operator of the Metrolink system, which serves primarily as a commuter rail service in our region. Metrolink provides service on 512 track miles along seven routes in Ventura, Orange, Los Angeles, San Bernardino, Riverside and San Diego Counties. Four routes (i.e., the Ventura County Line, the Orange County Line, the Inland Empire/Orange County Line, and the SR-91 Line) share portions of the LOSSAN Corridor with the Pacific Surfliner.
Metrolink has recently been pursuing innovative marketing, ticket pricing and operations strategies to increase ridership and reduce costs. In May 2011, Metrolink started express service demonstration programs on its San Bernardino and Antelope Valley lines. This service shaves a large amount of time off conventional trips. By skipping most stops, travel time is reduced 33 percent to just one hour on the San Bernardino line, and 25 per-cent to an hour-and-a-half on the Antelope Valley line. Metrolink has also started specific trains for Dodgers’ and Angels’ games, as well as other special events.
Despite these services, fast and efficient interregional and intercity ground transportation remains an issue within our region. One potential solution is high-speed rail. In November of 2008, California voters passed Proposition 1A, authorizing nearly $9 billion in bonds to build a statewide High Speed Train (HST) system and additional $950 million to upgrade connectivity of current rail services to the proposed HST. Subsequently, the federal government committed $3.6 billion through the American Recovery and Reinvestment Act (ARRA) of 2009. Phase I of the HST program will connect San Francisco with Los Angeles
and Anaheim and include several intermediate stops. Phase I is expected to be imple-mented during the RTP timeframe. Phase II will add connections to Sacramento, Ontario, Riverside, and San Diego.
The HST program presents an enormous opportunity for the state and the region, but faces significant challenges. The latest total costs for Phase I are estimated at $98.5 billion, and the State has secured only $12.6 billion in funds for Phase I to date. The California High-Speed Rail Authority, in partnership with the Federal Railroad Administration (FRA), has chosen to begin construction in the San Joaquin Valley, using federal High-Speed and Intercity Passenger Rail funds.
Due to the federal mandate of building the initial operating segment in the San Joaquin Valley, many local stakeholders are seeking to divert Proposition 1A revenues to fund and construct improvements to the LOSSAN and Metrolink corridors. This would provide faster speeds and better service to our region sooner, and act as a phased high-speed rail implementation. Once the high-speed train is built, three different rail passenger markets will be served through complementary systems.
acTiVE TRansPoRTaTion
Active transportation (e.g., bicycling and walking) are essential and increasingly important modes of transportation. These non-motorized modes are low-cost, do not emit green-house gases, help reduce roadway congestion, and increase health and the quality of life. As the region works towards reducing congestion and air pollution, walking and bicycling will become more essential to meet the future needs of our residents.
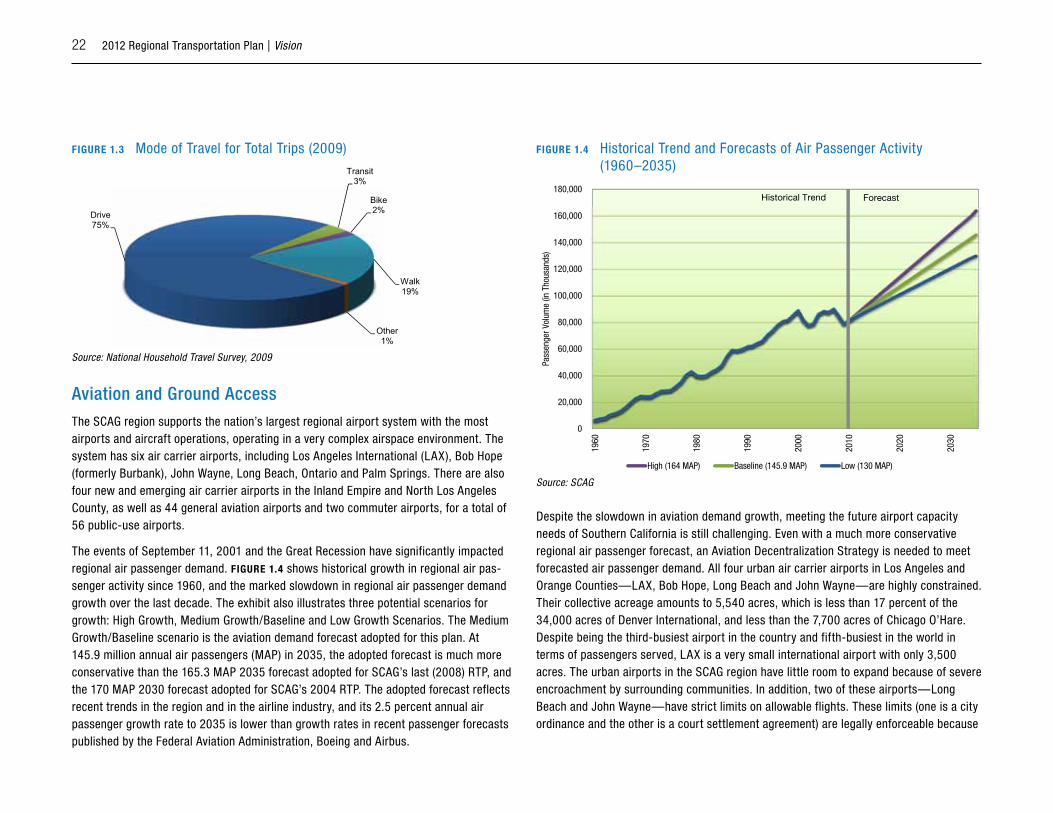
National Household Travel Survey (NHTS) data indicate that approximately 21 percent of all trips in the region in 2009 were conducted by walking (19 percent) or bicycling (2 percent), representing an approximately 75 percent increase from the 12 percent active transportation mode share in 2000 (FiGuRe 1.3). The 2009 NHTS data also showed that there was an 11 percent decrease in driving from 84 percent to 75 percent. More active transportation has placed a greater focus on the preservation, maintenance and expan-sion of active transportation infrastructure. As the population in the SCAG region grows and matures, and as parts of the region move towards denser, mixed-use, and transit-oriented development, the demand and use of active transportation will increase.
22 2012 Regional Transportation Plan | Vision
FiGuRe 1.3 Mode of Travel for Total Trips (2009)
Drive75%
Transit3%
Bike2%
Walk19%
Other1%
Source: National Household Travel Survey, 2009
aviation and Ground accessThe SCAG region supports the nation’s largest regional airport system with the most airports and aircraft operations, operating in a very complex airspace environment. The system has six air carrier airports, including Los Angeles International (LAX), Bob Hope (formerly Burbank), John Wayne, Long Beach, Ontario and Palm Springs. There are also four new and emerging air carrier airports in the Inland Empire and North Los Angeles County, as well as 44 general aviation airports and two commuter airports, for a total of 56 public-use airports.
The events of September 11, 2001 and the Great Recession have significantly impacted regional air passenger demand. FiGuRe 1.4 shows historical growth in regional air pas-senger activity since 1960, and the marked slowdown in regional air passenger demand growth over the last decade. The exhibit also illustrates three potential scenarios for growth: High Growth, Medium Growth/Baseline and Low Growth Scenarios. The Medium Growth/Baseline scenario is the aviation demand forecast adopted for this plan. At 145.9 million annual air passengers (MAP) in 2035, the adopted forecast is much more conservative than the 165.3 MAP 2035 forecast adopted for SCAG’s last (2008) RTP, and the 170 MAP 2030 forecast adopted for SCAG’s 2004 RTP. The adopted forecast reflects recent trends in the region and in the airline industry, and its 2.5 percent annual air passenger growth rate to 2035 is lower than growth rates in recent passenger forecasts published by the Federal Aviation Administration, Boeing and Airbus.
FiGuRe 1.4 Historical Trend and Forecasts of Air Passenger Activity (1960–2035)
0
20,000
40,000
60,000
80,000
100,000
120,000
140,000
160,000
180,000
1960
1970
1980
1990
2000
2010
2020
2030
Pass
enge
r Vol
ume
(in T
hous
ands
)
High (164 MAP) Baseline (145.9 MAP) Low (130 MAP)
Historical Trend Forecast
Source: SCAG
Despite the slowdown in aviation demand growth, meeting the future airport capacity needs of Southern California is still challenging. Even with a much more conservative regional air passenger forecast, an Aviation Decentralization Strategy is needed to meet forecasted air passenger demand. All four urban air carrier airports in Los Angeles and Orange Counties—LAX, Bob Hope, Long Beach and John Wayne—are highly constrained. Their collective acreage amounts to 5,540 acres, which is less than 17 percent of the 34,000 acres of Denver International, and less than the 7,700 acres of Chicago O’Hare. Despite being the third-busiest airport in the country and fifth-busiest in the world in terms of passengers served, LAX is a very small international airport with only 3,500 acres. The urban airports in the SCAG region have little room to expand because of severe encroachment by surrounding communities. In addition, two of these airports—Long Beach and John Wayne—have strict limits on allowable flights. These limits (one is a city ordinance and the other is a court settlement agreement) are legally enforceable because

2012 Regional Transportation Plan | Vision 23
they predate the Federal Airport Noise and Capacity Act of 1990 (ANCA). Air passenger growth at LAX is also limited by a settlement agreement constraint.
The challenge of meeting future aviation demand in the SCAG region is tied to improv-ing regional airport ground access. To meet that demand, future air passengers from the urban areas of Los Angeles and Orange Counties need convenient access to available airport capacity at airports in the Inland Empire and North Los Angeles County. This chal-lenge is complicated by the fact that the regional roadway system will become increas-ingly congested and unreliable unless we are successful in implementing improvements proposed in this plan. This will require air passengers to allow more time to get to the airport to meet flights in a timely fashion. An unreliable and unpredictable airport ground access system will make it difficult to accommodate future aviation demand by fully utiliz-ing the region’s airports with available capacity. They will have higher ground access time and costs associated with them. Until they fully mature, they will have few alternative flights to offer air travelers who miss their flights because of unreliable ground access.
Southern California airports play a crucial role in international trade, particularly with Pacific Rim countries, and to the regional economy. Unless the regional airport ground access system is substantially improved, many potential air passengers will choose not to fly at all. This will translate to substantial economic loss to the region and a threat to our regional economy and well-being. A regional airport ground access strategy is therefore needed to help address the challenges posed by a highly constrained regional aviation system.
The Great Recession has had a substantial impact on airports in the regional system. Ontario Airport, for example, lost about a third of its air passenger activity from 2007 to 2010. It is in the region’s interest to help sustain and preserve airports like Ontario that have ample capacity to serve future aviation demand, until economic conditions improve and they can provide significant capacity relief to constrained urban airports in the region. The challenge is to identify how best to support the development of new air services at uncongested and unconstrained airports like Ontario, and to develop appropri-ate regional marketing strategies and economic incentives that can sustain these airports into the future.
Transportation demand ManagementTransportation Demand Management (TDM) strategies are designed to reduce conges-tion, particularly during peak periods, by managing or reducing demand on the system. This can be accomplished by a variety of strategies including increasing carpooling, supporting active transportation modes, promoting telecommuting, and shifting demand to off-peak periods. TDM strategies help to make the most efficient use of our existing resources.
The SCAG region has a long history of investing in a comprehensive High Occupancy Vehicle (HOV) lane system to support and promote carpooling. Additionally, park-and-ride facilities, rideshare matching and vanpooling services, and Guaranteed Ride Home programs support carpooling as a viable travel alternative. However, a review of Census
24 2012 Regional Transportation Plan | Vision
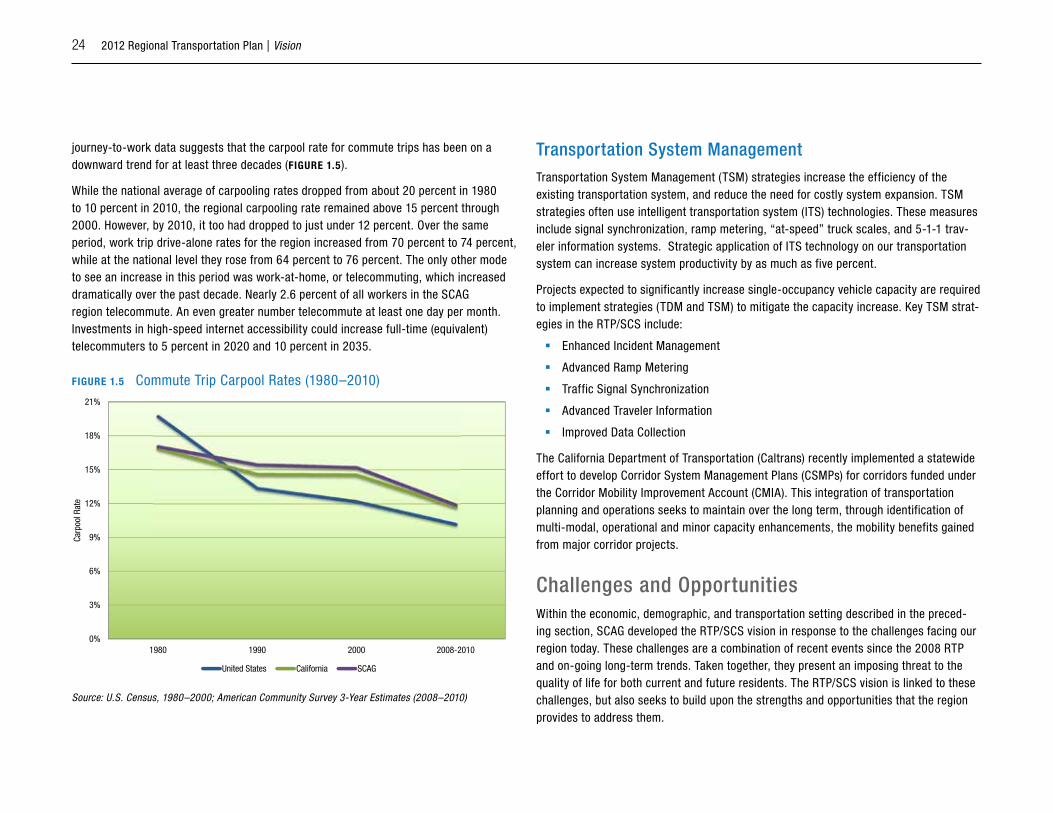
journey-to-work data suggests that the carpool rate for commute trips has been on a downward trend for at least three decades (FiGuRe 1.5).
While the national average of carpooling rates dropped from about 20 percent in 1980 to 10 percent in 2010, the regional carpooling rate remained above 15 percent through 2000. However, by 2010, it too had dropped to just under 12 percent. Over the same period, work trip drive-alone rates for the region increased from 70 percent to 74 percent, while at the national level they rose from 64 percent to 76 percent. The only other mode to see an increase in this period was work-at-home, or telecommuting, which increased dramatically over the past decade. Nearly 2.6 percent of all workers in the SCAG region telecommute. An even greater number telecommute at least one day per month. Investments in high-speed internet accessibility could increase full-time (equivalent) telecommuters to 5 percent in 2020 and 10 percent in 2035.
FiGuRe 1.5 Commute Trip Carpool Rates (1980–2010)
0%
3%
6%
9%
12%
15%
18%
21%
1980 1990 2000 2008-2010
Carp
ool R
ate
United States California SCAG
Source: U.S. Census, 1980–2000; American Community Survey 3-Year Estimates (2008–2010)
Transportation system ManagementTransportation System Management (TSM) strategies increase the efficiency of the existing transportation system, and reduce the need for costly system expansion. TSM strategies often use intelligent transportation system (ITS) technologies. These measures include signal synchronization, ramp metering, “at-speed” truck scales, and 5-1-1 trav-eler information systems. Strategic application of ITS technology on our transportation system can increase system productivity by as much as five percent.
Projects expected to significantly increase single-occupancy vehicle capacity are required to implement strategies (TDM and TSM) to mitigate the capacity increase. Key TSM strat-egies in the RTP/SCS include:
Enhanced Incident Management
Advanced Ramp Metering
Traffic Signal Synchronization
Advanced Traveler Information
Improved Data Collection
The California Department of Transportation (Caltrans) recently implemented a statewide effort to develop Corridor System Management Plans (CSMPs) for corridors funded under the Corridor Mobility Improvement Account (CMIA). This integration of transportation planning and operations seeks to maintain over the long term, through identification of multi-modal, operational and minor capacity enhancements, the mobility benefits gained from major corridor projects.
challenges and opportunitiesWithin the economic, demographic, and transportation setting described in the preced-ing section, SCAG developed the RTP/SCS vision in response to the challenges facing our region today. These challenges are a combination of recent events since the 2008 RTP and on-going long-term trends. Taken together, they present an imposing threat to the quality of life for both current and future residents. The RTP/SCS vision is linked to these challenges, but also seeks to build upon the strengths and opportunities that the region provides to address them.

2012 Regional Transportation Plan | Vision 25
Transportation FinancePerhaps the most critical challenge is the need for sustainable transportation funding sources. With the projected growth in population, employment, and demand for travel, the costs of our multimodal transportation needs surpass projected revenues available from our historic transportation funding source—the gas tax. Improved fuel efficiency and the growth of alternative-fuel vehicles have reduced fuel consumption and eroded gas tax revenues. Additionally, state and federal gas taxes have not kept up with inflation—the latest adjustments occurred nearly two decades ago. FiGuRe 1.6 highlights the decline in the gas tax in relation to growing population and travel demand.
FiGuRe 1.6 California Population, Travel, and Gas Tax Revenue Trends
0
50
100
150
200
250
300
350
400
450
1970 1980 1990 2000 2010 2020 2030
Ind
ex
Vehicle Miles Traveled Index Population Index Gas Tax Index
Historical Trend Forecast
Source: Caltrans, California Department of Finance, California State Board of Equalization, White House Office of Management and Budget
To backfill limited state and federal gas tax revenues, our region has continued to rely upon local initiatives (74 percent of core revenues) to meet transportation needs. With a total of seven sales tax measures throughout the region since the 1980s, we have shifted the burden to local agencies. However, the national purpose served by Southern California’s transportation system—particularly in the movement of goods—points to the need for stronger state and federal commitment. Our transportation system is the respon-sibility of all levels of government.
26 2012 Regional Transportation Plan | Vision
system PreservationThe region’s aging transportation system is facing increasing preservations costs in the face of diminishing revenues. These regional assets represent trillions of dollars of invest-ments that must be protected in order to serve current and future generations. The loss of even a small fraction of these assets could significantly compromise the region’s mobility.
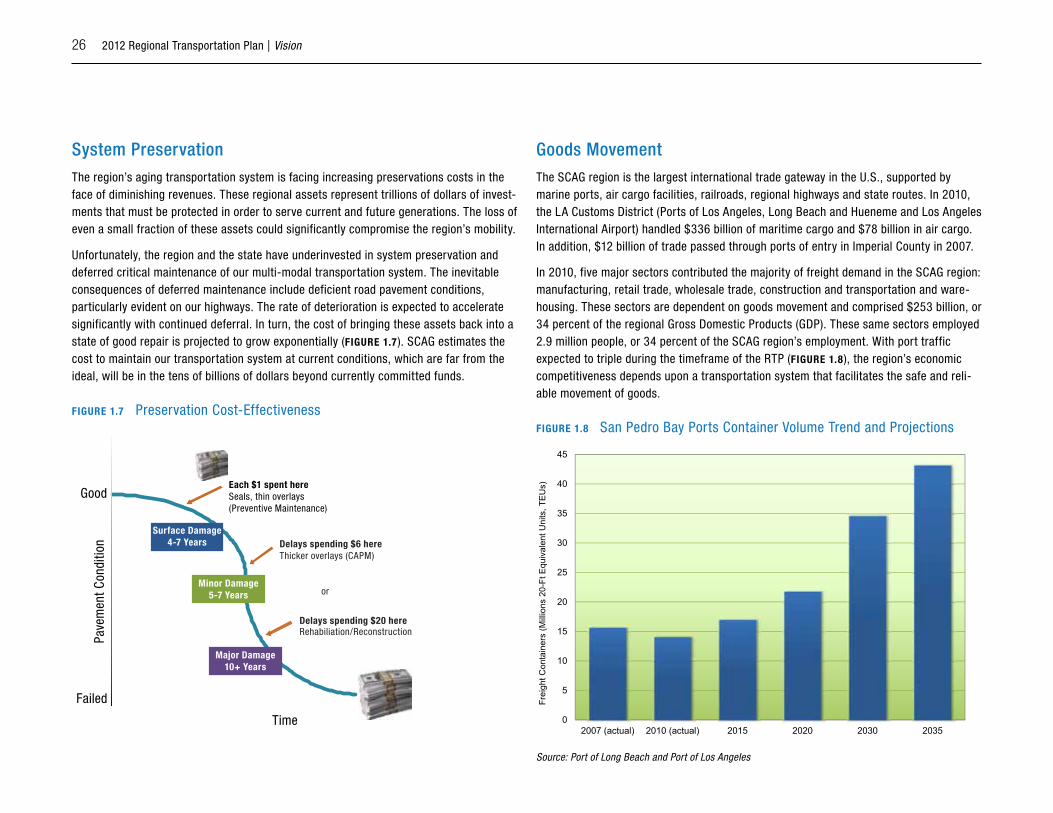
Unfortunately, the region and the state have underinvested in system preservation and deferred critical maintenance of our multi-modal transportation system. The inevitable consequences of deferred maintenance include deficient road pavement conditions, particularly evident on our highways. The rate of deterioration is expected to accelerate significantly with continued deferral. In turn, the cost of bringing these assets back into a state of good repair is projected to grow exponentially (FiGuRe 1.7). SCAG estimates the cost to maintain our transportation system at current conditions, which are far from the ideal, will be in the tens of billions of dollars beyond currently committed funds.
FiGuRe 1.7 Preservation Cost-Effectiveness
Good
Failed
Surface Damage4-7 Years
Minor Damage5-7 Years
Major Damage10+ Years
Each $1 spent hereSeals, thin overlays(Preventive Maintenance)
Delays spending $6 hereThicker overlays (CAPM)
or
Delays spending $20 hereRehabiliation/Reconstruction
Time
Pave
men
t Con
ditio
n
Goods MovementThe SCAG region is the largest international trade gateway in the U.S., supported by marine ports, air cargo facilities, railroads, regional highways and state routes. In 2010, the LA Customs District (Ports of Los Angeles, Long Beach and Hueneme and Los Angeles International Airport) handled $336 billion of maritime cargo and $78 billion in air cargo. In addition, $12 billion of trade passed through ports of entry in Imperial County in 2007.
In 2010, five major sectors contributed the majority of freight demand in the SCAG region: manufacturing, retail trade, wholesale trade, construction and transportation and ware-housing. These sectors are dependent on goods movement and comprised $253 billion, or 34 percent of the regional Gross Domestic Products (GDP). These same sectors employed 2.9 million people, or 34 percent of the SCAG region’s employment. With port traffic expected to triple during the timeframe of the RTP (FiGuRe 1.8), the region’s economic competitiveness depends upon a transportation system that facilitates the safe and reli-able movement of goods.
FiGuRe 1.8 San Pedro Bay Ports Container Volume Trend and Projections
0
5
10
15
20
25
30
35
40
45
2007 (actual) 2010 (actual) 2015 2020 2030 2035
Frei
ght C
onta
iner
s (M
illio
ns 2
0-Ft
Equ
ival
ent U
nits
, TEU
s)
Source: Port of Long Beach and Port of Los Angeles

2012 Regional Transportation Plan | Vision 27
To continue growing, the SCAG region’s businesses must be cost-competitive in pro-ducing their goods and shipping them to market. The same is true for raw materials, components and other inputs transported to the region for manufacturing and processing. Reduced congestion and improved travel time reliability are critical.
However, the economic benefits of the industry must be balanced given significant mobility, community, and environmental costs associated with goods movement. Goods movement is a major source of emissions that contribute to the region’s air pollution. An essential element to improving the region’s goods movement system is to reduce its current and long-term impacts on public health and the environment. The RTP goods movement strategy ensures that investments in transportation infrastructure and associ-ated transportation programs contribute to achievement of the region’s air quality goals. Efforts are already underway, as the San Pedro Bay Ports have invested heavily in deploy-ing clean trucks over the last several years. Additionally, planning efforts are underway to establish a regional zero emission freight system.
integrated land use and TransportationCalifornia’s Sustainable Communities and Climate Protection Act, or Senate Bill (SB) 375, requires SCAG to develop a Sustainable Communities Strategy (SCS) to reduce greenhouse gas (GHG) emissions from automobiles and light trucks through integrated transportation, land use, housing and environmental planning. The SCS provides a plan for meeting the greenhouse gas emission reduction targets set by the California Air Resources Board (ARB) for the SCAG region. The 2012 RTP/SCS achieves an 8 percent per capita reduction for 2020 and 16 percent per capita reduction for 2035.
The SCS is envisioned to integrate transportation and land-use strategies to meet the GHG reduction targets and must:
Identify existing land use,
Identify areas to accommodate long-term housing needs,
Identify areas to accommodate an eight-year projection of regional housing needs,
Identify transportation needs and the planned transportation network,
Consider resource areas and farmland,
Consider state housing goals and objectives,
Set forth a forecasted growth and development pattern, and
Comply with federal law for developing an RTP.
The SCS requirements are meant to lay a regional policy foundation that local govern-ments may build upon, and does not take away local land-use authority. The Gateway Cities COG and Orange County COG each developed a subregional SCS under SB 375 provisions. SCAG has incorporated these adopted subregional strategies into the regional SCS.
Based on SCAG’s analysis of recent land-use trends in the region, it is clear that a signifi-cant trend of development policies supporting better integrated land use and transporta-tion planning has emerged over time. Some of these recent trends include:
1. Changing demographics and housing market demand,
2. Redevelopment of main streets, downtowns and corridors to vibrant mixed use places,
3. Transit-oriented development adjacent to rail station areas and along major bus cor-ridors, and
4. Protection of resource areas and farmland.
28 2012 Regional Transportation Plan | Vision
The RTP/SCS does not envision a wholesale redevelopment of the Southern California region. The vast majority of neighborhoods and business districts that will exist in 2035 are already on the ground and most of them—especially residential neighborhoods, which include large lot single-family homes—will be unchanged in the next 25 years. Rather, the RTP/SCS envisions a new development pattern for new neighborhoods and revitalized neighborhoods and business districts that build upon the current pattern to give residents more choices and more opportunities as they consider where to live and work in the future.
air QualityWhile Southern California is a leader in reducing emissions and ambient levels of air pollutants are improving, the SCAG region continues to have the worst air quality in the nation and air pollution still causes thousands of premature deaths every year, as well as other serious adverse health effects. The South Coast Air Quality Management District (AQMD) estimates the monetary cost of air pollution in Southern California to be at least $14.6 billion annually.
TRansPoRTaTion conFoRMiTy
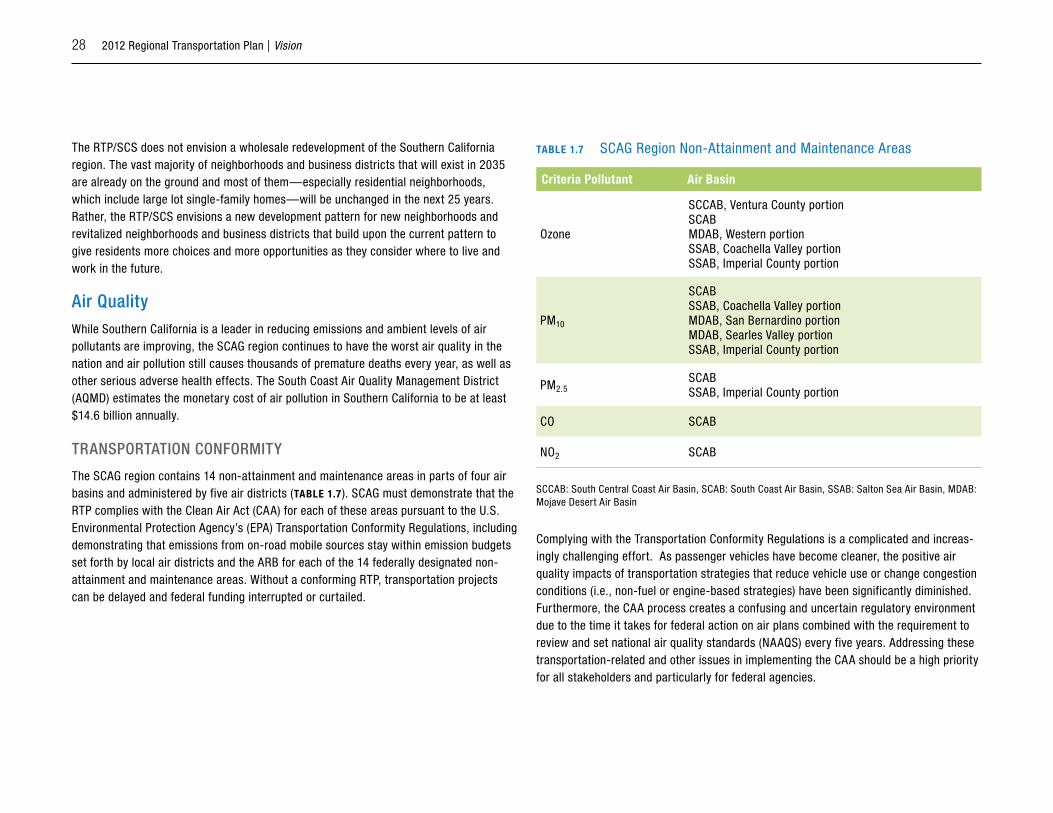
The SCAG region contains 14 non-attainment and maintenance areas in parts of four air basins and administered by five air districts (Table 1.7). SCAG must demonstrate that the RTP complies with the Clean Air Act (CAA) for each of these areas pursuant to the U.S. Environmental Protection Agency’s (EPA) Transportation Conformity Regulations, including demonstrating that emissions from on-road mobile sources stay within emission budgets set forth by local air districts and the ARB for each of the 14 federally designated non-attainment and maintenance areas. Without a conforming RTP, transportation projects can be delayed and federal funding interrupted or curtailed.
Table 1.7 SCAG Region Non-Attainment and Maintenance Areas
Criteria Pollutant air basin
Ozone
SCCAB, Ventura County portionSCABMDAB, Western portionSSAB, Coachella Valley portionSSAB, Imperial County portion
PM10
SCABSSAB, Coachella Valley portionMDAB, San Bernardino portionMDAB, Searles Valley portionSSAB, Imperial County portion
PM2.5SCABSSAB, Imperial County portion
CO SCAB
NO2 SCAB
SCCAB: South Central Coast Air Basin, SCAB: South Coast Air Basin, SSAB: Salton Sea Air Basin, MDAB: Mojave Desert Air Basin
Complying with the Transportation Conformity Regulations is a complicated and increas-ingly challenging effort. As passenger vehicles have become cleaner, the positive air quality impacts of transportation strategies that reduce vehicle use or change congestion conditions (i.e., non-fuel or engine-based strategies) have been significantly diminished. Furthermore, the CAA process creates a confusing and uncertain regulatory environment due to the time it takes for federal action on air plans combined with the requirement to review and set national air quality standards (NAAQS) every five years. Addressing these transportation-related and other issues in implementing the CAA should be a high priority for all stakeholders and particularly for federal agencies.
2012 Regional Transportation Plan | Vision 29
EMission REducTion cHallEnGE
A key component of air pollution is nitrogen oxides (NOX). NOX is emitted whenever fuel is combusted and reacts in the air to form ozone (smog) and fine particulates. Cars, trucks, trains, power plants and refineries are examples of sources that generate NOX. Even with on-going aggressive control strategies, ever more stringent national ozone standards require further reductions of NOX emissions in the SCAG region. In the South Coast Air Basin, for example, it is estimated that NOX emissions will need to be reduced by approxi-mately two-thirds in 2023 and three-quarters in 2030. This is a daunting challenge. Emissions from most sources, including cars and factories, have already been reduced by over 90 percent. Emissions forecasted for 2030 from just three sources—ships, trains and aircraft—would lead to ozone levels near the federal standard.
oPPoRTuniTiEs
The air quality challenge also provides opportunities for the region. As an innovator and leader, Southern California can develop solutions to mobility and air quality problems that help set important national policies. To support a shared long-term vision for Southern California, decisions and actions should be part of an integrated strategy that addresses multiple needs with single investments, wherever possible. We can start by aligning our actions to improve mobility and air quality with efforts to reduce petroleum consumption. The 2012 RTP/SCS sets forth a roadmap to this end through the comprehensive set of transit, active transportation, TDM, pricing, goods movement, and land-use strategies.
The air quality challenge also creates an opportunity for economic leadership, since technologies for global climate protection, air quality improvement, and energy security are needed for Southern California to attain federal air quality standards. We should posi-tion Southern California industries and universities as technology innovators that serve emerging global needs. The region can give our industries and universities every oppor-tunity to succeed by developing partnerships and accelerating demand for clean air and energy solutions.
The future belongs to those with the vision and commitment to act. SCAG and its partners can lead the way through the 2012 RTP/SCS.
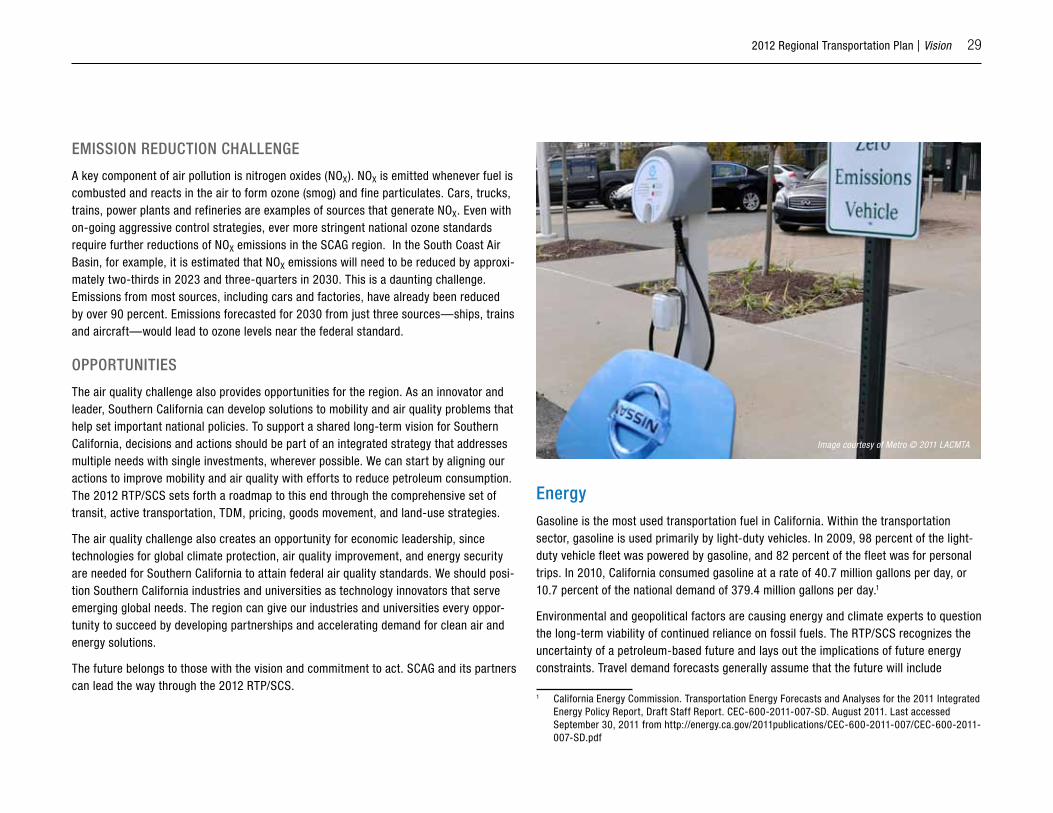
EnergyGasoline is the most used transportation fuel in California. Within the transportation sector, gasoline is used primarily by light-duty vehicles. In 2009, 98 percent of the light-duty vehicle fleet was powered by gasoline, and 82 percent of the fleet was for personal trips. In 2010, California consumed gasoline at a rate of 40.7 million gallons per day, or 10.7 percent of the national demand of 379.4 million gallons per day.1
Environmental and geopolitical factors are causing energy and climate experts to question the long-term viability of continued reliance on fossil fuels. The RTP/SCS recognizes the uncertainty of a petroleum-based future and lays out the implications of future energy constraints. Travel demand forecasts generally assume that the future will include
1 California Energy Commission. Transportation Energy Forecasts and Analyses for the 2011 Integrated Energy Policy Report, Draft Staff Report. CEC-600-2011-007-SD. August 2011. Last accessed September 30, 2011 from http://energy.ca.gov/2011publications/CEC-600-2011-007/CEC-600-2011-007-SD.pdf
Image courtesy of Metro © 2011 LACMTA

30 2012 Regional Transportation Plan | Vision
an abundant and relatively inexpensive supply of transportation fuels. However, this assumption is in question based on the International Energy Agency’s (IEA) 2010 World Energy Outlook.
The IEA forecasts that the emerging economies of India and China will drive global energy demand higher. The IEA further states that China overtook the United States in 2009 as the world’s largest energy consumer and their consumption will continue to grow. If governments act more vigorously to increase fuel efficiency and promote demand for alternative fuels, the demand for oil will decrease, avoiding price increases and supply disruptions.2
However, if fuel prices continue to increase, it would have a ripple effect on numerous areas including construction costs, gas tax revenue, travel and aviation demand, air emissions, mode choice and growth patterns. In response, the 2012 RTP/SCS supports the increased adoption of near zero and zero emission technologies to lessen the region’s exposure to fossil fuel price spikes resulting from an uncertain energy future and reduce GHGs and emissions of criteria pollutants.
In addition to reducing vehicle-miles traveled (VMT) through the integration of transporta-tion and land use planning, building design can also affect energy use. Electricity genera-tion, both in-state and out-of-state, and other residential and commercial energy use account for 32 percent of California’s greenhouse gas (GHG) emissions. This contribution is second only to the transportation sector.3 Energy efficiency reduces energy costs for owners, increases reliability and availability of electricity for the state, improves building occupant comfort, and reduces environmental impact. Furthermore, improving energy efficiency through both performance-based and prescriptive improvements could reduce emissions of pollutants for which federal and state standards exist.4
The RTP/SCS includes the following actions to address energy uncertainty and reduce the region’s contribution to global climate change:
2 International Energy Agency. World Energy Outlook 2010. November 2010. Last accessed October 6, 2011 from http://www.worldenergyoutlook.org/
3 California Air Resources Board. Climate Change Proposed Scoping Plan: A Framework for Change. Sacramento: California Air Resources Board. October 2008. Last accessed October 11, 2011 from http://www.arb.ca.gov/cc/scopingplan/document/psp.pdf.
4 California Energy Commission. Energy Aware Planning Guide. CEC– 600-200-013. February 2011. Last accessed October 5, 2011 from http://www.energy.ca.gov/energy_aware_guide/index.html
Supporting new automobile technology to increase fuel efficiency
Planning for the electrification of the vehicle fleet
Adopting mitigation measures to reduce household energy consumption
Testing an informal alternative that examines plan performance should the price of fuel double compared to what is assumed in other alternatives.
Public HealthThe RTP/SCS recognizes the impact that transportation and land-use decisions have on the health of the region’s residents. A substantial body of research shows that certain aspects of the transportation infrastructure, including public transit, sidewalks and safe street crossings near schools, and bicycle paths, are associated with more walking and bicycling, greater physical activity and lower obesity rates. A 2004 analysis of develop-ment patterns, travel behaviors, and health in the Atlanta region found that higher land-use densities and greater connectivity resulted in reduced rates of obesity. The study also found that each additional hour spent in a car per day was associated with a six percent increase in the likelihood of obesity.5 A recent study of the health costs of transportation policies found that the health expenditure reductions from meeting federal air quality standards for NOX and ozone could reach $22 billion per year within the South Coast Air Basin.6
The RTP/SCS supports the integration of transportation and land-use policies as well as initiatives to promote a cleaner fleet of vehicles to address a range of public health issues. The RTP allocates over $6 billion for active transportation projects, which is a 200-percent increase over expenditures in the 2008 RTP. It also seeks to promote active transportation options, increased funding and a decrease in bicycle and pedestrian fatali-ties and injuries. The 2012 RTP/SCS also sets forth a vision for a less carbon-intensive vehicle fleet. Through near zero and zero emission vehicle technologies, the RTP pro-motes a more sustainable future that creates an economic leadership opportunity for the region.
5 Frank LD, Andresen MA, Schmid TL. Obesity relationships with community design, physical activity, and time spent in cars. American Journal of Preventive Medicine. 2004 Aug;27(2):87–96.
6 American Public Health Association. The Hidden Health Costs of Transportation. February 2010. Last accessed October 6, 2011 from http://www.apha.org/NR/rdonlyres/E71B4070-9B9D-4EE1-8F43-349D21414962/0/FINALHiddenHealthCostsShortNewBackCover.pdf
2012 Regional Transportation Plan | Vision 31
Lastly, the 2012 RTP/SCS analyzes environmental justice (EJ) impacts to address equita-bility of the costs and benefits of the Plan are equitable.
The Environmental Justice appendix includes an analysis of pollution exposure within 500 feet of highly traveled corridors in the region, i.e. urban roads with more than 100,000 vehicles per day or rural roads with more than 50,000 vehicles per day. Additionally, SCAG conducted a Health Risk Assessment as part of the 2012 RTP/SCS Program Environmental Impact Report. This analysis evaluated emissions and cancer risk impacts resulting from transportation-related toxic emissions. The results are contained within the Program Environmental Impact Report. In partnership with our regional stakeholders, these actions will support a healthy future for Southern California.
adaptationClimate change mitigation means reducing or sequestering greenhouse gases, whereas adaptation is preparing for known impacts of climate change. Over the coming century, climate change studies project that Southern California will be expected to manage extremes of precipitation and temperature, increased storm frequency and intensity, and sea-level rise. These climate changes will impact streamflow, flooding, water supply, sea level and soil water content. These impacts will affect agriculture, stormwater, waste-water treatment, wildfire risk, roads, forest health, and biodiversity. These impacts will also have consequences for public health, economic livelihoods, the financial sector, the insurance industry, individual comfort and recreation. In practice, these impacts will mean coping with:
Longer and hotter heat waves,
Increased urban heat island impacts, such as heat-related illness and higher cooling demand and costs,
More damaging storms and storm surges,
Greater river flooding,
Increased frequency and intensity of combined sewer overflows,
More intense and extended duration of droughts,
Longer water supply shortages, and
Declines in local ecosystem services, such as species loss or the loss of specific ecosystem types (e.g., forests or coastal wetlands).
The associated impacts on buildings, water and transportation infrastructure, emergency preparedness, planning, and quality-of-life issues, have only now begun to be considered. Climate and impact modeling can offer a scientific basis for more informed planning, including improved data gathering. However, additional monitoring, development of improved management practices, and coordination among state and local agencies and the private sector are critical needs as well. Failure to anticipate and plan for climate variability and the prospect of extreme weather and related events could have serious impacts on the regional economy and quality of life. Starting now and continuing in the years and decades ahead, we can adapt to these new risks through resilient resource and land-use choices.

32 2012 Regional Transportation Plan | Vision
Plan overviewThe 2012 RTP/SCS is based on a careful analysis of our transportation system, the future growth of our region, and our vision for a sustainable future. The RTP/SCS is a living document that must be updated to reflect the most current information and conditions in order to remain relevant and useful. Updating the plan requires us to examine the prog-ress we are making as a region, not just in terms of delivering projects, but also in terms of meeting our vision, goals and objectives.
our approachSCAG is the federally designated MPO for the counties of Imperial, Los Angeles, Orange, Riverside, San Bernardino, and Ventura. As the MPO, SCAG develops the RTP and updates it every four years through a bottom-up and comprehensive, cooperative and continu-ous (“3-C”) process involving numerous stakeholders. Transportation investments in the SCAG region that receive state and federal funds or require federal approvals (such as environmental clearance) must be consistent with the RTP and must be included in SCAG’s Federal Transportation Improvement Program (FTIP) when ready for funding. The FTIP is a four-year program and represents the immediate, near-term commitments of the RTP.
The development of the 2012 RTP/SCS has required a greater level of collaboration than in past plans. SCAG has worked together with stakeholders to develop a technically solid growth forecast, multi-modal transportation and land use strategies, economic impact analysis, and a realistically achievable financial plan.
The RTP/SCS has been developed using a ‘bottom-up’ approach respecting local com-munities’ General Plans and growth input.
sTakEHoldER inVolVEMEnT and Public PaRTiciPaTion
SCAG develops the RTP/SCS in close coordination with stakeholder agencies such as the county transportation commissions (CTCs), subregional councils of governments (COGs), transit operators, Caltrans, local jurisdictions, port authorities, air quality management dis- tricts, state and federal resource agencies and other transportation stakeholders (Table 1.8). More stakeholder groups are identified and listed in Public Participation Chapter (Chapter 6) and the supporting technical report.
Each of the six counties in the SCAG region has a CTC responsible for countywide transportation planning and implementation, allocating locally generated transportation revenues and, in some cases, operating transit services. Additionally, the SCAG region includes 15 COGs, which are groups of neighboring cities and communities that work together to identify, prioritize and seek transportation funding for needed investments in their respective areas.
The SCAG region includes all or part of 14 air quality non-attainment or maintenance areas in five air basins. Federal law requires that transportation and air quality planning are coordinated in these non-attainment and maintenance areas. The SCAG region further includes the Caltrans Districts 7, 8 and 12, and the Imperial County portion of District 11.
2012 Regional Transportation Plan | Vision 33
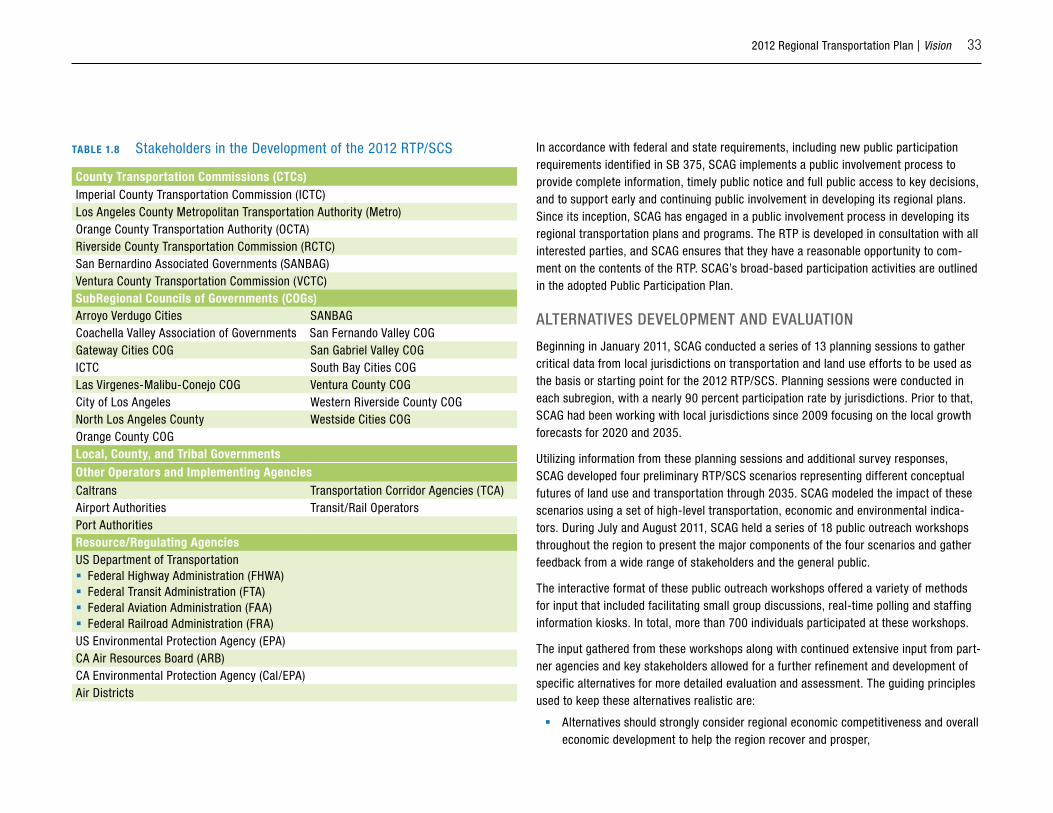
Table 1.8 Stakeholders in the Development of the 2012 RTP/SCS
County Transportation Commissions (CTCs)Imperial County Transportation Commission (ICTC)Los Angeles County Metropolitan Transportation Authority (Metro)Orange County Transportation Authority (OCTA)Riverside County Transportation Commission (RCTC)San Bernardino Associated Governments (SANBAG)Ventura County Transportation Commission (VCTC)SubRegional Councils of Governments (COGs)Arroyo Verdugo Cities SANBAGCoachella Valley Association of Governments San Fernando Valley COGGateway Cities COG San Gabriel Valley COGICTC South Bay Cities COGLas Virgenes-Malibu-Conejo COG Ventura County COGCity of Los Angeles Western Riverside County COGNorth Los Angeles County Westside Cities COGOrange County COGlocal, County, and Tribal GovernmentsOther Operators and implementing agenciesCaltrans Transportation Corridor Agencies (TCA)Airport Authorities Transit/Rail OperatorsPort AuthoritiesResource/Regulating agenciesUS Department of Transportation Federal Highway Administration (FHWA) Federal Transit Administration (FTA) Federal Aviation Administration (FAA) Federal Railroad Administration (FRA)US Environmental Protection Agency (EPA)CA Air Resources Board (ARB)CA Environmental Protection Agency (Cal/EPA)Air Districts
In accordance with federal and state requirements, including new public participation requirements identified in SB 375, SCAG implements a public involvement process to provide complete information, timely public notice and full public access to key decisions, and to support early and continuing public involvement in developing its regional plans. Since its inception, SCAG has engaged in a public involvement process in developing its regional transportation plans and programs. The RTP is developed in consultation with all interested parties, and SCAG ensures that they have a reasonable opportunity to com-ment on the contents of the RTP. SCAG’s broad-based participation activities are outlined in the adopted Public Participation Plan.
alTERnaTiVEs dEVEloPMEnT and EValuaTion
Beginning in January 2011, SCAG conducted a series of 13 planning sessions to gather critical data from local jurisdictions on transportation and land use efforts to be used as the basis or starting point for the 2012 RTP/SCS. Planning sessions were conducted in each subregion, with a nearly 90 percent participation rate by jurisdictions. Prior to that, SCAG had been working with local jurisdictions since 2009 focusing on the local growth forecasts for 2020 and 2035.
Utilizing information from these planning sessions and additional survey responses, SCAG developed four preliminary RTP/SCS scenarios representing different conceptual futures of land use and transportation through 2035. SCAG modeled the impact of these scenarios using a set of high-level transportation, economic and environmental indica-tors. During July and August 2011, SCAG held a series of 18 public outreach workshops throughout the region to present the major components of the four scenarios and gather feedback from a wide range of stakeholders and the general public.
The interactive format of these public outreach workshops offered a variety of methods for input that included facilitating small group discussions, real-time polling and staffing information kiosks. In total, more than 700 individuals participated at these workshops.
The input gathered from these workshops along with continued extensive input from part-ner agencies and key stakeholders allowed for a further refinement and development of specific alternatives for more detailed evaluation and assessment. The guiding principles used to keep these alternatives realistic are:
Alternatives should strongly consider regional economic competitiveness and overall economic development to help the region recover and prosper,

34 2012 Regional Transportation Plan | Vision
Transportation investment commitments made by the CTCs through local sales tax expenditure plans, adopted long-range plans, and board-adopted resolutions will be fully respected,
The subregional SCS submitted by the Gateway COG and the Orange County COG will be respected and integrated into the alternatives,
New investment strategies proposed over and beyond the CTC commitments will be funded only through new funding sources identified and approved by the Regional Council,
Ensuring an appropriate level of funding for system preservation will be given a priority, and
Each of the alternatives will be evaluated using a set of accepted performance measures.
Based on these considerations, three alternatives were defined and compared against a “No Project Baseline” representing projects in the 2011 FTIP that have received full envi-ronmental clearance. Out of this evaluation, a preferred alternative was selected for the 2012 RTP/SCS. The preferred alternative builds on the region’s success over the last four years in implementing the previous 2008 RTP and moves the region forward in meeting mobility, air quality, public health, integrated land use and transportation strategies and other regional goals. The components of the RTP/SCS are described briefly in the next section and in more detail in the succeeding chapters of this document.
strategies and investmentsGiven the setting and the challenges our region is facing, this Plan recognizes that our approach must be balanced, systematic, multimodal, and at the same time targeted to yield the best performance outcomes based on the established set of performance measures. Additionally, we recognize that much of the groundwork has already been laid out by our stakeholder agencies, particularly the CTCs in their countywide long-range transportation plans and local sales tax expenditure plans. The 2012 RTP supports and builds upon these local commitments.
We start first with the transportation investments, described in Chapter 2. This chapter proposes an integrated approach that would first make the most out of our existing trans-portation system by investing in system preservation and maintenance, transportation
demand management, and transportation systems management, followed by completing the system and closing critical gaps, and finally, strategic system expansion. The invest-ments in this chapter will provide more efficient and attractive travel choices for future generations on multiple modes of transportation.
In Chapter 3, we lay out a strategy to establish a long-term, sustainable funding plan. While recognizing financial constraints, the Plan sets forth funding strategies that are reasonably available within the time frame of the RTP. The financial plan ensures that the region can afford to implement the region’s near-term commitments as identified in the FTIP, the county commitments as identified in countywide transportation plans and sales tax measures, and the regional investments which are the focus of Chapter 2.
In Chapter 4, the SCS identifies a future land use and development pattern, integrated with the future transportation network and other transportation strategies, to reduce greenhouse gas emissions.
The outcomes and benefits of the RTP/SCS are presented in Chapter 5 in the form of performance measures that attempt to quantify the mobility, economic, and environmen-tal benefits of the plan investments. SCAG further recognizes that there are numerous co-benefits to implementing the SCS, not only in terms of transportation and the environ-ment, but also public health and livable communities. Chapter 5 also addresses the statu-tory requirements of the RTP/SCS, including environmental justice outcomes, reduction in greenhouse gas emissions, and transportation conformity.
The public participation plan for developing the RTP/SCS is described in Chapter 6. Finally, recognizing that despite our best efforts, there simply may not be enough money to implement solutions to all of our transportation needs, the RTP/SCS includes a strate-gic component in Chapter 7. The Strategic Plan identifies projects that cannot be funded at this point, but merit further consideration in future plan updates based on additional studies, funding support, and stakeholder consensus.
Related Documents