2015/2/10 EERA DeepWind’2015 1 SCADA Data Interpretation improves Wind Farm Maintenance Professor Kesheng Wang [email protected] Knowledhe Discovery Laboratory Department of Production and Quality Engineering Norwegian University of Science and Technology

Welcome message from author
This document is posted to help you gain knowledge. Please leave a comment to let me know what you think about it! Share it to your friends and learn new things together.
Transcript

2015/2/10 EERA DeepWind’2015 1
SCADA Data Interpretation improves Wind Farm Maintenance
Professor Kesheng Wang [email protected]
Knowledhe Discovery Laboratory Department of Production and Quality Engineering Norwegian University of Science and Technology

Outlines
Introduction Predictive Maintenance Framework of WINDSENSE Project SCADA Data Based CMS Case study Conclusions
2015/2/10 KDL, IPK NTNU 2

Introduction Renewable energy sources are playing an important role in
the global energy mix, as a means of reducing the impact of energy production on climate change. Wind energy is most developed renewable energy techniques.
The management of wind farms is challenging because it involves several difficult tasks, such as wind forecasting and the operations and maintenance of turbines.
The maintenance of wind turbines has received attention in recent years due to its impact on the cost of generating power from wind. The main tendency of maintenance policy is changing from Preventive Maintenance (PM) and Corrective Maintenance (CM), to Predictive Maintenance (PdM).
2015/2/10 KDL, IPK NTNU 3

NTNU
Classification of Maintenance Policy
2015/2/10 KDL, IPK NTNU 4
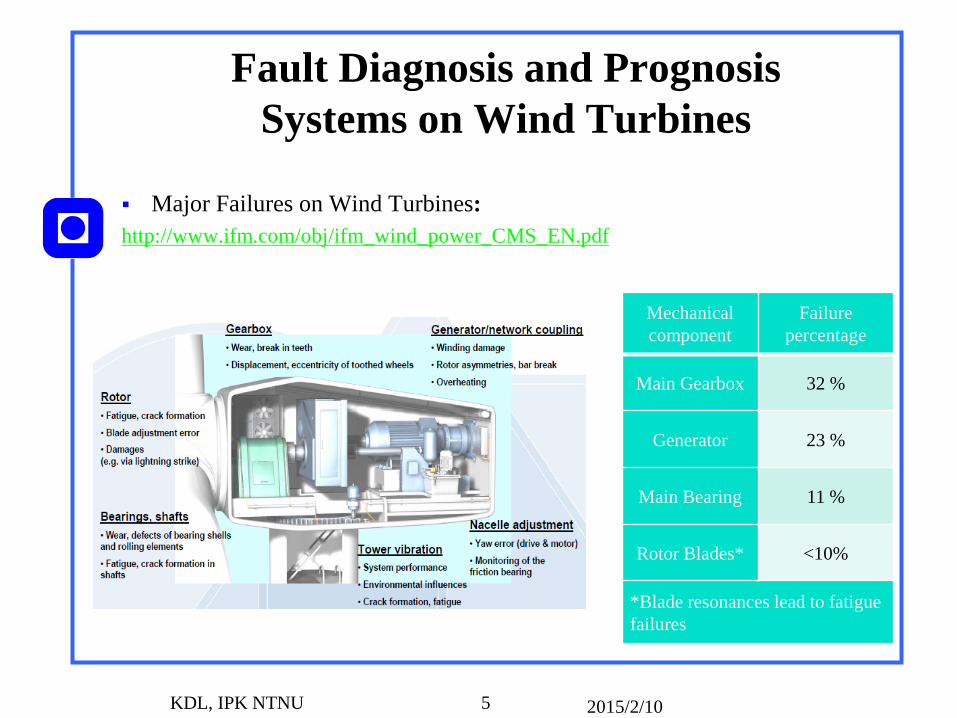
Fault Diagnosis and Prognosis Systems on Wind Turbines
Major Failures on Wind Turbines: http://www.ifm.com/obj/ifm_wind_power_CMS_EN.pdf
2015/2/10 KDL, IPK NTNU 5
Mechanical component
Failure percentage
Main Gearbox 32 %
Generator 23 %
Main Bearing 11 %
Rotor Blades* <10%
*Blade resonances lead to fatigue failures
NTNU
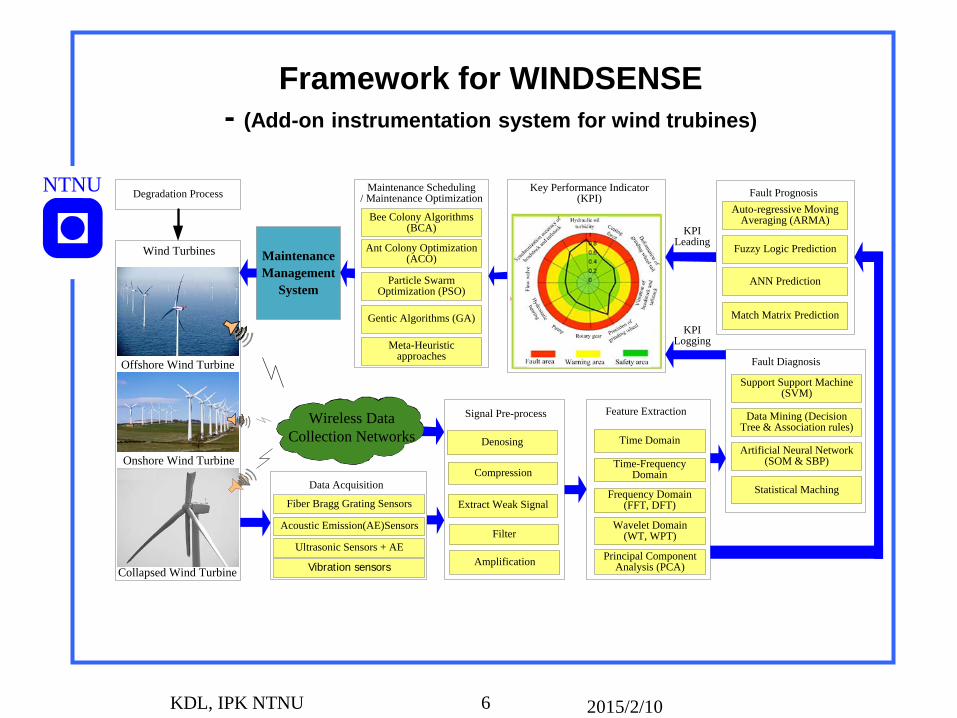
Framework for WINDSENSE - (Add-on instrumentation system for wind trubines)
2015/2/10 KDL, IPK NTNU 6
Wind Turbines
Degradation Process
Feature Extraction
Fault Diagnosis
Fault PrognosisMaintenance Scheduling / Maintenance Optimization
Signal Pre-process
Denosing Time Domain
Time-Frequency Domain
Frequency Domain (FFT, DFT)
Wavelet Domain (WT, WPT)
Principal Component Analysis (PCA)
Compression
Extract Weak Signal
Filter
Amplification
Support Support Machine (SVM)
Data Mining (Decision Tree & Association rules)
Artificial Neural Network (SOM & SBP)
Statistical Maching
Auto-regressive Moving Averaging (ARMA)
Fuzzy Logic Prediction
ANN Prediction
Match Matrix Prediction
Ant Colony Optimization (ACO)
Particle Swarm Optimization (PSO)
Gentic Algorithms (GA)
Meta-Heuristic approaches
Bee Colony Algorithms (BCA)
Key Performance Indicator (KPI)
KPI Leading
KPI Logging
Maintenance Management
System
Onshore Wind Turbine
Offshore Wind Turbine
Collapsed Wind Turbine
Data Acquisition
Fiber Bragg Grating Sensors
Acoustic Emission(AE)Sensors
Ultrasonic Sensors + AE
Vibration sensors
Wireless Data Collection Networks
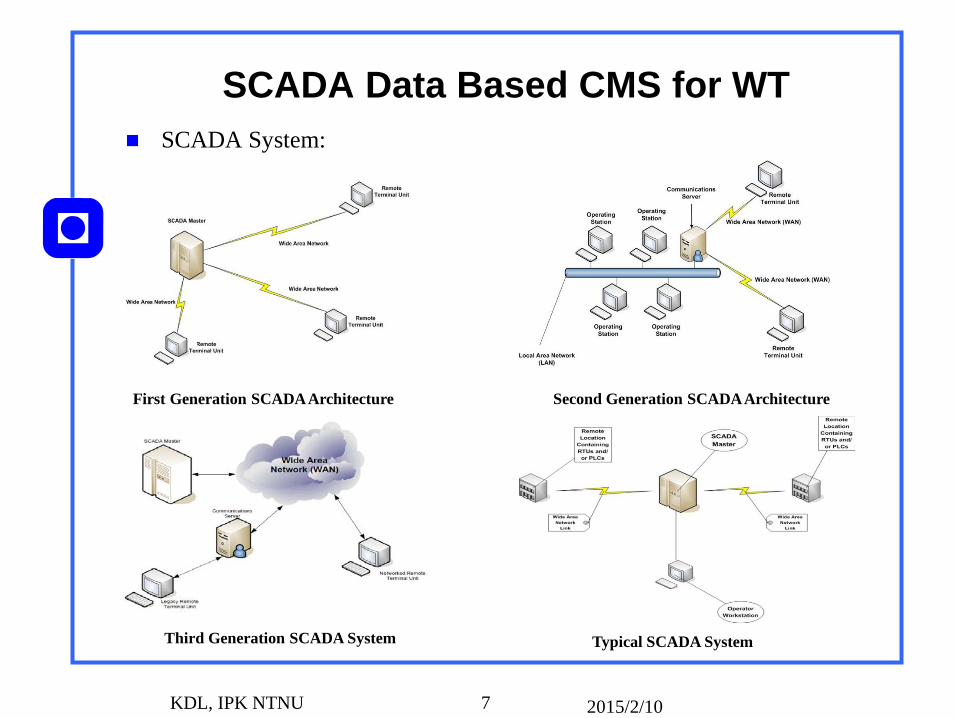
SCADA Data Based CMS for WT SCADA System:
2015/2/10 KDL, IPK NTNU 7
First Generation SCADA Architecture Second Generation SCADA Architecture
Third Generation SCADA System Typical SCADA System

SCADA Data Based CMS for WT
2015/2/10 KDL, IPK NTNU 8
Sensor 1 Micoprocessor
mounted on device
Sensor 2 Micoprocessor
Sensor N Micoprocessor
Centralised SCADA System
SCADA DATARAW DATA
SCADA master
10 mins average data
Fault diagnosis
Fault prognosis
Maintenance
DATA MINING
HMI
Corroborate
PAST/PRESENT DATA
PRESENT DATA
Operator Workstation
WANRTU remote location
and/orPLC
Strategy
Algorithmsand/ormodels
Raw Data and SCADA Data (proposed frame work)
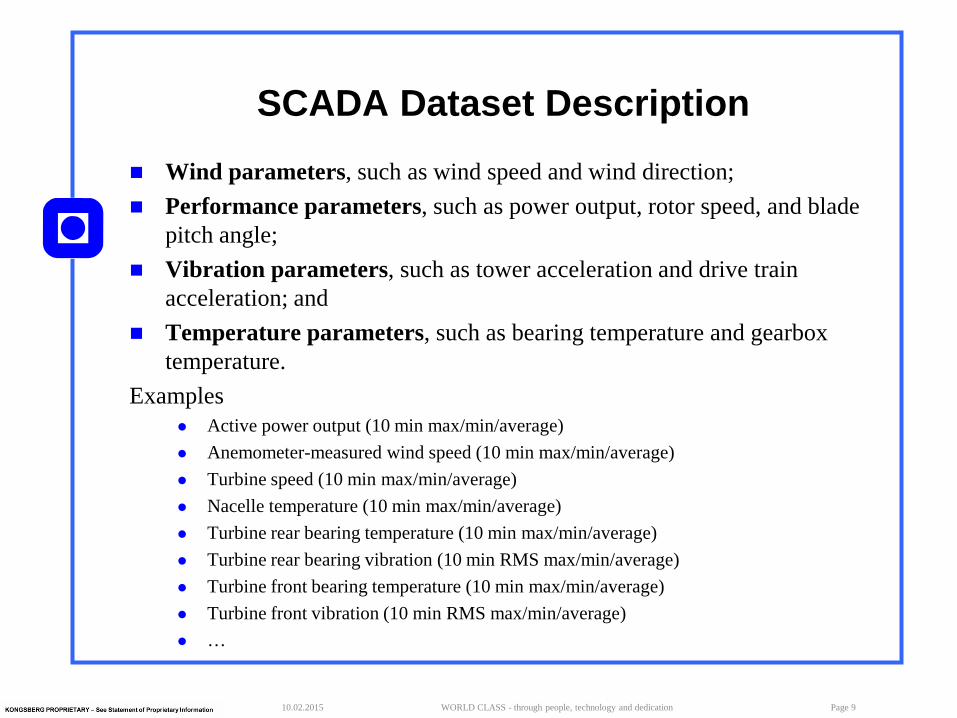
SCADA Dataset Description Wind parameters, such as wind speed and wind direction; Performance parameters, such as power output, rotor speed, and blade
pitch angle; Vibration parameters, such as tower acceleration and drive train
acceleration; and Temperature parameters, such as bearing temperature and gearbox
temperature. Examples
Active power output (10 min max/min/average) Anemometer-measured wind speed (10 min max/min/average) Turbine speed (10 min max/min/average) Nacelle temperature (10 min max/min/average) Turbine rear bearing temperature (10 min max/min/average) Turbine rear bearing vibration (10 min RMS max/min/average) Turbine front bearing temperature (10 min max/min/average) Turbine front vibration (10 min RMS max/min/average) …
10.02.2015 WORLD CLASS - through people, technology and dedication Page 9
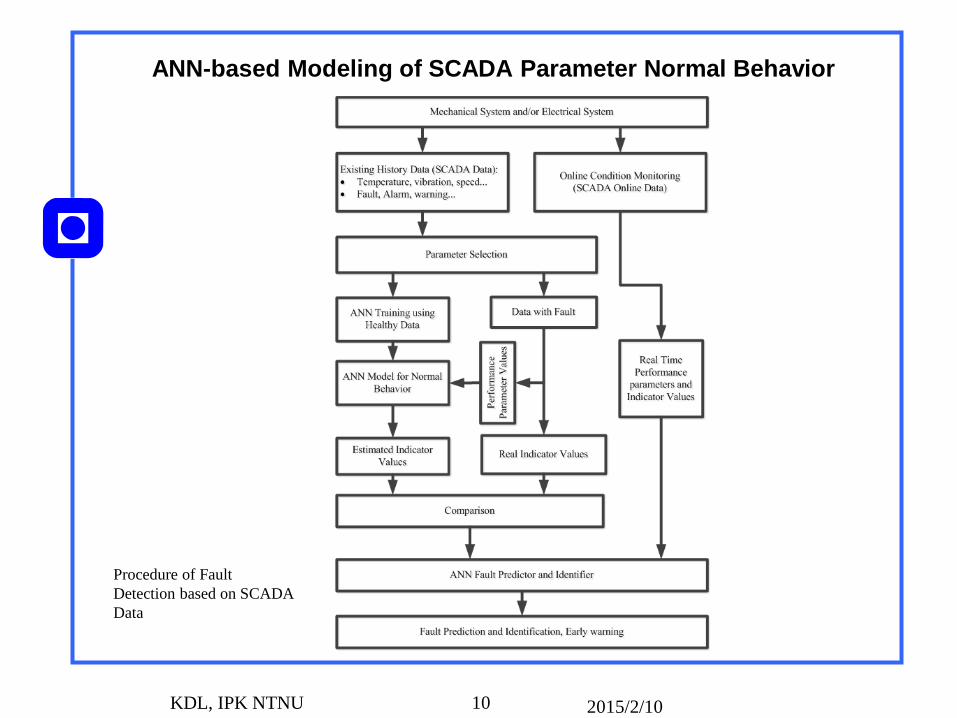
ANN-based Modeling of SCADA Parameter Normal Behavior
2015/2/10 KDL, IPK NTNU 10
Procedure of Fault Detection based on SCADA Data
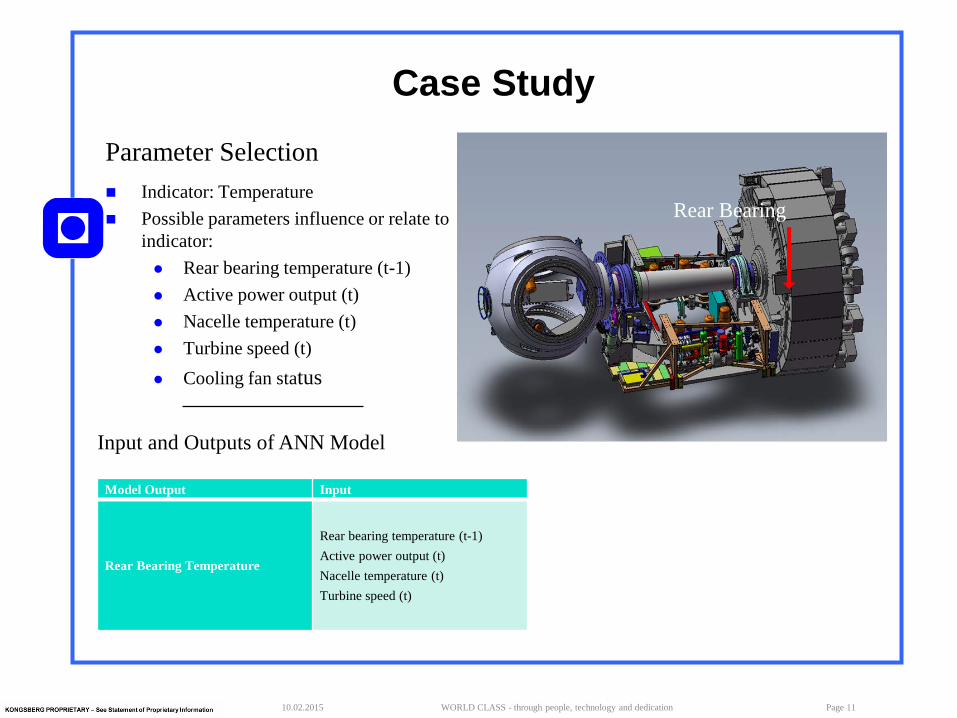
Case Study
Indicator: Temperature Possible parameters influence or relate to
indicator: Rear bearing temperature (t-1) Active power output (t) Nacelle temperature (t) Turbine speed (t) Cooling fan status
10.02.2015 WORLD CLASS - through people, technology and dedication Page 11
Rear Bearing
Model Output Input
Rear Bearing Temperature
Rear bearing temperature (t-1) Active power output (t) Nacelle temperature (t) Turbine speed (t)
Input and Outputs of ANN Model
Parameter Selection
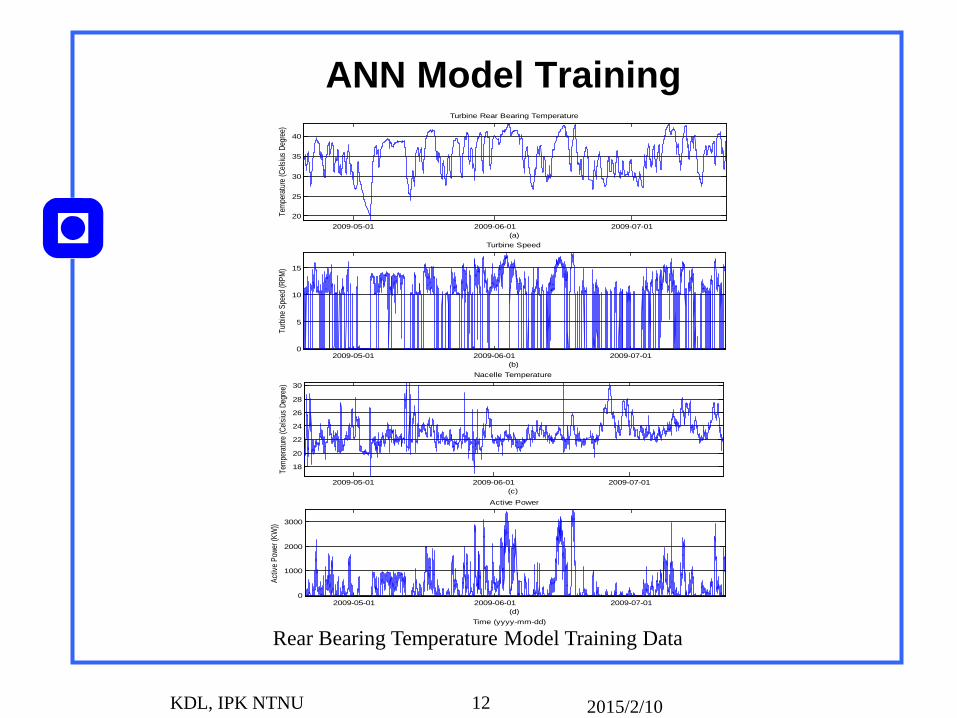
ANN Model Training
2015/2/10 KDL, IPK NTNU 12
2009-05-01 2009-06-01 2009-07-0120
25
30
35
40
Tem
pera
ture
(Cels
ius D
egre
e)
(a)
Turbine Rear Bearing Temperature
2009-05-01 2009-06-01 2009-07-010
5
10
15
Turbine Speed
(b)
Turb
ine S
peed
(RPM
)
2009-05-01 2009-06-01 2009-07-01
18
20
22
24
26
28
30Nacelle Temperature
(c)
Tem
pera
ture
(Cels
ius D
egre
e)
2009-05-01 2009-06-01 2009-07-010
1000
2000
3000
(d)
Activ
e Po
wer (
KW))
Active Power
Time (yyyy-mm-dd)
Rear Bearing Temperature Model Training Data

ANN Model Testing
10.02.2015 WORLD CLASS - through people, technology and dedication Page 13
2009-05-31 2009-06-07 2009-06-14 2009-06-21 2009-06-28 2009-07-05 2009-07-12 2009-07-19 2009-07-2625
30
35
40
45
(a)
Real Temperature and Estimated Temperature
EstimatedTempBearTemp
09-05-31 09-06-07 09-06-14 09-06-21 09-06-28 09-07-05 09-07-12 09-07-19 09-07-26-3
-2
-1
0
1
2
3Difference Between Actual and Estimated Temperature
(b)
Time (yyyy-mm-dd)
Rear Bearing Model Output in Normal Condition
2009-05-31 2009-06-07 2009-06-14 2009-06-21 2009-06-28 2009-07-05 2009-07-12 2009-07-19 2009-07-2625
30
35
40
45
(a)
Tem
pera
ture
(Cel
sius
Deg
ree)
Turbine Rear Bearing Temperature (t-1)
2009-05-31 2009-06-07 2009-06-14 2009-06-21 2009-06-28 2009-07-05 2009-07-12 2009-07-19 2009-07-260
5
10
15
20
(b)
Turb
ine
Spee
d (R
PM)
Turbine Speed
2009-05-31 2009-06-07 2009-06-14 2009-06-21 2009-06-28 2009-07-05 2009-07-12 2009-07-19 2009-07-2615
20
25
30
35
(c)
Tem
pera
ture
(Cel
sius
Deg
ree)
Nacelle Temperature
2009-05-31 2009-06-07 2009-06-14 2009-06-21 2009-06-28 2009-07-05 2009-07-12 2009-07-19 2009-07-260
1000
2000
3000
4000
(d)
Activ
e Po
wer (
KW))
Active Power
Time (yyyy-mm-dd)
Rear Bearing Model Testing Input Data
Test Data: 26.05.2009 to 26.07.2009

Detection of Rear Bearing Fault
①: The first important deviation from the model estimates occurred from the start of October 2010.
③: the turbine was stopped because of overheating.
The operator try to solve the problem two times in point ③ and ④ but not successful.
⑤: the turbine was completely stopped because of the overheating
3 months early warning 10 days close alarm
10.02.2015 WORLD CLASS - through people, technology and dedication Page 14
2010-08-01 2010-09-01 2010-10-01 2010-11-01 2010-12-01 2011-01-01 2011-02-01 2011-03-01
10
20
30
40
50
60
(a)
Actual and Estimated Temperature
EstimatedTempBearTemp
2010-08-01 2010-09-01 2010-10-01 2010-11-01 2010-12-01 2011-01-01 2011-02-01 2011-03-01-5
0
5
10
15Difference Between Actual and Estimated Temperature
(b)
Time (yyyy-mm-dd)
4
52 3
1
4
1.5
Fault Detection Results of Rear Bearing

Discussion Whether the model established from the SCADA data of one turbine, can be applied in fault detection to another turbines?
10.02.2015 WORLD CLASS - through people, technology and dedication Page 15
2010-07-01 2010-08-01 2010-09-01 2010-10-01
25
30
35
40
(a)
Turbine Bearing Temperature (t-1)
2010-07-01 2010-08-01 2010-09-01 2010-10-010
5
10
15
(b)
Turbine Speed
2010-07-01 2010-08-01 2010-09-01 2010-10-010
10
20
30
(c)
Nacelle Temperature
2010-07-01 2010-08-01 2010-09-01 2010-10-010
1000
2000
3000
Active Power
(d)
Time (yyyy-mm-dd)
Rear Bearing Model Testing Input Data of New Turbine
2010-07-01 2010-08-01 2010-09-01 2010-10-0115
20
25
30
35
40
45
50Actual and Estimated Temerature
EstimatedTempBearTemp
2010-07-01 2010-08-01 2010-09-01 2010-10-01-2
-1.5
-1
-0.5
0
0.5
1
1.5
2Difference between Actual and Estimated Temerature
Yes, with the same type of turbines

Conclusions (1) The accuracy of the diagnosis model depends upon the input data. Thus a
careful selection of variables and the quality of the data (free from noise) are the prime factors affecting accuracy. Hence adequate pre-processing models are desirable. Though the comparison results of various models is mentioned but no one clear cut perfect modeling technique could emerge. So this area needs further explorations. Hence a lot is to be done in this area, in order to obtain a generic model for CMS using SCADA data.
The most of the research has been carried out using low frequency SCADA data (10 minutes average) and for a better prediction higher quality data is required (high frequency, noise free and long duration). This is another point which needs to be explored, i.e. what frequency SCADA data gives optimal results in case of WTs.
It is proposed to diagnose and prognosticate with both conventional data and SCADA data and with the comparison of the two results. The suitable maintenance strategy could then be worked out.
2015/2/10 KDL, IPK NTNU 16
Conclusions (2) Furthermore the relationships between faults have not been explored. It has been demonstrated that with combination of appropriate data mining
algorithms and computational intelligence concepts the accuracy and robustness of model is enhanced.
Most of the researchers have pinpointed that the data sharing by the wind engineering industry was major hindrance in this type of research. Hence there is a strong need for a pooling of common data base for researchers across the globe.
Based upon the CMS of WT’s using SCADA data appropriate maintenance strategy could be worked in order to achieve the goal of PdM.
2015/2/10 KDL, IPK NTNU 17

NTNU
2015/2/10 KDL, IPK NTNU 18
Related Documents


