Explore, enjoy and protect the planet CAFE: The Truth Behind The Testing

Welcome message from author
This document is posted to help you gain knowledge. Please leave a comment to let me know what you think about it! Share it to your friends and learn new things together.
Transcript
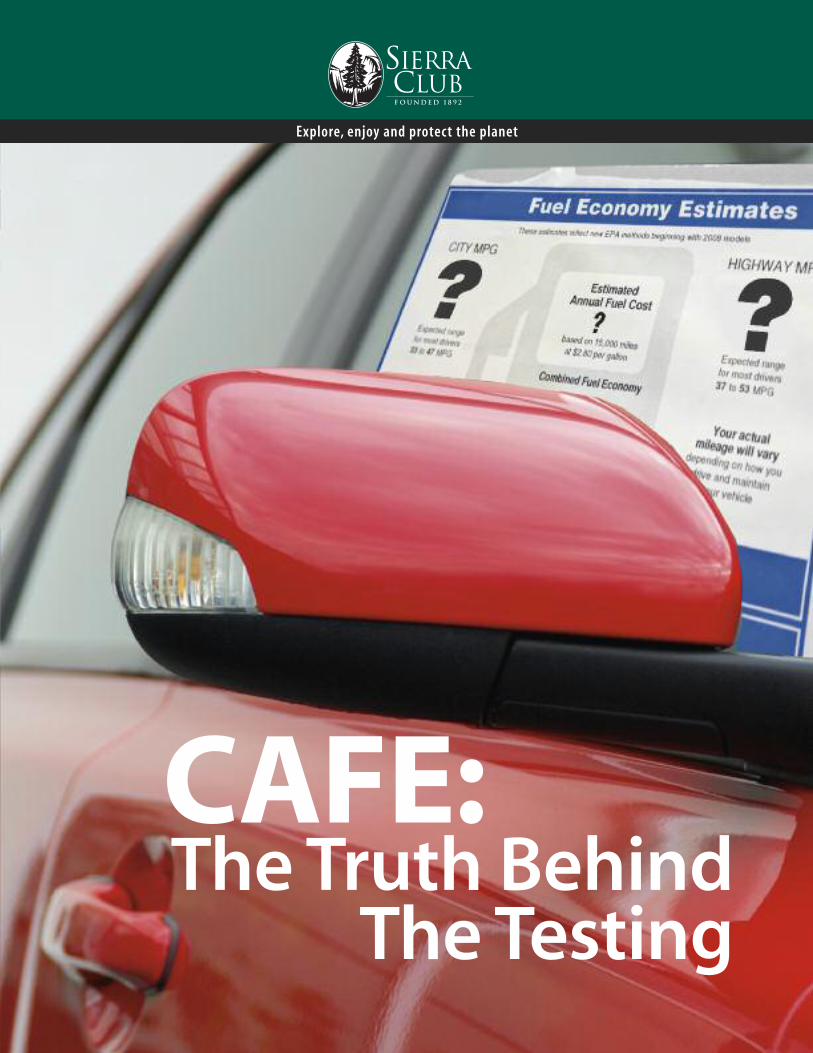
Explore, enjoy and protect the planet
CAFE: The Truth Behind
The Testing
3
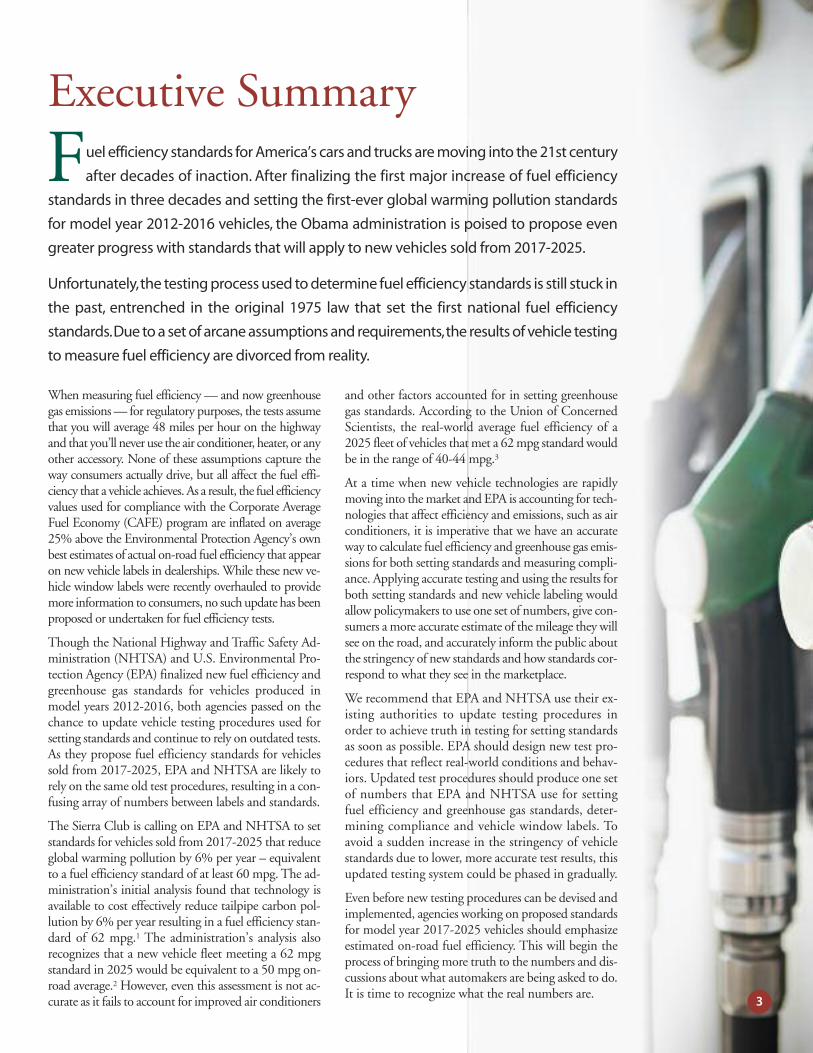
Executive Summary
When measuring fuel efficiency — and now greenhousegas emissions — for regulatory purposes, the tests assumethat you will average 48 miles per hour on the highwayand that you’ll never use the air conditioner, heater, or anyother accessory. None of these assumptions capture theway consumers actually drive, but all affect the fuel effi-ciency that a vehicle achieves. As a result, the fuel efficiencyvalues used for compliance with the Corporate AverageFuel Economy (CAFE) program are inflated on average25% above the Environmental Protection Agency’s ownbest estimates of actual on-road fuel efficiency that appearon new vehicle labels in dealerships. While these new ve-hicle window labels were recently overhauled to providemore information to consumers, no such update has beenproposed or undertaken for fuel efficiency tests.
Though the National Highway and Traffic Safety Ad-ministration (NHTSA) and U.S. Environmental Pro-tection Agency (EPA) finalized new fuel efficiency andgreenhouse gas standards for vehicles produced inmodel years 2012-2016, both agencies passed on thechance to update vehicle testing procedures used forsetting standards and continue to rely on outdated tests.As they propose fuel efficiency standards for vehiclessold from 2017-2025, EPA and NHTSA are likely torely on the same old test procedures, resulting in a con-fusing array of numbers between labels and standards.
The Sierra Club is calling on EPA and NHTSA to setstandards for vehicles sold from 2017-2025 that reduceglobal warming pollution by 6% per year – equivalentto a fuel efficiency standard of at least 60 mpg. The ad-ministration’s initial analysis found that technology isavailable to cost effectively reduce tailpipe carbon pol-lution by 6% per year resulting in a fuel efficiency stan-dard of 62 mpg.1 The administration’s analysis alsorecognizes that a new vehicle fleet meeting a 62 mpgstandard in 2025 would be equivalent to a 50 mpg on-road average.2 However, even this assessment is not ac-curate as it fails to account for improved air conditioners
and other factors accounted for in setting greenhousegas standards. According to the Union of ConcernedScientists, the real-world average fuel efficiency of a2025 fleet of vehicles that met a 62 mpg standard wouldbe in the range of 40-44 mpg.3
At a time when new vehicle technologies are rapidlymoving into the market and EPA is accounting for tech-nologies that affect efficiency and emissions, such as airconditioners, it is imperative that we have an accurateway to calculate fuel efficiency and greenhouse gas emis-sions for both setting standards and measuring compli-ance. Applying accurate testing and using the results forboth setting standards and new vehicle labeling wouldallow policymakers to use one set of numbers, give con-sumers a more accurate estimate of the mileage they willsee on the road, and accurately inform the public aboutthe stringency of new standards and how standards cor-respond to what they see in the marketplace.
We recommend that EPA and NHTSA use their ex-isting authorities to update testing procedures inorder to achieve truth in testing for setting standardsas soon as possible. EPA should design new test pro-cedures that reflect real-world conditions and behav-iors. Updated test procedures should produce one setof numbers that EPA and NHTSA use for settingfuel efficiency and greenhouse gas standards, deter-mining compliance and vehicle window labels. Toavoid a sudden increase in the stringency of vehiclestandards due to lower, more accurate test results, thisupdated testing system could be phased in gradually.
Even before new testing procedures can be devised andimplemented, agencies working on proposed standardsfor model year 2017-2025 vehicles should emphasizeestimated on-road fuel efficiency. This will begin theprocess of bringing more truth to the numbers and dis-cussions about what automakers are being asked to do.It is time to recognize what the real numbers are.
Fuel efficiency standards for America’s cars and trucks are moving into the 21st century
after decades of inaction. After finalizing the first major increase of fuel efficiency
standards in three decades and setting the first-ever global warming pollution standards
for model year 2012-2016 vehicles, the Obama administration is poised to propose even
greater progress with standards that will apply to new vehicles sold from 2017-2025.
Unfortunately, the testing process used to determine fuel efficiency standards is still stuck in
the past, entrenched in the original 1975 law that set the first national fuel efficiency
standards. Due to a set of arcane assumptions and requirements, the results of vehicle testing
to measure fuel efficiency are divorced from reality.
5
Introduction
Believe it or not, when regulators measure fuel effi-ciency for fuel economy standards and now tailpipegreenhouse gas standards, the tests assume that you willaverage 48 miles per hour on the highway and that youwill never use the air conditioner, heater, or any otheraccessory that might impact the vehicle’s fuel efficiency.When it comes to how we set fuel efficiency standards,we are in a world of fantasy numbers that are divorcedfrom reality. The fuel efficiency values used for com-pliance with the CAFE program are inflated on average25% above the Environmental Protection Agency’sown best estimates of actual on-road fuel efficiency asused for labeling purposes since model year (MY)4
2008. Although both the National Highway and Traf-fic Safety Administration (NHTSA) and U.S. Envi-ronmental Protection Agency (EPA) have finalized newfuel efficiency and greenhouse gas standards for cars andlight trucks produced in model years 2012-2016 andwill propose standards for model years 2017-2025, ve-hicle testing remains stuck in the past.
EPA has twice revised the way the tests are used tocalculate more accurate fuel efficiency estimates forvehicle window labels; these revisions will be dis-cussed later in more detail. However, even windowlabel numbers are estimates that rely on the old 1975tests, overlaid with additional tests that were not de-signed for accurately reflecting real-world fuel effi-ciency. Moreover, there has been no effort toreconcile the fuel efficiency values for testing andcompliance with national standards with the valuesdisplayed on window labels and seen on the road.Thus, the nation’s fuel efficiency and greenhouse gasemissions rating system is both complex and inaccu-rate. The result is two different ways of keeping thebooks on fuel efficiency: the unadjusted test valuesused for compliance with CAFE and greenhouse gasstandards (25% too high on average) and the ap-proach used to piece together more accurate valuesfor new vehicle labeling purposes, which are nowused in the annual EPA Fuel Economy Trends report.
The problem has only become more complicated nowthat EPA has finalized the first national greenhouse gasstandards for motor vehicles alongside new fuel effi-ciency standards. While EPA’s landmark greenhouse
gas standards will significantly cut oil consumption andreduce carbon pollution, EPA passed on the chance toupdate testing procedures to align standards with themileage that will appear on new vehicle labels.5
At a time when new vehicle technologies are rapidlymoving into the market and EPA is accounting for im-proved air conditioning systems and other technologiesthat affect efficiency and emissions, it is imperative thatwe have a way to accurately calculate vehicle fuel effi-ciency and use the results to determine new vehiclestandards. Accurate testing of new vehicles would allowpolicymakers to have coherent conversations based onone set of numbers, give consumers an accurate con-nection between standards and the mileage they willsee on the road and accurately inform the public aboutthe stringency of new standards.
This report will provide the history of how we got tothis confusing soup of numbers, detail the current testprocedures for both fuel efficiency and new greenhousegas standards and labels, and offer recommendationsfor how to move toward an accurate system that con-nects fuel efficiency standards to the real world.
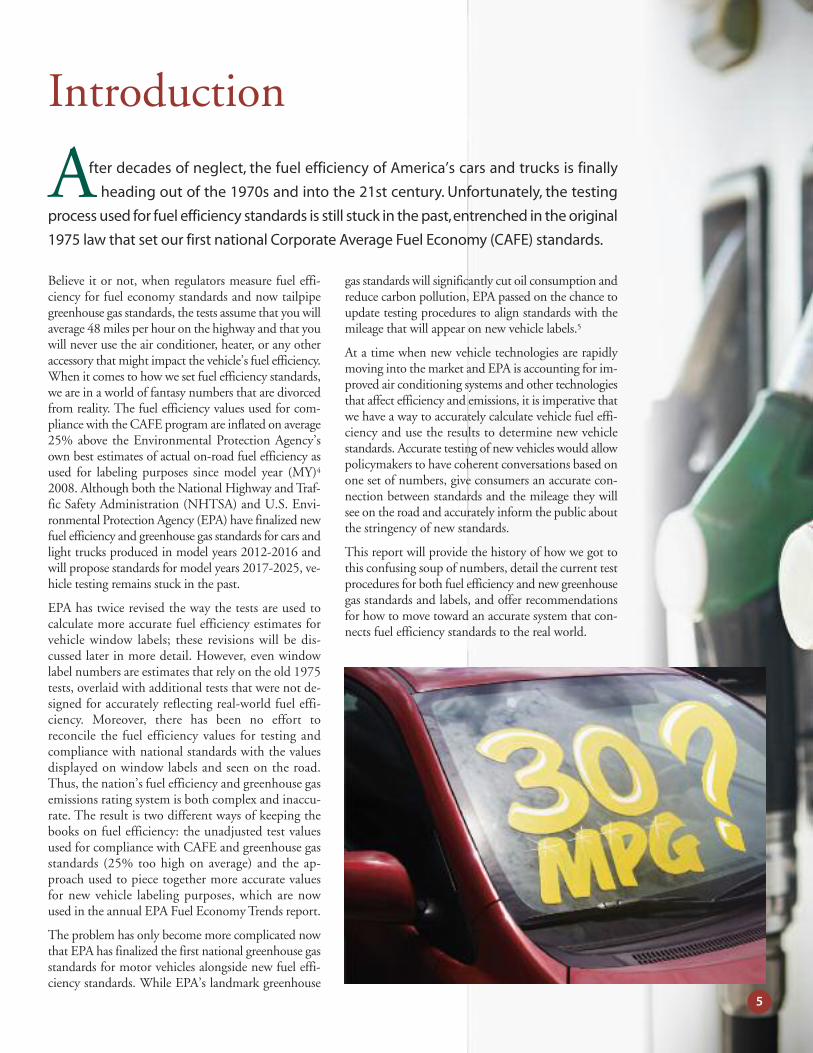
After decades of neglect, the fuel efficiency of America’s cars and trucks is finally
heading out of the 1970s and into the 21st century. Unfortunately, the testing
process used for fuel efficiency standards is still stuck in the past, entrenched in the original
1975 law that set our first national Corporate Average Fuel Economy (CAFE) standards.
EPCA – THE ORIGINAL FUEL ECONOMY LAW
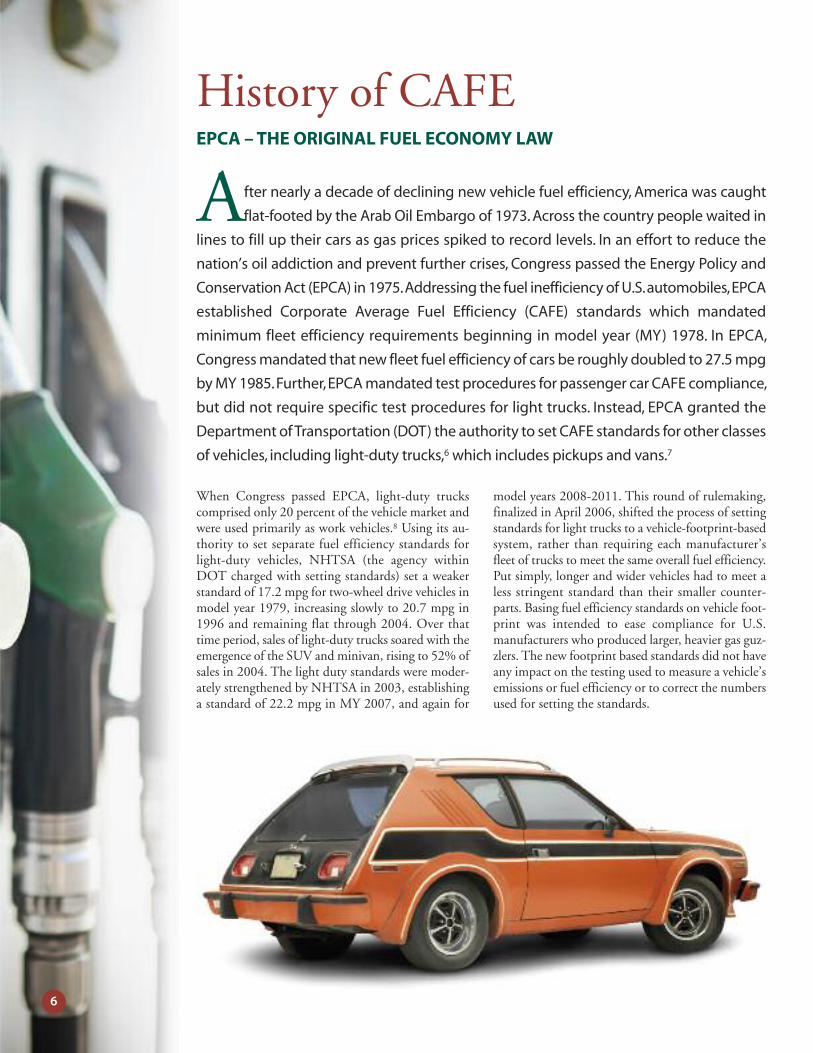
After nearly a decade of declining new vehicle fuel efficiency, America was caught
flat-footed by the Arab Oil Embargo of 1973. Across the country people waited in
lines to fill up their cars as gas prices spiked to record levels. In an effort to reduce the
nation’s oil addiction and prevent further crises, Congress passed the Energy Policy and
Conservation Act (EPCA) in 1975. Addressing the fuel inefficiency of U.S. automobiles, EPCA
established Corporate Average Fuel Efficiency (CAFE) standards which mandated
minimum fleet efficiency requirements beginning in model year (MY) 1978. In EPCA,
Congress mandated that new fleet fuel efficiency of cars be roughly doubled to 27.5 mpg
by MY 1985. Further, EPCA mandated test procedures for passenger car CAFE compliance,
but did not require specific test procedures for light trucks. Instead, EPCA granted the
Department of Transportation (DOT) the authority to set CAFE standards for other classes
of vehicles, including light-duty trucks,6 which includes pickups and vans.7
When Congress passed EPCA, light-duty truckscomprised only 20 percent of the vehicle market andwere used primarily as work vehicles.8 Using its au-thority to set separate fuel efficiency standards forlight-duty vehicles, NHTSA (the agency withinDOT charged with setting standards) set a weakerstandard of 17.2 mpg for two-wheel drive vehicles inmodel year 1979, increasing slowly to 20.7 mpg in1996 and remaining flat through 2004. Over thattime period, sales of light-duty trucks soared with theemergence of the SUV and minivan, rising to 52% ofsales in 2004. The light duty standards were moder-ately strengthened by NHTSA in 2003, establishinga standard of 22.2 mpg in MY 2007, and again for
model years 2008-2011. This round of rulemaking,finalized in April 2006, shifted the process of settingstandards for light trucks to a vehicle-footprint-basedsystem, rather than requiring each manufacturer’sfleet of trucks to meet the same overall fuel efficiency.Put simply, longer and wider vehicles had to meet aless stringent standard than their smaller counter-parts. Basing fuel efficiency standards on vehicle foot-print was intended to ease compliance for U.S.manufacturers who produced larger, heavier gas guz-zlers. The new footprint based standards did not haveany impact on the testing used to measure a vehicle’semissions or fuel efficiency or to correct the numbersused for setting the standards.
6
History of CAFE
ENERGY INDEPENDENCE AND SECURITY ACT OF 2007
In December 2007 Congress passed the Energy Inde-pendence and Security Act of 2007 (EISA), which in-cluded the first substantial changes to the CAFEprogram since its 1975 inception. EISA required newstandards to be set at the “maximum feasible” level,including a new standard of at least 35 mpg by 2020for the combined new passenger car and light truckfleet.9 As part of this historic increase in fuel efficiency,Congress directed NHTSA to use an attribute-basedsystem, previously incorporated in the MY 2008-2011Light Truck Rule, to set new standards rather than re-quiring each manufacturer to achieve one fuel effi-ciency average of cars and another for light trucks.
While EISA did not mandate which attribute shouldbe used, NHTSA selected vehicle footprint as the at-tribute on which to base new vehicle standards. As dis-cussed previously, footprint-based standards allowlarger footprint vehicles to meet a lower standard thanvehicles with smaller footprints. While EISA mandatedhigher standards, it did not address vehicle testing, in-stead keeping in place test procedures that had notbeen updated in more than 30 years.
Therefore the mandate in EISA to set a new vehiclefleet that meets a 35 mpg standard is equivalent toroughly a 29 mpg on-road standard.
7
PRESIDENT OBAMA ANNOUNCES CAFE INCREASES AND NEWGREENHOUSE GAS STANDARDSLess than one week after taking office, President Obamasigned memoranda directing EPA to re-evaluate its ini-tial denial of California’s clean car waiver.10 California,which has unique authority under the Clean Air Act toset emissions standards, acted during the years of stag-nating fuel efficiency standards. President Obama thenordered the Department of Transportation to issue fuelefficiency standards for the 2011 model year only,11
rather than finalizing the standards the Bush adminis-tration had proposed for model years 2011-2015.
Following up on those directives, in May 2009 Presi-dent Obama announced that his administration wouldraise fuel efficiency for cars and light trucks to a fleetaverage of 35.5 mpg by 2016 — achieving the goal ofthe 2007 energy bill four years early. This move alsocreated new national greenhouse gas emissions stan-dards of 250 grams of greenhouse gases per mile, theequivalent to nationalizing the California’s greenhousegas emissions standards for cars and light trucks.
On April 1, 2010, EPA and NHTSA finalized rulesthat will carry out the President’s announcement, set-ting 2016 standards of 250 grams carbon dioxideequivalent per mile (gCO2e/mi), which is equal to35.5 mpg (or 34.1 mpg if the value of the air condi-tioning credits is accounted for).12 In an attempt tomake the two standards as similar as possible, neitherEPA nor NHTSA attempted to change test proceduresfor the purposes of compliance, even though EPA haswide latitude to adopt new testing procedures for allvehicles and NHTSA has existing authority to change
testing procedures for light trucks. However, in theproposed rule, the agencies did note the inadequacy ofthe tests and their desire to update them, stating:
“Both EPA and NHTSA are interested in developingprograms that employ test procedures that are morerepresentative of real world driving conditions, to theextent authorized under their respective statutes. Thisis an important issue, and the agencies intend to ad-dress it in the context of a future rulemaking to ad-dress standards for model year 2017 and thereafter.”13
While it is encouraging that the agencies recognizedthe deficiencies of the current testing procedures, theagencies are already moving ahead with standards forvehicles sold in model years 2017-2025.
On September 30, 2010, EPA and NHTSA an-nounced that they were beginning the rulemakingprocess to set new vehicle standards for model years2017-2025 and would consider setting standards thatreduced emissions between 3 and 6% annually, equiv-alent to a range of 47-62 mpg, as measured by out-dated test procedures. The agencies recognize that theon-road fuel efficiency of a 62 mpg standard may onlybe 50 mpg; however, the actual real world number maybe as low as 40 mpg once emissions reductions from airconditioning systems and other factors are accountedfor.14 As the process to set standards through 2025 con-tinues, it is critical that the agencies move away fromtests designed in the 1970s and create tests that providereal world values for both standards and labels.
At the core of CAFE standards (and now greenhouse gas vehicle standards) is a
standardized method of testing vehicle fuel efficiency. Pursuant to EPCA, the EPA
published fuel efficiency testing procedures in 1976, effective with MY 1977.15Two testing
procedures, the Federal Testing Procedure (FTP), or “city” test, and the Highway Fuel
Economy Test (HFET), or “highway” test, were established as the basis for both CAFE and
labeling purposes.16 While both city and highway values are displayed on new vehicle
window labels, the two values are combined to determine CAFE compliance.
8
HISTORY OF FUEL ECONOMY TESTING
Originally developed for measuring tailpipe emis-sions and subsequently adopted to calculate city fuelefficiency, EPA developed the Federal Test Procedure(FTP) in the 1960s to simulate a drive in central LosAngeles. Covering 11 miles, a vehicle in the city teststarts with a cold engine, averages 21.2 miles per hourand reaches a top speed of 56 mph. The FTP simu-lates stop-and-go traffic, with vehicles stopping 23times, idling 18 percent of the time and acceleratingat a maximum rate of 3.3 mph/second.17
EPA designed the Highway Fuel Economy Test(HFET) in 1974, to estimate highway fuel efficiencysimulating a mix of rural and interstate highway driv-ing. In the HFET, vehicles start with a warm engineand drive 10.3 miles, averaging 48.3 miles per hourand reaching a maximum speed of 60 mph. Vehiclesdo not idle or stop during the test and accelerate at amaximum of 3.2 mph/second.18
Both the FTP and HFET are conducted in laborato-ries kept at a temperature of approximately 75 de-grees Fahrenheit. Vehicles are run without accessoriesoperating, including air conditioners, lights, heaters,or defrosters. During each test, a professional driverruns the vehicle following a standardized speed versustime schedule while on a dynamometer, a machineused to simulate vehicle road loads. Throughout thetest, a hose is connected to the tailpipe to continu-ously sample emissions in the exhaust. The amountof fuel consumed is calculated by measuring theamount of carbon in the collected exhaust and theamount of carbon in a gallon of gasoline.
While the EPA establishes test procedures, it does nottest each vehicle or each model. Instead, manufac-turers must test each model and submit results.When testing vehicles, manufacturers are allowed touse pre-production prototypes that may be special-ized to achieve better results. The EPA then confirmsthe results for roughly 10-15 percent of models in itsAnn Arbor, MI research facility.
EPA will not begin testing and assigning a fuel effi-ciency value for large SUVs and pickups – those thatweigh more than 8,500 pounds, such as the Ford F-250 and F-350 pickup trucks, GMC 1/2 ton YukonXL SUVs, and Chevrolet Express 2500 Passengervans — until MY 2011. EPCA restricted NHTSA’sregulatory authority to vehicles that weigh no morethan 10,000 pounds gross vehicle weight rating(GVWR)19; however, NHTSA chose to exempt ve-hicles weighing more than 8,500 pounds GVWRfrom fuel efficiency requirements. In MY 2011, newCAFE regulations will apply to trucks rated up to10,000 GVWR. It is important to note that, as a re-sult of pressure from agricultural interests, largepickup trucks will not be included in the new pro-gram. The EISA created a new class of “work trucks”for fuel efficiency purposes. Congress directed DOTto set fuel efficiency standards for these vehicles,which will include passenger vans and SUVs weigh-ing more than 10,000 pounds and pickups and cargovans that weigh more than 8,500 pounds, through aseparate process that is currently underway.
Fuel Economy Testing
It is clear that the current tests used to determine fuel efficiency standards and com-
pliance as well as new greenhouse gas emissions standards were behind the times
when they were designed and have grown more outdated ever since. These tests fail to
represent realistic driving conditions and are inadequate for accounting for new tech-
nologies, leading to inflated compliance estimates and allowing manufacturers to design
technologies to perform on the test but not necessarily on the road. Both the city and
highway test are filled with outdated assumptions that are geared to give the most fa-
vorable mpg rating for vehicles.
9
Failing the Tests?
SPEED AND ACCELERATIONBoth city and highway tests incorporate speeds, ac-celeration and braking that are significantly slowerthan today’s driving patterns. Designed a quarter-cen-tury ago when the national speed limit was 55 mph,20
the highway test sets a maximum speed of 60 mph.Since the inception of fuel efficiency testing, the na-tional speed limit has been abolished and most stateshave adopted interstate speed limits of 65 or 70 mph.In its analysis, the EPA found that 28 percent of driv-ing occurs at speeds greater than 60 mph.21 Driving athigher speeds greatly affects fuel efficiency. A Depart-ment of Transportation study shows that a vehicletraveling 70 mph achieves 17.1% lower fuel efficiencythan a vehicle traveling 55 mph.22
Similarly, the acceleration rates used in both tests aredramatically slower than those seen in on-road driving,further inflating fuel efficiency estimates. Instead of bas-ing acceleration rates on real-world behavior, the testsassumed slower acceleration rates because dynamome-ters (basically treadmills used for vehicle testing) in the1970s could not withstand real-world acceleration.23
While the city and highway tests assume maximum ac-celeration rates of 3.3 and 3.2 mph/second, respectively,on-road driving studies have found maximum acceler-ation rates of roughly 11-12 mph/second.24
In its analysis, EPA found that 33 percent of real-world driving does not fall within the speed and ac-celeration assumptions of the city and highway testprocedures.25
TEMPERATUREEPA directs tests to be conducted at approximately75 degrees Fahrenheit, simulating trips in southernCalifornia. At higher and lower temperatures, fuel ef-ficiency declines. Indeed, according to the EPA, only
about 20 percent of driving occurs between 70 and80 degrees Fahrenheit.26 Roughly 15 percent of driv-ing occurs above 80 degrees F, 65% of driving takesplace below 70 degrees F. In tests, EPA found that ve-hicles driven at cold temperatures achieved signifi-cantly lower fuel efficiency than those driven in testconditions and that performance ranged widely fromvehicle to vehicle. At 20 degrees F, vehicles averaged12% lower fuel efficiency than those driven in thestandard FTP test, with some vehicles showing fuelefficiency losses as much as 40 percent.27
ACCESSORIESAlthough not standard on many vehicles in the1970s, 99 percent of new cars and light trucks areoutfitted with air conditioning.28 While fuel effi-ciency tests are not run with accessories operating, itis clear that accessories such as air conditioners sub-stantially decrease fuel efficiency. A 2003 study bythe National Renewable Energy Laboratory foundthat mobile air conditioning operation consumesroughly 5.5 percent of fuel used annually by passen-ger vehicles.29 EPA analysis shows that running a ve-hicle with air conditioners at 95 degrees F reducesfuel efficiency by an average of 21 percent. Accordingto the Natural Resources Defense Council, this ac-counts for roughly one-quarter of the gap betweentest fuel efficiency and the Energy Information Ad-ministration’s on-road fuel efficiency estimate.30
OTHERMany other factors that can affect fuel efficiency are ei-ther considered inadequately or not at all in the test pro-cedures. These factors include trip length, the amount ofweight carried in the vehicle, lower energy content inalternative fuels, such as ethanol, and aftermarket tires.
10
A Tale of Two Numbers: CAFECompliance vs. EPA Labels
Historically, responsibilities for different aspects of the CAFE program have been
split between EPA, the Department of Transportation (DOT), and the Department
of Energy (DOE). EPA is responsible for determining fuel efficiency test procedures,
estimating fuel efficiency to be placed on window stickers and in an annual fuel efficiency
booklet and calculating each manufacturer’s corporate average fuel economy.31 DOT
administers the CAFE compliance program, including establishing standards for passenger
and non-passenger vehicles if necessary and determining manufacturer compliance with
CAFE standards and assessing penalties as needed.32 DOE is responsible for publishing
and distributing the annual fuel efficiency information booklet.33 And, finally, EPA issues
the annual Fuel Economy Trends Report.
Under the new National Program, which consists of EPA’s greenhouse gas standards and
DOT’s CAFE standards, both agencies will administer separate compliance programs;
however, EPA will still be responsible for vehicle testing.
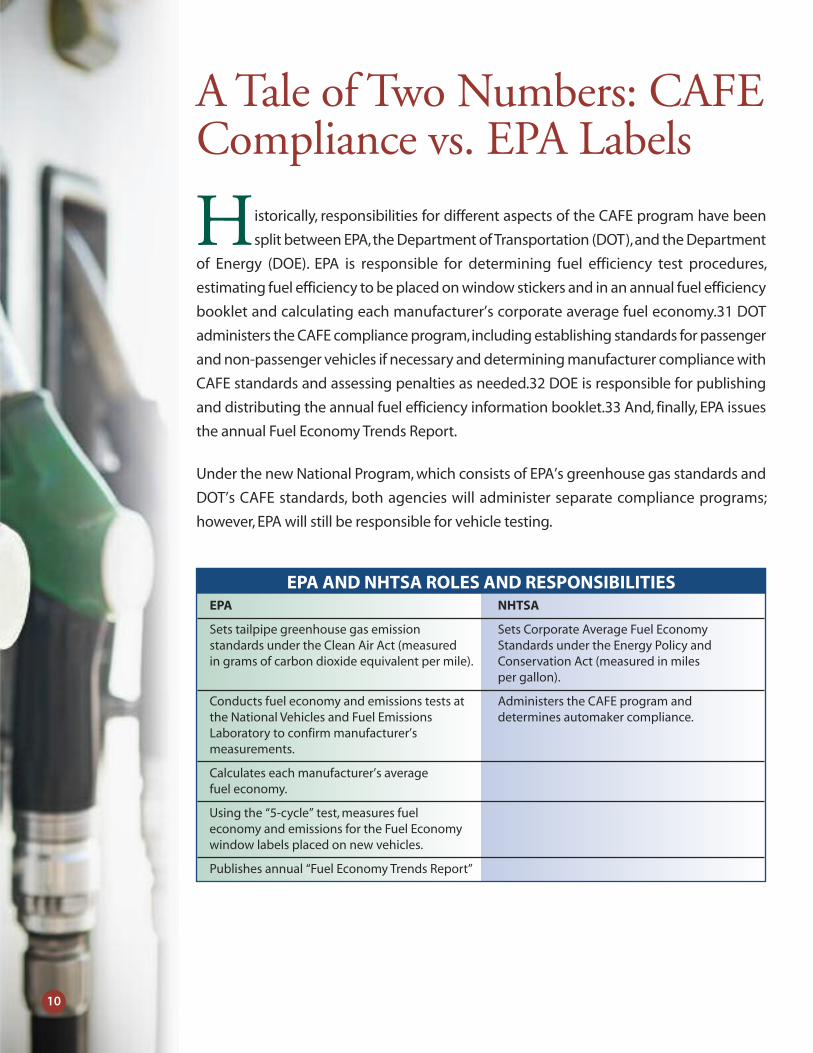
EPA AND NHTSA ROLES AND RESPONSIBILITIESEPA NHTSA
Sets tailpipe greenhouse gas emission Sets Corporate Average Fuel Economy standards under the Clean Air Act (measured Standards under the Energy Policy and in grams of carbon dioxide equivalent per mile). Conservation Act (measured in miles
per gallon).
Conducts fuel economy and emissions tests at Administers the CAFE program and the National Vehicles and Fuel Emissions determines automaker compliance.Laboratory to confirm manufacturer’s measurements.
Calculates each manufacturer’s average fuel economy.
Using the “5-cycle” test, measures fuel economy and emissions for the Fuel Economy window labels placed on new vehicles.
Publishes annual “Fuel Economy Trends Report”
11
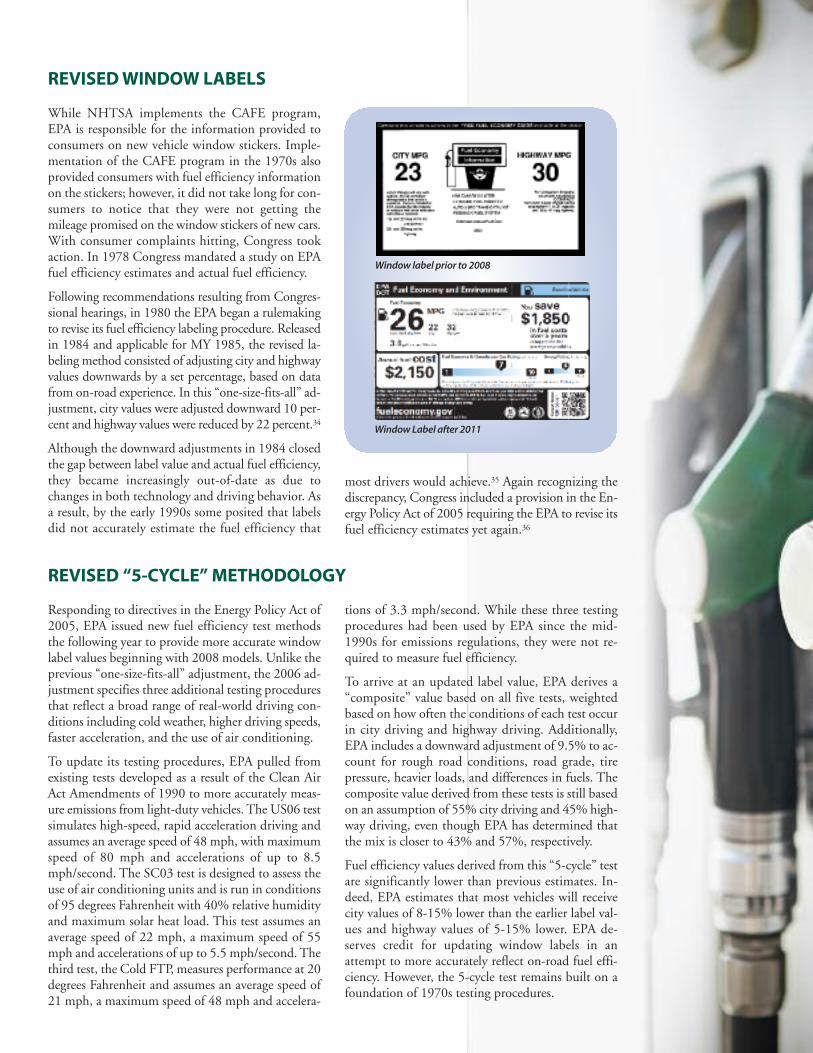
REVISED WINDOW LABELS
While NHTSA implements the CAFE program,EPA is responsible for the information provided toconsumers on new vehicle window stickers. Imple-mentation of the CAFE program in the 1970s alsoprovided consumers with fuel efficiency informationon the stickers; however, it did not take long for con-sumers to notice that they were not getting themileage promised on the window stickers of new cars.With consumer complaints hitting, Congress tookaction. In 1978 Congress mandated a study on EPAfuel efficiency estimates and actual fuel efficiency.
Following recommendations resulting from Congres-sional hearings, in 1980 the EPA began a rulemakingto revise its fuel efficiency labeling procedure. Releasedin 1984 and applicable for MY 1985, the revised la-beling method consisted of adjusting city and highwayvalues downwards by a set percentage, based on datafrom on-road experience. In this “one-size-fits-all” ad-justment, city values were adjusted downward 10 per-cent and highway values were reduced by 22 percent.34
Although the downward adjustments in 1984 closedthe gap between label value and actual fuel efficiency,they became increasingly out-of-date as due tochanges in both technology and driving behavior. Asa result, by the early 1990s some posited that labelsdid not accurately estimate the fuel efficiency that
most drivers would achieve.35 Again recognizing thediscrepancy, Congress included a provision in the En-ergy Policy Act of 2005 requiring the EPA to revise itsfuel efficiency estimates yet again.36
REVISED “5-CYCLE” METHODOLOGY
Responding to directives in the Energy Policy Act of2005, EPA issued new fuel efficiency test methodsthe following year to provide more accurate windowlabel values beginning with 2008 models. Unlike theprevious “one-size-fits-all” adjustment, the 2006 ad-justment specifies three additional testing proceduresthat reflect a broad range of real-world driving con-ditions including cold weather, higher driving speeds,faster acceleration, and the use of air conditioning.
To update its testing procedures, EPA pulled fromexisting tests developed as a result of the Clean AirAct Amendments of 1990 to more accurately meas-ure emissions from light-duty vehicles. The US06 testsimulates high-speed, rapid acceleration driving andassumes an average speed of 48 mph, with maximumspeed of 80 mph and accelerations of up to 8.5mph/second. The SC03 test is designed to assess theuse of air conditioning units and is run in conditionsof 95 degrees Fahrenheit with 40% relative humidityand maximum solar heat load. This test assumes anaverage speed of 22 mph, a maximum speed of 55mph and accelerations of up to 5.5 mph/second. Thethird test, the Cold FTP, measures performance at 20degrees Fahrenheit and assumes an average speed of21 mph, a maximum speed of 48 mph and accelera-
tions of 3.3 mph/second. While these three testingprocedures had been used by EPA since the mid-1990s for emissions regulations, they were not re-quired to measure fuel efficiency.
To arrive at an updated label value, EPA derives a“composite” value based on all five tests, weightedbased on how often the conditions of each test occurin city driving and highway driving. Additionally,EPA includes a downward adjustment of 9.5% to ac-count for rough road conditions, road grade, tirepressure, heavier loads, and differences in fuels. Thecomposite value derived from these tests is still basedon an assumption of 55% city driving and 45% high-way driving, even though EPA has determined thatthe mix is closer to 43% and 57%, respectively.
Fuel efficiency values derived from this “5-cycle” testare significantly lower than previous estimates. In-deed, EPA estimates that most vehicles will receivecity values of 8-15% lower than the earlier label val-ues and highway values of 5-15% lower. EPA de-serves credit for updating window labels in anattempt to more accurately reflect on-road fuel effi-ciency. However, the 5-cycle test remains built on afoundation of 1970s testing procedures.
Window label prior to 2008
Window Label after 2011
12
Implications of InaccurateCAFE Values
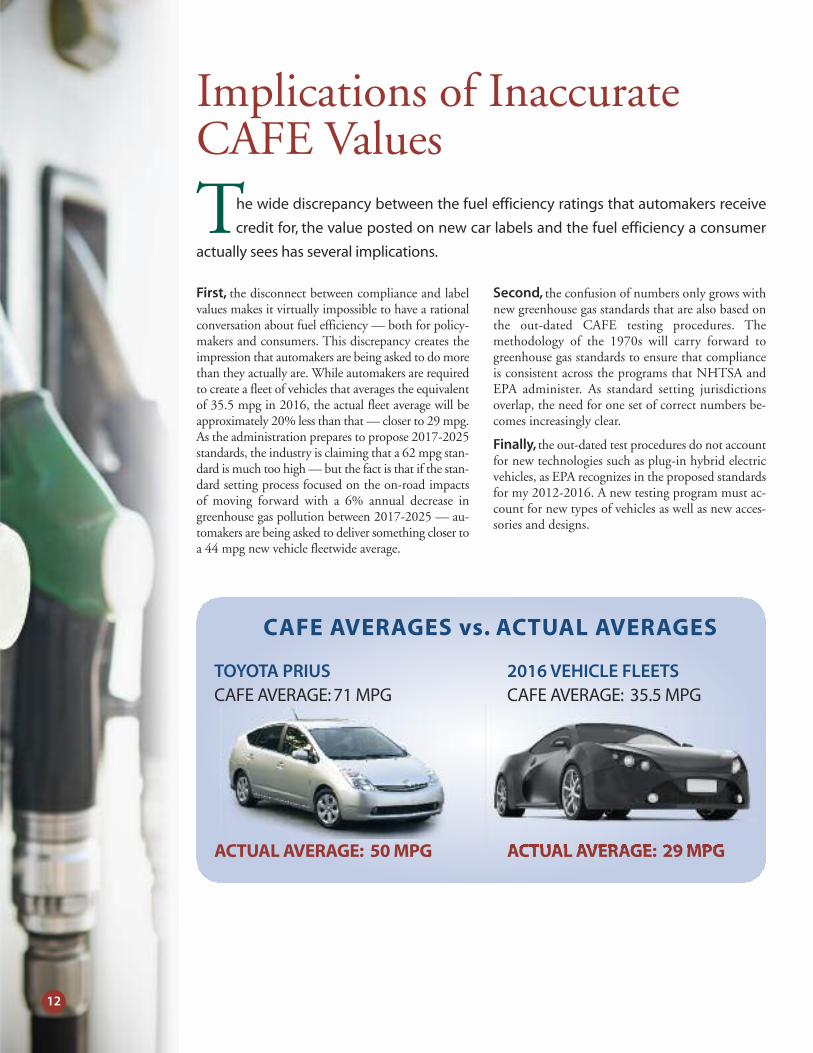
First, the disconnect between compliance and labelvalues makes it virtually impossible to have a rationalconversation about fuel efficiency — both for policy-makers and consumers. This discrepancy creates theimpression that automakers are being asked to do morethan they actually are. While automakers are requiredto create a fleet of vehicles that averages the equivalentof 35.5 mpg in 2016, the actual fleet average will beapproximately 20% less than that — closer to 29 mpg.As the administration prepares to propose 2017-2025standards, the industry is claiming that a 62 mpg stan-dard is much too high — but the fact is that if the stan-dard setting process focused on the on-road impactsof moving forward with a 6% annual decrease ingreenhouse gas pollution between 2017-2025 — au-tomakers are being asked to deliver something closer toa 44 mpg new vehicle fleetwide average.
Second, the confusion of numbers only grows withnew greenhouse gas standards that are also based onthe out-dated CAFE testing procedures. Themethodology of the 1970s will carry forward togreenhouse gas standards to ensure that complianceis consistent across the programs that NHTSA andEPA administer. As standard setting jurisdictionsoverlap, the need for one set of correct numbers be-comes increasingly clear.
Finally, the out-dated test procedures do not accountfor new technologies such as plug-in hybrid electricvehicles, as EPA recognizes in the proposed standardsfor my 2012-2016. A new testing program must ac-count for new types of vehicles as well as new acces-sories and designs.
The wide discrepancy between the fuel efficiency ratings that automakers receive
credit for, the value posted on new car labels and the fuel efficiency a consumer
actually sees has several implications.
TOYOTA PRIUS CAFE AVERAGE: 71 MPG
ACTUAL AVERAGE: 50 MPG
2016 VEHICLE FLEETSCAFE AVERAGE: 35.5 MPG
CAFE AVERAGES vs. ACTUAL AVERAGES
ACTUAL AVERAGE: 29 MPG
13
Looking Forward: Policy Recommendations
Fuel efficiency and tailpipe emissions testing procedures are inaccurate and in need
of a long overdue change that will bring them into the 21st century.
While NHTSA is statutorily constrained by EPCAwhen setting test procedures for CAFE standards forcars, it does have the authority to establish new testprocedures for light trucks. Additionally, under theClean Air Act, EPA has wide latitude to institutetest procedures that accurately represent on-roadgreenhouse gas emissions. It is vital that both EPAand NHTSA use their respective authorities to de-velop and implement accurate testing procedures assoon as possible.
Accurate testing of new vehicles and use of these newprocedures to guide new vehicle standards wouldallow policymakers to have coherent conversationsbased on one set of numbers for both compliancewith the law and new vehicle window labels. Accuratetesting will also give consumers a better sense of theaverage mileage they will see on the road and allowautomakers to showcase gains in fuel efficiency with-out having to qualify them. To achieve this, we rec-ommend the following:
Design new tests to reflect real-worldconditions and behaviorAlthough EPA’s updated window label testing pro-cedures are more accurate, they remain an ad hoc ap-proach. Instead of collecting real-world data andtesting sample vehicles to inform new tests, EPA hascontinued to rely on existing tests with a simple ad-justment to glue them together. Instead of upgrad-ing existing tests, EPA, in consultation with DOT
and DOE, should develop new testing proceduresthat incorporate road and weather conditions, use ofaccessories and more aggressive driving habits.
While NHTSA is statutorily constrained, EPA canand should implement new test procedures for pas-senger vehicle greenhouse gas standards. Similarly,NHTSA should use its authority to use new vehicletest procedures for light trucks. These changes willbegin the process of reforming testing and standards.
One set of numbers, phased inEPA and DOT should use one set of numbers, to theextent possible, based on updated testing proceduresthat reflect real world conditions and behavior forboth compliance and labeling. Using accurate fuel ef-ficiency and greenhouse gas values for compliancewith standards will ensure that the technologies im-plemented by manufacturers yield the most cost-ef-fective reductions in the real world, instead of onunrepresentative test cycles.
Because accurate tests will yield lower fuel efficiencyvalues, making existing standards (set based on in-flated testing values) harder to meet, accurate valuescould be phased in. A phase-in period of five yearswould avoid a sudden requirement for automakers toproduce more efficient vehicles, instead allowingthem to plan ahead for a steady increase in standardsthat will yield significant reductions in oil consump-tion and greenhouse gas emissions.
CONCLUSION
As our fuel efficiency and greenhouse gas standardscome out of the 1970s and into the 21st century, itis critical that testing procedures not remain miredin outdated and flawed assumptions. As EPA andNHTSA develop new standards for vehicles soldfrom 2017-2025, Sierra Club is calling on the Ad-ministration to decrease emissions by 6% per yearand set a fuel efficiency standard of at least 60 mpg by
2025. Due to outdated tests, the truth is that the on-road fuel efficiency of hitting 60 mpg could be closerto a 44 mpg. As the EPA and the DOT proceed withstandards that will make our cars and trucks cleanerand more efficient, they must embrace “truth in test-ing” in order to ensure that standards are grounded inreal values and that automakers are measured by theperformance that consumers see on the road.
14
Endnotes1 Environmental Protection Agency and National Highway TrafficSafety Administration. 2017 and Later Model Year Light DutyVehicle GHG Emissions and CAFE Standards; Notice of Intent.Oct. 2010. http://www.regulations.gov/#!documentDetail;D=NHTSA-2010-0131-0001
2 Ibid.
3 Union of Concerned Scientists. Translating New Auto Standardsinto On-Road Fuel Efficiency. May 2011.http://www.ucsusa.org/assets/documents/clean_vehicles/Trans-lating-Standards-into-On-Road.pdf
4 Vehicle sales are classified and regulated in “model years,” whichdo not necessarily correspond to calendar years. For the pur-poses of fuel economy and greenhouse gas standards, a modelyear is the annual production period for a vehicle manufacturerthat includes January 1 of the calendar year.
5 Similarly, California will soon consider its second round of cleancar standards, which will include compliance targets likely basedon the same tests.
6 Sierra Club, et al., Increasing America’s Fuel Economy. Feb. 2002.
7 The US Code defines a light-duty truck as any vehicle rated8,500 lbs GVWR or less and a curb weight of 6,000 lbs or lessthat is used either for the transportation of property or morethan 12 people or has off-street capability. This class coversmany minivans, sport-utility vehicles, and smaller pickuptrucks. (40 CFR 86.82-2)
8 Sierra Club, et al., Increasing America’s Fuel Economy. Feb. 2002.
9 Congressional Research Service. Automobile and Light Truck FuelEconomy: The CAFE Standards. 2008.http://assets.opencrs.com/rpts/RL33413_20080507.pdf
10 Under the Clean Air Act, California is allowed to implementmore stringent pollution standards for motor vehicles. However,before implementing more stringent regulations, Californiamust receive a waiver from the US EPA. In December 2007,the Bush Administration denied California a waiver to imple-ment its Pavley clean car standards. The denial marked the firsttime that EPA had denied California a Clean Air Act waiver.
11 The Bush Administration initiated the rulemaking process forMY 2011-2015, ramping up to a fleetwide 31.6 mpg in 2015.The Bush DOT did not issue the final rule, leaving it to the newObama DOT to finalize the standards. President Obama’s ac-tion directed DOT to issue the 2011 model year standard only,creating the room for a re-evaluating the longer term program.
12 If all emissions reductions used to meet the standard EPA’s stan-dard of 250 grams of Carbon Dioxide equivalent per mile weremet through improvements in fuel economy, the equivalent fueleconomy standard would be 35.5 miles per gallon. However,EPA’s standards allow for improvements in air conditioner effi-ciency and changes in refrigerants, while NHTSA’s CAFE stan-dards do not. Therefore, the final fuel economy standards were setlower, at 34.1 mpg, to account for air conditioning improvementsthat could be made in EPA’s standards, but not NHTSA’s.
13 Proposed Rulemaking To Establish Light-Duty Vehicle Green-house Gas Emission Standards and Corporate Average FuelEconomy Standards; Proposed Rule. Federal Register Vol. 74,No. 186 (28 Sept. 2009) 49454-49502
14 Union of Concerned Scientists. Translating New Auto Standardsinto On-Road Fuel Efficiency. May 2011. http://www.ucsusa.org/assets/documents/clean_vehicles/Translating-Standards-into-On-Road.pdf
15 Fuel Economy Labeling of Motor Vehicles: Revisions To Im-prove Calculation of Fuel Economy Estimates; Proposed Rule.Federal Register Vol. 71, No. 21. (1 Feb. 2006) 5426-5513.
16 Ibid.
17 US Environmental Protection Agency and US Department ofEnergy. Detailed Test Information. Accessed June 8, 2010 fromhttp://www.fueleconomy.gov/feg/fe_test_schedules.shtml
18 Ibid.
19 Gross Vehicle Weight Rating (GVWR), is the maximum allow-able total mass of a vehicle when loaded. GWVR includes theweight of the vehicle, as well as the weight of fuel, passengers,cargo and trailer tongue weight.
20 As a result of the Emergency Highway Energy ConservationAct, national speed limits were capped at 55 miles per hourfrom 1974 through 1987.
21 Fuel Economy Labeling of Motor Vehicles: Revisions To Im-prove Calculation of Fuel Economy Estimates; Proposed Rule.Federal Register Vol. 71, No. 21. (1 Feb. 2006) 5426-5513.
22 Data shown in Transportation Energy Data Book: Edition 23;Stacy C. Davis and Susan W. Diegel; Oak Ridge National Lab-oratory; ORNL-6970; Prepared for the U.S. Department ofEnergy; October 2003.
23 Ibid.
24 Fuel Economy Labeling of Motor Vehicles: Revisions To Im-prove Calculation of Fuel Economy Estimates; Proposed Rule.Federal Register Vol. 71, No. 21. (1 Feb. 2006) 5426-5513.
25 Ibid.
26 Ibid.
27 Ibid
28 Natural Resources Defense Council. Comments on the Peti-tion to Amend Fuel Economy Testing and Calculation Proce-dures. EPA Docket No. OAR-2003-0214. July 2004.
29 Rugh, J. and V. Hovland, National and World Fuel Savings andCO2 Emission Reductions by Increasing Vehicle Air ConditioningCOP, presentation at the 2003 Alternate Refrigerant Systems Sym-posium, National Renewable Energy Laboratory, July 17, 2003.
30 Natural Resources Defense Council. Comments on the Peti-tion to Amend Fuel Economy Testing and Calculation Proce-dures. EPA Docket No. OAR-2003-0214. July 2004.
31 Fuel Economy Labeling of Motor Vehicles: Revisions To Im-prove Calculation of Fuel Economy Estimates; Proposed Rule.Federal Register Vol. 71, No. 21. (1 Feb. 2006) 5426-5513.
32 Ibid. Automakers failing to comply with a given model yearstandards are required to pay a penalty ($5 per x mpg belowthe standard). Automakers averages are, however, determinedon a rolling basis with automakers able to apply credits earnedfrom overcompliance or from borrowing from as many as threeyears in the future. None of the Detroit automakers have everyfailed to comply with standards, whereas some European lux-ury and sports car brands pay penalties annually.
33 Fuel Economy Labeling of Motor Vehicles: Revisions To Im-prove Calculation of Fuel Economy Estimates; Proposed Rule.Federal Register Vol. 71, No. 21. (1 Feb. 2006) 5426-5513.
34 Ibid.
35 Mintz, M.M., A.R.D. Vyas, and L.A. Conley. Differences be-tween EPA-Test and In-Use Fuel Economy: Are the CorrectionFactors Correct? Paper No.931104, Transportation ResearchBoard, Washington, DC, Jan. 1993.
36 Fuel Economy Labeling of Motor Vehicles: Revisions To Im-prove Calculation of Fuel Economy Estimates; Proposed Rule.Federal Register Vol. 71, No. 21. (1 Feb. 2006) 5426-5513.
For more information: www.sierraclub.org
Related Documents