EDITOR'S CORNER Systems Biomedicine 1:4, 1–12; October/November/December 2013; © 2013 Landes Bioscience EDITOR'S CORNER www.landesbioscience.com Systems Biomedicine 1 Introduction An important milestone for systems biology is the devel- opment of methods that accurately and completely describe a disease state using molecular data. Such methods will lead to improved patient prognosis by providing more precise diagnoses and a clearer understanding of underlying pathologies to aid design of optimal therapeutic plans. These advancements require the discovery and characterization of biomarkers. The Biomarkers Definitions Working Group 1 defines biomarkers as characteristics that are objectively mea- sured and evaluated and serve as indicators of normal biological or pathogenic processes, or pharmacological responses to a thera- peutic intervention. A biomarker can be as simple as the presence or absence of a single gene or gene product that indicates a disease state. However, most disease biomarkers are likely characterized by a collection of gene or gene product states, each contributing to a specific diagnostic signature that can complement, or per- haps even replace, traditional clinical diagnoses based on medi- cal examination or pathological evaluation. Earlier attempts to discover molecular biomarkers have focused on identification of differentially expressed genes or gene products, between case and control populations. 2 More recent methods have endeavored to be increasingly predictive of new cases, thereby leading to enhanced diagnosis, improved prognostication, and the advance- ment of personalized medicine. 3 Researchers in the public and private sectors are racing to uncover diagnostic signatures for a variety of disease states using a host of novel computational and experimental techniques. To address practical concerns and foster the development of methodologies that are robust and versatile for clinical *Correspondence to: Kahn Rhrissorrakrai; Email: [email protected] Submitted: 08/30/2013; Accepted: 08/30/2013 http://dx.doi.org/10.4161/sysb.26325 sbv IMPROVER Diagnostics Signature Challenge Design and results Kahn Rhrissorrakrai, 1, * J Jeremy Rice, 1 Stephanie Boue, 2 Marja Talikka, 2 Erhan Bilal, 1 Florian Martin, 2 Pablo Meyer , 1 Raquel Norel, 1 Yang Xiang, 2 Gustavo Stolovitzky , 1 Julia Hoeng 2 and Manuel C Peitsch 2 1 IBM Computational Biology Center; Yorktown Heights, NY USA; 2 Philip Morris Products SA; Research and Development; Neuchâtel, Switzerland Keywords: crowdsourcing, gene array, biomarker, diagnostic, gene signature Abbreviations : AC, adenocarcinoma; AUPR, Area Under the Precision-Recall Curve; BCM, Belief Confusion Metric; CCEM, Correct Class Enrichment Metric; COPD, chronic obstructive pulmonary disease; DSC, Diagnostic Signature Challenge; FDR, false discovery rate; GCRMA, GeneChip-robust multichip average; GSEA, gene set enrich- ment analysis; IBM, International Business Machines; IMPROVER, Industrial Methodology for Process Verification in Research; LASSO, least absolute shrinkage and selection operator; LDA, linear discriminant analysis; MAS5, MicroArray Suite 5.0; MS, multiple sclerosis; PBMC, peripheral blood mononuclear cells; PMI, Philip Morris International; RMA, robust multichip average ; SBV, Systems Biology Verification; SCC, squamous cell carcinoma The sbv IMPROVER (systems biology verification—Indus- trial Methodology for Process Verification in Research) pro- cess aims to help companies verify component steps or tasks in larger research workflows for industrial applications. IMPROVER is built on challenges posed to the community that draws on the wisdom of crowds to assess the most suit- able methods for a given research task. The Diagnostic Sig- nature Challenge, open to the public from Mar. 5 to Jun. 21, 2012, was the first instantiation of the IMPROVER methodol- ogy and evaluated a fundamental biological question, specifi- cally, if there is sufficient information in gene expression data to diagnose diseases. Fifty-four teams used publically avail- able data to develop prediction models in four disease areas: multiple sclerosis, lung cancer, psoriasis, and chronic obstruc- tive pulmonary disease. The predictions were scored against unpublished, blinded data provided by the organizers, and the results, including methods of the top performers, presented at a conference in Boston on Oct. 2–3, 2012. This paper offers an overview of the Diagnostic Signature Challenge and the accom- panying symposium, and is the first article in a special issue of Systems Biomedicine, providing focused reviews of the sub- mitted methods and general conclusions from the challenge. Overall, it was observed that optimal method choice and performance appeared largely dependent on endpoint, and results indicate the psoriasis and lung cancer subtypes sub- challenges were more accurately predicted, while the remain- ing classification tasks were much more challenging. Though no one approach was superior for every sub-challenge, there were methods, like linear discriminant analysis, that were found to perform consistently well in all.

Welcome message from author
This document is posted to help you gain knowledge. Please leave a comment to let me know what you think about it! Share it to your friends and learn new things together.
Transcript

Editor's CornEr
systems Biomedicine 1:4, 1–12; october/november/december 2013; © 2013 Landes Bioscience
Editor's CornEr
www.landesbioscience.com systems Biomedicine 1
Introduction
An important milestone for systems biology is the devel-opment of methods that accurately and completely describe a disease state using molecular data. Such methods will lead to improved patient prognosis by providing more precise diagnoses and a clearer understanding of underlying pathologies to aid design of optimal therapeutic plans. These advancements require the discovery and characterization of biomarkers. The Biomarkers Definitions Working Group1 defines biomarkers as characteristics that are objectively mea-sured and evaluated and serve as indicators of normal biological or pathogenic processes, or pharmacological responses to a thera-peutic intervention.
A biomarker can be as simple as the presence or absence of a single gene or gene product that indicates a disease state. However, most disease biomarkers are likely characterized by a collection of gene or gene product states, each contributing to a specific diagnostic signature that can complement, or per-haps even replace, traditional clinical diagnoses based on medi-cal examination or pathological evaluation. Earlier attempts to discover molecular biomarkers have focused on identification of differentially expressed genes or gene products, between case and control populations.2 More recent methods have endeavored to be increasingly predictive of new cases, thereby leading to enhanced diagnosis, improved prognostication, and the advance-ment of personalized medicine.3 Researchers in the public and private sectors are racing to uncover diagnostic signatures for a variety of disease states using a host of novel computational and experimental techniques.
To address practical concerns and foster the development of methodologies that are robust and versatile for clinical
*Correspondence to: Kahn Rhrissorrakrai; Email: [email protected]: 08/30/2013; Accepted: 08/30/2013http://dx.doi.org/10.4161/sysb.26325
sbv IMPROVER Diagnostics Signature ChallengeDesign and results
Kahn rhrissorrakrai,1,* J Jeremy rice,1 stephanie Boue,2 Marja talikka,2 Erhan Bilal,1 Florian Martin,2 Pablo Meyer,1 raquel norel,1 Yang Xiang,2 Gustavo stolovitzky,1 Julia Hoeng2 and Manuel C Peitsch2
1iBM Computational Biology Center; Yorktown Heights, nY UsA; 2Philip Morris Products sA; research and development; neuchâtel, switzerland
Keywords: crowdsourcing, gene array, biomarker, diagnostic, gene signature
Abbreviations: AC, adenocarcinoma; AUPR, Area Under the Precision-Recall Curve; BCM, Belief Confusion Metric; CCEM, Correct Class Enrichment Metric; COPD, chronic obstructive pulmonary disease; DSC, Diagnostic
Signature Challenge; FDR, false discovery rate; GCRMA, GeneChip-robust multichip average; GSEA, gene set enrich-ment analysis; IBM, International Business Machines; IMPROVER, Industrial Methodology for Process Verification
in Research; LASSO, least absolute shrinkage and selection operator; LDA, linear discriminant analysis; MAS5, MicroArray Suite 5.0; MS, multiple sclerosis; PBMC, peripheral blood mononuclear cells; PMI, Philip Morris
International; RMA, robust multichip average ; SBV, Systems Biology Verification; SCC, squamous cell carcinoma
the sbv iMProVEr (systems biology verification—indus-trial Methodology for Process Verification in research) pro-cess aims to help companies verify component steps or tasks in larger research workflows for industrial applications. iMProVEr is built on challenges posed to the community that draws on the wisdom of crowds to assess the most suit-able methods for a given research task. the diagnostic sig-nature Challenge, open to the public from Mar. 5 to Jun. 21, 2012, was the first instantiation of the iMProVEr methodol-ogy and evaluated a fundamental biological question, specifi-cally, if there is sufficient information in gene expression data to diagnose diseases. Fifty-four teams used publically avail-able data to develop prediction models in four disease areas: multiple sclerosis, lung cancer, psoriasis, and chronic obstruc-tive pulmonary disease. the predictions were scored against unpublished, blinded data provided by the organizers, and the results, including methods of the top performers, presented at a conference in Boston on oct. 2–3, 2012. this paper offers an overview of the diagnostic signature Challenge and the accom-panying symposium, and is the first article in a special issue of Systems Biomedicine, providing focused reviews of the sub-mitted methods and general conclusions from the challenge. overall, it was observed that optimal method choice and performance appeared largely dependent on endpoint, and results indicate the psoriasis and lung cancer subtypes sub-challenges were more accurately predicted, while the remain-ing classification tasks were much more challenging. though no one approach was superior for every sub-challenge, there were methods, like linear discriminant analysis, that were found to perform consistently well in all.

2 systems Biomedicine Volume 1 issue 4
applications, the Diagnostic Signature Challenge (DSC) was designed as a double-blind competition that encompasses the first installment of challenges from sbv IMPROVER. IMPROVER is the result of collaboration between Philip Morris International (PMI) and IBM Corporation (International Business Machines) and was devised primarily as a methodol-ogy to validate industrial research processes related to systems biology.4 The methodology consists of breaking an industrial research workflow or pipeline into clearly defined building blocks or components amenable to independent verification. The overall robustness of the pipeline is assessed by sepa-rately evaluating the performance of each block, either inter-nally within a company or externally with the participation of the broader research community. One possible application of IMPROVER is the verification of quantitative, mechanism-based methodologies that assess potential health impacts of existing or proposed commercial products.
External assessments of building blocks are framed as “open challenges”, in which any team or individual can submit solu-tions to specific tasks in systems biology. After closure of the open phase, predictions are evaluated against a withheld gold standard to identify the best-performing techniques and teams. Furthermore, with a sufficient number of participants, it is pos-sible to leverage the wisdom of crowds to aggregate results, bet-ter understand classes of useful techniques, make more robust and accurate predictions and characterize the difficulty of the task. These assessments provide insight into the improvement of industrial and clinical research pipelines.
An important consideration in challenge design is balancing the research goals of the sponsoring company and independent researchers. Certain components of research pipelines may be too narrowly focused on the specific aims of the sponsoring com-pany or involve proprietary information. Therefore, challenges must be designed to appeal to independent researchers by ensur-ing they pertain to enduring, fundamental biological principles that are applicable to diverse research areas, specifically including those of interest to the sponsoring company.
The DSC aimed to assess the feasibility of diagnosing several different diseases based on mRNA expression measured by whole genome microarrays. Microarrays were selected as the mRNA expression measurement platform over more recent technologies, for example, high-throughput sequencing, because of the rela-tive maturity and uniformity of the technology and processing techniques. Moreover, public databases have a wealth of read-ily available microarray data sets collected under different con-ditions and for different species. Note that while microarray data is fairly uniform, several different commercial microarray platforms are available, each with specific differences in their DNA-based analytes (probesets), reagents and processing meth-odologies. Hence, combining data from these different platforms can introduce additional challenges that typify the realities of biomarker discovery when trying to integrate existing data with new information generated within and between research groups. Nevertheless, while challenging, biomarkers discovered in this environment may prove more applicable and robust to patient and methodological variations.
A good challenge requires high-quality input and benchmark data to train and test classifiers, respectively. That is, the data must be of sufficient size and scope to allow the participants and their algorithms to glean important differences between cases and controls. This non-trivial task is complicated by the need to conduct blinded tests, in which teams assemble their algo-rithms to make predictions on withheld data. Experience with the Dialogue for Reverse Engineering Assessments and Methods (DREAM) challenges has shown that, occasionally, participants will find shortcuts by attempting to “play the system” without solving the problem in earnest. Therefore, to prevent bias, the data used for testing cannot be previously published or publi-cally available (a challenging requirement because publication is a required practice for most researchers) and must be developed de novo or obtained from private sources.
As the first instantiation of the IMPROVER concept, the DSC sought to address an important question in biomarker discovery, specifically, whether gene expression measured using whole genome microarrays is sufficient to distinguish disease states in humans. In addition, the DSC worked to demonstrate how crowdsourcing with high participation and well-designed incentives can yield more robust predictions through the appli-cation and aggregation of numerous methodologies. Finally, the DSC symposium underscored the importance of sharing tech-niques and experiences at the end of the challenge to reinforce the lessons learnt and best practices gained from a rigorous, com-petitive comparison of analytic methods, in order to advance the field of biomarker discovery.
Results
Overview of participation and performanceThe DSC met an important objective, showing that
IMPROVER challenges can be implemented successfully by attracting sufficient participation. In total, 54 teams worldwide participated. The majority (61%) submitted predictions for all five sub-challenges (Fig. 1).
The performance varied widely between sub-challenges. At submission, teams were required to submit a measure of their belief as a confidence value between 0 and 1 that a subject was affected by the corresponding disease. The belief values from different teams for different samples are shown using a graded red-blue scale (Fig. 2). For psoriasis, the majority of predictions were distinctly blue or red in agreement with the gold standard (leftmost column in each figure subpanel). This was also found to a lesser degree for the lung cancer sub-challenge, with respect to distinguish-ing between adenocarcinoma (AC) and squamous cell carcinoma (SCC). For multiple sclerosis (MS) and chronic obstructive pul-monary disease (COPD) diagnosis, although the best predictions were statistically significant even after FDR correction, they were not as robust in distinguishing disease cases from controls.
The five sub-challenges and best performersThe DSC included five sub-challenges based on different dis-
ease phenotypes. However, results from one of the sub-challenges (MS Staging) were discarded because of the poor overall predic-tive power of the received submissions.

www.landesbioscience.com systems Biomedicine 3
PsoriasisThe psoriasis sub-challenge was found to be the least challeng-
ing classification task since many teams using disparate methods outperformed random predictions. The most significant adjusted P-values were 10−35 and 10−35 for the Belief Confusion Metric (BCM) and Correct Class Enrichment Metric (CCEM), respec-tively. (See Materials and Methods, and Norel et al. in this issue for details on the scoring methodologies).5 At least in part, this success reflects the fact that the microarray data came from skin samples, the tissue actively involved in the disease. Furthermore, as the majority of classifiers performed well, aggregation of meth-ods did not substantially increase performance, suggesting that individual methods were already extracting much of the biologi-cal signal.
The team of Kai Wang, Ji-Hoon Cho, and Alan Lin (Institute for Systems Biology, Seattle, WA, USA) achieved the best overall performance.6 After identifying all differentially expressed genes, they found that a Kernel Fisher Discriminant in conjunction with Scaled Alignment Selection was the best-suited classifier for this sub-challenge.
Multiple sclerosis diagnosisThe team of Mario Lauria (University of Trento, Italy) was
the best performer for the MS diagnosis sub-challenge with a P-value of 10−31 and 10−11 for BCM and CCEM, respec-tively, using a method based solely on ranking expression
Figure 1. overview of participation in the five sub-challenges. Fifty-four teams worldwide participated in the diagnostics signature Challenge. the percentage of teams participating in a total of 1 to 5 sub-challenges (ch) is indicated on the pie chart (e.g., 61%, or 23 teams, participated in all 5 sub-challenges). Participation was spread evenly across all five sub-challenges: psoriasis, 49 teams; CoPd, 40 teams, lung cancer, 46 teams; Ms diagnosis, 40 teams; and Ms staging, 39 teams.
Figure 2. Prediction overview for specific sub-challenges. For each sub-challenge, rows indicate different subjects in the test set, and columns the pre-dictions of different teams in order of their ranking on each sub-challenge. the data are presented as heat maps in which the degree of belief is graded from blue to red. the leftmost column in each plot is the gold standard that by definition correctly assigns each subject to a category with perfect con-fidence. For the lung-cancer sub-challenge, only the subtype classification is shown, as the staging classification was much less definitive.

4 systems Biomedicine Volume 1 issue 4
changes.7 These rankings rather than expression values were used as the diagnostic signature, with global similarity measures cal-culated and used for clustering.
Multiple sclerosis stagingThis MS sub-challenge was to distinguish patients in remis-
sion from those in relapse. This classification proved substantially more challenging, indicating that the signal in the peripheral blood mononuclear cell (PBMC) microarray data was weaker for MS Staging than for MS Diagnosis. Although a few participants achieved significant raw P-values, there were no teams whose pre-dictions reached significance after adjusting the P-value for mul-tiple hypothesis testing. Because of this poor performance, and in accordance with pre-established procedures, this sub-challenge was removed from the competition.
Lung cancerUnlike the other sub-challenges, which presented a binary
classification task, the lung cancer sub-challenge required teams to classify expression profiles into four classes, either SCC or AC and either stage 1 or 2. As with MS, the staging portion of the classification task proved more challenging. Prediction perfor-mance may have been complicated by the imbalanced training data, which was skewed more toward stage 1 than stage 2 samples (112 vs. 33, respectively, for AC and 85 vs. 30, respectively, for SCC), although overall expression differences between stages were more subtle than between cancer types.
The best performers in this challenge were the team of Sol Efroni and Rotem Ben-Hamo (Bar-Ilan University, Tel Aviv, Israel).8 Their results were highly significant on the four-way classification with P-values of 10−31 and 10−8 for BCM and CCEM, respectively. They achieved this performance using Mann-Whitney and Student’s t-tests for feature selection of significantly differentially expressed genes in the training data. Expression profiles of selected features were visually inspected in the test set to retain the best discriminating features (i.e., fea-tures where two clusters are clearly separated; first AC and SCC were separated, then stage separation was performed within each type). Class labels were then assigned to each sample based on expression levels of selected features, compared with the training set. Interestingly, a single gene, KRT5, was sufficient to correctly predict AC or SCC classification.8
Chronic obstructive pulmonary diseaseLung expression profiles for the COPD sub-challenge were
taken from bronchial brushings. Although available training data sets were from small-airway brushings, test sets were sampled from large airways. This made the prediction task more chal-lenging but potentially more applicable as differences in sample collection are likely to be an accurate reflection of clinical collec-tions and may potentially guide methods to identify more robust COPD biomarkers. In addition to expression profiles, the orga-nizers provided age, gender, and smoking status for each subject, which some teams found informative.
For this challenge, only a few teams achieved statistically significant results. The best result, with an adjusted P-value of 7 × 10⁻⁴ for BCM, was reached by the team of Steve Horvath and Lin Song (University of California Los Angeles, CA USA).9 This group used random generalized linear models, an ensemble
classifier based on bootstrapping of generalized linear models. This specific collection of ordinary linear regressions allows for outcomes that do not follow normal distributions and is ame-nable to high-dimensional data such as microarrays.
Best overall performersThe best overall performing method across all sub-challenges
was based on linear discriminant analysis (LDA) as implemented by the team of Adi Tarca and Robert Romero (Wayne State University, Detroit, MI USA).10 Although they were not ranked as a top performer in any of the sub-challenges, they performed well in all four. The team’s implementation relied on the simplic-ity of the feature set and classifier to yield more robust results. They found the critical step was careful selection of the most informative and consistent data sets to prevent non-biological differences in the training data from obscuring true biological differences capable of predicting the phenotype. For more details, see Tarca et al.’s article in this issue.
The second-best overall performer was the team of Mario Lauria (University of Trento, Italy).7 For each subject, genes were ranked with respect to their up- or downregulation. Unlike most other methods used, the diagnostic signature was based entirely on these ranks, not on expression levels. The final classification was derived from clustering of expression rank profiles, arguably less sensitive than other methods to batch effects and other sys-tematic distortions.
The third-best overall performer was Team BISON led by Heinz Koeppl (ETH Zurich, Switzerland).11 Their scheme employed regularized logistic expression in conjunction with a rank-sum test to select features. Their method was completely data-driven and without biological assumptions. Interestingly, this method used relatively few microarray probes, anywhere from 14 to 23 of the 54,000 available probesets, for each disease’s final diagnostic signature.
With a few exceptions (notably Lauria’s method), the overall classification task could be broken into several components, and included data normalization, batch-effect correction (particularly important when the test and training data are independent of each other), feature selection, and a core classification algorithm. Successful teams employed various combinations of algorithms for each task, and no particular technique emerged as clearly superior. Significant differences in performance appeared to be the result of specific choices pertaining to data selection and pro-cessing. However, the method choice took on greater importance when the biological signal was weaker. In contrast, a strong bio-logical signal produced good classification performance regard-less of the method specifics.
Symposium resultsAn important aspect of the IMPROVER methodology was
the symposium to announce the results, and disseminate and discuss the collective challenge findings. The DSC symposium was held in Boston on Oct. 2–3, 2012 and was attended by 60 participants, not including the organizers. The top performers were invited to present their methods and results. In addition, an overview presentation covered the scoring methodologies, final rankings, and lessons learnt. Another vital aspect of the sympo-sium was to invite speakers to address greater challenges in the

www.landesbioscience.com systems Biomedicine 5
field and how the DSC fits into this context. The invited key-note speakers covered a range of topics that are briefly described below.
Donna L. Mendrick (Director, Division of Systems Biology, NCTR/FDA, Washington, DC, USA) discussed the challenges facing researchers in translating biomarkers from other regions of the body, diseases, or species, to provide information about the disease of interest. She also noted the difference between “qualifying” and “validating” a biomarker. Qualifying shows a biomarker is fit for a purpose, i.e., is able to diagnose a given disease, whereas validating demonstrates that the testing plat-form robustly detects the disease using the biomarker. She noted MicroArray Quality Control-II (MAQC-II)3 as an endeavor similar to IMPROVER, to develop robust diagnostic signatures trained on a controlled data set that are then used to predict clas-sifications of new, unlabeled data. This study brought important insights into the methods and functions that succeed and fail across diseases and species. Although there are natural road-blocks or systemic inertia to the adoption of a new biomarker, its uptake can be hastened and promoted by its robust identification by different multi-disciplinary teams, using different methods and statistical models, and in different species.
John Quackenbush (Professor of Computational Biology & Bioinformatics, Dana-Farber Cancer Institute, Boston, MA USA) discussed the need for innovative biomarker discovery by finding patterns in the deluge of data provided by new technolo-gies. He commented on the need for a holistic view of the cell and animal that integrates genomic measurements with other information such as clinical data, gene function, and pathway databases to “really pull that information together in an effec-tive way to make sense of the underlying measurements”. The data cannot be limited to humans, and researchers should use the knowledge gained from other species. He noted that pathways could be remodeled in disease or by the environment, so a useful model should capture normal and altered function rather than just the components and connections in exemplar cases, typically stored in pathway databases. A related theme was that impor-tant biological information may reside in the variance of appar-ent noisy behaviors exhibited by biological systems. Researchers often try to reduce apparent noise by averaging over many repli-cates, as the assumption in the field has typically been that the important biological signals are hidden in spurious noise that should be removed. He suggested that disease models should use a less deterministic approach and a more stochastic one, where response variance is taken into consideration.
Peter Sorger (Professor of Systems Biology, Harvard Medical School, Boston, MA USA) also spoke on the importance of variability using the example of programmed cell death. After describing the canonical members of the apoptotic pathways, he shared that small, stochastic differences in protein number will affect protein competition and produce fundamentally dif-ferent phenotypes in response to biological perturbants. Indeed, the phenotypic behavior of time of death in response to TRAIL, a protein that induces apoptosis, diverges so quickly that after two cell divisions, sister cells are no more similar to each other than randomly chosen cells. These effects could in part be due to
the observed 5-fold variation of the overall proteome level, which may be greater than the genome variation. He argued that mod-els should be developed programmatically, as rules to be imple-mented to test hypotheses, rather than simple, static interaction maps or text representations that fail to capture the biological complexity and lead to extensive information loss.
Birgit Schoeberl (Vice President of Discovery, Merrimack Pharmaceuticals, Boston, MA USA) followed with similar themes by describing cancer as a very complex disease often driven by multiple oncogene and pathway mutations. Noting that tumors are rarely dependent on a single gene, her group developed a com-putational model of the ErbB pathway with phospho-AKT as a survival readout. The model was used to predict the mechanism of action of their drug, determine whether certain phosphorylated isoforms could be utilized as biomarkers, and predict respond-ers vs. non-responders. Later, the model was made multiscale to include cellular-level regulatory pathways and to accommodate multiple data types and measurements. It was then extended to include pharmacokinetic/pharmacodynamic effects, for investi-gation of drug scheduling or combination therapies. She affirmed the concept of “systems pharmacology” to consider whole body physiology vs. single cells. Compared with extensive combinato-rial testing, such models are likely to be useful in determining effective dosing strategies, or may at least point to the most infor-mative experiments to perform.
Discussion
Data limitationsBiological data classification is susceptible to human error,
even in our gold standard set (Fig. 2). The heat maps, especially for the lung cancer sub-challenge, revealed occasional horizon-tal stripes of disjoint color from neighboring subjects that cor-responded to subjects likely miscategorized by many different teams. This suggests that these subjects were classified differently by expression profile analysis than by the clinical means used for the gold standard and may represent cases of misdiagnosis or ambiguity.8 Independent verification of these potentially misdi-agnosed subjects confirmed likely errors in the gold standard for these specific cases. Furthermore, when a subject was re-diag-nosed and the new classification was in conflict with the original, the expression-based classification was also often in conflict with the original diagnosis.12
Often the diagnostic criteria include other types of informa-tion (such as the presence of metastases in cancer) that are not likely to be directly detected in molecular classifications. These factors can change the significance of molecular profiles. For lung cancer, samples with a high necrotic rate were misclassified by most teams. Similarly, a subject’s smoking history was often a bet-ter indicator of COPD than their expression profile. In such cases, expression profiles may need to be supplemented with additional information to ensure a reliable diagnosis. However, there may be cases where these disagreements reflect weaknesses in the tra-ditional diagnostic criteria rather than the molecular techniques per se. Generally, diseases do not progress in highly distinct stages but appear as a continuum, as will be discussed later. As such,

6 systems Biomedicine Volume 1 issue 4
intermediate cases may be prone to divergent classification, and as was observed, misclassification can occur based on both tra-ditional diagnostic methods (e.g., pathology or medical exams) and microarray expression profiles. Moreover, clinical diagnos-tic techniques may have a certain level of ambiguity or rely on human judgments that involve a degree of bias and subjectivity.
One concern about classification based on microarray expres-sion profiles is that mRNA measurements may not directly reflect the biological disease state or process. Post-transcriptional regulation and epigenetic effects are now appreciated to be cen-tral to disease processes13,14 but cannot be directly assessed by standard microarrays and transcriptomics. For example, tran-scribed microRNAs (miRNAs) can modify the amount of pro-tein produced by its target mRNA by enhancing degradation or modulating translation, and miRNAs are known to be strongly, differentially expressed in some diseases. Signatures based on protein, rather than mRNA measurements, could provide a more direct and robust disease indicator. However, proteomic methods lack maturity vs. the relative standardization in transcriptomics, a feature that drove its use in the DSC. Nevertheless, future chal-lenges will consider proteomic data that can potentially provide a more direct readout of the disease state.
Limitations of the disease state conceptAt a more philosophical level, disease or health may not cor-
respond to well-defined discrete states as required in classifica-tion tasks. For example, psoriasis often appears continuous rather than dichotomous, and misclassifications in the MS sub-chal-lenges were increased with milder disease severity. In other cases, disease may be better compared with the well-defined states observed in dynamic system approaches. For example, cancer can be likened to stable attractors,15 and oncogene dependency, as dis-cussed in the keynote talks, may correspond to a state that could be determined by high-throughput screening methods combined with complex cellular network analysis.16 Disease progression may correspond to transitions over time between stable attrac-tors during which the system may take on characteristics that are intermediate between the beginning and ending attractor states.
As a result of the disease state continuum, there is an open question as to whether diagnostic signatures should be more concerned with generating a simple, discrete classification (e.g., disease or not disease), or reporting a degree of belief. Indeed, several keynote presentations highlighted the complexity of dis-eases, and that important information may reside in the variabil-ity rather than the consistencies. Physicians must typically reach a discrete decision regarding disease state in order to proceed with treatment, yet belief values offer richer, graded information of intermediate stages. Additionally, a single disease phenotype may reflect any of several underlying pathologies that may be unaccounted for in current clinical practice. As molecular clas-sification improves, possibly with the incorporation of important non-molecular criteria, it may be possible to better understand complex diseases and tailor clinical treatments according to a combination of these belief values.
Biological interpretation of developed classifiersThe task of the DSC was classification only, and no restric-
tions were placed on the use of biological information in the
design of the classifier method. Likewise, there was no require-ment that the identified gene signatures have a well-defined bio-logical interpretation. Although the methods submitted varied widely, there was commonality in that most teams’ approaches entailed a series of basic steps that together formed a classification pipeline, and included: selecting training data sets, data prepro-cessing and summarization, selecting features, fitting a classifier/model of choice, and generating predictions on the test data. Teams using machine learning techniques in their methods could often generate signatures in the absence of biological knowledge.
The results show a fairly complicated relationship between the submitted methods and underlying biology. To one extreme, the successful method often considered very few features to prevent overfitting but consequently made limited use of the richness of knowledge available in pathways and networks of biological systems. With regard to the classification models used, the top performing team of Tarca and Romero used a classical discrimi-nation method, LDA, that discovered signatures using as few as two genes in two of the four sub-challenges and at most two dozen in the remaining two. The third team used Least Absolute Shrinkage and Selection Operator (LASSO) logistic regression, an emerging approach to high-dimensional data classification, while the second team used an experimental clustering-based classifier. Among the top performers, Lauria’s team favored inclu-sion of hundreds of genes and incorporated Gene Set Enrichment Analysis (GSEA),17 which uses prior specific biological knowl-edge as gene sets are compiled based on related biological and molecular attributes of genes and gene products.
In contrast to Lauria’s team, most participants did not exploit prior biological knowledge, such as gene sets, to develop their predictor, and in fact, many of the successful predictors had entirely disjoint sets of features. This disparity in feature selection may have been the result of normal variability in gene expression data, and it is possible that more information could be gleaned by grouping the features based on known pathway or modules. By using more structural, network-based data, diagnostic signatures may potentially be more robust to gene expression differences, and their inclusion may yield improved performance with greater consensus among predictors’ features, as discussed by Florian Martin (Philip Morris Products, Neuchâtel, Switzerland) during the symposium.
One factor that may have allowed classification devoid of bio-logical interpretation was the challenge design. Although blinded test data was provided to participating teams for generation of belief matrices, it is still possible that clues to the correct clas-sification were inadvertently provided to participants. Such clues could include regularities in the test data that, if exploited, would improve classifier performance. In the case of the psoriasis data, disease patient samples were measured in separate batches from control samples, thus it is possible that batch effects may account for samples clustering into two groups.
Comparison with previous classification challengesThe results of the IMPROVER study largely parallel those
of the MAQC-II, described by Donna Mendrick in her keynote address at the DSC Symposium as a large-scale study of the use of microarray data for classifying disease states.3 The similarities
www.landesbioscience.com systems Biomedicine 7
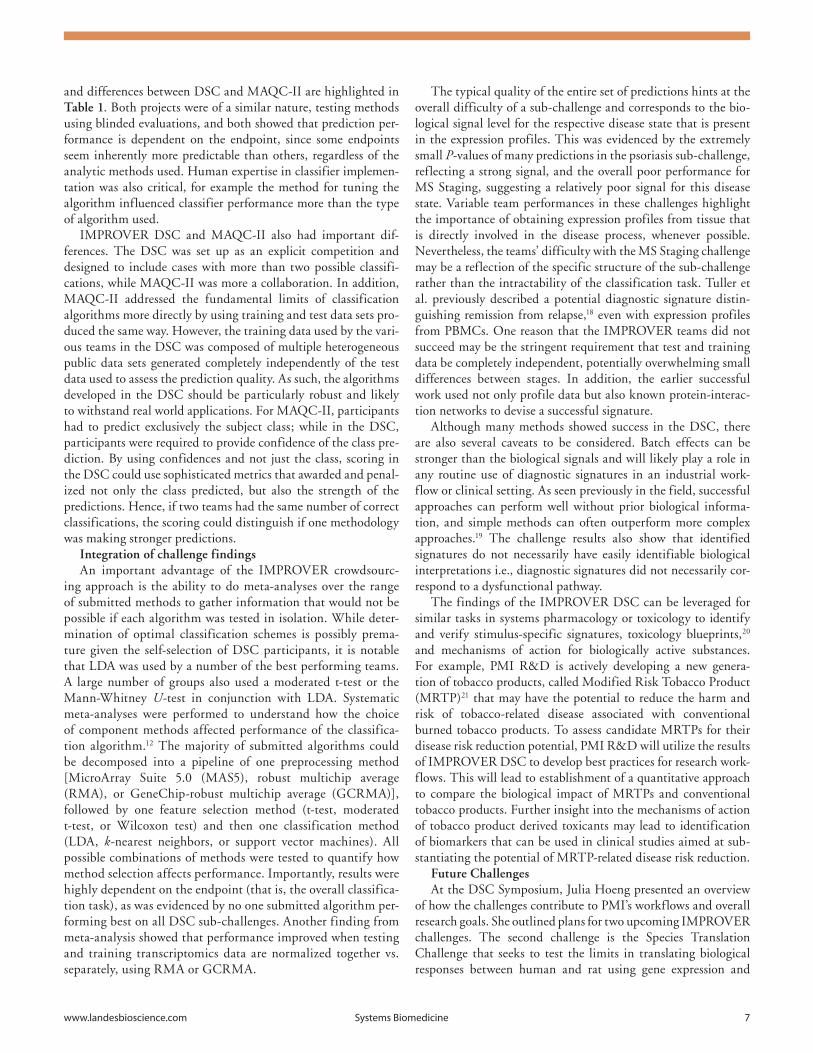
and differences between DSC and MAQC-II are highlighted in Table 1. Both projects were of a similar nature, testing methods using blinded evaluations, and both showed that prediction per-formance is dependent on the endpoint, since some endpoints seem inherently more predictable than others, regardless of the analytic methods used. Human expertise in classifier implemen-tation was also critical, for example the method for tuning the algorithm influenced classifier performance more than the type of algorithm used.
IMPROVER DSC and MAQC-II also had important dif-ferences. The DSC was set up as an explicit competition and designed to include cases with more than two possible classifi-cations, while MAQC-II was more a collaboration. In addition, MAQC-II addressed the fundamental limits of classification algorithms more directly by using training and test data sets pro-duced the same way. However, the training data used by the vari-ous teams in the DSC was composed of multiple heterogeneous public data sets generated completely independently of the test data used to assess the prediction quality. As such, the algorithms developed in the DSC should be particularly robust and likely to withstand real world applications. For MAQC-II, participants had to predict exclusively the subject class; while in the DSC, participants were required to provide confidence of the class pre-diction. By using confidences and not just the class, scoring in the DSC could use sophisticated metrics that awarded and penal-ized not only the class predicted, but also the strength of the predictions. Hence, if two teams had the same number of correct classifications, the scoring could distinguish if one methodology was making stronger predictions.
Integration of challenge findingsAn important advantage of the IMPROVER crowdsourc-
ing approach is the ability to do meta-analyses over the range of submitted methods to gather information that would not be possible if each algorithm was tested in isolation. While deter-mination of optimal classification schemes is possibly prema-ture given the self-selection of DSC participants, it is notable that LDA was used by a number of the best performing teams. A large number of groups also used a moderated t-test or the Mann-Whitney U-test in conjunction with LDA. Systematic meta-analyses were performed to understand how the choice of component methods affected performance of the classifica-tion algorithm.12 The majority of submitted algorithms could be decomposed into a pipeline of one preprocessing method [MicroArray Suite 5.0 (MAS5), robust multichip average (RMA), or GeneChip-robust multichip average (GCRMA)], followed by one feature selection method (t-test, moderated t-test, or Wilcoxon test) and then one classification method (LDA, k-nearest neighbors, or support vector machines). All possible combinations of methods were tested to quantify how method selection affects performance. Importantly, results were highly dependent on the endpoint (that is, the overall classifica-tion task), as was evidenced by no one submitted algorithm per-forming best on all DSC sub-challenges. Another finding from meta-analysis showed that performance improved when testing and training transcriptomics data are normalized together vs. separately, using RMA or GCRMA.
The typical quality of the entire set of predictions hints at the overall difficulty of a sub-challenge and corresponds to the bio-logical signal level for the respective disease state that is present in the expression profiles. This was evidenced by the extremely small P-values of many predictions in the psoriasis sub-challenge, reflecting a strong signal, and the overall poor performance for MS Staging, suggesting a relatively poor signal for this disease state. Variable team performances in these challenges highlight the importance of obtaining expression profiles from tissue that is directly involved in the disease process, whenever possible. Nevertheless, the teams’ difficulty with the MS Staging challenge may be a reflection of the specific structure of the sub-challenge rather than the intractability of the classification task. Tuller et al. previously described a potential diagnostic signature distin-guishing remission from relapse,18 even with expression profiles from PBMCs. One reason that the IMPROVER teams did not succeed may be the stringent requirement that test and training data be completely independent, potentially overwhelming small differences between stages. In addition, the earlier successful work used not only profile data but also known protein-interac-tion networks to devise a successful signature.
Although many methods showed success in the DSC, there are also several caveats to be considered. Batch effects can be stronger than the biological signals and will likely play a role in any routine use of diagnostic signatures in an industrial work-flow or clinical setting. As seen previously in the field, successful approaches can perform well without prior biological informa-tion, and simple methods can often outperform more complex approaches.19 The challenge results also show that identified signatures do not necessarily have easily identifiable biological interpretations i.e., diagnostic signatures did not necessarily cor-respond to a dysfunctional pathway.
The findings of the IMPROVER DSC can be leveraged for similar tasks in systems pharmacology or toxicology to identify and verify stimulus-specific signatures, toxicology blueprints,20 and mechanisms of action for biologically active substances. For example, PMI R&D is actively developing a new genera-tion of tobacco products, called Modified Risk Tobacco Product (MRTP)21 that may have the potential to reduce the harm and risk of tobacco-related disease associated with conventional burned tobacco products. To assess candidate MRTPs for their disease risk reduction potential, PMI R&D will utilize the results of IMPROVER DSC to develop best practices for research work-flows. This will lead to establishment of a quantitative approach to compare the biological impact of MRTPs and conventional tobacco products. Further insight into the mechanisms of action of tobacco product derived toxicants may lead to identification of biomarkers that can be used in clinical studies aimed at sub-stantiating the potential of MRTP-related disease risk reduction.
Future ChallengesAt the DSC Symposium, Julia Hoeng presented an overview
of how the challenges contribute to PMI’s workflows and overall research goals. She outlined plans for two upcoming IMPROVER challenges. The second challenge is the Species Translation Challenge that seeks to test the limits in translating biological responses between human and rat using gene expression and
8 systems Biomedicine Volume 1 issue 4
phosphoproteomics data. Animal studies with rodents constitute a necessary research phase to investigate and dissect molecular mechanisms underlying human disease development. However, the utility of animal models to predict clinical efficacy is contro-versial, as each model presents inherent strengths and weaknesses in faithfully mirroring the extremely complex processes involved in human diseases, such as carcinogenesis.22 The challenge goals will address these issues in translatability by identifying compu-tational methods that are most effective for inferring gene, phos-phorylation, and pathway responses to diverse stimuli between human and rat.
The subsequent challenge will be the Network Verification Challenge (NVC), which will engage the scientific commu-nity to review molecular mechanisms related to diseases of the human respiratory system as embodied in network and pathway diagrams. A primary objective of the challenge is to verify and improve existing knowledge models. Unlike the DSC, it is antici-pated that the NVC will have a website user interface, allowing an interactive review and curation process with other partici-pants, as well as a leaderboard system to gauge relative activity and performance. The NVC will be designed to incentivize high user engagement and reward scientifically valid contributions,
Table 1. Comparison of the MAQC-ii project and sbv iMProVEr dsC
Features MAQC-II project sbv IMPROVER project
Project typeCollaboration (included a method review by other members)
Competition
SubmissionPredictions (with model summary and information tables)
Predictions (with report)
Number of participating teams 36 (17 submitted to all endpoints) 54 (33 submitted to all endpoints)
Classification type Binary Confidence levels (2- and 4-way)
Number of test data sets 6 5
Species Human, mouse, rat Human
DiseasesLung and breast cancer, multiple myeloma, neuroblastoma
Psoriasis, CoPd, lung cancer, Ms
Prediction type13 preclinical and clinical endpoints; 2 positive and 2 negative controls
diagnosis, staging
Training data sets Public Public
Test data setsGenerated for the MAQC-ii project by the same pro-viders as the training data set. Biological endpoints unknown to modelers
Created for or licensed to the sbv iMProVEr proj-ect. Completely unrelated to the training data sets
Project stages
stage 1: train on training set and test on blinded test data setstage 2: train on test set and test on training data set (not blinded)
only one stage: train on training data set, and test on test data set
Scoring metrics
· MCC· Accuracy· sensitivity· specificity· Area under the receiver operating characteristic curve· root mean squared error
· BCM· CCEM· AUPr_avg
Methods used
· 17 summary and normalization methods· 9 batch effect removal methods· 33 feature selection methods· 24 classification algorithms
MAs5, rMA, frMA, GCrMA, Hook and Combinations → 15 feature selection methods → 10 classification algorithms
Community benefit· Available data sets can be used for benchmarking· series of publications summarizing the key lessons and biological interpretation
· Available data sets can be used for benchmarking· determined robust signatures for a particular dis-ease/data set· individual Methods published in special issue of Systems Biomedicine
MCC, Matthews correlation coefficient; BCM, belief confusion metric; CCEM, correct class enrichment metric; AUPr_avg, area under precision-recall score; Ms, multiple sclerosis
www.landesbioscience.com systems Biomedicine 9
while maintaining safeguards to eliminate spurious submissions. As the gold standard will be unknown, the challenge will use consensus-based scoring. A symposium will again be held at the culmination of the challenge, where invited participants and top performers will gather to share expertise, adjudicate network rela-tionships that did not reach consensus, and to develop finalized network and pathway diagrams.
OutlookIdentifying diagnostic signatures is an important problem of
general biomedical interest. The DSC sought to motivate the field toward the development of improved diagnostic signatures through constructive competition. There are several lessons learnt that may improve design of future challenges. For exam-ple, the blinded test data was provided to participating teams to generate belief matrices. It is possible that using the blinded data, teams were able to identify regularities and clues in the test data. Therefore, test data should be withheld from participants and teams required to supply executable classifier source code that scorers use to generate predictions, similar to MAQC-II. This protocol would have the added advantage of ensuring teams deliver a truly autonomous classification procedure. Additionally, a web-based platform is being developed for perennial bench-marking, where future teams can test their methods and perform a self-assessment of their predictions. Though this system will no longer qualify as strictly blinded testing, and requires careful interpretation of scores, it will offer intermediate results and is a stable method for participants to benchmark themselves against current front-runners.
ConclusionThe DSC underscores the feasibility and importance of lever-
aging community involvement to assess and compare the predic-tive value of diagnostic signatures. It shows that a well-chosen and clearly defined task of general biomedical interest can attract enthusiastic participation from a wide variety of teams from the broader research community. In many regards, the DSC and IMPROVER confirm what has been seen in the commercial crowdsourcing space. Kaggle’s William Cukierski described in his DSC Symposium talk that commercial crowdsourcing offers sponsors several important features, including consistently bet-ter results than existing standards, regardless of the specific challenge, shorter timelines than possible for a single research group, and significant analysis cost-effectiveness. He also noted that commercial crowdsourcing stands out for its engagement of participants with a diversity of expertise, where many work out-side the challenge domain but achieve high performance in their competitions.
With respect to biomarker discovery, the DSC confirms that, in some cases, publicly available data sets are sufficient to enable researchers to develop diagnostics signatures or classifiers that identify disease states in completely independent measure-ments. Although no single method was found to be superior for each classification task in each of the sub-challenges, the team of Tarca and Romero demonstrated there are techniques that can be broadly applied with reasonable success to all. The best perform-ing methods submitted to the IMPROVER DSC (and reviewed in this special issue) can serve as the basis for moving the field
forward in diagnosing disease states based on microarray data. Hence this work could make an important contribution to more generalized diagnostic signature approaches for new applications, such as personalized medicine and improved prognosis.
The results and participation from this first challenge bode well for future extensions of the IMPROVER vision to provide robust, external verification of other aspects of industrial sys-tems biology analysis, and corroborates the use of competition-based external validations for addressing interesting biological questions.
Materials and Methods
Challenge design and disease areasThe DSC sought diagnostic signatures in four target disease
areas, each of which was framed as a sub-challenge:1. Chronic obstructive pulmonary diseaseCOPD is an overarching term describing chronic lung dis-
eases that cause limitations in lung airflow, and whose symptoms most commonly include chronic breathlessness, excessive sputum production, and chronic cough. Participants were asked to diag-nosis gene expression profiles of bronchial brushings for COPD.
2. Multiple sclerosisThe initial set of sub-challenges included two related to MS, a
chronic, inflammatory, autoimmune disease. This disease attacks the myelin sheath of nerve cells, causing a wide range of debili-tating neurological symptoms. In the relapsing-remitting form of the disease (RRMS), progression is characterized by periods of relapse, or intensification, alternating with periods of remis-sion that have a profound effect on quality of life. The two MS sub-challenges involved predicting the presence of MS (referred to as “MS Diagnosis”) and its stage of either remission or relapse (referred to as “MS Stage”).
3. PsoriasisPsoriasis is a common, chronic, inflammatory, autoimmune
skin disease. In the psoriasis sub-challenge, participants were asked to classify gene-expression profiles of skin biopsies, either from active lesions of psoriatic patients or from healthy patients.
4. Lung cancerThe most prevalent type of lung cancer, non-small cell lung
cancer, can be subdivided into SCC, AC, and large cell car-cinoma. Individual cases are then classified into Stages 1–4 based on the size and spread of the tumor, the involvement of lymph nodes, and metastatic spread according to the TNM Classification of Malignant Tumors (http://www.cancer.gov/cancertopics/factsheet/detection/staging).23 Unlike the other sub-challenges, which are binary classification tasks, the lung cancer sub-challenge involved classification of expression profiles into four classes, either SCC or AC and either stage 1 or 2.
Data sets for sub-challengesThere were important practical considerations with respect to
data collection for the training and test data sets. Using micro-arrays as the primary gene expression data source can lead to systematic differences as a result of data acquisition on different platforms. Consequently, when the training and test data come from the same platform, the signal-to-noise ratio is maximized,

10 systems Biomedicine Volume 1 issue 4
increasing the likelihood of discovering subtle differences in expression profiles. Unfortunately, it is difficult for a single lab to gather sufficient clinical samples to generate a large training data set. Researchers may have to combine data sets from across plat-forms to create a training set of sufficient size and then perform additional work to account for platform-specific differences. This leads to an interesting question for diagnostic signature development: Is it possible to identify robust signals from pub-licly available data that can identify disease states in completely unrelated test sets taken from different laboratories at different times in different patients? This question was addressed in the sub-challenges posed in the DSC. While challenging for classifi-cation, the independence of the test and training data should aid development of more broadly applicable diagnostic signatures, possessing greater robustness to variations in data across studies, labs, and sample populations.
Gold standardA critical step in the development of each sub-challenge was
defining the reference benchmark, often referred to as the “gold standard”. The gold standard is a known correct reference that can be used to assess new methods, models, and data. However, an absolute true and correct standard is often not possible in biol-ogy because it is not generally known. In the absence of this, the practical solution is to use an established method as reference with the caveat that errors may be present in the gold standard. This was the approach taken in the DSC, with patient classifica-tion based on standard medical diagnostic techniques that are subject to ambiguities or misinterpretations due to human bias and limitations in current disease knowledge. For example, cer-tain patients were consistently misclassified by DSC participants. Later analysis of these misclassified cases, based on microarray data and clinical information, suggested that the initial medical diagnosis may have been incorrect or at least unreliable, perhaps because subjects were borderline between case and control (see also Discussion).
For all sub-challenges, except the MS Stage sub-challenge, test data was obtained on the Affymetrix® GeneChip Human Genome U133 Plus 2.0 platform. Gene Logic® (Hyderabad, India) collected data for the COPD, psoriasis, and MS diagnostic sub-challenges. For MS, gene-expression profiles were measured in PBMCs that are commonly used to study immune system diseases. PMBCs include or are precursors for a wide range of cell types involved in immune responses, and although they are not necessarily directly involved in MS, they serve as a proxy for detecting the disease state. Lung tumor samples (n = 150) were chosen from a biobank and consisted of 41 stage 1 AC, 36 stage 2 AC, 34 stage 1 SCC, and 39 stage 2 SCC. RNA from each tumor was isolated by the tissue provider and gene expression profil-ing performed by AROS Applied Biotechnology AS (Aarhus N, Denmark).
The test data (with class data withheld) was available for download as both “raw” data, in the manufacturer’s CEL file format, and as a table of quantified gene expression values. Raw CEL files were converted to gene expression values using the MAS5 algorithm implemented in Affymetrix®’s Expression Console™ (www.affymetrix.com), and available for download
via Affymetrix®’s NetAffx™ Analysis Center website (http://www.affymetrix.com/analysis/index.affx). In addition, par-ticipants were free to use their preferred normalization method (RMA, GCRMA, etc.) on the raw data.
Challenge participants were advised to use any suitable train-ing data that was publicly available to develop and optimize their algorithms. For each specific sub-challenge, the organizers pro-vided a list of IDs of publicly available data sets from third par-ties that participants could download from the Gene Expression Omnibus (GEO) Database24 (http://www.ncbi.nlm.nih.gov/geo/) or ArrayExpress25 (http://www.ebi.ac.uk/arrayexpress/).
Participant submissionsThough the ultimate goal of a classification task is to assign
subjects to one class, for example “with disease” or “without dis-ease”, such a binary assignment obscures the reality that some subjects can be assigned more confidently than others. For this reason, teams were asked to assign a “belief”, or confidence, as to whether each subject belonged in a particular class. The belief is a value between 0 and 1, and its sum over all classes for a given subject equals 1. A team’s complete set of predictions is viewed as a “belief matrix”, with rows and columns corresponding to individual subjects and possible classifications, respectively. This belief matrix was evaluated against a “gold standard” matrix, where elements are 1 for “true” classification of a subject and 0 otherwise.
IncentivesA critical component of the IMPROVER methodology is to
provide incentives that drive sufficient participation to achieve the outlined scientific goals and harness the wisdom of crowds to assess the best available methods. The organizers paid special attention to developing incentives that furthered the scientific goals of participants as well as the company. To encourage sci-entific development in the DSC, the overall best performer was awarded a research grant of $50k.
There were additional benefits aimed at the larger body of participants. The participants received independent assessment of their submitted methods. The DSC included a symposium at the end of the challenge to announce the best performers but also to encourage exchange of best practices and lessons learnt. The highest performers overall and in each of the sub-challenges were invited to make a formal presentation of their algorithms and methods at the symposium with reimbursed travel expenses. This special issue of Systems Biomedicine contains papers from the best performers,6-11,26,27 and reviews of the method aggregation and general conclusions drawn from the collective knowledge gained from the challenge.5,28
ScoringThe overall goal of scoring is to evaluate predictions in a fair
and unbiased way. IBM developed and implemented the scoring methods with the oversight and approval of an independent panel of experts comprising the External Scoring Panel. The panel was also tasked with adjudicating ties and other unforeseen issues that might arise.
A large number of scoring metrics were initially considered because each can assess different aspects of classification truth-fulness. The External Scoring Panel decided on a final scoring

www.landesbioscience.com systems Biomedicine 11
scheme that was an aggregate of several individual metrics to be applied to each of the sub-challenges. While the general structure of the scoring methodologies was disclosed, the specific details of the methods were disclosed only after the challenge closure, as strongly advised by John Moult (University of Maryland, College Park, MD, USA), one of the external panel members involved in design of the DSC. As a principal organizer of the Critical Assessment of Protein Structure Prediction (CASP), Moult had previously observed participating teams custom tailoring algo-rithms to improve their score on a given metric instead of submit-ting more general purpose algorithms with overall better quality predictions.29
The aggregation of several scoring metrics was based on sev-eral criteria including a requirement to score multi-class as well as binary problems, a combination of threshold-based and thresh-old-free metrics, and an assessment of the confidence of predic-tions. The final assessment included three scoring metrics that were non-redundant and highlighted different qualities of the submissions, namely the BCM, Area Under the Precision-Recall (AUPR) Curve, and CCEM. For more information regarding the scoring metrics, please see Norel et al. in this issue.5
IBM team members computed scores for each submission based on the three metrics in a true double-blind evaluation procedure. That is, participants were not provided labels for the subjects they had to classify, and teams were anonymous to the scorers. For each sub-challenge, each of the three metrics was normalized to range from 0 to a perfect score of 1. Statistical significance was calculated based on a distribution of 100,000 random predictions, and P-values adjusted by multiplying by the number of tests to characterize the false discovery rate (FDR).
Teams were ranked within and across sub-challenges by aggregating all three scoring metrics. Although P-values provide
quantitative performance information for each sub-challenge, aggregation of P-values across sub-challenges (e.g., geometric mean) can be confounded when there is a too large spread in P-values from one sub-challenge to the next. To avoid this bias, a rank-sum scheme was used both to combine rankings across sub-challenges to identify best overall performers, but also to combine scoring metrics within each sub-challenge to identify best individual performers. To verify the robustness of the best performers, bootstrapping was performed to ensure that the best performers’ rankings were not overly sensitive to the exact con-figuration of the gold standard. Specifically, the gold standard was sampled with replacement 100 times, and rankings recom-puted. The best performers remained the same within the dif-ferent samples, but teams below rank 3 were not as robust (i.e., with different sampling they obtained a different rank). For more details on the scoring methodology, see Norel et al. in this issue.5
Disclosure of Potential Conflicts of Interest
No potential conflicts of interest were disclosed.
Acknowledgments
The authors thank Elise Blaese for reviewing and help-ing to edit the manuscript; Filipe Bonjour, Bruce O’Neel and Kaushik Sarkar for development and support of the DSC web-site; Hugh Browne, Claudia Frei, Christian Haettenschwiler, Tim Kilhenmann and Shweta Stadler for organization of com-munications with the DSC participants and the sbv IMPROVER symposium 2012; Jean Binder, Nathalie Conrad, Stephanie Corthesy, Peter Fraser Curle, Chaturika Jayadewa, Lionel Schilli, Joerg Sprengel and all the team members who are not among the authors for their contributions during discussion sessions and management of the project.
References1. Biomarkers Definitions Working Group. Biomarkers
and surrogate endpoints: preferred definitions and conceptual framework. Clin Pharmacol Ther 2001; 69:89-95; PMID:11240971; http://dx.doi.org/10.1067/mcp.2001.113989
2. Shi L, Reid LH, Jones WD, Shippy R, Warrington JA, Baker SC, Collins PJ, de Longueville F, Kawasaki ES, Lee KY, et al.; MAQC Consortium. The MicroArray Quality Control (MAQC) proj-ect shows inter- and intraplatform reproducibility of gene expression measurements. Nat Biotechnol 2006; 24:1151-61; PMID:16964229; http://dx.doi.org/10.1038/nbt1239
3. Shi L, Campbell G, Jones WD, Campagne F, Wen Z, Walker SJ, Su Z, Chu TM, Goodsaid FM, Pusztai L, et al.; MAQC Consortium. The MicroArray Quality Control (MAQC)-II study of common practices for the development and validation of microarray-based predictive models. Nat Biotechnol 2010; 28:827-38; PMID:20676074; http://dx.doi.org/10.1038/nbt.1665
4. Meyer P, Alexopoulos LG, Bonk T, Califano A, Cho CR, de la Fuente A, de Graaf D, Hartemink AJ, Hoeng J, Ivanov NV, et al. Verification of systems biology research in the age of collaborative competition. Nat Biotechnol 2011; 29:811-5; PMID:21904331; http://dx.doi.org/10.1038/nbt.1968
5. Norel R, Bilal E, Conrad-Chemineau N, Bonneau R, de la Fuente A, Jurisica I, Marbach D, Meyer P, Rice JJ, Tuller T, et al. IMPROVER Diagnostics Signature Challenge scoring strategies. Syst Biomed 2013; In press.
6. Cho J, Lin A, Wang K. Kernel-based method for fea-ture selection and disease diagnosis using transcrip-tomics data. Syst Biomed 2013; In press.
7. Lauria M. Rank-based transcriptional signatures: A novel approach to diagnostic biomarker definition and analysis. Syst Biomed 2013; In press.
8. Ben-Hamo R, Boue S, Martin F, Talikka M, Efroni S. Classification of lung adenocarcinoma and squamous cell carcinoma samples based on their gene expres-sion profile in the Improver Diagnostic Signature Challenge. Syst Biomed 2013; In press.
9. Song L, Horvath S. Predicting COPD status with a random generalized linear model. Syst Biomed 2013; In press.
10. Tarca AL, Than NG, Romero R. Methodological approach from the Best Overall Team in the IMPROVER Diagnostic Signature Challenge. Syst Biomed 2013; In press.
11. Nandy P, Unger M, Zechner C, Dey KK, Koeppl H. Learning diagnostic signatures from microarray data using L1-regularized logistic regression. Syst Biomed 2013; In press.
12. Tarca A, Lauria M, Unger M, Bilal E, Boue S, Dey KK, et al. Strengths and limitations of microarray-based phenotype prediction: Lessons learned from the IMPROVER Diagnostic Signature Challenge; Submitted
13. Portela A, Esteller M. Epigenetic modifications and human disease. Nat Biotechnol 2010; 28:1057-68; PMID:20944598; http://dx.doi.org/10.1038/nbt.1685
14. Vidal CJ. Post-translational modifications in health and disease. New York: Springer; 2011. xiii, 486 pp
15. Huang S. Gene expression profiling, genetic net-works, and cellular states: an integrating concept for tumorigenesis and drug discovery. J Mol Med (Berl) 1999; 77:469-80; PMID:10475062; http://dx.doi.org/10.1007/s001099900023
16. Weinstein IB, Joe AK. Mechanisms of disease: Oncogene addiction--a rationale for molecular tar-geting in cancer therapy. Nat Clin Pract Oncol 2006; 3:448-57; PMID:16894390; http://dx.doi.org/10.1038/ncponc0558
17. Subramanian A, Tamayo P, Mootha VK, Mukherjee S, Ebert BL, Gillette MA, Paulovich A, Pomeroy SL, Golub TR, Lander ES, et al. Gene set enrichment analysis: a knowledge-based approach for interpreting genome-wide expression profiles. Proc Natl Acad Sci U S A 2005; 102:15545-50; PMID:16199517; http://dx.doi.org/10.1073/pnas.0506580102
18. Tuller T, Atar S, Ruppin E, Gurevich M, Achiron A. Global map of physical interactions among differen-tially expressed genes in multiple sclerosis relapses and remissions. Hum Mol Genet 2011; 20:3606-19; PMID:21676896; http://dx.doi.org/10.1093/hmg/ddr281

12 systems Biomedicine Volume 1 issue 4
19. Marbach D, Prill RJ, Schaffter T, Mattiussi C, Floreano D, Stolovitzky G. Revealing strengths and weaknesses of methods for gene network infer-ence. Proc Natl Acad Sci U S A 2010; 107:6286-91; PMID:20308593; http://dx.doi.org/10.1073/pnas.0913357107
20. Bai JP, Abernethy DR. Systems pharmacology to predict drug toxicity: integration across levels of bio-logical organization. Annu Rev Pharmacol Toxicol 2013; 53:451-73; PMID:23140241; http://dx.doi.org/10.1146/annurev-pharmtox-011112-140248
21. Modified Risk Tobacco Product. Available from: http://www.fda.gov/TobaccoProducts/Labeling/TobaccoProductReviewEvaluation/ucm304465.htm.
22. de Jong M, Maina T. Of mice and humans: are they the same?--Implications in cancer translational research. J Nucl Med 2010; 51:501-4; PMID:20237033; http://dx.doi.org/10.2967/jnumed.109.065706
23. Nair A, Klusmann MJ, Jogeesvaran KH, Grubnic S, Green SJ, Vlahos I. Revisions to the TNM stag-ing of non-small cell lung cancer: rationale, clinico-radiologic implications, and persistent limitations. Radiographics 2011; 31:215-38; PMID:21257943; http://dx.doi.org/10.1148/rg.311105039
24. Barrett T, Wilhite SE, Ledoux P, Evangelista C, Kim IF, Tomashevsky M, Marshall KA, Phillippy KH, Sherman PM, Holko M, et al. NCBI GEO: archive for functional genomics data sets--update. Nucleic Acids Res 2013; 41(Database issue):D991-5; PMID:23193258; http://dx.doi.org/10.1093/nar/gks1193
25. Rustici G, Kolesnikov N, Brandizi M, Burdett T, Dylag M, Emam I, Farne A, Hastings E, Ison J, Keays M, et al. ArrayExpress update--trends in data-base growth and links to data analysis tools. Nucleic Acids Res 2013; 41(Database issue):D987-90; PMID:23193272; http://dx.doi.org/10.1093/nar/gks1174
26. Tian S, Suárez-Fariñas M. Hierarchical-TGDR: Combining biological hierarchy with a regularization method for multi-class classification of lung cancer samples via high-throughput gene-expression data. Syst Biomed 2013; In press.
27. Zhao C, Deshwar AG, Morris Q. Relapsing-remitting multiple sclerosis classification using elastic net logis-tic regression on gene expression data. Syst Biomed 2013; In press.
28. Hoeng J, Stolovitzky G, Peitsch MC. Diagnostic Signature Challenge: sbv IMPROVER. Syst Biomed 2013; In press.
29. Moult J, Fidelis K, Kryshtafovych A, Tramontano A. Critical assessment of methods of protein struc-ture prediction (CASP)--round IX. Proteins 2011; 79(Suppl 10):1-5; PMID:21997831; http://dx.doi.org/10.1002/prot.23200
Related Documents


![Cheap Electronic Shift Improver[1]](https://static.cupdf.com/doc/110x72/577d35601a28ab3a6b904536/cheap-electronic-shift-improver1.jpg)

