GE.18-20075(E) *1820075* Subsidiary Body for Implementation Forty-ninth session Katowice, 2–8 December 2018 Item 3(b) of the provisional agenda Reporting from and review of Parties included in Annex I to the Convention Compilations and syntheses of second and third biennial reports from Parties included in Annex I to the Convention Compilation and synthesis of third biennial reports of Parties included in Annex I to the Convention Executive summary Report by the secretariat Summary This document contains a summary of the compilation and synthesis of the third biennial reports submitted to the secretariat by Parties included in Annex I to the Convention. The summary highlights key findings in relation to quantified economy-wide emission reduction targets; progress towards the achievement of those targets, including information on mitigation actions and their effects, estimates of emission reductions and removals and the use of units from market-based mechanisms and land use, land-use change and forestry activities; greenhouse gas emission trends and projections; and the provision of financial, technological and capacity-building support to developing country Parties. United Nations FCCC/SBI/2018/INF.8 Distr.: General 22 November 2018 English only

Welcome message from author
This document is posted to help you gain knowledge. Please leave a comment to let me know what you think about it! Share it to your friends and learn new things together.
Transcript
GE.18-20075(E)
*1820075*
Subsidiary Body for Implementation Forty-ninth session
Katowice, 2–8 December 2018
Item 3(b) of the provisional agenda
Reporting from and review of Parties included in Annex I to the Convention
Compilations and syntheses of second and third biennial reports from Parties
included in Annex I to the Convention
Compilation and synthesis of third biennial reports of Parties included in Annex I to the Convention
Executive summary
Report by the secretariat
Summary
This document contains a summary of the compilation and synthesis of the third
biennial reports submitted to the secretariat by Parties included in Annex I to the Convention.
The summary highlights key findings in relation to quantified economy-wide emission
reduction targets; progress towards the achievement of those targets, including information
on mitigation actions and their effects, estimates of emission reductions and removals and
the use of units from market-based mechanisms and land use, land-use change and forestry
activities; greenhouse gas emission trends and projections; and the provision of financial,
technological and capacity-building support to developing country Parties.
United Nations FCCC/SBI/2018/INF.8
Distr.: General
22 November 2018
English only
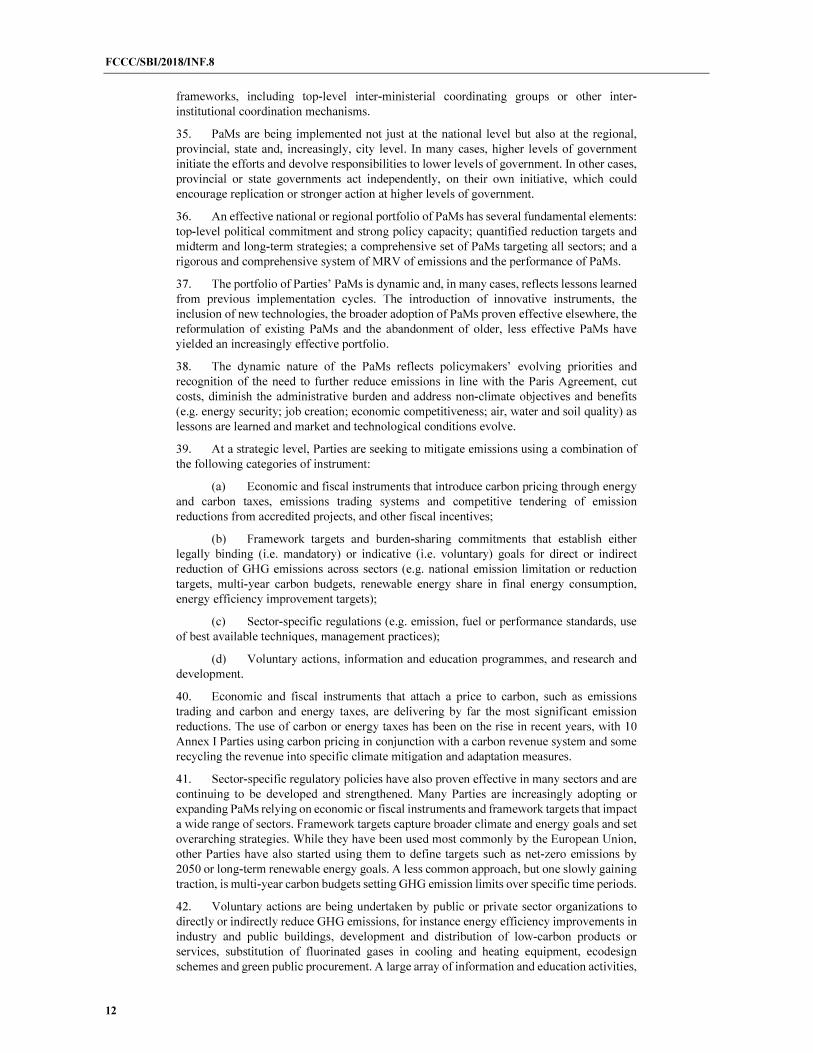
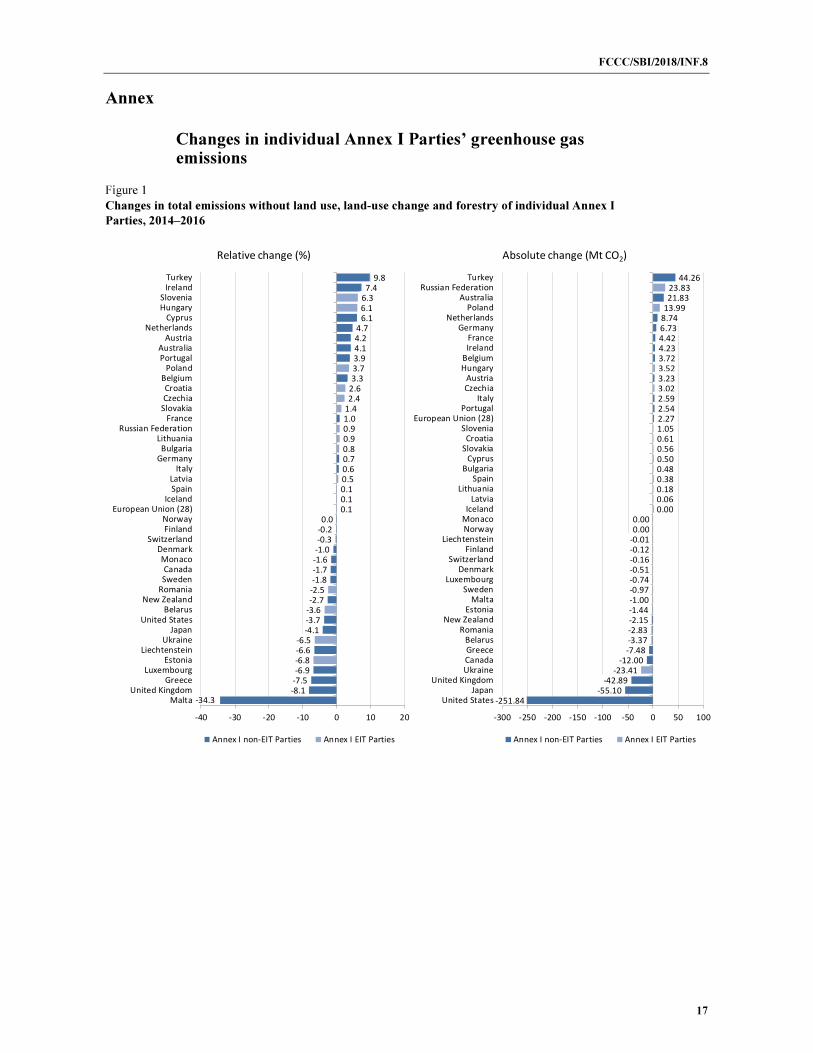
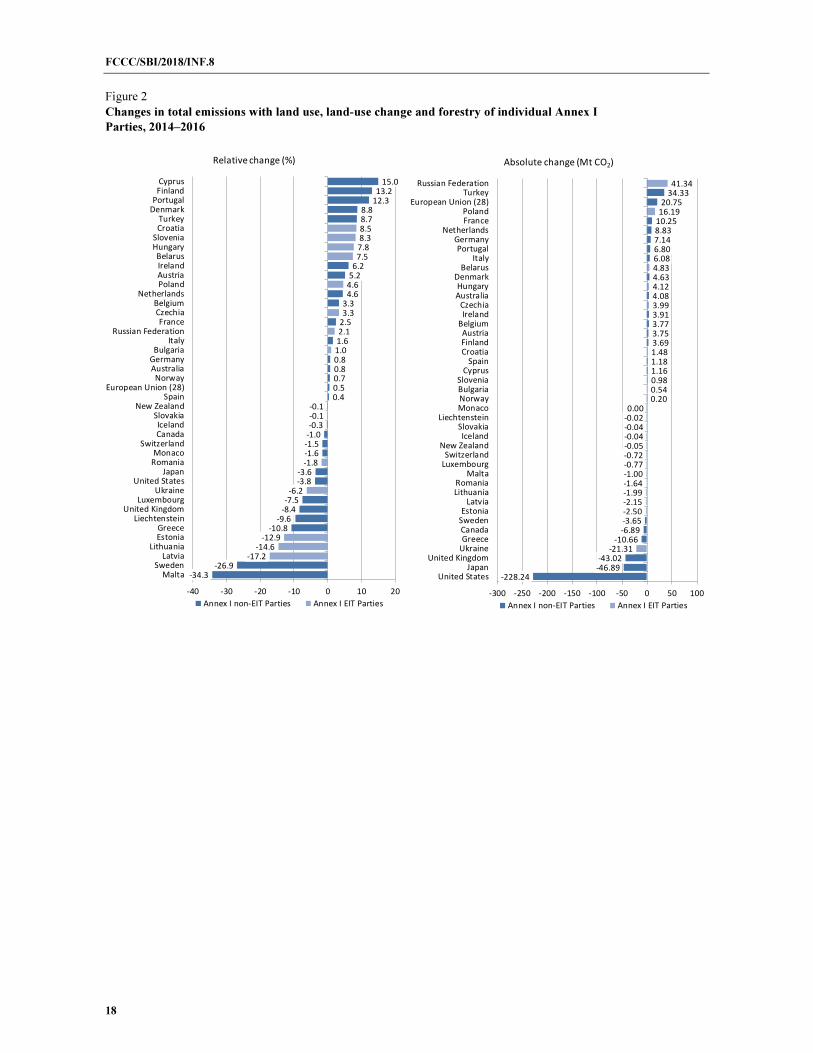
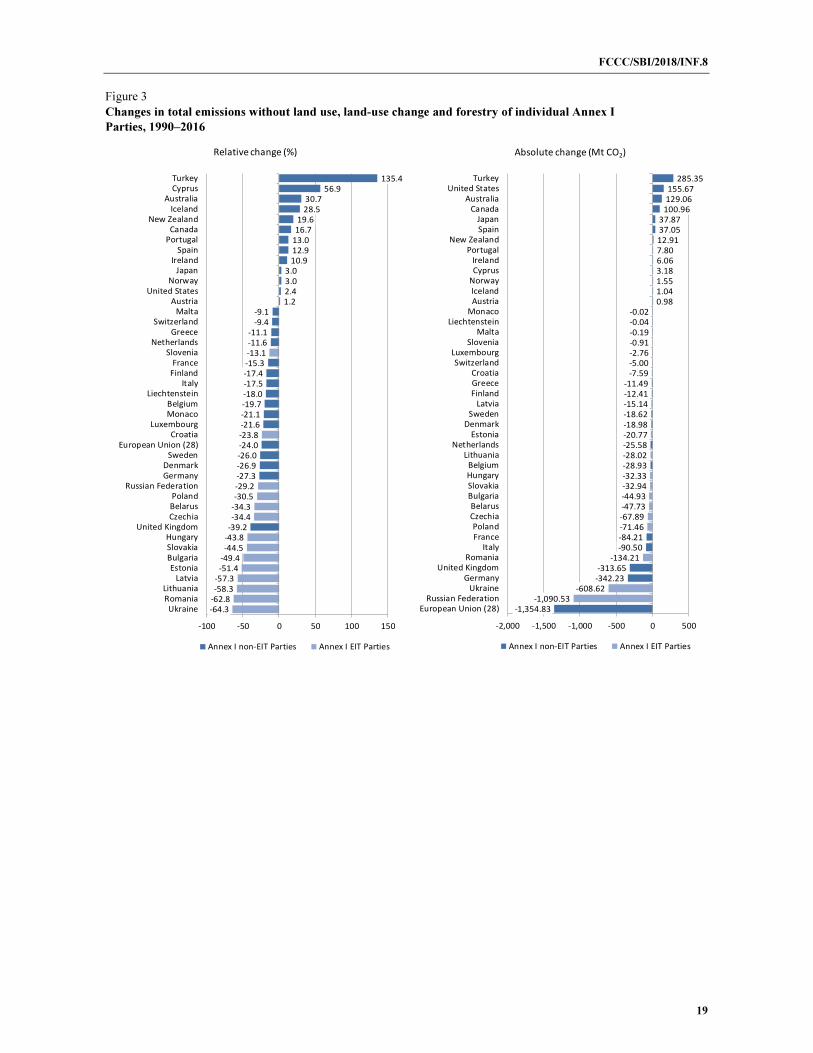
FCCC/SBI/2018/INF.8
2
Contents
Paragraphs Page
Abbreviations and acronyms ................................................................................... 3
I. Mandate and approach ............................................................................................ 1–2 4
II. Key messages from the compilation and synthesis of third biennial reports ........... 3–15 4
III. Executive summary ................................................................................................. 16–67 7
A. Quantified economy-wide emission reduction targets .................................... 16–20 7
B. Progress in achieving the quantified economy-wide emission reduction
targets and use of units from market-based mechanisms ................................ 21–32 8
C. Mitigation actions ........................................................................................... 33–48 11
D. Greenhouse gas emission projections ............................................................. 49–55 13
E. Provision of financial, technological and capacity-building support to
developing country Parties .............................................................................. 56–67 14 Annex
Changes in individual Annex I Parties’ greenhouse gas emissions .................................................. 17
FCCC/SBI/2018/INF.8
3
Abbreviations and acronyms
Annex I Party Party included in Annex I to the Convention
Annex II Party Party included in Annex II to the Convention
BR biennial report
COP Conference of the Parties
CO2 eq carbon dioxide equivalent
EIT Parties Parties with economies in transition
GDP gross domestic product
GHG greenhouse gas
LULUCF land use, land-use change and forestry
MBM market-based mechanism
MRV measurement, reporting and verification
NDC nationally determined contribution
non-EIT Parties Parties that do not have economies in transition
PaMs policies and measures
PPP purchasing power parity
REDD-plus In decision 1/CP.16, paragraph 70, the Conference of the Parties
encouraged developing country Parties to contribute to mitigation
actions in the forest sector by undertaking the following activities:
reducing emissions from deforestation; reducing emissions from forest
degradation; conservation of forest carbon stocks; sustainable
management of forests; and enhancement of forest carbon stocks
FCCC/SBI/2018/INF.8
4
I. Mandate and approach
1. COP 17 decided that developed country Parties should submit their BRs two years
after the due date of a full national communication.1 BR3s were due for submission on
1 January 2018. The COP also decided that developed country Parties should use the
“UNFCCC biennial reporting guidelines for developed country Parties” and the common
tabular format for those guidelines for the preparation of their BRs.2
2. In addition, COP 17 requested the secretariat to prepare compilation and synthesis
reports on the BRs.3 The latest report is contained in document FCCC/SBI/2018/INF.8/Add.1
and provides a compilation and synthesis of the information provided in the submitted BR3s.4
This document is an executive summary of that information.
II. Key messages from the compilation and synthesis of third biennial reports
3. Annex I Parties are increasingly implementing mitigation PaMs that bring them
closer to their 2020 targets. The impact of these PaMs is manifested in the flattening of
GHG emission trends by 2020 and beyond. Increasing levels of financial support provided
by Annex II Parties to non-Annex I Parties could provide an incentive for a shift towards a
low-emission and climate-resilient development pathway.
4. The total GHG emissions of Annex I Parties have continued to decrease. The
emission trend shows that their total emissions have been on a relatively steady reduction
pathway: excluding LULUCF they decreased by 13.0 per cent from 1990 to 2016 and by 4.4
per cent more recently, from 2010 to 2016. During the 1990–2016 reporting period, the total
GHG emissions of Annex I Parties were highest in 1990; after 1990, a deep decrease in the
emissions of EIT Parties more than offset the slow growth in the emissions of non-EIT
Parties, which peaked in 2007. This was followed by a steep decline in Annex I Parties’ total
emissions in the period 2008–2009, reflecting the impact of the global economic and financial
crisis, and a subsequent rebound in emissions in 2010.
5. GHG emissions relative to economic output and population have also declined,
which signals a continued decarbonization of societies and economies. GHG emissions
per unit of GDP using PPP have continued to decline at the same rate since 2010 for EIT and
non-EIT Parties, following a period in which emissions per unit of GDP in EIT Parties
declined more rapidly. GHG emissions per capita of EIT and non-EIT Parties converged in
2012 and have since stayed on a similar declining path.
6. The total GHG emissions are projected to be roughly at the same level in 2020 as
in 2016. Compared with the 1990 level, a 11.4 per cent decrease in total GHG emissions
excluding LULUCF and a 17.9 per cent decrease including LULUCF are projected for 2020
under the ‘with existing measures’ scenario, which takes into account implemented and
adopted PaMs. The projections from 2016 (the latest available reporting year for GHG
inventories) to 2020 show emissions increasing by 1.9 per cent, but this increase might be
attributed in part to the fact that the projections reported in the BR3s are modelled using
emission data for 2015 or earlier. The overall decline in GHG emissions since 1990 reflects
primarily the impact of the economic transformation of EIT Parties in the 1990s and the
strengthening of climate change mitigation actions by all Parties in the second half of the
2000s and in the 2010s.
7. Annex I Parties are progressing towards their 2020 targets but gaps remain.
Individual Parties have made varying progress towards their 2020 targets: most Parties’
emission levels are already below their 2020 targets; some Parties must make further efforts
to meet their targets by strengthening implementation of their existing PaMs and using units
from MBMs, if needed, and the contribution from LULUCF, if applicable; other Parties’
1 Decision 2/CP.17, paragraph 13.
2 Decisions 2/CP.17, paragraph 13, and 19/CP.18, paragraph 1.
3 Decision 2/CP.17, paragraph 21.
4 Information on the status of submission of BR3s is contained in document FCCC/SBI/2018/INF.14.
FCCC/SBI/2018/INF.8
5
emissions remained above their base-year level, owing mainly to inadequacy of domestic
PaMs, high marginal mitigation costs or energy system constraints – they indicated that the
use of units from MBMs and, if applicable, the contribution from LULUCF are expected to
make a sizable contribution towards achieving their targets.
8. Climate-related legal, institutional and policy frameworks are being
strengthened, reflecting lessons learned and responding to the requirement to prepare
for the implementation of the Paris Agreement. There is evidence in the BR3s that Parties
are strengthening their institutional and policy frameworks, which should not only enable
implementation of existing PaMs and achievement of quantified economy-wide emission
reduction targets for 2020 but also pave the way for implementation of post-2020 NDCs
under the Paris Agreement. Parties are treating climate change mitigation as a core issue on
their national policy agenda and have developed substantial policy capacity with legal,
institutional and policy frameworks, including top-level interministerial coordinating groups and other inter-institutional mechanisms.
9. The portfolio of PaMs continues to expand thanks to strong political
commitment. The BR3s show a continuation of the trend observed from previous BRs of a
growing, strengthening and diversifying portfolio of mitigation PaMs towards achieving the
2020 targets, which is now also being shaped by the increased ambition of the midterm targets
communicated in NDCs under the Paris Agreement. The portfolio of Annex I Parties’ PaMs
is dynamic and, in many cases, reflects lessons learned from previous implementation cycles.
Economic and fiscal instruments that attach a price to carbon, such as emissions trading and
carbon and energy taxes, are delivering by far the most significant emission reductions. More
Parties are starting to adopt carbon and energy taxes as they provide a price signal to
businesses and consumers and help to support both climate mitigation and adaptation action
through carbon revenue recycling. PaMs are driving innovation through policy instruments,
such as multi-year carbon budgets, and competitive tendering for new renewable energy
projects, rather than feed-in tariffs. A growing number of PaMs are focused on the
electrification of transport and space heating, which has significant potential to reduce
emissions when paired with low-carbon electricity generation and to increase energy
efficiency. Parties are largely maintaining rather than increasing their use of regulatory
measures and voluntary agreements.
10. Transformational change towards low- and zero-carbon economies is on its way
but the overall pace remains slow. The BR3s are the first submissions since the entry into
force of the Paris Agreement, and for the first time some Parties reported on both mid-term
and long-term emission reduction goals. Emission reduction targets for 2020 are increasingly
being seen not as an end point but as a waypoint on the trajectory towards the midterm and
long-term targets under the Paris Agreement (NDCs for 2030 and carbon neutrality or net-
zero emission targets, respectively). Parties reported in their BR3s mitigation actions
primarily aimed at meeting their 2020 targets, but considerable attention was also given to
actions aimed at meeting climate goals in 2030 and beyond. In the near term, however, the
overall results demonstrate a clear need for additional action, as emission trajectories to 2020
and 2030 are projected to remain relatively flat, rather than to continue to decline, owing to
other factors counteracting the impact of existing PaMs.
11. Financial support is increasing year on year. Total financial support provided by
Annex II Parties increased by 13.3 per cent from 2013–2014 to 2015–2016, amounting to
USD 49.4 billion in 2016. Although the overall impact of financial support provided by
Annex II Parties on emissions trends and resilience is difficult to estimate, the trend in support
provided may suggest the beginning of an urgently needed shift towards low-emission and
climate-resilient development – away from carbon-intensive infrastructure investments. The
largest share of the total financial support reported in the BR3s was categorized as climate-
specific support, the bulk of it being financial support through bilateral, regional and other
channels. Mitigation finance represented about two thirds of the climate-specific support,
with the bulk of the rest being adaptation finance and cross-cutting (mitigation and adaption)
finance. The share of core or general support (support provided to multilateral institutions
that Parties cannot specify as being climate-specific support) reported in the BR3s is lower
than that of support reported in the BR2s. The BR3s highlight the growing the role of private
finance, with 13 Annex II Parties providing quantitative information in various degrees of
FCCC/SBI/2018/INF.8
6
detail. In terms of sectoral distribution, the information provided suggests that the largest
amount of funding was provided to the energy sector, followed by transport, agriculture,
forestry, industry, and water and sanitation.
12. Support for technology transfer activities has remained stable. In the BR3s,
Annex II Parties reported on a similar number of activities for the provision of technological
support to developing countries to that reported in the BR2s. A number of EIT Parties also
provided information on their voluntary support activities. The level of support reported as
provided for adaptation technology activities remained similar to that reported in the BR2s.
Asia has become the predominant recipient of technology transfer. It was also noted that
more than 45 per cent of projects covered the least developed countries and more than 45 per
cent small island developing States. Most activities continued to be focused on mitigation in
the energy sector and adaptation in the agriculture sector, and were predominantly related to
the transfer or deployment of mature climate technologies.
13. Capacity-building is increasingly being geared towards adaptation and
addresses multiple sectors. Of the capacity-building activities reported, twice as many are
aiming to build capacity for adaptation as for mitigation. In addition, numerous activities
address capacity-building in multiple sectors, and a minority are focusing on technology
development and transfer. A number of Annex I Parties highlighted that capacity-building
support is often delivered together with climate finance support. The largest share of
capacity-building activities in 2015–2016 took place in Africa, Eastern Europe and, to a
lesser degree, Latin America and the Caribbean, which saw increases in their share of the
reported activities in 2015–2016 compared with 2013–2014, while the proportions of
multiregional or global activities and activities in Asia-Pacific decreased. Areas receiving
increased support include REDD-plus, readiness for and access to climate finance, NDC
implementation, and transparency.
14. While technology transfer, together with capacity-building support, is focusing
on the needs of developing countries in the lead-up to 2020, it is also helping to create
and strengthen their institutional and policy frameworks for action after 2020. The Paris
Agreement has led to a stronger international focus on technology transfer and capacity-
building for mitigation and adaptation, including providing the institutional and systemic
support developing countries need to establish the frameworks and policies for the
implementation of their post-2020 NDCs and to develop an MRV system that can properly
assess the effectiveness of their mitigation actions. The BR3s show that the pre-2020 period
is essential for building capacity for transparency through support for international
programmes and partnerships that deliver soft technology transfer, often in combination with
capacity-building. Such support is also helping to create and strengthen the institutional and
policy frameworks of developing countries so as to enable them to take action after 2020 as
well.
15. The quality of biennial reporting under the Convention has continued to
improve. The completeness and transparency of the information reported in the BR3s has
improved compared with the BR2s.5 To a large extent, the improvements are a result of the
effective functioning of the MRV system under the Convention and, in particular, the
technical review of BRs. Parties addressed many of the recommendations of expert review
teams and reported more information in greater detail on their mitigation actions and
provision of financial, technological and capacity-building support. In addition, Parties have
deepened their understanding of how their climate policies are performing over time and how
they affect emission trends, which was reflected in the enhanced reporting. Also, many
Parties not included in Annex II to the Convention (mostly EIT Parties) have gone beyond
the mandatory requirements of the Convention and have started to report on a voluntary basis
finance, technology transfer and capacity-building support to developing countries. Overall,
the improved quality of the reported information suggests that Parties are increasingly
moving towards data-driven policymaking on climate change at the national level (e.g. on
emissions trading) and are enhancing the transparency of the information that they share at
5 Conclusion based on a comparison of the number of recommendations of expert review teams on the
completeness and transparency of information provided in the BR2s and BR3s of 16 Parties whose
technical review reports were published by 31 October 2018.

FCCC/SBI/2018/INF.8
7
the international level on their efforts to mitigate emissions and support developing country
Parties’ action on climate change. Notwithstanding such improvements, reporting
quantitative estimates of the mitigation impact of individual PaMs continues to be a major
challenge for most Parties.
III. Executive summary
A. Quantified economy-wide emission reduction targets
16. All Annex I Parties, except Turkey, have communicated their quantified economy-
wide emission reduction targets for 20206 and reported these targets in their BR3s. Each
target is stipulated as a percentage reduction in absolute GHG emissions from the base-year
level to be achieved by 2020 and is supported by information on assumptions and conditions,
base year, coverage of gases and sectors, the role of LULUCF, if included in the target, and
the use of units from MBMs, if envisaged.
17. Although Parties are required to report ex post information relevant to assessing
progress towards their targets, including total annual GHG emissions and the contribution
from LULUCF and MBMs, there is no specific guidance outside the Kyoto Protocol rules on
accounting for such emissions and contributions to demonstrate the achievement of the 2020
targets, which would ensure, for instance, the avoidance of double counting of units from
MBMs across Parties.
18. Most Parties have taken on multiple targets: one that is unconditional (independent of
future circumstances) and one that is more ambitious but conditional (contingent on certain
conditions, such as treaty provisions or pledges made by other Parties). Parties did not report
in their BR3s whether any of the conditions for an increase in their ambition, attached to their
conditional targets, had been met so far.
19. Many Parties reported in their BR3s information on the post-2020 targets
communicated in their NDCs under the Paris Agreement. Several Parties also reported on
their long-term mitigation goals, typically for 2050, highlighting that the 2020 targets are part
of their national climate policies setting medium- to long-term trajectories towards more
substantial emission cuts and the transition to low- or zero-carbon economies.
20. An overview of Parties’ base years and unconditional and conditional targets for 2020,
2030 and 2050 is provided in the table below.
Annex I Parties’ greenhouse gas emission reduction targets
Party
Quantified economy-wide emission reduction
target for 2020 (reduction from base-year
emission level)
GHG emission reduction target for 2030 as
communicated in NDC under the Paris
Agreement unless otherwise noted
(reduction from base-year emission level)
GHG emission reduction long-
term target or objective
(reduction from base-year
emission level)
Base year Unconditional Conditional Base year Unconditional Conditional Base year Target/objective
Australia 2000 5% 15–25% 2005 26–28%
Belarus 1990 5–10% 1990 At least 28%
Canada 2005 17% 2005 30% 2005 At least 80%
European Union 1990 20% 30% 1990 At least 40% 1990 80–95% by 2050
Iceland 1990 20% 30% 1990 40%
Japan 2005 At least 3.8% 2013 26% 2010 At least 70% by
2050
6 Contained in document FCCC/SBSTA/2014/INF.6.

FCCC/SBI/2018/INF.8
8
Party
Quantified economy-wide emission reduction
target for 2020 (reduction from base-year
emission level)
GHG emission reduction target for 2030 as
communicated in NDC under the Paris
Agreement unless otherwise noted
(reduction from base-year emission level)
GHG emission reduction long-
term target or objective
(reduction from base-year
emission level)
Base year Unconditional Conditional Base year Unconditional Conditional Base year Target/objective
Kazakhstan 1990 15% 1990 15% 25% 1990 25% by 2050
Liechtenstein 1990 20% 30% 1990 40%
Monaco 1990 30% 1990 50% 1990 80% and carbon
neutral by 2050
New Zealand 1990 5% 10–20% 2005 30% 1990 50% by 2050
Norway 1990 30% 40% 1990 40% 1990 80–95% by 2050
and carbon
neutral by 2030
Russian Federation 1990 15–25% 1990 70–75%
Switzerland 1990 20% 30% 1990 50% 1990 70–85% by 2050
Turkey No target for 2020 Up to 21% reduction from ‘business
as usual’
Ukraine 1990 20% 1990 40% Low-emission
2050
development
strategy to
support 2 °С
target
United States 2005 In the range of
17%
2005 26–28%
by 2025
2005 80% or more by
2050
B. Progress in achieving the quantified economy-wide emission reduction
targets and use of units from market-based mechanisms
21. Parties reported on progress in achieving their targets in terms of both mitigation
actions and the results achieved as reflected in their GHG emission trends and use of units
from MBMs and contributions from LULUCF activities.
1. Greenhouse gas emission trends
22. For all Annex I Parties,7 total aggregate GHG emissions decreased over the period
1990–2016 by 13.0 per cent excluding LULUCF and by 18.5 per cent including LULUCF.
Over the same time period, emissions of EIT Parties decreased by 37.6 per cent without
LULUCF and by 49.6 per cent with LULUCF, while emissions of non-EIT Parties decreased
by 1.3 per cent without LULUCF and by 2.5 per cent with LULUCF.
23. Figure 1 shows that in the 1990–2016 reporting period, total emissions of Annex I
Parties were highest in 1990, mostly thanks to the high level of emissions of EIT Parties at
that time. After 1990, a deep decrease in the emissions of EIT Parties more than offset the
slow growth in the emissions of non-EIT Parties, which peaked in 2007. This was followed
by a steep decline in Annex I Parties’ total emissions in the period 2008–2009, reflecting the
impact of the global economic and financial crisis, and a subsequent rebound in emissions in
2010.
7 Latest available GHG emission data taken from the 2018 annual inventory submissions received as at
27 May 2018, including for the Annex I Parties that had not yet submitted their BR3s (Belarus,
Ukraine and United States).

FCCC/SBI/2018/INF.8
9
24. For all Annex I Parties, total aggregate GHG emissions decreased over the period
2010–2016 by 4.4 per cent excluding LULUCF and by 4.8 per cent including LULUCF. Over
the same period, emissions excluding LULUCF for non-EIT Parties fell by 5.3 per cent, while
those of EIT Parties decreased by 1.2 per cent.
Figure 1
Greenhouse gas emissions without land use, land-use change and forestry for Annex I
Parties, 1990–2016
2. Progress towards targets
25. The assessment of Parties’ individual progress in achieving their quantified economy-
wide emission reduction targets is based on a comparison of the latest levels of GHG
emissions reported by Parties, including the contribution of LULUCF, if included in the
target, and the use of units from MBMs, where applicable and available, with the base-year
emission level and the targeted emission level for 2020.
26. In this context, and given that all Parties’ 2020 targets require a degree of emission
reduction below the base-year level, the latest emission levels reported in the BR3s for 2015
can be placed into on the following categories:
(a) Below both the 2020 targeted emission level and the base-year emission level,
which implies that the 2020 target is likely to be achieved, assuming emissions don’t increase
in the lead-up to 2020;
(b) Between the base-year emission level and the 2020 targeted emission level,
which implies that progress towards the 2020 target has been made but that further efforts
are required to achieve it;
(c) Above the base-year emission level, which means that current emission trends
diverge from the trajectory towards achieving the 2020 target. This could result from the
inadequacy of domestic PaMs in reducing emissions and high marginal mitigation costs. It
could also result from system constraints, such as almost carbon-free electricity production
since the base year, leaving little room for improvement through decarbonization of the
power generation mix, or dependence for economic and energy security reasons on carbon
intensive domestic energy supply. Several Parties from this category indicated that they
intend to use MBMs to meet their 2020 targets.
27. Taking into account emission levels up to 2015 and reported contributions from
LULUCF as well as units from MBMs, individual Parties have made progress towards their
2020 targets to varying degrees:
(a) The emission levels of Australia, the EU, Japan, Kazakhstan and the Russian
Federation were already lower than their respective 2020 targeted emission levels;
19,694
17,127
13,336 13,161
6,358
3,967
0
5,000
10,000
15,000
20,000
1990 1992 1994 1996 1998 2000 2002 2004 2006 2008 2010 2012 2014 2016
Mt
CO
2e
q
Total Annex I Parties (-13.0%↓) Non-EIT Parties (-1.3%↓) EIT Parties (-37.6%↓)
FCCC/SBI/2018/INF.8
10
(b) The emissions levels in 2015 combined with the contributions from LULUCF
and/or units from MBMs, where applicable, of Monaco and Switzerland indicate that while
these Parties had made a good deal of the emission reductions needed to attain their 2020
targets, further efforts are needed to achieve those targets. Canada and Liechtenstein reported
information that indicates that while they have made progress towards their targets, the bulk
of the reductions needed to achieve their 2020 targets remain to be made;
(c) The 2015 emissions of Iceland, New Zealand and Norway were above their
base year levels. These Parties intend to use contributions from LULUCF and units from
MBMs to meet their respective targets.
28. For 2014–2016, more than half of Parties reported increases in their GHG emissions
(see figures 1 and 2 in the annex). Observed inter-annual deviations from long-term emission
trends could have been be caused by weather conditions, fuel prices, economic circumstances
and other factors. Given the relatively short time between now and 2020, it is important that
Parties closely assess such deviations to ensure that they are only temporary and not an
inflection point (see the changes in Annex I Parties’ total GHG emissions for the entire period
1990–2016 in figures 3 and 4 in the annex).
29. Further insight into the trends in Annex I Parties’ decarbonization of their societies
and economies is provided by two aggregate indicators that combine emissions and
additional statistical data: the level of GHG emissions per capita and the level of GHG
emissions per unit of GDP using PPP, an economic comparison that accounts for the
difference in the cost of living among countries. These indicators are useful for comparing
emission levels among Parties and for evaluating trends.
30. In general, the emission trends have been influenced by a combination of
demographic, economy-wide and sector-specific drivers, including, but not limited to,
population changes (see para. 31 below), structural changes in Annex I Parties’ economies
(i.e. the shift in the ratio of manufacturing to services, which was particularly pronounced in
EIT Parties); technological improvements in production processes and the shift to less
carbon-intensive fossil fuels (i.e. from coal to natural gas); the increased share of renewable
energy sources in electricity and heat generation; and increased energy efficiency.
31. Annex I Party GHG emissions per unit of GDP using PPP dropped by 46 per cent
between 1990 and 2016, and by 5 per cent between 2014 and 2016. This demonstrates the
continued decoupling of emissions from economic growth due to improvements in energy
efficiency, the increasing use of low-carbon and carbon-free energy sources and the increase
in lower-emission economic activity (services). The gap in GHG emissions per unit of GDP
using PPP between EIT and non-EIT Parties has narrowed since 1990; in EIT Parties they
declined more rapidly than in non-EIT Parties until 2010 and at approximately the same rate
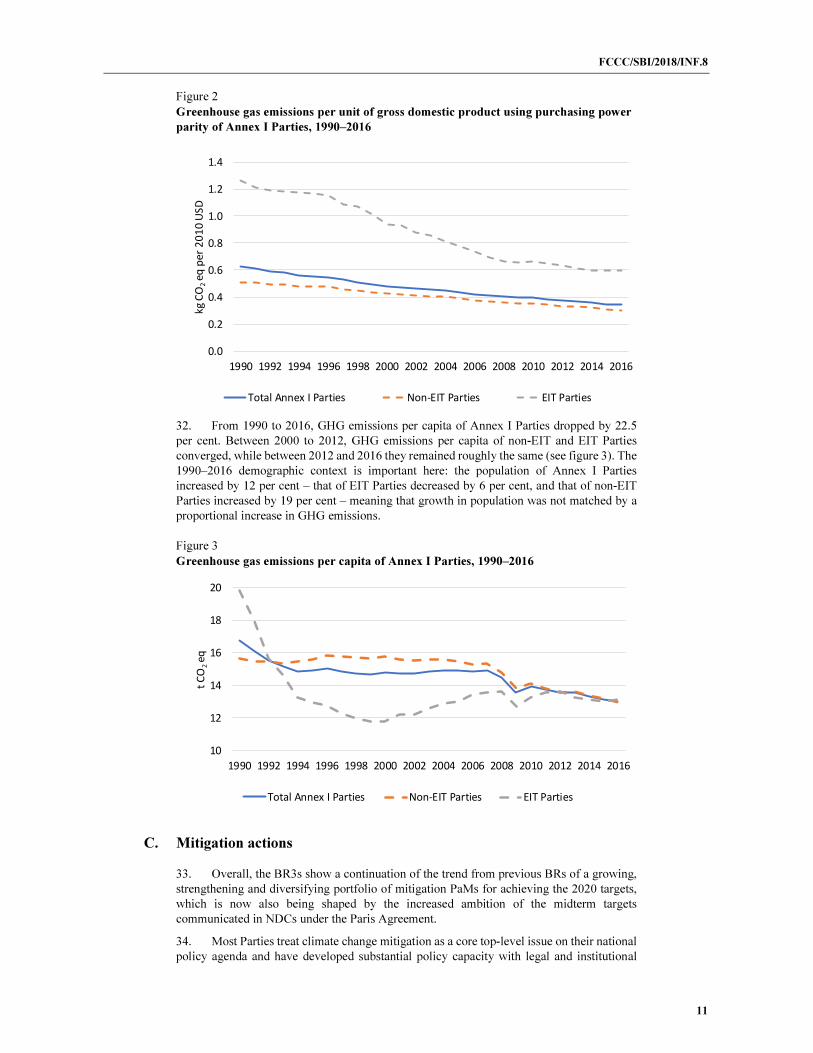
as in non-EIT Parties since then (see figure 2).
FCCC/SBI/2018/INF.8
11
Figure 2
Greenhouse gas emissions per unit of gross domestic product using purchasing power
parity of Annex I Parties, 1990–2016
32. From 1990 to 2016, GHG emissions per capita of Annex I Parties dropped by 22.5
per cent. Between 2000 to 2012, GHG emissions per capita of non-EIT and EIT Parties
converged, while between 2012 and 2016 they remained roughly the same (see figure 3). The
1990–2016 demographic context is important here: the population of Annex I Parties
increased by 12 per cent – that of EIT Parties decreased by 6 per cent, and that of non-EIT
Parties increased by 19 per cent – meaning that growth in population was not matched by a
proportional increase in GHG emissions.
Figure 3
Greenhouse gas emissions per capita of Annex I Parties, 1990–2016
C. Mitigation actions
33. Overall, the BR3s show a continuation of the trend from previous BRs of a growing,
strengthening and diversifying portfolio of mitigation PaMs for achieving the 2020 targets,
which is now also being shaped by the increased ambition of the midterm targets
communicated in NDCs under the Paris Agreement.
34. Most Parties treat climate change mitigation as a core top-level issue on their national
policy agenda and have developed substantial policy capacity with legal and institutional
0.0
0.2
0.4
0.6
0.8
1.0
1.2
1.4
1990 1992 1994 1996 1998 2000 2002 2004 2006 2008 2010 2012 2014 2016
kg
CO
2e
q p
er
20
10
US
D
Total Annex I Parties Non-EIT Parties EIT Parties
10
12
14
16
18
20
1990 1992 1994 1996 1998 2000 2002 2004 2006 2008 2010 2012 2014 2016
t C
O2
eq
Total Annex I Parties Non-EIT Parties EIT Parties
FCCC/SBI/2018/INF.8
12
frameworks, including top-level inter-ministerial coordinating groups or other inter-
institutional coordination mechanisms.
35. PaMs are being implemented not just at the national level but also at the regional,
provincial, state and, increasingly, city level. In many cases, higher levels of government
initiate the efforts and devolve responsibilities to lower levels of government. In other cases,
provincial or state governments act independently, on their own initiative, which could
encourage replication or stronger action at higher levels of government.
36. An effective national or regional portfolio of PaMs has several fundamental elements:
top-level political commitment and strong policy capacity; quantified reduction targets and
midterm and long-term strategies; a comprehensive set of PaMs targeting all sectors; and a
rigorous and comprehensive system of MRV of emissions and the performance of PaMs.
37. The portfolio of Parties’ PaMs is dynamic and, in many cases, reflects lessons learned
from previous implementation cycles. The introduction of innovative instruments, the
inclusion of new technologies, the broader adoption of PaMs proven effective elsewhere, the
reformulation of existing PaMs and the abandonment of older, less effective PaMs have
yielded an increasingly effective portfolio.
38. The dynamic nature of the PaMs reflects policymakers’ evolving priorities and
recognition of the need to further reduce emissions in line with the Paris Agreement, cut
costs, diminish the administrative burden and address non-climate objectives and benefits
(e.g. energy security; job creation; economic competitiveness; air, water and soil quality) as
lessons are learned and market and technological conditions evolve.
39. At a strategic level, Parties are seeking to mitigate emissions using a combination of
the following categories of instrument:
(a) Economic and fiscal instruments that introduce carbon pricing through energy
and carbon taxes, emissions trading systems and competitive tendering of emission
reductions from accredited projects, and other fiscal incentives;
(b) Framework targets and burden-sharing commitments that establish either
legally binding (i.e. mandatory) or indicative (i.e. voluntary) goals for direct or indirect
reduction of GHG emissions across sectors (e.g. national emission limitation or reduction
targets, multi-year carbon budgets, renewable energy share in final energy consumption,
energy efficiency improvement targets);
(c) Sector-specific regulations (e.g. emission, fuel or performance standards, use
of best available techniques, management practices);
(d) Voluntary actions, information and education programmes, and research and
development.
40. Economic and fiscal instruments that attach a price to carbon, such as emissions
trading and carbon and energy taxes, are delivering by far the most significant emission
reductions. The use of carbon or energy taxes has been on the rise in recent years, with 10
Annex I Parties using carbon pricing in conjunction with a carbon revenue system and some
recycling the revenue into specific climate mitigation and adaptation measures.
41. Sector-specific regulatory policies have also proven effective in many sectors and are
continuing to be developed and strengthened. Many Parties are increasingly adopting or
expanding PaMs relying on economic or fiscal instruments and framework targets that impact
a wide range of sectors. Framework targets capture broader climate and energy goals and set
overarching strategies. While they have been used most commonly by the European Union,
other Parties have also started using them to define targets such as net-zero emissions by
2050 or long-term renewable energy goals. A less common approach, but one slowly gaining
traction, is multi-year carbon budgets setting GHG emission limits over specific time periods.
42. Voluntary actions are being undertaken by public or private sector organizations to
directly or indirectly reduce GHG emissions, for instance energy efficiency improvements in
industry and public buildings, development and distribution of low-carbon products or
services, substitution of fluorinated gases in cooling and heating equipment, ecodesign
schemes and green public procurement. A large array of information and education activities,

FCCC/SBI/2018/INF.8
13
mostly on the demand or consumer side, are promoting, for instance, sustainable transport,
renewable energy sources, energy savings, and waste prevention and reuse. Research
activities have been focused on the energy and agriculture sectors.
43. Some 79 per cent of the reported PaMs are based on a single instrument type: 33 per
cent use only regulatory instruments, 24 per cent economic instruments, 7 per cent fiscal
instruments, 7 per cent information instruments and 4 per cent voluntary agreements.
44. The PaM profile varies widely among Parties, for example with regard to the sectors
and gases targeted, the instruments involved and the scale of their estimated mitigation
impacts. Of the 2,012 PaMs reported in the BR3s, about half target only the energy sector
(30 per cent) or only transport (20 per cent). Considerably fewer are aimed at the other
sectors: waste management or waste (8 per cent), agriculture (8 per cent), LULUCF (5 per
cent) and industry or industrial processes (5 per cent).
45. PaMs focused on the energy sector are delivering the greatest emission savings and
are directly or indirectly addressing the need to increase the efficiency of energy end use and
decrease the carbon intensity of energy supply by deploying renewable energy capacity and
shifting to less carbon-intensive fossil fuels (i.e. from coal to natural gas).
46. The transport sector, in which reducing GHG emissions has been a challenge in the
past, is experiencing some innovation, particularly around electric vehicles and the related
infrastructure. PaMs targeting the transport sector are projected to contribute 5 per cent of
the total emission reductions resulting from mitigation actions by 2020. Increasingly
innovative transport PaMs are having a positive impact.
47. PaMs directed at forestry and LULUCF seek to reduce emissions from sources and
enhance removals from sinks through programmes promoting afforestation, reforestation and
sustainable management of forests, grassland, wetlands and cropland. There are also
programmes to prevent forest fires, protect against natural disturbances, protect carbon soil
and increase green urban areas.
48. Institutional frameworks, such as a rigorous and comprehensive national or regional
system of MRV of emissions and performance of PaMs, are necessary to maximize the
relevance, effectiveness, efficiency and sustainability of the PaM portfolio. An effective
MRV system has a dual role. First, it helps to ensure and promote progress towards,
compliance with and responsibility or accountability for meeting commitments and
complying with regulations. This is especially important as more governments (at all levels)
and private sector organizations take on formal responsibilities and commitments for
mitigating climate change. Second, it alerts to the need for possible mid-course revision or
strengthening of PaMs if the results differ from the expected performance.
D. Greenhouse gas emission projections
49. Annex I Parties’ aggregate GHG emissions without LULUCF, including the effect of
implemented and adopted PaMs, are projected to be 11.4 per cent lower in 2020 than in 1990.
For the 40 Parties that reported emission projections with LULUCF, emissions in 2020 are
forecast to be 17.9 per cent lower than in 1990. The projected trend from 2016 (the latest
reported year) to 2020 shows emissions increasing by 1.9 per cent. It should be noted that
this increase could be attributed in part to the fact that the projections reported in the BR3s
are modelled using emission data for 2015 or earlier.8
50. Emissions in 2030 are projected to be 13.2 per cent lower than in 1990 owing to a
further 2.1 per cent drop in emissions after 2020, reflecting in part the effects of the increasing
scope and strengthening of PaMs. For the 40 Parties that reported emission projections with
LULUCF, emissions in 2030 are forecast to be 18.9 per cent lower than in 1990.
51. Figure 4 presents projected emissions for 2020 and 2030 under the ‘with measures’
scenario for both EIT and non-EIT Annex I Parties.
8 For the three Parties that had not yet submitted their BR3s, projections from their latest available BRs
were used, which are based on data for 2013 or earlier.

FCCC/SBI/2018/INF.8
14
Figure 4
Historical trends and projected greenhouse gas emissions without land use, land-use
change and forestry in 2020 and 2030 under the ‘with measures’ scenario for Annex I
Parties
52. Emissions from all sectors except industrial processes are projected to be lower in
2030 than in 1990. Notably, emissions from transport are also projected to be lower by both
2020 and 2030, a break from the past near-continuous emission growth in the sector in the
past. Net removals from the LULUCF sector in 2030 are projected to be below the 2020
projected level but still well above the 1990 level.
53. GHG emissions from international bunker fuel use are projected to increase
significantly – by 50.5 per cent from 1990 to 2020 and a further 11.4 per cent between 2020
and 2030, according to the data reported by 25 Parties.
54. While Parties used different approaches to project their GHG emissions, all reported
on the key drivers and assumptions behind their projections.
55. All Parties provided a ‘with existing measures’ scenario, but not all Parties provided
a ‘with additional measures’ or ‘without measures’ scenario. For the Parties that supplied a
‘with additional measures’ scenario, emissions are projected to be 3.2 and 9.3 per cent lower
than under the ‘with existing measures’ scenario in 2020 and 2030, respectively. Significant
additional emission reduction measures are therefore being considered by Parties that have
determined that they might not attain their 2020 targets with existing PaMs alone or by Parties
that have identified policy infrastructure needed to deliver further emission reductions after
2020.
E. Provision of financial, technological and capacity-building support to
developing country Parties
1. Financial support
56. The total financial contributions reported in the BR3s consist of climate-specific
contributions (for mitigation or adaptation, cross-cutting or other) and core or general
contributions (support provided to multilateral institutions that Parties cannot specify as
being climate-specific support).
57. Annex I Parties reported a clear and significant year-on-year increase in their
provision of financial support from 2013–2014 to 2015–2016, with 62 and 74 per cent,
respectively, on average being climate-specific support (see figure 5). The total financial
support provided by Annex II Parties saw an increase of 13.3 per cent from 2013–2014 to
2015–2016, amounting to USD 49.4 billion in 2016.
13,336
14,50113,896
13,161 13,27512,811
6,358
3,705 4,016 3,967 4,179 4,290
19,694
18,206 17,91317,127 17,454 17,101
0
5,000
10,000
15,000
20,000
1990 2000 2010 2016 2020 2030
Mt
CO
2 e
q
Non-EIT Parties EIT Parties Total Annex I Parties

FCCC/SBI/2018/INF.8
15
Figure 5
Financial contributions and their thematic distribution reported by Annex I Parties in
biennial report common tabular format table 7 for 2011–2016
58. On average, the thematic distribution of climate-specific support reported in the BR3s
is as follows: support for mitigation, 67 per cent; support for adaptation, 15 per cent, cross-
cutting support (mitigation and adaptation finance), 14 per cent; and the remaining 4 per cent
classified as other.
59. The largest portion of climate-specific funding still comes through bilateral, regional
and other channels, with a moderate increase in climate-specific funding reported as coming
through multilateral channels. A number of Annex I Parties also included quantitative
information on climate-related private finance in their BR3s.
2. Technological support
60. Annex I Parties have continued to provide technological support to developing
country Parties primarily in reducing GHG emissions through renewable energy and energy
efficiency technologies. The transfer of adaptation technology, which is less of a focus,
targets adaptation planning and support for disaster risk reduction.
61. More than half of all reported technology activities were for the transfer of mature
climate technologies, reflecting a pattern similar to that observed in the BR1s and BR2s.
62. The majority of activities reported focused on soft technology transfer through
cooperation programmes and innovation centres, highlighting the significant training and
capacity-building elements of technology transfer.
63. The Asia-Pacific received the greatest number of the reported technology activities,
reflecting a new trend since the BR2s, when it was the case for Africa.
3. Capacity-building support
64. Capacity-building activities focused on adaptation were more frequently reported than
those for mitigation. However, some new and emerging areas of capacity-building were
reported on, such as REDD-plus, readiness for and access to climate finance, NDC
implementation, and transparency. Numerous activities address capacity-building in multiple
sectors.
65. The largest share of capacity-building activities reported in the BR3s took place in
Africa, while the shares of the reported capacity-building taking place in Eastern Europe and,
to a lesser degree, in Latin America and the Caribbean, increased since the BR2s.
66. It is clear from the BR3s that the pre-2020 period is essential for building capacity for
transparency-related activities by providing support for establishing the institutional
frameworks and policies needed to implement NDCs and to develop an effective MRV
17.0 17.1
25.426.6
33.0
37.5
11.8 11.8
15.116.6
12.4 11.9
28.8 28.9
40.5
43.245.4
49.4
0
10
20
30
40
50
2011 2012 2013 2014 2015 2016
Billio
ns U
nit
ed
Sta
tes d
olla
rs
Climate-specific Core/general Total

FCCC/SBI/2018/INF.8
16
system for post-2020 international programmes and partnerships such as the Capacity-
building Initiative for Transparency.
67. Meanwhile, an increasing number of EIT Parties are starting to voluntarily report on
the level of finance, technology transfer and capacity-building support they have provided to
both developing countries and other EIT Parties.
FCCC/SBI/2018/INF.8
17
Annex
Changes in individual Annex I Parties’ greenhouse gas emissions
Figure 1
Changes in total emissions without land use, land-use change and forestry of individual Annex I
Parties, 2014–2016
-6.8
-6.5
-3.6
-2.5
0.5
0.8
0.90.9
1.42.42.6
3.7
6.1
6.3
-34.3-8.1-7.5-6.9
-6.6
-4.1-3.7
-2.7
-1.8-1.7-1.6-1.0-0.3-0.20.0
0.10.10.1
0.60.7
1.0
3.3
3.94.14.24.7
6.1
7.49.8
-40 -30 -20 -10 0 10 20
MaltaUnited Kingdom
GreeceLuxembourg
EstoniaLiechtenstein
UkraineJapan
United States
BelarusNew Zealand
RomaniaSwedenCanada
MonacoDenmark
SwitzerlandFinlandNorway
European Union (28)Iceland
SpainLatvia
ItalyGermanyBulgaria
LithuaniaRussian Federation
FranceSlovakiaCzechiaCroatia
BelgiumPoland
PortugalAustralia
Austria
NetherlandsCyprus
HungarySlovenia
IrelandTurkey
Relative change (%)
Annex I non-EIT Parties Annex I EIT Parties
-23.41
-3.37-2.83
-1.44
0.060.18
0.48
0.560.611.05
3.02
3.52
13.99
23.83
-251.84
-55.10-42.89
-12.00-7.48
-2.15
-1.00
-0.97-0.74-0.51-0.16-0.12-0.010.000.00
0.00
0.38
0.50
2.272.542.59
3.23
3.724.234.426.73
8.74
21.83
44.26
-300 -250 -200 -150 -100 -50 0 50 100
United StatesJapan
United KingdomUkraineCanadaGreeceBelarus
Romania
New ZealandEstonia
MaltaSweden
LuxembourgDenmark
SwitzerlandFinland
LiechtensteinNorwayMonacoIceland
Latvia
LithuaniaSpain
BulgariaCyprus
SlovakiaCroatia
SloveniaEuropean Union (28)
PortugalItaly
CzechiaAustria
HungaryBelgium
IrelandFrance
GermanyNetherlands
PolandAustralia
Russian FederationTurkey
Absolute change (Mt CO2)
Annex I non-EIT Parties Annex I EIT Parties
FCCC/SBI/2018/INF.8
18
Figure 2
Changes in total emissions with land use, land-use change and forestry of individual Annex I
Parties, 2014–2016
-17.2-14.6
-12.9
-6.2
-1.8
-0.1
1.0
2.1
3.3
4.6
7.57.88.38.5
-34.3-26.9
-10.8-9.6
-8.4-7.5
-3.8-3.6
-1.6-1.5-1.0-0.3
-0.10.40.50.70.80.8
1.6
2.5
3.34.6
5.26.2
8.78.8
12.313.2
15.0
-40 -30 -20 -10 0 10 20
MaltaSweden
LatviaLithuania
EstoniaGreece
LiechtensteinUnited Kingdom
LuxembourgUkraine
United StatesJapan
RomaniaMonaco
SwitzerlandCanadaIceland
SlovakiaNew Zealand
SpainEuropean Union (28)
NorwayAustraliaGermanyBulgaria
ItalyRussian Federation
FranceCzechiaBelgium
NetherlandsPolandAustriaIrelandBelarus
HungarySlovenia
CroatiaTurkey
DenmarkPortugalFinlandCyprus
Relative change (%)
Annex I non-EIT Parties Annex I EIT Parties
-21.31
-2.50-2.15-1.99-1.64
-0.04
0.000.540.980.000.001.480.000.00
3.99
4.12
4.83
16.19
41.34
-228.24-46.89-43.02
-10.66-6.89-3.65
-1.00-0.77-0.72-0.05-0.04
-0.020.00
0.20
1.161.18
3.693.753.773.91
4.08
4.63
6.086.807.148.8310.25
20.7534.33
-300 -250 -200 -150 -100 -50 0 50 100
United StatesJapan
United KingdomUkraineGreeceCanadaSwedenEstonia
LatviaLithuaniaRomania
MaltaLuxembourgSwitzerland
New ZealandIceland
SlovakiaLiechtenstein
MonacoNorwayBulgariaSlovenia
CyprusSpain
CroatiaFinlandAustria
BelgiumIreland
CzechiaAustraliaHungary
DenmarkBelarus
ItalyPortugal
GermanyNetherlands
FrancePoland
European Union (28)Turkey
Russian Federation
Absolute change (Mt CO2)
Annex I non-EIT Parties Annex I EIT Parties
FCCC/SBI/2018/INF.8
19
Figure 3
Changes in total emissions without land use, land-use change and forestry of individual Annex I
Parties, 1990–2016
-64.3
-62.8
-58.3
-57.3
-51.4
-49.4
-44.5
-43.8
-34.4
-34.3
-30.5
-29.2
-23.8
-13.1
-39.2
-27.3
-26.9
-26.0
-24.0
-21.6
-21.1
-19.7
-18.0
-17.5
-17.4
-15.3
-11.6
-11.1
-9.4
-9.1
1.2
2.4
3.0
3.0
10.9
12.9
13.0
16.7
19.6
28.5
30.7
56.9
135.4
-100 -50 0 50 100 150
Ukraine
Romania
Lithuania
Latvia
Estonia
Bulgaria
Slovakia
Hungary
United Kingdom
Czechia
Belarus
Poland
Russian Federation
Germany
Denmark
Sweden
European Union (28)
Croatia
Luxembourg
Monaco
Belgium
Liechtenstein
Italy
Finland
France
Slovenia
Netherlands
Greece
Switzerland
Malta
Austria
United States
Norway
Japan
Ireland
Spain
Portugal
Canada
New Zealand
Iceland
Australia
Cyprus
Turkey
Relative change (%)
Annex I non-EIT Parties Annex I EIT Parties
-1,090.53
-608.62
-134.21
-71.46
-67.89
-47.73
-44.93
-32.94
-32.33
-28.02
-20.77
-15.14
-7.59
-0.91
-1,354.83
-342.23
-313.65
-90.50
-84.21
-28.93
-25.58
-18.98
-18.62
-12.41
-11.49
-5.00
-2.76
-0.19
-0.04
-0.02
0.98
1.04
1.55
3.18
6.06
7.80
12.91
37.05
37.87
100.96
129.06
155.67
285.35
-2,000 -1,500 -1,000 -500 0 500
European Union (28)
Russian Federation
Ukraine
Germany
United Kingdom
Romania
Italy
France
Poland
Czechia
Belarus
Bulgaria
Slovakia
Hungary
Belgium
Lithuania
Netherlands
Estonia
Denmark
Sweden
Latvia
Finland
Greece
Croatia
Switzerland
Luxembourg
Slovenia
Malta
Liechtenstein
Monaco
Austria
Iceland
Norway
Cyprus
Ireland
Portugal
New Zealand
Spain
Japan
Canada
Australia
United States
Turkey
Absolute change (Mt CO2)
Annex I non-EIT Parties Annex I EIT Parties

FCCC/SBI/2018/INF.8
20
Figure 4
Changes in total emissions with land use, land-use change and forestry of individual Annex I
Parties, 1990–2016
-1,883.79
-568.64
-137.91
-71.81
-66.67
-48.53
-36.60
-34.08
-31.41
-30.26
-21.95
-6.40
-5.37
-1.69
-1,396.54
-326.06
-325.40
-117.39
-94.94
-51.76
-27.64
-25.67
-25.44
-24.95
-18.35
-12.68
-12.45
-6.14
-3.30
-0.19
-0.04
-0.02
1.16
1.25
3.53
4.60
8.76
19.68
35.66
43.55
140.85
246.20
258.51
-2,500 -2,000 -1,500 -1,000 -500 0 500
Russian FederationEuropean Union (28)
UkraineUnited Kingdom
GermanyRomania
ItalyFrancePoland
CzechiaAustralia
BelarusBulgariaHungary
LithuaniaSlovakiaBelgiumSwedenFinland
NetherlandsEstonia
DenmarkGreece
NorwayCroatia
SwitzerlandLatvia
LuxembourgSlovenia
MaltaLiechtenstein
MonacoIceland
PortugalCyprusIrelandAustria
New ZealandSpainJapan
CanadaTurkey
United States
Absolute change (Mt CO2)
Annex I non-EIT Parties Annex I EIT Parties
-73.0
-68.9
-63.9
-56.5
-48.4
-48.3
-47.0
-46.9
-41.1
-34.9
-34.1
-33.6
-25.3
-19.8
-72.1
-44.5
-40.9
-30.1
-26.7
-25.9
-25.7
-24.3
-22.8
-21.2
-19.2
-18.1
-16.5
-12.6
-11.7
-11.0
-9.1
-9.0
2.0
3.6
4.7
7.4
8.5
13.1
14.4
26.3
54.2
66.4
135.4
-100 -50 0 50 100 150
LithuaniaSweden
RomaniaUkraineEstonia
Russian FederationBulgariaSlovakiaHungary
FinlandBelarus
United KingdomCzechia
LatviaPoland
NorwayGermany
European Union (28)Luxembourg
CroatiaDenmark
ItalyMonacoSloveniaBelgium
FranceLiechtenstein
GreeceSwitzerland
NetherlandsMalta
AustraliaPortugal
JapanUnited States
IrelandIcelandAustria
SpainCanada
New ZealandCyprusTurkey
Relative change (%)
Annex I Non-EIT Parties Annex I EIT Parties
Related Documents