Saving Lives ANNUAL REPORT 2013 CONTENT 04 President’s Letter 06 Targets 07 Dimensions of Autoliv 08 Vision and Values 12 Safety Systems 16 Innovations 18 Autoliv in China 20 Social Responsibility 22 Employees 24 Global Presence 26 Market & Competitors 28 Customers 30 Manufacturing & Purchasing 32 Quality 34 Shareholders 36 Share Performance 39 Management’s Discussion and Analysis 56 Consolidated Statements of Net Income 56 Consolidated Statements of Comprehensive Income 57 Consolidated Balance Sheets 58 Consolidated Statements of Cash Flows 59 Consolidated Statements of Total Equity 60 Notes to Consolidated Financial Statements 82 Auditor’s Reports 83 Glossary and Definitions 84 Corporate Governance 86 Board of Directors 87 Executive Management 88 Contact Information & Calendar 89 Selected Financial Data READER’S GUIDE Autoliv, Inc. is incorporated in Delaware, USA, and follows Generally Accepted Accounting Principles in the United States (U.S. GAAP). This annual report also contains certain non-U.S. GAAP measures, see page 42 and page 54. All amounts in this annual report are in U.S. dollars unless otherwise indicated. “We”, “the Company” and “Autoliv” refer to “Autoliv Inc.” as defined in Note 1 “Principles of Consolidation” on page 60. For forward- looking information, refer to the “Safe Harbor Statement” on page 55. Data on markets and competitors are Autoliv’s estimates (unless otherwise indicated). The estimates are based on orders awarded to us or our competitors or other information put out by third parties as well as plans announced by vehicle manufacturers and regula- tory agencies. FINANCIAL INFORMATION Every year, Autoliv publishes an annual report and a proxy statement prior to the Annual General Meeting of Shareholders, see page 36. The proxy statement provides information not only on the agenda for the meeting, but also on the work of the Board of Directors and its committees as well as on compensation paid to and presentation of directors and certain senior executive officers. For financial information, please also refer to the Form 10-K and Form 10-Q reports and Autoliv’s other filings with the Securities and Exchange Commission (SEC) and the New York Stock Exchange (NYSE). These filings (including the CEO/CFO Section 302 Certifications, Section 16 Insider Filings) are available at www.autoliv.com under Investors/Filings. The annual and quarterly reports, the proxy statement and Autoliv’s filings with the SEC as well as the Company’s Corporate Governance Guidelines, Charters, Code of Conduct and other documents governing the Company can be downloaded from the Company’s corporate website. Hard copies of the above-mentioned documents can be obtained free of charge from the Company at the addresses on page 88.

Welcome message from author
This document is posted to help you gain knowledge. Please leave a comment to let me know what you think about it! Share it to your friends and learn new things together.
Transcript

Saving LivesANNUAL REPORT 2013
CONTENT
04 President’s Letter06 Targets07 Dimensions of Autoliv08 Vision and Values12 Safety Systems16 Innovations18 Autoliv in China20 Social Responsibility22 Employees24 Global Presence26 Market & Competitors28 Customers30 Manufacturing & Purchasing32 Quality34 Shareholders36 Share Performance
39 Management’s Discussion and Analysis56 Consolidated Statements of Net Income56 Consolidated Statements of Comprehensive
Income57 Consolidated Balance Sheets58 Consolidated Statements of Cash Flows59 Consolidated Statements of Total Equity60 Notes to Consolidated Financial Statements82 Auditor’s Reports83 Glossary and Definitions84 Corporate Governance86 Board of Directors87 Executive Management88 Contact Information & Calendar89 Selected Financial Data
READER’S GUIDE Autoliv, Inc. is incorporated in Delaware, USA, and follows Generally Accepted Accounting Principles in the United States (U.S. GAAP). This annual report also contains certain non-U.S. GAAP measures, see page 42 and page 54. All amounts in this annual report are in U.S. dollars unless otherwise indicated.
“We”, “the Company” and “Autoliv” refer to “Autoliv Inc.” as defined in Note 1 “Principles of Consolidation” on page 60. For forward-looking information, refer to the “Safe Harbor Statement” on page 55.
Data on markets and competitors are Autoliv’s estimates (unless otherwise indicated). The estimates are based on orders awarded to us or our competitors or other information put out by third parties as well as plans announced by vehicle manufacturers and regula-tory agencies.
FINANCIAL INFORMATIONEvery year, Autoliv publishes an annual report and a proxy statement prior to the Annual General Meeting of Shareholders, see page 36.
The proxy statement provides information not only on the agenda for the meeting, but also on the work of the Board of Directors and its committees as well as on compensation paid to and presentation of directors and certain senior executive officers.
For financial information, please also refer to the Form 10-K and Form 10-Q reports and Autoliv’s other filings with the Securities and Exchange Commission (SEC) and the New York Stock Exchange (NYSE). These filings (including the CEO/CFO Section 302 Certifications, Section 16 Insider Filings) are available at www.autoliv.com under Investors/Filings.
The annual and quarterly reports, the proxy statement and Autoliv’s filings with the SEC as well as the Company’s Corporate Governance Guidelines, Charters, Code of Conduct and other documents governing the Company can be downloaded from the Company’s corporate website. Hard copies of the above-mentioned documents can be obtained free of charge from the Company at the addresses on page 88.
2013201220112010200920082007200620052004
Asia Americas Europe
9,000
US$ (Millions)
6,000
3,000
0
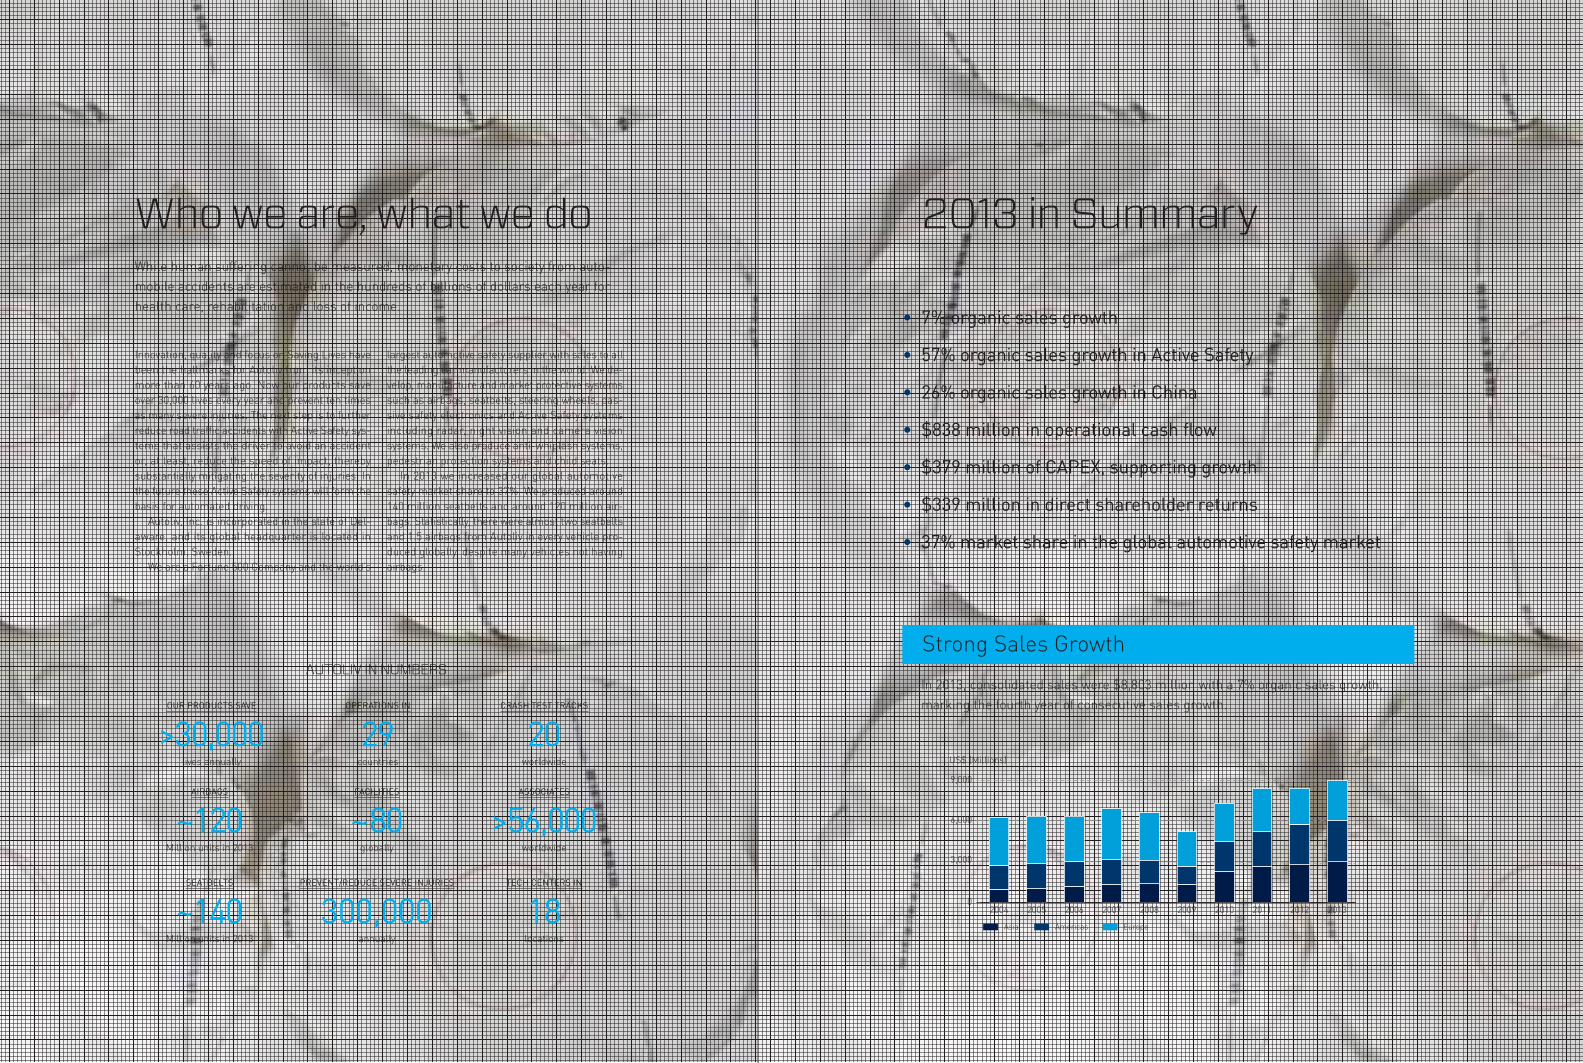
• 7% organic sales growth
• 57% organic sales growth in Active Safety
• 26% organic sales growth in China
• $838 million in operational cash flow
• $379 million of CAPEX, supporting growth
• $339 million in direct shareholder returns
• 37% market share in the global automotive safety market
Who we are, what we doWhile human suffering cannot be measured, monetary costs to society from auto-mobile accidents are estimated in the hundreds of billions of dollars each year for health care, rehabilitation and loss of income.
2013 in Summary
Innovation, quality and focus on Saving Lives have been the hallmarks for Autoliv from its inception more than 60 years ago. Now our products save over 30,000 lives every year and prevent ten times as many severe injuries. The next step is to further reduce road traffic accidents with Active Safety sys-tems that assists the driver to avoid an accident or, at least, reduce the speed of impact, thereby substantially mitigating the severity of injuries. In the future these Active Safety systems will form the basis for automated driving.
Autoliv, Inc. is incorporated in the state of Del-aware, and its global headquarter is located in Stockholm, Sweden.
We are a Fortune 500 Company and the world’s
largest automotive safety supplier with sales to all the leading car manufacturers in the world. We de-velop, manufacture and market protective systems such as airbags, seatbelts, steering wheels, pas-sive safety electronics and Active Safety systems including radar, night vision and camera vision systems. We also produce anti-whiplash systems, pedestrian protection systems and child seats.
In 2013 we increased our global automotive safety market share to 37%. We produced around 140 million seatbelts and around 120 million air-bags. Statistically, there were almost two seatbelts and 1.5 airbags from Autoliv in every vehicle pro-duced globally, despite many vehicles not having airbags.
Strong Sales Growth
OUR PRODUCTS SAVE
>30,000lives annually
PREVENT/REDUCE SEVERE INJURIES
300,000annually
FACILITIES
~80globally
AIRBAGS
~120Million units in 2013
SEATBELTS
~140Million units in 2013
OPERATIONS IN
29countries
ASSOCIATES
>56,000worldwide
CRASH TEST TRACKS
20worldwide
TECH CENTERS IN
18locations
AUTOLIV IN NUMBERSIn 2013, consolidated sales were $8,803 million with a 7% organic sales growth, marking the fourth year of consecutive sales growth.
500
0
1,000
1,500
US$ (Millions)
20132012201120102009Sales, China
0
200
100
300
400
20132012201120102009
Capex, net
0.0
1.5
3.0
4.5
6.0
% of sales, net
US$ (Millions) %
100
0
200
300
400
20132012201120102009
Dividend Share buy backs
US$ (Millions)
1
0
2
3
4
20132012201120102009
No. of units
0
20
40
60
80
No. of vehicle models
ModelsMillion units
03
Active Safety Adoption Expansion in China
Investing for Growth Shareholder Returns
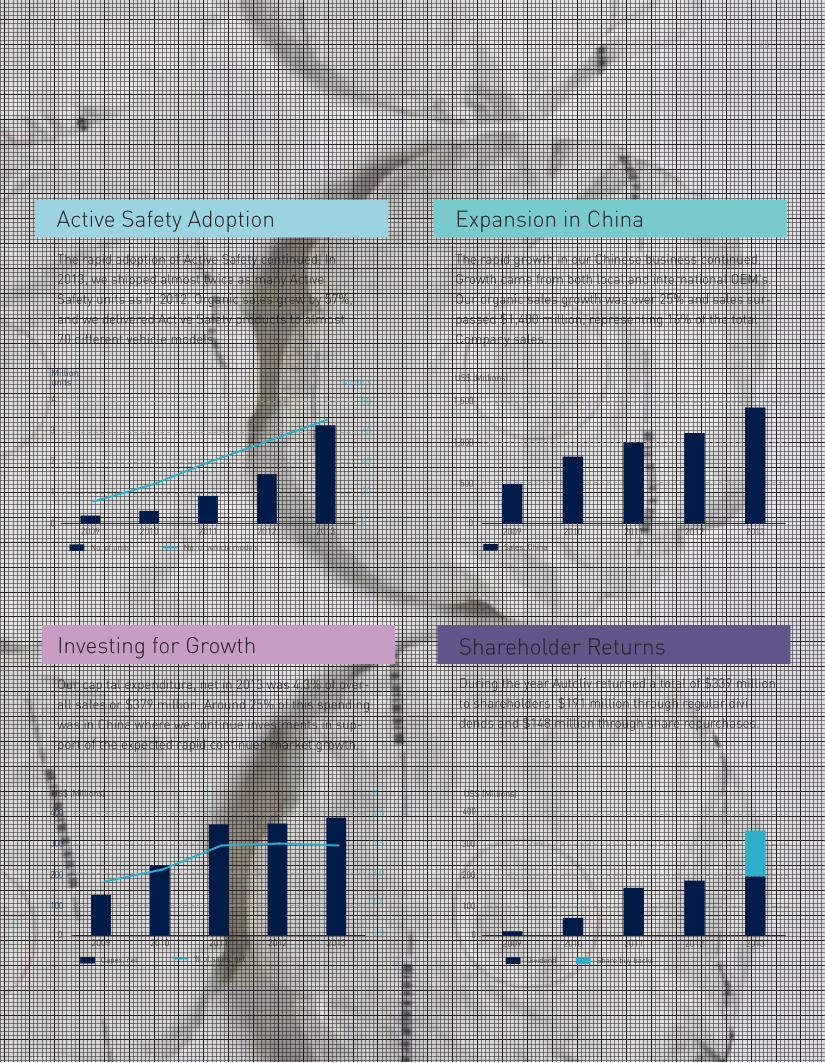
The rapid adoption of Active Safety continued. In 2013, we shipped almost twice as many Active Safety units as in 2012. Organic sales grew by 57%, and we delivered Active Safety products to almost 70 different vehicle models.
The rapid growth in our Chinese business continued. Growth came from both local and international OEM's. Our organic sales growth was over 25% and sales sur-passed $1,400 million, representing 16% of the total Company sales.
Our capital expenditure, net in 2013 was 4.3% of over-all sales or $379 million. Around 25% of this spending was in China where we continue investments in sup-port of the expected rapid continued market growth.
During the year Autoliv returned a total of $339 million to shareholders: $191 million through regular divi-dends and $148 million through share repurchases.
2018201320082003
North America
Western Europe
Japan
Developed Markets
Other
China~28M
~57M~66M
~83M
~99M
~59M
~40M~38M
GrowthMarkets
04 AUTOLIV 2013 / PRESIDENTS LETTER
LIGHT VEHICLE PRODUCTIONIn millions units
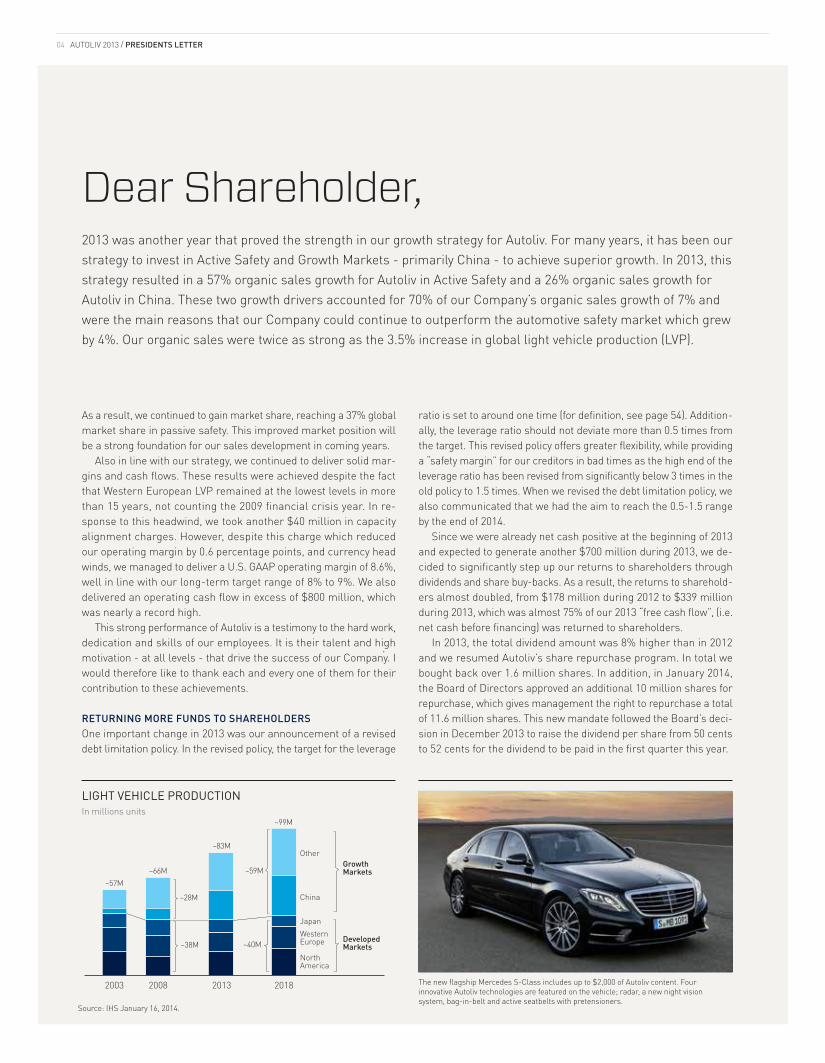
Dear Shareholder,2013 was another year that proved the strength in our growth strategy for Autoliv. For many years, it has been our strategy to invest in Active Safety and Growth Markets - primarily China - to achieve superior growth. In 2013, this strategy resulted in a 57% organic sales growth for Autoliv in Active Safety and a 26% organic sales growth for Autoliv in China. These two growth drivers accounted for 70% of our Company’s organic sales growth of 7% and were the main reasons that our Company could continue to outperform the automotive safety market which grew by 4%. Our organic sales were twice as strong as the 3.5% increase in global light vehicle production (LVP).
As a result, we continued to gain market share, reaching a 37% global market share in passive safety. This improved market position will be a strong foundation for our sales development in coming years.
Also in line with our strategy, we continued to deliver solid mar-gins and cash flows. These results were achieved despite the fact that Western European LVP remained at the lowest levels in more than 15 years, not counting the 2009 financial crisis year. In re-sponse to this headwind, we took another $40 million in capacity alignment charges. However, despite this charge which reduced our operating margin by 0.6 percentage points, and currency head winds, we managed to deliver a U.S. GAAP operating margin of 8.6%, well in line with our long-term target range of 8% to 9%. We also delivered an operating cash flow in excess of $800 million, which was nearly a record high.
This strong performance of Autoliv is a testimony to the hard work, dedication and skills of our employees. It is their talent and high motivation - at all levels - that drive the success of our Company. I would therefore like to thank each and every one of them for their contribution to these achievements.
RETURNING MORE FUNDS TO SHAREHOLDERSOne important change in 2013 was our announcement of a revised debt limitation policy. In the revised policy, the target for the leverage
ratio is set to around one time (for definition, see page 54). Addition-ally, the leverage ratio should not deviate more than 0.5 times from the target. This revised policy offers greater flexibility, while providing a “safety margin” for our creditors in bad times as the high end of the leverage ratio has been revised from significantly below 3 times in the old policy to 1.5 times. When we revised the debt limitation policy, we also communicated that we had the aim to reach the 0.5-1.5 range by the end of 2014.
Since we were already net cash positive at the beginning of 2013 and expected to generate another $700 million during 2013, we de-cided to significantly step up our returns to shareholders through dividends and share buy-backs. As a result, the returns to sharehold-ers almost doubled, from $178 million during 2012 to $339 million during 2013, which was almost 75% of our 2013 “free cash flow”, (i.e. net cash before financing) was returned to shareholders.
In 2013, the total dividend amount was 8% higher than in 2012 and we resumed Autoliv’s share repurchase program. In total we bought back over 1.6 million shares. In addition, in January 2014, the Board of Directors approved an additional 10 million shares for repurchase, which gives management the right to repurchase a total of 11.6 million shares. This new mandate followed the Board’s deci-sion in December 2013 to raise the dividend per share from 50 cents to 52 cents for the dividend to be paid in the first quarter this year.
The new flagship Mercedes S-Class includes up to $2,000 of Autoliv content. Four innovative Autoliv technologies are featured on the vehicle; radar, a new night vision system, bag-in-belt and active seatbelts with pretensioners.
Source: IHS January 16, 2014.
05
BUILDING FOR THE FUTUREWe stepped up the returns to shareholder to $339 million, and spent close to $900 million investing for the future. We spent $379 million, or 4.3% of sales in capital expenditures alone, and $489 million, or 5.6% of sales in Research, Development and Engineering (R,D&E).
We continue to invest heavily in China where we had our two largest capital expenditures ever in 2013. The purpose of these two capital investments is both to provide additional manufacturing ca-pacity for our growing business and to reduce costs by allocating manufacturing closer to customers. Both new plants in China (an airbag propellant center and a textile center) are expected to begin production in 2014.
In R,D&E, we continue to explore new technical possibilities, both in passive safety and active safety (as seen on page 16). Our strong position in active safety is becoming increasingly important strate-gically as more and more vehicle manufacturers develop cars that can drive by themselves, so called autonomously driven cars. These vehicles will need forward-looking vision and radar systems as well as surround-view cameras that Autoliv along with other companies have been developing. Therefore, it turns out that our pioneering efforts in active safety will pave the way for semi-automated and autonomous driving vehicles.
CONTINUED FOCUS ON OPERATIONSAlso going forward, we will continue to focus on operations. Western European LVP is not expected to recover significantly any time soon. Consequently, we need to continue to execute on our European capac-ity alignment program. The implementation of the program (originally initiated in February 2012) is taking longer than initially planned, but we are on track reaching the expected savings.
Additionally, we have some specific operational challenges, arising primarily from our strong sales growth in steering wheels in Europe and our supply structure in Brazil. These items had a negative impact on our operating margin in 2013, but the effect should gradually di-minish in 2014 through our continued focus on execution.
Operational focus also includes focus on quality. This is becoming increasingly important as vehicle manufactures continuously raise
their quality requirements in order to develop and produce ever su-perior quality cars for the car-buying public. Therefore, an uncom-promising view on quality is fundamental in everything we do, and our target is of course zero defects. In 2013 we moved closer to this zero-defect target as all of our key quality indicators improved.
OUTLOOK 2014In 2014, global LVP is expected by the market institute IHS to grow by over 3%, as in 2013. However, IHS expects the strong LVP growth of 14% in China, recorded in 2013, to decline to 10% and in the important West European market, LVP is expected to increase by only 1% from its extremely low level in 2013. Despite these mixed market condi-tions, the indication is for Autoliv to be able to grow its organic and consolidated sales by around 5% in 2014 and achieve an operating margin of around 9%, excluding costs for capacity alignments and antitrust investigations for the full year 2014.
Most of the sales improvements in 2014 are again expected to come from China and Active Safety. In addition, we should start to see increasing savings from our employees’ hard work with the capacity alignment program in Europe.
As a result, 2014 should become a year that proves the strength in our growth strategy, while providing a testimony to the hard work of our employees.
Yours sincerely,
Jan CarlsonStockholm, February 21, 2014
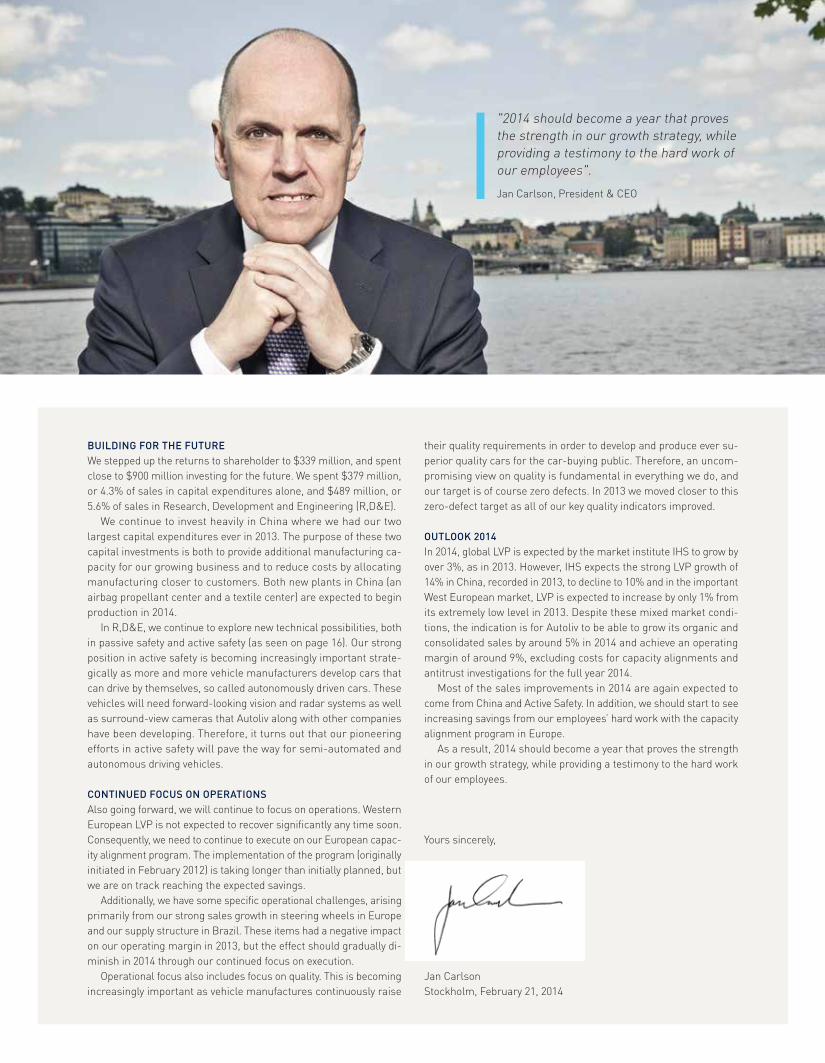
"2014 should become a year that proves the strength in our growth strategy, while providing a testimony to the hard work of our employees". Jan Carlson, President & CEO
Long-term Target, %
Long-term Target
Organic Sales growth, %
EPS growth, %
Automotive Safety Market growth, %
Organic Sales growth, %
’11’10’09 ’12 ’1302468
101214
’11’10’09 ’12 ’13-25
-10
5
20
35
505,225%
-95%
’11’10’09 ’12 ’130.0
0.5
1.0
1.5
2.0
’11’10’09 ’12 ’13-20
-10
0
10
20
30
06 AUTOLIV 2013 / TARGETS
Organic SalesGrow at least in line with our market.Definition on page 42(Non-U.S. GAAP measure).
Leverage RatioAround 1 time (see page 54).Definition on page 83(Non-U.S. GAAP measure).
Operating Margin8–9% over the business cycles (Non-U.S. GAAP excluding antitrust).
Earnings Per ShareGrow faster than organic sales growth (excluding currency effects).Definition on page 42(Non-U.S. GAAP measure).
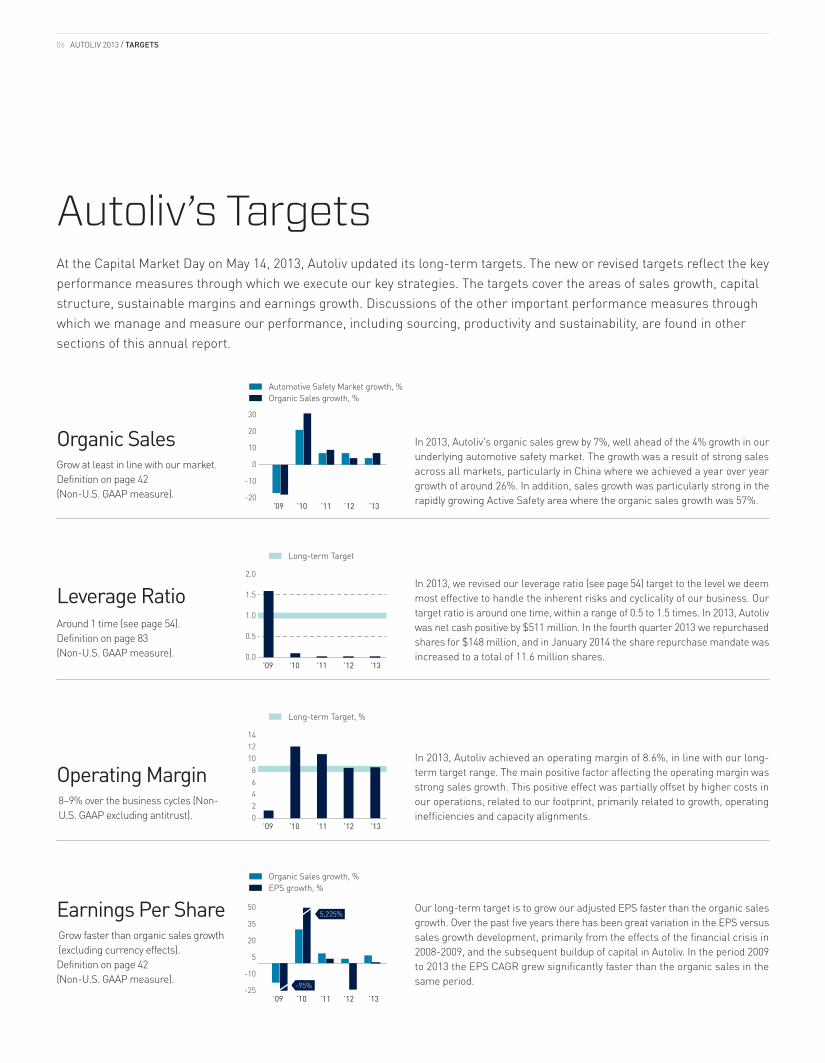
In 2013, Autoliv's organic sales grew by 7%, well ahead of the 4% growth in our underlying automotive safety market. The growth was a result of strong sales across all markets, particularly in China where we achieved a year over year growth of around 26%. In addition, sales growth was particularly strong in the rapidly growing Active Safety area where the organic sales growth was 57%.
In 2013, we revised our leverage ratio (see page 54) target to the level we deem most effective to handle the inherent risks and cyclicality of our business. Our target ratio is around one time, within a range of 0.5 to 1.5 times. In 2013, Autoliv was net cash positive by $511 million. In the fourth quarter 2013 we repurchased shares for $148 million, and in January 2014 the share repurchase mandate was increased to a total of 11.6 million shares.
In 2013, Autoliv achieved an operating margin of 8.6%, in line with our long- term target range. The main positive factor affecting the operating margin was strong sales growth. This positive effect was partially offset by higher costs in our operations, related to our footprint, primarily related to growth, operating inefficiencies and capacity alignments.
Our long-term target is to grow our adjusted EPS faster than the organic sales growth. Over the past five years there has been great variation in the EPS versus sales growth development, primarily from the effects of the financial crisis in 2008-2009, and the subsequent buildup of capital in Autoliv. In the period 2009 to 2013 the EPS CAGR grew significantly faster than the organic sales in the same period.
Autoliv’s TargetsAt the Capital Market Day on May 14, 2013, Autoliv updated its long-term targets. The new or revised targets reflect the key performance measures through which we execute our key strategies. The targets cover the areas of sales growth, capital structure, sustainable margins and earnings growth. Discussions of the other important performance measures through which we manage and measure our performance, including sourcing, productivity and sustainability, are found in other sections of this annual report.
07AUTOLIV 2013 / DIMENSIONS OF AUTOLIV
FinancialsOur clear business models, with a strong focus on capital and cost control, result in strong cash flow generation. Shareholder friendly with a strong focus on shareholder returns and long-term value creation.
InnovationAutoliv has delivered the vast majority of firsts in our industry. Continuing to be the innovation leader through fundamental research, global product development, and application engi-neering is key to create value.
SustainabilityWe recognize that in order to be sustainable every part of our business needs to be managed with responsibility, integrity and operational excellence. We measure our sustainability performance in several dimensions.
PeopleWe believe in attracting, developing and re-taining highly skilled people, possessing a diversity of knowledge and skills. We support creativity, entrepreneurial behavior and result oriented action.
ProcessDelivering the same product according to the same process all over the world reduces cost, increases predictability and frees up resourc-es. We constantly target reducing the number of product variants and simplifying processes.
QualityOur primary goal is to save lives. Our products never get a second chance. Our goals of zero defects, customer value and reduced scrap sets the direction. Quality in every aspect: behavior, product, customer, growth and suppliers.
CustomerDelivering value to our customers is at the heart of everything we do. Our customers are virtually every vehicle manufacturer in the world. Their satisfaction is a prerequisite for our continued success.
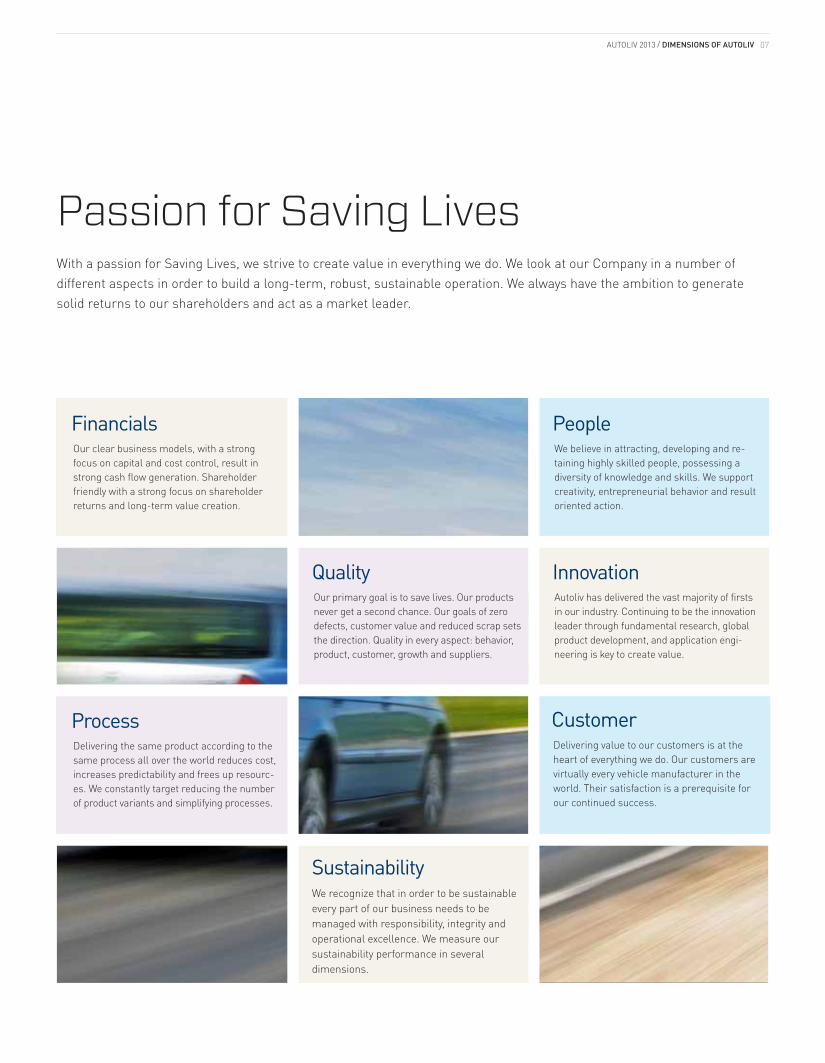
Passion for Saving LivesWith a passion for Saving Lives, we strive to create value in everything we do. We look at our Company in a number of different aspects in order to build a long-term, robust, sustainable operation. We always have the ambition to generate solid returns to our shareholders and act as a market leader.
08 AUTOLIV 2013 / VISION AND VALUES
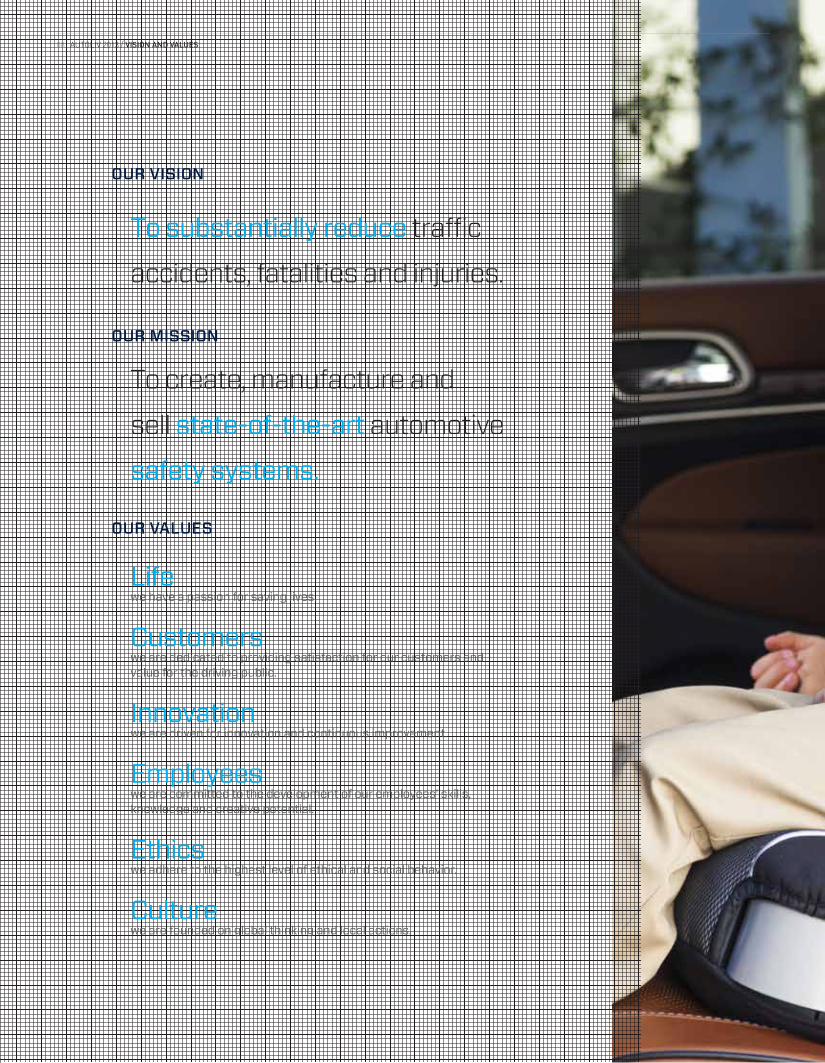
OUR VISION
OUR MISSION
OUR VALUES
To substantially reduce traffic
accidents, fatalities and injuries.
To create, manufacture and
sell state-of-the-art automotive
safety systems.
Lifewe have a passion for saving lives.
Customerswe are dedicated to providing satisfaction for our customers and value for the driving public.
Innovationwe are driven for innovation and continuous improvement.
Employeeswe are committed to the development of our employees’ skills, knowledge and creative potential.
Ethicswe adhere to the highest level of ethical and social behavior.
Culturewe are founded on global thinking and local actions.

09

The major advancement from Active Safety products is to reduce the crash severity and avoid the crash altogether by warning the driver or automatically braking the car.
Passive safety products, such as airbags and seatbelts, are there to help protect you from injury if a crash is unavoidable. More than a million hu-man beings owe their life to them.
Allowing the car to act automatically is crucial when moving towards our vision of saving 150,000 lives per year.
The Road to
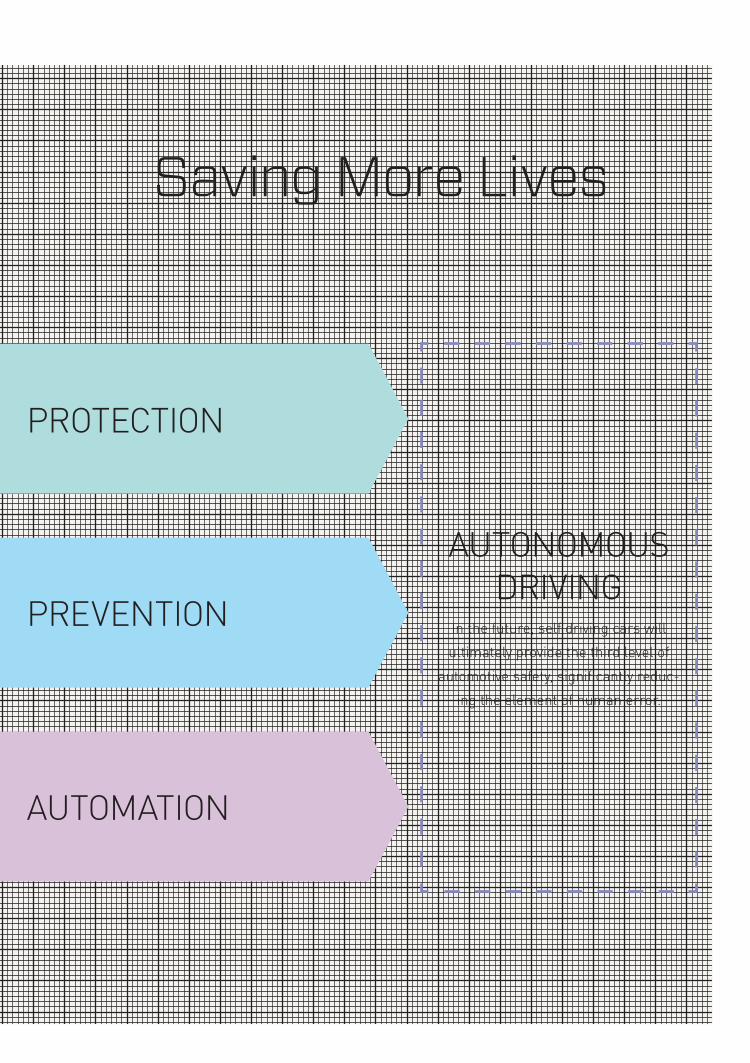
PREVENTION
PROTECTION
AUTONOMOUS DRIVING
In the future, self driving cars will ultimately provide the third level of
automotive safety, significantly reduc-ing the element of human error.
Saving More Lives
AUTOMATION
AUTOLIV 2013 / SAFETY SYSTEMS12
Active SafetyOur Active Safety systems are designed to intervene before a crash by adjusting engine output, steering and braking. These systems can create a “Virtual Crash Zone” using our radar and vision technologies to monitor the environment around the vehicle. In addition, these technologies make driving easier and more comfortable.
thanks to passive safety systems such as seatbelts and airbags, vehicle safety has substantially improved. Although these systems are effective in mitigating the human consequences of an accident, they can never prevent the accident from occurring.
With the introduction of Active Safety systems, many accidents and collisions will become avoidable or at least less severe by re-ducing the speed of impact. This will also result in significant im-provements in the protection provided by the passive safety system.
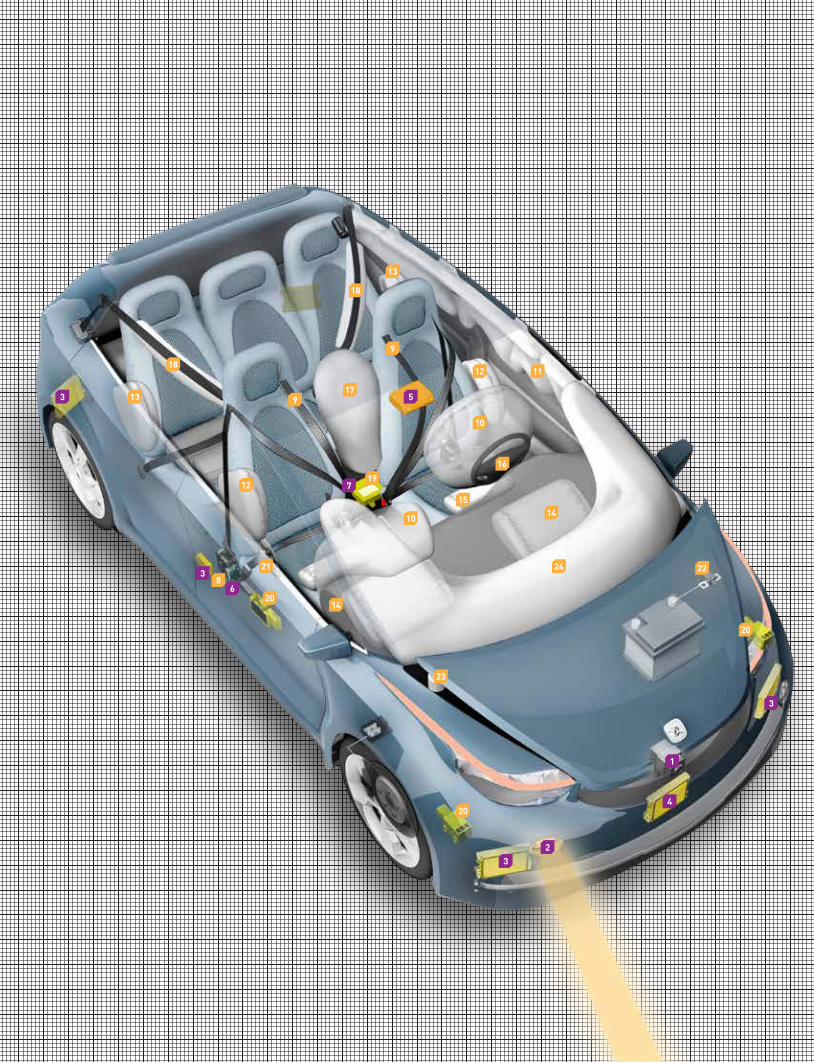
NIGHT DRIVING ASSIST1 The night driving assist displays an image of the road scene
ahead to make night-driving easier and safer. The image gener-ated in the heat-sensing device is processed using different filters to obtain a black and white image with sharp light or dark outlines, in which shapes are easily detected. The system also analyzes the scene content with respect to the motion of the vehicle to determine if a pedestrian or an object is at risk of being hit by the vehicle. It can detect pedestrians and animals up to two times further away than the typical headlight range and, if a threat exists, the driver is warned. The latest generation of our night vision, called 2 Dynamic Spot Light, has a revolutionary function that selectively illuminates pedestrians and animals with a separate marking headlight.
RADAR SYSTEMS3 Short and medium range radar system provides all-weather
object detection and can be used effectively in all directions around the vehicle. By scanning up to 30 meters, the system can provide an advanced warning of an imminent collision. The radar is also used for detecting objects in the blind spots of a vehicle and to control stop-and-go functions in queue assist systems. Our 4 long range radars are utilized for adaptive cruise control systems.
VISION SYSTEMSAutoliv’s pioneering work with camera-based 5 vision systems gives the driver, in effect, an additional pair of eyes scanning the
road ahead for danger. Advanced algorithms enable the camera to recognize and track
other vehicles, speed signs and lane markings. They can also warn the driver when the car is in danger of colliding with pedestrians, other vehicles or straying out of lane.
To provide a free view, the camera is typically located at the upper edge of the wind shield.
ACTIVE SEATBELTS6 An active seatbelt has an electrically driven pretensioner that
tightens the belt as a precaution in hazardous situations. The belt system then releases some webbing if the driver manages to avoid the traffic hazard.
This function also warns the driver by letting the pretensioner vibrate the seatbelt webbing.
This technology also offers improved comfort to the occupants while using the seatbelt.
BRAKE CONTROL/ESC7 Autoliv has developed the world’s first Integrated Inertial Mea-
surement Unit that combines the controls of the vehicle’s restraint system with those controls for the vehicle’s brakes that can provide Electronic Stability Control (ESC), Anti-locking Brakes (ABS) and Automatic Traction Control (ATC). This merger of the control sys-tems, which will be launched in 2014, provides significant savings and enhanced performance.
ACTIVE AND PASSIVE SAFETY INTEGRATIONTo monitor the environment around the vehicle and control the ve-hicle motion, Autoliv is developing the next generation of electronic integration.
This Electronic Safety Domain Controller (ESDC) links all safety sensors (including the environmental sensor) and all actuators that control vehicle motion (brakes, steering, and engine/transmission).
13AUTOLIV 2013 / SAFETY SYSTEMS
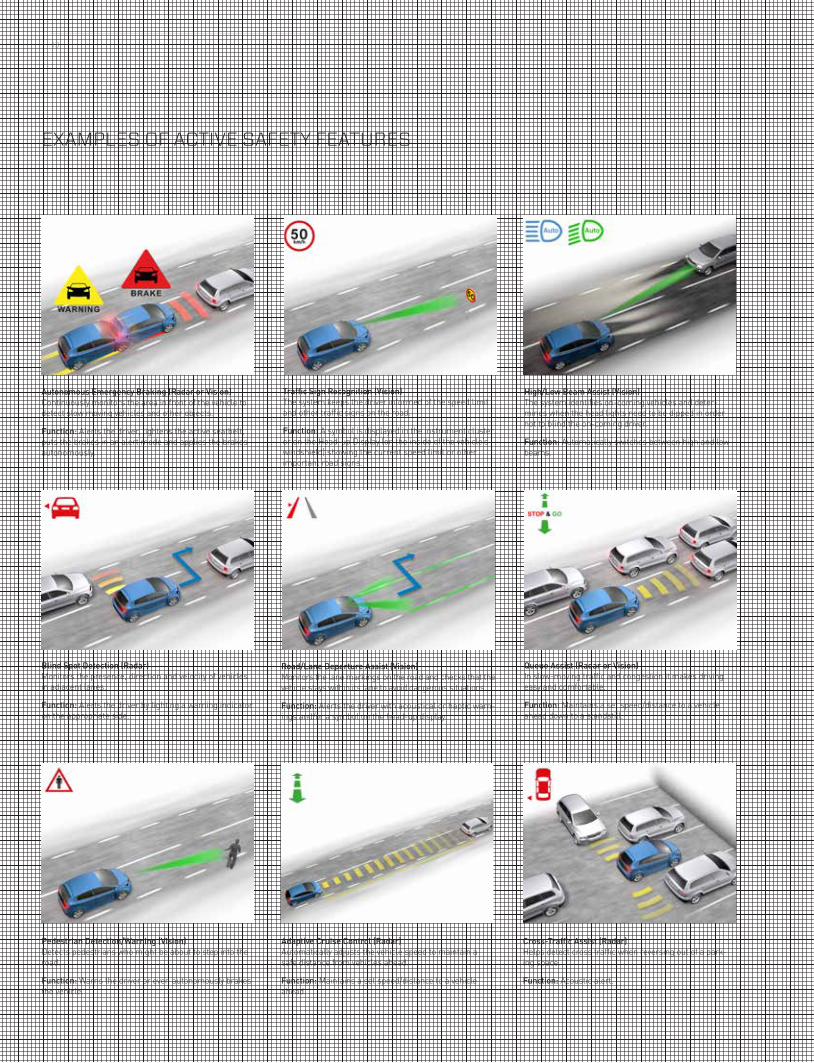
EXAMPLES OF ACTIVE SAFETY FEATURES
Adaptive Cruise Control (Radar)Automatically adjusts the vehicle speed to maintain a safe distance from vehicles ahead.
Function: Maintains a set speed/distance to a vehicle ahead.
Pedestrian Detection/Warning (Vision)Detects pedestrians who might be about to step into the road.
Function: Warns the driver or even autonomously brakes the vehicle.
High/Low Beam Assist (Vision)The system identifies on-coming vehicles and deter-mines when the head lights need to be dipped in order not to blind the on-coming driver.
Function: Automatically switches between high and low beams.
Traffic Sign Recognition (Vision)The system keeps the driver informed of the speed limit and other traffic signs on the road.
Function: A symbol is displayed in the instrument cluster or on the Head-up Display (on the inside of the vehicle’s windshield) showing the current speed limit or other important road signs.
Road/Lane Departure Assist (Vision)Monitors the lane markings on the road and checks that the vehicle stays within its lane to avoid dangerous situations.
Function: Alerts the driver with acoustical or haptic warn-ings and/or a symbol on the head-up display.
Cross-Traffic Assist (Radar)Helps detect cross traffic when reversing out of a park-ing space.
Function: Acoustic alert.
Queue Assist (Radar or Vision)In slow-moving traffic and congestion it makes driving easy and comfortable.
Function: Maintains a set speed/distance to a vehicle ahead down to a standstill.
Blind Spot Detection (Radar)Monitors the presence, direction and velocity of vehicles in adjacent lanes.
Function: Alerts the driver by lighting a warning indicator on the appropriate side.
Autonomous Emergency Braking (Radar or Vision)Continuously monitors the area in front of the vehicle to detect slow moving vehicles and other objects.
Function: Alerts the driver, tightens the active seatbelt, puts the brakes in an alert mode and applies the brakes autonomously.
1
5
6
7
3
3
3
4
3
2
8
1112
12
14
14
16
18
18
15
13
13
19
20
20
20
2421
23
22
17
10
9
9
10
14
15
Passive SafetyAutoliv has accounted for virtually all major technological breakthroughs within passive safety over the last 60 years.
SEATBELT SYSTEMS8 Modern seatbelts can reduce the overall risk of serious injuries
in frontal crashes by as much as 60% thanks to advanced seatbelt technologies such as pretensioners and load limiters.
8 Retractor and buckle pretensioners tighten the belt at the onset of a frontal crash, using a small pyrotechnic charge. Slack is eliminated and the occupant is restrained as early as possible, thereby reducing the risk of rib fractures.
8 Lap pretensioners further tighten the webbing to avoid sliding under the belt which improves lower-leg protection and prevents ab-dominal injuries from a loose belt. In an accident, 8 load limiters release some webbing in a controlled way to avoid the load on the occupant’s chest from becoming too high. When used in combination, pretensioners, load limiters, lap pretensioners and frontal airbags, have a 75% reduction of the risk of life-threatening head or chest injuries in frontal crashes.
9 Supplemental belts prevent occupants from sliding out of the “open side” of the regular 3-point belt in roll overs and far-side collisions.
AIRBAGS AND STEERING WHEELS10 Driver and the passenger airbags deploy in 50 milliseconds, half the time of the “blink of an eye”, and can be “smart”, i.e. the power of the airbags can be tuned to the severity of the crash and the size of the occupant, using adaptive output airbag inflators. The driver airbag reduces fatalities in frontal crashes by approximately 25% (for belted drivers) and reduces serious head injuries by over 60%. The airbag for the front-seat passenger reduces fatalities in frontal crashes by approximately 20% (for belted occupants).
11 Side curtain airbags reduce the risk of life-threatening head in-juries in side impacts by approximately 50% for occupants who are sitting on the side of the vehicle that is struck. Curtain airbags cover the whole upper side of the vehicle.
Single-chamber 12 side airbags reduce the risk for chest injuries by approximately 25%. With dual-chamber side airbags, both the pelvis and the chest areas are protected which further reduces the risk of serious injuries in side-impact crashes.
13 Rear side airbags reduce injuries for rear occupants.
14 Knee airbags significantly reduce the risk of injuries to the knee, thigh and hip. These injuries today represent 23% of the active-life years lost to injury in frontal crashes involving motor vehicles.
15 Anti-sliding airbags are installed in the seat cushion. In a crash, the airbag raises the front end of the seat cushion to prevent the oc-
cupant from sliding under the seatbelt. This reduces significantly the risk for knee, thigh, and hip injuries for belted occupants. In addition, by keeping the occupant in an upright position, the protection from the frontal airbag becomes more efficient.
16 Steering wheels offer a variety of control switches and different designs. Some of our steering wheels have an integrated electrical motor that can vibrate the steering wheel, thereby alerting the driver of a dangerous situation. To improve comfort in cold climate, the steering wheel can have a heated rim.
17 Far-side airbags that inflate between the seats can significantly reduce injuries by preventing the occupants to move sideways. Studies have shown that 30% of all serious injuries in side-impact collisions are related to the far-side occupant hitting the other occupant or hard objects.
18 Bag-in-belt is a combination of a seatbelt and an airbag to further reduce the load on the occupant’s rib cage in a frontal collision.
CRASH ELECTRONICS19 The ECU (Electronic Control Unit) is the “brain” of the car’s safety system. It decides not only if, but also exactly when, the seatbelt pre-tensioners should be triggered and each airbag system should be deployed. The ECU contains crash sensors and a microprocessor, as well as back-up electricity in the event the connection to the car battery is cut off in the crash. The ECU is located in the middle of the vehicle where it is well protected during a crash. Autoliv’s latest ECU also contains sensors for the Electronic Stability Control System (see “Brake Control/ESC” on the previous page).
20 Satellite sensors are mounted in the door beam, the pillar be-tween the doors, the rocker panel, and/or in various locations at the front of the vehicle, to quickly provide the ECU with acceleration data to enable appropriate deployment of the airbags and seatbelt pre-tensioners.
ANTI WHIPLASH21 Anti-whiplash systems are based on a yieldable backrest that tilts in a controlled way in a rear-end collision, thereby reducing the risk for neck injuries.
BATTERY DISCONNECT SAFETY SWITCH22 The Pyrotechnic Safety Switch utilizes a pyrotechnic initiator to cut the electrical power to a designated portion of the vehicle in a crash. This minimizes the potential for a fire in a crash. It is especially important in electrical vehicles to automatically and safely cut-off the connection to the electrical power.
PEDESTRIAN PROTECTIONTo protect the head, the hood needs to be able to act as a cushion. This can be achieved by using 23 pyrotechnic hood-lifters that raise the rear end of the hood to create clearance above the rigid engine structure beneath. However, in many smaller vehicles, the hood is too short, and the head of a pedestrian will most likely hit the hard area between the hood and the windscreen or one of the windshield pillars. In this case
an outside 24 pedestrian protection airbag can be used to create a cushion effect.
Pedestrian protection systems are deployed either by contact sen-sors in the bumper or by an Active Safety system. The latter system has the advantage of being able to brake the car, thereby reducing the speed and the severity of impact.
0
140
280
420
560
700
20132012201120102009
429490
568
Customer funded
% of sales, grossNet
% of sales, net0
2
4
6
8
10598
634
%US$ (Millions)
Takata 6%
GM 5%
Hyundai 4%
Denso 3%
Ford 3%
OtherApplicants 42%
Bosch 4%
TRW 3%
Autoliv 8%
Toyota 9%
Renault/Nissan 2%
VW 2%
TR+TG 3%Suzuki 3%
Honda 3%
16 AUTOLIV 2013 / INNOVATIONS
Innovations to Save LivesAutoliv has 5,000 people, or close to 10% of all its associates, engaged in Research, Development and Application Engineering.
safety is one of the strongest sales drivers for new cars. In virtually all inquiries about what consumers want in their next vehicle, new safety products rank very high or at the top of their priorities.
Autoliv assists vehicle manufacturers in meeting these evolving safety trends by stay-ing at the forefront of technology, crash-testing more vehicles than any other safety company and working as a development partner for new vehicles.
We have 5,000 people in Research, Develop-ment and Application Engineering (R,D&E).
Research (R) is conducted by some 30 dedi-cated specialists at our Swedish Safety Center. We also provide funding for another 30 scien-tists at universities and independent research institutes to work on special projects. We use accident databases (such as NASS-CDS in the U.S., as well as GIDAS in Europe and CIDAS in China, both of which Autoliv is a member) to identify the types of traffic injuries to which we might apply Autoliv’s safety expertise. We also draw on our crash tests and trials, as well as on the vast expertise our specialists have gathered over many years.
Corporate passive safety development projects (D) are assigned to our leading tech centers in
China, France, Germany, Japan, South Korea, Sweden and the United States. For electronics and Active Safety we have technical centers in the U.S., Sweden, France, Romania and Japan. Application engineering projects are completed in our tech centers in close cooperation with the manufacturing units.
Our R,D&E focuses both on inventing com-pletely new technologies and on implementing further improvements and cost savings to existing products.
In total, Autoliv currently has thousands of R,D&E projects with the vast majority of the projects (and the associated costs) in application engineering to support the development of new vehicle models. No single project accounts for more than 3% of Autoliv’s total R,D&E spending.
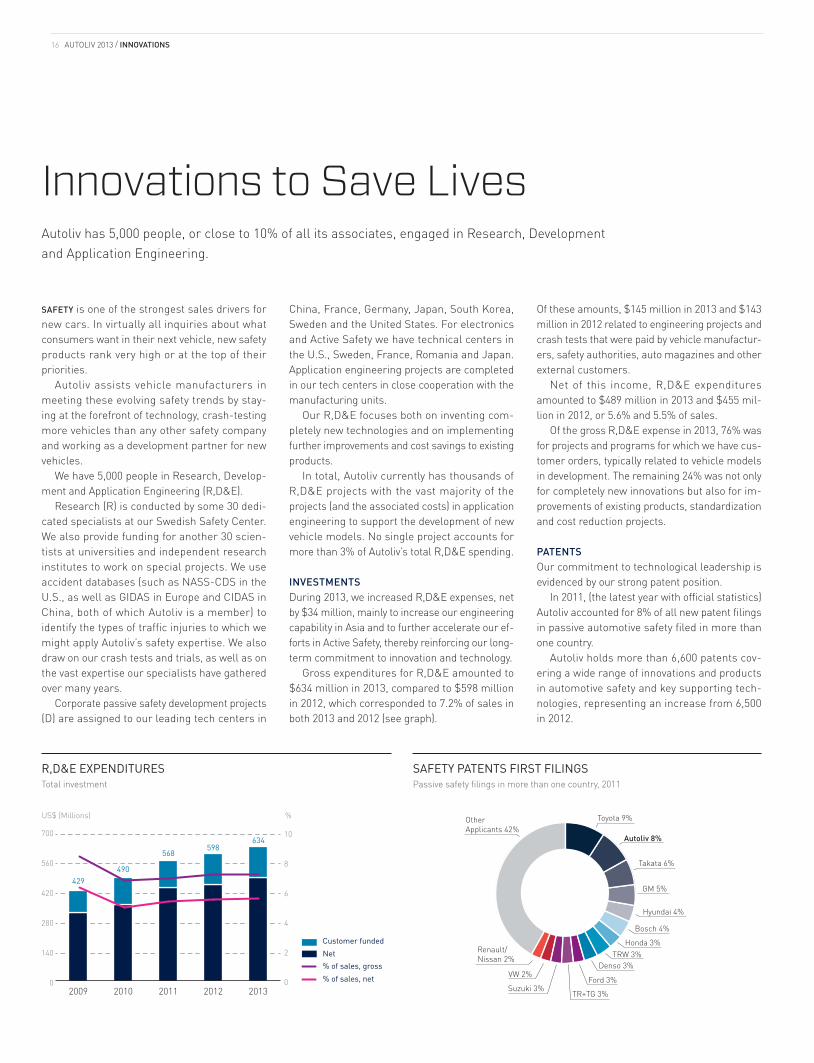
INVESTMENTSDuring 2013, we increased R,D&E expenses, net by $34 million, mainly to increase our engineering capability in Asia and to further accelerate our ef-forts in Active Safety, thereby reinforcing our long-term commitment to innovation and technology.
Gross expenditures for R,D&E amounted to $634 million in 2013, compared to $598 million in 2012, which corresponded to 7.2% of sales in both 2013 and 2012 (see graph).
Of these amounts, $145 million in 2013 and $143 million in 2012 related to engineering projects and crash tests that were paid by vehicle manufactur-ers, safety authorities, auto magazines and other external customers.
Net of this income, R,D&E expenditures amounted to $489 million in 2013 and $455 mil-lion in 2012, or 5.6% and 5.5% of sales.
Of the gross R,D&E expense in 2013, 76% was for projects and programs for which we have cus-tomer orders, typically related to vehicle models in development. The remaining 24% was not only for completely new innovations but also for im-provements of existing products, standardization and cost reduction projects.
PATENTSOur commitment to technological leadership is evidenced by our strong patent position.
In 2011, (the latest year with official statistics) Autoliv accounted for 8% of all new patent filings in passive automotive safety filed in more than one country.
Autoliv holds more than 6,600 patents cov-ering a wide range of innovations and products in automotive safety and key supporting tech-nologies, representing an increase from 6,500 in 2012.
R,D&E EXPENDITURESTotal investment
SAFETY PATENTS FIRST FILINGSPassive safety filings in more than one country, 2011
17
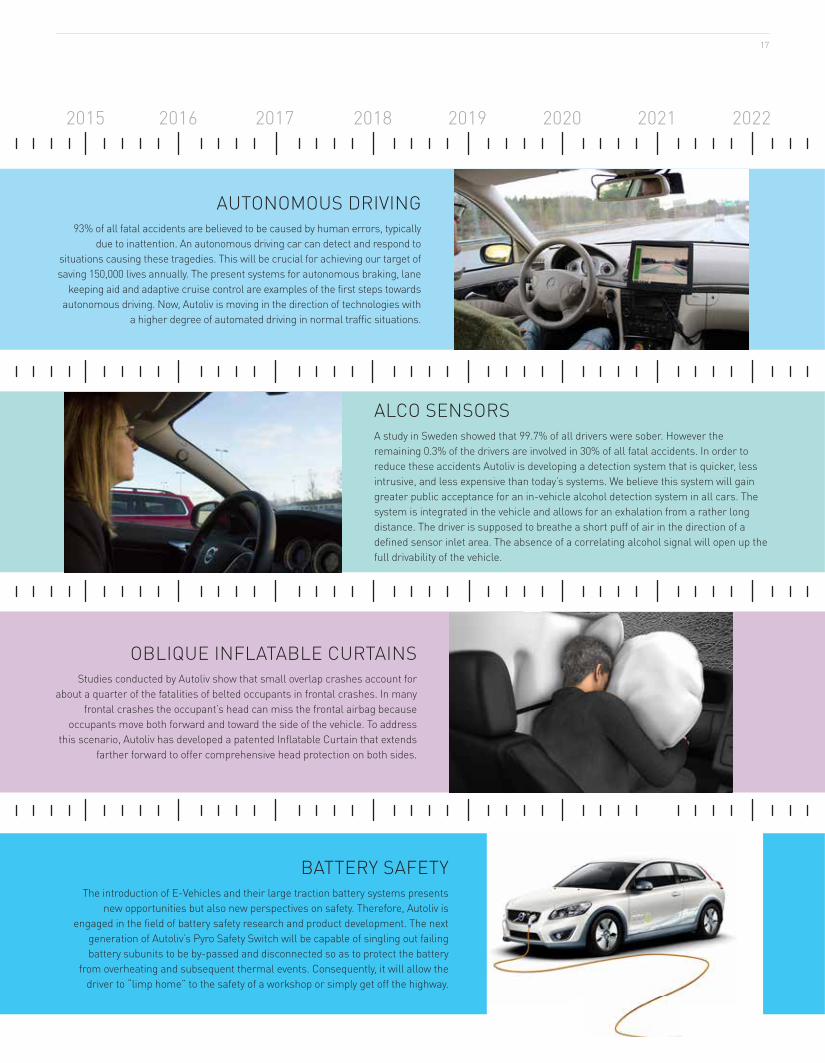
AUTONOMOUS DRIVING93% of all fatal accidents are believed to be caused by human errors, typically
due to inattention. An autonomous driving car can detect and respond to situations causing these tragedies. This will be crucial for achieving our target of saving 150,000 lives annually. The present systems for autonomous braking, lane
keeping aid and adaptive cruise control are examples of the first steps towards autonomous driving. Now, Autoliv is moving in the direction of technologies with
a higher degree of automated driving in normal traffic situations.
OBLIQUE INFLATABLE CURTAINSStudies conducted by Autoliv show that small overlap crashes account for
about a quarter of the fatalities of belted occupants in frontal crashes. In many frontal crashes the occupant’s head can miss the frontal airbag because
occupants move both forward and toward the side of the vehicle. To address this scenario, Autoliv has developed a patented Inflatable Curtain that extends
farther forward to offer comprehensive head protection on both sides.
BATTERY SAFETYThe introduction of E-Vehicles and their large traction battery systems presents
new opportunities but also new perspectives on safety. Therefore, Autoliv is engaged in the field of battery safety research and product development. The next
generation of Autoliv’s Pyro Safety Switch will be capable of singling out failing battery subunits to be by-passed and disconnected so as to protect the battery
from overheating and subsequent thermal events. Consequently, it will allow the driver to “limp home” to the safety of a workshop or simply get off the highway.
ALCO SENSORSA study in Sweden showed that 99.7% of all drivers were sober. However the remaining 0.3% of the drivers are involved in 30% of all fatal accidents. In order to reduce these accidents Autoliv is developing a detection system that is quicker, less intrusive, and less expensive than today’s systems. We believe this system will gain greater public acceptance for an in-vehicle alcohol detection system in all cars. The system is integrated in the vehicle and allows for an exhalation from a rather long distance. The driver is supposed to breathe a short puff of air in the direction of a defined sensor inlet area. The absence of a correlating alcohol signal will open up the full drivability of the vehicle.
2015 2016 2017 2018 2019 2020 2021 2022

18 AUTOLIV 2013 / AUTOLIV IN CHINA
19
Autoliv in China
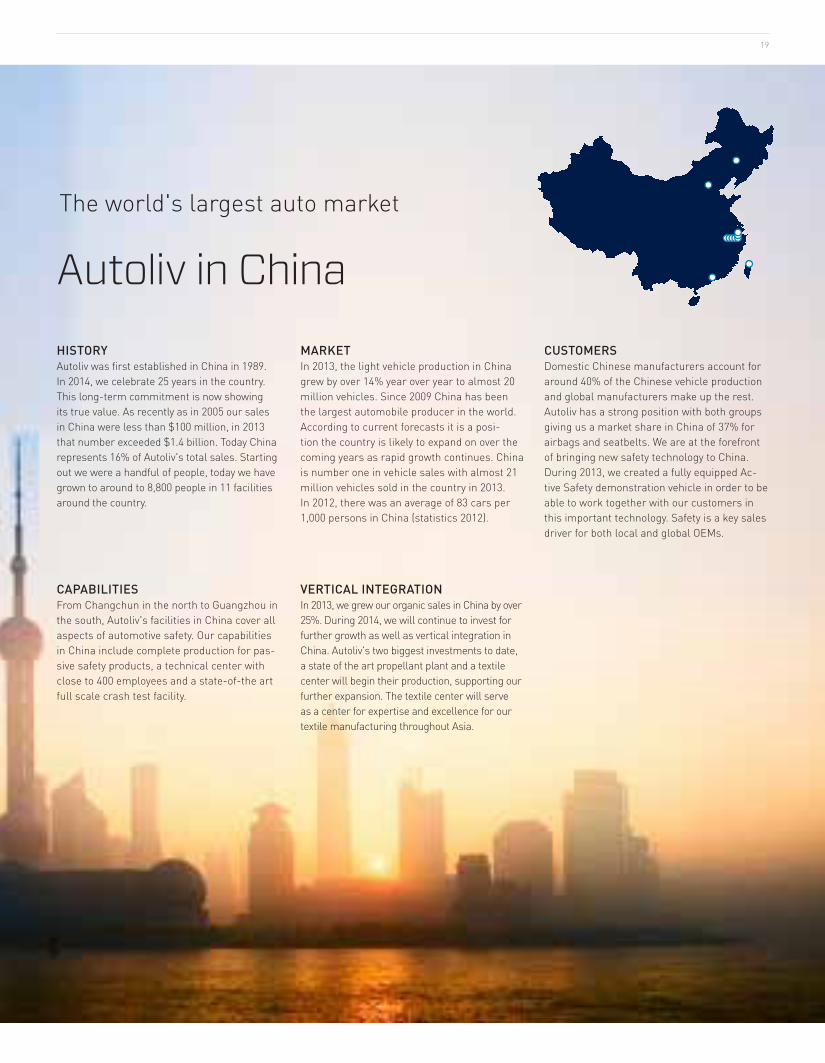
HISTORYAutoliv was first established in China in 1989. In 2014, we celebrate 25 years in the country. This long-term commitment is now showing its true value. As recently as in 2005 our sales in China were less than $100 million, in 2013 that number exceeded $1.4 billion. Today China represents 16% of Autoliv's total sales. Starting out we were a handful of people, today we have grown to around to 8,800 people in 11 facilities around the country.
CUstomeRsDomestic Chinese manufacturers account for around 40% of the Chinese vehicle production and global manufacturers make up the rest. Autoliv has a strong position with both groups giving us a market share in China of 37% for airbags and seatbelts. We are at the forefront of bringing new safety technology to China. During 2013, we created a fully equipped Ac-tive Safety demonstration vehicle in order to be able to work together with our customers in this important technology. Safety is a key sales driver for both local and global OEMs.
CAPABILITIESFrom Changchun in the north to Guangzhou in the south, Autoliv's facilities in China cover all aspects of automotive safety. Our capabilities in China include complete production for pas-sive safety products, a technical center with close to 400 employees and a state-of-the art full scale crash test facility.
MARKETIn 2013, the light vehicle production in China grew by over 14% year over year to almost 20 million vehicles. Since 2009 China has been the largest automobile producer in the world. According to current forecasts it is a posi-tion the country is likely to expand on over the coming years as rapid growth continues. China is number one in vehicle sales with almost 21 million vehicles sold in the country in 2013. In 2012, there was an average of 83 cars per 1,000 persons in China (statistics 2012).
The world's largest auto market
VERTICAL INTEGRATIONIn 2013, we grew our organic sales in China by over 25%. During 2014, we will continue to invest for further growth as well as vertical integration in China. Autoliv's two biggest investments to date, a state of the art propellant plant and a textile center will begin their production, supporting our further expansion. The textile center will serve as a center for expertise and excellence for our textile manufacturing throughout Asia.
20 AUTOLIV 2013 / SOCIAL RESPONSIBILITY
Creating Sustainable ValueTo achieve sustainable growth and profitability, we recognize that every part of our business needs to be run with responsibility, integrity and operational excellence.
today aRoUnd 75% of the value of a vehicle is created in the supply-chain, through outsourc-ing of innovation and production. Safety and fuel-economy standards are strong competitive drivers within the automotive industry. As sup-pliers we have an opportunity to contribute to the success of our customers. This entails meeting customer expectations on environmental, social and ethical standards in their supply-chain. Most of our major customers are, through regular as-sessments keeping track of our performance in these areas.
KEEPING PACE WITH GROWTH Global thinking and local actions is one of our core values. As our Company grows, this principle becomes even more relevant and challenging. Our Growth Markets are characterized by very high labor turnover. Although below market average, the turnover rate among Autoliv’s employees in China was 32% in 2013, in India it was 13%.
In such a changing and dynamic environment we have to uphold a global standard of ethical behavior and integrity, without losing the power of local action and initiative. We need to ensure that all current and new co-workers are aware of and committed to the duties and rights that come with Autoliv employment. We have to keep pace with our growth.
One critical factor is the frequency of train-ing and internal communication. Based on our Standard of Business Conduct and Ethics (Code of Conduct), we have in place the elements of an ef-fective compliance program, including the Board of Directors’ supervision, executive sponsorship, employee training and a whistle-blower service, Autoliv Helpline.
As Autoliv is operating in different legal and cultural environments, it is crucial to bring our standards and policies to life in a local context. The Code of Conduct is available in 20 languages, and in 2013 all new employees received training.
New employees are within 30 days provided with compliance and awareness training, as part of their orientation program. In line with a three year plan starting in 2014, training will be repeated an-nually, extended with specific training for targeted employees.
SPEAK UPWe have a strong culture of communication and sharing of knowledge. At our plants each shift starts with a debriefing where concerns can be raised. The Autoliv Helpline is a multilingual third-party operated service, where reports can be made confidentially about any suspected or known violations of law, policies, or other con-cerns. Reporting is followed up by regional and global legal and compliance functions. Employ-ees are entitled to voluntarily join associations in accordance with local legislation and rules, although the level of unionization varies signifi-cantly throughout our operations. The European Works Council meets with Management twice a year.
BUILDING A SUSTAINABLE INVESTMENT CASEOur investors are increasingly focusing on our ability to create value based on sustainable per-formance. We welcome this development as it provides us with the opportunity to present a broader view of our Company, revealing new or hidden value drivers. Over the coming years, we aim to further improve our communication in this respect, and strive for an effective integration of environmental, social and governance (ESG) is-sues that are material for our growth, profitability and risk management.
MANAGING OUR SUPPLY CHAINAutoliv has a strategy of consolidating its sup-ply base by reducing the number of suppliers, alongside the standardization of components
and raw materials, and a review of the sourc-ing of sub-components. We expect this to lead to reduced complexity and improved relations with preferred suppliers. Autoliv will further strengthen the supply base by the deployment of improvement programs, based on the Autoliv Production System (APS). Suppliers in emerg-ing markets, with capability to deliver to broader regions matching the Company footprint, are es-pecially targeted.
Autoliv has a global sourcing council and a common purchasing system for all units.
In the pre-qualification process new sup-pliers are required to acknowledge and follow the guidelines stated in the Autoliv Supplier Manual, including the Code of Conduct. For a full environmental commitment, our suppliers should implement an Environmental Manage-ment System, preferably based on ISO 14001. All substances used in production part materials shall be declared and comply with the Autoliv substance use restrictions, aligned with the Eu-ropean REACH and RoHS Directive, respectively. Assessments also include tracing of potential conflict minerals.
Current suppliers are frequently visited. Audits are performed by the Supplier Quality organiza-tion. The auditing framework includes items from the Code of Conduct, such as human rights and working conditions, environment and business conduct and ethics.
AUTOLIV PRODUCTION SYSTEM PERFORMANCEAutoliv’s own operations generate modest en-vironmental impact, compared to impacts up-stream and downstream in the value chain. The Autoliv Production System (APS) is self-developed and based on the Lean philosophy of resource ef-ficiency. Close to all Autoliv facilities are certified in accordance with ISO14001. We have launched several energy saving programs. Our total ener-
21
MEASUREMENTS 2011 2012 2013
Energy consumption, GWh 680 715 771CO2 equivalents metric tons 230,000 246,000 257,000No of plants with zero-injuries 19 13 16Injuries/20 ,000h 1.7 1.7 1.5Code of Conduct training, number of employees 2,389 49,614 19,115
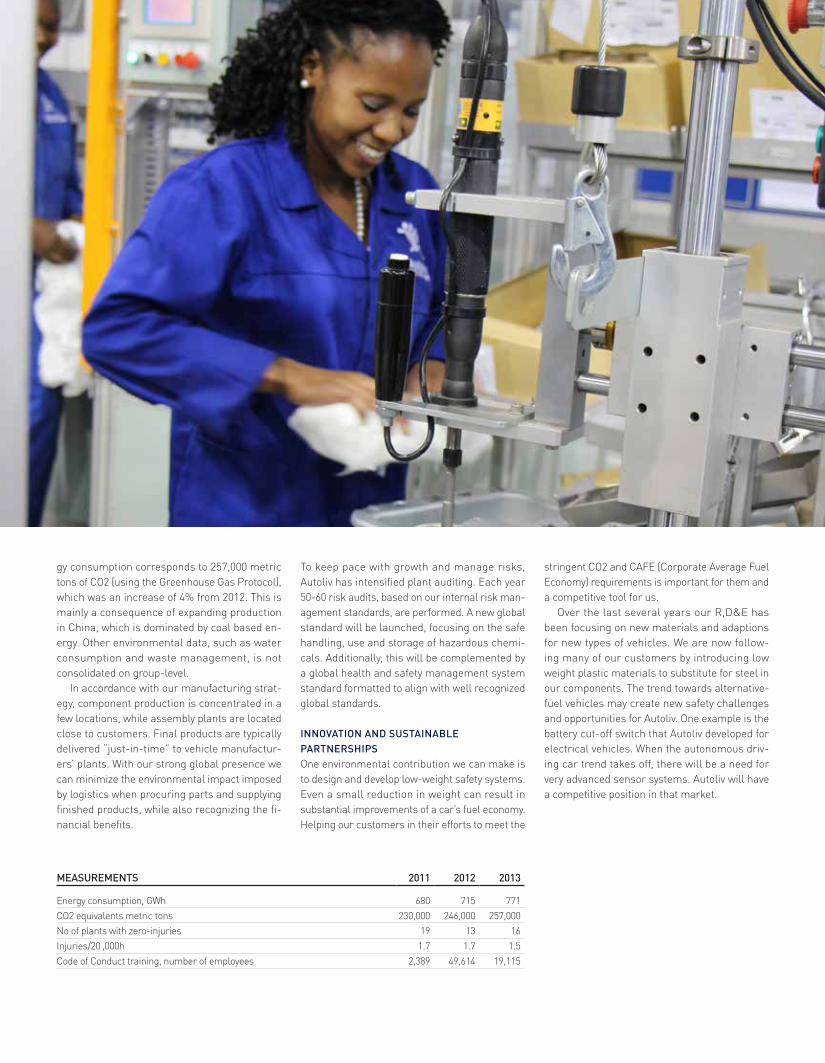
gy consumption corresponds to 257,000 metric tons of CO2 (using the Greenhouse Gas Protocol), which was an increase of 4% from 2012. This is mainly a consequence of expanding production in China, which is dominated by coal based en-ergy. Other environmental data, such as water consumption and waste management, is not consolidated on group-level.
In accordance with our manufacturing strat-egy, component production is concentrated in a few locations, while assembly plants are located close to customers. Final products are typically delivered “just-in-time” to vehicle manufactur-ers’ plants. With our strong global presence we can minimize the environmental impact imposed by logistics when procuring parts and supplying finished products, while also recognizing the fi-nancial benefits.
To keep pace with growth and manage risks, Autoliv has intensified plant auditing. Each year 50-60 risk audits, based on our internal risk man-agement standards, are performed. A new global standard will be launched, focusing on the safe handling, use and storage of hazardous chemi-cals. Additionally, this will be complemented by a global health and safety management system standard formatted to align with well recognized global standards.
INNOVATION AND SUSTAINABLE PARTNERSHIPSOne environmental contribution we can make is to design and develop low-weight safety systems. Even a small reduction in weight can result in substantial improvements of a car’s fuel economy. Helping our customers in their efforts to meet the
stringent CO2 and CAFE (Corporate Average Fuel Economy) requirements is important for them and a competitive tool for us.
Over the last several years our R,D&E has been focusing on new materials and adaptions for new types of vehicles. We are now follow-ing many of our customers by introducing low weight plastic materials to substitute for steel in our components. The trend towards alternative-fuel vehicles may create new safety challenges and opportunities for Autoliv. One example is the battery cut-off switch that Autoliv developed for electrical vehicles. When the autonomous driv-ing car trend takes off, there will be a need for very advanced sensor systems. Autoliv will have a competitive position in that market.
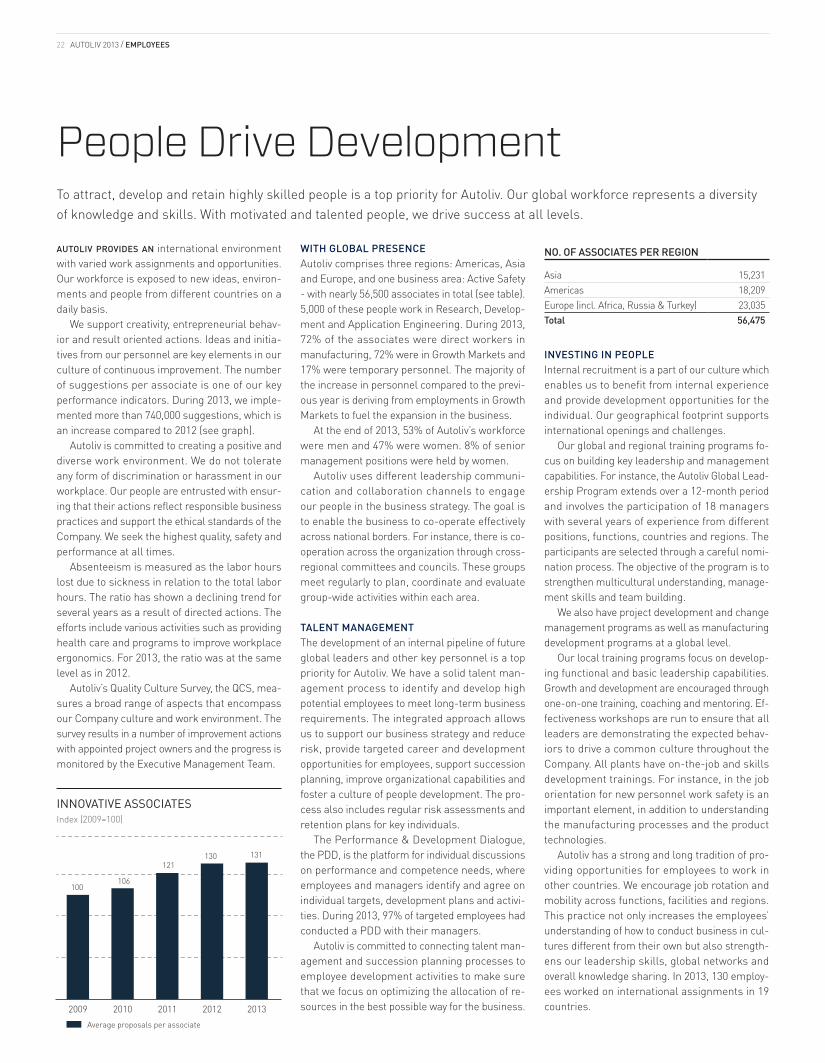
Average proposals per associate
100106
121130 131
20132012201120102009
22 AUTOLIV 2013 / EMPLOYEES
aUtoliv pRovides an international environment with varied work assignments and opportunities. Our workforce is exposed to new ideas, environ-ments and people from different countries on a daily basis.
We support creativity, entrepreneurial behav-ior and result oriented actions. Ideas and initia-tives from our personnel are key elements in our culture of continuous improvement. The number of suggestions per associate is one of our key performance indicators. During 2013, we imple-mented more than 740,000 suggestions, which is an increase compared to 2012 (see graph).
Autoliv is committed to creating a positive and diverse work environment. We do not tolerate any form of discrimination or harassment in our workplace. Our people are entrusted with ensur-ing that their actions reflect responsible business practices and support the ethical standards of the Company. We seek the highest quality, safety and performance at all times.
Absenteeism is measured as the labor hours lost due to sickness in relation to the total labor hours. The ratio has shown a declining trend for several years as a result of directed actions. The efforts include various activities such as providing health care and programs to improve workplace ergonomics. For 2013, the ratio was at the same level as in 2012.
Autoliv’s Quality Culture Survey, the QCS, mea-sures a broad range of aspects that encompass our Company culture and work environment. The survey results in a number of improvement actions with appointed project owners and the progress is monitored by the Executive Management Team.
People Drive DevelopmentTo attract, develop and retain highly skilled people is a top priority for Autoliv. Our global workforce represents a diversity of knowledge and skills. With motivated and talented people, we drive success at all levels.
INNOVATIVE ASSOCIATESIndex (2009=100)
WITH GLOBAL PRESENCEAutoliv comprises three regions: Americas, Asia and Europe, and one business area: Active Safety - with nearly 56,500 associates in total (see table). 5,000 of these people work in Research, Develop-ment and Application Engineering. During 2013, 72% of the associates were direct workers in manufacturing, 72% were in Growth Markets and 17% were temporary personnel. The majority of the increase in personnel compared to the previ-ous year is deriving from employments in Growth Markets to fuel the expansion in the business.
At the end of 2013, 53% of Autoliv’s workforce were men and 47% were women. 8% of senior management positions were held by women.
Autoliv uses different leadership communi-cation and collaboration channels to engage our people in the business strategy. The goal is to enable the business to co-operate effectively across national borders. For instance, there is co-operation across the organization through cross-regional committees and councils. These groups meet regularly to plan, coordinate and evaluate group-wide activities within each area.
TALENT MANAGEMENT The development of an internal pipeline of future global leaders and other key personnel is a top priority for Autoliv. We have a solid talent man-agement process to identify and develop high potential employees to meet long-term business requirements. The integrated approach allows us to support our business strategy and reduce risk, provide targeted career and development opportunities for employees, support succession planning, improve organizational capabilities and foster a culture of people development. The pro-cess also includes regular risk assessments and retention plans for key individuals.
The Performance & Development Dialogue, the PDD, is the platform for individual discussions on performance and competence needs, where employees and managers identify and agree on individual targets, development plans and activi-ties. During 2013, 97% of targeted employees had conducted a PDD with their managers.
Autoliv is committed to connecting talent man-agement and succession planning processes to employee development activities to make sure that we focus on optimizing the allocation of re-sources in the best possible way for the business.
INVESTING IN PEOPLE Internal recruitment is a part of our culture which enables us to benefit from internal experience and provide development opportunities for the individual. Our geographical footprint supports international openings and challenges.
Our global and regional training programs fo-cus on building key leadership and management capabilities. For instance, the Autoliv Global Lead-ership Program extends over a 12-month period and involves the participation of 18 managers with several years of experience from different positions, functions, countries and regions. The participants are selected through a careful nomi-nation process. The objective of the program is to strengthen multicultural understanding, manage-ment skills and team building.
We also have project development and change management programs as well as manufacturing development programs at a global level.
Our local training programs focus on develop-ing functional and basic leadership capabilities. Growth and development are encouraged through one-on-one training, coaching and mentoring. Ef-fectiveness workshops are run to ensure that all leaders are demonstrating the expected behav-iors to drive a common culture throughout the Company. All plants have on-the-job and skills development trainings. For instance, in the job orientation for new personnel work safety is an important element, in addition to understanding the manufacturing processes and the product technologies.
Autoliv has a strong and long tradition of pro-viding opportunities for employees to work in other countries. We encourage job rotation and mobility across functions, facilities and regions. This practice not only increases the employees’ understanding of how to conduct business in cul-tures different from their own but also strength-ens our leadership skills, global networks and overall knowledge sharing. In 2013, 130 employ-ees worked on international assignments in 19 countries.
NO. OF ASSOCIATES PER REGION
Asia 15,231Americas 18,209Europe (incl. Africa, Russia & Turkey) 23,035Total 56,475

23
GROW YOUR POTENTIALWe are committed to the development of our employees’ skills, knowledge and creative potential.
Personal growth and advancement are important. Our culture is built on openness, trust and the power to act.
DEVELOPING SAFETY INNOVATIONSThe revolutionary Relative Velocity Control (RVC) seatbelt retractor can tune its restraining force indi-vidually to each vehicle occupant and the crash severity – without any sensor. A dedicated interdis-ciplinary development team has worked many years to come up with this innovative safety product.
“We started out in a small scale but already after a couple of years it turned into a global develop-ment project. The team’s curiosity and patience, the step-by-step improvements and the teamwork have been the main success fac-tors”, says a representative of the team.
REPRESENTING AUTOLIV IN THE WORLDOriginally from India, Suresh Nandagopal moved to the U.S. for studies and work in the early 1990s. After 10 years as Plat-form Manager in Auburn Hills (Michigan), Suresh accepted an offer to work as En-gineering Director in India on an interna-tional assignment. Suresh and his team have effectively built up an engineering
organization supporting Autoliv globally and improving Operational Excellence in India. Suresh was appointed the Presi-dent of Autoliv India in 2010: “I am very thankful to Autoliv for investing in me to develop and build a successful business in India for the future”. Autoliv has around 1,100 employees in India.
NEW AT AUTOLIVVincent Zhang recently started working for Autoliv China as General Manager in the Purchasing Department. For Vincent, the most important values he looks for in a job are the ability to grow his career continu-ously and to contribute to the business. China is a very dynamic and fast growing market. The Chinese team invests a lot
of time discussing and coming up with ideas on how to work differently to keep the competitive edge and to inspire and retain talent: “This kind of people-oriented culture pays off since I see a stable team of employees with a long-term of service in Autoliv China”. Autoliv has around 8,800 employees in China.VINCENT ZHANG General Manager Purchasing
Autoliv China, Shanghai, China
SURESH NANDAGOPAL President Autoliv India, Bangalore, India
A GLOBAL DEVELOPMENT PROJECT The Relative Velocity Control Retractor team
For the full versions of the interviews please visit www.autoliv.com/career
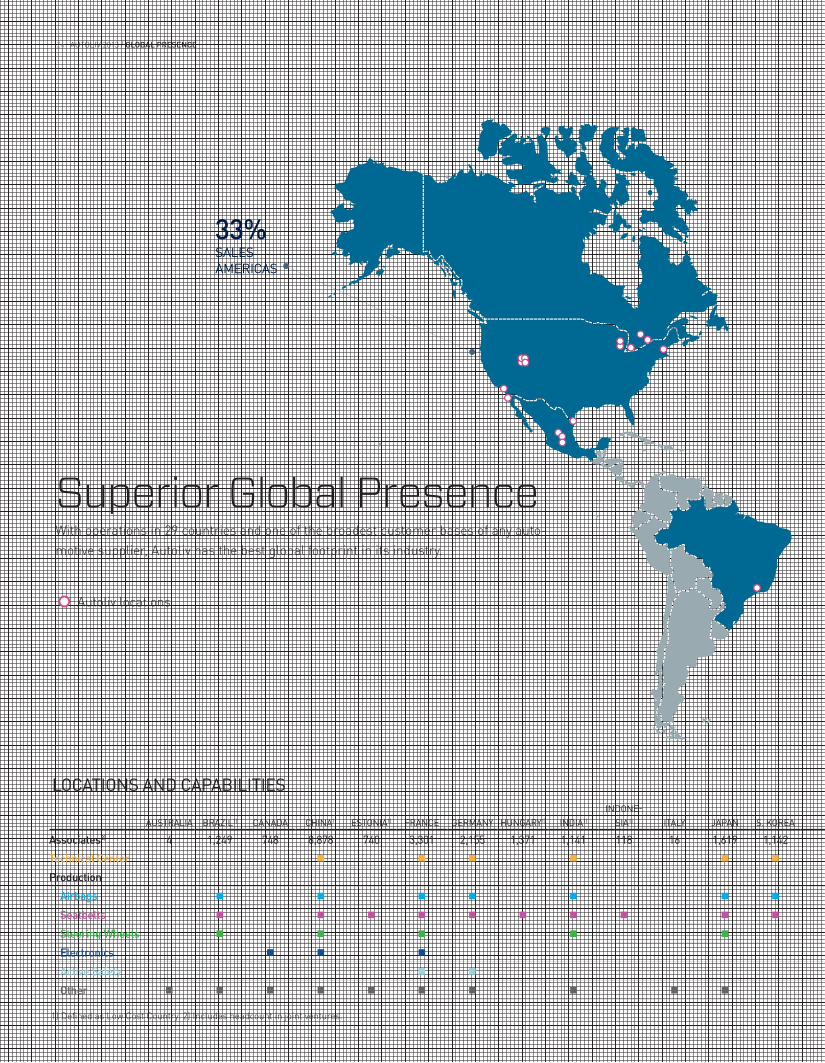
33%AMERICASSALES
24 AUTOLIV 2013 / GLOBAL PRESENCE
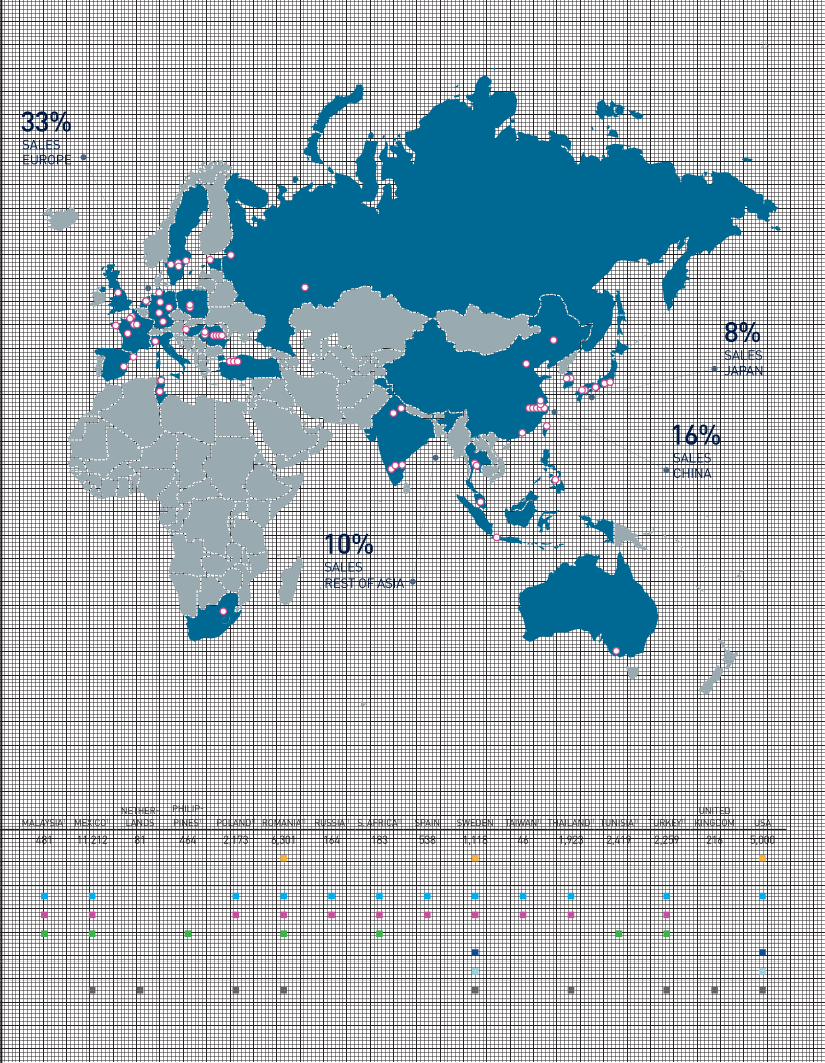
Superior Global PresenceWith operations in 29 countries and one of the broadest customer bases of any auto-motive supplier, Autoliv has the best global footprint in its industry.
AUSTRALIA BRAZIL1) CANADA CHINA1) ESTONIA1) FRANCE GERMANY HUNGARY1) INDIA1)
INDONE-SIA1) ITALY JAPAN S. KOREA MALAYSIA1) MEXICO1)
NETHER-LANDS
PHILIP-PINES1) POLAND1) ROMANIA1) RUSSIA1) S. AFRICA1) SPAIN SWEDEN TAIWAN1) THAILAND1) TUNISIA1) TURKEY1)
UNITED KINGDOM USA
Associates2) 4 1,249 748 8,878 740 3,301 2,155 1,371 1,141 118 16 1,619 1,142 481 11,212 81 464 2,173 6,301 164 183 538 1,118 46 1,923 2,419 2,259 216 5,000Technical Center
Production Airbags
Seatbelts
Steering Wheels
Electronics
Active Safety
Other
LOCATIONS AND CAPABILITIES
1) Defined as Low Cost Country. 2) Includes headcount in joint ventures.
Autoliv locations
EUROPE
REST OF ASIA
CHINA
JAPAN
33%SALES
10%SALES
8%SALES
16%SALES
25
AUSTRALIA BRAZIL1) CANADA CHINA1) ESTONIA1) FRANCE GERMANY HUNGARY1) INDIA1)
INDONE-SIA1) ITALY JAPAN S. KOREA MALAYSIA1) MEXICO1)
NETHER-LANDS
PHILIP-PINES1) POLAND1) ROMANIA1) RUSSIA1) S. AFRICA1) SPAIN SWEDEN TAIWAN1) THAILAND1) TUNISIA1) TURKEY1)
UNITED KINGDOM USA
Associates2) 4 1,249 748 8,878 740 3,301 2,155 1,371 1,141 118 16 1,619 1,142 481 11,212 81 464 2,173 6,301 164 183 538 1,118 46 1,923 2,419 2,259 216 5,000Technical Center
Production Airbags
Seatbelts
Steering Wheels
Electronics
Active Safety
Other
0
100
200
300
400
20132012201120102009Developed Markets2)
Average Growth markets3)
2013 CAGR 2016
7.1
5.3
2.7
4.8
4.2
6.3
5.7
2.4
6.0
7.8 North America
Western Europe
Japan
China
Other~$24B
~$28B~5%
~3%
~4%
~(4)%
~11%
~10%
DevelopedMarkets
Growthmarkets
AUTOLIV 2013 / MARKET & COMPETITORS26
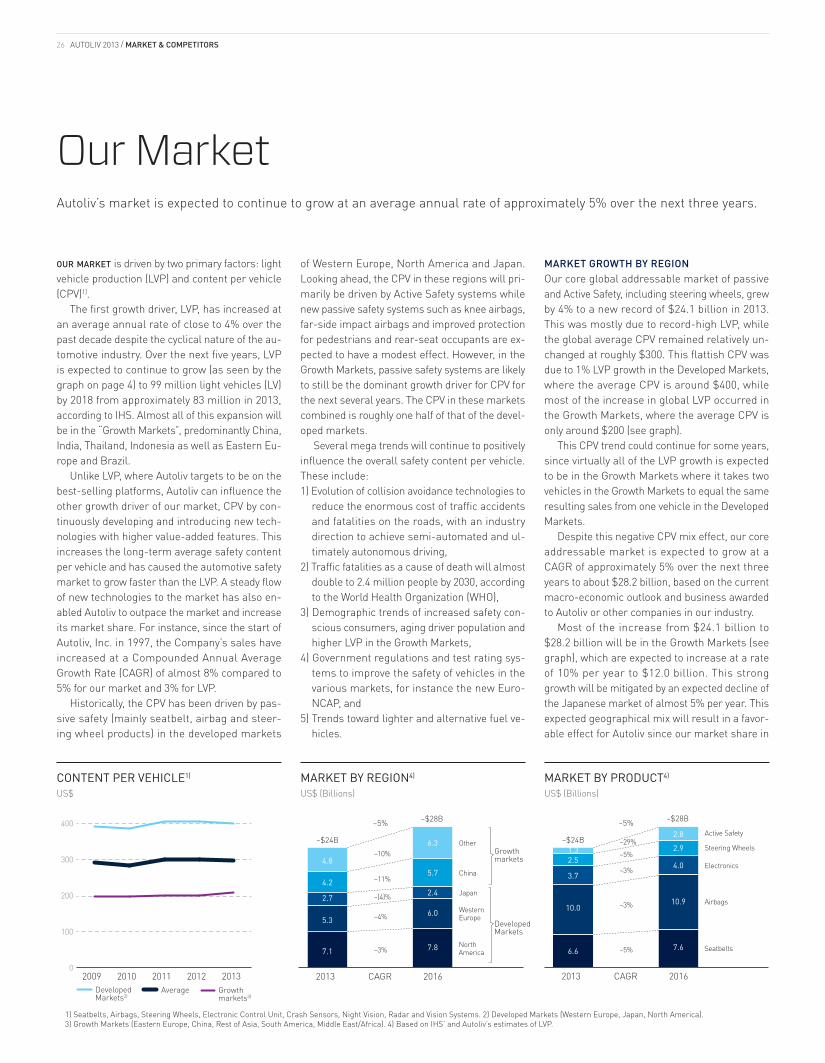
oUR maRket is driven by two primary factors: light vehicle production (LVP) and content per vehicle (CPV)1).
The first growth driver, LVP, has increased at an average annual rate of close to 4% over the past decade despite the cyclical nature of the au-tomotive industry. Over the next five years, LVP is expected to continue to grow (as seen by the graph on page 4) to 99 million light vehicles (LV) by 2018 from approximately 83 million in 2013, according to IHS. Almost all of this expansion will be in the “Growth Markets”, predominantly China, India, Thailand, Indonesia as well as Eastern Eu-rope and Brazil.
Unlike LVP, where Autoliv targets to be on the best-selling platforms, Autoliv can influence the other growth driver of our market, CPV by con-tinuously developing and introducing new tech-nologies with higher value-added features. This increases the long-term average safety content per vehicle and has caused the automotive safety market to grow faster than the LVP. A steady flow of new technologies to the market has also en-abled Autoliv to outpace the market and increase its market share. For instance, since the start of Autoliv, Inc. in 1997, the Company’s sales have increased at a Compounded Annual Average Growth Rate (CAGR) of almost 8% compared to 5% for our market and 3% for LVP.
Historically, the CPV has been driven by pas-sive safety (mainly seatbelt, airbag and steer-ing wheel products) in the developed markets
of Western Europe, North America and Japan. Looking ahead, the CPV in these regions will pri-marily be driven by Active Safety systems while new passive safety systems such as knee airbags, far-side impact airbags and improved protection for pedestrians and rear-seat occupants are ex-pected to have a modest effect. However, in the Growth Markets, passive safety systems are likely to still be the dominant growth driver for CPV for the next several years. The CPV in these markets combined is roughly one half of that of the devel-oped markets.
Several mega trends will continue to positively influence the overall safety content per vehicle. These include:1) Evolution of collision avoidance technologies to
reduce the enormous cost of traffic accidents and fatalities on the roads, with an industry direction to achieve semi-automated and ul-timately autonomous driving,
2) Traffic fatalities as a cause of death will almost double to 2.4 million people by 2030, according to the World Health Organization (WHO),
3) Demographic trends of increased safety con-scious consumers, aging driver population and higher LVP in the Growth Markets,
4) Government regulations and test rating sys-tems to improve the safety of vehicles in the various markets, for instance the new Euro-NCAP, and
5) Trends toward lighter and alternative fuel ve-hicles.
MARKET GROWTH BY REGIONOur core global addressable market of passive and Active Safety, including steering wheels, grew by 4% to a new record of $24.1 billion in 2013. This was mostly due to record-high LVP, while the global average CPV remained relatively un-changed at roughly $300. This flattish CPV was due to 1% LVP growth in the Developed Markets, where the average CPV is around $400, while most of the increase in global LVP occurred in the Growth Markets, where the average CPV is only around $200 (see graph).
This CPV trend could continue for some years, since virtually all of the LVP growth is expected to be in the Growth Markets where it takes two vehicles in the Growth Markets to equal the same resulting sales from one vehicle in the Developed Markets.
Despite this negative CPV mix effect, our core addressable market is expected to grow at a CAGR of approximately 5% over the next three years to about $28.2 billion, based on the current macro-economic outlook and business awarded to Autoliv or other companies in our industry.
Most of the increase from $24.1 billion to $28.2 billion will be in the Growth Markets (see graph), which are expected to increase at a rate of 10% per year to $12.0 billion. This strong growth will be mitigated by an expected decline of the Japanese market of almost 5% per year. This expected geographical mix will result in a favor-able effect for Autoliv since our market share in
Our MarketAutoliv’s market is expected to continue to grow at an average annual rate of approximately 5% over the next three years.
CONTENT PER VEHICLE1)
US$MARKET BY REGION4)
US$ (Billions)
2013 CAGR 2016
6.6
10.0
3.7
1.32.5
2.8
2.9
4.0
10.9
7.6 Seatbelts
Airbags
Electronics
Steering Wheels
Active Safety~$24B
~$28B~5%
~5%
~3%
~3%
~5%
~29%
MARKET BY PRODUCT4)
US$ (Billions)
1) Seatbelts, Airbags, Steering Wheels, Electronic Control Unit, Crash Sensors, Night Vision, Radar and Vision Systems. 2) Developed Markets (Western Europe, Japan, North America). 3) Growth Markets (Eastern Europe, China, Rest of Asia, South America, Middle East/Africa). 4) Based on IHS’ and Autoliv’s estimates of LVP.
the Growth Markets is 35% and increasing, while our market share in Japan is approximately 20%. However, this favorable mix will be moderated by the fact that the important Western European market is expected to expand at a rate that will be 1 percentage point less than the global aver-age growth rate.
MARKET GROWTH BY PRODUCTOur passive safety market is expected to grow at a CAGR of 4% over the next three years with the highest growth rate expected in seatbelts (see graph).
This product line is expected to grow at a CAGR of 5% or by $1.0 billion to $7.6 billion (see graph). In seatbelts, Autoliv has reached a global market share of approximately 40%, primarily due to be-ing the technology leader with several important innovations such as pretensioners and load limit-ers. Our strong market position is also a reflection of our superior global footprint. Seatbelts are the primary life-saving safety product and are also an important requirement in low-end vehicles for the Growth Markets. This provides an excellent opportunity to benefit from the expected growth in this segment of the market.
The market for airbags, where Autoliv has a market share of almost 40%, is expected to grow at an annual rate of 3% to $10.9 billion. The lower growth rate than seatbelts is related to the di-lutive effect from new low-end vehicles in the Growth Markets, with relatively low installation rates for airbags.
The passive safety electronics market is ex-pected to grow by 3% annually while the steering
wheel market is expected to grow by almost 5% annually, i.e. close to the expected average growth rate of our market. Our market share in passive safety electronics has more than doubled over the last decade to more than 20% and is expected to continue to increase in the future. Our latest electronic control unit (ECU) for airbags is very competitive as it integrates active and passive safety (see page 15).
Our newest core market, Active Safety (radar, night vision and front-view cameras), is expected to grow at a rate of 29% and more than double in size to $2.8 billion by 2016. Through acquisitions and technology partnerships with our customers, Autoliv holds a strong number two market posi-tion. During the year Autoliv increased its market share to significantly more than 20%.
In addition to our core addressable Active Safety market, the additional market potential including brake controls, rear-view and surround-view cameras should add close to $9.1 billion in 2016 to the $2.8 billion mentioned earlier. Autoliv plans to enter the brake control market with a new product offering, the Safety Domain Control-ler during the first quarter of 2014.
In summary, the winners in the automotive safety market during the next several years are likely to be companies that have built a strong position in Active Safety along with a strong posi-tion in the Growth Markets, which is in line with Autoliv’s strategy.
OUR COMPETITORSIn passive safety, Autoliv’s major competitors are Takata and TRW, where we estimate that they ac-
count for roughly one fifth and one sixth of the market, respectively, while Autoliv leads the mar-ket with an approximate share of 37%.
Takata is a family-controlled Japanese com-pany with its shares listed on the Tokyo Stock Exchange. Takata has its strongest market posi-tions in Japan and North America. TRW is a U.S. listed company on the New York Stock Exchange, with strong market positions in Europe and North America.
In Japan, South Korea and China there are a number of local manufacturers that have close ties with the domestic vehicle manufacturers. For instance, Toyota has the “keiretsu” (in-house) suppliers Tokai Rika for seatbelts, Denso for elec-tronics and Toyoda Gosei for airbags and steer-ing wheels. These suppliers generally receive the majority of the Toyota business in Japan for these products, as does Mobis, a major supplier to Hyundai-Kia, in South Korea.
Other passive safety system competitors in-clude US private equity owned KSS, Nihon Plast and Ashimori of Japan, Jinheng of China, Sam-song in South Korea and Chris in South America. Collectively, these competitors account for the majority of the remaining 25% global market share in passive safety.
The Active Safety market remains relatively fragmented with more, larger competitors than in the passive safety market and include Continen-tal, Bosch, Delphi, Valeo, Gentex, Magna, Hella, TRW, Denso and Panasonic, of which we believe Continental has the leading market position today.
Continental, Bosch and Denso are also major competitors in passive safety electronics.
Every year, Autoliv’s products save over 30,000 lives!
0
4
8
12
16
Other
Chinese OEMsVolvo
Toyota
FIAT/Chrysler
HondaDaimler
PSABMW
Hyundai/Kia
Ford VW
Renault/Nissan
GM
% of Autoliv’s sales % of global LVP
DIVERSIFIED CUSTOMER MIX
2003 2008 2013Chinese South KoreanEuropean & Other D3 (US Brands)
Japanese
20
0
40
60
100
%
80
DIVERSIFIED CUSTOMER MIX CUSTOMER SALES TREND
28 AUTOLIV 2013 / CUSTOMERS
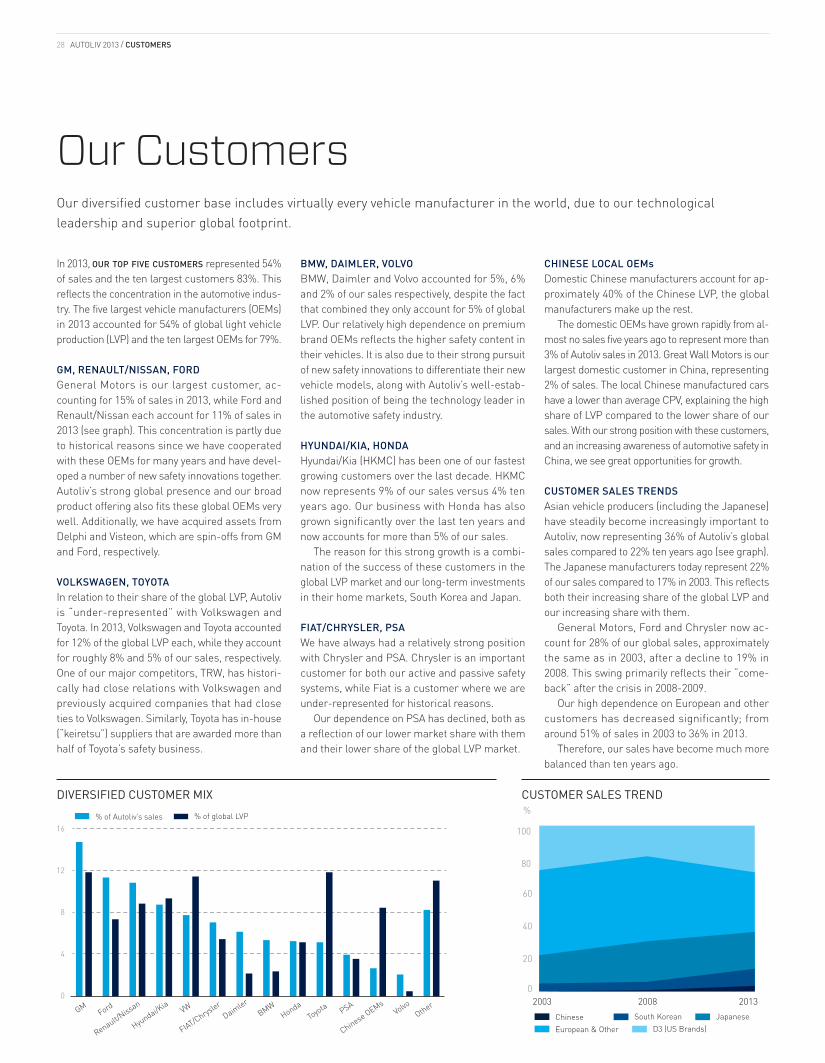
In 2013, oUR top five CUstomeRs represented 54% of sales and the ten largest customers 83%. This reflects the concentration in the automotive indus-try. The five largest vehicle manufacturers (OEMs) in 2013 accounted for 54% of global light vehicle production (LVP) and the ten largest OEMs for 79%.
GM, RENAULT/NISSAN, FORDGeneral Motors is our largest customer, ac-counting for 15% of sales in 2013, while Ford and Renault/Nissan each account for 11% of sales in 2013 (see graph). This concentration is partly due to historical reasons since we have cooperated with these OEMs for many years and have devel-oped a number of new safety innovations together. Autoliv’s strong global presence and our broad product offering also fits these global OEMs very well. Additionally, we have acquired assets from Delphi and Visteon, which are spin-offs from GM and Ford, respectively.
VOLKSWAGEN, TOYOTAIn relation to their share of the global LVP, Autoliv is “under-represented” with Volkswagen and Toyota. In 2013, Volkswagen and Toyota accounted for 12% of the global LVP each, while they account for roughly 8% and 5% of our sales, respectively. One of our major competitors, TRW, has histori-cally had close relations with Volkswagen and previously acquired companies that had close ties to Volkswagen. Similarly, Toyota has in-house (“keiretsu”) suppliers that are awarded more than half of Toyota’s safety business.
BMW, DAIMLER, VOLVO BMW, Daimler and Volvo accounted for 5%, 6% and 2% of our sales respectively, despite the fact that combined they only account for 5% of global LVP. Our relatively high dependence on premium brand OEMs reflects the higher safety content in their vehicles. It is also due to their strong pursuit of new safety innovations to differentiate their new vehicle models, along with Autoliv’s well-estab-lished position of being the technology leader in the automotive safety industry.
HYUNDAI/KIA, HONDAHyundai/Kia (HKMC) has been one of our fastest growing customers over the last decade. HKMC now represents 9% of our sales versus 4% ten years ago. Our business with Honda has also grown significantly over the last ten years and now accounts for more than 5% of our sales.
The reason for this strong growth is a combi-nation of the success of these customers in the global LVP market and our long-term investments in their home markets, South Korea and Japan.
FIAT/CHRYSLER, PSAWe have always had a relatively strong position with Chrysler and PSA. Chrysler is an important customer for both our active and passive safety systems, while Fiat is a customer where we are under-represented for historical reasons.
Our dependence on PSA has declined, both as a reflection of our lower market share with them and their lower share of the global LVP market.
CHINESE LOCAL OEMsDomestic Chinese manufacturers account for ap-proximately 40% of the Chinese LVP, the global manufacturers make up the rest.
The domestic OEMs have grown rapidly from al-most no sales five years ago to represent more than 3% of Autoliv sales in 2013. Great Wall Motors is our largest domestic customer in China, representing 2% of sales. The local Chinese manufactured cars have a lower than average CPV, explaining the high share of LVP compared to the lower share of our sales. With our strong position with these customers, and an increasing awareness of automotive safety in China, we see great opportunities for growth.
CUSTOMER SALES TRENDSAsian vehicle producers (including the Japanese) have steadily become increasingly important to Autoliv, now representing 36% of Autoliv’s global sales compared to 22% ten years ago (see graph). The Japanese manufacturers today represent 22% of our sales compared to 17% in 2003. This reflects both their increasing share of the global LVP and our increasing share with them.
General Motors, Ford and Chrysler now ac-count for 28% of our global sales, approximately the same as in 2003, after a decline to 19% in 2008. This swing primarily reflects their “come-back” after the crisis in 2008-2009.
Our high dependence on European and other customers has decreased significantly; from around 51% of sales in 2003 to 36% in 2013.
Therefore, our sales have become much more balanced than ten years ago.
Our CustomersOur diversified customer base includes virtually every vehicle manufacturer in the world, due to our technological leadership and superior global footprint.
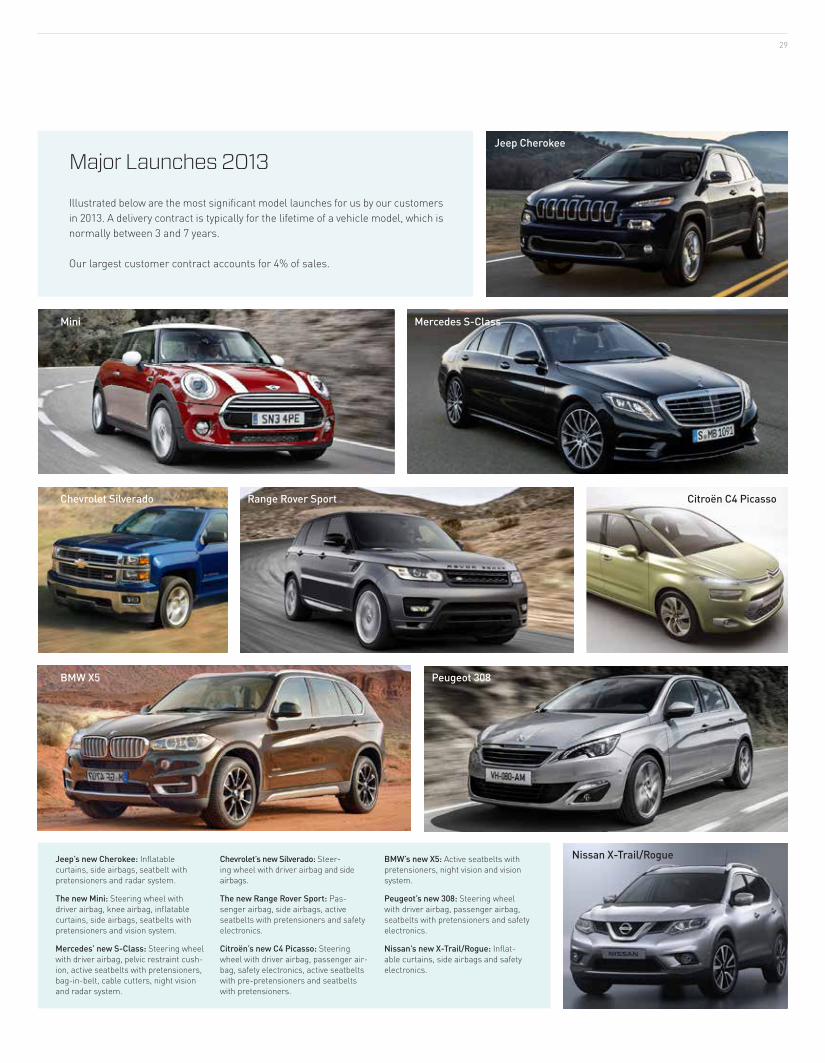
29
Major Launches 2013
Illustrated below are the most significant model launches for us by our customers in 2013. A delivery contract is typically for the lifetime of a vehicle model, which is normally between 3 and 7 years.
Our largest customer contract accounts for 4% of sales.
Jeep’s new Cherokee: Inflatable curtains, side airbags, seatbelt with pretensioners and radar system.
The new Mini: Steering wheel with driver airbag, knee airbag, inflatable curtains, side airbags, seatbelts with pretensioners and vision system.
Mercedes’ new S-Class: Steering wheel with driver airbag, pelvic restraint cush-ion, active seatbelts with pretensioners, bag-in-belt, cable cutters, night vision and radar system.
Chevrolet’s new Silverado: Steer-ing wheel with driver airbag and side airbags.
The new Range Rover Sport: Pas-senger airbag, side airbags, active seatbelts with pretensioners and safety electronics.
Citroën’s new C4 Picasso: Steering wheel with driver airbag, passenger air-bag, safety electronics, active seatbelts with pre-pretensioners and seatbelts with pretensioners.
BMW’s new X5: Active seatbelts with pretensioners, night vision and vision system.
Peugeot’s new 308: Steering wheel with driver airbag, passenger airbag, seatbelts with pretensioners and safety electronics.
Nissan’s new X-Trail/Rogue: Inflat-able curtains, side airbags and safety electronics.
Mini
Nissan X-Trail/Rogue
Range Rover Sport Citroën C4 Picasso
Mercedes S-Class
BMW X5 Peugeot 308
Jeep Cherokee
Chevrolet Silverado
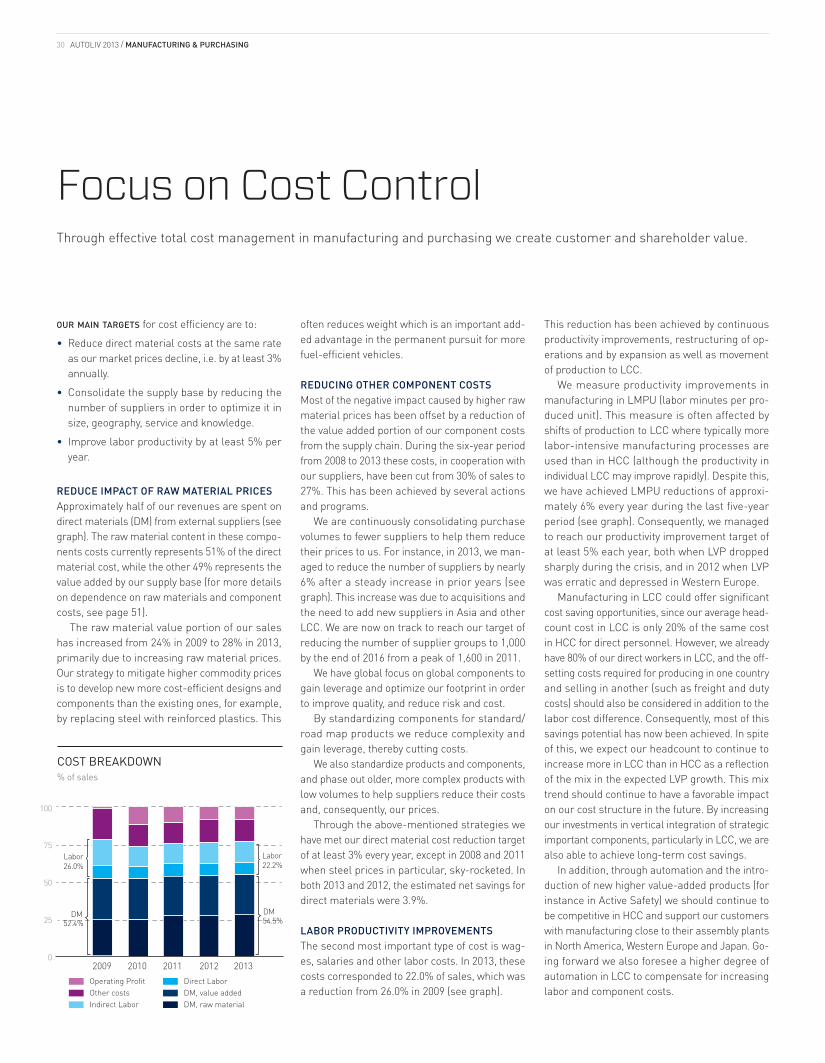
0
25
50
75
100
20132012201120102009
DM, raw materialDM, value addedDirect Labor
Other costsOperating Profit
Indirect Labor
DM
Labor
DM
Labor26.0%
52.4%
22.2%
54.5%
COST BREAKDOWN% of sales
AUTOLIV 2013 / MANUFACTURING & PURCHASING30
oUR main taRgets for cost efficiency are to:
• Reduce direct material costs at the same rate as our market prices decline, i.e. by at least 3% annually.
• Consolidate the supply base by reducing the number of suppliers in order to optimize it in size, geography, service and knowledge.
• Improve labor productivity by at least 5% per year.
REDUCE IMPACT OF RAW MATERIAL PRICESApproximately half of our revenues are spent on direct materials (DM) from external suppliers (see graph). The raw material content in these compo-nents costs currently represents 51% of the direct material cost, while the other 49% represents the value added by our supply base (for more details on dependence on raw materials and component costs, see page 51).
The raw material value portion of our sales has increased from 24% in 2009 to 28% in 2013, primarily due to increasing raw material prices. Our strategy to mitigate higher commodity prices is to develop new more cost-efficient designs and components than the existing ones, for example, by replacing steel with reinforced plastics. This
Focus on Cost ControlThrough effective total cost management in manufacturing and purchasing we create customer and shareholder value.
often reduces weight which is an important add-ed advantage in the permanent pursuit for more fuel-efficient vehicles.
REDUCING OTHER COMPONENT COSTSMost of the negative impact caused by higher raw material prices has been offset by a reduction of the value added portion of our component costs from the supply chain. During the six-year period from 2008 to 2013 these costs, in cooperation with our suppliers, have been cut from 30% of sales to 27%. This has been achieved by several actions and programs.
We are continuously consolidating purchase volumes to fewer suppliers to help them reduce their prices to us. For instance, in 2013, we man-aged to reduce the number of suppliers by nearly 6% after a steady increase in prior years (see graph). This increase was due to acquisitions and the need to add new suppliers in Asia and other LCC. We are now on track to reach our target of reducing the number of supplier groups to 1,000 by the end of 2016 from a peak of 1,600 in 2011.
We have global focus on global components to gain leverage and optimize our footprint in order to improve quality, and reduce risk and cost.
By standardizing components for standard/road map products we reduce complexity and gain leverage, thereby cutting costs.
We also standardize products and components, and phase out older, more complex products with low volumes to help suppliers reduce their costs and, consequently, our prices.
Through the above-mentioned strategies we have met our direct material cost reduction target of at least 3% every year, except in 2008 and 2011 when steel prices in particular, sky-rocketed. In both 2013 and 2012, the estimated net savings for direct materials were 3.9%.
LABOR PRODUCTIVITY IMPROVEMENTS The second most important type of cost is wag-es, salaries and other labor costs. In 2013, these costs corresponded to 22.0% of sales, which was a reduction from 26.0% in 2009 (see graph).
This reduction has been achieved by continuous productivity improvements, restructuring of op-erations and by expansion as well as movement of production to LCC.
We measure productivity improvements in manufacturing in LMPU (labor minutes per pro-duced unit). This measure is often affected by shifts of production to LCC where typically more labor-intensive manufacturing processes are used than in HCC (although the productivity in individual LCC may improve rapidly). Despite this, we have achieved LMPU reductions of approxi-mately 6% every year during the last five-year period (see graph). Consequently, we managed to reach our productivity improvement target of at least 5% each year, both when LVP dropped sharply during the crisis, and in 2012 when LVP was erratic and depressed in Western Europe.
Manufacturing in LCC could offer significant cost saving opportunities, since our average head-count cost in LCC is only 20% of the same cost in HCC for direct personnel. However, we already have 80% of our direct workers in LCC, and the off-setting costs required for producing in one country and selling in another (such as freight and duty costs) should also be considered in addition to the labor cost difference. Consequently, most of this savings potential has now been achieved. In spite of this, we expect our headcount to continue to increase more in LCC than in HCC as a reflection of the mix in the expected LVP growth. This mix trend should continue to have a favorable impact on our cost structure in the future. By increasing our investments in vertical integration of strategic important components, particularly in LCC, we are also able to achieve long-term cost savings.
In addition, through automation and the intro-duction of new higher value-added products (for instance in Active Safety) we should continue to be competitive in HCC and support our customers with manufacturing close to their assembly plants in North America, Western Europe and Japan. Go-ing forward we also foresee a higher degree of automation in LCC to compensate for increasing labor and component costs.
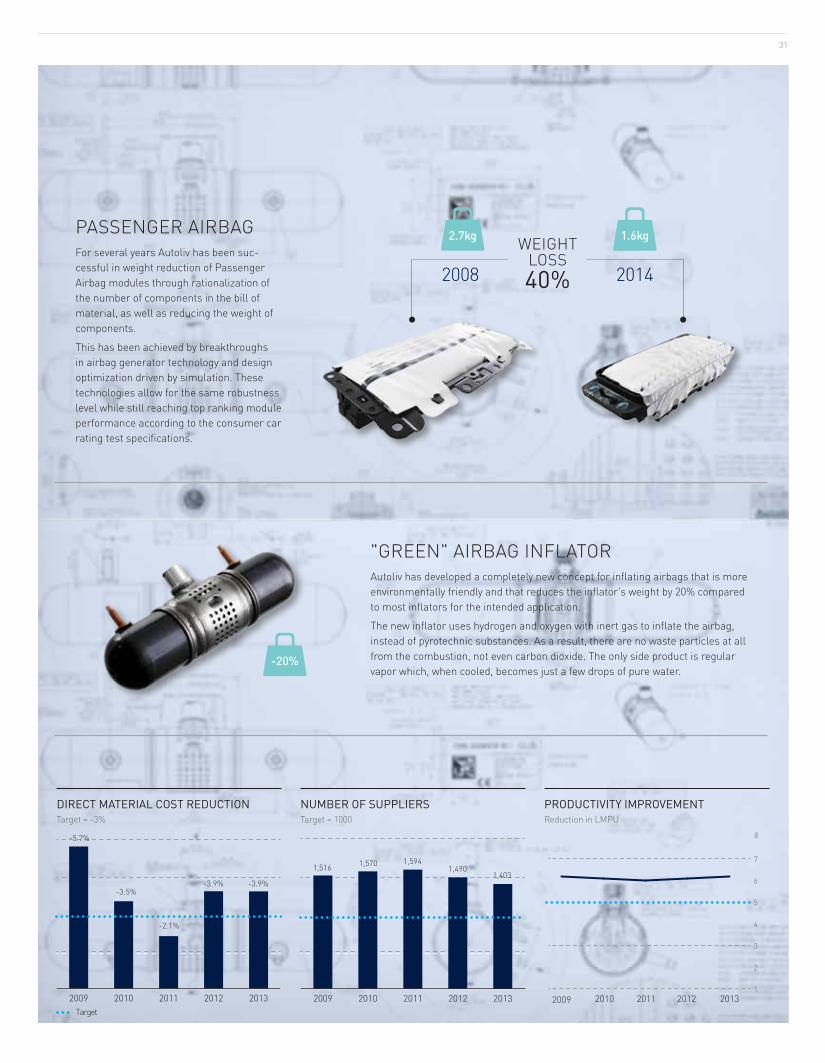
1
2
3
4
5
6
7
8
2009 2013201220112010
NUMBER OF SUPPLIERSTarget = 1000
DIRECT MATERIAL COST REDUCTIONTarget = -3%
PRODUCTIVITY IMPROVEMENTReduction in LMPU
20132012201120102009
-5.7%
-3.5%
-2.1%
-3.9% -3.9%
Target20132012201120102009
1,516 1,570 1,5941,490
1,403
31
PASSENGER AIRBAGFor several years Autoliv has been suc-cessful in weight reduction of Passenger Airbag modules through rationalization of the number of components in the bill of material, as well as reducing the weight of components.
This has been achieved by breakthroughs in airbag generator technology and design optimization driven by simulation. These technologies allow for the same robustness level while still reaching top ranking module performance according to the consumer car rating test specifications.
"GREEN" AIRBAG INFLATORAutoliv has developed a completely new concept for inflating airbags that is more environmentally friendly and that reduces the inflator's weight by 20% compared to most inflators for the intended application.
The new inflator uses hydrogen and oxygen with inert gas to inflate the airbag, instead of pyro technic substances. As a result, there are no waste particles at all from the combustion, not even carbon dioxide. The only side product is regular vapor which, when cooled, becomes just a few drops of pure water.
2.7kg
-20%
2008 2014
1.6kgWEIGHT LOSS40%
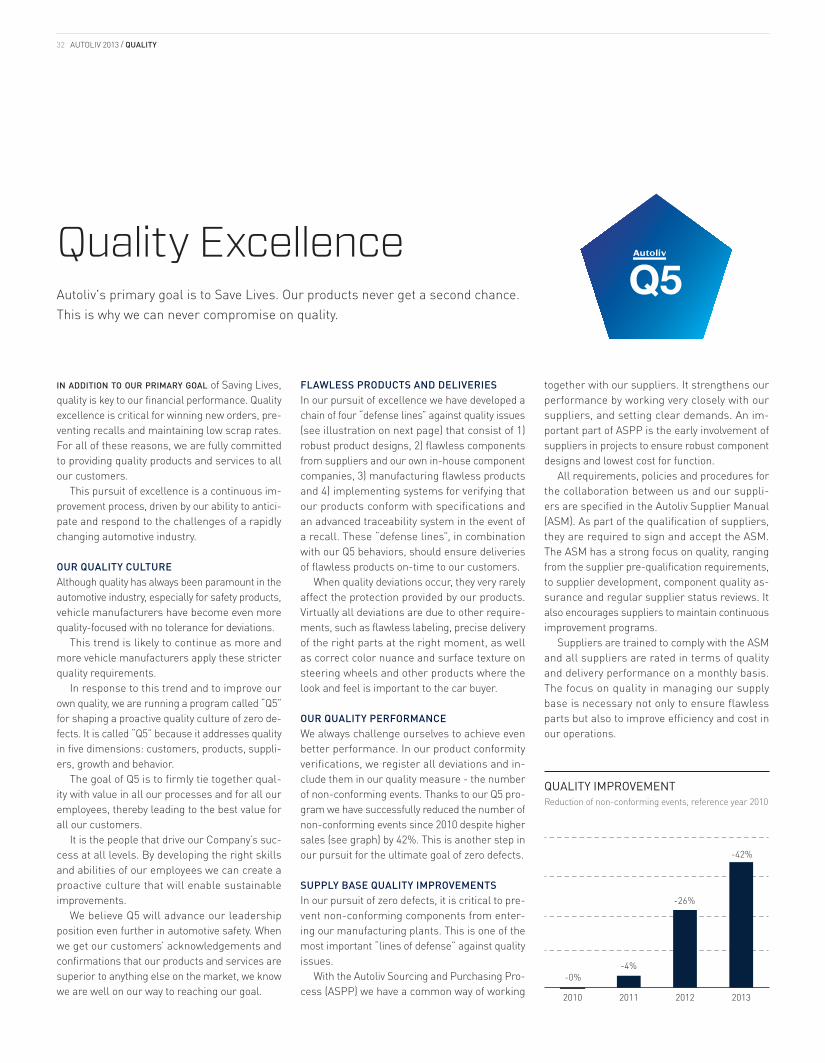
QUALITY IMPROVEMENTReduction of non-conforming events, reference year 2010
2013201220112010
-42%
-26%
-4%-0%
32 AUTOLIV 2013 / QUALITY
in addition to oUR pRimaRy goal of Saving Lives, quality is key to our financial performance. Quality excellence is critical for winning new orders, pre-venting recalls and maintaining low scrap rates. For all of these reasons, we are fully committed to providing quality products and services to all our customers.
This pursuit of excellence is a continuous im-provement process, driven by our ability to antici-pate and respond to the challenges of a rapidly changing automotive industry.
OUR QUALITY CULTURE Although quality has always been paramount in the automotive industry, especially for safety products, vehicle manufacturers have become even more quality-focused with no tolerance for deviations.
This trend is likely to continue as more and more vehicle manufacturers apply these stricter quality requirements.
In response to this trend and to improve our own quality, we are running a program called “Q5” for shaping a proactive quality culture of zero de-fects. It is called “Q5” because it addresses quality in five dimensions: customers, products, suppli-ers, growth and behavior.
The goal of Q5 is to firmly tie together qual-ity with value in all our processes and for all our employees, thereby leading to the best value for all our customers.
It is the people that drive our Company’s suc-cess at all levels. By developing the right skills and abilities of our employees we can create a proactive culture that will enable sustainable improvements.
We believe Q5 will advance our leadership position even further in automotive safety. When we get our customers’ acknowledgements and confirmations that our products and services are superior to anything else on the market, we know we are well on our way to reaching our goal.
FLAWLESS PRODUCTS AND DELIVERIESIn our pursuit of excellence we have developed a chain of four “defense lines” against quality issues (see illustration on next page) that consist of 1) robust product designs, 2) flawless components from suppliers and our own in-house component companies, 3) manufacturing flawless products and 4) implementing systems for verifying that our products conform with specifications and an advanced traceability system in the event of a recall. These “defense lines”, in combination with our Q5 behaviors, should ensure deliveries of flawless products on-time to our customers.
When quality deviations occur, they very rarely affect the protection provided by our products. Virtually all deviations are due to other require-ments, such as flawless labeling, precise delivery of the right parts at the right moment, as well as correct color nuance and surface texture on steering wheels and other products where the look and feel is important to the car buyer.
OUR QUALITY PERFORMANCEWe always challenge ourselves to achieve even better performance. In our product conformity verifications, we register all deviations and in-clude them in our quality measure - the number of non-conforming events. Thanks to our Q5 pro-gram we have successfully reduced the number of non-conforming events since 2010 despite higher sales (see graph) by 42%. This is another step in our pursuit for the ultimate goal of zero defects.
SUPPLY BASE QUALITY IMPROVEMENTSIn our pursuit of zero defects, it is critical to pre-vent non-conforming components from enter-ing our manufacturing plants. This is one of the most important “lines of defense” against quality issues.
With the Autoliv Sourcing and Purchasing Pro-cess (ASPP) we have a common way of working
together with our suppliers. It strengthens our performance by working very closely with our suppliers, and setting clear demands. An im-portant part of ASPP is the early involvement of suppliers in projects to ensure robust component designs and lowest cost for function.
All requirements, policies and procedures for the collaboration between us and our suppli-ers are specified in the Autoliv Supplier Manual (ASM). As part of the qualification of suppliers, they are required to sign and accept the ASM. The ASM has a strong focus on quality, ranging from the supplier pre-qualification requirements, to supplier development, component quality as-surance and regular supplier status reviews. It also encourages suppliers to maintain continuous improvement programs.
Suppliers are trained to comply with the ASM and all suppliers are rated in terms of quality and delivery performance on a monthly basis. The focus on quality in managing our supply base is necessary not only to ensure flawless parts but also to improve efficiency and cost in our operations.
Quality ExcellenceAutoliv's primary goal is to Save Lives. Our products never get a second chance. This is why we can never compromise on quality.
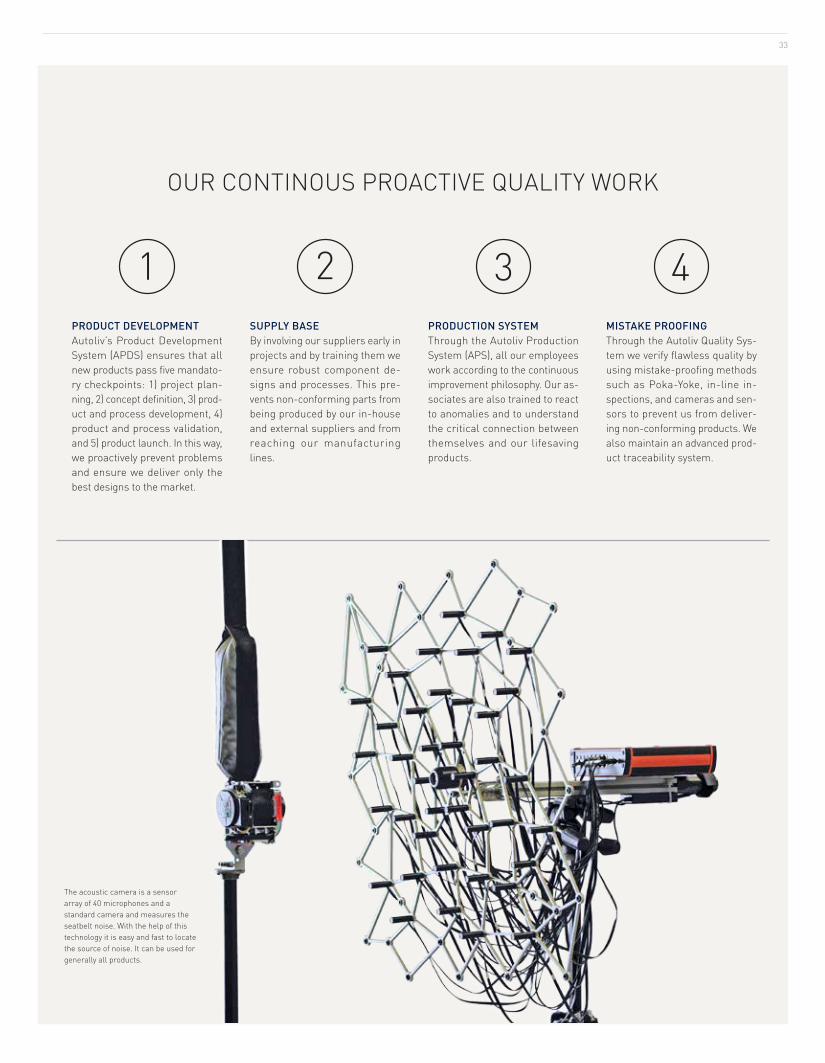
33
OUR CONTINOUS PROACTIVE QUALITY WORK
PRODUCT DEVELOPMENTAutoliv’s Product Development System (APDS) ensures that all new products pass five mandato-ry checkpoints: 1) project plan-ning, 2) concept definition, 3) prod-uct and process development, 4) product and process validation, and 5) product launch. In this way, we proactively prevent problems and ensure we deliver only the best designs to the market.
SUPPLY BASEBy involving our suppliers early in projects and by training them we ensure robust component de-signs and processes. This pre-vents non-conforming parts from being produced by our in-house and external suppliers and from reaching our manufacturing lines.
PRODUCTION SYSTEMThrough the Autoliv Production System (APS), all our employees work according to the continuous improvement philosophy. Our as-sociates are also trained to react to anomalies and to understand the critical connection between themselves and our lifesaving products.
MISTAKE PROOFINGThrough the Autoliv Quality Sys-tem we verify flawless quality by using mistake-proofing methods such as Poka-Yoke, in-line in-spections, and cameras and sen-sors to prevent us from deliver-ing non-conforming products. We also maintain an advanced prod-uct traceability system.
1 2 3 4
The acoustic camera is a sensor array of 40 microphones and a standard camera and measures the seatbelt noise. With the help of this technology it is easy and fast to locate the source of noise. It can be used for generally all products.
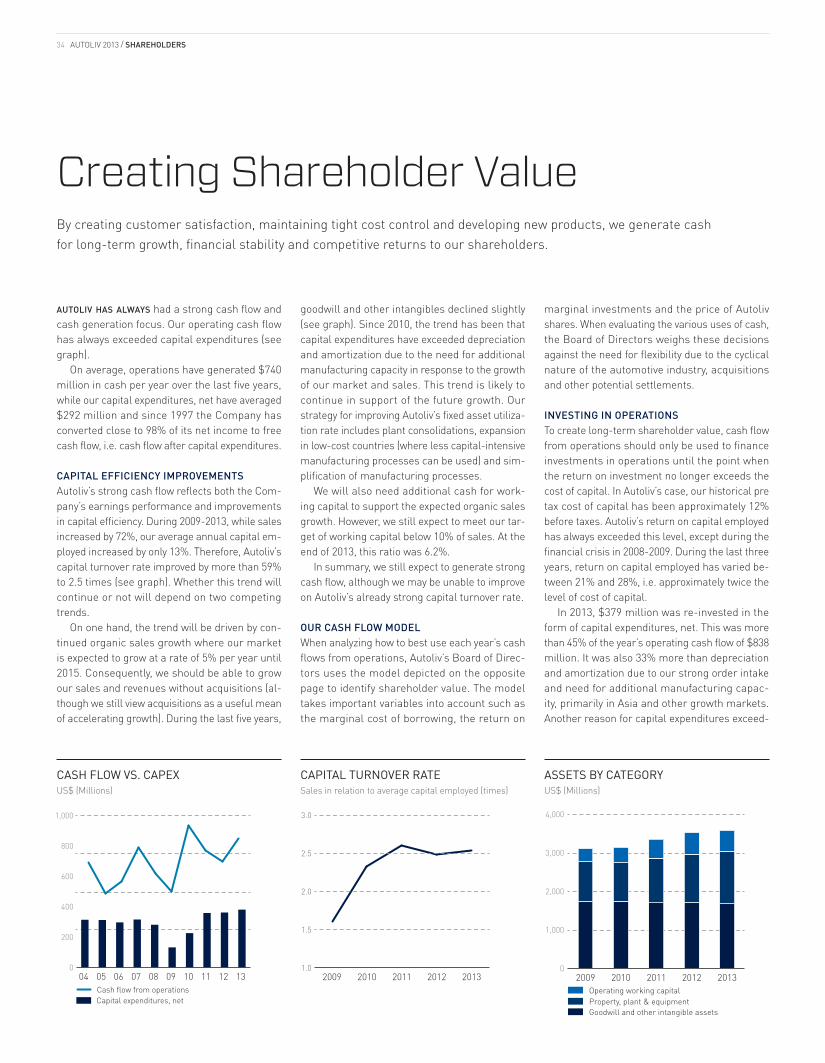
Cash flow from operationsCapital expenditures, net
0
200
400
600
800
1,000
13121110090807060504Operating working capital
0
1,000
2,000
3,000
4,000
20132012201120102009
Property, plant & equipmentGoodwill and other intangible assets
1.0
1.5
2.0
2.5
3.0
20132012201120102009
CASH FLOW VS. CAPEXUS$ (Millions)
CAPITAL TURNOVER RATESales in relation to average capital employed (times)
ASSETS BY CATEGORYUS$ (Millions)
34 AUTOLIV 2013 / SHAREHOLDERS
Creating Shareholder ValueBy creating customer satisfaction, maintaining tight cost control and developing new products, we generate cash for long-term growth, financial stability and competitive returns to our shareholders.
aUtoliv has always had a strong cash flow and cash generation focus. Our operating cash flow has always exceeded capital expenditures (see graph).
On average, operations have generated $740 million in cash per year over the last five years, while our capital expenditures, net have averaged $292 million and since 1997 the Company has converted close to 98% of its net income to free cash flow, i.e. cash flow after capital expenditures.
CAPITAL EFFICIENCY IMPROVEMENTSAutoliv’s strong cash flow reflects both the Com-pany’s earnings performance and improvements in capital efficiency. During 2009-2013, while sales increased by 72%, our average annual capital em-ployed increased by only 13%. Therefore, Autoliv’s capital turnover rate improved by more than 59% to 2.5 times (see graph). Whether this trend will continue or not will depend on two competing trends.
On one hand, the trend will be driven by con-tinued organic sales growth where our market is expected to grow at a rate of 5% per year until 2015. Consequently, we should be able to grow our sales and revenues without acquisitions (al-though we still view acquisitions as a useful mean of accelerating growth). During the last five years,
goodwill and other intangibles declined slightly (see graph). Since 2010, the trend has been that capital expenditures have exceeded depreciation and amortization due to the need for additional manufacturing capacity in response to the growth of our market and sales. This trend is likely to continue in support of the future growth. Our strategy for improving Autoliv’s fixed asset utiliza-tion rate includes plant consolidations, expansion in low-cost countries (where less capital-intensive manufacturing processes can be used) and sim-plification of manufacturing processes.
We will also need additional cash for work-ing capital to support the expected organic sales growth. However, we still expect to meet our tar-get of working capital below 10% of sales. At the end of 2013, this ratio was 6.2%.
In summary, we still expect to generate strong cash flow, although we may be unable to improve on Autoliv’s already strong capital turnover rate.
OUR CASH FLOW MODELWhen analyzing how to best use each year’s cash flows from operations, Autoliv’s Board of Direc-tors uses the model depicted on the opposite page to identify shareholder value. The model takes important variables into account such as the marginal cost of borrowing, the return on
marginal investments and the price of Autoliv shares. When evaluating the various uses of cash, the Board of Directors weighs these decisions against the need for flexibility due to the cyclical nature of the automotive industry, acquisitions and other potential settlements.
INVESTING IN OPERATIONSTo create long-term shareholder value, cash flow from operations should only be used to finance investments in operations until the point when the return on investment no longer exceeds the cost of capital. In Autoliv’s case, our historical pre tax cost of capital has been approximately 12% before taxes. Autoliv’s return on capital employed has always exceeded this level, except during the financial crisis in 2008-2009. During the last three years, return on capital employed has varied be-tween 21% and 28%, i.e. approximately twice the level of cost of capital.
In 2013, $379 million was re-invested in the form of capital expenditures, net. This was more than 45% of the year’s operating cash flow of $838 million. It was also 33% more than depreciation and amortization due to our strong order intake and need for additional manufacturing capac-ity, primarily in Asia and other growth markets. Another reason for capital expenditures exceed-
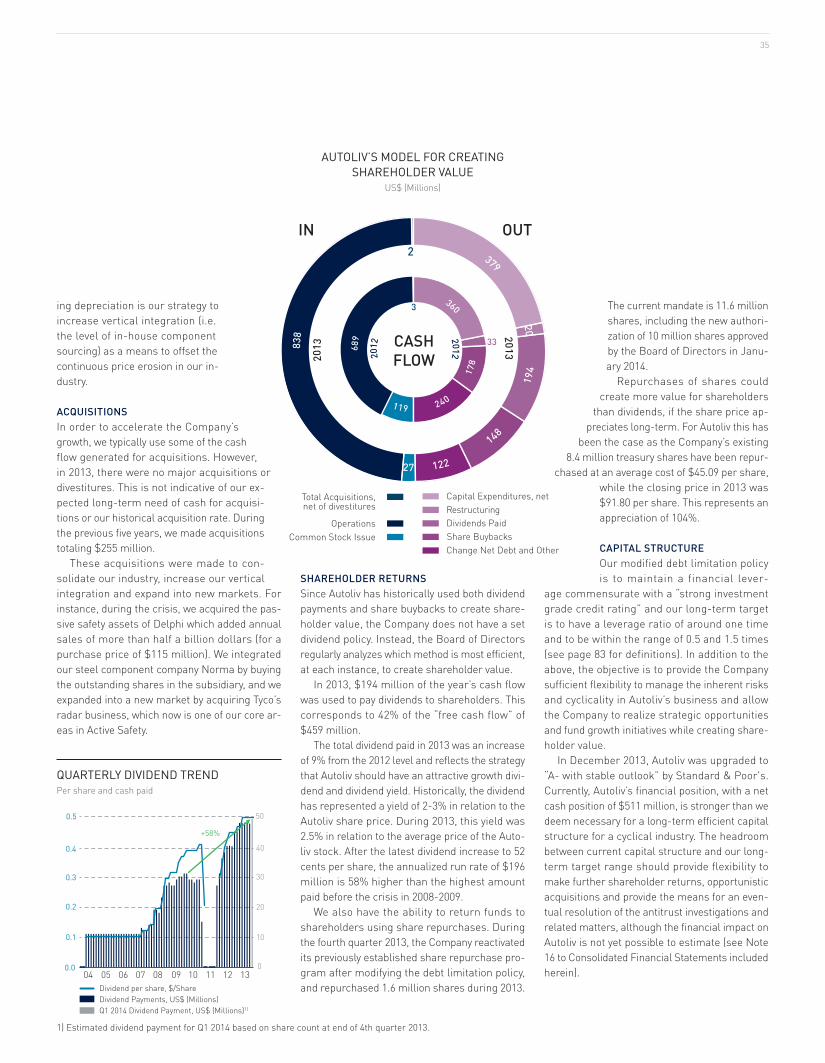
Dividend per share, $/ShareDividend Payments, US$ (Millions)
0
10
20
30
40
50
0.0
0.1
0.2
0.3
0.4
0.5
Q1 2014 Dividend Payment, US$ (Millions)1)
04 05 06 07 08 09 10 11 12 13
+58%
OperationsCommon Stock Issue
Total Acquisitions, net of divestitures
Share BuybacksChange Net Debt and Other
RestructuringDividends Paid
Capital Expenditures, net
379 20
491
841
221
72
838
2013
2
013
2012
2
012
360
871
042
911
689
IN OUT
3
2
33CASHFLOW
AUTOLIV’S MODEL FOR CREATING SHAREHOLDER VALUE
US$ (Millions)
QUARTERLY DIVIDEND TRENDPer share and cash paid
35
ing depreciation is our strategy to increase vertical integration (i.e. the level of in-house component sourcing) as a means to offset the continuous price erosion in our in-dustry.
ACQUISITIONSIn order to accelerate the Company’s growth, we typically use some of the cash flow generated for acquisitions. However, in 2013, there were no major acquisitions or divestitures. This is not indicative of our ex-pected long-term need of cash for acquisi-tions or our historical acquisition rate. During the previous five years, we made acquisitions totaling $255 million.
These acquisitions were made to con-solidate our industry, increase our vertical integration and expand into new markets. For instance, during the crisis, we acquired the pas-sive safety assets of Delphi which added annual sales of more than half a billion dollars (for a purchase price of $115 million). We integrated our steel component company Norma by buying the outstanding shares in the subsidiary, and we expanded into a new market by acquiring Tyco’s radar business, which now is one of our core ar-eas in Active Safety.
SHAREHOLDER RETURNSSince Autoliv has historically used both dividend payments and share buybacks to create share-holder value, the Company does not have a set dividend policy. Instead, the Board of Directors regularly analyzes which method is most efficient, at each instance, to create shareholder value.
In 2013, $194 million of the year’s cash flow was used to pay dividends to shareholders. This corresponds to 42% of the “free cash flow” of $459 million.
The total dividend paid in 2013 was an increase of 9% from the 2012 level and reflects the strategy that Autoliv should have an attractive growth divi-dend and dividend yield. Historically, the dividend has represented a yield of 2-3% in relation to the Autoliv share price. During 2013, this yield was 2.5% in relation to the average price of the Auto-liv stock. After the latest dividend increase to 52 cents per share, the annualized run rate of $196 million is 58% higher than the highest amount paid before the crisis in 2008-2009.
We also have the ability to return funds to shareholders using share repurchases. During the fourth quarter 2013, the Company reactivated its previously established share repurchase pro-gram after modifying the debt limitation policy, and repurchased 1.6 million shares during 2013.
The current mandate is 11.6 million shares, including the new authori-zation of 10 million shares approved by the Board of Directors in Janu-ary 2014.
Repurchases of shares could create more value for shareholders
than dividends, if the share price ap-preciates long-term. For Autoliv this has
been the case as the Company’s existing 8.4 million treasury shares have been repur-
chased at an average cost of $45.09 per share, while the closing price in 2013 was $91.80 per share. This represents an appreciation of 104%.
CAPITAL STRUCTUREOur modified debt limitation policy is to maintain a financial lever-
age commensurate with a “strong investment grade credit rating” and our long-term target is to have a leverage ratio of around one time and to be within the range of 0.5 and 1.5 times (see page 83 for definitions). In addition to the above, the objective is to provide the Company sufficient flexibility to manage the inherent risks and cyclicality in Autoliv’s business and allow the Company to realize strategic opportunities and fund growth initiatives while creating share-holder value.
In December 2013, Autoliv was upgraded to “A- with stable outlook” by Standard & Poor's. Currently, Autoliv’s financial position, with a net cash position of $511 million, is stronger than we deem necessary for a long-term efficient capital structure for a cyclical industry. The headroom between current capital structure and our long-term target range should provide flexibility to make further shareholder returns, opportunistic acquisitions and provide the means for an even-tual resolution of the antitrust investigations and related matters, although the financial impact on Autoliv is not yet possible to estimate (see Note 16 to Consolidated Financial Statements included herein).
1) Estimated dividend payment for Q1 2014 based on share count at end of 4th quarter 2013.
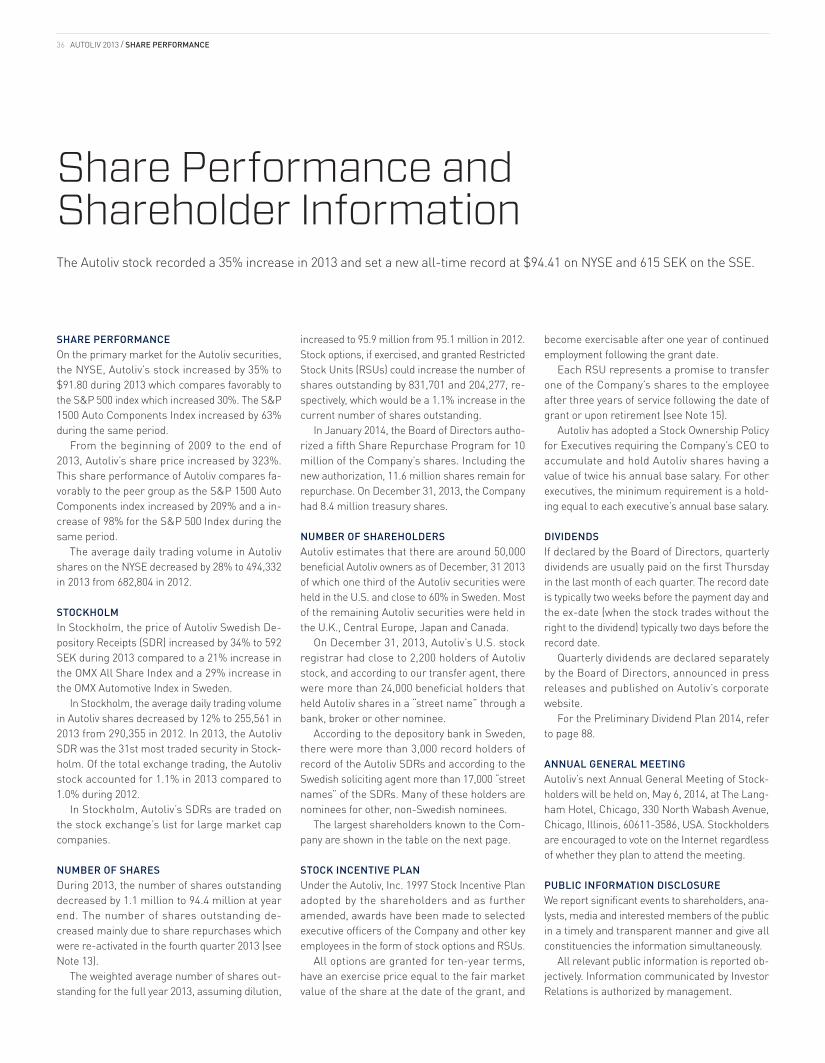
36 AUTOLIV 2013 / SHARE PERFORMANCE
Share Performance and Shareholder InformationThe Autoliv stock recorded a 35% increase in 2013 and set a new all-time record at $94.41 on NYSE and 615 SEK on the SSE.
SHARE PERFORMANCEOn the primary market for the Autoliv securities, the NYSE, Autoliv’s stock increased by 35% to $91.80 during 2013 which compares favorably to the S&P 500 index which increased 30%. The S&P 1500 Auto Components Index increased by 63% during the same period.
From the beginning of 2009 to the end of 2013, Autoliv’s share price increased by 323%. This share performance of Autoliv compares fa-vorably to the peer group as the S&P 1500 Auto Components index increased by 209% and a in-crease of 98% for the S&P 500 Index during the same period.
The average daily trading volume in Autoliv shares on the NYSE decreased by 28% to 494,332 in 2013 from 682,804 in 2012.
STOCKHOLMIn Stockholm, the price of Autoliv Swedish De-pository Receipts (SDR) increased by 34% to 592 SEK during 2013 compared to a 21% increase in the OMX All Share Index and a 29% increase in the OMX Automotive Index in Sweden.
In Stockholm, the average daily trading volume in Autoliv shares decreased by 12% to 255,561 in 2013 from 290,355 in 2012. In 2013, the Autoliv SDR was the 31st most traded security in Stock-holm. Of the total exchange trading, the Autoliv stock accounted for 1.1% in 2013 compared to 1.0% during 2012.
In Stockholm, Autoliv’s SDRs are traded on the stock exchange’s list for large market cap companies.
NUMBER OF SHARESDuring 2013, the number of shares outstanding decreased by 1.1 million to 94.4 million at year end. The number of shares outstanding de-creased mainly due to share repurchases which were re-activated in the fourth quarter 2013 (see Note 13).
The weighted average number of shares out-standing for the full year 2013, assuming dilution,
increased to 95.9 million from 95.1 million in 2012.Stock options, if exercised, and granted Restricted Stock Units (RSUs) could increase the number of shares outstanding by 831,701 and 204,277, re-spectively, which would be a 1.1% increase in the current number of shares outstanding.
In January 2014, the Board of Directors autho-rized a fifth Share Repurchase Program for 10 million of the Company’s shares. Including the new authorization, 11.6 million shares remain for repurchase. On December 31, 2013, the Company had 8.4 million treasury shares.
NUMBER OF SHAREHOLDERSAutoliv estimates that there are around 50,000 beneficial Autoliv owners as of December, 31 2013 of which one third of the Autoliv securities were held in the U.S. and close to 60% in Sweden. Most of the remaining Autoliv securities were held in the U.K., Central Europe, Japan and Canada.
On December 31, 2013, Autoliv’s U.S. stock registrar had close to 2,200 holders of Autoliv stock, and according to our transfer agent, there were more than 24,000 beneficial holders that held Autoliv shares in a “street name” through a bank, broker or other nominee.
According to the depository bank in Sweden, there were more than 3,000 record holders of record of the Autoliv SDRs and according to the Swedish soliciting agent more than 17,000 “street names” of the SDRs. Many of these holders are nominees for other, non-Swedish nominees.
The largest shareholders known to the Com-pany are shown in the table on the next page.
STOCK INCENTIVE PLANUnder the Autoliv, Inc. 1997 Stock Incentive Plan adopted by the shareholders and as further amended, awards have been made to selected executive officers of the Company and other key employees in the form of stock options and RSUs.
All options are granted for ten-year terms, have an exercise price equal to the fair market value of the share at the date of the grant, and
become exercisable after one year of continued employment following the grant date.
Each RSU represents a promise to transfer one of the Company’s shares to the employee after three years of service following the date of grant or upon retirement (see Note 15).
Autoliv has adopted a Stock Ownership Policy for Executives requiring the Company’s CEO to accumulate and hold Autoliv shares having a value of twice his annual base salary. For other executives, the minimum requirement is a hold-ing equal to each executive’s annual base salary.
DIVIDENDSIf declared by the Board of Directors, quarterly dividends are usually paid on the first Thursday in the last month of each quarter. The record date is typically two weeks before the payment day and the ex-date (when the stock trades without the right to the dividend) typically two days before the record date.
Quarterly dividends are declared separately by the Board of Directors, announced in press releases and published on Autoliv’s corporate website.
For the Preliminary Dividend Plan 2014, refer to page 88.
ANNUAL GENERAL MEETINGAutoliv’s next Annual General Meeting of Stock-holders will be held on, May 6, 2014, at The Lang-ham Hotel, Chicago, 330 North Wabash Avenue, Chicago, Illinois, 60611-3586, USA. Stockholders are encouraged to vote on the Internet regardless of whether they plan to attend the meeting.
PUBLIC INFORMATION DISCLOSUREWe report significant events to shareholders, ana-lysts, media and interested members of the public in a timely and transparent manner and give all constituencies the information simultaneously.
All relevant public information is reported ob-jectively. Information communicated by Investor Relations is authorized by management.
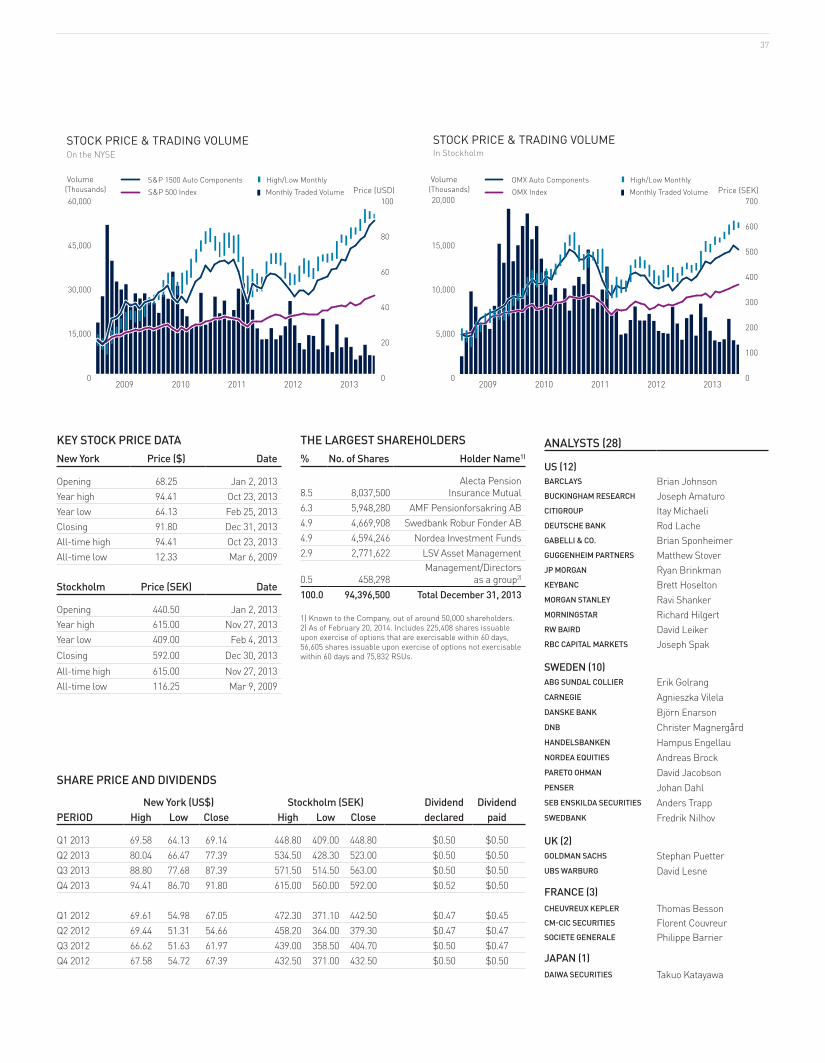
High/Low MonthlyOMX IndexOMX Auto Components
Monthly Traded VolumeVolume
Price (SEK)
In StockholmSTOCK PRICE & TRADING VOLUME
0
5,000
10,000
15,000
20,000
2009 2010 2011 2012 2013
(Thousands)
0
100
200
300
400
500
600
700
0
100
200
300
400
500
600
700
High/Low MonthlyS&P 500 IndexS&P 1500 Auto Components
Monthly Traded VolumeVolume
Price (USD)
On the NYSESTOCK PRICE & TRADING VOLUME
0
15,000
30,000
45,000
60,000
2009 2010 2011 2012 2013
(Thousands)
0
20
40
60
80
100
0
20
40
60
80
100
37
SHARE PRICE AND DIVIDENDS
New York (US$) Stockholm (SEK) Dividend DividendPERIOD High Low Close High Low Close declared paid
Q1 2013 69.58 64.13 69.14 448.80 409.00 448.80 $0.50 $0.50Q2 2013 80.04 66.47 77.39 534.50 428.30 523.00 $0.50 $0.50Q3 2013 88.80 77.68 87.39 571.50 514.50 563.00 $0.50 $0.50Q4 2013 94.41 86.70 91.80 615.00 560.00 592.00 $0.52 $0.50
Q1 2012 69.61 54.98 67.05 472.30 371.10 442.50 $0.47 $0.45Q2 2012 69.44 51.31 54.66 458.20 364.00 379.30 $0.47 $0.47Q3 2012 66.62 51.63 61.97 439.00 358.50 404.70 $0.50 $0.47Q4 2012 67.58 54.72 67.39 432.50 371.00 432.50 $0.50 $0.50
KEY STOCK PRICE DATANew York Price ($) Date
Opening 68.25 Jan 2, 2013Year high 94.41 Oct 23, 2013Year low 64.13 Feb 25, 2013Closing 91.80 Dec 31, 2013All-time high 94.41 Oct 23, 2013All-time low 12.33 Mar 6, 2009
Stockholm Price (SEK) Date
Opening 440.50 Jan 2, 2013Year high 615.00 Nov 27, 2013Year low 409.00 Feb 4, 2013Closing 592.00 Dec 30, 2013All-time high 615.00 Nov 27, 2013All-time low 116.25 Mar 9, 2009
ANALYSTS (28)
Us (12)BARCLAYS Brian JohnsonBUCKINGHAM RESEARCH Joseph AmaturoCITIGROUP Itay MichaeliDEUTSCHE BANK Rod LacheGABELLI & CO. Brian SponheimerGUGGENHEIM PARTNERS Matthew StoverJP MORGAN Ryan BrinkmanKEYBANC Brett HoseltonMORGAN STANLEY Ravi ShankerMORNINGSTAR Richard HilgertRW BAIRD David LeikerRBC CAPITAL MARKETS Joseph Spak
sweden (10)ABG SUNDAL COLLIER Erik GolrangCARNEGIE Agnieszka VilelaDANSKE BANK Björn EnarsonDNB Christer MagnergårdHANDELSBANKEN Hampus EngellauNORDEA EQUITIES Andreas BrockPARETO OHMAN David JacobsonPENSER Johan DahlSEB ENSKILDA SECURITIES Anders TrappSWEDBANK Fredrik Nilhov
Uk (2)GOLDMAN SACHS Stephan PuetterUBS WARBURG David Lesne
FRANCE (3)CHEUVREUX KEPLER Thomas BessonCM-CIC SECURITIES Florent CouvreurSOCIETE GENERALE Philippe Barrier
JAPAN (1)DAIWA SECURITIES Takuo Katayawa
THE LARGEST SHAREHOLDERS% No. of Shares Holder Name1)
8.5 8,037,500Alecta Pension
Insurance Mutual6.3 5,948,280 AMF Pensionforsakring AB4.9 4,669,908 Swedbank Robur Fonder AB4.9 4,594,246 Nordea Investment Funds2.9 2,771,622 LSV Asset Management
0.5 458,298Management/Directors
as a group2)
100.0 94,396,500 Total December 31, 2013
1) Known to the Company, out of around 50,000 shareholders. 2) As of February 20, 2014. Includes 225,408 shares issuable upon exercise of options that are exercisable within 60 days, 56,605 shares issuable upon exercise of options not exercisable within 60 days and 75,832 RSUs.
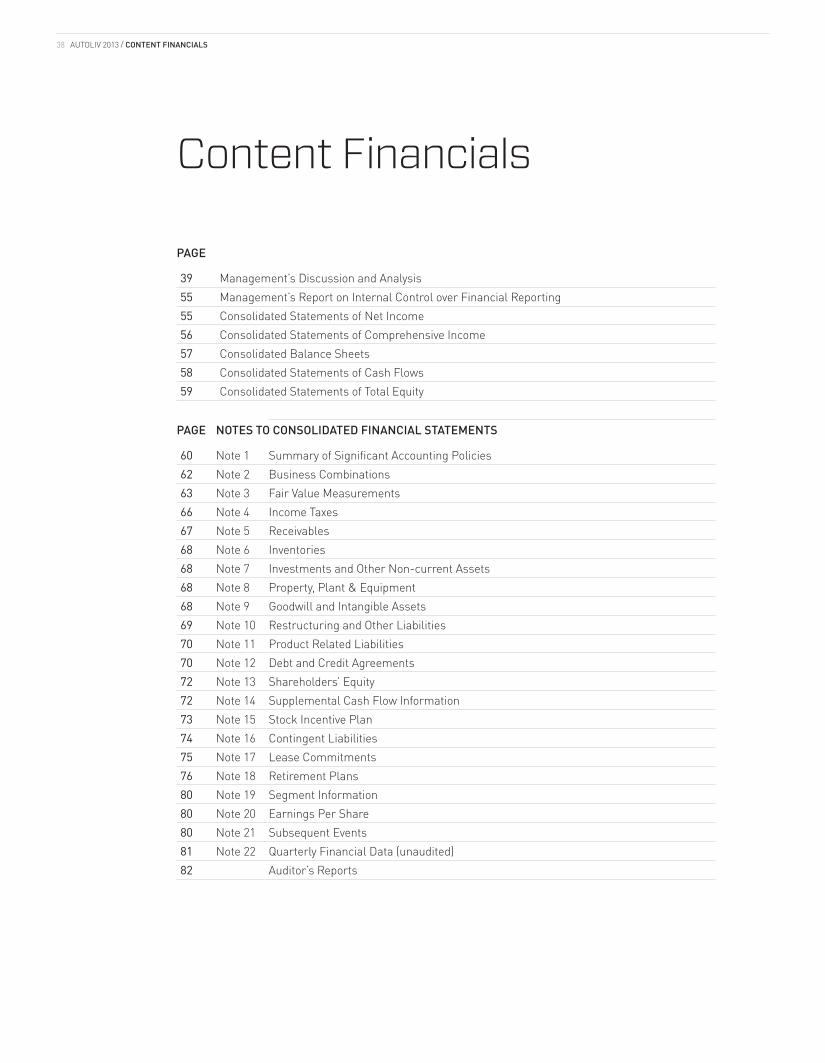
38 AUTOLIV 2013 / CONTENT FINANCIALS
Content Financials
PAGE
39 Management’s Discussion and Analysis55 Management’s Report on Internal Control over Financial Reporting55 Consolidated Statements of Net Income56 Consolidated Statements of Comprehensive Income57 Consolidated Balance Sheets58 Consolidated Statements of Cash Flows59 Consolidated Statements of Total Equity
PAGE NOTES TO CONSOLIDATED FINANCIAL STATEMENTS
60 Note 1 Summary of Significant Accounting Policies62 Note 2 Business Combinations63 Note 3 Fair Value Measurements66 Note 4 Income Taxes67 Note 5 Receivables68 Note 6 Inventories68 Note 7 Investments and Other Non-current Assets68 Note 8 Property, Plant & Equipment68 Note 9 Goodwill and Intangible Assets69 Note 10 Restructuring and Other Liabilities70 Note 11 Product Related Liabilities70 Note 12 Debt and Credit Agreements72 Note 13 Shareholders’ Equity72 Note 14 Supplemental Cash Flow Information73 Note 15 Stock Incentive Plan74 Note 16 Contingent Liabilities75 Note 17 Lease Commitments76 Note 18 Retirement Plans80 Note 19 Segment Information80 Note 20 Earnings Per Share80 Note 21 Subsequent Events81 Note 22 Quarterly Financial Data (unaudited)82 Auditor’s Reports
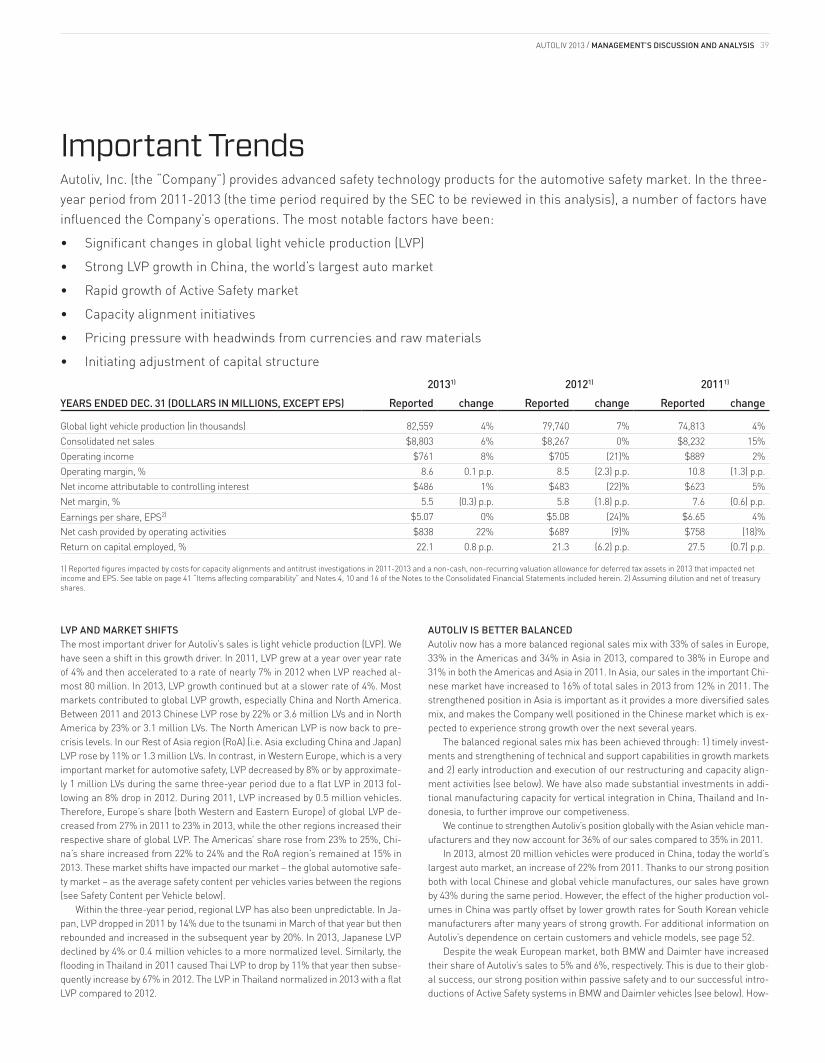
39
LVP AND MARKET SHIFTSThe most important driver for Autoliv’s sales is light vehicle production (LVP). We have seen a shift in this growth driver. In 2011, LVP grew at a year over year rate of 4% and then accelerated to a rate of nearly 7% in 2012 when LVP reached al-most 80 million. In 2013, LVP growth continued but at a slower rate of 4%. Most markets contributed to global LVP growth, especially China and North America. Between 2011 and 2013 Chinese LVP rose by 22% or 3.6 million LVs and in North America by 23% or 3.1 million LVs. The North American LVP is now back to pre-crisis levels. In our Rest of Asia region (RoA) (i.e. Asia excluding China and Japan) LVP rose by 11% or 1.3 million LVs. In contrast, in Western Europe, which is a very important market for automotive safety, LVP decreased by 8% or by approximate-ly 1 million LVs during the same three-year period due to a flat LVP in 2013 fol-lowing an 8% drop in 2012. During 2011, LVP increased by 0.5 million vehicles. Therefore, Europe’s share (both Western and Eastern Europe) of global LVP de-creased from 27% in 2011 to 23% in 2013, while the other regions increased their respective share of global LVP. The Americas’ share rose from 23% to 25%, Chi-na’s share increased from 22% to 24% and the RoA region’s remained at 15% in 2013. These market shifts have impacted our market – the global automotive safe-ty market – as the average safety content per vehicles varies between the regions (see Safety Content per Vehicle below).
Within the three-year period, regional LVP has also been unpredictable. In Ja-pan, LVP dropped in 2011 by 14% due to the tsunami in March of that year but then rebounded and increased in the subsequent year by 20%. In 2013, Japanese LVP declined by 4% or 0.4 million vehicles to a more normalized level. Similarly, the flooding in Thailand in 2011 caused Thai LVP to drop by 11% that year then subse-quently increase by 67% in 2012. The LVP in Thailand normalized in 2013 with a flat LVP compared to 2012.
AUTOLIV IS BETTER BALANCED Autoliv now has a more balanced regional sales mix with 33% of sales in Europe, 33% in the Americas and 34% in Asia in 2013, compared to 38% in Europe and 31% in both the Americas and Asia in 2011. In Asia, our sales in the important Chi-nese market have increased to 16% of total sales in 2013 from 12% in 2011. The strengthened position in Asia is important as it provides a more diversified sales mix, and makes the Company well positioned in the Chinese market which is ex-pected to experience strong growth over the next several years.
The balanced regional sales mix has been achieved through: 1) timely invest-ments and strengthening of technical and support capabilities in growth markets and 2) early introduction and execution of our restructuring and capacity align-ment activities (see below). We have also made substantial investments in addi-tional manufacturing capacity for vertical integration in China, Thailand and In-donesia, to further improve our competiveness.
We continue to strengthen Autoliv’s position globally with the Asian vehicle man-ufacturers and they now account for 36% of our sales compared to 35% in 2011.
In 2013, almost 20 million vehicles were produced in China, today the world’s largest auto market, an increase of 22% from 2011. Thanks to our strong position both with local Chinese and global vehicle manufactures, our sales have grown by 43% during the same period. However, the effect of the higher production vol-umes in China was partly offset by lower growth rates for South Korean vehicle manufacturers after many years of strong growth. For additional information on Autoliv’s dependence on certain customers and vehicle models, see page 52.
Despite the weak European market, both BMW and Daimler have increased their share of Autoliv’s sales to 5% and 6%, respectively. This is due to their glob-al success, our strong position within passive safety and to our successful intro-ductions of Active Safety systems in BMW and Daimler vehicles (see below). How-
Important TrendsAutoliv, Inc. (the “Company”) provides advanced safety technology products for the automotive safety market. In the three-year period from 2011-2013 (the time period required by the SEC to be reviewed in this analysis), a number of factors have influenced the Company’s operations. The most notable factors have been:
• Significant changes in global light vehicle production (LVP)
• Strong LVP growth in China, the world’s largest auto market
• Rapid growth of Active Safety market
• Capacity alignment initiatives
• Pricing pressure with headwinds from currencies and raw materials
• Initiating adjustment of capital structure 20131) 20121) 20111)
YEARS ENDED DEC. 31 (DOLLARS IN MILLIONS, EXCEPT EPS) Reported change Reported change Reported change
Global light vehicle production (in thousands) 82,559 4% 79,740 7% 74,813 4%Consolidated net sales $8,803 6% $8,267 0% $8,232 15%Operating income $761 8% $705 (21)% $889 2%Operating margin, % 8.6 0.1 p.p. 8.5 (2.3) p.p. 10.8 (1.3) p.p.Net income attributable to controlling interest $486 1% $483 (22)% $623 5%Net margin, % 5.5 (0.3) p.p. 5.8 (1.8) p.p. 7.6 (0.6) p.p.Earnings per share, EPS2) $5.07 0% $5.08 (24)% $6.65 4%Net cash provided by operating activities $838 22% $689 (9)% $758 (18)%Return on capital employed, % 22.1 0.8 p.p. 21.3 (6.2) p.p. 27.5 (0.7) p.p.
1) Reported figures impacted by costs for capacity alignments and antitrust investigations in 2011-2013 and a non-cash, non-recurring valuation allowance for deferred tax assets in 2013 that impacted net income and EPS. See table on page 41 “Items affecting comparability” and Notes 4, 10 and 16 of the Notes to the Consolidated Financial Statements included herein. 2) Assuming dilution and net of treasury shares.
AUTOLIV 2013 / MANAGEMENT’S DISCUSSION AND ANALYSIS
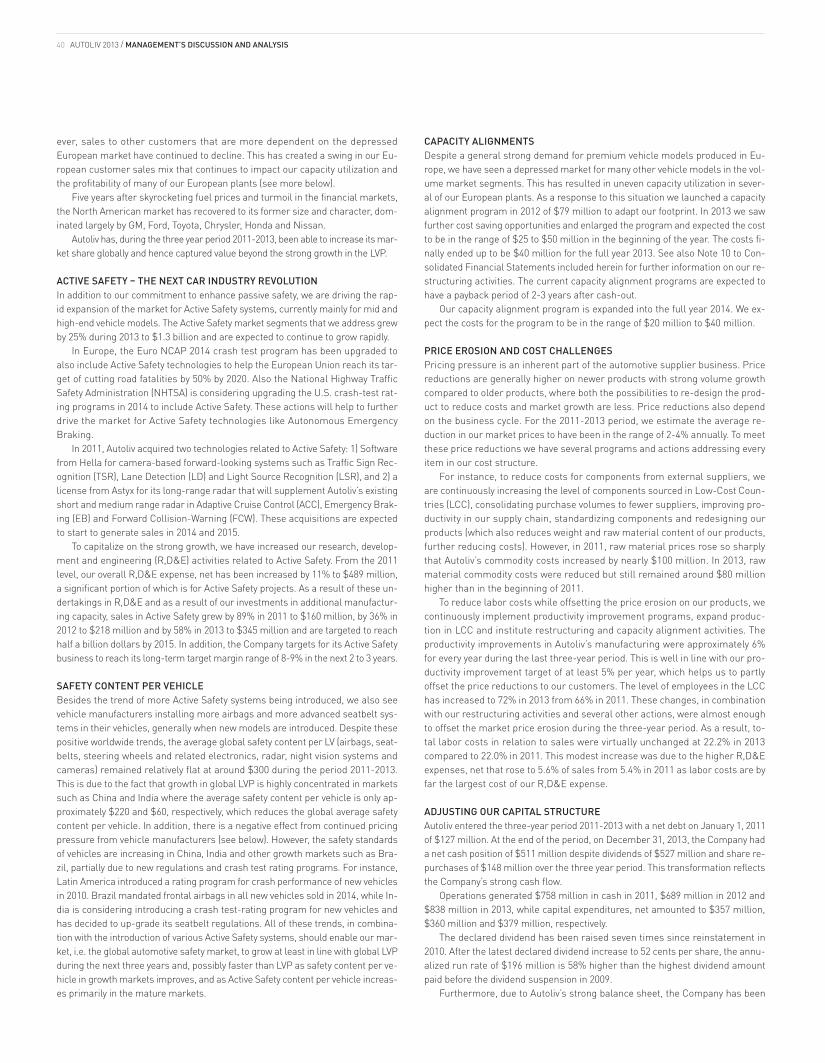
AUTOLIV 2013 / MANAGEMENT’S DISCUSSION AND ANALYSIS40
ever, sales to other customers that are more dependent on the depressed European market have continued to decline. This has created a swing in our Eu-ropean customer sales mix that continues to impact our capacity utilization and the profitability of many of our European plants (see more below).
Five years after skyrocketing fuel prices and turmoil in the financial markets, the North American market has recovered to its former size and character, dom-inated largely by GM, Ford, Toyota, Chrysler, Honda and Nissan.
Autoliv has, during the three year period 2011-2013, been able to increase its mar-ket share globally and hence captured value beyond the strong growth in the LVP.
ACTIVE SAFETY – THE NEXT CAR INDUSTRY REVOLUTION In addition to our commitment to enhance passive safety, we are driving the rap-id expansion of the market for Active Safety systems, currently mainly for mid and high-end vehicle models. The Active Safety market segments that we address grew by 25% during 2013 to $1.3 billion and are expected to continue to grow rapidly.
In Europe, the Euro NCAP 2014 crash test program has been upgraded to also include Active Safety technologies to help the European Union reach its tar-get of cutting road fatalities by 50% by 2020. Also the National Highway Traffic Safety Administration (NHTSA) is considering upgrading the U.S. crash-test rat-ing programs in 2014 to include Active Safety. These actions will help to further drive the market for Active Safety technologies like Autonomous Emergency Braking.
In 2011, Autoliv acquired two technologies related to Active Safety: 1) Software from Hella for camera-based forward-looking systems such as Traffic Sign Rec-ognition (TSR), Lane Detection (LD) and Light Source Recognition (LSR), and 2) a license from Astyx for its long-range radar that will supplement Autoliv’s existing short and medium range radar in Adaptive Cruise Control (ACC), Emergency Brak-ing (EB) and Forward Collision-Warning (FCW). These acquisitions are expected to start to generate sales in 2014 and 2015.
To capitalize on the strong growth, we have increased our research, develop-ment and engineering (R,D&E) activities related to Active Safety. From the 2011 level, our overall R,D&E expense, net has been increased by 11% to $489 million, a significant portion of which is for Active Safety projects. As a result of these un-dertakings in R,D&E and as a result of our investments in additional manufactur-ing capacity, sales in Active Safety grew by 89% in 2011 to $160 million, by 36% in 2012 to $218 million and by 58% in 2013 to $345 million and are targeted to reach half a billion dollars by 2015. In addition, the Company targets for its Active Safety business to reach its long-term target margin range of 8-9% in the next 2 to 3 years.
SAFETY CONTENT PER VEHICLE Besides the trend of more Active Safety systems being introduced, we also see vehicle manufacturers installing more airbags and more advanced seatbelt sys-tems in their vehicles, generally when new models are introduced. Despite these positive worldwide trends, the average global safety content per LV (airbags, seat-belts, steering wheels and related electronics, radar, night vision systems and cameras) remained relatively flat at around $300 during the period 2011-2013. This is due to the fact that growth in global LVP is highly concentrated in markets such as China and India where the average safety content per vehicle is only ap-proximately $220 and $60, respectively, which reduces the global average safety content per vehicle. In addition, there is a negative effect from continued pricing pressure from vehicle manufacturers (see below). However, the safety standards of vehicles are increasing in China, India and other growth markets such as Bra-zil, partially due to new regulations and crash test rating programs. For instance, Latin America introduced a rating program for crash performance of new vehicles in 2010. Brazil mandated frontal airbags in all new vehicles sold in 2014, while In-dia is considering introducing a crash test-rating program for new vehicles and has decided to up-grade its seatbelt regulations. All of these trends, in combina-tion with the introduction of various Active Safety systems, should enable our mar-ket, i.e. the global automotive safety market, to grow at least in line with global LVP during the next three years and, possibly faster than LVP as safety content per ve-hicle in growth markets improves, and as Active Safety content per vehicle increas-es primarily in the mature markets.
CAPACITY ALIGNMENTS Despite a general strong demand for premium vehicle models produced in Eu-rope, we have seen a depressed market for many other vehicle models in the vol-ume market segments. This has resulted in uneven capacity utilization in sever-al of our European plants. As a response to this situation we launched a capacity alignment program in 2012 of $79 million to adapt our footprint. In 2013 we saw further cost saving opportunities and enlarged the program and expected the cost to be in the range of $25 to $50 million in the beginning of the year. The costs fi-nally ended up to be $40 million for the full year 2013. See also Note 10 to Con-solidated Financial Statements included herein for further information on our re-structuring activities. The current capacity alignment programs are expected to have a payback period of 2-3 years after cash-out.
Our capacity alignment program is expanded into the full year 2014. We ex-pect the costs for the program to be in the range of $20 million to $40 million.
PRICE EROSION AND COST CHALLENGES Pricing pressure is an inherent part of the automotive supplier business. Price reductions are generally higher on newer products with strong volume growth compared to older products, where both the possibilities to re-design the prod-uct to reduce costs and market growth are less. Price reductions also depend on the business cycle. For the 2011-2013 period, we estimate the average re-duction in our market prices to have been in the range of 2-4% annually. To meet these price reductions we have several programs and actions addressing every item in our cost structure.
For instance, to reduce costs for components from external suppliers, we are continuously increasing the level of components sourced in Low-Cost Coun-tries (LCC), consolidating purchase volumes to fewer suppliers, improving pro-ductivity in our supply chain, standardizing components and redesigning our products (which also reduces weight and raw material content of our products, further reducing costs). However, in 2011, raw material prices rose so sharply that Autoliv’s commodity costs increased by nearly $100 million. In 2013, raw material commodity costs were reduced but still remained around $80 million higher than in the beginning of 2011.
To reduce labor costs while offsetting the price erosion on our products, we continuously implement productivity improvement programs, expand produc-tion in LCC and institute restructuring and capacity alignment activities. The productivity improvements in Autoliv’s manufacturing were approximately 6% for every year during the last three-year period. This is well in line with our pro-ductivity improvement target of at least 5% per year, which helps us to partly offset the price reductions to our customers. The level of employees in the LCC has increased to 72% in 2013 from 66% in 2011. These changes, in combination with our restructuring activities and several other actions, were almost enough to offset the market price erosion during the three-year period. As a result, to-tal labor costs in relation to sales were virtually unchanged at 22.2% in 2013 compared to 22.0% in 2011. This modest increase was due to the higher R,D&E expenses, net that rose to 5.6% of sales from 5.4% in 2011 as labor costs are by far the largest cost of our R,D&E expense.
ADJUSTING OUR CAPITAL STRUCTUREAutoliv entered the three-year period 2011-2013 with a net debt on January 1, 2011 of $127 million. At the end of the period, on December 31, 2013, the Company had a net cash position of $511 million despite dividends of $527 million and share re-purchases of $148 million over the three year period. This transformation reflects the Company’s strong cash flow.
Operations generated $758 million in cash in 2011, $689 million in 2012 and $838 million in 2013, while capital expenditures, net amounted to $357 million, $360 million and $379 million, respectively.
The declared dividend has been raised seven times since reinstatement in 2010. After the latest declared dividend increase to 52 cents per share, the annu-alized run rate of $196 million is 58% higher than the highest dividend amount paid before the dividend suspension in 2009.
Furthermore, due to Autoliv’s strong balance sheet, the Company has been
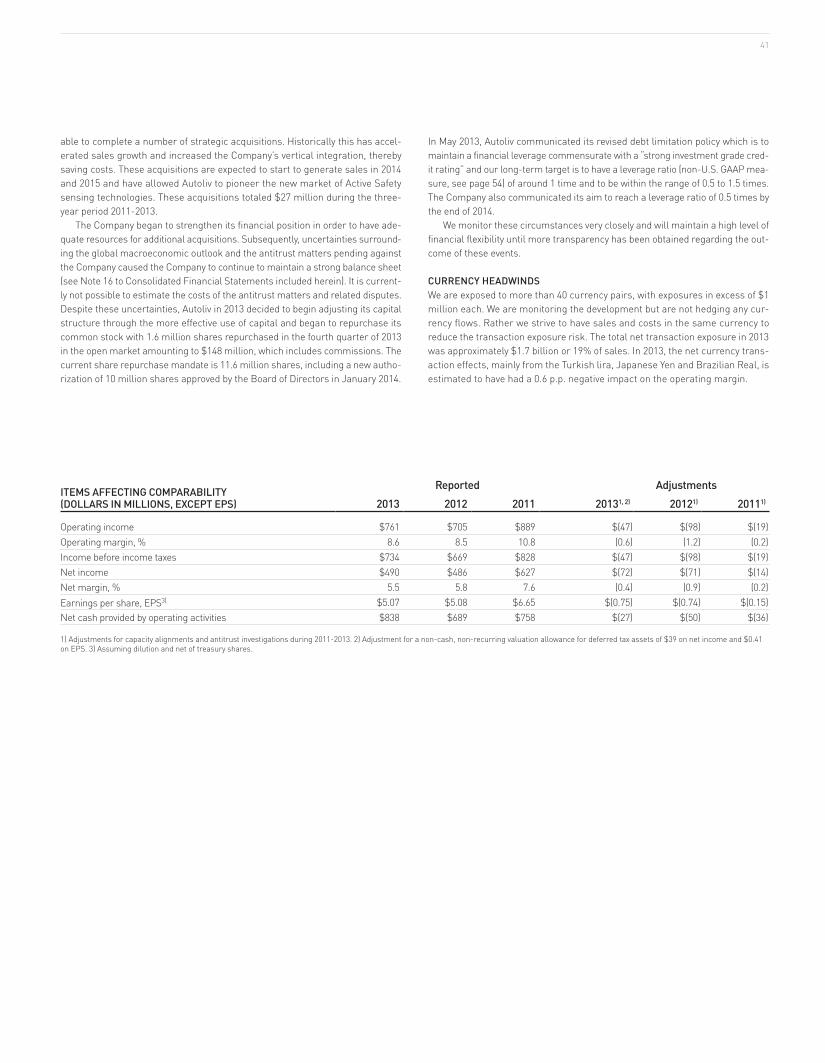
41
able to complete a number of strategic acquisitions. Historically this has accel-erated sales growth and increased the Company’s vertical integration, thereby saving costs. These acquisitions are expected to start to generate sales in 2014 and 2015 and have allowed Autoliv to pioneer the new market of Active Safety sensing technologies. These acquisitions totaled $27 million during the three-year period 2011-2013.
The Company began to strengthen its financial position in order to have ade-quate resources for additional acquisitions. Subsequently, uncertainties surround-ing the global macroeconomic outlook and the antitrust matters pending against the Company caused the Company to continue to maintain a strong balance sheet (see Note 16 to Consolidated Financial Statements included herein). It is current-ly not possible to estimate the costs of the antitrust matters and related disputes. Despite these uncertainties, Autoliv in 2013 decided to begin adjusting its capital structure through the more effective use of capital and began to repurchase its common stock with 1.6 million shares repurchased in the fourth quarter of 2013 in the open market amounting to $148 million, which includes commissions. The current share repurchase mandate is 11.6 million shares, including a new autho-rization of 10 million shares approved by the Board of Directors in January 2014.
In May 2013, Autoliv communicated its revised debt limitation policy which is to maintain a financial leverage commensurate with a “strong investment grade cred-it rating” and our long-term target is to have a leverage ratio (non-U.S. GAAP mea-sure, see page 54) of around 1 time and to be within the range of 0.5 to 1.5 times. The Company also communicated its aim to reach a leverage ratio of 0.5 times by the end of 2014.
We monitor these circumstances very closely and will maintain a high level of financial flexibility until more transparency has been obtained regarding the out-come of these events.
CURRENCY HEADWINDSWe are exposed to more than 40 currency pairs, with exposures in excess of $1 million each. We are monitoring the development but are not hedging any cur-rency flows. Rather we strive to have sales and costs in the same currency to reduce the transaction exposure risk. The total net transaction exposure in 2013 was approximately $1.7 billion or 19% of sales. In 2013, the net currency trans-action effects, mainly from the Turkish lira, Japanese Yen and Brazilian Real, is estimated to have had a 0.6 p.p. negative impact on the operating margin.
ITEMS AFFECTING COMPARABILITY (DOLLARS IN MILLIONS, EXCEPT EPS)
Reported Adjustments2013 2012 2011 20131, 2) 20121) 20111)
Operating income $761 $705 $889 $(47) $(98) $(19)Operating margin, % 8.6 8.5 10.8 (0.6) (1.2) (0.2) Income before income taxes $734 $669 $828 $(47) $(98) $(19)Net income $490 $486 $627 $(72) $(71) $(14)Net margin, % 5.5 5.8 7.6 (0.4) (0.9) (0.2) Earnings per share, EPS3) $5.07 $5.08 $6.65 $(0.75) $(0.74) $(0.15)Net cash provided by operating activities $838 $689 $758 $(27) $(50) $(36)
1) Adjustments for capacity alignments and antitrust investigations during 2011-2013. 2) Adjustment for a non-cash, non-recurring valuation allowance for deferred tax assets of $39 on net income and $0.41 on EPS. 3) Assuming dilution and net of treasury shares.
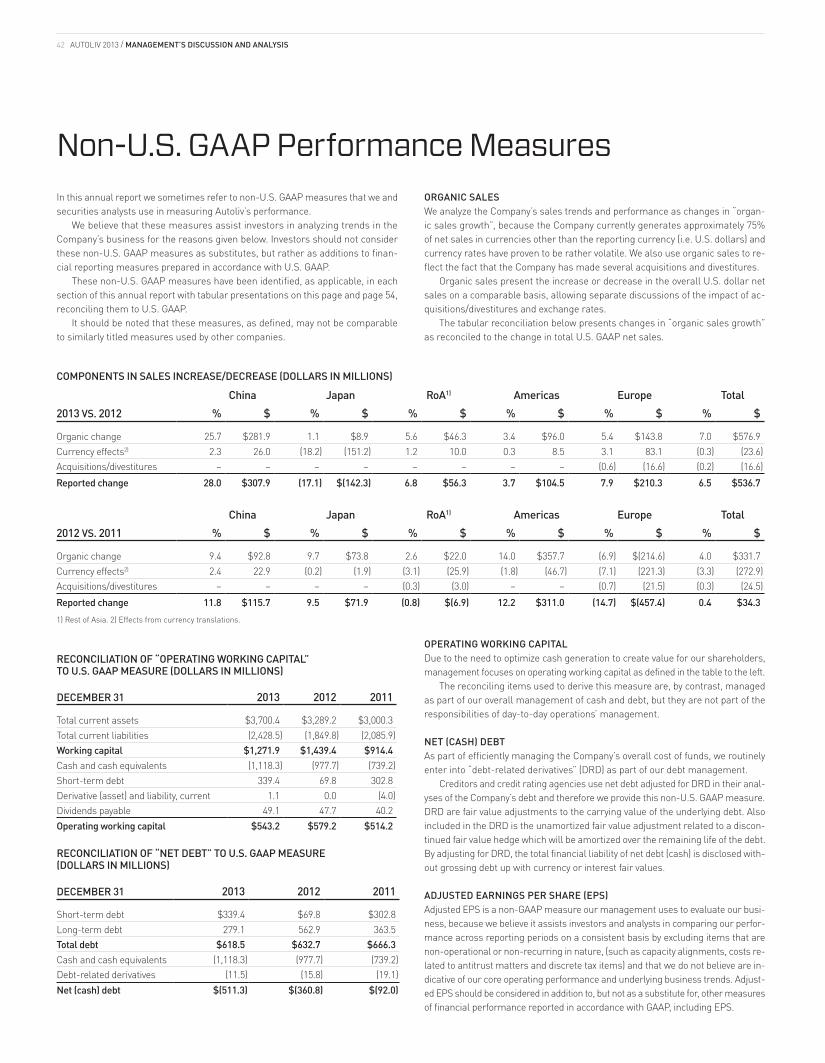
AUTOLIV 2013 / MANAGEMENT’S DISCUSSION AND ANALYSIS42
In this annual report we sometimes refer to non-U.S. GAAP measures that we and securities analysts use in measuring Autoliv’s performance.
We believe that these measures assist investors in analyzing trends in the Company’s business for the reasons given below. Investors should not consider these non-U.S. GAAP measures as substitutes, but rather as additions to finan-cial reporting measures prepared in accordance with U.S. GAAP.
These non-U.S. GAAP measures have been identified, as applicable, in each section of this annual report with tabular presentations on this page and page 54, reconciling them to U.S. GAAP.
It should be noted that these measures, as defined, may not be comparable to similarly titled measures used by other companies.
ORGANIC SALESWe analyze the Company’s sales trends and performance as changes in “organ-ic sales growth”, because the Company currently generates approximately 75% of net sales in currencies other than the reporting currency (i.e. U.S. dollars) and currency rates have proven to be rather volatile. We also use organic sales to re-flect the fact that the Company has made several acquisitions and divestitures.
Organic sales present the increase or decrease in the overall U.S. dollar net sales on a comparable basis, allowing separate discussions of the impact of ac-quisitions/divestitures and exchange rates.
The tabular reconciliation below presents changes in “organic sales growth” as reconciled to the change in total U.S. GAAP net sales.
COMPONENTS IN SALES INCREASE/DECREASE (DOLLARS IN MILLIONS)
China Japan RoA1) Americas Europe Total2013 VS. 2012 % $ % $ % $ % $ % $ % $
Organic change 25.7 $281.9 1.1 $8.9 5.6 $46.3 3.4 $96.0 5.4 $143.8 7.0 $576.9Currency effects2) 2.3 26.0 (18.2) (151.2) 1.2 10.0 0.3 8.5 3.1 83.1 (0.3) (23.6)Acquisitions/divestitures – – – – – – – – (0.6) (16.6) (0.2) (16.6)Reported change 28.0 $307.9 (17.1) $(142.3) 6.8 $56.3 3.7 $104.5 7.9 $210.3 6.5 $536.7
China Japan RoA1) Americas Europe Total
2012 VS. 2011 % $ % $ % $ % $ % $ % $
Organic change 9.4 $92.8 9.7 $73.8 2.6 $22.0 14.0 $357.7 (6.9) $(214.6) 4.0 $331.7Currency effects2) 2.4 22.9 (0.2) (1.9) (3.1) (25.9) (1.8) (46.7) (7.1) (221.3) (3.3) (272.9)Acquisitions/divestitures – – – – (0.3) (3.0) – – (0.7) (21.5) (0.3) (24.5)Reported change 11.8 $115.7 9.5 $71.9 (0.8) $(6.9) 12.2 $311.0 (14.7) $(457.4) 0.4 $34.31) Rest of Asia. 2) Effects from currency translations.
RECONCILIATION OF “OPERATING WORKING CAPITAL” TO U.S. GAAP MEASURE (DOLLARS IN MILLIONS)
DECEMBER 31 2013 2012 2011
Total current assets $3,700.4 $3,289.2 $3,000.3Total current liabilities (2,428.5) (1,849.8) (2,085.9)Working capital $1,271.9 $1,439.4 $914.4Cash and cash equivalents (1,118.3) (977.7) (739.2)Short-term debt 339.4 69.8 302.8Derivative (asset) and liability, current 1.1 0.0 (4.0)Dividends payable 49.1 47.7 40.2Operating working capital $543.2 $579.2 $514.2
RECONCILIATION OF “NET DEBT” TO U.S. GAAP MEASURE (DOLLARS IN MILLIONS)
DECEMBER 31 2013 2012 2011
Short-term debt $339.4 $69.8 $302.8Long-term debt 279.1 562.9 363.5Total debt $618.5 $632.7 $666.3Cash and cash equivalents (1,118.3) (977.7) (739.2)Debt-related derivatives (11.5) (15.8) (19.1)Net (cash) debt $(511.3) $(360.8) $(92.0)
OPERATING WORKING CAPITALDue to the need to optimize cash generation to create value for our shareholders, management focuses on operating working capital as defined in the table to the left.
The reconciling items used to derive this measure are, by contrast, managed as part of our overall management of cash and debt, but they are not part of the responsibilities of day-to-day operations’ management.
NET (CASH) DEBTAs part of efficiently managing the Company’s overall cost of funds, we routinely enter into “debt-related derivatives” (DRD) as part of our debt management.
Creditors and credit rating agencies use net debt adjusted for DRD in their anal-yses of the Company’s debt and therefore we provide this non-U.S. GAAP measure. DRD are fair value adjustments to the carrying value of the underlying debt. Also included in the DRD is the unamortized fair value adjustment related to a discon-tinued fair value hedge which will be amortized over the remaining life of the debt. By adjusting for DRD, the total financial liability of net debt (cash) is disclosed with-out grossing debt up with currency or interest fair values.
ADJUSTED EARNINGS PER SHARE (EPS)Adjusted EPS is a non-GAAP measure our management uses to evaluate our busi-ness, because we believe it assists investors and analysts in comparing our perfor-mance across reporting periods on a consistent basis by excluding items that are non-operational or non-recurring in nature, (such as capacity alignments, costs re-lated to antitrust matters and discrete tax items) and that we do not believe are in-dicative of our core operating performance and underlying business trends. Adjust-ed EPS should be considered in addition to, but not as a substitute for, other measures of financial performance reported in accordance with GAAP, including EPS.
Non-U.S. GAAP Performance Measures
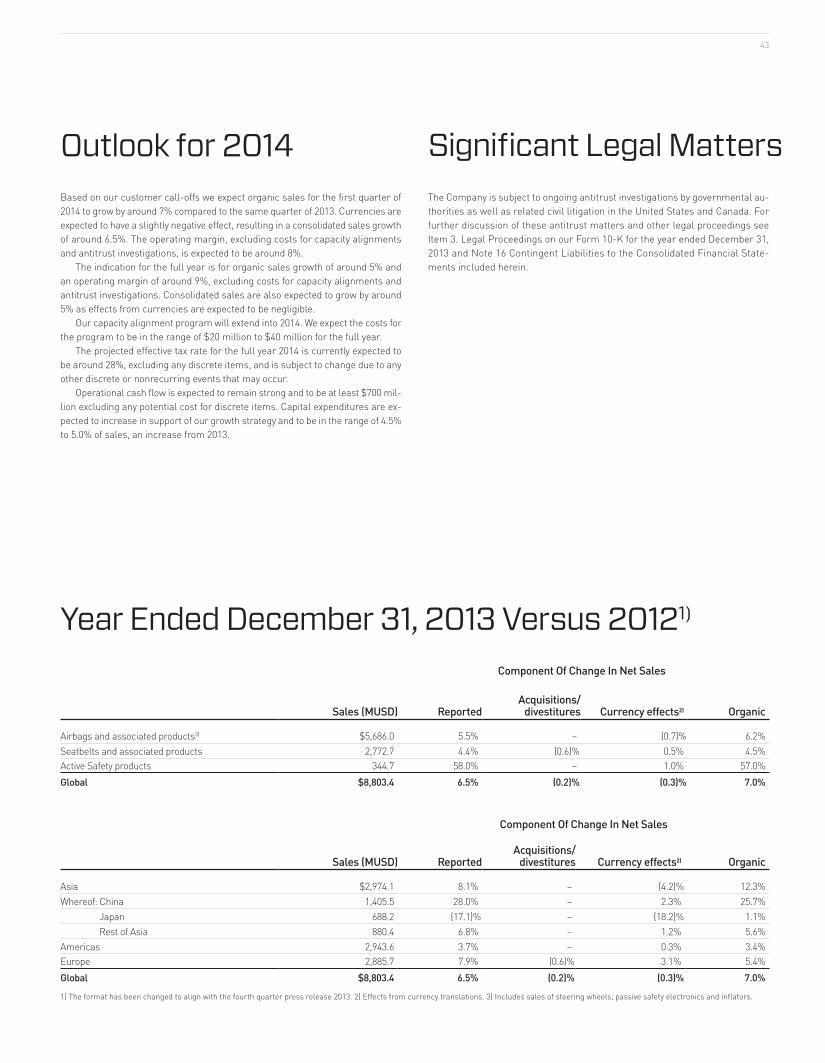
43
The Company is subject to ongoing antitrust investigations by governmental au-thorities as well as related civil litigation in the United States and Canada. For further discussion of these antitrust matters and other legal proceedings see Item 3. Legal Proceedings on our Form 10-K for the year ended December 31, 2013 and Note 16 Contingent Liabilities to the Consolidated Financial State-ments included herein.
Significant Legal Matters
Component Of Change In Net Sales
Sales (MUSD) ReportedAcquisitions/
divestitures Currency effects2) Organic
Airbags and associated products3) $5,686.0 5.5% – (0.7)% 6.2%Seatbelts and associated products 2,772.7 4.4% (0.6)% 0.5% 4.5%Active Safety products 344.7 58.0% – 1.0% 57.0%Global $8,803.4 6.5% (0.2)% (0.3)% 7.0%
Component Of Change In Net Sales
Sales (MUSD) ReportedAcquisitions/
divestitures Currency effects2) Organic
Asia $2,974.1 8.1% – (4.2)% 12.3%Whereof: China 1,405.5 28.0% – 2.3% 25.7% Japan 688.2 (17.1)% – (18.2)% 1.1% Rest of Asia 880.4 6.8% – 1.2% 5.6%Americas 2,943.6 3.7% – 0.3% 3.4%Europe 2,885.7 7.9% (0.6)% 3.1% 5.4%Global $8,803.4 6.5% (0.2)% (0.3)% 7.0%
1) The format has been changed to align with the fourth quarter press release 2013. 2) Effects from currency translations. 3) Includes sales of steering wheels, passive safety electronics and inflators.
Year Ended December 31, 2013 Versus 20121)
Outlook for 2014Based on our customer call-offs we expect organic sales for the first quarter of 2014 to grow by around 7% compared to the same quarter of 2013. Currencies are expected to have a slightly negative effect, resulting in a consolidated sales growth of around 6.5%. The operating margin, excluding costs for capacity alignments and antitrust investigations, is expected to be around 8%.
The indication for the full year is for organic sales growth of around 5% and an operating margin of around 9%, excluding costs for capacity alignments and antitrust investigations. Consolidated sales are also expected to grow by around 5% as effects from currencies are expected to be negligible.
Our capacity alignment program will extend into 2014. We expect the costs for the program to be in the range of $20 million to $40 million for the full year.
The projected effective tax rate for the full year 2014 is currently expected to be around 28%, excluding any discrete items, and is subject to change due to any other discrete or nonrecurring events that may occur.
Operational cash flow is expected to remain strong and to be at least $700 mil-lion excluding any potential cost for discrete items. Capital expenditures are ex-pected to increase in support of our growth strategy and to be in the range of 4.5% to 5.0% of sales, an increase from 2013.
AUTOLIV 2013 / MANAGEMENT’S DISCUSSION AND ANALYSIS44
NET SALES Consolidated sales increased to $8,803 million from $8,267 million in 2012. Ex-cluding the effect from a 2012 divestiture and currencies, the organic sales growth (non-U.S. GAAP measure, see page 42) was 7%, which compares favor-ably to the growth of “more than 5%”, expected at the beginning of the fourth quarter 2013. All areas of the Company showed sales growth for the full year, with sales in China and of Active Safety products as the two individually most significant contributors. Together these two areas represented 70% of Autoliv’s organic sales growth in 2013.
Sales of airbag products (including steering wheels and passive safety elec-tronics) were favorably impacted by higher volumes of steering wheels, knee air-bags, pedestrian protection airbags and passive safety electronics.
Sales of seatbelt products were particularly strong in China and South Amer-ica. The reported sales were negatively affected by 0.6% from the divestiture of Autoliv Mekan AB in 2012. Additionally, the global trend towards more advanced and higher value-added seatbelt systems continued globally.
The strong increase in sales of Active Safety products (automotive radars, night vision systems and cameras with driver assist systems) resulted from growth in all areas of this business. Sales of radar related products were particularly strong, largely as a result of Mercedes’ decision to introduce CPA across most of its platforms. Sales of vision systems to BMW and night vision to Mercedes also contributed to the growth.
For the full year 2013, sales in Asia (China, Japan, RoA) represent 34% of to-tal sales, the Americas 33% and Europe 33%. Sales continue to be balanced across the regions and 2013 marks the first time for Asia as the largest region in terms of sales. The main growth drivers in 2013 were China and Active Safety, which combined represented 70% of the organic sales growth.
Sales from Autoliv’s companies in China grew rapidly with both Chinese and global OEMs. A number of models contributed, most importantly Great Wall’s M4 and Haval’s H6, Wuling’s Hongguang, Geely’s Emgrand, Jianghuai’s Refine S5, Nissan’s Teana and Sylphy, Ford’s Kuga and Focus and Hyundai’s Santa Fe.
Sales from Autoliv’s companies in Japan had slight organic growth despite de-clining LVP, with sales of high content export vehicles increasing during the year.
Sales from Autoliv’s companies in the RoA grew primarily through strong sales growth in Thailand, with Mitsubishi’s Mirage, and in South Korea as a result of a favorable model mix with KIA.
Sales from Autoliv’s companies in the Americas were positively impacted by increases in a number of models from Ford, such as the Fusion, and Nissan’s Pathfinder and Altima.
Sales from Autoliv’s companies in Europe were driven by sales to Mercedes through its roll out of CPA across most platforms and high sales for the E- and S-Class models. Increasing market share and strong growth for premium brands such as BMW’s 3-series and Land Rover’s Range Rover models contributed to the increased sales in Europe.
GROSS PROFITGross profit increased by $58 million, primarily as a result of the higher sales. Gross margin declined by 0.5 p.p. compared to 2012 mainly as a result of a com-bination of operational inefficiencies in Europe and Brazil, as well as adverse cur-rency effects, primarily from the Japanese Yen, Turkish Lira and Brazilian Real. Lower raw material costs had a positive impact.
OPERATING INCOMEOperating income increased by $56 million to $761 million and the operating mar-gin by 0.1 p.p. to 8.6%. R,D&E net, was $34 million higher due to costs for growth and high engineering costs in Active Safety. The increase was partly offset by high-er engineering income.
Costs for capacity alignments and antitrust investigations had a negative im-pact on the operating margin by 0.6 p.p. in 2013 compared to 1.2 p.p. in 2012 (see Note 16 to Consolidated Financial Statements included herein).
INTEREST EXPENSE, NETInterest expense, net decreased by $9 million to $29 million compared to 2012. The decrease relates primarily to the $110 million US Private Placement note that matured in November 2012 and also to the remarketing in March 2012 of our se-nior notes due in 2014 (see Note 12 to Consolidated Financial Statements includ-ed herein). In addition, during 2013, Autoliv had a net cash position of $437 mil-lion on average, compared to $214 million on average in 2012 (see Treasury Activities on page 48).
INCOME TAXESIncome before taxes increased by $65 million to $734 million, $9 million more than the increase in operating income, mainly due to lower interest expense, net. Income tax expense was $244 million compared to $183 million in 2012. In 2013, discrete tax items, net of $33 million increased the rate by 4.5 p.p. The effective tax rate was 33.2% compared to 27.4% for 2012 when discrete tax items net, re-duced the rate by 0.6 p.p. See Note 4 to Consolidated Financial Statements in-cluded herein.
NET INCOME AND EARNINGS PER SHARENet income attributable to controlling interest amounted to $486 million com-pared to $483 million in 2012.
EPS amounted to $5.07 assuming dilution compared to $5.08 for 2012. EPS assuming dilution was negatively affected by an increase in the valuation allow-ance related to deferred tax assets of $39 million or $0.41 per share. This non-cash, non-recurring allowance is related to the inefficiencies in Europe and ca-pacity alignment due to depressed volumes in the region. These effects were partly offset by the positive effect from lower capacity alignment costs.
The weighted average number of shares outstanding assuming dilution in-creased to 95.9 million compared to 95.1 million for the full year 2012.
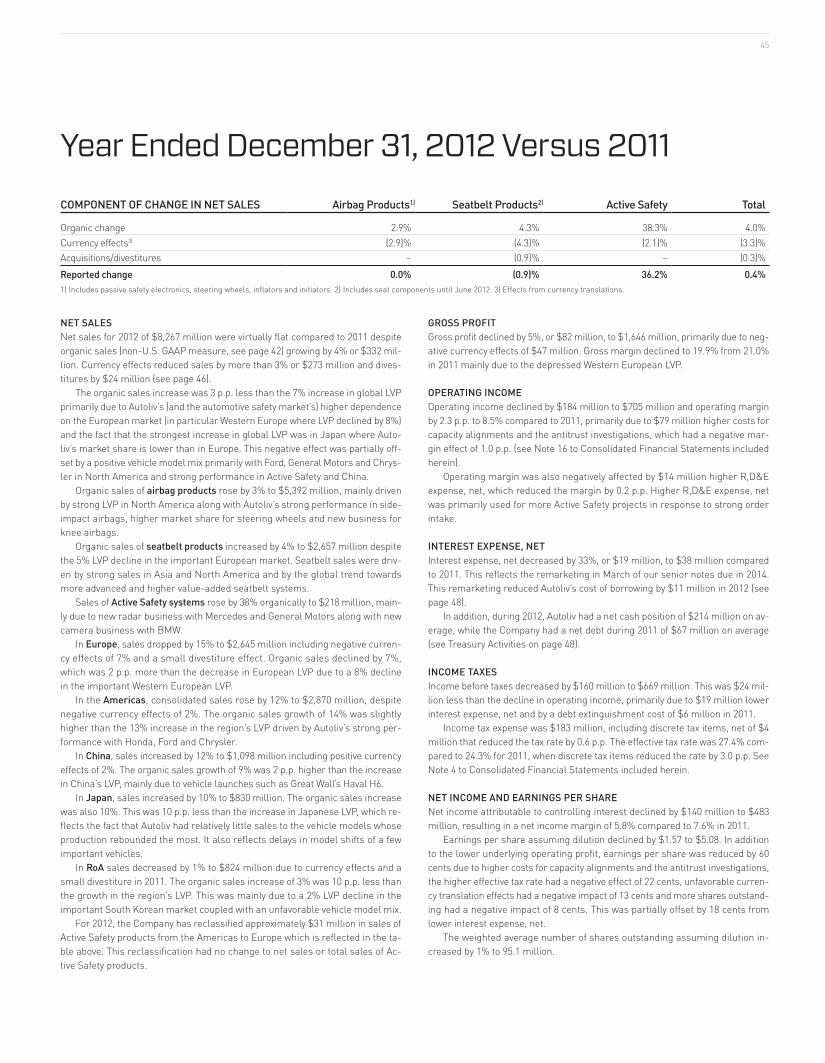
45
COMPONENT OF CHANGE IN NET SALES Airbag Products1) Seatbelt Products2) Active Safety Total
Organic change 2.9% 4.3% 38.3% 4.0%Currency effects3) (2.9)% (4.3)% (2.1)% (3.3)%Acquisitions/divestitures – (0.9)% – (0.3)%Reported change 0.0% (0.9)% 36.2% 0.4%1) Includes passive safety electronics, steering wheels, inflators and initiators. 2) Includes seat components until June 2012. 3) Effects from currency translations.
NET SALES Net sales for 2012 of $8,267 million were virtually flat compared to 2011 despite organic sales (non-U.S. GAAP measure, see page 42) growing by 4% or $332 mil-lion. Currency effects reduced sales by more than 3% or $273 million and dives-titures by $24 million (see page 46).
The organic sales increase was 3 p.p. less than the 7% increase in global LVP primarily due to Autoliv’s (and the automotive safety market’s) higher dependence on the European market (in particular Western Europe where LVP declined by 8%) and the fact that the strongest increase in global LVP was in Japan where Auto-liv’s market share is lower than in Europe. This negative effect was partially off-set by a positive vehicle model mix primarily with Ford, General Motors and Chrys-ler in North America and strong performance in Active Safety and China.
Organic sales of airbag products rose by 3% to $5,392 million, mainly driven by strong LVP in North America along with Autoliv’s strong performance in side-impact airbags, higher market share for steering wheels and new business for knee airbags.
Organic sales of seatbelt products increased by 4% to $2,657 million despite the 5% LVP decline in the important European market. Seatbelt sales were driv-en by strong sales in Asia and North America and by the global trend towards more advanced and higher value-added seatbelt systems.
Sales of Active Safety systems rose by 38% organically to $218 million, main-ly due to new radar business with Mercedes and General Motors along with new camera business with BMW.
In Europe, sales dropped by 15% to $2,645 million including negative curren-cy effects of 7% and a small divestiture effect. Organic sales declined by 7%, which was 2 p.p. more than the decrease in European LVP due to a 8% decline in the important Western European LVP.
In the Americas, consolidated sales rose by 12% to $2,870 million, despite negative currency effects of 2%. The organic sales growth of 14% was slightly higher than the 13% increase in the region’s LVP driven by Autoliv’s strong per-formance with Honda, Ford and Chrysler.
In China, sales increased by 12% to $1,098 million including positive currency effects of 2%. The organic sales growth of 9% was 2 p.p. higher than the increase in China’s LVP, mainly due to vehicle launches such as Great Wall’s Haval H6.
In Japan, sales increased by 10% to $830 million. The organic sales increase was also 10%. This was 10 p.p. less than the increase in Japanese LVP, which re-flects the fact that Autoliv had relatively little sales to the vehicle models whose production rebounded the most. It also reflects delays in model shifts of a few important vehicles.
In RoA sales decreased by 1% to $824 million due to currency effects and a small divestiture in 2011. The organic sales increase of 3% was 10 p.p. less than the growth in the region’s LVP. This was mainly due to a 2% LVP decline in the important South Korean market coupled with an unfavorable vehicle model mix.
For 2012, the Company has reclassified approximately $31 million in sales of Active Safety products from the Americas to Europe which is reflected in the ta-ble above. This reclassification had no change to net sales or total sales of Ac-tive Safety products.
GROSS PROFITGross profit declined by 5%, or $82 million, to $1,646 million, primarily due to neg-ative currency effects of $47 million. Gross margin declined to 19.9% from 21.0% in 2011 mainly due to the depressed Western European LVP.
OPERATING INCOMEOperating income declined by $184 million to $705 million and operating margin by 2.3 p.p. to 8.5% compared to 2011, primarily due to $79 million higher costs for capacity alignments and the antitrust investigations, which had a negative mar-gin effect of 1.0 p.p. (see Note 16 to Consolidated Financial Statements included herein).
Operating margin was also negatively affected by $14 million higher R,D&E expense, net, which reduced the margin by 0.2 p.p. Higher R,D&E expense, net was primarily used for more Active Safety projects in response to strong order intake.
INTEREST EXPENSE, NETInterest expense, net decreased by 33%, or $19 million, to $38 million compared to 2011. This reflects the remarketing in March of our senior notes due in 2014. This remarketing reduced Autoliv’s cost of borrowing by $11 million in 2012 (see page 48).
In addition, during 2012, Autoliv had a net cash position of $214 million on av-erage, while the Company had a net debt during 2011 of $67 million on average (see Treasury Activities on page 48).
INCOME TAXESIncome before taxes decreased by $160 million to $669 million. This was $24 mil-lion less than the decline in operating income, primarily due to $19 million lower interest expense, net and by a debt extinguishment cost of $6 million in 2011.
Income tax expense was $183 million, including discrete tax items, net of $4 million that reduced the tax rate by 0.6 p.p. The effective tax rate was 27.4% com-pared to 24.3% for 2011, when discrete tax items reduced the rate by 3.0 p.p. See Note 4 to Consolidated Financial Statements included herein.
NET INCOME AND EARNINGS PER SHARENet income attributable to controlling interest declined by $140 million to $483 million, resulting in a net income margin of 5.8% compared to 7.6% in 2011.
Earnings per share assuming dilution declined by $1.57 to $5.08. In addition to the lower underlying operating profit, earnings per share was reduced by 60 cents due to higher costs for capacity alignments and the antitrust investigations, the higher effective tax rate had a negative effect of 22 cents, unfavorable curren-cy translation effects had a negative impact of 13 cents and more shares outstand-ing had a negative impact of 8 cents. This was partially offset by 18 cents from lower interest expense, net.
The weighted average number of shares outstanding assuming dilution in-creased by 1% to 95.1 million.
Year Ended December 31, 2012 Versus 2011
AUTOLIV 2013 / MANAGEMENT’S DISCUSSION AND ANALYSIS46
Liquidity, Resources and Financial Position
CASH FROM OPERATIONSCash flow from operations, together with available financial resources and cred-it facilities, are expected to be sufficient to fund Autoliv’s anticipated working cap-ital requirements, capital expenditures and future dividend payments.
Cash provided by operating activities was $838 million in 2013, $689 million in 2012 and $758 million in 2011.
While management of cash and debt is important to the overall business, it is not part of the operational management’s day-to-day responsibilities. We there-fore focus on operationally derived working capital and have set a policy that the operating working capital should not exceed 10% of the last 12-month net sales.
At December 31, 2013, operating working capital (non-U.S. GAAP measure see page 42) stood at $543 million corresponding to 6.2% of net sales compared to $579 million and 7.0%, respectively, at December 31, 2012. This ratio was re-duced by 1.0 p.p. in 2013 and by 0.9 p.p. in 2012 by provisions for capacity align-ment and other restructuring charges, and favorably impacted by 1.0 p.p. and 1.2 p.p., respectively, from the sale of receivables and discounting of notes totaling $93 million in 2013 and $95 million in 2012 (see “Treasury Activities” on page 48).
Days receivables outstanding (see page 83 for definition) increased to 70 at De-cember 31, 2013 from 66 days on December 31, 2012. Factoring agreements did not have any material effect on days receivables outstanding for 2013, 2012 or 2011.
Days inventory outstanding (definition on page 83) increased to 31 at Decem-ber 31, 2013 from 30 one year earlier.
CAPITAL EXPENDITURES Cash generated by operating activities continued to sufficiently cover capital ex-penditures for property, plant and equipment.
Capital expenditures, gross were $386 million in 2013, $365 million in 2012 and $367 million in 2011, corresponding to 4.4%, 4.4% and 4.5% of net sales, re-spectively.
Capital expenditures, net of $379 million were $93 million higher than depre-ciation and amortization of $286 million in 2013 and $106 million higher than de-preciation and amortization of $273 million in 2012.
Capital expenditures, net for 2014 are expected to increase to be in the range of 4.5% to 5.0% of sales to support the increasing need for manufacturing capac-ity in China and other growth markets.
During 2013, construction commenced on three new facilities in China to meet the need of additional manufacturing capacity for webbing manufacturing, cush-ion fabric weaving and cushion sewing as well as an expansion of the existing steering wheel facility in China. In addition, major investments have been done to increase manufacturing capacity of inflators in all the three regions Americas, Asia and Europe.
During 2012, construction was commenced on a new gas generant facility in China and on an expansion of the existing generant and initiator facilities in North America. These investments will allow us to increase, long-term, our airbag pro-duction capacity by up to 30%. In 2012, we also began the extension of our seat-belt assembly plant in Hungary and Autoliv’s technical center in China; a new as-sembly facility for seatbelts was completed in Indonesia; a new steering wheel plant was brought into operations in Romania; and a new seatbelt assembly plant was brought into operations in Russia.
During 2011, two plants were expanded in China and two other Chinese plants were transferred to new buildings. Additionally, to meet the growing unit sales and the need for additional manufacturing capacity, a seatbelt webbing facility was opened in India, a steering wheel plant was expanded in Brazil, an airbag cush-ion plant was opened in Thailand and an airbag cushion plant moved to a larger building in Brazil.
BUSINESS COMBINATIONS, ACQUISITIONS AND DIVESTMENTS Historically, the Company has made many acquisitions. Generally, we focus on two principal growth areas around our core business with the greatest potential: Active Safety systems and growth markets.
The total acquisitions of businesses, net of cash acquired, amounted to $2 mil-lion in 2013 (prior year acquisitions), $2 million in 2012 (prior year acquisitions) and to $23 million in 2011. No business combinations or acquisitions occurred in 2013 or 2012 although Autoliv did divest Autoliv Mekan AB in 2012, which manu-factures seat components, primarily for seats in Volvo vehicles. This non-core sub-sidiary had sales of SEK 260 million (approximately $37 million) and slightly less than 200 employees.
In 2011, Autoliv acquired two technologies related to Active Safety: 1) software from Hella for camera-based forward-looking systems such as Traffic Sign Rec-ognition (TSR), Lane Detection (LD) and Light Source Recognition (LSR) and 2) a license from Astyx for long-range radar that will supplement Autoliv’s existing short and medium range radar in Adaptive Cruise Control (ACC), Emergency Brak-ing (EB) and Forward Collision-Warning (FCW). These acquisitions are expected to generate sales in 2014 and 2015, respectively.
FINANCING ACTIVITIES Cash used in financing activities amounted to $318 million in 2013, $91 million in 2012 and $223 million in 2011. The increase is mainly due to the Company’s re-purchase of common shares amounting to $148 million, see Note 13 to Consoli-dated Financial Statements included herein. Cash and cash equivalents increased by $141 million to $1,118 million in 2013 and by $239 million to $978 million in 2012. Gross debt decreased by $14 million to $619 million at December 31, 2013 and by $34 million to $633 million at December 31, 2012.
Net cash (non-U.S. GAAP measure see page 42) increased during 2013 by $151 million to $511 million at December 31, 2013, despite the Company’s repurchase program, see Note 13 to Consolidated Financial Statements included herein. Dur-ing 2012, net cash increased by $269 million to $361 million at December 31, 2012.
INCOME TAXES The Company has reserves for taxes that may become payable in future periods as a result of tax audits.
At any given time, the Company is undergoing tax audits covering multiple years in several tax jurisdictions. Ultimate outcomes are uncertain but could, in future periods, have a significant impact on the Company’s cash flows. See dis-cussions of income taxes under “Accounting Policies” on page 60 and also Note 4 to Consolidated Financial Statements included herein.
PENSION ARRANGEMENTS The Company has defined benefit pension plans covering most U.S. employees, although the Company froze participation in the U.S. plans to exclude employees hired after December 31, 2003. Many of the Company’s non-U.S. employees are also covered by pension arrangements.
At December 31, 2013, the Company’s pension liability (i.e. the actual funded status) for its U.S. and non-U.S. plans was $147 million and $255 million one year earlier. The plans had a net unamortized actuarial loss of $76 million recorded in Accumulated other comprehensive income (loss) in the Consolidated Statement of Equity at December 31, 2013, compared to $171 million at December 31, 2012. The amortization of this loss is expected to be $3 million in 2014.
The liability decrease in 2013 of $108 million was mainly due to an increase in the discount rate for the U.S. plans and contributions of $50 million. The liability increase in 2012 of $62 million was mainly due to a decrease in the discount rate
47
for all significant plans, except for the plan in Japan. Pension expense associated with the defined benefit plans was $40 million in
2013, $36 million in 2012 and $33 million in 2011 and is expected to be $24 mil-lion in 2014. The increase in pension expense associated with the defined benefit plans in 2013 of $4 million was mainly due to prior year decrease in discount rates. The increase in pension expense associated with the defined benefit plans in 2012 of $3 million was mainly due to a $7 million increase in the U.S. plans as a result of the decrease in discount rate, offset by a decrease in Japan due to the Japa-nese plan conversion in 2011. The increase in pension expense associated with the defined benefit plans in 2011 of $11 million was mainly due to a $3 million in-crease in the U.S. plans and a $4 million increase in the Japanese plans as part of the plan conversion.
The Company contributed $50 million to its defined benefit plans in 2013, $19 million in 2012 and $30 million in 2011. The increase in defined benefit plan con-tributions in 2013 was mainly due to an unscheduled voluntary contribution of $35 million to a U.S. pension plan in the fourth quarter. The increase in defined benefit plan contributions in 2011 was mainly due to the Japanese plan conver-sion, resulting in an increase in contributions of $13 million compared to 2010. The Company expects to contribute $13 million to these plans in 2014 and is cur-rently projecting a yearly funding at approximately the same level in the subse-quent years.
For further information about retirement plans see Note 18 to Consolidated Financial Statements included herein.
SHAREHOLDER RETURNSTotal cash dividends paid were $191 million in 2013, $178 million in 2012 and $154 million in 2011. Before the global financial crisis, the Company paid quarterly div-idends of 39 cents per share. The Company has raised the dividend from 30 cents per share in 2010 to 50 cents per share in 2013, see table below. The Board of Di-rectors has declared a dividend of 52 cents per share for the first quarter of 2014. The annualized dividend amount of $196 million, based on 52 cents per share and the number of shares outstanding at December 31, 2013, is 58% higher than the highest amount paid before the financial crisis.
During the fourth quarter 2013, the Company reactivated its share repurchase program and bought back 1.6 million shares for cash of $148 million, including commissions. In total, Autoliv has repurchased 35.9 million shares between May 2000 and December 2013 for cash of $1,621.1 million, including commissions. The maximum number of shares that may yet be purchased under the stock repur-chase program amount to 1.6 million shares at December 31, 2013. In January 2014, the Board of Directors approved an additional 10 million shares for the Com-pany’s share repurchase program (for a total of approximately 11.6 million shares together with the existing authorization). There is no expiration date for the share repurchase authorization in order to provide management flexibility in the Com-pany’s share repurchases.
DIVIDENDS PAID 2010 2011 2012 2013 2014
1st Quarter – $0.40 $0.45 $0.50 $0.521)
2nd Quarter – $0.43 $0.47 $0.503rd Quarter $0.30 $0.45 $0.47 $0.504th Quarter $0.35 $0.45 $0.50 $0.50
1) Declared.
EQUITY During 2013, total equity increased by 6% or $224 million to $4,000 million. This was due to net income of $490 million, $59 million due to changes in pension li-abilities and a $36 million effect from the issuance of shares and other effects re-lated to stock compensation. Equity was reduced by $196 million due to dividends, by $17 million due to negative currency effects and by $148 million due to share repurchases.
During 2012, total equity increased by 13% or $427 million to $3,776 million. This was due to net income of $486 million, a $105 million net effect from the set-tlement of the purchase contracts related to the Equity Units, a $28 million pos-itive currency effect and nearly a $21 million effect related to stock incentives. Eq-uity was reduced by $186 million due to dividends and by $26 million due to changes in pension liabilities.
IMPACT OF INFLATION Inflation has generally not had a significant impact on the Company’s financial position or results of operations. The negative impact of raw material prices in 2011, total of around $100 million, was mitigated in 2013 by $23 million. For 2014, we currently expect a favorable impact of more than $10 million from declining raw material prices.
Changes in most raw material prices affect the Company with a time lag, which is usually three to six months for most materials (see Component Costs on page 51).
In many growth markets, inflation is relatively high, especially labor inflation. We have managed to offset this negative effect mainly by labor productivity im-provements. However, no assurance can be given that this will continue to be pos-sible going forward.
PERSONNEL During the past three years, total headcount (permanent employees and tempo-rary personnel) has risen by 30% from the beginning of 2011 to 56,500 in 2013. This reflects the rebound in the cyclical automotive business as well as the com-bined effect of long-term growth of global LVP, strong demand for safer vehicles and Autoliv’s market share gains, which all drive the need for additional manu-facturing personnel.
During 2013, headcount increased by 5,500 with no impact from acquisitions or divestitures. During 2012, headcount increased by 3,000 despite a decrease of 200 due to divestitures and no impact from acquisitions. During 2011, when head-count increased by 4,600 there were no impacts from acquisitions or divestitures. Excluding acquisitions and divestitures, headcount increased by 11% during 2013, 7% during 2012 and 11% during 2011, which should be compared to increases in organic sales of 7%, 4% and 9% for the same years. During 2013 and 2012, Auto-liv’s vertical integration and manufacturing in low-cost-countries (LCC) increased as a means to offset price erosion in the automotive industry which caused head-count to increase faster than sales.
At the end of 2013, 72% of total headcount was in LCC compared to 63% at the beginning of 2011. Furthermore, 72% of total headcount at December 31, 2013 was direct workers in manufacturing compared to 70% at the beginning of 2011, while 17% of total headcount at December 31, 2013 was temporaries, compared to 20% at the beginning of 2011.
Compensation to directors and executive officers is reported, as is customary for U.S. public companies, in Autoliv’s proxy statement, which will be available to shareholders in March 2014.
AUTOLIV 2013 / MANAGEMENT’S DISCUSSION AND ANALYSIS48
Treasury Activities
CREDIT FACILITIESFrom the peak of the financial crisis, credit markets have eased significantly. In 2011, Autoliv refinanced its $1.1 billion Revolving Credit Facility (RCF), which was scheduled to mature in November 2012. The facility, now syndicated among 13 banks, has a margin of 0.45% on the applicable LIBOR or IBOR when utilized, giv-en the rating of A- from Standard & Poor’s at December 31, 2013. After the RCF-refinancing in 2011, Autoliv cancelled two credit facilities from 2010 which were no longer cost efficient and a SEK 600 million ($92 million equivalent) bond was repurchased at a discount. The Company recorded, in 2011, a debt extinguishment cost of $6 million related to this transaction, but the transaction is expected to have reduced interest expense by $8 million through 2014 (i.e. $2 million more than the cost). In connection with the bond repurchase, the Company issued a SEK 300 million ($46 million equivalent) 6-year bond with an interest rate of 3-month STIBOR + 0.95%. The European Investment Bank’s (EIB) loan commit-ment was also renegotiated in 2011 and the terms were further improved.
In April 2012, Autoliv extended essentially all of its $1.1 billion RCF from April 2016 to April 2017 with unchanged terms and conditions. In November 2012, a U.S. private placement note of $110 million matured, which had a fixed interest rate of 5.6%. A new fixed-rate note was issued in December 2012 of 350 million SEK ($54 million equivalent). This 5-year note matures in December 2017 and car-ries a fixed interest rate of 2.49%. The remainder of EIB’s commitment was can-celled in December 2012.
In 2013, Autoliv extended essentially all of its $1.1 billion RCF from April 2017 to April 2018 with unchanged terms and conditions. In July 2013, Autoliv AB, en-tered into an 18-month financing commitment agreement with EIB, giving Auto-liv AB access to a loan of €200 million ($275 million equivalent). At December 31, 2013, Autoliv’s unutilized long-term credit facilities were $1.4 billion, represent-ed by the RCF and the EIB credit facility. Neither of these facilities are subject to any financial covenants nor is any other substantial financing of Autoliv. The Com-pany had a net cash position at year end 2013 and 2012 of $511 million and $361 million, respectively. See Note 12 to Consolidated Financial Statements included herein for additional information.
During 2013 and 2012, the Company sold receivables and discounted notes related to selected customers. These factoring arrangements increase cash while reducing accounts receivable and customer risks. At December 31, 2013, the Com-pany had received $93 million for sold receivables without recourse and discount-ed notes with a discount of $2 million during the year, compared to $95 million at year end 2012 with a discount of $2 million recorded in Other financial items, net.
Autoliv’s long-term credit rating from Standard and Poor’s was upgraded from BBB+ to A- with stable outlook in December 2013. Autoliv’s credit rating is in line with its objective of maintaining a strong investment grade rating.
EQUITY AND EQUITY UNITS In March 2009, we decided to strengthen Autoliv’s equity base, primarily to (i) be in a position to participate in the likely consolidation of our industry resulting from the financial crisis, (ii) stabilize the Company’s credit rating because GM and Chrys-ler were at risk of going into bankruptcy and S&P’s down-grading of Autoliv be-tween November 2008 and February 2009 from A- to BBB-, and (iii) have a strong negotiating position with the EIB. Autoliv therefore sold 14,687,500 treasury shares at $16.00 and 6,600,000 equity units at $25.00, which generated net proceeds of $377 million.
Originally, the face value of the debt related to these notes amounted to $165 million, and the number of shares that would have been issued as a result of the equity units was 8.6 million to 10.3 million. In 2010, we conducted various accel-erated exchange transactions totaling 36% of the then outstanding equity units at an average of a 22% discount compared to the agreed cash coupon. This reduced our debt by $54 million and increased equity by $57 million due to the issuance
of 3,058,735 Autoliv treasury shares in the exchanges. In 2010, the Company also recorded a debt extinguishment cost of $12 million related to these exchanges, but the transaction saved $16 million in interest expense through April 2012.
In March 2012, Autoliv completed the remarketing of the senior notes and the coupon on the notes was reset to 3.854% with a yield of 2.875%. This reduced in-terest expense by around $11 million in 2012 compared to 2011.
On April 30, 2012, Autoliv settled the purchase contracts underlying the 4,250,920 outstanding equity units by delivering 5.8 million of its treasury shares and, in return, received approximately $106 million in cash. As a result, the Com-pany’s net cash position and equity were increased by approximately $106 million, and the total number of shares outstanding increased from 89.5 million to 95.3 million. Following the settlement of the purchase contracts no equity units were outstanding.
For dilution effects from these transactions, see “Number of Shares” below. For an additional description of our equity units, see Note 13 to Consolidated Fi-nancial Statements included herein.
NUMBER OF SHARES At December 31, 2013, 94.4 million shares were outstanding (net of 8.4 million treasury shares), a 1% decrease from 95.5 million one year earlier mainly due to the reinitiated share buybacks program, see below.
Due to the settlement of the remaining equity units, the number of shares out-standing increased on April 30, 2012 by 5.8 million. The number of shares out-standing is expected to further increase by 1.0 million when all Restricted Stock Units (RSU) vest and if all stock options to key employees are exercised, see Note 15 to Consolidated Financial Statements included herein.
For calculating earnings per share assuming dilution, Autoliv follows the Trea-sury Stock Method. As a result, the dilutive effect from the equity units varied with the price of Autoliv’s shares during 2012. For 2012, 1.3 million shares were includ-ed in the dilutive weighted average share amount related to the equity units. Due to the settlement in April 2012 there is no effect in 2013, see Note 20 to Consoli-dated Financial Statements included herein.
During the fourth quarter 2013, the Company reactivated its previously estab-lished share repurchase program. The maximum number of shares that may yet be purchased under the stock repurchase program amount to 1.6 million shares at December 31, 2013. In January, 2014, the Board of Directors approved an ad-ditional 10 million shares for the Company’s share repurchase program (for a to-tal of approximately 11.6 million shares together with the existing authorization). In total, Autoliv has repurchased 35.9 million shares between May 2000 and De-cember 2013 for cash of $1,621.1 million, including commissions. The average cost per share for all repurchased shares to date is $45.09. Purchases can be made from time to time as market and business conditions warrant in open mar-ket, negotiated or block transactions. There is no expiration date for the repur-chase program in order to provide management flexibility in the Company’s share repurchases.
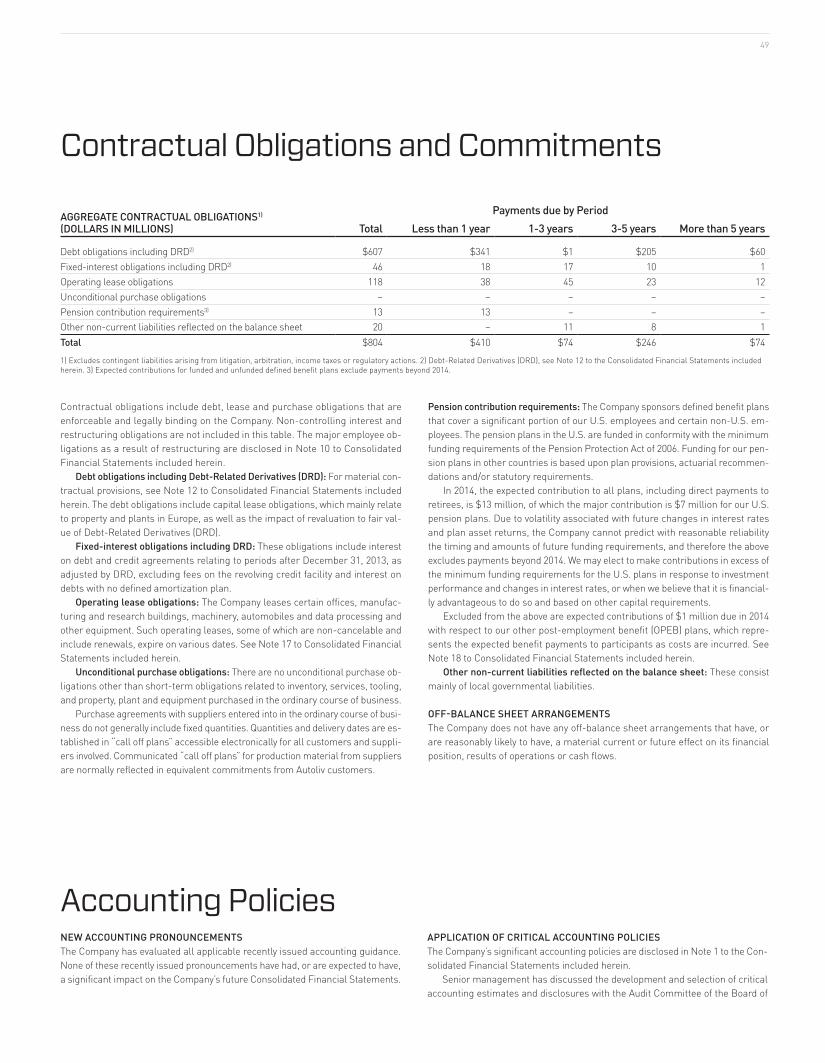
49
Contractual obligations include debt, lease and purchase obligations that are enforceable and legally binding on the Company. Non-controlling interest and restructuring obligations are not included in this table. The major employee ob-ligations as a result of restructuring are disclosed in Note 10 to Consolidated Financial Statements included herein.
Debt obligations including Debt-Related Derivatives (DRD): For material con-tractual provisions, see Note 12 to Consolidated Financial Statements included herein. The debt obligations include capital lease obligations, which mainly relate to property and plants in Europe, as well as the impact of revaluation to fair val-ue of Debt-Related Derivatives (DRD).
Fixed-interest obligations including DRD: These obligations include interest on debt and credit agreements relating to periods after December 31, 2013, as adjusted by DRD, excluding fees on the revolving credit facility and interest on debts with no defined amortization plan.
Operating lease obligations: The Company leases certain offices, manufac-turing and research buildings, machinery, automobiles and data processing and other equipment. Such operating leases, some of which are non-cancelable and include renewals, expire on various dates. See Note 17 to Consolidated Financial Statements included herein.
Unconditional purchase obligations: There are no unconditional purchase ob-ligations other than short-term obligations related to inventory, services, tooling, and property, plant and equipment purchased in the ordinary course of business.
Purchase agreements with suppliers entered into in the ordinary course of busi-ness do not generally include fixed quantities. Quantities and delivery dates are es-tablished in “call off plans” accessible electronically for all customers and suppli-ers involved. Communicated “call off plans” for production material from suppliers are normally reflected in equivalent commitments from Autoliv customers.
Pension contribution requirements: The Company sponsors defined benefit plans that cover a significant portion of our U.S. employees and certain non-U.S. em-ployees. The pension plans in the U.S. are funded in conformity with the minimum funding requirements of the Pension Protection Act of 2006. Funding for our pen-sion plans in other countries is based upon plan provisions, actuarial recommen-dations and/or statutory requirements.
In 2014, the expected contribution to all plans, including direct payments to retirees, is $13 million, of which the major contribution is $7 million for our U.S. pension plans. Due to volatility associated with future changes in interest rates and plan asset returns, the Company cannot predict with reasonable reliability the timing and amounts of future funding requirements, and therefore the above excludes payments beyond 2014. We may elect to make contributions in excess of the minimum funding requirements for the U.S. plans in response to investment performance and changes in interest rates, or when we believe that it is financial-ly advantageous to do so and based on other capital requirements.
Excluded from the above are expected contributions of $1 million due in 2014 with respect to our other post-employment benefit (OPEB) plans, which repre-sents the expected benefit payments to participants as costs are incurred. See Note 18 to Consolidated Financial Statements included herein.
Other non-current liabilities reflected on the balance sheet: These consist mainly of local governmental liabilities.
OFF-BALANCE SHEET ARRANGEMENTSThe Company does not have any off-balance sheet arrangements that have, or are reasonably likely to have, a material current or future effect on its financial position, results of operations or cash flows.
Contractual Obligations and Commitments
AGGREGATE CONTRACTUAL OBLIGATIONS1) (DOLLARS IN MILLIONS)
Payments due by PeriodTotal Less than 1 year 1-3 years 3-5 years More than 5 years
Debt obligations including DRD2) $607 $341 $1 $205 $60Fixed-interest obligations including DRD2) 46 18 17 10 1Operating lease obligations 118 38 45 23 12Unconditional purchase obligations – – – – –Pension contribution requirements3) 13 13 – – –Other non-current liabilities reflected on the balance sheet 20 – 11 8 1Total $804 $410 $74 $246 $74
1) Excludes contingent liabilities arising from litigation, arbitration, income taxes or regulatory actions. 2) Debt-Related Derivatives (DRD), see Note 12 to the Consolidated Financial Statements included herein. 3) Expected contributions for funded and unfunded defined benefit plans exclude payments beyond 2014.
NEW ACCOUNTING PRONOUNCEMENTSThe Company has evaluated all applicable recently issued accounting guidance. None of these recently issued pronouncements have had, or are expected to have, a significant impact on the Company’s future Consolidated Financial Statements.
APPLICATION OF CRITICAL ACCOUNTING POLICIESThe Company’s significant accounting policies are disclosed in Note 1 to the Con-solidated Financial Statements included herein.
Senior management has discussed the development and selection of critical accounting estimates and disclosures with the Audit Committee of the Board of
Accounting Policies
AUTOLIV 2013 / MANAGEMENT’S DISCUSSION AND ANALYSIS50
Directors. The application of accounting policies necessarily requires judgments and the use of estimates by a Company’s management. Actual results could dif-fer from these estimates.
Management considers it important to assure that all appropriate costs are recognized on a timely basis. In cases where capitalization of costs is required (e.g., certain pre-production costs), stringent realization criteria are applied before cap-italization is permitted. The depreciable lives of fixed assets are intended to reflect their true economic life, taking into account such factors as product life cycles and expected changes in technology. Assets are periodically reviewed for realizability and appropriate valuation allowances are established when evidence of impair-ment exists. Impairment of long-lived assets has generally not been significant.
REVENUE RECOGNITIONRevenues are recognized when there is evidence of a sales agreement, delivery of goods has occurred, the sales price is fixed and determinable and the collect-ability of revenue is reasonably assured. The Company records revenue from the sale of manufactured products upon shipment to customers and transfer of title and risk of loss under standard commercial terms.
Accruals are made for retroactive price adjustments if probable and can be reasonably estimated. Net sales exclude taxes assessed by a governmental au-thority that are directly imposed on revenue-producing transactions between the Company and its customers.
BAD DEBT AND INVENTORY RESERVESThe Company has reserves for bad debts as well as for excess and obsolete inven-tories. The Company has guidelines for calculating provisions for bad debts based on the age of receivables. In addition, the accounts receivable are evaluated on a specific identification basis. In determining the amount of a bad debt reserve, man-agement uses its judgment to consider factors such as the prior experience with the customer, the experience with other enterprises in the same industry, the cus-tomer’s ability to pay and/or an appraisal of current economic conditions.
Inventories are evaluated based on individual or, in some cases, groups of in-ventory items. Reserves are established to reduce the value of inventories to the lower of cost or market, with market generally defined as net realizable value for finished goods and replacement cost for raw materials and work-in-process. Ex-cess inventories are quantities of items that exceed anticipated sales or usage for a reasonable period. The Company has guidelines for calculating provisions for excess inventories based on the number of months of inventories on hand com-pared to anticipated sales or usage. Management uses its judgment to forecast sales or usage and to determine what constitutes a reasonable period.
There can be no assurance that the amount ultimately realized for receivables and inventories will not be materially different than that assumed in the calcula-tion of the reserves.
GOODWILL IMPAIRMENTThe Company performs an annual impairment review of goodwill in the fourth quarter of each year following the Company’s annual forecasting process. The es-timated fair market value of goodwill is determined by the discounted cash flow method. The Company discounts projected operating cash flows using its weight-ed average cost of capital.
To supplement this analysis, the Company compares the market value of its equity, calculated by reference to the quoted market prices of its shares, with the book value of its equity. There were no goodwill impairments in 2011-2013. See “Goodwill and Intangible Assets” in Note 1 to Consolidated Financial Statements included herein.
RESTRUCTURING PROVISIONSThe Company defines restructuring expense to include costs directly associated with capacity alignment programs, exit or disposal activities. Estimates of restruc-turing charges are based on information available at the time such charges are recorded. In general, management anticipates that restructuring activities will be completed within a time frame such that significant changes to the exit plan are not likely.
Due to inherent uncertainty involved in estimating restructuring expenses, actu-al amounts paid for such activities may differ from amounts initially estimated. See Note 10 to the Consolidated Financial Statements included herein.
DEFINED BENEFIT PENSION PLANSThe Company has defined benefit pension plans in thirteen countries. The most significant plans exist in the U.S. and cover most U.S. employees. These plans represent 56% of the Company’s total pension benefit obligation. See Note 18 to Consolidated Financial Statements included herein.
The Company, in consultation with its actuarial advisors, determines certain key assumptions to be used in calculating the projected benefit obligation and an-nual pension expense. For the U.S. plans, the assumptions used for calculating the 2013 pension expense were a discount rate of 4.05%, expected rate of increase in compensation levels of 3.50%, and an expected long-term rate of return on plan assets of 7.50%.
The assumptions used in calculating the U.S. benefit obligations disclosed as of December 31, 2013 were a discount rate of 5.00% and an expected age-based rate of increase in compensation levels of 3.50%. The discount rate for the U.S. plans has been set based on the rates of return of high-quality fixed-income in-vestments currently available at the measurement date and are expected to be available during the period the benefits will be paid. The expected rate of increase in compensation levels and long-term return on plan assets are determined based on a number of factors and must take into account long-term expectations and reflect the financial environment in the respective local markets. The Company assumes a long-term rate of return on U.S. plan assets of 7.50% for calculating the 2013 expense. At December 31, 2013, 57% of the U.S. plan assets were invest-ed in equities, which is in line with the target of 55%.
A one percentage point (p.p.) decrease in the long-term rate of return on plan assets would result in an increase in the 2013 U.S. benefit cost of $2 million. A one p.p. decrease in the discount rate would have increased the 2013 U.S. benefit cost by $8 million and would have increased the December 31, 2013 U.S. benefit obli-gation by $59 million. A one p.p. increase in the expected rate of increase in com-pensation levels would have increased 2013 U.S. benefit cost by $4 million and would have increased the December 31, 2013 U.S. benefit obligation by $21 million.
INCOME TAXES Significant judgment is required in determining the worldwide provision for in-come taxes. In the ordinary course of a global business, there are many transac-tions for which the ultimate tax outcome is uncertain. Many of these uncertain-ties arise as a consequence of inter-company transactions and arrangements.
Although the Company believes that its tax return positions are supportable, no assurance can be given that the final outcome of these matters will not be ma-terially different than that which is reflected in the historical income tax provisions and accruals. Such differences could have a material effect on the income tax pro-visions or benefits in the periods in which such determinations are made. See Note 4 to Consolidated Financial Statements included herein.
CONTINGENT LIABILITIES Various claims, lawsuits and proceedings are pending or threatened against the Company or its subsidiaries, covering a range of matters that arise in the ordi-nary course of its business activities with respect to commercial, product liabili-ty or other matters. Because we are unable to estimate the financial impact of ongoing and potential antitrust investigations and related civil litigation or the pe-riods during which such impact would be recorded, the Company has not record-ed a provision for those matters as of December 31, 2013. See Note 16 to the Con-solidated Financial Statements included herein and Item 3 – ”Legal Proceedings” in our Form 10-K for the year ended December 31, 2013.
The Company diligently defends itself in such matters and, in addition, carries insurance coverage to the extent reasonably available against insurable risks.
The Company records liabilities for claims, lawsuits and proceedings when they are identified and it is possible to reasonably estimate the cost of such liabil-ities. Legal costs expected to be incurred in connection with a loss contingency are expensed as such costs are incurred.
51
Operational Risks
LIGHT VEHICLE PRODUCTIONSince nearly 30% of Autoliv’s costs are relatively fixed, short-term earnings are highly dependent on capacity utilization in the Company’s plants and are, there-fore, sales dependent.
Global LVP is an indicator of the Company’s sales development. Ultimately, however, sales are determined by the production levels for the individual vehicle models for which Autoliv is a supplier (see Dependence on Customers). The Com-pany’s sales are split over several hundred contracts covering approximately 1,300 vehicle models which generally moderates the effect of changes in vehicle de-mand of individual countries and regions or stops in production, due to, for in-stance, natural disasters. The risk in fluctuating sales has also been mitigated by Autoliv’s rapid expansion in Asia and other growth markets, which has reduced the Company’s former high dependence on Europe from more than 50% of sales to a diversified mix with Europe, the Americas and Asia each accounting for about one third of 2013 sales.
It is also the Company’s strategy to reduce this risk in fluctuating sales by us-ing a high number of temporary employees instead of permanent employees. Dur-ing 2011-2013, the level of temporary personnel in relation to total headcount var-ied between 17.0% at December 31, 2013 and 22.3% at March 31, 2011.
However, when there is a dramatic reduction in the production of vehicle mod-els supplied by the Company such as occurred during the financial crisis in 2008 and 2009 and during 2012 when Western European LVP declined by 8% followed by a flat development in 2013, it takes time to reduce the level of permanent em-ployees and even longer to reduce fixed production capacity. As a result, our sales and margin could drop significantly and materially impact earnings and cash flow. Therefore, it is our strategy to have a strong financial position and high level of manufacturing in low-cost countries where more flexible labor-intensive produc-tion lines can be used than highly automated lines with fixed costs in high-cost countries.
PRICING PRESSUREPricing pressure from customers is an inherent part of the automotive compo-nents business. The extent of price reductions varies from year to year, and takes the form of reductions in direct sales prices as well as discounted reimburse-ments for engineering work.
In response, Autoliv is continuously engaged in efforts to reduce costs and to provide customers added value by developing new products. Generally, the speed by which these cost-reduction programs generate results will, to a large extent, determine the future profitability of the Company. The various cost-reduction pro-grams are, to a considerable extent, interrelated. This interrelationship makes it difficult to isolate the impact on costs of any single program. Therefore, we moni-tor key measures such as costs in relation to sales and geographical employee mix.
COMPONENT COSTS Changes in these component costs and raw material prices could have a major im-pact on margins, since the cost of direct materials is approximately 54.5% of sales. Autoliv does not generally buy raw materials, but rather purchases manufactured components (such as stamped steel parts and sewn airbag cushions). In spite of this, raw material price changes in Autoliv’s supply chain could have a major im-pact on our profitability since approximately 51% of the Company’s component costs (corresponding to 28% of net sales) are comprised of raw materials. The re-maining 49% are value added by the supply chain.
Currently, 36% of the raw material cost (or 10% of net sales) is based on steel prices; 32% on oil prices (i.e. nylon, polyester and engineering plastics) (9% of net sales); 15% on electronic components, such as circuit boards (4% of net sales); and 7% on zinc, aluminum and other non-ferrous metals (2% of net sales).
Changes in most raw material prices affect the Company with a time lag. This lag used to be six to twelve months, but now more often three to six months. For non-ferrous industrial metals like aluminum and zinc, we have quarterly and sometimes monthly price adjustments.
The Company’s strategy is to offset price increases on cost of materials by tak-ing several actions such as re-design of products to reduce material content (as well as weight), material standardization to globally available raw materials, con-solidating volumes to fewer suppliers and moving components sourcing to low-cost countries. However, should these actions not be sufficient to offset compo-nent price increases, our earnings could be materially impacted.
LEGAL The Company is involved from time to time in regulatory, commercial and con-tractual legal proceedings that may be significant, and the Company’s business may suffer as a result of adverse outcomes of current or future legal proceedings. These claims may include, without limitation, commercial or contractual disputes, including disputes with the Company’s suppliers, intellectual property matters, regulatory matters and governmental investigations, personal injury claims, en-vironmental issues, tax and customs matters, and employment matters.
The Company is currently subject to ongoing antitrust investigations by gov-ernmental authorities, as well as related civil litigation in the United States and Canada alleging anti-competitive conduct. In addition, management believes that additional antitrust authorities are evaluating whether to commence investiga-tions. Such legal proceedings, including regulatory actions and government in-vestigations, may seek recovery of very large indeterminate amounts or limit the Company’s operations, and the possibility that such proceedings may arise and their magnitude may remain unknown for substantial periods of time.
A substantial legal liability or adverse regulatory outcome and the substantial cost to defend the litigation or regulatory proceedings may have an adverse effect on the Company’s business, operating results, financial condition, cash flows and reputation.
Risks and Risk Management The Company is exposed to several categories of risks. They can broadly be categorized as operational risks, strategic risks and financial risks. Some of the major risks in each category are described below. There are also other risks that could have a material effect on the Company’s results and financial position and the description below is not complete but should be read in conjunction with the discussion of risks in our 10-K filed with the SEC, which contains a description of our material risks.
As described below, the Company has taken several mitigating actions, applied many strategies, adopted policies, and introduced control and reporting systems to reduce and mitigate these risks. In addition, the Company from time to time identifies and evaluates emerging or changing risks to the Company in order to ensure that identified risks and related risk management are updated in this fast moving environment.
AUTOLIV 2013 / MANAGEMENT’S DISCUSSION AND ANALYSIS52
No assurances can be given that such proceedings and claims will not have a ma-terial adverse impact on the Company’s profitability and consolidated financial position or that reserves or insurance will mitigate such impact. See Note 16 Con-tingent Liabilities to the Consolidated Financial Statements included herein and Item 3 – ”Legal Proceedings” in our Form 10-K for the year ended December 31, 2013.
PRODUCT WARRANTY AND RECALLS The Company is exposed to various claims for damages and compensation, if our products fail to perform as expected. Such claims can be made, and result in costs and other losses to the Company, even where the relevant product is eventually found to have functioned properly. If a product (actually or allegedly) fails to per-form as expected, we may face warranty and recall claims. If such actual or al-leged failure results in bodily injury and/or property damage, we may in addition face product-liability and other claims. The Company may experience material warranty, recall or product-liability claims or losses in the future, and the Com-pany may incur significant cost to defend against such claims. The Company may also be required to participate in a recall involving its products. Each vehicle man-ufacturer has its own practices regarding product recalls and other product-lia-bility actions relating to its suppliers. As suppliers become more integrally in-volved in the vehicle design process and assume more vehicle assembly functions, vehicle manufacturers are increasingly looking to their suppliers for contribution when faced with recalls and product-liability claims. In addition, with global plat-forms and procedures, vehicle manufacturers are increasingly evaluating our qual-ity performance on a global basis. Any one or more quality, warranty or other re-call issue(s) (also the ones affecting few units and/or having a small financial impact) may cause a vehicle manufacturer to implement measures which may have a severe impact on the Company’s operations, such as a temporary or pro-longed suspension of new orders or the Company’s ability to bid for new business.
In addition, there is a risk that the number of vehicles affected by a failure or defect will increase significantly (as would the Company’s costs), since our prod-ucts more frequently use global designs and are increasingly based on or utilize the same or similar parts, components or solutions.
A warranty, recall or a product-liability claim brought against the Company in excess of the Company’s insurance may have a material adverse effect on its business and/or financial results. Vehicle manufacturers are also increasingly requiring their external suppliers to guarantee or warrant their products and bear the costs of repair and replacement of such products under new vehicle warranties. A vehicle manufacturer may attempt to hold the Company responsi-ble for some or all of the repair or replacement costs of defective products un-der new vehicle warranties when the product supplied did not perform as repre-sented. Additionally, a customer may not allow us to bid for expiring or new business until certain remedial steps have been taken. Accordingly, the future costs of warranty claims by the Company’s customers may be material. We be-lieve our established reserves are adequate to cover potential warranty settle-ments typically seen in our business.
The Company’s warranty reserves are based upon management’s best esti-mates of amounts necessary to settle future and existing claims. Management regularly evaluates the appropriateness of these reserves, and adjusts them when we believe it is appropriate to do so. However, the final amounts determined to be due could differ materially from the Company’s recorded estimates.
The Company’s strategy is to follow a stringent procedure when developing new products and technologies and to apply a proactive “zero-defect” quality pol-icy (see page 32). In addition, the Company carries product-liability and product-recall insurance at levels that management believes are generally sufficient to cover the risks. However, such insurance may not always be available in appro-priate amounts or in all markets. Management’s decision regarding what insur-ance to procure is also impacted by the cost for such insurance. As a result, the Company may face material losses in excess of the insurance coverage procured. A substantial recall or liability in excess of coverage levels could therefore have a material adverse effect on the Company.
ENVIRONMENTAL Most of the Company’s manufacturing processes consist of the assembly of com-ponents. As a result, the environmental impact from the Company’s plants is gen-erally modest. While the Company’s businesses from time to time are subject to environmental investigations, there are no material environmental-related cases pending against the Company. Therefore, Autoliv does not incur (or expect to in-cur) any material costs or capital expenditures associated with maintaining facil-ities compliant with U.S. or non-U.S. environmental requirements. To reduce en-vironmental risk, the Company has implemented an environmental management system and has adopted an environmental policy (see corporate website www.au-toliv.com) that requires, for instance, that all plants should be ISO-14001 certified.
However, environmental requirements are complex, change and are general-ly becoming more stringent over time. Accordingly, there can be no assurance that these requirements will not change in the future, or that we will at all times be in compliance with all such requirements and regulations, despite our intention to be. The Company may also find itself subject, possibly due to changes in legisla-tion or other regulation, to environmental liabilities based on the activities of its predecessor entities or of businesses acquired. Such liability could be based on activities which are not at all related to the Company’s current activities.
Strategic RisksREGULATIONSIn addition to vehicle production, the Company’s market is driven by the safety content per vehicle, which is affected by new regulations and new vehicle rating programs, in addition to consumer demand for new safety technologies.
The most important regulation is the U.S. federal law that, since 1997, requires frontal airbags for both the driver and the front-seat passenger in all new vehicles sold in the U.S. Seatbelt installation laws exist in all vehicle-producing countries. Many countries also have strict enforcement laws on the wearing of seatbelts. In 2007, the U.S. adopted new regulations for side-impact protection to be phased-in by 2015. China introduced a vehicle rating program in 2006, and Latin America introduced a similar program in 2010. The United States upgraded its vehicle rat-ing program in 2010 and Europe completed an upgrade of its Euro NCAP rating system in 2012 and has initiated a further upgrade, which will be fully implement-ed by 2017. There are also other plans for improved automotive safety, both in these countries and many other countries that could affect the Company’s market.
However, there can be no assurance that changes in regulations will not ad-versely affect the demand for the Company’s products or, at least, result in a slow-er increase in the demand for them.
DEPENDENCE ON CUSTOMERS The five largest vehicle manufacturers account for 54% of global LVP and the ten largest manufacturers for 79%.
As a result of this highly consolidated market, the Company is dependent on a relatively small number of customers with strong purchasing power.
In 2013, the Company’s five largest customers accounted for 54% of revenues and the ten largest customers for 83% of revenues. For a list of the largest cus-tomers, see Note 19 to the Consolidated Financial Statements on page 80.
Our largest customer contract accounted for 4% of sales in 2013. Although business with every major customer is split into several contracts
(usually one contract per vehicle platform) and although the customer base has become more balanced and diversified as a result of Autoliv’s significant expan-sion in China and other rapidly-growing markets, the loss of all business from a major customer (whether by a cancellation of existing contracts or not awarding us new business), the consolidation of one or more major customers or a bank-ruptcy of a major customer could have a material adverse effect on the Compa-ny. In addition, a quality issue, shortcomings in our service to a customer or un-competitive prices or products could result in the customer not awarding us new business, which will gradually have a negative impact on our sales when current contracts start to expire.
53
CUSTOMER PAYMENT RISK Another risk related to our customers is the risk that one or more customers will be unable to pay invoices that become due. We seek to limit this customer pay-ment risk by invoicing major customers through their local subsidiaries in each country, even for global contracts. We thus try to avoid having the receivables with a multinational customer group exposed to the risk that a bankruptcy or similar event in one country puts all receivables with the customer group at risk. In each country, we also monitor invoices becoming overdue.
Even so, if a major customer would be unable to fulfill its payment obligations, it is likely that we would be forced to record a substantial loss on such receivables.
DEPENDENCE ON SUPPLIERS Autoliv, at each stage of production, relies on internal or external suppliers in or-der to meet its delivery commitments. In some cases, customers require that the suppliers are qualified and approved by them. Autoliv’s supplier consolidation pro-gram seeks to reduce costs but increases our dependence on the remaining sup-pliers. As a result, the Company is dependent, in several instances, on a single supplier for a specific component. However, this dependence is mitigated by the fact that we seldom are dependent on a specific manufacturing technology. Con-sequently, we can often change suppliers, albeit with some costs and time for val-idation and customer approval.
Consequently, there is a risk that disruptions in the supply chain could lead to the Company not being able to meet its delivery commitments and, as a con-sequence, to extra costs. This risk increases as suppliers are being squeezed between higher raw material prices and the continuous pricing pressure in the automotive industry. This risk also increases when our internal and external suppliers are to a higher degree located in countries which have a higher polit-ical risk.
The Company’s strategy is to reduce these supplier risks by seeking to main-tain an optimal number of suppliers in all significant component technologies, by standardization and by developing alternative suppliers around the world.
However, for various reasons including costs involved in maintaining alterna-tive suppliers, this is not always possible. As a result, difficulties with a single sup-plier could impact more than one customer and product, and thus materially im-pact our earnings.
NEW COMPETITIONThe market for occupant restraint systems has undergone a significant consoli-dation during the past ten years and Autoliv has strengthened its position in this passive safety market.
However, in the future, the most attractive growth opportunities may be in the Active Safety systems markets, which include and are likely to include other and often larger companies than Autoliv’s traditional competitors. Additionally, there is no guarantee our customers will adopt our new products or technologies.
Autoliv is reducing the risk of this trend by utilizing its leadership in passive safety to develop a strong position in Active Safety (see page 12).
PATENTS AND PROPRIETARY TECHNOLOGY The Company’s strategy is to protect its innovations with patents, and to vigorous-ly protect and defend its patents, trademarks and know-how against infringement and unauthorized use. At the end of 2013, the Company held more than 6,600 pat-ents. These patents expire on various dates during the period from 2014 to 2033. The expiration of any single patent is not expected to have a material adverse ef-fect on the Company’s financial results.
Although the Company believes that its products and technology do not in-fringe upon the proprietary rights of others, there can be no assurance that third parties will not assert infringement claims against the Company in the future. Also, there can be no assurance that any patent now owned by the Company will afford protection against competitors that develop similar technology.
Financial Risks The Company is exposed to financial risks through its international operations and normal debt-financed activities. Most of the financial risks are caused by vari-ations in the Company’s cash flow generation resulting from, among other things, changes in exchange rates and interest rate levels, as well as from refinancing risk and credit risk.
In order to reduce the financial risks and to take advantage of economies of scale, the Company has a central treasury department supporting operations and management. The treasury department handles external financial transactions and functions as the Company’s in-house bank for its subsidiaries.
The Board of Directors monitors compliance with the financial policy on an on-going basis.
CURRENCY RISKS 1. Transaction ExposureTransaction exposure arises because the cost of a product originates in one cur-rency and the product is sold in another currency.
The Company’s gross transaction exposure forecasted for 2014 is approxi-mately $2.5 billion. A part of the currency flows have counter-flows in the same currency pair, which reduces the net exposure to approximately $1.7 billion per year. In the three largest net exposures, Autoliv expects to sell U.S dollars against the Mexican Peso for the equivalent of $282 million, Euros against the Swedish Krona for the equivalent of $236 million and buy Euros against the Chinese Ren-minbi for the equivalent of $168 million. Together these currencies will account for almost 40% of the Company’s net currency transaction exposure.
Since the Company can only effectively hedge these currency flows in the short term, periodic hedging would only reduce the impact of fluctuations tem-porarily. Over time, periodic hedging would postpone but not reduce the impact of fluctuations. In addition, the net exposure is limited to less than one quarter of net sales and is made up of more than 40 different currency pairs with expo-sures in excess of $1 million each. Consequently, the income statement effects related to transaction exposures are generally modest. As a result, Autoliv does not hedge these flows.
2. Translation Exposure in the Income StatementAnother effect of exchange rate fluctuations arises when the income statements of non-U.S. subsidiaries are translated into U.S. dollars. Outside the U.S., the Company’s most significant currency is the Euro. We estimate that slightly more than 32% of the Company’s net sales will be denominated in Euro or other Euro-pean currencies during 2014, while approximately a quarter of net sales is esti-mated to be denominated in U.S. dollars.
The Company estimates that a 1% increase in the value of the U.S. dollar ver-sus the European currencies will decrease reported U.S. dollar annual net sales in 2014 by $30 million or by 0.3% while operating income for 2014 will decline by approximately 0.1% or by about $1 million.
The Company’s policy is not to hedge this type of translation exposure since there is no cash flow effect to hedge.
3. Translation Exposure in the Balance SheetA translation exposure also arises when the balance sheets of non-U.S. subsid-iaries are translated into U.S. dollars. The policy of the Company is to finance ma-jor subsidiaries in the country’s local currency and to minimize the amounts held by subsidiaries in foreign currency accounts.
Consequently, changes in currency rates relating to funding and foreign cur-rency accounts normally have a small impact on the Company’s income.
INTEREST RATE RISKInterest rate risk refers to the risk that interest rate changes will affect the Com-pany’s borrowing costs. Autoliv’s interest rate risk policy states that an increase in floating interest rates of one percentage point should not increase the annual net interest expense by more than $10 million in the following year and not by
AUTOLIV 2013 / MANAGEMENT’S DISCUSSION AND ANALYSIS54
RECONCILIATIONS TO U.S. GAAP (DOLLARS IN MILLIONS)Leverage ratioDecember 31, 2013
Net debt (cash)1) $(511.3)Pension liabilities 147.3Debt (cash) per the Policy $(364.0)Income before income taxes $734.0Plus: Interest expense net2) 28.9Depreciation and amortization of intangibles3) 286.0EBITDA per the Policy $1,048.9Leverage ratio4) n/a1) Net debt (cash) is short- and long-term debt and debt-related derivatives (see Note 12) less cash and cash equivalents. 2) Interest expense, net is interest expense including cost for extinguishment of debt, if any, less interest income. 3) Including impairment write-offs, if any. 4) Leverage ratio is not applicable due to net cash position.
more than $15 million in the second year. Given the Company’s current capital structure, we estimate that a one-per-
centage point interest rate increase would reduce net interest expense by ap-proximately $8 million, both in 2014 and 2015. This is based on the capital struc-ture at the end of 2013 when the gross fixed-rate debt was $454 million while the Company had a net cash position of $511 million (non-U.S. GAAP measure, see page 42).
Fixed interest rate debt is achieved both by issuing fixed rate notes and through interest rate swaps. The most notable debt carrying fixed interest rates is the $290 million U.S. private placement notes issued in 2007, the remarketed debt note re-lated to the equity units of $107 million repriced in April 2012 and the EIB note is-sued in December 2012 of SEK 350 million ($54 million equivalent), see Note 12 to Consolidated Financial Statements included herein.
The entire 2007 U.S. private placement was issued carrying fixed interest rates. Initially, $200 million of this placement was swapped into floating inter-est rates, $140 million of these swaps were cancelled in 2008 and the remain-ing $60 million swap was cancelled during the first quarter 2013 resulting in a cash-flow gain and therefore lower fixed rate debt was achieved when consid-ering the amortization of this gain, see Note 12 to Consolidated Financial State-ments included herein.
REFINANCING RISKRefinancing risk or borrowing risk refers to the risk that it could become difficult to refinance outstanding debt.
Autoliv’s refinancing risk policy requires the Company to maintain long-term facilities with an average maturity of at least three years (drawn or undrawn) cor-responding to 150% of total net debt (non-U.S. GAAP measure, see page 42). Meet-ing this policy can be achieved by raising long-term debt or debt commitments or by using cash flow to repay debt.
During the past four years, Autoliv has reduced its net debt by $1,173 million and was, at December 31, 2013, in a net cash position, and has been in a net cash position since December 31, 2011, which reduces the Company’s refinancing risk significantly. In addition to this net cash position of $511 million, the Company had undrawn long-term debt facilities of $1.4 billion at the end of 2013 with an aver-age remaining life of 4.2 years. Furthermore, the Company has no significant fi-nancing with financial covenants (i.e. performance-related restrictions).
DEBT LIMITATION POLICYTo manage the inherent risks and cyclicality in Autoliv’s business, the Company maintains a relatively conservative financial leverage.
In May 2013, Autoliv communicated its revised debt limitation policy which is to maintain a financial leverage commensurate with a “strong investment grade credit rating” and our long-term target is to have a leverage ratio of around 1 time and to be within the range of 0.5 to 1.5 times. The Company also communicated its aim to reach a leverage ratio of 0.5 times by the end of 2014.
The Company has had a strong investment grade rating during all periods since the Company was initially rated in 2000 except during February 2009 and July 2010 when the Company’s long-term credit rating was reduced by Standard and Poor’s (S&P) to BBB-. In July 2010, the rating was restored to investment grade, BBB+. In December 2013 Autoliv was upgraded to A- with stable outlook by S&P.
At December 31, 2013, the leverage ratio was not applicable, since the Com-pany was in a net cash position. For details on leverage ratio, refer to the table below which reconciles this non-U.S. GAAP measure to U.S. GAAP measure.
CREDIT RISK IN FINANCIAL MARKETSCredit risk refers to the risk of a financial counterparty being unable to fulfill an agreed-upon obligation. This risk was increased for almost all companies as a result of the deterioration of the credit quality of many banks during 2008 and 2009 and again starting in the second half of 2011 and continuing into 2012 and 2013.
In the Company’s financial operations, this risk arises when cash is deposit-ed with banks and when entering into forward exchange agreements, swap con-tracts or other financial instruments.
The policy of the Company is to work with banks that have a high credit rating and that participate in Autoliv’s financing.
In order to further reduce credit risk, deposits and financial instruments can only be entered into with core banks up to a calculated risk amount of $150 mil-lion per bank for banks rated A- or above and up to $50 million for banks rated BBB+. In addition, deposits can be made in U.S. and Swedish government short-term notes and certain AAA rated money market funds as approved by the Com-pany’s Board of Directors. At year end 2013, the Company was compliant with this policy and held $433 million in AAA rated money market funds and $100 million directly in U.S. Treasury Bills.
IMPAIRMENT RISK Impairment risk refers to the risk that the Company will be obliged to write down a material amount of its goodwill of approximately $1.6 billion. This risk is as-sessed, at least, annually in the fourth quarter each year when the Company per-forms an impairment test. The impairment testing is based on two reporting units: 1) Passive Safety Systems to which virtually all of the goodwill is related; and 2) Active Safety Systems with $8 million in goodwill.
The discounted cash flow method is used for determining the fair value of these reporting units. The Company also compares the market value of its equi-ty to the value derived from the discounted cash flow method. However, due to the combined effects of the cyclicality in the automotive industry and the volatility of stock markets, this method is only used as a supplement. The Company has con-cluded that presently none of its reporting units are “at risk” of failing the good-will impairment test. See also discussion under Goodwill and Intangible Assets in Note 1 to Consolidated Financial Statements included herein.
Not even during the unprecedented challenges for the global automotive in-dustry in 2009 and 2008 was the Company required to record a goodwill impair-ment charge. However, there can be no assurance that goodwill will not be im-paired due to future significant declines in LVP, due to our technologies or products becoming obsolete or for any other reason. We could also acquire com-panies where goodwill could turn out to be less resilient to deteriorations in ex-ternal conditions.
55
Management’s Report on Internal Control over Financial ReportingManagement of the Company is responsible for establishing and maintaining ad-equate internal control over financial reporting.
Internal control over financial reporting is defined in Rules 13a-15(f) and 15d-15(f) under the Securities Exchange Act of 1934, as amended, as a process de-signed by, or under the supervision of, the Company’s principal executive and prin-cipal financial officers and effected by the Company’s board of directors, management and other personnel to provide reasonable assurance regarding the reliability of financial reporting and the preparation of financial statements for ex-ternal purposes in accordance with generally accepted accounting principles and includes those policies and procedures that:
• pertain to the maintenance of records that in reasonable detail accurately and
fairly reflect the transactions and dispositions of the assets of the Company;• provide reasonable assurance that transactions are recorded as necessary
to permit preparation of financial statements in accordance with generally accepted accounting principles, and that receipts and expenditures of the Company are being made only in accordance with authorizations of manage-ment and directors of the Company; and provide reasonable assurance re-garding prevention or timely detection of unauthorized acquisition, use or dis-position of the Company’s assets that could have a material effect on the financial statements.
Because of its inherent limitations, internal control over financial reporting may not prevent or detect misstatements. Projections of any evaluation of effective-ness to future periods are subject to the risks that controls may become inade-quate because of changes in conditions, or that the degree of compliance with the policies or procedures may deteriorate.
Management assessed the effectiveness of Autoliv’s internal control over fi-nancial reporting as of December 31, 2013. In making this assessment, we used the criteria set forth by the Committee of Sponsoring Organizations of the Tread-way Commission (COSO) in Internal Control – Integrated Framework (1992 frame-work).
Based on our assessment, we believe that, as of December 31, 2013, the Com-pany’s internal control over financial reporting is effective.
The Company’s independent auditors – Ernst & Young AB, an independent reg-istered public accounting firm – have issued an audit report on the effectiveness of the Company’s internal control over financial reporting, which is included here-in, see page 82.
There have not been any changes in the Company’s internal control over fi-nancial reporting (as such term is defined in Rules 13a-15(f) and 15d-15(f) under the Exchange Act) during the quarter ended December 31, 2013 that have mate-rially affected, or are reasonably likely to materially affect, the Company’s inter-nal control over financial reporting.
This Annual Report contains statements that are not historical facts but rather forward-looking statements within the meaning of the Private Securities Litiga-tion Reform Act of 1995. Such forward-looking statements include those that ad-dress activities, events or developments that Autoliv, Inc. or its management be-lieves or anticipates may occur in the future. For example, forward-looking statements include, without limitation, statements relating to industry trends (in-cluding light vehicle production), business opportunities, sales contracts, sales backlog, and on-going commercial arrangements and discussions, as well as any statements about estimated sales, operating margin, cash flow, effective tax rate, or other future operating performance or financial results.
In some cases, you can identify these statements by forward-looking words such as “estimates,” “expects,” “anticipates,” “projects,” “plans,” “intends,” “believes,” “may,” “likely,” “might,” “will,” “should,” or the negative of these terms and other com-parable terminology, although not all forward-looking statements contain such words.
All forward-looking statements, including without limitation, management’s examination of historical operating trends and data, are based upon our current expectations, various assumptions and data available from third parties. Our ex-pectations and assumptions are expressed in good faith and we believe there is a reasonable basis for them. However, there can be no assurance that such for-ward-looking statements will materialize or prove to be correct as forward-look-ing statements are inherently subject to known and unknown risks, uncertainties and other factors which may cause actual future results, performance or achieve-ments to differ materially from the future results, performance or achievements expressed in or implied by such forward-looking statements.
Because these forward-looking statements involve risks and uncertainties, the outcome could differ materially from those set out in the forward-looking state-ments for a variety of reasons, including without limitation, changes in global light vehicle production; fluctuation in vehicle production schedules for which the Com-pany is a supplier; market acceptance of our new products; changes in general in-dustry market conditions or regional growth or declines; changes in and the suc-
cessful execution of our capacity alignment, restructuring and cost reduction initiatives discussed herein and the market reaction thereto; loss of business from increased competition; higher raw material, fuel and energy costs; changes in con-sumer and customer preferences for end products; customer losses; changes in regulatory conditions; customer bankruptcies; consolidations or restructuring; di-vestiture of customer brands; unfavorable fluctuations in currencies or interest rates among the various jurisdictions in which we operate; component shortages; costs or difficulties related to the integration of any new or acquired businesses and technologies; continued uncertainty in program awards and performance; the financial results of companies in which Autoliv has made technology investments or joint-venture arrangements; pricing negotiations with customers; our ability to be awarded new business; product liability, warranty and recall claims and other litigation and customer reactions thereto; higher expenses for our pension and other postretirement benefits including higher funding requirements of our pen-sion plans; work stoppages or other labor issues at our facilities or at the facilities of our customers or suppliers; possible adverse results of pending or future liti-gation or infringement claims; negative impacts of antitrust investigations or oth-er governmental investigations and associated litigation relating to the conduct of our business; tax assessments by governmental authorities and changes in our effective tax rate; dependence on key personnel; legislative or regulatory changes limiting our business; political conditions; dependence on and relationships with customers and suppliers; and other risks and uncertainties identified in Item 1A “Risk Factors” and Item 7 “Management’s Discussion and Analysis of Financial Condition and Results of Operations” in our 10-K for the year ended December 31, 2013. The Company undertakes no obligation to update publicly or revise any for-ward-looking statements in light of new information or future events.
For any forward-looking statements contained in this or any other document, we claim the protection of the safe harbor for forward-looking statements con-tained in the Private Securities Litigation Reform Act of 1995, and we assume no obligation to update any such statement.
“Safe Harbor Statement”
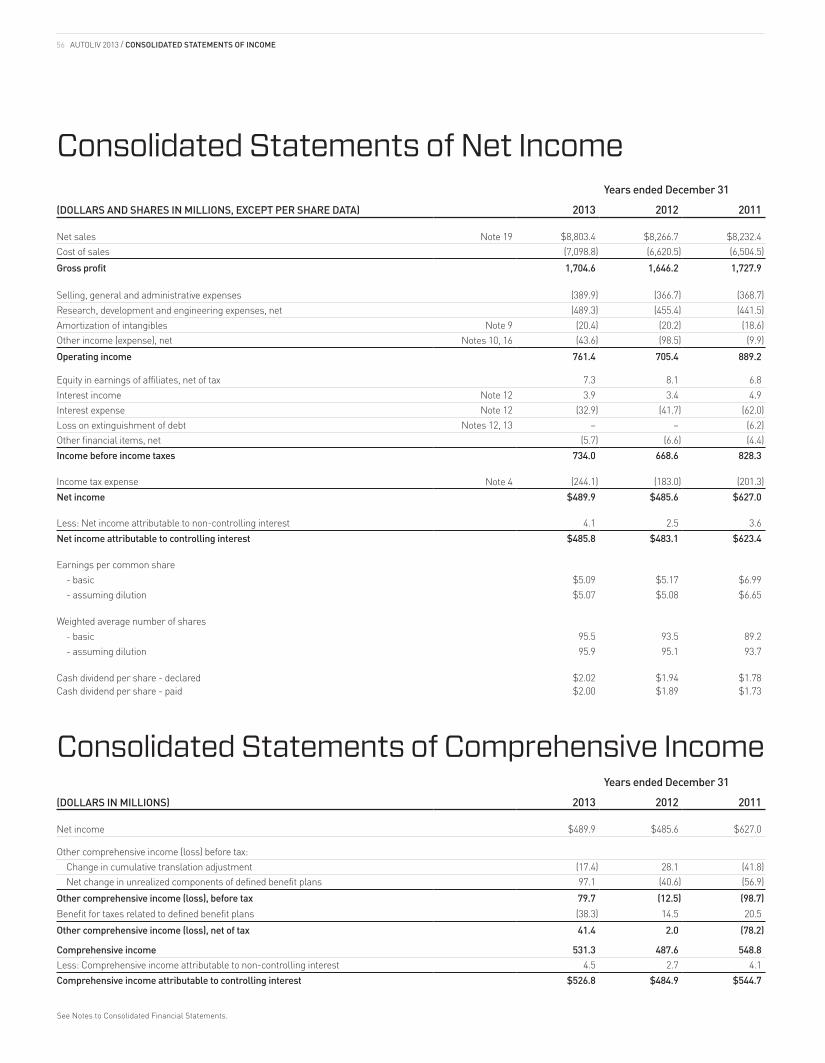
56 AUTOLIV 2013 / CONSOLIDATED STATEMENTS OF INCOME
Years ended December 31
(DOLLARS AND SHARES IN MILLIONS, EXCEPT PER SHARE DATA) 2013 2012 2011
Net sales Note 19 $8,803.4 $8,266.7 $8,232.4Cost of sales (7,098.8) (6,620.5) (6,504.5)Gross profit 1,704.6 1,646.2 1,727.9
Selling, general and administrative expenses (389.9) (366.7) (368.7)Research, development and engineering expenses, net (489.3) (455.4) (441.5)Amortization of intangibles Note 9 (20.4) (20.2) (18.6)Other income (expense), net Notes 10, 16 (43.6) (98.5) (9.9)Operating income 761.4 705.4 889.2
Equity in earnings of affiliates, net of tax 7.3 8.1 6.8Interest income Note 12 3.9 3.4 4.9Interest expense Note 12 (32.9) (41.7) (62.0) Loss on extinguishment of debt Notes 12, 13 – – (6.2)Other financial items, net (5.7) (6.6) (4.4)Income before income taxes 734.0 668.6 828.3
Income tax expense Note 4 (244.1) (183.0) (201.3)Net income $489.9 $485.6 $627.0
Less: Net income attributable to non-controlling interest 4.1 2.5 3.6Net income attributable to controlling interest $485.8 $483.1 $623.4
Earnings per common share - basic $5.09 $5.17 $6.99 - assuming dilution $5.07 $5.08 $6.65
Weighted average number of shares - basic 95.5 93.5 89.2 - assuming dilution 95.9 95.1 93.7
Cash dividend per share - declared $2.02 $1.94 $1.78Cash dividend per share - paid $2.00 $1.89 $1.73
Years ended December 31
(DOLLARS IN MILLIONS) 2013 2012 2011
Net income $489.9 $485.6 $627.0
Other comprehensive income (loss) before tax: Change in cumulative translation adjustment (17.4) 28.1 (41.8) Net change in unrealized components of defined benefit plans 97.1 (40.6) (56.9)Other comprehensive income (loss), before tax 79.7 (12.5) (98.7)Benefit for taxes related to defined benefit plans (38.3) 14.5 20.5Other comprehensive income (loss), net of tax 41.4 2.0 (78.2)
Comprehensive income 531.3 487.6 548.8Less: Comprehensive income attributable to non-controlling interest 4.5 2.7 4.1Comprehensive income attributable to controlling interest $526.8 $484.9 $544.7
Consolidated Statements of Net Income
Consolidated Statements of Comprehensive Income
See Notes to Consolidated Financial Statements.
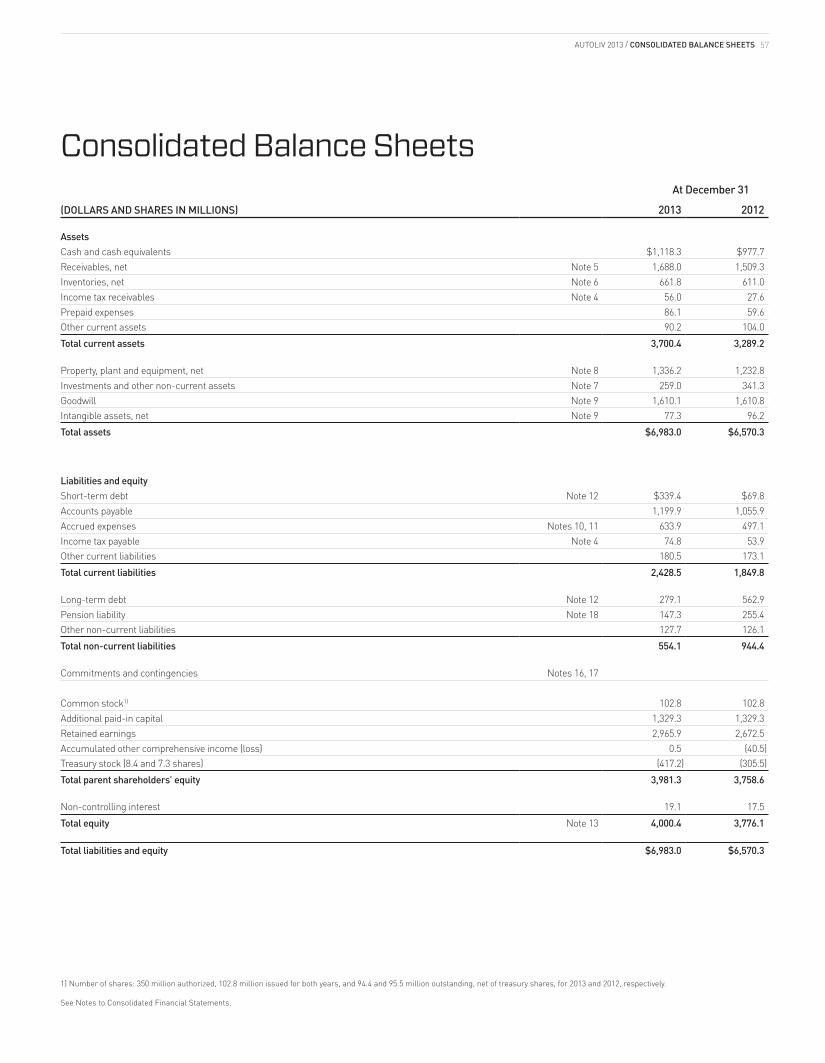
57AUTOLIV 2013 / CONSOLIDATED BALANCE SHEETS
At December 31
(DOLLARS AND SHARES IN MILLIONS) 2013 2012
AssetsCash and cash equivalents $1,118.3 $977.7Receivables, net Note 5 1,688.0 1,509.3Inventories, net Note 6 661.8 611.0Income tax receivables Note 4 56.0 27.6Prepaid expenses 86.1 59.6Other current assets 90.2 104.0Total current assets 3,700.4 3,289.2
Property, plant and equipment, net Note 8 1,336.2 1,232.8Investments and other non-current assets Note 7 259.0 341.3Goodwill Note 9 1,610.1 1,610.8Intangible assets, net Note 9 77.3 96.2Total assets $6,983.0 $6,570.3
Liabilities and equityShort-term debt Note 12 $339.4 $69.8Accounts payable 1,199.9 1,055.9Accrued expenses Notes 10, 11 633.9 497.1Income tax payable Note 4 74.8 53.9Other current liabilities 180.5 173.1Total current liabilities 2,428.5 1,849.8
Long-term debt Note 12 279.1 562.9Pension liability Note 18 147.3 255.4Other non-current liabilities 127.7 126.1Total non-current liabilities 554.1 944.4
Commitments and contingencies Notes 16, 17
Common stock1) 102.8 102.8Additional paid-in capital 1,329.3 1,329.3Retained earnings 2,965.9 2,672.5Accumulated other comprehensive income (loss) 0.5 (40.5)Treasury stock (8.4 and 7.3 shares) (417.2) (305.5)Total parent shareholders’ equity 3,981.3 3,758.6
Non-controlling interest 19.1 17.5Total equity Note 13 4,000.4 3,776.1
Total liabilities and equity $6,983.0 $6,570.3
1) Number of shares: 350 million authorized, 102.8 million issued for both years, and 94.4 and 95.5 million outstanding, net of treasury shares, for 2013 and 2012, respectively.
See Notes to Consolidated Financial Statements.
Consolidated Balance Sheets
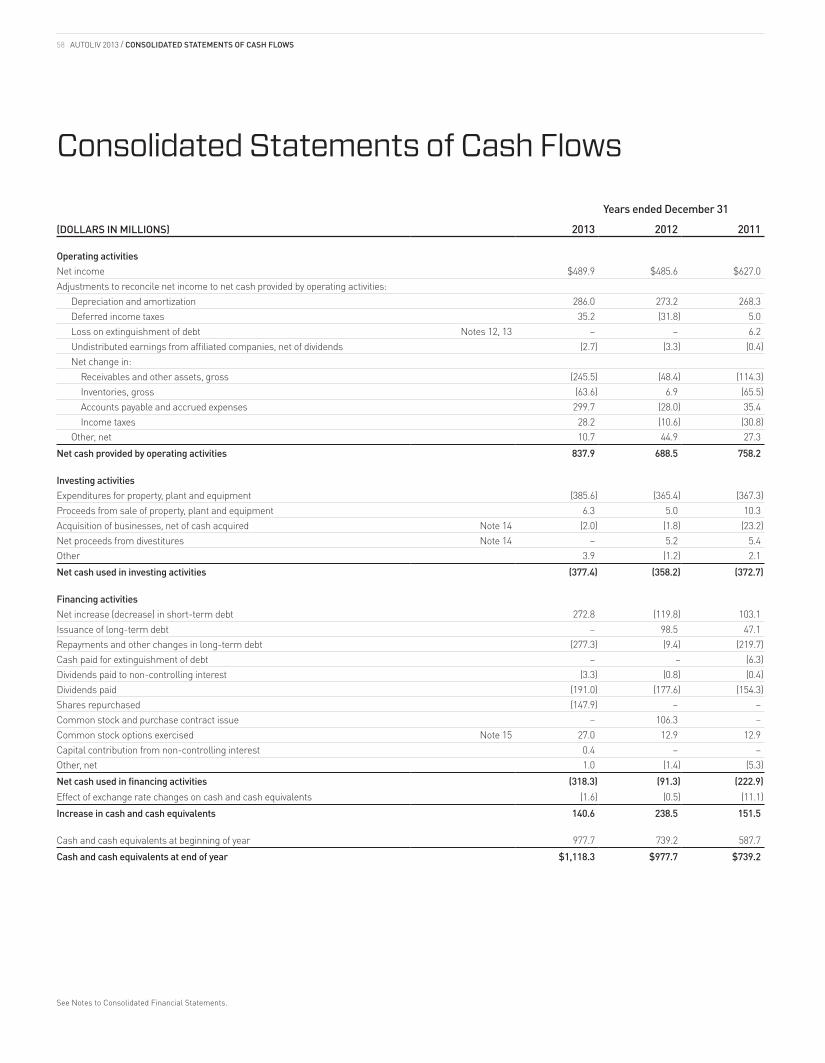
58 AUTOLIV 2013 / CONSOLIDATED STATEMENTS OF CASH FLOWS
See Notes to Consolidated Financial Statements.
Years ended December 31
(DOLLARS IN MILLIONS) 2013 2012 2011
Operating activitiesNet income $489.9 $485.6 $627.0Adjustments to reconcile net income to net cash provided by operating activities: Depreciation and amortization 286.0 273.2 268.3 Deferred income taxes 35.2 (31.8) 5.0 Loss on extinguishment of debt Notes 12, 13 – – 6.2 Undistributed earnings from affiliated companies, net of dividends (2.7) (3.3) (0.4) Net change in: Receivables and other assets, gross (245.5) (48.4) (114.3) Inventories, gross (63.6) 6.9 (65.5) Accounts payable and accrued expenses 299.7 (28.0) 35.4 Income taxes 28.2 (10.6) (30.8) Other, net 10.7 44.9 27.3 Net cash provided by operating activities 837.9 688.5 758.2
Investing activitiesExpenditures for property, plant and equipment (385.6) (365.4) (367.3)Proceeds from sale of property, plant and equipment 6.3 5.0 10.3Acquisition of businesses, net of cash acquired Note 14 (2.0) (1.8) (23.2)Net proceeds from divestitures Note 14 – 5.2 5.4Other 3.9 (1.2) 2.1Net cash used in investing activities (377.4) (358.2) (372.7)
Financing activitiesNet increase (decrease) in short-term debt 272.8 (119.8) 103.1Issuance of long-term debt – 98.5 47.1Repayments and other changes in long-term debt (277.3) (9.4) (219.7)Cash paid for extinguishment of debt – – (6.3)Dividends paid to non-controlling interest (3.3) (0.8) (0.4)Dividends paid (191.0) (177.6) (154.3)Shares repurchased (147.9) – –Common stock and purchase contract issue – 106.3 –Common stock options exercised Note 15 27.0 12.9 12.9Capital contribution from non-controlling interest 0.4 – –Other, net 1.0 (1.4) (5.3)Net cash used in financing activities (318.3) (91.3) (222.9)Effect of exchange rate changes on cash and cash equivalents (1.6) (0.5) (11.1)Increase in cash and cash equivalents 140.6 238.5 151.5
Cash and cash equivalents at beginning of year 977.7 739.2 587.7Cash and cash equivalents at end of year $1,118.3 $977.7 $739.2
Consolidated Statements of Cash Flows
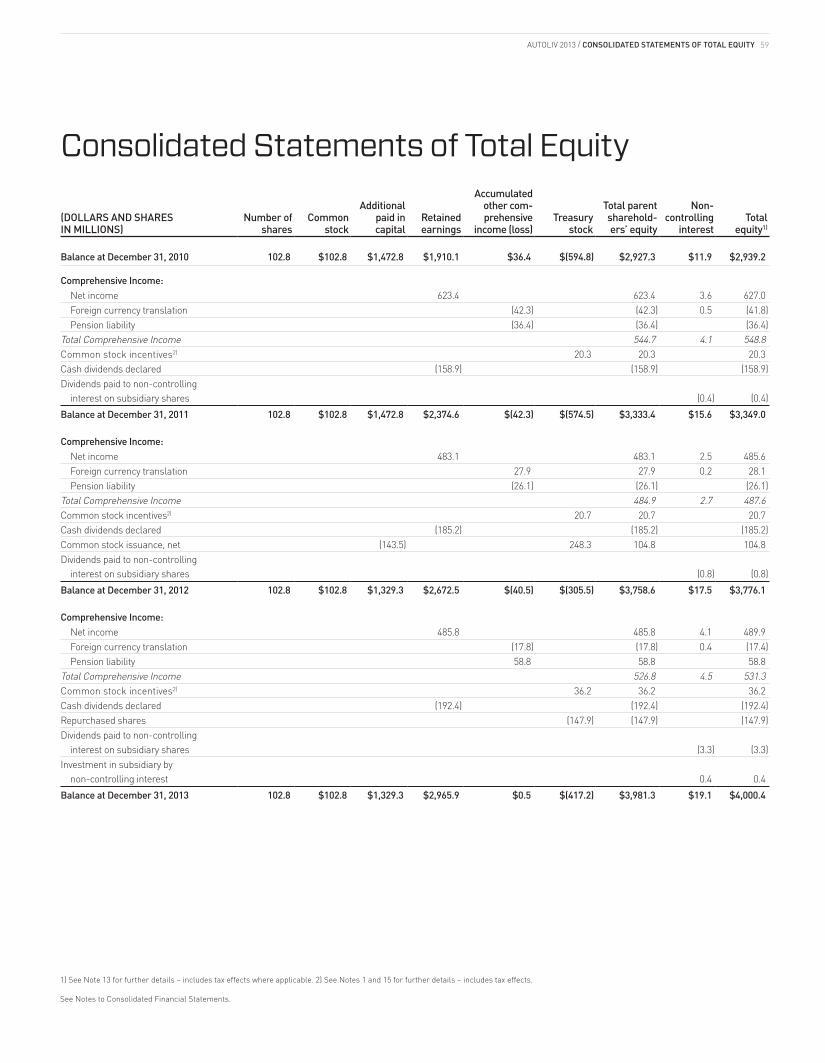
59AUTOLIV 2013 / CONSOLIDATED STATEMENTS OF TOTAL EQUITY
1) See Note 13 for further details – includes tax effects where applicable. 2) See Notes 1 and 15 for further details – includes tax effects.
See Notes to Consolidated Financial Statements.
(DOLLARS AND SHARES IN MILLIONS)
Number of shares
Common stock
Additional paid in capital
Retained earnings
Accumulated other com- p rehensive
income (loss)Treasury
stock
Total parent sharehold-ers’ equity
Non- controlling
interestTotal
equity1)
Balance at December 31, 2010 102.8 $102.8 $1,472.8 $1,910.1 $36.4 $(594.8) $2,927.3 $11.9 $2,939.2
Comprehensive Income: Net income 623.4 623.4 3.6 627.0 Foreign currency translation (42.3) (42.3) 0.5 (41.8) Pension liability (36.4) (36.4) (36.4)Total Comprehensive Income 544.7 4.1 548.8Common stock incentives2) 20.3 20.3 20.3Cash dividends declared (158.9) (158.9) (158.9)Dividends paid to non-controlling interest on subsidiary shares (0.4) (0.4)Balance at December 31, 2011 102.8 $102.8 $1,472.8 $2,374.6 $(42.3) $(574.5) $3,333.4 $15.6 $3,349.0
Comprehensive Income: Net income 483.1 483.1 2.5 485.6 Foreign currency translation 27.9 27.9 0.2 28.1 Pension liability (26.1) (26.1) (26.1)Total Comprehensive Income 484.9 2.7 487.6Common stock incentives2) 20.7 20.7 20.7Cash dividends declared (185.2) (185.2) (185.2)Common stock issuance, net (143.5) 248.3 104.8 104.8Dividends paid to non-controlling interest on subsidiary shares (0.8) (0.8)Balance at December 31, 2012 102.8 $102.8 $1,329.3 $2,672.5 $(40.5) $(305.5) $3,758.6 $17.5 $3,776.1
Comprehensive Income: Net income 485.8 485.8 4.1 489.9 Foreign currency translation (17.8) (17.8) 0.4 (17.4) Pension liability 58.8 58.8 58.8Total Comprehensive Income 526.8 4.5 531.3Common stock incentives2) 36.2 36.2 36.2Cash dividends declared (192.4) (192.4) (192.4)Repurchased shares (147.9) (147.9) (147.9)Dividends paid to non-controlling interest on subsidiary shares (3.3) (3.3)Investment in subsidiary by non-controlling interest 0.4 0.4Balance at December 31, 2013 102.8 $102.8 $1,329.3 $2,965.9 $0.5 $(417.2) $3,981.3 $19.1 $4,000.4
Consolidated Statements of Total Equity
AUTOLIV 2013 / NOTES60
1. Summary of Significant Accounting Policies
(DOLLARS IN MILLIONS, EXCEPT PER SHARE DATA)
NATURE OF OPERATIONSThrough its operating subsidiaries, Autoliv is a supplier of automotive safety sys-tems with a broad range of product offerings, including modules and components for passenger and driver-side airbags, side-impact airbag protection systems, seatbelts, steering wheels, safety electronics, whiplash protection systems and child seats, including components for such systems, as well as night vision sys-tems, radar and other Active Safety systems.
Autoliv has approximately 80 facilities and operates in 29 countries. Our cus-tomers include the world’s largest car manufacturers.
PRINCIPLES OF CONSOLIDATIONThe consolidated financial statements have been prepared in accordance with United States (U.S.) Generally Accepted Accounting Principles (GAAP) and include Autoliv, Inc. and all companies over which Autoliv, Inc. directly or indirectly exer-cises control, which as a general rule means that the Company owns more than 50% of the voting rights.
Consolidation is also required when the Company has both the power to di-rect the activities of a variable interest entity (VIE) and the obligation to absorb losses or right to receive benefits from the VIE that could be significant to the VIE.
All intercompany accounts and transactions within the Company have been eliminated from the consolidated financial statements.
Investments in affiliated companies in which the Company exercises signifi-cant influence over the operations and financial policies, but does not control, are reported using the equity method of accounting. Generally, the Company owns between 20 and 50 percent of such investments.
BUSINESS COMBINATIONSTransactions in which the Company obtains control of a business are accounted for according to the acquisition method as described in Financial Accounting Stan-dards Board (FASB) Accounting Standards Codification (ASC) 805, Business Com-binations. The assets acquired and liabilities assumed are recognized and mea-sured at their full fair values as of the date control is obtained, regardless of the percentage ownership in the acquired entity or how the acquisition was achieved. Acquisition related costs in connection with a business combination are expensed as incurred. Contingent considerations are recognized and measured at fair val-ue at the acquisition date and classified as either liabilities or equity based on ap-propriate GAAP.
USE OF ESTIMATESThe preparation of consolidated financial statements in conformity with GAAP requires management to make estimates and assumptions that affect the re-ported amounts of assets and liabilities, disclosures of contingent assets and li-abilities at the date of the consolidated financial statements, and the reported amounts of net sales and expenses during the reporting period. The accounting estimates that require management’s most significant judgments include the estimation of retroactive price adjustments, valuation of stock based payments, assessment of recoverability of goodwill and intangible assets, estimation of pen-sion benefit obligations based on actuarial assumptions, estimation of accruals for warranty and product liabilities, restructuring charges, uncertain tax posi-tions, valuation allowances and legal proceedings. Actual results could differ from those estimates.
REVENUE RECOGNITIONRevenues are recognized when there is evidence of a sales agreement, delivery of goods has occurred, the sales price is fixed and determinable and the collect-ability of revenue is reasonably assured. The Company records revenue from the sale of manufactured products upon shipment to customers and transfer of title and risk of loss under standard commercial terms (typically F.O.B. shipping point). In those limited instances where other terms are negotiated and agreed, revenue is recorded when title and risk of loss are transferred to the customer.
Accruals are made for retroactive price adjustments when probable and able to be reasonably estimated.
Net sales exclude taxes assessed by a governmental authority that are di-rectly imposed on revenue-producing transactions between the Company and its customers.
COST OF SALESShipping and handling costs are included in Cost of sales in the Consolidated Statements of Net Income. Contracts to supply products which extend for peri-ods in excess of one year are reviewed when conditions indicate that costs may exceed selling prices, resulting in losses. Losses on long-term supply contracts are recognized when probable and estimable.
RESEARCH, DEVELOPMENT AND ENGINEERING (R,D&E)Research and development and most engineering expenses are expensed as in-curred. These expenses are reported net of income from contracts to perform en-gineering design and product development services. Such income is not signifi-cant in any period presented.
Certain engineering expenses related to long-term supply arrangements are capitalized when the defined criteria, such as the existence of a contractual guar-antee for reimbursement, are met. The aggregate amount of such assets is not significant in any period presented.
Tooling is generally agreed upon as a separate contract or a separate compo-nent of an engineering contract, as a pre-production project. Capitalization of tool-ing costs is made only when the specific criteria for capitalization of customer-funded tooling are met or the criteria for capitalization as Property, Plant & Equipment (P,P&E) for tools owned by the Company are fulfilled. Depreciation on the Company’s own tooling is recognized in the Consolidated Statements of Net Income as Cost of sales.
STOCK BASED COMPENSATION The compensation costs for all of the Company’s stock-based compensation awards are determined based on the fair value method as defined in ASC 718, Compensation - Stock Compensation. The Company records the compensation expense for Restricted Stock Units (RSUs), awards under the Stock Incentive Plan, and stock options over the vesting period.
INCOME TAXESCurrent tax liabilities and assets are recognized for the estimated taxes payable or refundable on the tax returns for the current year. In certain circumstances, payments or refunds may extend beyond twelve months, in such cases amounts would be classified as non-current taxes payable or refundable. Deferred tax lia-bilities or assets are recognized for the estimated future tax effects attributable to temporary differences and carry-forwards that result from events that have been recognized in either the financial statements or the tax returns, but not both. The measurement of current and deferred tax liabilities and assets is based on
Notes to Consolidated Financial Statements
61
provisions of enacted tax laws. Deferred tax assets are reduced by the amount of any tax benefits that are not expected to be realized. A valuation allowance is rec-ognized if, based on the weight of all available evidence, it is more-likely-than-not that some portion, or all, of the deferred tax asset will not be realized. Evaluation of the realizability of deferred tax assets is subject to significant judgment requir-ing careful consideration of all facts and circumstances. Current and non-current components of deferred tax balances are reported separately based on financial statement classification of the related asset or liability giving rise to the tempo-rary difference. If a deferred tax asset or liability is not related to an asset or lia-bility that exists for financial reporting purposes, including deferred tax assets re-lated to carry forwards, the deferred tax asset or liability would be classified based on the expected reversal date of the temporary differences. Tax assets and liabil-ities are not offset unless attributable to the same tax jurisdiction and netting is possible according to law and expected to take place in the same period.
Tax benefits associated with tax positions taken in the Company’s income tax returns are initially recognized and measured in the financial statements when it is more likely than not that those tax positions will be sustained upon examina-tion by the relevant taxing authorities. The Company’s evaluation of its tax bene-fits is based on the probability of the tax position being upheld if challenged by the taxing authorities (including through negotiation, appeals, settlement and litiga-tion). Whenever a tax position does not meet the initial recognition criteria, the tax benefit is subsequently recognized and measured if there is a substantive change in the facts and circumstances that cause a change in judgment concerning the sustainability of the tax position upon examination by the relevant taxing author-ities. In cases where tax benefits meet the initial recognition criterion, the Com-pany continues, in subsequent periods, to assess its ability to sustain those posi-tions. A previously recognized tax benefit is derecognized when it is no longer more likely than not that the tax position would be sustained upon examination. Liabil-ities for unrecognized tax benefits are classified as non-current unless the pay-ment of the liability is expected to be made within the next 12 months.
EARNINGS PER SHAREThe Company calculates basic earnings per share (EPS) by dividing net income at-tributable to controlling interest by the weighted-average number of common shares outstanding for the period (net of treasury shares). When it would not be antidilu-tive (such as during periods of net loss), the diluted EPS also reflects the potential dilution that could occur if common stock were issued for awards under the Stock Incentive Plan and for common stock issued upon conversion of the equity units.
CASH EQUIVALENTSThe Company considers all highly liquid investment instruments purchased with a maturity of three months or less to be cash equivalents.
RECEIVABLESThe Company has guidelines for calculating the allowance for bad debts. In de-termining the amount of a bad debt allowance, management uses its judgment to consider factors such as the age of the receivables, the Company’s prior expe-rience with the customer, the experience of other enterprises in the same indus-try, the customer’s ability to pay, and/or an appraisal of current economic condi-tions. Collateral is typically not required. There can be no assurance that the amount ultimately realized for receivables will not be materially different than that assumed in the calculation of the allowance.
FINANCIAL INSTRUMENTSThe Company uses derivative financial instruments, “derivatives”, as part of its debt management to mitigate the market risk that occurs from its exposure to changes in interest and foreign exchange rates. The Company does not enter into derivatives for trading or other speculative purposes. The use of such derivatives is in accordance with the strategies contained in the Company’s overall financial policy. The derivatives outstanding at year-end are foreign exchange swaps. All swaps principally match the terms and maturity of the underlying debt and no swaps have a maturity beyond 2014.
All derivatives are recognized in the consolidated financial statements at fair val-ue. Certain derivatives are from time to time designated either as fair value hedg-es or cash flow hedges in line with the hedge accounting criteria. For certain oth-er derivatives hedge accounting is not applied either because non-hedge accounting treatment creates the same accounting result or the hedge does not meet the hedge accounting requirements, although entered into applying the same rationale concerning mitigating market risk that occurs from changes in interest and foreign exchange rates.
When a hedge is classified as a fair value hedge, the change in the fair value of the hedge is recognized in the Consolidated Statements of Net Income along with the offsetting change in the fair value of the hedged item. When a hedge is classi-fied as a cash flow hedge, any change in the fair value of the hedge is initially re-corded in equity as a component of Other Comprehensive Income, (OCI), and re-classified into the Consolidated Statements of Net Income when the hedge transaction affects net earnings. There were no material reclassifications from OCI to the Consolidated Statements of Net Income in 2013 and, likewise, no material reclassifications are expected in 2014. Any ineffectiveness has been immaterial.
For further details on the Company’s financial instruments, see Note 3.
INVENTORIESThe cost of inventories is computed according to the first-in, first-out method (FIFO). Cost includes the cost of materials, direct labor and the applicable share of manufacturing overhead. Inventories are evaluated based on individual or, in some cases, groups of inventory items. Reserves are established to reduce the value of inventories to the lower of cost or market, with the market generally de-fined as net realizable value for finished goods and replacement cost for raw ma-terials and work-in-process. Excess inventories are quantities of items that ex-ceed anticipated sales or usage for a reasonable period. The Company has guidelines for calculating provisions for excess inventories based on the number of months of inventories on hand compared to anticipated sales or usage. Man-agement uses its judgment to forecast sales or usage and to determine what con-stitutes a reasonable period. There can be no assurance that the amount ulti-mately realized for inventories will not be materially different than that assumed in the calculation of the reserves.
PROPERTY, PLANT AND EQUIPMENTProperty, Plant and Equipment are recorded at historical cost. Construction in progress generally involves short-term projects for which capitalized interest is not significant. The Company provides for depreciation of property, plant and equip-ment computed under the straight-line method over the assets’ estimated use-ful lives. Depreciation on capital leases is recognized in the Consolidated State-ments of Net Income over the shorter of the assets’ expected life or the lease contract terms. Repairs and maintenance are expensed as incurred.
The Company evaluates the carrying value of long-lived assets other than good-will when indications of impairment are evident. Impairment testing is primarily done by using the cash flow method based on undiscounted future cash flows.
GOODWILL AND INTANGIBLE ASSETSGoodwill represents the excess of the fair value of consideration transferred over the fair value of net assets of businesses acquired. Goodwill is not amortized, but is subject to at least an annual review for impairment. Other intangible assets, principally related to acquired technology and contractual relationships, are am-ortized over their useful lives which range from 3 to 25 years.
As of December 31, 2013 and 2012, the Company recorded goodwill of approx-imately $1.6 billion which nearly all is associated with the reporting unit Passive Safety Systems. Approximately $1.2 billion is goodwill associated with the 1997 merger of Autoliv AB and the Automotive Safety Products Division of Morton In-ternational, Inc. The Company performs its annual impairment testing in the fourth quarter of each year. Impairment testing is required more often than annually if an event or circumstance indicates that an impairment, or decline in value, may have occurred. The impairment testing of goodwill is based on two different re-porting units: 1) Passive Safety Systems and 2) Active Safety Systems.
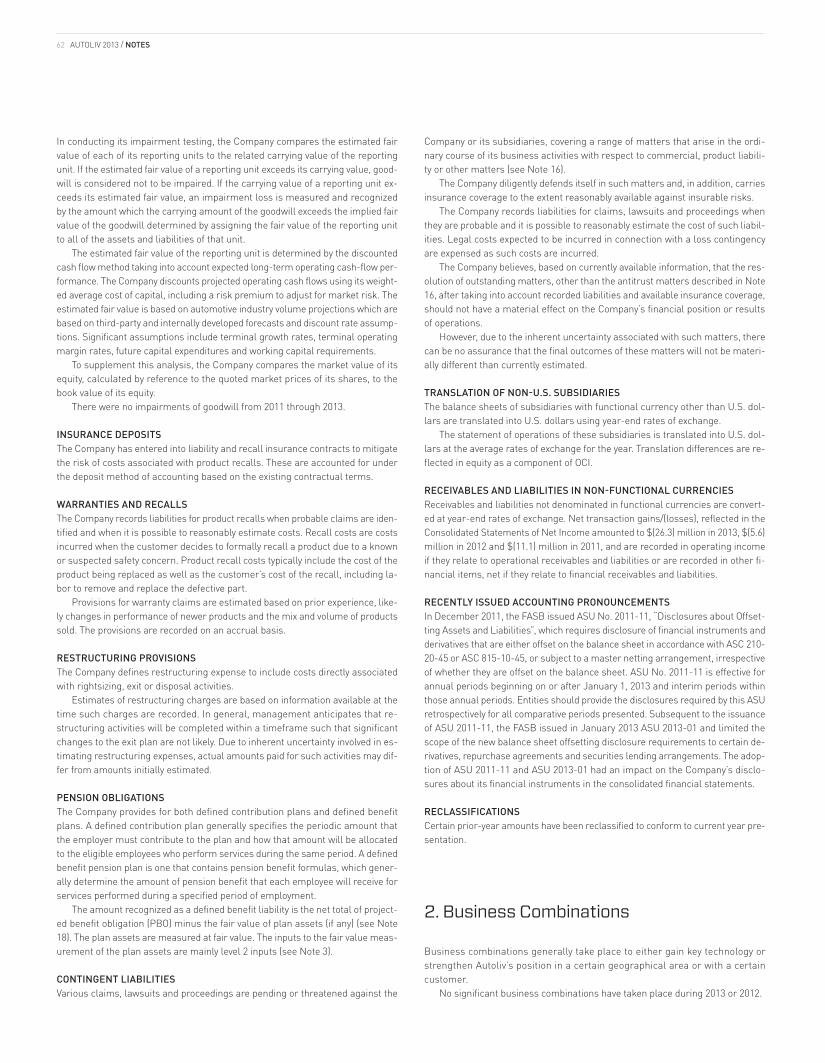
AUTOLIV 2013 / NOTES62
In conducting its impairment testing, the Company compares the estimated fair value of each of its reporting units to the related carrying value of the reporting unit. If the estimated fair value of a reporting unit exceeds its carrying value, good-will is considered not to be impaired. If the carrying value of a reporting unit ex-ceeds its estimated fair value, an impairment loss is measured and recognized by the amount which the carrying amount of the goodwill exceeds the implied fair value of the goodwill determined by assigning the fair value of the reporting unit to all of the assets and liabilities of that unit.
The estimated fair value of the reporting unit is determined by the discounted cash flow method taking into account expected long-term operating cash-flow per-formance. The Company discounts projected operating cash flows using its weight-ed average cost of capital, including a risk premium to adjust for market risk. The estimated fair value is based on automotive industry volume projections which are based on third-party and internally developed forecasts and discount rate assump-tions. Significant assumptions include terminal growth rates, terminal operating margin rates, future capital expenditures and working capital requirements.
To supplement this analysis, the Company compares the market value of its equity, calculated by reference to the quoted market prices of its shares, to the book value of its equity.
There were no impairments of goodwill from 2011 through 2013.
INSURANCE DEPOSITSThe Company has entered into liability and recall insurance contracts to mitigate the risk of costs associated with product recalls. These are accounted for under the deposit method of accounting based on the existing contractual terms.
WARRANTIES AND RECALLSThe Company records liabilities for product recalls when probable claims are iden-tified and when it is possible to reasonably estimate costs. Recall costs are costs incurred when the customer decides to formally recall a product due to a known or suspected safety concern. Product recall costs typically include the cost of the product being replaced as well as the customer’s cost of the recall, including la-bor to remove and replace the defective part.
Provisions for warranty claims are estimated based on prior experience, like-ly changes in performance of newer products and the mix and volume of products sold. The provisions are recorded on an accrual basis.
RESTRUCTURING PROVISIONSThe Company defines restructuring expense to include costs directly associated with rightsizing, exit or disposal activities.
Estimates of restructuring charges are based on information available at the time such charges are recorded. In general, management anticipates that re-structuring activities will be completed within a timeframe such that significant changes to the exit plan are not likely. Due to inherent uncertainty involved in es-timating restructuring expenses, actual amounts paid for such activities may dif-fer from amounts initially estimated.
PENSION OBLIGATIONSThe Company provides for both defined contribution plans and defined benefit plans. A defined contribution plan generally specifies the periodic amount that the employer must contribute to the plan and how that amount will be allocated to the eligible employees who perform services during the same period. A defined benefit pension plan is one that contains pension benefit formulas, which gener-ally determine the amount of pension benefit that each employee will receive for services performed during a specified period of employment.
The amount recognized as a defined benefit liability is the net total of project-ed benefit obligation (PBO) minus the fair value of plan assets (if any) (see Note 18). The plan assets are measured at fair value. The inputs to the fair value meas-urement of the plan assets are mainly level 2 inputs (see Note 3).
CONTINGENT LIABILITIESVarious claims, lawsuits and proceedings are pending or threatened against the
Company or its subsidiaries, covering a range of matters that arise in the ordi-nary course of its business activities with respect to commercial, product liabili-ty or other matters (see Note 16).
The Company diligently defends itself in such matters and, in addition, carries insurance coverage to the extent reasonably available against insurable risks.
The Company records liabilities for claims, lawsuits and proceedings when they are probable and it is possible to reasonably estimate the cost of such liabil-ities. Legal costs expected to be incurred in connection with a loss contingency are expensed as such costs are incurred.
The Company believes, based on currently available information, that the res-olution of outstanding matters, other than the antitrust matters described in Note 16, after taking into account recorded liabilities and available insurance coverage, should not have a material effect on the Company’s financial position or results of operations.
However, due to the inherent uncertainty associated with such matters, there can be no assurance that the final outcomes of these matters will not be materi-ally different than currently estimated.
TRANSLATION OF NON-U.S. SUBSIDIARIESThe balance sheets of subsidiaries with functional currency other than U.S. dol-lars are translated into U.S. dollars using year-end rates of exchange.
The statement of operations of these subsidiaries is translated into U.S. dol-lars at the average rates of exchange for the year. Translation differences are re-flected in equity as a component of OCI.
RECEIVABLES AND LIABILITIES IN NON-FUNCTIONAL CURRENCIESReceivables and liabilities not denominated in functional currencies are convert-ed at year-end rates of exchange. Net transaction gains/(losses), reflected in the Consolidated Statements of Net Income amounted to $(26.3) million in 2013, $(5.6) million in 2012 and $(11.1) million in 2011, and are recorded in operating income if they relate to operational receivables and liabilities or are recorded in other fi-nancial items, net if they relate to financial receivables and liabilities.
RECENTLY ISSUED ACCOUNTING PRONOUNCEMENTSIn December 2011, the FASB issued ASU No. 2011-11, “Disclosures about Offset-ting Assets and Liabilities”, which requires disclosure of financial instruments and derivatives that are either offset on the balance sheet in accordance with ASC 210-20-45 or ASC 815-10-45, or subject to a master netting arrangement, irrespective of whether they are offset on the balance sheet. ASU No. 2011-11 is effective for annual periods beginning on or after January 1, 2013 and interim periods within those annual periods. Entities should provide the disclosures required by this ASU retrospectively for all comparative periods presented. Subsequent to the issuance of ASU 2011-11, the FASB issued in January 2013 ASU 2013-01 and limited the scope of the new balance sheet offsetting disclosure requirements to certain de-rivatives, repurchase agreements and securities lending arrangements. The adop-tion of ASU 2011-11 and ASU 2013-01 had an impact on the Company’s disclo-sures about its financial instruments in the consolidated financial statements.
RECLASSIFICATIONSCertain prior-year amounts have been reclassified to conform to current year pre-sentation.
2. Business Combinations
Business combinations generally take place to either gain key technology or strengthen Autoliv’s position in a certain geographical area or with a certain customer.
No significant business combinations have taken place during 2013 or 2012.
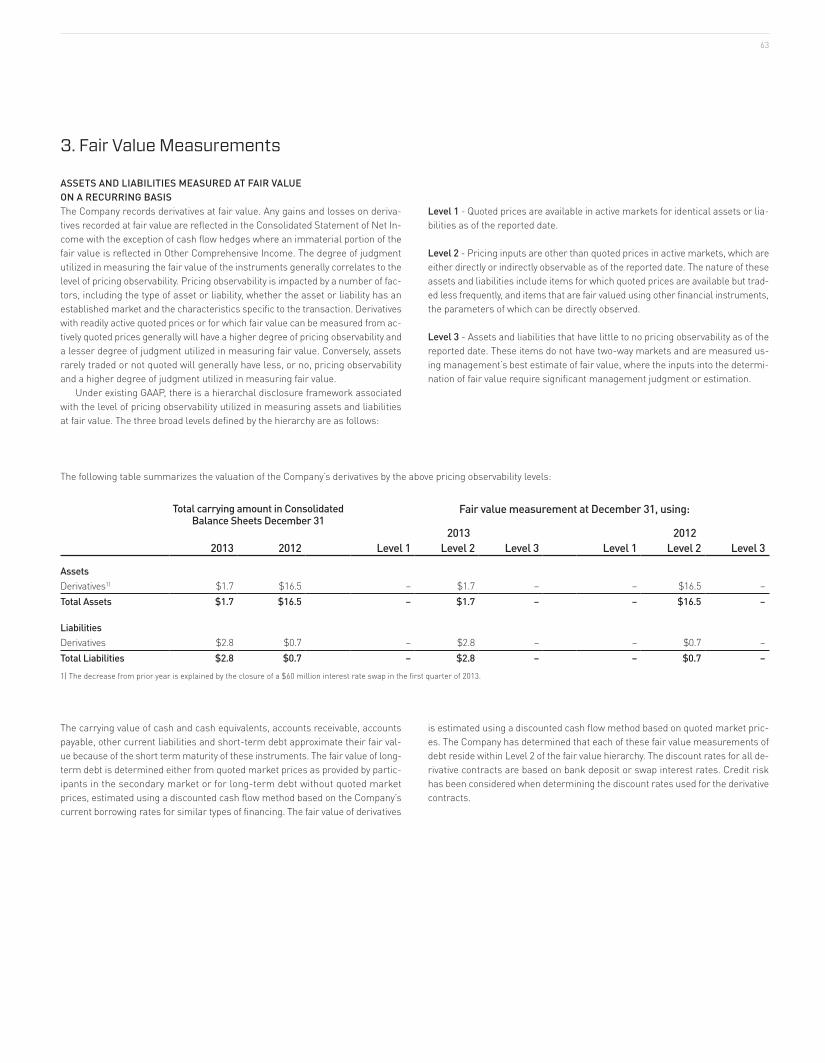
63
3. Fair Value Measurements
ASSETS AND LIABILITIES MEASURED AT FAIR VALUE ON A RECURRING BASIS The Company records derivatives at fair value. Any gains and losses on deriva-tives recorded at fair value are reflected in the Consolidated Statement of Net In-come with the exception of cash flow hedges where an immaterial portion of the fair value is reflected in Other Comprehensive Income. The degree of judgment utilized in measuring the fair value of the instruments generally correlates to the level of pricing observability. Pricing observability is impacted by a number of fac-tors, including the type of asset or liability, whether the asset or liability has an established market and the characteristics specific to the transaction. Derivatives with readily active quoted prices or for which fair value can be measured from ac-tively quoted prices generally will have a higher degree of pricing observability and a lesser degree of judgment utilized in measuring fair value. Conversely, assets rarely traded or not quoted will generally have less, or no, pricing observability and a higher degree of judgment utilized in measuring fair value.
Under existing GAAP, there is a hierarchal disclosure framework associated with the level of pricing observability utilized in measuring assets and liabilities at fair value. The three broad levels defined by the hierarchy are as follows:
Level 1 - Quoted prices are available in active markets for identical assets or lia-bilities as of the reported date.
Level 2 - Pricing inputs are other than quoted prices in active markets, which are either directly or indirectly observable as of the reported date. The nature of these assets and liabilities include items for which quoted prices are available but trad-ed less frequently, and items that are fair valued using other financial instruments, the parameters of which can be directly observed.
Level 3 - Assets and liabilities that have little to no pricing observability as of the reported date. These items do not have two-way markets and are measured us-ing management’s best estimate of fair value, where the inputs into the determi-nation of fair value require significant management judgment or estimation.
The following table summarizes the valuation of the Company’s derivatives by the above pricing observability levels:
Total carrying amount in Consolidated Balance Sheets December 31
Fair value measurement at December 31, using:
2013 20122013 2012 Level 1 Level 2 Level 3 Level 1 Level 2 Level 3
AssetsDerivatives1) $1.7 $16.5 – $1.7 – – $16.5 –Total Assets $1.7 $16.5 – $1.7 – – $16.5 –
LiabilitiesDerivatives $2.8 $0.7 – $2.8 – – $0.7 –Total Liabilities $2.8 $0.7 – $2.8 – – $0.7 –1) The decrease from prior year is explained by the closure of a $60 million interest rate swap in the first quarter of 2013.
The carrying value of cash and cash equivalents, accounts receivable, accounts payable, other current liabilities and short-term debt approximate their fair val-ue because of the short term maturity of these instruments. The fair value of long-term debt is determined either from quoted market prices as provided by partic-ipants in the secondary market or for long-term debt without quoted market prices, estimated using a discounted cash flow method based on the Company’s current borrowing rates for similar types of financing. The fair value of derivatives
is estimated using a discounted cash flow method based on quoted market pric-es. The Company has determined that each of these fair value measurements of debt reside within Level 2 of the fair value hierarchy. The discount rates for all de-rivative contracts are based on bank deposit or swap interest rates. Credit risk has been considered when determining the discount rates used for the derivative contracts.
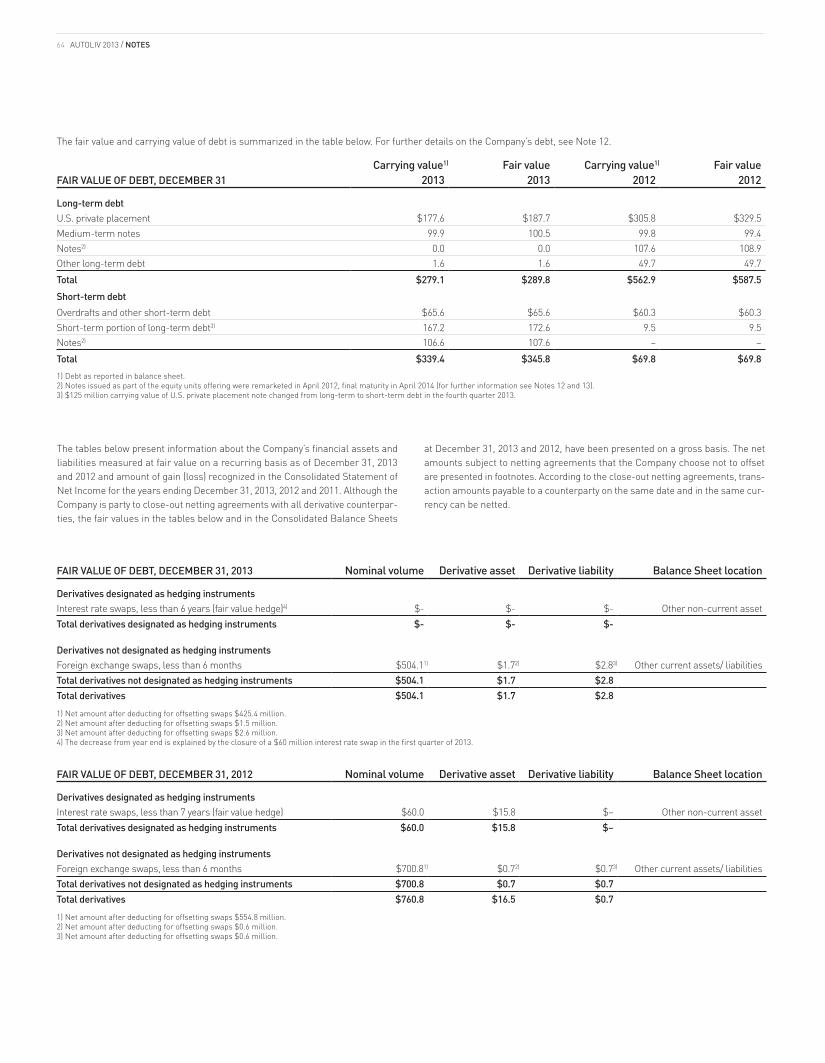
AUTOLIV 2013 / NOTES64
The fair value and carrying value of debt is summarized in the table below. For further details on the Company’s debt, see Note 12.
Carrying value1) Fair value Carrying value1) Fair valueFAIR VALUE OF DEBT, DECEMBER 31 2013 2013 2012 2012
Long-term debtU.S. private placement $177.6 $187.7 $305.8 $329.5Medium-term notes 99.9 100.5 99.8 99.4Notes2) 0.0 0.0 107.6 108.9Other long-term debt 1.6 1.6 49.7 49.7Total $279.1 $289.8 $562.9 $587.5Short-term debtOverdrafts and other short-term debt $65.6 $65.6 $60.3 $60.3Short-term portion of long-term debt3) 167.2 172.6 9.5 9.5Notes2) 106.6 107.6 – –Total $339.4 $345.8 $69.8 $69.81) Debt as reported in balance sheet.2) Notes issued as part of the equity units offering were remarketed in April 2012, final maturity in April 2014 (for further information see Notes 12 and 13).3) $125 million carrying value of U.S. private placement note changed from long-term to short-term debt in the fourth quarter 2013.
The tables below present information about the Company’s financial assets and liabilities measured at fair value on a recurring basis as of December 31, 2013 and 2012 and amount of gain (loss) recognized in the Consolidated Statement of Net Income for the years ending December 31, 2013, 2012 and 2011. Although the Company is party to close-out netting agreements with all derivative counterpar-ties, the fair values in the tables below and in the Consolidated Balance Sheets
at December 31, 2013 and 2012, have been presented on a gross basis. The net amounts subject to netting agreements that the Company choose not to offset are presented in footnotes. According to the close-out netting agreements, trans-action amounts payable to a counterparty on the same date and in the same cur-rency can be netted.
FAIR VALUE OF DEBT, DECEMBER 31, 2013 Nominal volume Derivative asset Derivative liability Balance Sheet location
Derivatives designated as hedging instrumentsInterest rate swaps, less than 6 years (fair value hedge)4) $- $- $- Other non-current assetTotal derivatives designated as hedging instruments $- $- $-
Derivatives not designated as hedging instrumentsForeign exchange swaps, less than 6 months $504.11) $1.72) $2.83) Other current assets/ liabilitiesTotal derivatives not designated as hedging instruments $504.1 $1.7 $2.8Total derivatives $504.1 $1.7 $2.81) Net amount after deducting for offsetting swaps $425.4 million. 2) Net amount after deducting for offsetting swaps $1.5 million. 3) Net amount after deducting for offsetting swaps $2.6 million. 4) The decrease from year end is explained by the closure of a $60 million interest rate swap in the first quarter of 2013.
FAIR VALUE OF DEBT, DECEMBER 31, 2012 Nominal volume Derivative asset Derivative liability Balance Sheet location
Derivatives designated as hedging instrumentsInterest rate swaps, less than 7 years (fair value hedge) $60.0 $15.8 $– Other non-current assetTotal derivatives designated as hedging instruments $60.0 $15.8 $–
Derivatives not designated as hedging instrumentsForeign exchange swaps, less than 6 months $700.81) $0.72) $0.73) Other current assets/ liabilitiesTotal derivatives not designated as hedging instruments $700.8 $0.7 $0.7Total derivatives $760.8 $16.5 $0.71) Net amount after deducting for offsetting swaps $554.8 million. 2) Net amount after deducting for offsetting swaps $0.6 million.3) Net amount after deducting for offsetting swaps $0.6 million.
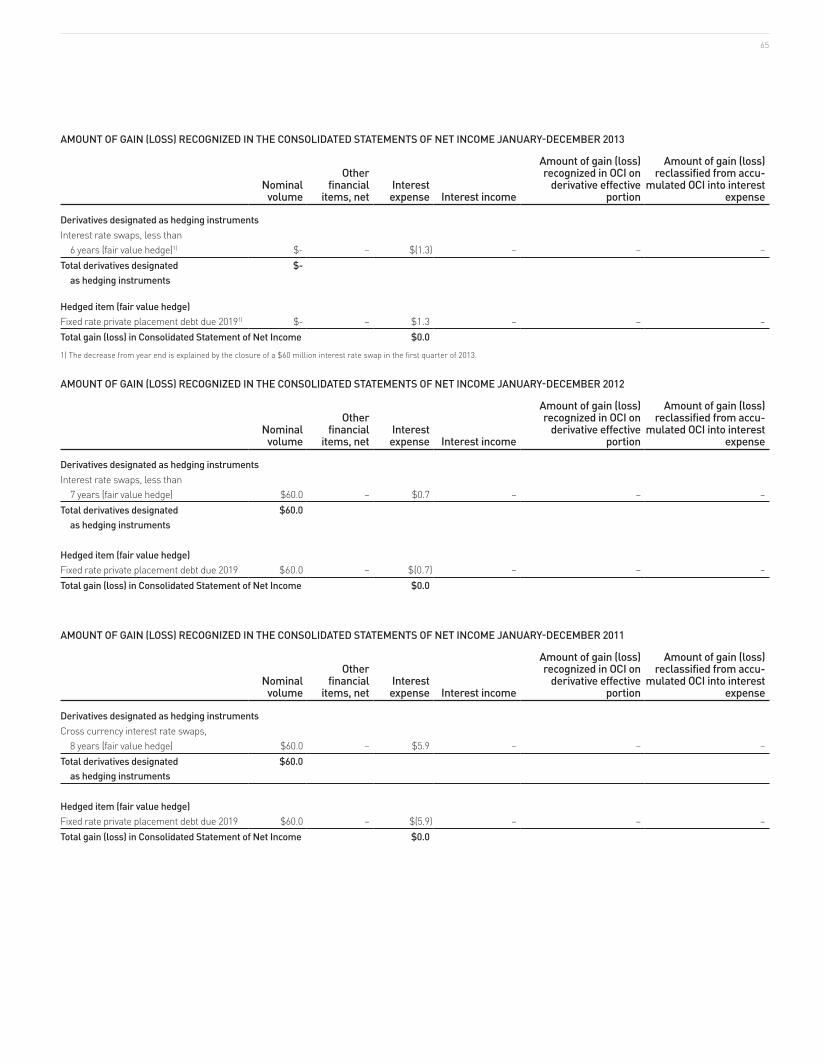
65
AMOUNT OF GAIN (LOSS) RECOGNIZED IN THE CONSOLIDATED STATEMENTS OF NET INCOME JANUARY-DECEMBER 2013
Nominal volume
Other financial
items, netInterest expense Interest income
Amount of gain (loss) recognized in OCI on
derivative effective portion
Amount of gain (loss) reclassified from accu-
mulated OCI into interest expense
Derivatives designated as hedging instrumentsInterest rate swaps, less than 6 years (fair value hedge)1) $- – $(1.3) – – –Total derivatives designated $- as hedging instruments
Hedged item (fair value hedge)Fixed rate private placement debt due 20191) $- – $1.3 – – –Total gain (loss) in Consolidated Statement of Net Income $0.01) The decrease from year end is explained by the closure of a $60 million interest rate swap in the first quarter of 2013.
AMOUNT OF GAIN (LOSS) RECOGNIZED IN THE CONSOLIDATED STATEMENTS OF NET INCOME JANUARY-DECEMBER 2012
Nominal volume
Other financial
items, netInterest expense Interest income
Amount of gain (loss) recognized in OCI on
derivative effective portion
Amount of gain (loss) reclassified from accu-
mulated OCI into interest expense
Derivatives designated as hedging instrumentsInterest rate swaps, less than 7 years (fair value hedge) $60.0 – $0.7 – – –Total derivatives designated $60.0 as hedging instruments
Hedged item (fair value hedge)Fixed rate private placement debt due 2019 $60.0 – $(0.7) – – –Total gain (loss) in Consolidated Statement of Net Income $0.0
AMOUNT OF GAIN (LOSS) RECOGNIZED IN THE CONSOLIDATED STATEMENTS OF NET INCOME JANUARY-DECEMBER 2011
Nominal volume
Other financial
items, netInterest expense Interest income
Amount of gain (loss) recognized in OCI on
derivative effective portion
Amount of gain (loss) reclassified from accu-
mulated OCI into interest expense
Derivatives designated as hedging instrumentsCross currency interest rate swaps, 8 years (fair value hedge) $60.0 – $5.9 – – –Total derivatives designated $60.0 as hedging instruments
Hedged item (fair value hedge)Fixed rate private placement debt due 2019 $60.0 – $(5.9) – – –Total gain (loss) in Consolidated Statement of Net Income $0.0
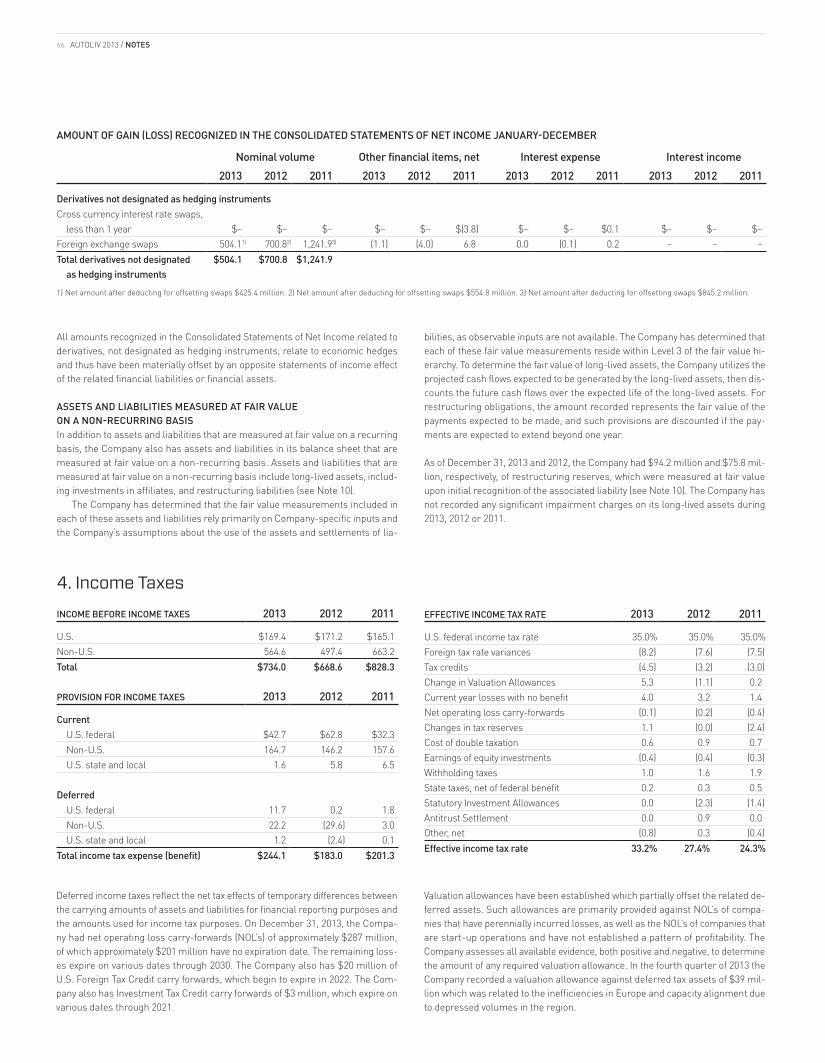
AUTOLIV 2013 / NOTES66
AMOUNT OF GAIN (LOSS) RECOGNIZED IN THE CONSOLIDATED STATEMENTS OF NET INCOME JANUARY-DECEMBER
Nominal volume Other financial items, net Interest expense Interest income2013 2012 2011 2013 2012 2011 2013 2012 2011 2013 2012 2011
Derivatives not designated as hedging instrumentsCross currency interest rate swaps, less than 1 year $– $– $– $– $– $(3.8) $– $– $0.1 $– $– $–Foreign exchange swaps 504.11) 700.82) 1,241.93) (1.1) (4.0) 6.8 0.0 (0.1) 0.2 – – –Total derivatives not designated $504.1 $700.8 $1,241.9 as hedging instruments
1) Net amount after deducting for offsetting swaps $425.4 million. 2) Net amount after deducting for offsetting swaps $554.8 million. 3) Net amount after deducting for offsetting swaps $845.2 million.
4. Income Taxes
INCOME BEFORE INCOME TAXES 2013 2012 2011
U.S. $169.4 $171.2 $165.1Non-U.S. 564.6 497.4 663.2Total $734.0 $668.6 $828.3
PROVISION FOR INCOME TAXES 2013 2012 2011
Current U.S. federal $42.7 $62.8 $32.3 Non-U.S. 164.7 146.2 157.6 U.S. state and local 1.6 5.8 6.5
Deferred U.S. federal 11.7 0.2 1.8 Non-U.S. 22.2 (29.6) 3.0 U.S. state and local 1.2 (2.4) 0.1Total income tax expense (benefit) $244.1 $183.0 $201.3
EFFECTIVE INCOME TAX RATE 2013 2012 2011
U.S. federal income tax rate 35.0% 35.0% 35.0%Foreign tax rate variances (8.2) (7.6) (7.5)Tax credits (4.5) (3.2) (3.0)Change in Valuation Allowances 5.3 (1.1) 0.2Current year losses with no benefit 4.0 3.2 1.4Net operating loss carry-forwards (0.1) (0.2) (0.4)Changes in tax reserves 1.1 (0.0) (2.4)Cost of double taxation 0.6 0.9 0.7Earnings of equity investments (0.4) (0.4) (0.3)Withholding taxes 1.0 1.6 1.9State taxes, net of federal benefit 0.2 0.3 0.5Statutory Investment Allowances 0.0 (2.3) (1.4)Antitrust Settlement 0.0 0.9 0.0Other, net (0.8) 0.3 (0.4)Effective income tax rate 33.2% 27.4% 24.3%
All amounts recognized in the Consolidated Statements of Net Income related to derivatives, not designated as hedging instruments, relate to economic hedges and thus have been materially offset by an opposite statements of income effect of the related financial liabilities or financial assets.
ASSETS AND LIABILITIES MEASURED AT FAIR VALUE ON A NON-RECURRING BASIS In addition to assets and liabilities that are measured at fair value on a recurring basis, the Company also has assets and liabilities in its balance sheet that are measured at fair value on a non-recurring basis. Assets and liabilities that are measured at fair value on a non-recurring basis include long-lived assets, includ-ing investments in affiliates, and restructuring liabilities (see Note 10).
The Company has determined that the fair value measurements included in each of these assets and liabilities rely primarily on Company-specific inputs and the Company’s assumptions about the use of the assets and settlements of lia-
bilities, as observable inputs are not available. The Company has determined that each of these fair value measurements reside within Level 3 of the fair value hi-erarchy. To determine the fair value of long-lived assets, the Company utilizes the projected cash flows expected to be generated by the long-lived assets, then dis-counts the future cash flows over the expected life of the long-lived assets. For restructuring obligations, the amount recorded represents the fair value of the payments expected to be made, and such provisions are discounted if the pay-ments are expected to extend beyond one year.
As of December 31, 2013 and 2012, the Company had $94.2 million and $75.8 mil-lion, respectively, of restructuring reserves, which were measured at fair value upon initial recognition of the associated liability (see Note 10). The Company has not recorded any significant impairment charges on its long-lived assets during 2013, 2012 or 2011.
Deferred income taxes reflect the net tax effects of temporary differences between the carrying amounts of assets and liabilities for financial reporting purposes and the amounts used for income tax purposes. On December 31, 2013, the Compa-ny had net operating loss carry-forwards (NOL’s) of approximately $287 million, of which approximately $201 million have no expiration date. The remaining loss-es expire on various dates through 2030. The Company also has $20 million of U.S. Foreign Tax Credit carry forwards, which begin to expire in 2022. The Com-pany also has Investment Tax Credit carry forwards of $3 million, which expire on various dates through 2021.
Valuation allowances have been established which partially offset the related de-ferred assets. Such allowances are primarily provided against NOL’s of compa-nies that have perennially incurred losses, as well as the NOL’s of companies that are start-up operations and have not established a pattern of profitability. The Company assesses all available evidence, both positive and negative, to determine the amount of any required valuation allowance. In the fourth quarter of 2013 the Company recorded a valuation allowance against deferred tax assets of $39 mil-lion which was related to the inefficiencies in Europe and capacity alignment due to depressed volumes in the region.
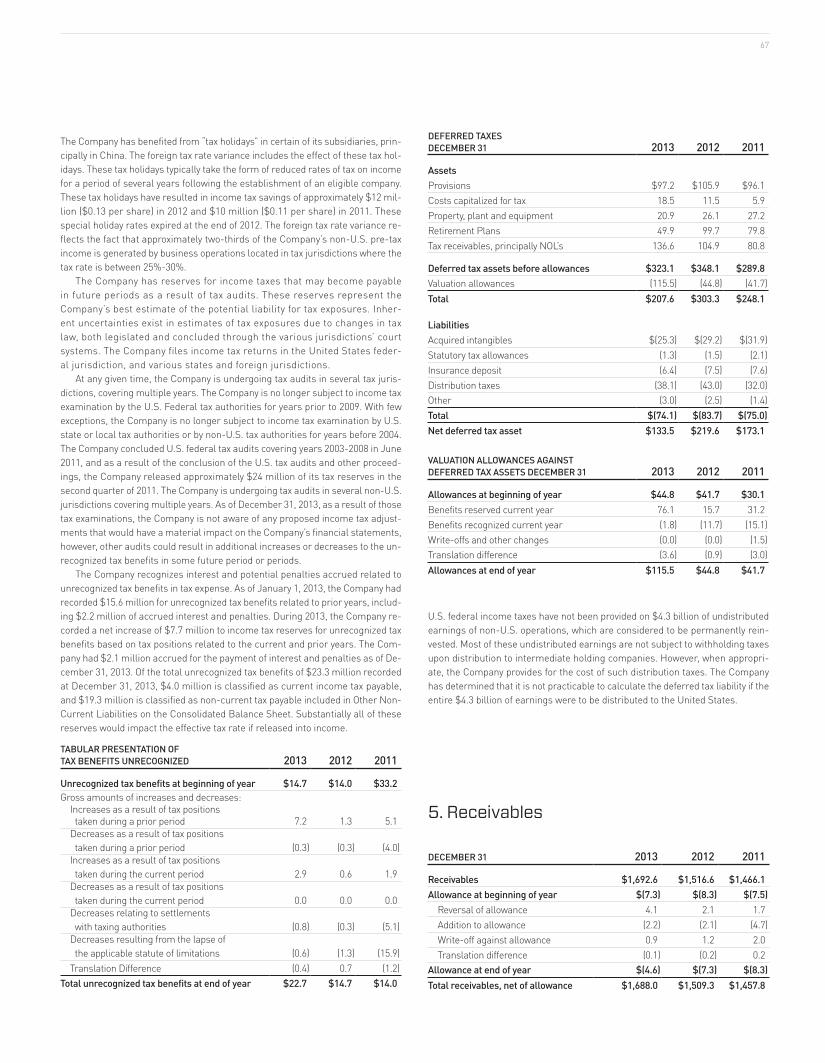
67
5. Receivables
DECEMBER 31 2013 2012 2011
Receivables $1,692.6 $1,516.6 $1,466.1Allowance at beginning of year $(7.3) $(8.3) $(7.5) Reversal of allowance 4.1 2.1 1.7 Addition to allowance (2.2) (2.1) (4.7) Write-off against allowance 0.9 1.2 2.0 Translation difference (0.1) (0.2) 0.2Allowance at end of year $(4.6) $(7.3) $(8.3)Total receivables, net of allowance $1,688.0 $1,509.3 $1,457.8
The Company has benefited from “tax holidays” in certain of its subsidiaries, prin-cipally in China. The foreign tax rate variance includes the effect of these tax hol-idays. These tax holidays typically take the form of reduced rates of tax on income for a period of several years following the establishment of an eligible company. These tax holidays have resulted in income tax savings of approximately $12 mil-lion ($0.13 per share) in 2012 and $10 million ($0.11 per share) in 2011. These special holiday rates expired at the end of 2012. The foreign tax rate variance re-flects the fact that approximately two-thirds of the Company’s non-U.S. pre-tax income is generated by business operations located in tax jurisdictions where the tax rate is between 25%-30%.
The Company has reserves for income taxes that may become payable in future periods as a result of tax audits. These reserves represent the Company’s best estimate of the potential liability for tax exposures. Inher-ent uncertainties exist in estimates of tax exposures due to changes in tax law, both legislated and concluded through the various jurisdictions’ court systems. The Company files income tax returns in the United States feder-al jurisdiction, and various states and foreign jurisdictions.
At any given time, the Company is undergoing tax audits in several tax juris-dictions, covering multiple years. The Company is no longer subject to income tax examination by the U.S. Federal tax authorities for years prior to 2009. With few exceptions, the Company is no longer subject to income tax examination by U.S. state or local tax authorities or by non-U.S. tax authorities for years before 2004. The Company concluded U.S. federal tax audits covering years 2003-2008 in June 2011, and as a result of the conclusion of the U.S. tax audits and other proceed-ings, the Company released approximately $24 million of its tax reserves in the second quarter of 2011. The Company is undergoing tax audits in several non-U.S. jurisdictions covering multiple years. As of December 31, 2013, as a result of those tax examinations, the Company is not aware of any proposed income tax adjust-ments that would have a material impact on the Company’s financial statements, however, other audits could result in additional increases or decreases to the un-recognized tax benefits in some future period or periods.
The Company recognizes interest and potential penalties accrued related to unrecognized tax benefits in tax expense. As of January 1, 2013, the Company had recorded $15.6 million for unrecognized tax benefits related to prior years, includ-ing $2.2 million of accrued interest and penalties. During 2013, the Company re-corded a net increase of $7.7 million to income tax reserves for unrecognized tax benefits based on tax positions related to the current and prior years. The Com-pany had $2.1 million accrued for the payment of interest and penalties as of De-cember 31, 2013. Of the total unrecognized tax benefits of $23.3 million recorded at December 31, 2013, $4.0 million is classified as current income tax payable, and $19.3 million is classified as non-current tax payable included in Other Non-Current Liabilities on the Consolidated Balance Sheet. Substantially all of these reserves would impact the effective tax rate if released into income.
TABULAR PRESENTATION OF TAX BENEFITS UNRECOGNIZED 2013 2012 2011
Unrecognized tax benefits at beginning of year $14.7 $14.0 $33.2Gross amounts of increases and decreases: Increases as a result of tax positions taken during a prior period 7.2 1.3 5.1 Decreases as a result of tax positions taken during a prior period (0.3) (0.3) (4.0) Increases as a result of tax positions taken during the current period 2.9 0.6 1.9 Decreases as a result of tax positions taken during the current period 0.0 0.0 0.0 Decreases relating to settlements with taxing authorities (0.8) (0.3) (5.1) Decreases resulting from the lapse of the applicable statute of limitations (0.6) (1.3) (15.9) Translation Difference (0.4) 0.7 (1.2)Total unrecognized tax benefits at end of year $22.7 $14.7 $14.0
DEFERRED TAXES DECEMBER 31 2013 2012 2011
AssetsProvisions $97.2 $105.9 $96.1Costs capitalized for tax 18.5 11.5 5.9Property, plant and equipment 20.9 26.1 27.2Retirement Plans 49.9 99.7 79.8Tax receivables, principally NOL’s 136.6 104.9 80.8
Deferred tax assets before allowances $323.1 $348.1 $289.8Valuation allowances (115.5) (44.8) (41.7)Total $207.6 $303.3 $248.1
LiabilitiesAcquired intangibles $(25.3) $(29.2) $(31.9)Statutory tax allowances (1.3) (1.5) (2.1)Insurance deposit (6.4) (7.5) (7.6)Distribution taxes (38.1) (43.0) (32.0)Other (3.0) (2.5) (1.4)Total $(74.1) $(83.7) $(75.0)Net deferred tax asset $133.5 $219.6 $173.1
VALUATION ALLOWANCES AGAINST DEFERRED TAX ASSETS DECEMBER 31 2013 2012 2011
Allowances at beginning of year $44.8 $41.7 $30.1Benefits reserved current year 76.1 15.7 31.2Benefits recognized current year (1.8) (11.7) (15.1)Write-offs and other changes (0.0) (0.0) (1.5)Translation difference (3.6) (0.9) (3.0)Allowances at end of year $115.5 $44.8 $41.7
U.S. federal income taxes have not been provided on $4.3 billion of undistributed earnings of non-U.S. operations, which are considered to be permanently rein-vested. Most of these undistributed earnings are not subject to withholding taxes upon distribution to intermediate holding companies. However, when appropri-ate, the Company provides for the cost of such distribution taxes. The Company has determined that it is not practicable to calculate the deferred tax liability if the entire $4.3 billion of earnings were to be distributed to the United States.
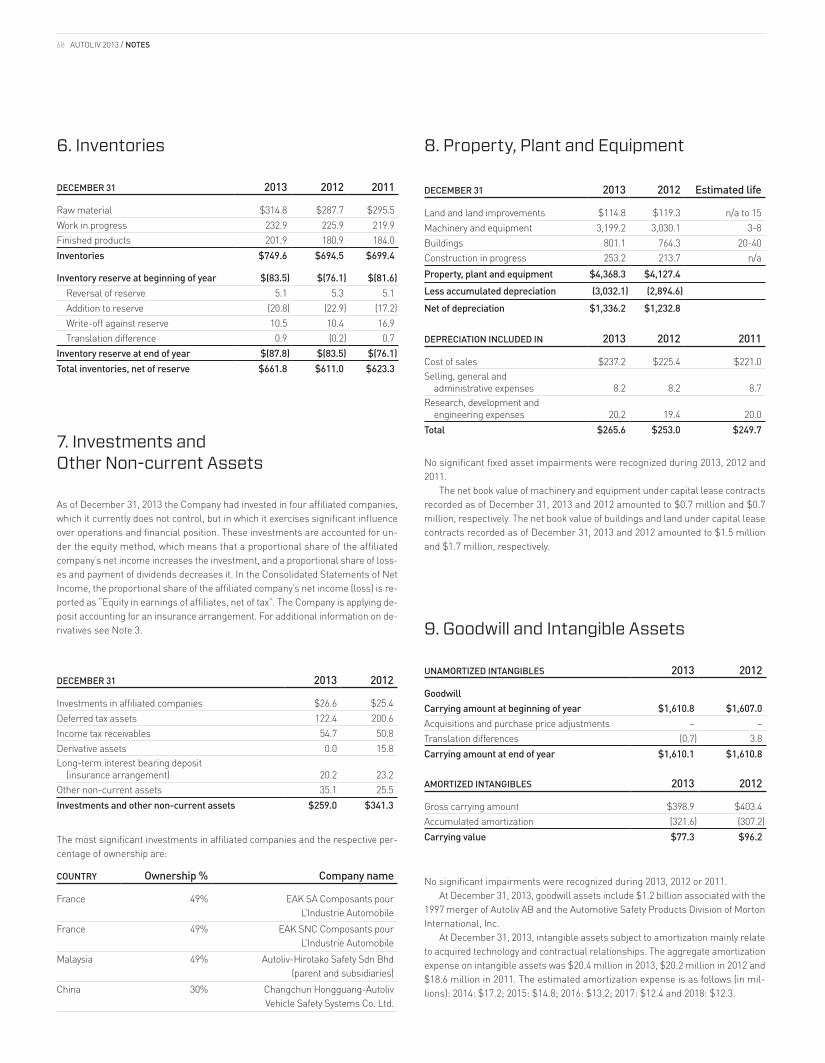
AUTOLIV 2013 / NOTES68
6. Inventories
DECEMBER 31 2013 2012 2011
Raw material $314.8 $287.7 $295.5Work in progress 232.9 225.9 219.9Finished products 201.9 180.9 184.0Inventories $749.6 $694.5 $699.4
Inventory reserve at beginning of year $(83.5) $(76.1) $(81.6) Reversal of reserve 5.1 5.3 5.1 Addition to reserve (20.8) (22.9) (17.2) Write-off against reserve 10.5 10.4 16.9 Translation difference 0.9 (0.2) 0.7Inventory reserve at end of year $(87.8) $(83.5) $(76.1)Total inventories, net of reserve $661.8 $611.0 $623.3
7. Investments and Other Non-current Assets
As of December 31, 2013 the Company had invested in four affiliated companies, which it currently does not control, but in which it exercises significant influence over operations and financial position. These investments are accounted for un-der the equity method, which means that a proportional share of the affiliated company’s net income increases the investment, and a proportional share of loss-es and payment of dividends decreases it. In the Consolidated Statements of Net Income, the proportional share of the affiliated company’s net income (loss) is re-ported as “Equity in earnings of affiliates, net of tax”. The Company is applying de-posit accounting for an insurance arrangement. For additional information on de-rivatives see Note 3.
DECEMBER 31 2013 2012
Investments in affiliated companies $26.6 $25.4Deferred tax assets 122.4 200.6Income tax receivables 54.7 50.8Derivative assets 0.0 15.8Long-term interest bearing deposit (insurance arrangement) 20.2 23.2Other non-current assets 35.1 25.5Investments and other non-current assets $259.0 $341.3
The most significant investments in affiliated companies and the respective per-centage of ownership are:
COUNTRY Ownership % Company name
France 49% EAK SA Composants pour L’Industrie Automobile
France 49% EAK SNC Composants pour L’Industrie Automobile
Malaysia 49% Autoliv-Hirotako Safety Sdn Bhd (parent and subsidiaries)
China 30% Changchun Hongguang-Autoliv Vehicle Safety Systems Co. Ltd.
9. Goodwill and Intangible Assets
UNAMORTIZED INTANGIBLES 2013 2012
Goodwill Carrying amount at beginning of year $1,610.8 $1,607.0Acquisitions and purchase price adjustments – –Translation differences (0.7) 3.8Carrying amount at end of year $1,610.1 $1,610.8
AMORTIZED INTANGIBLES 2013 2012
Gross carrying amount $398.9 $403.4Accumulated amortization (321.6) (307.2)Carrying value $77.3 $96.2
No significant impairments were recognized during 2013, 2012 or 2011. At December 31, 2013, goodwill assets include $1.2 billion associated with the
1997 merger of Autoliv AB and the Automotive Safety Products Division of Morton International, Inc.
At December 31, 2013, intangible assets subject to amortization mainly relate to acquired technology and contractual relationships. The aggregate amortization expense on intangible assets was $20.4 million in 2013, $20.2 million in 2012 and $18.6 million in 2011. The estimated amortization expense is as follows (in mil-lions): 2014: $17.2; 2015: $14.8; 2016: $13.2; 2017: $12.4 and 2018: $12.3.
8. Property, Plant and Equipment
DECEMBER 31 2013 2012 Estimated life
Land and land improvements $114.8 $119.3 n/a to 15Machinery and equipment 3,199.2 3,030.1 3-8Buildings 801.1 764.3 20-40Construction in progress 253.2 213.7 n/aProperty, plant and equipment $4,368.3 $4,127.4Less accumulated depreciation (3,032.1) (2,894.6)Net of depreciation $1,336.2 $1,232.8
DEPRECIATION INCLUDED IN 2013 2012 2011
Cost of sales $237.2 $225.4 $221.0Selling, general and administrative expenses 8.2 8.2 8.7Research, development and engineering expenses 20.2 19.4 20.0Total $265.6 $253.0 $249.7
No significant fixed asset impairments were recognized during 2013, 2012 and 2011.
The net book value of machinery and equipment under capital lease contracts recorded as of December 31, 2013 and 2012 amounted to $0.7 million and $0.7 million, respectively. The net book value of buildings and land under capital lease contracts recorded as of December 31, 2013 and 2012 amounted to $1.5 million and $1.7 million, respectively.
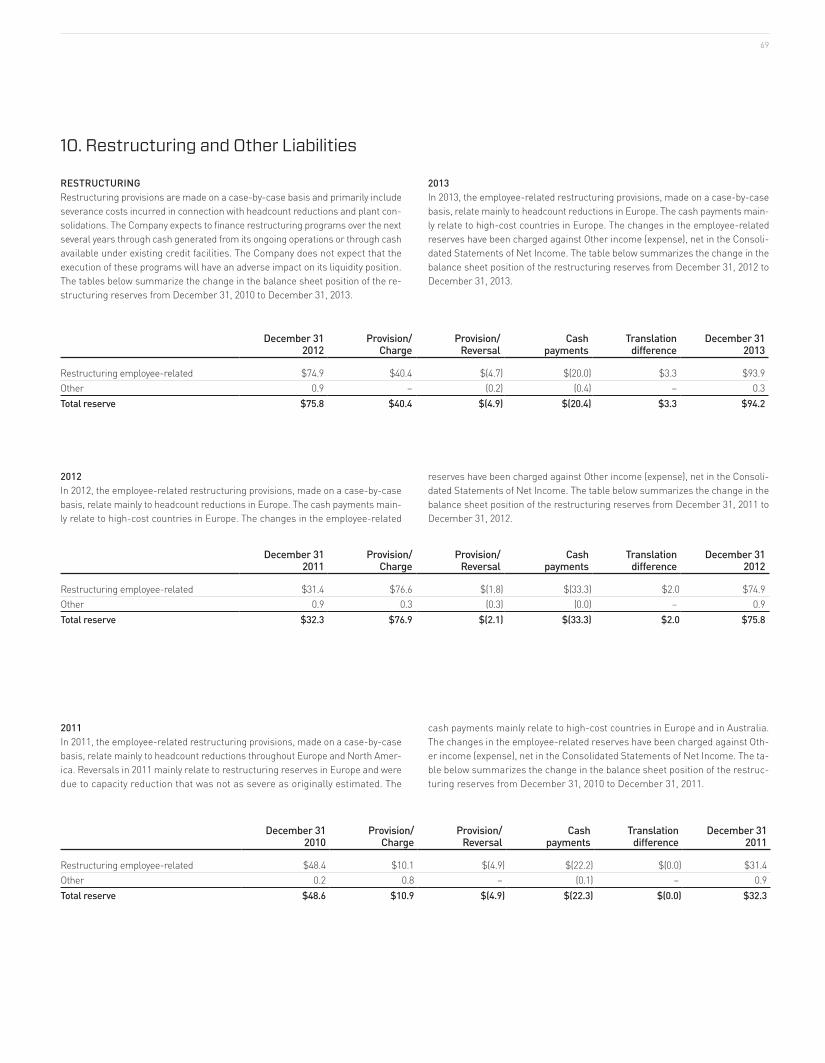
69
10. Restructuring and Other Liabilities
RESTRUCTURINGRestructuring provisions are made on a case-by-case basis and primarily include severance costs incurred in connection with headcount reductions and plant con-solidations. The Company expects to finance restructuring programs over the next several years through cash generated from its ongoing operations or through cash available under existing credit facilities. The Company does not expect that the execution of these programs will have an adverse impact on its liquidity position. The tables below summarize the change in the balance sheet position of the re-structuring reserves from December 31, 2010 to December 31, 2013.
2013In 2013, the employee-related restructuring provisions, made on a case-by-case basis, relate mainly to headcount reductions in Europe. The cash payments main-ly relate to high-cost countries in Europe. The changes in the employee-related reserves have been charged against Other income (expense), net in the Consoli-dated Statements of Net Income. The table below summarizes the change in the balance sheet position of the restructuring reserves from December 31, 2012 to December 31, 2013.
December 312012
Provision/Charge
Provision/Reversal
Cashpayments
Translationdifference
December 312013
Restructuring employee-related $74.9 $40.4 $(4.7) $(20.0) $3.3 $93.9Other 0.9 – (0.2) (0.4) – 0.3Total reserve $75.8 $40.4 $(4.9) $(20.4) $3.3 $94.2
2012In 2012, the employee-related restructuring provisions, made on a case-by-case basis, relate mainly to headcount reductions in Europe. The cash payments main-ly relate to high-cost countries in Europe. The changes in the employee-related
reserves have been charged against Other income (expense), net in the Consoli-dated Statements of Net Income. The table below summarizes the change in the balance sheet position of the restructuring reserves from December 31, 2011 to December 31, 2012.
2011In 2011, the employee-related restructuring provisions, made on a case-by-case basis, relate mainly to headcount reductions throughout Europe and North Amer-ica. Reversals in 2011 mainly relate to restructuring reserves in Europe and were due to capacity reduction that was not as severe as originally estimated. The
cash payments mainly relate to high-cost countries in Europe and in Australia. The changes in the employee-related reserves have been charged against Oth-er income (expense), net in the Consolidated Statements of Net Income. The ta-ble below summarizes the change in the balance sheet position of the restruc-turing reserves from December 31, 2010 to December 31, 2011.
December 312011
Provision/Charge
Provision/Reversal
Cashpayments
Translationdifference
December 312012
Restructuring employee-related $31.4 $76.6 $(1.8) $(33.3) $2.0 $74.9Other 0.9 0.3 (0.3) (0.0) – 0.9Total reserve $32.3 $76.9 $(2.1) $(33.3) $2.0 $75.8
December 312010
Provision/Charge
Provision/Reversal
Cash payments
Translationdifference
December 312011
Restructuring employee-related $48.4 $10.1 $(4.9) $(22.2) $(0.0) $31.4Other 0.2 0.8 – (0.1) – 0.9Total reserve $48.6 $10.9 $(4.9) $(22.3) $(0.0) $32.3

AUTOLIV 2013 / NOTES70
11. Product Related Liabilities
Autoliv is exposed to product liability and warranty claims in the event that the Company’s products fail to perform as represented and such failure results, or is alleged to result, in bodily injury, and/or property damage or other loss. The Com-pany has reserves for product risks. Such reserves are related to product perfor-mance issues including recall, product liability and warranty issues.
The Company records liabilities for product-related risks when probable claims are identified and when it is possible to reasonably estimate costs. Provisions for warranty claims are estimated based on prior experience, likely changes in per-formance of newer products, and the mix and volume of the products sold. The provisions are recorded on an accrual basis.
The increase in reserve in 2013 mainly relates to recall related issues and in 2012 and 2011 the increase mainly relates to warranty related issues. Cash pay-
ments in 2013 and 2012 mainly relate to warranty related issues, and cash pay-ments in 2011 mainly relate to recall related issues. The table below summariz-es the change in the balance sheet position of the product-related liabilities.
DECEMBER 31 2013 2012 2011
Reserve at beginning of the year $29.9 $33.0 $39.2Change in reserve 21.3 19.3 14.8Cash payments (15.2) (22.7) (21.2)Translation difference 0.4 0.3 0.2Reserve at end of the year $36.4 $29.9 $33.0
12. Debt and Credit Agreements
As part of its debt management, the Company enters into derivatives to achieve economically effective hedges and to minimize the cost of its funding. In this note, short-term debt and long-term debt are discussed including Debt-Related Deriv-atives (DRD), i.e. debt including fair value adjustments from hedges. Included in the DRD is also the unamortized fair value adjustment related to a discontinued fair value hedge which will be amortized over the remaining life of the debt. The Debt Profile table also shows debt excluding DRD, i.e. reconciled to debt as re-ported in the balance sheet.
SHORT-TERM DEBTAs of December 31, 2013, total short-term debt including DRD was $341 million in-cluding $274 million of short-term portion of long-term loans. In March 2012, Auto-liv completed the remarketing of the senior notes related to the equity units and the coupon of the notes was reset to 3.854% with a yield of 2.875%. The notes will have a carrying amount of $106.3 million at maturity, April 30, 2014. The remaining un-amortized premium was $0.3 million at December 31, 2013. On April 30, 2012, Au-toliv settled the purchase contracts underlying the equity units by issuing approxi-mately 5.8 million shares of common stock in exchange for $106 million in proceeds generated by the maturity of the U.S. Treasury securities purchased following the re-marketing.
In November 2012, $110 million of the U.S. private placement notes, which car-ried fixed interest rates of 5.6%, matured. In November 2014, another $125 million of senior notes issued in 2007 as private placements by Autoliv ASP Inc. carrying fixed interest rate of 5.8% will mature. The remaining part of short term portion of long-term loans consists of financing at the subsidiary level, primarily $36 million of loans borrowed by Autoliv do Brazil Ltda (a wholly-owned subsidiary) carrying interest rates of 9.8% and $4 million equivalent loans borrowed locally in Russia by OOO Autoliv (a wholly-owned subsidiary), which carry an interest rate of 8.5% and of $2 million equivalent of loans borrowed from Japanese banks by Autoliv KK (a wholly-owned subsidiary), which carry an interest rate of 1.6%.
The Company’s subsidiaries also have credit agreements, principally in the form of overdraft facilities, with a number of local banks. Total available short-term facilities, as of December 31, 2013, excluding commercial paper facilities as described below, amounted to $380 million, of which $104 million was utilized. The aggregate amount of unused short-term lines of credit at December 31, 2013 was $276 million. The weighted average interest rate on total short-term debt outstanding at December 31, 2013 and 2012 excluding the short-term portion of long-term debt was 3.5% and 3.7%, respectively.
LONG-TERM DEBT – OUTSTANDING LOANSLong-term debt including DRD of $266 million consists of $165 million of senior
notes issued in 2007 as private placements by Autoliv ASP Inc., a wholly owned subsidiary of the Company. The notes were guaranteed by the Company and con-sist of two long-term tranches maturing in 2017 and 2019 respectively, which car-ried fixed interest rates between 6.1% and 6.2%. The Company entered into swap arrangements with respect to part of the proceeds of the notes offering, most of which were cancelled in 2008 resulting in a mark-to-market gain. In March 2013 the remaining interest rate swap, with a nominal value of $60 million, was can-celled. This gain is amortized through interest expense over the life of the respec-tive notes.
Consequently, the remaining $165 million of the long-term notes carry fixed interest rates varying between 2.5% and 5.4%, when including the amortization of the cancelled swaps.
In 2011, the Company repurchased a SEK 600 million note ($92 million equiv-alent) maturing in 2014 which carried a floating interest of STIBOR +3.9% at a dis-count and as a result reported $6.2 million as debt extinguishment cost. The Com-pany also issued, to the same investor, a SEK 300 million note ($46 million equivalent) maturing in 2017 carrying a floating interest rate of STIBOR + 0.95%.
A fixed-rate note was issued in December 2012 of 350 million SEK ($54 mil-lion equivalent). The 5-year note will mature in December 2017 and carries a fixed interest rate of 2.49%, which represents the European Investment Bank’s (EIB) cost of funds plus 0.3%. The remaining other long-term debt of $2 million, con-sisted primarily of $1 million equivalent loans borrowed from Japanese banks by Autoliv KK (a wholly-owned subsidiary), which carry an interest rate of 1.6%.
LONG-TERM DEBT – LOAN FACILITIESIn April 2011, the Company refinanced its revolving credit facility (RCF) of $1,100 million. The facility is now syndicated among 13 banks and originally had two ex-tension options where Autoliv could request the banks to extend the maturity to 2017 and 2018, respectively, on the first and second anniversaries of the April 2011 loan facility, a so called 5+1+1 structure. In April 2012 and in April 2013, Autoliv extended essentially all of its $1,100 million RCF, as noted above, with unchanged terms and conditions. The Company pays a commitment fee of 0.16% (given the rating of A- from Standard & Poor’s at December 31, 2013). Financing costs of $5 million were incurred in April 2011 and are amortized over the expected life of the facility. Borrowings under this facility are unsecured and bear interest based on the relevant LIBOR or IBOR rate. The commitment is available for general corpo-rate purposes. Borrowings are prepayable at any time and are due at the respec-tive expiration date. The extension fees, incurred in April 2012 and April 2013, of $1 million in total are amortized over the remaining expected life of the facility.
In June 2009, Autoliv AB, (a wholly-owned subsidiary) entered into an 18-month financing commitment with EIB of €225 million ($309 million equivalent). In July
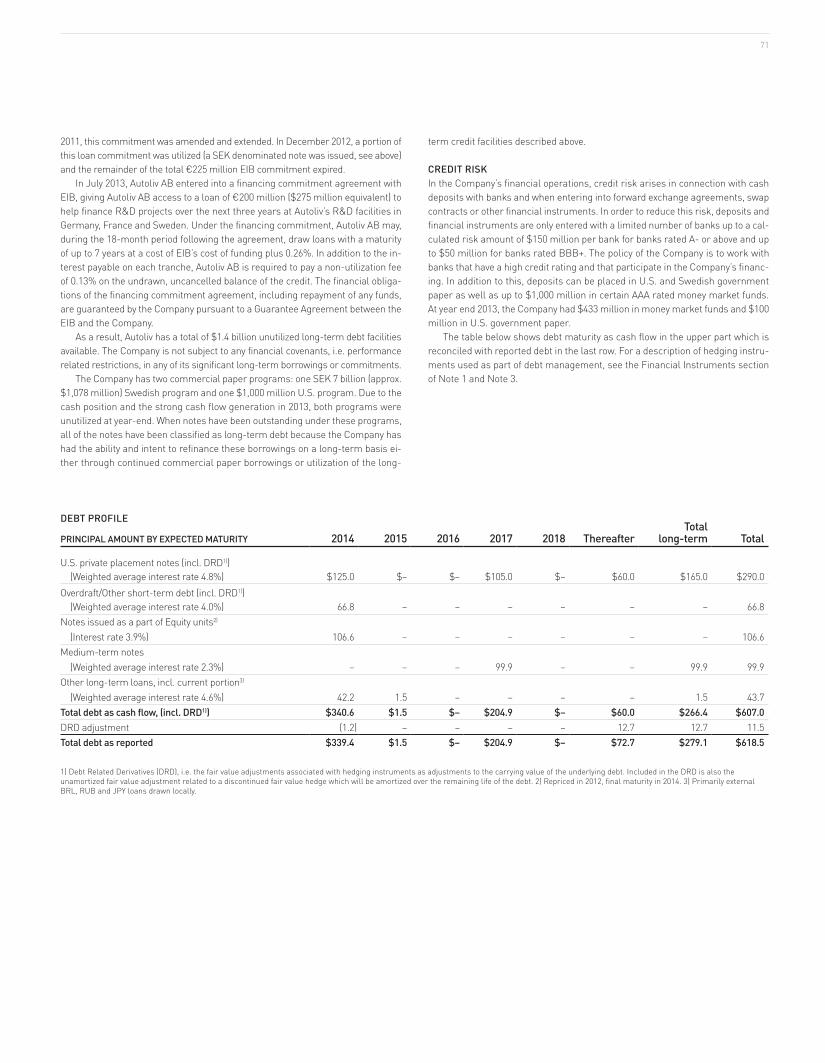
71
2011, this commitment was amended and extended. In December 2012, a portion of this loan commitment was utilized (a SEK denominated note was issued, see above) and the remainder of the total €225 million EIB commitment expired.
In July 2013, Autoliv AB entered into a financing commitment agreement with EIB, giving Autoliv AB access to a loan of €200 million ($275 million equivalent) to help finance R&D projects over the next three years at Autoliv’s R&D facilities in Germany, France and Sweden. Under the financing commitment, Autoliv AB may, during the 18-month period following the agreement, draw loans with a maturity of up to 7 years at a cost of EIB’s cost of funding plus 0.26%. In addition to the in-terest payable on each tranche, Autoliv AB is required to pay a non-utilization fee of 0.13% on the undrawn, uncancelled balance of the credit. The financial obliga-tions of the financing commitment agreement, including repayment of any funds, are guaranteed by the Company pursuant to a Guarantee Agreement between the EIB and the Company.
As a result, Autoliv has a total of $1.4 billion unutilized long-term debt facilities available. The Company is not subject to any financial covenants, i.e. performance related restrictions, in any of its significant long-term borrowings or commitments.
The Company has two commercial paper programs: one SEK 7 billion (approx. $1,078 million) Swedish program and one $1,000 million U.S. program. Due to the cash position and the strong cash flow generation in 2013, both programs were unutilized at year-end. When notes have been outstanding under these programs, all of the notes have been classified as long-term debt because the Company has had the ability and intent to refinance these borrowings on a long-term basis ei-ther through continued commercial paper borrowings or utilization of the long-
term credit facilities described above.
CREDIT RISKIn the Company’s financial operations, credit risk arises in connection with cash deposits with banks and when entering into forward exchange agreements, swap contracts or other financial instruments. In order to reduce this risk, deposits and financial instruments are only entered with a limited number of banks up to a cal-culated risk amount of $150 million per bank for banks rated A- or above and up to $50 million for banks rated BBB+. The policy of the Company is to work with banks that have a high credit rating and that participate in the Company’s financ-ing. In addition to this, deposits can be placed in U.S. and Swedish government paper as well as up to $1,000 million in certain AAA rated money market funds. At year end 2013, the Company had $433 million in money market funds and $100 million in U.S. government paper.
The table below shows debt maturity as cash flow in the upper part which is reconciled with reported debt in the last row. For a description of hedging instru-ments used as part of debt management, see the Financial Instruments section of Note 1 and Note 3.
DEBT PROFILE
PRINCIPAL AMOUNT BY EXPECTED MATURITY 2014 2015 2016 2017 2018 ThereafterTotal
long-term Total
U.S. private placement notes (incl. DRD1)) (Weighted average interest rate 4.8%) $125.0 $– $– $105.0 $– $60.0 $165.0 $290.0Overdraft/Other short-term debt (incl. DRD1)) (Weighted average interest rate 4.0%) 66.8 – – – – – – 66.8Notes issued as a part of Equity units2)
(Interest rate 3.9%) 106.6 – – – – – – 106.6Medium-term notes (Weighted average interest rate 2.3%) – – – 99.9 – – 99.9 99.9Other long-term loans, incl. current portion3)
(Weighted average interest rate 4.6%) 42.2 1.5 – – – – 1.5 43.7Total debt as cash flow, (incl. DRD1)) $340.6 $1.5 $– $204.9 $– $60.0 $266.4 $607.0DRD adjustment (1.2) – – – – 12.7 12.7 11.5Total debt as reported $339.4 $1.5 $– $204.9 $– $72.7 $279.1 $618.5
1) Debt Related Derivatives (DRD), i.e. the fair value adjustments associated with hedging instruments as adjustments to the carrying value of the underlying debt. Included in the DRD is also the unamortized fair value adjustment related to a discontinued fair value hedge which will be amortized over the remaining life of the debt. 2) Repriced in 2012, final maturity in 2014. 3) Primarily external BRL, RUB and JPY loans drawn locally.
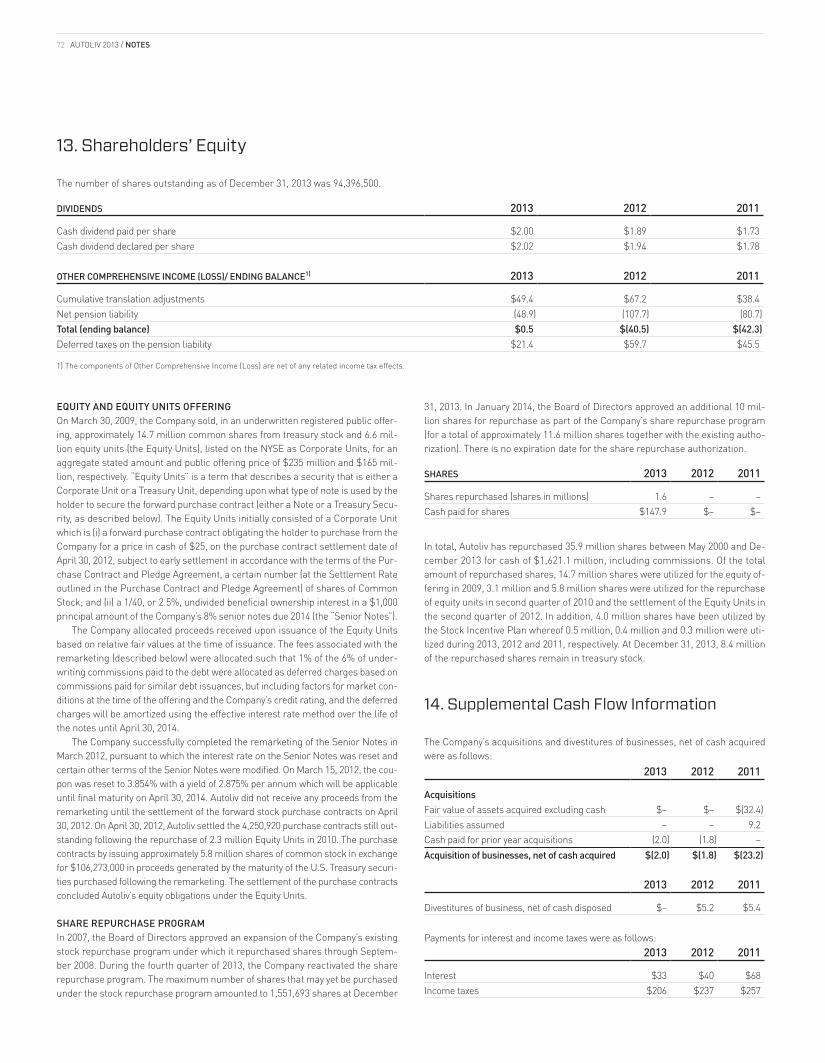
AUTOLIV 2013 / NOTES72
EQUITY AND EQUITY UNITS OFFERINGOn March 30, 2009, the Company sold, in an underwritten registered public offer-ing, approximately 14.7 million common shares from treasury stock and 6.6 mil-lion equity units (the Equity Units), listed on the NYSE as Corporate Units, for an aggregate stated amount and public offering price of $235 million and $165 mil-lion, respectively. “Equity Units” is a term that describes a security that is either a Corporate Unit or a Treasury Unit, depending upon what type of note is used by the holder to secure the forward purchase contract (either a Note or a Treasury Secu-rity, as described below). The Equity Units initially consisted of a Corporate Unit which is (i) a forward purchase contract obligating the holder to purchase from the Company for a price in cash of $25, on the purchase contract settlement date of April 30, 2012, subject to early settlement in accordance with the terms of the Pur-chase Contract and Pledge Agreement, a certain number (at the Settlement Rate outlined in the Purchase Contract and Pledge Agreement) of shares of Common Stock; and (ii) a 1/40, or 2.5%, undivided beneficial ownership interest in a $1,000 principal amount of the Company’s 8% senior notes due 2014 (the “Senior Notes”).
The Company allocated proceeds received upon issuance of the Equity Units based on relative fair values at the time of issuance. The fees associated with the remarketing (described below) were allocated such that 1% of the 6% of under-writing commissions paid to the debt were allocated as deferred charges based on commissions paid for similar debt issuances, but including factors for market con-ditions at the time of the offering and the Company’s credit rating, and the deferred charges will be amortized using the effective interest rate method over the life of the notes until April 30, 2014.
The Company successfully completed the remarketing of the Senior Notes in March 2012, pursuant to which the interest rate on the Senior Notes was reset and certain other terms of the Senior Notes were modified. On March 15, 2012, the cou-pon was reset to 3.854% with a yield of 2.875% per annum which will be applicable until final maturity on April 30, 2014. Autoliv did not receive any proceeds from the remarketing until the settlement of the forward stock purchase contracts on April 30, 2012. On April 30, 2012, Autoliv settled the 4,250,920 purchase contracts still out-standing following the repurchase of 2.3 million Equity Units in 2010. The purchase contracts by issuing approximately 5.8 million shares of common stock in exchange for $106,273,000 in proceeds generated by the maturity of the U.S. Treasury securi-ties purchased following the remarketing. The settlement of the purchase contracts concluded Autoliv’s equity obligations under the Equity Units.
SHARE REPURCHASE PROGRAMIn 2007, the Board of Directors approved an expansion of the Company’s existing stock repurchase program under which it repurchased shares through Septem-ber 2008. During the fourth quarter of 2013, the Company reactivated the share repurchase program. The maximum number of shares that may yet be purchased under the stock repurchase program amounted to 1,551,693 shares at December
31, 2013. In January 2014, the Board of Directors approved an additional 10 mil-lion shares for repurchase as part of the Company’s share repurchase program (for a total of approximately 11.6 million shares together with the existing autho-rization). There is no expiration date for the share repurchase authorization.
SHARES 2013 2012 2011
Shares repurchased (shares in millions) 1.6 – –Cash paid for shares $147.9 $– $–
In total, Autoliv has repurchased 35.9 million shares between May 2000 and De-cember 2013 for cash of $1,621.1 million, including commissions. Of the total amount of repurchased shares, 14.7 million shares were utilized for the equity of-fering in 2009, 3.1 million and 5.8 million shares were utilized for the repurchase of equity units in second quarter of 2010 and the settlement of the Equity Units in the second quarter of 2012. In addition, 4.0 million shares have been utilized by the Stock Incentive Plan whereof 0.5 million, 0.4 million and 0.3 million were uti-lized during 2013, 2012 and 2011, respectively. At December 31, 2013, 8.4 million of the repurchased shares remain in treasury stock.
14. Supplemental Cash Flow Information
The Company’s acquisitions and divestitures of businesses, net of cash acquired were as follows:
2013 2012 2011
AcquisitionsFair value of assets acquired excluding cash $– $– $(32.4)Liabilities assumed – – 9.2Cash paid for prior year acquisitions (2.0) (1.8) –Acquisition of businesses, net of cash acquired $(2.0) $(1.8) $(23.2)
2013 2012 2011
Divestitures of business, net of cash disposed $– $5.2 $5.4
Payments for interest and income taxes were as follows:2013 2012 2011
Interest $33 $40 $68Income taxes $206 $237 $257
13. Shareholders’ Equity
The number of shares outstanding as of December 31, 2013 was 94,396,500.
DIVIDENDS 2013 2012 2011
Cash dividend paid per share $2.00 $1.89 $1.73Cash dividend declared per share $2.02 $1.94 $1.78
OTHER COMPREHENSIVE INCOME (LOSS)/ ENDING BALANCE1) 2013 2012 2011
Cumulative translation adjustments $49.4 $67.2 $38.4Net pension liability (48.9) (107.7) (80.7)Total (ending balance) $0.5 $(40.5) $(42.3)Deferred taxes on the pension liability $21.4 $59.7 $45.5
1) The components of Other Comprehensive Income (Loss) are net of any related income tax effects.
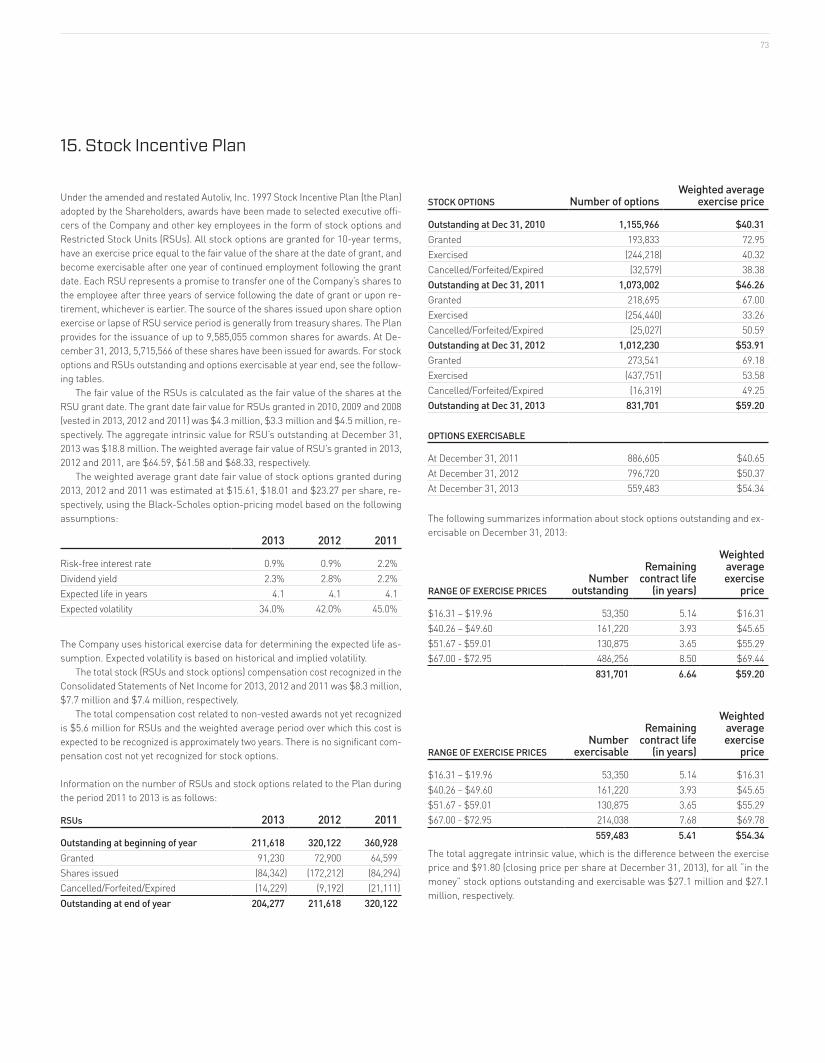
73
STOCK OPTIONS Number of optionsWeighted average
exercise price
Outstanding at Dec 31, 2010 1,155,966 $40.31Granted 193,833 72.95Exercised (244,218) 40.32Cancelled/Forfeited/Expired (32,579) 38.38Outstanding at Dec 31, 2011 1,073,002 $46.26Granted 218,695 67.00Exercised (254,440) 33.26Cancelled/Forfeited/Expired (25,027) 50.59Outstanding at Dec 31, 2012 1,012,230 $53.91Granted 273,541 69.18Exercised (437,751) 53.58Cancelled/Forfeited/Expired (16,319) 49.25Outstanding at Dec 31, 2013 831,701 $59.20
OPTIONS EXERCISABLE
At December 31, 2011 886,605 $40.65At December 31, 2012 796,720 $50.37At December 31, 2013 559,483 $54.34
The following summarizes information about stock options outstanding and ex-ercisable on December 31, 2013:
RANGE OF EXERCISE PRICESNumber
outstanding
Remaining contract life
(in years)
Weighted average exercise
price
$16.31 – $19.96 53,350 5.14 $16.31$40.26 – $49.60 161,220 3.93 $45.65$51.67 - $59.01 130,875 3.65 $55.29$67.00 - $72.95 486,256 8.50 $69.44
831,701 6.64 $59.20
RANGE OF EXERCISE PRICESNumber
exercisable
Remaining contract life
(in years)
Weighted average exercise
price
$16.31 – $19.96 53,350 5.14 $16.31$40.26 – $49.60 161,220 3.93 $45.65$51.67 - $59.01 130,875 3.65 $55.29$67.00 - $72.95 214,038 7.68 $69.78
559,483 5.41 $54.34
The total aggregate intrinsic value, which is the difference between the exercise price and $91.80 (closing price per share at December 31, 2013), for all “in the money” stock options outstanding and exercisable was $27.1 million and $27.1 million, respectively.
Under the amended and restated Autoliv, Inc. 1997 Stock Incentive Plan (the Plan) adopted by the Shareholders, awards have been made to selected executive offi-cers of the Company and other key employees in the form of stock options and Restricted Stock Units (RSUs). All stock options are granted for 10-year terms, have an exercise price equal to the fair value of the share at the date of grant, and become exercisable after one year of continued employment following the grant date. Each RSU represents a promise to transfer one of the Company’s shares to the employee after three years of service following the date of grant or upon re-tirement, whichever is earlier. The source of the shares issued upon share option exercise or lapse of RSU service period is generally from treasury shares. The Plan provides for the issuance of up to 9,585,055 common shares for awards. At De-cember 31, 2013, 5,715,566 of these shares have been issued for awards. For stock options and RSUs outstanding and options exercisable at year end, see the follow-ing tables.
The fair value of the RSUs is calculated as the fair value of the shares at the RSU grant date. The grant date fair value for RSUs granted in 2010, 2009 and 2008 (vested in 2013, 2012 and 2011) was $4.3 million, $3.3 million and $4.5 million, re-spectively. The aggregate intrinsic value for RSU’s outstanding at December 31, 2013 was $18.8 million. The weighted average fair value of RSU’s granted in 2013, 2012 and 2011, are $64.59, $61.58 and $68.33, respectively.
The weighted average grant date fair value of stock options granted during 2013, 2012 and 2011 was estimated at $15.61, $18.01 and $23.27 per share, re-spectively, using the Black-Scholes option-pricing model based on the following assumptions:
2013 2012 2011
Risk-free interest rate 0.9% 0.9% 2.2%Dividend yield 2.3% 2.8% 2.2%Expected life in years 4.1 4.1 4.1Expected volatility 34.0% 42.0% 45.0%
The Company uses historical exercise data for determining the expected life as-sumption. Expected volatility is based on historical and implied volatility.
The total stock (RSUs and stock options) compensation cost recognized in the Consolidated Statements of Net Income for 2013, 2012 and 2011 was $8.3 million, $7.7 million and $7.4 million, respectively.
The total compensation cost related to non-vested awards not yet recognized is $5.6 million for RSUs and the weighted average period over which this cost is expected to be recognized is approximately two years. There is no significant com-pensation cost not yet recognized for stock options.
Information on the number of RSUs and stock options related to the Plan during the period 2011 to 2013 is as follows:
RSUs 2013 2012 2011
Outstanding at beginning of year 211,618 320,122 360,928Granted 91,230 72,900 64,599Shares issued (84,342) (172,212) (84,294)Cancelled/Forfeited/Expired (14,229) (9,192) (21,111)Outstanding at end of year 204,277 211,618 320,122
15. Stock Incentive Plan
AUTOLIV 2013 / NOTES74
16. Contingent Liabilities
LEGAL PROCEEDINGSVarious claims, lawsuits and proceedings are pending or threatened against the Company or its subsidiaries, covering a range of matters that arise in the ordi-nary course of its business activities with respect to commercial, product liabili-ty and other matters. Litigation is subject to many uncertainties, and the outcome of any litigation cannot be assured. After discussions with counsel, and with the exception of losses resulting from the antitrust proceedings described below, it is the opinion of management that the various legal proceedings and investigations to which the Company currently is a party will not have a material adverse impact on the consolidated financial position of Autoliv, but the Company cannot provide assurance that Autoliv will not experience material litigation, product liability or other losses in the future.
ANTITRUST MATTERSAuthorities in several jurisdictions are currently conducting broad, and in some cases, long-running investigations of suspected anti-competitive behavior among parts suppliers in the global automotive vehicle industry. These investigations in-clude, but are not limited to, segments in which the Company operates. In addi-tion to pending matters, authorities of other countries with significant light vehi-cle manufacturing or sales may initiate similar investigations. It is the Company’s policy to cooperate with governmental investigations.
On February 8, 2011, a Company subsidiary received a grand jury subpoena from the Antitrust Division of the U.S. Department of Justice (“DOJ”) related to its investigation of anti-competitive behavior among suppliers of occupant safety sys-tems. On June 6, 2012, the Company entered into a plea agreement with the DOJ and subsequently pled guilty to two counts of antitrust law violations involving a Japanese subsidiary and paid a fine of $14.5 million. Under the terms of the agree-ment the Company will continue to cooperate with the DOJ in its investigation of other suppliers, but the DOJ will not otherwise prosecute Autoliv or any of its sub-sidiaries, present or former directors, officers or employees for the matters in-vestigated (the DOJ did reserve the option to prosecute three specific employees, none of whom is a member of the senior management of the Company).
On June 7-9, 2011, representatives of the European Commission (“EC”), the European antitrust authority, visited two facilities of a Company subsidiary in Ger-many to gather information for a similar investigation. The investigation is still pending and the Company remains unable to estimate the financial impact such investigation will have or predict the reporting periods in which such financial im-pact may be recorded and has consequently not recorded a provision for loss as of December 31, 2013. However, management has concluded that it is probable that the Company’s operating results and cash flows will be materially adversely impacted for the reporting periods in which the EC investigation is resolved or be-comes estimable.
On October 3, 2012, the Company received a letter from the Competition Bu-reau of Canada (“CBC”) related to the subjects investigated by the DOJ, seeking the voluntary production of certain corporate records and information related to sales subject to Canadian jurisdiction. In February 2014, the Company received an additional request from the CBC for further information. The Company continues to cooperate with the CBC’s investigation. On November 6, 2012, the Korean Fair Trade Commission visited one of the Company’s South Korean subsidiaries to gath-er information for a similar investigation. The Company cannot predict the dura-tion, scope or ultimate outcome of these investigations and is unable to estimate the financial impact they may have, or predict the reporting periods in which any such financial impacts may be recorded. Consequently, the Company has not re-corded a provision for loss as of December 31, 2013 with respect to these investi-gations. Also, since the Company’s plea agreement with the DOJ involved the ac-tions of employees of a Japanese subsidiary of the Company, the Japan Fair Trade Commission is evaluating whether to initiate an investigation.
The Company is also subject to civil litigation alleging anti-competitive con-duct. Notably, the Company, several of its subsidiaries and its competitors are de-
fendants in a total of seventeen purported antitrust class action lawsuits filed be-tween July 2012 and October 2013. Thirteen of these lawsuits, brought by direct purchasers, auto dealers and end-payors, have been consolidated in the Occu-pant Safety Systems (OSS) segment of the Automobile Parts Antitrust Litigation, a Multi-District Litigation (MDL) proceeding in the United States District Court for the Eastern District of Michigan. The Company expects one additional lawsuit filed in the same court (Rainbow Chevrolet v. Autoliv, et al.) to be consolidated into the MDL proceeding. Based on current schedules, substantive discovery in the OSS segment of the MDL, which includes Autoliv, is not likely to begin before May 2014. The other three lawsuits are pending in Canada (Sheridan Chevrolet Cadillac Ltd. et al. v. Autoliv, Inc. et al., filed in the Ontario Superior Court of Justice on Janu-ary 18, 2013; M. Serge Asselin v. Autoliv, Inc. et al., filed in the Superior Court of Quebec on March 14, 2013; and Ewert v. Autoliv, Inc. et al., filed in the Supreme Court of British Columbia on July 18, 2013). The Canadian cases assert claims on behalf of putative classes of auto dealers and end-payors. There is currently no timeline for discovery in the Canadian cases.
Plaintiffs in the above U.S. and Canadian civil antitrust class actions general-ly allege that the defendants have engaged in long-running global conspiracies to fix the prices of occupant safety systems or components thereof in violation of various antitrust laws and unfair or deceptive trade practice statutes. Plaintiffs seek to represent purported classes of direct purchasers, auto dealers and end-payors (e.g. consumers) who purchased occupant safety systems or components either directly from a defendant or indirectly through purchases of new vehicles containing such systems. Plaintiffs seek injunctive relief, treble damages and at-torneys’ fees. The plaintiffs in these cases make allegations that extend signifi-cantly beyond the specific admissions of the plea discussed above. The Company denies these overly broad allegations and intends to actively defend itself against the same. While it is probable that the Company will incur losses as a result of these antitrust cases, the duration or ultimate outcome of these cases currently cannot be predicted or estimated and no provision for a loss has been recorded as of December 31, 2013.
On April 17, 2013, the Construction Laborers Pension Trust of Greater St. Lou-is (“Plaintiff”) filed a purported class action securities lawsuit against Autoliv and two of its officers in the United States District Court for the Southern District of New York (Civil Action File No. 13-CIV-2546). On October 21, 2013, Plaintiff filed an amended complaint in that lawsuit, adding as a third individual defendant an employee of one of the Company’s subsidiaries. The amended complaint alleges misrepresentations or failures to disclose material facts that artificially inflated the Company’s stock price in violation of the federal securities laws, in particular Section 10(b) and Section 20(a) of the Securities Exchange Act of 1934, as amend-ed, and failed to disclose prior to June 6, 2012 that employees had engaged in cer-tain price fixing activity in violation of the law and that the Company’s prior finan-cial results allegedly had been inflated as a result of the anti-competitive activity. Plaintiff purports to bring this lawsuit on behalf of a class of purchasers of com-mon stock of the Company between October 26, 2010 and July 21, 2011. Plaintiff seeks to recover damages in an unspecified amount. The Company and its two officers deny any wrongdoing, believe the claims are baseless, and will defend ac-cordingly. On December 20, 2013, the Company filed a Motion to Dismiss the law-suit, which the Court has not yet ruled on.
The Company understands that on February 18, 2014, Henry Zwang, a pur-ported stockholder of the Company, filed a putative derivative lawsuit against Autoliv and twelve of its current or former officers and directors in the Delaware Court of Chancery (Case No. 9539 --- __). The complaint purports to allege claims against the individual defendants for breach of fiduciary duty, waste and unjust enrichment related to the Company’s antitrust issues. The complaint names the Company as a nominal defendant only and purports to seek monetary and other relief on behalf of Autoliv against the individual defendants. The Company and its current and former officers and directors deny any wrongdoing, believe the claims are baseless, and will defend accordingly.
75
PRODUCT WARRANTY, RECALLS AND INTELLECTUAL PROPERTYAutoliv is exposed to various claims for damages and compensation if products fail to perform as expected. Such claims can be made, and result in costs and oth-er losses to the Company, even where the product is eventually found to have func-tioned properly. If a product (actually or allegedly) fails to perform as expected the Company faces warranty and recall claims. If such (actual or alleged) failure re-sults in bodily injury and/or property damage, the Company may also face prod-uct-liability claims. There can be no assurance that the Company will not experi-ence material warranty, recall or product (or other) liability claims or losses in the future, or that the Company will not incur significant costs to defend against such claims. The Company may be required to participate in a recall involving its prod-ucts. Each vehicle manufacturer has its own practices regarding product recalls and other product liability actions relating to its suppliers. As suppliers become more integrally involved in the vehicle design process and assume more of the ve-hicle assembly functions, vehicle manufacturers are increasingly looking to their suppliers for contribution when faced with recalls and product liability claims.
A warranty, recall or product-liability claim brought against the Company in excess of its insurance may have a material adverse effect on the Company’s busi-ness. Vehicle manufacturers are also increasingly requiring their outside suppli-ers to guarantee or warrant their products and bear the costs of repair and re-placement of such products under new vehicle warranties. A vehicle manufacturer may attempt to hold the Company responsible for some, or all, of the repair or replacement costs of defective products under new vehicle warran-ties, when the product supplied did not perform as represented. Accordingly, the future costs of warranty claims by customers may be material. However, the Com-pany believes its established reserves are adequate to cover potential warranty settlements. Autoliv’s warranty reserves are based upon the Company’s best es-timates of amounts necessary to settle future and existing claims. The Company regularly evaluates the appropriateness of these reserves, and adjusts them when appropriate. However, the final amounts determined to be due related to these matters could differ materially from the Company’s recorded estimates.
In addition, the global platforms and procedures used by vehicle manufactur-ers have led to quality performance evaluations being conducted on an increas-ingly global basis. Any one or more quality, warranty or other recall issue(s) (in-cluding those affecting few units and/or having a small financial impact) may cause a vehicle manufacturer to implement measures such as a temporary or prolonged suspension of new orders, which may have a material impact on the Company’s results of operations.
The Company believes that it is currently reasonably insured against signifi-cant warranty, recall and product liability risks, at levels sufficient to cover poten-tial claims that are reasonably likely to arise in our businesses. Autoliv cannot be assured that the level of coverage will be sufficient to cover every possible claim that can arise in our businesses, now or in the future, or that such coverage al-ways will be available on our current market terms should we, now or in the fu-ture, wish to extend or increase insurance.
In its products, the Company utilizes technologies which may be subject to in-tellectual property rights of third parties. While the Company seeks to identify the intellectual property rights of relevance to its products, and, where relevant, tries to procure the necessary rights to utilize such intellectual property rights, we may fail to do so. When this happens, the Company may be exposed to material claims from the owners of such rights. If the Company has sold products which infringe upon such rights, our customers may be entitled to be indemnified by us for the claims they suffer as a result thereof. Such claims could be material.
17. Lease Commitments
OPERATING LEASEThe Company leases certain offices, manufacturing and research buildings, ma-chinery, automobiles, data processing and other equipment under operating lease contracts. The operating leases, some of which are non-cancellable and include renewals, expire at various dates through 2045. The Company pays most mainte-nance, insurance and tax expenses relating to leased assets. Rental expense for operating leases was $45.8 million for 2013, $35.5 million for 2012 and $36.4 mil-lion for 2011.
At December 31, 2013, future minimum lease payments for non-cancellable operating leases totalled $117.8 million and are payable as follows (in millions): 2014: $37.8; 2015: $28.0; 2016: $17.3; 2017: $12.7; 2018: $9.9; 2019 and thereaf-ter: $12.1.
CAPITAL LEASEThe Company leases certain property, plant and equipment under capital lease contracts. The capital leases expire at various dates through 2017.
At December 31, 2013, future minimum lease payments for non-cancellable capital leases totalled $1.0 million and are payable as follows (in millions): 2014: $0.5; 2015: $0.4; 2016: $0.1; 2017: $0.0; 2018: $0.0; 2019 and thereafter: $0.0.
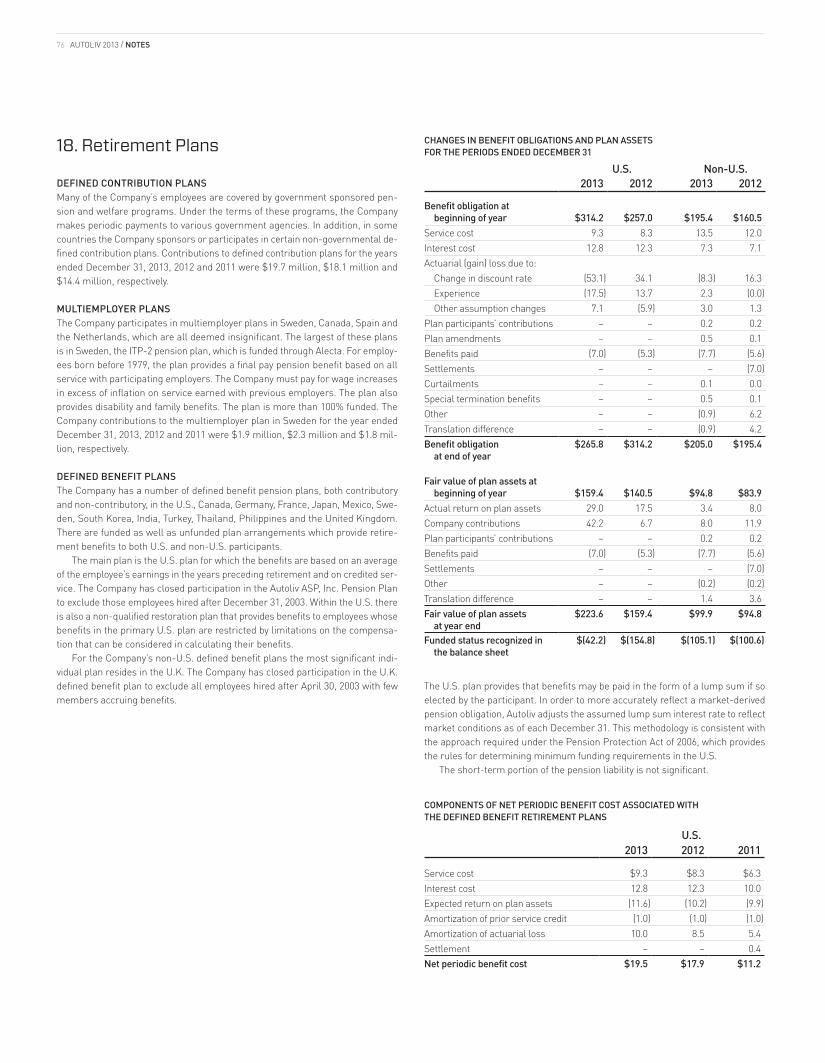
AUTOLIV 2013 / NOTES76
18. Retirement Plans
DEFINED CONTRIBUTION PLANSMany of the Company’s employees are covered by government sponsored pen-sion and welfare programs. Under the terms of these programs, the Company makes periodic payments to various government agencies. In addition, in some countries the Company sponsors or participates in certain non-governmental de-fined contribution plans. Contributions to defined contribution plans for the years ended December 31, 2013, 2012 and 2011 were $19.7 million, $18.1 million and $14.4 million, respectively.
MULTIEMPLOYER PLANSThe Company participates in multiemployer plans in Sweden, Canada, Spain and the Netherlands, which are all deemed insignificant. The largest of these plans is in Sweden, the ITP-2 pension plan, which is funded through Alecta. For employ-ees born before 1979, the plan provides a final pay pension benefit based on all service with participating employers. The Company must pay for wage increases in excess of inflation on service earned with previous employers. The plan also provides disability and family benefits. The plan is more than 100% funded. The Company contributions to the multiemployer plan in Sweden for the year ended December 31, 2013, 2012 and 2011 were $1.9 million, $2.3 million and $1.8 mil-lion, respectively.
DEFINED BENEFIT PLANSThe Company has a number of defined benefit pension plans, both contributory and non-contributory, in the U.S., Canada, Germany, France, Japan, Mexico, Swe-den, South Korea, India, Turkey, Thailand, Philippines and the United Kingdom. There are funded as well as unfunded plan arrangements which provide retire-ment benefits to both U.S. and non-U.S. participants.
The main plan is the U.S. plan for which the benefits are based on an average of the employee’s earnings in the years preceding retirement and on credited ser-vice. The Company has closed participation in the Autoliv ASP, Inc. Pension Plan to exclude those employees hired after December 31, 2003. Within the U.S. there is also a non-qualified restoration plan that provides benefits to employees whose benefits in the primary U.S. plan are restricted by limitations on the compensa-tion that can be considered in calculating their benefits.
For the Company’s non-U.S. defined benefit plans the most significant indi-vidual plan resides in the U.K. The Company has closed participation in the U.K. defined benefit plan to exclude all employees hired after April 30, 2003 with few members accruing benefits.
CHANGES IN BENEFIT OBLIGATIONS AND PLAN ASSETS FOR THE PERIODS ENDED DECEMBER 31
U.S. Non-U.S.2013 2012 2013 2012
Benefit obligation at beginning of year $314.2 $257.0 $195.4 $160.5Service cost 9.3 8.3 13.5 12.0Interest cost 12.8 12.3 7.3 7.1Actuarial (gain) loss due to: Change in discount rate (53.1) 34.1 (8.3) 16.3 Experience (17.5) 13.7 2.3 (0.0) Other assumption changes 7.1 (5.9) 3.0 1.3Plan participants’ contributions – – 0.2 0.2Plan amendments – – 0.5 0.1Benefits paid (7.0) (5.3) (7.7) (5.6)Settlements – – – (7.0)Curtailments – – 0.1 0.0Special termination benefits – – 0.5 0.1Other – – (0.9) 6.2Translation difference – – (0.9) 4.2Benefit obligation at end of year
$265.8 $314.2 $205.0 $195.4
Fair value of plan assets at beginning of year $159.4 $140.5 $94.8 $83.9Actual return on plan assets 29.0 17.5 3.4 8.0Company contributions 42.2 6.7 8.0 11.9Plan participants’ contributions – – 0.2 0.2Benefits paid (7.0) (5.3) (7.7) (5.6)Settlements – – – (7.0)Other – – (0.2) (0.2)Translation difference – – 1.4 3.6Fair value of plan assets at year end
$223.6 $159.4 $99.9 $94.8
Funded status recognized in the balance sheet
$(42.2) $(154.8) $(105.1) $(100.6)
The U.S. plan provides that benefits may be paid in the form of a lump sum if so elected by the participant. In order to more accurately reflect a market-derived pension obligation, Autoliv adjusts the assumed lump sum interest rate to reflect market conditions as of each December 31. This methodology is consistent with the approach required under the Pension Protection Act of 2006, which provides the rules for determining minimum funding requirements in the U.S.
The short-term portion of the pension liability is not significant.
COMPONENTS OF NET PERIODIC BENEFIT COST ASSOCIATED WITH THE DEFINED BENEFIT RETIREMENT PLANS
U.S.2013 2012 2011
Service cost $9.3 $8.3 $6.3Interest cost 12.8 12.3 10.0Expected return on plan assets (11.6) (10.2) (9.9)Amortization of prior service credit (1.0) (1.0) (1.0)Amortization of actuarial loss 10.0 8.5 5.4Settlement – – 0.4Net periodic benefit cost $19.5 $17.9 $11.2
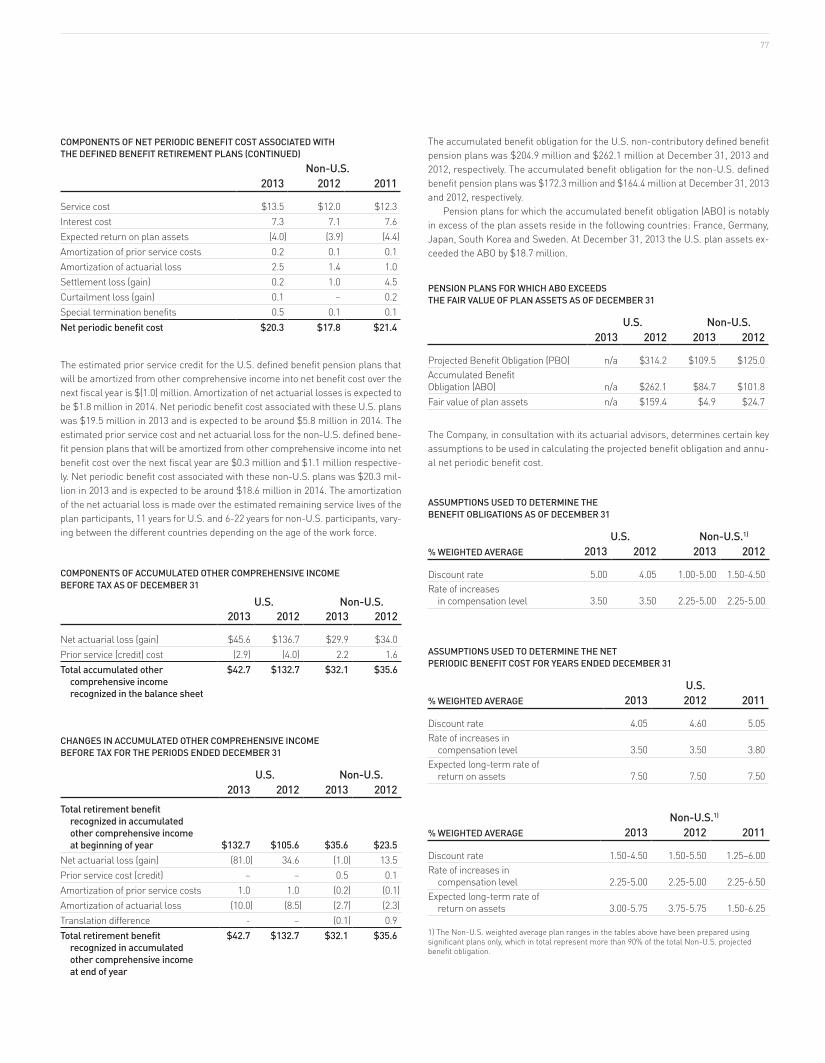
77
The accumulated benefit obligation for the U.S. non-contributory defined benefit pension plans was $204.9 million and $262.1 million at December 31, 2013 and 2012, respectively. The accumulated benefit obligation for the non-U.S. defined benefit pension plans was $172.3 million and $164.4 million at December 31, 2013 and 2012, respectively.
Pension plans for which the accumulated benefit obligation (ABO) is notably in excess of the plan assets reside in the following countries: France, Germany, Japan, South Korea and Sweden. At December 31, 2013 the U.S. plan assets ex-ceeded the ABO by $18.7 million.
PENSION PLANS FOR WHICH ABO EXCEEDS THE FAIR VALUE OF PLAN ASSETS AS OF DECEMBER 31
U.S. Non-U.S.2013 2012 2013 2012
Projected Benefit Obligation (PBO) n/a $314.2 $109.5 $125.0Accumulated Benefit Obligation (ABO) n/a $262.1 $84.7 $101.8Fair value of plan assets n/a $159.4 $4.9 $24.7
The Company, in consultation with its actuarial advisors, determines certain key assumptions to be used in calculating the projected benefit obligation and annu-al net periodic benefit cost.
ASSUMPTIONS USED TO DETERMINE THE BENEFIT OBLIGATIONS AS OF DECEMBER 31
U.S. Non-U.S.1)
% WEIGHTED AVERAGE 2013 2012 2013 2012
Discount rate 5.00 4.05 1.00-5.00 1.50-4.50Rate of increases in compensation level 3.50 3.50 2.25-5.00 2.25-5.00
ASSUMPTIONS USED TO DETERMINE THE NET PERIODIC BENEFIT COST FOR YEARS ENDED DECEMBER 31
U.S.% WEIGHTED AVERAGE 2013 2012 2011
Discount rate 4.05 4.60 5.05Rate of increases in compensation level 3.50 3.50 3.80Expected long-term rate of return on assets 7.50 7.50 7.50
Non-U.S.1)
% WEIGHTED AVERAGE 2013 2012 2011
Discount rate 1.50-4.50 1.50-5.50 1.25–6.00Rate of increases in compensation level 2.25-5.00 2.25-5.00 2.25-6.50Expected long-term rate of return on assets 3.00-5.75 3.75-5.75 1.50-6.25
1) The Non-U.S. weighted average plan ranges in the tables above have been prepared using significant plans only, which in total represent more than 90% of the total Non-U.S. projected benefit obligation.
COMPONENTS OF NET PERIODIC BENEFIT COST ASSOCIATED WITH THE DEFINED BENEFIT RETIREMENT PLANS (CONTINUED)
Non-U.S.2013 2012 2011
Service cost $13.5 $12.0 $12.3Interest cost 7.3 7.1 7.6Expected return on plan assets (4.0) (3.9) (4.4)Amortization of prior service costs 0.2 0.1 0.1Amortization of actuarial loss 2.5 1.4 1.0Settlement loss (gain) 0.2 1.0 4.5Curtailment loss (gain) 0.1 – 0.2Special termination benefits 0.5 0.1 0.1Net periodic benefit cost $20.3 $17.8 $21.4
The estimated prior service credit for the U.S. defined benefit pension plans that will be amortized from other comprehensive income into net benefit cost over the next fiscal year is $(1.0) million. Amortization of net actuarial losses is expected to be $1.8 million in 2014. Net periodic benefit cost associated with these U.S. plans was $19.5 million in 2013 and is expected to be around $5.8 million in 2014. The estimated prior service cost and net actuarial loss for the non-U.S. defined bene-fit pension plans that will be amortized from other comprehensive income into net benefit cost over the next fiscal year are $0.3 million and $1.1 million respective-ly. Net periodic benefit cost associated with these non-U.S. plans was $20.3 mil-lion in 2013 and is expected to be around $18.6 million in 2014. The amortization of the net actuarial loss is made over the estimated remaining service lives of the plan participants, 11 years for U.S. and 6-22 years for non-U.S. participants, vary-ing between the different countries depending on the age of the work force.
COMPONENTS OF ACCUMULATED OTHER COMPREHENSIVE INCOME BEFORE TAX AS OF DECEMBER 31
U.S. Non-U.S.2013 2012 2013 2012
Net actuarial loss (gain) $45.6 $136.7 $29.9 $34.0Prior service (credit) cost (2.9) (4.0) 2.2 1.6Total accumulated other comprehensive income recognized in the balance sheet
$42.7 $132.7 $32.1 $35.6
CHANGES IN ACCUMULATED OTHER COMPREHENSIVE INCOME BEFORE TAX FOR THE PERIODS ENDED DECEMBER 31
U.S. Non-U.S.2013 2012 2013 2012
Total retirement benefit recognized in accumulated other comprehensive income at beginning of year $132.7 $105.6 $35.6 $23.5Net actuarial loss (gain) (81.0) 34.6 (1.0) 13.5Prior service cost (credit) – – 0.5 0.1Amortization of prior service costs 1.0 1.0 (0.2) (0.1)Amortization of actuarial loss (10.0) (8.5) (2.7) (2.3)Translation difference - – (0.1) 0.9Total retirement benefit recognized in accumulated other comprehensive income at end of year
$42.7 $132.7 $32.1 $35.6
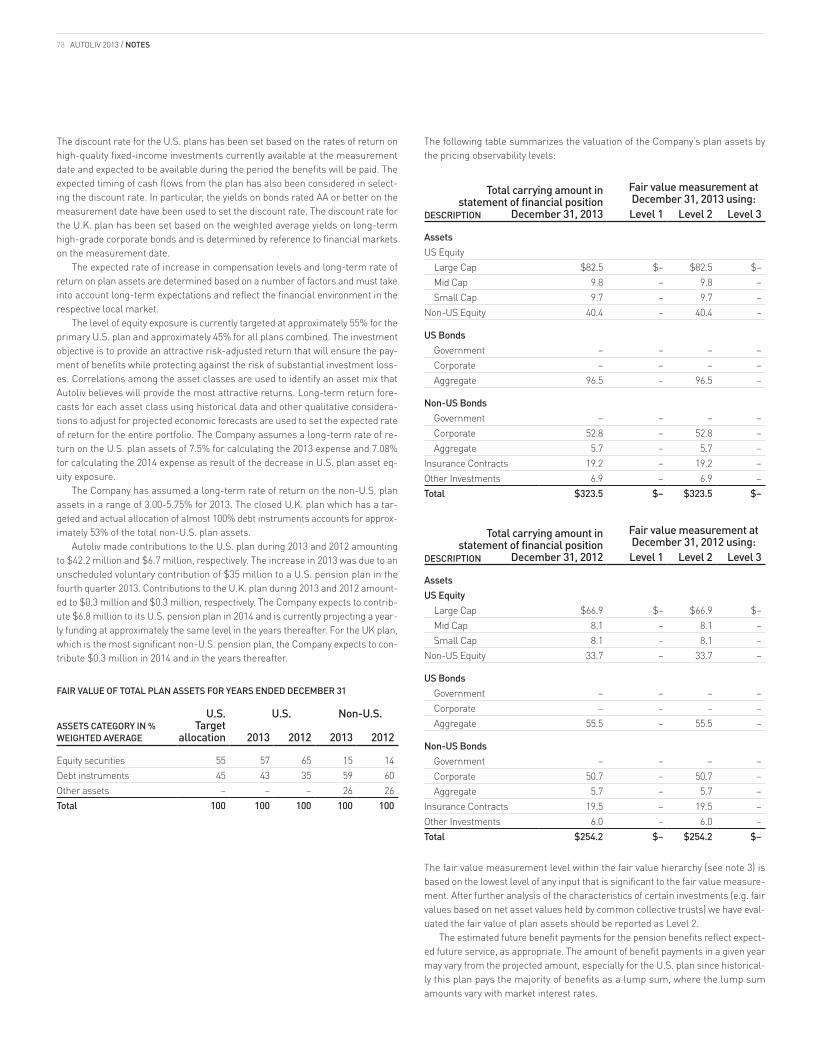
AUTOLIV 2013 / NOTES78
The following table summarizes the valuation of the Company’s plan assets by the pricing observability levels:
Total carrying amount in statement of financial position
December 31, 2013
Fair value measurement at December 31, 2013 using:Level 1 Level 2 Level 3
AssetsUS Equity Large Cap $82.5 $– $82.5 $– Mid Cap 9.8 – 9.8 – Small Cap 9.7 – 9.7 –Non-US Equity 40.4 – 40.4 –
US Bonds Government – – – – Corporate – – – – Aggregate 96.5 – 96.5 –
Non-US Bonds Government – – – – Corporate 52.8 – 52.8 – Aggregate 5.7 – 5.7 –Insurance Contracts 19.2 – 19.2 –Other Investments 6.9 – 6.9 –Total $323.5 $– $323.5 $–
Total carrying amount in statement of financial position
December 31, 2012
Fair value measurement at December 31, 2012 using:Level 1 Level 2 Level 3
AssetsUS Equity Large Cap $66.9 $– $66.9 $– Mid Cap 8.1 – 8.1 – Small Cap 8.1 – 8.1 –Non-US Equity 33.7 – 33.7 –
US Bonds Government – – – – Corporate – – – – Aggregate 55.5 – 55.5 –
Non-US Bonds Government – – – – Corporate 50.7 – 50.7 – Aggregate 5.7 – 5.7 –Insurance Contracts 19.5 – 19.5 –Other Investments 6.0 – 6.0 –Total $254.2 $– $254.2 $–
The fair value measurement level within the fair value hierarchy (see note 3) is based on the lowest level of any input that is significant to the fair value measure-ment. After further analysis of the characteristics of certain investments (e.g. fair values based on net asset values held by common collective trusts) we have eval-uated the fair value of plan assets should be reported as Level 2.
The estimated future benefit payments for the pension benefits reflect expect-ed future service, as appropriate. The amount of benefit payments in a given year may vary from the projected amount, especially for the U.S. plan since historical-ly this plan pays the majority of benefits as a lump sum, where the lump sum amounts vary with market interest rates.
The discount rate for the U.S. plans has been set based on the rates of return on high-quality fixed-income investments currently available at the measurement date and expected to be available during the period the benefits will be paid. The expected timing of cash flows from the plan has also been considered in select-ing the discount rate. In particular, the yields on bonds rated AA or better on the measurement date have been used to set the discount rate. The discount rate for the U.K. plan has been set based on the weighted average yields on long-term high-grade corporate bonds and is determined by reference to financial markets on the measurement date.
The expected rate of increase in compensation levels and long-term rate of return on plan assets are determined based on a number of factors and must take into account long-term expectations and reflect the financial environment in the respective local market.
The level of equity exposure is currently targeted at approximately 55% for the primary U.S. plan and approximately 45% for all plans combined. The investment objective is to provide an attractive risk-adjusted return that will ensure the pay-ment of benefits while protecting against the risk of substantial investment loss-es. Correlations among the asset classes are used to identify an asset mix that Autoliv believes will provide the most attractive returns. Long-term return fore-casts for each asset class using historical data and other qualitative considera-tions to adjust for projected economic forecasts are used to set the expected rate of return for the entire portfolio. The Company assumes a long-term rate of re-turn on the U.S. plan assets of 7.5% for calculating the 2013 expense and 7.08% for calculating the 2014 expense as result of the decrease in U.S. plan asset eq-uity exposure.
The Company has assumed a long-term rate of return on the non-U.S. plan assets in a range of 3.00-5.75% for 2013. The closed U.K. plan which has a tar-geted and actual allocation of almost 100% debt instruments accounts for approx-imately 53% of the total non-U.S. plan assets.
Autoliv made contributions to the U.S. plan during 2013 and 2012 amounting to $42.2 million and $6.7 million, respectively. The increase in 2013 was due to an unscheduled voluntary contribution of $35 million to a U.S. pension plan in the fourth quarter 2013. Contributions to the U.K. plan during 2013 and 2012 amount-ed to $0.3 million and $0.3 million, respectively. The Company expects to contrib-ute $6.8 million to its U.S. pension plan in 2014 and is currently projecting a year-ly funding at approximately the same level in the years thereafter. For the UK plan, which is the most significant non-U.S. pension plan, the Company expects to con-tribute $0.3 million in 2014 and in the years thereafter.
FAIR VALUE OF TOTAL PLAN ASSETS FOR YEARS ENDED DECEMBER 31
ASSETS CATEGORY IN % WEIGHTED AVERAGE
U.S. U.S. Non-U.S.Target
allocation 2013 2012 2013 2012
Equity securities 55 57 65 15 14Debt instruments 45 43 35 59 60Other assets – – – 26 26Total 100 100 100 100 100
DESCRIPTION
DESCRIPTION
79
PENSION BENEFITS EXPECTED PAYMENTS U.S. Non-U.S.
2014 $10.2 $5.82015 $11.0 $6.72016 $12.6 $7.02017 $13.7 $8.02018 $14.9 $8.9Years 2019-2023 $98.1 $59.3
POSTRETIREMENT BENEFITS OTHER THAN PENSIONSThe Company currently provides postretirement health care and life insurance benefits to most of its U.S. retirees. Such benefits in other countries are includ-ed in the tables below, but are not significant.
In general, the terms of the plans provide that U.S. employees who retire af-ter attaining age 55, with five years of service (15 years after December 31, 2006), are eligible for continued health care and life insurance coverage. Dependent health care and life insurance coverage is also available. Most retirees contrib-ute toward the cost of health care coverage with the contributions generally var-ying based on service. The plan was amended in 2003 to restrict participation to existing retirees who were eligible retirees as of December 31, 2003 and active employees who were eligible to participate in the Autoliv ASP, Inc. Pension Plan as of December 31, 2003. The plan provides a Company paid subsidy based on service for all current and future retirees that qualify for retirement based on the restrictions stated above. Employees hired on or after January 1, 2004 are not el-igible to participate in the plan. The amount of the Company paid subsidy is fro-zen and will not change in the future. Generally, employees will need 15 years of service to qualify for a benefit from the plan in the future.
At present, there is no pre-funding of the postretirement benefits recognized. The Company has reviewed the impact of the Medicare Prescription Drug, Improve-ment and Modernization Act of 2003 (Medicare Part D) on its financial statements. Although the Plan may currently qualify for a subsidy from Medicare, the amount of the subsidy is so small that the expenses incurred to file for the subsidy may ex-ceed the subsidy itself. Therefore the impact of any subsidy is ignored in the cal-culations as Autoliv will not be filing for any reimbursement from Medicare.
CHANGES IN BENEFIT OBLIGATIONS AND PLAN ASSETS FOR POSTRETIREMENT BENEFIT PLANS OTHER THAN PENSIONS AS OF DECEMBER 31
2013 2012 2011
Benefit obligation at beginning of year $34.6 $30.8 $27.9Service cost 1.4 1.1 1.3Interest cost 1.4 1.3 1.5Actuarial (gain) loss due to: Change in discount rate (3.7) 1.9 3.1 Experience 1.0 (3.1) 0.5 Other assumption changes (1.0) 3.2 (2.7)Benefits paid (0.3) (0.5) (0.8)Other 0.9 (0.1) –Benefit obligation at end of year $34.3 $34.6 $30.8
Fair value of plan assets at beginning of year $- $– $–Company contributions 0.3 0.5 0.8Benefits paid (0.3) (0.5) (0.8)Fair value of plan assets at end of year
$- $– $–
Accrued postretirement benefit cost recognized in the balance sheet
$(34.3) $(34.6) $(30.8)
The liability for postretirement benefits other than pensions is classified as oth-er non-current liabilities in the balance sheet. The short-term portion of the lia-bility for postretirement benefits other than pensions is not significant.
COMPONENTS OF NET PERIODIC BENEFIT COST ASSOCIATED WITH THE POST-RETIREMENT BENEFIT PLANS OTHER THAN PENSIONS
PERIOD ENDED DECEMBER 31 2013 2012 2011
Service cost $1.4 $1.1 $1.3Interest cost 1.4 1.3 1.5Amortization of prior service cost (0.1) (0.1) (0.1)Amortization of actuarial loss (0.1) (0.2) (0.1)Net periodic benefit cost $2.6 $2.1 $2.6
COMPONENTS OF ACCUMULATED OTHER COMPREHENSIVE INCOME BEFORE TAX ASSOCIATED WITH POSTRETIREMENT BENEFIT PLANS OTHER THAN PENSIONS AS OF DECEMBER 31
U.S. Non-U.S.2013 2012 2013 2012
Net actuarial loss (gain) $(2.4) $0.1 $(1.8) $(0.7)Prior service cost (credit) (0.2) (0.3) (0.0) (0.0)Total accumulated other comprehensive income recognized in the balance sheet
$(2.6) $(0.2) $(1.8) $(0.7)
For measuring end-of-year obligations at December 31, 2013, health care trends are not needed due to the fixed-cost nature of the benefits provided in 2013 and beyond. After 2006, all retirees receive a fixed dollar subsidy toward the cost of their health benefits. The individual retiree subsidy will not increase in future years.
The weighted average discount rate used to determine the U.S. postretirement benefit obligation was 5.05% in 2013 and 4.25% in 2012. The average discount rate used in determining the postretirement benefit cost was 4.25% in 2013, 4.60% in 2012 and 5.40% in 2011.
A one percentage point increase or decrease in the annual health care cost trend rates would have had no significant impact on the Company’s net benefit cost for the current period or on the accumulated postretirement benefit obliga-tion at December 31, 2013. This is due to the fixed-dollar nature of the benefits provided under the plan.
The estimated net gain and prior service credit for the postretirement benefit plans that will be amortized from other comprehensive income into net benefit cost over the next fiscal year are approximately $0.2 million combined.
The estimated future benefit payments for the postretirement benefits reflect expected future service as appropriate.
POSTRETIREMENT BENEFITS EXPECTED PAYMENTS
2014 $1.02015 $1.22016 $1.32017 $1.52018 $1.7Years 2019–2023 $11.5
AUTOLIV 2013 / NOTES80
21. Subsequent Events After December 31, 2013, as previously announced, the Board of Directors ap-proved an additional 10 million shares for repurchase as part of the Company’s share repurchase program (see Note 13).
There were no other reportable events subsequent to December 31, 2013.
19. Segment Information
The Company has two operating segments (also known internally as reporting units): Passive Safety products (mainly various airbag and seatbelt products and components, including common electronic and sensing systems) and Active Safe-ty products (radars, night vision systems and cameras with driver assist systems). The Company’s Active Safety operating segment represents less than 4% of the Company’s total sales. Due to the relative size of the Active Safety operating seg-ment the Company has concluded that its operating segments meet the criteria for combination for reporting purposes into a single reportable segment.
The Company’s customers consist of all major European, U.S. and Asian au-tomobile manufacturers. Sales to individual customers representing 10% or more of net sales were:
In 2013: GM 15% (incl. Opel, etc.), Ford 11% and Renault 11% (incl. Nissan).In 2012: GM 15% (incl. Opel, etc.), Ford 11% and Renault 11% (incl. Nissan).In 2011: GM 15% (incl. Opel, etc.), Renault 12% (incl. Nissan) and Ford 10%.
NET SALES 2013 2012 2011
Asia $2,974.1 $2,752.2 $2,571.4Whereof: China 1,405.5 1,097.6 981.9 Japan 688.2 830.5 758.5 Rest of Asia 880.4 824.1 831.0Americas 2,943.6 2,839.1 2,558.9Europe 2,885.7 2,675.4 3,102.1Total $8,803.4 $8,266.7 $8,232.4
The Company has attributed net sales to the geographic area based on the loca-tion of the entity selling the final product. For 2012, the Company has reclassified approximately $31 million in sales of Active Safety products from the Americas to Europe which is reflected in the table above. This reclassification had no change to net sales or total sales of Active Safety products.
External sales in the U.S. amounted to $2,122 million, $2,073 million and $1,920 million in 2013, 2012 and 2011, respectively. Of the external sales, exports from the U.S. to other regions amounted to approximately $488 million, $543 million and $535 million in 2013, 2012 and 2011, respectively.
SALES BY PRODUCT 2013 2012 2011
Airbags and associated products1) $5,686.0 $5,392.0 $5,392.8Seatbelts and associated products 2,772.7 2,656.5 2,679.4Active Safety products 344.7 218.2 160.2Total $8,803.4 $8,266.7 $8,232.4
1) Includes sales of steering wheels, passive safety electronics and inflators.
LONG-LIVED ASSETS 2013 2012
Asia $612 $573Whereof: China 277 243 Japan 106 130 Rest of Asia 229 200Americas 1,927 1,977Europe 744 731Total $3,283 $3,281
Long-lived assets in the U.S. amounted to $1,741 million and $1,812 million for 2013 and 2012, respectively. For 2013, $1,485 million (2012, $1,497 million) of the long-lived assets in the U.S. refers to intangible assets, principally from acquisi-tion goodwill.
20. Earnings Per Share
The weighted average shares used in calculating earnings per share were:
2013 2012 2011
Weighted average shares basic 95.5 93.5 89.2Effect of dilutive securities: stock options/share awards 0.4 0.3 0.5 equity units – 1.3 4.0Weighted average shares diluted 95.9 95.1 93.7
The number of shares outstanding increased on April 30, 2012 by 5.8 million due to the settlement of the remaining equity units. For 2012, 1.3 million shares were included in the dilutive weighted average share amount related to the equity units. Due to the settlement in April 2012 there is no effect in 2013. For further informa-tion see Note 13.
Approximately 0.0 million, 0.4 million and 0.2 million common shares related to the Company’s Stock Incentive Plan, which were antidilutive during the respec-tive year, but that could potentially dilute basic EPS in the future, are not includ-ed in the computation of the diluted EPS for 2013, 2012 and 2011, respectively.
81
22. Quarterly Financial Data (unaudited)
2013 Q1 Q2 Q3 Q4
Net sales $2,135.0 $2,197.5 $2,119.0 $2,351.9Gross profit 414.3 430.5 404.9 454.9Income before taxes 170.1 192.7 176.6 194.6Net income 125.1 139.4 124.9 100.5Net income attributable to controlling interest 123.5 138.7 123.9 99.7Earnings per share– basic $1.29 $1.45 $1.29 $1.05– diluted $1.29 $1.44 $1.29 $1.04Dividends paid $0.50 $0.50 $0.50 $0.50
2012 Q1 Q2 Q3 Q4
Net sales $2,178.9 $2,088.8 $1,947.1 $2,051.9Gross profit 441.1 422.1 387.6 395.4Income before taxes 141.1 182.4 175.1 170.0Net income 101.4 126.2 118.0 140.0Net income attributable to controlling interest 100.5 126.4 117.5 138.7Earnings per share– basic $1.12 $1.35 $1.23 $1.45– diluted $1.07 $1.33 $1.23 $1.45Dividends paid $0.45 $0.47 $0.47 $0.50
EXCHANGE RATES FOR KEY CURRENCIES VS. U.S. DOLLAR
2013 2013 2012 2012 2011 2011 2010 2010 2009 2009Average Year end Average Year end Average Year end Average Year end Average Year end
EUR 1.328 1.374 1.285 1.322 1.390 1.292 1.321 1.323 1.387 1.435CNY 0.162 0.165 0.159 0.160 0.155 0.159 0.148 0.151 0.146 0.147JPY/1000 10.256 9.494 12.538 11.607 12.570 12.881 11.411 12.268 10.692 10.877KRW/1000 0.914 0.949 0.888 0.937 0.904 0.863 0.864 0.883 0.783 0.859MXN 0.078 0.077 0.076 0.077 0.080 0.071 0.079 0.081 0.074 0.076SEK 0.153 0.154 0.148 0.153 0.154 0.144 0.139 0.147 0.131 0.139
82 AUTOLIV 2013 / AUDITOR’S REPORTS
Report of Independent Registered Public Accounting Firm on Internal Control Over Financial ReportingThe Board of Directors and Shareholders of Autoliv, Inc.
We have audited Autoliv, Inc.’s internal control over financial reporting as of December 31, 2013, based on criteria established in Internal Control–Integrated Framework issued by the Committee of Sponsoring Organizations of the Tread-way Commission (1992 framework) (the COSO criteria). Autoliv, Inc.’s manage-ment is responsible for maintaining effective internal control over financial re-porting, and for its assessment of the effectiveness of internal control over financial reporting included in the accompanying Management’s Report on Inter-nal Control over Financial Reporting. Our responsibility is to express an opinion on the Company’s internal control over financial reporting based on our audit.
We conducted our audit in accordance with the standards of the Public Com-pany Accounting Oversight Board (United States). Those standards require that we plan and perform the audit to obtain reasonable assurance about whether ef-fective internal control over financial reporting was maintained in all material re-spects. Our audit included obtaining an understanding of internal control over fi-nancial reporting, assessing the risk that a material weakness exists, testing and evaluating the design and operating effectiveness of internal control based on the assessed risk, and performing such other procedures as we considered neces-sary in the circumstances. We believe that our audit provides a reasonable basis for our opinion.
A Company’s internal control over financial reporting is a process designed to provide reasonable assurance regarding the reliability of financial reporting and the preparation of financial statements for external purposes in accordance with generally accepted accounting principles. A Company’s internal control over fi-nancial reporting includes those policies and procedures that (1) pertain to the maintenance of records that, in reasonable detail, accurately and fairly reflect the transactions and dispositions of the assets of the Company; (2) provide reasona-ble assurance that transactions are recorded as necessary to permit preparation
of financial statements in accordance with generally accepted accounting princi-ples, and that receipts and expenditures of the Company are being made only in accordance with authorizations of management and directors of the Company; and (3) provide reasonable assurance regarding prevention or timely detection of unauthorized acquisition, use or disposition of the Company’s assets that could have a material effect on the financial statements.
Because of its inherent limitations, internal control over financial reporting may not prevent or detect misstatements. Also, projections of any evaluation of effectiveness to future periods are subject to the risk that controls may become inadequate because of changes in conditions, or that the degree of compliance with the policies or procedures may deteriorate.
In our opinion, Autoliv, Inc. maintained, in all material respects, effective in-ternal control over financial reporting as of December 31, 2013, based on the COSO criteria.
We have also audited, in accordance with the standards of the Public Compa-ny Accounting Oversight Board (United States), the consolidated balance sheets of Autoliv, Inc. as of December 31, 2013 and 2012, and the related consolidated statements of income and comprehensive income, shareholders’ equity and cash flows of Autoliv, Inc. for each of the three years in the period ended December 31, 2013 and our report dated February 21, 2014 expressed an unqualified opinion thereon.
Stockholm, Sweden February 21, 2014 / s / Ernst & Young AB
Report of Independent Registered Public Accounting FirmThe Board of Directors and Shareholders of Autoliv, Inc.
We have audited the accompanying consolidated balance sheets of Autoliv, Inc. as of December 31, 2013 and 2012, and the related consolidated statements of net income, comprehensive income, shareholders’ equity and cash flows for each of the three years in the period ended December 31, 2013. These financial state-ments are the responsibility of the Company’s management. Our responsibility is to express an opinion on these financial statements based on our audits.
We conducted our audits in accordance with the standards of the Public Com-pany Accounting Oversight Board (United States). Those standards require that we plan and perform the audit to obtain reasonable assurance about whether the financial statements are free of material misstatement. An audit includes exam-ining, on a test basis, evidence supporting the amounts and disclosures in the fi-nancial statements. An audit also includes assessing the accounting principles used and significant estimates made by management, as well as evaluating the overall financial statement presentation. We believe that our audits provide a rea-sonable basis for our opinion.
In our opinion, the financial statements referred to above present fairly, in all material respects, the consolidated financial position of Autoliv, Inc. at December 31, 2013 and 2012, and the consolidated results of its operations and its cash flows
for each of the three years in the period ended December 31, 2013, in conformity with U.S. generally accepted accounting principles.
We also have audited, in accordance with the standards of the Public Compa-ny Accounting Oversight Board (United States), Autoliv, Inc.’s internal control over financial reporting as of December 31, 2013, based on criteria established in In-ternal Control–Integrated Framework issued by the Committee of Sponsoring Or-ganizations of the Treadway Commission (1992 framework) and our report dated February 21, 2014 expressed an unqualified opinion thereon.
Stockholm, Sweden February 21, 2014 / s / Ernst & Young AB
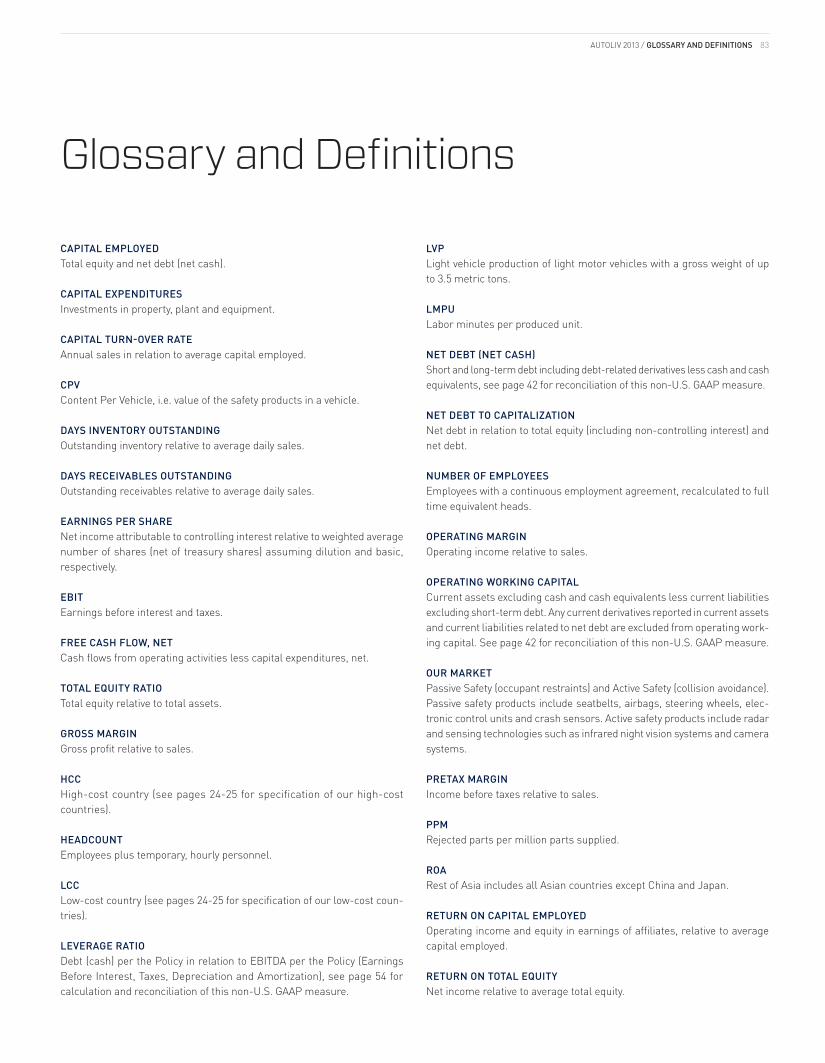
83
Glossary and Definitions
CAPITAL EMPLOYEDTotal equity and net debt (net cash).
CAPITAL EXPENDITURESInvestments in property, plant and equipment.
CAPITAL TURN-OVER RATEAnnual sales in relation to average capital employed.
CPVContent Per Vehicle, i.e. value of the safety products in a vehicle.
DAYS INVENTORY OUTSTANDINGOutstanding inventory relative to average daily sales.
DAYS RECEIVABLES OUTSTANDINGOutstanding receivables relative to average daily sales.
EARNINGS PER SHARENet income attributable to controlling interest relative to weighted average number of shares (net of treasury shares) assuming dilution and basic, respectively.
EBITEarnings before interest and taxes.
FREE CASH FLOW, NETCash flows from operating activities less capital expenditures, net.
TOTAL EQUITY RATIOTotal equity relative to total assets.
GROSS MARGINGross profit relative to sales.
HCCHigh-cost country (see pages 24-25 for specification of our high-cost countries).
HEADCOUNTEmployees plus temporary, hourly personnel.
LCCLow-cost country (see pages 24-25 for specification of our low-cost coun-tries).
LEVERAGE RATIODebt (cash) per the Policy in relation to EBITDA per the Policy (Earnings Before Interest, Taxes, Depreciation and Amortization), see page 54 for calculation and reconciliation of this non-U.S. GAAP measure.
LVPLight vehicle production of light motor vehicles with a gross weight of up to 3.5 metric tons.
LMPULabor minutes per produced unit.
NET DEBT (NET CASH)Short and long-term debt including debt-related derivatives less cash and cash equivalents, see page 42 for reconciliation of this non-U.S. GAAP measure.
NET DEBT TO CAPITALIZATIONNet debt in relation to total equity (including non-controlling interest) and net debt.
NUMBER OF EMPLOYEESEmployees with a continuous employment agreement, recalculated to full time equivalent heads.
OPERATING MARGINOperating income relative to sales.
OPERATING WORKING CAPITALCurrent assets excluding cash and cash equivalents less current liabilities excluding short-term debt. Any current derivatives reported in current assets and current liabilities related to net debt are excluded from operating work-ing capital. See page 42 for reconciliation of this non-U.S. GAAP measure.
OUR MARKETPassive Safety (occupant restraints) and Active Safety (collision avoidance). Passive safety products include seatbelts, airbags, steering wheels, elec-tronic control units and crash sensors. Active safety products include radar and sensing technologies such as infrared night vision systems and camera systems.
PRETAX MARGINIncome before taxes relative to sales.
PPMRejected parts per million parts supplied.
ROARest of Asia includes all Asian countries except China and Japan.
RETURN ON CAPITAL EMPLOYEDOperating income and equity in earnings of affiliates, relative to average capital employed.
RETURN ON TOTAL EQUITYNet income relative to average total equity.
AUTOLIV 2013 / GLOSSARY AND DEFINITIONS
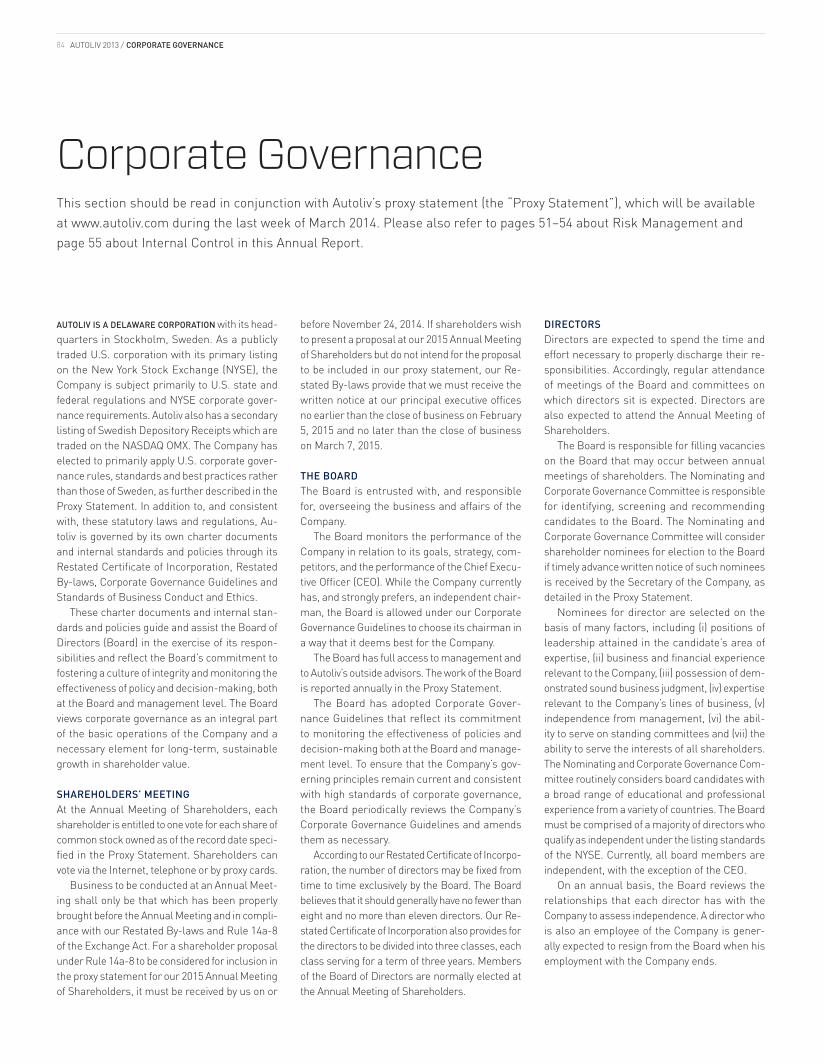
84 AUTOLIV 2013 / CORPORATE GOVERNANCE
Corporate GovernanceThis section should be read in conjunction with Autoliv’s proxy statement (the “Proxy Statement”), which will be available at www.autoliv.com during the last week of March 2014. Please also refer to pages 51–54 about Risk Management and page 55 about Internal Control in this Annual Report.
aUtoliv is a delawaRe CoRpoRation with its head-quarters in Stockholm, Sweden. As a publicly traded U.S. corporation with its primary listing on the New York Stock Exchange (NYSE), the Company is subject primarily to U.S. state and federal regulations and NYSE corporate gover-nance requirements. Autoliv also has a secondary listing of Swedish Depository Receipts which are traded on the NASDAQ OMX. The Company has elected to primarily apply U.S. corporate gover-nance rules, standards and best practices rather than those of Sweden, as further described in the Proxy Statement. In addition to, and consistent with, these statutory laws and regulations, Au-toliv is governed by its own charter documents and internal standards and policies through its Restated Certificate of Incorporation, Restated By-laws, Corporate Governance Guidelines and Standards of Business Conduct and Ethics.
These charter documents and internal stan-dards and policies guide and assist the Board of Directors (Board) in the exercise of its respon-sibilities and reflect the Board’s commitment to fostering a culture of integrity and monitoring the effectiveness of policy and decision-making, both at the Board and management level. The Board views corporate governance as an integral part of the basic operations of the Company and a necessary element for long-term, sustainable growth in shareholder value.
SHAREHOLDERS’ MEETING At the Annual Meeting of Shareholders, each shareholder is entitled to one vote for each share of common stock owned as of the record date speci-fied in the Proxy Statement. Shareholders can vote via the Internet, telephone or by proxy cards.
Business to be conducted at an Annual Meet-ing shall only be that which has been properly brought before the Annual Meeting and in compli-ance with our Restated By-laws and Rule 14a-8 of the Exchange Act. For a shareholder proposal under Rule 14a-8 to be considered for inclusion in the proxy statement for our 2015 Annual Meeting of Shareholders, it must be received by us on or
before November 24, 2014. If shareholders wish to present a proposal at our 2015 Annual Meeting of Shareholders but do not intend for the proposal to be included in our proxy statement, our Re-stated By-laws provide that we must receive the written notice at our principal executive offices no earlier than the close of business on February 5, 2015 and no later than the close of business on March 7, 2015.
THE BOARD The Board is entrusted with, and responsible for, overseeing the business and affairs of the Company.
The Board monitors the performance of the Company in relation to its goals, strategy, com-petitors, and the performance of the Chief Execu-tive Officer (CEO). While the Company currently has, and strongly prefers, an independent chair-man, the Board is allowed under our Corporate Governance Guidelines to choose its chairman in a way that it deems best for the Company.
The Board has full access to management and to Autoliv’s outside advisors. The work of the Board is reported annually in the Proxy Statement.
The Board has adopted Corporate Gover-nance Guidelines that reflect its commitment to monitoring the effectiveness of policies and decision-making both at the Board and manage-ment level. To ensure that the Company’s gov-erning principles remain current and consistent with high standards of corporate governance, the Board periodically reviews the Company’s Corporate Governance Guidelines and amends them as necessary.
According to our Restated Certificate of Incorpo-ration, the number of directors may be fixed from time to time exclusively by the Board. The Board believes that it should generally have no fewer than eight and no more than eleven directors. Our Re-stated Certificate of Incorporation also provides for the directors to be divided into three classes, each class serving for a term of three years. Members of the Board of Directors are normally elected at the Annual Meeting of Shareholders.
DIRECTORS Directors are expected to spend the time and effort necessary to properly discharge their re-sponsibilities. Accordingly, regular attendance of meetings of the Board and committees on which directors sit is expected. Directors are also expected to attend the Annual Meeting of Shareholders.
The Board is responsible for filling vacancies on the Board that may occur between annual meetings of shareholders. The Nominating and Corporate Governance Committee is responsible for identifying, screening and recommending candidates to the Board. The Nominating and Corporate Governance Committee will consider shareholder nominees for election to the Board if timely advance written notice of such nominees is received by the Secretary of the Company, as detailed in the Proxy Statement.
Nominees for director are selected on the basis of many factors, including (i) positions of leadership attained in the candidate’s area of expertise, (ii) business and financial experience relevant to the Company, (iii) possession of dem-onstrated sound business judgment, (iv) expertise relevant to the Company’s lines of business, (v) independence from management, (vi) the abil-ity to serve on standing committees and (vii) the ability to serve the interests of all shareholders. The Nominating and Corporate Governance Com-mittee routinely considers board candidates with a broad range of educational and professional experience from a variety of countries. The Board must be comprised of a majority of directors who qualify as independent under the listing standards of the NYSE. Currently, all board members are independent, with the exception of the CEO.
On an annual basis, the Board reviews the relationships that each director has with the Company to assess independence. A director who is also an employee of the Company is gener-ally expected to resign from the Board when his employment with the Company ends.
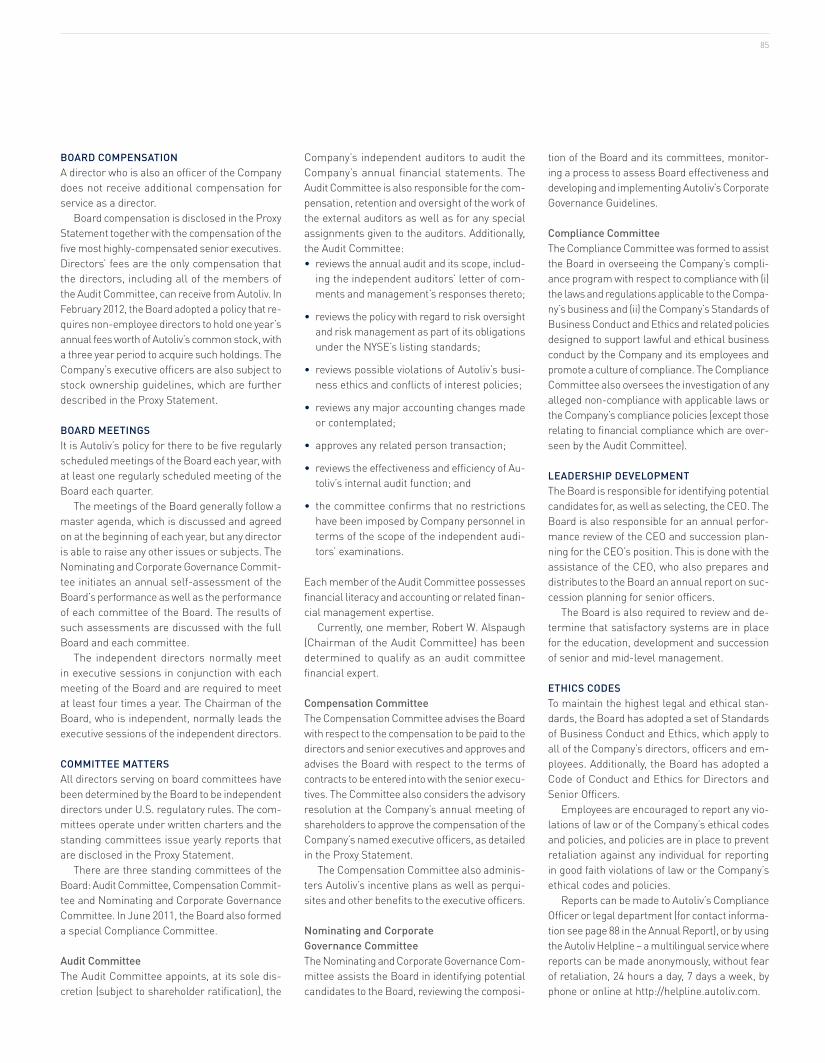
85
BOARD COMPENSATION A director who is also an officer of the Company does not receive additional compensation for service as a director.
Board compensation is disclosed in the Proxy Statement together with the compensation of the five most highly-compensated senior executives. Directors’ fees are the only compensation that the directors, including all of the members of the Audit Committee, can receive from Autoliv. In February 2012, the Board adopted a policy that re-quires non-employee directors to hold one year’s annual fees worth of Autoliv’s common stock, with a three year period to acquire such holdings. The Company’s executive officers are also subject to stock ownership guidelines, which are further described in the Proxy Statement.
BOARD MEETINGS It is Autoliv’s policy for there to be five regularly scheduled meetings of the Board each year, with at least one regularly scheduled meeting of the Board each quarter.
The meetings of the Board generally follow a master agenda, which is discussed and agreed on at the beginning of each year, but any director is able to raise any other issues or subjects. The Nominating and Corporate Governance Commit-tee initiates an annual self-assessment of the Board’s performance as well as the performance of each committee of the Board. The results of such assessments are discussed with the full Board and each committee.
The independent directors normally meet in executive sessions in conjunction with each meeting of the Board and are required to meet at least four times a year. The Chairman of the Board, who is independent, normally leads the executive sessions of the independent directors.
COMMITTEE MATTERS All directors serving on board committees have been determined by the Board to be independent directors under U.S. regulatory rules. The com-mittees operate under written charters and the standing committees issue yearly reports that are disclosed in the Proxy Statement.
There are three standing committees of the Board: Audit Committee, Compensation Commit-tee and Nominating and Corporate Governance Committee. In June 2011, the Board also formed a special Compliance Committee.
Audit Committee The Audit Committee appoints, at its sole dis-cretion (subject to shareholder ratification), the
Company’s independent auditors to audit the Company’s annual financial statements. The Audit Committee is also responsible for the com-pensation, retention and oversight of the work of the external auditors as well as for any special assignments given to the auditors. Additionally, the Audit Committee: • reviews the annual audit and its scope, includ-
ing the independent auditors’ letter of com-ments and management’s responses thereto;
• reviews the policy with regard to risk oversight and risk management as part of its obligations under the NYSE’s listing standards;
• reviews possible violations of Autoliv’s busi-ness ethics and conflicts of interest policies;
• reviews any major accounting changes made or contemplated;
• approves any related person transaction;
• reviews the effectiveness and efficiency of Au-toliv’s internal audit function; and
• the committee confirms that no restrictions have been imposed by Company personnel in terms of the scope of the independent audi-tors’ examinations.
Each member of the Audit Committee possesses financial literacy and accounting or related finan-cial management expertise.
Currently, one member, Robert W. Alspaugh (Chairman of the Audit Committee) has been determined to qualify as an audit committee financial expert.
Compensation Committee The Compensation Committee advises the Board with respect to the compensation to be paid to the directors and senior executives and approves and advises the Board with respect to the terms of contracts to be entered into with the senior execu-tives. The Committee also considers the advisory resolution at the Company’s annual meeting of shareholders to approve the compensation of the Company’s named executive officers, as detailed in the Proxy Statement.
The Compensation Committee also adminis-ters Autoliv’s incentive plans as well as perqui-sites and other benefits to the executive officers.
Nominating and Corporate Governance Committee The Nominating and Corporate Governance Com-mittee assists the Board in identifying potential candidates to the Board, reviewing the composi-
tion of the Board and its committees, monitor-ing a process to assess Board effectiveness and developing and implementing Autoliv’s Corporate Governance Guidelines.
Compliance Committee The Compliance Committee was formed to assist the Board in overseeing the Company’s compli-ance program with respect to compliance with (i) the laws and regulations applicable to the Compa-ny’s business and (ii) the Company’s Standards of Business Conduct and Ethics and related policies designed to support lawful and ethical business conduct by the Company and its employees and promote a culture of compliance. The Compliance Committee also oversees the investigation of any alleged non-compliance with applicable laws or the Company’s compliance policies (except those relating to financial compliance which are over-seen by the Audit Committee).
LEADERSHIP DEVELOPMENT The Board is responsible for identifying potential candidates for, as well as selecting, the CEO. The Board is also responsible for an annual perfor-mance review of the CEO and succession plan-ning for the CEO’s position. This is done with the assistance of the CEO, who also prepares and distributes to the Board an annual report on suc-cession planning for senior officers.
The Board is also required to review and de-termine that satisfactory systems are in place for the education, development and succession of senior and mid-level management.
ETHICS CODES To maintain the highest legal and ethical stan-dards, the Board has adopted a set of Standards of Business Conduct and Ethics, which apply to all of the Company’s directors, officers and em-ployees. Additionally, the Board has adopted a Code of Conduct and Ethics for Directors and Senior Officers.
Employees are encouraged to report any vio-lations of law or of the Company’s ethical codes and policies, and policies are in place to prevent retaliation against any individual for reporting in good faith violations of law or the Company’s ethical codes and policies.
Reports can be made to Autoliv’s Compliance Officer or legal department (for contact informa-tion see page 88 in the Annual Report), or by using the Autoliv Helpline – a multilingual service where reports can be made anonymously, without fear of retaliation, 24 hours a day, 7 days a week, by phone or online at http://helpline.autoliv.com.
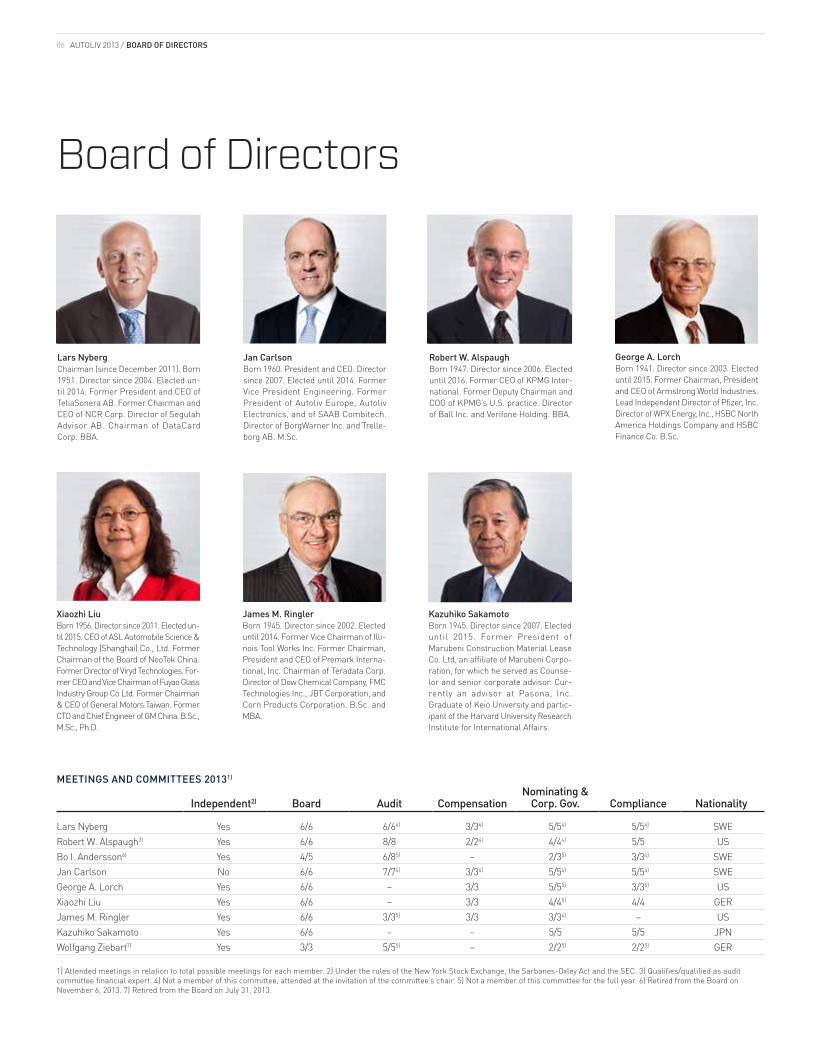
86 AUTOLIV 2013 / BOARD OF DIRECTORS
Kazuhiko SakamotoBorn 1945. Director since 2007. Elected until 2015. Former President of Marubeni Construction Material Lease Co. Ltd, an affiliate of Marubeni Corpo-ration, for which he served as Counse-lor and senior corporate advisor. Cur-rently an advisor at Pasona, Inc. Graduate of Keio University and partic-ipant of the Harvard University Research Institute for International Affairs.
George A. LorchBorn 1941. Director since 2003. Elected until 2015. Former Chairman, President and CEO of Armstrong World Industries. Lead Independent Director of Pfizer, Inc. Director of WPX Energy, Inc., HSBC North America Holdings Company and HSBC Finance Co. B.Sc.
Board of Directors
Lars NybergChairman (since December 2011). Born 1951. Director since 2004. Elected un-til 2014. Former President and CEO of TeliaSonera AB. Former Chairman and CEO of NCR Corp. Director of Segulah Advisor AB. Chairman of DataCard Corp. BBA.
Xiaozhi LiuBorn 1956. Director since 2011. Elected un-til 2015. CEO of ASL Automobile Science & Technology (Shanghai) Co., Ltd. Former Chairman of the Board of NeoTek China. Former Director of Viryd Technologies. For-mer CEO and Vice Chairman of Fuyao Glass Industry Group Co Ltd. Former Chairman & CEO of General Motors Taiwan. Former CTO and Chief Engineer of GM China. B.Sc., M.Sc., Ph.D.
Robert W. AlspaughBorn 1947. Director since 2006. Elected until 2016. Former CEO of KPMG Inter-national. Former Deputy Chairman and COO of KPMG’s U.S. practice. Director of Ball Inc. and Verifone Holding. BBA.
James M. RinglerBorn 1945. Director since 2002. Elected until 2014. Former Vice Chairman of Illi-nois Tool Works Inc. Former Chairman, President and CEO of Premark Interna-tional, Inc. Chairman of Teradata Corp. Director of Dow Chemical Company, FMC Technologies Inc., JBT Corporation, and Corn Products Corporation. B.Sc. and MBA.
Jan CarlsonBorn 1960. President and CEO. Director since 2007. Elected until 2014. Former Vice President Engineering. Former President of Autoliv Europe, Autoliv Electronics, and of SAAB Combitech. Director of BorgWarner Inc. and Trelle-borg AB. M.Sc.
MEETINGS AND COMMITTEES 20131)
Independent2) Board Audit CompensationNominating &
Corp. Gov. Compliance Nationality
Lars Nyberg Yes 6/6 6/64) 3/34) 5/54) 5/54) SWERobert W. Alspaugh3) Yes 6/6 8/8 2/24) 4/44) 5/5 USBo I. Andersson6) Yes 4/5 6/85) – 2/35) 3/34) SWEJan Carlson No 6/6 7/74) 3/34) 5/54) 5/54) SWEGeorge A. Lorch Yes 6/6 – 3/3 5/55) 3/35) USXiaozhi Liu Yes 6/6 – 3/3 4/45) 4/4 GERJames M. Ringler Yes 6/6 3/35) 3/3 3/34) – USKazuhiko Sakamoto Yes 6/6 – – 5/5 5/5 JPNWolfgang Ziebart7) Yes 3/3 5/55) – 2/25) 2/25) GER
1) Attended meetings in relation to total possible meetings for each member. 2) Under the rules of the New York Stock Exchange, the Sarbanes-Oxley Act and the SEC. 3) Qualifies/qualified as audit committee financial expert. 4) Not a member of this committee, attended at the invitation of the committee’s chair. 5) Not a member of this committee for the full year. 6) Retired from the Board on November 6, 2013. 7) Retired from the Board on July 31, 2013.
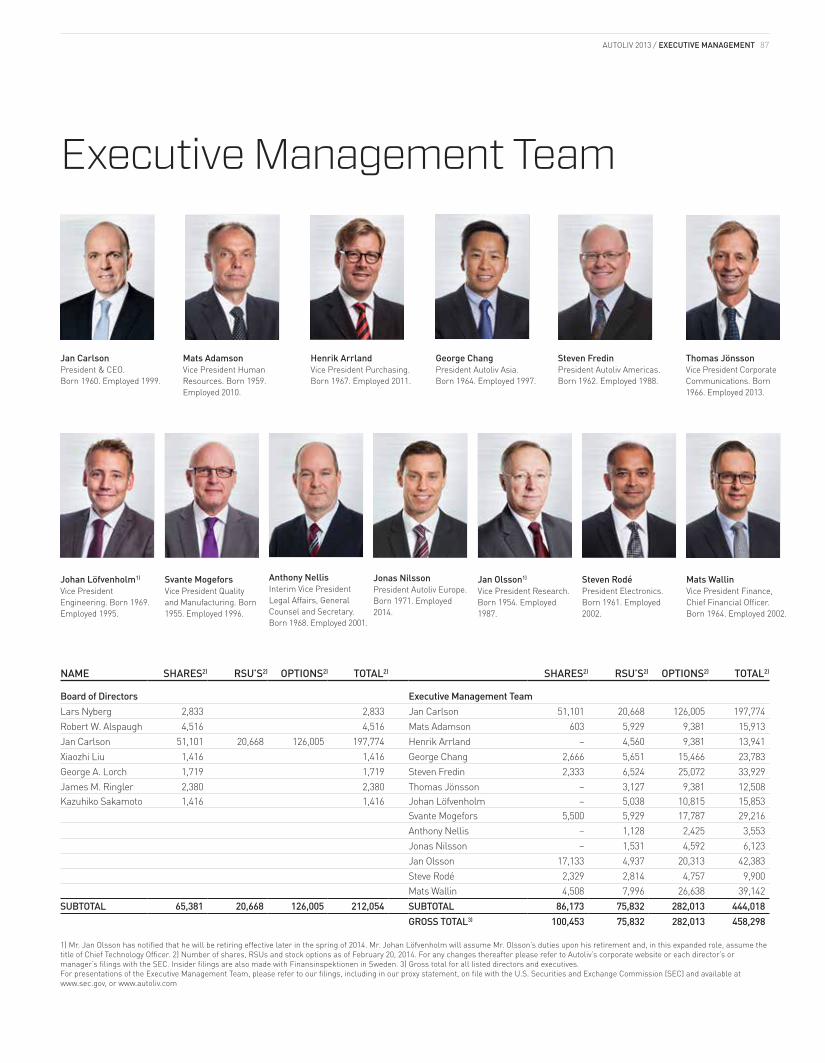
87AUTOLIV 2013 / EXECUTIVE MANAGEMENT
Executive Management Team
Jan CarlsonPresident & CEO. Born 1960. Employed 1999.
Svante MogeforsVice President Quality and Manufacturing. Born 1955. Employed 1996.
Steven FredinPresident Autoliv Americas. Born 1962. Employed 1988.
Mats AdamsonVice President Human Resources. Born 1959. Employed 2010.
Anthony NellisInterim Vice President Legal Affairs, General Counsel and Secretary. Born 1968. Employed 2001.
Johan Löfvenholm1)
Vice President Engineering. Born 1969. Employed 1995.
Jonas NilssonPresident Autoliv Europe. Born 1971. Employed 2014.
Henrik ArrlandVice President Purchasing. Born 1967. Employed 2011.
Jan Olsson1)
Vice President Research. Born 1954. Employed 1987.
George ChangPresident Autoliv Asia. Born 1964. Employed 1997.
Thomas JönssonVice President Corporate Communications. Born 1966. Employed 2013.
Mats WallinVice President Finance, Chief Financial Officer. Born 1964. Employed 2002.
Steven RodéPresident Electronics.Born 1961. Employed 2002.
NAME SHARES2) RSU’S2) OPTIONS2) TOTAL2) SHARES2) RSU’S2) OPTIONS2) TOTAL2)
Board of Directors Executive Management TeamLars Nyberg 2,833 2,833 Jan Carlson 51,101 20,668 126,005 197,774 Robert W. Alspaugh 4,516 4,516 Mats Adamson 603 5,929 9,381 15,913 Jan Carlson 51,101 20,668 126,005 197,774 Henrik Arrland – 4,560 9,381 13,941 Xiaozhi Liu 1,416 1,416 George Chang 2,666 5,651 15,466 23,783 George A. Lorch 1,719 1,719 Steven Fredin 2,333 6,524 25,072 33,929 James M. Ringler 2,380 2,380 Thomas Jönsson – 3,127 9,381 12,508 Kazuhiko Sakamoto 1,416 1,416 Johan Löfvenholm – 5,038 10,815 15,853
Svante Mogefors 5,500 5,929 17,787 29,216 Anthony Nellis – 1,128 2,425 3,553 Jonas Nilsson – 1,531 4,592 6,123 Jan Olsson 17,133 4,937 20,313 42,383 Steve Rodé 2,329 2,814 4,757 9,900
Mats Wallin 4,508 7,996 26,638 39,142 SUBTOTAL 65,381 20,668 126,005 212,054 SUBTOTAL 86,173 75,832 282,013 444,018
GROSS TOTAL3) 100,453 75,832 282,013 458,298
1) Mr. Jan Olsson has notified that he will be retiring effective later in the spring of 2014. Mr. Johan Löfvenholm will assume Mr. Olsson’s duties upon his retirement and, in this expanded role, assume the title of Chief Technology Officer. 2) Number of shares, RSUs and stock options as of February 20, 2014. For any changes thereafter please refer to Autoliv’s corporate website or each director’s or manager’s filings with the SEC. Insider filings are also made with Finansinspektionen in Sweden. 3) Gross total for all listed directors and executives. For presentations of the Executive Management Team, please refer to our filings, including in our proxy statement, on file with the U.S. Securities and Exchange Commission (SEC) and available at www.sec.gov, or www.autoliv.com
88 AUTOLIV 2013 / INFORMATION
Contact Information & CalendarAUTOLIV INC.Visiting address: Vasagatan 11, 7th Floor, Stockholm, Sweden Mail: P.O. Box 70381, SE-107 24 Stockholm, SwedenTel: +46 (0)8 587 20 600E-mail: [email protected]: www.autoliv.com
CONTACT INFORMATION BOARD AND CORPORATE COMPLIANCE COUNSELc/o Vice President Legal Affairs Autoliv, Inc. / Box 70381, SE-107 24 Stockholm, SwedenTel: +46 (0)8 58 72 06 00 Fax: +46 (0)8 58 72 06 33E-mail: [email protected]
The Board, the independent directors, as well as the committees of the Board can be contacted using the address above. Contact can be made anonymously and communication with the independent directors is not screened. The relevant chairman receives all such communication after it has been determined that the content represents a message to such chairman.
STOCK TRANSFER AGENT & REGISTRARInternet: www.computershare.com
INVESTOR REQUESTS AMERICASAutoliv, Inc., c/o Autoliv Electronics America, 26545 American Drive, Southfield, MI 48034 Tel: +1 (248) 223 8107 E-mail: [email protected]
INVESTOR REQUESTS REST OF THE WORLDAutoliv, Inc., Box 70381, SE-107 24, Stockholm, Sweden Tel: +46 (0)8 58 72 06 27E-mail: [email protected]
MEDIA CONTACTAutoliv, Inc., Box 70381, SE-107 24, Stockholm, Sweden Tel: +46 (0)8 58 72 06 27 E-mail: [email protected]
ACKNOWLEDGEMENTSConcept and Design: PCG Stockholm, SwedenIllustrations: Borgs Ingenjörsbyrå, SwedenPhotos: Naru Unui, Rickard L. Eriksson, Pieter Mouton, Bernhard Sturm
The raw material of this report supports responsibly managed forests. Paper Gallerie Art Matt, Colorit.
2014 PRELIMINARY DIVIDEND PLAN
PERIOD EX-DATE RECORD DATEPLANNED
PAYMENT DATE
1st quarter February 18 February 20 March 6
2nd quarter May 19 May 21 June 5
3rd quarter1) August 18 August 20 September 4
4th quarter1) November 17 November 19 December 4
1) If declared by the Board of Directors.
2014 FINANCIAL CALENDAR
DATE EVENT
April 25, 2014 Q1 Report
May 6, 2014 Shareholder AGM
July 18, 2014 Q2 Report
October 23, 2014 Q3 Report
Autoliv’s head office is located on the 7th floor in the Vasahuset building, Vasagatan 11 Stockholm, Sweden.

89
Selected Financial Data(DOLLARS IN MILLIONS, EXCEPT PER SHARE DATA) 20131,6) 20121) 20111) 20101) 20091)
Sales and IncomeNet sales $8,803 $8,267 $8,232 $7,171 $5,121Operating income 761 705 889 869 69Income before income taxes 734 669 828 806 6Net income attributable to controlling interest 486 483 623 591 10
Financial PositionCurrent assets excluding cash 2,582 2,312 2,261 2,101 1,707Property, plant and equipment, net 1,336 1,233 1,121 1,026 1,042Intangible assets (primarily goodwill) 1,687 1,707 1,716 1,722 1,729Non-interest bearing liabilities 2,364 2,162 2,102 2,001 1,610Capital employed2) 3,489 3,415 3,257 3,066 3,098Net (cash) debt (511) (361) (92) 127 662Total equity2) 4,000 3,776 3,349 2,939 2,436Total assets 6,983 6,570 6,117 5,665 5,186Long-term debt 279 563 364 638 821
Share dataEarnings per share (US$) – basic 5.09 5.17 6.99 6.77 0.12Earnings per share (US$) – assuming dilution 5.07 5.08 6.65 6.39 0.12Total parent shareholders’ equity per share (US$)2) 42.17 39.36 37.33 32.89 28.06Cash dividends paid per share (US$) 2.00 1.89 1.73 0.65 0.21Cash dividends declared per share (US$) 2.02 1.94 1.78 1.05 –Share repurchases 148 – – – –Number of shares outstanding (million)3) 94.4 95.5 89.3 89.0 85.1
RatiosGross margin (%) 19.4 19.9 21.0 22.2 16.6Operating margin (%) 8.6 8.5 10.8 12.1 1.3Pretax margin (%) 8.3 8.1 10.1 11.2 0.1Return on capital employed (%)2) 22 21 28 28 2Return on total equity (%)2) 13 14 20 22 1Total equity ratio (%)2) 57 57 55 52 47Net debt to capitalization (%) n/a n/a n/a 4 21Days receivables outstanding 70 66 67 69 75Days inventory outstanding 31 30 32 32 40
Other dataAirbag sales4) 5,686 5,392 5,393 4,723 3,250Seatbelt sales5) 2,773 2,657 2,679 2,363 1,822Active Safety sales 345 218 160 85 49Net cash provided by operating activities 838 689 758 924 493Capital expenditures, net 379 360 357 224 130Net cash used in investing activities (377) (358) (373) (297) (157)Net cash provided by (used in) financing activities (318) (91) (223) (529) (376)Number of employees, December 31 46,900 41,700 38,500 34,600 30,200
1) Costs in 2013, 2012, 2011, 2010 and 2009 for capacity alignments and antitrust investigations reduced operating income by (millions) $47, $98, $19, $21 and $133 and net income by (millions) $33, $71, $14, $16 and $96. This corresponds to 0.6%, 1.2%, 0.2%, 0.3% and 2.6% on operating margins and 0.4%, 0.9%, 0.2%, 0.2% and 1.9% on net margins. The impact on EPS was $0.34, $0.74, $0.15, $0.17 and $1.14 while return on total equity was reduced by 0.8%, 1.8%, 0.4%, 0.6% and 4.1% for the same five year period. 2) Adjusted in accordance with FASB ASC 810, adopted on January 1, 2009. 3) At year end, net of treasury shares. 4) Incl. passive electronics, steering wheels, inflators and initiators. 5) Incl. seat components until a June 2012 divestiture. 6) Includes adjustments for a non-cash, non-recurring valuation allowance for deferred tax assets of $39 million on net income and capital employed, and $0.41 on EPS and total parent shareholder equity per share.

EVERY YEAR, AUTOLIV’S PRODUCTS SAVE OVER 30,000 LIVES
Related Documents