Saudi Digitalization

Welcome message from author
This document is posted to help you gain knowledge. Please leave a comment to let me know what you think about it! Share it to your friends and learn new things together.
Transcript
SaudiDigitalization
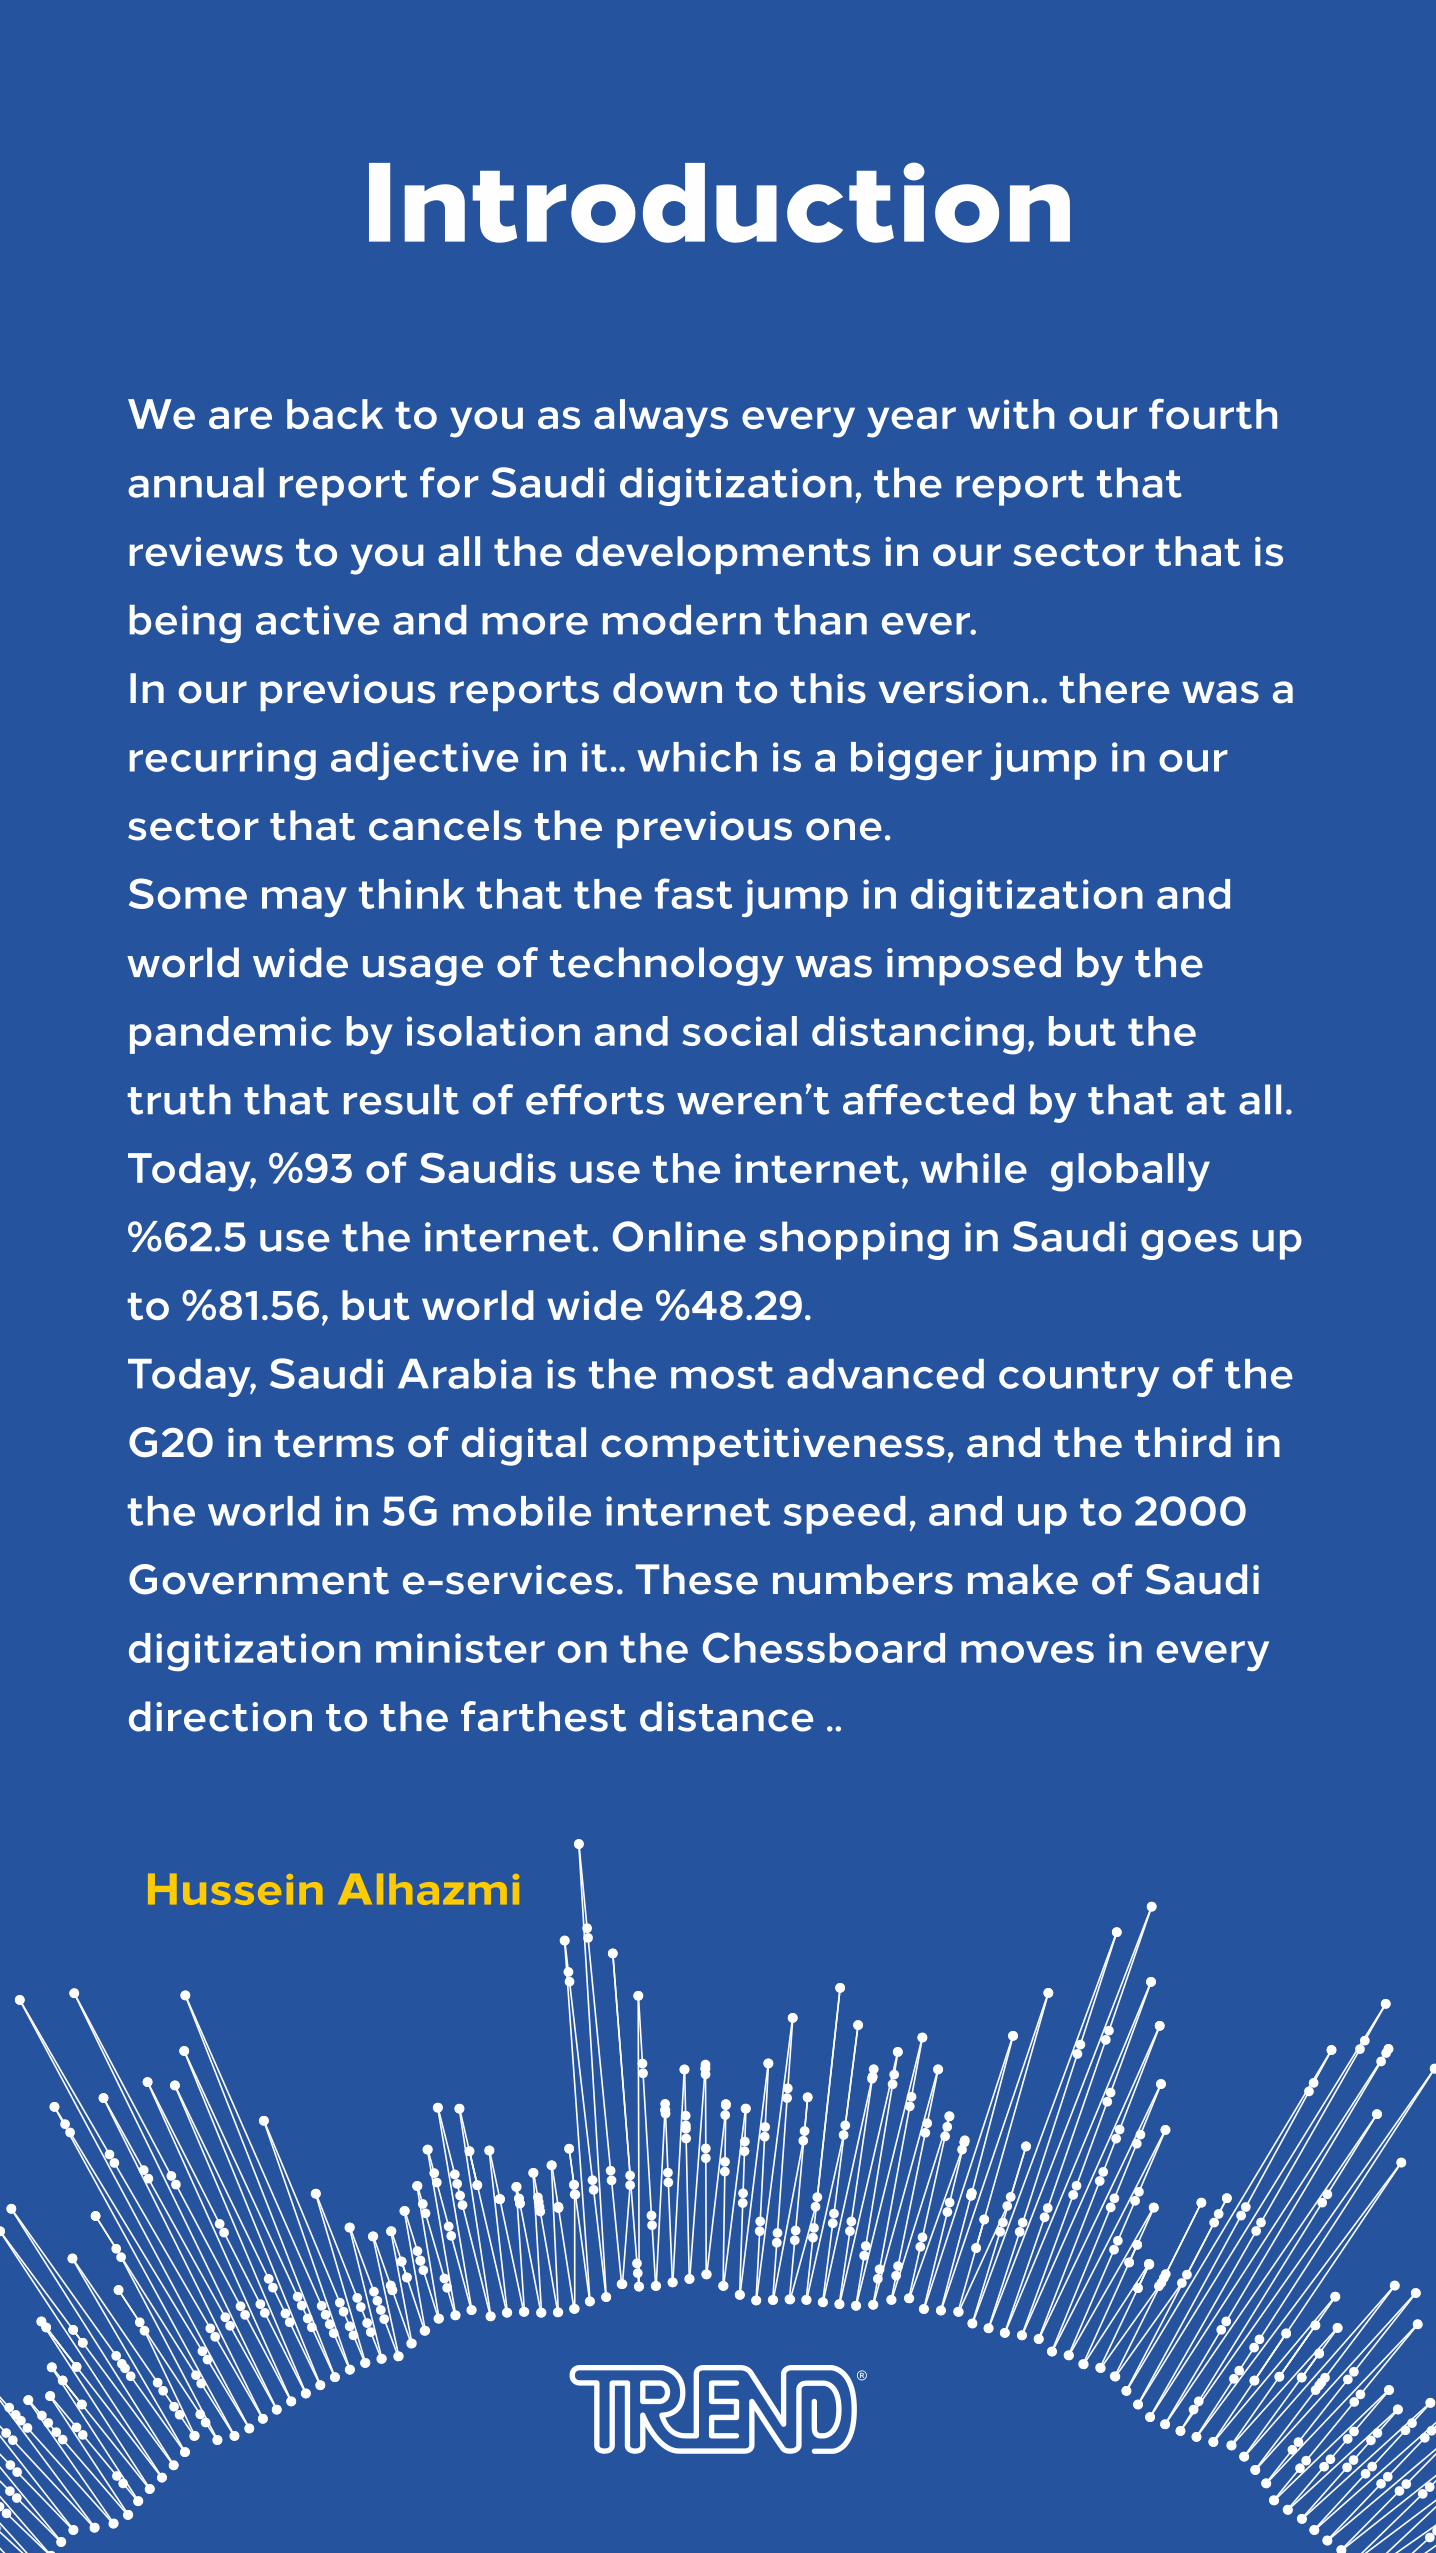
We are back to you as always every year with our fourth annual report for Saudi digitization, the report that reviews to you all the developments in our sector that is being active and more modern than ever. In our previous reports down to this version.. there was a recurring adjective in it.. which is a bigger jump in our sector that cancels the previous one. Some may think that the fast jump in digitization and world wide usage of technology was imposed by the pandemic by isolation and social distancing, but the truth that result of e�orts weren’t a�ected by that at all. Today, %93 of Saudis use the internet, while globally %62.5 use the internet. Online shopping in Saudi goes up to %81.56, but world wide %48.29. Today, Saudi Arabia is the most advanced country of the G20 in terms of digital competitiveness, and the third in the world in 5G mobile internet speed, and up to 2000 Government e-services. These numbers make of Saudi digitization minister on the Chessboard moves in every direction to the farthest distance ..
Introduction
فريق العمل
Hussein Alhazmi
Contents
Digitization in Saudi Arabia
Payments and e-commerce
Video Games
Digitization Globally
Digital content globally
6
Internet usage
15
Saudi Arabia in numbers
3
28
33
38
47
Saudi Arabiain numbers
4
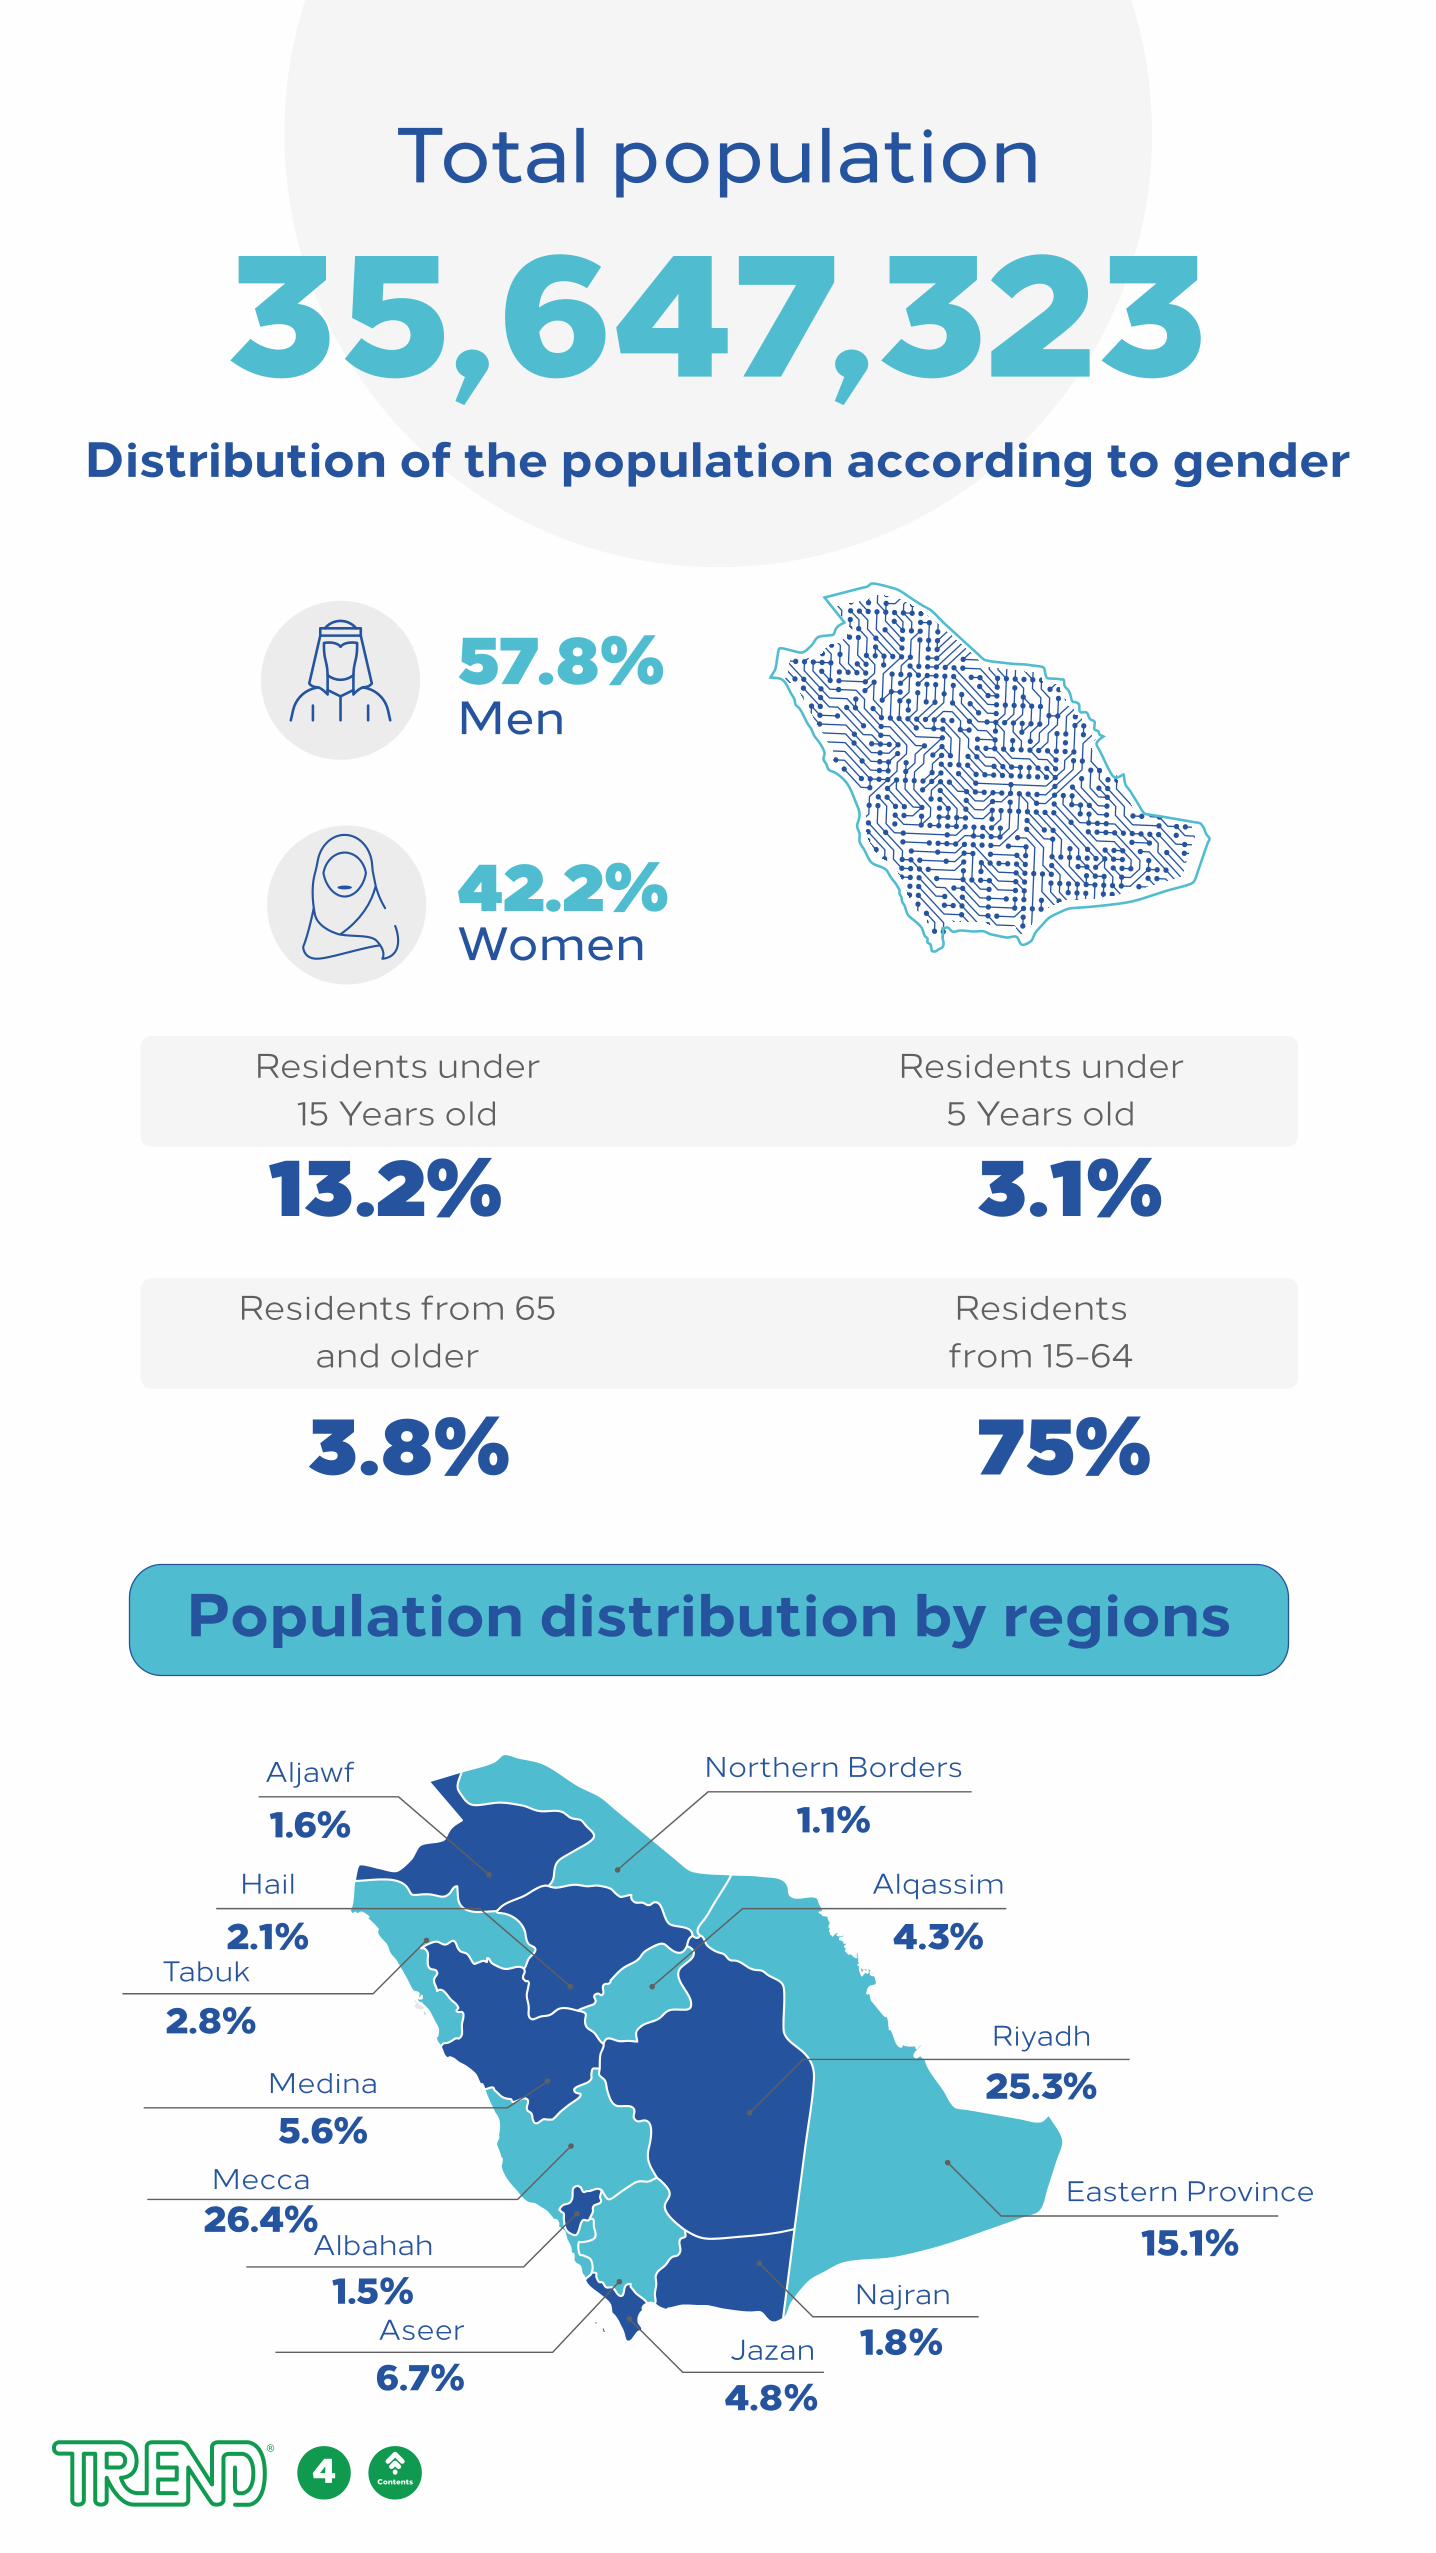
35,647,323Total population
57.8%Men
42.2%Women
Distribution of the population according to gender
Residents under 5 Years old
Residents under 15 Years old
3.1%13.2% Residents from 15-64
Residents from 65and older
75%3.8%
Population distribution by regions
Mecca26.4%
Medina
5.6%
Alqassim
4.3%
Northern Borders
1.1%Hail
2.1%Tabuk
2.8%
Aljawf
1.6%
Aseer
6.7%
Albahah1.5%
Jazan
4.8%
Najran
1.8%
Riyadh
25.3%
Eastern Province
15.1%
Contents
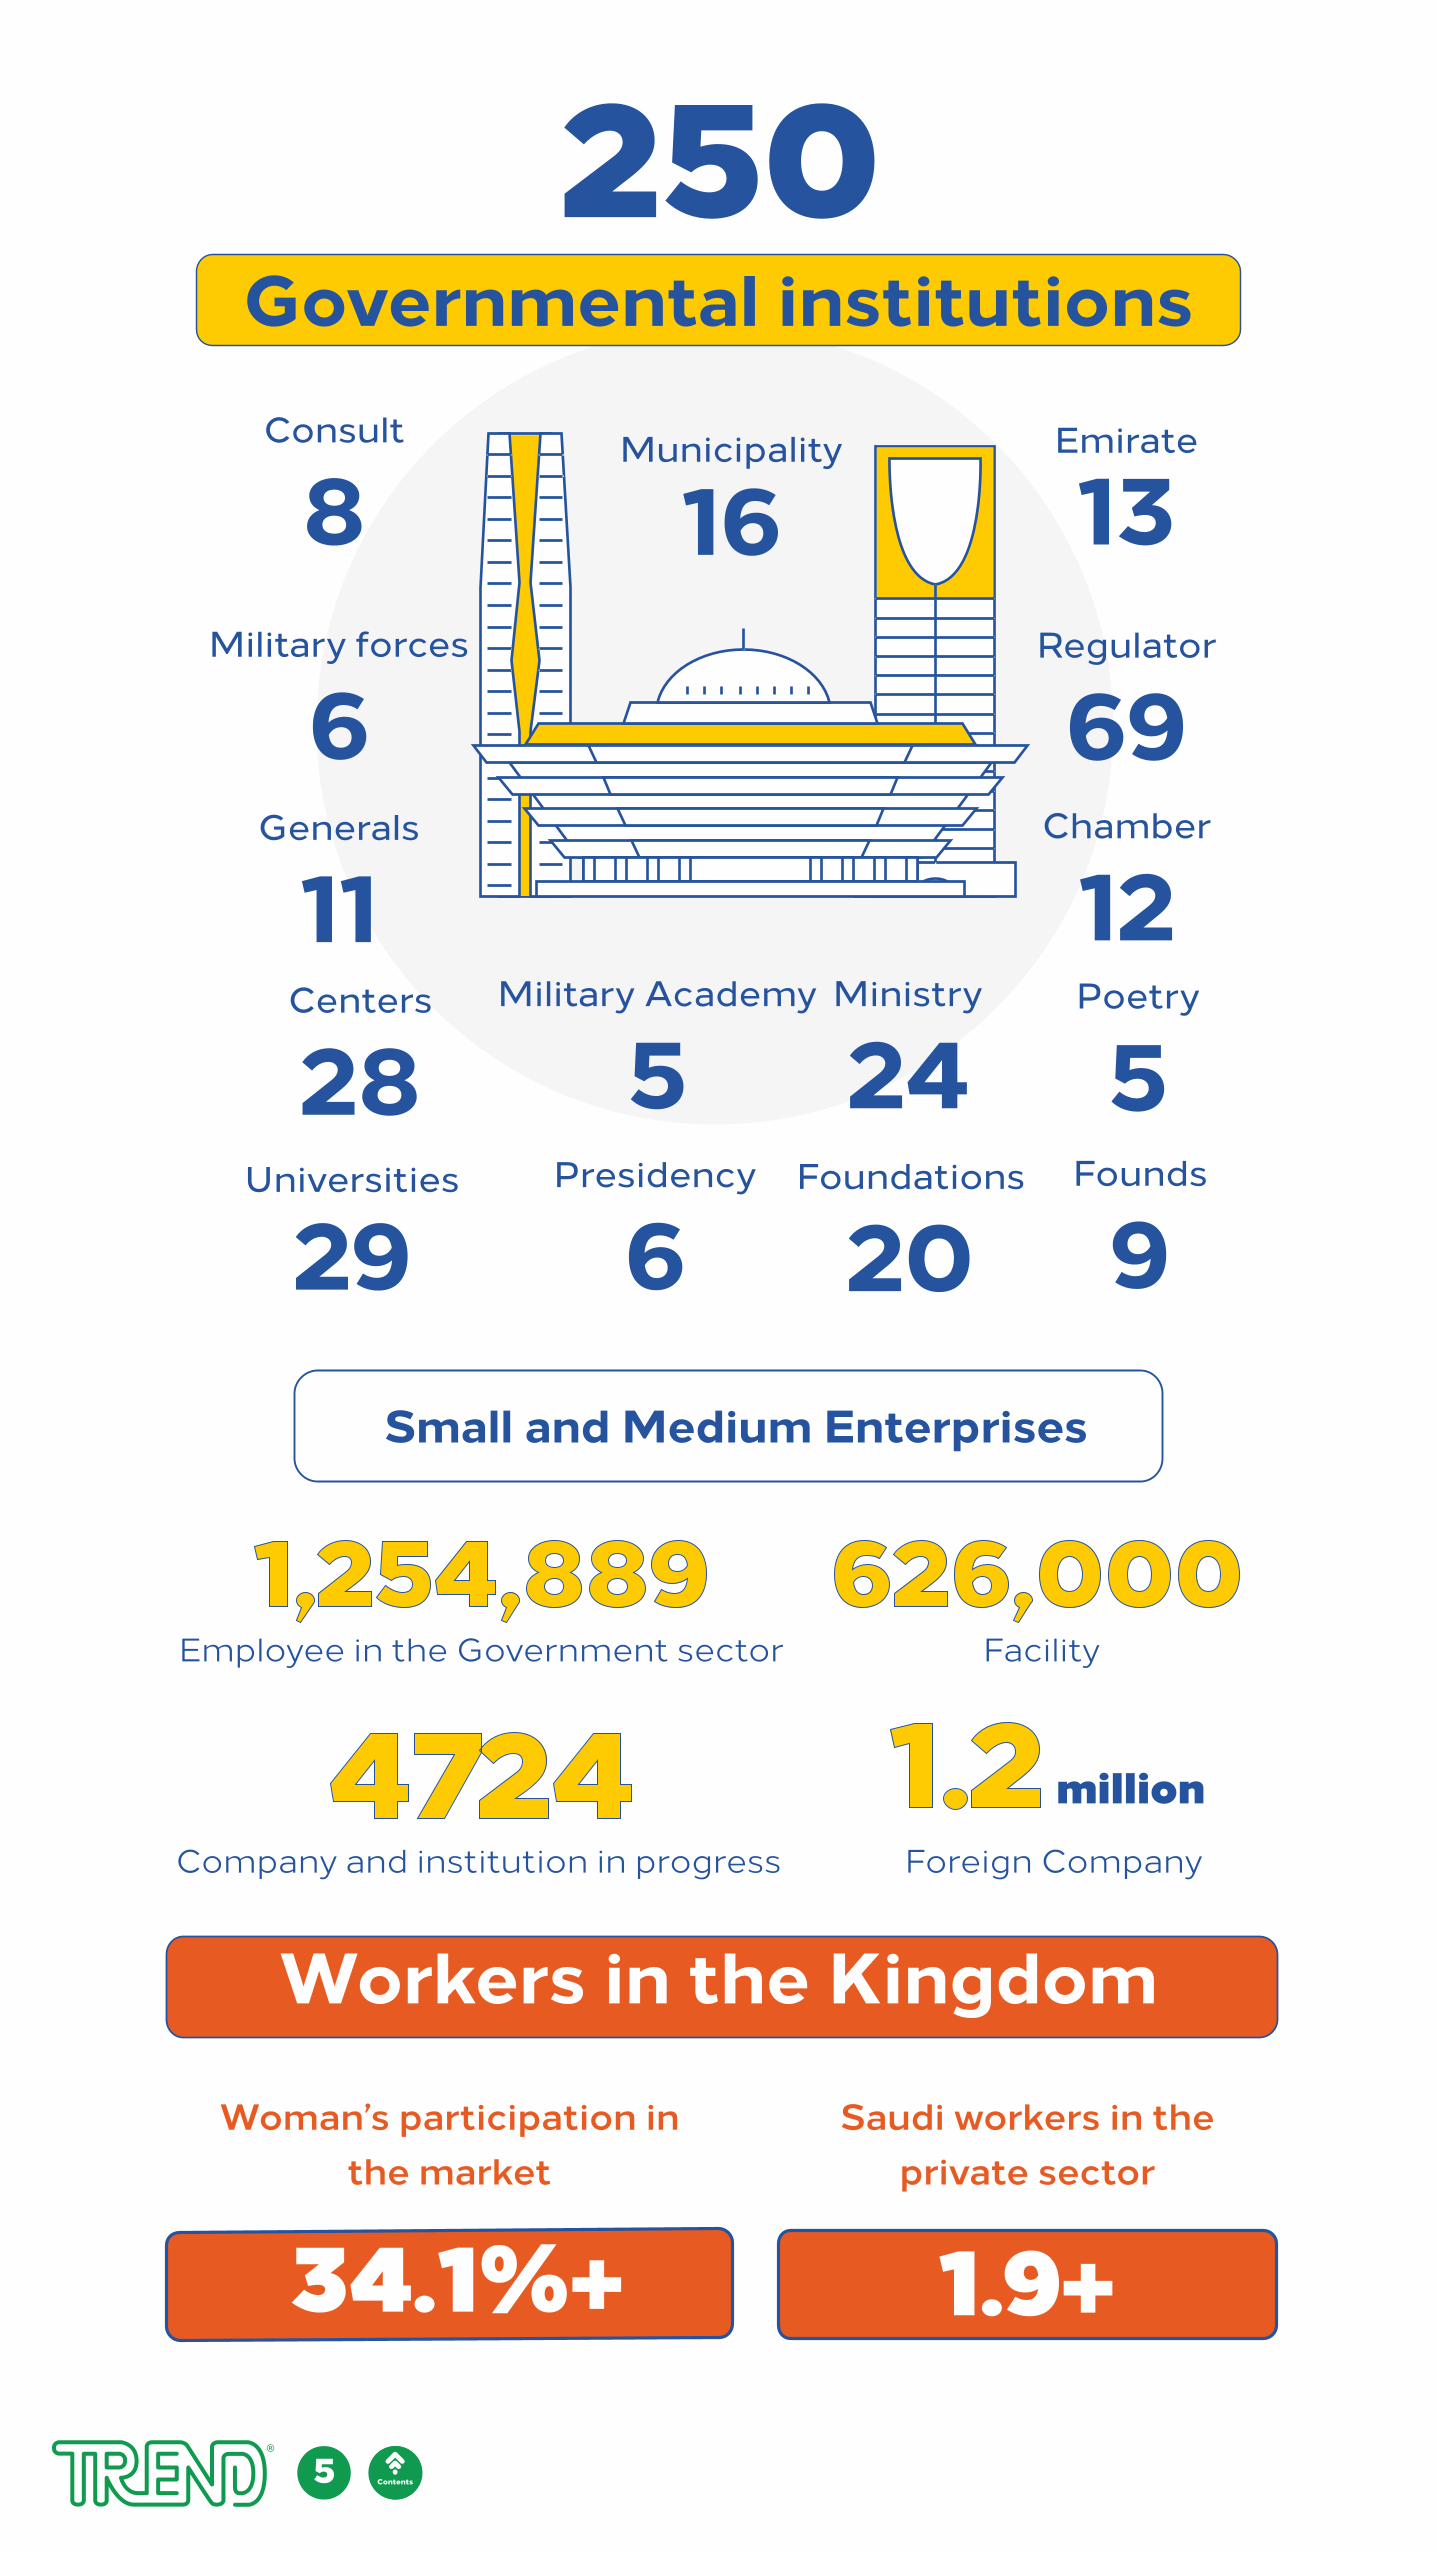
Small and Medium Enterprises
FacilityEmployee in the Government sector
Governmental institutions
Workers in the Kingdom
250Emirate
13Municipality
16
Universities
29
Poetry
5Presidency
6Founds
9
Military forces
6
Military Academy
5
Chamber
12
Consult
8
Generals
11
Foundations
20
Regulator
69
Ministry
24Centers
28
626,0001,254,889
Foreign Company
millionCompany and institution in progress
4724
Saudi workers in theprivate sector
Woman’s participation inthe market
1.9+34.1%+
5 المحتويات
1.2
Contents
Digitization inSaudi Arabia
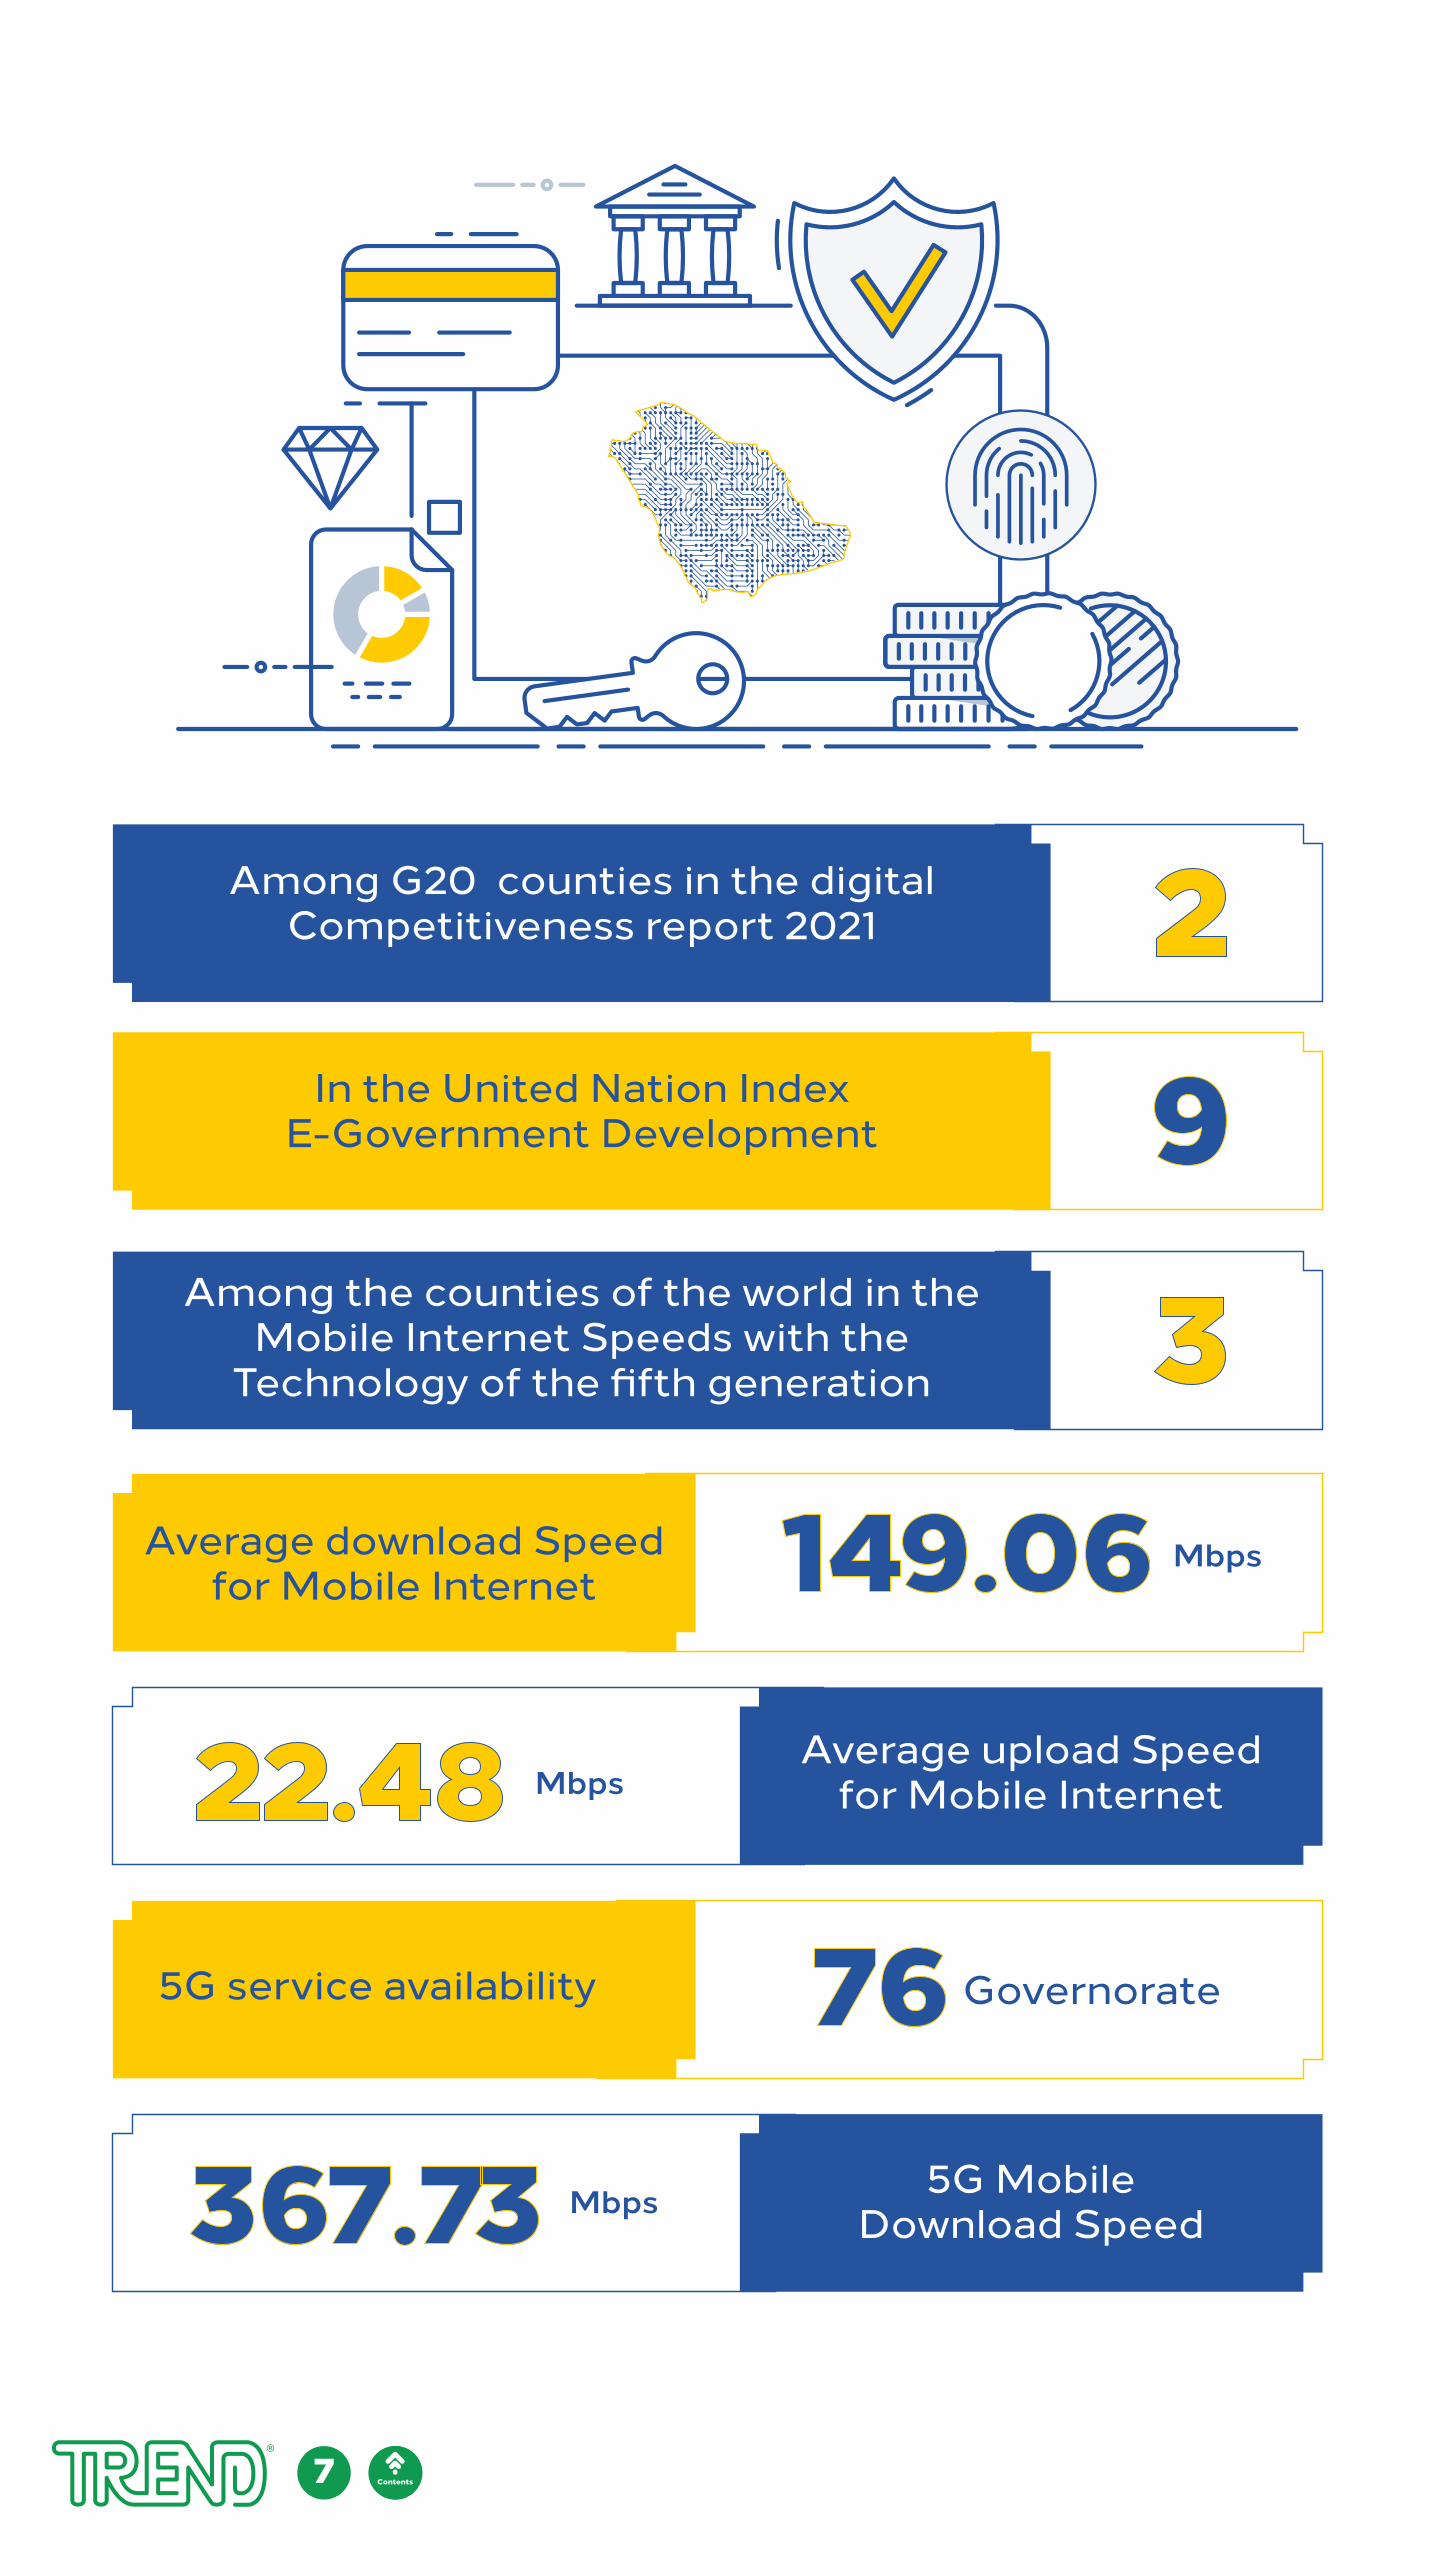
بين دول مجموعة العشرين لتسجيل Among G20 counties in the digital التقدم في الشرق األوسط
Competitiveness report 2021
5G MobileDownload Speed
Governorate
367.73
Average upload Speedfor Mobile Internet 22.48
Average download Speedfor Mobile Internet 149.06
5G service availability 76
7 المحتويات
2
3
In the United Nation IndexE-Government Development 9
Among the counties of the world in the Mobile Internet Speeds with the
Technology of the fifth generation
Mbps
Mbps
Mbps
Contents
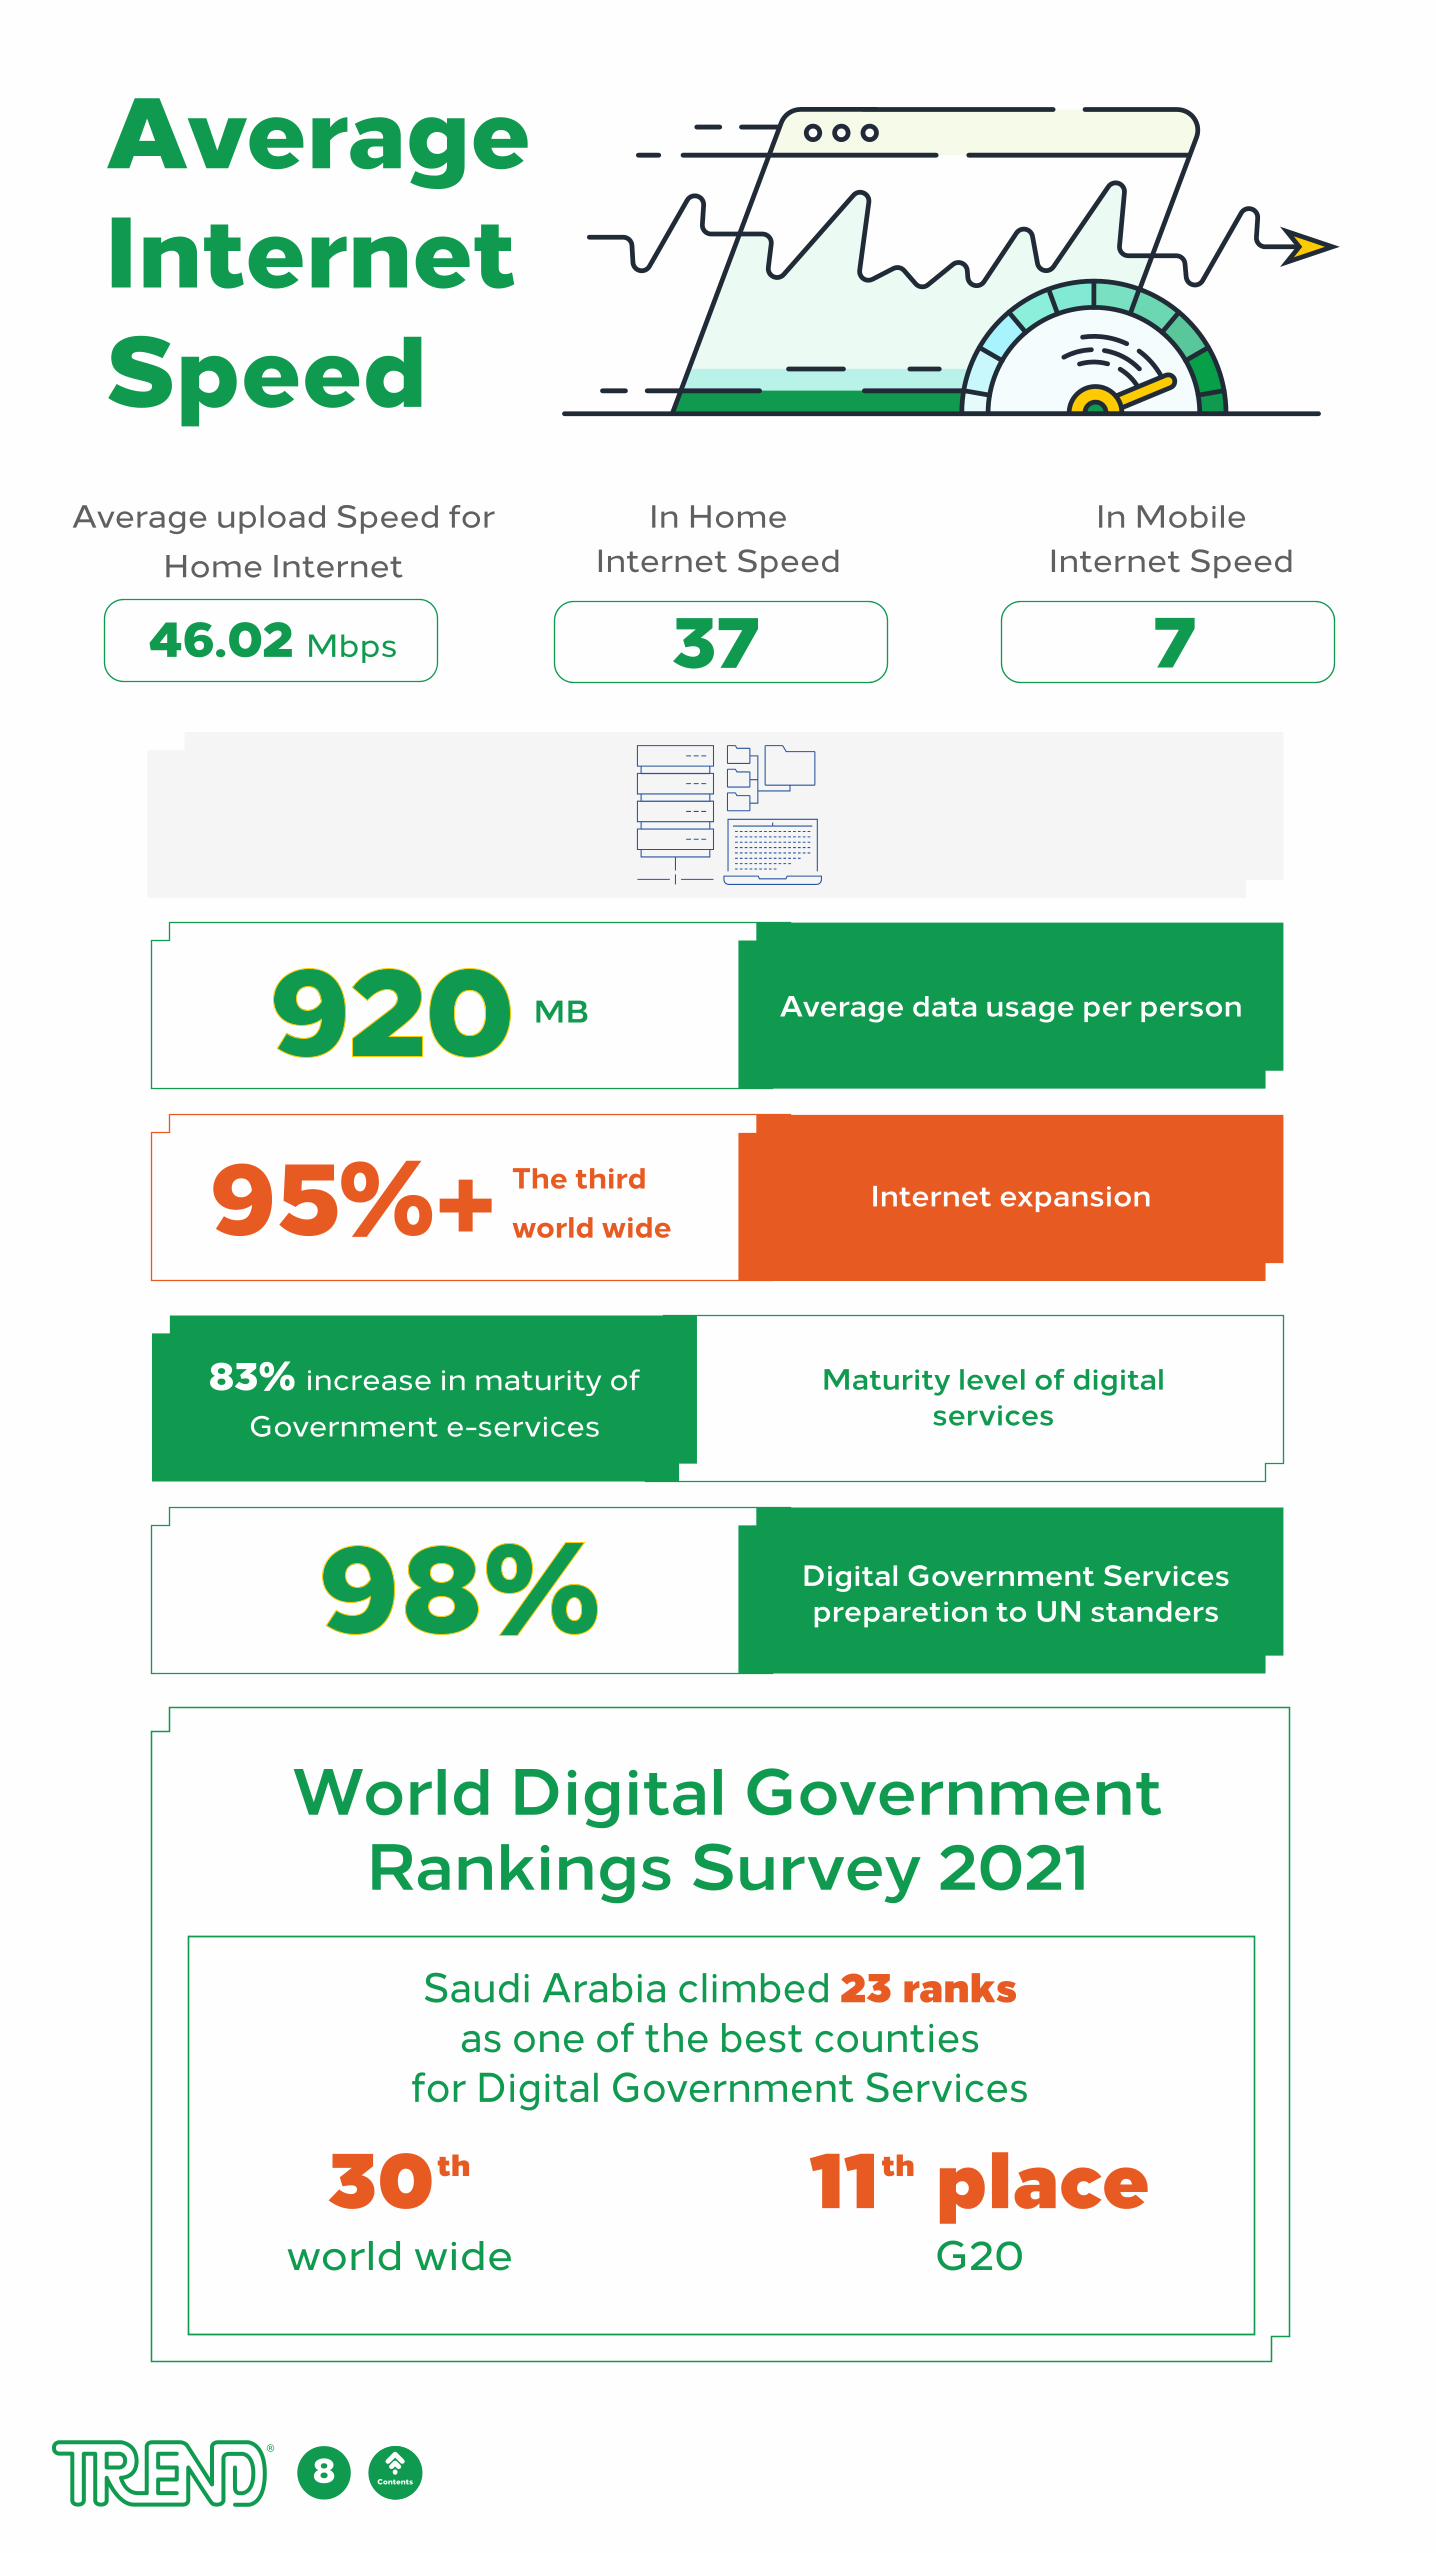
AverageInternetSpeed
Average data usage per person 920Internet expansionThe third
world wide
Digital Government Servicespreparetion to UN standers98%
Maturity level of digitalservices
83% increase in maturity of Government e-services
World Digital GovernmentRankings Survey 2021
73746.02 Mbps
Saudi Arabia climbed 23 ranksas one of the best counties
for Digital Government Services
8 المحتويات
MB
95%+
In MobileInternet Speed
In HomeInternet Speed
Average upload Speed forHome Internet
30 11 placethth
world wide G20
Contents
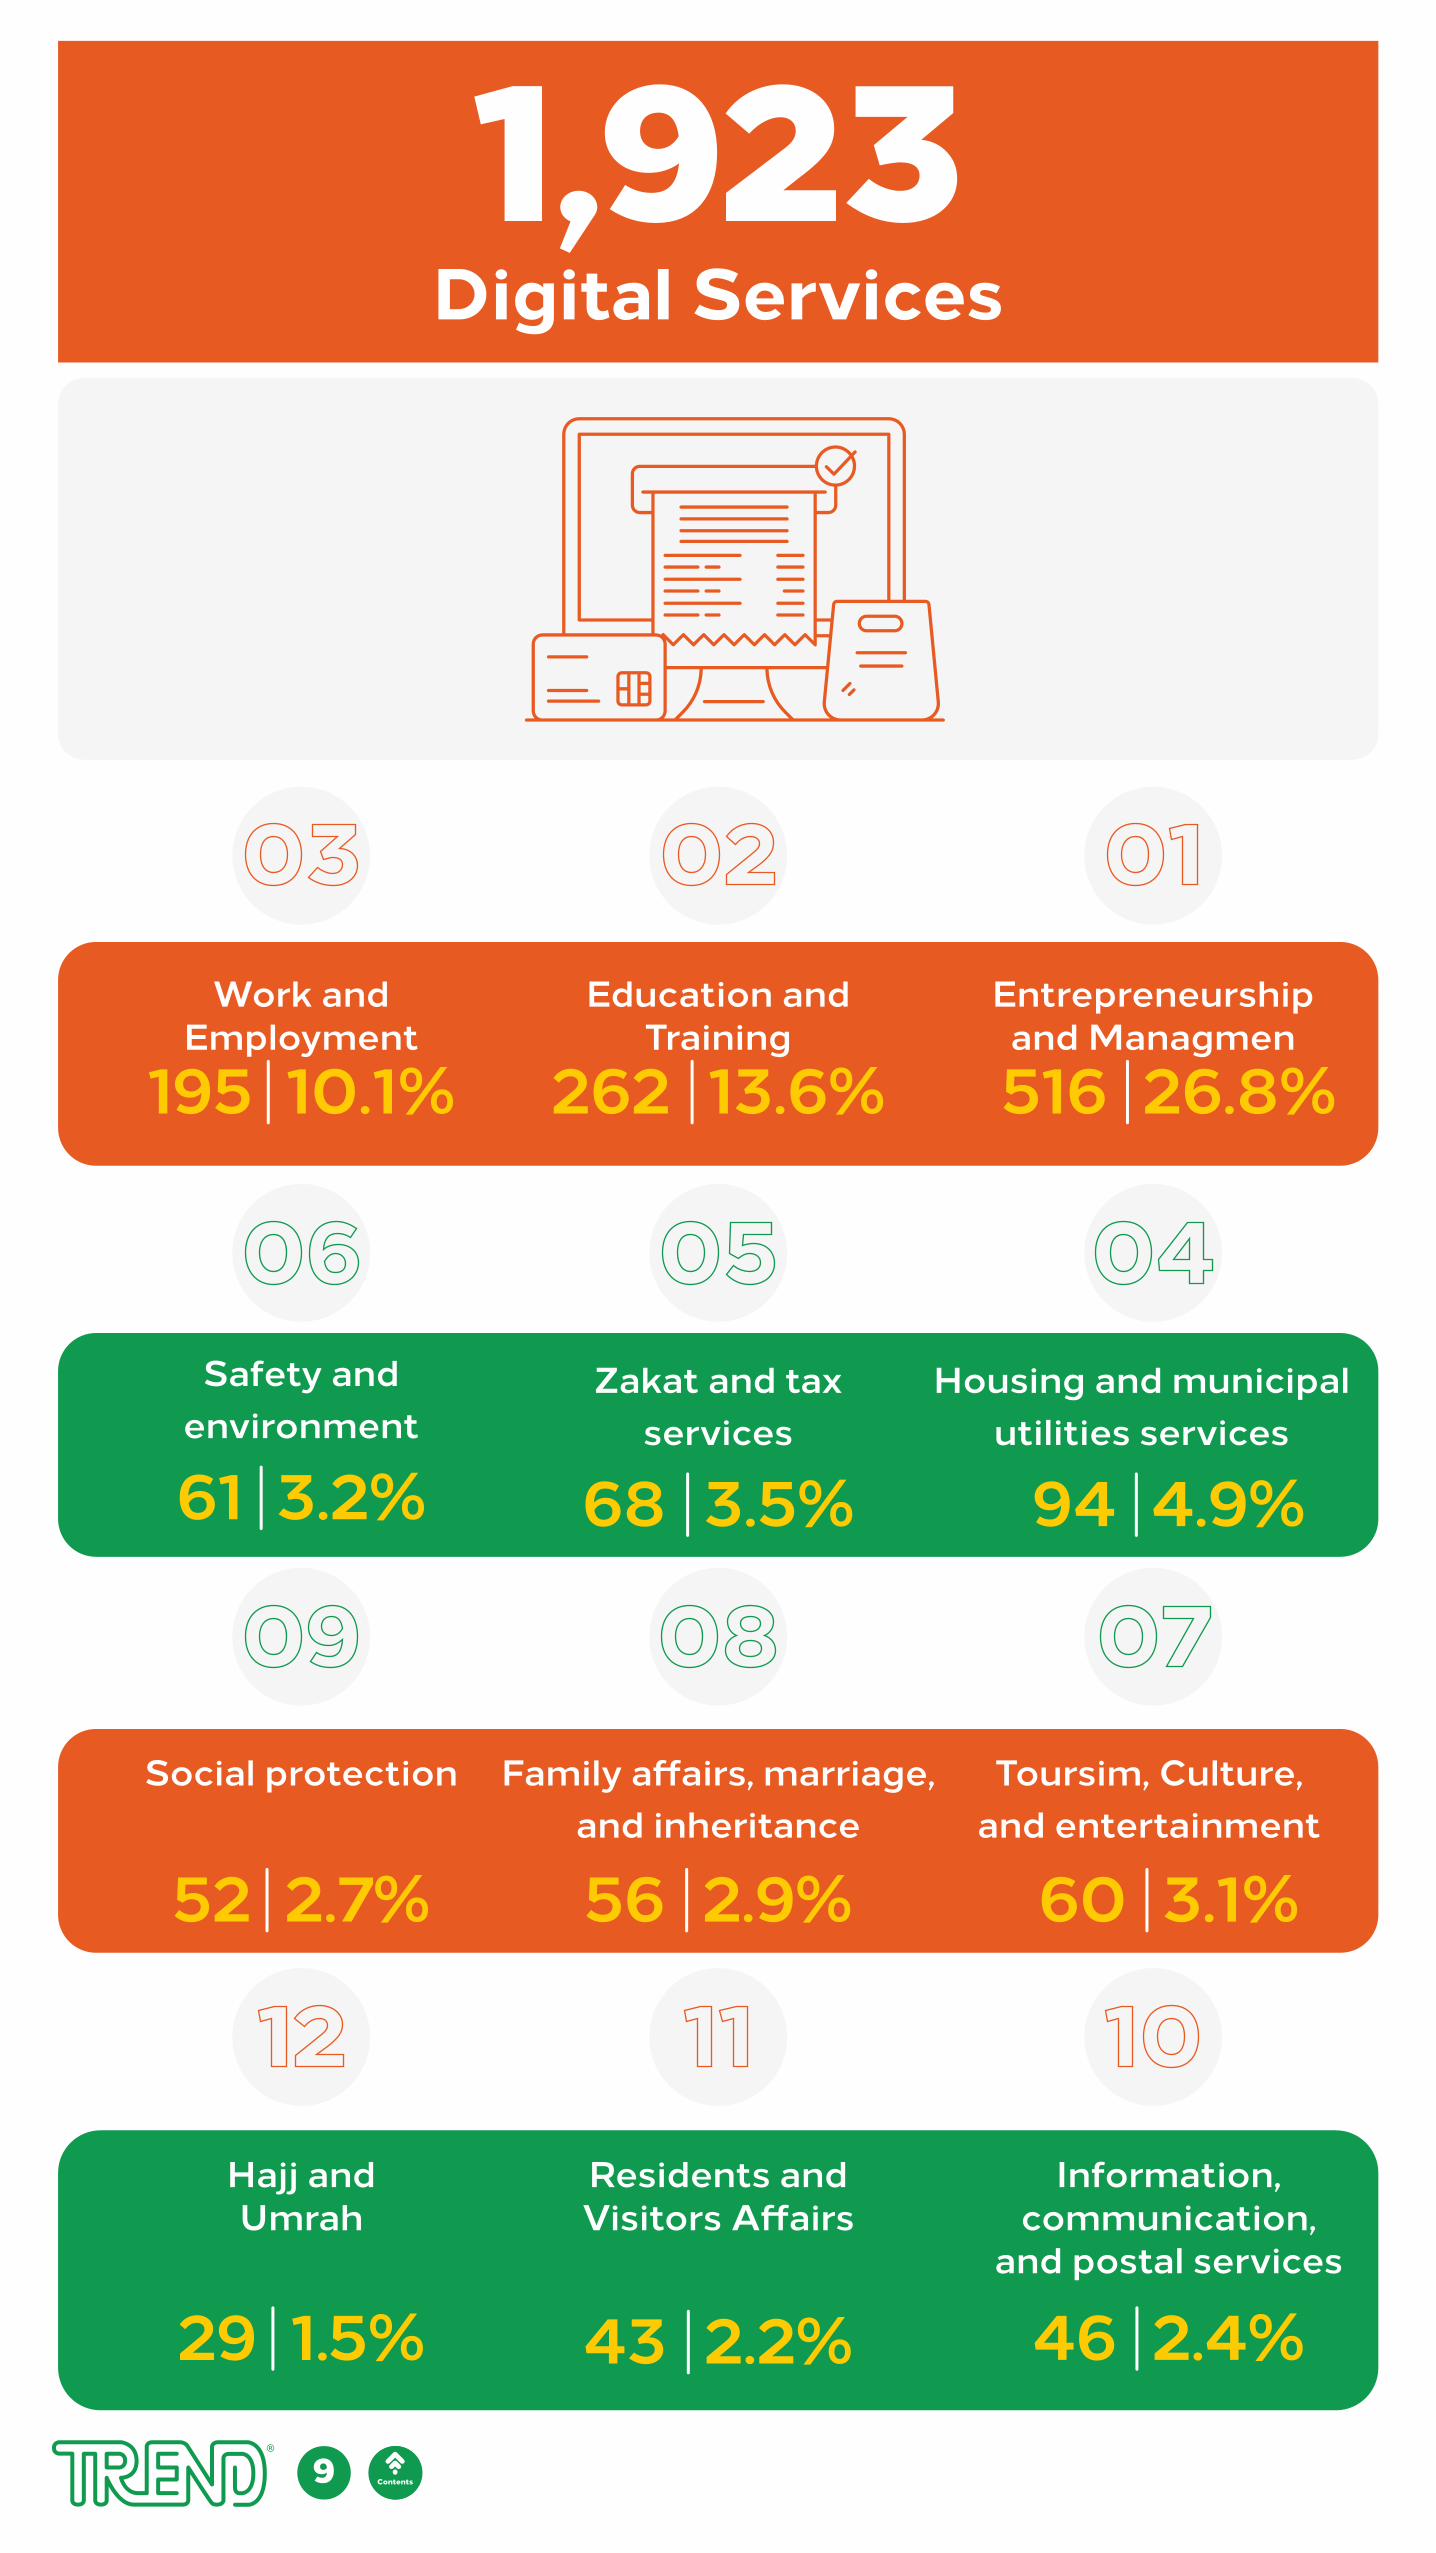
1,923Digital Services
Entrepreneurshipand Managmen
Education and Training
Work and Employment
Housing and municipalutilities services
Zakat and taxservices
Safety andenvironment
Toursim, Culture,and entertainment
Family a�airs, marriage,and inheritance
Social protection
Information, communication,
and postal services
Residents andVisitors A�airs
Hajj andUmrah
9 المحتويات
26.8%516
4.9%94
3.1%60
2.4%46
13.6%262
3.5%68
2.9%56
2.2%43
10.1%195
3.2%61
2.7%52
1.5%29
Contents
10 المحتويات
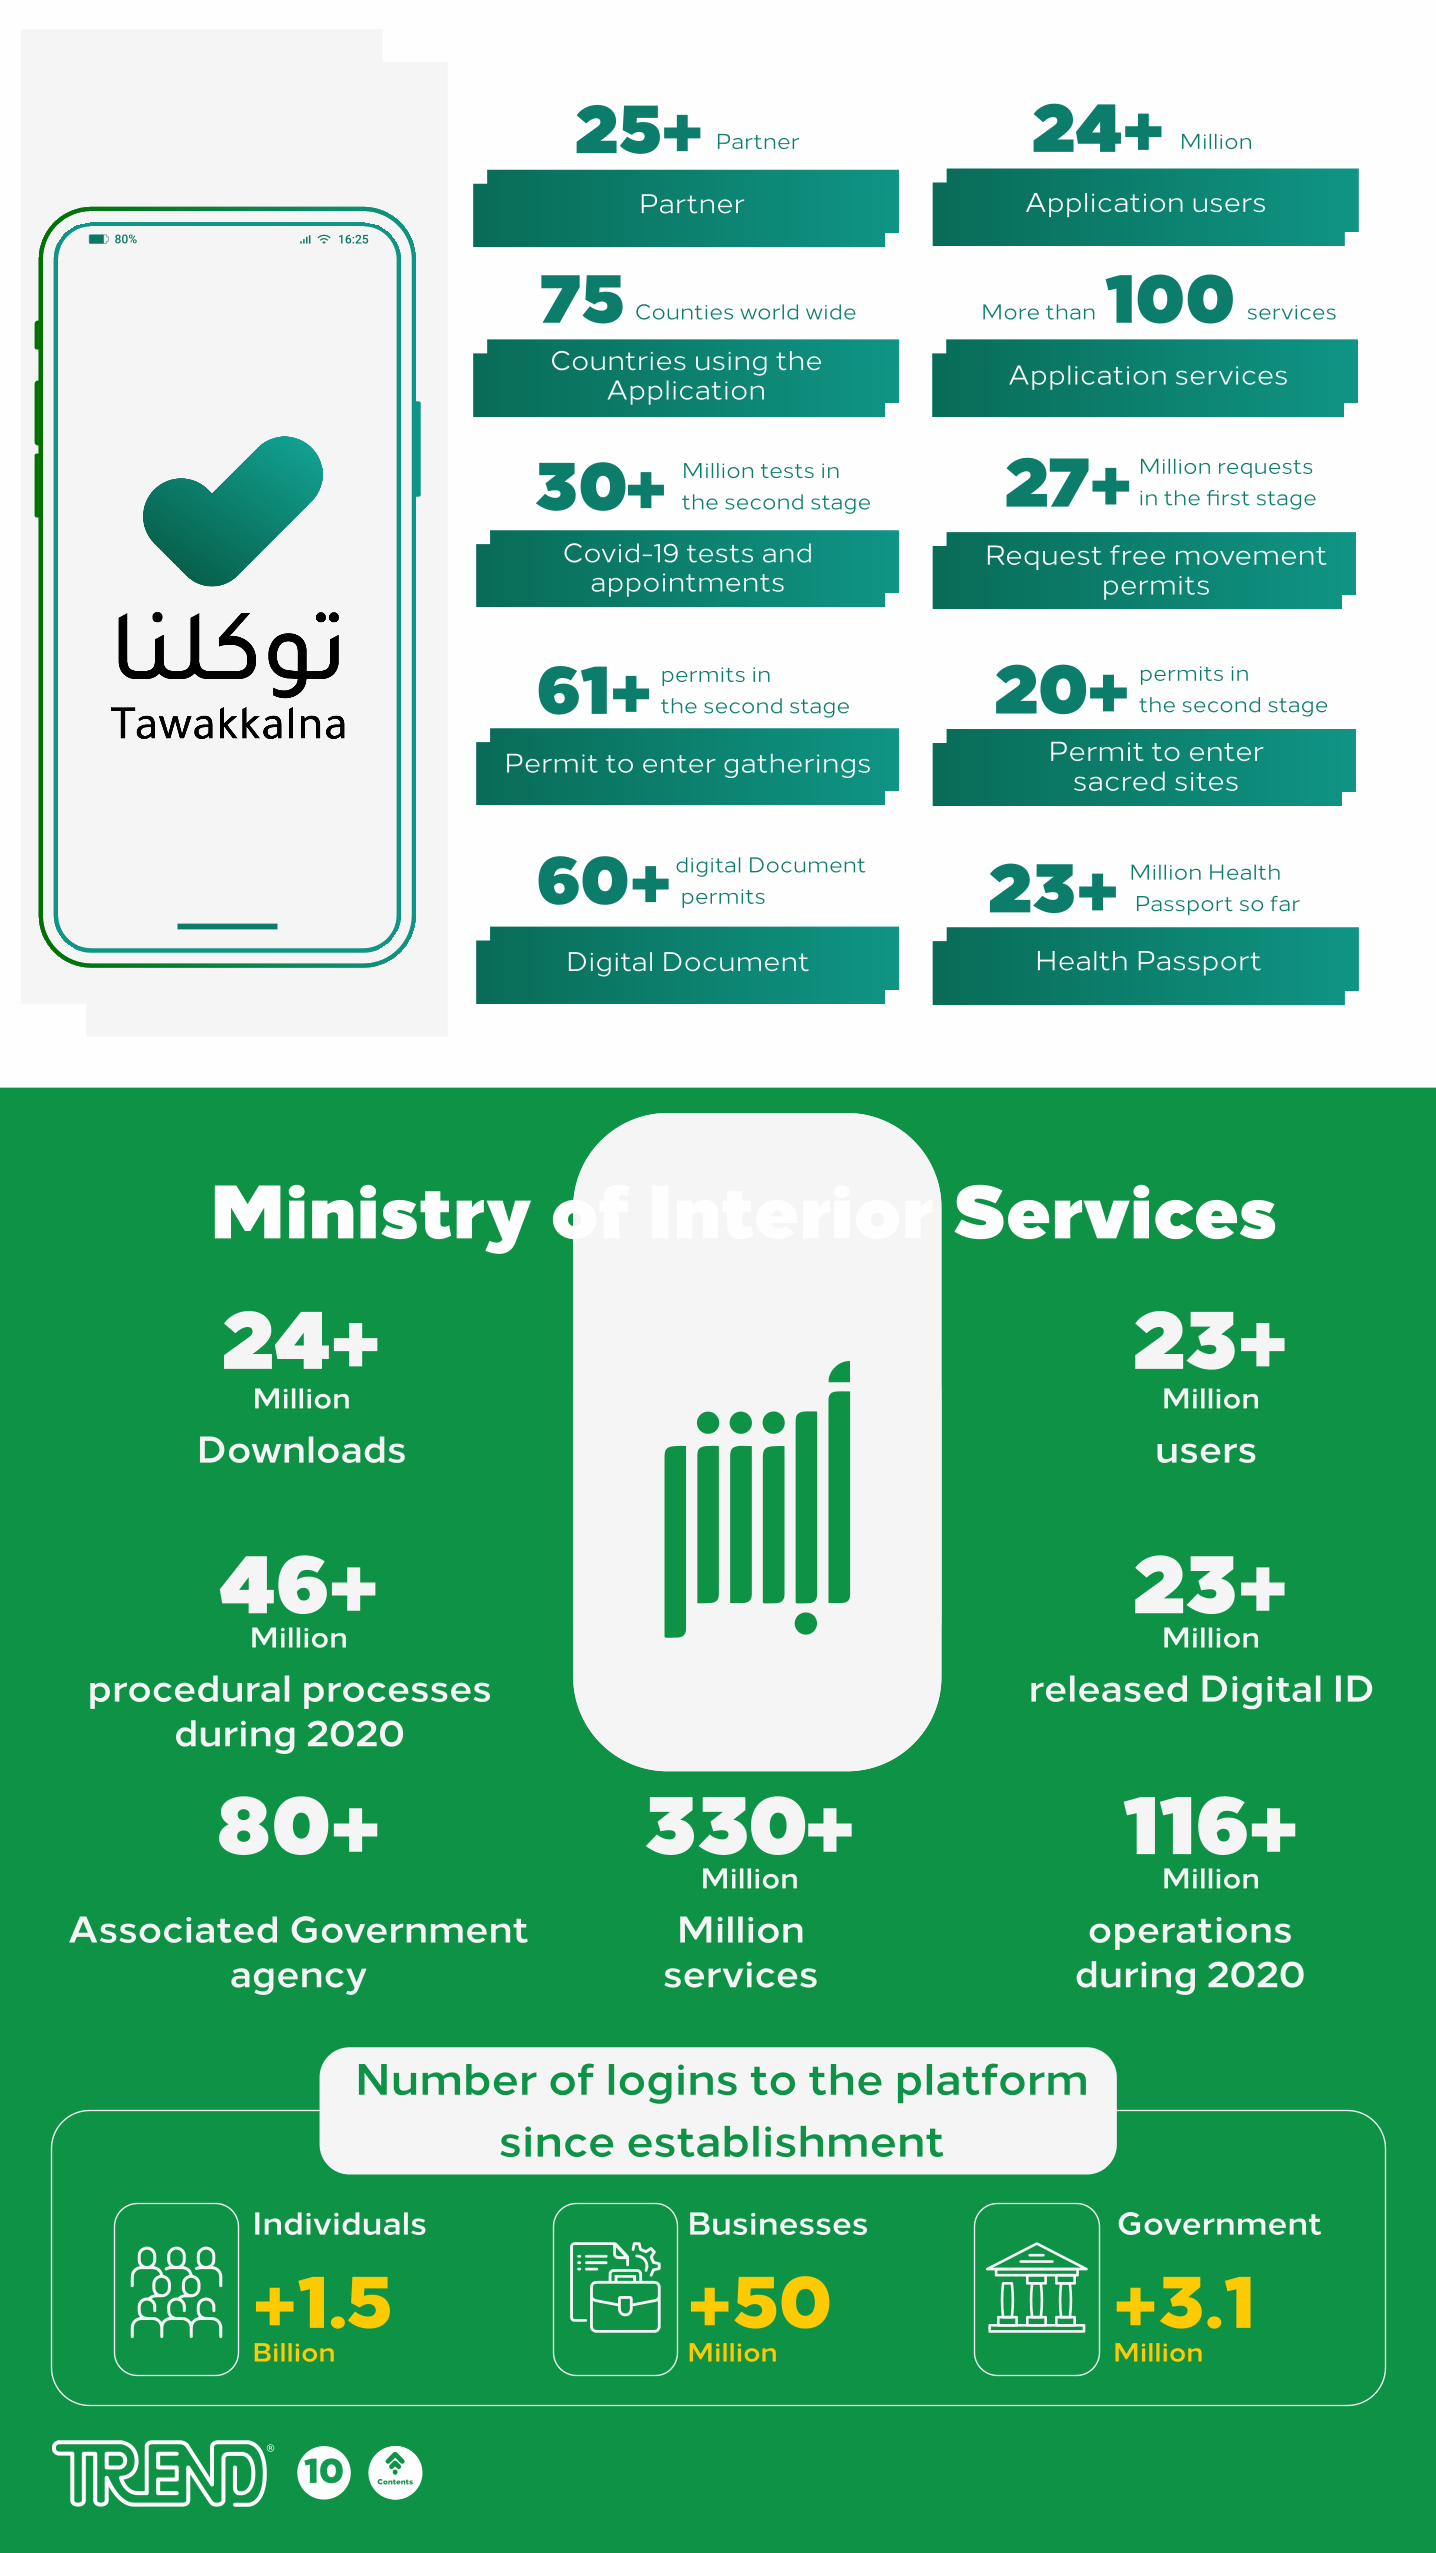
users Million
Ministry of Interior Services23+
released Digital IDMillion
23+
operationsduring 2020
Million116+
Million services
Million330+
Associated Government agency
procedural processesduring 2020
Million46+
DownloadsMillion
24+
Number of logins to the platformsince establishment
Individuals
+1.5Billion
Businesses
+50Million
Government
Million+3.1
Application users
24+
100
Health PassportDigital Document
Permit to enter sacred sitesPermit to enter gatherings
Covid-19 tests andappointments
27+ 30+
23+ 60+
20+ 61+
Partner
25+
Countries using theApplication
75
Request free movementpermits
permits inthe second stage
Million Health Passport so far
Million requestsin the first stage
Million tests inthe second stage
permits inthe second stage
digital Document permits
Partner Million
More than Counties world wide services
Application services
80+
Contents
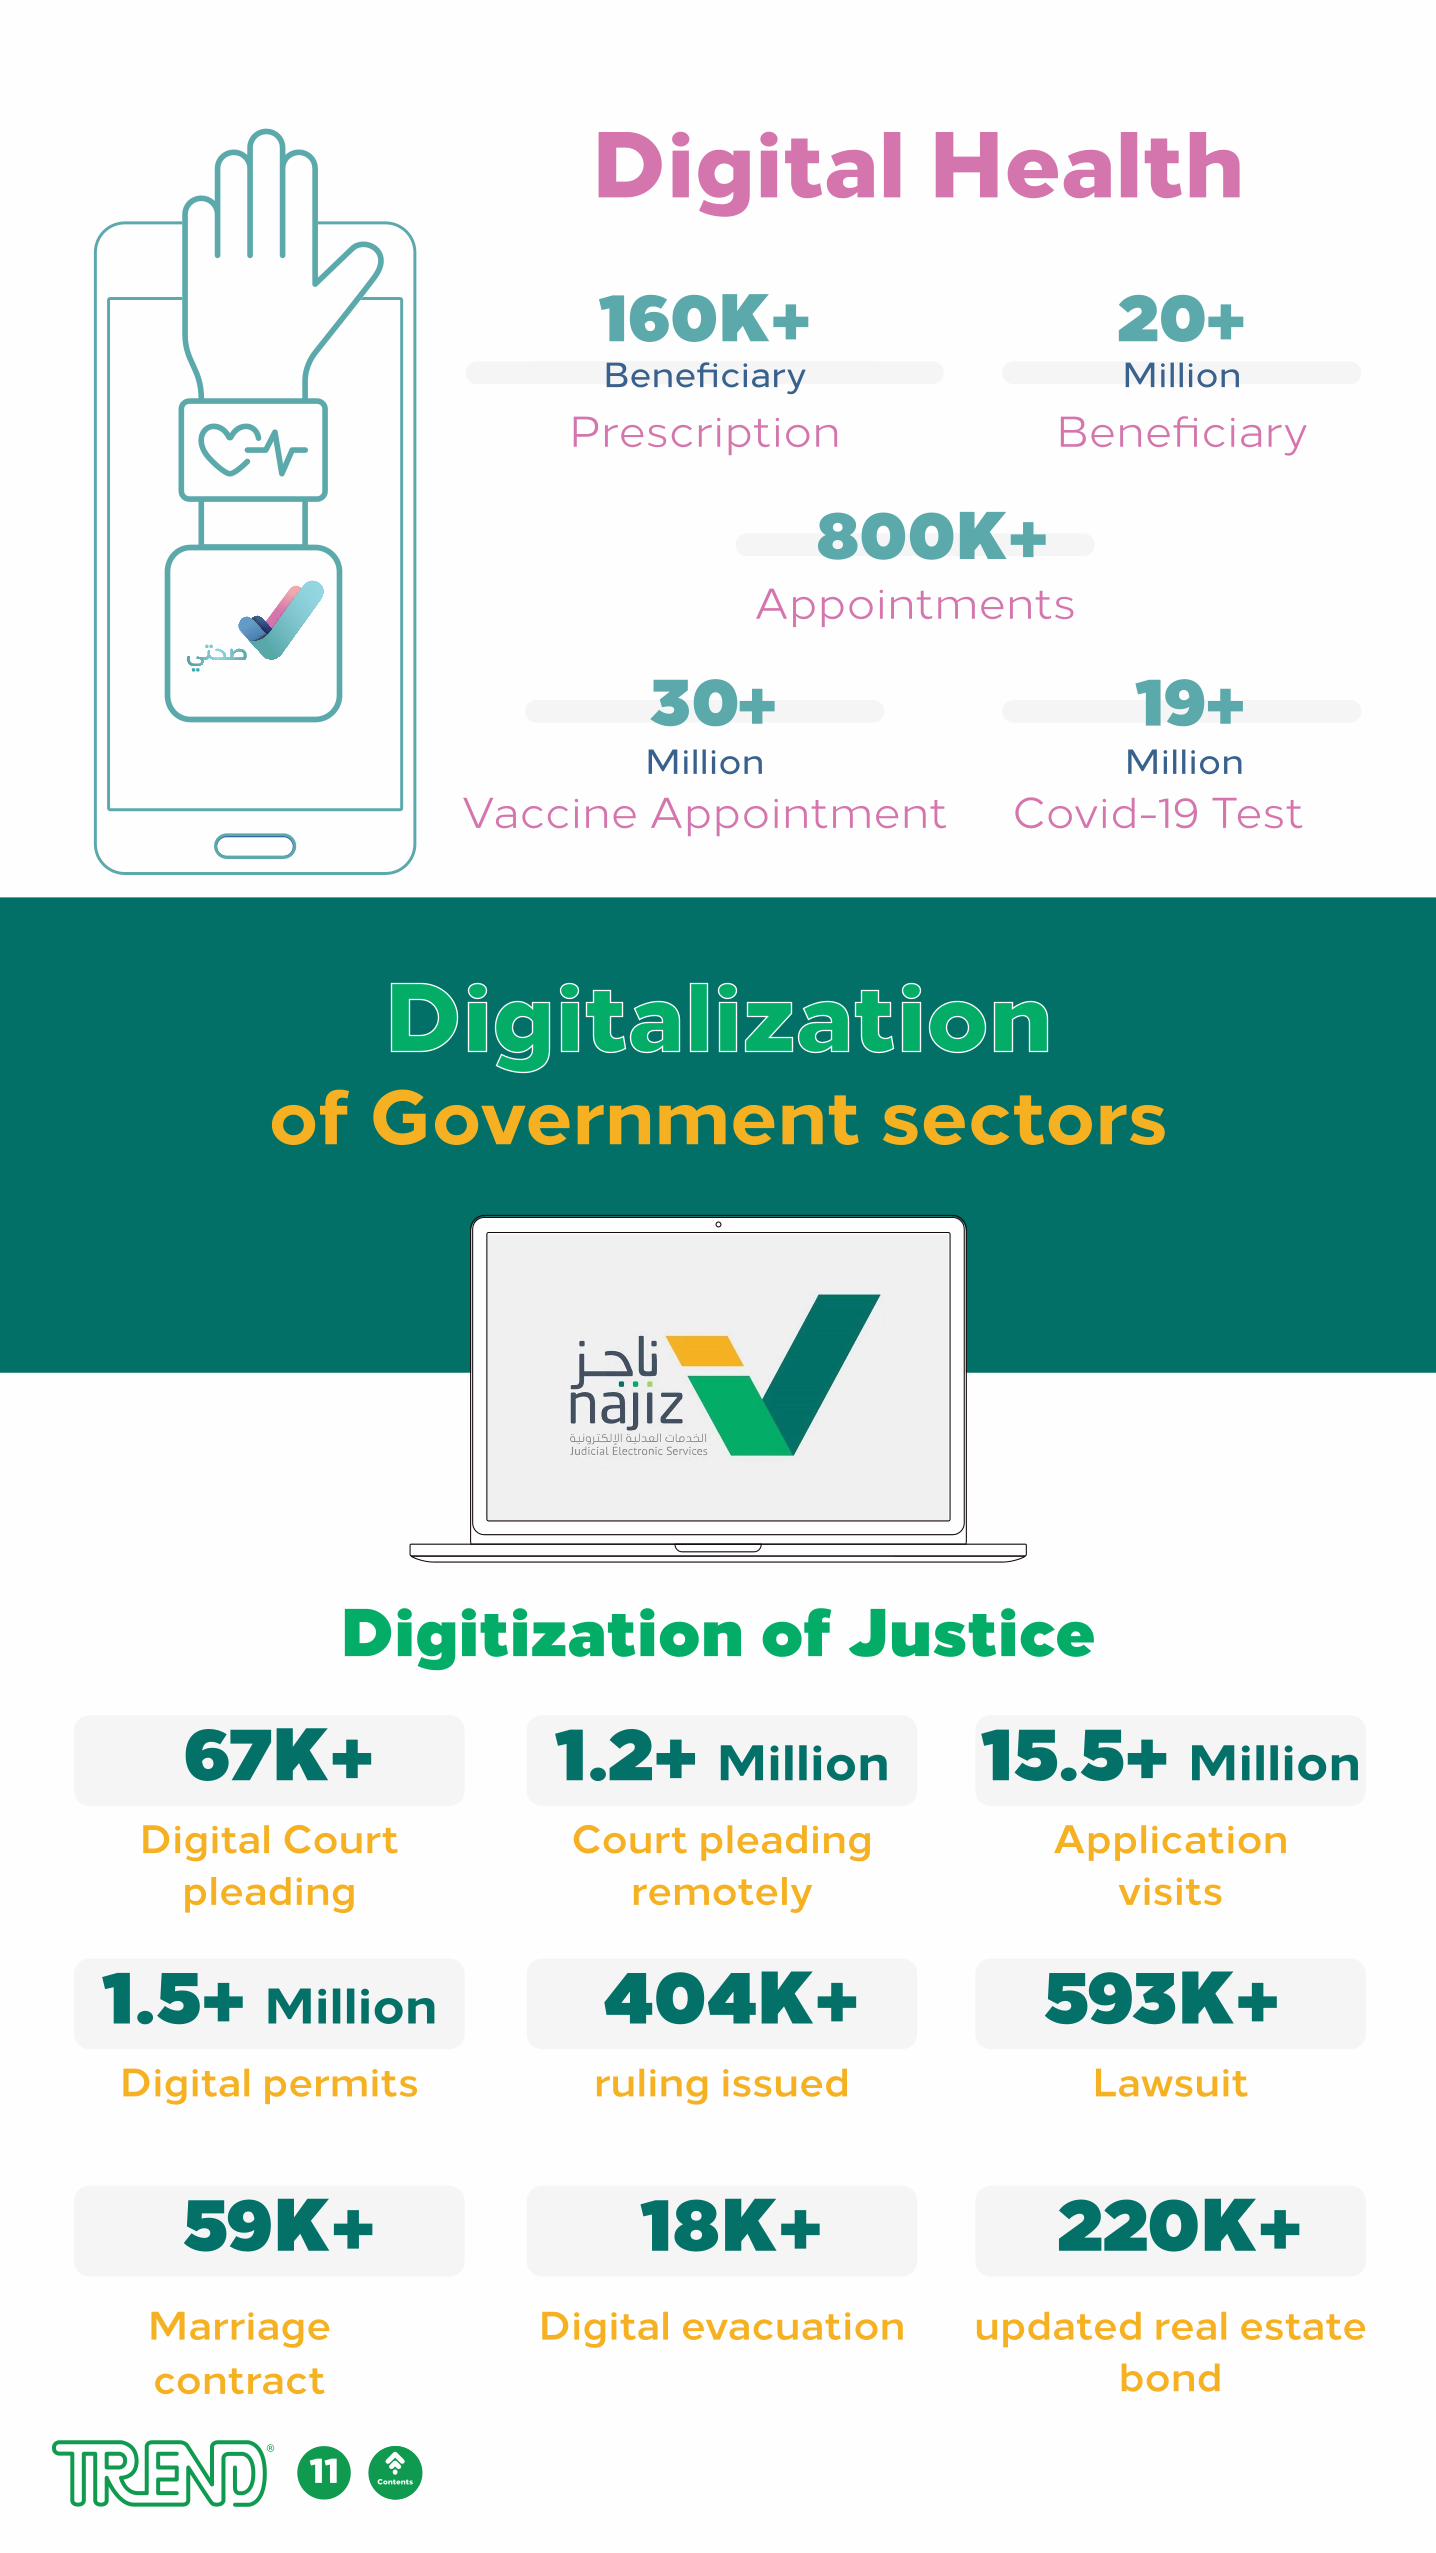
Digitization of Justice
15.5+ Million Application
visits
1.2+ Million Court pleading
remotely
67K+ Digital Court
pleading
593K+ Lawsuit
404K+ruling issued
1.5+ MillionDigital permits
220K+ updated real estate
bond
18K+ Digital evacuation
59K+ Marriage contract
Digital Health
800K+Appointments
MillionBeneficiary
BeneficiaryPrescription
19+Covid-19 Test
30+Vaccine Appointment
20+160K+
Million Million
11 المحتويات
Digitalizationof Government sectors
Contents
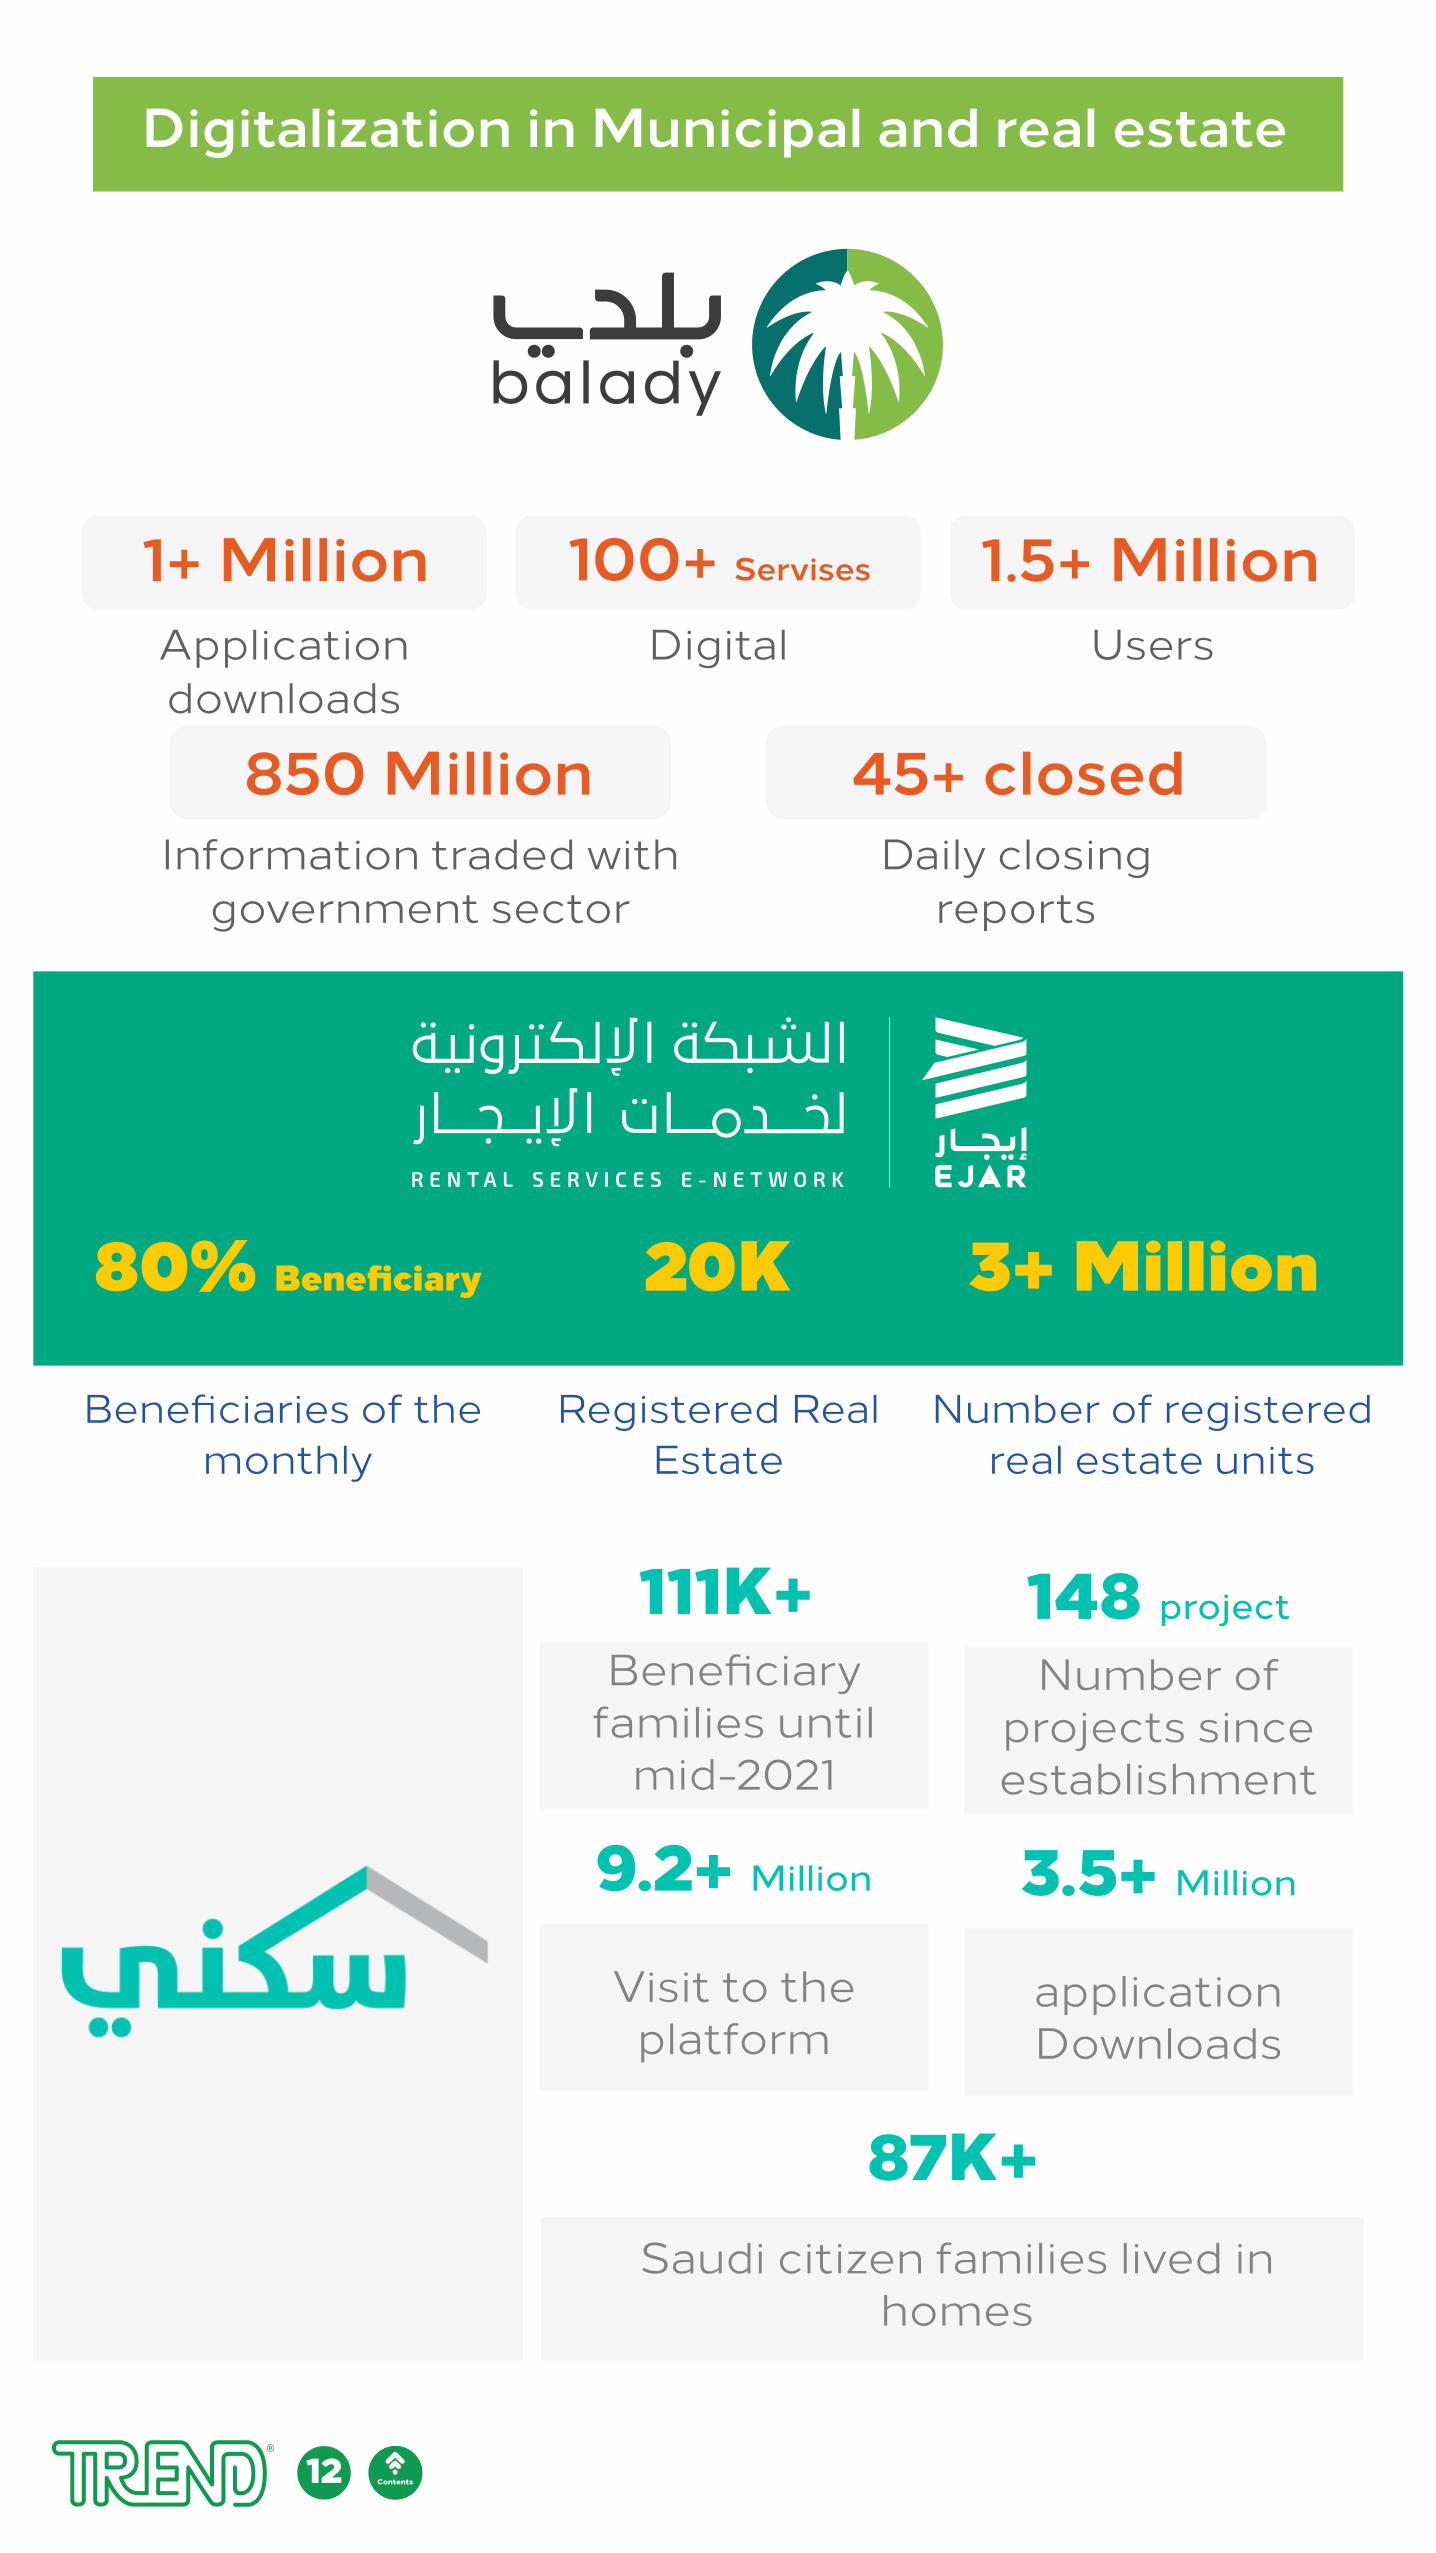
Digitalization in Municipal and real estate
45+ closed Daily closing
reports
850 Million Information traded with
government sector
1.5+ MillionUsers
100+ Servises Digital
1+ Million Applicationdownloads
Number of registeredreal estate units
Registered RealEstate
Beneficiaries of the monthly
3+ Million 20K80% Beneficiary
Saudi citizen families lived in homes
87K+
Number ofprojects sinceestablishment
Beneficiary families until
mid-2021
148 project
Visit to theplatform
9.2+ Million
application Downloads
3.5+ Million
111K+
12 Contentsالمحتويات
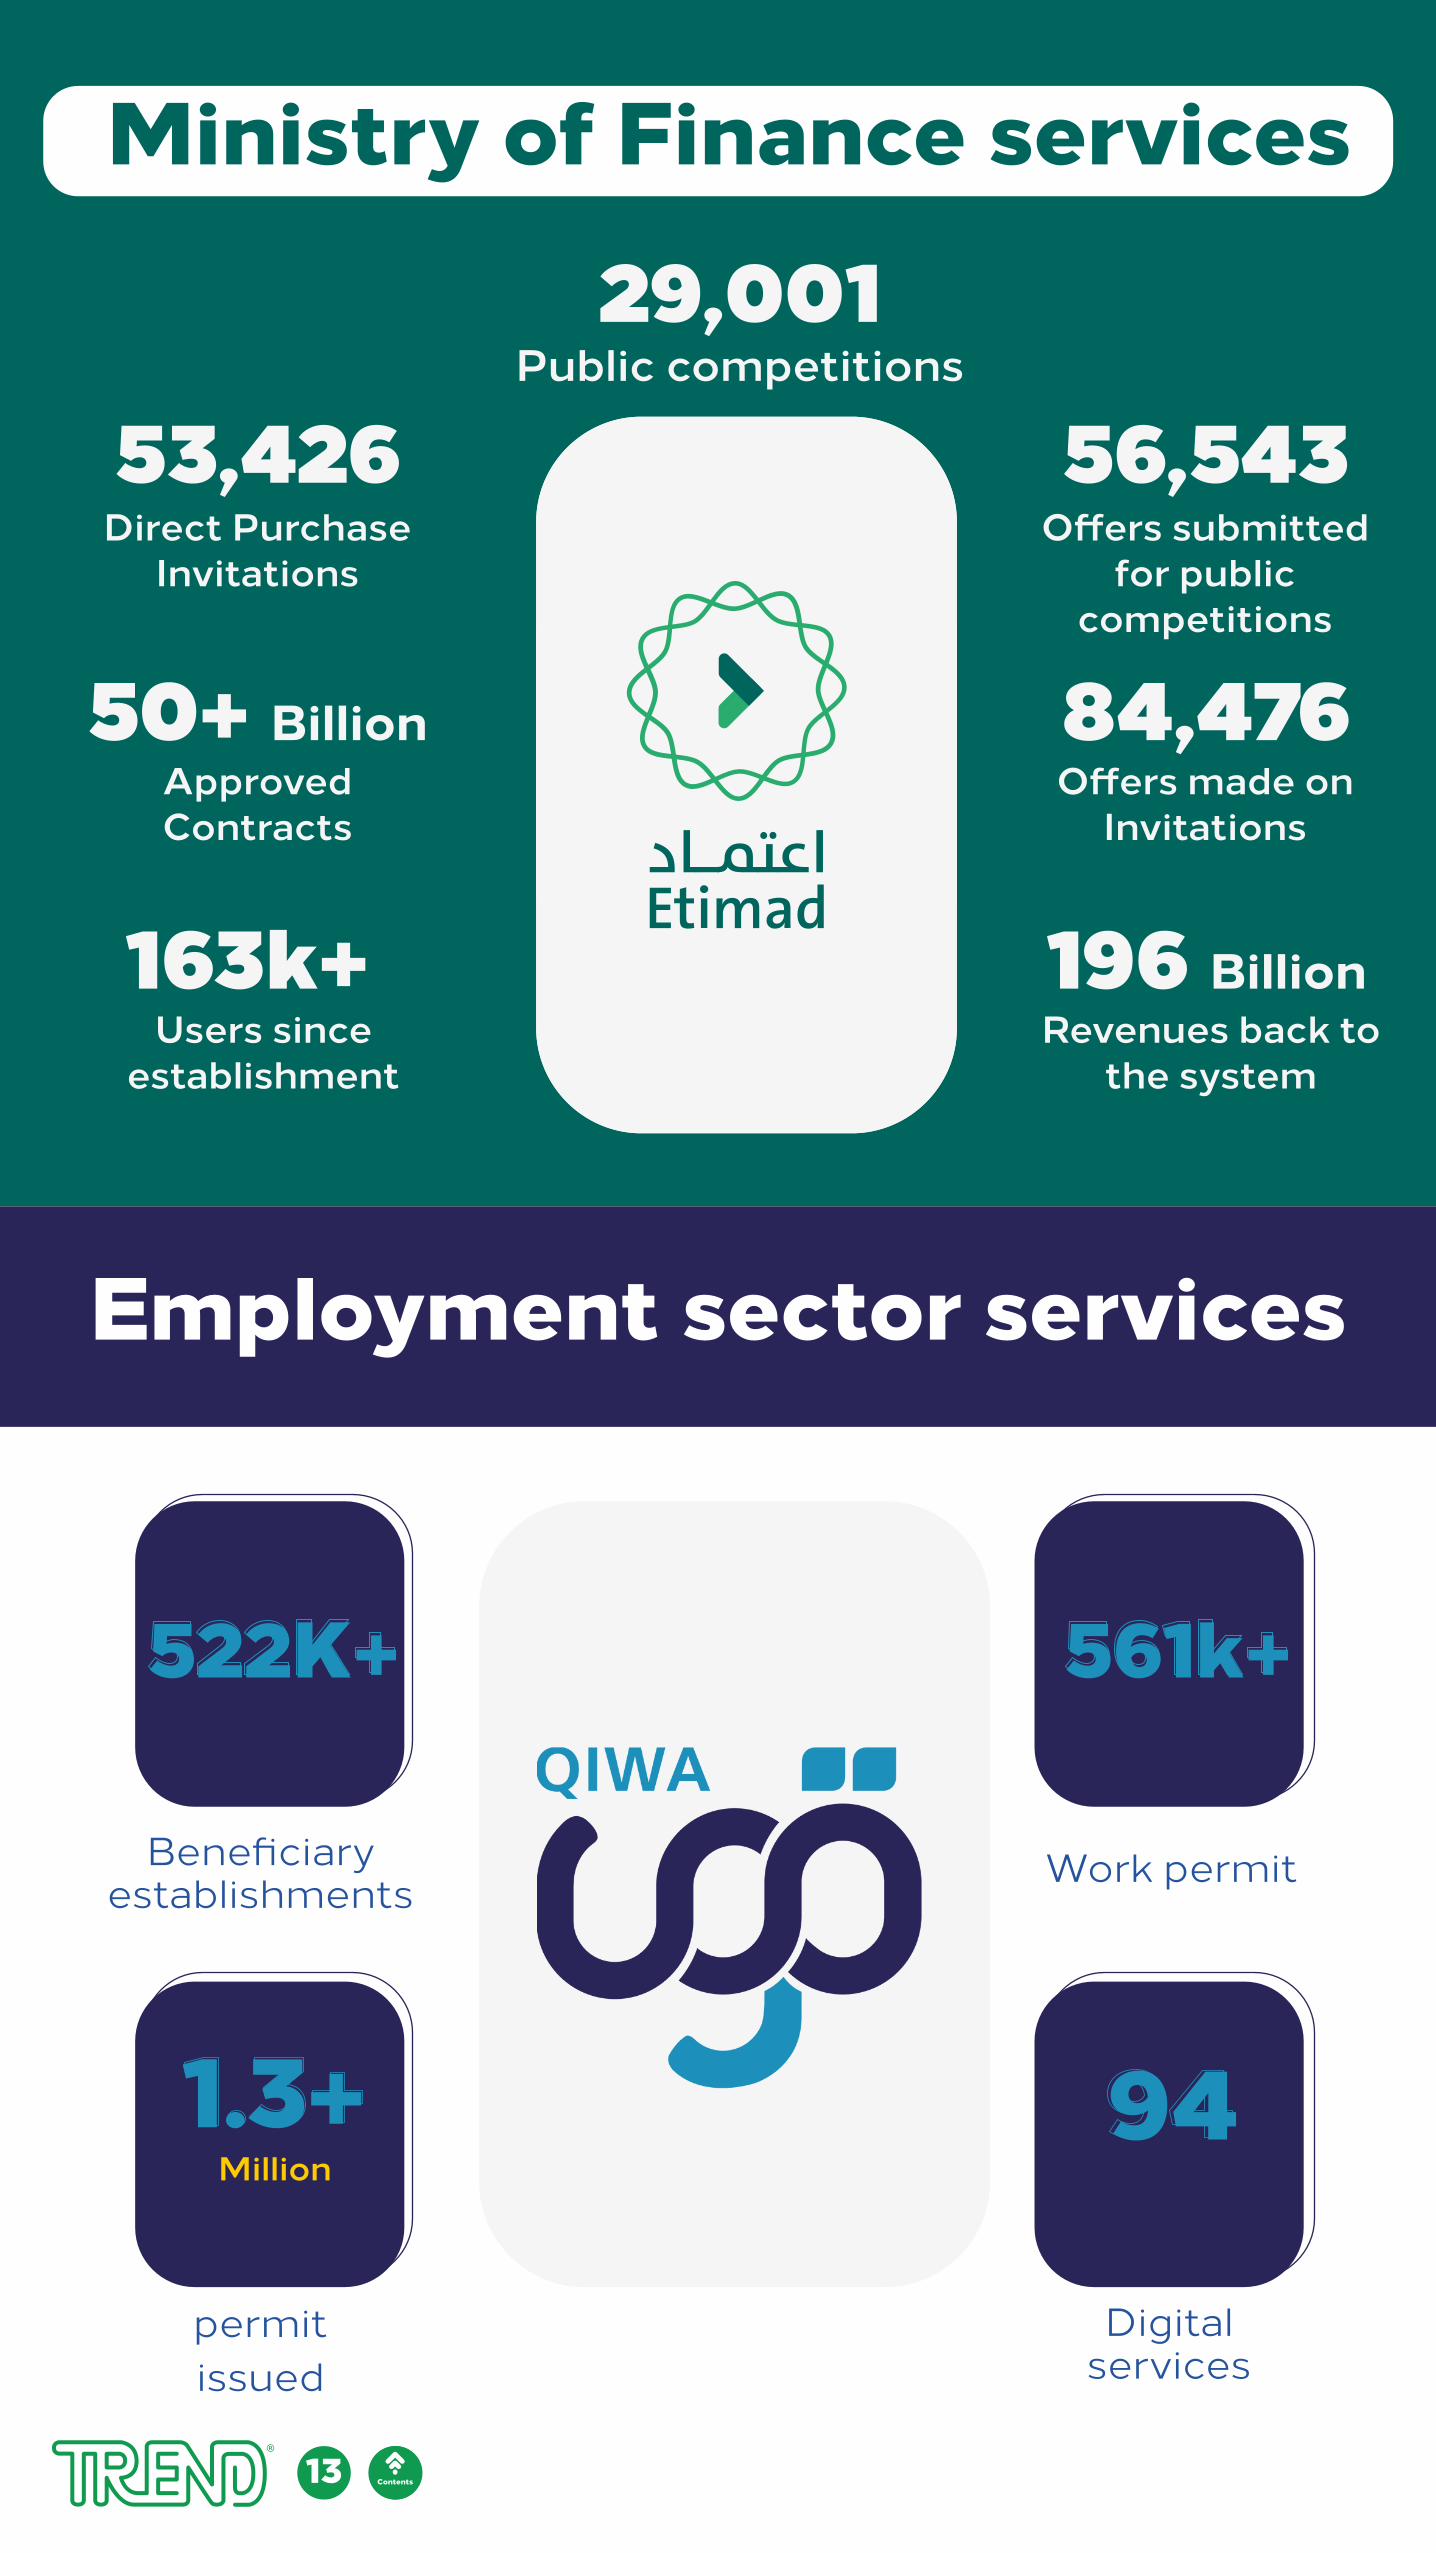
29,001Public competitions
56,543 O�ers submitted
for public competitions
53,426 Direct Purchase
Invitations
84,476 O�ers made on
Invitations
50+ Billion Approved Contracts
196 Billion Revenues back to
the system
163k+ Users since
establishment
Ministry of Finance services
Employment sector services
Work permit Beneficiary establishments
Digital services
94
permitissued
Million1.3+
13 المحتويات
561k+522K+
Contents
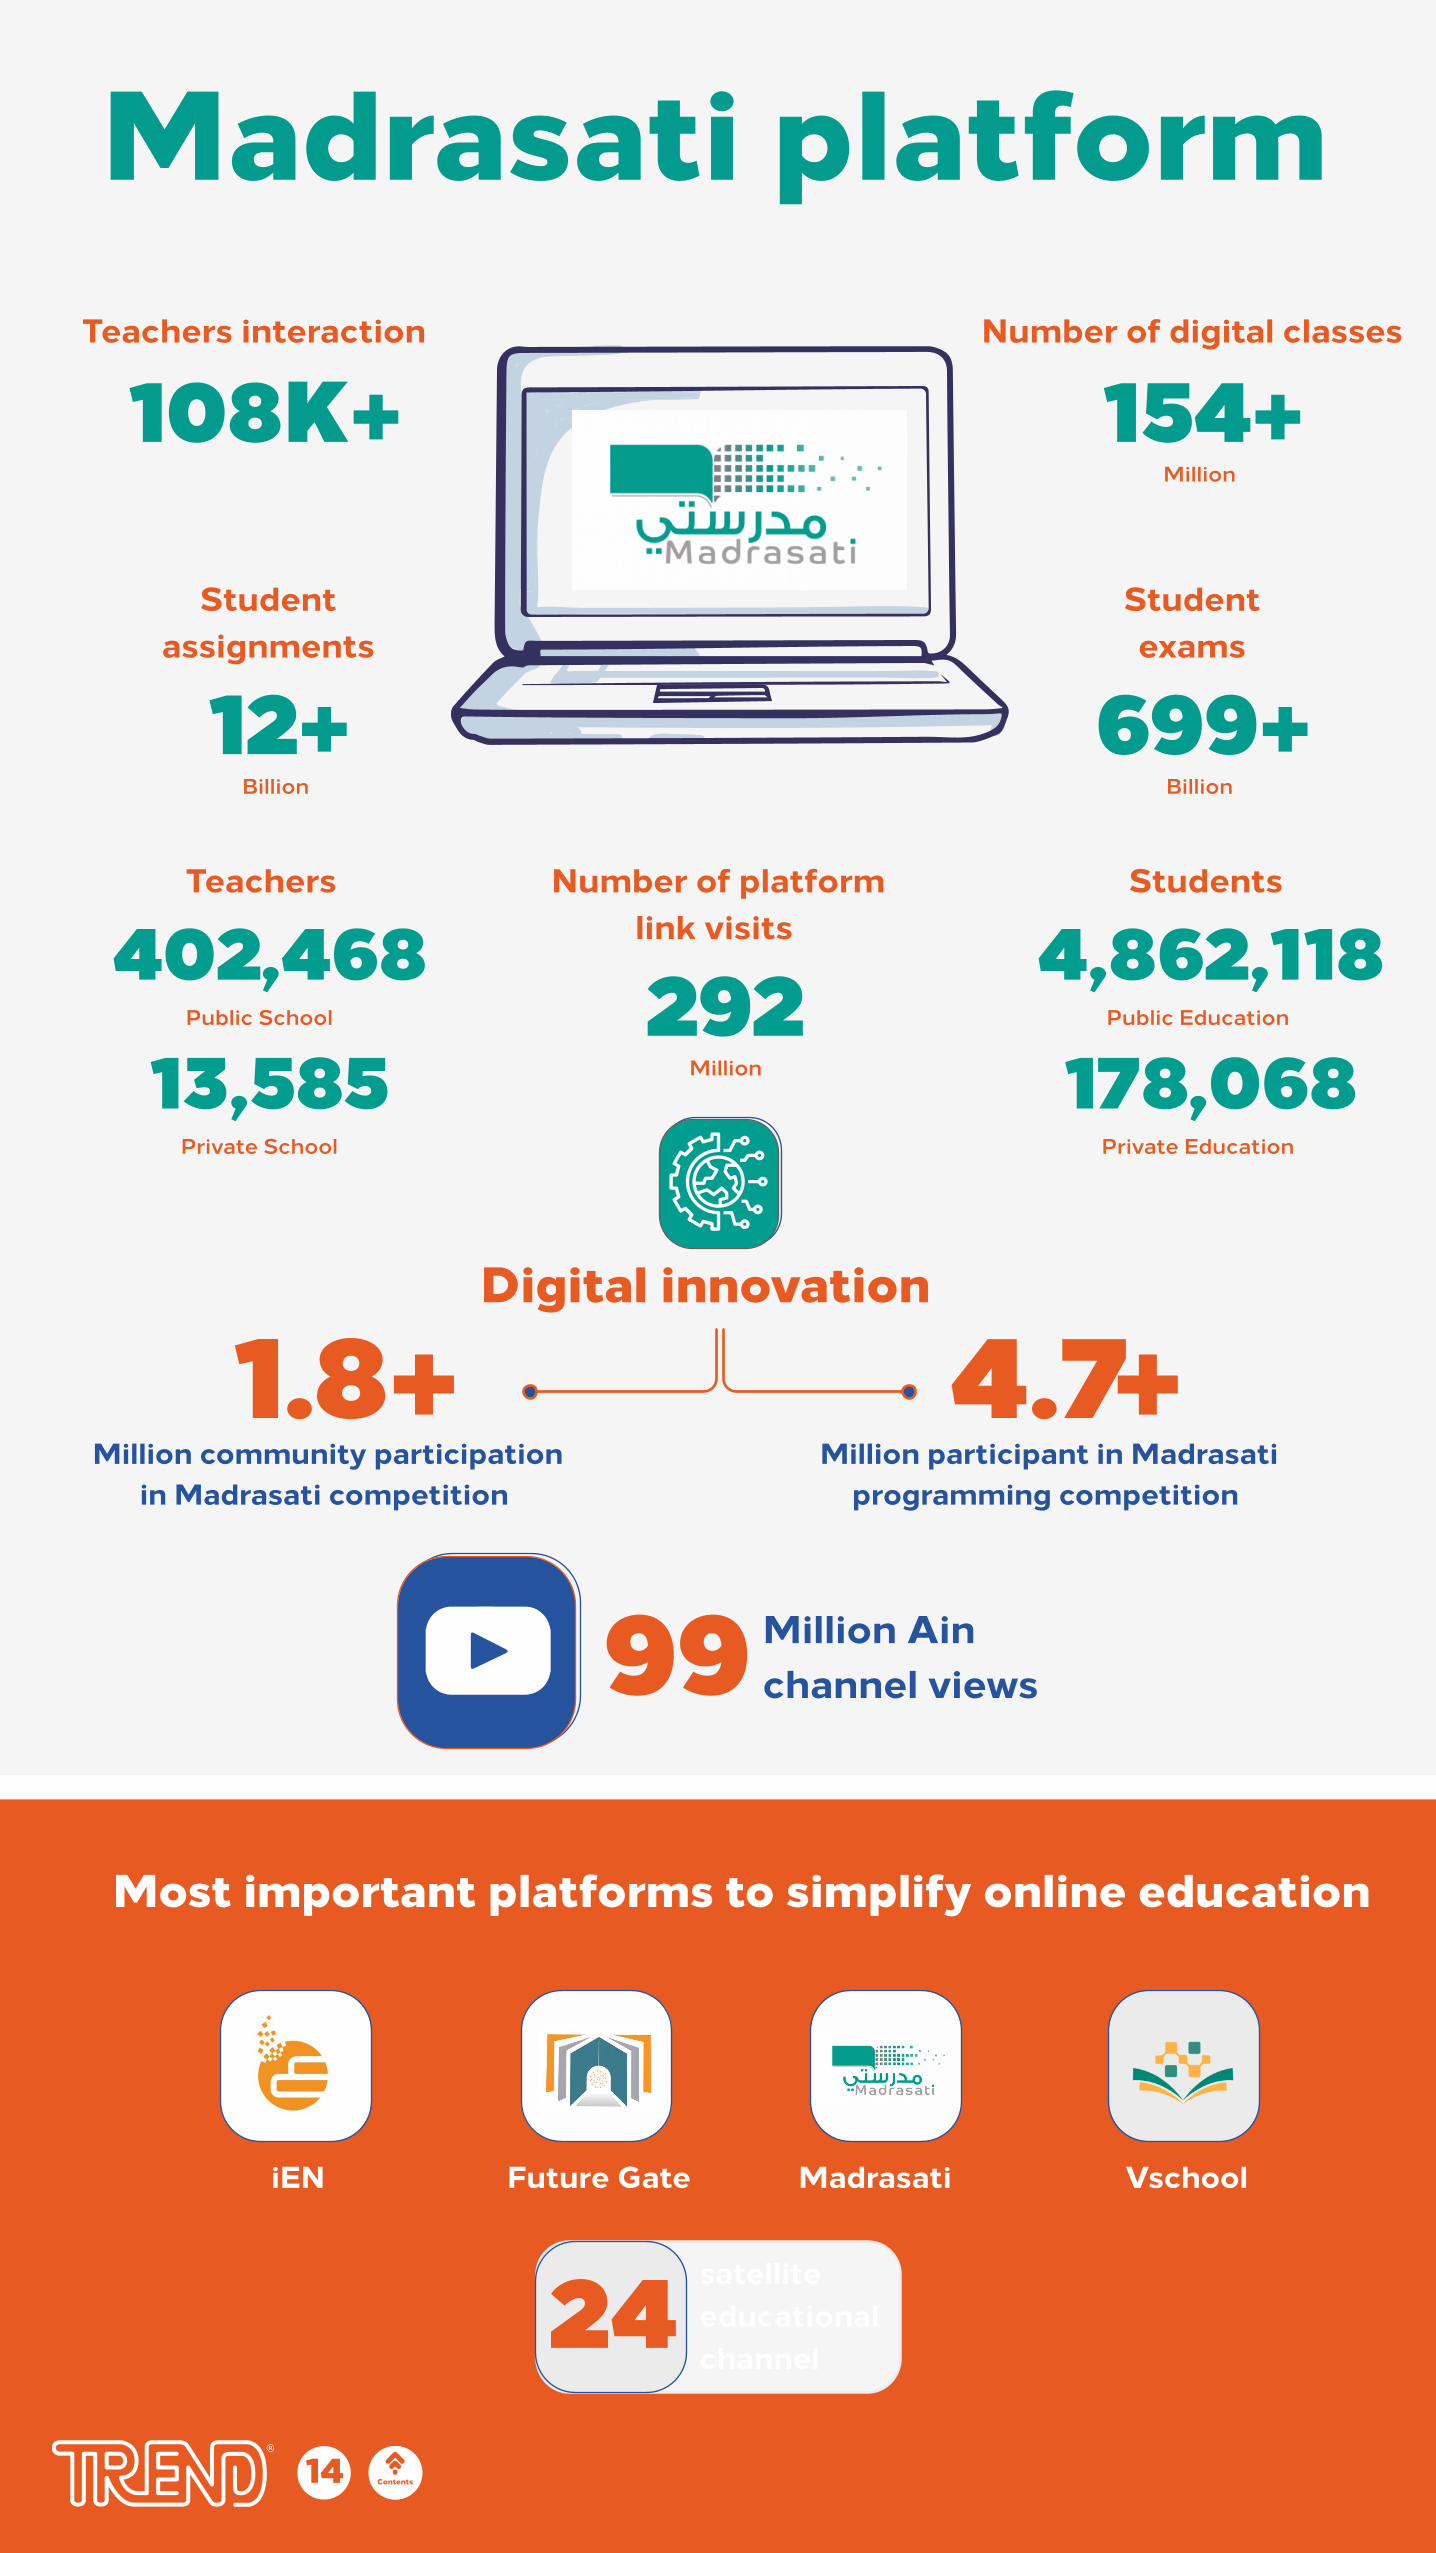
Madrasati platformNumber of digital classes
154+Million
Studentexams
699+
4.7+1.8+
Billion
Million participant in Madrasatiprogramming competition
Million community participationin Madrasati competition
Teachers Number of platformlink visits
292Million
Students
4,862,118Public Education
178,068Private Education
402,468Public School
13,585Private School
Studentassignments
12+Billion
Teachers interaction
108K+
Digital innovation
99 Million Ainchannel views
Most important platforms to simplify online education
VschoolMadrasatiFuture GateiEN
satelliteeducationalchannel
2414 Contentsالمحتويات
InternetUsage
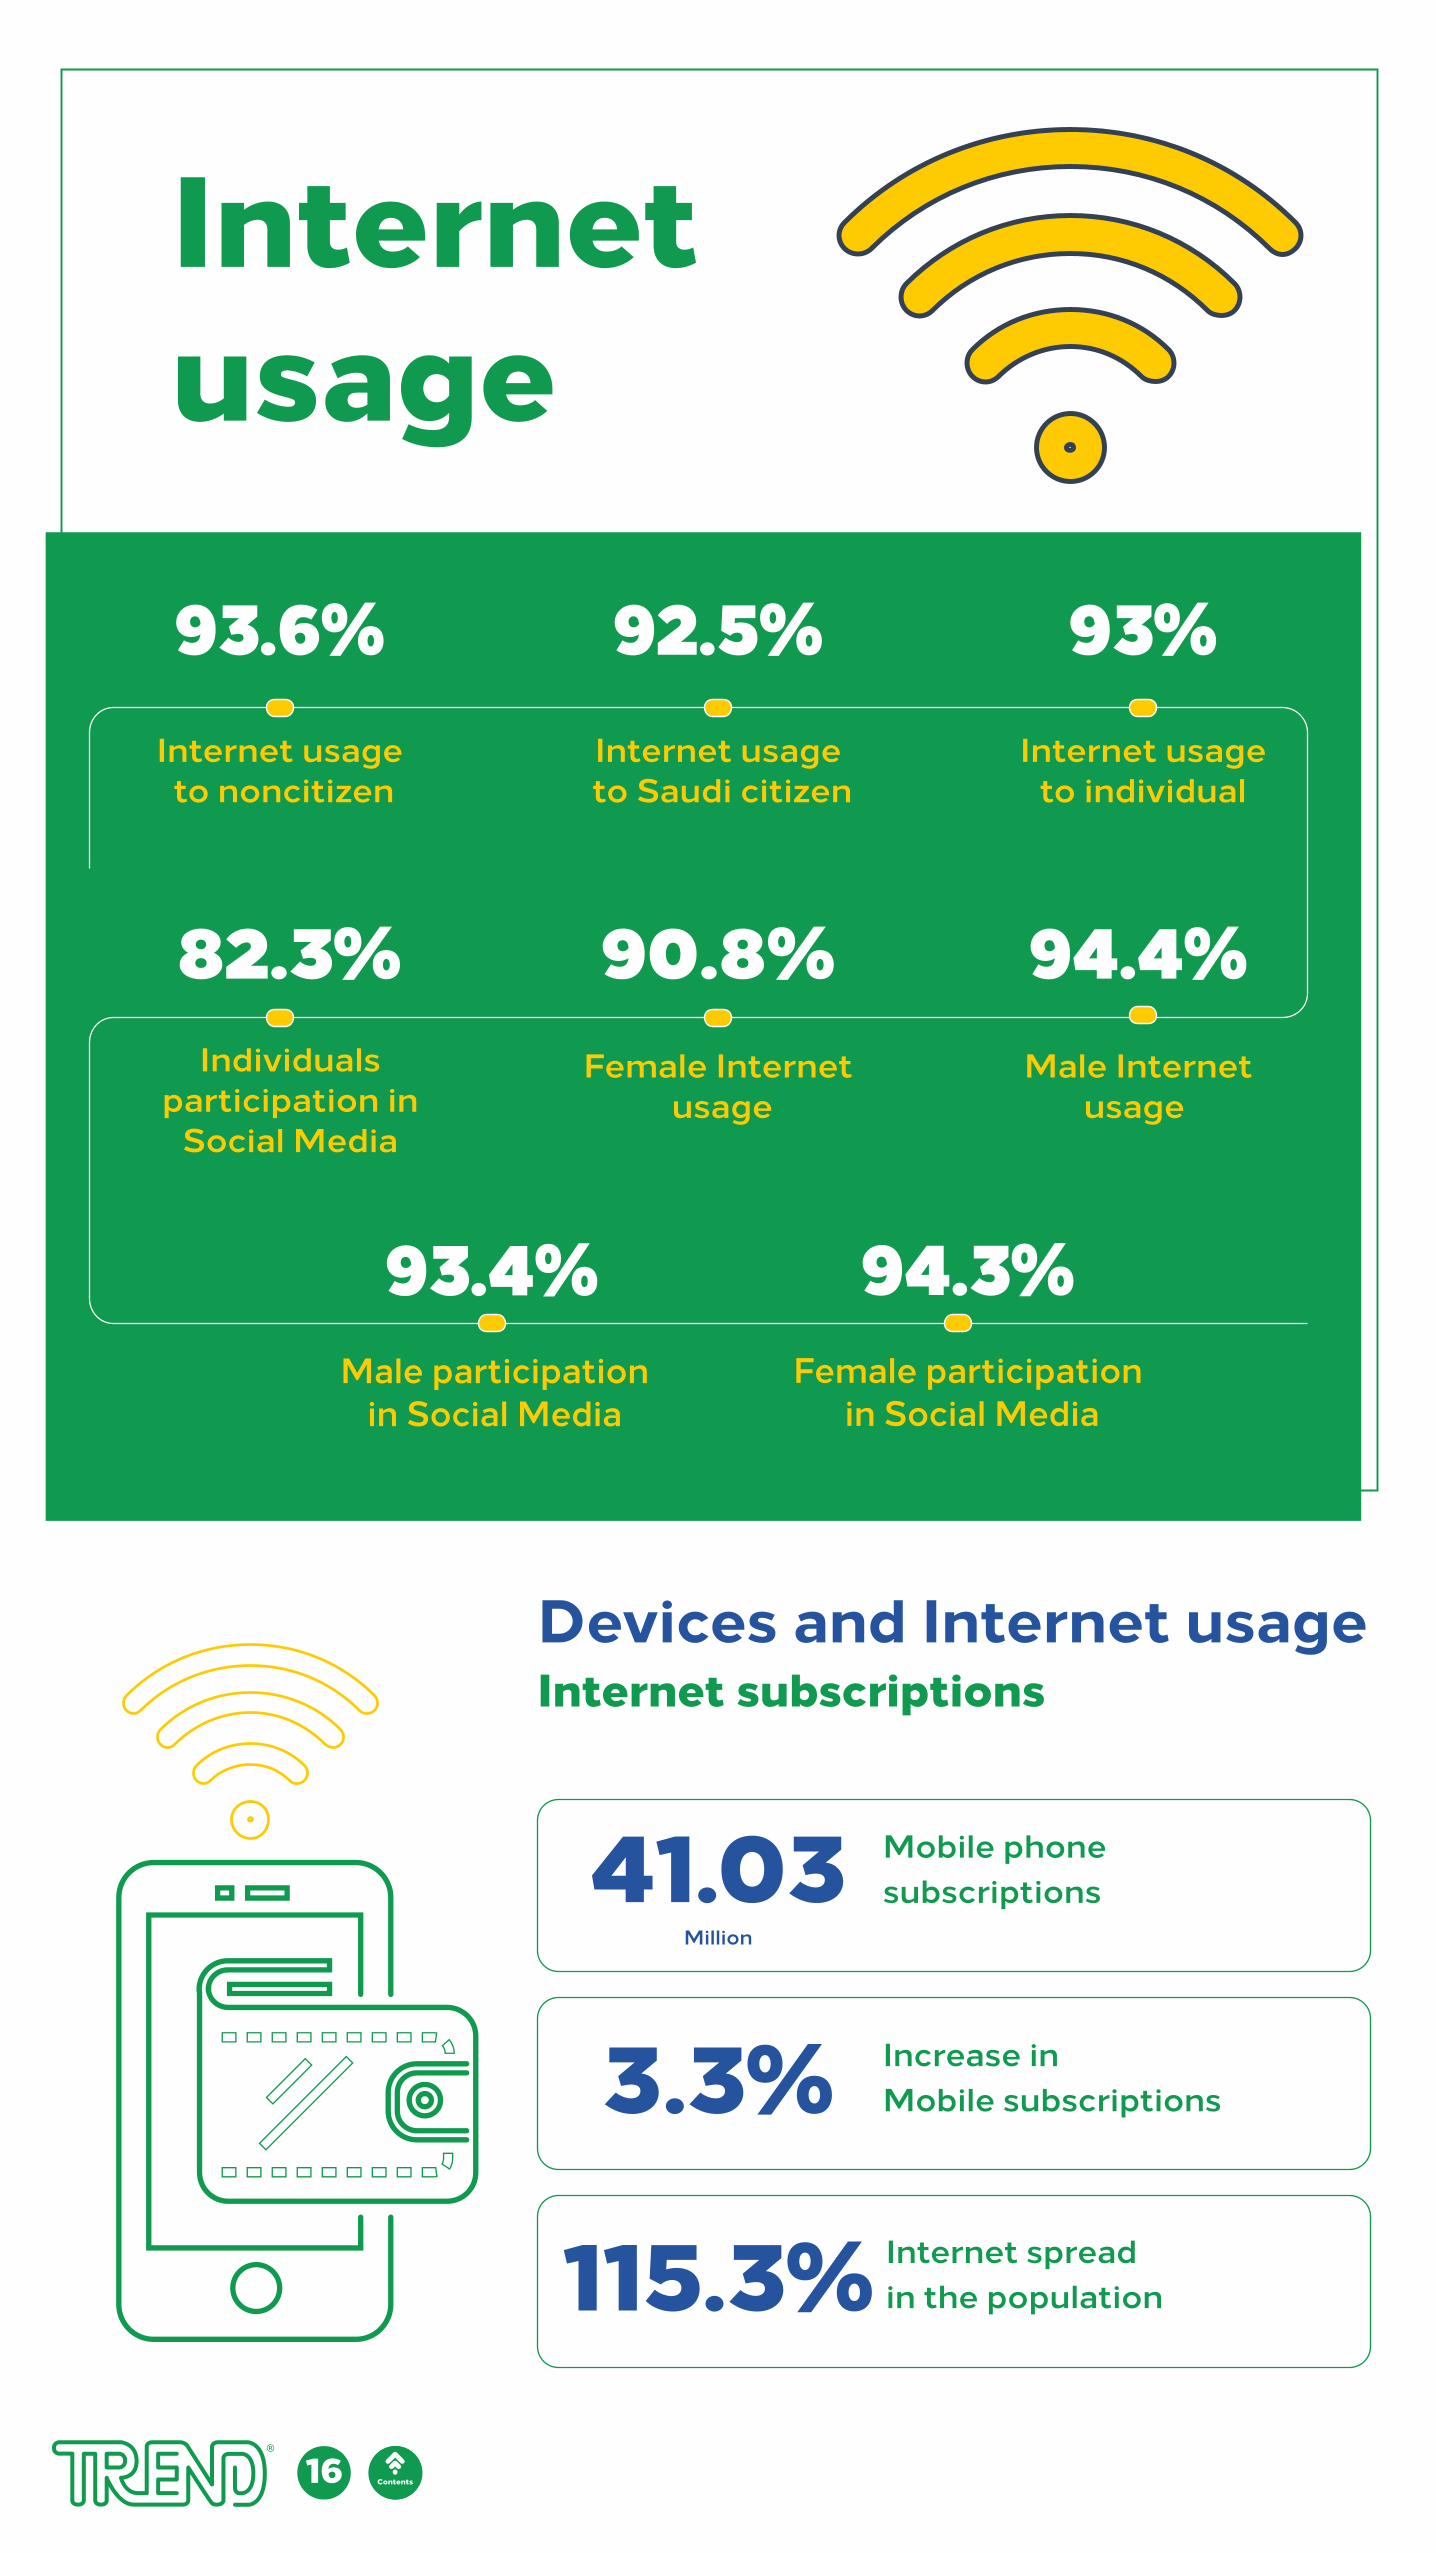
Devices and Internet usageInternet subscriptions
Internetusage
Mobile phone subscriptions
Internet spreadin the population
Increase inMobile subscriptions
41.03
3.3%
115.3%
Million
Internet usageto individual
Internet usage to Saudi citizen
Internet usage to noncitizen
Individualsparticipation in
Social Media
Female Internet usage
Male Internetusage
Female participation in Social Media
Male participationin Social Media
93%92.5%93.6%
82.3% 90.8% 94.4%
94.3%93.4%
16 Contentsالمحتويات
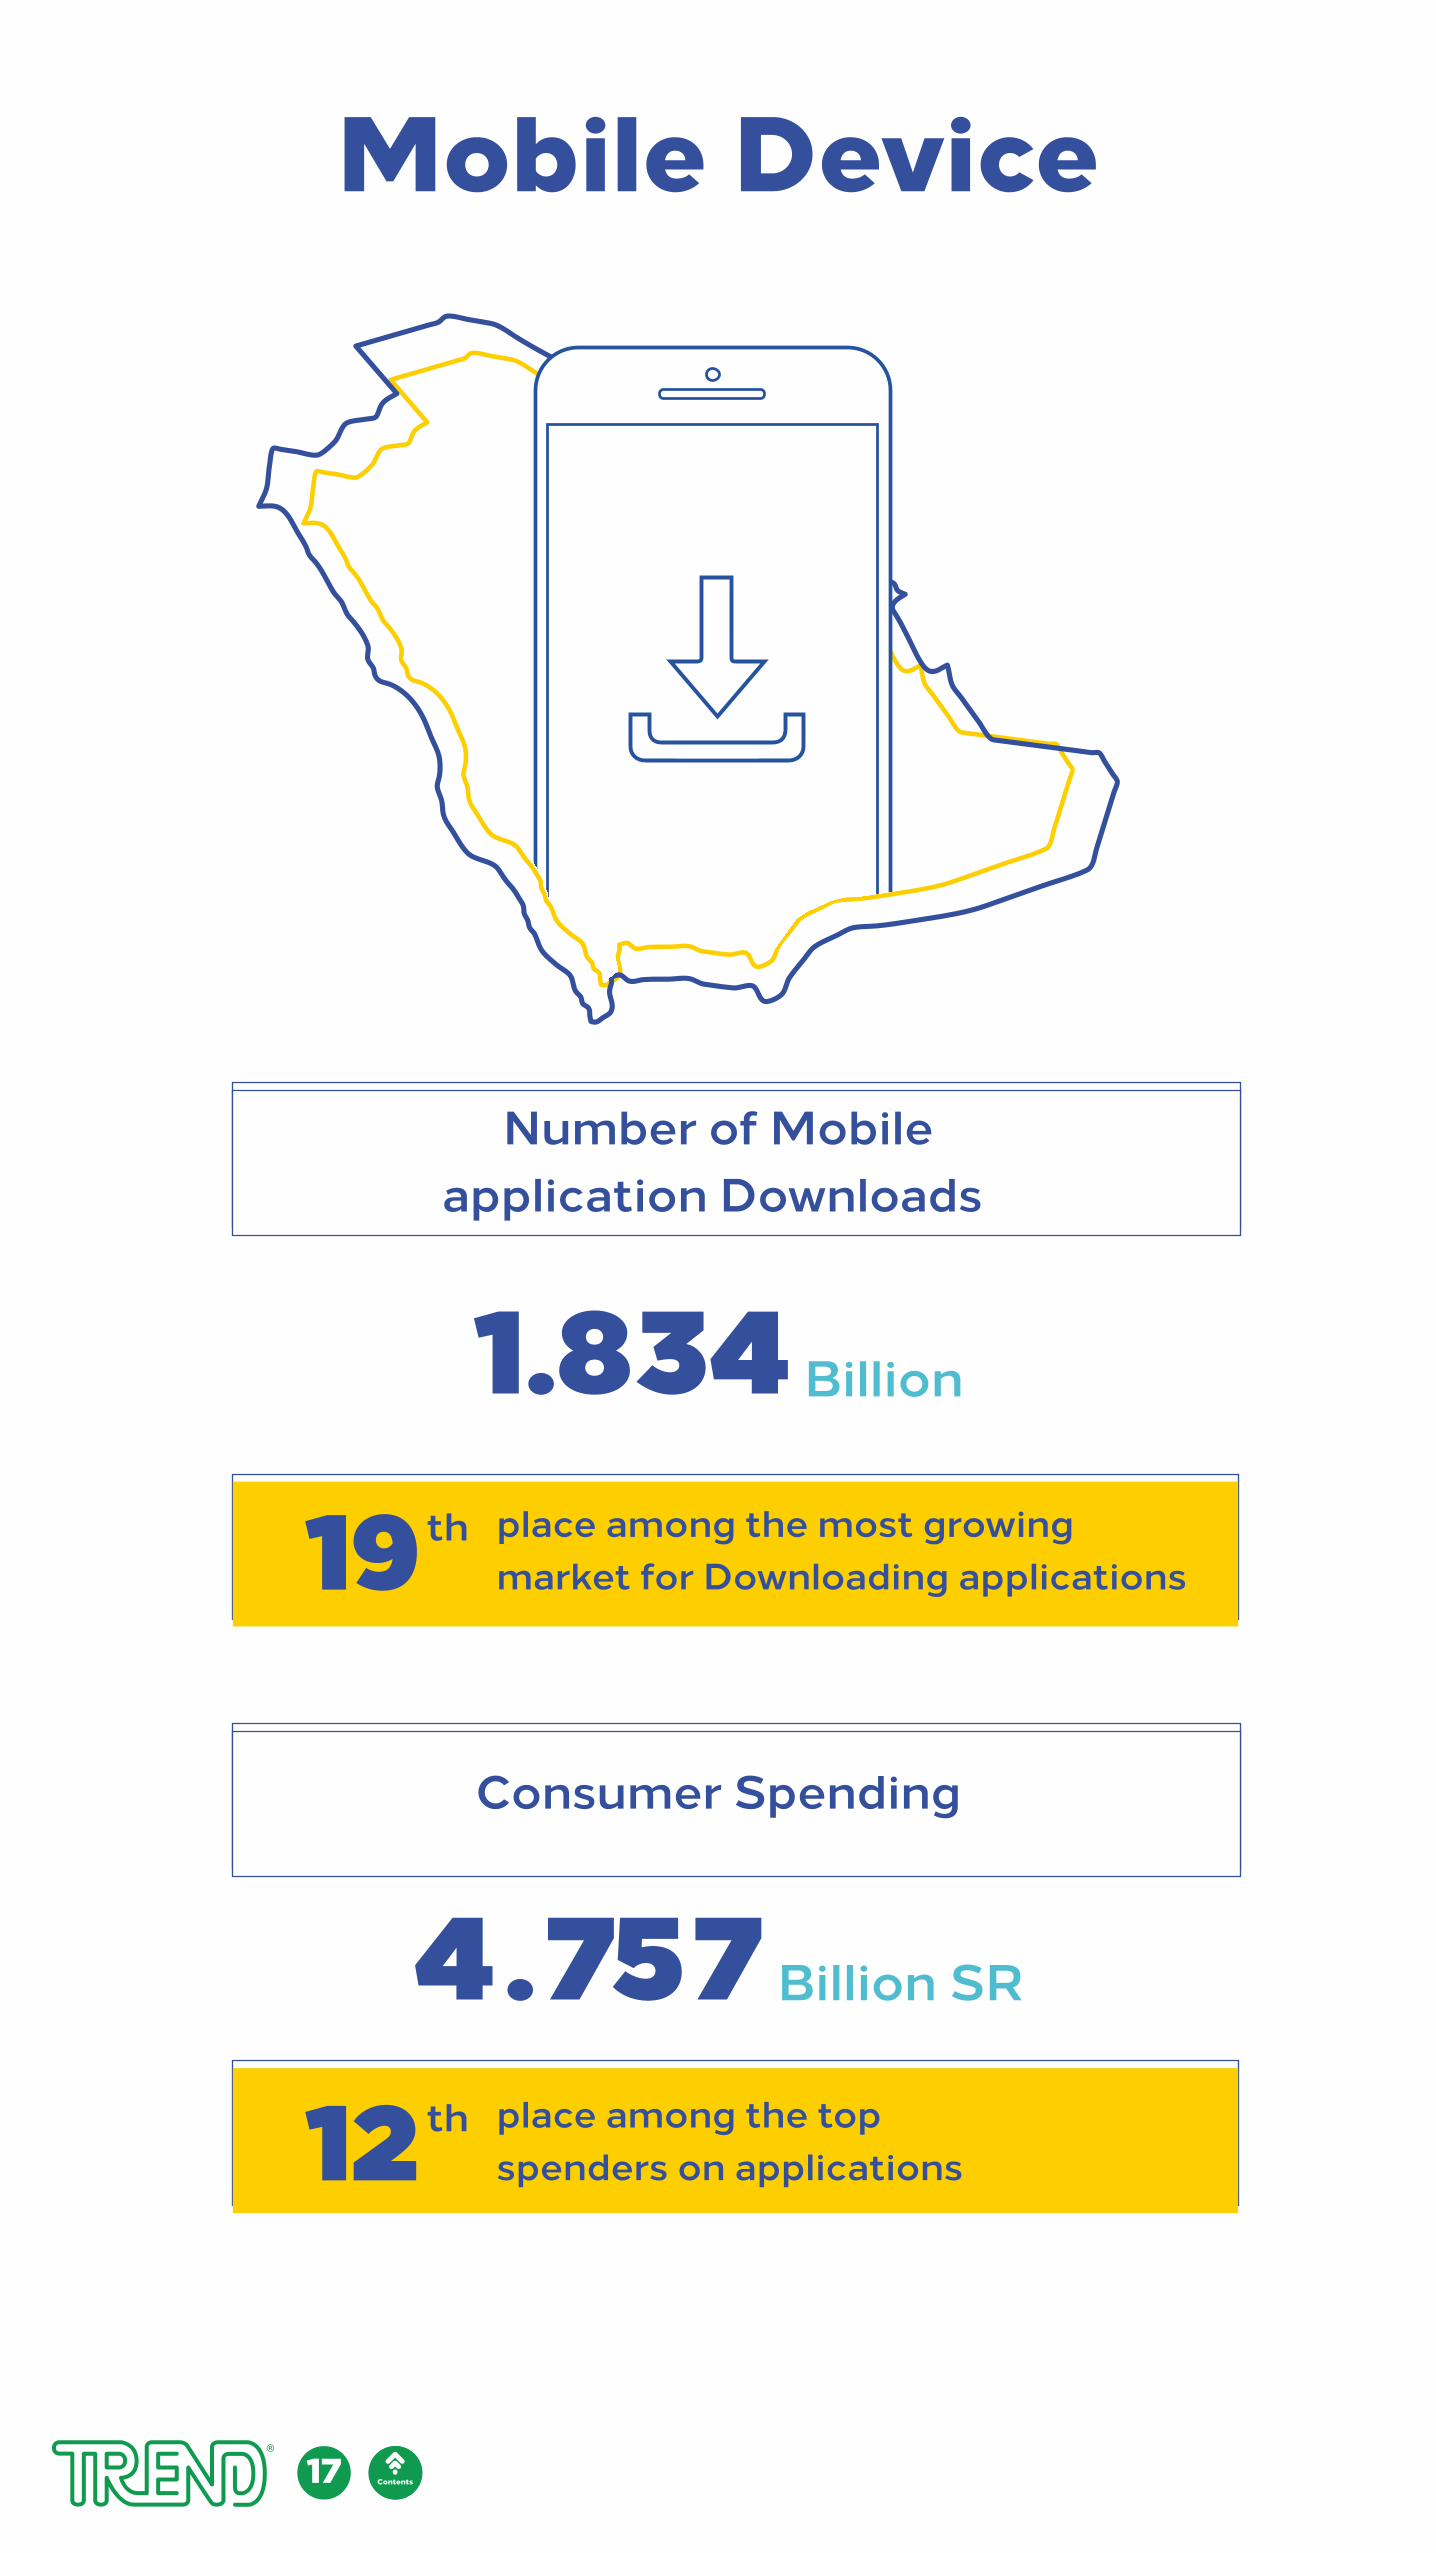
Number of Mobileapplication Downloads
Consumer Spending
Mobile Device
4.757 Billion SR
1.834 Billion
17 المحتويات
th19 place among the most growingmarket for Downloading applications
th12 place among the topspenders on applications
Contents
37
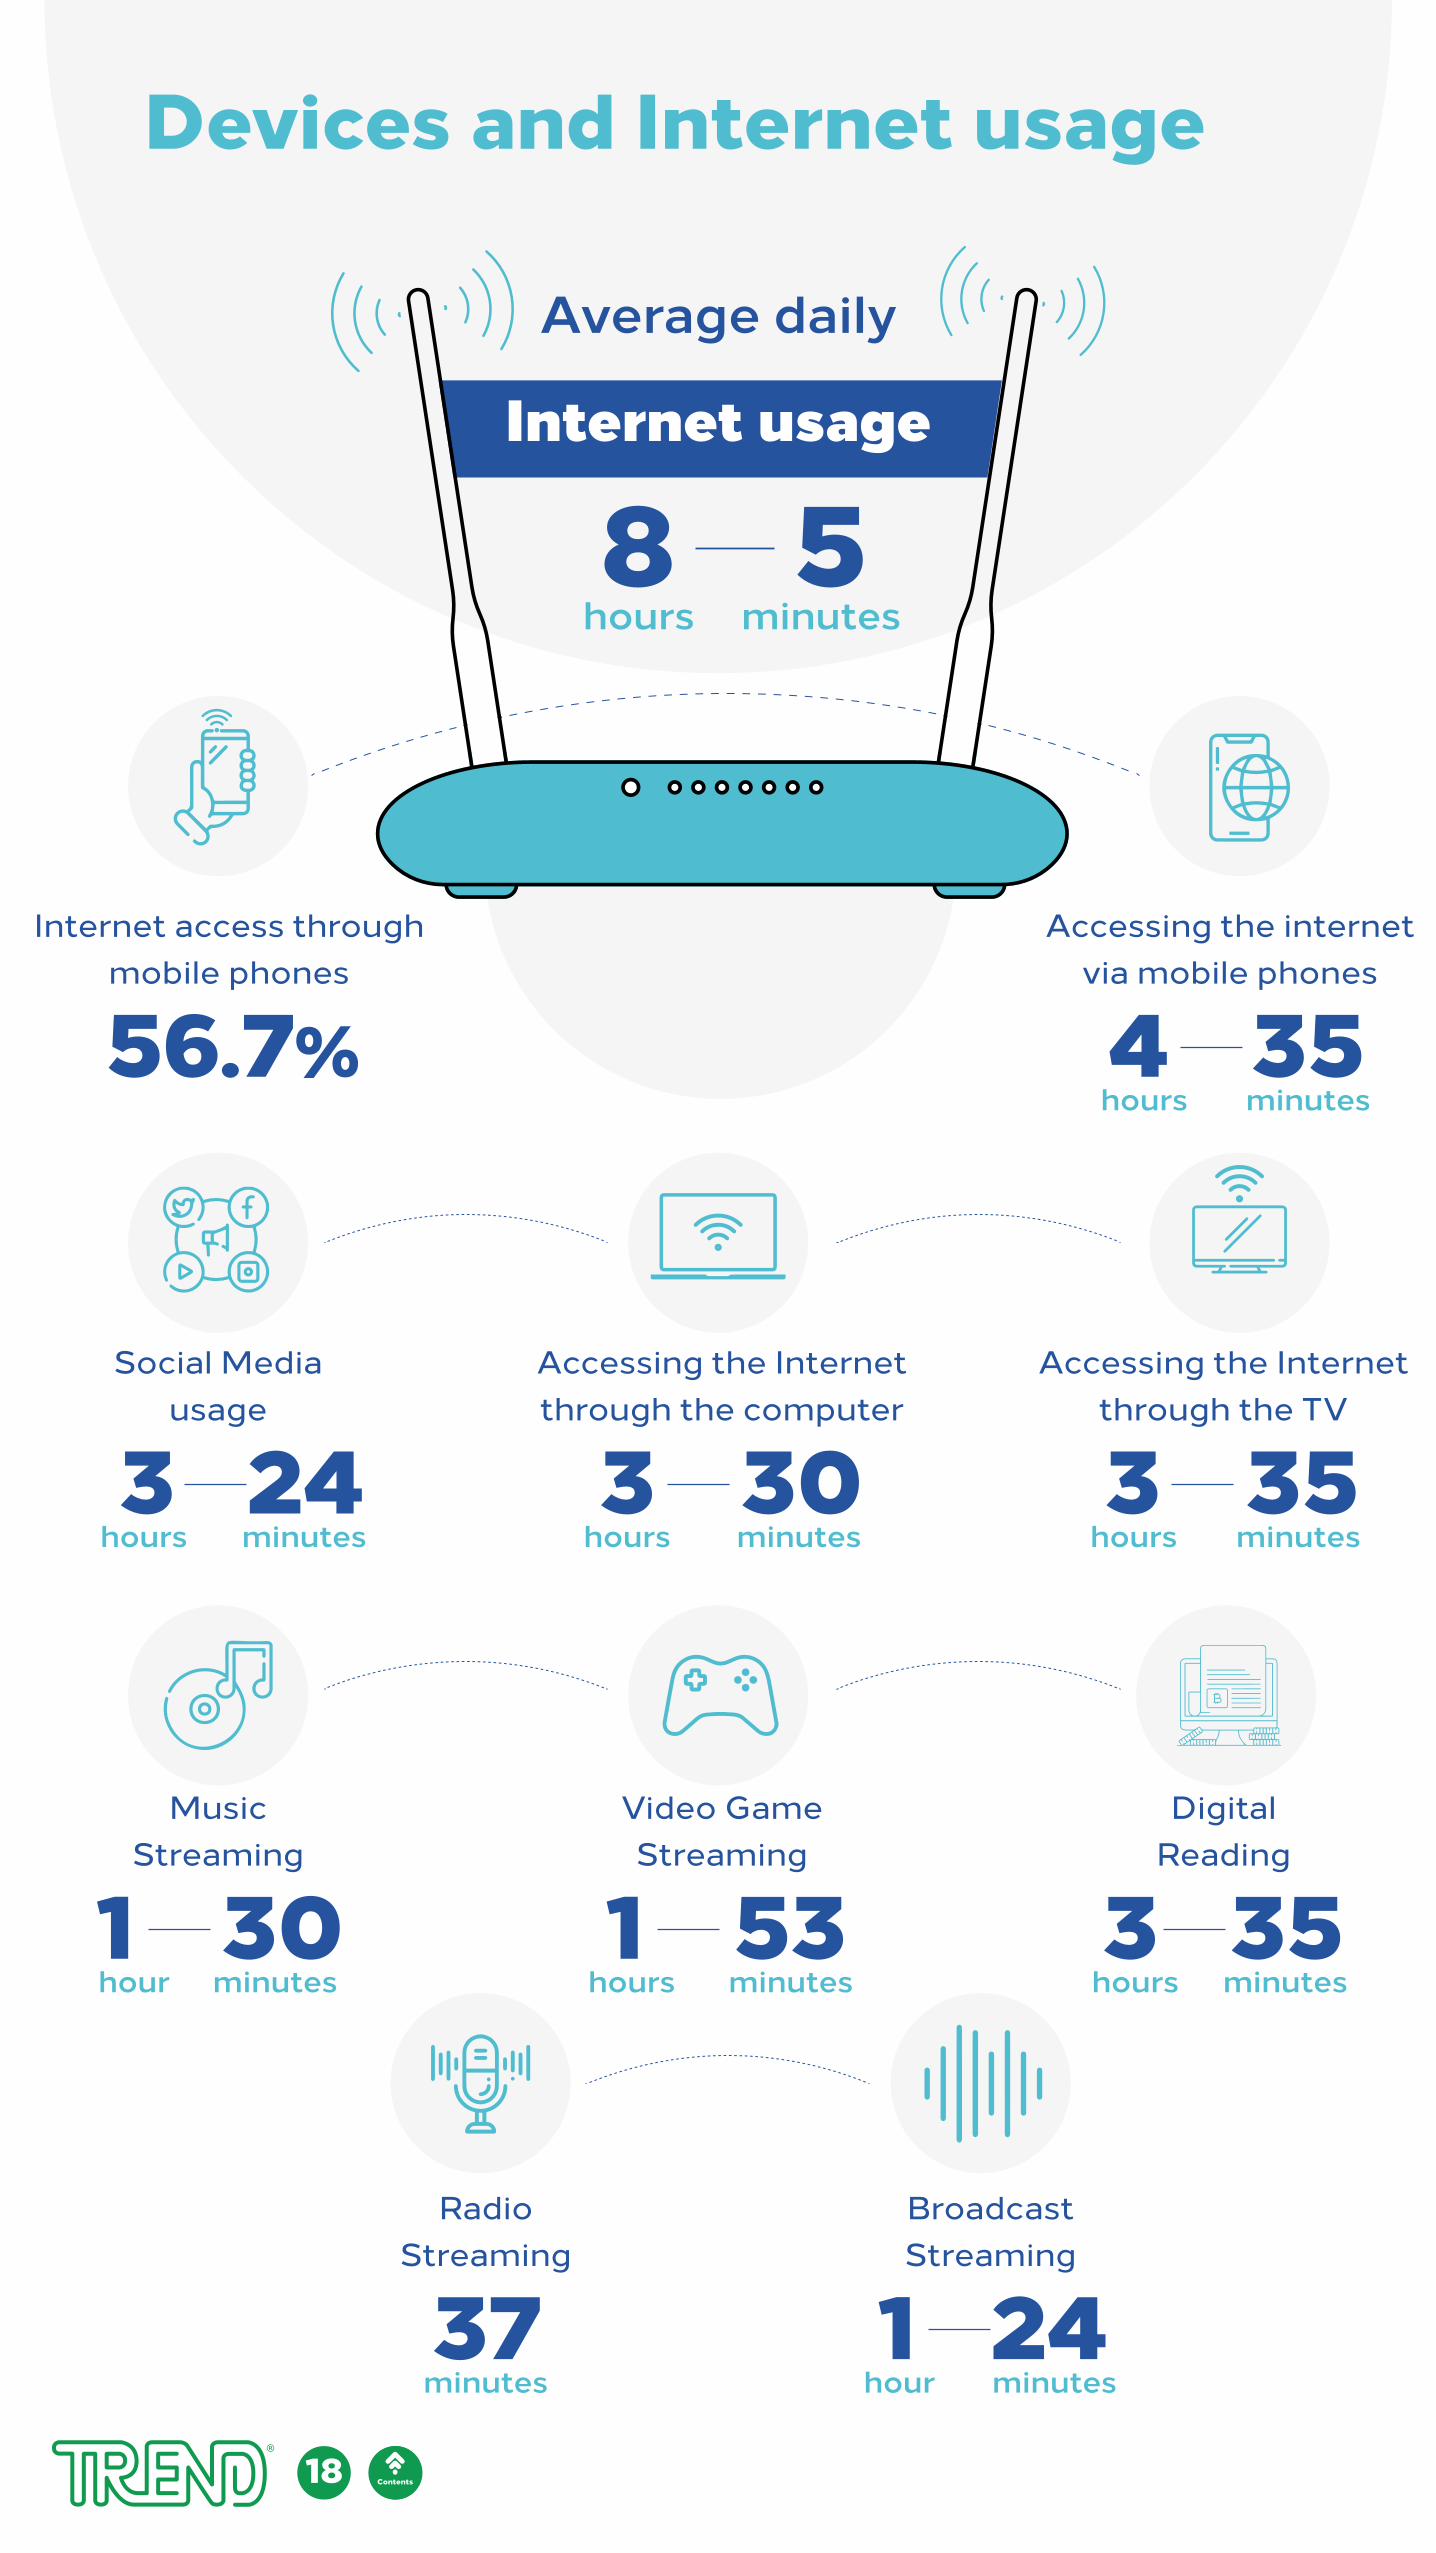
Devices and Internet usage
Average daily
Internet usage
minutes5
hours8
minutes35
hours456.7%
Accessing the internetvia mobile phones
minutes35
hours3
Accessing the Internetthrough the TV
minuteshours3Social Media
usage
minutes30
hours3
Accessing the Internetthrough the computer
minutes35
hours3
DigitalReading
minutes30
hour1
Music Streaming
minutes53
hours1Video GameStreaming
minutes24
hour1
BroadcastStreaming
minutes
RadioStreaming
Internet access throughmobile phones
18 المحتويات
24
Contents
19 المحتويات
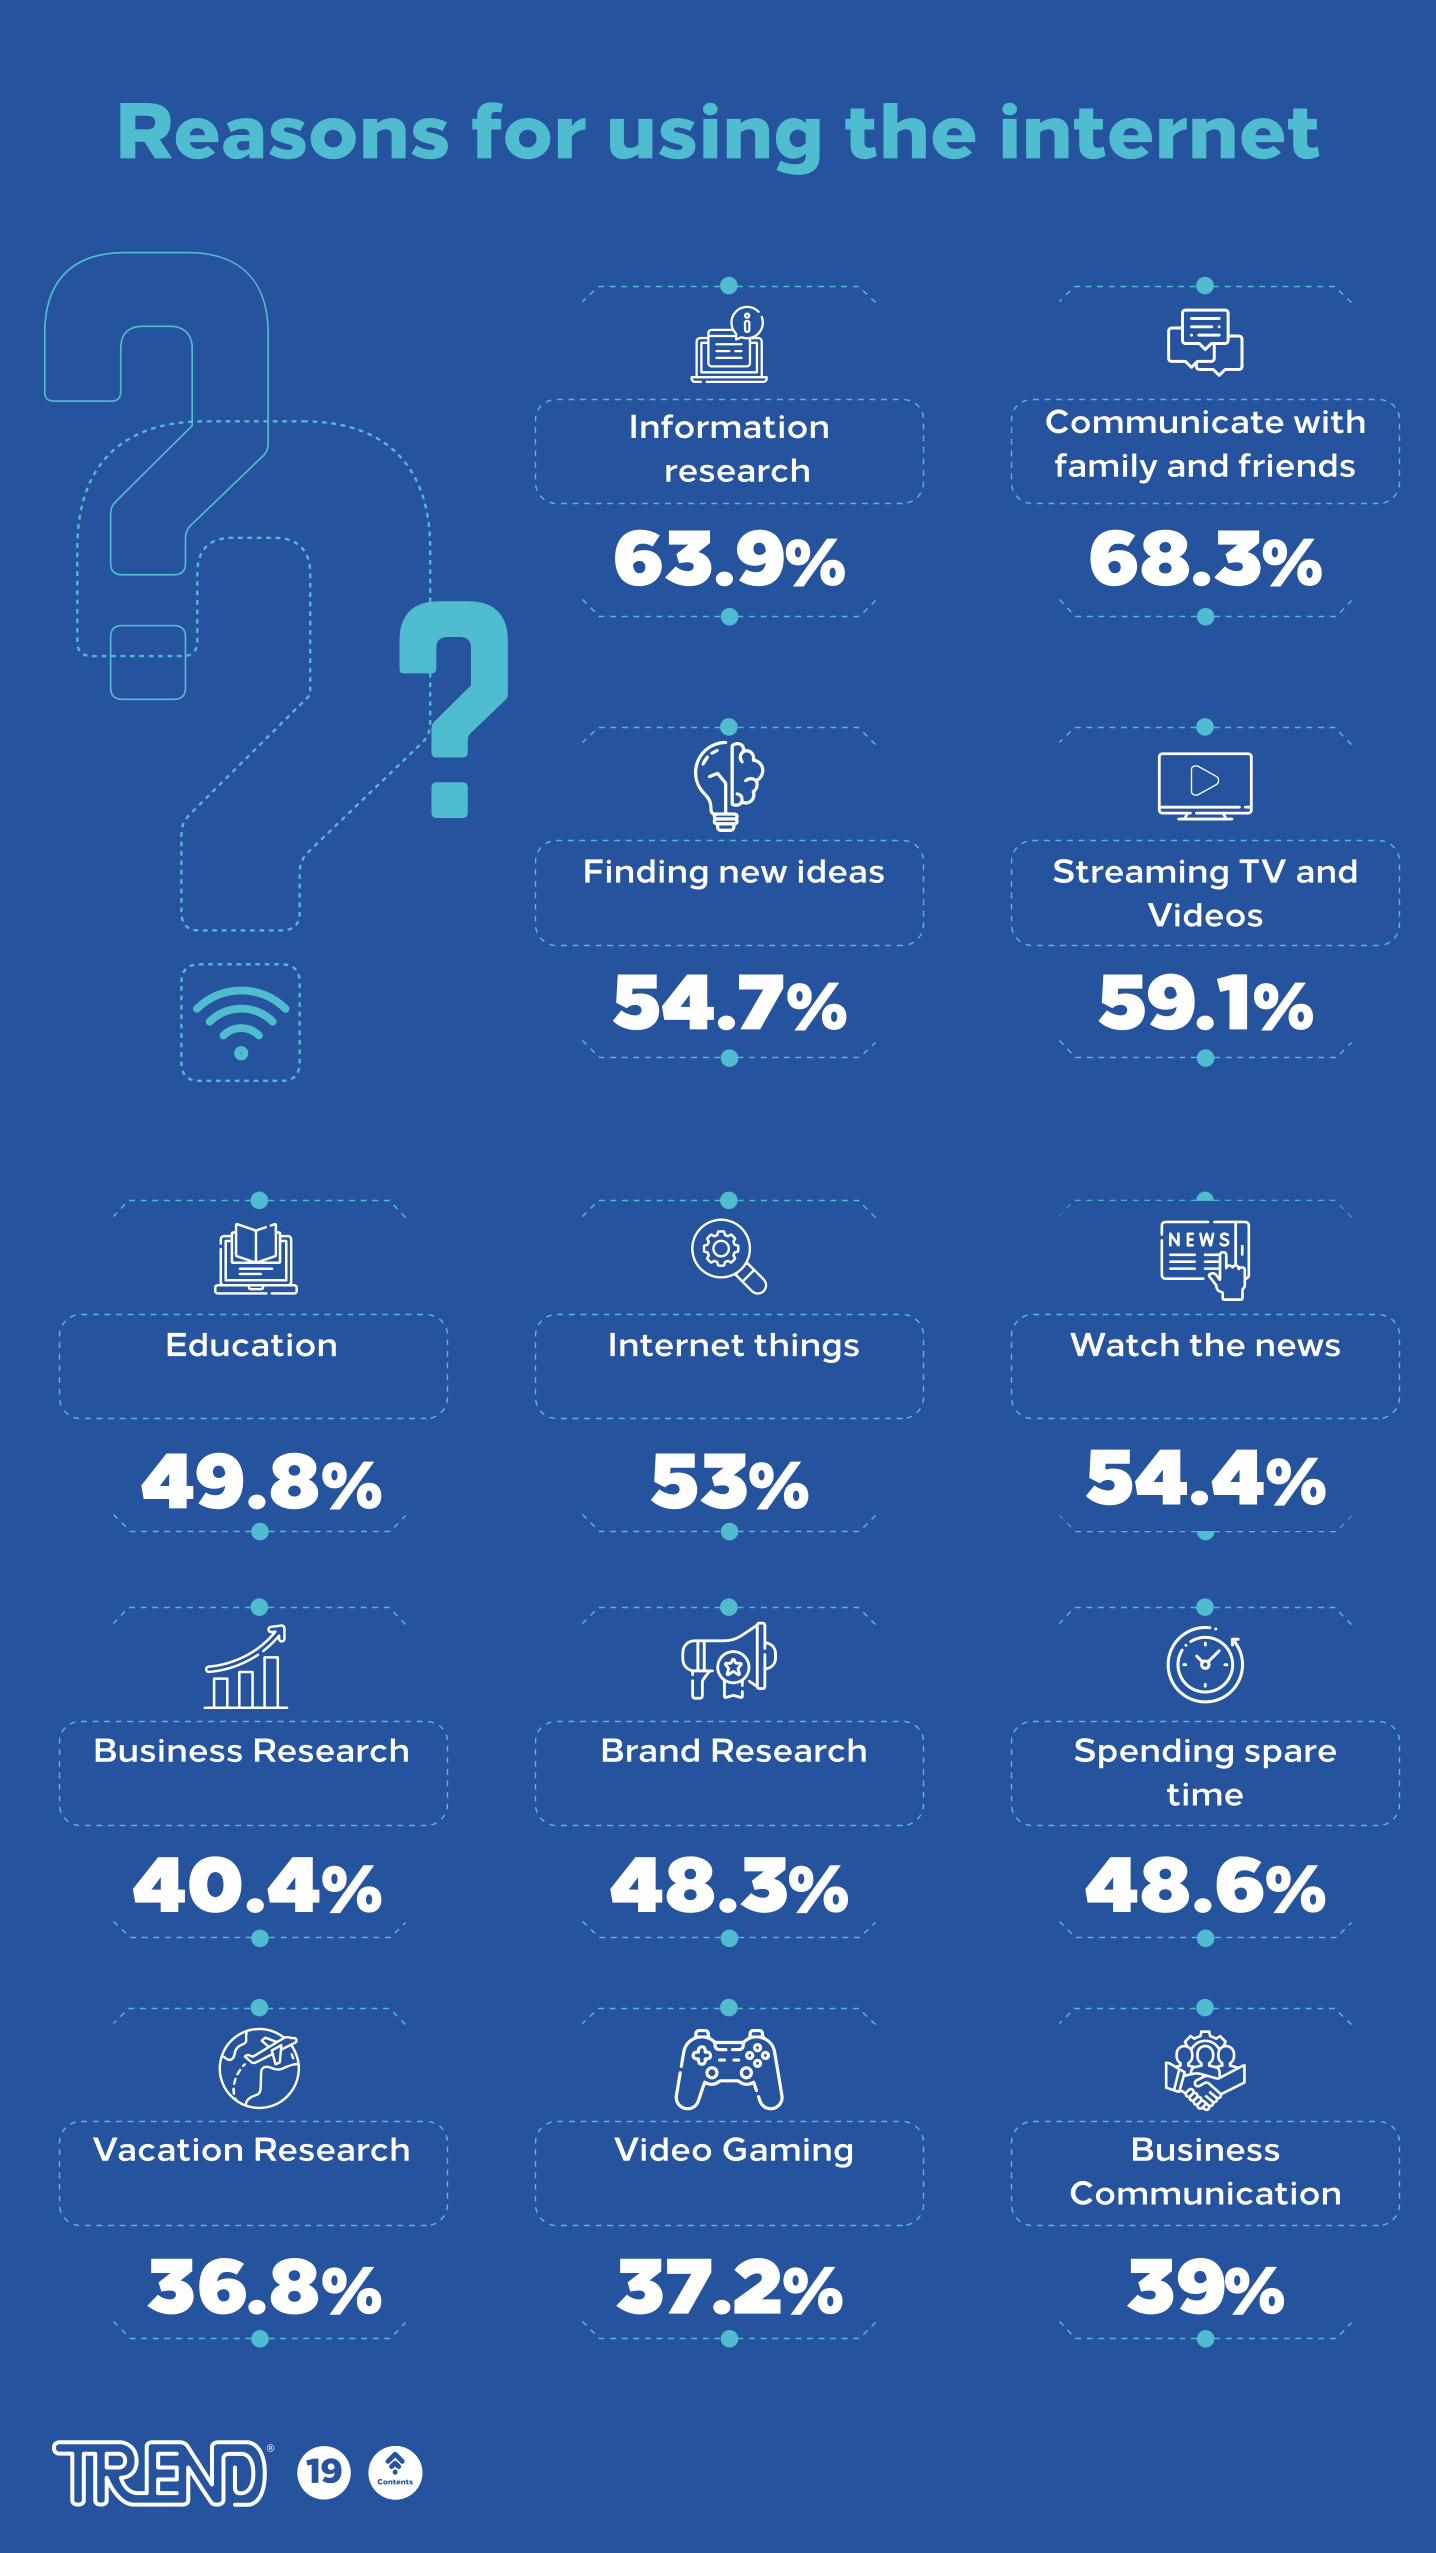
Reasons for using the internet
Information research
68.3%
59.1%54.7%
54.4%53%49.8%
48.6%48.3%40.4%
39%37.2%36.8%
63.9%
Communicate with family and friends
Streaming TV and Videos
Finding new ideas
Watch the news Internet things
Spending spare time
Brand Research
Business Communication
Video Gaming
Education
Business Research
Vacation Research
Contents
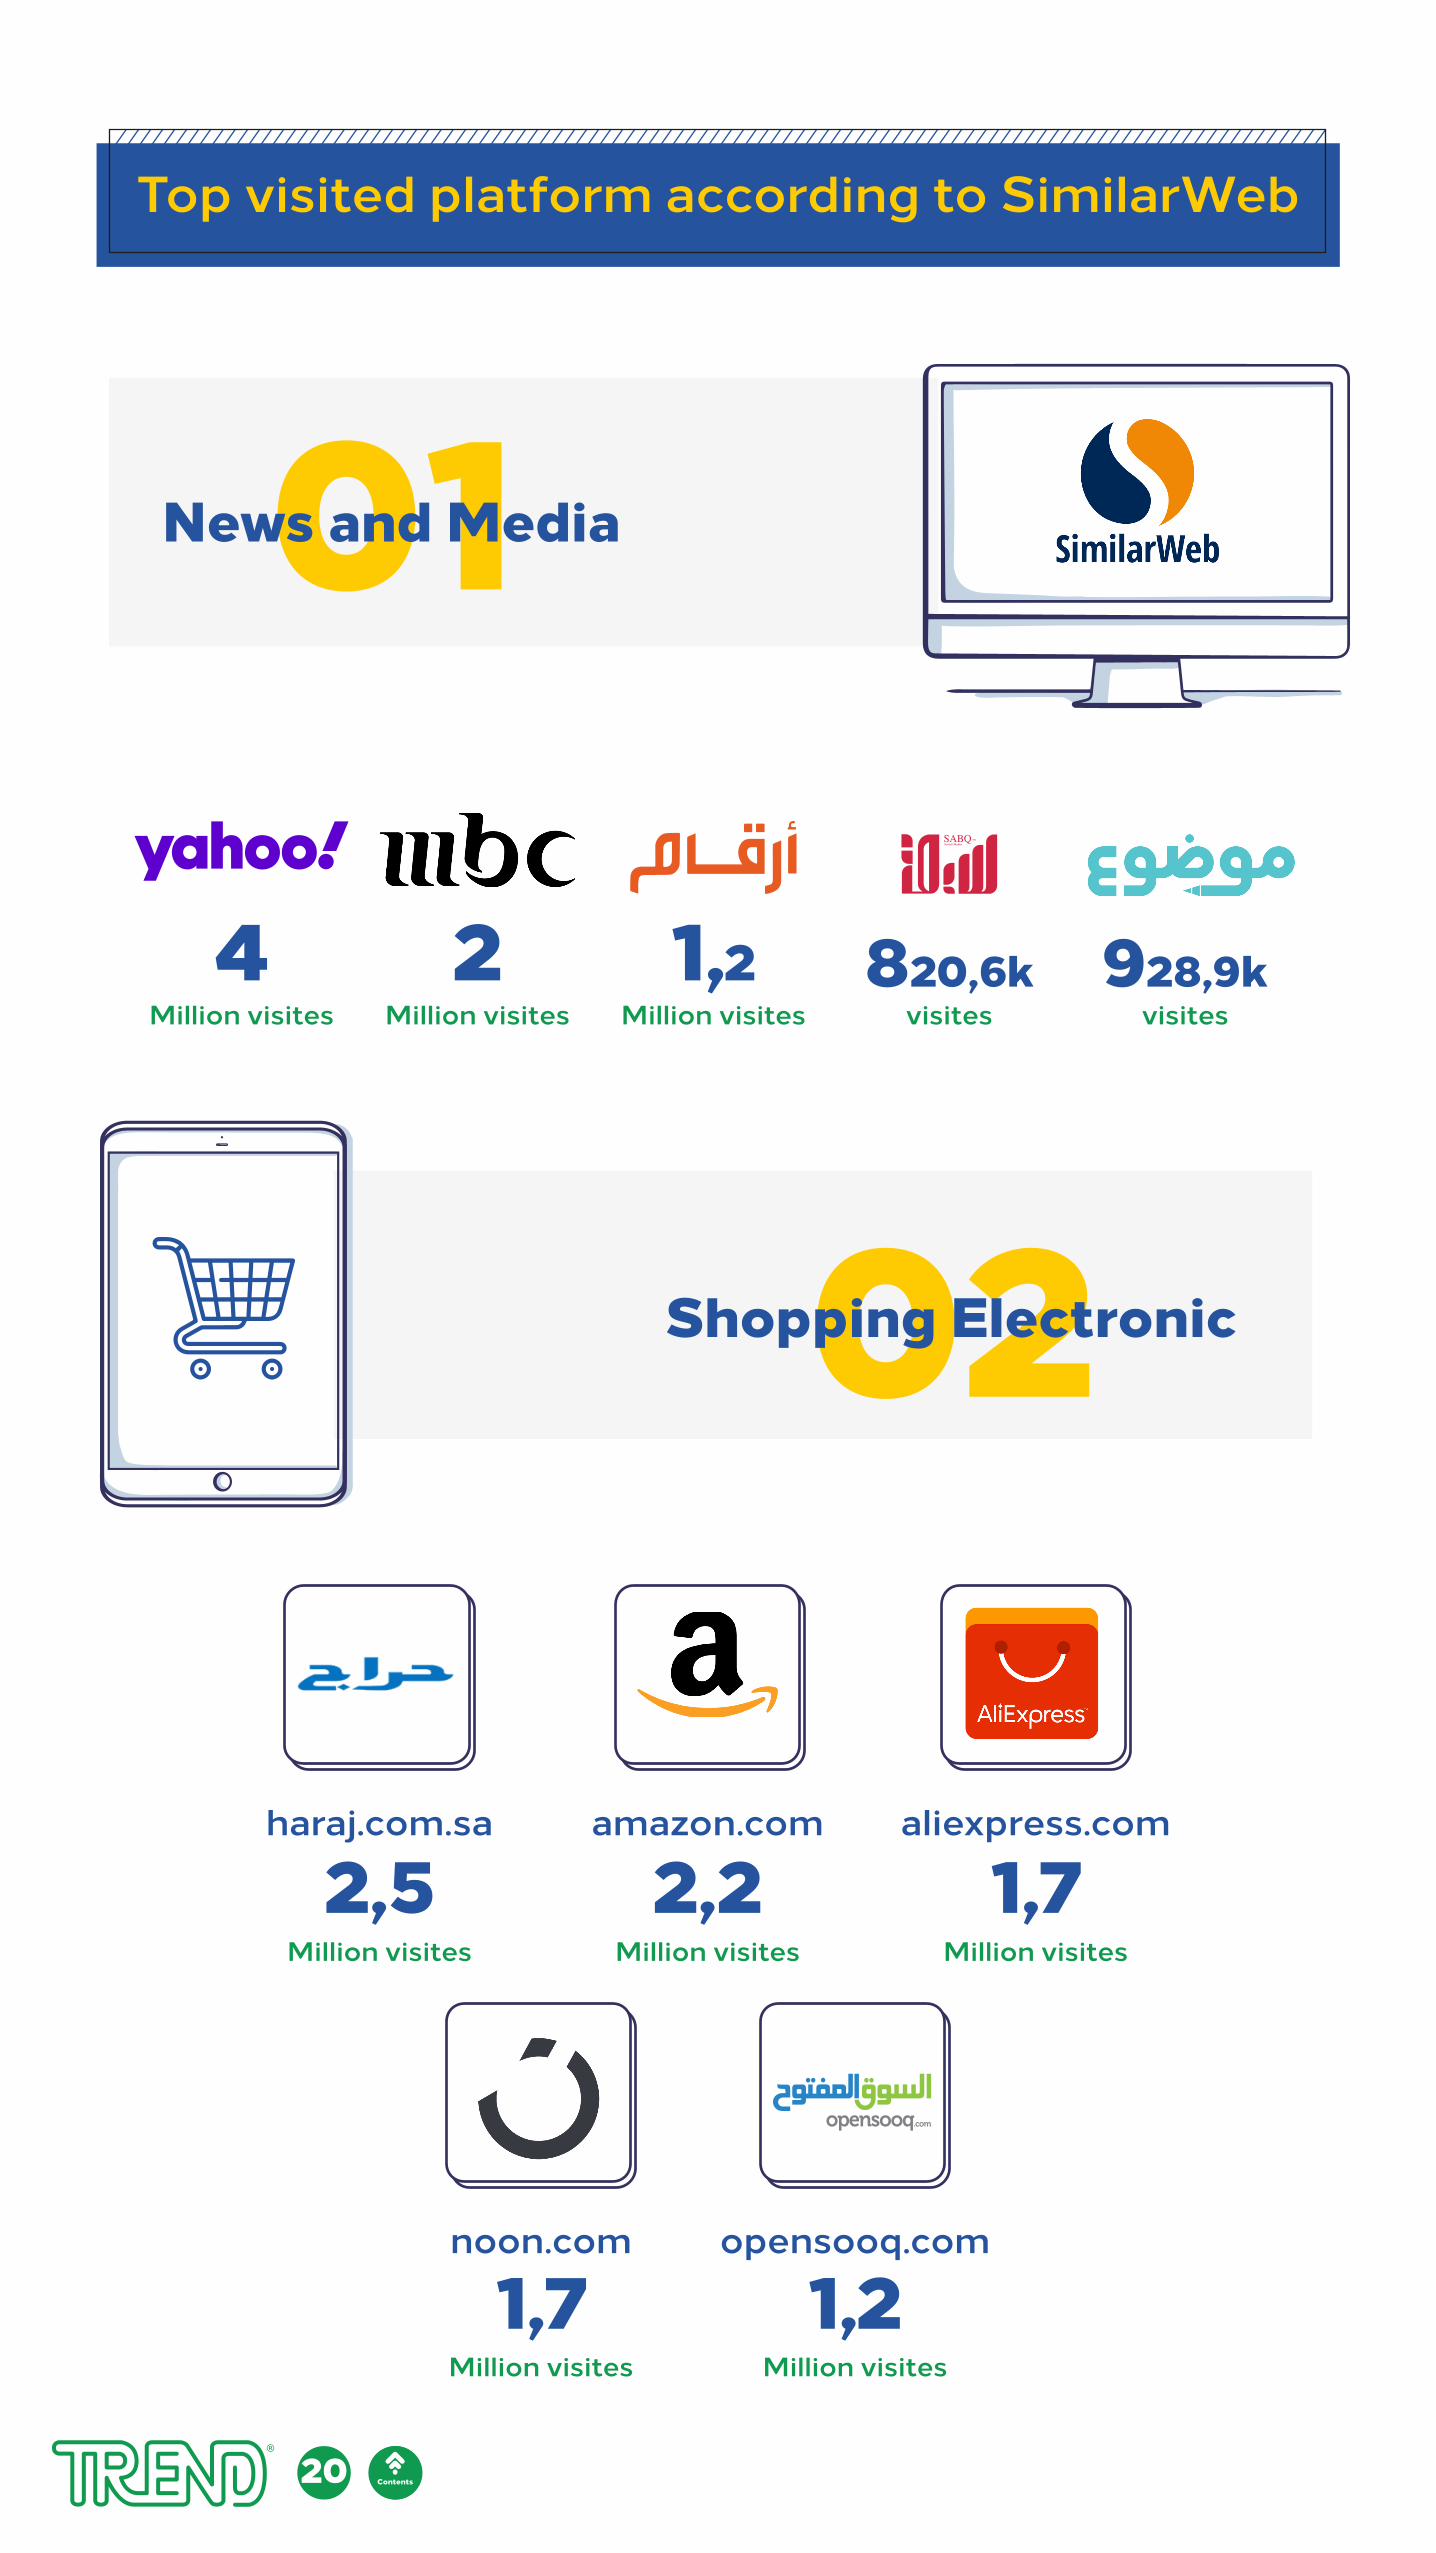
01 Top visited platform according to SimilarWeb
News and Media
02Shopping Electronic
4Million visites
2Million visites
1,2Million visites
928,9kvisites
820,6kvisites
Million visites
2,5haraj.com.sa
Million visites
2,2amazon.com
Million visites
1,7aliexpress.com
Million visites
1,7noon.com
Million visites
1,2opensooq.com
20 Contentsالمحتويات
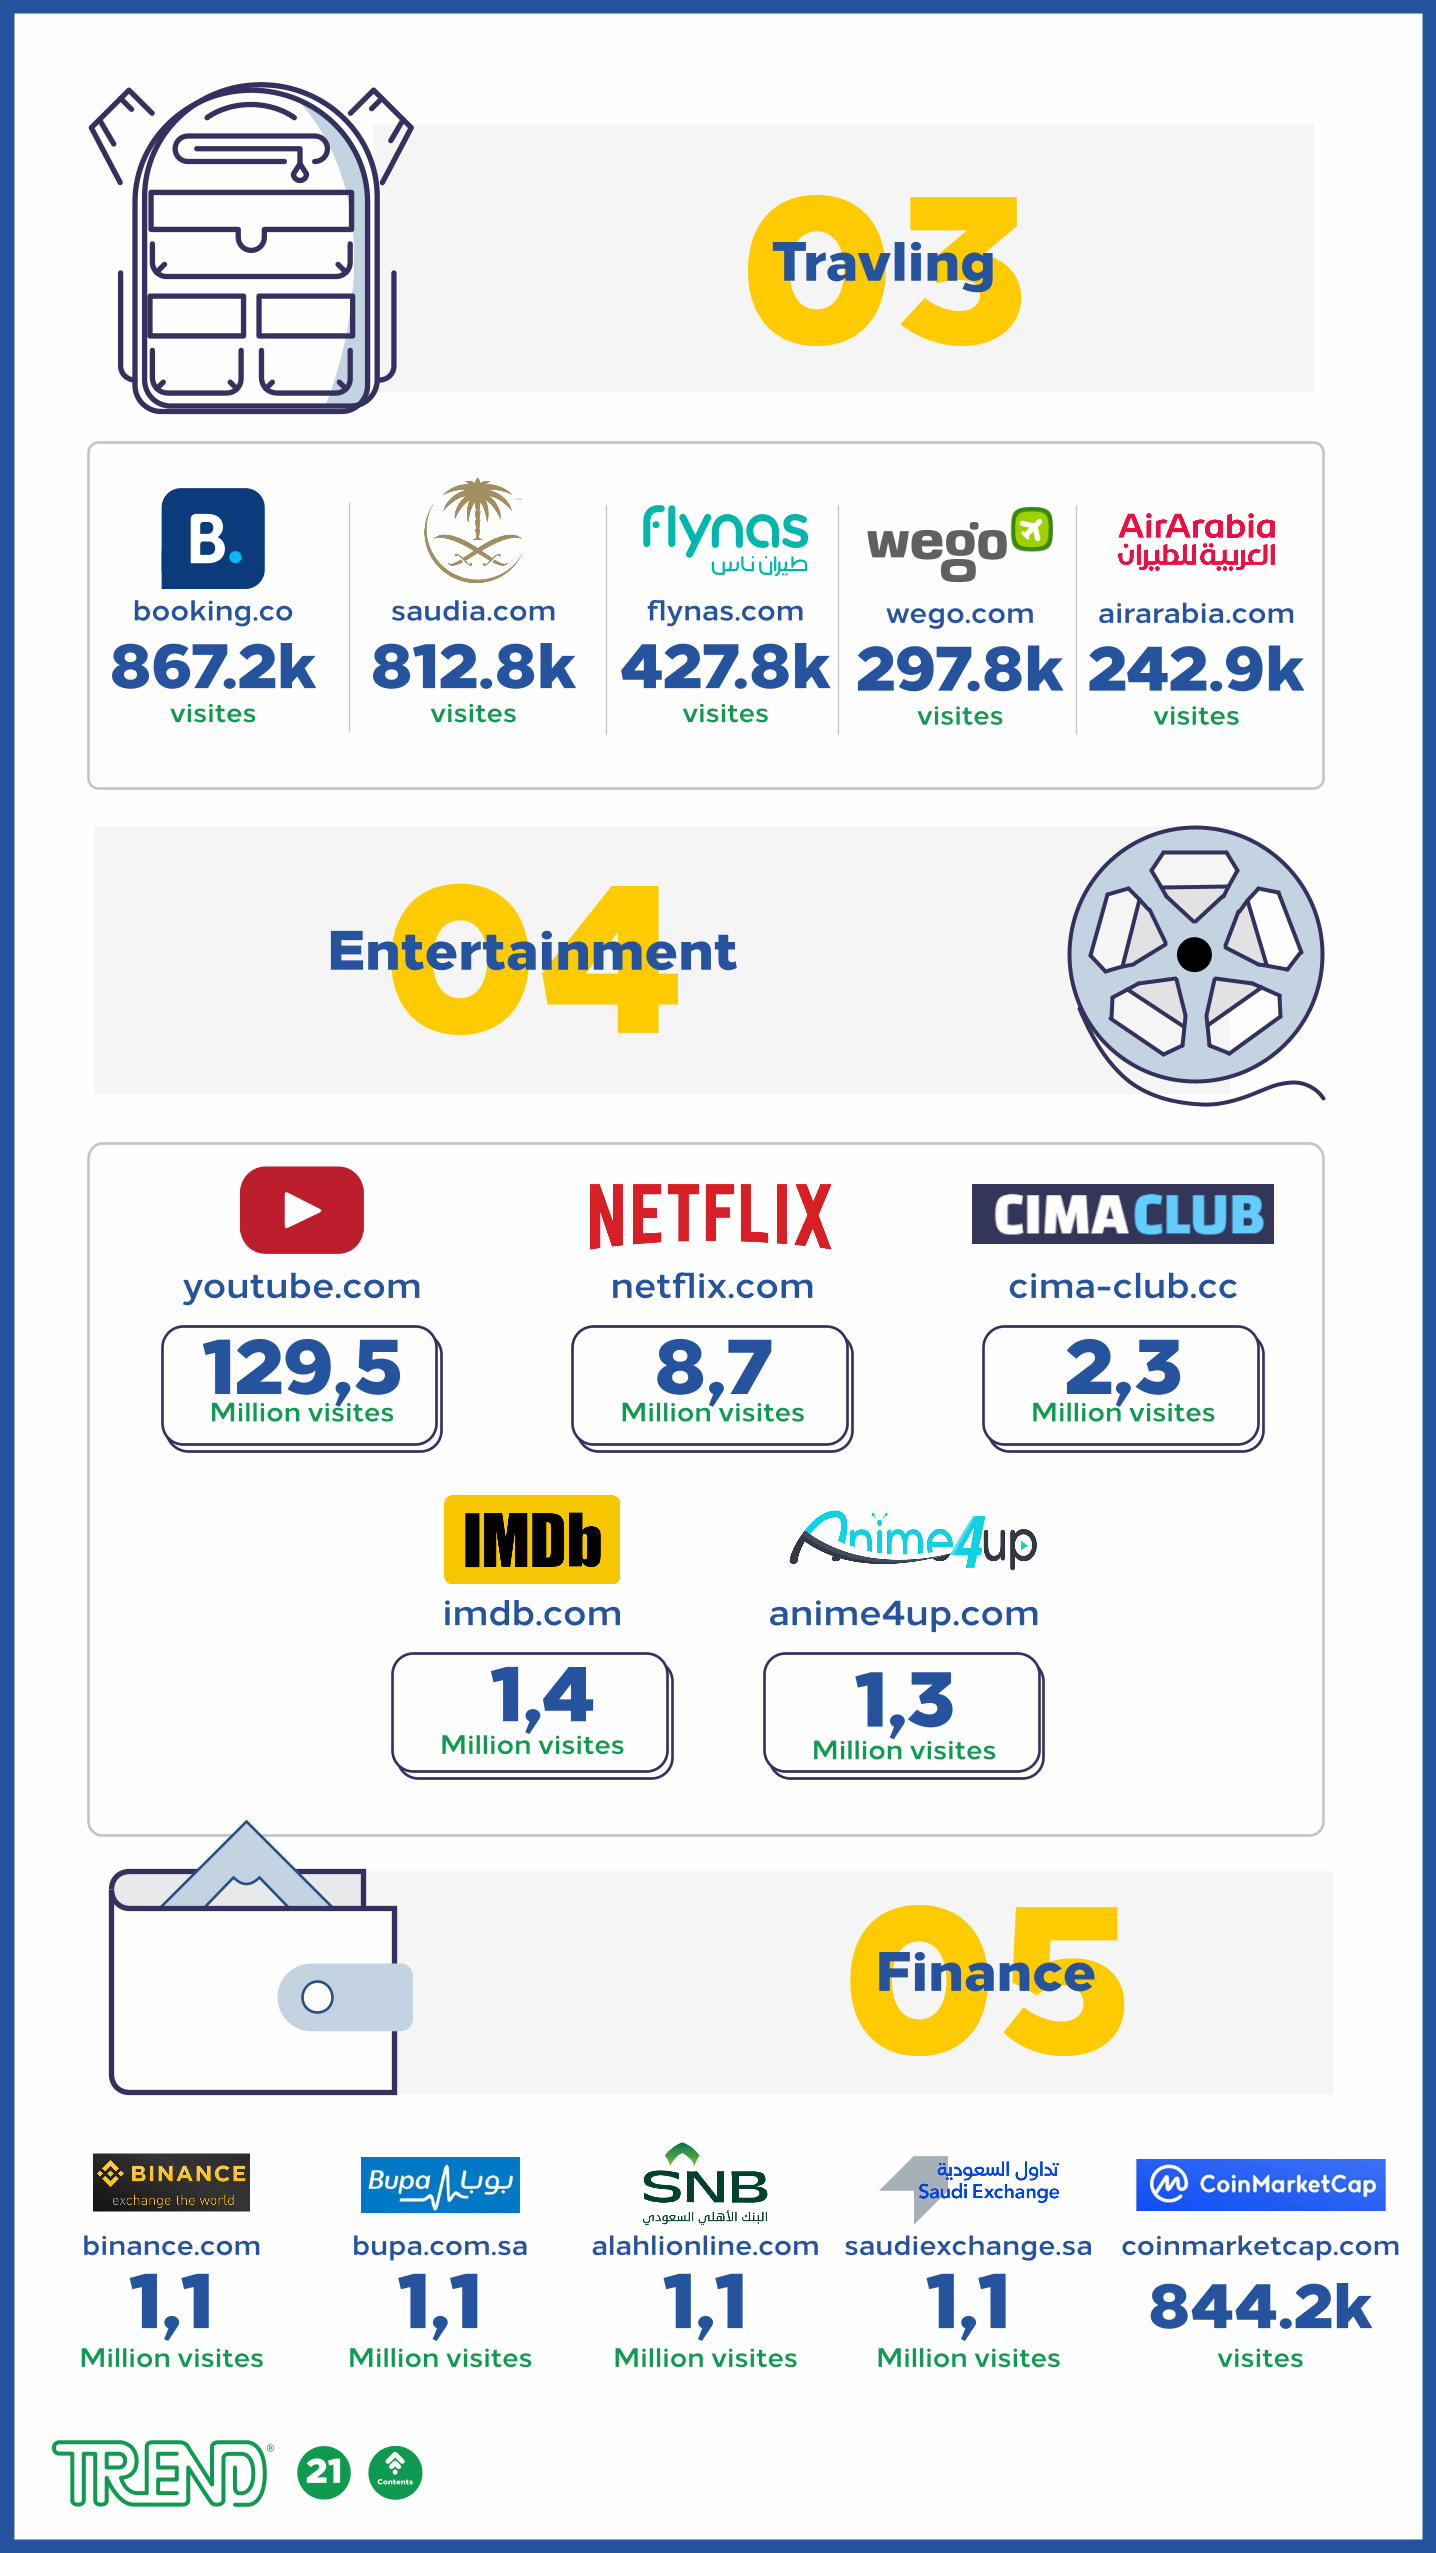
03Travling
04Entertainment
05Finance
867.2kvisites
booking.co
812.8kvisites
saudia.com
427.8kvisites
flynas.com
297.8kvisites
wego.com
242.9kvisites
airarabia.com
Million visites
youtube.com
129,5netflix.com
Million visites8,7
cima-club.cc
Million visites2,3
Million visites
imdb.com
1,4anime4up.com
Million visites1,3
Million visites
saudiexchange.sa
1,1alahlionline.com
Million visites1,1
bupa.com.sa
Million visites1,1
binance.com
Million visites1,1
coinmarketcap.com
visites844.2k
21 Contentsالمحتويات
22 المحتويات
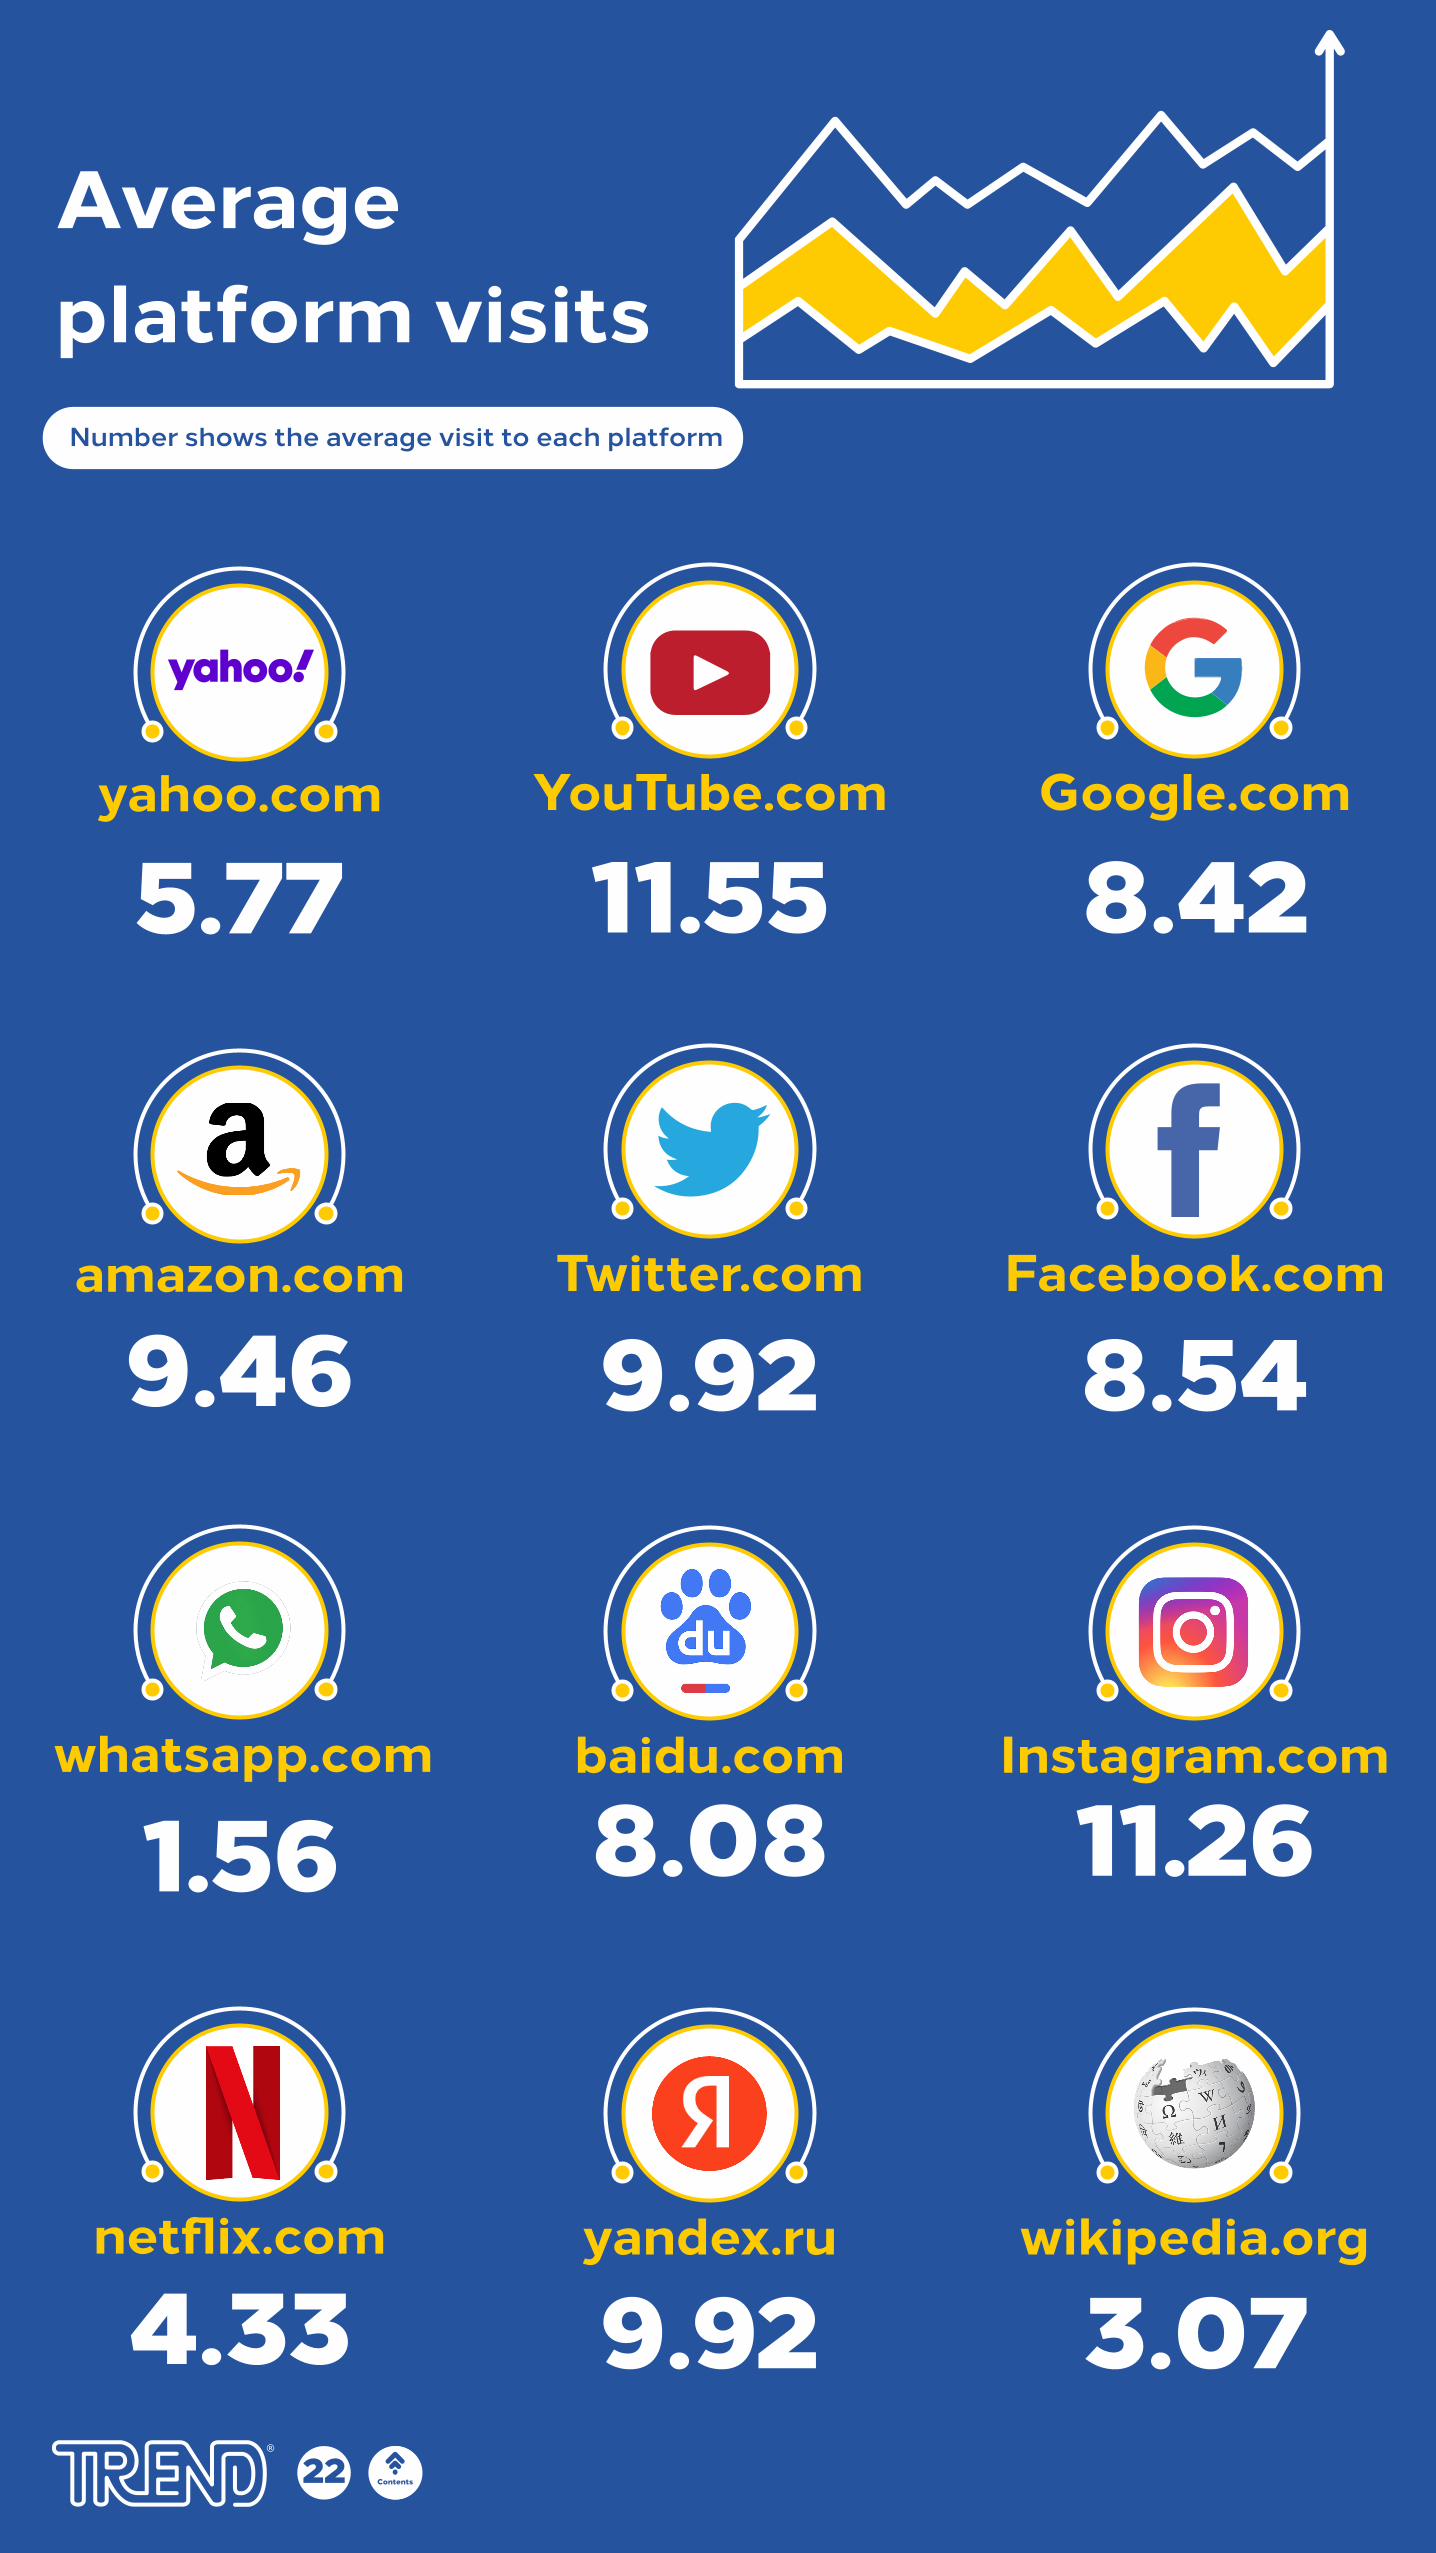
Averageplatform visits
Google.com
8.4211.55YouTube.com
Facebook.com
8.549.92Twitter.com
Instagram.com
11.268.08baidu.com
wikipedia.org
3.079.92yandex.ru
yahoo.com
5.77
1.56whatsapp.com
amazon.com
9.46
4.33netflix.com
Number shows the average visit to each platform
Contents
23 المحتويات
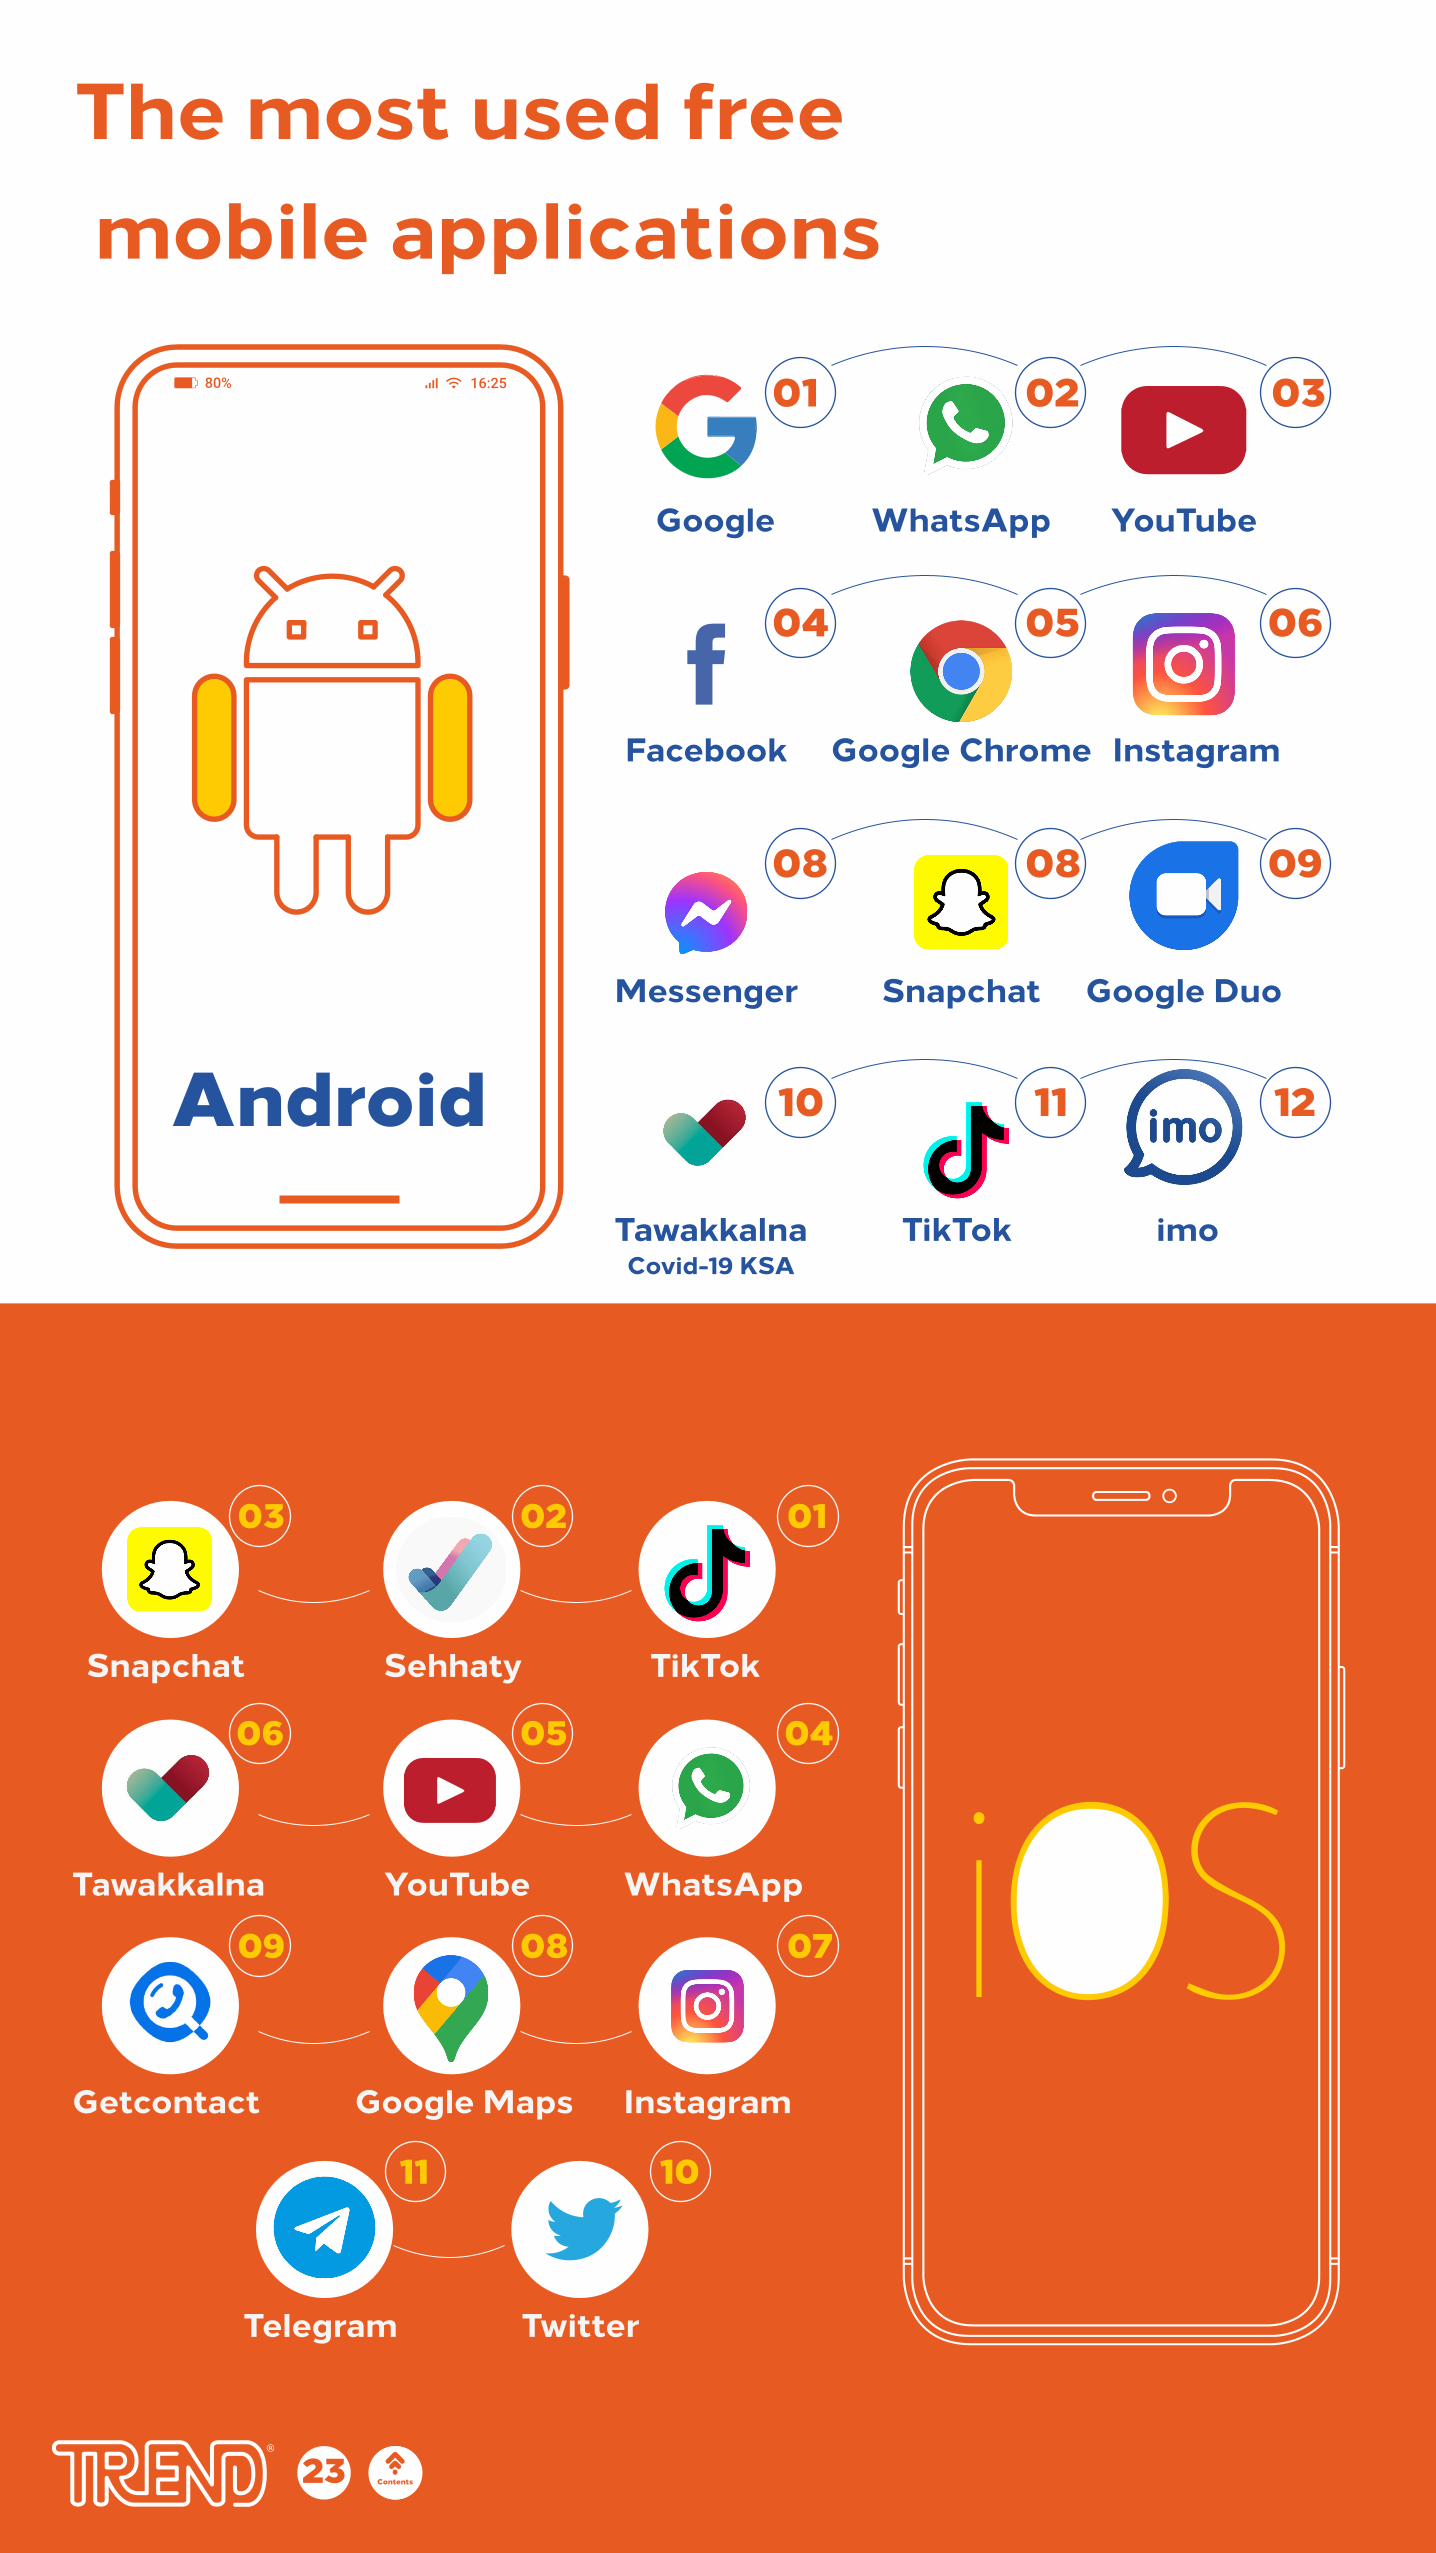
The most used free mobile applications
Android
030201
Google Chrome
060504
090808
Snapchat
Messenger
TawakkalnaCovid-19 KSA
TikTok
YouTube
Google Duo
imo
121110
TikTok
Sehhaty Snapchat
WhatsApp YouTubeTawakkalna
Instagram Google MapsGetcontact
Twitter Telegram
010203
040506
0708
1011
09
Contents
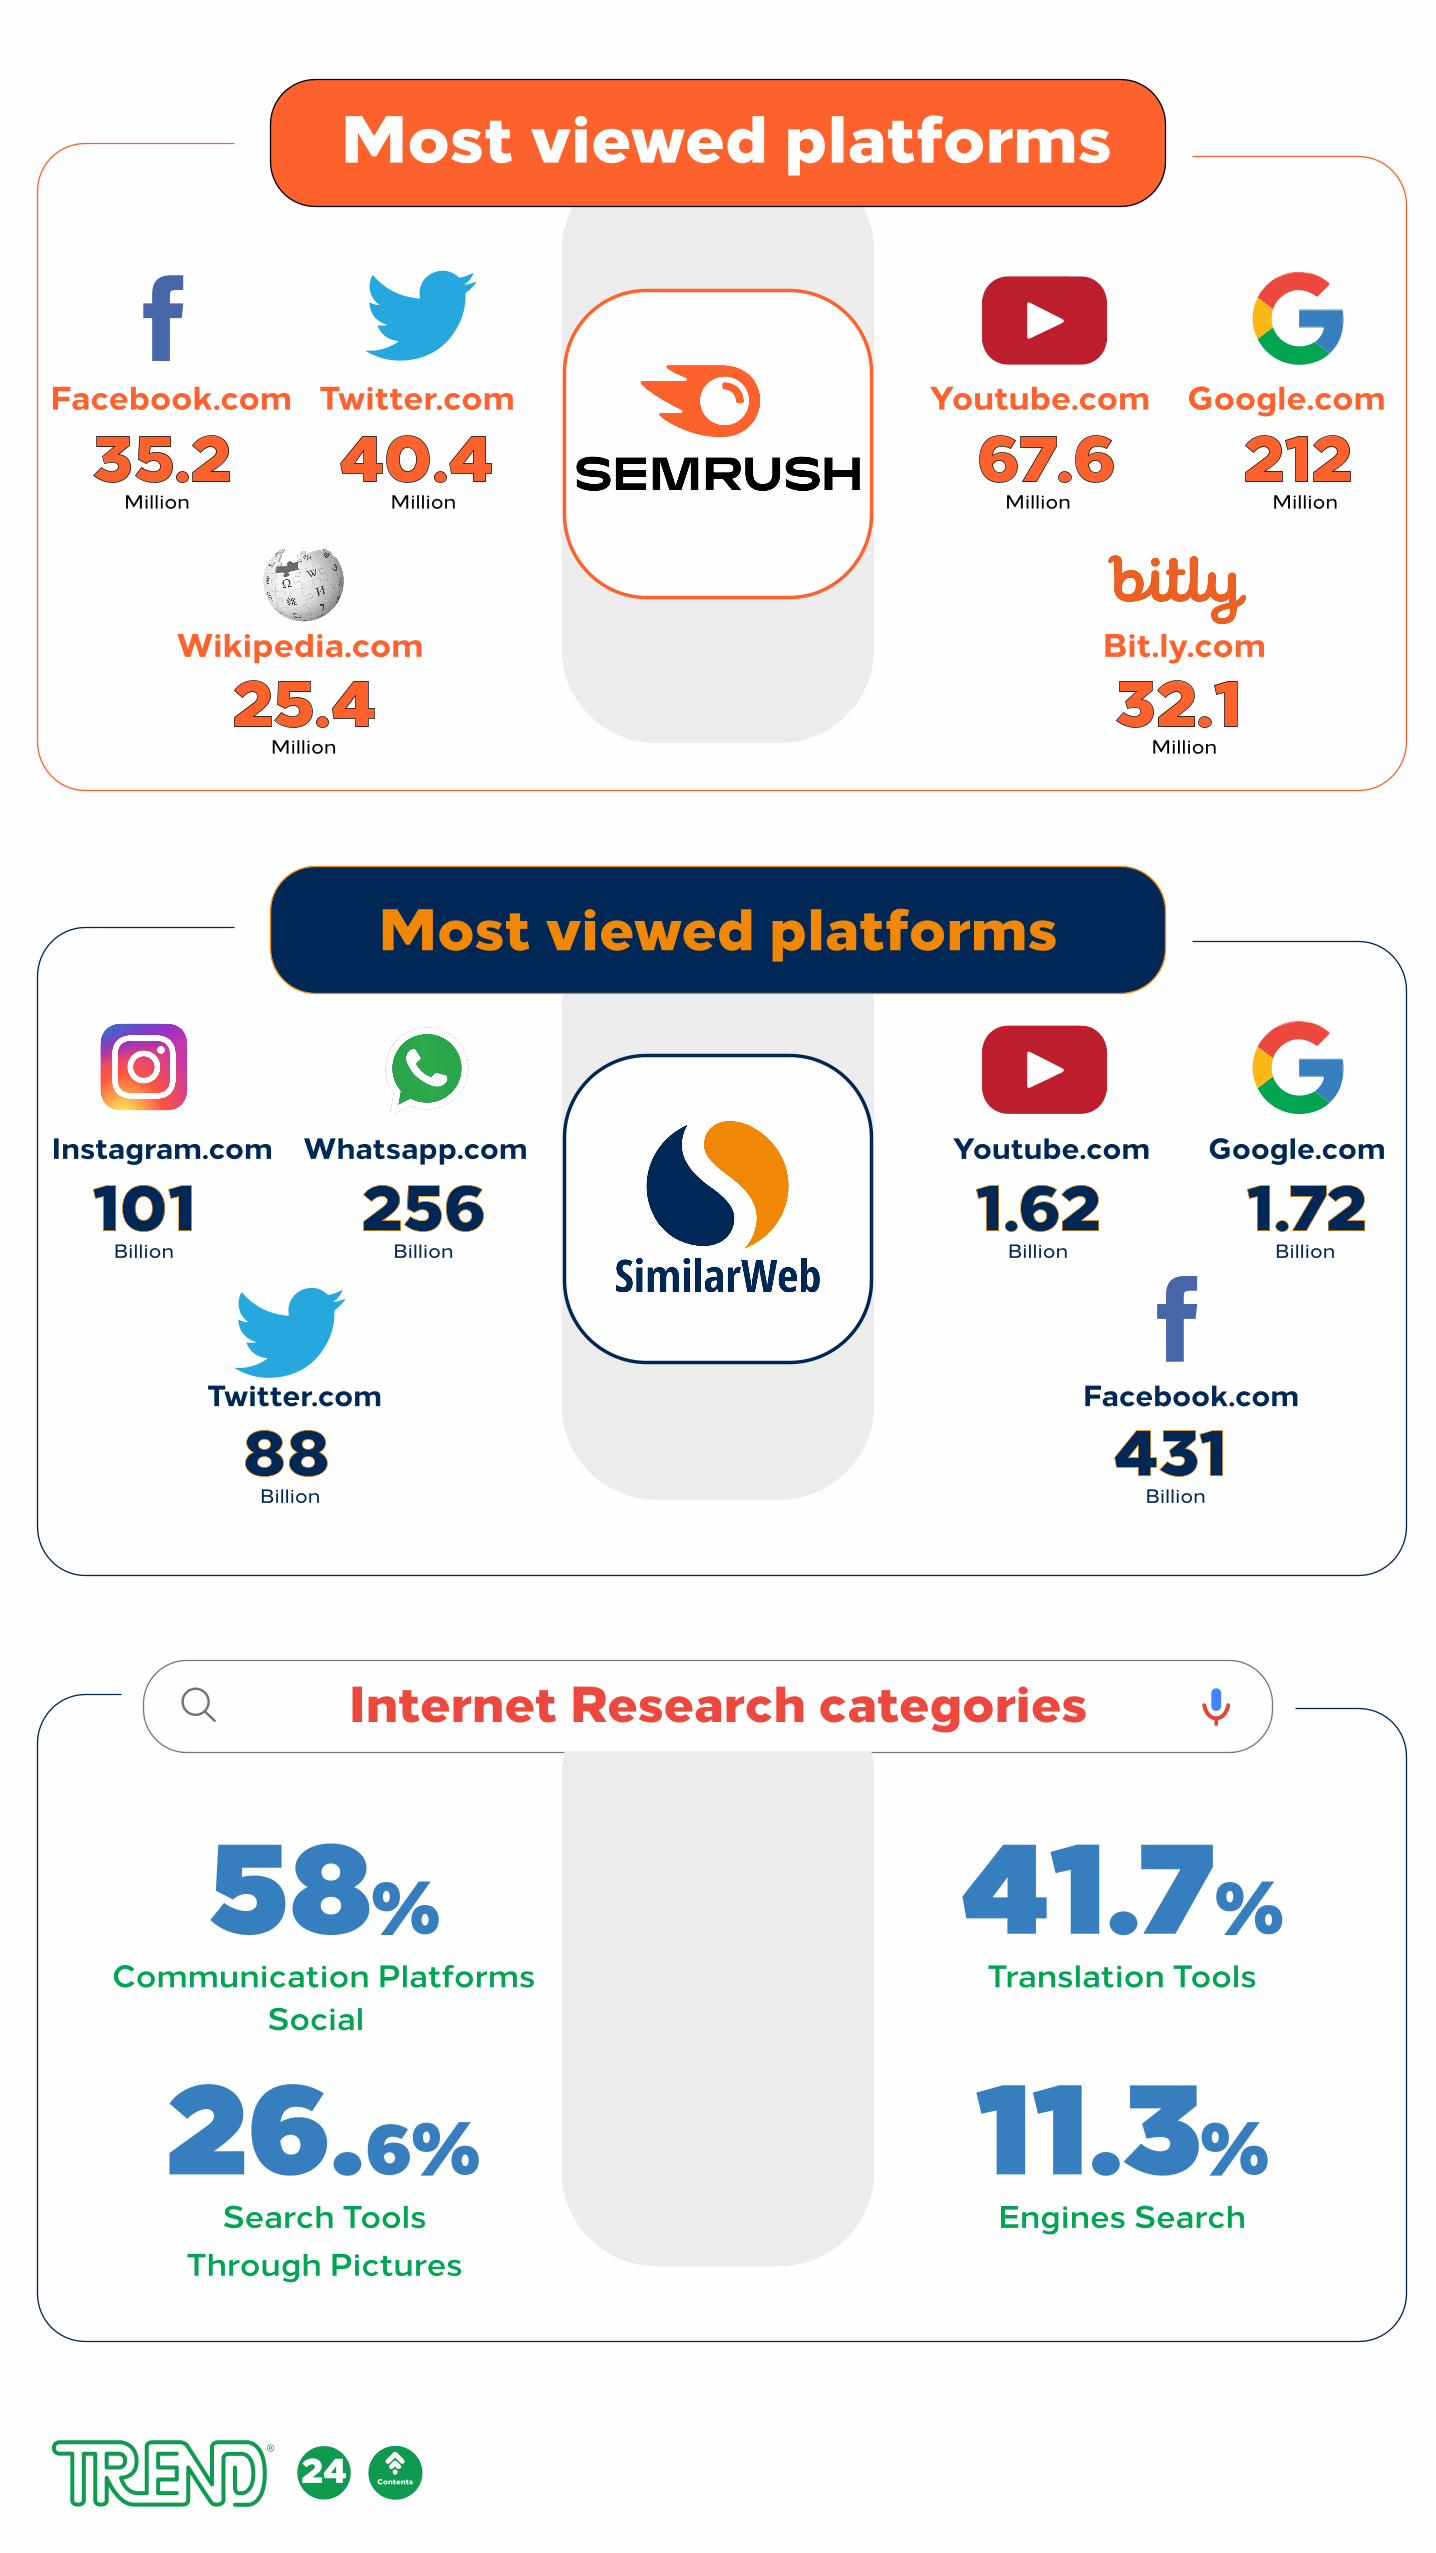
Google.comYoutube.com
Bit.ly.com
212 67.6Million
32.1Million
Million
Twitter.comFacebook.com
40.4 35.2MillionMillion
Google.comYoutube.com
Facebook.com
1.721.62Billion
431Billion
Billion
Whatsapp.comInstagram.com
Twitter.com
256101Billion
88Billion
Billion
Wikipedia.com
25.4Million
Most viewed platforms
Most viewed platforms
Search ToolsThrough Pictures
Internet Research categories
24 المحتويات
Communication PlatformsSocial
58%
26.6%
41.7%
Engines Search11.3%
Translation Tools
Contents
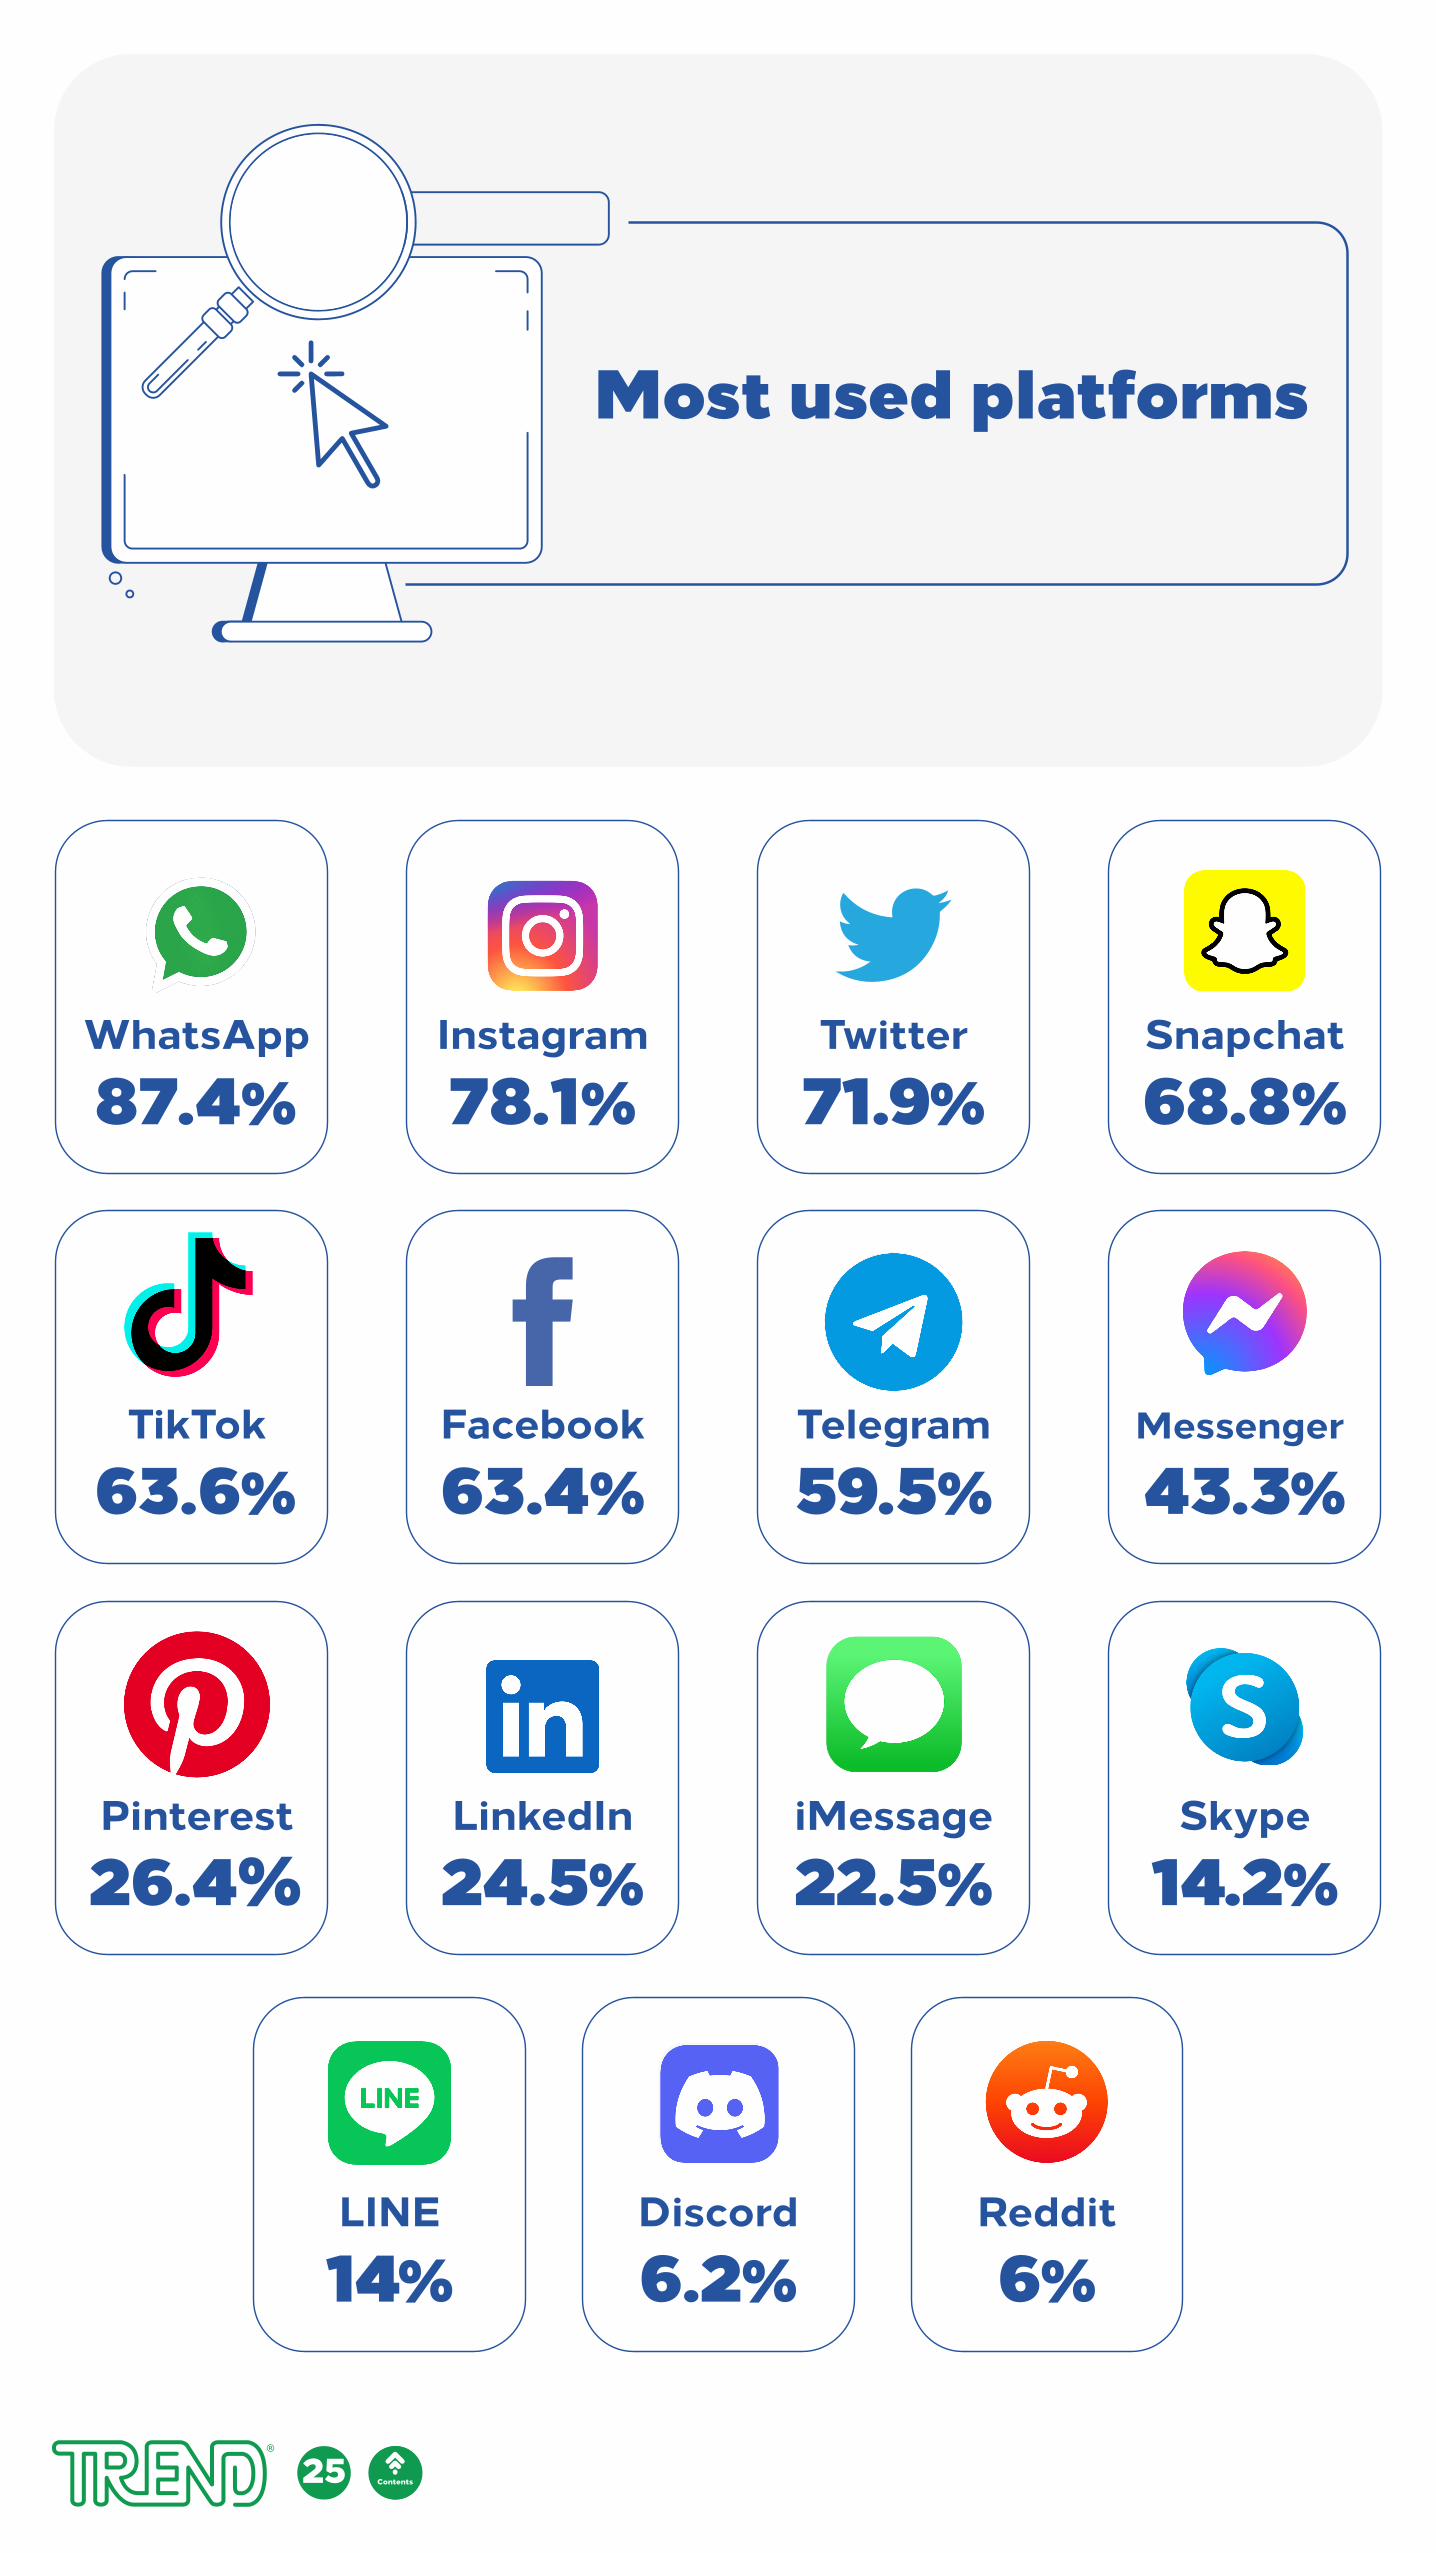
Most used platforms
87.4%
TikTok
63.6%
26.4%
78.1%
63.4%
24.5%
71.9%
Telegram
59.5%
iMessage
22.5%
Snapchat
68.8%
Messenger
43.3%
Skype
14.2%
LINE
14%Discord
6.2%Reddit
6%
25 Contentsالمحتويات
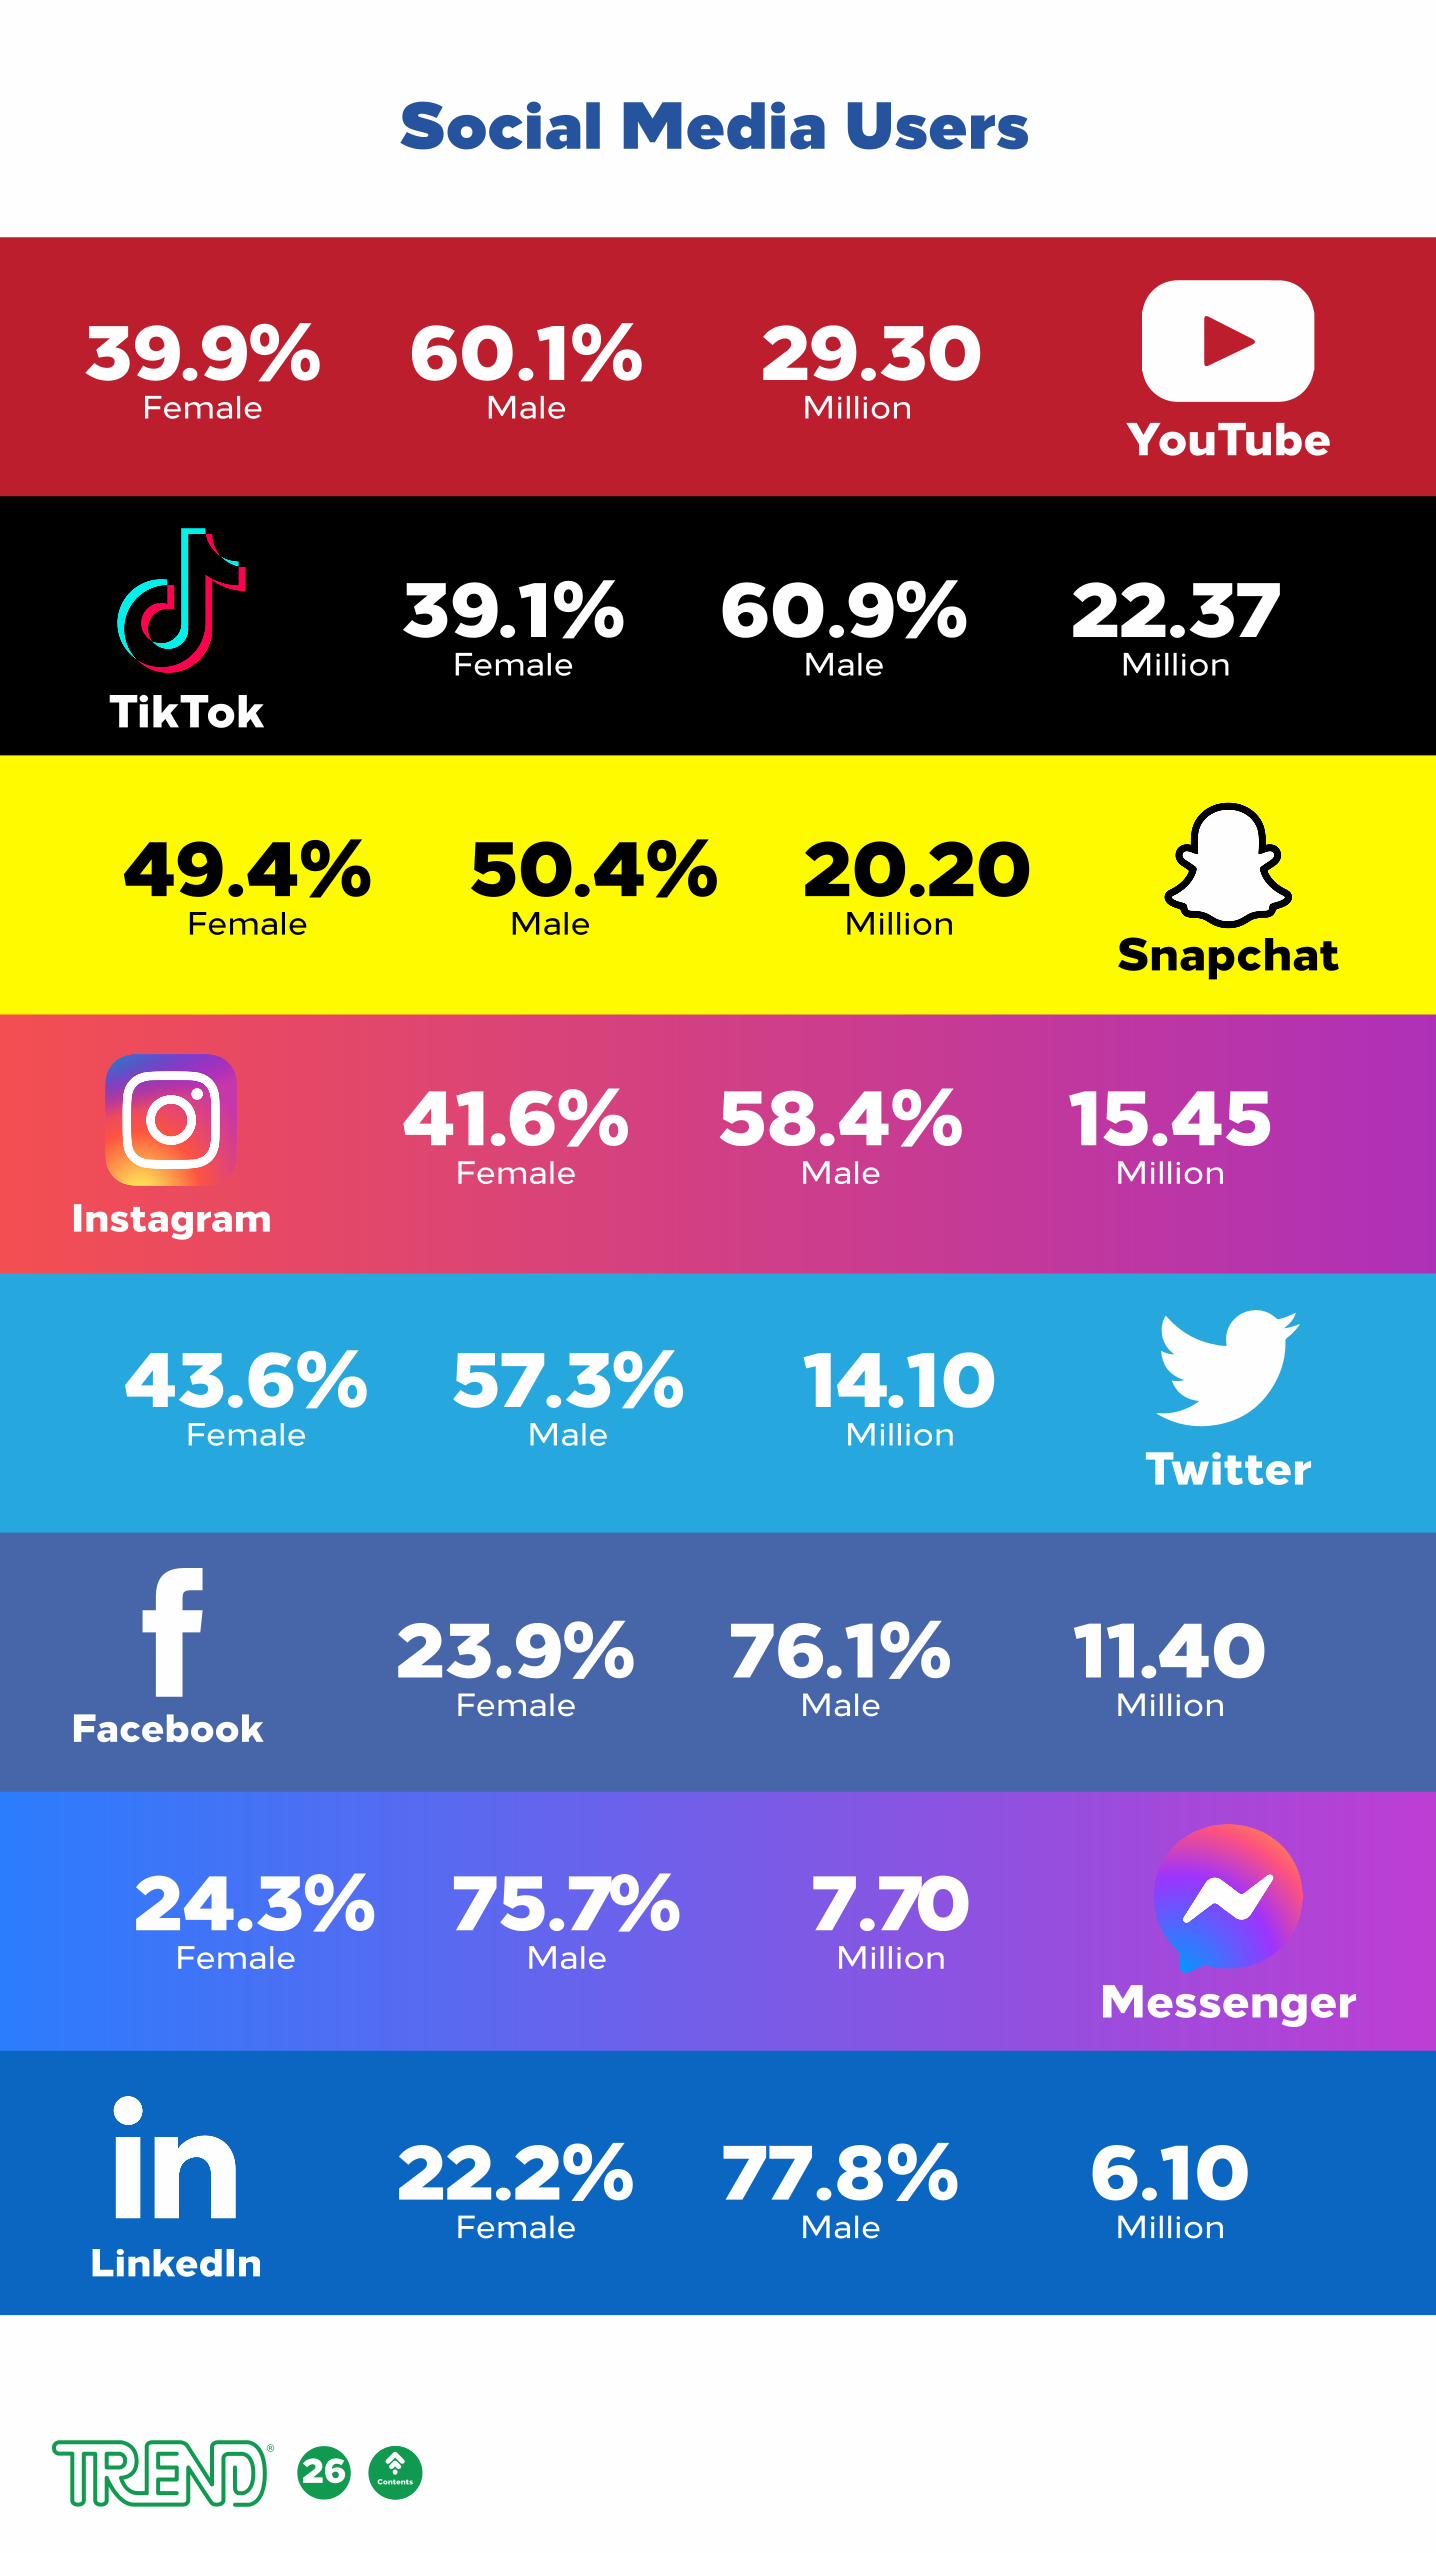
Social Media Users
YouTube
TikTok
Messenger
Snapchat
29.30Million
60.1%Male
39.9%Female
22.37Million
60.9%Male
39.1%Female
15.45Million
58.4%Male
41.6%Female
11.40Million
76.1%Male
23.9%Female
6.10Million
77.8%Male
22.2%Female
14.10Million
57.3%Male
43.6%Female
7.70Million
75.7%Male
24.3%Female
20.20Million
50.4%Male
49.4%Female
26 Contentsالمحتويات
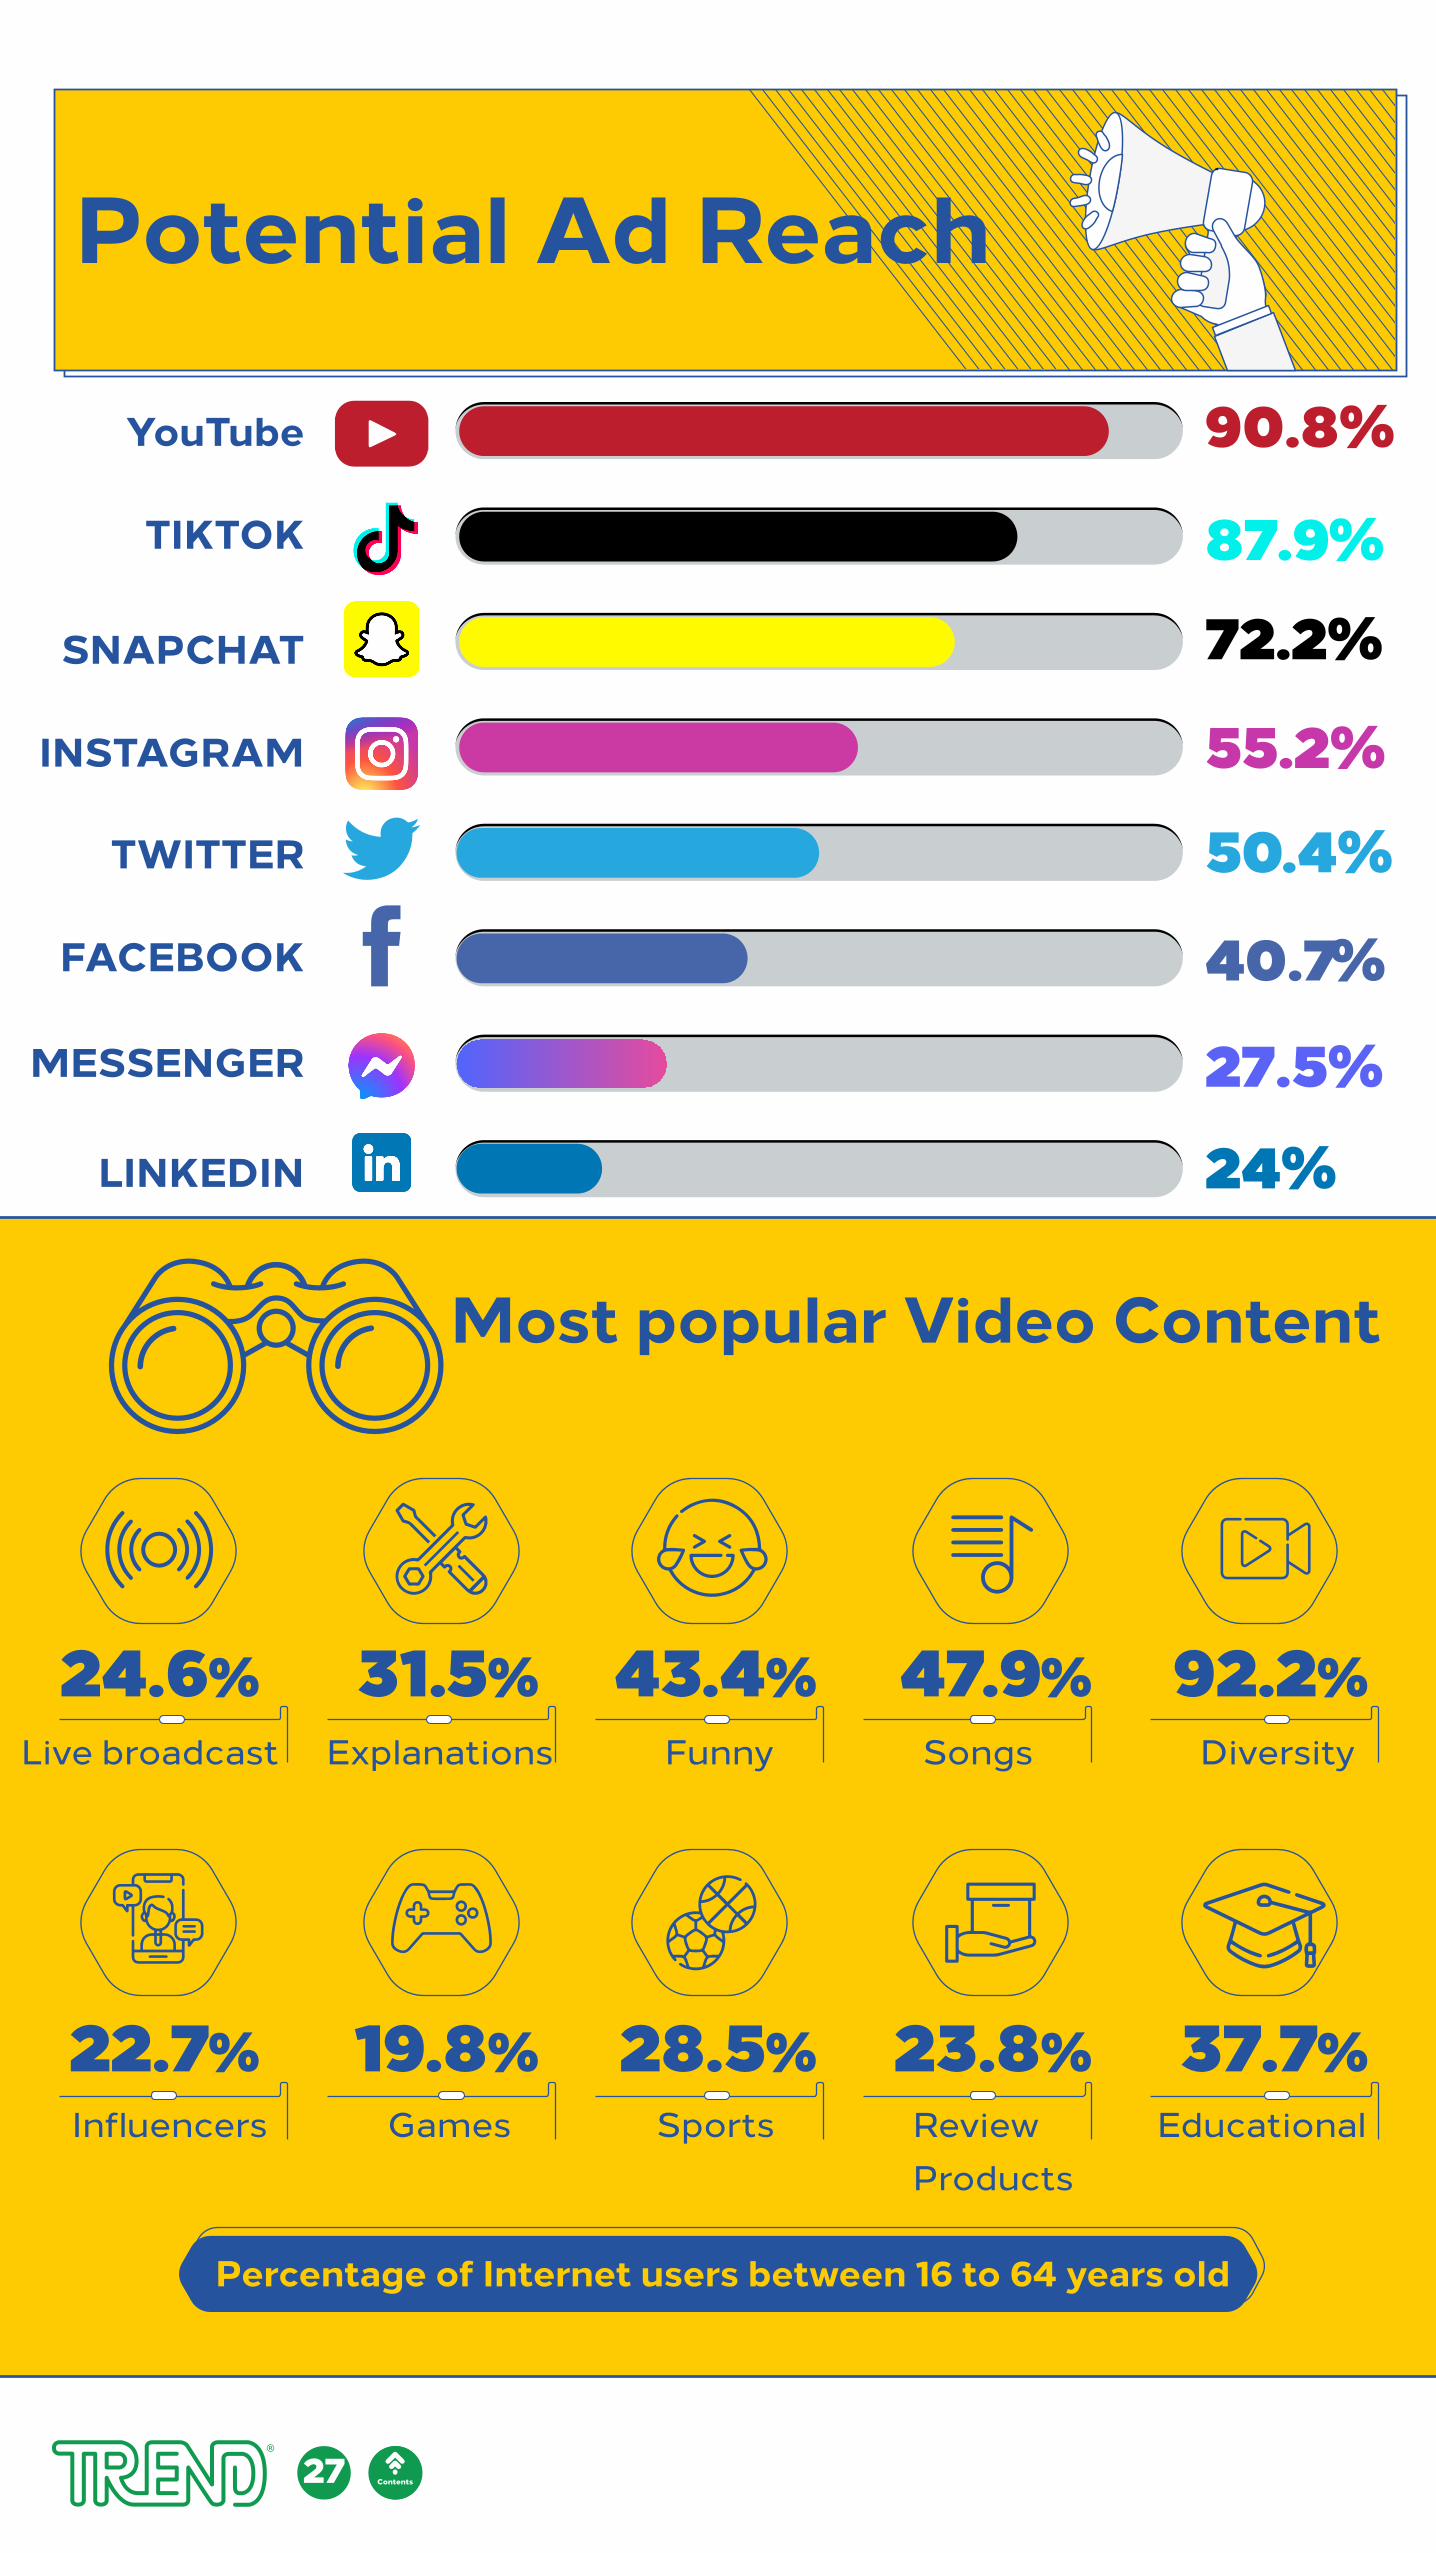
YouTube
TIKTOK
SNAPCHAT
MESSENGER
90.8%
87.9%72.2%
55.2%
50.4%
40.7%
27.5%24%
Potential Ad Reach
27 المحتويات
Most popular Video Content
DiversitySongsFunnyExplanationsLive broadcast
EducationalReviewProducts
SportsGamesInfluencers
92.2%47.9%43.4%31.5%24.6%
37.7%23.8%28.5%19.8%22.7%
Percentage of Internet users between 16 to 64 years old
Contents
Paymentsand
e-commerce
29 المحتويات
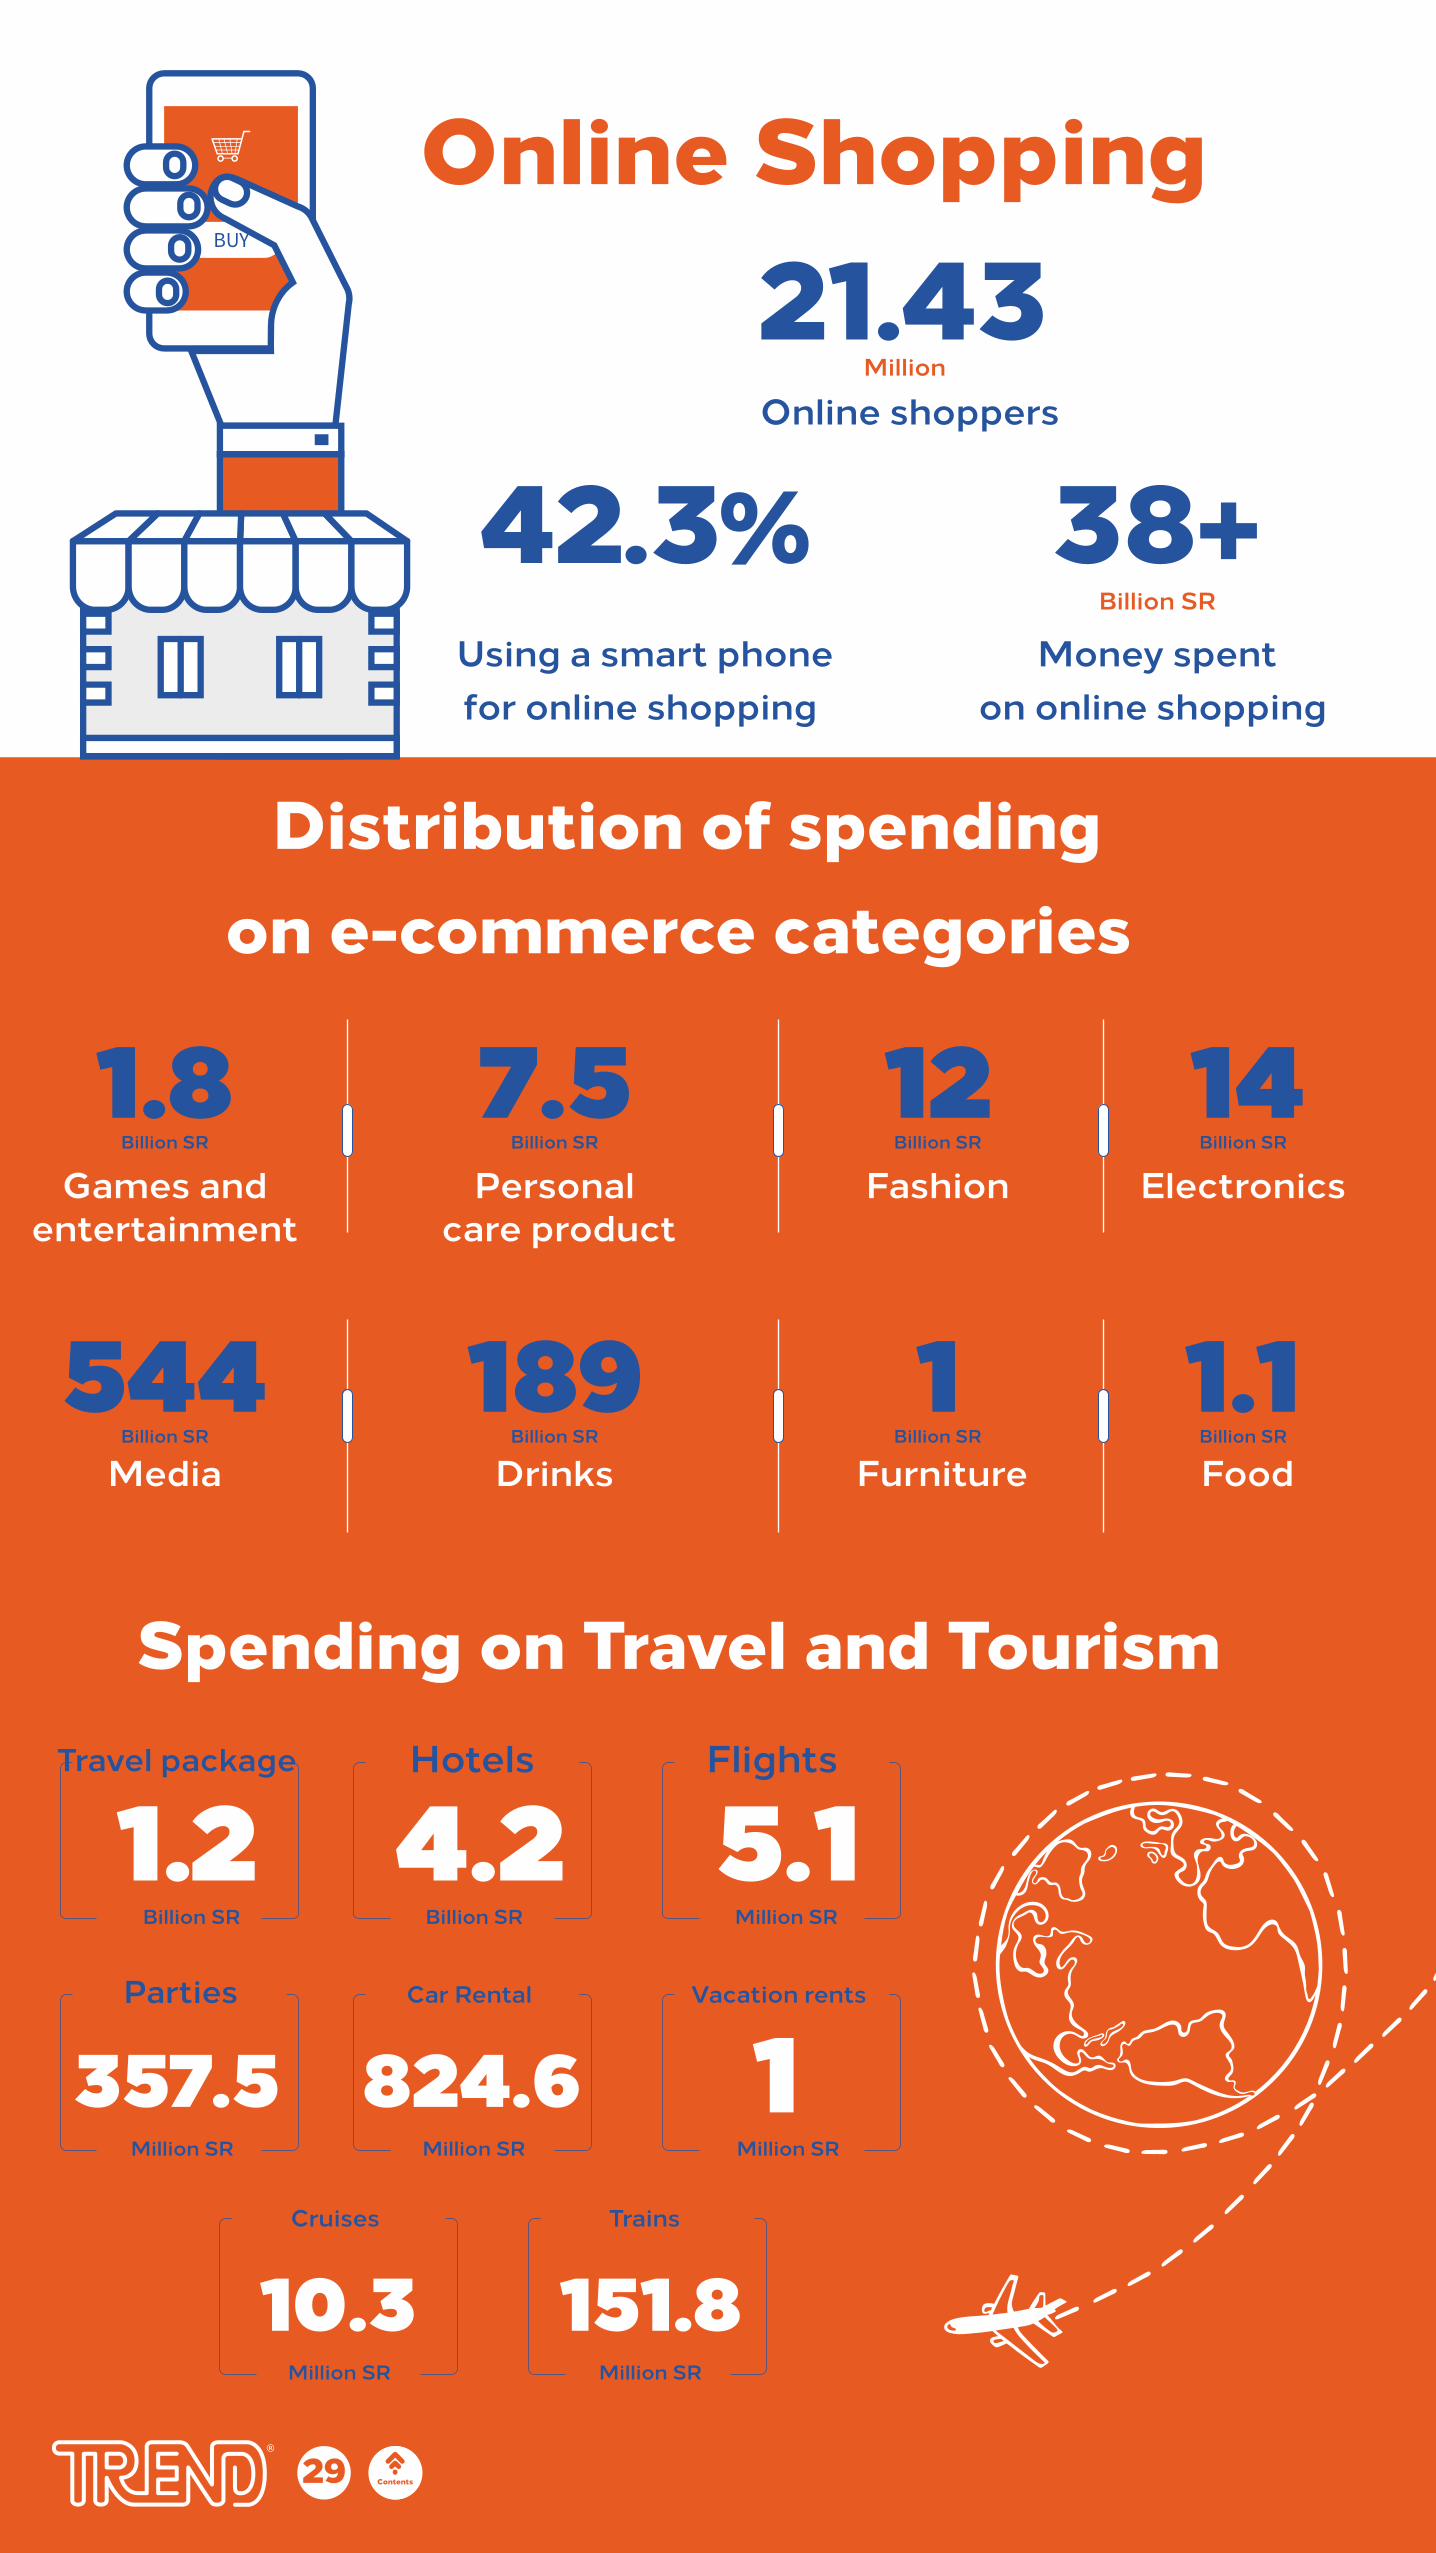
Online Shopping
Distribution of spendingon e-commerce categories
Spending on Travel and Tourism
21.43Million
Online shoppers
38+Billion SR
Billion SR
Money spenton online shopping
42.3%Using a smart phonefor online shopping
ElectronicsFashionGames and entertainment
Personal care product
Food FurnitureMedia Drinks
14Billion SR12
Billion SR7.5
Billion SR1.8
Billion SR1.1
Billion SR1
5.1
189Billion SR Billion SR
544
Flights
Million SR
4.2Hotels
Billion SR
1.2Travel package
Billion SR
1Vacation rents Car Rental
Million SR
824.6Million SRMillion SR
151.8Trains Cruises
10.3Million SR Million SR
357.5Parties
Contents
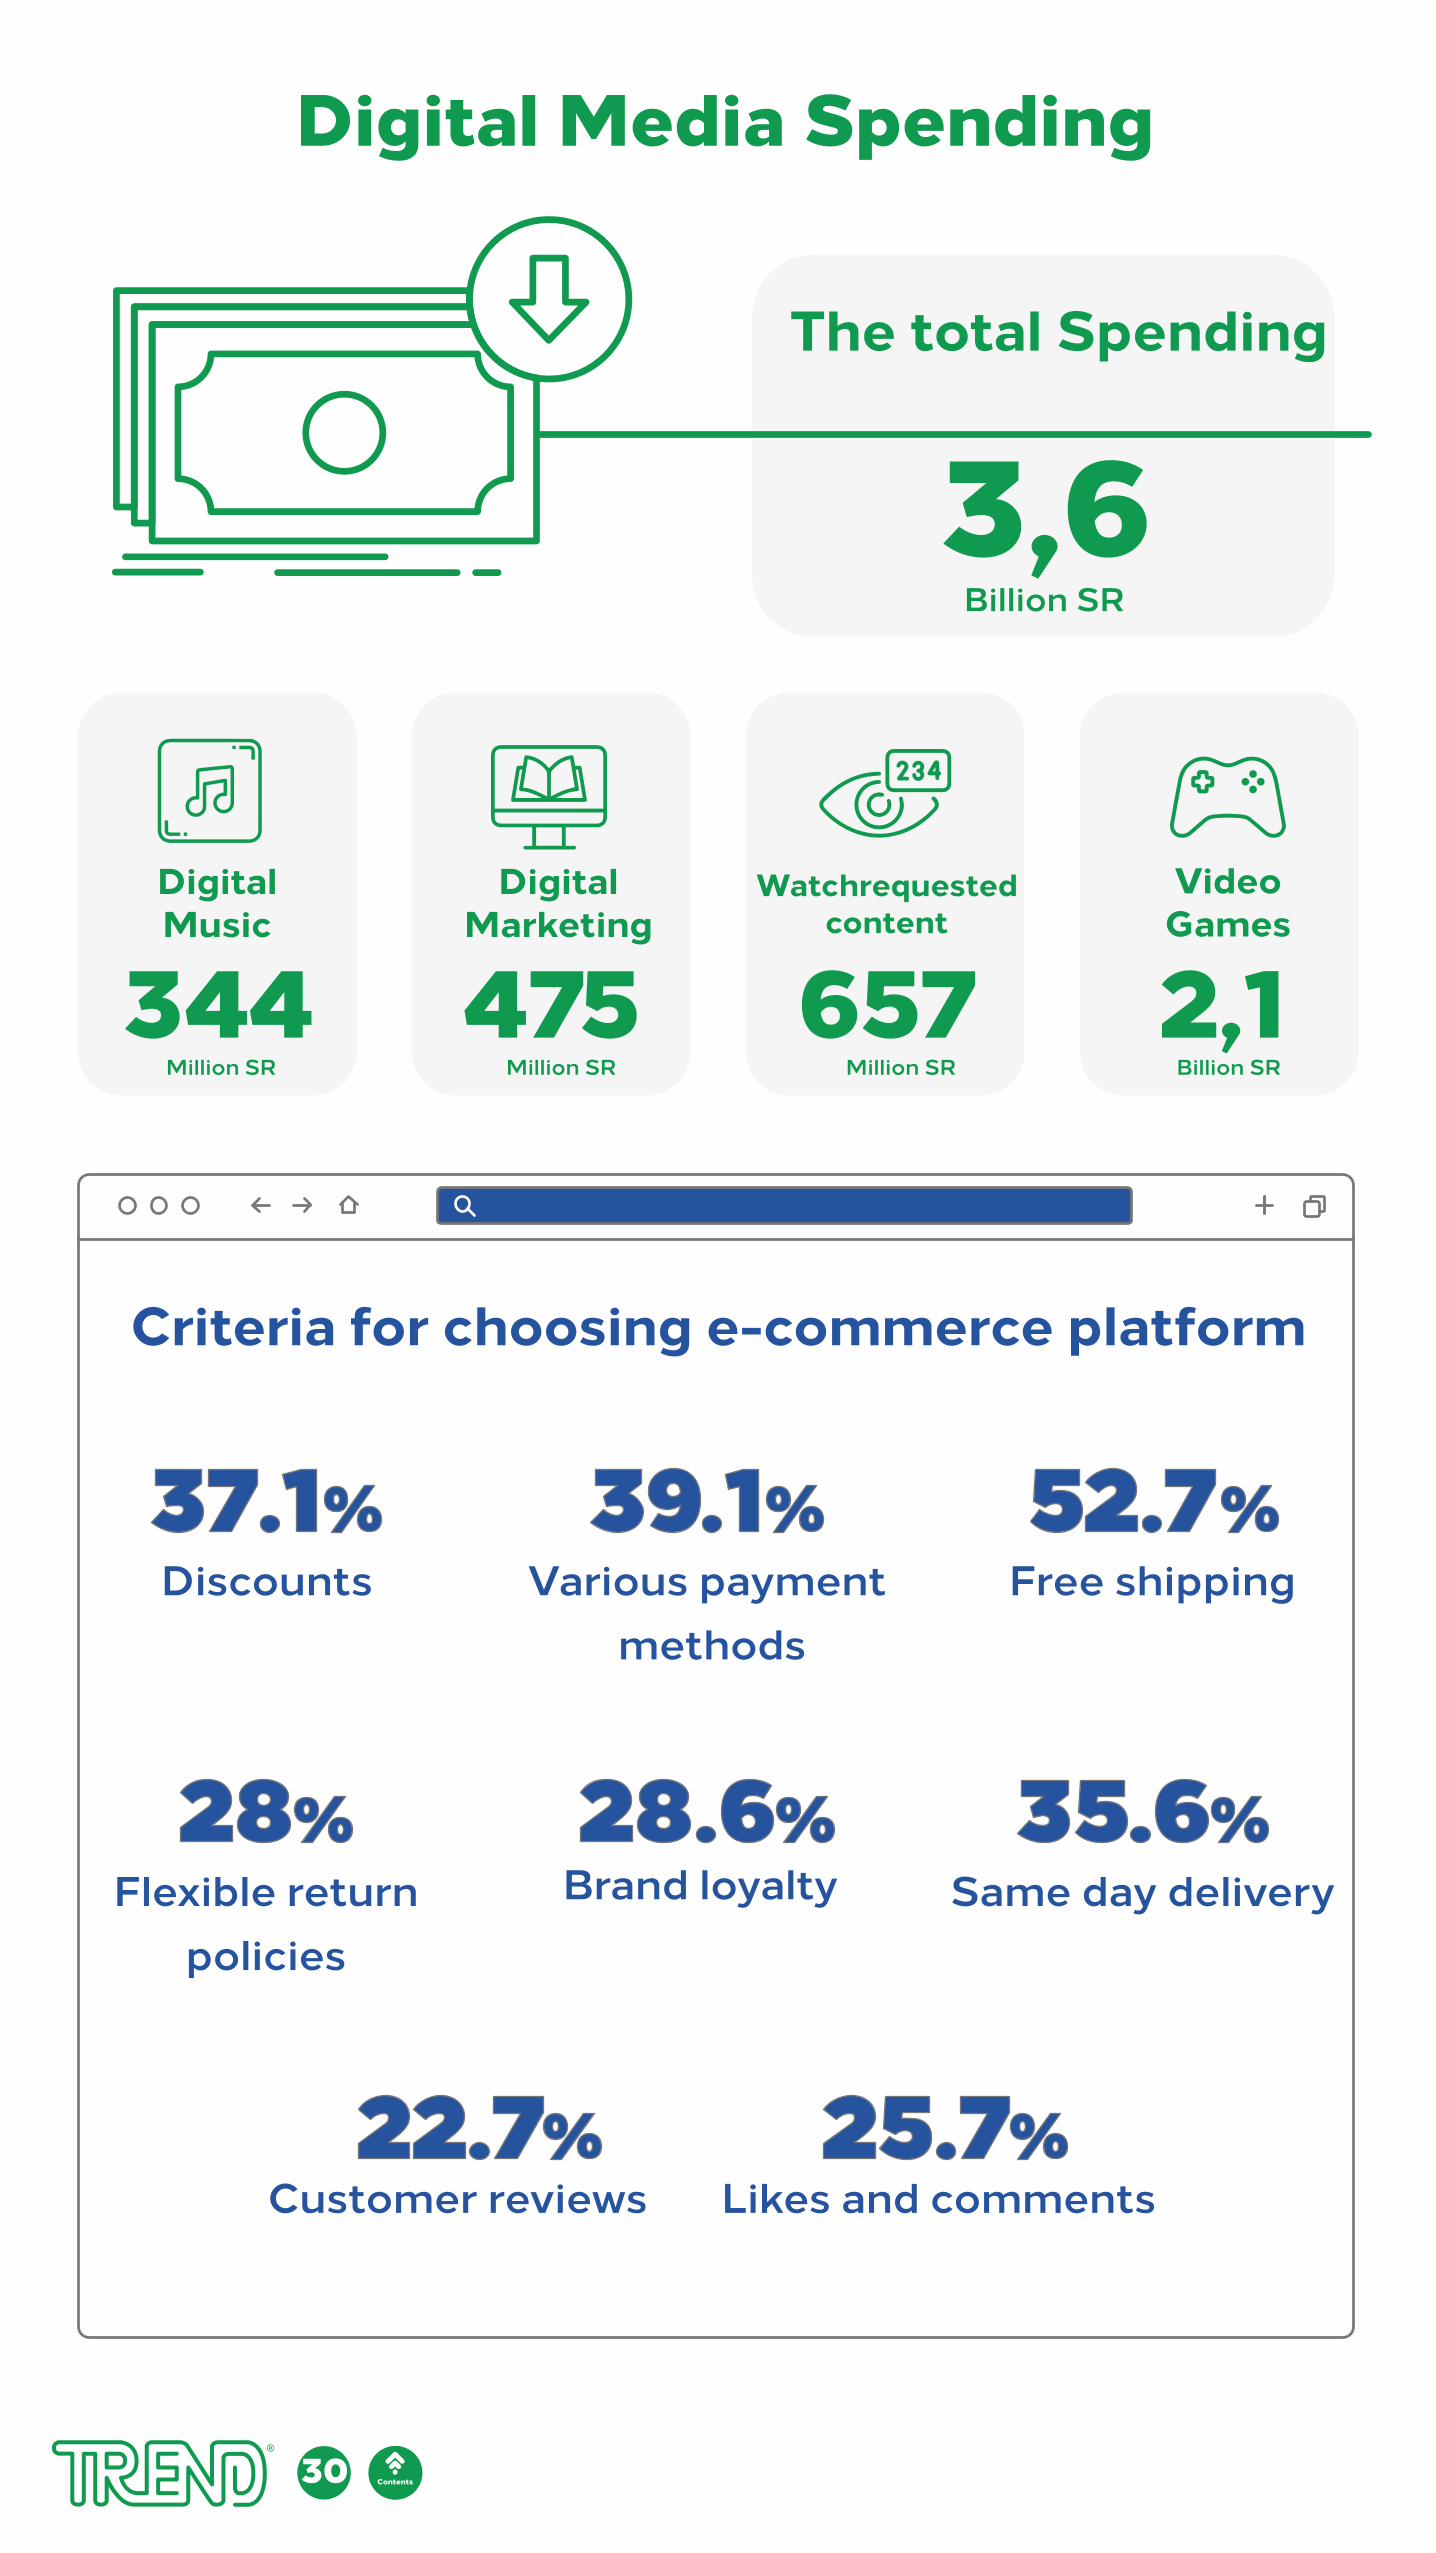
Digital Media Spending
Criteria for choosing e-commerce platform
Free shippingVarious payment methods
Discounts
Same day deliveryBrand loyalty
Likes and commentsCustomer reviews
Flexible returnpolicies
Billion SR3,6
The total Spending
2,1 Video
GamesWatchrequested
contentDigital
MarketingDigitalMusic
Billion SRMillion SR657
Million SR475
Million SR344
52.7%39.1%37.1%
35.6%28.6%28%
25.7%22.7%
30 Contentsالمحتويات
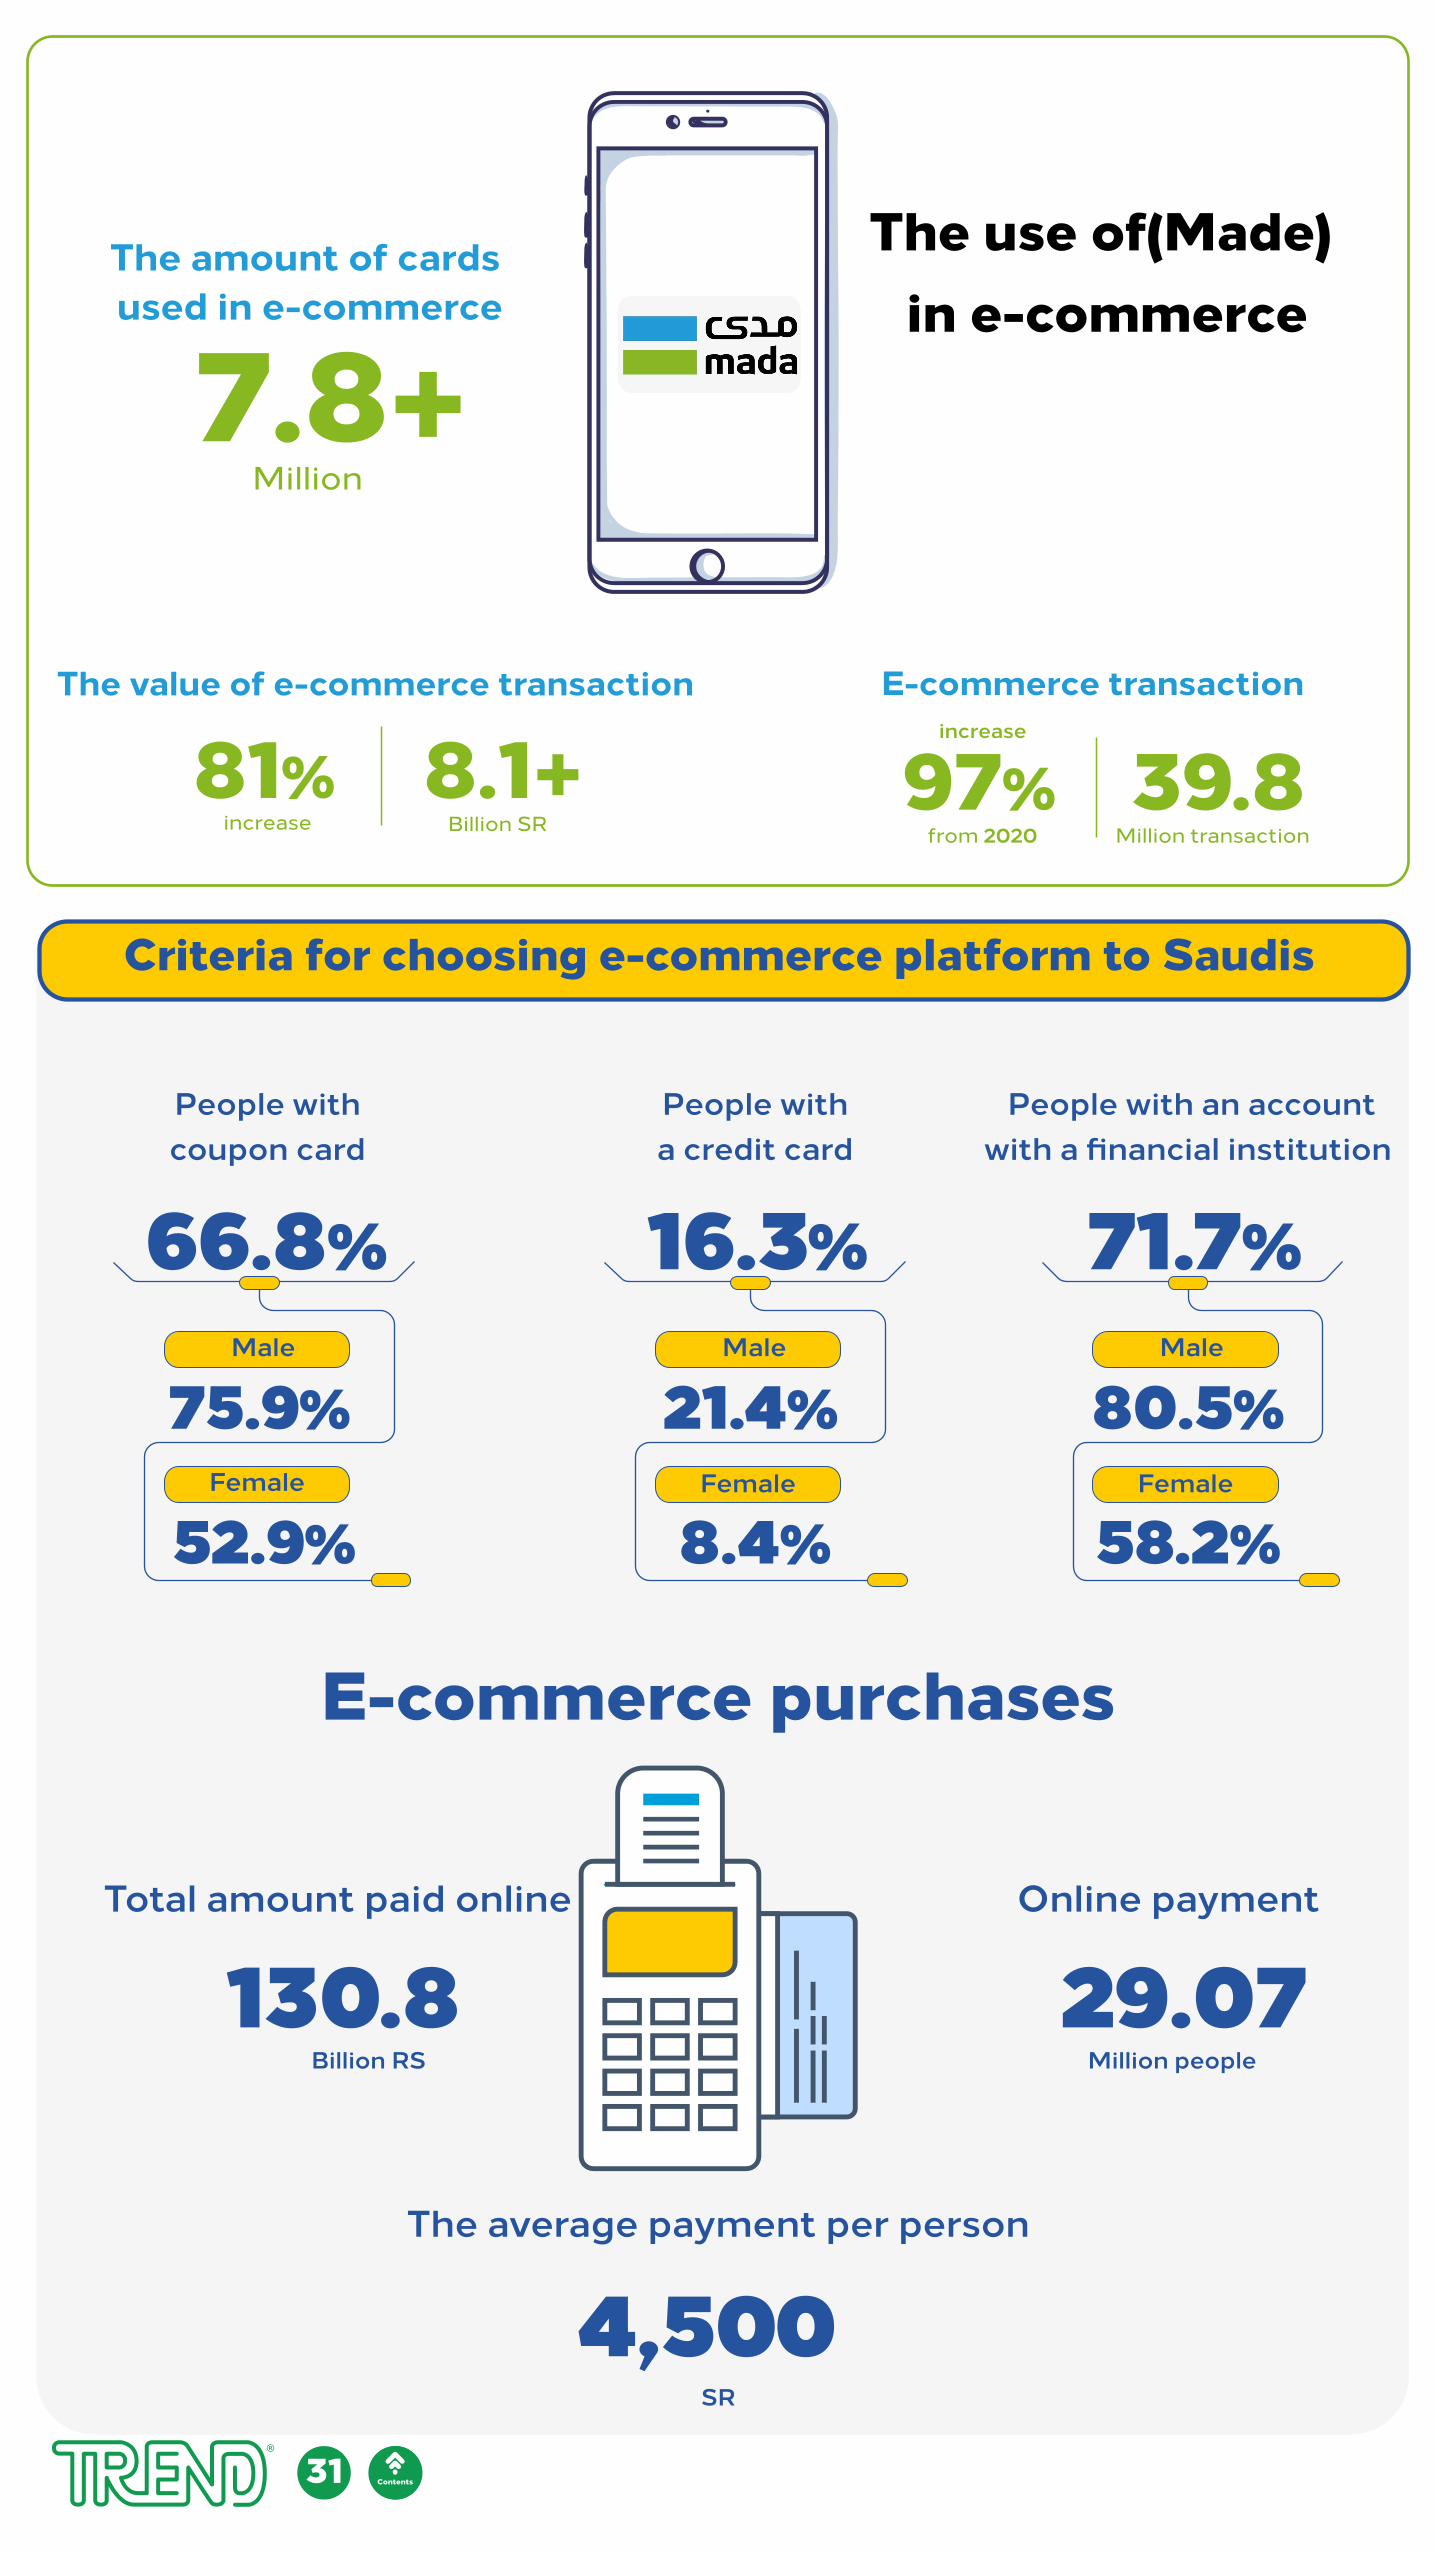
The use of(Made) in e-commerce
The amount of cards used in e-commerce
E-commerce transactionThe value of e-commerce transaction
7.8+
39.8
Million
Million transaction97%
from 2020
increase
8.1+Billion SR
81%increase
Criteria for choosing e-commerce platform to Saudis
E-commerce purchases
People with an accountwith a financial institution
People withcoupon card
People witha credit card
71.7%
80.5%Male
58.2%
29.07
4,500
Female
16.3%
21.4%Male
8.4%Female
66.8%
75.9%Male
52.9%Female
Online payment
Million people
130.8 Total amount paid online
The average payment per person
Billion RS
SR
31 Contentsالمحتويات
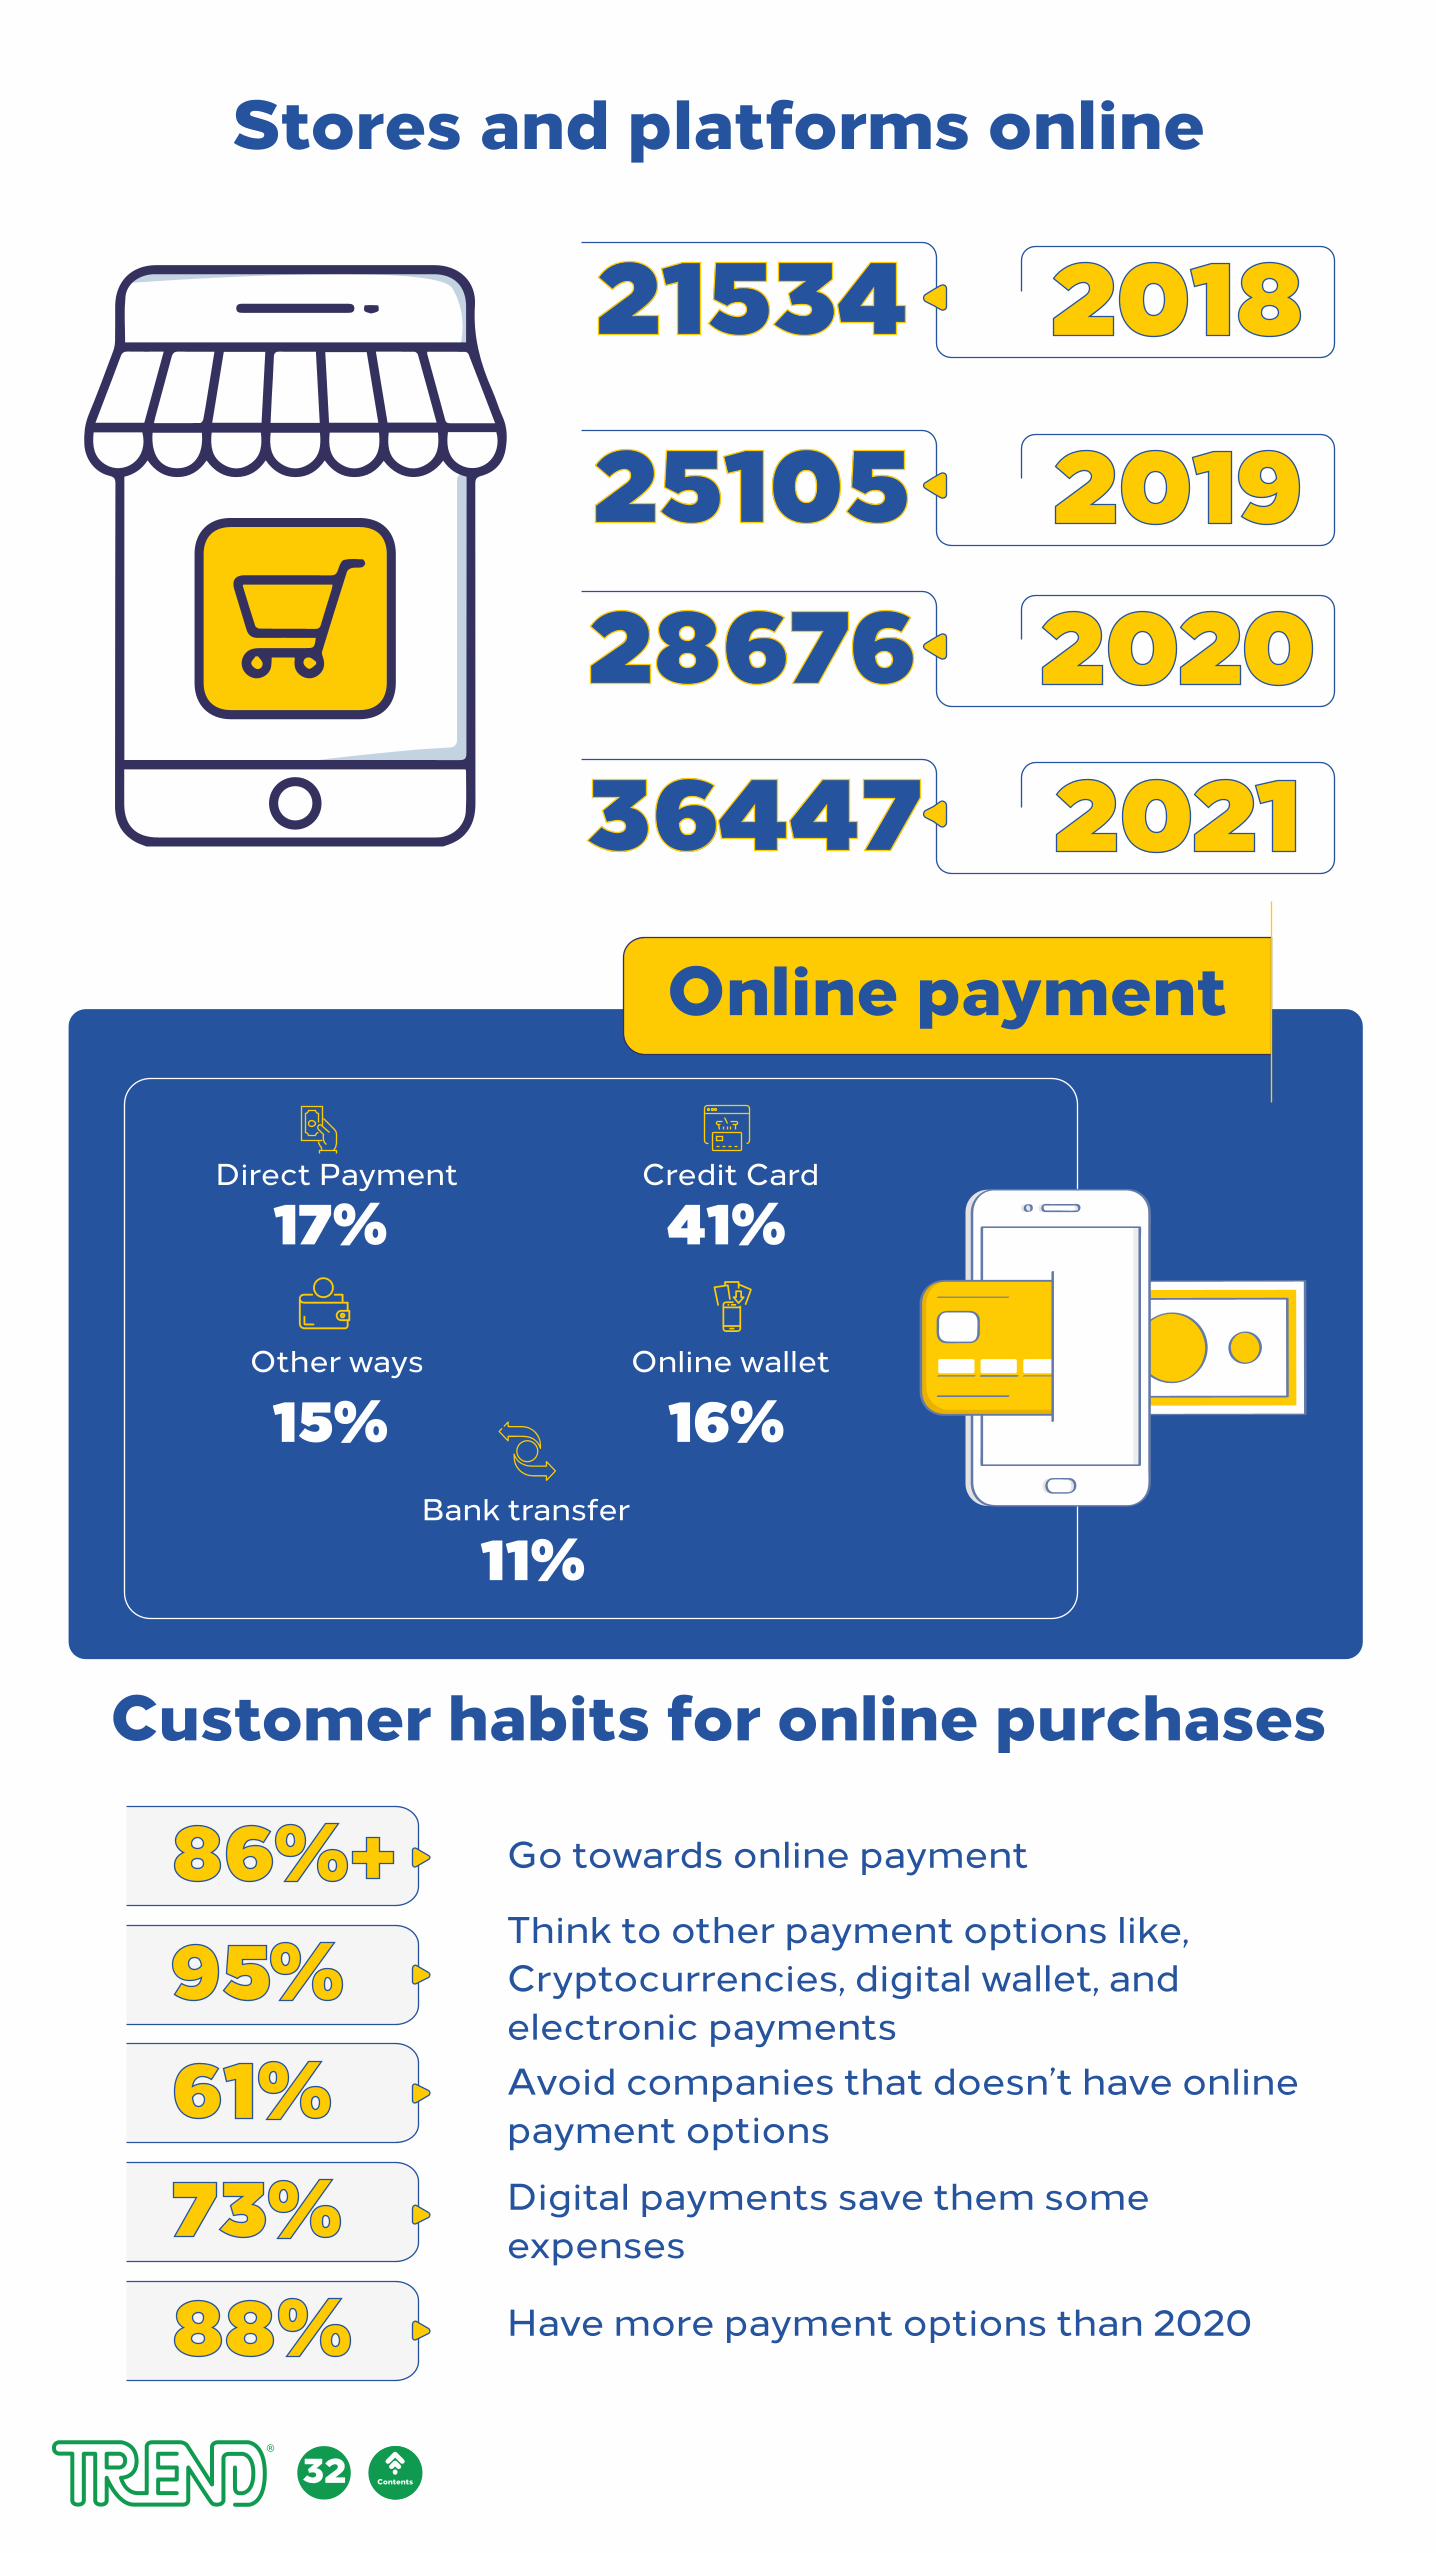
Stores and platforms online
Online payment
Customer habits for online purchases
201821534
201925105202028676202136447
Credit CardDirect Payment
Online wallet
Bank transfer
Other ways
41%17%
16%15%
11%
86%+95%61%73%88%
Go towards online payment
32 المحتويات
Think to other payment options like, Cryptocurrencies, digital wallet, and electronic payments Avoid companies that doesn’t have onlinepayment options
Digital payments save them some expenses
Have more payment options than 2020
Contents
VideoGames
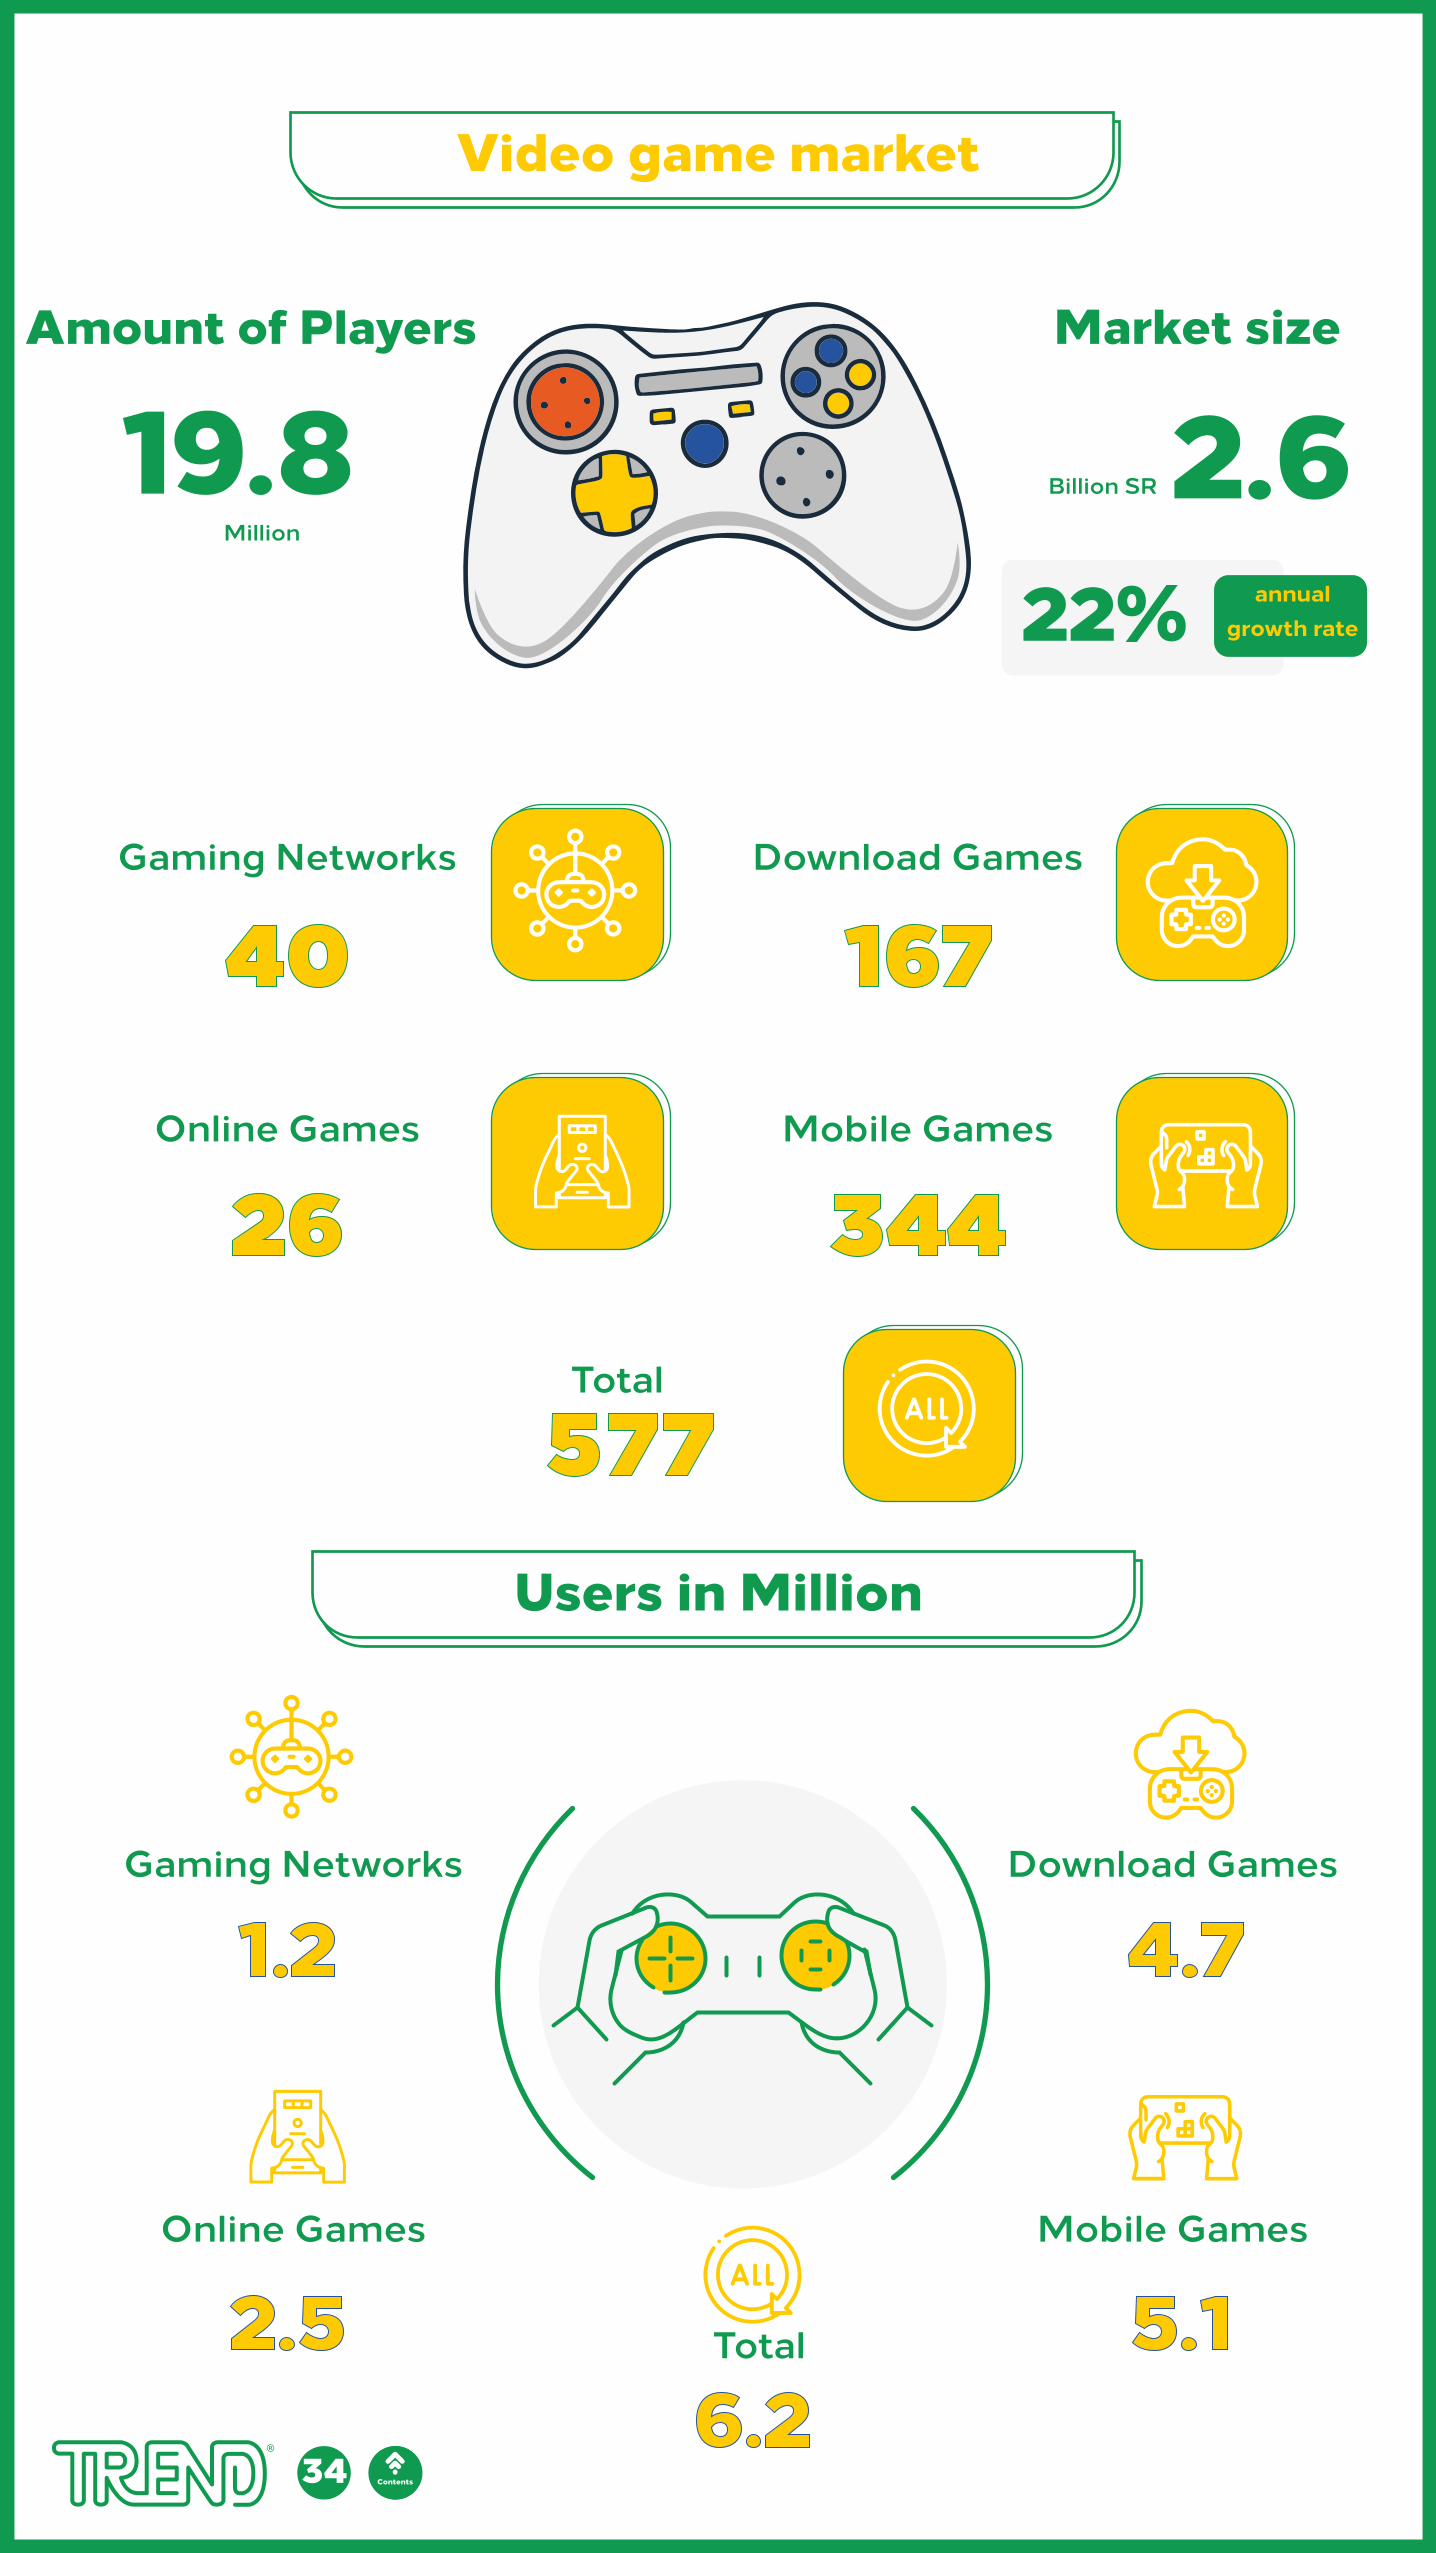
Video game market
Market sizeAmount of Players
2.619.822%
Billion SR
Download Games
Million
annualgrowth rate
167Gaming Networks
40Mobile Games
Total
344
577
Online Games
26
Users in Million
Download GamesGaming Networks
Mobile Games
Total
Online Games
4.71.2
5.12.56.2
34 Contentsالمحتويات
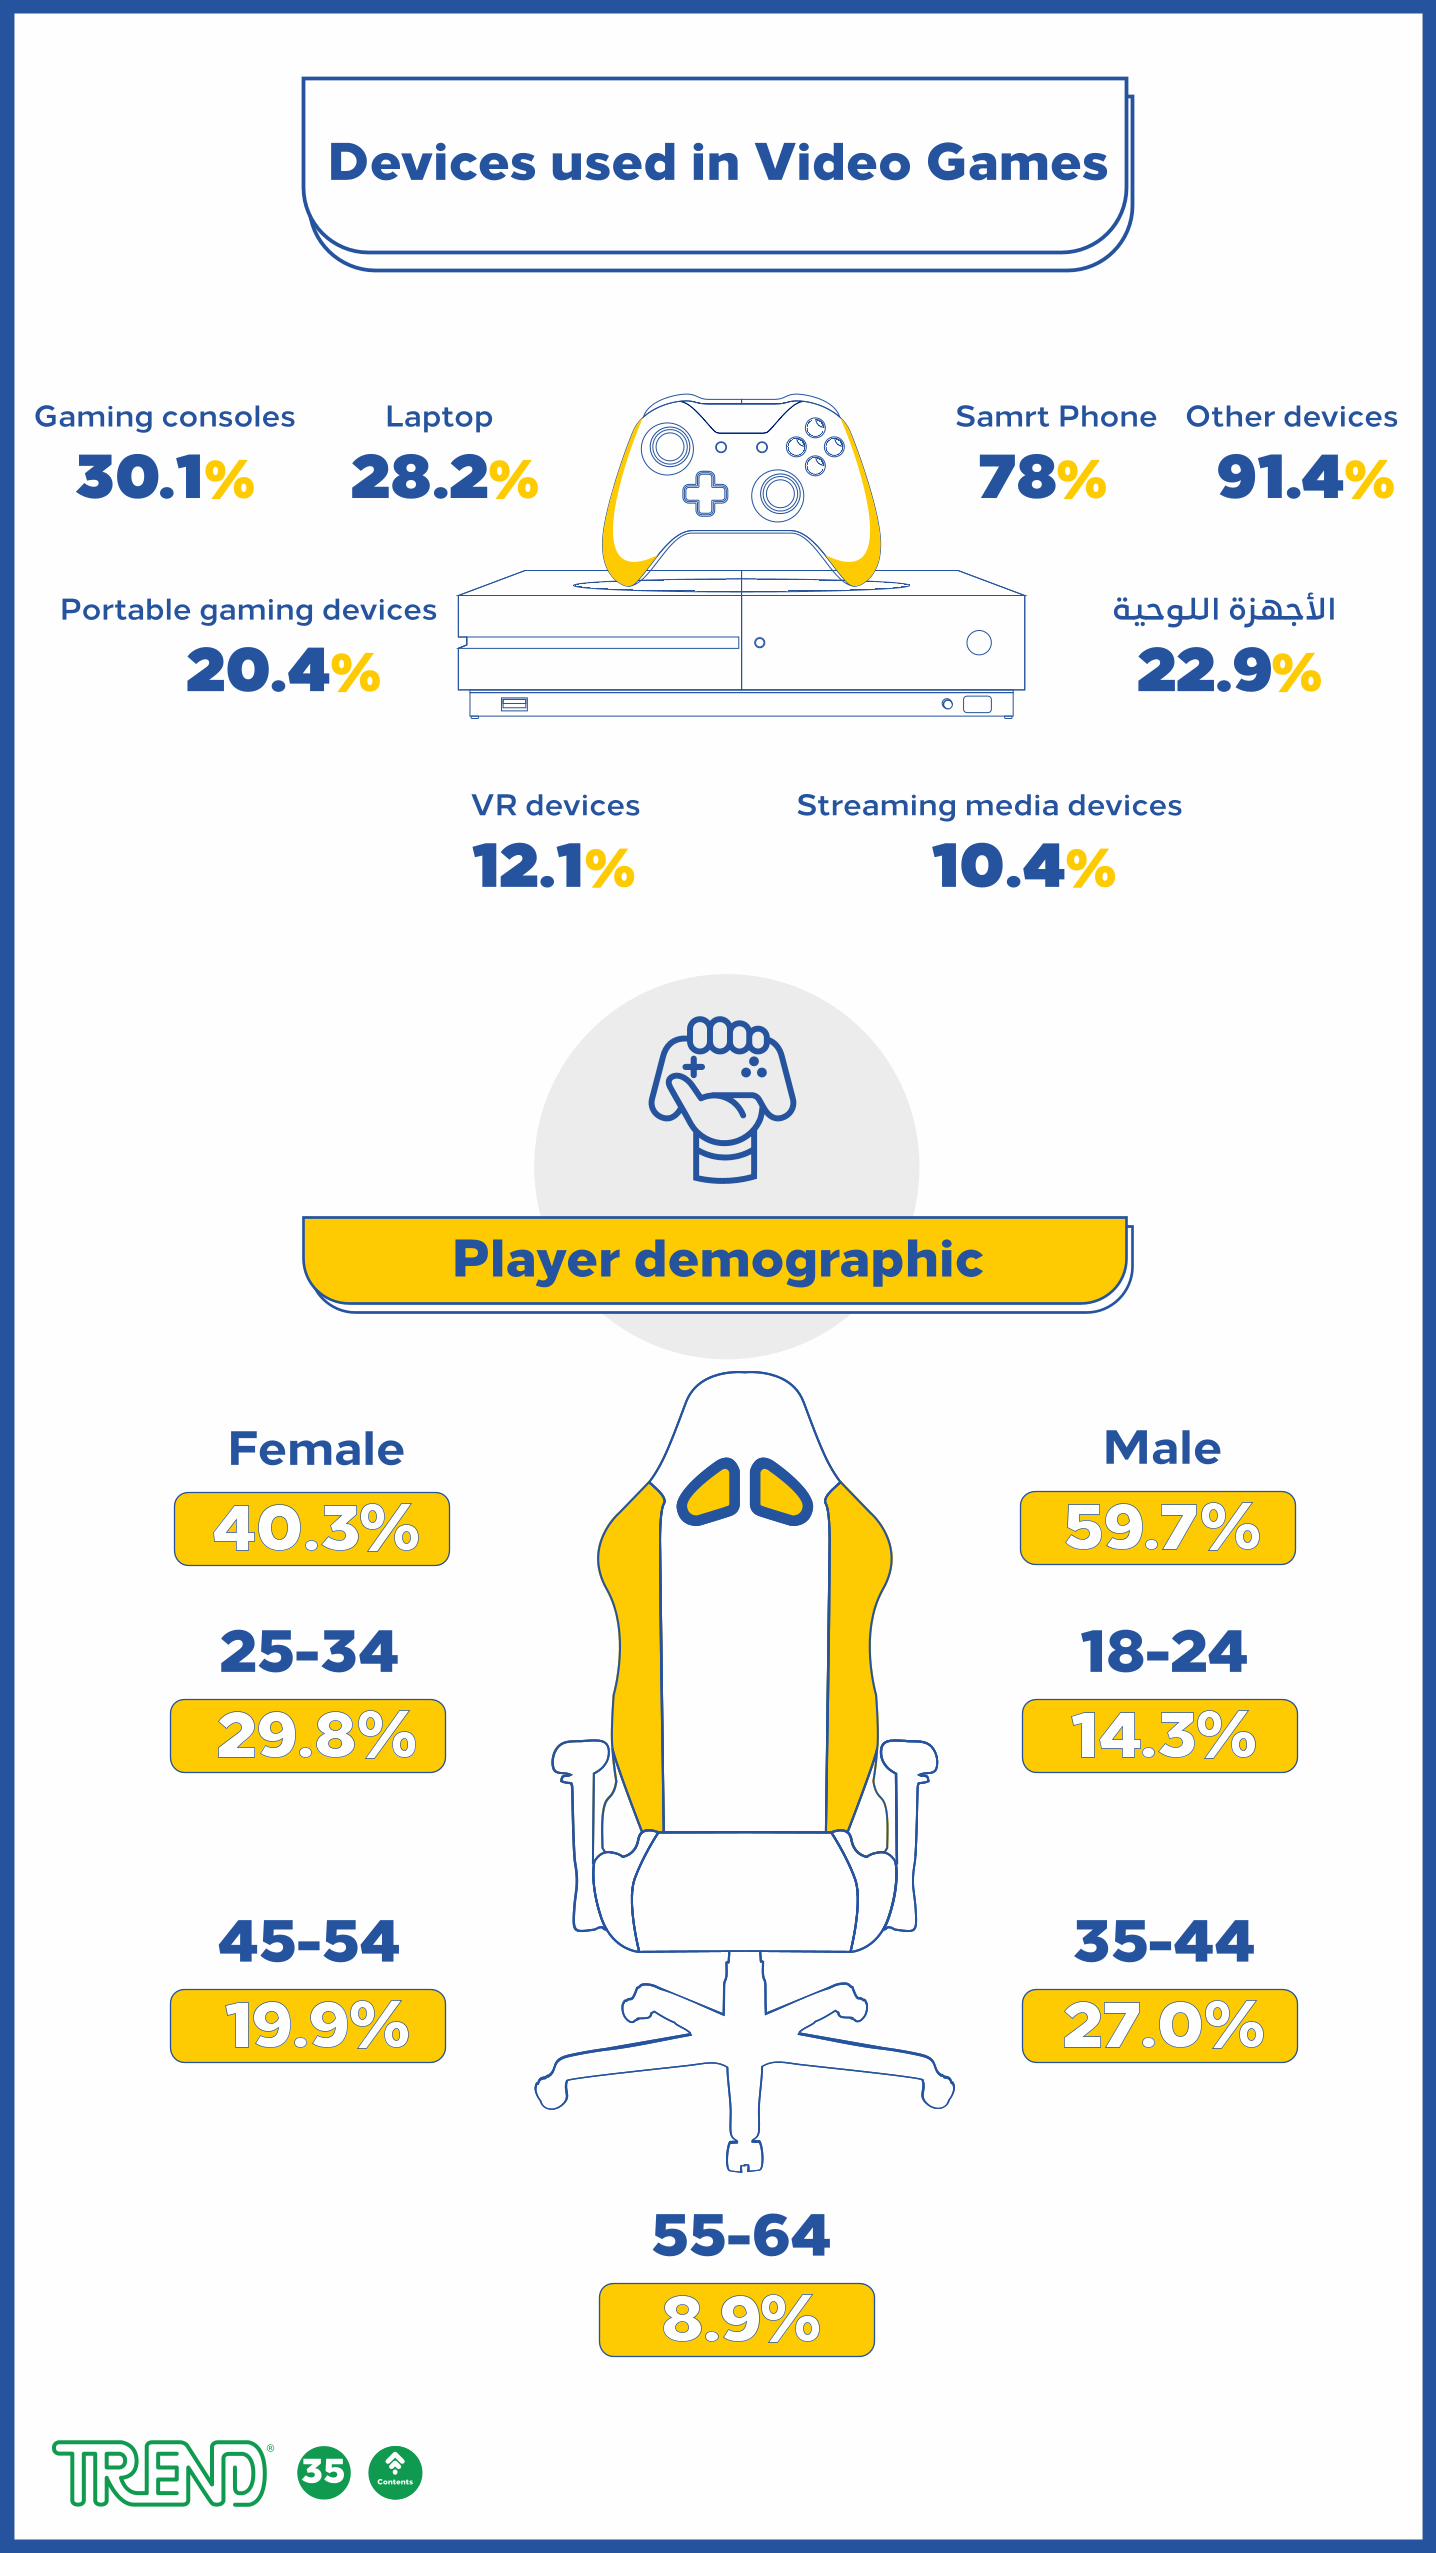
Player demographic
Devices used in Video Games
18-2425-3414.3%29.8%
35-4445-5427.0%
55-648.9%
Female
40.3%Male
59.7%
19.9%
Other devicesSamrt Phone
91.4%
األجهزة اللوحية
22.9%Portable gaming devices
20.4%
Streaming media devices
10.4%VR devices
12.1%
78%LaptopGaming consoles
28.2%30.1%
35 Contentsالمحتويات
Online Education
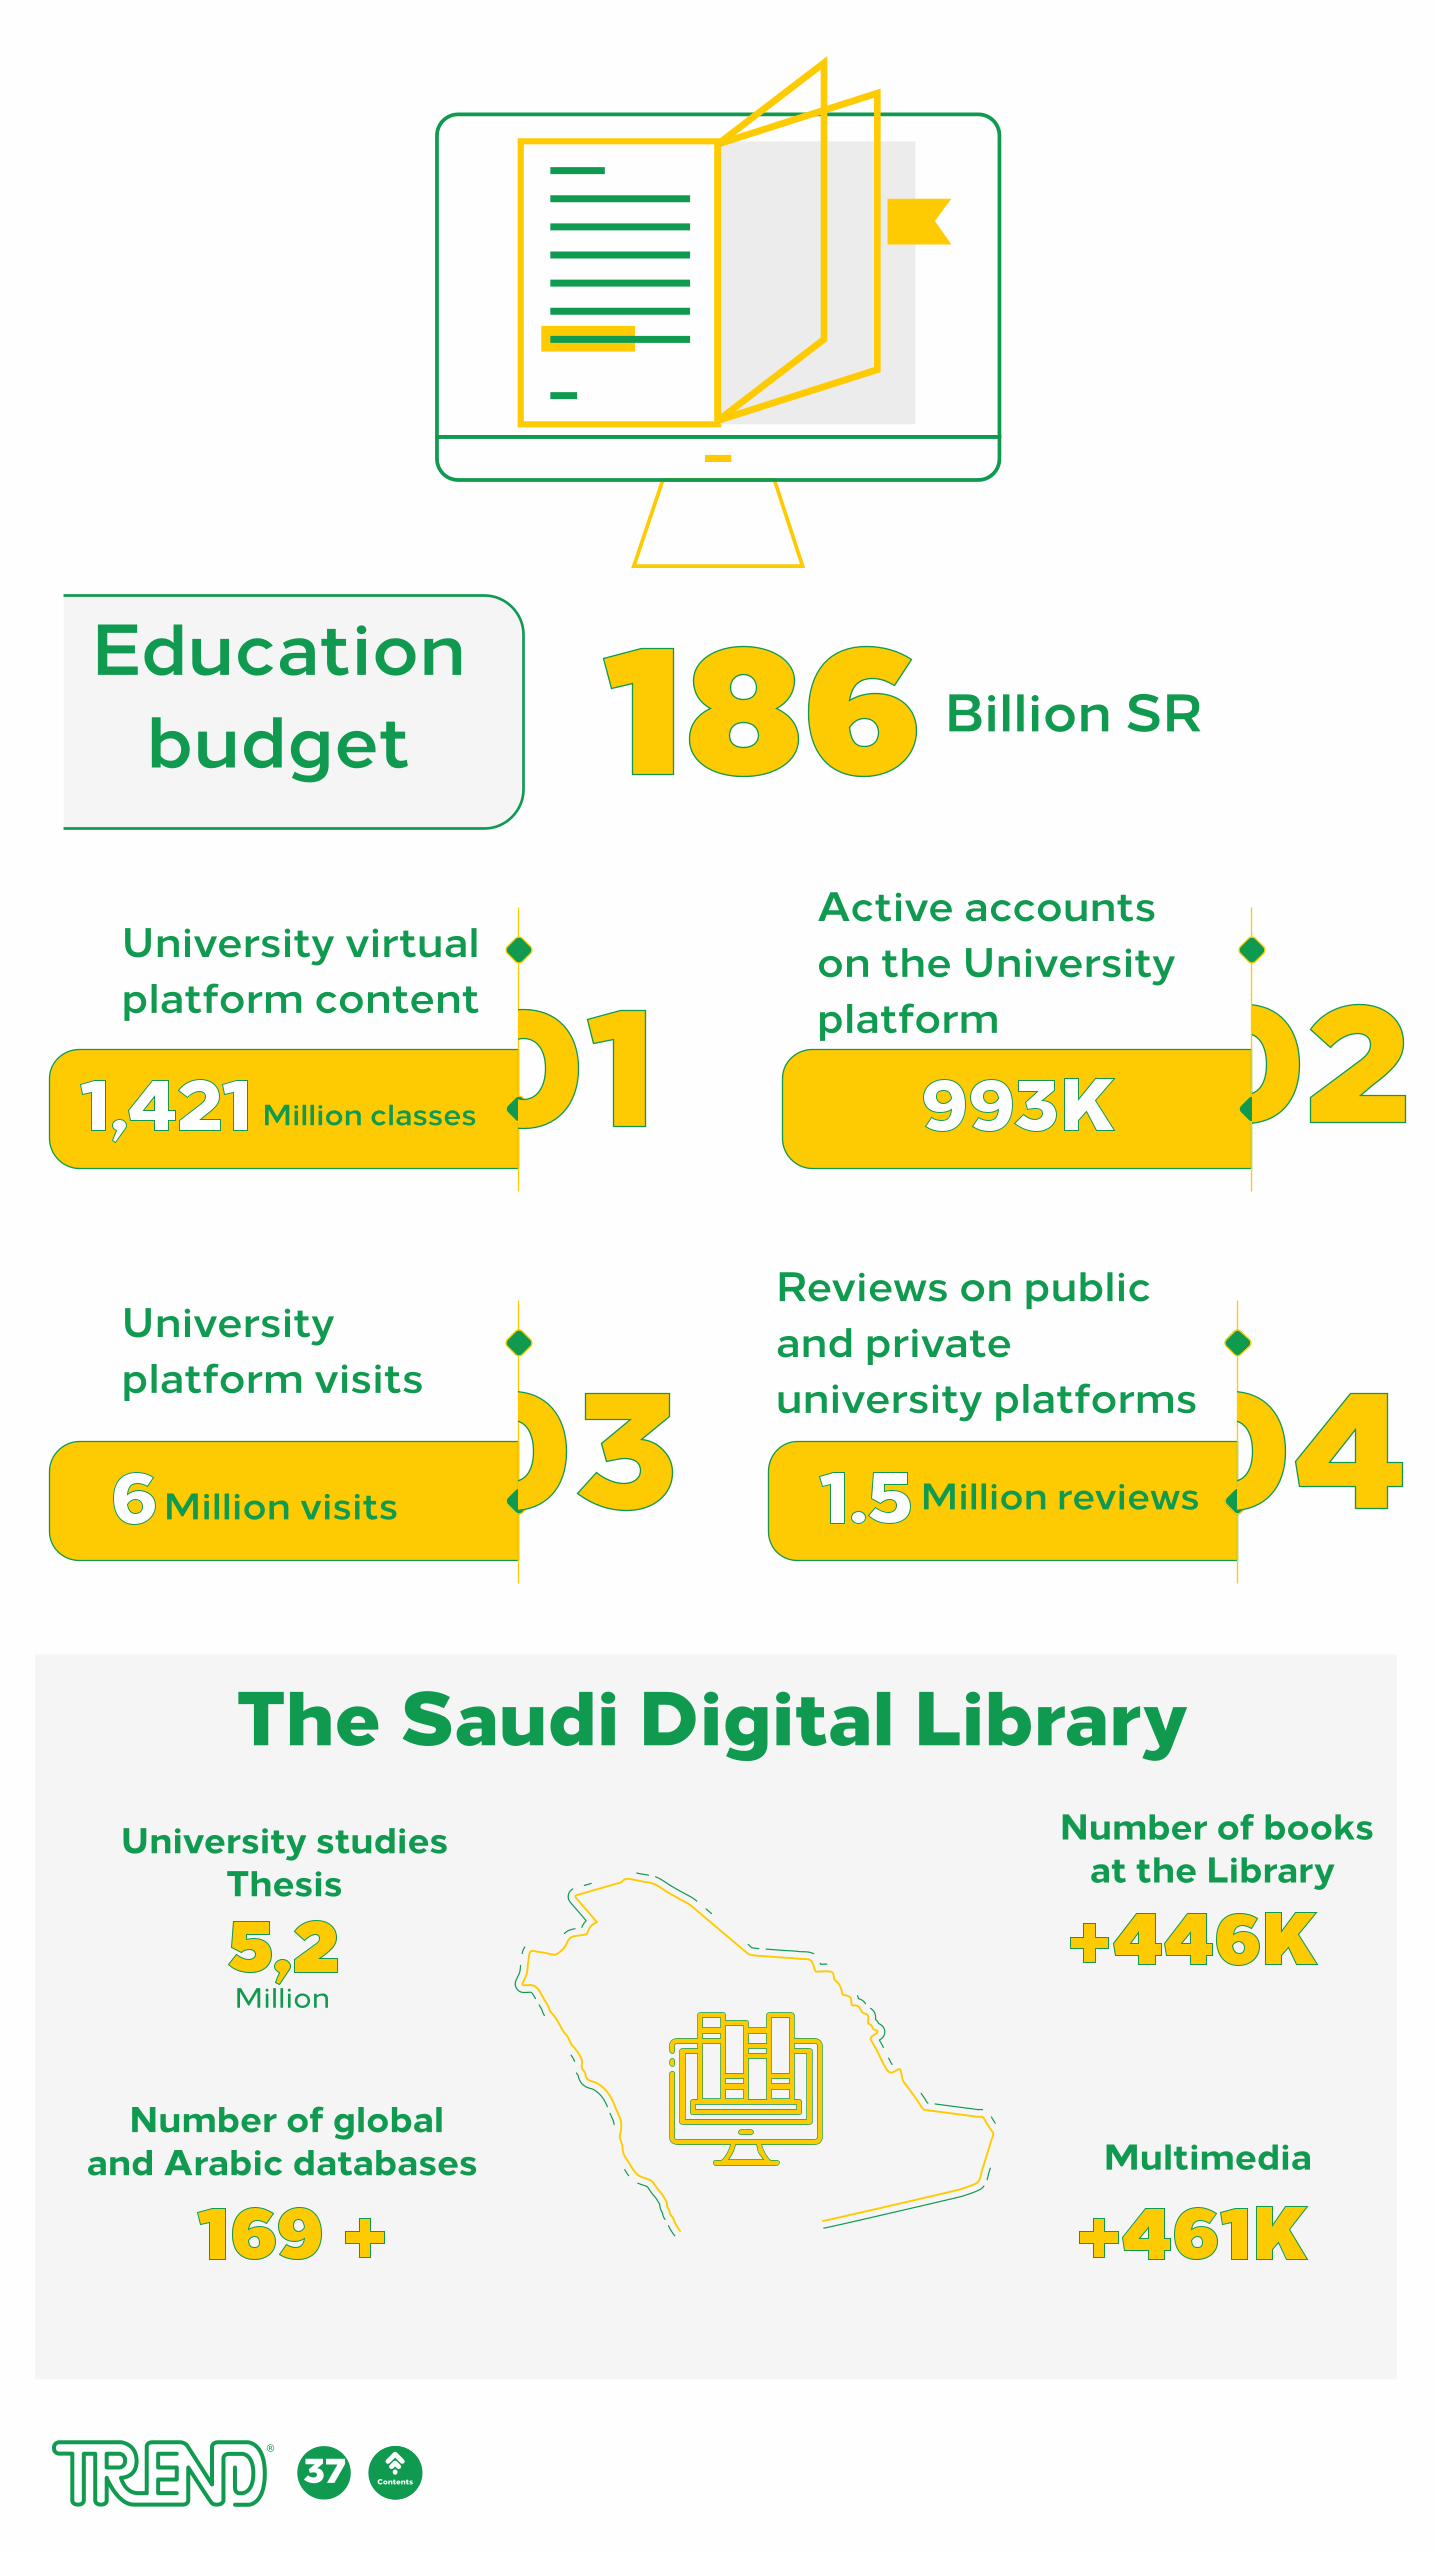
Educationbudget 186 Billion SR
The Saudi Digital Library
1.5 Million reviews04
Number of booksat the Library
Multimedia
University studiesThesis
Number of globaland Arabic databases
+446K5,2Million
169 + +461K
37 المحتويات
036 Million visits
1,421 Million classes01 University virtual platform content
993K 02 Active accounts on the University platform
University platform visits
Reviews on public and private university platforms
Contents
Digitization Globally
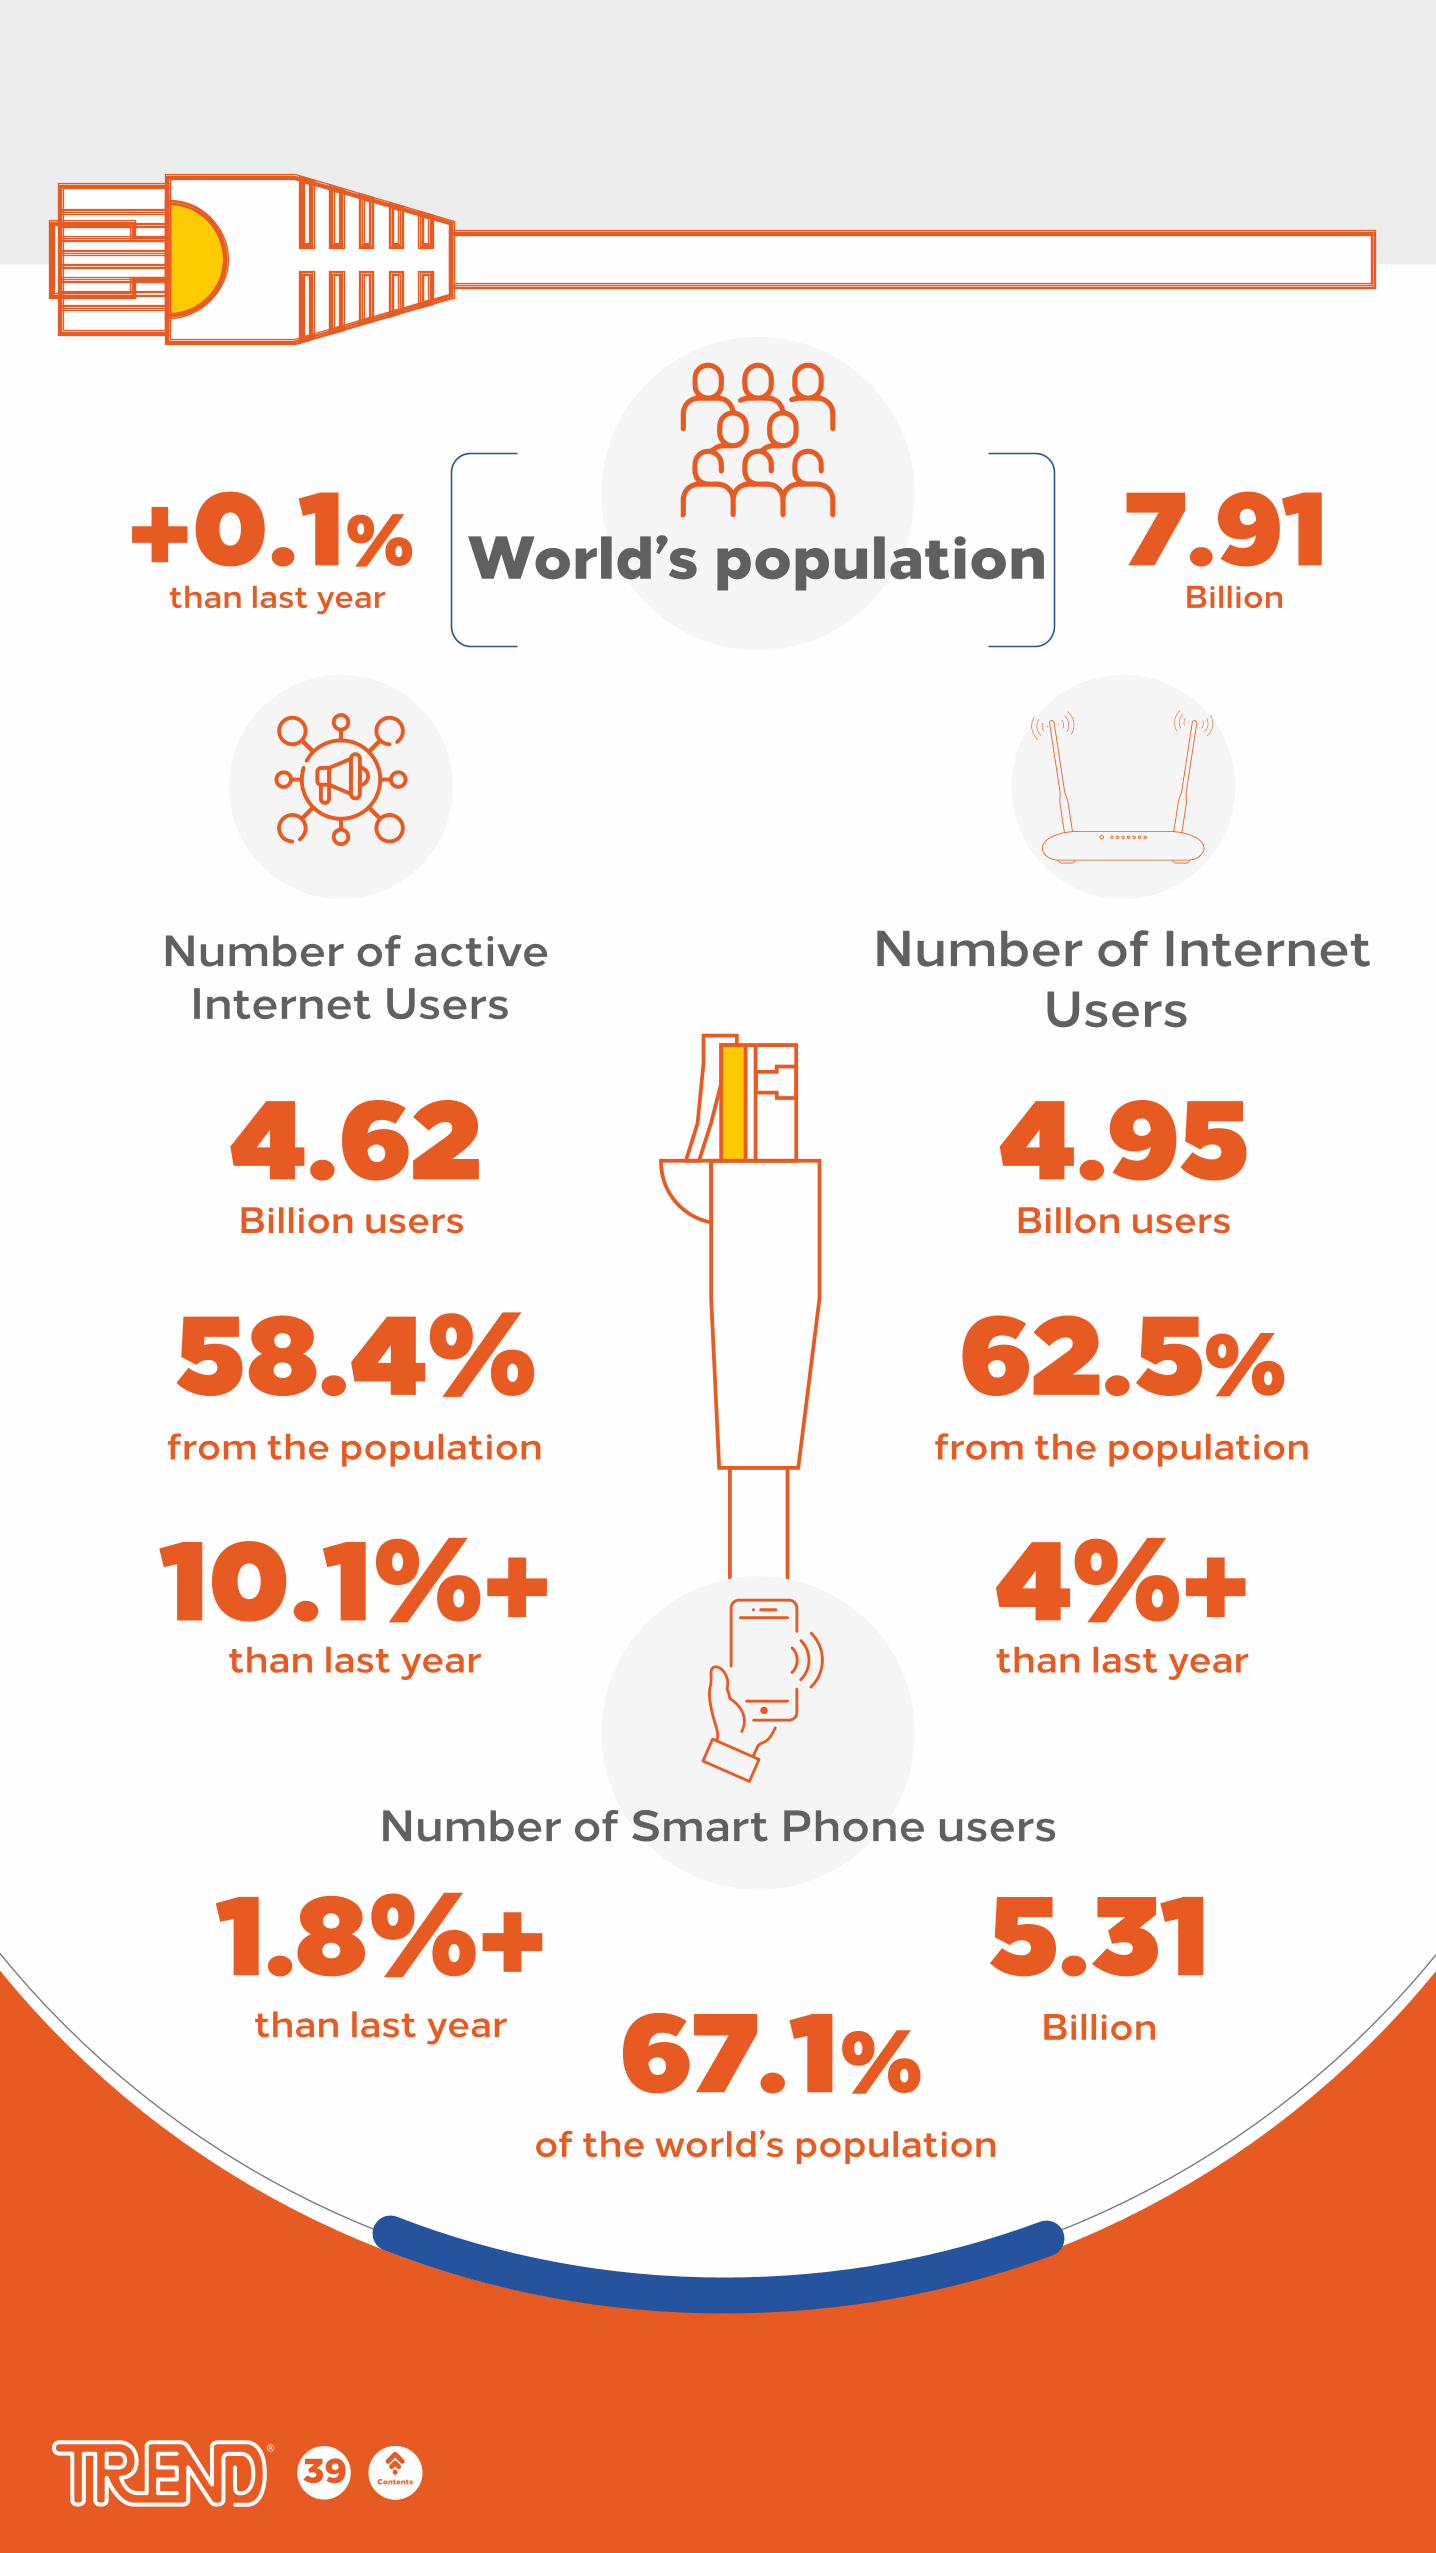
4.62
39 المحتويات
World’s population
Number of InternetUsers
Number of activeInternet Users
Number of Smart Phone users
Billionthan last year7.91
4.95
62.5%
4%+
+0.1%
Billon users
5.31Billion
from the population
67.1%of the world’s population
than last year
58.4%
10.1%+
Billion users
from the population
than last year
1.8%+than last year
Digitization Globally
Contents
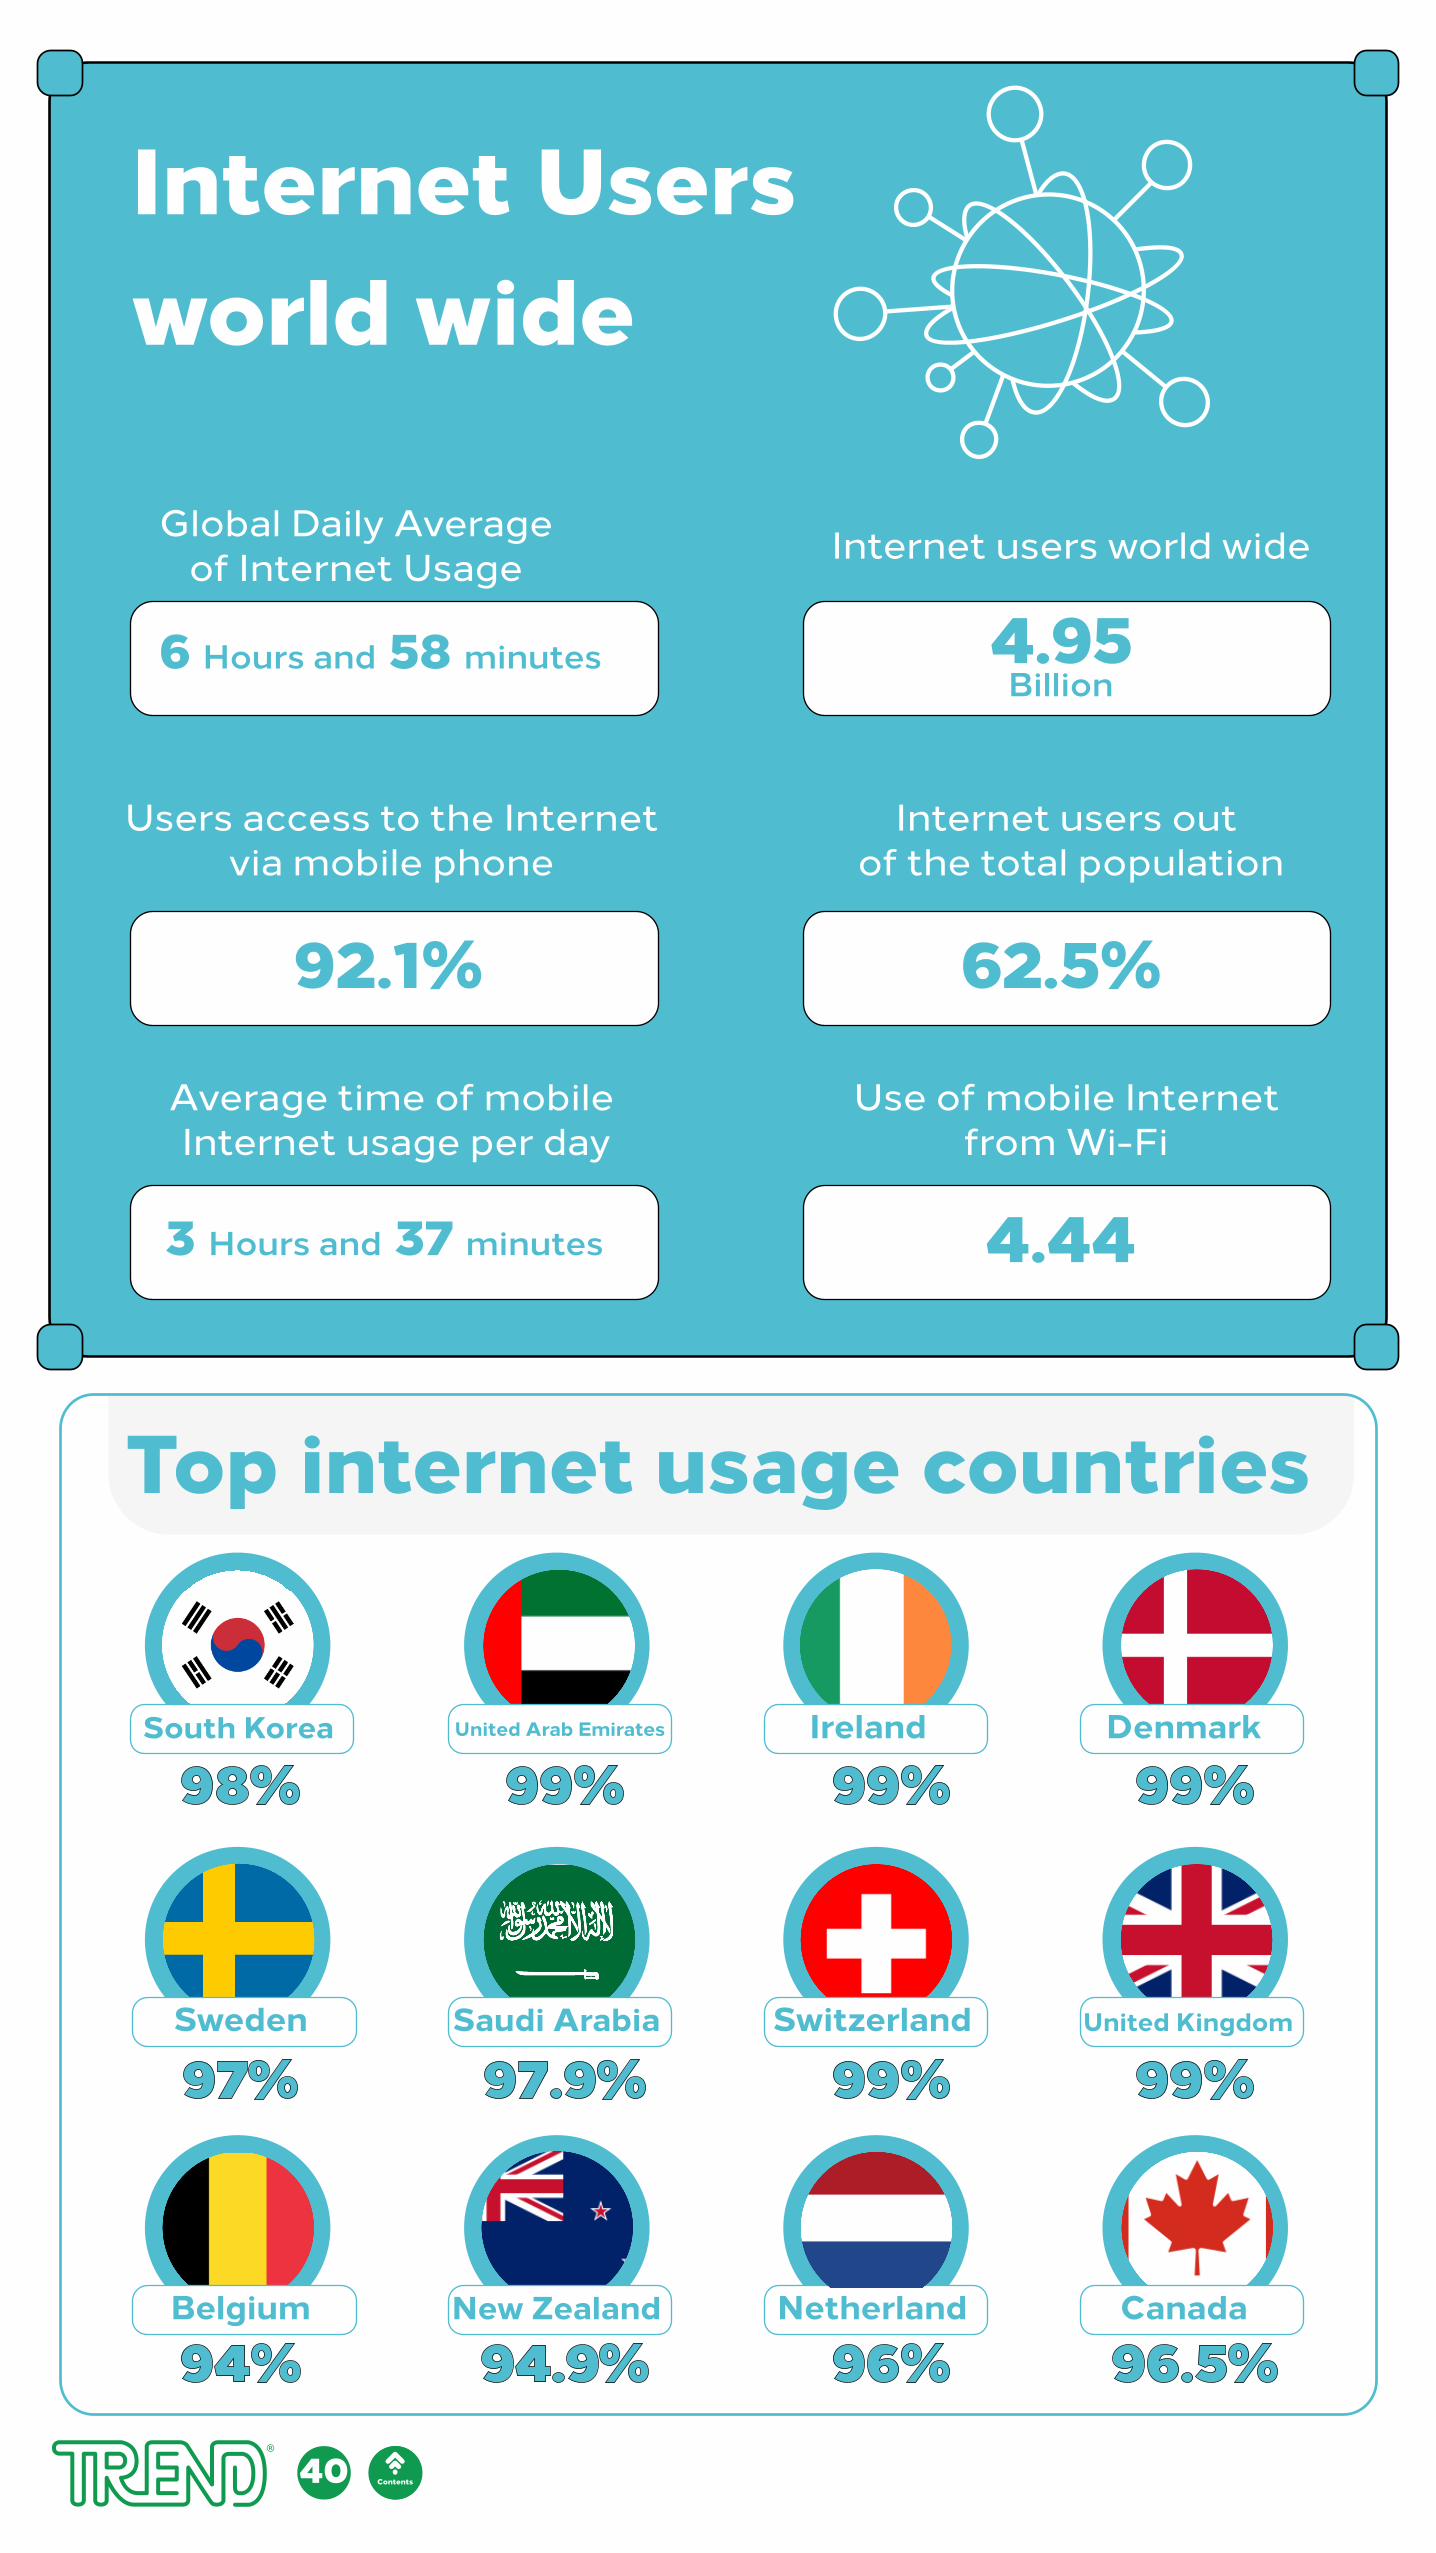
Internet Users world wide
Top internet usage countries
Internet users world wideGlobal Daily Averageof Internet Usage
Internet users out of the total population
Users access to the Internetvia mobile phone
Use of mobile Internetfrom Wi-Fi
Average time of mobile Internet usage per day
4.95Billion
6 Hours and 58 minutes
62.5%92.1%
4.443 Hours and 37 minutes
Netherland
Denmark Ireland United Arab EmiratesSouth Korea
United KingdomSwitzerlandSaudi ArabiaSweden
Canada New ZealandBelgium
99%99%99%98%
99%99%97.9%97%
96.5%96%94.9%94%
40 Contentsالمحتويات
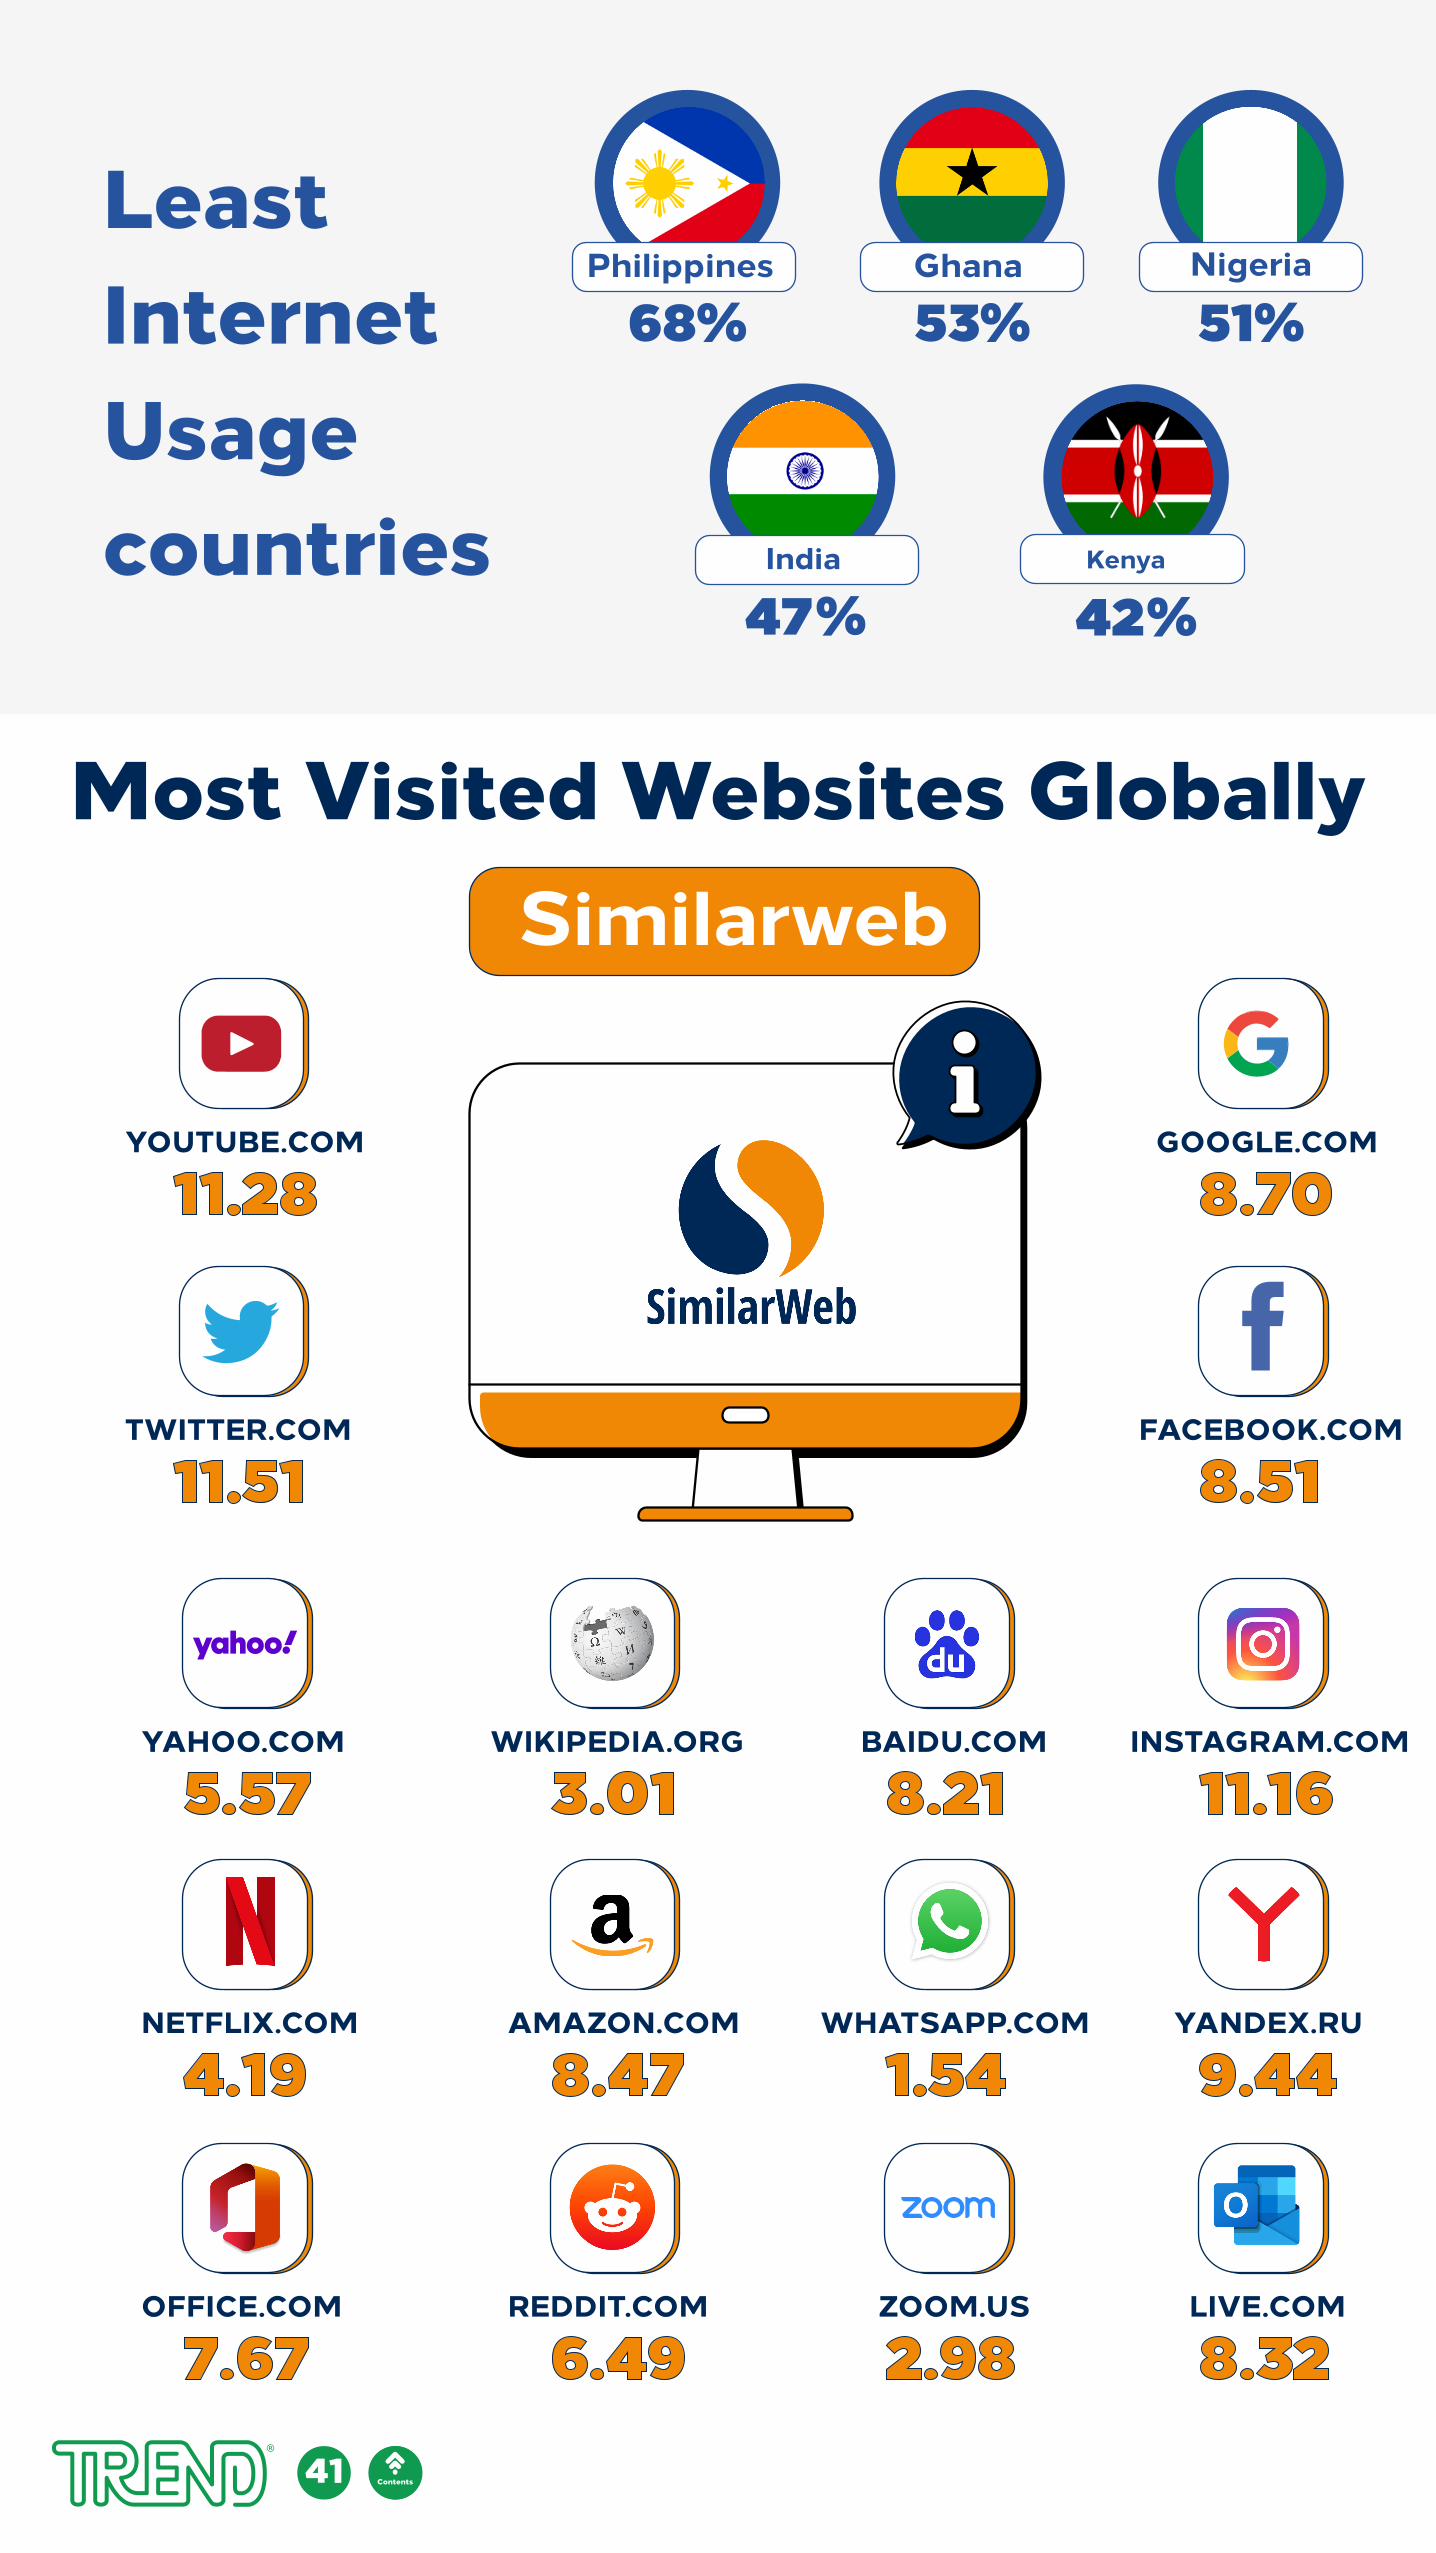
Most Visited Websites Globally
India Kenya
Philippines
68%Ghana
53%Nigeria
51%
47% 42%
Similarweb
GOOGLE.COMYOUTUBE.COM
8.7011.28
FACEBOOK.COMTWITTER.COM
8.5111.51
INSTAGRAM.COM
11.16BAIDU.COM
8.21WIKIPEDIA.ORG
3.01YAHOO.COM
5.57
YANDEX.RU
9.44WHATSAPP.COM
1.54AMAZON.COM
8.47NETFLIX.COM
4.19
LIVE.COM
8.32ZOOM.US
2.98REDDIT.COM
6.49OFFICE.COM
7.6741 المحتويات
Least Internet Usagecountries
Contents
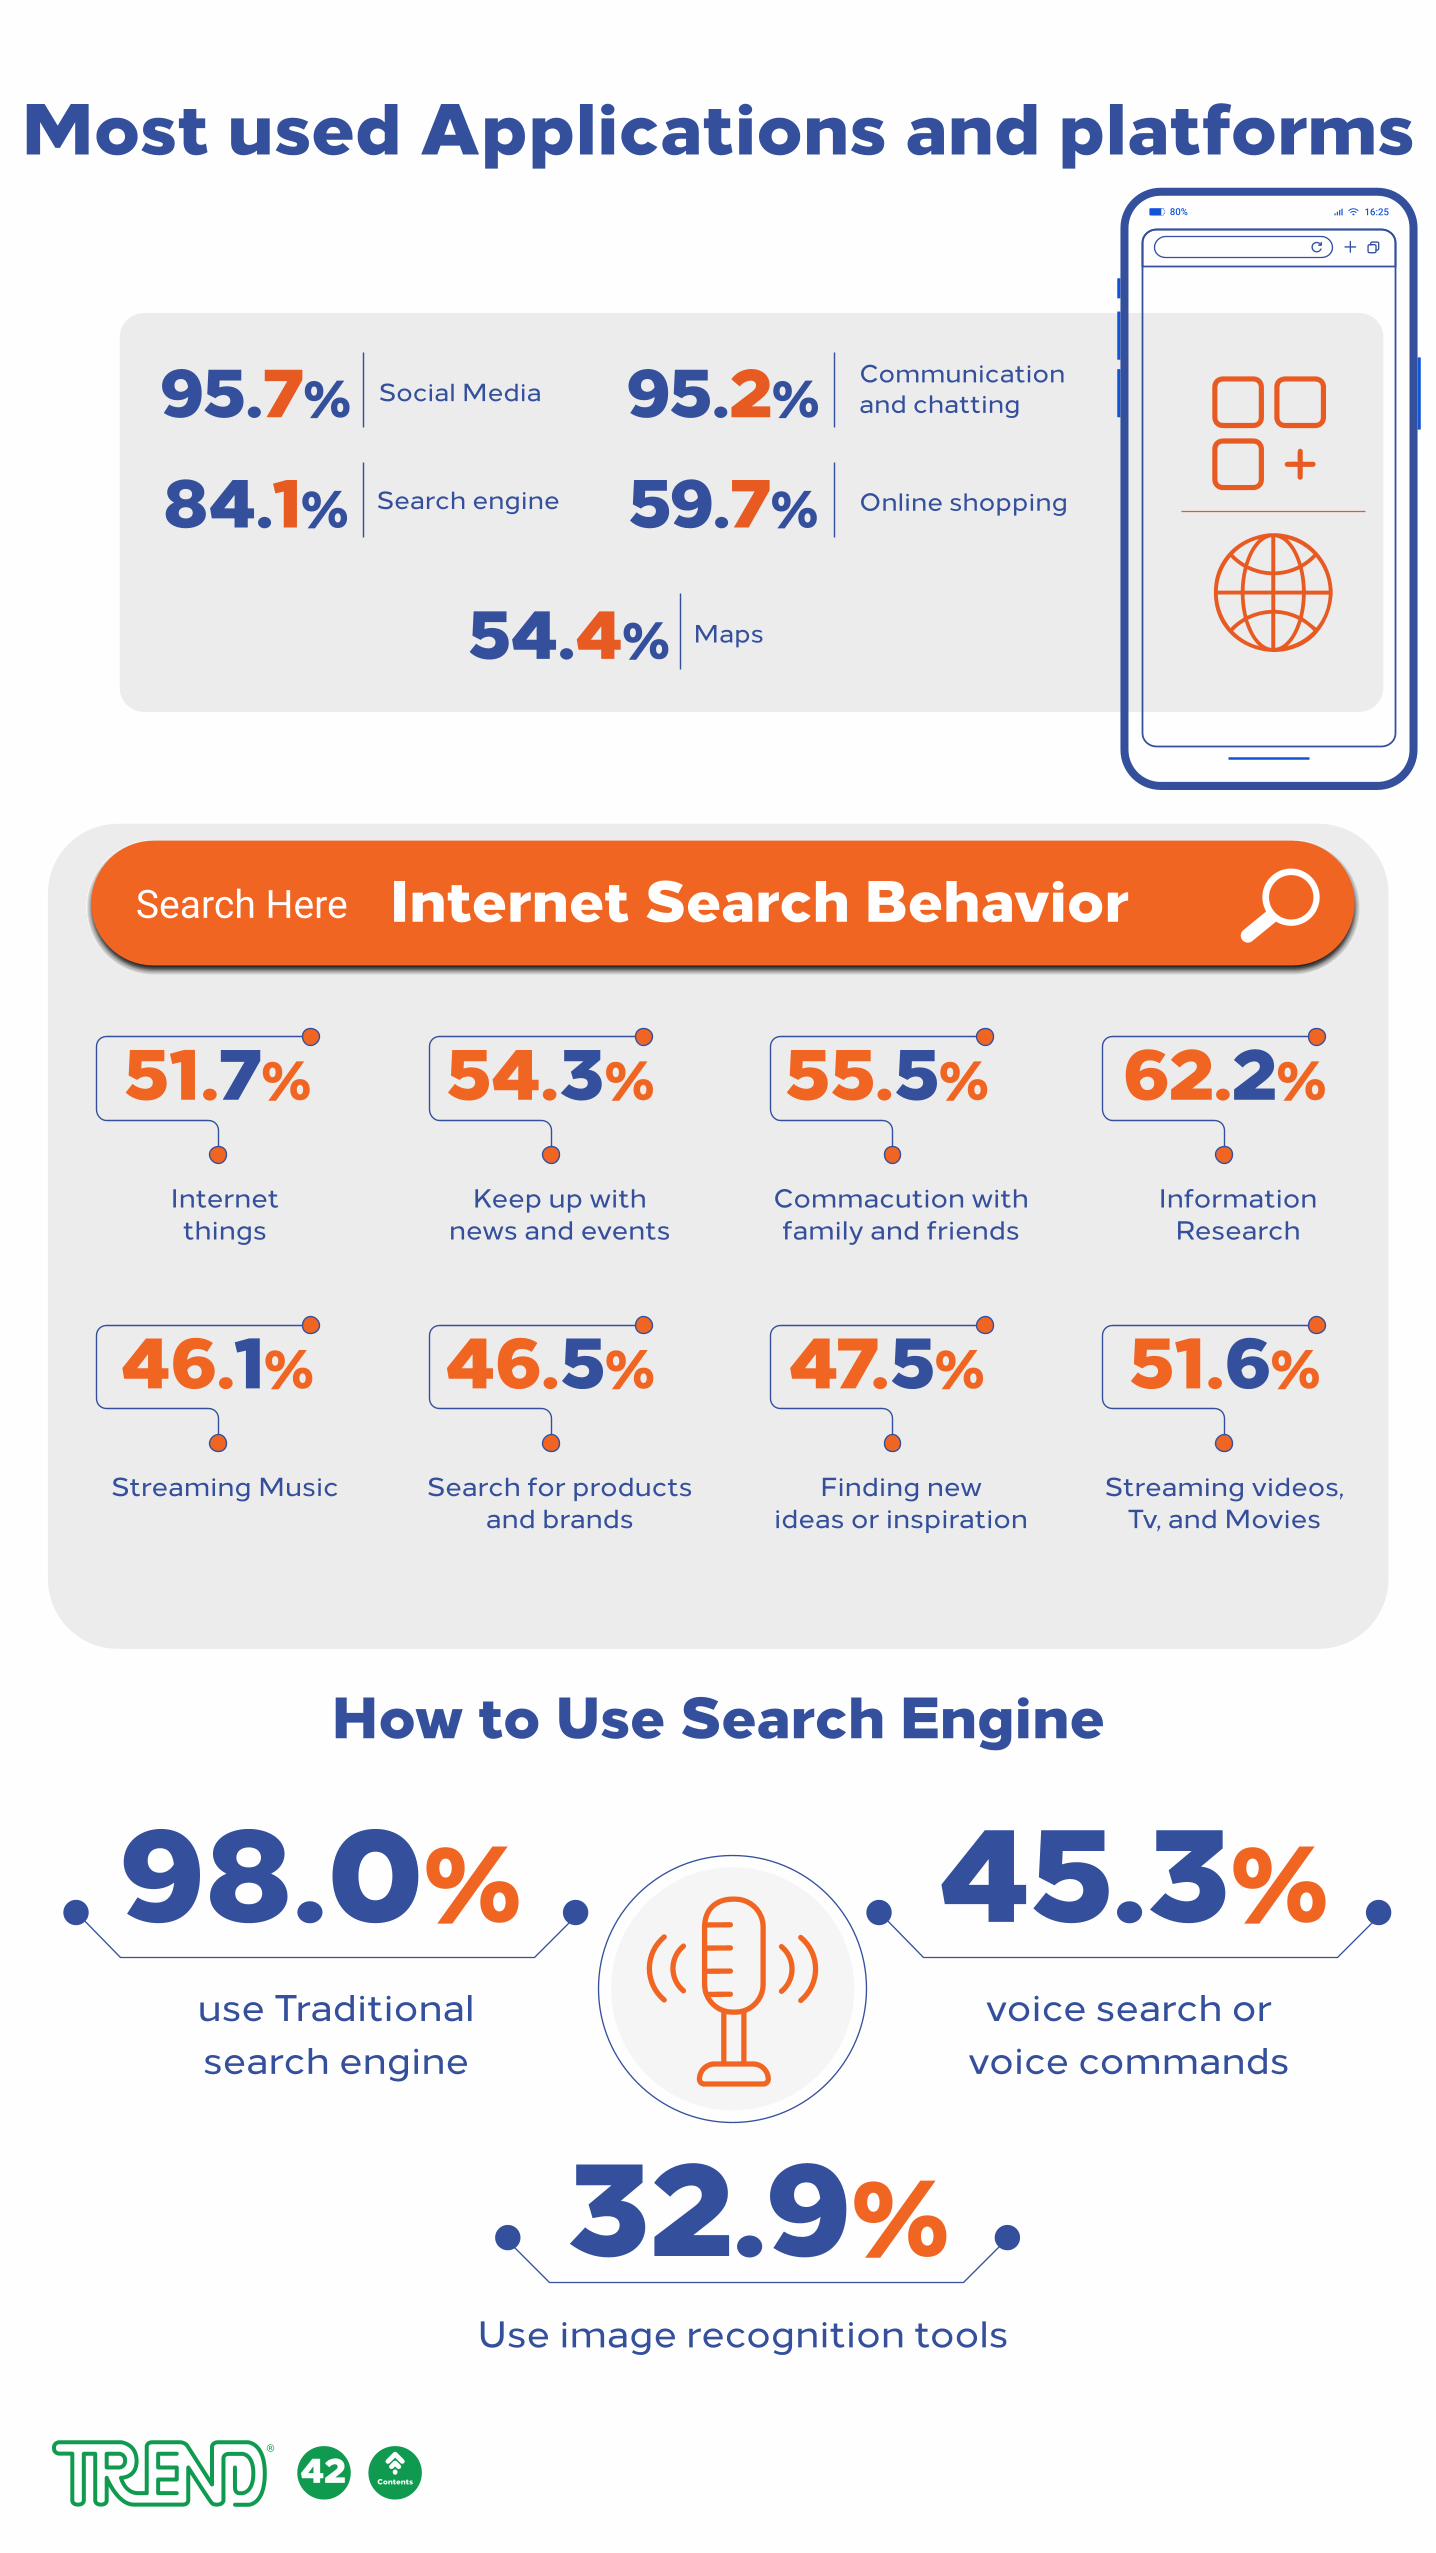
Most used Applications and platforms
95.7٪
62.2%55.5٪54.3٪51.7٪
Social Media
84.1٪ Search engine
54.4٪ Maps
59.7٪ Online shopping
95.2٪ Communicationand chatting
Internet Search Behavior
How to Use Search Engine
InformationResearch
Commacution withfamily and friends
Keep up withnews and events
Internetthings
51.6٪47.5٪46.5٪46.1٪
Streaming videos,Tv, and Movies
Finding newideas or inspiration
Search for productsand brands
Streaming Music
32.9٪
98.0٪use Traditionalsearch engine
45.3٪voice search or
voice commands
Use image recognition tools
42 Contents
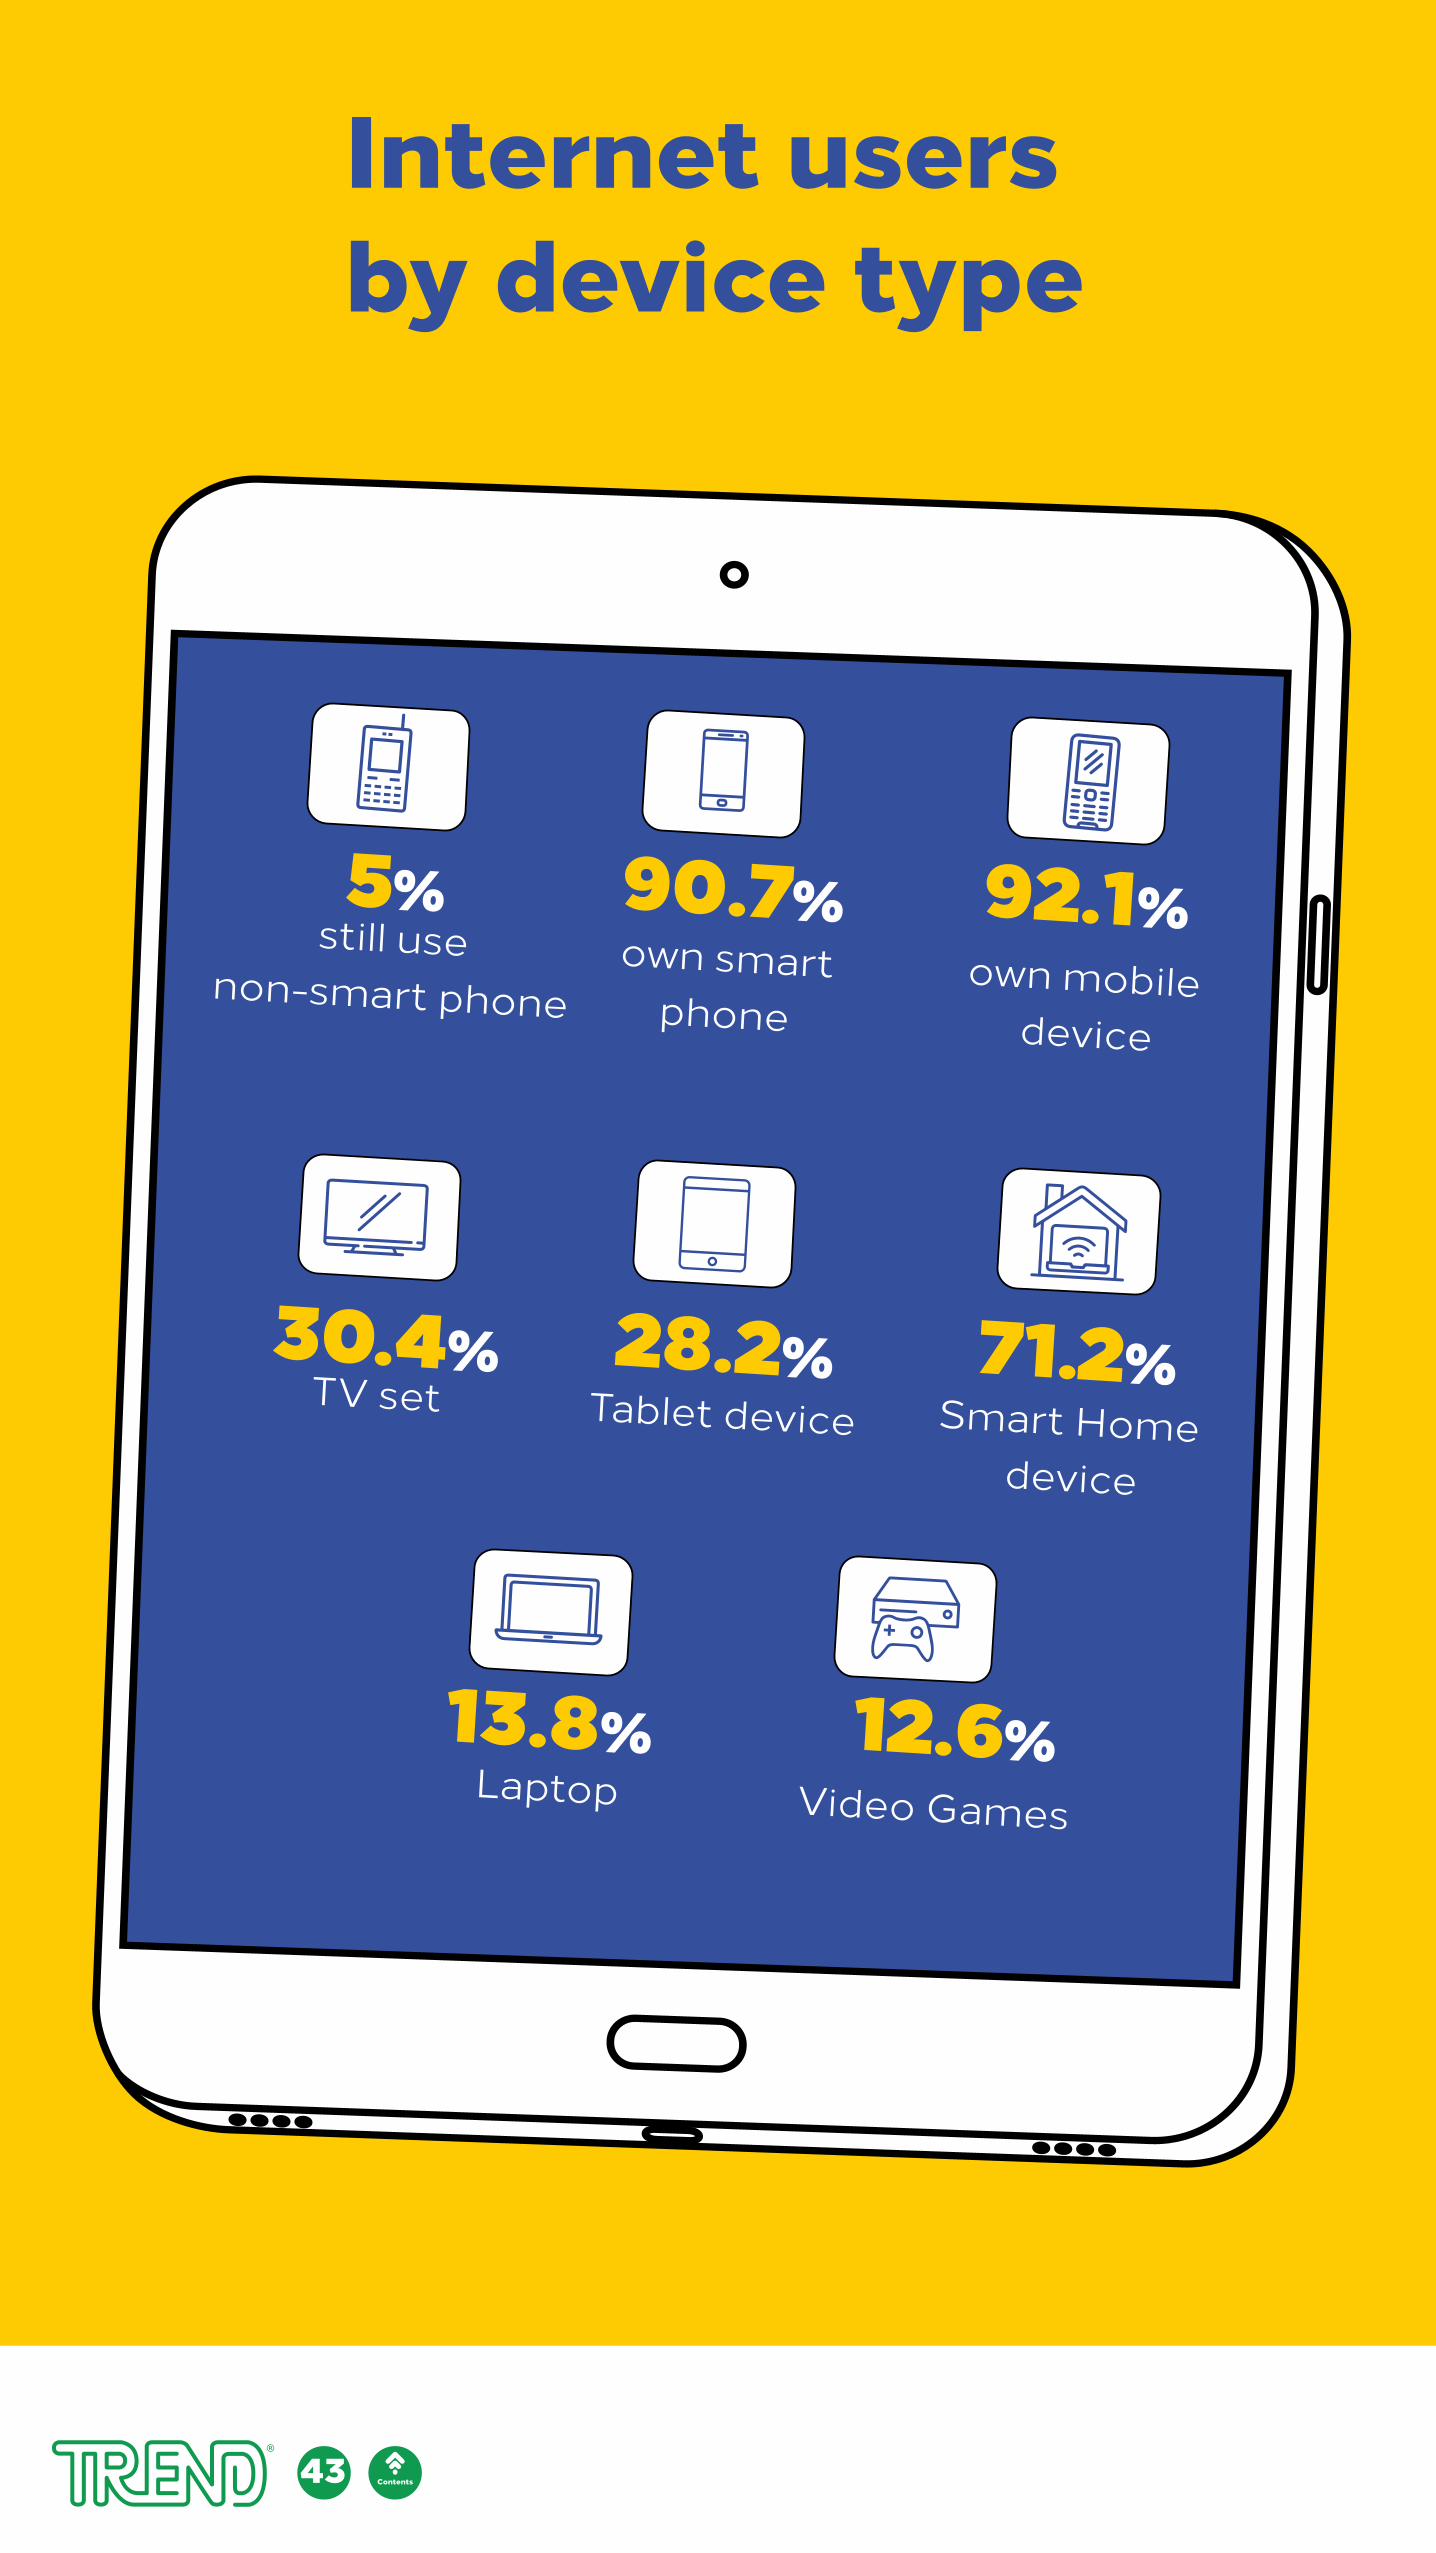
Internet users by device type
own mobile device
own smartphone
still usenon-smart phone
Laptop
Tablet deviceTV set
Video Games
Smart Home device
92.1%90.7%5%
71.2%28.2%
12.6%13.8%
30.4%
43 Contents
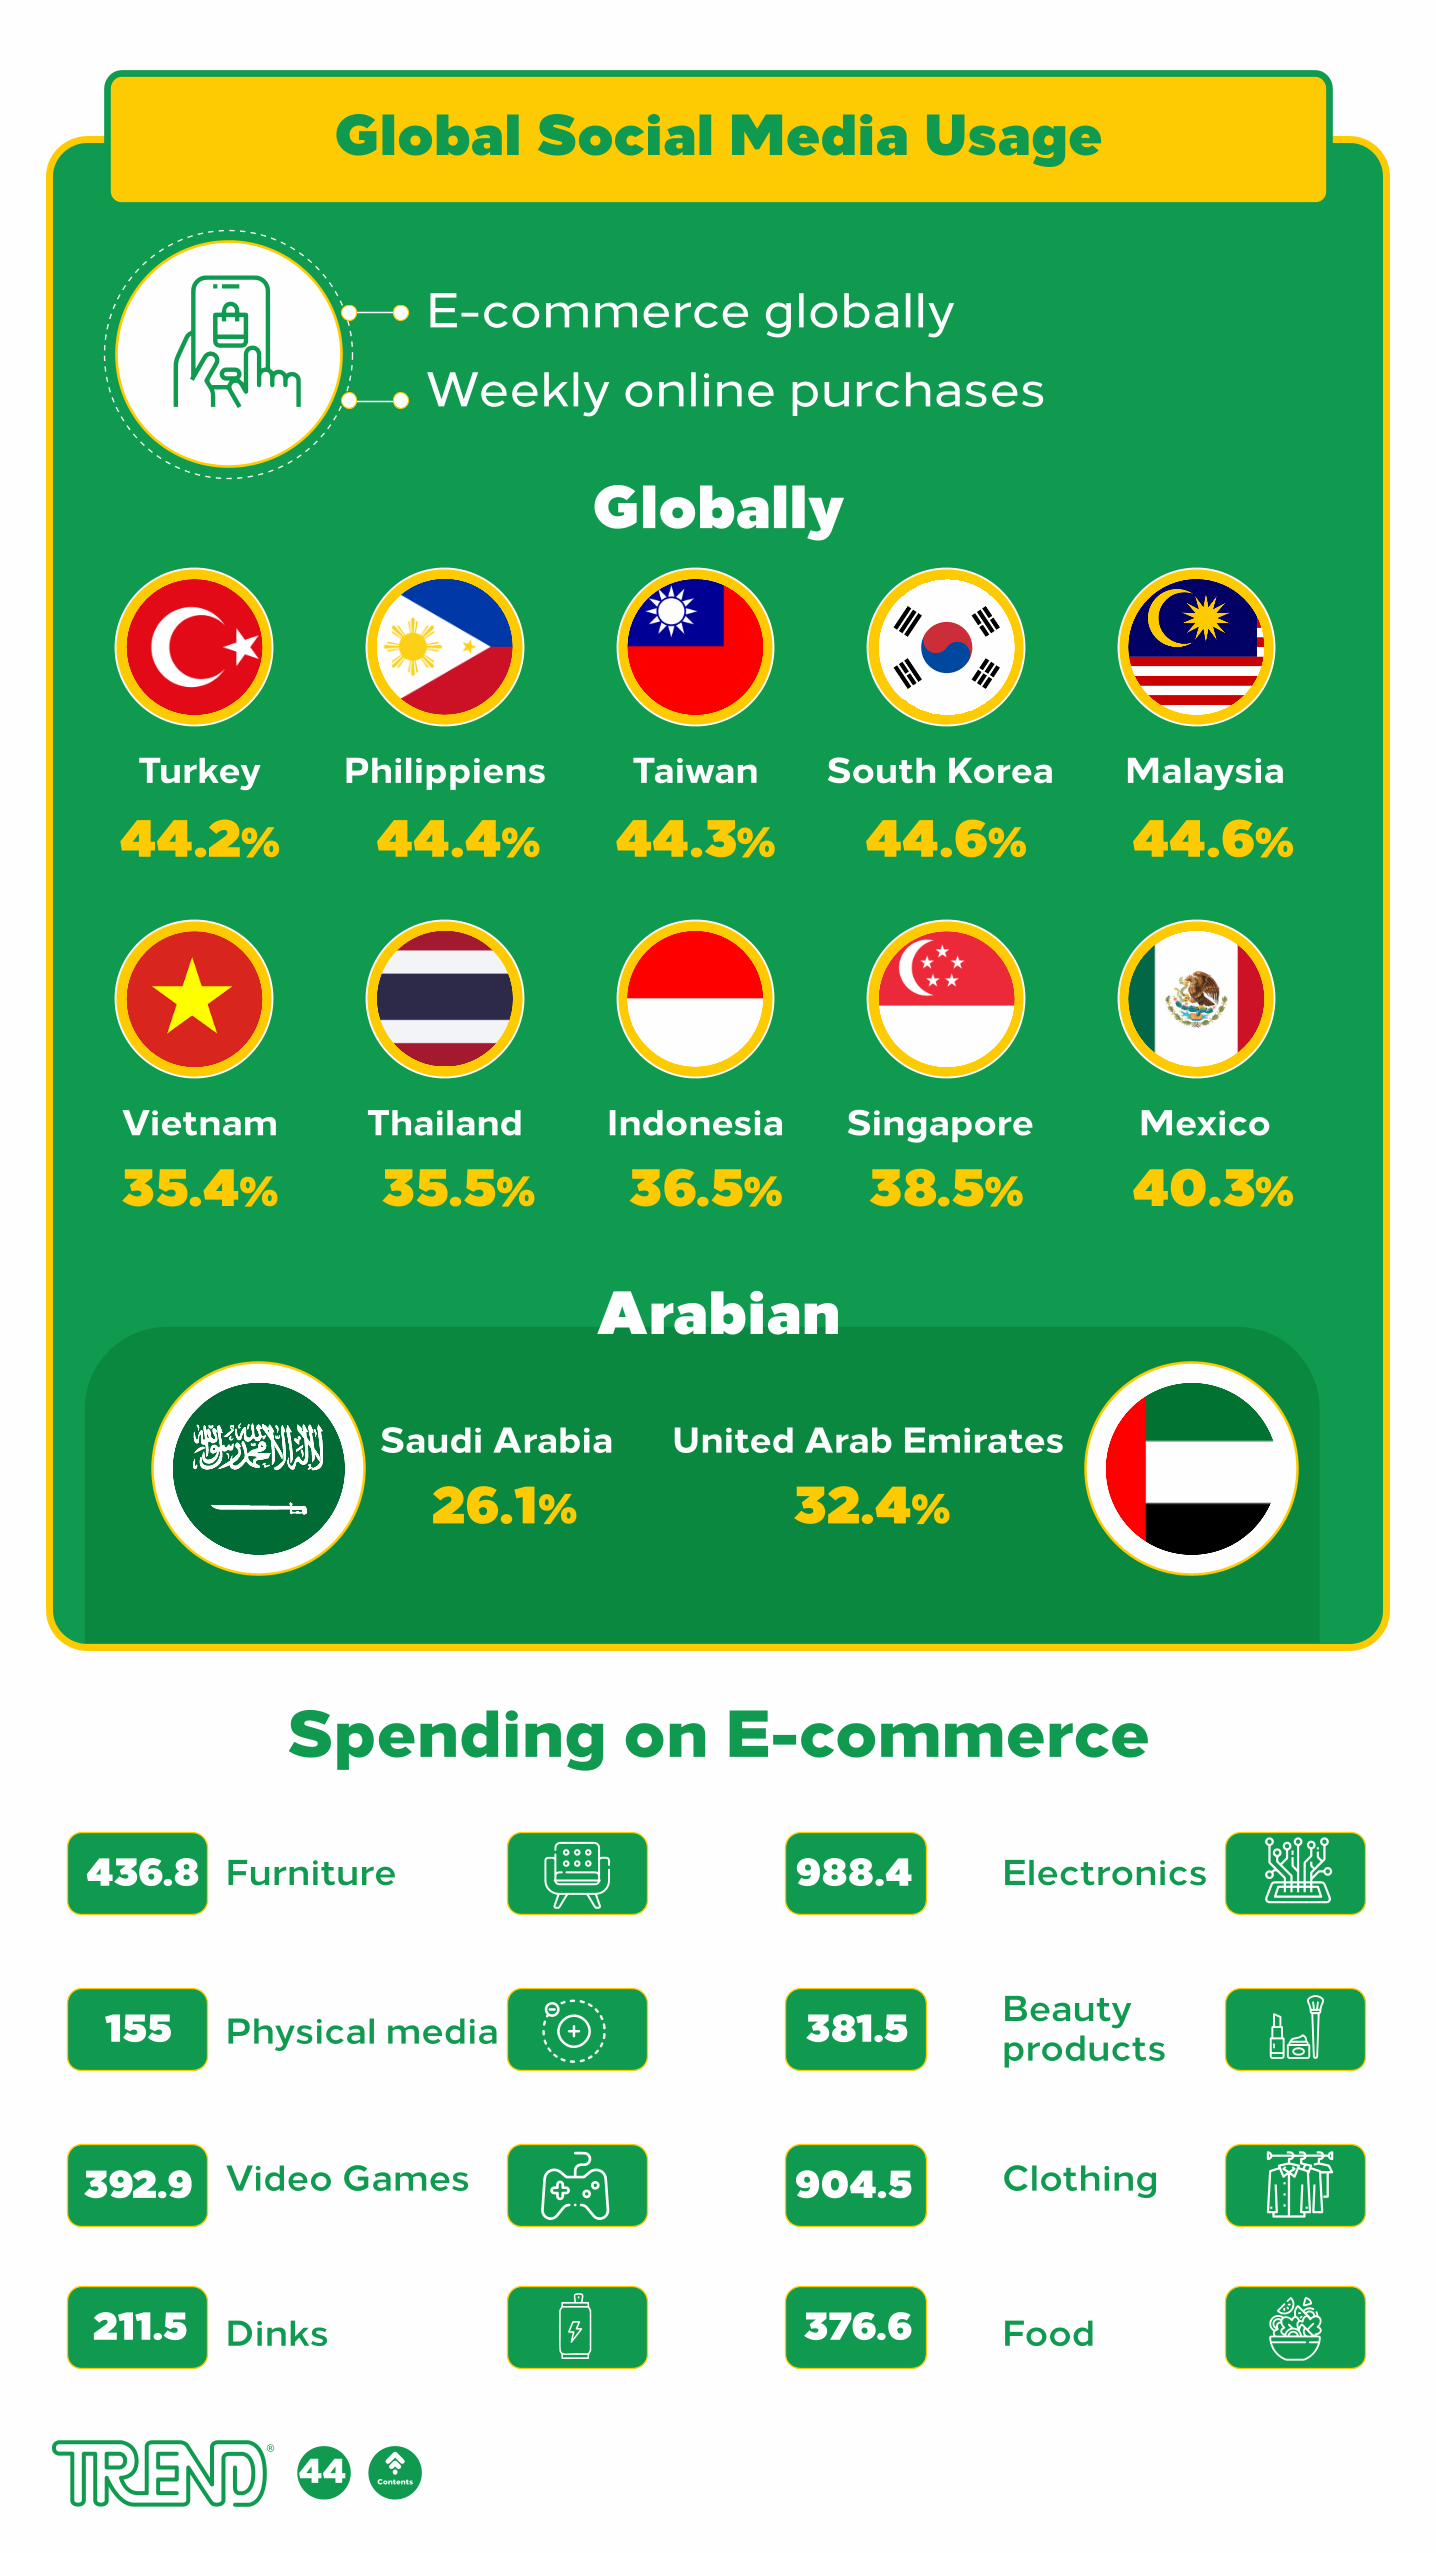
Global Social Media Usage
Spending on E-commerce
E-commerce globallyWeekly online purchases
MalaysiaTaiwanPhilippiensTurkey South Korea
MexicoIndonesiaThailandVietnam Singapore
44.6%44.6%44.3%44.4%44.2%
40.3%38.5%36.5%35.5%35.4%
Globally
Arabian
United Arab Emirates
32.4%Saudi Arabia
26.1%
Electronics
Beautyproducts
Clothing
Food
Furniture
Physical media
Video Games
Dinks
988.4
381.5
904.5
376.6
436.8
155
392.9
211.5
44 Contents
45
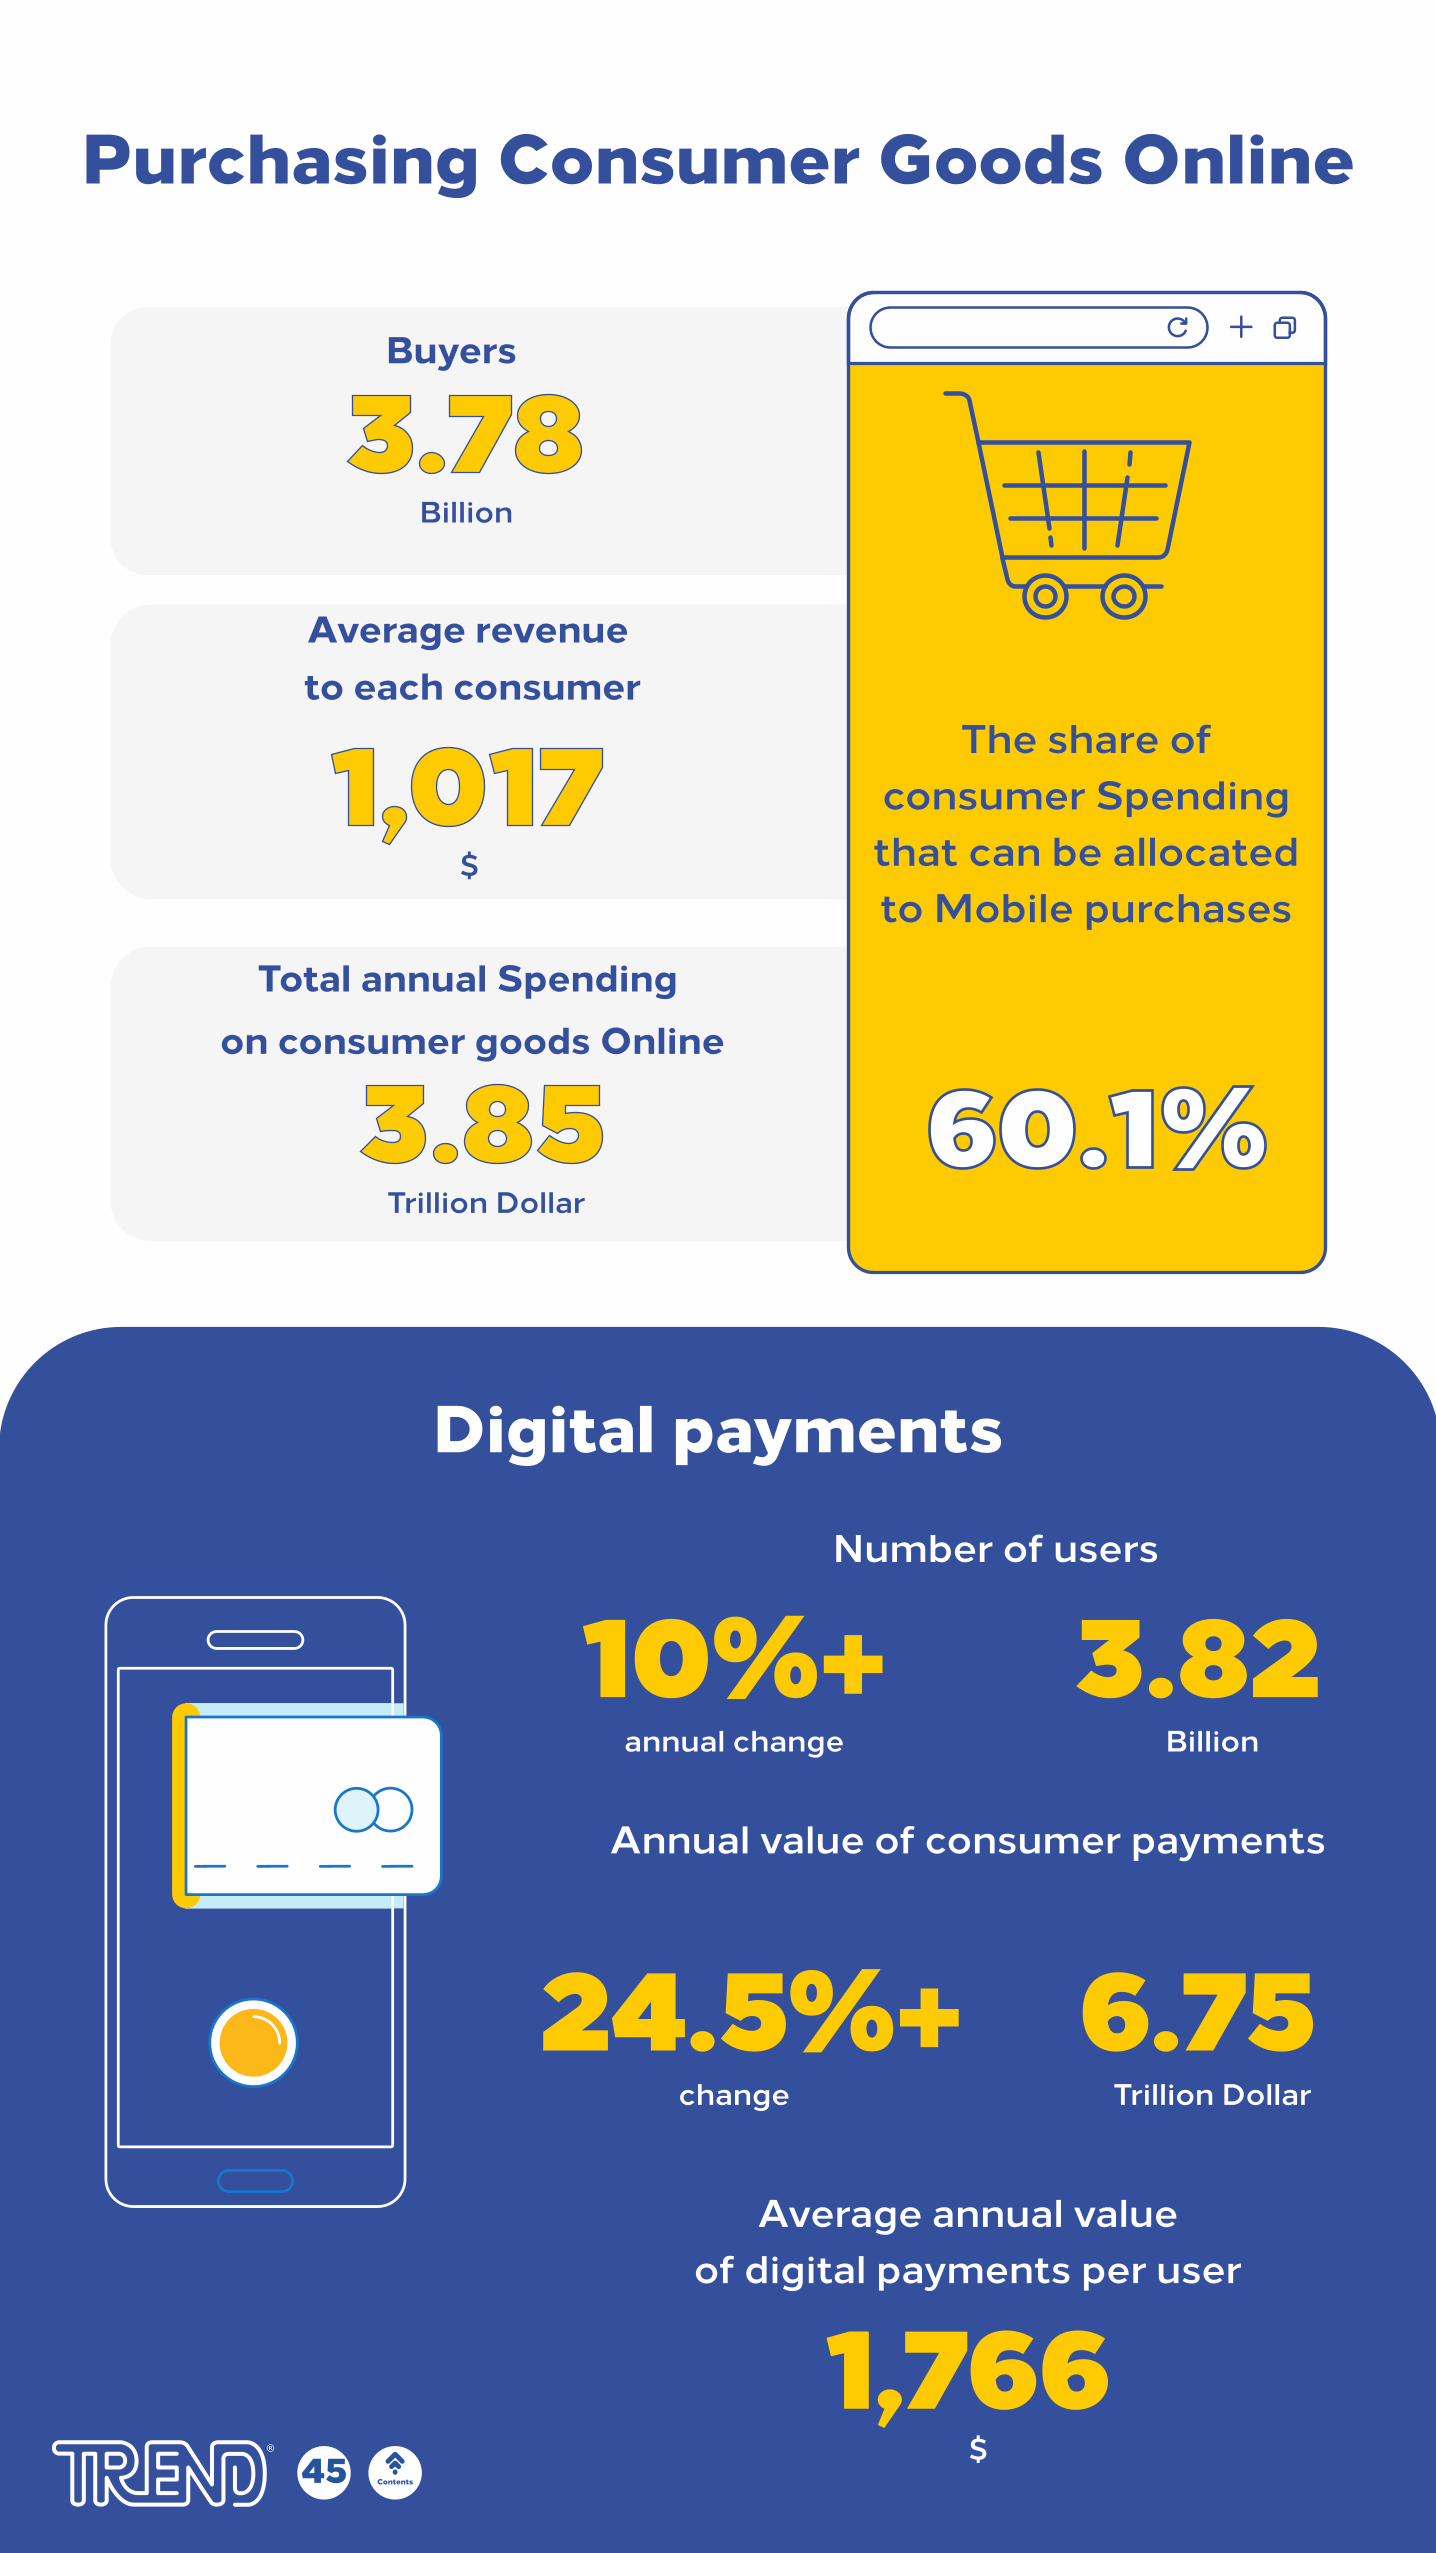
Purchasing Consumer Goods Online
Digital paymentsNumber of users
Annual value of consumer payments
Average annual valueof digital payments per user
Buyers
Average revenue to each consumer
Total annual Spending on consumer goods Online
3.78
60.1%
1,017
Billion
$
3.85
3.8210%+
Trillion Dollar
Billionannual change
6.75
1,766
24.5%+Trillion Dollar
$
change
The share of consumer Spending that can be allocatedto Mobile purchases
Contents
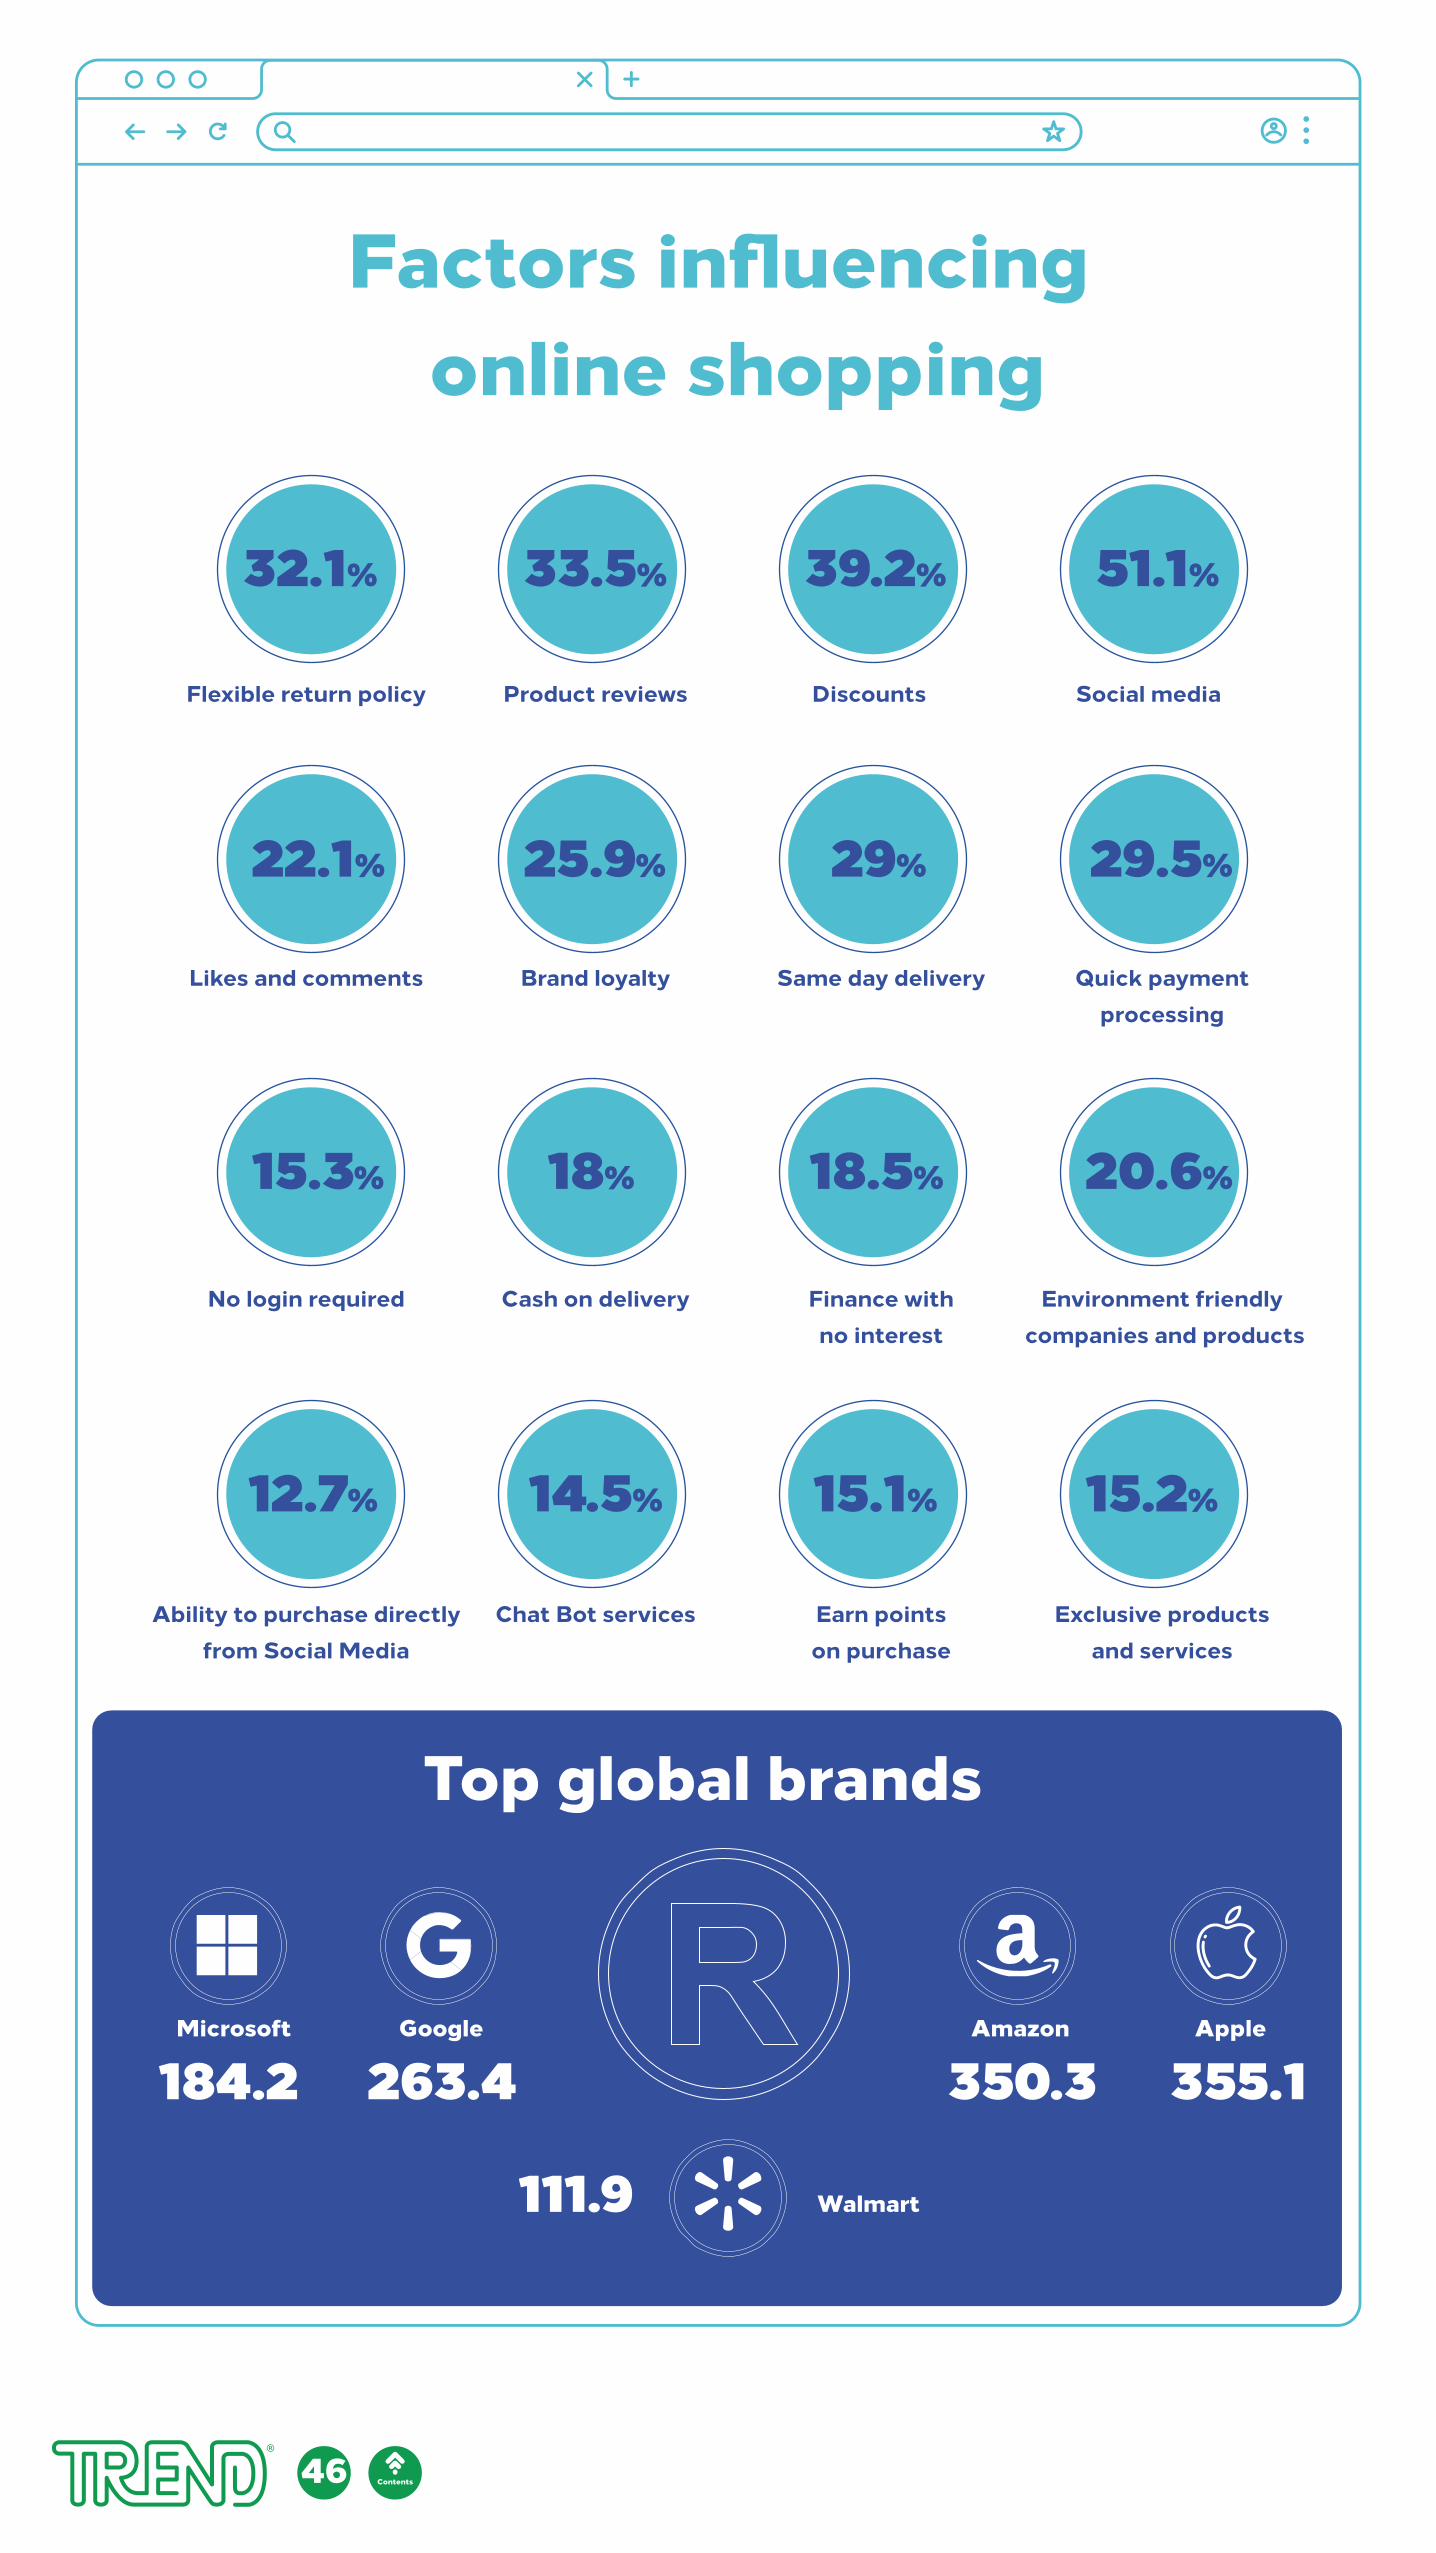
Top global brands
Factors influencing online shopping
Social mediaDiscountsProduct reviewsFlexible return policy
Quick paymentprocessing
Same day deliveryBrand loyaltyLikes and comments
Environment friendly companies and products
Finance withno interest
Cash on deliveryNo login required
Exclusive productsand services
Earn pointson purchase
Chat Bot servicesAbility to purchase directlyfrom Social Media
51.1%39.2%33.5%32.1%
29.5%29%25.9%22.1%
20.6%18.5%18%15.3%
15.2%
355.1350.3
15.1%14.5%12.7%
AppleAmazon
263.4
111.9
184.2Google
Walmart
Microsoft
46 Contents
Digitalcontentglobally
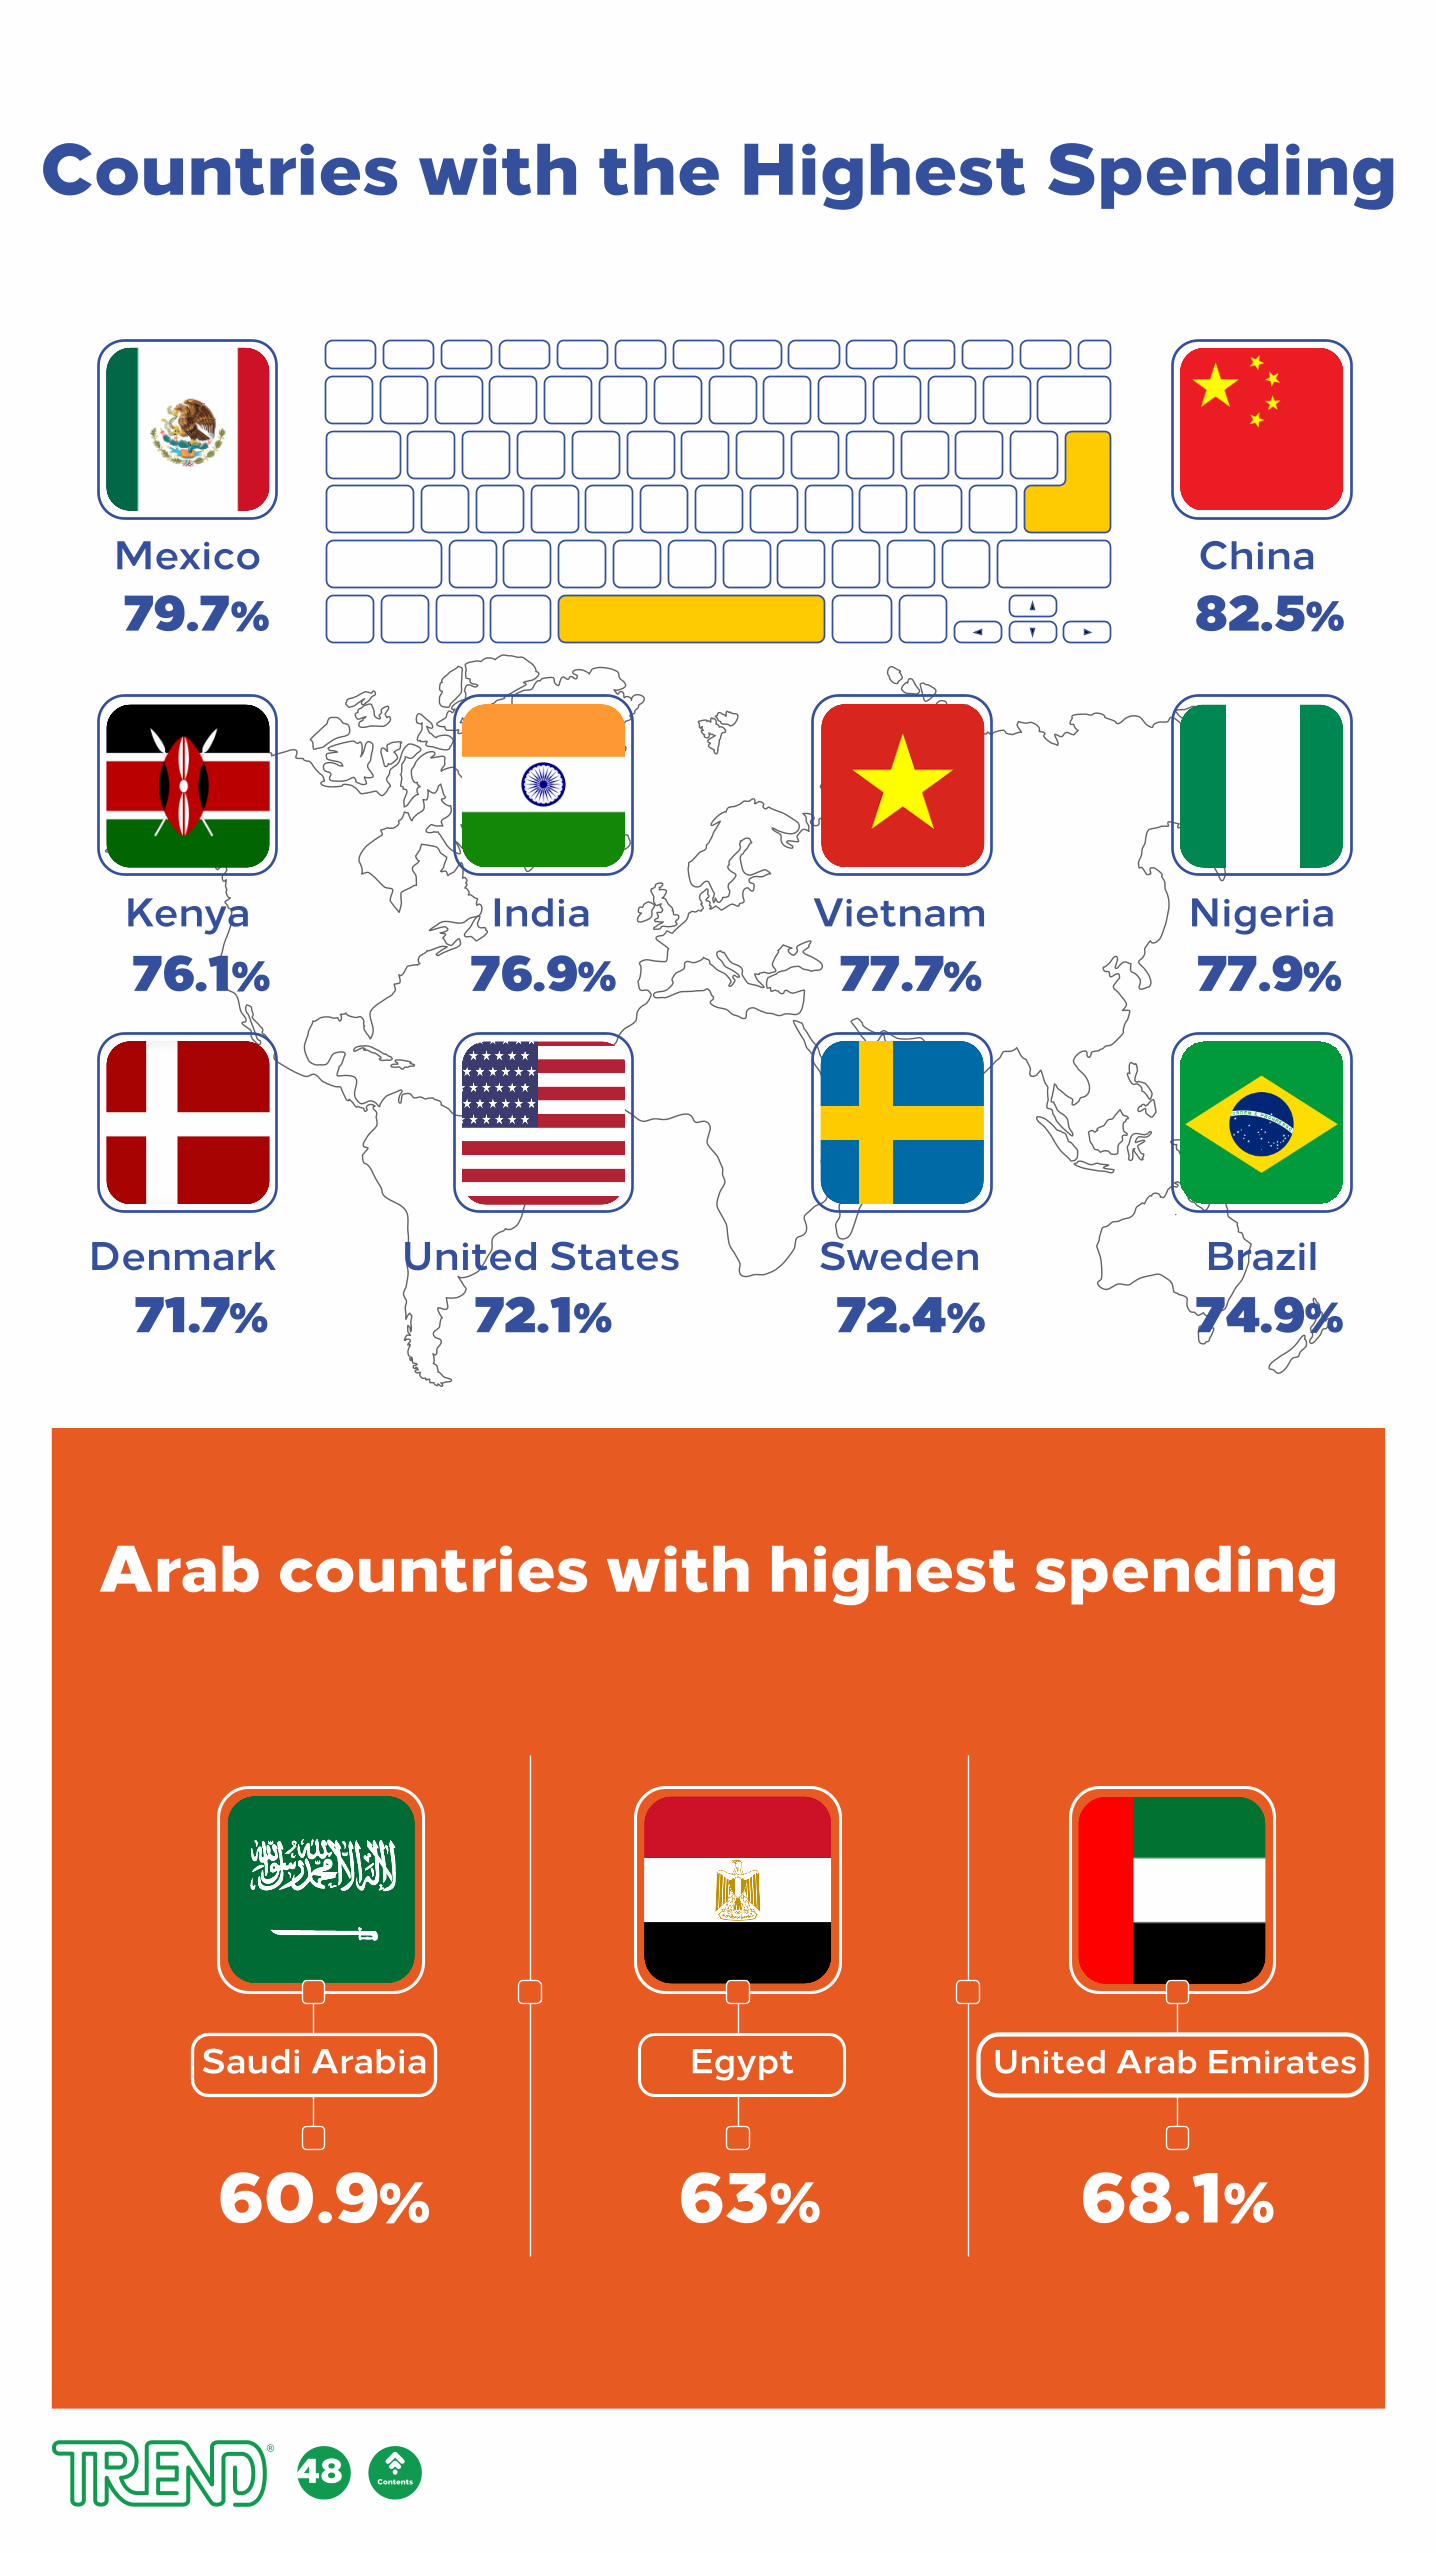
Countries with the Highest Spending
Arab countries with highest spending
China
NigeriaVietnamIndiaKenya
BrazilSwedenUnited StatesDenmark
Mexico82.5%
77.9%77.7%76.9%76.1%
74.9%
68.1%63%60.9%
72.4%72.1%71.7%
79.7%
United Arab EmiratesEgyptSaudi Arabia
48 Contents
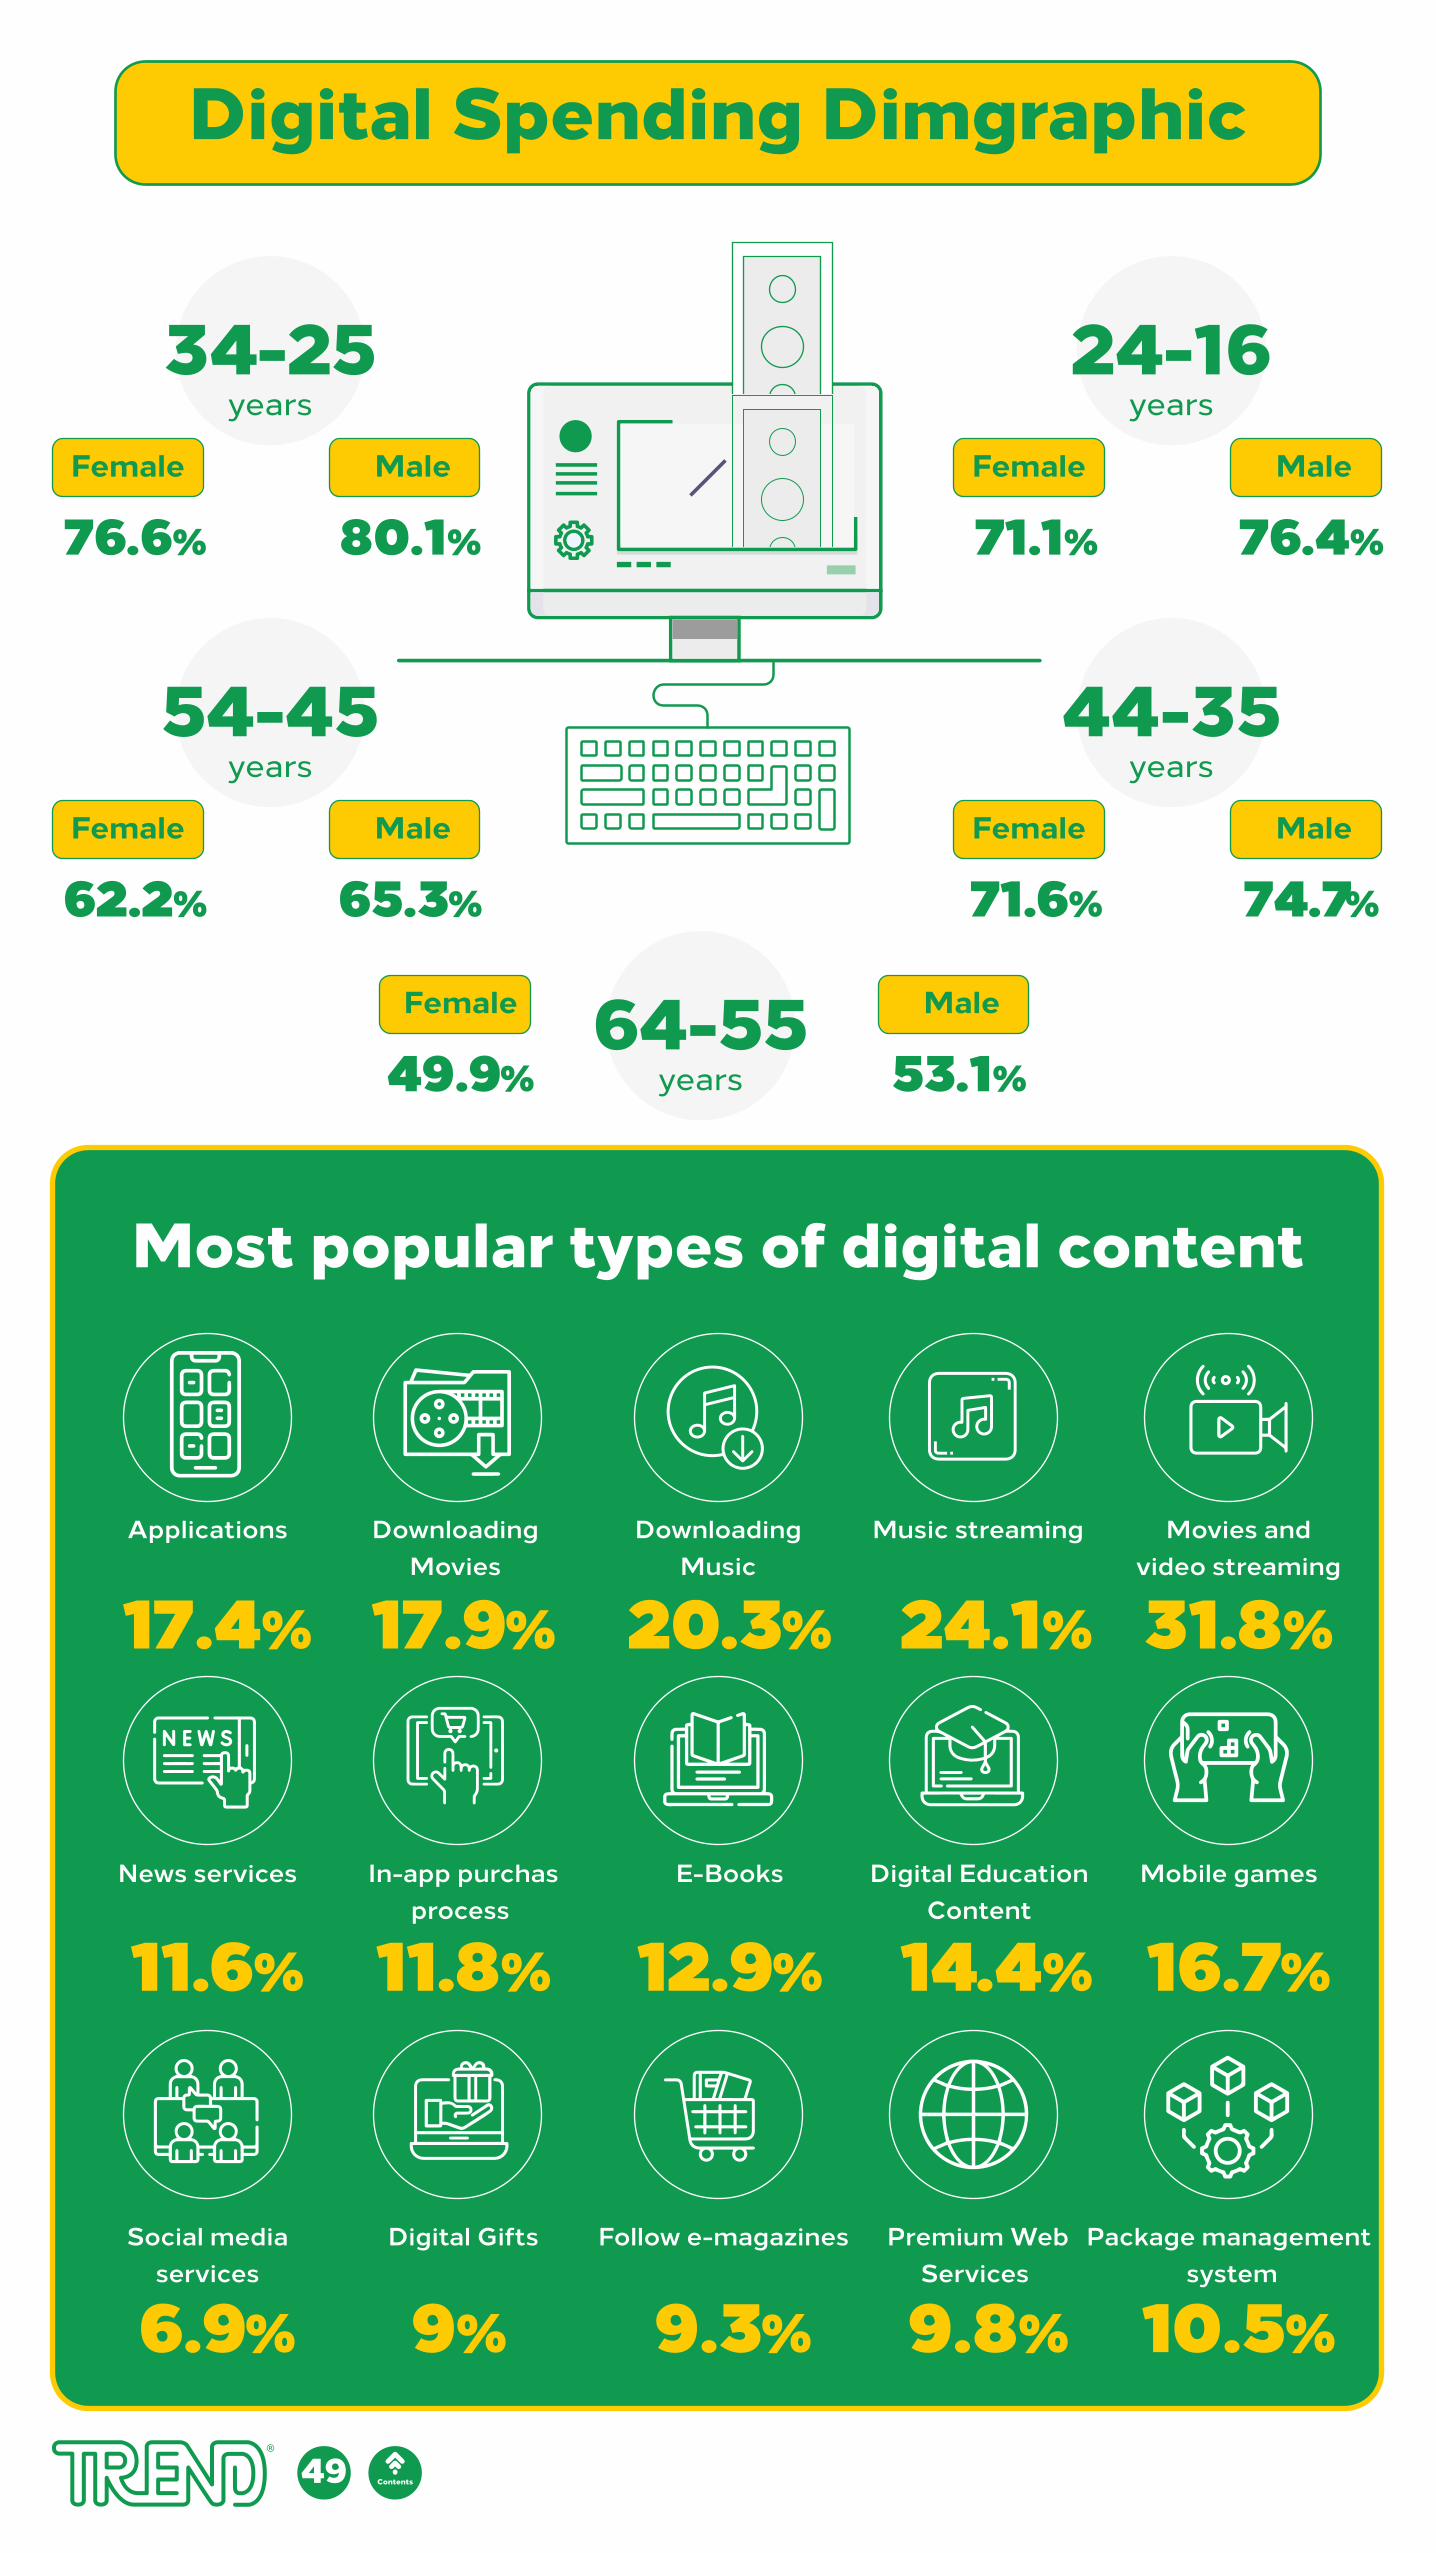
Digital Spending Dimgraphic
24-16years
MaleFemale
76.4%71.1%
34-25years
MaleFemale
80.1%76.6%
44-35years
64-55years
MaleFemale
74.7%
Male
53.1%
Female
49.9%
71.6%
54-45years
MaleFemale
65.3%62.2%
Most popular types of digital content
Movies andvideo streaming
Music streamingDownloadingMusic
DownloadingMovies
Applications
Mobile gamesDigital EducationContent
E-BooksIn-app purchasprocess
News services
Package management system
Premium WebServices
Follow e-magazinesDigital GiftsSocial mediaservices
6.9% 9% 9.3% 9.8% 10.5%
16.7%
31.8%17.4% 17.9% 20.3% 24.1%
11.6% 11.8% 12.9% 14.4%
49 Contents
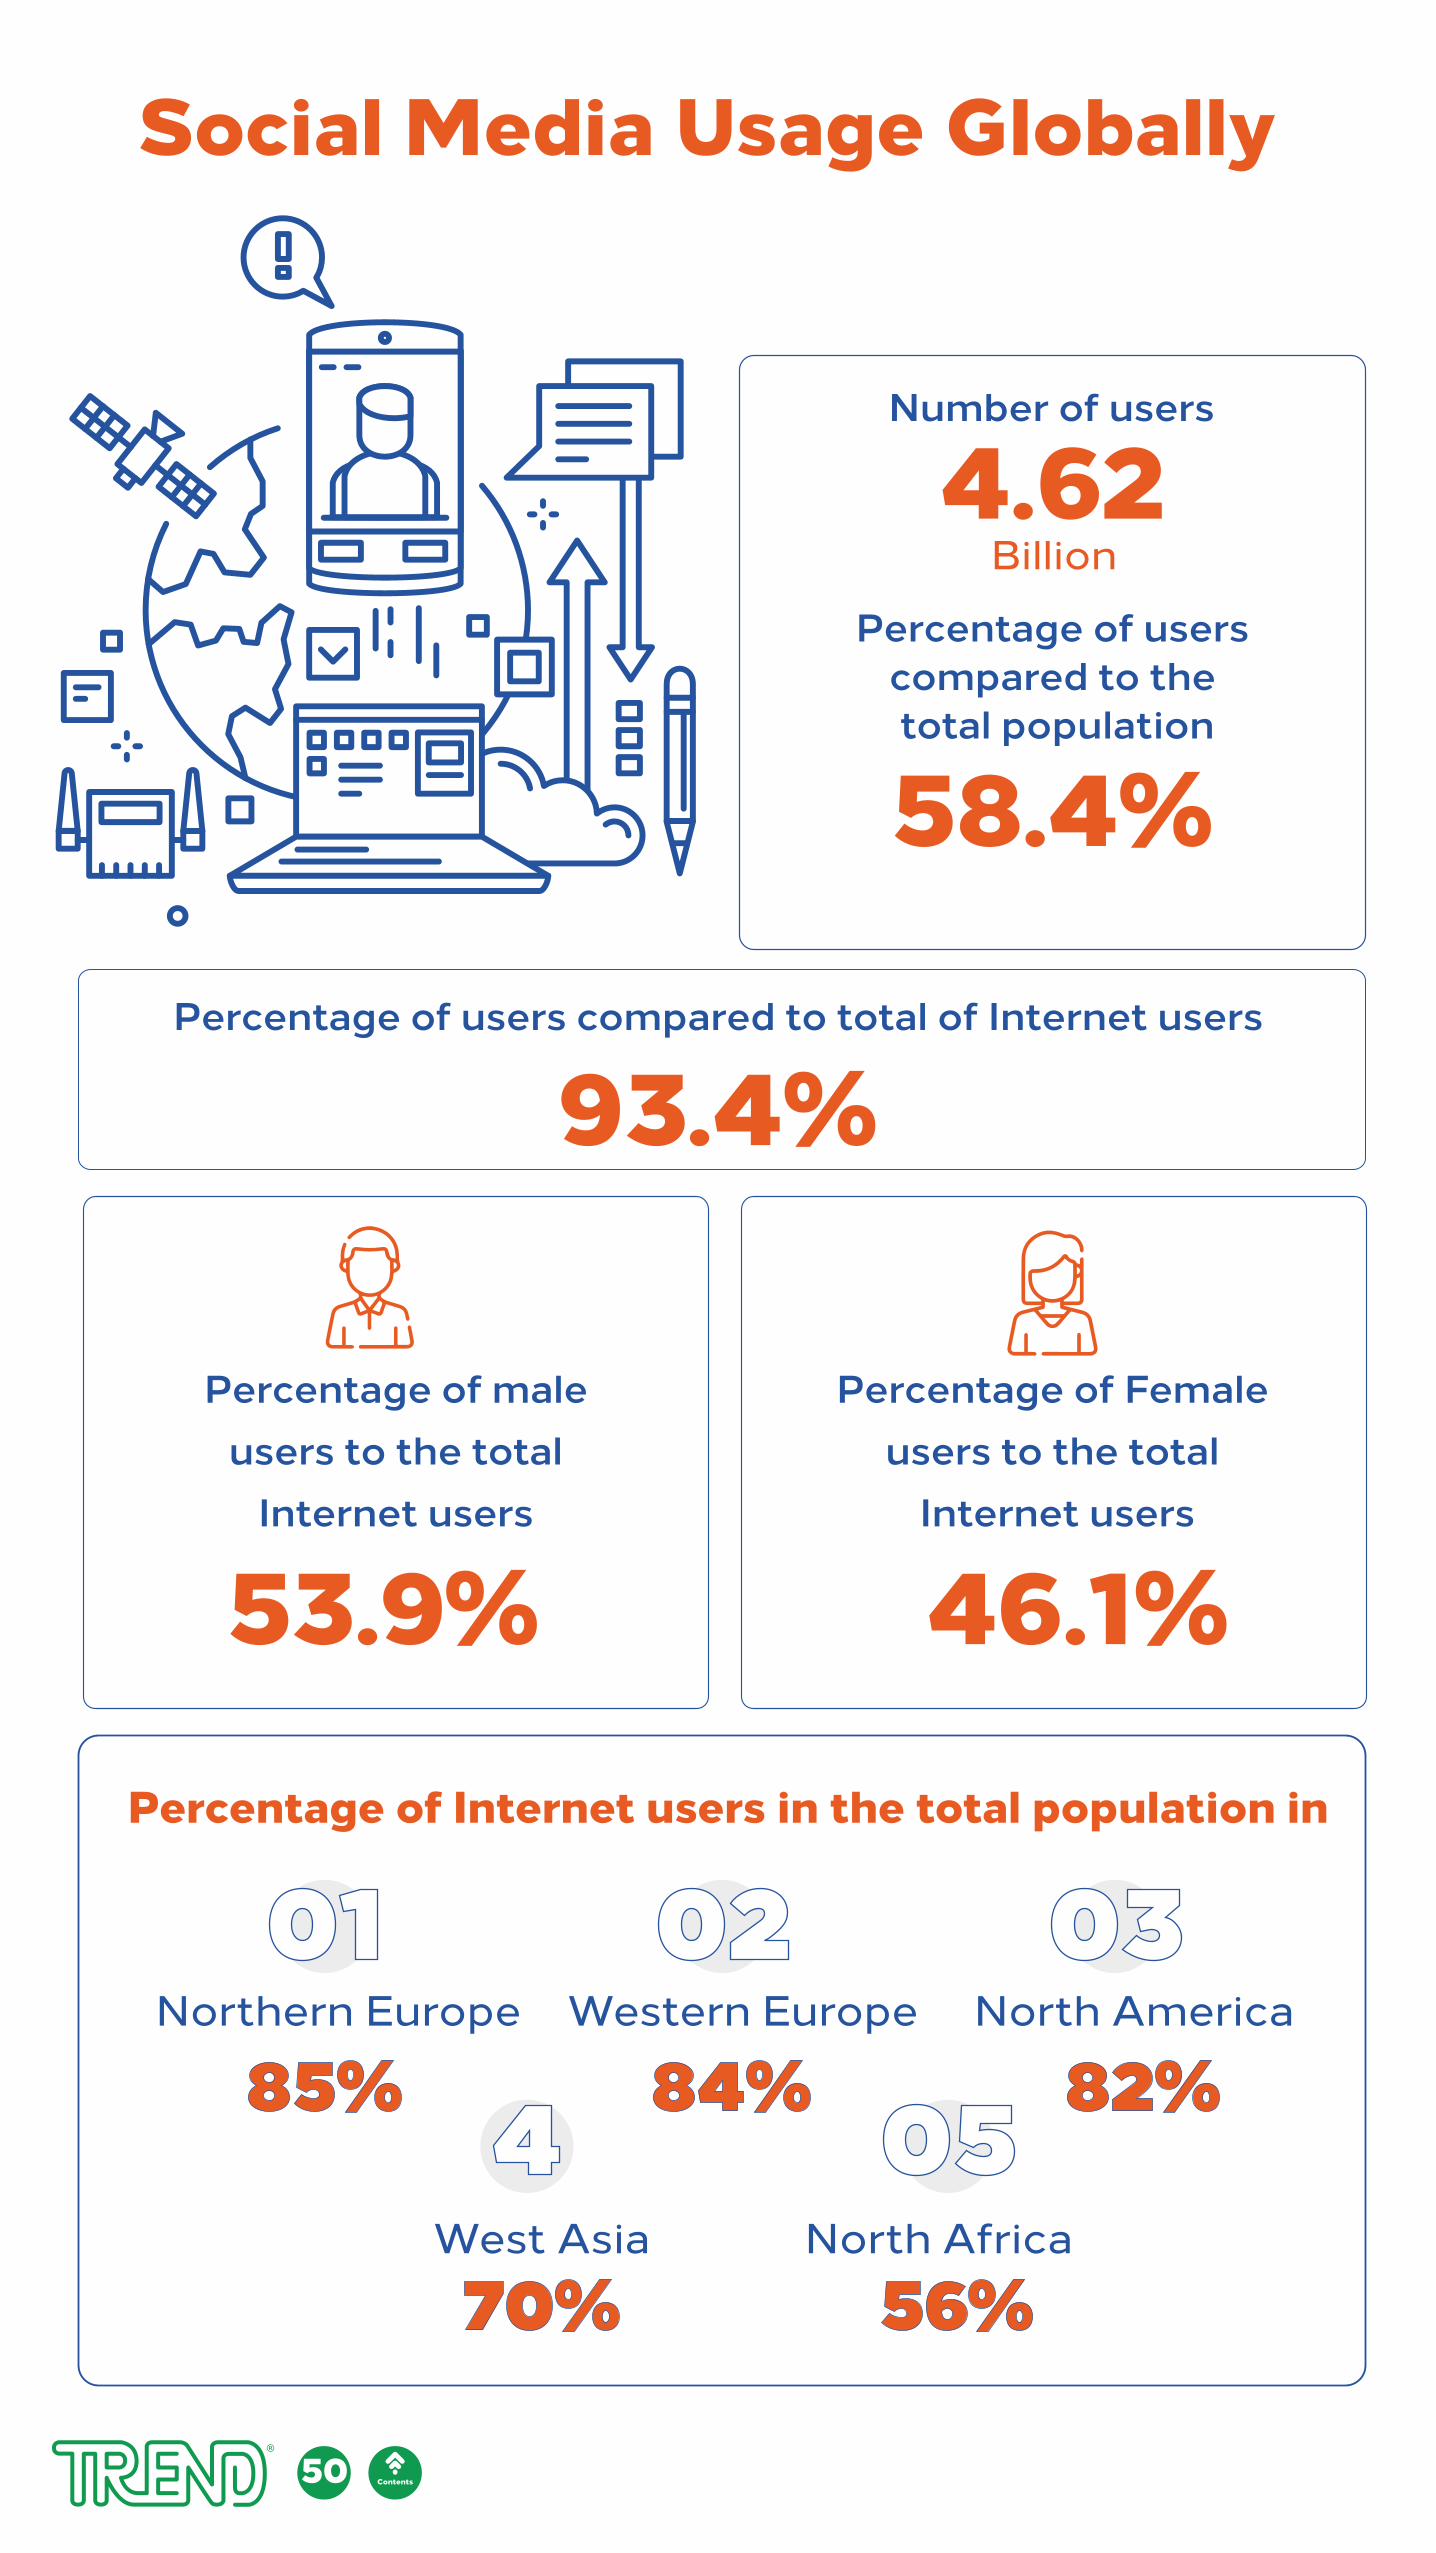
Social Media Usage Globally
4.62Billion
Number of users
58.4%
93.4%
Percentage of userscompared to the total population
Percentage of users compared to total of Internet users
46.1%53.9%
Percentage of Femaleusers to the total
Internet users
Percentage of Internet users in the total population in
Percentage of maleusers to the total
Internet users
Northern Europe
85%
01Western Europe
84%
02
West Asia
70%
4North Africa
56%
05North America
82%
03
50 Contents
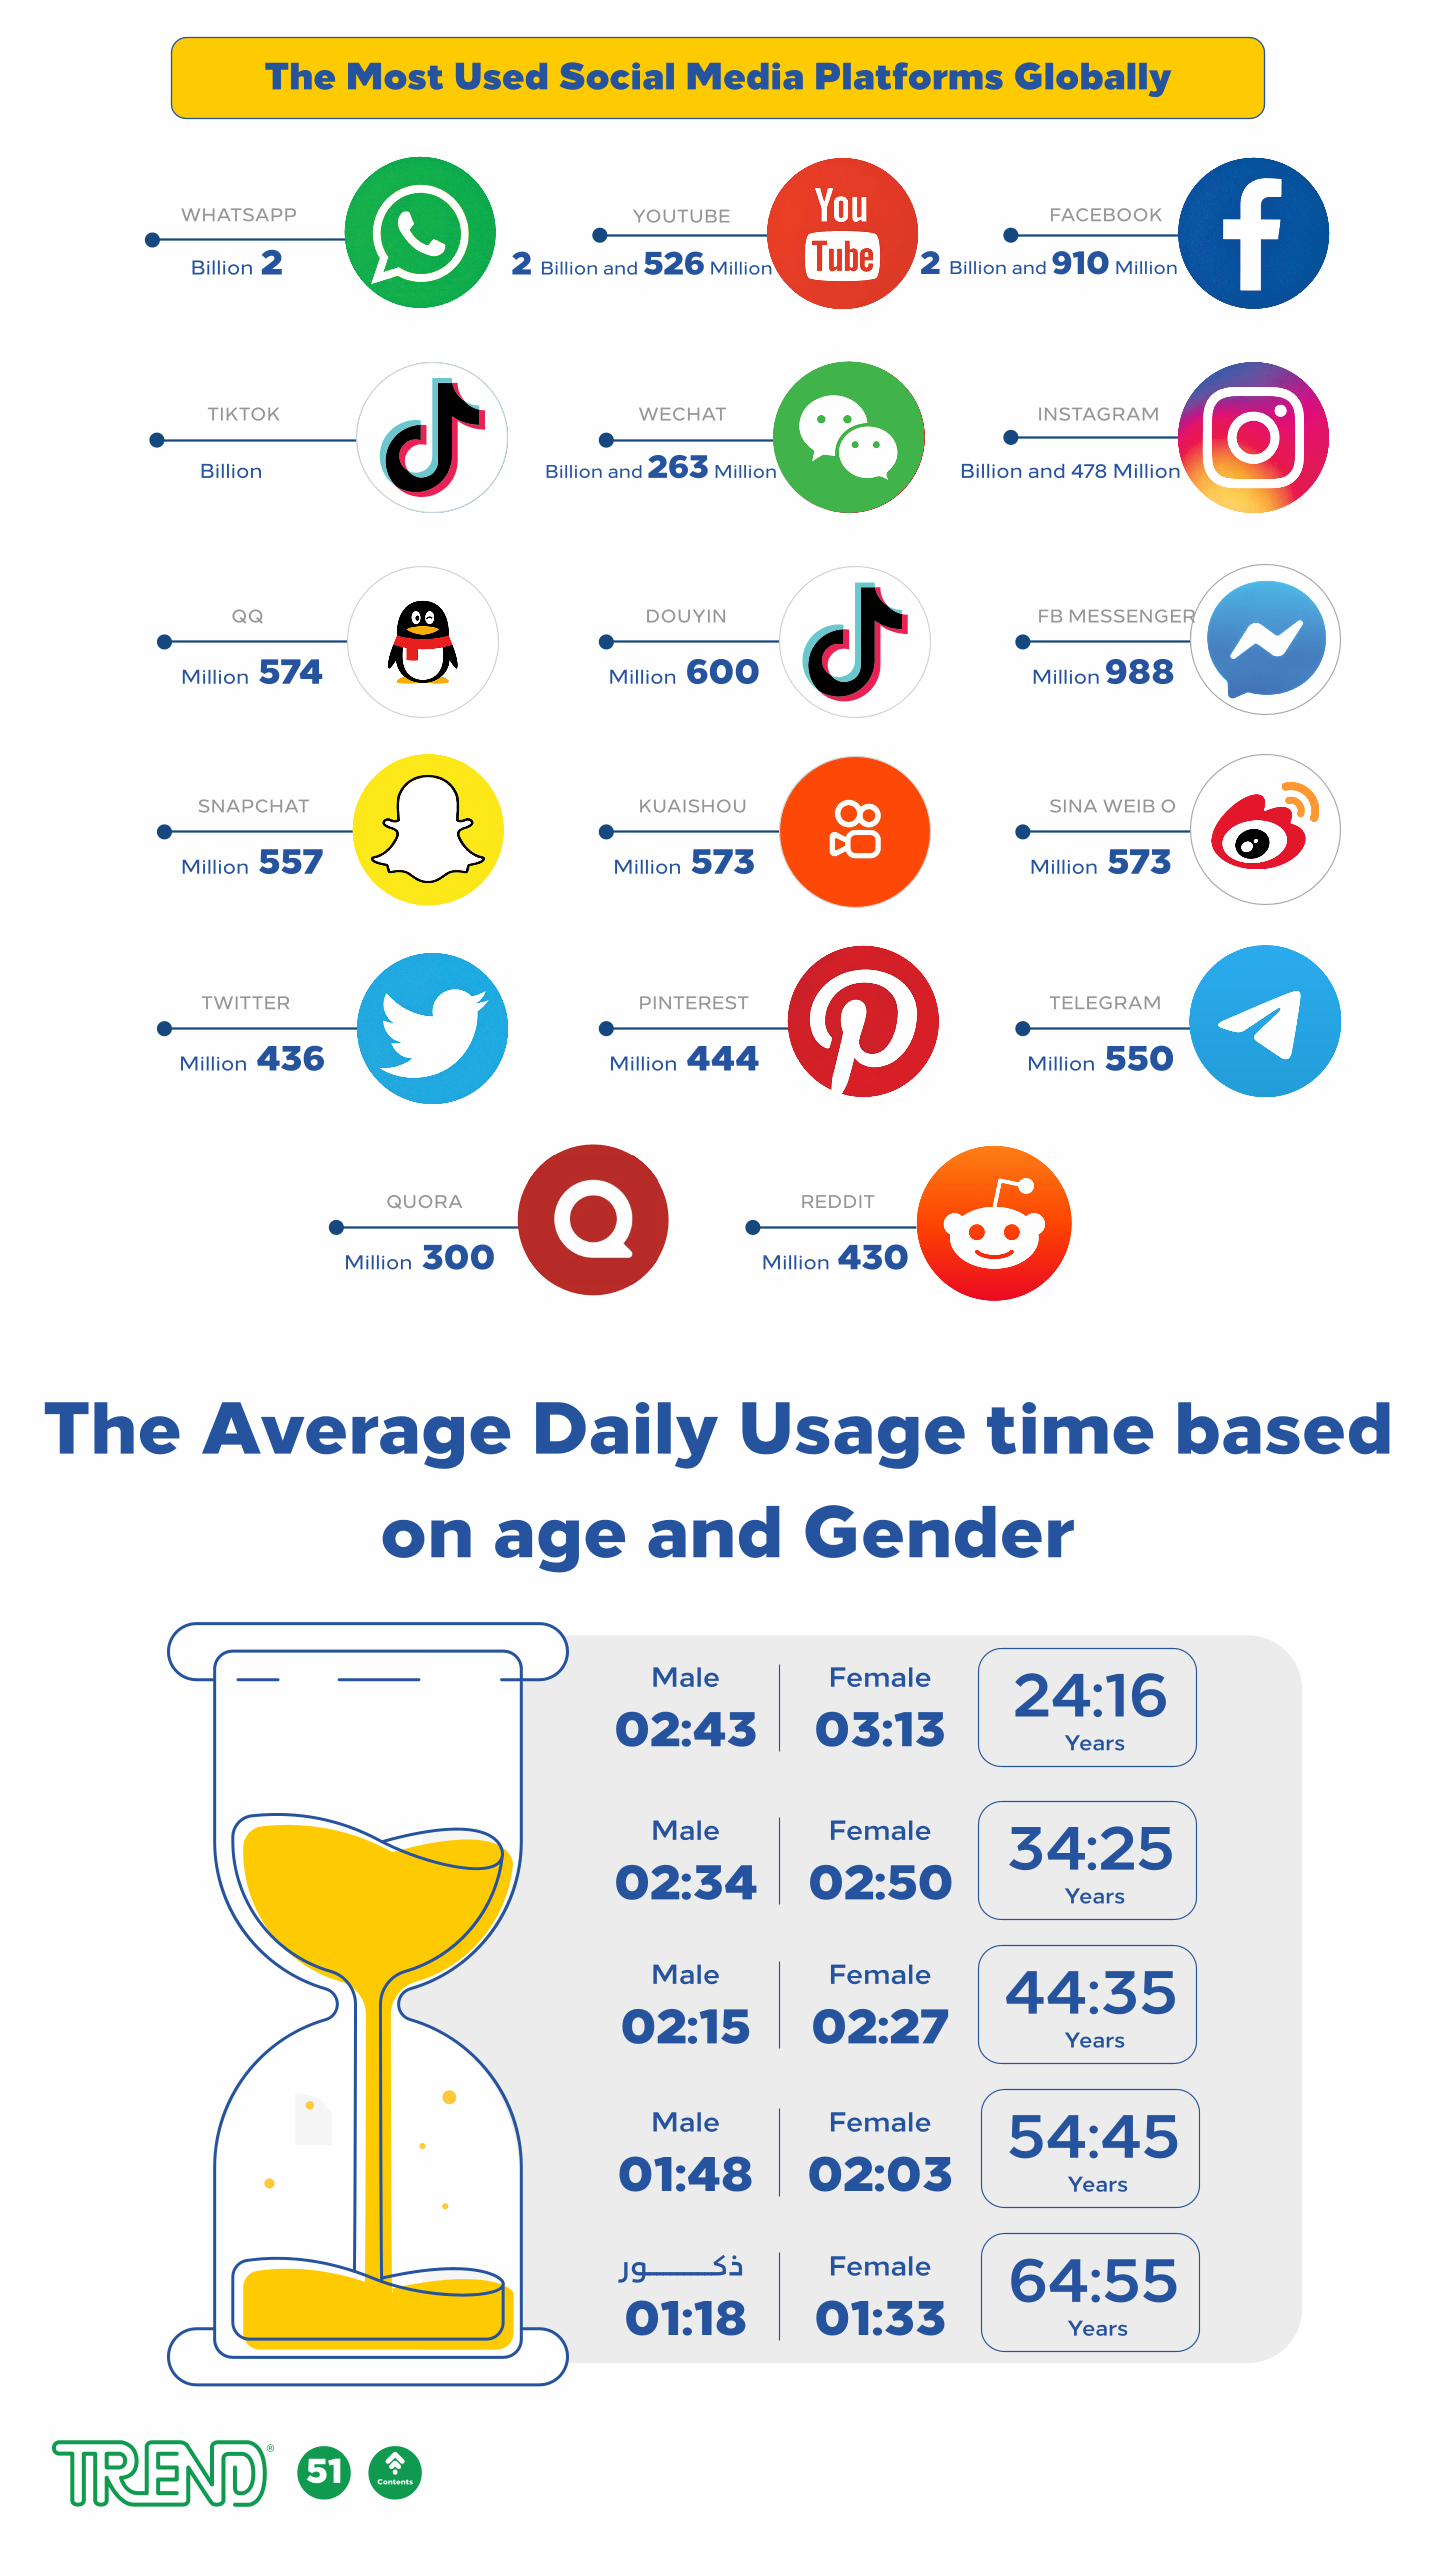
The Average Daily Usage time based on age and Gender
24:1603:13 Years
Female
02:43Male
34:2502:50 Years
Female
02:34Male
44:3502:27 Years
54:45Years
64:55Years
Female
02:15Male
02:03Female
01:48Male
01:33Female
01:18 ذكـــــــــور
The Most Used Social Media Platforms Globally
2 Billion and 910 Million
Billion and 478 Million
Million 988
Billion and 263 MillionBillion
2 Billion and 526 MillionBillion 2YOUTUBEWHATSAPP FACEBOOK
FB MESSENGER
Million 600
DOUYIN
TIKTOK
Million 574
Million 573
SINA WEIB O
Million 573
KUAISHOU
Million 557
SNAPCHAT
Million 550
TELEGRAM
Million 444
Million 436
Million 430
Million 300
QUORA
51 Contents
52
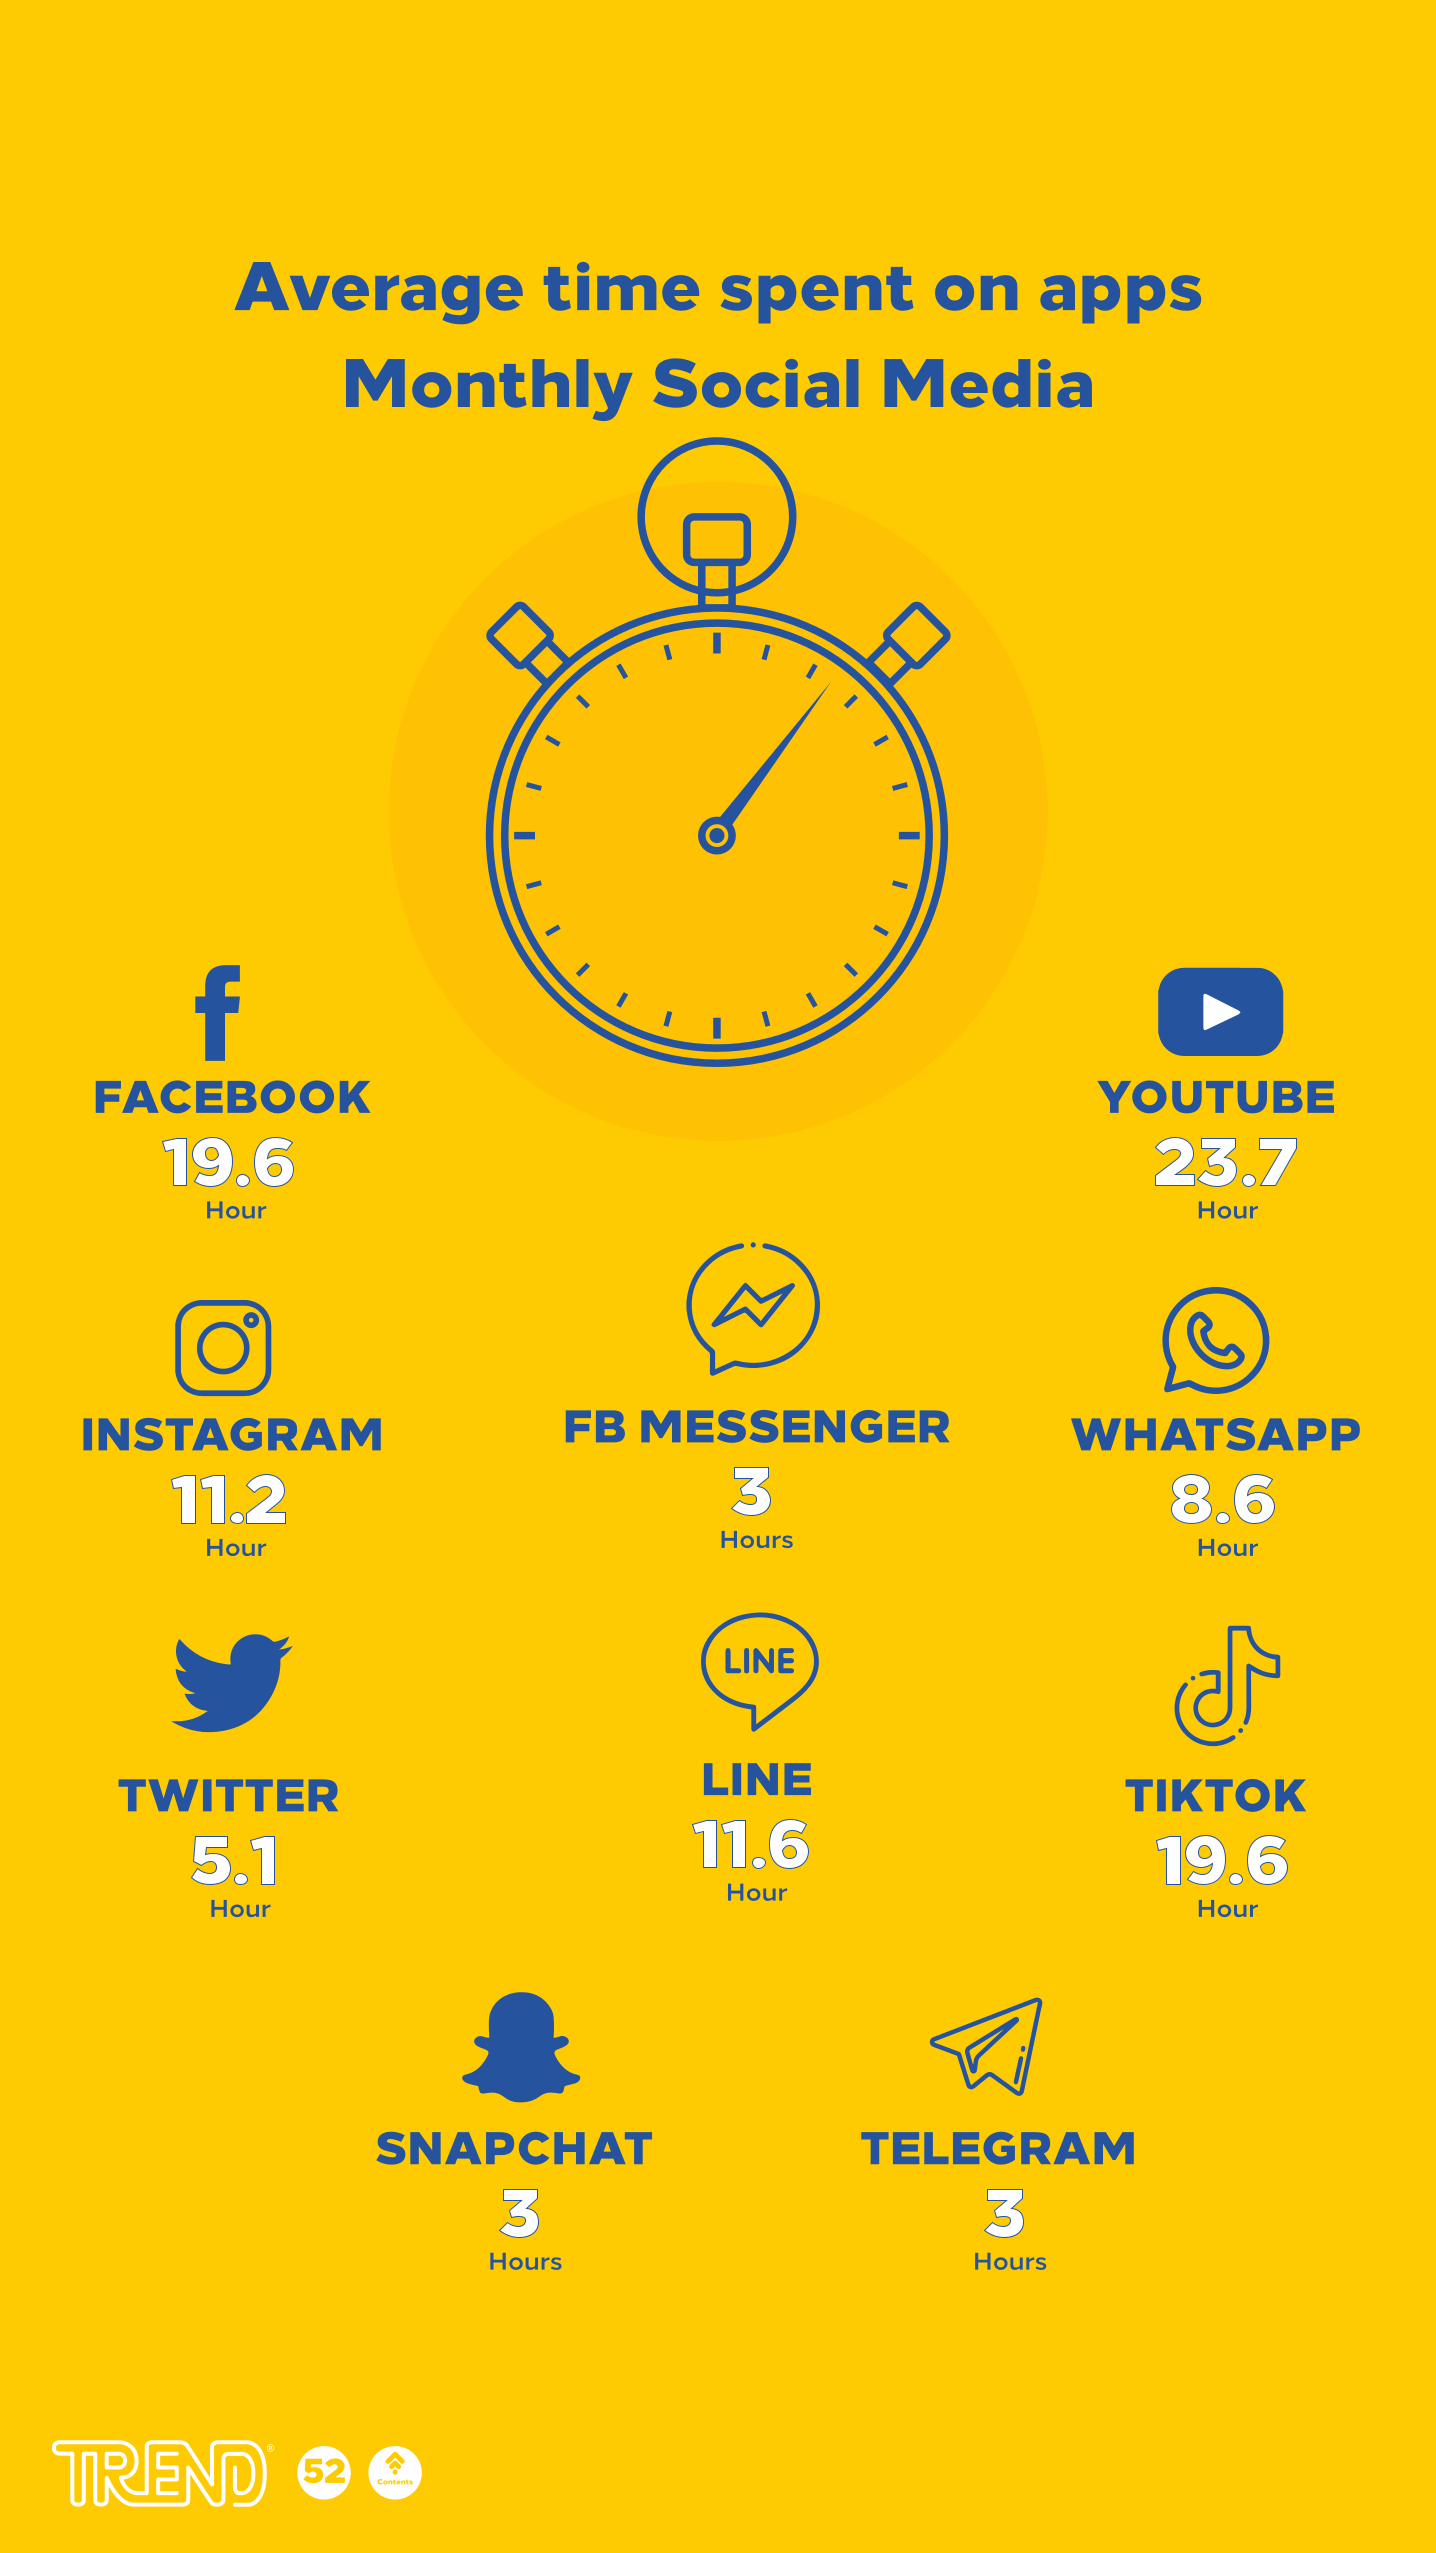
Average time spent on appsMonthly Social Media
YOUTUBE
Hour23.7
Hour19.6
Hour8.6
TIKTOK
Hour19.6
Hour11.2
FB MESSENGER
Hours3
Hour5.1
TELEGRAM
Hours3
LINE
Hour11.6
SNAPCHAT
Hours3
Contents
Smart Home devices
Global smart Home devices
worldwide
Arabian
23.8%22.4%20.7%20.7%20%
United kingdomIrelandcanada
9.7%7.1%6%
EmiratesEgyptSaudia Arbia
United StateChina
Number of houses with smart devices
Market value of smart Home devices
263.417%+Million houses annual change
Market value of smart home entertainment devices
11.6025%+Million houses annual change
104.433%+
Million houses
annual change
Market value of smart control Home devices
20.7633%+
Million houses
annual change
Market value of smart Home devices
39.3835%+
Million houses
annual change
Market value of smart Home energy management
8.23 34%+
Million houses
annual change
Market Value of smart Home security
15.7130%+
Million houses
annual change
53 Contents
Related Documents