Saudi Arabia’s food security policy and nutrition Expert Consultation on trade and nutrition 15-16 November 2016 FAO, Rome Panos Konandreas Trade Policy Plus [email protected]

Welcome message from author
This document is posted to help you gain knowledge. Please leave a comment to let me know what you think about it! Share it to your friends and learn new things together.
Transcript

Saudi Arabia’s food security policy and nutrition
Expert Consultation on trade and nutrition15-16 November 2016
FAO, Rome
Panos KonandreasTrade Policy Plus
Saudi Arabia’s food security policy and nutrition
Particularities in KSA demographics
The food secure situation in the KSA
Factors contributing to KSA food security
The extent of malnutrition in the KSA
KSA food security policy
policy options to secure access to food supplies
gross inadequacies in public policy on food utilization and healthy diets/lifestyles
Overall conclusions
3
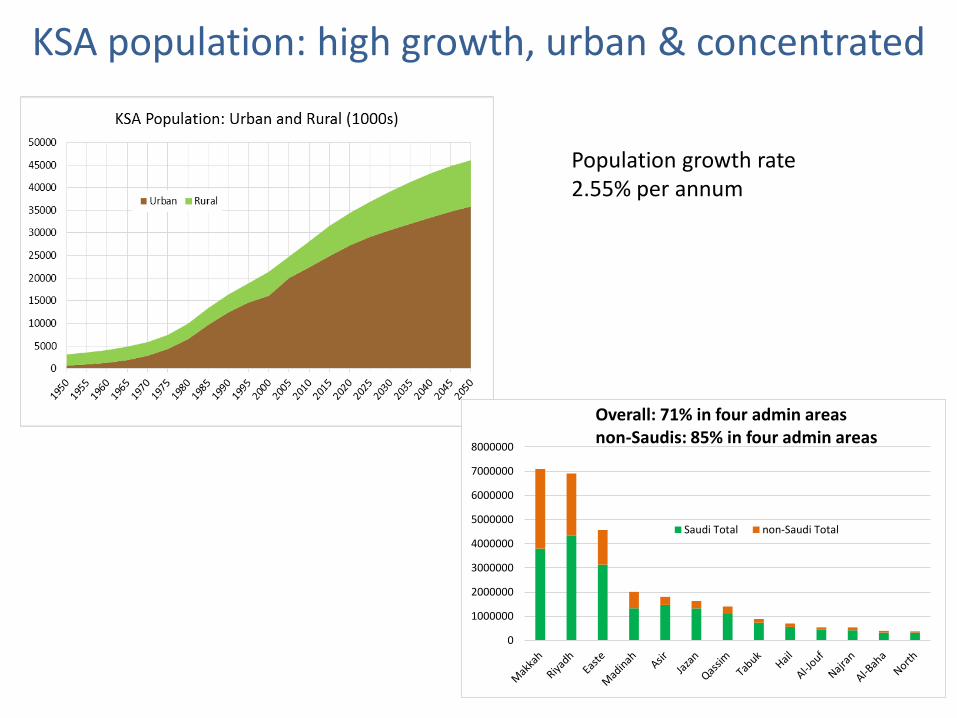
KSA population: high growth, urban & concentrated
0
1000000
2000000
3000000
4000000
5000000
6000000
7000000
8000000
Overall: 71% in four admin areasnon-Saudis: 85% in four admin areas
Saudi Total non-Saudi Total
Population growth rate 2.55% per annum
4
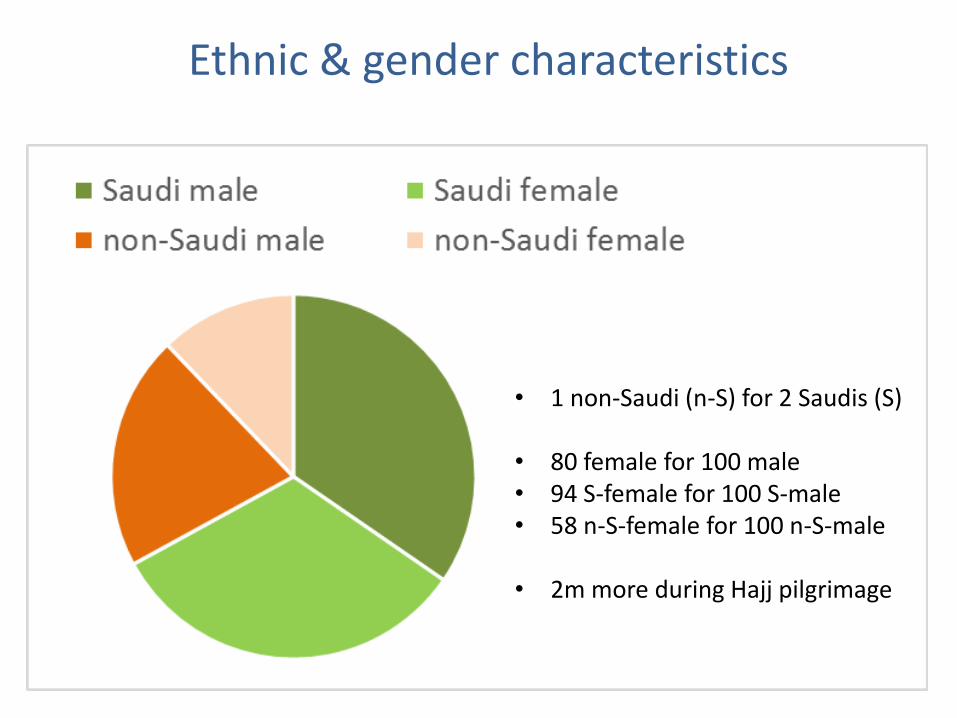
Ethnic & gender characteristics
• 1 non-Saudi (n-S) for 2 Saudis (S)
• 80 female for 100 male• 94 S-female for 100 S-male • 58 n-S-female for 100 n-S-male
• 2m more during Hajj pilgrimage
5
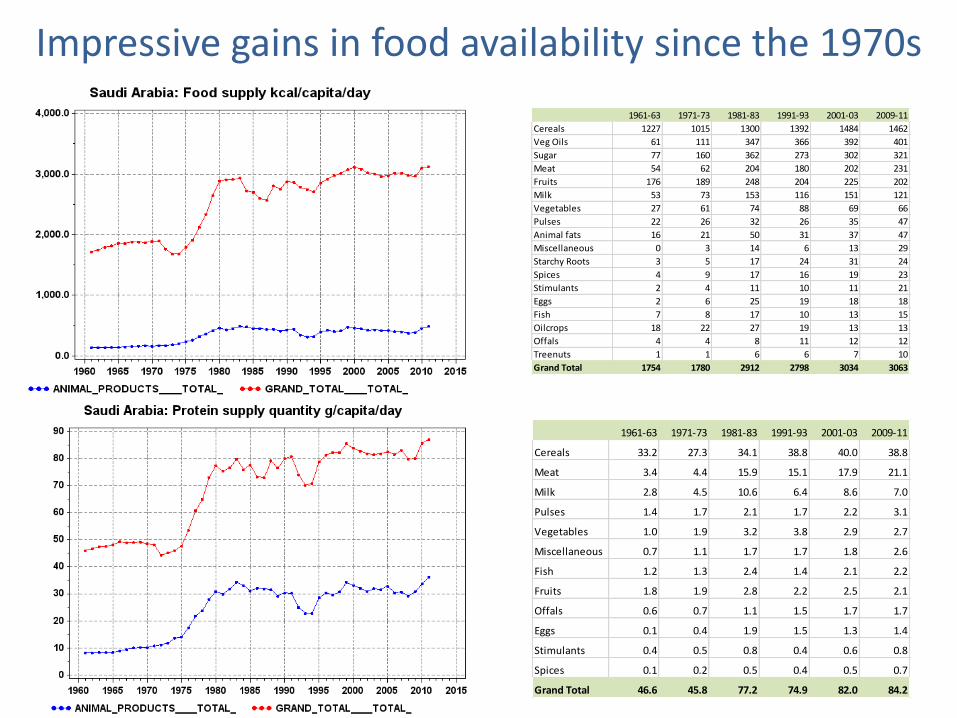
Impressive gains in food availability since the 1970s
1961-63 1971-73 1981-83 1991-93 2001-03 2009-11
Cereals 1227 1015 1300 1392 1484 1462
Veg Oils 61 111 347 366 392 401
Sugar 77 160 362 273 302 321
Meat 54 62 204 180 202 231
Fruits 176 189 248 204 225 202
Milk 53 73 153 116 151 121
Vegetables 27 61 74 88 69 66
Pulses 22 26 32 26 35 47
Animal fats 16 21 50 31 37 47
Miscellaneous 0 3 14 6 13 29
Starchy Roots 3 5 17 24 31 24
Spices 4 9 17 16 19 23
Stimulants 2 4 11 10 11 21
Eggs 2 6 25 19 18 18
Fish 7 8 17 10 13 15
Oilcrops 18 22 27 19 13 13
Offals 4 4 8 11 12 12
Treenuts 1 1 6 6 7 10
Grand Total 1754 1780 2912 2798 3034 3063
1961-63 1971-73 1981-83 1991-93 2001-03 2009-11
Cereals 33.2 27.3 34.1 38.8 40.0 38.8
Meat 3.4 4.4 15.9 15.1 17.9 21.1
Milk 2.8 4.5 10.6 6.4 8.6 7.0
Pulses 1.4 1.7 2.1 1.7 2.2 3.1
Vegetables 1.0 1.9 3.2 3.8 2.9 2.7
Miscellaneous 0.7 1.1 1.7 1.7 1.8 2.6
Fish 1.2 1.3 2.4 1.4 2.1 2.2
Fruits 1.8 1.9 2.8 2.2 2.5 2.1
Offals 0.6 0.7 1.1 1.5 1.7 1.7
Eggs 0.1 0.4 1.9 1.5 1.3 1.4
Stimulants 0.4 0.5 0.8 0.4 0.6 0.8
Spices 0.1 0.2 0.5 0.4 0.5 0.7
Grand Total 46.6 45.8 77.2 74.9 82.0 84.2
6
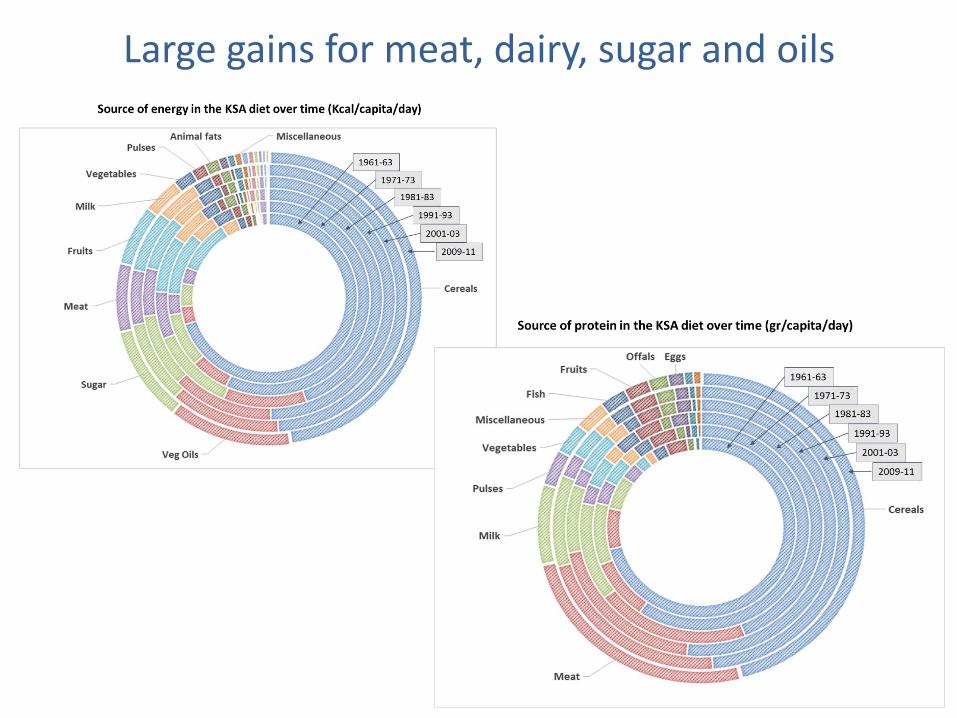
Large gains for meat, dairy, sugar and oils

1990-92 2014-16 1990-92 2014-16
World 113 123 113 111
Dev'd 131 136 98 101
Dev'g 108 120 119 114
NE in Asia 123 124 104 110
KSA 128 137 100 100
Region
KSA over regional
averages (%)
Supply adequacy
(%)
KSA aggregate food availability (DES) well above requirements for an active and healthy life
KSA variability due to influx of migrants

8
Under-nourishment comparable to Dev’d
1990-92 2014-16 1990-92 2014-16
World 26 17 26 30
Dev'd 5 5 132 100
Dev'g 32 20 21 26
NE in Asia 16 18 40 28
KSA 7 5 100 100
Inadequacy (%)KSA over regional
averages (%)Region
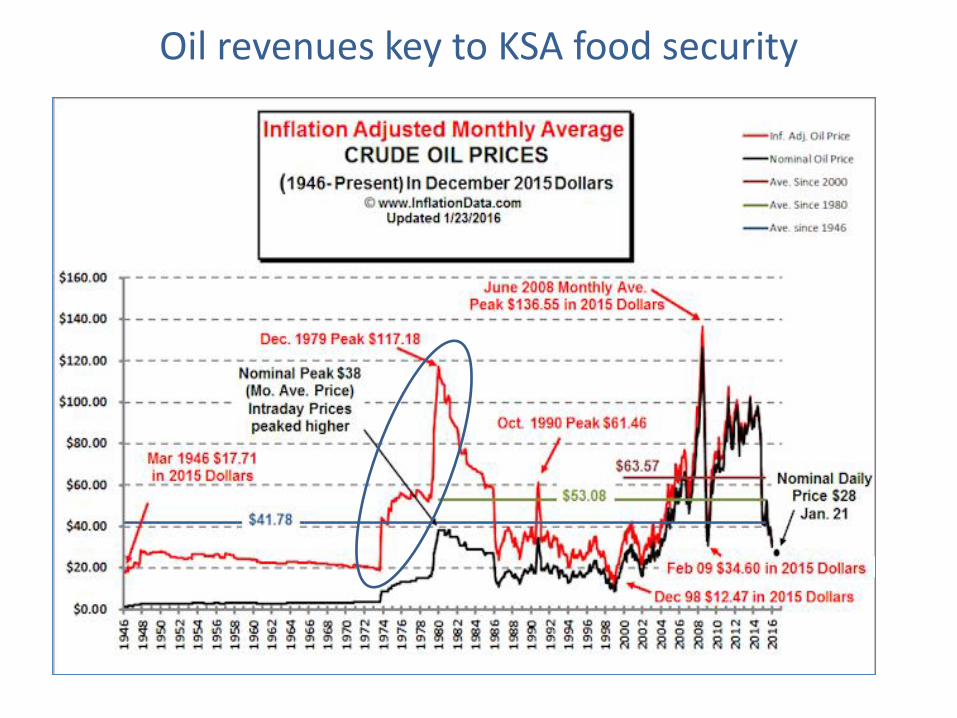
Oil revenues key to KSA food security

Co-movement of monthly food and oil prices

Generous food subsidies
http://www.focus-economics.com/regions/middle-east-and-north-africa
My back of envelope calculationsWheat 1 billionBarley 1.2 bMaize 0.3 bTOTAL above 2.5 b
Other products:DairyPoultry
Plus other indirect subsidies that benefit meat and dairy sectors:• 2.5% GDP KSA Electricity subsidy• 6.5% GDP KSA Diesel and gasoline

12
Ave price
(SR/Unit) 2009 2010 2011 2012 2013 2014 2015
Wheat flour, local, brown (Grain Silos) 1kg 2.1 3.7 2.2 2.1 2.1 2.1 2.1 2.0 2.1
Rice, Maza Indian (Abu Kas) 10kg 65.5 13.1 76.7 59.6 57.9 56.9 66.5 76.6 76.2
Bread, white 4loaves 1.0 0.0 1.0 1.0 1.0 1.0 1.0 1.0 1.0
Cattle Meat, fresh 1kg 36.3 9.1 28.1 30.7 34.7 36.5 38.5 39.1 39.2
Sheep Meat, cooled imported 1kg 37.0 7.4 27.6 33.0 35.0 37.5 39.2 39.1 39.1
Chicken, frozen imported (Doux) 900gm 11.2 8.7 10.5 9.9 11.5 11.4 12.5 11.1 10.9
Fish, fresh, (Kanaad) 1kg 43.9 13.5 32.0 36.3 40.4 42.0 44.7 48.8 53.6
Milk, fresh, local (Al Maraai) 1L 4.0 0.1 4.0 4.0 4.0 4.0 4.0 4.0 4.0
Yoghurt, (Al Saffi) 170gm 1.0 0.4 1.0 1.0 1.0 1.0 1.0 1.0 1.0
Vegetable oil, (frying) Al arabi 1.8L 15.2 6.6 15.7 13.5 15.3 16.5 15.6 15.2 15.0
Sugar, soft, Al Ossra 10kg 33.7 13.7 23.4 33.1 40.8 36.3 34.0 31.0 26.9
Soft Drinks Pack 1.5 4.0 1.0 1.5 1.5 1.5 1.5 1.5 1.5
Pumpkin 1kg 5.2 12.4 4.5 4.1 4.9 5.2 5.3 5.6 6.0
Cabbage, white 1kg 3.2 13.4 3.1 2.9 2.9 3.4 3.1 3.4 3.3
Beans, green 1kg 10.4 13.4 9.1 9.4 9.3 10.4 10.2 11.3 12.1
Tomatoes, imported 1kg 5.3 23.5 4.6 4.8 4.4 5.2 6.0 5.8 5.8
Zucchini, local 1kg 5.9 18.3 5.5 5.3 5.4 5.8 5.9 6.6 6.3
Cucumbers, local 1kg 4.8 15.7 6.0 4.2 4.3 4.6 5.1 5.5 5.2
Peppers, green, local 1kg 7.6 16.0 7.1 6.5 6.3 7.2 7.9 8.7 8.8
Lettuce, local 1kg 5.6 15.3 4.9 5.0 4.9 5.7 5.9 6.0 6.2
Watermelon, local 1kg 2.3 19.1 2.2 1.9 2.2 2.5 2.5 2.4 2.6
Melon, local 1kg 4.0 17.5 4.3 3.3 3.6 4.1 4.1 4.2 4.5
Mango, Pakistani 1kg 12.2 11.3 12.1 10.9 12.1 12.5 12.6 12.6 13.4
Dates, (Maknoz, Khilas) 1kg 15.5 6.3 16.8 16.1 16.1 16.1 15.6 14.6 13.9
STDEV
(% of
Ave)
UnitProductAnnual average price (SR/Unit)
Subsidies & price controls kept most food prices stable

Food affordability improving

… but for poorest H-holds up to 40% on food
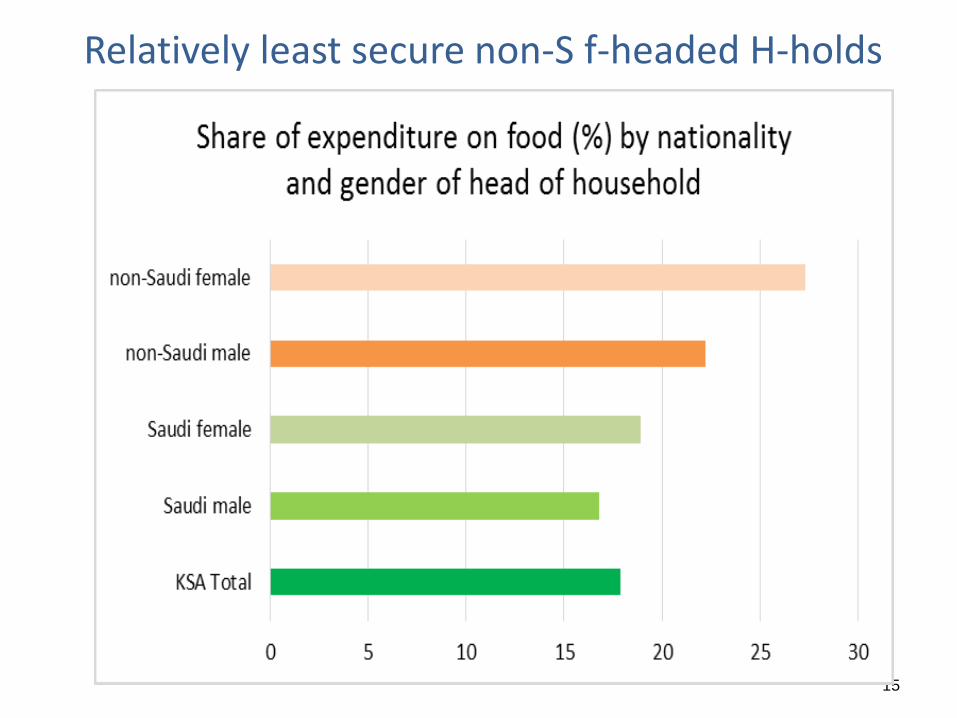
15
Relatively least secure non-S f-headed H-holds

Also, food imports relatively more affordable
17
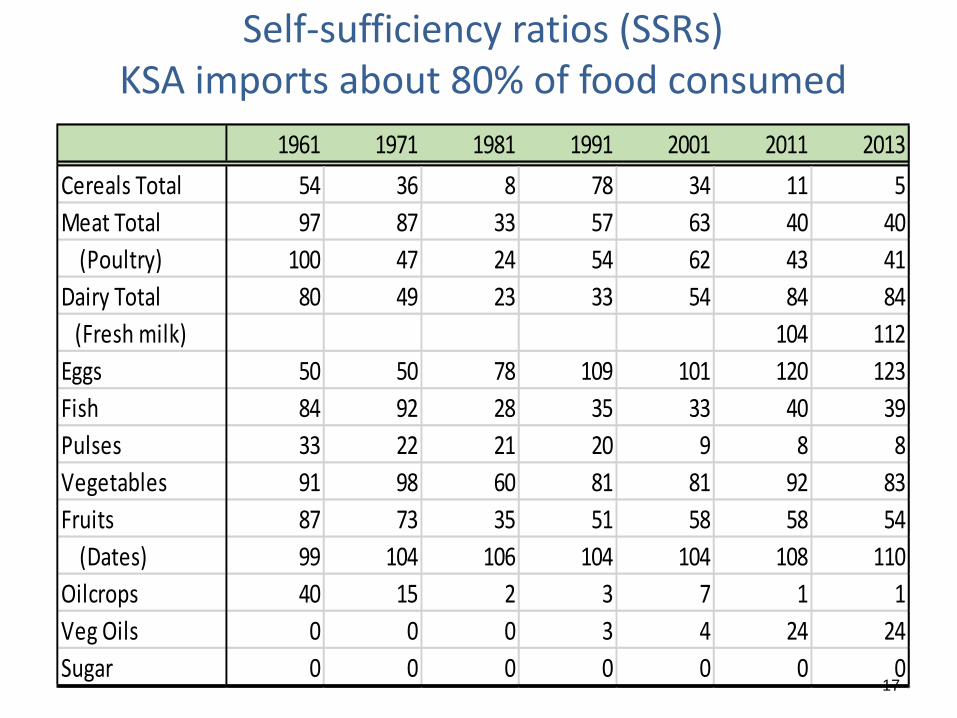
Self-sufficiency ratios (SSRs)KSA imports about 80% of food consumed
1961 1971 1981 1991 2001 2011 2013
Cereals Total 54 36 8 78 34 11 5
Meat Total 97 87 33 57 63 40 40
(Poultry) 100 47 24 54 62 43 41
Dairy Total 80 49 23 33 54 84 84
(Fresh milk) 104 112
Eggs 50 50 78 109 101 120 123
Fish 84 92 28 35 33 40 39
Pulses 33 22 21 20 9 8 8
Vegetables 91 98 60 81 81 92 83
Fruits 87 73 35 51 58 58 54
(Dates) 99 104 106 104 104 108 110
Oilcrops 40 15 2 3 7 1 1
Veg Oils 0 0 0 3 4 24 24
Sugar 0 0 0 0 0 0 0

KSA is overall food secure but suffers from malnutrition

19
Overindulgence and growing obesity
Anaemia
Vitamin
A Iodine
Stunting
among
children
(%)
Under-
nourishment
(%)
Food
inadequacy
(%)
Over-
indulgence
(%)
Obesity
among
adults
(%)
2014-16 2014-16 2014-16 2014-16 2008
World 2902 47.9 30.7 30.3 25.7 10.9 16.8 30.7 11.7
Dev'd 3408 11.8 3.9 37.7 7.2 <5.0 <5.0 45.7 22.2
Dev'g 2795 52.4 34 29.6 28.0 12.9 19.6 27.6 8.7
NE in Asia 2874 45.5 15.8 19.5 24.4 12.6 18.1 32.9 29.4
KSA 3290 33.1 3.6 23.0 9.3 <5.0 <5.0 43.9 35.2
Most recent observation
Food
availability
(kcal/cap/
day)
Prevalence of deficiencies
among children (%)Prevalence of malnutrition

20
Heavy toll - Causes of mortality in KSA (all deaths)
21
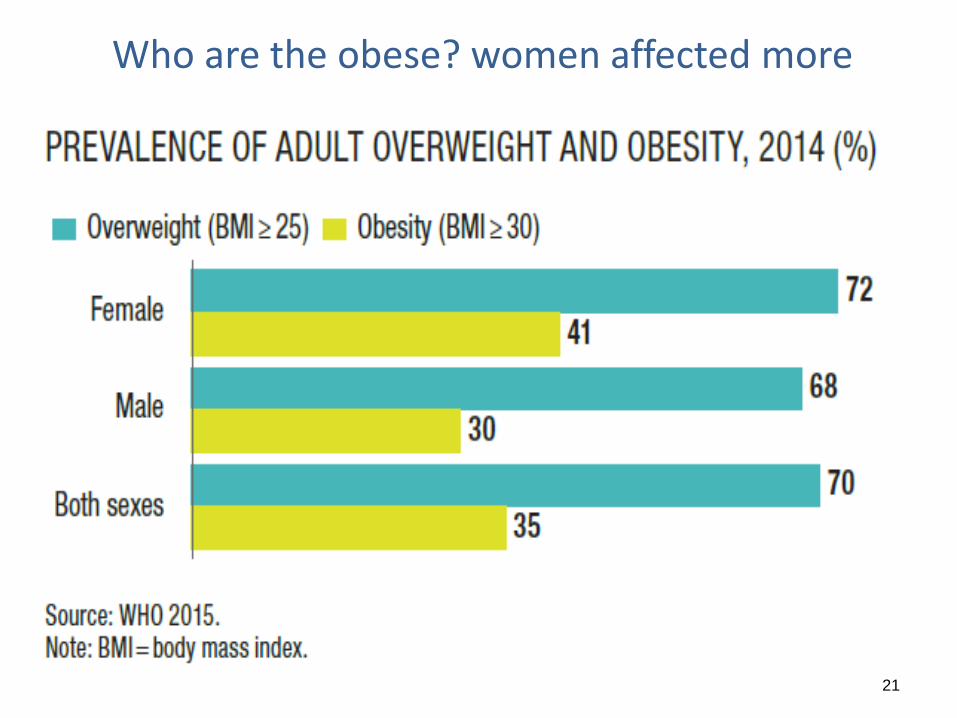
Who are the obese? women affected more
22
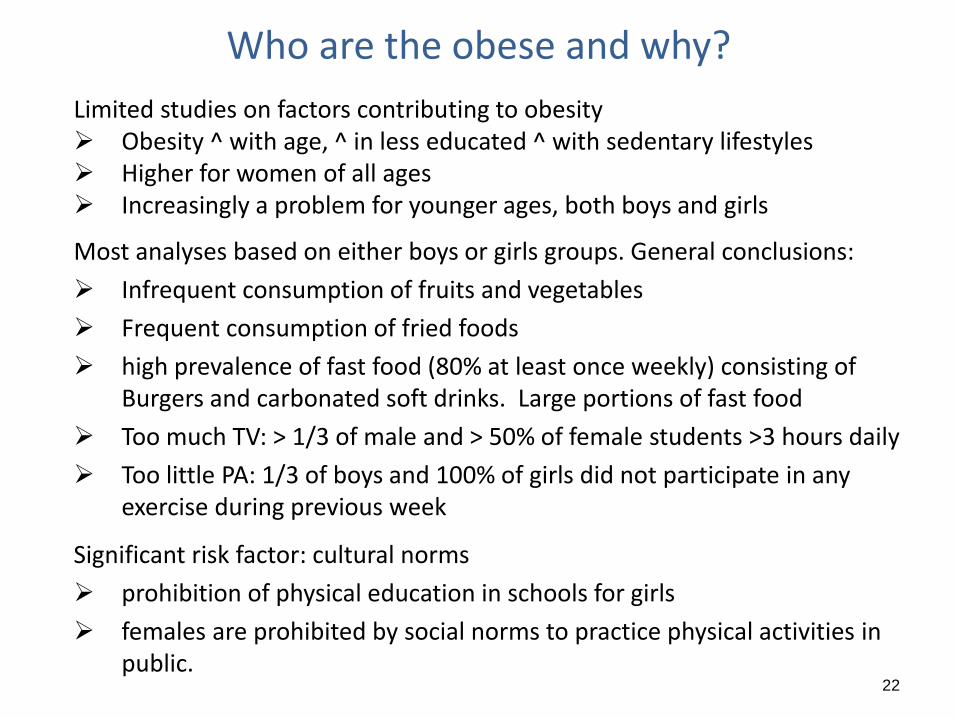
Who are the obese and why?
Limited studies on factors contributing to obesity Obesity ^ with age, ^ in less educated ^ with sedentary lifestyles Higher for women of all ages Increasingly a problem for younger ages, both boys and girls
Most analyses based on either boys or girls groups. General conclusions:
Infrequent consumption of fruits and vegetables
Frequent consumption of fried foods
high prevalence of fast food (80% at least once weekly) consisting of Burgers and carbonated soft drinks. Large portions of fast food
Too much TV: > 1/3 of male and > 50% of female students >3 hours daily
Too little PA: 1/3 of boys and 100% of girls did not participate in any exercise during previous week
Significant risk factor: cultural norms
prohibition of physical education in schools for girls
females are prohibited by social norms to practice physical activities in public.

23
KSA policy options to secure access to food supplies
Domestic productionInvestment abroad Diversification in sourcing importsFood stocks
24
KSA food security policy obsessed with access to food supplies
25
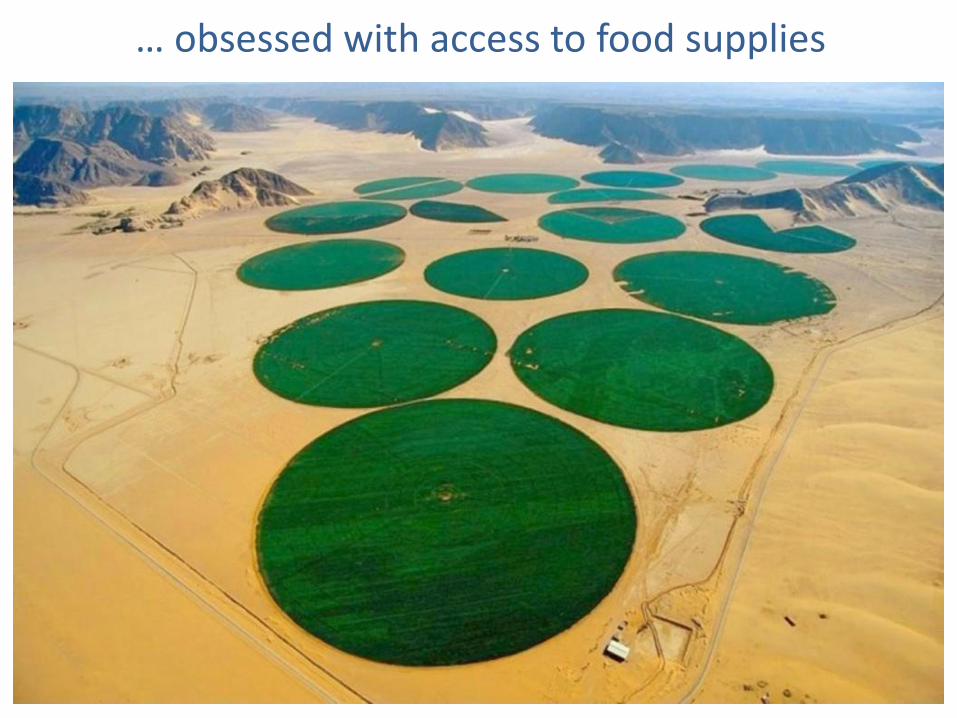
… obsessed with access to food supplies

26
… obsessed with access to food supplies
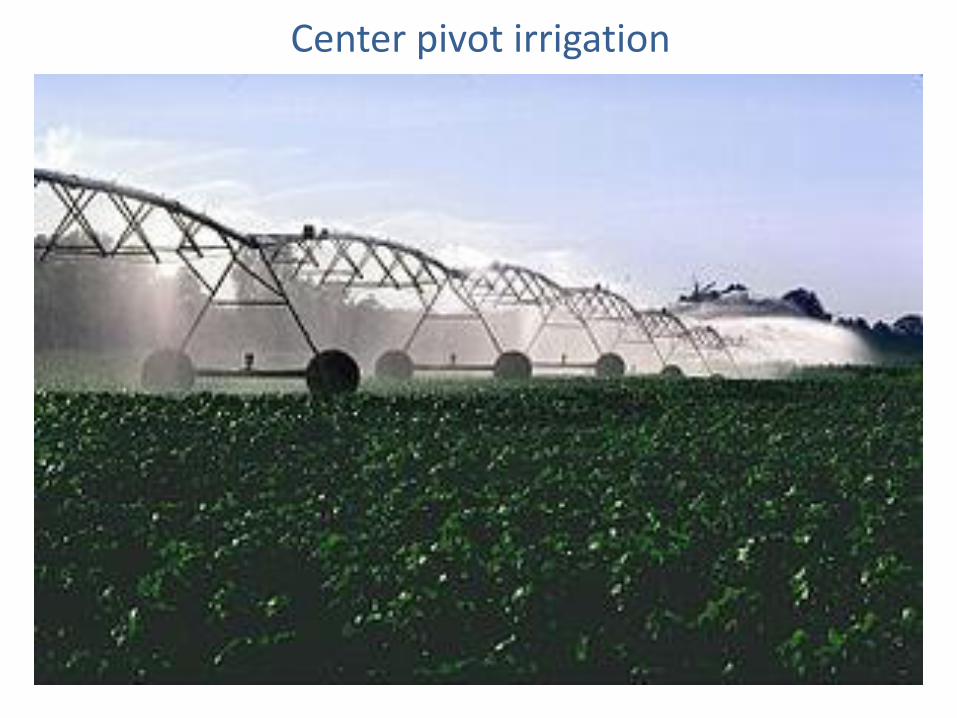
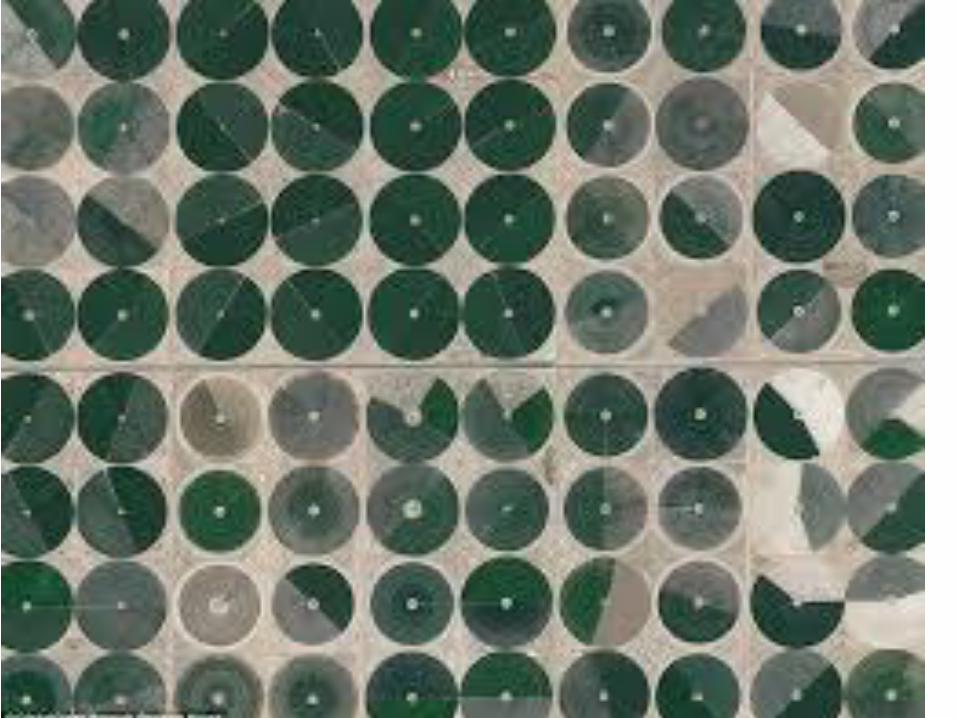
Center pivot irrigation

28
1987
1991
2000
2012
Agricultural Fields, Wadi As-Sirhan Basin, Saudi Arabia
29
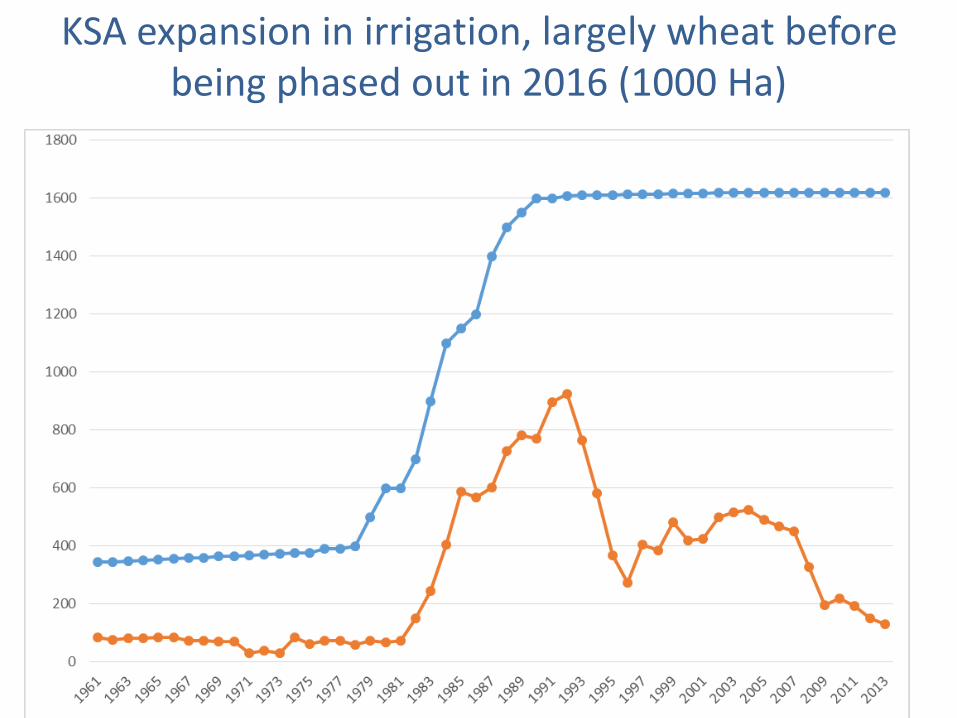
KSA expansion in irrigation, largely wheat before being phased out in 2016 (1000 Ha)
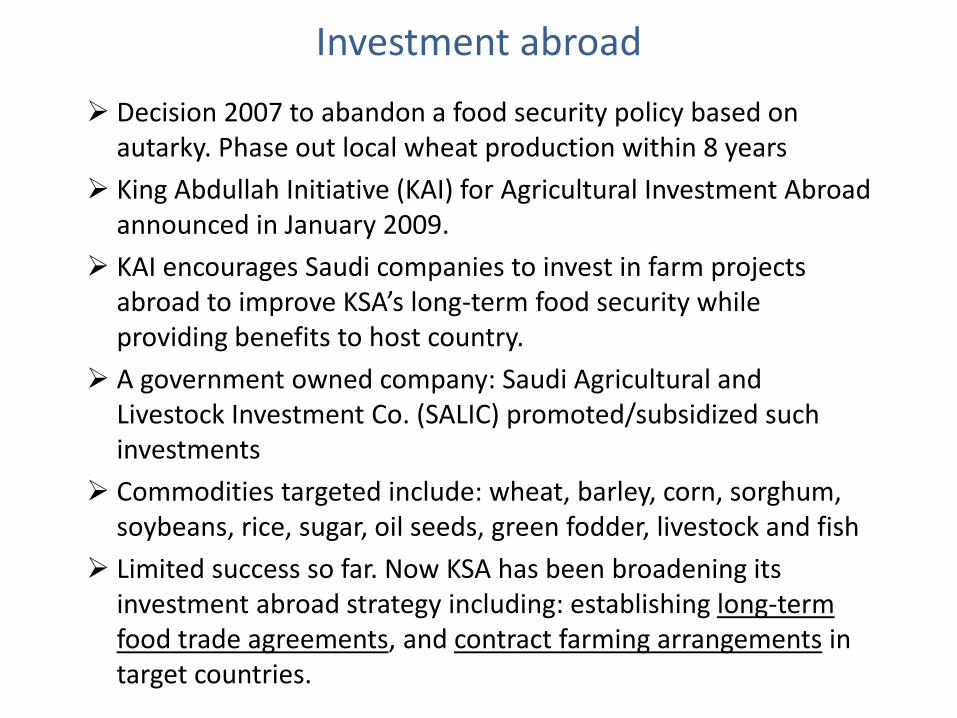
Investment abroad
Decision 2007 to abandon a food security policy based on autarky. Phase out local wheat production within 8 years
King Abdullah Initiative (KAI) for Agricultural Investment Abroad announced in January 2009.
KAI encourages Saudi companies to invest in farm projects abroad to improve KSA’s long-term food security while providing benefits to host country.
A government owned company: Saudi Agricultural and Livestock Investment Co. (SALIC) promoted/subsidized such investments
Commodities targeted include: wheat, barley, corn, sorghum, soybeans, rice, sugar, oil seeds, green fodder, livestock and fish
Limited success so far. Now KSA has been broadening its investment abroad strategy including: establishing long-term food trade agreements, and contract farming arrangements in target countries.
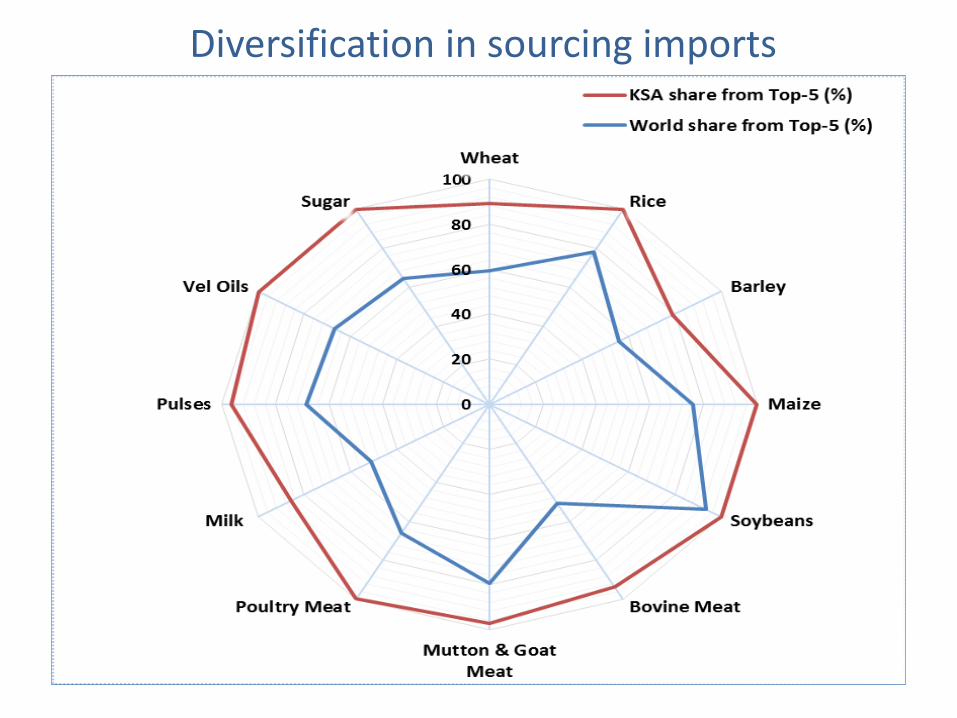
Diversification in sourcing imports
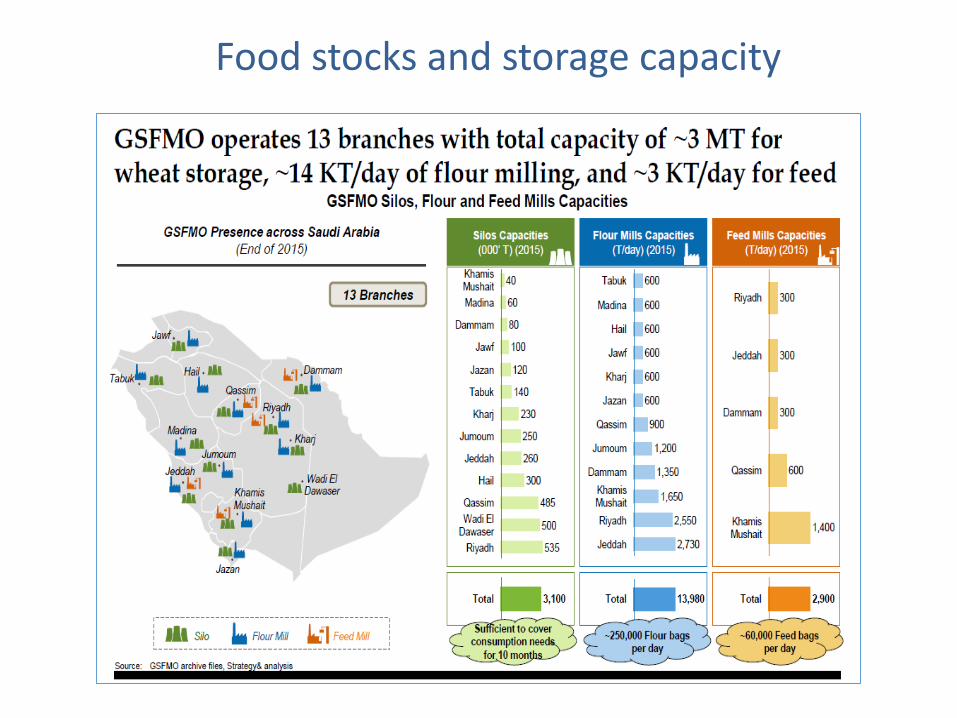
Food stocks and storage capacity

33
Gross inadequacies in public policies on food utilization
Huge food waste: food is cheap and not valued MoA recent estimate Saudis waste $35 million worth of food
every day, amounting to $13 billion per year Partly linked to non-targeted and inflexible consumption policies Also linked to cultural factors, social traditions and extravagant
celebration events Food waste accounts for an estimated 28% of all waste: a serious
environmental problem for its disposal.
Deep-rooted social constraints Inadequate nutrition education at schools PE is absent from curricula of girls schools, and PA not practiced Prohibition of women for participating in physical activity in public Limiting the role that women could play in promoting good
nutrition and healthy lifestyles

34
Conclusions
KSA is a food secure country adequacy of supplies well above requirements; small share of undernourished
Transition to food security very rapid fuelled by petroleum revenues Span of few years KSA availability increased more than what other countries achieved in decades
But KSA is malnourished Excessive consumption of an unbalanced diet rich in meats, fatty foods and fast foods
leading to obesity
A policy of cheap subsidized food contributes to excessive intake and unbalanced diets
Sedentary lifestyles and limited physical activity
Public policy is obsessed with securing access to supplies Domestic production; investment abroad; diversification; stocks
Public policy pays much less attention to food utilization, healthy diets and lifestyles Paradox of huge food waste in a heavily import dependent country; continuing
excessive subsidization;
Lack of recognition of the importance of PE at schools and the need for nutrition education for nurturing healthy lifestyles
Continuing cultural constraints and prohibitions especially affecting women.
Related Documents