107 Saudi Arabia’s Domestic Energy Situation and Policy: Focusing on Its Power Sector HAGIHARA Jun * 1. Introduction Saudi Arabia was formally established in 1932 by King Abd al-Aziz ibn Abd al-Rahman ibn Faisal Al Saud. The new nation’s principal industries at that time were commerce, oasis farming and nomadic herding, and governmental revenue depended on the taxation of hajj pilgrims and foreign aid from the United Kingdom. The Great Depression that hit the world economy in the 30’s caused a significant decrease in pilgrims, and the Saudi treasury was on the verge of bankruptcy when vast reserves of oil were discovered in the Eastern Province in 1938. This new found oil wealth provided the government with a stable income, and Saudi Arabia rose to become a major oil producing country wielding a strong influence over the world economy. An American oil company, Aramco, commenced intensive and rapid infrastructure development in Dammam to extract, produce, and export the oil. This included building a town in the desert and a port, with interconnecting roads, utility supplies, housing and a market for workers. By 1939, Saudi Arabia had begun to export oil. From 1970, Saudi Arabia began a 5 Year Development Plan to pursue what was termed “Modernization without Westernization” as instructed by the 3rd king, Faisal bin Abd al-Aziz Al Saud. Today, the Saudi people enjoy a modern infrastructure, free education, free health-care and a high standard of living comparable to developed countries. We can safely say that Saudi Arabia has accomplished its “modernization”, and this achievement was made possible by the production and export of oil. Since Saudi Arabia is a major and influential oil producing country, its production capability, reserves and national security risks are discussed frequently. However, its domestic energy economy has attracted little attention. How does Saudi Arabia use energy? What is its energy infrastructure like? What is the current situation? These are the questions we will attempt to answer in this article by examining the history, policy, detailed situation and issues related to Saudi Arabia’s domestic energy use, focusing on electricity. 2. Domestic Energy Demand Structure and Energy Efficiency This section covers both primary energy and secondary energy in Saudi Arabia. Primary energy can be defined as natural resources for fuel, such as crude oil, coal and gas, while secondary energy is derived from primary energy by refining it for practical use in the form of イスラーム世界研究 第 6 巻(2013 年 3 月)107‒135 頁 Kyoto Bulletin of Islamic Area Studies, 6 (March 2013), pp. 107–135 * Graduate School of Asian and African Area Studies, Kyoto University.

Welcome message from author
This document is posted to help you gain knowledge. Please leave a comment to let me know what you think about it! Share it to your friends and learn new things together.
Transcript
107
Saudi Arabia’s Domestic Energy Situation and Policy
Saudi Arabia’s Domestic Energy Situation and Policy:Focusing on Its Power Sector
HAGIHARA Jun*
1. IntroductionSaudi Arabia was formally established in 1932 by King Abd al-Aziz ibn Abd al-Rahman ibn Faisal Al Saud. The new nation’s principal industries at that time were commerce, oasis farming and nomadic herding, and governmental revenue depended on the taxation of hajj pilgrims and foreign aid from the United Kingdom. The Great Depression that hit the world economy in the 30’s caused a significant decrease in pilgrims, and the Saudi treasury was on the verge of bankruptcy when vast reserves of oil were discovered in the Eastern Province in 1938. This new found oil wealth provided the government with a stable income, and Saudi Arabia rose to become a major oil producing country wielding a strong influence over the world economy.
An American oil company, Aramco, commenced intensive and rapid infrastructure development in Dammam to extract, produce, and export the oil. This included building a town in the desert and a port, with interconnecting roads, utility supplies, housing and a market for workers. By 1939, Saudi Arabia had begun to export oil. From 1970, Saudi Arabia began a 5 Year Development Plan to pursue what was termed “Modernization without Westernization” as instructed by the 3rd king, Faisal bin Abd al-Aziz Al Saud. Today, the Saudi people enjoy a modern infrastructure, free education, free health-care and a high standard of living comparable to developed countries. We can safely say that Saudi Arabia has accomplished its “modernization”, and this achievement was made possible by the production and export of oil.
Since Saudi Arabia is a major and influential oil producing country, its production capability, reserves and national security risks are discussed frequently. However, its domestic energy economy has attracted little attention. How does Saudi Arabia use energy? What is its energy infrastructure like? What is the current situation? These are the questions we will attempt to answer in this article by examining the history, policy, detailed situation and issues related to Saudi Arabia’s domestic energy use, focusing on electricity.
2. Domestic Energy Demand Structure and Energy EfficiencyThis section covers both primary energy and secondary energy in Saudi Arabia. Primary energy can be defined as natural resources for fuel, such as crude oil, coal and gas, while secondary energy is derived from primary energy by refining it for practical use in the form of
イスラーム世界研究 第 6巻(2013 年 3 月)107‒135 頁
Kyoto Bulletin of Islamic Area Studies, 6 (March 2013), pp. 107–135
* Graduate School of Asian and African Area Studies, Kyoto University.
13英論1_萩原_ver4.indd 10713英論1_萩原_ver4.indd 107 2013/03/05 15:13:532013/03/05 15:13:53
108
Kyoto Bulletin of Islamic Area Studies 6 (March 2013)
electricity, petroleum products and so on.
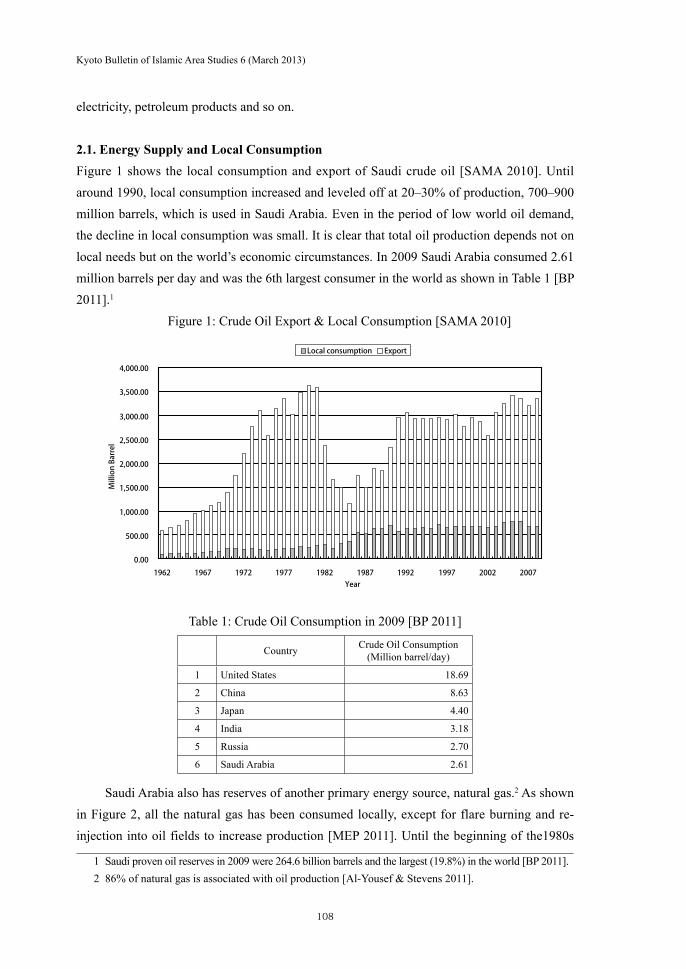
2.1. Energy Supply and Local ConsumptionFigure 1 shows the local consumption and export of Saudi crude oil [SAMA 2010]. Until around 1990, local consumption increased and leveled off at 20–30% of production, 700–900 million barrels, which is used in Saudi Arabia. Even in the period of low world oil demand, the decline in local consumption was small. It is clear that total oil production depends not on local needs but on the world’s economic circumstances. In 2009 Saudi Arabia consumed 2.61 million barrels per day and was the 6th largest consumer in the world as shown in Table 1 [BP 2011].1
Figure 1: Crude Oil Export & Local Consumption [SAMA 2010]
Table 1: Crude Oil Consumption in 2009 [BP 2011]
Country Crude Oil Consumption(Million barrel/day)
1 United States 18.69
2 China 8.63
3 Japan 4.40
4 India 3.18
5 Russia 2.70
6 Saudi Arabia 2.61
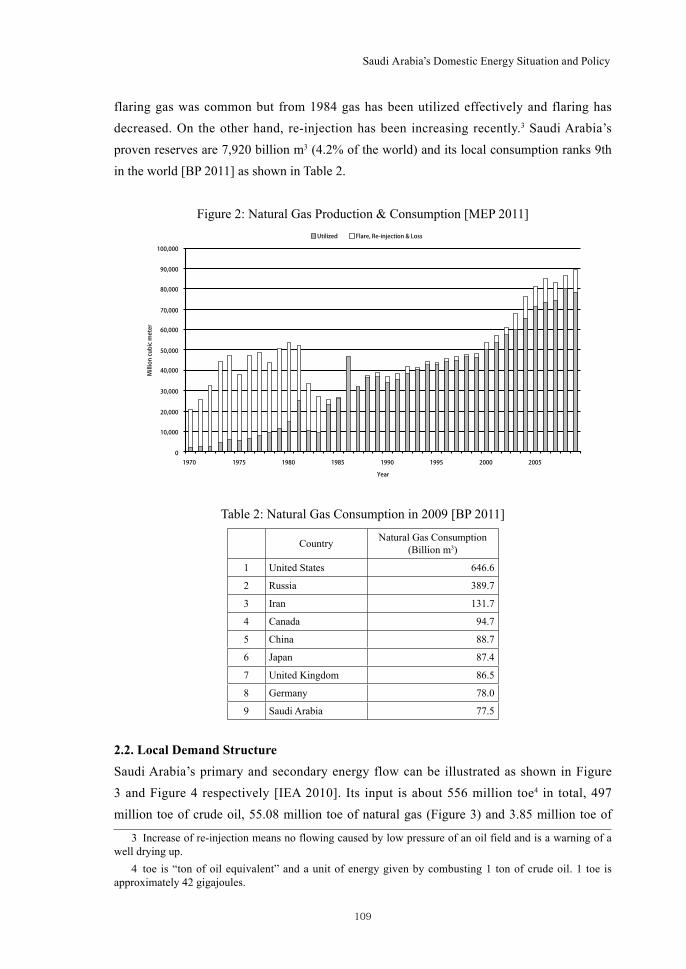
Saudi Arabia also has reserves of another primary energy source, natural gas.2 As shown in Figure 2, all the natural gas has been consumed locally, except for flare burning and re-injection into oil fields to increase production [MEP 2011]. Until the beginning of the1980s
1 Saudi proven oil reserves in 2009 were 264.6 billion barrels and the largest (19.8%) in the world [BP 2011].2 86% of natural gas is associated with oil production [Al-Yousef & Stevens 2011].
1962 1967 1972 1977 1982 1987 1992 1997 2002 2007Year
0.00
500.00
1,000.00
1,500.00
2,000.00
2,500.00
3,000.00
3,500.00
4,000.00
Million Barrel
Local consumption Export
13英論1_萩原_ver4.indd 10813英論1_萩原_ver4.indd 108 2013/03/05 15:13:572013/03/05 15:13:57
109
Saudi Arabia’s Domestic Energy Situation and Policy
flaring gas was common but from 1984 gas has been utilized effectively and flaring has decreased. On the other hand, re-injection has been increasing recently.3 Saudi Arabia’s proven reserves are 7,920 billion m3 (4.2% of the world) and its local consumption ranks 9th in the world [BP 2011] as shown in Table 2.
Figure 2: Natural Gas Production & Consumption [MEP 2011]
Table 2: Natural Gas Consumption in 2009 [BP 2011]
Country Natural Gas Consumption(Billion m3)
1 United States 646.6
2 Russia 389.7
3 Iran 131.7
4 Canada 94.7
5 China 88.7
6 Japan 87.4
7 United Kingdom 86.5
8 Germany 78.0
9 Saudi Arabia 77.5
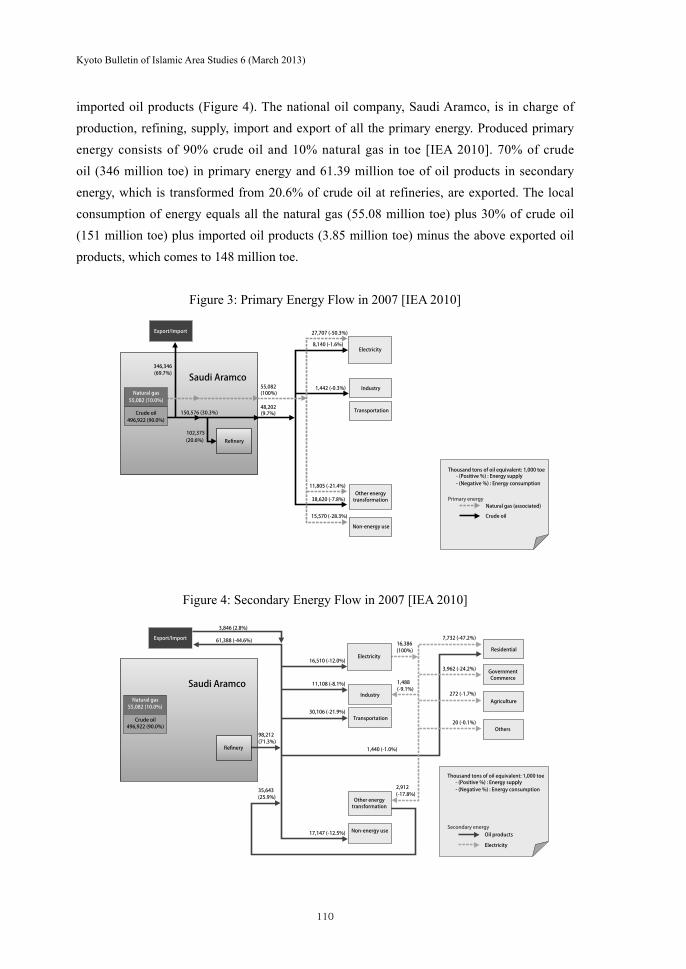
2.2. Local Demand StructureSaudi Arabia’s primary and secondary energy flow can be illustrated as shown in Figure 3 and Figure 4 respectively [IEA 2010]. Its input is about 556 million toe4 in total, 497 million toe of crude oil, 55.08 million toe of natural gas (Figure 3) and 3.85 million toe of
3 Increase of re-injection means no flowing caused by low pressure of an oil field and is a warning of a well drying up.
4 toe is “ton of oil equivalent” and a unit of energy given by combusting 1 ton of crude oil. 1 toe is approximately 42 gigajoules.
1970 1975 1980 1985 1990 1995 2000 2005
Year
60,000
70,000
80,000
90,000
100,000
50,000
40,000
30,000
20,000
10,000
0
Million cubic meter
Utilized Flare, Re-injection & Loss
13英論1_萩原_ver4.indd 10913英論1_萩原_ver4.indd 109 2013/03/05 15:14:002013/03/05 15:14:00
110
Kyoto Bulletin of Islamic Area Studies 6 (March 2013)
imported oil products (Figure 4). The national oil company, Saudi Aramco, is in charge of production, refining, supply, import and export of all the primary energy. Produced primary energy consists of 90% crude oil and 10% natural gas in toe [IEA 2010]. 70% of crude oil (346 million toe) in primary energy and 61.39 million toe of oil products in secondary energy, which is transformed from 20.6% of crude oil at refineries, are exported. The local consumption of energy equals all the natural gas (55.08 million toe) plus 30% of crude oil (151 million toe) plus imported oil products (3.85 million toe) minus the above exported oil products, which comes to 148 million toe.
Figure 3: Primary Energy Flow in 2007 [IEA 2010]
Figure 4: Secondary Energy Flow in 2007 [IEA 2010]
Export/Import
346,346
102,375
55,082Saudi Aramco
48,202
Natural gas55,082 (10.0%)
150,576 (30.3%)
1,442 (-0.3%)
11,805 (-21.4%)
38,620 (-7.8%)
15,570 (-28.3%)
8,140 (-1.6%)
27,707 (-50.3%)
496,922 (90.0%)Crude oil
Refinery
Electricity
Industry
Transportation
Other energytransformation
Non-energy use
(69.7%)
(20.6%)
(100%)
(9.7%)
Thousand tons of oil equivalent: 1,000 toe
Primary energyNatural gas (associated)
Crude oil
- (Positive %) : Energy supply- (Negative %) : Energy consumption
Export/Import
Saudi Aramco
98,212
35,643
Natural gas55,082 (10.0%)
11,108 (-8.1%)
30,106 (-21.9%)
1,440 (-1.0%)
17,147 (-12.5%)
16,510 (-12.0%)
7,732 (-47.2%)
3,962 (-24.2%)
272 (-1.7%)
20 (-0.1%)
3,846 (2.8%)
61,388 (-44.6%)
496,922 (90.0%)Crude oil
Refinery
ElectricityResidential
Agriculture
Others
GovernmentCommerce
Industry
Transportation
Other energytransformation
Non-energy use
(71.3%)
(25.9%)
2,912(-17.8%)
1,488(-9.1%)
16,386(100%)
Thousand tons of oil equivalent: 1,000 toe
Secondary energyOil products
Electricity
- (Positive %) : Energy supply- (Negative %) : Energy consumption
13英論1_萩原_ver4.indd 11013英論1_萩原_ver4.indd 110 2013/03/05 15:14:022013/03/05 15:14:02
111
Saudi Arabia’s Domestic Energy Situation and Policy
As shown in Figure 3, half of natural gas is used for power generation and the rest is consumed in other forms of energy transformation such as heat plants and refining, and non-energy use. The main non-energy user is the petrochemical industry. 22% of refined oil products are used in the transportation sector. The state power company, Saudi Electricity Company (SEC), generates 16.39 million toe of electricity (secondary energy) which corresponds to 11% of total local consumption. Almost half of the power demand (47%) is consumed by the residential sector, 24% by government and commerce, and only 9% of electricity is used by the industrial sector. As can be seen here, the specific feature of Saudi electricity use is a small industrial demand5 and a large non-industrial one, especially in the residential sector.
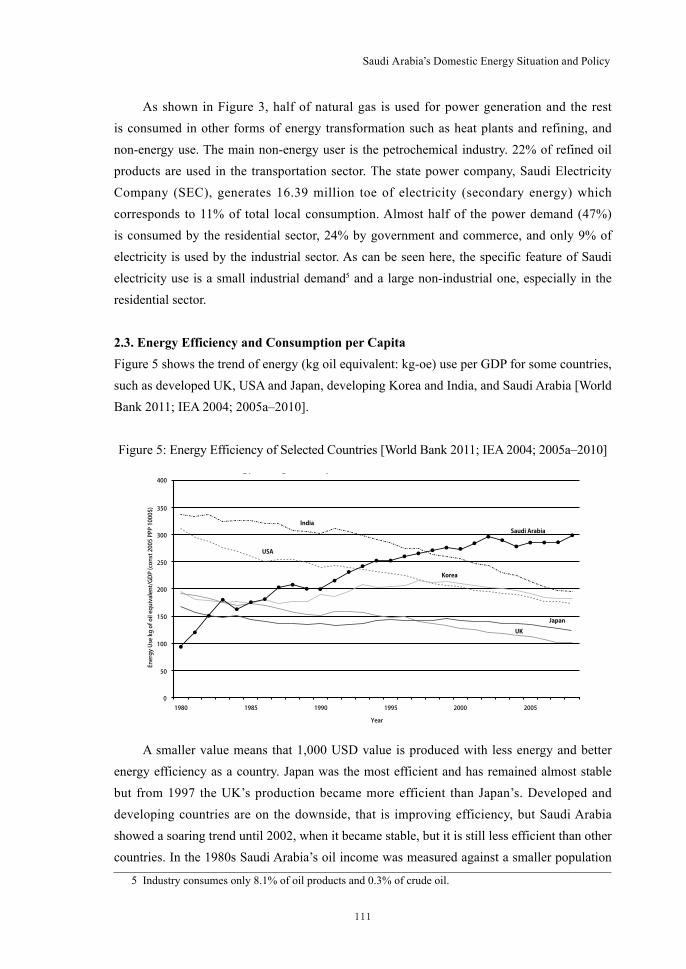
2.3. Energy Efficiency and Consumption per CapitaFigure 5 shows the trend of energy (kg oil equivalent: kg-oe) use per GDP for some countries, such as developed UK, USA and Japan, developing Korea and India, and Saudi Arabia [World Bank 2011; IEA 2004; 2005a–2010].
Figure 5: Energy Efficiency of Selected Countries [World Bank 2011; IEA 2004; 2005a–2010]
A smaller value means that 1,000 USD value is produced with less energy and better energy efficiency as a country. Japan was the most efficient and has remained almost stable but from 1997 the UK’s production became more efficient than Japan’s. Developed and developing countries are on the downside, that is improving efficiency, but Saudi Arabia showed a soaring trend until 2002, when it became stable, but it is still less efficient than other countries. In the 1980s Saudi Arabia’s oil income was measured against a smaller population
5 Industry consumes only 8.1% of oil products and 0.3% of crude oil.
1980 1985 1990 1995 2000 2005
Year
0
50
100
150
200
250
300
350
400
Energy Use kg of oil equivalent/GDP (const 2005 PPP 1000$)
gy g q
India
USA
Saudi Arabia
Korea
Japan
UK
13英論1_萩原_ver4.indd 11113英論1_萩原_ver4.indd 111 2013/03/05 15:14:072013/03/05 15:14:07
112
Kyoto Bulletin of Islamic Area Studies 6 (March 2013)
and lower energy consumption, so it was more efficient than the other energy producers. However since then, the growth of its energy demands has exceeded its GDP growth, and its efficiency has worsened. Saudi efficiency rate was 300 kg-oe/1,000USD in 2008, 2.4 times less efficient than Japan (124 kg-oe/1,000USD).
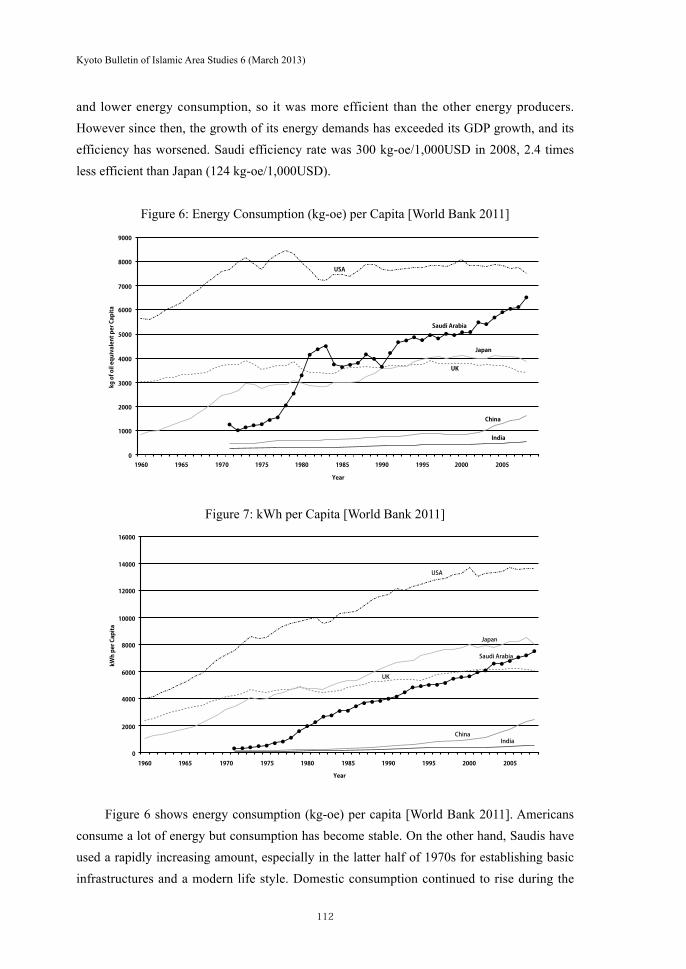
Figure 6: Energy Consumption (kg-oe) per Capita [World Bank 2011]
Figure 7: kWh per Capita [World Bank 2011]
Figure 6 shows energy consumption (kg-oe) per capita [World Bank 2011]. Americans consume a lot of energy but consumption has become stable. On the other hand, Saudis have used a rapidly increasing amount, especially in the latter half of 1970s for establishing basic infrastructures and a modern life style. Domestic consumption continued to rise during the
1960 1965 1970 1975 1980 1985 1990 1995 2000 2005
Year
9000
8000
7000
6000
5000
4000
3000
2000
1000
0
kg of oil equivalent per Capita
USA
Saudi Arabia
Japan
UK
China
India
1960 1965 1970 1975 1980 1985 1990 1995 2000 2005
Year
16000
14000
12000
10000
8000
6000
4000
2000
0
kWh per Capita
USA
Japan
Saudi Arabia
UK
ChinaIndia
13英論1_萩原_ver4.indd 11213英論1_萩原_ver4.indd 112 2013/03/05 15:14:092013/03/05 15:14:09
113
Saudi Arabia’s Domestic Energy Situation and Policy
oil depression from 1983 to 1990. The Saudis consumed 6,514 kg-oe in 2008, 1,7 times more than the Japanese (3,882 kg-oe) and per capita consumption is still increasing. China and India also show increases but their absolute values are small as are their growth rates. Figure 7 shows electricity consumption (kW) per capita [World Bank 2011]. The growth rate of Saudi Arabia has been large and presently the Saudis are consuming 7,527 kWh, which is similar to the Japanese (8,071 kWh).
From these analyses, we can say that as an oil producing nation, Saudi Arabia has an increasing local oil demand accompanied by worsening energy efficiency and its people make lavish use of energy. The per capita consumption is similar to or larger than developed countries and this situation is an indication of a modernized Saudi society.
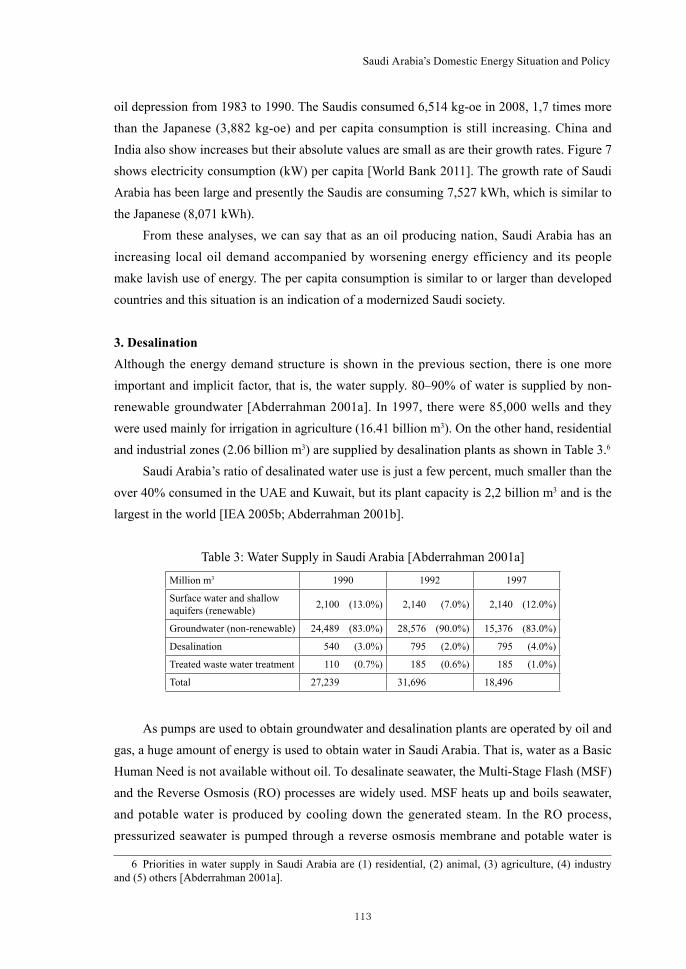
3. DesalinationAlthough the energy demand structure is shown in the previous section, there is one more important and implicit factor, that is, the water supply. 80–90% of water is supplied by non-renewable groundwater [Abderrahman 2001a]. In 1997, there were 85,000 wells and they were used mainly for irrigation in agriculture (16.41 billion m3). On the other hand, residential and industrial zones (2.06 billion m3) are supplied by desalination plants as shown in Table 3.6
Saudi Arabia’s ratio of desalinated water use is just a few percent, much smaller than the over 40% consumed in the UAE and Kuwait, but its plant capacity is 2,2 billion m3 and is the largest in the world [IEA 2005b; Abderrahman 2001b].
Table 3: Water Supply in Saudi Arabia [Abderrahman 2001a]
Million m3 1990 1992 1997
Surface water and shallow aquifers (renewable) 2,100 (13.0%) 2,140 (7.0%) 2,140 (12.0%)
Groundwater (non-renewable) 24,489 (83.0%) 28,576 (90.0%) 15,376 (83.0%)
Desalination 540 (3.0%) 795 (2.0%) 795 (4.0%)
Treated waste water treatment 110 (0.7%) 185 (0.6%) 185 (1.0%)
Total 27,239 31,696 18,496
As pumps are used to obtain groundwater and desalination plants are operated by oil and gas, a huge amount of energy is used to obtain water in Saudi Arabia. That is, water as a Basic Human Need is not available without oil. To desalinate seawater, the Multi-Stage Flash (MSF) and the Reverse Osmosis (RO) processes are widely used. MSF heats up and boils seawater, and potable water is produced by cooling down the generated steam. In the RO process, pressurized seawater is pumped through a reverse osmosis membrane and potable water is
6 Priorities in water supply in Saudi Arabia are (1) residential, (2) animal, (3) agriculture, (4) industry and (5) others [Abderrahman 2001a].
13英論1_萩原_ver4.indd 11313英論1_萩原_ver4.indd 113 2013/03/05 15:14:132013/03/05 15:14:13
114
Kyoto Bulletin of Islamic Area Studies 6 (March 2013)
leached out by condensation and disposing of saline matter. In the MSF process, 2–4 kWh or more of electricity for heat input is needed to obtain 1 m3 of water and in the RO process, 3–8 kWh of electricity is required [IEA 2005b]. To pump up groundwater, 0.4–0.8 kWh of electricity is necessary [Abderrahman 2001b]. Assuming 3 kWh/m3 for MSF, 5.5 kWh/m3 for RO and 0.6 kWh/m3 for pumping up groundwater, the annual power consumption is approx. 13.13 GWh based on the supplied quantity in Table 3 and it corresponds to 8.6% of the total generation of SEC (153.28 GWh).
The desalination process consumes not only electricity but also gas/oil as fuel to boil water especially in the MSF process. Total consumed primary and secondary energy is 11 million toe which comes to 8.4% of Saudi energy consumption, 130 million toe [IEA 2005b]. The cost of desalination is 2.6 SR7 (0.69 USD) and transmission & distribution cost via pipeline is 5.5–6.6 SR [Abderrahman 2001a: 71].8
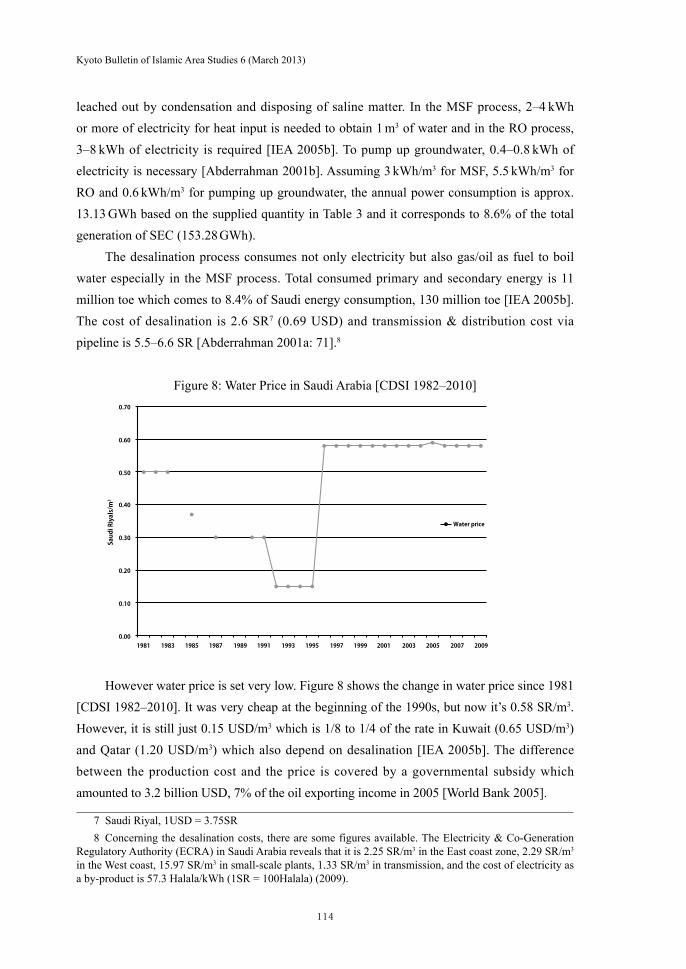
Figure 8: Water Price in Saudi Arabia [CDSI 1982–2010]
However water price is set very low. Figure 8 shows the change in water price since 1981 [CDSI 1982–2010]. It was very cheap at the beginning of the 1990s, but now it’s 0.58 SR/m3. However, it is still just 0.15 USD/m3 which is 1/8 to 1/4 of the rate in Kuwait (0.65 USD/m3) and Qatar (1.20 USD/m3) which also depend on desalination [IEA 2005b]. The difference between the production cost and the price is covered by a governmental subsidy which amounted to 3.2 billion USD, 7% of the oil exporting income in 2005 [World Bank 2005].
7 Saudi Riyal, 1USD = 3.75SR8 Concerning the desalination costs, there are some figures available. The Electricity & Co-Generation
Regulatory Authority (ECRA) in Saudi Arabia reveals that it is 2.25 SR/m3 in the East coast zone, 2.29 SR/m3 in the West coast, 15.97 SR/m3 in small-scale plants, 1.33 SR/m3 in transmission, and the cost of electricity as a by-product is 57.3 Halala/kWh (1SR = 100Halala) (2009).
1981 1983 1985 1987 1989 1991 1993 1995 1997 1999 2001 2003 2005 2007 20090.00
0.10
0.20
0.30
0.40
0.50
0.60
0.70
Saudi Riyals/m3
Water price
13英論1_萩原_ver4.indd 11413英論1_萩原_ver4.indd 114 2013/03/05 15:14:132013/03/05 15:14:13
115
Saudi Arabia’s Domestic Energy Situation and Policy
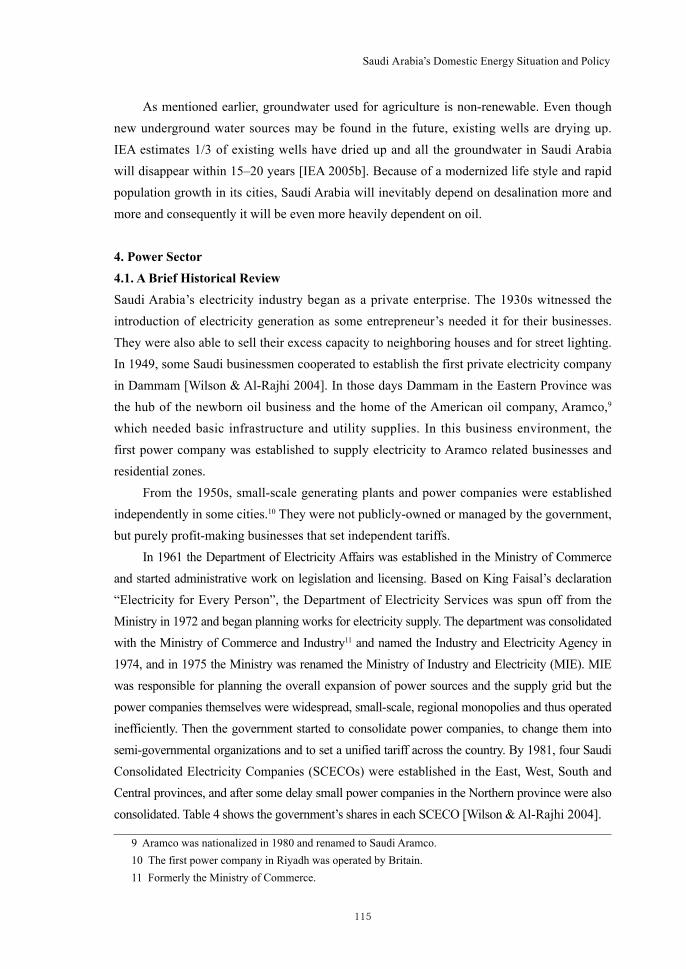
As mentioned earlier, groundwater used for agriculture is non-renewable. Even though new underground water sources may be found in the future, existing wells are drying up. IEA estimates 1/3 of existing wells have dried up and all the groundwater in Saudi Arabia will disappear within 15–20 years [IEA 2005b]. Because of a modernized life style and rapid population growth in its cities, Saudi Arabia will inevitably depend on desalination more and more and consequently it will be even more heavily dependent on oil.
4. Power Sector4.1. A Brief Historical ReviewSaudi Arabia’s electricity industry began as a private enterprise. The 1930s witnessed the introduction of electricity generation as some entrepreneur’s needed it for their businesses. They were also able to sell their excess capacity to neighboring houses and for street lighting. In 1949, some Saudi businessmen cooperated to establish the first private electricity company in Dammam [Wilson & Al-Rajhi 2004]. In those days Dammam in the Eastern Province was the hub of the newborn oil business and the home of the American oil company, Aramco,9 which needed basic infrastructure and utility supplies. In this business environment, the first power company was established to supply electricity to Aramco related businesses and residential zones.
From the 1950s, small-scale generating plants and power companies were established independently in some cities.10 They were not publicly-owned or managed by the government, but purely profit-making businesses that set independent tariffs.
In 1961 the Department of Electricity Affairs was established in the Ministry of Commerce and started administrative work on legislation and licensing. Based on King Faisal’s declaration “Electricity for Every Person”, the Department of Electricity Services was spun off from the Ministry in 1972 and began planning works for electricity supply. The department was consolidated with the Ministry of Commerce and Industry11 and named the Industry and Electricity Agency in 1974, and in 1975 the Ministry was renamed the Ministry of Industry and Electricity (MIE). MIE was responsible for planning the overall expansion of power sources and the supply grid but the power companies themselves were widespread, small-scale, regional monopolies and thus operated inefficiently. Then the government started to consolidate power companies, to change them into semi-governmental organizations and to set a unified tariff across the country. By 1981, four Saudi Consolidated Electricity Companies (SCECOs) were established in the East, West, South and Central provinces, and after some delay small power companies in the Northern province were also consolidated. Table 4 shows the government’s shares in each SCECO [Wilson & Al-Rajhi 2004].
9 Aramco was nationalized in 1980 and renamed to Saudi Aramco.10 The first power company in Riyadh was operated by Britain.11 Formerly the Ministry of Commerce.
13英論1_萩原_ver4.indd 11513英論1_萩原_ver4.indd 115 2013/03/05 15:14:152013/03/05 15:14:15
116
Kyoto Bulletin of Islamic Area Studies 6 (March 2013)
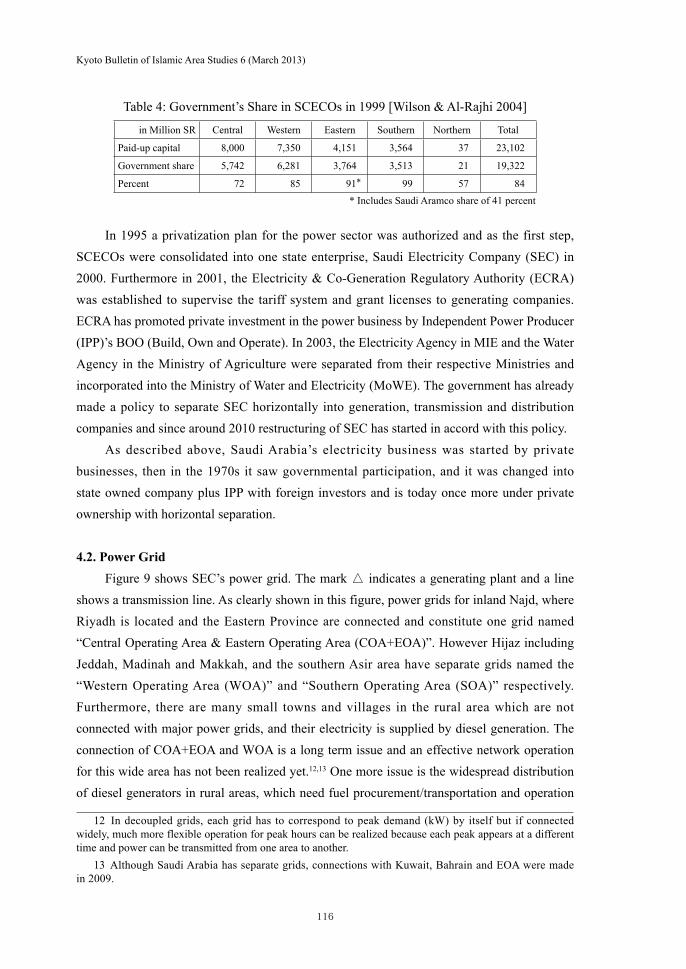
Table 4: Government’s Share in SCECOs in 1999 [Wilson & Al-Rajhi 2004]
in Million SR Central Western Eastern Southern Northern Total
Paid-up capital 8,000 7,350 4,151 3,564 37 23,102
Government share 5,742 6,281 3,764 3,513 21 19,322
Percent 72 85 91* 99 57 84 * Includes Saudi Aramco share of 41 percent
In 1995 a privatization plan for the power sector was authorized and as the first step, SCECOs were consolidated into one state enterprise, Saudi Electricity Company (SEC) in 2000. Furthermore in 2001, the Electricity & Co-Generation Regulatory Authority (ECRA) was established to supervise the tariff system and grant licenses to generating companies. ECRA has promoted private investment in the power business by Independent Power Producer (IPP)’s BOO (Build, Own and Operate). In 2003, the Electricity Agency in MIE and the Water Agency in the Ministry of Agriculture were separated from their respective Ministries and incorporated into the Ministry of Water and Electricity (MoWE). The government has already made a policy to separate SEC horizontally into generation, transmission and distribution companies and since around 2010 restructuring of SEC has started in accord with this policy.
As described above, Saudi Arabia’s electricity business was started by private businesses, then in the 1970s it saw governmental participation, and it was changed into state owned company plus IPP with foreign investors and is today once more under private ownership with horizontal separation.
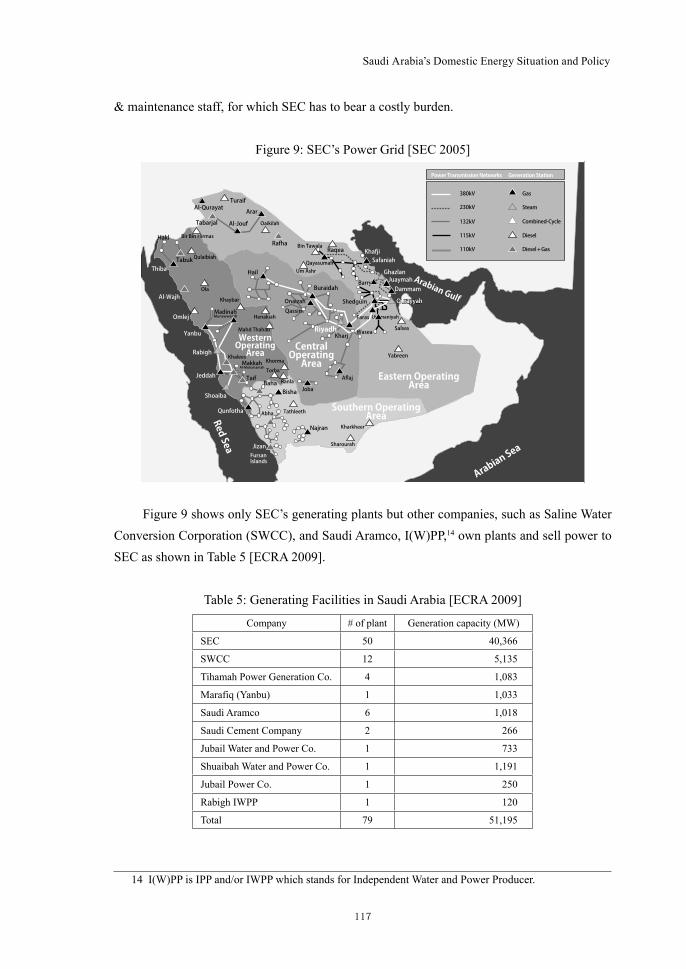
4.2. Power GridFigure 9 shows SEC’s power grid. The mark ▲ indicates a generating plant and a line
shows a transmission line. As clearly shown in this figure, power grids for inland Najd, where Riyadh is located and the Eastern Province are connected and constitute one grid named “Central Operating Area & Eastern Operating Area (COA+EOA)”. However Hijaz including Jeddah, Madinah and Makkah, and the southern Asir area have separate grids named the “Western Operating Area (WOA)” and “Southern Operating Area (SOA)” respectively. Furthermore, there are many small towns and villages in the rural area which are not connected with major power grids, and their electricity is supplied by diesel generation. The connection of COA+EOA and WOA is a long term issue and an effective network operation for this wide area has not been realized yet.12,13 One more issue is the widespread distribution of diesel generators in rural areas, which need fuel procurement/transportation and operation
12 In decoupled grids, each grid has to correspond to peak demand (kW) by itself but if connected widely, much more flexible operation for peak hours can be realized because each peak appears at a different time and power can be transmitted from one area to another.
13 Although Saudi Arabia has separate grids, connections with Kuwait, Bahrain and EOA were made in 2009.
13英論1_萩原_ver4.indd 11613英論1_萩原_ver4.indd 116 2013/03/05 15:14:152013/03/05 15:14:15
117
Saudi Arabia’s Domestic Energy Situation and Policy
& maintenance staff, for which SEC has to bear a costly burden.
Figure 9: SEC’s Power Grid [SEC 2005]
Figure 9 shows only SEC’s generating plants but other companies, such as Saline Water Conversion Corporation (SWCC), and Saudi Aramco, I(W)PP,14 own plants and sell power to SEC as shown in Table 5 [ECRA 2009].
Table 5: Generating Facilities in Saudi Arabia [ECRA 2009]
Company # of plant Generation capacity (MW)
SEC 50 40,366
SWCC 12 5,135
Tihamah Power Generation Co. 4 1,083
Marafiq (Yanbu) 1 1,033
Saudi Aramco 6 1,018
Saudi Cement Company 2 266
Jubail Water and Power Co. 1 733
Shuaibah Water and Power Co. 1 1,191
Jubail Power Co. 1 250
Rabigh IWPP 1 120
Total 79 51,195
14 I(W)PP is IPP and/or IWPP which stands for Independent Water and Power Producer.
Thiba
Al-Wajh
Omlej
Yanbu
Rabigh
Jeddah
Shoaiba
Qunfotha
Jizan
Red Sea
Arabian SeaFursan
Islands
Arabian Gulf
KhafjiSafaniah
GhazlanJuaymahDammam
QurayyahQurayyah
WesternOperatingArea
CentralOperatingArea
Southern OperatingArea
Eastern OperatingArea
Riyadh
Hakl
Tabarjal
Al-QurayatTuraif
Arar
Al-Jouf
Tabuk
Hail
Taif
MadinahMunawwarah
MakkahAl-Mukarramah
Qulaibiah
Ola
Khaybar
Henakiah
Khalees
Torba
Khorma
Ranla
Abha Tathleeth
Sharourah
Kharkheer
BahaBisha
Najran
Mahd Thahab
Oaikilah
Bin Tawala
Qayasumah
Kharj
Barry
Shedgum
Faras
WaseaSalwa
Yabreen
Aflaj
Joba
Uthmaniyah
Um Ashr
OnaizahQassim
RafhaRaqea
Buraidah
Bir Bin Hirmas
380kV
230kV
132kV
115kV
110kV
Gas
Steam
Diesel
Diesel + Gas
Combined-Cycle
Power Transmission Networks Generation Station
13英論1_萩原_ver4.indd 11713英論1_萩原_ver4.indd 117 2013/03/05 15:14:152013/03/05 15:14:15
118
Kyoto Bulletin of Islamic Area Studies 6 (March 2013)
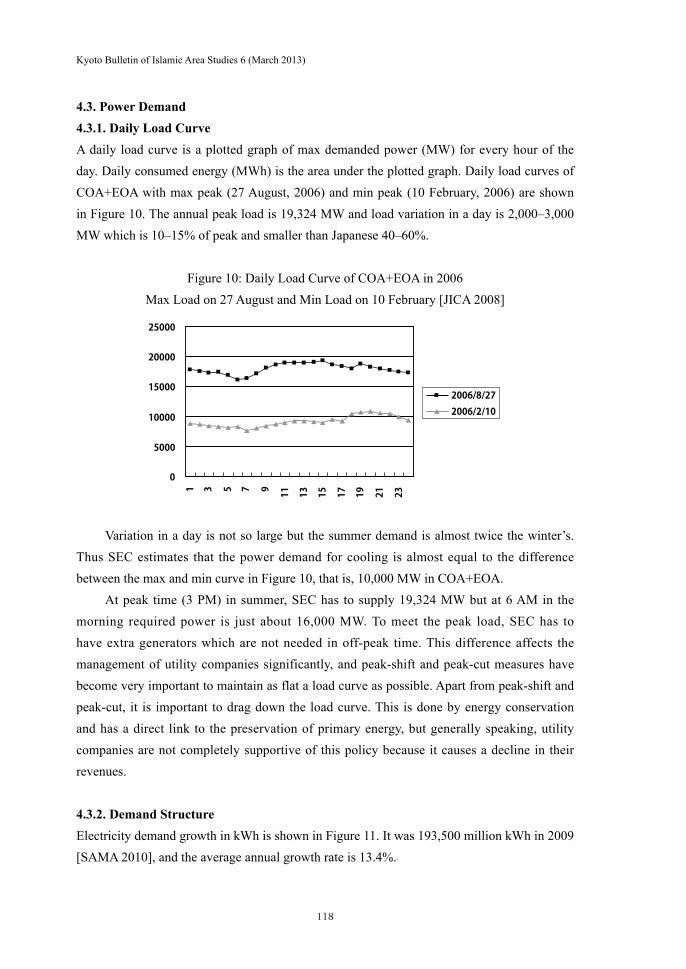
4.3. Power Demand4.3.1. Daily Load CurveA daily load curve is a plotted graph of max demanded power (MW) for every hour of the day. Daily consumed energy (MWh) is the area under the plotted graph. Daily load curves of COA+EOA with max peak (27 August, 2006) and min peak (10 February, 2006) are shown in Figure 10. The annual peak load is 19,324 MW and load variation in a day is 2,000–3,000 MW which is 10–15% of peak and smaller than Japanese 40–60%.
Figure 10: Daily Load Curve of COA+EOA in 2006Max Load on 27 August and Min Load on 10 February [JICA 2008]
Variation in a day is not so large but the summer demand is almost twice the winter’s. Thus SEC estimates that the power demand for cooling is almost equal to the difference between the max and min curve in Figure 10, that is, 10,000 MW in COA+EOA.
At peak time (3 PM) in summer, SEC has to supply 19,324 MW but at 6 AM in the morning required power is just about 16,000 MW. To meet the peak load, SEC has to have extra generators which are not needed in off-peak time. This difference affects the management of utility companies significantly, and peak-shift and peak-cut measures have become very important to maintain as flat a load curve as possible. Apart from peak-shift and peak-cut, it is important to drag down the load curve. This is done by energy conservation and has a direct link to the preservation of primary energy, but generally speaking, utility companies are not completely supportive of this policy because it causes a decline in their revenues.
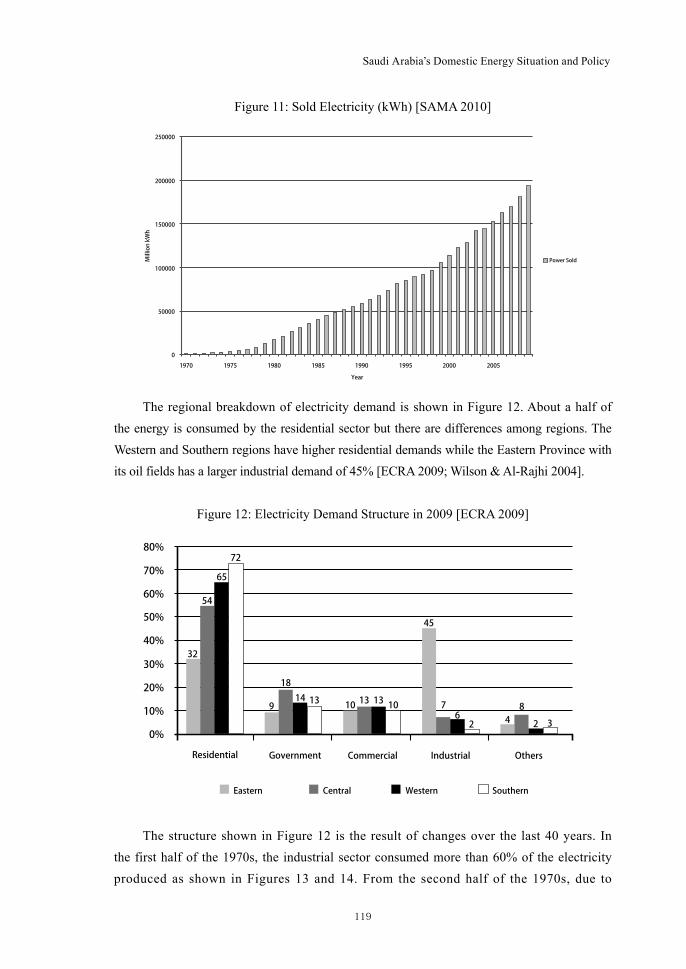
4.3.2. Demand StructureElectricity demand growth in kWh is shown in Figure 11. It was 193,500 million kWh in 2009 [SAMA 2010], and the average annual growth rate is 13.4%..
1 3 5 7 9 11 13 15 17 19 21 23
0
5000
10000
15000
20000
25000
2006/2/102006/8/27
13英論1_萩原_ver4.indd 11813英論1_萩原_ver4.indd 118 2013/03/05 15:14:192013/03/05 15:14:19
119
Saudi Arabia’s Domestic Energy Situation and Policy
Figure 11: Sold Electricity (kWh) [SAMA 2010]
The regional breakdown of electricity demand is shown in Figure 12. About a half of the energy is consumed by the residential sector but there are differences among regions. The Western and Southern regions have higher residential demands while the Eastern Province with its oil fields has a larger industrial demand of 45% [ECRA 2009; Wilson & Al-Rajhi 2004].
Figure 12: Electricity Demand Structure in 2009 [ECRA 2009]
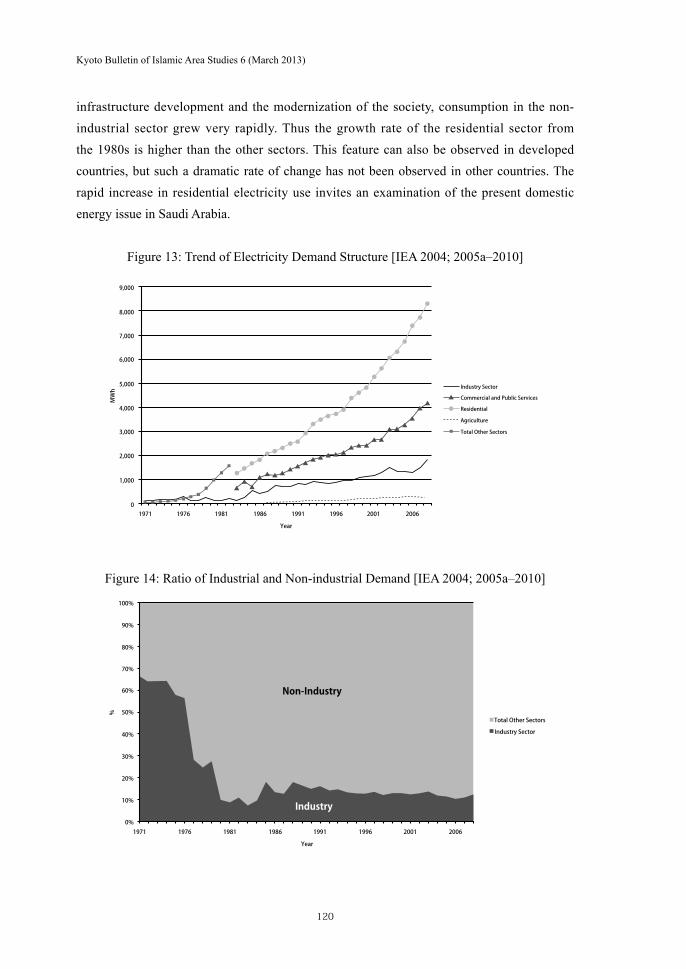
The structure shown in Figure 12 is the result of changes over the last 40 years. In the first half of the 1970s, the industrial sector consumed more than 60% of the electricity produced as shown in Figures 13 and 14. From the second half of the 1970s, due to
1970 1975 1980 1985 1990 1995 2000 2005
Year
0
50000
100000
150000
200000
250000Million kWh
Power Sold
Residential
Eastern Central Western Southern
Government Commercial Industrial Others
0%
10%
20%
30%
40%
50%
60%
70%
80%
32
54
65
72
9
1814 13 10 13 13 10
45
762 4
8
2 3
13英論1_萩原_ver4.indd 11913英論1_萩原_ver4.indd 119 2013/03/05 15:14:212013/03/05 15:14:21
120
Kyoto Bulletin of Islamic Area Studies 6 (March 2013)
infrastructure development and the modernization of the society, consumption in the non-industrial sector grew very rapidly. Thus the growth rate of the residential sector from the 1980s is higher than the other sectors. This feature can also be observed in developed countries, but such a dramatic rate of change has not been observed in other countries. The rapid increase in residential electricity use invites an examination of the present domestic energy issue in Saudi Arabia.
Figure 13: Trend of Electricity Demand Structure [IEA 2004; 2005a–2010]
Figure 14: Ratio of Industrial and Non-industrial Demand [IEA 2004; 2005a–2010]
19710
1,000
2,000
3,000
4,000
5,000
6,000
7,000
8,000
9,000
1976 1981 1986 1991 1996 2001 2006
Year
MWh Industry Sector
Commercial and Public Services
Residential
Agriculture
Total Other Sectors
19710%
10%
20%
30%
40%
50%
60%
70%
80%
90%
100%
1976 1981 1986 1991 1996 2001 2006
Year
%
Industry Sector
Total Other Sectors
Industry
Non-Industry
13英論1_萩原_ver4.indd 12013英論1_萩原_ver4.indd 120 2013/03/05 15:14:252013/03/05 15:14:25
121
Saudi Arabia’s Domestic Energy Situation and Policy
Industrial modernization began with increased oil consumption, while social and residential modernisation started with and requires an ever increasing supply of electricity. Today, electricity is essential to sustain a modern life style. The Bedouin Settlement Policy from the 1940s and TV broadcasting from 1965 both gave impetus to this tendency. In 1970 the First 5 Year Development Plan was started and the government embarked on an urban planning scheme. Comprehensive city planning for Riyadh was established in 1973 and it was from this moment that Saudi people demanded a modern electricity dependent life style, and it goes without saying that in the dry, torrid conditions of the desert climate, air conditioning is most important for a better quality of life. Thus electricity demands for air conditioning are very large, as mentioned earlier.
Saudi Arabia’s electricity demand is unique in that it is not the industrial but the residential sector that consumes a lot. Generally, as modernization has progressed, expensive and convenient secondary energy, especially electricity, has been used to provide an increasingly comfortable life style, but in Saudi Arabia with its severe climate conditions, this has always been the first priority.
5. Issues in Power SectorSo far, the history, distribution, and demand of Saudi Arabia’s power sector have been described and various issues have been mentioned. This section focuses on three major issues: the increasing demand in kWh, the growing peak demand (kW)15 and the distribution of small generators in rural areas.
The growth of electricity demand in kWh is very large and there is an urgent need to moderate it. Furthermore, as shown in Section 3, a huge amount of power and oil resources are devoted to desalination. The Ministry of Petroleum and Mineral Resources and Saudi Aramco have been expressing an urgent sense of crisis, since both water supply and power production depend on oil which is a very valuable export. If it is possible for Saudi Arabia to reduce its local oil consumption this would lead directly to an increase in foreign currency income and conservation of its limited oil and gas resources.
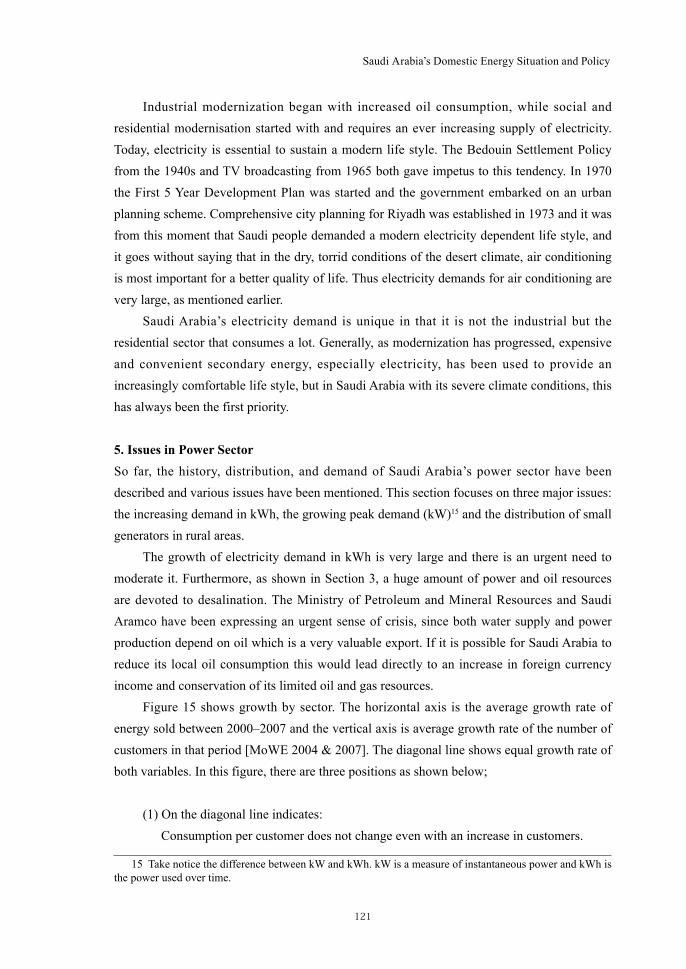
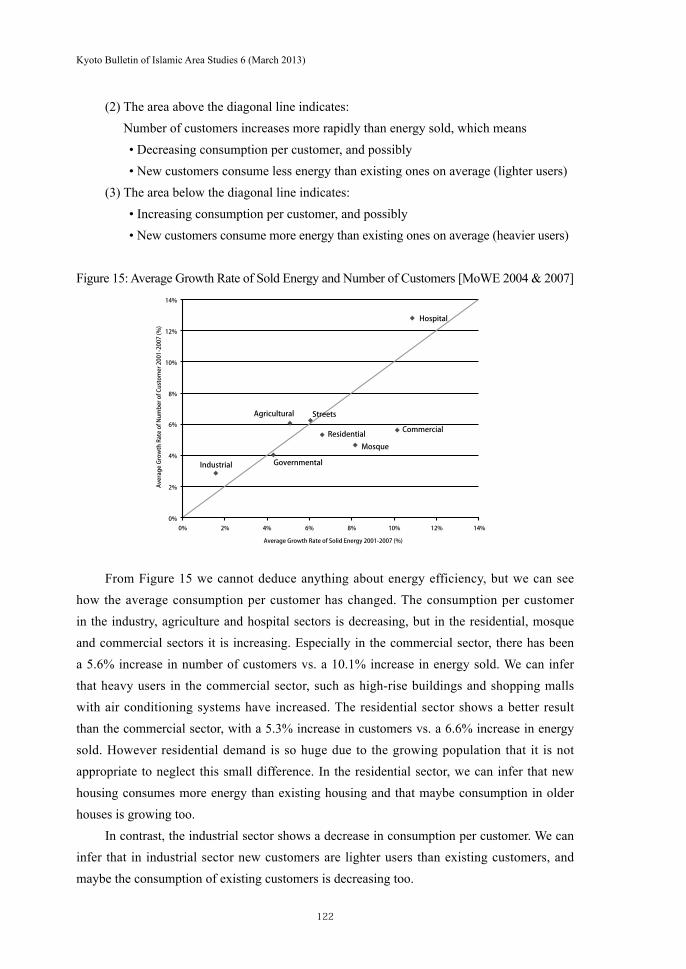
Figure 15 shows growth by sector. The horizontal axis is the average growth rate of energy sold between 2000–2007 and the vertical axis is average growth rate of the number of customers in that period [MoWE 2004 & 2007]. The diagonal line shows equal growth rate of both variables. In this figure, there are three positions as shown below;
(1) On the diagonal line indicates:Consumption per customer does not change even with an increase in customers.
15 Take notice the difference between kW and kWh. kW is a measure of instantaneous power and kWh is the power used over time.
13英論1_萩原_ver4.indd 12113英論1_萩原_ver4.indd 121 2013/03/05 15:14:282013/03/05 15:14:28
122
Kyoto Bulletin of Islamic Area Studies 6 (March 2013)
(2) The area above the diagonal line indicates:Number of customers increases more rapidly than energy sold, which means• Decreasing consumption per customer, and possibly • New customers consume less energy than existing ones on average (lighter users)
(3) The area below the diagonal line indicates:• Increasing consumption per customer, and possibly• New customers consume more energy than existing ones on average (heavier users)
Figure 15: Average Growth Rate of Sold Energy and Number of Customers [MoWE 2004 & 2007]
From Figure 15 we cannot deduce anything about energy efficiency, but we can see how the average consumption per customer has changed. The consumption per customer in the industry, agriculture and hospital sectors is decreasing, but in the residential, mosque and commercial sectors it is increasing. Especially in the commercial sector, there has been a 5.6% increase in number of customers vs. a 10.1% increase in energy sold. We can infer that heavy users in the commercial sector, such as high-rise buildings and shopping malls with air conditioning systems have increased. The residential sector shows a better result than the commercial sector, with a 5.3% increase in customers vs. a 6.6% increase in energy sold. However residential demand is so huge due to the growing population that it is not appropriate to neglect this small difference. In the residential sector, we can infer that new housing consumes more energy than existing housing and that maybe consumption in older houses is growing too.
In contrast, the industrial sector shows a decrease in consumption per customer. We can infer that in industrial sector new customers are lighter users than existing customers, and maybe the consumption of existing customers is decreasing too.
0%0%
2%
4%
6%
8%
10%
12%
14%
2% 4% 6% 8% 10% 12% 14%
Average Growth Rate of Solid Energy 2001-2007 (%)
Average Growth Rate of Number of Customer 2001-2007 (%)
Industrial Governmental
Agricultural Streets
ResidentialMosque
Commercial
Hospital
13英論1_萩原_ver4.indd 12213英論1_萩原_ver4.indd 122 2013/03/05 15:14:292013/03/05 15:14:29
123
Saudi Arabia’s Domestic Energy Situation and Policy
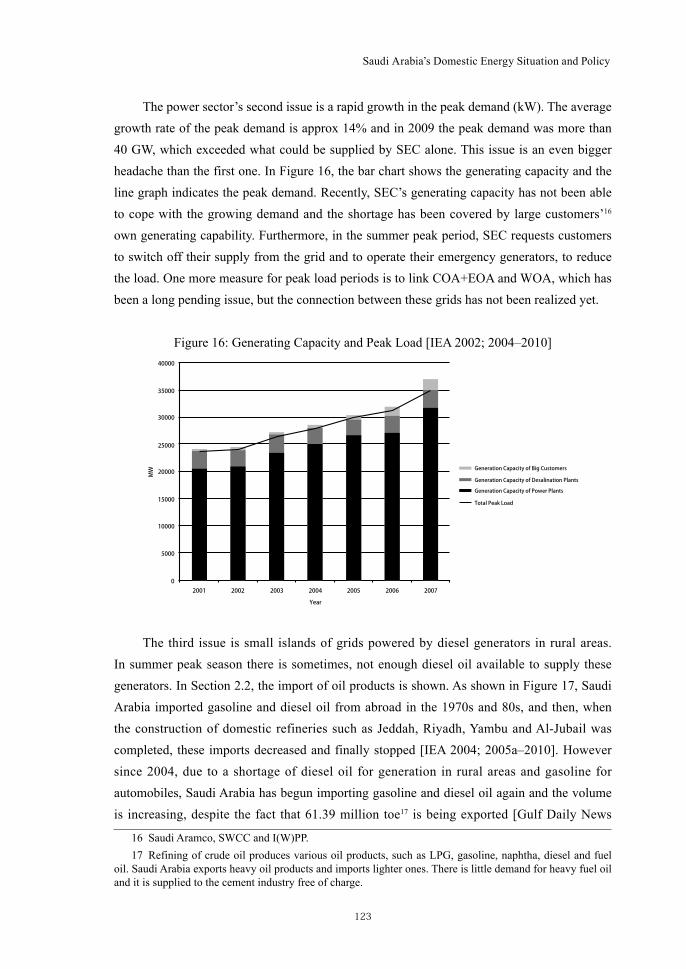
The power sector’s second issue is a rapid growth in the peak demand (kW). The average growth rate of the peak demand is approx 14% and in 2009 the peak demand was more than 40 GW, which exceeded what could be supplied by SEC alone. This issue is an even bigger headache than the first one. In Figure 16, the bar chart shows the generating capacity and the line graph indicates the peak demand. Recently, SEC’s generating capacity has not been able to cope with the growing demand and the shortage has been covered by large customers’16 own generating capability. Furthermore, in the summer peak period, SEC requests customers to switch off their supply from the grid and to operate their emergency generators, to reduce the load. One more measure for peak load periods is to link COA+EOA and WOA, which has been a long pending issue, but the connection between these grids has not been realized yet.
Figure 16: Generating Capacity and Peak Load [IEA 2002; 2004–2010]
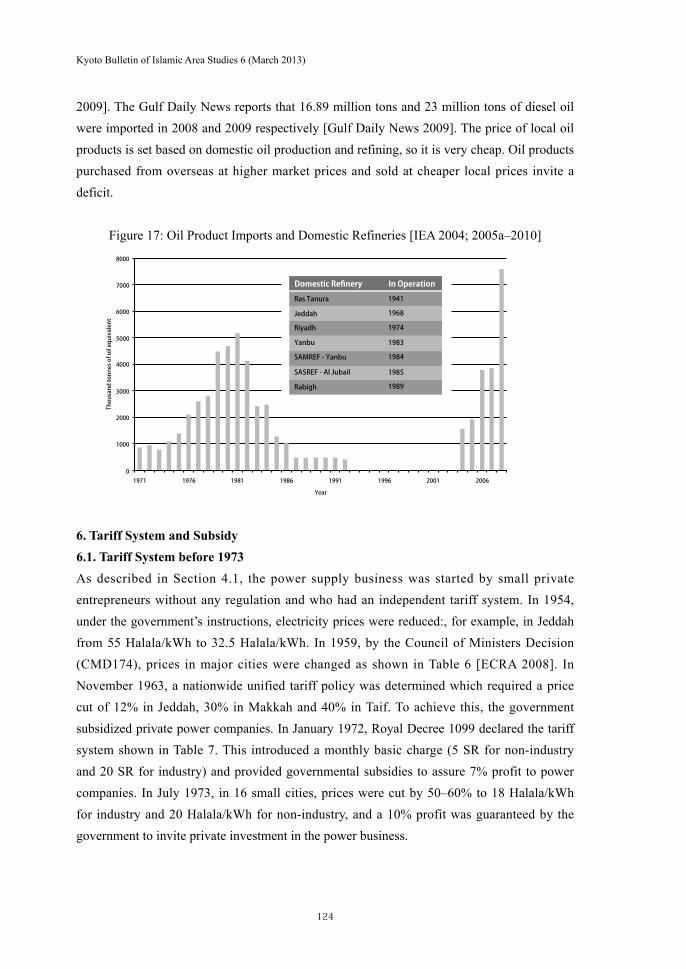
The third issue is small islands of grids powered by diesel generators in rural areas. In summer peak season there is sometimes, not enough diesel oil available to supply these generators. In Section 2.2, the import of oil products is shown. As shown in Figure 17, Saudi Arabia imported gasoline and diesel oil from abroad in the 1970s and 80s, and then, when the construction of domestic refineries such as Jeddah, Riyadh, Yambu and Al-Jubail was completed, these imports decreased and finally stopped [IEA 2004; 2005a–2010]. However since 2004, due to a shortage of diesel oil for generation in rural areas and gasoline for automobiles, Saudi Arabia has begun importing gasoline and diesel oil again and the volume is increasing, despite the fact that 61.39 million toe17 is being exported [Gulf Daily News
16 Saudi Aramco, SWCC and I(W)PP.17 Refining of crude oil produces various oil products, such as LPG, gasoline, naphtha, diesel and fuel
oil. Saudi Arabia exports heavy oil products and imports lighter ones. There is little demand for heavy fuel oil and it is supplied to the cement industry free of charge.
2001 2002 2003 2004 2005 2006 2007
Year
0
5000
10000
15000
20000
25000
30000
35000
40000
MW
Total Peak Load
Generation Capacity of Power Plants
Generation Capacity of Big Customers
Generation Capacity of Desalination Plants
13英論1_萩原_ver4.indd 12313英論1_萩原_ver4.indd 123 2013/03/05 15:14:312013/03/05 15:14:31
124
Kyoto Bulletin of Islamic Area Studies 6 (March 2013)
2009]. The Gulf Daily News reports that 16.89 million tons and 23 million tons of diesel oil were imported in 2008 and 2009 respectively [Gulf Daily News 2009]. The price of local oil products is set based on domestic oil production and refining, so it is very cheap. Oil products purchased from overseas at higher market prices and sold at cheaper local prices invite a deficit.
Figure 17: Oil Product Imports and Domestic Refineries [IEA 2004; 2005a–2010]
6. Tariff System and Subsidy 6.1. Tariff System before 1973As described in Section 4.1, the power supply business was started by small private entrepreneurs without any regulation and who had an independent tariff system. In 1954, under the government’s instructions, electricity prices were reduced:, for example, in Jeddah from 55 Halala/kWh to 32.5 Halala/kWh. In 1959, by the Council of Ministers Decision (CMD174), prices in major cities were changed as shown in Table 6 [ECRA 2008]. In November 1963, a nationwide unified tariff policy was determined which required a price cut of 12% in Jeddah, 30% in Makkah and 40% in Taif. To achieve this, the government subsidized private power companies. In January 1972, Royal Decree 1099 declared the tariff system shown in Table 7. This introduced a monthly basic charge (5 SR for non-industry and 20 SR for industry) and provided governmental subsidies to assure 7% profit to power companies. In July 1973, in 16 small cities, prices were cut by 50–60% to 18 Halala/kWh for industry and 20 Halala/kWh for non-industry, and a 10% profit was guaranteed by the government to invite private investment in the power business.
Domestic Refinery
Ras Tanura 1941
1968
1974
1983
1984
1985
1989
Jeddah
Riyadh
Yanbu
Rabigh
SAMREF - Yanbu
SASREF - Al Jubail
In Operation
1971
1000
2000
3000
4000
5000
6000
7000
8000
01976 1981 1986 1991 1996 2001 2006
Year
Thousand tonnes of oil equivalent
13英論1_萩原_ver4.indd 12413英論1_萩原_ver4.indd 124 2013/03/05 15:14:332013/03/05 15:14:33
125
Saudi Arabia’s Domestic Energy Situation and Policy
Table 6: Electricity Prices in Major Cities per CMD 174 of 1959 [ECRA 2008]
Customer except for Mosque (Halala/kWh)Mosque
(Halala/kWh)First 100 kWh
More than 100 kWh
First 4 hours after sunset
Past 4 hours after sunset
Jeddah 24 21 24 18 18
Makkah 30 25 30 17 15
Madinah 30 25 30 18 15
Khobar 30 25 26 17 15
Dammam 30 25 26 17 15
Table 7: Electricity Prices in Various Cities as per Royal Decree (1099) of 30/11/1391 AH (17/1/1972) [ECRA 2008]
Halala/kWh Non-industrial consumption(Halala/kWh)
Industrial consumption(Halala/kWh)
Jeddah 14 13
Makkah 20 18
Taif 20 18
Madinah 20 18
Yanbu 25 20
Dammam 14 10
6.2. Tariff System after 1974As described above, before 1973 electricity prices were 10–30 Halala/kWh and higher than at present. After 1974, 7 changes in the tariff system were made in 1984, 1985, 1992, 1995, April and October 2000 and January 2011. There was a big revision in January 2011 which broke up the non-industrial sector and introduced a Time of Use (TOU) tariff system for industry18.
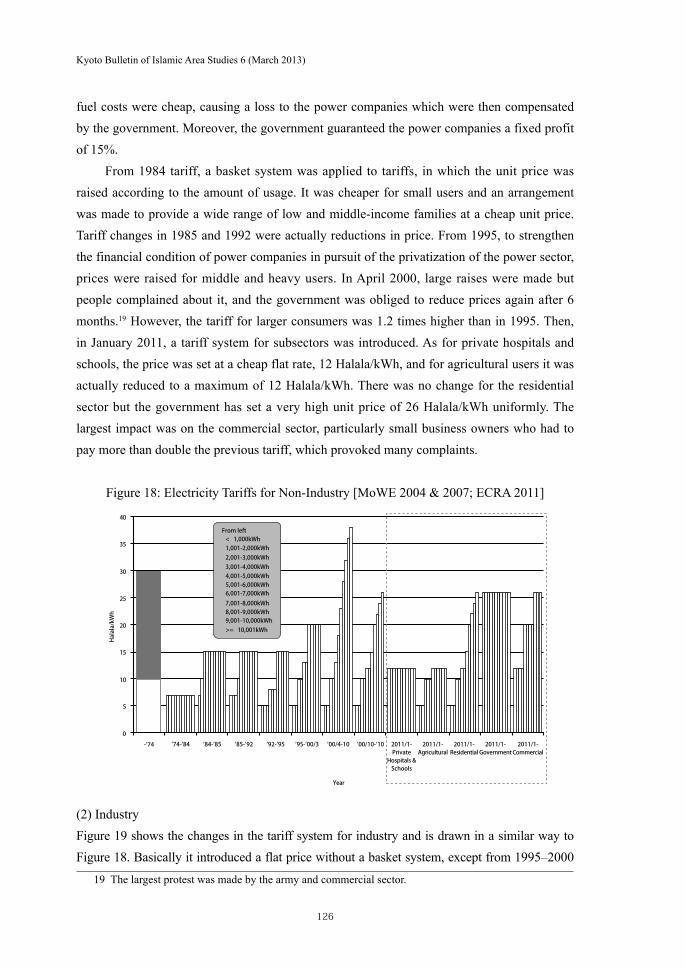
(1) Non-industryFigure 18 shows the changes in non-industrial tariffs. In this figure, from left to right, 9 tariffs are shown in chronological order. The latest is at the far right, surrounded by a dotted line which includes five tariffs for each sector. Each tariff may have different unit prices, shown in 11 bar charts, for each additional 1,000kW from left to right. Unit prices for smaller usage are cheaper.
By CMD1020 in 1974, the government had shares in power companies and prices were cut to less than half (unified 7 Halala/kWh). At the very initial stage, due to regional monopolies, prices were too high , but this new, unified price setting was too low, even though
18 Here I focus on metered tariffs only. Other initial charges on power receiving contracts and meter reading tariff s (basic charge) are not discussed below.
13英論1_萩原_ver4.indd 12513英論1_萩原_ver4.indd 125 2013/03/05 15:14:352013/03/05 15:14:35
126
Kyoto Bulletin of Islamic Area Studies 6 (March 2013)
fuel costs were cheap, causing a loss to the power companies which were then compensated by the government. Moreover, the government guaranteed the power companies a fixed profit of 15%.
From 1984 tariff, a basket system was applied to tariffs, in which the unit price was raised according to the amount of usage. It was cheaper for small users and an arrangement was made to provide a wide range of low and middle-income families at a cheap unit price. Tariff changes in 1985 and 1992 were actually reductions in price. From 1995, to strengthen the financial condition of power companies in pursuit of the privatization of the power sector, prices were raised for middle and heavy users. In April 2000, large raises were made but people complained about it, and the government was obliged to reduce prices again after 6 months.19 However, the tariff for larger consumers was 1.2 times higher than in 1995. Then, in January 2011, a tariff system for subsectors was introduced. As for private hospitals and schools, the price was set at a cheap flat rate, 12 Halala/kWh, and for agricultural users it was actually reduced to a maximum of 12 Halala/kWh. There was no change for the residential sector but the government has set a very high unit price of 26 Halala/kWh uniformly. The largest impact was on the commercial sector, particularly small business owners who had to pay more than double the previous tariff, which provoked many complaints.
Figure 18: Electricity Tariffs for Non-Industry [MoWE 2004 & 2007; ECRA 2011]
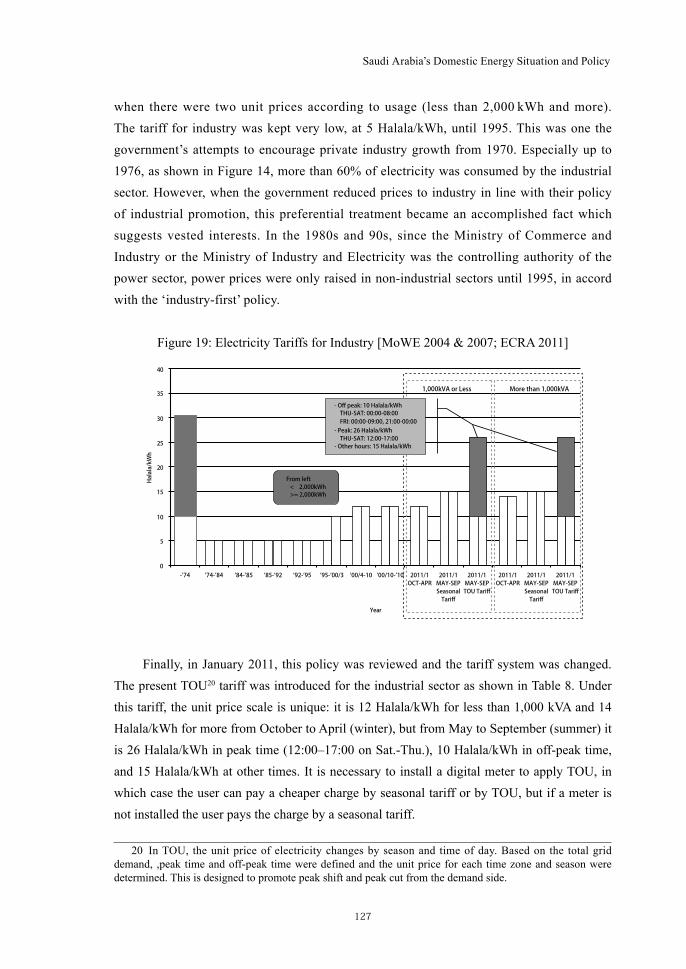
(2) IndustryFigure 19 shows the changes in the tariff system for industry and is drawn in a similar way to Figure 18. Basically it introduced a flat price without a basket system, except from 1995–2000
19 The largest protest was made by the army and commercial sector.
From left< 1,000kWh
>= 10,001kWh
1,001-2,000kWh2,001-3,000kWh3,001-4,000kWh4,001-5,000kWh5,001-6,000kWh6,001-7,000kWh7,001-8,000kWh8,001-9,000kWh9,001-10,000kWh
-’74 ’74-’84 ’84-’85 ’85-’92 ’92-’95 ’95-’00/3 ’00/10-’10 2011/1-PrivateHospitals &Schools
2011/1-Agricultural
2011/1-Residential
2011/1-Government
2011/1-Commercial
’00/4-10
Year
0
5
10
15
20
25
30
35
40
Halala/kWh
13英論1_萩原_ver4.indd 12613英論1_萩原_ver4.indd 126 2013/03/05 15:14:352013/03/05 15:14:35
127
Saudi Arabia’s Domestic Energy Situation and Policy
when there were two unit prices according to usage (less than 2,000 kWh and more). The tariff for industry was kept very low, at 5 Halala/kWh, until 1995. This was one the government’s attempts to encourage private industry growth from 1970. Especially up to 1976, as shown in Figure 14, more than 60% of electricity was consumed by the industrial sector. However, when the government reduced prices to industry in line with their policy of industrial promotion, this preferential treatment became an accomplished fact which suggests vested interests. In the 1980s and 90s, since the Ministry of Commerce and Industry or the Ministry of Industry and Electricity was the controlling authority of the power sector, power prices were only raised in non-industrial sectors until 1995, in accord with the ‘industry-first’ policy.
Figure 19: Electricity Tariffs for Industry [MoWE 2004 & 2007; ECRA 2011]
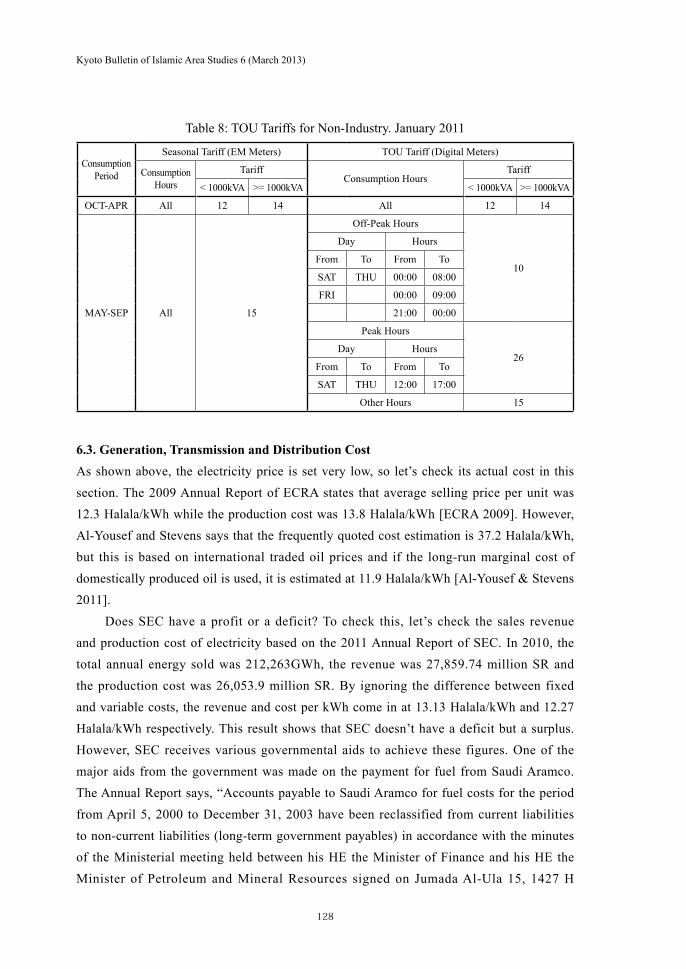
Finally, in January 2011, this policy was reviewed and the tariff system was changed. The present TOU20 tariff was introduced for the industrial sector as shown in Table 8. Under this tariff, the unit price scale is unique: it is 12 Halala/kWh for less than 1,000 kVA and 14 Halala/kWh for more from October to April (winter), but from May to September (summer) it is 26 Halala/kWh in peak time (12:00–17:00 on Sat.-Thu.), 10 Halala/kWh in off-peak time, and 15 Halala/kWh at other times. It is necessary to install a digital meter to apply TOU, in which case the user can pay a cheaper charge by seasonal tariff or by TOU, but if a meter is not installed the user pays the charge by a seasonal tariff.
20 In TOU, the unit price of electricity changes by season and time of day. Based on the total grid demand, ,peak time and off-peak time were defined and the unit price for each time zone and season were determined. This is designed to promote peak shift and peak cut from the demand side.
From left< 2,000kWh>= 2,000kWh
- Off peak: 10 Halala/kWh
- Peak: 26 Halala/kWh
- Other hours: 15 Halala/kWh
THU-SAT: 00:00-08:00
THU-SAT: 12:00-17:00
FRI: 00:00-09:00, 21:00-00:00
1,000kVA or Less More than 1,000kVA
-’74 ’74-’84 ’84-’85 ’85-’92 ’92-’95 ’95-’00/3 ’00/10-’10 2011/1OCT-APR
2011/1MAY-SEPSeasonalTariff
2011/1MAY-SEPSeasonalTariff
2011/1MAY-SEPTOU Tariff
2011/1MAY-SEPTOU Tariff
2011/1OCT-APR
’00/4-10
Year
0
5
10
15
20
25
30
35
40
Halala/kWh
13英論1_萩原_ver4.indd 12713英論1_萩原_ver4.indd 127 2013/03/05 15:14:372013/03/05 15:14:37
128
Kyoto Bulletin of Islamic Area Studies 6 (March 2013)
Table 8: TOU Tariffs for Non-Industry. January 2011
Consumption Period
Seasonal Tariff (EM Meters) TOU Tariff (Digital Meters)
Consumption Hours
TariffConsumption Hours
Tariff
< 1000kVA >= 1000kVA < 1000kVA >= 1000kVA
OCT-APR All 12 14 All 12 14
MAY-SEP All 15
Off-Peak Hours
10
Day Hours
From To From To
SAT THU 00:00 08:00
FRI 00:00 09:00
21:00 00:00
Peak Hours
26Day Hours
From To From To
SAT THU 12:00 17:00
Other Hours 15
6.3. Generation, Transmission and Distribution CostAs shown above, the electricity price is set very low, so let’s check its actual cost in this section. The 2009 Annual Report of ECRA states that average selling price per unit was 12.3 Halala/kWh while the production cost was 13.8 Halala/kWh [ECRA 2009]. However, Al-Yousef and Stevens says that the frequently quoted cost estimation is 37.2 Halala/kWh, but this is based on international traded oil prices and if the long-run marginal cost of domestically produced oil is used, it is estimated at 11.9 Halala/kWh [Al-Yousef & Stevens 2011].
Does SEC have a profit or a deficit? To check this, let’s check the sales revenue and production cost of electricity based on the 2011 Annual Report of SEC. In 2010, the total annual energy sold was 212,263GWh, the revenue was 27,859.74 million SR and the production cost was 26,053.9 million SR. By ignoring the difference between fixed and variable costs, the revenue and cost per kWh come in at 13.13 Halala/kWh and 12.27 Halala/kWh respectively. This result shows that SEC doesn’t have a deficit but a surplus. However, SEC receives various governmental aids to achieve these figures. One of the major aids from the government was made on the payment for fuel from Saudi Aramco. The Annual Report says, “Accounts payable to Saudi Aramco for fuel costs for the period from April 5, 2000 to December 31, 2003 have been reclassified from current liabilities to non-current liabilities (long-term government payables) in accordance with the minutes of the Ministerial meeting held between his HE the Minister of Finance and his HE the Minister of Petroleum and Mineral Resources signed on Jumada Al-Ula 15, 1427 H
13英論1_萩原_ver4.indd 12813英論1_萩原_ver4.indd 128 2013/03/05 15:14:392013/03/05 15:14:39
129
Saudi Arabia’s Domestic Energy Situation and Policy
whereby the Company’s liability to Saudi Aramco was transferred to the account of the Ministry of Finance.” Taking these supports into consideration, we infer that SEC still has a deficit.
It is very difficult to identify the electricity costs of Saudi Arabia and we cannot determine an accurate figure. Anyway, the governmental agency ECRA reports a 1.5 Halala/kWh deficit which comes to 3,260 billion SR annually, which is covered by governmental subsidies, but even in this case, the cost is not based on the international traded oil price. If less were consumed for power generation, Saudi Arabia could obtain more income by selling the oil in the international market. Therefore, increasing the financial strength of SEC is an urgent matter.
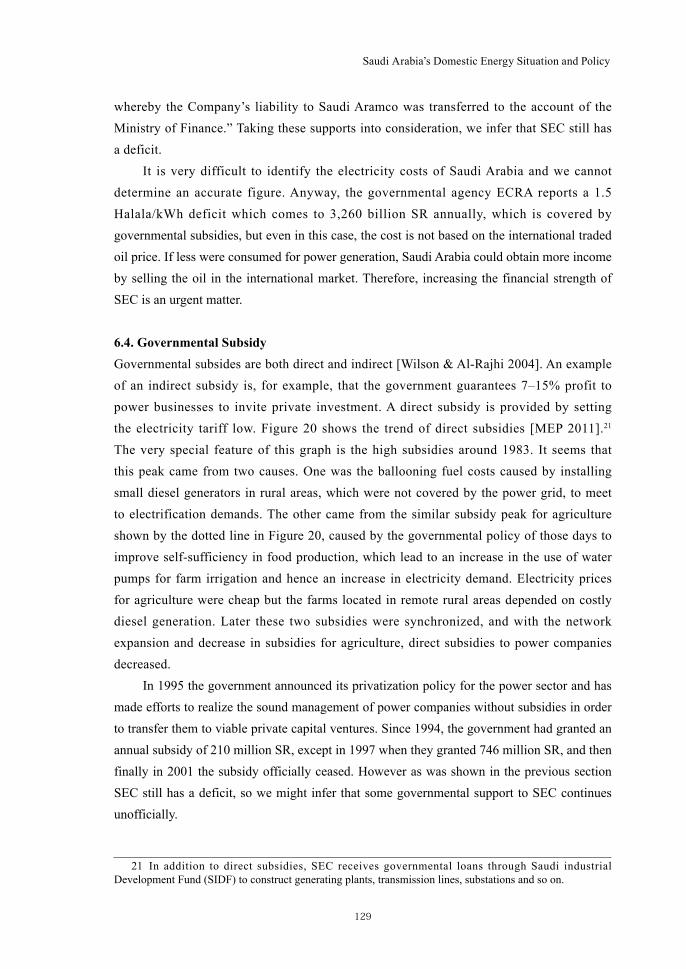
6.4. Governmental SubsidyGovernmental subsides are both direct and indirect [Wilson & Al-Rajhi 2004]. An example of an indirect subsidy is, for example, that the government guarantees 7–15% profit to power businesses to invite private investment. A direct subsidy is provided by setting the electricity tariff low. Figure 20 shows the trend of direct subsidies [MEP 2011].21 The very special feature of this graph is the high subsidies around 1983. It seems that this peak came from two causes. One was the ballooning fuel costs caused by installing small diesel generators in rural areas, which were not covered by the power grid, to meet to electrification demands. The other came from the similar subsidy peak for agriculture shown by the dotted line in Figure 20, caused by the governmental policy of those days to improve self-sufficiency in food production, which lead to an increase in the use of water pumps for farm irrigation and hence an increase in electricity demand. Electricity prices for agriculture were cheap but the farms located in remote rural areas depended on costly diesel generation. Later these two subsidies were synchronized, and with the network expansion and decrease in subsidies for agriculture, direct subsidies to power companies decreased.
In 1995 the government announced its privatization policy for the power sector and has made efforts to realize the sound management of power companies without subsidies in order to transfer them to viable private capital ventures. Since 1994, the government had granted an annual subsidy of 210 million SR, except in 1997 when they granted 746 million SR, and then finally in 2001 the subsidy officially ceased. However as was shown in the previous section SEC still has a deficit, so we might infer that some governmental support to SEC continues unofficially.
21 In addition to direct subsidies, SEC receives governmental loans through Saudi industrial Development Fund (SIDF) to construct generating plants, transmission lines, substations and so on.
13英論1_萩原_ver4.indd 12913英論1_萩原_ver4.indd 129 2013/03/05 15:14:392013/03/05 15:14:39
130
Kyoto Bulletin of Islamic Area Studies 6 (March 2013)
Figure 20: Governmental Subsidy for Electricity and Agriculture [MEP 2011]
One year before the price rise in 2011, financial support for low-income families was started. With this subsidy 220 thousand families received social aid for electricity and food. The Ministry of Social Affairs earmarked SR 103 million for food allowances for the month of Rajab (mid-June to mid-July), while SR 30 million was set aside for the payment of electricity bills [Saudi Gazette 2011]. Support for low-income families was largely improved because total social aid subsidies rose sharply from 3.011 billion SR in 2005 to 13.663 billion SR in 2007.
Governmental subsidies are wide ranging. They are not only for electricity but also imported food such as barley, agriculture such as wheat production, social aid, and so on. These subsidies are officially supports for low-income families and really intended to distribute the country’s vast oil income among the people. But with these subsidies, daily essentials such as water, gasoline, electricity, wheat and milk have been very cheap and accordingly it became possible to hire foreign workers at low salaries [Al-Yousef & Stevens 2011]. As for example in Qatar, water and electricity are free of charge for Qatar citizens but foreign workers have to buy them, Al-Yousef and Stevens have suggested establishing different tariff systems for Saudis and non-Saudis [Al-Yousef & Stevens 2011].
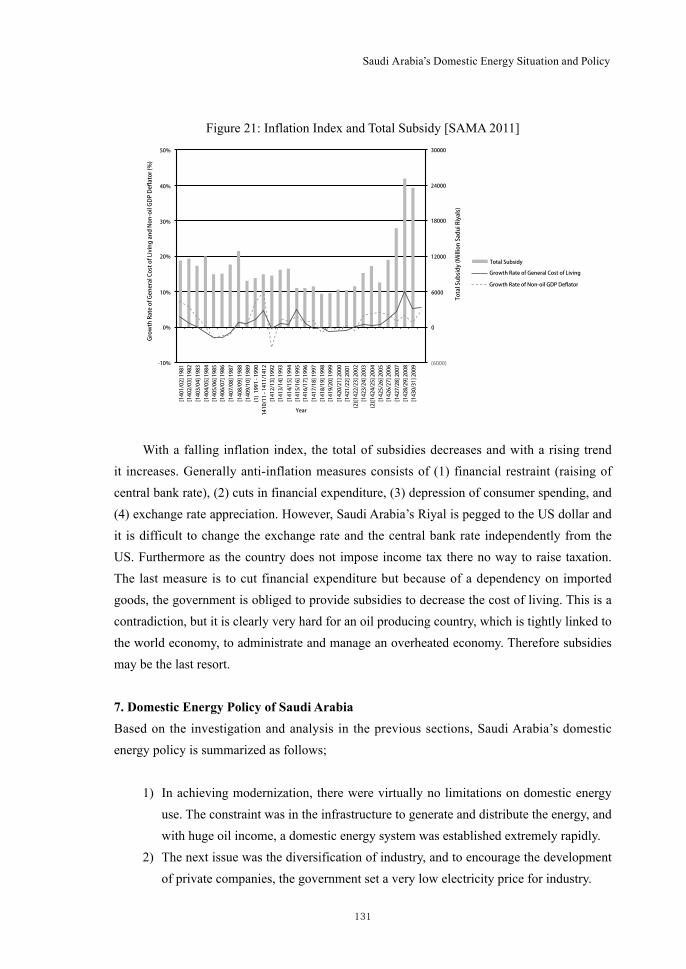
Oil producing states such as Saudi Arabia which are called the Rentier States, can maintain the stability of their administration by distributing their oil wealth. One of these distribution paths is through subsidies, but it should be mentioned that a subsidy is an anti-inflation measure. Figure 21 shows the inflation index, growth rate of cost of living and non-oil GDP deflator with line graphs, and total subsidies with a bar chart [SAMA 2011].
1970 1975 1980 1985 1990 1995 2000 *2005
Year
0.0
500.0
1,000.0
1,500.0
2,000.0
2,500.0
3,000.0
3,500.0
4,000.0
Million Saudi Riyals
g
Agricultural Sector
Electric Companies
13英論1_萩原_ver4.indd 13013英論1_萩原_ver4.indd 130 2013/03/05 15:14:392013/03/05 15:14:39
131
Saudi Arabia’s Domestic Energy Situation and Policy
Figure 21: Inflation Index and Total Subsidy [SAMA 2011]
With a falling inflation index, the total of subsidies decreases and with a rising trend it increases. Generally anti-inflation measures consists of (1) financial restraint (raising of central bank rate), (2) cuts in financial expenditure, (3) depression of consumer spending, and (4) exchange rate appreciation. However, Saudi Arabia’s Riyal is pegged to the US dollar and it is difficult to change the exchange rate and the central bank rate independently from the US. Furthermore as the country does not impose income tax there no way to raise taxation. The last measure is to cut financial expenditure but because of a dependency on imported goods, the government is obliged to provide subsidies to decrease the cost of living. This is a contradiction, but it is clearly very hard for an oil producing country, which is tightly linked to the world economy, to administrate and manage an overheated economy. Therefore subsidies may be the last resort.
7. Domestic Energy Policy of Saudi ArabiaBased on the investigation and analysis in the previous sections, Saudi Arabia’s domestic energy policy is summarized as follows;
1) In achieving modernization, there were virtually no limitations on domestic energy use. The constraint was in the infrastructure to generate and distribute the energy, and with huge oil income, a domestic energy system was established extremely rapidly.
2) The next issue was the diversification of industry, and to encourage the development of private companies, the government set a very low electricity price for industry.
[1401/02] 1981
[1402/03] 1982
[1403/04] 1983
[1404/05] 1984
[1405/06] 1985
[1406/07] 1986
[1407/08] 1987
[1408/09] 1988
[1409/10] 1989
[1412/13] 1992
[1413/14] 1993
[1414/15] 1994
[1415/16] 1995
[1416/17] 1996
[1417/18] 1997
[1418/19] 1998
[1419/20] 1999
[1420/21] 2000
[1421/22] 2001
[1423/24] 2003
(2)[1424/25] 2004
[1425/26] 2005
[1426/27] 2006
[1427/28] 2007
[1428/29] 2008
[1430/31] 2009
(2)[1422/23] 2002
1410/11 - 1411/1412
(1) 1991 - 1990
Year
-10%
0%
10%
20%
30%
40%
50%Growth Rate of General Cost of Living and Non-oil GDP Deflator (%)
(6000)
0
6000
12000
18000
24000
30000
Total Subsidy (Million Sadui Riyals)
y
Total Subsidy
Growth Rate of General Cost of Living
Growth Rate of Non-oil GDP Deflator
13英論1_萩原_ver4.indd 13113英論1_萩原_ver4.indd 131 2013/03/05 15:14:412013/03/05 15:14:41
132
Kyoto Bulletin of Islamic Area Studies 6 (March 2013)
3) Natural gas is only for local use, in power generation for producing feedstock, petrochemical plants, and desalination.
4) The power sector started as a purely private business, then the government took a share in 1970s and it was converted into a state owned company, but now it is once more under privatization and horizontal separation. While the government was driven by necessity to make the power sector public, the water sector, in contrast has always been owned and operated by the government until recently.
5) To invite private investment and ensure a lower price, a subsidy has been provided to the power sector.
6) In the latest tariff system, electricity prices were raised for the commercial sector and the TOU tariff was introduced for the industrial sector.
It is very interesting to know that government hopes to encourage private investment in the power sector. Generally in the Arab world, a huge investment is regarded as high risk, so a subsidy may be necessary to overcome a negative business environment. However, as a very limited number of persons can actually benefit from this subsidy, then it might lead to crony capitalism or be one of distribution channels for the oil income. Even in the present day it is said that IPP business cannot obtain a project without involving a member of the Royal Family.
The difference in the degree of governmental involvement between the power and water sectors is interesting too. Water is the most important commodity in the desert and the government recognized its critical responsibility for water management. As modernization has progressed, the importance of electricity in the non-industrial sector has increased and has now become a new Basic Human Need in this country. The government has to try to maintain a stable supply at a reasonable price.
The price of water and electricity are kept very low by huge subsidies. In Saudi Arabia there is unwritten social contract between the governor and the governed within the fundamental political system [Al-Yousef & Stevens 2011]. The governor and the elite class govern the state with minimum consultation with the governed. To keep cheap utility prices is the nation’s will, and if jeopardized drastic measures have to be taken, as happened in 2000, when the price rise had to be withdrawn after only 6 months. Subsidies to compensate negative net worth were the cost of promoting modernization in the initial stages, but now they have become a very strong impediment. Taking this background into consideration, the tariff change in 2011 was epoch making. To correspond to the urgent issue, peak cut/shift, the TOU tariff was introduced successfully. Meanwhile, price rises for the commercial sector can be taken as evidence of the existence of a consumer society as shown in Figure 15. However, there still much to be done. The unwritten social contract may be very tough, but price rises
13英論1_萩原_ver4.indd 13213英論1_萩原_ver4.indd 132 2013/03/05 15:14:432013/03/05 15:14:43
133
Saudi Arabia’s Domestic Energy Situation and Policy
for the residential sector are necessary. It will be a hard task but it is clearly necessary to provide this nation with a sustainable economy.
8. ConclusionThe history, policy, detailed situation and issues of the Saudi Arabia’s domestic energy, especially electricity, have been analyzed. These topics have seldom been studied in academic articles. Since Saudi Arabia has not publicized its own comprehensive energy plan, this article contributes to the energy policy analysis of Saudi Arabia.
This country is important internationally, since it has produced and exported oil for the world economy. Oil has been essential to the development of the world’s industries, both as a fuel (heat source) and for its byproducts. Moreover, its importance has increased since 1990, because of the development of the IT society and the global economy. IT is maintained by electricity, which is generated mainly using oil, and the global economy needs efficient logistics, which are fuelled by oil. We can say that a modernized society would be brain dead and the global economy would collapse without sufficient energy supplies. Saudi Arabia has become the major “utility state” for the world economy. For this reason Saudi Arabia has always been the center of attention in terms of its oil supply and it has made responding to the world’s (or West’s) expectations as a swing producer its first priority by sacrificing better resource utilization plans for its own sake. Of course, a major reason why Saudi Arabia could do this is its abundant oil resources. It could utilize its oil to modernize its society without paying heed to the cost.
Here are the answers to the questions raised in the introduction. Saudi Arabia has intended to support and develop its non-oil industries through lower energy prices. However, excessive non-industrial energy use has become a major obstacle. The power sector was developed basically by private businesses with government support. Because of the growing peak demands there have been difficulties in maintaining domestic supplies, and wide area grid operation has not been realized. Energy saving and peak shift/cut have become urgent issues and to solve them, the tariff system was changed in 2011.
Now Saudi Arabia has increasing local energy consumption. It is a serious issue and indicates one of Saudi Arabia’s structural paradoxes. It became a modernized country by exporting its vast oil resources to international consumers, but due to the resulting rapid growth it is now consuming ever increasing amounts of its own resources.
13英論1_萩原_ver4.indd 13313英論1_萩原_ver4.indd 133 2013/03/05 15:14:432013/03/05 15:14:43
134
Kyoto Bulletin of Islamic Area Studies 6 (March 2013)
Bibliography
Abderrahman, Walid. 2001a. “Water demand management in Saudi Arabia,” in N. I. Faruqui, A. K. Biswas & M. J. Bino (ed.), Water Management in Islam, Tokyo, New York, Paris: United Nations University Press.
———. 2001b. “Energy and Water in Arid Developing Countries: Saudi Arabia, a Case-study,” Water Resources Development 17(2), pp. 247–255.
British Petroleum. 2011. Statistical Review of World Energy 2010. London: BP.Central Department of Statistics & Information, Ministry of Economic Planning. 1963–2010.
CDSI Statistical Year Book 1–46. Riyadh: CDSI.Electricity & Co-generation Regulatory Authority. 2008. Activities and Achievements of the
Authority 2008. Riyadh: ECRA.———. 2009. Activities and Achievements of the Authority 2009. Riyadh: ECRA———. 2011. Electricity Tariff. Riyadh: ECRA.International Energy Agency. 2004. Energy Balance of Non-OECD Countries, 1971–2003.
Paris: OECD/IEA (CD-ROM).———. 2005a. Energy Balance of Non-OECD Countries 2005 Edition. Paris: OECD/IEA.———. 2005b. World Energy Outlook 2005: Middle East and North Africa Insights. Paris:
OECD/IEA.———. 2006. Energy Balance of Non-OECD Countries 2006 Edition. Paris: OECD/IEA.———. 2007. Energy Balance of Non-OECD Countries 2007 Edition. Paris: OECD/IEA.———. 2008. Energy Balance of Non-OECD Countries 2008 Edition. Paris: OECD/IEA.———. 2009. Energy Balance of Non-OECD Countries 2009 Edition. Paris: OECD/IEA.———. 2010. Energy Balance of Non-OECD Countries 2010 Edition. Paris: OECD/IEA.Japan International Corporation Agency (JICA). 2008. The Master Plan Study for Energy
Conservation in the Power Sector in the Kingdom of Saudi Arabia – Final Report. Tokyo: JICA.
Ministry of Economic Planning. 2011. Achievement of Development Plan 27. Riyadh: MEP.Ministry of Water and Electricity. 2004. Electricity: Growth and Development in Saudi
Arabia, 1424–1425 H (2004G). Riyadh: MoWE.———. 2007. Electricity: Growth and Development in Saudi Arabia, 1427–1428 H (2007G).
Riyadh: MoWE.Saudi Arabian Monetary Agency. 2010. Annual Report 46. Riyadh: SAMA ———. 2011b. Annual Report 47. Riyadh: SAMA.Wilson, Rodney and Al-Rajhi, Ahmad. 2004. Economic Development in Saudi Arabia.
London & New York: Routledge Curzon.World Bank. 2005. A Water Sector Assessment Report on the Countries of the Cooperation
13英論1_萩原_ver4.indd 13413英論1_萩原_ver4.indd 134 2013/03/05 15:14:442013/03/05 15:14:44
135
Saudi Arabia’s Domestic Energy Situation and Policy
Council of the Arab States of the Gulf, Report No. 32539-MNA, 31 March 2005. Washington DC: The World Bank.
———. 2011. World Bank Data. http://data.worldbank.org/ (Accessed on May 31, 2012).Al-Yousef, Yousef and Stevens, Paul. 2011. “The cost of domestic energy prices to Saudi
Arabia,” Energy Policy 39, pp. 6900–6905.
13英論1_萩原_ver4.indd 13513英論1_萩原_ver4.indd 135 2013/03/05 15:14:442013/03/05 15:14:44
Related Documents