Icarus 202 (2009) 249–259 Contents lists available at ScienceDirect Icarus www.elsevier.com/locate/icarus Saturn’s latitudinal C 2 H 2 and C 2 H 6 abundance profiles from Cassini/CIRS and ground-based observations Brigette E. Hesman a,∗ , Donald E. Jennings b , Pedro V. Sada c , Gordon L. Bjoraker b , Richard K. Achterberg d , Amy A. Simon-Miller b , Carrie M. Anderson b , Robert J. Boyle e , Conor A. Nixon d , Leigh N. Fletcher f , George H. McCabe g a Pete V. Domenici Science Operations Center – NRAO, 1003 Lopezville Road, Socorro, NM 87801, USA b Goddard Space Flight Center, Greenbelt, MD 20771, USA c Departamento de Física y Matemáticas, Universidad de Monterrey, Garza García, NL 66238, Mexico d University of Maryland, Department of Astronomy, College Park, MD 20742, USA e Department of Physics and Astronomy, Dickinson College, Carlisle, PA 17013, USA f Jet Propulsion Laboratory, Pasadena, CA 91109, USA g CMA ConsultingServices, Latham, NY 12110, USA article info abstract Article history: Received 29 August 2008 Revised 11 February 2009 Accepted 16 February 2009 Available online 26 February 2009 Keywords: Abundances, atmospheres Saturn, atmosphere Atmospheres, dynamics Hydrocarbons in the upper atmosphere of Saturn are known, from Voyager, ground-based, and early Cassini results, to vary in emission intensity with latitude. Of particular interest is the marked increase in hydrocarbon line intensity near the south pole during southern summer, as the increased line intensity cannot be simply explained by the increased temperatures observed in that region since the variations between C 2 H 2 and C 2 H 6 emission in the south pole region are different. In order to measure the latitudinal variations of hydrocarbons in Saturn’s southern hemisphere we have used 3 cm −1 resolution Cassini CIRS data from 2006 and combined this with measurements from the ground in October 2006 at NASA’s IRTF using Celeste, an infrared high-resolution cryogenic grating spectrometer. These two data sets have been used to infer the molecular abundances of C 2 H 2 and C 2 H 6 across the southern hemisphere in the 1–10 mbar altitude region. We find that the latitudinal acetylene profile follows the yearly average mean daily insolation except at the southern pole where it peaks in abundance. Near the equator (5 ◦ S) the C 2 H 2 abundance at the 1.2 mbar level is (1.6 ± 0.19) × 10 −7 and it decreases by a factor of 2.7 from the equator toward the pole. However, at the pole (∼87 ◦ S) the C 2 H 2 abundance jumps to (1.8 ± 0.3) × 10 −7 , approximately the equatorial value. The C 2 H 6 abundance near the equator at the 2 mbar level is (0.7 ± 0.1) × 10 −5 and stays approximately constant until mid-latitudes where it increases gradually toward the pole, attaining a value of (1.4 ± 0.4) × 10 −5 there. The increase in ethane toward the pole with the corresponding decrease in acetylene is consistent with southern hemisphere meridional winds [Greathouse, T.K., Lacy, J.H., Bézard, B., Moses, J.I., Griffith, C.A., Richter, M.J., 2005. Icarus 177, 18– 31]. The localized increase in acetylene at the pole provides evidence that there is dynamical transport of hydrocarbons from the equator to the southern pole. © 2009 Elsevier Inc. All rights reserved. 1. Introduction Acetylene (C 2 H 2 ) and ethane (C 2 H 6 ) are important species in outer planet atmospheres as they are photochemical by-products of methane photolysis and the dominant stratospheric coolants at mid-infrared wavelengths. Their latitudinal abundance profiles may be tied to seasonally varying insolation (Moses and Greathouse, 2005) and possibly indicate the dynamical forces at work in the atmosphere. Therefore, latitudinal, temporal, and vertical variations * Corresponding author. Fax: +1 (575) 835 7027. E-mail address: [email protected] (B.E. Hesman). of stratospheric hydrocarbons can provide constraints on dynamics, seasonal climate models, and photochemical models. Observations of the south pole stratosphere, between Saturn’s southern summer solstice and 3 saturnian weeks after solstice ( L s = 270 ◦ –293 ◦ , Apr 2002–Jan 2004), have shown that the pole is 10–15 K warmer than the equator regions (Flasar et al., 2005; Orton and Yanamandra-Fisher, 2005; Greathouse et al., 2005). An early radiative model by Bezard and Gautier (1985) and a ra- diative/dynamic model by Conrath et al. (1990) indicate that the radiative relaxation time is approximately 9 Earth years at the 1 mbar level on Saturn. Therefore, at the time of these observa- tions a maximum difference of 5 K in stratospheric temperature should have been observed between the equator and the southern 0019-1035/$ – see front matter © 2009 Elsevier Inc. All rights reserved. doi:10.1016/j.icarus.2009.02.013

Welcome message from author
This document is posted to help you gain knowledge. Please leave a comment to let me know what you think about it! Share it to your friends and learn new things together.
Transcript
Icarus 202 (2009) 249–259
Contents lists available at ScienceDirect
Icarus
www.elsevier.com/locate/icarus
Saturn’s latitudinal C2H2 and C2H6 abundance profiles from Cassini/CIRS andground-based observations
Brigette E. Hesman a,∗, Donald E. Jennings b, Pedro V. Sada c, Gordon L. Bjoraker b, Richard K. Achterberg d,Amy A. Simon-Miller b, Carrie M. Anderson b, Robert J. Boyle e, Conor A. Nixon d, Leigh N. Fletcher f,George H. McCabe g
a Pete V. Domenici Science Operations Center – NRAO, 1003 Lopezville Road, Socorro, NM 87801, USAb Goddard Space Flight Center, Greenbelt, MD 20771, USAc Departamento de Física y Matemáticas, Universidad de Monterrey, Garza García, NL 66238, Mexicod University of Maryland, Department of Astronomy, College Park, MD 20742, USAe Department of Physics and Astronomy, Dickinson College, Carlisle, PA 17013, USAf Jet Propulsion Laboratory, Pasadena, CA 91109, USAg CMA Consulting Services, Latham, NY 12110, USA
a r t i c l e i n f o a b s t r a c t
Article history:Received 29 August 2008Revised 11 February 2009Accepted 16 February 2009Available online 26 February 2009
Keywords:Abundances, atmospheresSaturn, atmosphereAtmospheres, dynamics
Hydrocarbons in the upper atmosphere of Saturn are known, from Voyager, ground-based, and earlyCassini results, to vary in emission intensity with latitude. Of particular interest is the marked increase inhydrocarbon line intensity near the south pole during southern summer, as the increased line intensitycannot be simply explained by the increased temperatures observed in that region since the variationsbetween C2H2 and C2H6 emission in the south pole region are different. In order to measure thelatitudinal variations of hydrocarbons in Saturn’s southern hemisphere we have used 3 cm−1 resolutionCassini CIRS data from 2006 and combined this with measurements from the ground in October 2006at NASA’s IRTF using Celeste, an infrared high-resolution cryogenic grating spectrometer. These twodata sets have been used to infer the molecular abundances of C2H2 and C2H6 across the southernhemisphere in the 1–10 mbar altitude region. We find that the latitudinal acetylene profile follows theyearly average mean daily insolation except at the southern pole where it peaks in abundance. Nearthe equator (5◦ S) the C2H2 abundance at the 1.2 mbar level is (1.6 ± 0.19) × 10−7 and it decreases by afactor of 2.7 from the equator toward the pole. However, at the pole (∼87◦ S) the C2H2 abundance jumpsto (1.8 ± 0.3) × 10−7, approximately the equatorial value. The C2H6 abundance near the equator at the2 mbar level is (0.7±0.1)×10−5 and stays approximately constant until mid-latitudes where it increasesgradually toward the pole, attaining a value of (1.4 ± 0.4) × 10−5 there. The increase in ethane towardthe pole with the corresponding decrease in acetylene is consistent with southern hemisphere meridionalwinds [Greathouse, T.K., Lacy, J.H., Bézard, B., Moses, J.I., Griffith, C.A., Richter, M.J., 2005. Icarus 177, 18–31]. The localized increase in acetylene at the pole provides evidence that there is dynamical transportof hydrocarbons from the equator to the southern pole.
© 2009 Elsevier Inc. All rights reserved.
1. Introduction
Acetylene (C2H2) and ethane (C2H6) are important species inouter planet atmospheres as they are photochemical by-productsof methane photolysis and the dominant stratospheric coolants atmid-infrared wavelengths. Their latitudinal abundance profiles maybe tied to seasonally varying insolation (Moses and Greathouse,2005) and possibly indicate the dynamical forces at work in theatmosphere. Therefore, latitudinal, temporal, and vertical variations
* Corresponding author. Fax: +1 (575) 835 7027.E-mail address: [email protected] (B.E. Hesman).
0019-1035/$ – see front matter © 2009 Elsevier Inc. All rights reserved.doi:10.1016/j.icarus.2009.02.013
of stratospheric hydrocarbons can provide constraints on dynamics,seasonal climate models, and photochemical models.
Observations of the south pole stratosphere, between Saturn’ssouthern summer solstice and 3 saturnian weeks after solstice(Ls = 270◦–293◦ , Apr 2002–Jan 2004), have shown that the poleis 10–15 K warmer than the equator regions (Flasar et al., 2005;Orton and Yanamandra-Fisher, 2005; Greathouse et al., 2005). Anearly radiative model by Bezard and Gautier (1985) and a ra-diative/dynamic model by Conrath et al. (1990) indicate that theradiative relaxation time is approximately 9 Earth years at the1 mbar level on Saturn. Therefore, at the time of these observa-tions a maximum difference of 5 K in stratospheric temperatureshould have been observed between the equator and the southern

250 B.E. Hesman et al. / Icarus 202 (2009) 249–259
pole. This model-data mismatch is likely due to the assumptionof uniform mole fraction profiles of C2H2 and C2H6 with latitude,altitude, and season. More accurate profiles of these species willgreatly affect the outcome of radiative models and therefore thepredicted seasonal behavior of the temperatures on Saturn.
Acetylene and ethane are formed at pressures less than 0.1mbar by photolysis of methane. The complete chemical pathwayby which these species are formed is given in Moses et al. (2000).Acetylene has a short lifetime because it has a large cross-section,relative to other species susceptible to photolysis, and is thereforenot well shielded. It is however efficiently recycled which increasesits lifetime above the vertical transport time; thereby, allowingits transport deeper into the atmosphere (e.g. at 2 mbar, 36◦ S,and Ls = 273◦ its lifetime is ∼100 years; Moses and Greathouse,2005). Ethane’s lifetime is significantly longer as its photolysiscross-section is smaller than the more abundant species methanewhich effectively shields it and also allows its transport into thedeeper atmosphere (e.g. at 2 mbar, 36◦ S, and Ls = 273◦ its lifetimeis ∼700 years; Moses and Greathouse, 2005). In addition, the longvertical diffusion timescales in Saturn’s stratosphere should pre-vent any dramatic seasonal changes from propagating to the lowerstratosphere. Models of the lower stratospheric latitudinal abun-dance profiles of acetylene and ethane, by Moses and Greathouse(2005), indicate that their shapes should resemble the yearly av-erage mean daily insolation (see Fig. 4; Moses and Greathouse,2005). Therefore, observations should show that the acetylene andethane latitudinal profiles should decrease from the equator to thepole.
Investigation and monitoring of the latitudinal profiles of Sat-urn’s hydrocarbons until recently was not possible and thereforeonly global averages were reported. The most recent measure-ments published which determined global averages were by Sadaet al. (2005). Sada et al. used the cryogenic grating spectrometer,Celeste, at the McMath–Pierce telescope, in 1994 (Ls = 178◦), todetermine C2H2 and C2H6 abundances of 3.4 × 10⁻⁷ at 1.6 mbarand 6.7 × 10⁻⁶ respectively at 1.0 mbar. They also performed are-analysis of Voyager IRIS data (Ls = 8◦–19◦) to find mid-latitudevalues of 1.6 × 10⁻⁷ at 2 mbar and 8.6 × 10⁻⁶ at 0.1–3 mbar forC2H2 and C2H6 respectively.
Greathouse et al. (2005) published the first measurements ofthe latitudinal variations of C2H2 and C2H6. They used the mid-infrared TEXES grating spectrograph at the NASA Infrared TelescopeFacility (IRTF) during Saturn’s southern summer solstice (October2002; Ls = 270◦) to measure 12 latitude bins across the southernhemisphere. They found that C2H2 decreased in abundance fromthe equator to the south pole by a factor of ∼3.7 at 1 mbar andC2H6 stayed approximately constant from equator to the pole at2 mbar.
Most recently, Howett et al. (2007) utilized the excellent spa-tial resolution available from the Composite Infrared Spectrometer(CIRS) onboard the Cassini spacecraft to determine the latitudinalabundance profiles of C2H2 and C2H6. Howett et al. used 0.5 cm−1,low-emission angle CIRS data that ranged in latitude from ∼14◦–66◦ S. The data were taken between June and November 2004(centered on Ls = 293◦). Howett et al.’s results indicate that theC2H2 latitudinal profile decreases by ∼1.7 from equator to thesouthern polar region whereas the C2H6 profile stays relativelyconstant until approximately 60◦ S and then increases toward thepole (both results stated for 2 mbar).
The results of Greathouse et al. (2005) and Howett et al. (2007)agree with the model results of Moses and Greathouse (2005) forC2H2; the latitudinal profiles decrease in abundance toward thesouth pole and approximately follows the yearly average meandaily insolation. However, the models of Moses and Greathouseindicate that C2H6 at the 2 mbar level should also have a pro-file that decreases from equator to pole; the observations indicate
a constant or increasing abundance. The differences between themodels and observations seem to indicate the presence of merid-ional transport, in the southern hemisphere, that has a timescaleless than the ethane lifetime and longer than the acetylene life-time. Moses and Greathouse concluded that the southern merid-ional winds should have a magnitude of ∼0.4–2 cm/s at 2 mbar.
Hydrocarbon monitoring is still required to confirm the aboveresults and watch for changes in hydrocarbon latitudinal profilesas the seasons change on Saturn. In addition, CIRS observationshave continued to add additional spectra at higher southern lati-tudes. The additional CIRS spectra enable us to determine an entiresouthern hemisphere latitudinal profile for C2H2 and C2H6, whichincludes observations performed within 3◦ of the southern pole.These observations have been combined here with ground-basedC2H2 and C2H6 measurements that were performed in conjunc-tion with south pole observations by CIRS on October 11, 2006(Ls = 317◦). The ground-based observations provide complemen-tary measurements of individual C2H2 and C2H6 spectral featuresfor the southern hemisphere.
2. Observations
The Cassini CIRS instrument in orbit around Saturn presentsa unique opportunity to compare and contrast space-based ob-servations with infrared ground-based observations, using a high-resolution (<0.1 cm−1) cryogenic grating spectrometer (Celeste).The two methods complement each other as the CIRS observationsprovide excellent spatial resolution (∼0.5◦) whereas Celeste pro-vides higher spectral resolution and can produce a snapshot of alllatitudes viewable from Earth at the time of the CIRS observations.
2.1. CIRS
The Composite Infrared Spectrometer (CIRS) on Cassini is adual Fourier transform spectrometer covering the thermal infrared(Kunde et al., 1996). A Martin–Puplett polarizing interferometercovers the far-infrared from 10 to 600 cm−1 with a single 4 mradfield-of-view detector (FP1). A conventional Michelson interferom-eter covers the mid-infrared ranges 600–1100 cm−1 (FP3) and1100–1500 cm−1 (FP4) with two 10-element detector arrays, eachdetector having a 0.3 mrad field-of-view. The apodized spectralresolution of CIRS can be chosen to be 0.5 to 15 cm−1. The in-strument operates at a temperature of 170 K, except for the mid-infrared detectors that operate near 80 K. CIRS is mounted onCassini’s remote sensing pallet and is bore-sighted with the otherremote sensing ultraviolet, visible and infrared instruments. Point-ing is achieved by positioning the spacecraft.
CIRS must build up planet-wide observations over many observ-ing sessions and at higher spectral resolution more time is requiredat each latitude which results in there being less latitude coverageat 0.5 cm−1 spectral resolution. The 3 cm−1 spectral resolution ob-servations provide relatively good spatial coverage and when thisdata is taken at high emission angle (θ > 70◦) it is possible to de-termine C2H2 and C2H6 abundances from the FP3 spectra. Fig. 1shows the C2H2 and C2H6 contribution functions from model CIRSobservations at 3 cm−1 with low- and high-emission angles. Inthe low-emission angle case (dash and dash–dot lines) there aretwo peaks: one in the stratospheric line forming region for thesetwo hydrocarbons (∼1 mbar) and the other in the troposphericcontinuum forming region (∼600 mbar). Using low-emission angle3 cm−1 observations to retrieve hydrocarbon abundances can bedifficult because any uncertainty in the tropospheric temperaturecan therefore affect the retrieved hydrocarbon abundance. Usinghigh-emission angle data provides an excellent alternative as thecontribution from the tropospheric continuum is significantly re-duced which allows the hydrocarbon abundances to be retrieved

Saturn’s hydrocarbon latitudinal abundance variations 251
Fig. 1. Normalized contribution functions at wavenumbers used to retrieve C2H2 and C2H6 abundances for a spectral resolution of 3 cm−1. A comparison between thecontribution functions for high emission angle data (θ > 70◦) and low emission angle data (θ < 15◦) are shown.
Table 1Summary of the 2006 CIRS Focal Plane 3 (FP3) observations at 3 cm−1 spectralresolution used for acetylene and ethane abundance retrievals.
Bin Averagelatitude
Averagelongitude
Averageemission angle
Number ofspectra
80–90◦ S −87.2◦ 319.9◦ 75.1◦ 306570–80◦ S −74.2◦ 86.9◦ 81.2◦ 18760–70◦ S −64.1◦ 148.6◦ 78.6◦ 1750–60◦ S −50.3◦ 126.9◦ 74.7◦ 5440–50◦ S −45.8◦ 134.7◦ 74.9◦ 27630–40◦ S −34.2◦ 271.3◦ 76.4◦ 144220–30◦ S −25.0◦ 232.1◦ 78.9◦ 75510–20◦ S −14.5◦ 153.0◦ 81.2◦ 17010–10◦ S −5.2◦ 95.1◦ 74.9◦ 420
with greater confidence from the 3 cm−1 data; this allows us tocapitalize on the greater spatial coverage in the 3 cm−1 data set.
The following criteria were used when selecting our CIRS data:the observing period was limited to 2006 to ensure the CIRS andCeleste observations were performed at approximately the samesaturnian time (maximum temporal separation between Celesteand CIRS observations was 1.5 saturnian weeks), the emission an-gle was constrained to have values between 70◦ and 90◦ , and alatitude bin size of 10◦ was used for comparison to our Celestedata and to ensure adequate signal-to-noise (S/N). Table 1 summa-rizes the CIRS observations used in this analysis for the acetyleneand ethane abundance retrievals.
To retrieve temperatures, we used a series of observations takenduring 2005 in which the FP3 and FP4 arrays were placed alongSaturn’s central meridian for two 11-hour periods separated byapproximately 10 hours. To increase the S/N, the detectors wereoperated in paired mode, giving data at 5 latitudes for each obser-vation. Longitude coverage was provided by the rotation of Saturn.The resulting data cover the spectral range from 600 to 1400 cm−1
at an apodized spectral resolution of 3 cm−1. The spatial resolu-tion of the observations is approximately 2◦ of latitude. Table 2summarizes the CIRS observations used in this analysis to retrievetemperatures.
Table 2Summary of the CIRS Focal Plane 3 (FP3) and Focal Plane 4 (FP4) observations at3 cm−1 spectral resolution used for temperature retrievals.
Observationdates
Latituderange
Averageemission angle
Number ofFP3 spectra
Number ofFP4 spectra
8–9 Aug 2005 −(1.5–8.4)◦ 5.5◦ 30160 3016018–19 Jul 2005 −(7.3–12.8)◦ 4.8◦ 29842 298732–3 Jul 2005 −(16.3–23.2)◦ 10.8◦ 13305 1330513–14 Jun 2005 −(26.6–33.0)◦ 22.4◦ 31933 3195323–24 Feb 2005 −(35.0–43.2)◦ 40.0◦ 29880 2988822 Feb 2005 −(44.7–53.2)◦ 50.1◦ 27570 275701–2 Mar 2005 −(53.3–65.4)◦ 60.3◦ 30590 3058926–27 May 2005 −(64.8–76.0)◦ 63.1◦ 30795 3079523–24 Apr 2005 −(71.8–84.7)◦ 67.4◦ 21860 20495
2.2. Celeste
Our ground-based spectrometer Celeste is a cryogenic gratingspectrometer with an array detector (Moran et al., 2007). It usesa 128 × 128-element Si:As blocked impurity band array and oper-ates in the 5 to 25 μm range with resolving powers up to 30,000.The grating is an 18 × 33 cm2, 31.6 ruling per millimeter echelleblazed at 63◦ . The beam is focused through a window, filter wheeland circular variable filter, and forms an image at a slit wheel. Thebeam is expanded and collimated by Cassegrain optics, diffractedat the grating, and refocused on the detector array. The spectrome-ter is housed in a 43-inch long, 13-inch diameter dewar. The array,grating and all other internal optics are cooled with liquid helium.A computer controls the array, stores the data, and communicateswith the telescope computer. On the IRTF the infrared portion ofthe f/37 beam from the telescope secondary is reflected from adichroic mirror and is sent to an external lens that changes thefocal ratio of the beam to f/8 and focuses it into the dewar. Thedichroic mirror passes visible light to a guide camera.
The Celeste observations were performed at the IRTF on Octo-ber 11–12, 2006 in conjunction with the CIRS south pole observa-tions on October 11, 2006. This was approximately the middle ofSaturn’s southern summer and the south pole tilt as viewed fromthe Earth was 13◦ . The slit length covered approximately 50′′ on

252 B.E. Hesman et al. / Icarus 202 (2009) 249–259
Table 3Summary of the 2006 IRTF Celeste observations.
Molecularspecies
Wavenumber(cm−1)
Ordernumber
Bandwidth(cm−1)
Dispersion(cm−1/px)
Resolution(cm−1)
C2H2 ν5 R(5) 743.3 4th 1.51 0.012 0.05C2H6 ν9
R Q0 822.3 4th 2.24 0.018 0.07
the sky so that Saturn’s polar diameter (Dpol = 15.6′′ during theseobservations) was imaged onto the array and the slit was alignedalong the central meridian. We were therefore able to measure thehydrocarbon emission across the southern hemisphere while CIRSwas pointed at one latitude region (∼87◦ S). The Celeste obser-vations covered System III west longitudes of 228 to 310◦ and 230to 255◦ for C2H2 and C2H6 respectively. The total integration timesfor C2H2 and C2H6 were 2.6 and 0.6 hours respectively. Table 3shows the grating setup for these observations including the in-strument dispersion for each molecule. The slit was oriented alongthe planetocentric north–south direction. The slit width was 2.4′′resulting in an effective spectral resolution covering about 4 spec-tral pixels. The width of the slit and the planet rotation during anintegration limited the longitude resolution. The observations werechopped on and off source along with nodding between the twochop positions in order to remove the sky emission. Moon spec-tra were used for atmospheric correction and for normalizing thearray response.
3. Data analysis
3.1. CIRS
CIRS records interferograms and these are converted to radi-ance spectra by the method discussed in Flasar et al. (2004). Nearthe time that the Saturn scans are recorded, two types of refer-ence scans are also taken. The first type is observations of deepspace, recorded with the field of view pointed at blank sky. Thesecond type is taken with an internal shutter closed to provide ameasurement of the 170 K instrument. In the calibration of a Sat-
urn spectrum, the deep space scans are averaged and subtractedfrom both the Saturn scan and the average of the shutter scans.The difference of Saturn and deep space is the interferogram ofSaturn alone. The difference of shutter and deep space is an inter-ferogram of the 170 K instrument alone. These two interferogramsare now transformed into spectra. By dividing the Saturn spectrumby the instrument spectrum and multiplying by a calculated 170 Kblackbody spectrum, the calibrated radiance spectrum of Saturn isderived. This is repeated for all the Saturn data.
Once the FP3 CIRS data were reduced and calibrated they werebinned based on the selection criteria defined in Section 2.1; theresults of which are shown in Fig. 2. Fig. 3 shows the detailedversions of the C2H2 and C2H6 bands. The emission from bothspecies increases toward the polar regions but exhibit their largestincreases in different latitude bins. This indicates that not onlyis temperature changing as the pole is approached but so arethe C2H2 and C2H6 abundances in relation to each other. Thelargest increase in acetylene emission happens at its most polarbin whereas ethane’s largest increase in emission happens at the70◦–80◦ S bin. If the increase in emission was simply due to tem-perature both species should have responded to the temperaturerise in a similar manner as their contributions peak at similar alti-tudes.
3.2. Celeste
The Celeste observations were reduced in the standard methodwhereby the spectra from the two nod positions were subtractedto remove the offset signal, the response of the array was normal-ized using the moon flat-fields, and as longitude mapping was nota goal of this project, all spectra for each molecule were averagedto increase the S/N. The spectra, for each molecule, were convertedto intensity units using a scale factor applied to all spectra thatwas determined using continuum radiance matching for the equa-torial bin. Although the continuum intensities in the acetylene andethane spectra are small compared to the line intensities, there aresections clear of lines that could be set equal to the model. The un-certainty due to the radiance calibration is estimated at 15 to 20%.
Fig. 2. Focal Plane 3 CIRS data in 10◦ latitude bins at a spectral resolution of 3 cm−1 and emission angles between 74◦ and 82◦ .

Saturn’s hydrocarbon latitudinal abundance variations 253
Fig. 3. C2H2 (a) and C2H6 (b) 3 cm−1 spectral resolution CIRS data from Fig. 2.
Fig. 4. C2H2 (a) and C2H6 (b) data as measured by Celeste at the IRTF. The C2H2 line is the R(5) line of the ν5 band and the C2H6 line is the R Q0 branch in the ν9 band.Spectral resolutions were 0.05 cm−1 and 0.07 cm−1 for respectively C2H2 and C2H6.
At the IRTF our spatial resolution is approximately 0.6′′ perpixel. Combining two spatial pixels, to increase the S/N, resultedin 10◦ latitude bins, except in the vicinity of the south pole wheretwo pixels subtended 20◦ . Seeing conditions during the obser-vations could not guarantee that the slit over the polar regionswas continuously illuminated. This effect therefore required spec-tra at latitudes greater than 60◦ S to be excluded from this analy-sis.
Fig. 4 shows the resultant Celeste spectra for six 10◦ latitudebins. The spectra have been corrected for the radial velocity of Sat-urn with respect to the Earth so the C2H2 and C2H6 spectra areshown at their rest wavelengths. In addition, each of the spectrahave been smoothed by a 4-spectral-pixel boxcar (our slit-widthresolution). This smoothing results in lower effective spectral res-olution which better represents the observed emission linewidthsin the spectra due to our selection of slit width. As with the CIRS

254 B.E. Hesman et al. / Icarus 202 (2009) 249–259
Fig. 5. The temperature profiles used in modeling the CIRS spectra (colored curves) and the associated uncertainty in each profile (shaded curves).
spectra, the Celeste spectra show that for both molecules the emis-sion increases toward high southern latitudes.
4. Modeling
Acetylene and ethane emission are coupled to both atmospherictemperature and the species abundance. Latitudinal temperatureprofiles were therefore first retrieved from CIRS data and then ap-plied to models to retrieve the acetylene and ethane latitudinalprofiles from the CIRS and Celeste spectra presented in Section 3.
4.1. Temperature retrieval
To retrieve temperature profiles from the CIRS data, radiancespectra for each detector were first averaged over 2◦ in longi-tude and then converted to brightness temperature and zonallyaveraged. Separate retrievals for upper tropospheric and strato-spheric temperatures were performed using the constrained lin-ear inversion algorithm described by Conrath et al. (1998). Forthe tropospheric retrievals, we use the spectral range from 600to 675 cm−1 (FP3), where the atmospheric opacity is from thecollision-induced S(1) line of hydrogen. We include opacity fromH2–H2, H2–He, and H2–CH4 pairs, using the algorithms of Borysowet al. (1985, 1988) and Borysow and Frommhold (1986), assum-ing a He mole fraction of 0.119 (Conrath and Gautier, 2000) anda CH4 mole fraction of 4.5 × 10⁻³ (Flasar et al., 2005). For thestratospheric retrievals, we use part of the ν4 band of CH4 be-tween 1250 and 1311 cm−1 (FP4). CH4 absorption was calculatedusing the correlated-k method (Lacis and Oinas, 1991), using linedata from the Geisa 2003 line atlas (Jacquinet-Husson et al., 2005).
To model the 10◦-binned CIRS FP3 spectra the retrieved tem-peratures were combined by a weighted average to simulate theaverage latitude within each bin. Using the standard deviation inthe retrieved temperatures, the uncertainty in each binned temper-ature profile was found by averaging the standard deviations usingthe same weighting as used to average the temperatures into 10◦latitude bins. Fig. 5 shows the retrieved 10◦ averaged temperatureprofiles (colored curves) and their associated uncertainties (shadedregions) used for modeling the FP3 CIRS spectra.
The retrieved temperature profiles from the CIRS data werealso used in modeling the Celeste spectra. The temperature pro-files were averaged into 10◦ bins, as done for the FP3 CIRS spectra,but as the 10◦ binned Celeste data corresponded to different aver-age latitudes within the bin we used binned temperature profilesthat corresponded to the Celeste average latitudes. Fig. 6 shows theretrieved 10◦ averaged temperature profiles (colored curves) andtheir associated uncertainties (shaded regions) used for modelingthe Celeste spectra.
4.2. Hydrocarbon abundance retrieval
The spectral model used to calculate the acetylene and ethanespectra for the CIRS and Celeste observations is based on the inte-grated transmittance algorithm developed by Kunde and Maguire(1974). The acetylene line parameters were taken from the Geisa2003 line atlas (Jacquinet-Husson et al., 2005). The ethane lineparameters were taken from the most current results by VanderAuwera et al. (2007), which have higher line intensities by approx-imately 30% than the values listed in the Geisa line atlas.
H2 and He mole fractions, as determined by reanalysis of Voy-ager data, were 0.881 and 0.119 (Conrath and Gautier, 2000).The hydrocarbon profiles were taken from the work of Mosesand Greathouse (2005) and are shown in Fig. 7. In Moses andGreathouse (2005) many hydrocarbon profiles were derived usinga one-dimensional seasonal model for stratospheric photochem-istry on Saturn. The profiles used in this analysis were determinedusing a warm temperature profile. This temperature profile is morecharacteristic of the temperatures in the southern hemisphere dur-ing our observations and we therefore expect these hydrocarbonprofiles to be more relevant for this analysis than the profiles thatwere produced by other input parameters.
The CIRS and Celeste data were fit using the Levenberg–Marquardt least-squares minimization method to determine thebest-fit scale factor for the C2H2 and C2H6 abundance profiles ineach latitude bin. Figs. 8 and 9 show the results of this fittingtechnique for the 0◦–10◦ S bin. The data is shown as the solidcurve and the best-fit model as the dotted. The residuals between

Saturn’s hydrocarbon latitudinal abundance variations 255
Fig. 6. The temperature profiles used in modeling the Celeste spectra (colored curves) and the associated uncertainty in each profile (shaded curves).
Fig. 7. The hydrocarbon altitude profiles (C2H2: dash curve, C2H6: dash–dot curve) from Moses and Greathouse (2005). A model temperature profile is show as the solidcurve. These abundance profiles were used in modeling the Celeste and CIRS spectra.
the data and best-fit model are shown directly below each set ofcurves.
5. Results
The contribution functions for the CIRS and Celeste dataare compared in Fig. 10 which show that both measurementtechniques sample the same level of the atmosphere for bothmolecules. The C2H2 contribution peaks at approximately 1.2 mbar
and for C2H6 at 2 mbar. The CIRS and Celeste data are thereforedirectly comparable.
Fig. 11 shows the resultant latitudinal mole fraction profiles atthe 2 mbar level for C2H2 and C2H6 which were derived fromthe best-fit scale factors. There were many sources of uncertaintyto consider when deriving the error bars shown in Fig. 11. Thefollowing were considered and compared: the measurement andcalibration uncertainty associated with each instrument; the 1-σstatistical uncertainty in the fit of the model to the data; and, the
256 B.E. Hesman et al. / Icarus 202 (2009) 249–259
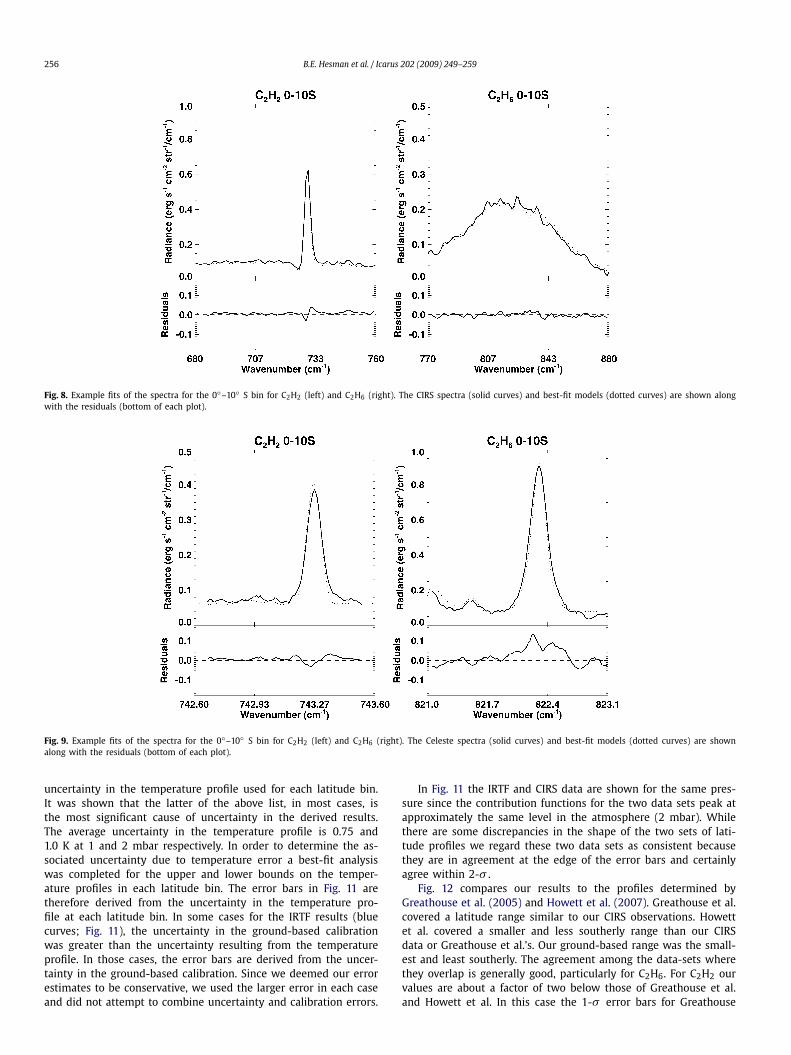
Fig. 8. Example fits of the spectra for the 0◦–10◦ S bin for C2H2 (left) and C2H6 (right). The CIRS spectra (solid curves) and best-fit models (dotted curves) are shown alongwith the residuals (bottom of each plot).
Fig. 9. Example fits of the spectra for the 0◦–10◦ S bin for C2H2 (left) and C2H6 (right). The Celeste spectra (solid curves) and best-fit models (dotted curves) are shownalong with the residuals (bottom of each plot).
uncertainty in the temperature profile used for each latitude bin.It was shown that the latter of the above list, in most cases, isthe most significant cause of uncertainty in the derived results.The average uncertainty in the temperature profile is 0.75 and1.0 K at 1 and 2 mbar respectively. In order to determine the as-sociated uncertainty due to temperature error a best-fit analysiswas completed for the upper and lower bounds on the temper-ature profiles in each latitude bin. The error bars in Fig. 11 aretherefore derived from the uncertainty in the temperature pro-file at each latitude bin. In some cases for the IRTF results (bluecurves; Fig. 11), the uncertainty in the ground-based calibrationwas greater than the uncertainty resulting from the temperatureprofile. In those cases, the error bars are derived from the uncer-tainty in the ground-based calibration. Since we deemed our errorestimates to be conservative, we used the larger error in each caseand did not attempt to combine uncertainty and calibration errors.
In Fig. 11 the IRTF and CIRS data are shown for the same pres-sure since the contribution functions for the two data sets peak atapproximately the same level in the atmosphere (2 mbar). Whilethere are some discrepancies in the shape of the two sets of lati-tude profiles we regard these two data sets as consistent becausethey are in agreement at the edge of the error bars and certainlyagree within 2-σ .
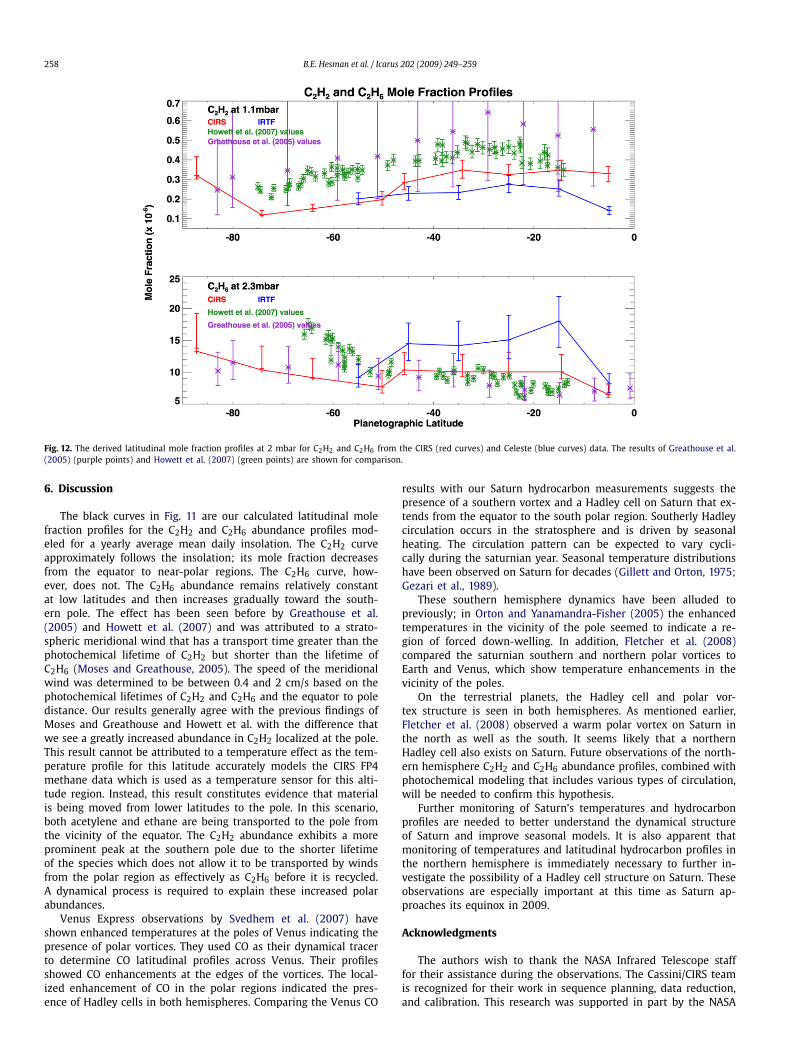
Fig. 12 compares our results to the profiles determined byGreathouse et al. (2005) and Howett et al. (2007). Greathouse et al.covered a latitude range similar to our CIRS observations. Howettet al. covered a smaller and less southerly range than our CIRSdata or Greathouse et al.’s. Our ground-based range was the small-est and least southerly. The agreement among the data-sets wherethey overlap is generally good, particularly for C2H6. For C2H2 ourvalues are about a factor of two below those of Greathouse et al.and Howett et al. In this case the 1-σ error bars for Greathouse

Saturn’s hydrocarbon latitudinal abundance variations 257
Fig. 10. The contribution functions for C2H2 (dashed curves) and C2H6 (solid curves) for the CIRS (black curves) and Celeste (red curves) data. The contribution functions forthe CIRS observations are shown for a resolution of 3 cm−1 and the Celeste data are shown for resolutions of 0.05 cm−1 and 0.07 cm−1 for C2H2 and C2H6 respectively. Thecontribution from C2H2 is maximum at 1.2 mbar and for C2H6 is maximum at 2 mbar. The contribution functions show that the CIRS and Celeste data are sensing the samelevel of the atmosphere for both molecules.
Fig. 11. The derived latitudinal mole fraction profiles at 2 mbar for C2H2 and C2H6 from the CIRS (red curves) and Celeste (blue curves) data. The error bars are derivedfrom the uncertainty in the temperature profile used for each bin. In some cases, however, the error bars associated with the IRTF results are due to the uncertainty in theground-based calibration. The black curves are the latitudinal mole fraction profiles we calculate if the C2H2 and C2H6 abundance profiles followed the yearly average meandaily insolation.
et al. are large, encompassing those of Howett et al. and just reach-ing ours at the lower limit. The error bars of Howett et al. do notoverlap our error bars, but we calculated our errors in differentways; Howett et al. used the statistics from the fit of the model tothe data (which included the errors in the averaged observations)
to estimate the errors, while we included the uncertainty in thetemperature profile, which makes the largest contribution to theerror. We assume that Howett et al. would have found larger un-certainties if they had included the uncertainty in the temperatureprofile.
258 B.E. Hesman et al. / Icarus 202 (2009) 249–259
Fig. 12. The derived latitudinal mole fraction profiles at 2 mbar for C2H2 and C2H6 from the CIRS (red curves) and Celeste (blue curves) data. The results of Greathouse et al.(2005) (purple points) and Howett et al. (2007) (green points) are shown for comparison.
6. Discussion
The black curves in Fig. 11 are our calculated latitudinal molefraction profiles for the C2H2 and C2H6 abundance profiles mod-eled for a yearly average mean daily insolation. The C2H2 curveapproximately follows the insolation; its mole fraction decreasesfrom the equator to near-polar regions. The C2H6 curve, how-ever, does not. The C2H6 abundance remains relatively constantat low latitudes and then increases gradually toward the south-ern pole. The effect has been seen before by Greathouse et al.(2005) and Howett et al. (2007) and was attributed to a strato-spheric meridional wind that has a transport time greater than thephotochemical lifetime of C2H2 but shorter than the lifetime ofC2H6 (Moses and Greathouse, 2005). The speed of the meridionalwind was determined to be between 0.4 and 2 cm/s based on thephotochemical lifetimes of C2H2 and C2H6 and the equator to poledistance. Our results generally agree with the previous findings ofMoses and Greathouse and Howett et al. with the difference thatwe see a greatly increased abundance in C2H2 localized at the pole.This result cannot be attributed to a temperature effect as the tem-perature profile for this latitude accurately models the CIRS FP4methane data which is used as a temperature sensor for this alti-tude region. Instead, this result constitutes evidence that materialis being moved from lower latitudes to the pole. In this scenario,both acetylene and ethane are being transported to the pole fromthe vicinity of the equator. The C2H2 abundance exhibits a moreprominent peak at the southern pole due to the shorter lifetimeof the species which does not allow it to be transported by windsfrom the polar region as effectively as C2H6 before it is recycled.A dynamical process is required to explain these increased polarabundances.
Venus Express observations by Svedhem et al. (2007) haveshown enhanced temperatures at the poles of Venus indicating thepresence of polar vortices. They used CO as their dynamical tracerto determine CO latitudinal profiles across Venus. Their profilesshowed CO enhancements at the edges of the vortices. The local-ized enhancement of CO in the polar regions indicated the pres-ence of Hadley cells in both hemispheres. Comparing the Venus CO
results with our Saturn hydrocarbon measurements suggests thepresence of a southern vortex and a Hadley cell on Saturn that ex-tends from the equator to the south polar region. Southerly Hadleycirculation occurs in the stratosphere and is driven by seasonalheating. The circulation pattern can be expected to vary cycli-cally during the saturnian year. Seasonal temperature distributionshave been observed on Saturn for decades (Gillett and Orton, 1975;Gezari et al., 1989).
These southern hemisphere dynamics have been alluded topreviously; in Orton and Yanamandra-Fisher (2005) the enhancedtemperatures in the vicinity of the pole seemed to indicate a re-gion of forced down-welling. In addition, Fletcher et al. (2008)compared the saturnian southern and northern polar vortices toEarth and Venus, which show temperature enhancements in thevicinity of the poles.
On the terrestrial planets, the Hadley cell and polar vor-tex structure is seen in both hemispheres. As mentioned earlier,Fletcher et al. (2008) observed a warm polar vortex on Saturn inthe north as well as the south. It seems likely that a northernHadley cell also exists on Saturn. Future observations of the north-ern hemisphere C2H2 and C2H6 abundance profiles, combined withphotochemical modeling that includes various types of circulation,will be needed to confirm this hypothesis.
Further monitoring of Saturn’s temperatures and hydrocarbonprofiles are needed to better understand the dynamical structureof Saturn and improve seasonal models. It is also apparent thatmonitoring of temperatures and latitudinal hydrocarbon profiles inthe northern hemisphere is immediately necessary to further in-vestigate the possibility of a Hadley cell structure on Saturn. Theseobservations are especially important at this time as Saturn ap-proaches its equinox in 2009.
Acknowledgments
The authors wish to thank the NASA Infrared Telescope stafffor their assistance during the observations. The Cassini/CIRS teamis recognized for their work in sequence planning, data reduction,and calibration. This research was supported in part by the NASA

Saturn’s hydrocarbon latitudinal abundance variations 259
Planetary Astronomy Program. B.E. Hesman was supported by aNASA Postdoctoral Program Fellowship appointment conducted atthe Goddard Space Flight Center, administered by Oak Ridge As-sociated Universities through a contract with NASA. B.E. Hesmanis currently supported by the National Radio Astronomy Obser-vatory. The National Radio Astronomy Observatory is a facility ofthe National Science Foundation operated under cooperative agree-ment by Associated Universities, Incorporated. D.E.J., G.L.B., R.K.A.,A.A.S.-M., and C.A.N. acknowledge the continuing support of theNASA Cassini Mission. C.M. Anderson was supported by an ap-pointment to the NASA Postdoctoral Program at the Goddard SpaceFlight Center, administered by Oak Ridge Associated Universitiesthrough a contract with NASA. L.N. Fletcher was supported by anappointment to the NASA Postdoctoral Program at the Jet Propul-sion Laboratory, California Institute of Technology, administered byOak Ridge Associated Universities through a contract with NASA.
References
Bezard, B., Gautier, D., 1985. A seasonal climate model of the atmospheres of thegiant planets at the Voyager encounter time. I. Saturn’s stratosphere. Icarus 61,296–310.
Borysow, A., Frommhold, L., 1986. Theoretical collision-induced rototranslational ab-sorption spectra for the outer planets — H2–CH4 pairs. Astrophys. J. 304, 849–865.
Borysow, J., Trafton, L., Frommhold, L., Birnbaum, G., 1985. Modeling of pressure-induced far-infrared absorption spectra: Molecular hydrogen pairs. Astro-phys. J. 296, 644–654.
Borysow, J., Frommhold, L., Birnbaum, G., 1988. Collision-induced rototranslationalabsorption spectra of H2–He pairs at temperatures from 40 to 3000 K. Astro-phys. J. 326, 509–515.
Conrath, B.J., Gautier, D., 2000. Saturn helium abundance: A reanalysis of Voyagermeasurements. Icarus 144, 124–134.
Conrath, B.J., Gierasch, P.J., Leroy, S.S., 1990. Temperature and circulation in thestratosphere of the outer planets. Icarus 83, 255–281.
Conrath, B.J., Gierasch, P.J., Ustinov, E.A., 1998. Thermal structure and para hydrogenfraction on the outer planets from Voyager IRIS measurements. Icarus 135, 501–517.
Flasar, F.M., Kunde, V.G., Abbas, M.M., Achterberg, R.K., Ade, P., Barucci, A., Bézard,B., Bjoraker, G.L., Brasunas, J.C., Calcutt, S., Carlson, R., Césarsky, C.J., Conrath,B.J., Coradini, A., Courtin, R., Coustenis, A., Edberg, S., Edgington, S., Ferrari,C., Fouchet, T., Gautier, D., Gierasch, P.J., Grossman, K., Irwin, P., Jennings, D.E.,Lellouch, E., Mamoutkine, A.A., Marten, A., Meyer, J.P., Nixon, C.A., Orton, G.S.,Owen, T.C., Pearl, J.C., Prangé, R., Raulin, F., Read, P.L., Romani, P.N., Samuelson,R.E., Segura, M.E., Showalter, M.R., Simon-Miller, A.A., Smith, M.D., Spencer, J.R.,Spilker, L.J., Taylor, F.W., 2004. Exploring the Saturn system in the thermal in-frared: The composite infrared spectrometer. Space Sci. Rev. 115, 169–297.
Flasar, F.M., Achterberg, R.K., Conrath, B.J., Pearl, J.C., Bjoraker, G.L., Jennings, D.E.,Romani, P.N., Simon-Miller, A.A., Kunde, V.G., Nixon, C.A., Bézard, B., Orton, G.S.,Spilker, L.J., Spencer, J.R., Irwin, P.G.J., Teanby, N.A., Owen, T.C., Brasunas, J., Se-gura, M.E., Carlson, R.C., Mamoutkine, A., Gierasch, P.J., Schinder, P.J., Showalter,M.R., Ferrari, C., Barucci, A., Courtin, R., Coustenis, A., Fouchet, T., Gautier, D., Lel-louch, E., Marten, A., Prangé, R., Strobel, D.F., Calcutt, S.B., Read, P.L., Taylor, F.W.,Bowles, N., Samuelson, R.E., Abbas, M.M., Raulin, F., Ade, P., Edgington, S., Pilorz,S., Wallis, B., Wishnow, E.H., 2005. Temperatures, winds, and composition in thesaturnian system. Science 307, 1247–1251.
Fletcher, L.N., Irwin, P.G.J., Orton, G.S., Teanby, N.A., Achterberg, R.K., Bjoraker, G.L.,Read, P.L., Simon-Miller, A.A., Howett, C., de Kok, R., Bowles, N., Calcutt, S.B.,Hesman, B., Flasar, F.M., 2008. Temperature and composition of Saturn’s polarhot spots and hexagon. Science 319, 79–81.
Gezari, D.Y., Mumma, M.J., Espenak, F., Deming, D., Bjoraker, G., Woods, L., Folz, W.,1989. New features in Saturn’s atmosphere revealed by high-resolution thermalinfrared images. Nature 342, 777–780.
Gillett, F.C., Orton, G.S., 1975. Center-to-limb observations of Saturn in the thermalinfrared. Astrophys. J. 195, L47–L49.
Greathouse, T.K., Lacy, J.H., Bézard, B., Moses, J.I., Griffith, C.A., Richter, M.J., 2005.Meridional variations of temperature, C2H2 and C2H6 abundances in Saturn’sstratosphere at southern summer solstice. Icarus 177, 18–31.
Howett, C.J.A., Irwin, P.G.J., Teanby, N.A., Simon-Miller, A., Calcutt, S.B., Fletcher, L.N.,de Kok, R., 2007. Meridional variations in stratospheric acetylene and ethanein the southern hemisphere of the saturnian atmosphere as determined fromCassini/CIRS measurements. Icarus 190, 556–572.
Jacquinet-Husson, N., Scott, N.A., Chedin, A., Garceran, K., Armante, R., Chursin, A.A.,Barbe, A., Birk, M., Brown, L.R., Camy-Peyret, C., Claveau, C., Clerbaux, C., Co-heur, P.F., Dana, V., Daumont, L., Debacker-Barilly, M.R., Flaud, J.M., Goldman,A., Hamdouni, A., Hess, M., Jacquemart, D., Kopke, P., Mandin, J.Y., Massie, S.,Mikhailenko, S., Nemtchinov, V., Nikitin, A., Newnham, D., Perrin, A., Perevalov,V.I., Regalia-Jarlot, L., Rublev, A., Schreier, F., Schult, I., Smith, K.M., Tashkun, S.A.,Teffo, J.L., Toth, R.A., Tyuterev, V.G., Vander Auwera, J., Varanasi, P., Wagner, G.,2005. The 2003 edition of the GEISA/IASI spectroscopic database. J. Quant. Spec-trosc. Radiat. Trans. 95, 429–467.
Kunde, V.G., Ade, P.A., Barney, R.D., Bergman, D., Bonnal, J.-F., Borelli, R., Boyd,D., Brasunas, J.C., Brown, G., Calcutt, S.B., Carroll, F., Courtin, R., Cretolle, J.,Crooke, J.A., Davis, M.A., Edberg, S., Fettig, R., Flasar, M., Glenar, D.A., Graham,S., Hagopian, J.G., Hakun, C.F., Hayes, P.A., Herath, L., Horn, L., Jennings, D.E.,Karpati, G., Kellebenz, C., Lakew, B., Lindsay, J., Lohr, J., Lyons, J.J., Martineau,R.J., Martino, A.J., Matsumura, M., McCloskey, J., Melak, T., Michel, G., Morell, A.,Mosier, C., Pack, L., Plants, M., Robinson, D., Rodriguez, L., Romani, P., Schae-fer, W.J., Schmidt, S., Trujillo, C., Vellacott, T., Wagner, K., Yun, D., 1996. Cassiniinfrared Fourier spectroscopic investigation. In: Horn, L. (Ed.), Cassini/Huygens:A Mission to the Saturnian Systems. In: Proc. SPIE, vol. 2803. SPIE, Bellingham,WA, pp. 162–177.
Kunde, V.R., Maguire, W.C., 1974. Direct integration transmittance model. J. Quant.Spectrosc. Radiat. Trans. 14, 803–817.
Lacis, A.A., Oinas, V., 1991. A description of the correlated-k distribution methodfor modelling nongray gaseous absorption, thermal emission, and multiple scat-tering in vertically inhomogeneous atmospheres. J. Geophys. Res. 96, 9027–9064.
Moran, T.G., Jennings, D.E., Deming, L.D., McCabe, G.H., Sada, P.V., Boyle, R.J., 2007.Solar magnetograms at 12 μm using the Celeste spectrograph. Sol. Phys. 241,213–222.
Moses, J.I., Greathouse, T.K., 2005. Latitudinal and seasonal models of stratosphericphotochemistry on Saturn: Comparison with infrared data from IRTF/TEXES.J. Geophys. Res. (Planets) 110, doi:10.1029/2005JE002450. 9007.
Moses, J.I., Bézard, B., Lellouch, E., Gladstone, G.R., Feuchtgruber, H., Allen, M.,2000. Photochemistry of Saturn’s atmosphere. I. Hydrocarbon chemistry andcomparisons with ISO observations. Icarus 143, 244–298.
Orton, G.S., Yanamandra-Fisher, P.A., 2005. Saturn’s temperature field from high-resolution middle-infrared imaging. Science 307, 696–698.
Sada, P.V., Bjoraker, G.L., Jennings, D.E., Romani, P.N., McCabe, G.H., 2005. Observa-tions of C2H6 and C2H2 in the stratosphere of Saturn. Icarus 173, 499–507.
Svedhem, H., Titov, D.V., Taylor, F.W., Witasse, O., 2007. Venus as a more Earth-likeplanet. Nature 450, 629–632.
Vander Auwera, J., Moazzen-Ahmadi, N., Flaud, J.-M., 2007. Toward an accuratedatabase for the 12 μm region of the ethane spectrum. Astrophys. J. 662,750–757.
Related Documents