SGVU J CLIM CHANGE WATER Vol. 5, 2018 pp. 1-8 Kumar et al. SGVU J CLIM CHANGE WATER Vol. 5 , 1-10 ISSN: 2347-7741 1 Satellite Image Based Land Use Land Cover Change Analysis of Ranchi District, Jharkhand Rabindar Kumar 1 ,Obaidullah Ehrar 1 ,Dilip Kumar Mahto 1 1 Center for Land Resource Management, Central University of Jharkhand, Ranchi * Corresponding author: [email protected] ABSTRACT The high rate of urbanization coupled with population growth has caused changes in land use and land cover in Ranchi, Jharkhand. Therefore, understanding and quantifying the spatio- temporal dynamics of land use and land cover changes and its driving factors is essential to put forward the right policies and monitoring mechanisms on urban growth for decision making. Thus, the objective of this study was to analyze land use and land cover changes in Ranchi area, Jharkhand by applying geospatial technology and land use change modelling. In order to achieve this, satellite data of Landsat-5, TM of 1992 and Landsat-8, OLI of 2017 have been obtained and pre-processed using ArcGIS. The Maximum Likelihood Algorithm of Supervised Classification has been used to generate land use and land cover maps. For the accuracy of classified land use and land cover maps, a confusion matrix was used to derive overall accuracy and results were above the minimum and acceptable threshold level. The generated land cover maps have been run with Land Change Modeller for quantifying land use and land cover changes, to examine land use transitions between land cover classes, to identify gain and losses of built up areas in relation to other land cover classes and to asses spatial trend of built up areas. Finally, Land Change Modeller has been run to model land use and land cover changes in Ranchi area and to predict land use changes. Generally, the results of Ranchi district of Jharkhand study have shown that there was an increased expansion of built up areas in the last 25 years from 9.69% in 1992 to 21.00% in 2017. The spatial trend of built up areas also showed that there was a growing trend in the center part relative to other directions and also increase in agriculture land from 1992 to 2017 that is 28% to 37%, Forest in 1992 was about16.01% and in 2017 about 10.00% decrease in the forest areas, Barren land in 1992 was about 10.04% and the year 2017 about 8.34%, Vegetation was about 24.26 % in 1992 and in the year 2017 about 16.74 % ,Water bodies was also lit decreased in the year 1992 to 2017 there was 11.06 % to 10.02 %. Growing population pressure and its associated problems, such as the increasing demand for land and trees, poor institutional and socio-economic settings, and also unfavourable government policies, such as lack of land tenure security and poor infrastructure development, have been the major driving forces behind the LULC changes. Hence, special attention should be given to the introduction of wise land resource uses and management practices, secure land possession systems, regulated population growth, and integrated environmental rehabilitation programmes. The existing tree plantation practices should be encouraged by promoting the planting of indigenous tree species, rather than eucalyptus trees, in order to enhance ecological harmony. Keywords: Landsat-5 TM, Landsat-8 OLI, Geospatial Technology, Land Use Change Modelling and Supervised Classification INTRODUCTION The land cover scenario is continuously undergoing changes in its structure and has been the reason of deep concern to the urban planners and decision- makers. The main contributor to the urban change is the steady increase in the urban population that mainly includes the migration from small towns and rural areas which by far is the main factor of the ever increasing land costs and slum proliferation in the urban areas and illegal occupation of government land and protected forest cover by migrants and greedy construction companies. One arrives at a conclusion that these changes are happening fast and the methods to curtail them or nip them in the bud are not happening which is not true at all. There is lack of awareness among people regarding new technology due to which they resort to age old methods of problem identification and irradiation that takes a lot of time and money and not to forget heavy manpower and to make all these factors work in a single smooth fashion is just another problem, there are hitches and hurdles in conventional surveys and ground truthing. By the time all the information is collected and a action plan is developed the ground reality would have changed so much that the plan does not stand any chance of success. This is one of the major problems, which most of the Government machineries and various other organisations are facing today. Issues of land use and land cover have become increasingly important as problems of uncontrolled development, deteriorating environmental quality, loss of prime agricultural lands, destruction of important wetlands, and loss of fish and wildlife habitat continue to worsen .To better understand the impact of land use change on global ecosystems, the factors affecting land use must be

Welcome message from author
This document is posted to help you gain knowledge. Please leave a comment to let me know what you think about it! Share it to your friends and learn new things together.
Transcript
SGVU J CLIM CHANGE WATER Vol. 5, 2018 pp. 1-8 Kumar et al. SGVU J CLIM CHANGE WATER Vol. 5 , 1-10 ISSN: 2347-7741
1
Satellite Image Based Land Use Land Cover Change Analysis of Ranchi District, Jharkhand
Rabindar Kumar1 ,Obaidullah Ehrar1,Dilip Kumar Mahto1
1Center for Land Resource Management, Central University of Jharkhand, Ranchi
*Corresponding author: [email protected]
ABSTRACT
The high rate of urbanization coupled with population growth has caused changes in land use and land cover in
Ranchi, Jharkhand. Therefore, understanding and quantifying the spatio- temporal dynamics of land use and
land cover changes and its driving factors is essential to put forward the right policies and monitoring
mechanisms on urban growth for decision making. Thus, the objective of this study was to analyze land use and
land cover changes in Ranchi area, Jharkhand by applying geospatial technology and land use change
modelling. In order to achieve this, satellite data of Landsat-5, TM of 1992 and Landsat-8, OLI of 2017 have
been obtained and pre-processed using ArcGIS. The Maximum Likelihood Algorithm of Supervised
Classification has been used to generate land use and land cover maps. For the accuracy of classified land use
and land cover maps, a confusion matrix was used to derive overall accuracy and results were above the
minimum and acceptable threshold level. The generated land cover maps have been run with Land Change
Modeller for quantifying land use and land cover changes, to examine land use transitions between land cover
classes, to identify gain and losses of built up areas in relation to other land cover classes and to asses spatial
trend of built up areas. Finally, Land Change Modeller has been run to model land use and land cover changes
in Ranchi area and to predict land use changes. Generally, the results of Ranchi district of Jharkhand study have
shown that there was an increased expansion of built up areas in the last 25 years from 9.69% in 1992 to 21.00%
in 2017. The spatial trend of built up areas also showed that there was a growing trend in the center part relative
to other directions and also increase in agriculture land from 1992 to 2017 that is 28% to 37%, Forest in 1992
was about16.01% and in 2017 about 10.00% decrease in the forest areas, Barren land in 1992 was about
10.04% and the year 2017 about 8.34%, Vegetation was about 24.26 % in 1992 and in the year 2017 about
16.74 % ,Water bodies was also lit decreased in the year 1992 to 2017 there was 11.06 % to 10.02 %. Growing
population pressure and its associated problems, such as the increasing demand for land and trees, poor
institutional and socio-economic settings, and also unfavourable government policies, such as lack of land
tenure security and poor infrastructure development, have been the major driving forces behind the LULC
changes. Hence, special attention should be given to the introduction of wise land resource uses and
management practices, secure land possession systems, regulated population growth, and integrated
environmental rehabilitation programmes. The existing tree plantation practices should be encouraged by
promoting the planting of indigenous tree species, rather than eucalyptus trees, in order to enhance ecological
harmony.
Keywords: Landsat-5 TM, Landsat-8 OLI, Geospatial Technology, Land Use Change Modelling and
Supervised Classification
INTRODUCTION The land cover scenario is continuously undergoing
changes in its structure and has been the reason of
deep concern to the urban planners and decision-
makers. The main contributor to the urban change
is the steady increase in the urban
population that mainly includes the migration
from small towns and rural areas which by far is
the main factor of the ever increasing land costs
and slum proliferation in the urban areas and illegal
occupation of government land and protected forest
cover by migrants and greedy construction
companies. One arrives at a conclusion that these
changes are happening fast and the methods to
curtail them or nip them in the bud are not
happening which is not true at all. There is lack of
awareness among people regarding new technology
due to which they resort to age old methods of
problem identification and irradiation that takes a
lot of time and money and not to forget heavy
manpower and to make all these factors work in a
single smooth fashion is just another problem, there
are hitches and hurdles in conventional surveys and
ground truthing. By the time all the information is
collected and a action plan is developed the ground
reality would have changed so much that the plan
does not stand any chance of success. This is one of
the major problems, which most of the Government
machineries and various other organisations are
facing today.
Issues of land use and land cover have become
increasingly important as problems of uncontrolled
development, deteriorating environmental quality,
loss of prime agricultural lands, destruction of
important wetlands, and loss of fish and wildlife
habitat continue to worsen .To better understand
the impact of land use change on global
ecosystems, the factors affecting land use must be
SGVU J CLIM CHANGE WATER Vol. 5, 2018 pp. 1-8 Kumar et al. SGVU J CLIM CHANGE WATER Vol. 5 , 1-10 ISSN: 2347-7741
2
further examined. Growing human population exert
increasing pressure on the landscape as demands
multiply for resources such as food, water, shelter,
and fuel. These social and economic factors often
dictate how land is used regionally. Land use
practices generally develop over a long period
under different environmental, political,
demographic, and social conditions. These
conditions often vary yet have a direct impact on
land use and land cover (Ojima, et. al.,
1994).Examples of land use include creating parks,
golf courses, urban areas, and athletic fields. Land
cover refers to natural features of the surface of
earth, such as vegetation cover, which may or may
not been modified by humans (Richardson and Al-
Tahir, 2009).A change in land use and land cover
(LULC) may limit the availability of products and
services for human populations and can have a
profound impact on a region’s fauna and flora, as
well as on environmental and ecological health.
The vast majority of land use and land cover data
are acquired through interpretation of aerial
photography and other similar imagery. Remotely
sensed data provide the comprehensive detail
needed to effectively study land use patterns. In
this study remotely sensed data were used because
they lend themselves to accurate land cover and
land use analysis. Land cover information can be
visually interpreted using evidence from aerial
images, and specific objects can be seen in the
context of their neighbouring features (Campbell,
2007). In addition, according to Willkie and Finn
(1996), by utilizing geospatial technologies and
techniques, researchers can monitor changes in
land use and land cover and map areas for specific
research and analysis.
STUDY AREA Ranchi is located in the southern part of the Chota
Nagpur plateau, which is the eastern section of the
Deccan plateau. The latitude of Ranchi, Jharkhand,
India is 23.344101, and the longitude is 85.309563.
Ranchi, Jharkhand, India is located at India country
in the Cities place category with the GPS
coordinates of 23° 20' 38.7636'' N and 85° 18'
34.4268'' E. Ranchi has a hilly topography and its
dense tropical forests a combination that produces a
relatively moderate climate compared to the rest of
the state. However, due to the uncontrolled
deforestation, and development of the city, the
average temperature has increased. Ranchi,
Jharkhand, India elevation is a 644 meters height
that is equal to 2,113 feet. Area is included in
Toposheet no. 73A, 73B, 73E and 73F. Ranchi has
a humid subtropical climate. However, due to its
position and the forests around the city, it is known
for its pleasant climate. Its climate is the primary
reason why Ranchi was once the summer capital of
the undivided State of Bihar. Ranchi used to be a
preferable hill station in the past. Temperature
ranges from maximum 42 to 20 °C during summer
and from 25 to 0 °C during winter. December and
January are the coolest months with temperature
getting to freezing point in some places of the city.
The annual rainfall is about 1430 mm (56.34
inches). From June to September the rainfall is
about 1,100 mm. Ranchi is located at 23°21′N
85°20′E. The total area covered by the Ranchi
municipal area is 175.12 square kilometres and the
average elevation of the city is 651 m above sea
level. Ranchi is located on the southern part of the
Chota Nagpur plateau which forms the eastern edge
of the Deccan plateau. Ranchi is referred to as the
"City of Waterfalls", due to the presence of
numerous large and small falls of around the close
vicinity of the city. The most popular ones are
Dassam Falls, Hundru Falls, Jonha Falls, Hirni
Falls and Panchghagh Falls.
MATERIAL AND METHODS
Database preparation
In this study Landsat imageries of TM and OLI
TIRS were employed and acquired in the same
season and the same level of resolution for the
periods 1992 & 2017.Thus, it was conducive for
comparison of changes and patterns occurred in the
time under discussion. The images were
downloaded from the Global Land Cover Facility
of the University of Maryland (GLCF, 2013) and
the United States Geological Survey (USGS) and
spatially referenced in the Universal Transverse
Mercator (UTM) projection with datum World
Geodetic System (WGS) 1984 UTM. These data
sets were imported in ERDAS Imagine version
(Leica Geosystems, Atlanta, U.S.A.), satellite
image processing software to create a false colour
composite (FCC). The layer stack option in image
interpreter tool box was used to generate FCCs for
the study areas. The sub-setting of satellite images
were performed for extracting study area from both
images by taking geo-referenced out line boundary.
LAND USE/COVER DETECTION AND
ANALYSIS
To work out the land use/cover classification,
supervised classification method with maximum
likelihood algorithm was applied in the ERDAS
Imagine Software. Maximum likelihood algorithm
(MLC) is one of the most popular supervised
classification methods used with remote sensing
image data. This method is based on the probability
that a pixel belongs to a particular class. The basic
theory assumes that these probabilities are equal for
all classes and that the input bands have normal
distributions. However, this method needs long
SGVU J CLIM CHANGE WATER Vol. 5, 2018 pp. 1-8 Kumar et al. SGVU J CLIM CHANGE WATER Vol. 5 , 1-10 ISSN: 2347-7741
3
time of computation, relies heavily on a normal
distribution of the data in each input band and tends
to over-classify signatures with relatively large
values in the covariance matrix. The spectral
distance method calculates the spectral distance
between the measurement vector for the candidate
pixel and the mean vector for each signature and
the equation for classifying by spectral distance is
based on the equation for Euclidean distance. It
requires the least computational time among other
supervised methods, however, the pixels that
should not be unclassified become classified, and it
does not consider class variability. Ground
verification was done for doubtful areas. Based on
the ground truthing, the misclassified areas were
corrected using recode option in ERDAS Imagine.
The error matrix methods and Kappa methods were
used to assess the mapping accuracy.
LAND USE/COVER CHANGE DETECTION
AND ANALYSIS
For performing land use/cover change detection, a
post-classification detection method was employed.
A pixel-based comparison was used to produce
change information on pixel basis and thus,
interpret the changes more efficiently taking the
advantage of ‘‘-from, -to’’ information. Classified
image pairs of two different decade data were
compared using cross-tabulation in order to
determine qualitative and quantitative aspects of
the changes for the periods from 1992 to 2017. A
change matrix (Weng, 2001) was produced with the
help of ERDAS Imagine software. Quantitative
areal data of the overall land use/cover changes as
well as gains and losses in each category between
1992 and 2017 were then compiled.
RESULTS AND DISCUSSIONS
The results obtained through the analysis of multi-
temporal satellite imageries were diagrammatically
illustrated in Figs. 2–4 and data are registered in
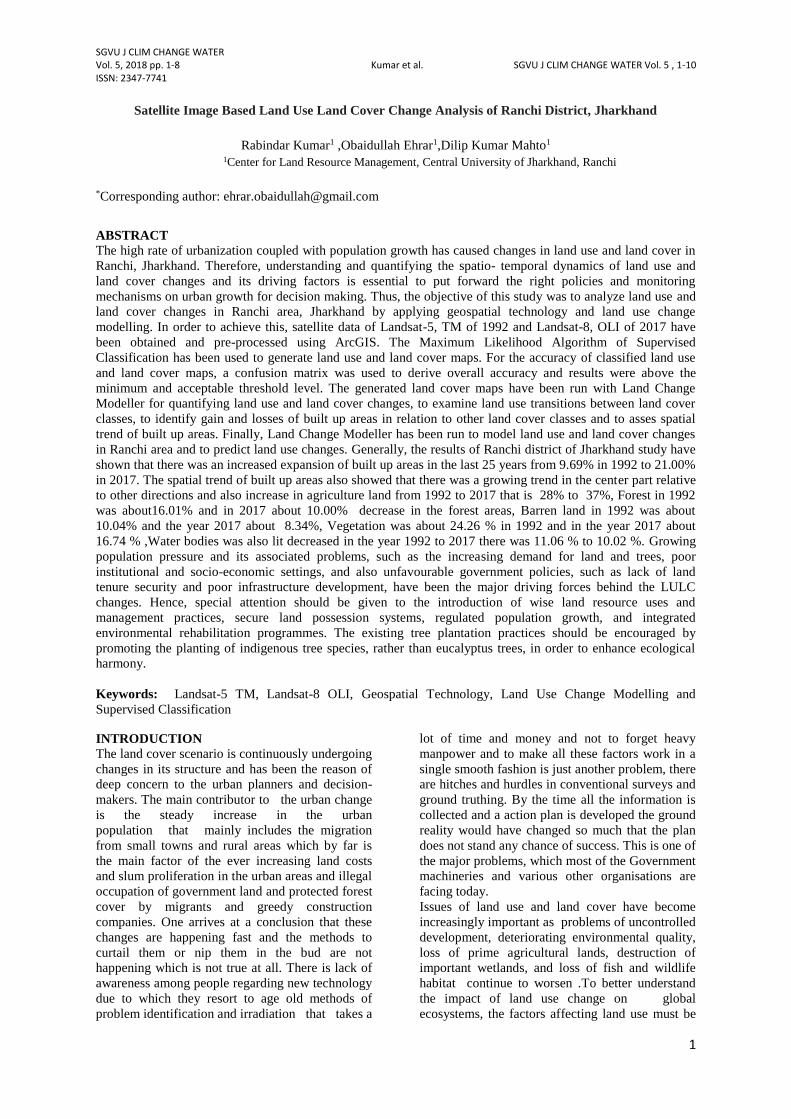
Tables 1 and 2. Fig. 2 depicts land use/cover status,
Fig. 3 depicts land use/cover change in different
land use categories and Fig. 4 illustrates magnitude
of change in different land categories. A brief
account of these results is discussed in the
following paragraphs
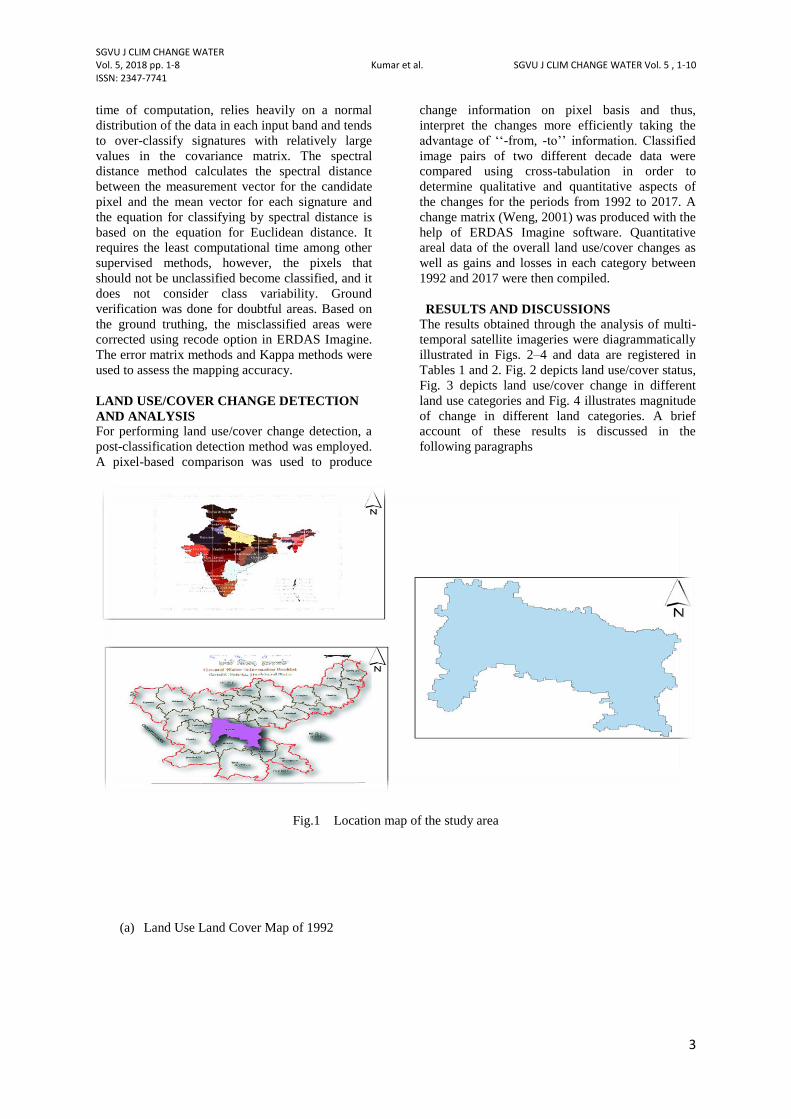
Fig.1 Location map of the study area
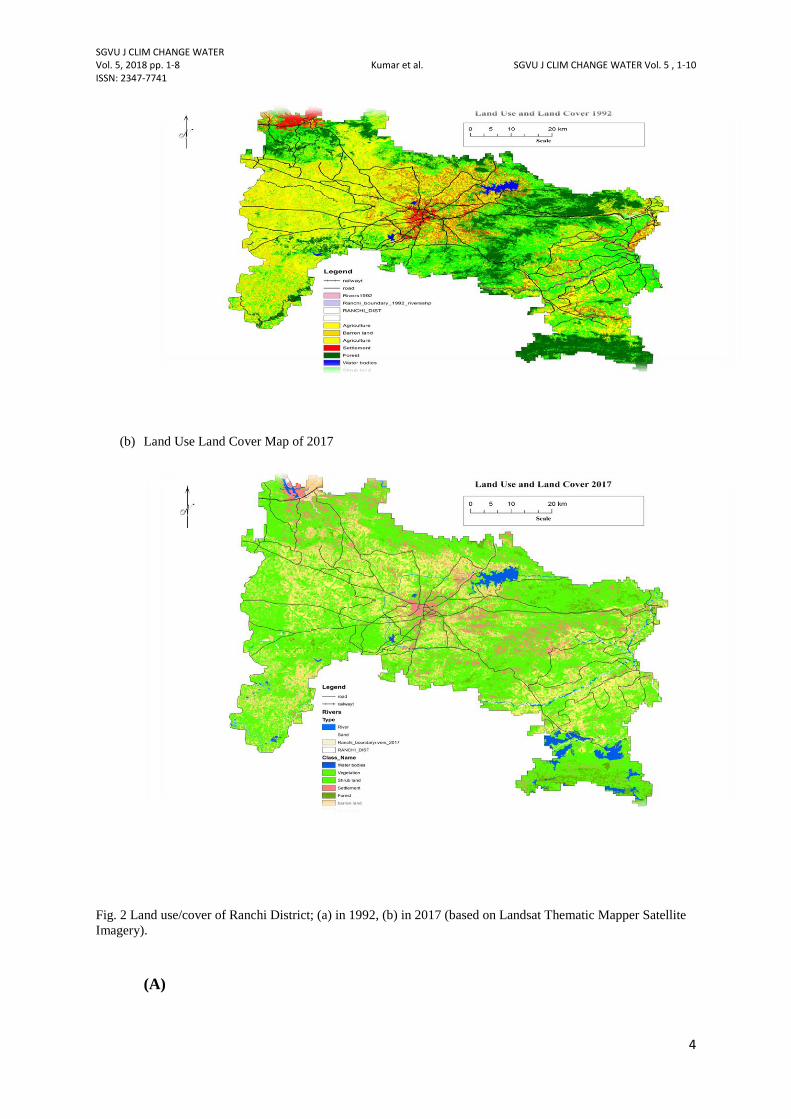
(a) Land Use Land Cover Map of 1992
SGVU J CLIM CHANGE WATER Vol. 5, 2018 pp. 1-8 Kumar et al. SGVU J CLIM CHANGE WATER Vol. 5 , 1-10 ISSN: 2347-7741
4
(b) Land Use Land Cover Map of 2017
Fig. 2 Land use/cover of Ranchi District; (a) in 1992, (b) in 2017 (based on Landsat Thematic Mapper Satellite
Imagery).
(A)
SGVU J CLIM CHANGE WATER Vol. 5, 2018 pp. 1-8 Kumar et al. SGVU J CLIM CHANGE WATER Vol. 5 , 1-10 ISSN: 2347-7741
5
(B)
(C)
SGVU J CLIM CHANGE WATER Vol. 5, 2018 pp. 1-8 Kumar et al. SGVU J CLIM CHANGE WATER Vol. 5 , 1-10 ISSN: 2347-7741
6
(D)
SGVU J CLIM CHANGE WATER Vol. 5, 2018 pp. 1-8 Kumar et al. SGVU J CLIM CHANGE WATER Vol. 5 , 1-10 ISSN: 2347-7741
7
(E)
(F)
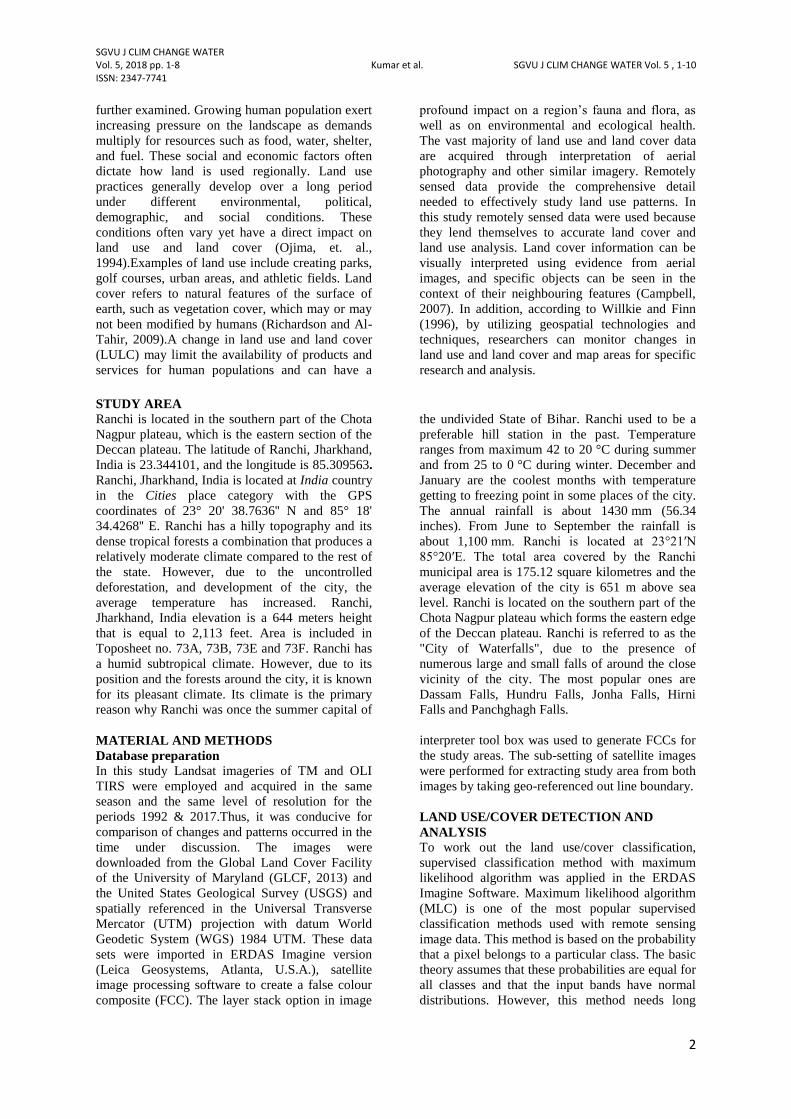
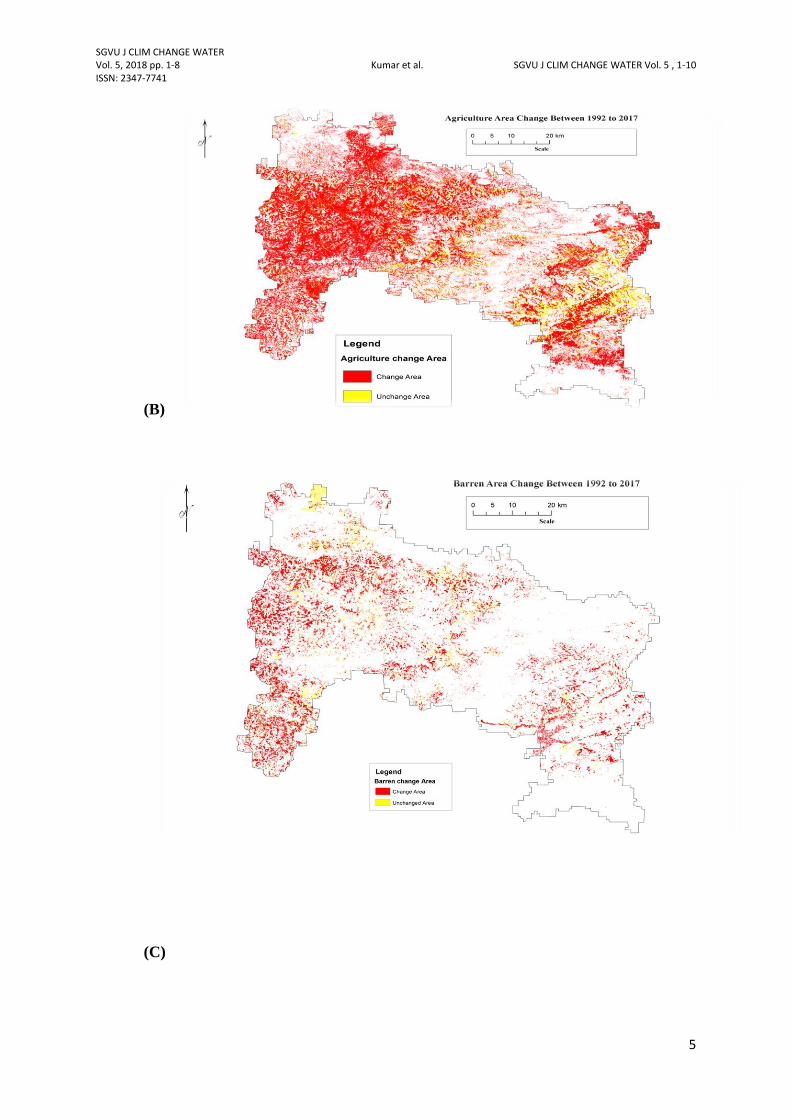
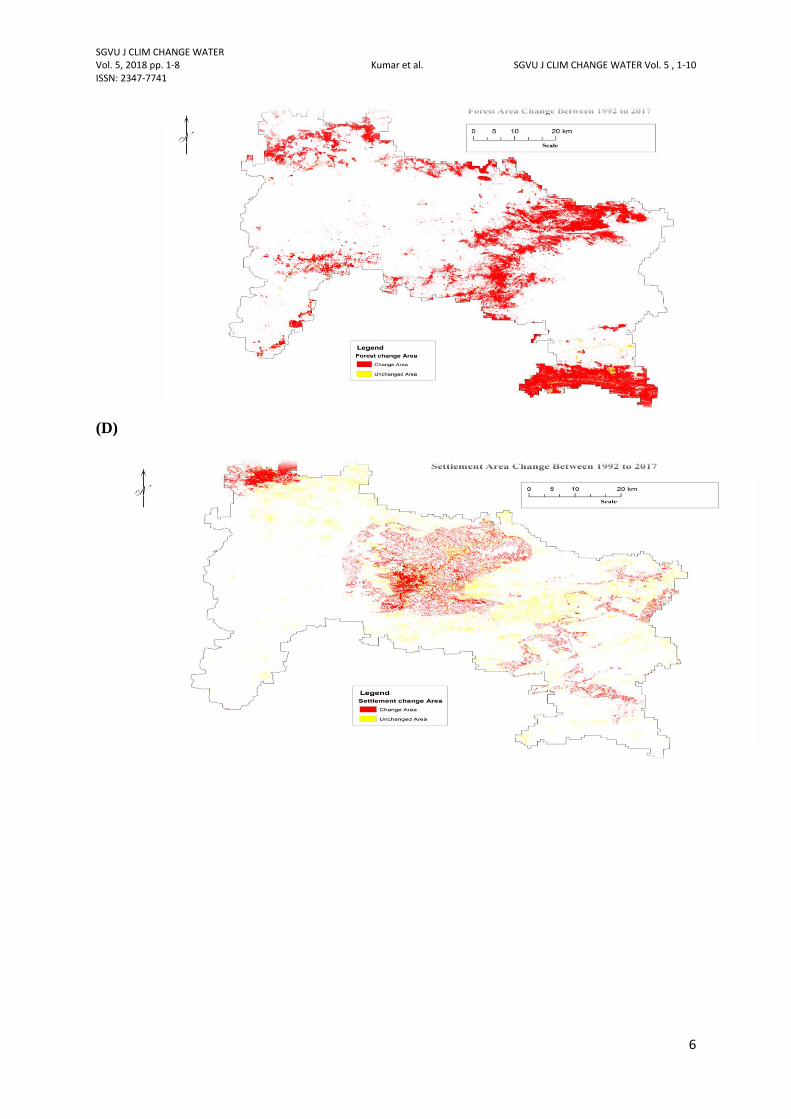
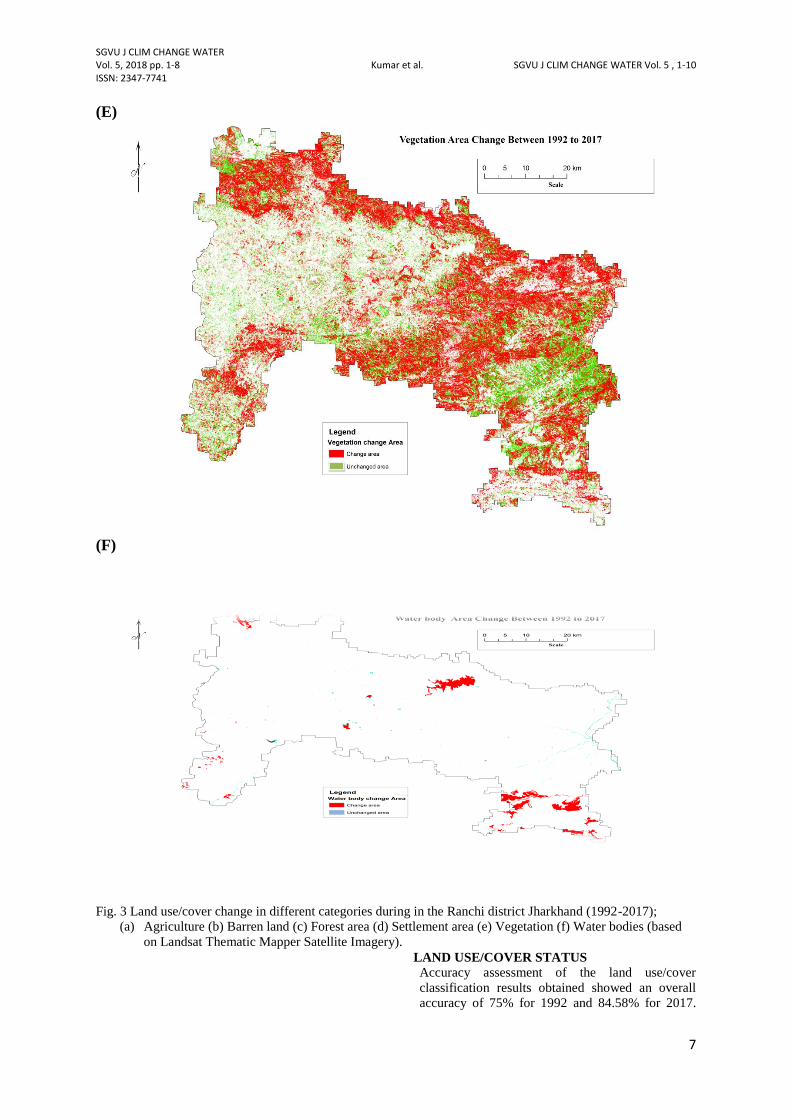
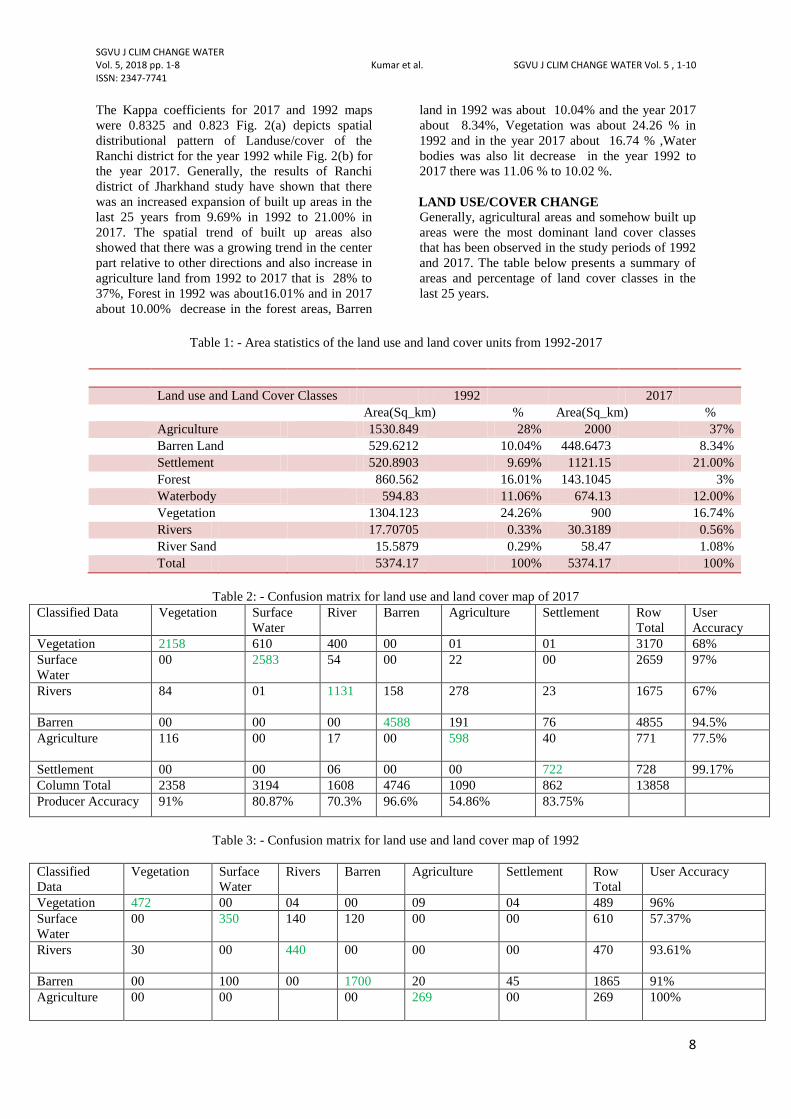
Fig. 3 Land use/cover change in different categories during in the Ranchi district Jharkhand (1992-2017);
(a) Agriculture (b) Barren land (c) Forest area (d) Settlement area (e) Vegetation (f) Water bodies (based
on Landsat Thematic Mapper Satellite Imagery).
LAND USE/COVER STATUS
Accuracy assessment of the land use/cover
classification results obtained showed an overall
accuracy of 75% for 1992 and 84.58% for 2017.
SGVU J CLIM CHANGE WATER Vol. 5, 2018 pp. 1-8 Kumar et al. SGVU J CLIM CHANGE WATER Vol. 5 , 1-10 ISSN: 2347-7741
8
The Kappa coefficients for 2017 and 1992 maps
were 0.8325 and 0.823 Fig. 2(a) depicts spatial
distributional pattern of Landuse/cover of the
Ranchi district for the year 1992 while Fig. 2(b) for
the year 2017. Generally, the results of Ranchi
district of Jharkhand study have shown that there
was an increased expansion of built up areas in the
last 25 years from 9.69% in 1992 to 21.00% in
2017. The spatial trend of built up areas also
showed that there was a growing trend in the center
part relative to other directions and also increase in
agriculture land from 1992 to 2017 that is 28% to
37%, Forest in 1992 was about16.01% and in 2017
about 10.00% decrease in the forest areas, Barren
land in 1992 was about 10.04% and the year 2017
about 8.34%, Vegetation was about 24.26 % in
1992 and in the year 2017 about 16.74 % ,Water
bodies was also lit decrease in the year 1992 to
2017 there was 11.06 % to 10.02 %.
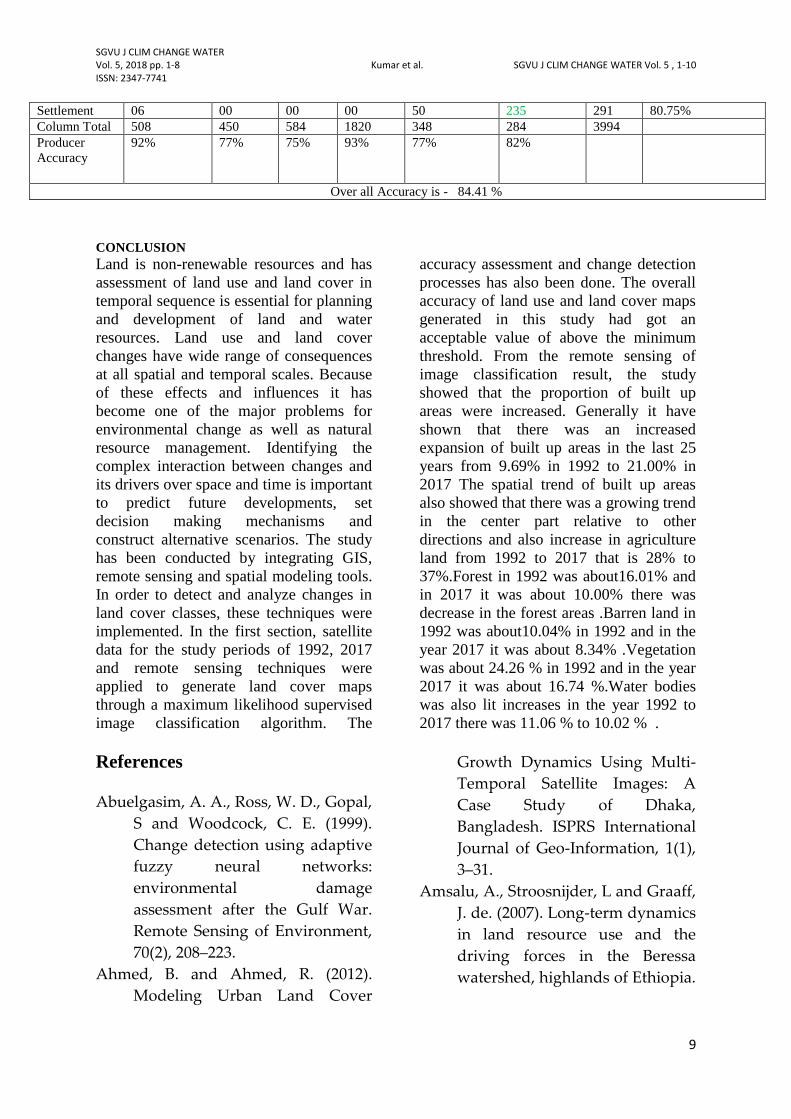
LAND USE/COVER CHANGE
Generally, agricultural areas and somehow built up
areas were the most dominant land cover classes
that has been observed in the study periods of 1992
and 2017. The table below presents a summary of
areas and percentage of land cover classes in the
last 25 years.
Table 1: - Area statistics of the land use and land cover units from 1992-2017
Land use and Land Cover Classes 1992 2017
Area(Sq_km) % Area(Sq_km) %
Agriculture 1530.849 28% 2000 37%
Barren Land 529.6212 10.04% 448.6473 8.34%
Settlement 520.8903 9.69% 1121.15 21.00%
Forest 860.562 16.01% 143.1045 3%
Waterbody 594.83 11.06% 674.13 12.00%
Vegetation 1304.123 24.26% 900 16.74%
Rivers 17.70705 0.33% 30.3189 0.56%
River Sand 15.5879 0.29% 58.47 1.08%
Total 5374.17 100% 5374.17 100%
Table 2: - Confusion matrix for land use and land cover map of 2017 Classified Data Vegetation Surface
Water
River
Barren
Agriculture
Settlement
Row
Total
User
Accuracy
Vegetation 2158 610 400 00 01 01 3170 68%
Surface
Water
00 2583 54 00 22 00 2659 97%
Rivers
84 01 1131 158 278 23 1675 67%
Barren 00 00 00 4588 191 76 4855 94.5%
Agriculture
116 00 17 00 598 40 771 77.5%
Settlement 00 00 06 00 00 722 728 99.17%
Column Total 2358 3194 1608 4746 1090 862 13858
Producer Accuracy 91% 80.87% 70.3% 96.6% 54.86% 83.75%
Table 3: - Confusion matrix for land use and land cover map of 1992
Classified
Data
Vegetation Surface
Water
Rivers
Barren
Agriculture
Settlement
Row
Total
User Accuracy
Vegetation 472 00 04 00 09 04 489 96%
Surface
Water
00 350 140 120 00 00 610 57.37%
Rivers
30 00 440 00 00 00 470 93.61%
Barren 00 100 00 1700 20 45 1865 91%
Agriculture
00 00 00 269 00 269 100%
SGVU J CLIM CHANGE WATER Vol. 5, 2018 pp. 1-8 Kumar et al. SGVU J CLIM CHANGE WATER Vol. 5 , 1-10 ISSN: 2347-7741
9
Settlement 06 00 00 00 50 235 291 80.75%
Column Total 508 450 584 1820 348 284 3994
Producer
Accuracy
92% 77% 75% 93% 77% 82%
Over all Accuracy is - 84.41 %
CONCLUSION
Land is non-renewable resources and has
assessment of land use and land cover in
temporal sequence is essential for planning
and development of land and water
resources. Land use and land cover
changes have wide range of consequences
at all spatial and temporal scales. Because
of these effects and influences it has
become one of the major problems for
environmental change as well as natural
resource management. Identifying the
complex interaction between changes and
its drivers over space and time is important
to predict future developments, set
decision making mechanisms and
construct alternative scenarios. The study
has been conducted by integrating GIS,
remote sensing and spatial modeling tools.
In order to detect and analyze changes in
land cover classes, these techniques were
implemented. In the first section, satellite
data for the study periods of 1992, 2017
and remote sensing techniques were
applied to generate land cover maps
through a maximum likelihood supervised
image classification algorithm. The
accuracy assessment and change detection
processes has also been done. The overall
accuracy of land use and land cover maps
generated in this study had got an
acceptable value of above the minimum
threshold. From the remote sensing of
image classification result, the study
showed that the proportion of built up
areas were increased. Generally it have
shown that there was an increased
expansion of built up areas in the last 25
years from 9.69% in 1992 to 21.00% in
2017 The spatial trend of built up areas
also showed that there was a growing trend
in the center part relative to other
directions and also increase in agriculture
land from 1992 to 2017 that is 28% to
37%.Forest in 1992 was about16.01% and
in 2017 it was about 10.00% there was
decrease in the forest areas .Barren land in
1992 was about10.04% in 1992 and in the
year 2017 it was about 8.34% .Vegetation
was about 24.26 % in 1992 and in the year
2017 it was about 16.74 %.Water bodies
was also lit increases in the year 1992 to
2017 there was 11.06 % to 10.02 % .
References
Abuelgasim, A. A., Ross, W. D., Gopal,
S and Woodcock, C. E. (1999).
Change detection using adaptive
fuzzy neural networks:
environmental damage
assessment after the Gulf War.
Remote Sensing of Environment,
70(2), 208–223.
Ahmed, B. and Ahmed, R. (2012).
Modeling Urban Land Cover
Growth Dynamics Using Multi-
Temporal Satellite Images: A
Case Study of Dhaka,
Bangladesh. ISPRS International
Journal of Geo-Information, 1(1),
3–31.
Amsalu, A., Stroosnijder, L and Graaff,
J. de. (2007). Long-term dynamics
in land resource use and the
driving forces in the Beressa
watershed, highlands of Ethiopia.
SGVU J CLIM CHANGE WATER Vol. 5, 2018 pp. 1-8 Kumar et al. SGVU J CLIM CHANGE WATER Vol. 5 , 1-10 ISSN: 2347-7741
10
Journal of Environmental
Management, 83(4), 448–459. Anderson, J. R., Hardy, J. T. R and
Witmer, R. E. (1976). A land use
and land cover classification A.
Pensuk and RP Shrestha/GMSARN
International Journal 2 (2008), 190.
Bhatta, B. (2010). Causes and
Consequences of Urban Growth
and Sprawl. In Analysis of Urban
Growth and Sprawl from Remote
Sensing Data (pp. 17–36).
Springer.
Brockerhoff, M. (2000). An urbanizing
world. Population Reference
Bureau.
Related Documents