Charter High Schools’ Effects on Long-Term Attainment and Earnings Tim R. Sass Ron W. Zimmer Brian P. Gill T. Kevin Booker Abstract Since their inception in 1992, the number of charter schools has grown to more than 6,800 nationally, serving nearly three million students. Various studies have examined charter schools’ impacts on test scores, and a few have begun to examine longer-term outcomes including graduation and college attendance. This paper is the first to esti- mate charter schools’ effects on earnings in adulthood, alongside effects on educational attainment. Using data from Florida, we first confirm previous research (Booker et al., 2011) that students attending charter high schools are more likely to graduate from high school and enroll in college. We then examine two longer-term outcomes not pre- viously studied in research on charter schools—college persistence and earnings. We find that students attending charter high schools are more likely to persist in college, and that in their mid-20s they experience higher earnings. C 2016 by the Association for Public Policy Analysis and Management. INTRODUCTION Charter schools—publicly funded schools of choice that operate outside the direct control of traditional school districts—have grown rapidly since their inception two decades ago. More than 6,800 schools operate in more than 40 states, serving nearly three million students. Most of the research on charter schools’ efficacy has focused on short-term effects on student test scores. This paper makes new contributions to a much thinner literature on the longer-term effects of charter schools. Using longitudinal data from Florida, this study extends beyond previous research on the effects of attending charter schools on high school graduation and college enroll- ment (Booker et al., 2011) by examining college persistence and earnings. 1 Previous charter school studies have focused on test score impacts, collectively covering a wide array of jurisdictions. Some have used quasi-experimental methods with longitudinal data (e.g., Bifulco & Ladd, 2006; Booker et al., 2007; Davis & Ray- mond, 2012; Furgeson et al., 2012; Hanushek et al., 2007; Sass, 2006; Zimmer et al., 2003, 2009, 2012; Zimmer & Buddin, 2006). Others have employed experimental ap- proaches using data from admission lotteries (Abdulkadiroglu et al., 2011; Angrist et al., 2013b; Furgeson et al., 2012; Gleason et al., 2010; Hoxby & Murarka, 2007; Hoxby & Rockoff, 2004). The findings from this research are mixed. The totality of 1 In Booker et al. (2011), they included Chicago as part of the analysis. In this follow-up study, we did not include Chicago because we were unable to obtain earnings data for Chicago. Journal of Policy Analysis and Management, Vol. 00, No. 0, 1–24 (2016) C 2016 by the Association for Public Policy Analysis and Management Published by Wiley Periodicals, Inc. View this article online at wileyonlinelibrary.com/journal/pam DOI:10.1002/pam.21913

Welcome message from author
This document is posted to help you gain knowledge. Please leave a comment to let me know what you think about it! Share it to your friends and learn new things together.
Transcript

Charter High Schools’ Effectson Long-Term Attainmentand Earnings
Tim R. SassRon W. Zimmer
Brian P. GillT. Kevin Booker
Abstract
Since their inception in 1992, the number of charter schools has grown to more than6,800 nationally, serving nearly three million students. Various studies have examinedcharter schools’ impacts on test scores, and a few have begun to examine longer-termoutcomes including graduation and college attendance. This paper is the first to esti-mate charter schools’ effects on earnings in adulthood, alongside effects on educationalattainment. Using data from Florida, we first confirm previous research (Booker et al.,2011) that students attending charter high schools are more likely to graduate fromhigh school and enroll in college. We then examine two longer-term outcomes not pre-viously studied in research on charter schools—college persistence and earnings. Wefind that students attending charter high schools are more likely to persist in college,and that in their mid-20s they experience higher earnings. C© 2016 by the Associationfor Public Policy Analysis and Management.
INTRODUCTION
Charter schools—publicly funded schools of choice that operate outside the directcontrol of traditional school districts—have grown rapidly since their inception twodecades ago. More than 6,800 schools operate in more than 40 states, serving nearlythree million students. Most of the research on charter schools’ efficacy has focusedon short-term effects on student test scores. This paper makes new contributionsto a much thinner literature on the longer-term effects of charter schools. Usinglongitudinal data from Florida, this study extends beyond previous research on theeffects of attending charter schools on high school graduation and college enroll-ment (Booker et al., 2011) by examining college persistence and earnings.1
Previous charter school studies have focused on test score impacts, collectivelycovering a wide array of jurisdictions. Some have used quasi-experimental methodswith longitudinal data (e.g., Bifulco & Ladd, 2006; Booker et al., 2007; Davis & Ray-mond, 2012; Furgeson et al., 2012; Hanushek et al., 2007; Sass, 2006; Zimmer et al.,2003, 2009, 2012; Zimmer & Buddin, 2006). Others have employed experimental ap-proaches using data from admission lotteries (Abdulkadiroglu et al., 2011; Angristet al., 2013b; Furgeson et al., 2012; Gleason et al., 2010; Hoxby & Murarka, 2007;Hoxby & Rockoff, 2004). The findings from this research are mixed. The totality of
1 In Booker et al. (2011), they included Chicago as part of the analysis. In this follow-up study, we didnot include Chicago because we were unable to obtain earnings data for Chicago.
Journal of Policy Analysis and Management, Vol. 00, No. 0, 1–24 (2016)C© 2016 by the Association for Public Policy Analysis and ManagementPublished by Wiley Periodicals, Inc. View this article online at wileyonlinelibrary.com/journal/pamDOI:10.1002/pam.21913

2 / Charter High Schools’ Effects on Long-Term Attainment and Earnings
evidence suggests that any difference in average performance of charters and tradi-tional public schools across the country is probably small; however, it is clear thatsome types of charter schools (e.g., Knowledge is Power Program [KIPP] and other“no-excuses” charter schools serving disadvantaged urban students) significantlyand substantially improve their students’ test scores (Angrist et al., 2013b; Dobbie& Fryer, 2013a; Tuttle et al., 2013).
While measuring charter schools’ impact on test scores is important, it may notcapture the full scope of the impact schools have on students. In fact, nontest scoreoutcomes such as high school graduation, college enrollment and persistence, andearnings may be of greater consequence than test scores. For instance, the financialadvantage associated with a college education has long been recognized (Day &Newburger, 2002) and in recent years, its value has become increasingly apparentas manufacturing jobs have vanished and the wages of high school educated workershave stagnated. Even as the cost of higher education has increased substantially, thevalue of a degree has continued to grow. Recognizing this, the Obama administrationand other policymakers and funders have sought to increase access to college andimprove students’ readiness for college.
Recognizing the importance of college, a few recent studies have used post-secondary enrollment as an outcome to evaluate the impact of a variety of K-12programs and policies (Bettinger et al., 2012; Chetty, Friedman, & Rockoff, 2014;Chingos & Peterson, 2012; Deming et al., 2014; Richburg-Hayes et al., 2009). Com-pared to the voluminous literature on achievement effects, research on the impactof charter schools on educational attainment—including high school graduation,college attendance, and college persistence—is still sparse. Booker et al., (2011) wasthe first to examine attainment outcomes associated with charter schools and theyfound that students attending Chicago and Florida charter high schools were 7 to15 percentage points more likely to graduate and 8 to 10 percentage points morelikely to enroll in college than comparison groups of students who attended chartermiddle schools but matriculated to traditional public high schools. Subsequently,Furgeson et al. (2012) found evidence that impacts on high school graduation andcollege entry vary in different charter school management organizations (CMOs),but that some CMOs appeared to produce substantial positive attainment impacts.Angrist et al. (2013a), relying on randomized admissions lotteries, found that Bostoncharter high schools had positive impacts on measures of college preparation (suchas SAT scores), no statistically significant impact on high school graduation, and aneffect of shifting students from two-year colleges into four-year colleges.2 Anotherstudy (Dobbie & Fryer, 2013b) found significantly positive attainment impacts, butit examined only one charter school.
The findings of these studies are intriguing, but they also raise additional ques-tions. In particular, how should policymakers, parents, and citizens interpret pos-itive attainment results when many studies3 have shown little or no effect on testscores? Skeptics could argue that positive effects on graduation and postsecondaryattendance could be illusorily if schools are setting lower graduation standards andnot actually preparing their students for college or employment. Alternatively, char-ter schools might produce larger effects on attainment than on test scores because
2 Other studies have estimated impacts of non-charter schools that are similar to charters in somerespects including examination of small high schools (Bloom & Unterman, 2013), Catholic high schools(Evans & Schwab, 1995; Grogger & Neal, 2000; Neal, 1997; Sander & Krautmann, 1995), and voucherstudies (Chingos & Peterson, 2012; Wolf et al., 2013) with similar results.3 In Chicago, Booker et al. (2009) used the same methodology as Booker et al. (2011) and found littleeffect on test scores, but strong graduation and college attendance effects. For the current study, we applythe same research design as this current paper in Florida, and find a statistically insignificant relationshipin reading and a statistically significant negative relationship of 0.075 of a standard deviation in math.
Journal of Policy Analysis and Management DOI: 10.1002/pamPublished on behalf of the Association for Public Policy Analysis and Management
Charter High Schools’ Effects on Long-Term Attainment and Earnings / 3
they are endowing students with skills, knowledge, work habits, motivation, andvalues that are important for long-term success but are not fully captured by testscores. Notably, no studies have attempted to measure the effect of charter schoolson eventual earnings in adulthood.
This paper extends the literature by going beyond graduation and postsecondaryadmission rates to examine whether students who attended charter high schools aremore likely to persist in postsecondary institutions and ultimately achieve higherearnings. We use a similar research design as Booker et al. (2011) to address thepotential selection bias inherent in studies of schools of choice. Lacking data onrandomized admissions lotteries, we restrict our attention to a sample of studentswho were enrolled in charter schools in eighth grade. The treatment students inour analysis enrolled in charter schools in ninth grade; the comparison studentsswitched to conventional public schools. The counterfactual condition, in otherwords, is represented by students who also had once chosen to enroll in charterschools rather than by students who had never chosen charter schools. We alsoaddress selection by matching on observable baseline student characteristics (in-cluding eighth-grade test scores) and by conducting a sensitivity analysis that usesthe distance to the nearest charter high school as an instrument for enrollment, aswell as other approaches that restrict the comparison group based on their choiceset of schools.
In Booker et al.’s (2011) study of charter high schools in Chicago and Florida,the schools had not been operating long enough to permit the authors to follow asufficient sample of charter graduates beyond initial college entry. In Florida, wecollected long enough timeframe of data that we now are able to track earnings offormer charter high school students when they are 23 to 25 years old. In the analysis,we first examine graduation rates and college attendance as a check to see if theoriginal results from Booker et al. hold with a larger sample that includes additionalyears of data. Next, we examine college persistence, which will help answer thequestion of whether the higher rates of college attendance in the Booker et al.study were illusory—that is, if students enter college, but quickly dropout, then theadvantage in initial college entry would not be much of a benefit to the students.4
We then turn to the main focus of our paper, examining labor outcomes of studentswho are up to 12 years removed from the eighth-grade baseline year—yielding thefirst evidence on the effects of charter schools on earnings in adulthood. We find thatenrollment in a charter high school is associated not only with higher rates of highschool graduation and college entry, but we also find some evidence of increasedpersistence in college and increased long-run earnings.
METHODS
Determining the impact of charter high schools is not easy, due to the inherentselection problem implicit in any study of school choice: students who select intocharter high schools may be different in ways that are not readily observable fromthose who choose to attend traditional public high schools. The fact that the charterstudents and their parents actively seek an alternative to traditional public schoolssuggests the students may be more motivated or their parents may be more involvedin their child’s education than are the families of traditional public school attendees.
4 While we do not report the Chicago results in this paper, we did collect and analyze additional dataon high school graduation, college attendance, and college persistence outcomes in Chicago. The resultsfrom these analyses were substantively similar to the results we ascertained for Florida, but since theylargely replicated our previously published findings, we chose not to present them in this paper. Theresults are available upon request.
Journal of Policy Analysis and Management DOI: 10.1002/pamPublished on behalf of the Association for Public Policy Analysis and Management
4 / Charter High Schools’ Effects on Long-Term Attainment and Earnings
Alternately, the students may be those who are having difficulty in traditional publicschools. These characteristics are likely to affect later student outcomes, making itdifficult to distinguish the effect of the school from the effect of underlying (andtypically unobservable) student characteristics.
The two methods most commonly used to deal with selection bias in school choiceimpact studies—experimental methods using randomized admissions lotteries andnonexperimental, longitudinal approaches using pretreatment measures of the out-come of interest—are not available to us. Lottery-based studies (see, e.g., Angristet al., 2013b; Gleason et al., 2010; Hoxby & Murarka, 2007) identify oversubscribedschools that use randomized admissions lotteries to allocate scarce spaces amongapplicants. Admissions lottery results are not available in our data. Even if they wereavailable, prior experience (Furgeson et al., 2012; Tuttle, Gleason, & Clark, 2012;Tuttle et al., 2013) demonstrates that they could be used to create valid experimentaltreatment and control groups in only a small percentage of the schools, dramati-cally reducing statistical power and raising questions about external validity (seealso Abdulkadiroglu et al., 2011; Bifulco, Cobb, & Bell, 2009; Zimmer & Engberg,2016).
The longitudinal approach using pretreatment measures of the outcomes of inter-est is often useful in examining impacts on test scores because, in reading and math,students typically take tests repeatedly over many years. The change in test scoresfor individual students who move between traditional public schools and charterscan be used to infer the impacts of the charter schools on student achievement,while holding time-invariant student/family characteristics constant. Two recentstudies (Furgeson et al., 2012; Tuttle et al., 2013) have demonstrated that longitudi-nal analyses of test score impacts that control for pretreatment test scores can closelyreplicate randomized experimental impact estimates for the same students. But thisapproach cannot be used to measure long-term outcomes such as graduation, col-lege enrollment, college persistence, and employment, because those outcomes donot occur before a student’s enrollment in a charter school.
With the usual approaches unavailable, we use other strategies to deal with se-lection bias. The first involves identifying a strong comparison group. In this ap-proach, we restrict the sample to students who attended a charter school in grade8, just before beginning high school. The motivation for this is that unmeasuredstudent/family characteristics that lead to the selection of charter high schools andwhich influence outcomes later in life are also likely to be related to the choiceof a charter school at the middle school level. This is the same approach that Al-tonji, Elder, and Taber (2005) take to assess the attainment effects of Catholic highschools. The approach potentially limits the external validity of the results, becauseeffects on charter high school students who attended charter middle schools mightdiffer from effects on charter high school students who did not attend charter mid-dle schools. Sacrificing some external validity is worthwhile to promote internalvalidity, however.
Using a comparison group of charter middle school students does not perfectlysolve the selection problem, because “back end” selection bias could occur throughthe comparison students’ choice to exit the charter sector after eighth grade. But thiskind of selection is likely to be far less consequential than the initial selection into thecharter sector, because enrolling in a new school in ninth grade is a normal transitionthat is undertaken by most students regardless of whether they are changing schoolsectors. Large numbers of students in both the treatment group and the comparisongroup are transferring to new schools to begin high school, and, from the perspectiveof the student, changing sectors (from charter to traditional public) is likely to be lesssalient than changing schools with or without a sector change. In consequence, eventhough the comparison students’ voluntary exit from the sector could in principle
Journal of Policy Analysis and Management DOI: 10.1002/pamPublished on behalf of the Association for Public Policy Analysis and Management

Charter High Schools’ Effects on Long-Term Attainment and Earnings / 5
create a selection bias problem, our focus on a typical transition year should reducethe likelihood of such a bias.
To further deal with potential endogeneity, we also use a matching approachpopularized by Rubin (1977) and Rosenbaum and Rubin (1983). While matchingprocedures can take many forms, we use a one-to-one nearest-neighbor Mahalanobismatching approach (also referred to as a covariate match) in which we match onobservable characteristics to create a control group.5 We then examine difference instudent outcomes between those in treatment relative to this counterfactual controlgroup. Formally, this can be specified as (Smith & Todd, 2001):
�tt = E(y1|x, z = 1) − E(y0|x, z = 1). (1)
This approach can give causal results in estimating a “treatment” when observablecharacteristics (x) are sufficient to make the counterfactual outcome y0 independentof z.
y0 ⊥ z|x.
In our case, by restricting the population of students to those who are enrolled incharter schools in eighth grade, we make an argument that conditional on the vectorof covariates x, z, and y0 are independent. After creating a control group of non-charter high school students, we then compare the mean difference in outcomes.
A similar matching approach was used (without a prior restriction to a charterpopulation) in a recent report on charter middle schools affiliated with the KIPP(Tuttle et al., 2010), an analysis of charter school authorizers (Zimmer et al., 2014),and in CREDO’s (2009, 2013) evaluation of charter schools. These evaluations arebolstered by research suggesting that the creation of a carefully matched comparisongroup in some circumstances produce impact estimates that replicate the findings ofrandomized experiments (Cook, Shadish, & Wong, 2008). More recently, researchhas suggested that a matching strategy can replicate randomized design resultswhen examining school choice programs (Bifulco, 2012; Furgeson et al., 2012).In this paper, we report the results using the matching approach as our primaryanalysis. However, later we conduct sensitivity analysis using modifications to therestricted sample for the matching analysis as well as an instrumental variable (IV)approach to provide further evidence of the robustness of our results.
DATA
Studying effects of K-12 interventions on long-term outcomes demands linked dataon individual students from K-12 program participation through postsecondary en-rollment, postsecondary persistence, employment, and earnings. Even when linksare available to connect K-12 data with postsecondary and earnings data, a longtime series is needed; studying the long-term effects of a high school interventionrequires prehigh school data back to eighth grade and posthigh school informationinto college and beyond. In addition, the jurisdiction studied must have a sufficientsample of students participating in the intervention (and a sufficient sample of com-parison students) to provide reliable results. Florida represents one among perhapsa handful of places where all the necessary data elements are currently in place.
5 Using teffects nnmatch routine in Stata, we matched to the closest non-charter high school student basedon the nearest Mahalanobis distance with no caliper restriction with replacement. Multiple matches wereincluded in the event of ties. The algorithm imputes the missing potential outcome for each student byusing an average of the outcomes of similar students in the control group.
Journal of Policy Analysis and Management DOI: 10.1002/pamPublished on behalf of the Association for Public Policy Analysis and Management
6 / Charter High Schools’ Effects on Long-Term Attainment and Earnings
To create the data set for the analysis, we had to merge data from a varietyof sources. The primary source for student-level information is the Florida De-partment of Education’s K-20 Education Data Warehouse (K-20 EDW), an inte-grated longitudinal database covering all public school students and teachers in thestate of Florida. The K-20 EDW includes detailed enrollment, demographic, andprogram participation information for each student, as well as their reading andmath achievement test scores. As the name implies, the K-20 EDW includes stu-dent records for K-12 public school students and students enrolled in communitycolleges or four-year public universities in Florida. The K-20 EDW also containsinformation on the Florida Resident Assistance Grant (FRAG), a grant available toFlorida residents who attend private colleges and universities in the state. Data fromthe National Student Clearinghouse (NSC), a national database that includes enroll-ment data from 3,300 colleges throughout the United States, is used to track collegeattendance outside the state of Florida, as well as any private college enrollment inFlorida that the FRAG data do not pick up. Unfortunately, the Florida Departmentof Education’s data-sharing agreement with the NSC expired in the latter part of the2000s, so we can only reliably track students who attended private colleges and uni-versities within Florida or any postsecondary institution outside of Florida throughschool year 2006 to 2007.6
The identity and location of schools is determined by the Master School ID files(for public K-12 schools) and the Non-Public Master Files (for private schools) main-tained by the Florida Department of Education. Grade offerings are determined byenrollment in October’s membership survey and by the school grade configurationinformation in the relevant school ID file.
We also collect information on employment outcomes from the Florida Edu-cation and Training Placement Information Program (FETPIP). FETPIP reportsinformation for any individual who has participated in any public education ortraining program in Florida. The FETPIP data contain unemployment insurance(UI) records, which provide information on a person’s quarterly earnings and theemployer’s North American Industry Classification System (NAICS) code. This al-lows us to determine the employment status and income of all Florida high schoolstudents who remain in the state and are employed in industries covered by UI.7
The Florida Department of Education routinely links these data to elements in theK-20 EDW and assigns an individual-level anonymous student ID code.
High school graduation is determined by withdrawal information and studentaward data from the K-20 EDW. Only students who receive a standard high schooldiploma are considered to be high school graduates. Students earning a GRE orspecial education diploma are counted as not graduating. Similarly, students whowithdrew with no intention of returning or exited for other reasons (such as nonat-tendance, court action, joining the military, marriage, pregnancy, or medical prob-lems), but did not later graduate, are counted as not graduating. Students who diedwhile in school are removed from the sample. It is not possible to directly determinethe graduation status of students who leave the Florida public school system to at-tend a home-schooling program or to enroll in a private school, or who move out ofstate. Similarly, some students leave the public school system for unknown reasons.In the sample, students whose graduation status is unknown are more likely to have
6 Information on the NSC is available at www.studentclearinghouse.org.7 Excluded are members of the armed forces, the self-employed, proprietors, domestic workers, and rail-road workers covered by the railroad UI system. In addition, only about half of all workers in agriculturalindustries are covered. The leakage due to college enrollment outside of Florida is relatively small. Amongstudents in our sample, 52 percent go to college, but only 4 percent go to postsecondary institutions outof state.
Journal of Policy Analysis and Management DOI: 10.1002/pamPublished on behalf of the Association for Public Policy Analysis and Management
Charter High Schools’ Effects on Long-Term Attainment and Earnings / 7
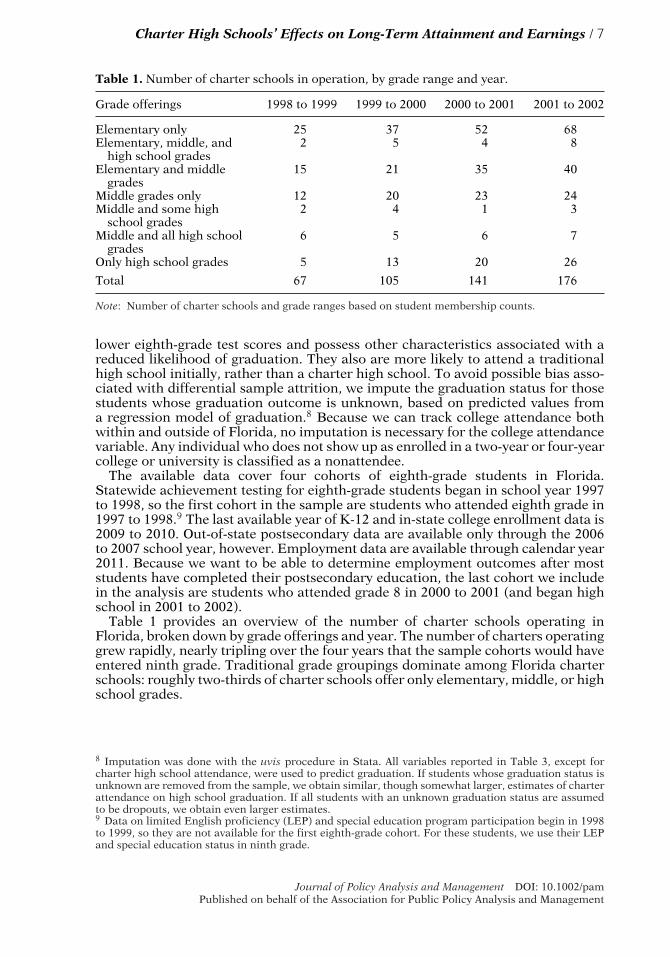
Table 1. Number of charter schools in operation, by grade range and year.
Grade offerings 1998 to 1999 1999 to 2000 2000 to 2001 2001 to 2002
Elementary only 25 37 52 68Elementary, middle, and
high school grades2 5 4 8
Elementary and middlegrades
15 21 35 40
Middle grades only 12 20 23 24Middle and some high
school grades2 4 1 3
Middle and all high schoolgrades
6 5 6 7
Only high school grades 5 13 20 26
Total 67 105 141 176
Note: Number of charter schools and grade ranges based on student membership counts.
lower eighth-grade test scores and possess other characteristics associated with areduced likelihood of graduation. They also are more likely to attend a traditionalhigh school initially, rather than a charter high school. To avoid possible bias asso-ciated with differential sample attrition, we impute the graduation status for thosestudents whose graduation outcome is unknown, based on predicted values froma regression model of graduation.8 Because we can track college attendance bothwithin and outside of Florida, no imputation is necessary for the college attendancevariable. Any individual who does not show up as enrolled in a two-year or four-yearcollege or university is classified as a nonattendee.
The available data cover four cohorts of eighth-grade students in Florida.Statewide achievement testing for eighth-grade students began in school year 1997to 1998, so the first cohort in the sample are students who attended eighth grade in1997 to 1998.9 The last available year of K-12 and in-state college enrollment data is2009 to 2010. Out-of-state postsecondary data are available only through the 2006to 2007 school year, however. Employment data are available through calendar year2011. Because we want to be able to determine employment outcomes after moststudents have completed their postsecondary education, the last cohort we includein the analysis are students who attended grade 8 in 2000 to 2001 (and began highschool in 2001 to 2002).
Table 1 provides an overview of the number of charter schools operating inFlorida, broken down by grade offerings and year. The number of charters operatinggrew rapidly, nearly tripling over the four years that the sample cohorts would haveentered ninth grade. Traditional grade groupings dominate among Florida charterschools: roughly two-thirds of charter schools offer only elementary, middle, or highschool grades.
8 Imputation was done with the uvis procedure in Stata. All variables reported in Table 3, except forcharter high school attendance, were used to predict graduation. If students whose graduation status isunknown are removed from the sample, we obtain similar, though somewhat larger, estimates of charterattendance on high school graduation. If all students with an unknown graduation status are assumedto be dropouts, we obtain even larger estimates.9 Data on limited English proficiency (LEP) and special education program participation begin in 1998to 1999, so they are not available for the first eighth-grade cohort. For these students, we use their LEPand special education status in ninth grade.
Journal of Policy Analysis and Management DOI: 10.1002/pamPublished on behalf of the Association for Public Policy Analysis and Management
8 / Charter High Schools’ Effects on Long-Term Attainment and Earnings
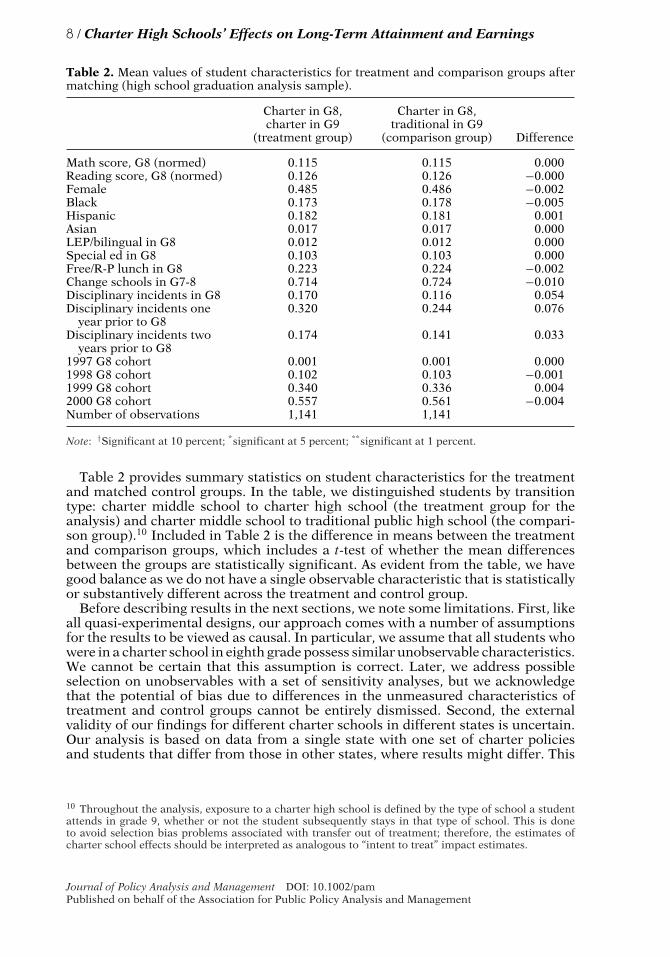
Table 2. Mean values of student characteristics for treatment and comparison groups aftermatching (high school graduation analysis sample).
Charter in G8,charter in G9
(treatment group)
Charter in G8,traditional in G9
(comparison group) Difference
Math score, G8 (normed) 0.115 0.115 0.000Reading score, G8 (normed) 0.126 0.126 −0.000Female 0.485 0.486 −0.002Black 0.173 0.178 −0.005Hispanic 0.182 0.181 0.001Asian 0.017 0.017 0.000LEP/bilingual in G8 0.012 0.012 0.000Special ed in G8 0.103 0.103 0.000Free/R-P lunch in G8 0.223 0.224 −0.002Change schools in G7-8 0.714 0.724 −0.010Disciplinary incidents in G8 0.170 0.116 0.054Disciplinary incidents one
year prior to G80.320 0.244 0.076
Disciplinary incidents twoyears prior to G8
0.174 0.141 0.033
1997 G8 cohort 0.001 0.001 0.0001998 G8 cohort 0.102 0.103 −0.0011999 G8 cohort 0.340 0.336 0.0042000 G8 cohort 0.557 0.561 −0.004Number of observations 1,141 1,141
Note: †Significant at 10 percent; *significant at 5 percent; **significant at 1 percent.
Table 2 provides summary statistics on student characteristics for the treatmentand matched control groups. In the table, we distinguished students by transitiontype: charter middle school to charter high school (the treatment group for theanalysis) and charter middle school to traditional public high school (the compari-son group).10 Included in Table 2 is the difference in means between the treatmentand comparison groups, which includes a t-test of whether the mean differencesbetween the groups are statistically significant. As evident from the table, we havegood balance as we do not have a single observable characteristic that is statisticallyor substantively different across the treatment and control group.
Before describing results in the next sections, we note some limitations. First, likeall quasi-experimental designs, our approach comes with a number of assumptionsfor the results to be viewed as causal. In particular, we assume that all students whowere in a charter school in eighth grade possess similar unobservable characteristics.We cannot be certain that this assumption is correct. Later, we address possibleselection on unobservables with a set of sensitivity analyses, but we acknowledgethat the potential of bias due to differences in the unmeasured characteristics oftreatment and control groups cannot be entirely dismissed. Second, the externalvalidity of our findings for different charter schools in different states is uncertain.Our analysis is based on data from a single state with one set of charter policiesand students that differ from those in other states, where results might differ. This
10 Throughout the analysis, exposure to a charter high school is defined by the type of school a studentattends in grade 9, whether or not the student subsequently stays in that type of school. This is doneto avoid selection bias problems associated with transfer out of treatment; therefore, the estimates ofcharter school effects should be interpreted as analogous to “intent to treat” impact estimates.
Journal of Policy Analysis and Management DOI: 10.1002/pamPublished on behalf of the Association for Public Policy Analysis and Management

Charter High Schools’ Effects on Long-Term Attainment and Earnings / 9
is a limitation of any research that examines a policy in a specific location. Thefact that our previous work (Booker et al., 2011) found very similar results (forstudent attainment effects) in a second location (Chicago) is encouraging, however.Third, like any study of long-term outcomes, our study is examining the effects ofa treatment as it existed in the past. In the interim, conditions could have changedin the treatment (in this case, the number and types of charter schools). Therefore,the analyses may have limitations in their applicability to the current set of charterschools in Florida. This limitation is inherent in any study of long-term outcomes.Finally, our analysis focuses on the subset of charter high school students whohad also attended charter schools in eighth grade. The design cannot measure theeffects of charter high schools on students who were not in charter schools ineighth grade, potentially limiting the external validity of the results. This loss ofexternal validity was necessary to promote the study’s internal validity by identifyinga comparison group of students who provide a plausible counterfactual. (Later wedescribe analyses that gauge how sensitive our results are to this restriction.) Despitethe limitations described above, this paper provides some of the first empiricalevidence on the relationship between attending a charter high school and long-termoutcomes, including earnings.
RESULTS
Implementation of Analytic Approach
We first replicate Booker et al.’s (2011) previous analysis of high school graduationand college enrollment with an expanded sample that includes additional yearsof data. We measure high school graduation as receiving a standard high schooldiploma within five years of entering ninth grade. College enrollment is determinedby enrollment in any postsecondary institution within six years of starting highschool.
We extend the analysis in this paper by considering the long-run effects of charterhigh school attendance on persistence in college and earnings. We gauge persistenceby assessing whether a student is enrolled in any postsecondary institution at leasttwo consecutive years. The two-year persistence measure is important, because ittypically takes at least two years to obtain a degree from a community college. Inaddition, dropout from four-year higher education institutions is highest in the firstyear, meaning persistence into the second year is correlated with degree completionin four-year institutions as well (Berkner & Choy, 2008). Measuring persistence overa longer period for attendees of four-year institutions would be desirable, but datalimitations prevent us from conducting useful analyses of longer-term persistenceand degree completion.11 More specifically, the available NSC data on college en-rollment ends in 2006 to 2007, so we could only track our first cohort of students(who entered high school in 1998) through four years of college, and then only ifthey graduated high school within four years and entered college immediately.
In addition, and most importantly, we possess earnings data through the end ofcalendar year 2011 and can determine annual income for four student cohorts inthe 10th and 11th years after beginning grade 8 and for three of the four cohorts 12years after entering grade 8. For example, employment of our last cohort of eighthgraders (those attending grade 8 in 2000 to 2001) is measured through calendar year
11 Interpreting persistence beyond two years is problematic for students enrolled in community colleges.If a student goes to community college for two years they can get an Associate degree, which may betheir terminal degree.
Journal of Policy Analysis and Management DOI: 10.1002/pamPublished on behalf of the Association for Public Policy Analysis and Management

10 / Charter High Schools’ Effects on Long-Term Attainment and Earnings
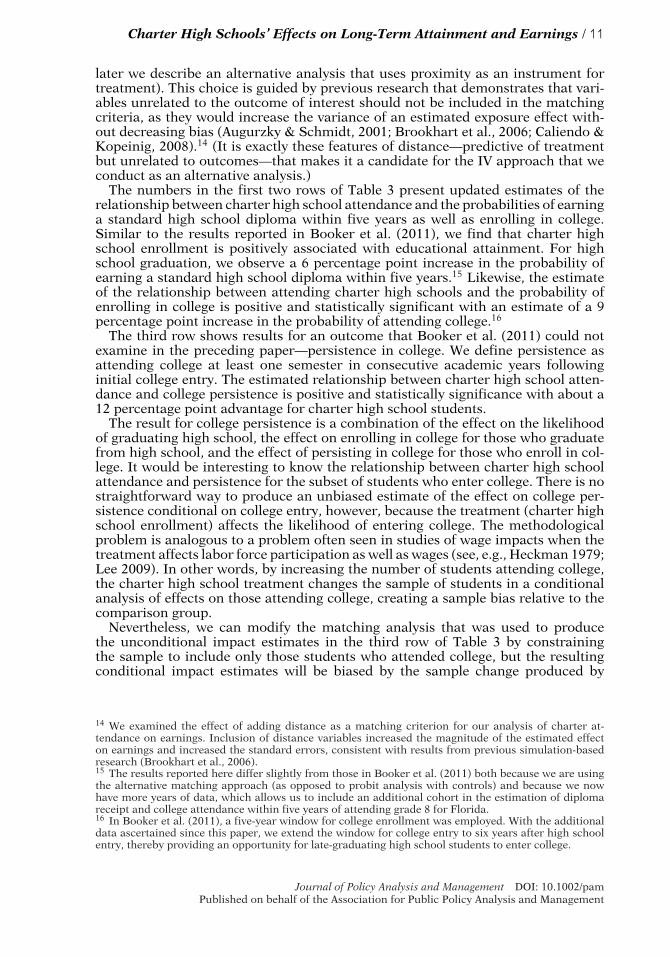
Table 3. Estimates of the effect of attending a charter high school on educational attainment(average treatment effects on the treated).
Nearest-neighbormatching model
Receive standard high school diploma within five years 0.061**
(0.020)[N = 2,282]
Attend a two-year or four-year college within six years 0.088**
(0.026)[N = 2,286]
Persist in any college at least two consecutive years(unconditional)
0.117**
(0.027)[N = 2,142]
Persist in any college at least two consecutive years(conditional on initial enrollment in college)
0.062*
(0.031)[N = 1,396]
Notes: †significant at 10 percent; *significant at 5 percent; **significant at 1 percent. Robust Abadie–Imbens standard errors are reported in parentheses. The following characteristics are used as matchcriteria: student demographics, English-language skills, special education program participation, familyincome (proxied by free/reduced-price lunch status), mobility during middle school, disciplinary inci-dents during middle school, eighth-grade test scores in math and reading, and a set of cohort indicators.N is the sum of treated observations and matched control observations (including ties).
2011. A student in that cohort who took four years to finish high school and fouryears to finish college would graduate from college in spring 2009, which would benine years after the beginning of grade 8. The following year (10 years after enteringgrade 8) represents the first full year of earnings after potentially graduating college.To account for initial employment in temporary jobs, early spells of unemployment,or employment in occupations outside one’s long-term profession, we measure themaximum annual earnings 10, 11, or 12 years from initial enrollment in grade 8. Thislatter measure is potentially the most reliable, because it maximizes our sample sizeand accounts for many of the short-term fluctuations in employment and earningsthat can frequently occur among young job market entrants.
ESTIMATES OF ATTAINMENT IMPACT
Table 3 presents the estimated impacts of charter high schools on students’ subse-quent academic attainment, as measured by high school graduation, college entry,and college persistence with the standard errors clustered at the high school level.For the analysis, we match on student demographics, English-language skills, spe-cial education program participation, family income (proxied by free/reduced-pricelunch status), baseline disciplinary incidents and mobility during middle school.12
Importantly, as part of the match, we include student ability and prior educationalinputs by incorporating eighth-grade math and reading test scores.13 We do notinclude the proximity of charter schools in the set of matching variables (although
12 English-language skills are measured by participation in an LEP program. Student mobility is mea-sured by an indicator for students who changed schools between grades 6 and 7 or between grades 7 and8.13 For test scores, we use the Student’s normed scores on the FCAT-SSS test, a criterion-referencedtest based on the state’s curriculum standards. The Stanford Achievement Test is also administered tostudents in Florida, but administration of the Stanford test did not begin until school year 1999 to 2000.
Journal of Policy Analysis and Management DOI: 10.1002/pamPublished on behalf of the Association for Public Policy Analysis and Management
Charter High Schools’ Effects on Long-Term Attainment and Earnings / 11
later we describe an alternative analysis that uses proximity as an instrument fortreatment). This choice is guided by previous research that demonstrates that vari-ables unrelated to the outcome of interest should not be included in the matchingcriteria, as they would increase the variance of an estimated exposure effect with-out decreasing bias (Augurzky & Schmidt, 2001; Brookhart et al., 2006; Caliendo &Kopeinig, 2008).14 (It is exactly these features of distance—predictive of treatmentbut unrelated to outcomes—that makes it a candidate for the IV approach that weconduct as an alternative analysis.)
The numbers in the first two rows of Table 3 present updated estimates of therelationship between charter high school attendance and the probabilities of earninga standard high school diploma within five years as well as enrolling in college.Similar to the results reported in Booker et al. (2011), we find that charter highschool enrollment is positively associated with educational attainment. For highschool graduation, we observe a 6 percentage point increase in the probability ofearning a standard high school diploma within five years.15 Likewise, the estimateof the relationship between attending charter high schools and the probability ofenrolling in college is positive and statistically significant with an estimate of a 9percentage point increase in the probability of attending college.16
The third row shows results for an outcome that Booker et al. (2011) could notexamine in the preceding paper—persistence in college. We define persistence asattending college at least one semester in consecutive academic years followinginitial college entry. The estimated relationship between charter high school atten-dance and college persistence is positive and statistically significance with about a12 percentage point advantage for charter high school students.
The result for college persistence is a combination of the effect on the likelihoodof graduating high school, the effect on enrolling in college for those who graduatefrom high school, and the effect of persisting in college for those who enroll in col-lege. It would be interesting to know the relationship between charter high schoolattendance and persistence for the subset of students who enter college. There is nostraightforward way to produce an unbiased estimate of the effect on college per-sistence conditional on college entry, however, because the treatment (charter highschool enrollment) affects the likelihood of entering college. The methodologicalproblem is analogous to a problem often seen in studies of wage impacts when thetreatment affects labor force participation as well as wages (see, e.g., Heckman 1979;Lee 2009). In other words, by increasing the number of students attending college,the charter high school treatment changes the sample of students in a conditionalanalysis of effects on those attending college, creating a sample bias relative to thecomparison group.
Nevertheless, we can modify the matching analysis that was used to producethe unconditional impact estimates in the third row of Table 3 by constrainingthe sample to include only those students who attended college, but the resultingconditional impact estimates will be biased by the sample change produced by
14 We examined the effect of adding distance as a matching criterion for our analysis of charter at-tendance on earnings. Inclusion of distance variables increased the magnitude of the estimated effecton earnings and increased the standard errors, consistent with results from previous simulation-basedresearch (Brookhart et al., 2006).15 The results reported here differ slightly from those in Booker et al. (2011) both because we are usingthe alternative matching approach (as opposed to probit analysis with controls) and because we nowhave more years of data, which allows us to include an additional cohort in the estimation of diplomareceipt and college attendance within five years of attending grade 8 for Florida.16 In Booker et al. (2011), a five-year window for college enrollment was employed. With the additionaldata ascertained since this paper, we extend the window for college entry to six years after high schoolentry, thereby providing an opportunity for late-graduating high school students to enter college.
Journal of Policy Analysis and Management DOI: 10.1002/pamPublished on behalf of the Association for Public Policy Analysis and Management
12 / Charter High Schools’ Effects on Long-Term Attainment and Earnings
the effect on college entry. Given that the treatment has increased the number ofstudents entering college—presumably adding students who had lower ability levelsin eighth grade and perhaps less motivation for college—the conditional impactestimate is likely to be biased downward. The fourth row in Table 3 shows the resultsof the conditional estimate of a 6 percentage point advantage for charter high schoolstudents, which suggests that charter school graduates are significantly more likelyto persist for two years, even after controlling for postsecondary enrollment.
Overall, the results reaffirm the results from Booker et al. (2011)—attending acharter high school is associated with higher levels of educational attainment. Im-portantly, in the measure Booker et al. could not observe in our previous paper (i.e.,college persistence), we observe a positive relationship between attending a char-ter high school and college persistence, which suggests that Booker et al.’s resultswere not simply a function of charter high schools reducing graduation standardsor pushing students into college when they are not prepared for the rigor of college.
Impacts on Earnings
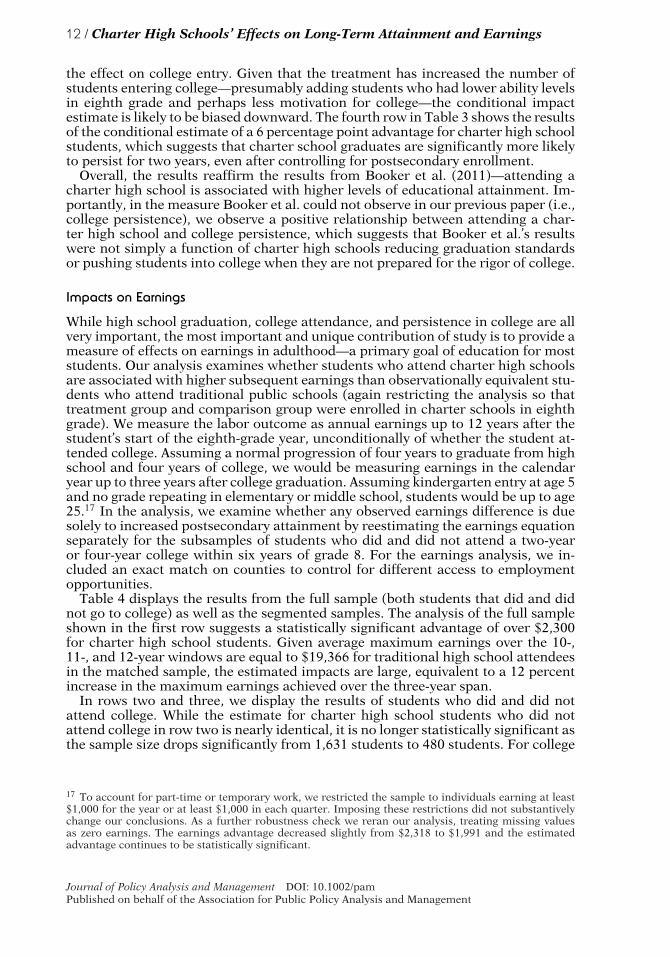
While high school graduation, college attendance, and persistence in college are allvery important, the most important and unique contribution of study is to provide ameasure of effects on earnings in adulthood—a primary goal of education for moststudents. Our analysis examines whether students who attend charter high schoolsare associated with higher subsequent earnings than observationally equivalent stu-dents who attend traditional public schools (again restricting the analysis so thattreatment group and comparison group were enrolled in charter schools in eighthgrade). We measure the labor outcome as annual earnings up to 12 years after thestudent’s start of the eighth-grade year, unconditionally of whether the student at-tended college. Assuming a normal progression of four years to graduate from highschool and four years of college, we would be measuring earnings in the calendaryear up to three years after college graduation. Assuming kindergarten entry at age 5and no grade repeating in elementary or middle school, students would be up to age25.17 In the analysis, we examine whether any observed earnings difference is duesolely to increased postsecondary attainment by reestimating the earnings equationseparately for the subsamples of students who did and did not attend a two-yearor four-year college within six years of grade 8. For the earnings analysis, we in-cluded an exact match on counties to control for different access to employmentopportunities.
Table 4 displays the results from the full sample (both students that did and didnot go to college) as well as the segmented samples. The analysis of the full sampleshown in the first row suggests a statistically significant advantage of over $2,300for charter high school students. Given average maximum earnings over the 10-,11-, and 12-year windows are equal to $19,366 for traditional high school attendeesin the matched sample, the estimated impacts are large, equivalent to a 12 percentincrease in the maximum earnings achieved over the three-year span.
In rows two and three, we display the results of students who did and did notattend college. While the estimate for charter high school students who did notattend college in row two is nearly identical, it is no longer statistically significant asthe sample size drops significantly from 1,631 students to 480 students. For college
17 To account for part-time or temporary work, we restricted the sample to individuals earning at least$1,000 for the year or at least $1,000 in each quarter. Imposing these restrictions did not substantivelychange our conclusions. As a further robustness check we reran our analysis, treating missing valuesas zero earnings. The earnings advantage decreased slightly from $2,318 to $1,991 and the estimatedadvantage continues to be statistically significant.
Journal of Policy Analysis and Management DOI: 10.1002/pamPublished on behalf of the Association for Public Policy Analysis and Management
Charter High Schools’ Effects on Long-Term Attainment and Earnings / 13
Table 4. Estimates of the effect of Florida Charter High School attendance on maximumannual earnings 10, 11, or 12 years since beginning grade 8, by college attendance (averagetreatment effects on the treated).
Sample Nearest-neighbor matching model
All 2,318.36*
(1,162.11)[N = 1,631]
No college within six years 2,325.09(2,067.04)[N = 480]
Attend college within six years 3,029.24*
(1,364.96)[N = 1,147]
Notes: †significant at 10 percent; *significant at 5 percent; **significant at 1 percent. Robust Abadie–Imbens standard errors are reported in parentheses. The following characteristics are used as matchcriteria: student demographics, English-language skills, special education program participation, familyincome (proxied by free/reduced-price lunch status), mobility during middle school, disciplinary inci-dents during middle school, eighth-grade test scores in math and reading, and a set of cohort indicators.N is the sum of treated observations and matched control observations (including ties). The number ofobservations in the “college” and “no college” categories may not sum to the total number of observationsdue to missing values for college attendance.
attendees, the estimated charter coefficient is positive and significant, suggestingthat, even among students who went to college, charter students have an earningsadvantage. Therefore, college attendance alone cannot explain the advantage of theearning difference we see for the full sample.
SENSITIVITY ANALYSES
As noted above, despite our best efforts to minimize selection bias, some bias couldremain. For instance, our analysis relies upon a set of students that all attendedcharter schools in eighth grade with treatment students going on to attend a charterhigh school while the control students attend traditional public high schools. Al-though these students may have been similarly motived to attend a charter middleschool, students and their families may have undergone changes while attendingmiddle school that lead them to make different high school choices. If any unob-served changes not only affected the choice of high school type but also later studentperformance, our initial estimate could be biased. We address this concern with twosets of alternative analyses, one of which continues to use matching techniques butmakes alterations to the treatment and control groups and another that uses analternative IV estimation approach.
First, we build off our current analysis by using the same treatment group—students who attended a charter school in eighth grade and attended a charterhigh school in ninth grade. However, we modify the control group in the hope offurther minimizing any selection bias. Previously, the control group was a matchedset of students drawn from the restricted population of students who attended acharter school in eighth grade, but who chose to attend a traditional public highschool in ninth grade. This set of students includes a mix of students who chosenot to attend a charter high school for a variety of reasons. In some cases, studentsmay have switched because of some observable event—for example, because theyhave not performed well in a charter middle school or had disciplinary issues.While including these students in our control group is a concern, we argue that ourcurrent matching approach should minimize this potential problem as we match on
Journal of Policy Analysis and Management DOI: 10.1002/pamPublished on behalf of the Association for Public Policy Analysis and Management
14 / Charter High Schools’ Effects on Long-Term Attainment and Earnings
observable characteristics such as baseline test scores and discipline incidents. Inother cases, students may switch to traditional public high schools for unobservedreasons. For instance, some students may switch for extra-curricular opportunities.To the degree that these unobserved motivations are correlated with the ultimateoutcomes and uncorrelated with the observed student characteristics we match on,the inclusion of these students could create selection bias. However, there could bea third subset of students who switch to traditional public high school because thereis no local charter high school option. Many of these students would be motivated toattend a charter high school, but cannot because no local charter high school exists.As a sensitivity analysis, we focus on the third subset of students as our controlstudents as we restrict our pool of students to match on those students that did nothave a charter high school available to them within five miles when entering ninthgrade.18 We argue that many of these students would attend a charter high school ifa local charter school were available. Therefore, these students may be more similarin their motivation than the other two subsets of students in our original control setof students.
While the above approach may help with student unobserved selection intoschools, it may not deal with another possible source of bias—the endogenouslocation of charter high schools. For charter operators, some geographic areas maybe more appealing than others and cause operators to locate charter schools innonrandom ways. To the degree that the motivation of charter operators to locatein certain areas is correlated with the ultimate student outcomes and uncorrelatedwith the matched set of observed student characteristics, the nonrandom location ofcharter high schools could create selection bias. To minimize this possible bias, wetake one more step—we restrict the control group of students to those who attendedcharter middle schools but lived in an area where no charter high schools existednearby at the time the students entered high school, but which did possess a charterhigh school sometime in the future. In other words, the control group of studentsdid not have an option to attend a charter high school when they entered high schoolbut would have had that option if they had entered high school in a later year.
In sum, the revised matching approach (which we refer to as a geographicallyrestricted matching) uses the same treatment group from the primary analysis, butthe pool of students to match on for the set of control students is different. Thispool of control students contains students who attended a charter school in eighthgrade, attended a traditional public high school in ninth grade, did not have anearby charter high school option when they entered high school, but would havea charter high school available to them within five miles sometime in the future.Using this pool of students, just like in our primary analysis, we conduct a nearest-neighbor Mahalonbis match (using the same observable student characteristics asmatch criteria as before). Conceptually, we argue that this could be a preferredmodel. However, the geographic restriction of this revised approach significantlyreduces the sample of students we can draw upon for the nearest-neighbor matchand therefore we argue that this provides for a good sensitivity analysis but shouldnot be used as our primary analysis.
As noted above, our primary analysis is based on a set of students that all attendedcharter schools in eighth grade, some of which remain in the charter sector in ninthgrade while others switch to a traditional public school in ninth grade. A concernwith this approach is that students switching sectors (i.e., charter to traditional)could be different in unmeasured ways from students who remain in the same sector
18 We measure physical proximity of other charter high schools by the minimum linear distance from astudent’s eighth-grade charter to a different charter school offering grade 9.
Journal of Policy Analysis and Management DOI: 10.1002/pamPublished on behalf of the Association for Public Policy Analysis and Management
Charter High Schools’ Effects on Long-Term Attainment and Earnings / 15
(although, as we have noted above, focusing on the beginning of high school, whenmost students are changing schools anyway, should minimize this problem). Toexamine this issue, we conduct a second sensitivity analysis in which we change thepool of students in the comparison group. Instead of using students who switchedfrom a charter school in eighth grade to a traditional public school in ninth gradeas our control, we utilize students who were in traditional public schools in botheighth and ninth grade as our comparison group. We refer to this approach as the“nonswitcher” approach. The disadvantage of this approach is that it does not havethe benefit that both the treatment and control students all chose to attend a charterschool in the middle grades (and thus may not account for important unmeasuredstudent and family characteristics that persist from middle to high school).
In a similar vein, as a third sensitivity analysis, we exclude from the estimationsample students who attended charter schools that offered both middle and highschool grades. While having a nontraditional grade configuration may be part of thecharter school “treatment,” students who do not have to switch schools to attendgrade 9 face a rather different choice than do students who must choose betweenmoving to a different charter high school or to a different traditional public highschool. Restricting the sample in this way does come at a cost, however. Only a bitmore than half (26 of 44) high schools in the final year of our analysis (2001/2002)were “stand-alone” high schools that offered only the traditional grade range of 9through 12.
Finally, for the sake of comparison, we reestimate our models, but include asthe treatment group all students attending charter schools in grade 9 (not justthose students who attended a charter school in grade 8) and allow the comparisongroup to be drawn from all students attending traditional public schools (regardlessof whether the student switched into a traditional public school from a charterschool). Using a more inclusive population has the potential to increase the externalvalidity of the results. However, using the full sample is the weakest approach forinternal validity because it implicitly assumes that students who attended chartermiddle schools possess the same unmeasured characteristics as students who wereenrolled in traditional middle schools.
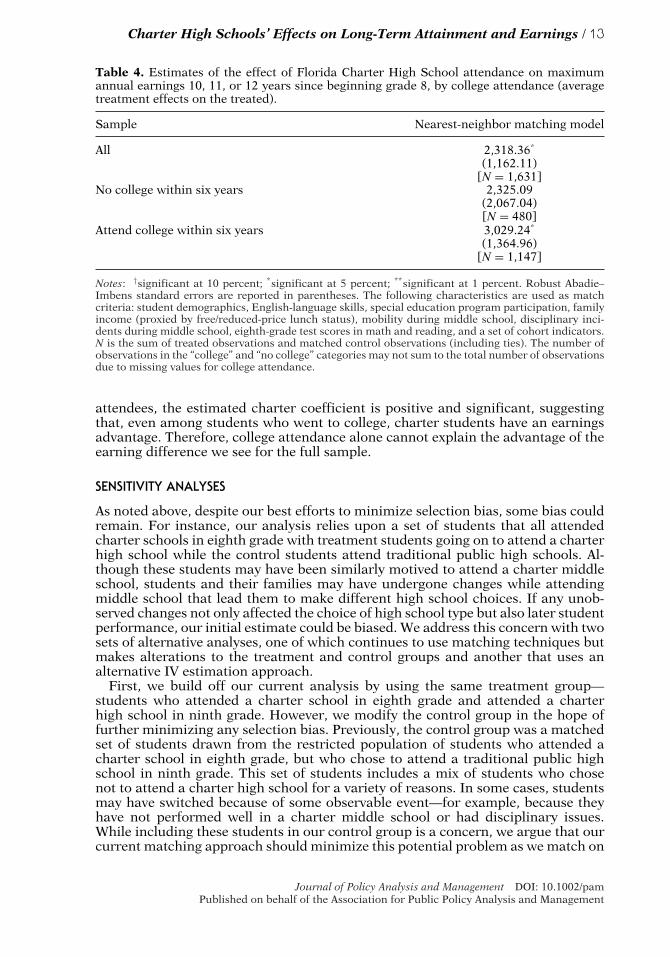
Table 5 displays the results from our original analysis across the four primaryoutcomes as well as the results from the set of sensitivity analyses based on alterna-tive samples: the geographically restricted sample, the nonswitchers approach, thestand-alone high school sample, and the full sample. Focusing first on the sensitiv-ity analyses designed to account for student unobservable characteristics (columns2 through 4), across the educational attainment measures, the results suggest thesame substantive conclusions as the primary analyses as all the estimates are posi-tive and statistically significant. The estimates for charter impacts on earnings are ofsimilar magnitude to those from the main analysis for the geographically restrictedsample (column 2) and the analysis excluding students attending charter schoolswith both eighth and ninth grades (column 4), but are no longer statistically signifi-cant.19 For the “nonswitchers” analysis (column 3), the estimated impact on earningsdrops in magnitude to $822 and is no longer statistically significant. Finally, in thefull-sample analysis (column 5), we find no statistically significant effects. This isconsistent with the notion that students who select into charter schools in the mid-dle grades are different in unmeasured ways from students who attend traditionalmiddle schools, and that those unmeasured differences affect long-run outcomes.
19 The reduced sample size for the analysis of earnings with the charter location restriction is due tothe imposition of exact matching of treatment and control groups by county. Without the exact matchcriterion, the sum of treatment and matched control observations is 1,640.
Journal of Policy Analysis and Management DOI: 10.1002/pamPublished on behalf of the Association for Public Policy Analysis and Management

16 / Charter High Schools’ Effects on Long-Term Attainment and Earnings
Tab
le5
.Sen
siti
vity
anal
ysis
usi
ng
geog
rap
hic
ally
rest
rict
edsa
mp
leof
mat
ched
sch
ools
.
Ou
tcom
e
Nea
rest
-nei
ghb
orm
atch
ing
resu
lts
from
our
pri
mar
yan
alys
is
Exc
lud
ing
trad
itio
nal
hig
hsc
hoo
l(H
S)
atte
nd
ees
wit
hch
arte
rH
Sw
ith
infi
vem
iles
Com
par
esst
ud
ents
wh
oat
ten
ded
ach
arte
rin
grad
e8
and
ach
arte
rin
grad
e9
tost
ud
ents
wh
oat
ten
ded
atr
adit
ion
alp
ub
lic
sch
ooli
nb
oth
grad
e8
and
grad
e9
Exc
lud
ing
stu
den
tsat
ten
din
gch
arte
rm
idd
lesc
hoo
lsth
atof
fere
dgr
ade
9
Com
par
esst
ud
ents
wh
oat
ten
ded
ach
arte
rin
grad
e9
tost
ud
ents
wh
oat
ten
ded
atr
adit
ion
alp
ub
lic
sch
ooli
ngr
ade
9,ir
resp
ecti
veof
sch
ool
typ
ein
grad
e8
(1)
(2)
(3)
(4)
(5)
Rec
eive
stan
dar
dh
igh
sch
oold
iplo
ma
wit
hin
five
year
s
0.06
1**0.
148**
0.04
1**0.
049†
−0.0
16(0
.020
)(0
.049
)(0
.015
)(0
.030
)(0
.010
)[N
=2,
282]
[N=
2,28
2][N
=2,
447]
[N=
1,00
2][N
=6,
202]
Att
end
atw
o-ye
aror
fou
r-ye
arco
lleg
ew
ith
insi
xye
ars
0.08
8**0.
215**
0.08
4**0.
122**
−0.0
03(0
.026
)(0
.047
)(0
.018
)(0
.042
)(0
.011
)[N
=2,
286]
[N=
2,28
6][N
=2,
472]
[N=
1,01
6][N
=7,
278]
Per
sist
inan
yco
lleg
eat
leas
ttw
oco
nse
cuti
veye
ars
(un
con
dit
ion
al)
0.11
7**0.
288**
0.09
6**0.
180**
0.00
2(0
.027
)(0
.044
)(0
.018
)(0
.044
)(0
.010
)[N
=2,
142]
[N=
2,14
2][N
=2,
313]
[N=
944]
[N=
4,74
5]
Max
imu
man
nu
alea
rnin
gs10
,11,
or12
year
ssi
nce
beg
inn
ing
grad
e8
(fu
llsa
mp
le)—
wit
hex
act
mat
chon
cou
nty
2,31
8.36
*2,
527.
9282
2.82
2,35
4.90
493.
15(1
,162
.11)
(4,4
69.0
1)(7
86.1
0)(2
,789
.27)
(987
.30)
[N=
1,63
1][N
=93
3][N
=1,
638]
[N=
702]
[N=
3,14
1]
Not
es:
† sig
nif
ican
tat
10p
erce
nt;
*si
gnif
ican
tat
5p
erce
nt;
**si
gnif
ican
tat
1p
erce
nt.
Rob
ust
Ab
adie
–Im
ben
sst
and
ard
erro
rsar
ein
par
enth
eses
.T
he
foll
owin
gco
ntr
ols
are
use
das
mat
chcr
iter
iain
the
mat
chin
gm
odel
:st
ud
ent
dem
ogra
ph
ics,
En
glis
h-l
angu
age
skil
ls,
spec
ial
edu
cati
onp
rogr
amp
arti
cip
atio
n,
fam
ily
inco
me
(pro
xied
by
free
/red
uce
d-p
rice
lun
chst
atu
s),m
obil
ity
du
rin
gm
idd
lesc
hoo
l,d
isci
pli
nar
yin
cid
ents
du
rin
gm
idd
lesc
hoo
l,ei
ghth
-gra
de
test
scor
esin
mat
han
dre
adin
g,an
da
set
ofco
hor
tin
dic
ator
s.N
isth
esu
mof
trea
ted
obse
rvat
ion
san
dm
atch
edco
ntr
olob
serv
atio
ns
(in
clu
din
gti
es).
Journal of Policy Analysis and Management DOI: 10.1002/pamPublished on behalf of the Association for Public Policy Analysis and Management

Charter High Schools’ Effects on Long-Term Attainment and Earnings / 17
Of course, we cannot rule out the possibility that our primary findings simply donot apply to the population of students attending traditional middle schools.
Overall, the results indicate that our educational attainment results are relativelyrobust to varying research designs. Focusing on the approaches that deal with selec-tion bias caused by unmeasured factors, the analyses produce similar magnitudesin two out of the three alternative approaches when examining earnings as an out-come. In the “nonswitchers” approach (which, again, we see as the weakest approachamong those designed to control for persistent unmeasured characteristics of stu-dents and families) the results are of smaller magnitude than our main findings,but still represent about a 4 percent increase in earnings. To give some perspective,Chetty, Friedman, and Rockoff (2014) found that a one standard deviation increasein teacher quality (which many agree is the single most important school input) ina single grade increases student eventual earnings by about 1 percent.
As a further check on the validity of our primary results, we consider an alternativemechanism for dealing with selection bias. More specifically, we conduct a two-stage, IV analysis that exploits variation in the location of charter high schools(relative to the charter middle schools the students attended) to predict charter highschool enrollment (following the approach of Grogger & Neal, 2000; Neal, 1997,in their analyses of Catholic high schools). This plays out in two ways. First, somecharter schools offer both middle and high school grades, effectively making thetransition cost zero.20 A charter middle school student is more likely to attend acharter high school if he or she can stay in the same school for high school grades.Second, as we noted in our discussion above, when a student must switch schools toattend high school, distance can vary greatly; the nearest charter high school couldbe down the street or many miles away. Proximity to a charter high school shouldmake it more likely that a student will attend a charter high school.21
Depending on whether the outcome is dichotomous or continuous, we use abivariate probit or IV approach, both of which use measures of proximity to charterschools as an instrument for charter high school enrollment.
Consider the following bivariate probit:
C∗ = β ′1 X1 + u1 (2)
A∗ = β ′2 X2 + γ C + u2 (3)
where C* and A* are latent variables and X1 and X2 are vectors of exogenous vari-ables. We observe the binary choice, C, indicating charter high school attendance,where C = 1 if C* > 0 and C = 0 if C* � 0. Likewise, we observe the binary outcome,A (attainment of a high school diploma, college attendance, or college persistence,as applicable), where A = 1 if A* > 0 and A = 0 if A* � 0. The error terms, u1 and u2,are distributed as bivariate normal with mean zero, unit variance and correlationcoefficient ρ. In our analysis of labor market outcomes, the dependent variable,earnings (E), is continuous:
E = β ′3 X3 + δC + u3. (4)
20 Although many charter schools offering middle and high school classes have all grades in the samelocation, not all do. In some instances, there can be one common administration, but the high schoolcampus may be physically separate from the middle school campus.21 See Harris and Larsen (2015) for an analysis of the determinants of high school choice. More detailsof the proximity variables are presented in the Appendix. All appendices are available at the end of thisarticle as it appears in JPAM online. Go to the publisher’s Web site and use the search engine to locatethe article at http://onlinelibrary.wiley.com.
Journal of Policy Analysis and Management DOI: 10.1002/pamPublished on behalf of the Association for Public Policy Analysis and Management
18 / Charter High Schools’ Effects on Long-Term Attainment and Earnings
We therefore employ two-stage least squares, where in the first stage a linear proba-bility model is used to predict charter high school attendance as a function of charterlocation measures and other exogenous variables, X3. In the second stage, equation(4) is estimated with C replaced by its fitted value, C , and appropriate adjustmentsare made to the variance–covariance matrix.
Finally, in both the bivariate probit and the IV procedures, we test for endogeneityof charter high school attendance. In the bivariate probit, we test whether rho, thecorrelation between the error of the educational attainment equation and the errorof the selection equation, is nonzero. In the IV regression of earnings, we conduct a“C test” of endogeneity (which is similar to a Hausman test, but allows for clusteringof the standard errors; Baum, Schaffer, & Stillman, 2007) to determine whether theIV estimate differs significantly from an ordinary least squares (OLS) estimate. Forthe bivariate probit, the correlation between error of the regression equation andthe error of the selection equation (measured by rho) is not statistically significantfor high school graduation or for college persistence. Similarly, the C test results ina P-value of 0.70 and thus fails to reject the null hypothesis that the OLS estimateis consistent. Therefore, across three of the four outcomes, we fail to reject thenull hypothesis that high school choice (conditional on attending a charter middleschool and all the controls for observables) is exogenous. Put differently, we findno evidence that unobservable factors driving high school choice are affecting highschool graduation, college persistence, or earnings. We therefore rely upon ourmatched analysis as our primary results and present the bivariate probit and IVestimates as a robustness check (we present further details of the bivariate and IVapproach in the Appendix including the first stage results and the results from theexclusion-restriction test).22
Table 6 presents the IV estimates of the impact of charter school attendanceon each of the four primary outcomes. In each case, the bivariate estimates forthe educational attainment outcomes point in the same direction as the originalmatching estimates presented in Table 3, but are larger in magnitude and lessprecise (though still statistically significant at conventional levels for high schoolgraduation and college attendance). For the earnings outcome, again, we obtainan estimate that is also somewhat larger in magnitude than the earnings results inTable 4, but is less precise.
In sum, the two sets of sensitivity analyses designed to account for unobservablestudent characteristics each provide further support for our primary results pre-sented in Tables 3 and 4. For the geographically restricted matching approach, wefound positive and statistically significant estimates for the educational attainmentoutcomes and earnings estimate of similar magnitude to that from our primaryanalysis, but which was statistically insignificant. For the bivariate probit and IV es-timates, we found estimates of larger magnitudes but which were less precise. In thecases where the bivariate probit and IV estimates were not statistically significant,we fail to reject the null of exogenous high school choice (conditional on observablecontrols).
CONCLUSION
In previous work, we produced evidence that charter high school attendance haspositive effects on the probability of graduating from high school and enteringcollege (Booker et al., 2011). Enough time has now passed that the same cohorts
22 All appendices are available at the end of this article as it appears in JPAM online. Go to the publisher’sWeb site and use the search engine to locate the article at http://onlinelibrary.wiley.com.
Journal of Policy Analysis and Management DOI: 10.1002/pamPublished on behalf of the Association for Public Policy Analysis and Management

Charter High Schools’ Effects on Long-Term Attainment and Earnings / 19
Table 6. Bivariate probit/two stage least squares (2SLS) model estimates of the effects ofcharter high school attendance on educational attainment and earnings (coefficient estimatesare marginal effects).
Estimation method Estimate
Endogeneity test(test of rho = 0;
C test = 0)
Receiving a standard high school diploma (within five years)Matched estimate 0.061**
(0.020)Bivariate probit estimate 0.154** χ2(1) = 3.300
(0.054) P-value = 0.069Attending a two- or four-year college (within six years)
Matched estimate 0.088**
(0.026)Bivariate probit estimate 0.251** χ2(1) = 4.184
(0.065) P-value = 0.041Persist in any college at least two consecutive years—unconditional
Matched estimate 0.062**
(0.031)Bivariate probit estimate 0.146 χ2(1) = 0.150
(0.095) P-value = 0.698Maximum earnings 10 to 12 years maximum annual earnings 10, 11, or 12 years since
beginning grade 8 (full sample with county fixed effects)Matched estimate 2,318.36*
(1,162.11)Two-stage least squares 2,861.60 χ2(1) = 0.099Estimate (2,209.24) P-value = 0.753
Notes: †significant at 10 percent; *significant at 5 percent; **significant at 1 percent. Standard errorsadjusted for clustering at the school level are in parentheses. Coefficient estimates from bivariate probitsare marginal effects. For the bivariate probit estimates, the reported standard errors equal the marginaleffects divided by the bivariate probit z-scores (adjusted for clustering at the school level).
of students in Florida have had the opportunity to enroll in college for multipleyears and to begin careers. In this paper, we use a similar approach as Bookeret al. (2011)—relying on a restricted sample of students who were all (treatment andcomparison group alike) enrolled in a charter school in eighth grade to estimatethe relationship between attending a charter high school on educational attainmentand earnings in adulthood. As in Booker et al., we find that attendance at Floridacharter high schools is associated with both higher high school graduation andcollege attendance rates. Going beyond Booker et al., we also find that attendanceat a charter high school is associated with a higher likelihood of persisting in collegefor at least two years. More importantly, we also examine data on the subsequentearnings of students in our analytic sample, at a point after they could have earnedcollege degrees. In our primary analysis, charter high school attendance is associatedwith an increase in maximum annual earnings for students between ages 23 and 25of $2,318—or about 12 percent higher earnings than for comparable students whoattended a charter middle school but matriculated to a traditional high school.
To gauge the robustness of our results, we conduct a number of alternative anal-yses, including matching on observable characteristics, limiting the control groupto students who did not have a charter school near to them and using the prox-imity of different types of high schools as instruments for attending a charter highschool. In nearly all of the sensitivity analyses our estimates of the impacts of charterattendance on attainment outcomes are robust. While our sensitivity analyses for
Journal of Policy Analysis and Management DOI: 10.1002/pamPublished on behalf of the Association for Public Policy Analysis and Management

20 / Charter High Schools’ Effects on Long-Term Attainment and Earnings
earnings generally produce point estimates that are similar to those from our pri-mary analysis, the estimates are not always statistically significant. Therefore, whilewe cannot completely rule out the possibility that the earnings estimates are biasedby self-selection into charter high schools, taken as a whole, our results suggestthat charter high schools in our sample had a positive effect on the later wages oftheir students. Whether the estimated positive effects of Florida charter high schoolattendance on educational attainment and earnings apply to a larger population ofcharter students, other jurisdictions, and other time periods must be left for furtherresearch.
The positive relationships between charter high school attendance and long-termoutcomes are striking, given that charter schools in the same jurisdiction have notbeen shown to have large positive impacts on Students’ test scores (Sass, 2006).23 Tothe degree that our findings hold up in a broader set of charter students, locations,and different analytical approaches,24 a natural question to ask is what is leadingto these positive associations for educational attainment and earnings. For initialcollege entry, it may be that these charter schools are merely providing better coun-seling and encouragement to apply and enroll. But that could not explain higherrates of persistence in college or higher earnings. It is possible that charter highschools are endowing their students with skills that are useful for success in collegeand career but that test scores do not capture. For example, successful charter highschools might be particularly good at promoting skills such as grit, persistence,self-control, and conscientiousness—skills that are not fully captured in test scoresbut that are critical for long-term outcomes (Duckworth & Allred, 2012; Duckworth,Tsukayama, & Geier, 2010; Romer et al., 2010; Tsukayama et al., 2010). While thereis anecdotal evidence that charter schools are trying to focus on these life skills, littlesystematic evidence yet exists to confirm this or to link these efforts to improvedlong-term outcomes. Further research is needed to test the hypothesis.
Further research is also needed to test whether our quasi-experimental findingsin Florida hold up in randomized experimental studies and in charter schools inother locations and with a broader set of charter students. Nonetheless, this earlyevidence of positive effects for these students on educational attainment and earn-ings in adulthood raises the question of whether charter schools’ full long-termimpacts on their students have been underestimated by studies that examine onlytest scores. More broadly, the findings suggest that research examining the efficacyof educational programs should examine a broader array of outcomes than juststudent achievement.
TIM R. SASS is a Distinguished University Professor at Georgia State University, 14Marietta Street, NW, Atlanta, GA 30303 (e-mail: [email protected]).
RON W. ZIMMER is an Associate Professor of Public Policy and Educa-tion at Vanderbilt University, 230 Appleton Place, Nashville, TN 37203 (e-mail:[email protected]).
23 Sass (2006) did not use our matching approach. However, we applied the same matching approachas used in this paper to examine test scores and found no statistically significant effect on test scores inreading and a significant negative effect in math.24 There are at least two other instances in which researchers have found similar patterns in the contextof school choice. Wolf et al. (2013) found no statistically significant effect on test scores for Washington,DC voucher recipients, but did find effects on high school graduation. Similarly, in an examination ofcharter schools in an anonymous district, Imberman (2011) found little effect on test scores, but largeeffects on attendance and behavioral outcomes.
Journal of Policy Analysis and Management DOI: 10.1002/pamPublished on behalf of the Association for Public Policy Analysis and Management
Charter High Schools’ Effects on Long-Term Attainment and Earnings / 21
BRIAN P. GILL is a Senior Fellow at Mathematica Policy Research, 955 MassachusettsAvenue, Suite 801, Cambridge, MA 02139 (e-mail: [email protected]).
KEVIN T. BOOKER is a Senior Researcher at Mathematica Policy Research, 7901Loma Alta Trail, McKinney, TX 75070 (e-mail: [email protected]).
ACKNOWLEDGMENTS
We wish to thank participants at the Association of Education, Finance and Policy and theAssociation of Public Policy and Management as well as seminar participants at StanfordUniversity, University of Southern California, University of Kentucky, and Vanderbilt Uni-versity. We also want to thank the staff of the Florida Department of Education’s EducationData Warehouse for their help in obtaining and interpreting the data used in this study. Fi-nally, funding for this research was provided by the Joyce Foundation as well as the Bill andMelinda Gates and Smith-Richardson Foundations as part of a grant to the Center for theAnalysis of Longitudinal Data in Education Research (CALDER). Any opinions or errors aresolely attributable to us, however.
REFERENCES
Abdulkadiroglu, A., Angrist, J. D., Dynarski, S. M., Kane, T. J., & Pathak, P. A. (2011). Ac-countability and flexibility in public schools: Evidence from Boston’s charters and pilots.Quarterly Journal of Economics, 126, 699–748.
Altonji, J. G., Elder, T. E., & Taber, C. (2005). Selection on observed and unobserved variables:Assessing the effectiveness of Catholic schools. Journal of Political Economy, 113, 151–184.
Angrist, J. D., Cohodes, S. R., Dynarski, S. M., Pathak, P. A., & Walters, C. D. (2013a). Charterschools and the road to college readiness: The effects on college preparation, attendanceand choice. Boston, MA: Boston Foundation and NewSchools Venture Fund.
Angrist, J. D., Pathak, P. A., & Walters, C. R. (2013b). Explaining charter school effectiveness.American Economic Journal: Applied Economics, 5, 1–27.
Augurzky, B., & Schmidt, C. M. (2001). The propensity score: A means to an end. DiscussionPaper No. 271. Bonn, Germany: Institute for the Study of Labor.
Baum, C. F., Schaffer, M. E., & Stillman, S. (2007). Enhanced routines for instrumentalvariables/generalized method of moments estimation and testing. Stata Journal, 7, 465–506.
Berkner, L., & Choy, S. (2008). Descriptive summary of 2003-04 beginning postsecondary stu-dents: Three years later. NCES 2008–174. Washington, DC: U.S. Department of Education,Institute of Education Sciences, National Center for Education Statistics.
Bettinger, E. P., Long, B. T., Oreopoulos, P., & Sanbonmatsu, L. (2012). The role of simplifica-tion and information in college decisions: Results from the H&R Block FAFSA experiment.Quarterly Journal of Economics, 127, 1205–1242.
Bifulco, R. (2012). Can nonexperimental estimates replicate estimates based on randomassignment in evaluations of school choice? A within-study comparison. Journal of PolicyAnalysis and Management, 31, 729–751.
Bifulco, R., & Ladd, H. F. (2006). The impact of charter schools on student achievement:Evidence from North Carolina. Journal of Education Finance and Policy, 1, 50–90.
Bifulco, R., Cobb, C., & Bell, C. (2009). Can interdistrict choice boost achievement: Evidencefrom Connecticut’s interdistrict magnets. Educational Evaluation and Policy Analysis, 31,323–345.
Bloom, H., & Unterman, R. (2013). Sustained progress: New findings about the effectivenessand operation of small public high schools of choice in New York City. New York, NY:MDRC. Retrieved August 28, 2013, from http://www.mdrc.org/sites/default/files/sustained_progress_FR_0.pdf.
Journal of Policy Analysis and Management DOI: 10.1002/pamPublished on behalf of the Association for Public Policy Analysis and Management

22 / Charter High Schools’ Effects on Long-Term Attainment and Earnings
Booker, T. K., Gilpatric, S. M., Gronberg, T. J., & Jansen, D. W. (2007). The impact of charterschool student attendance on student performance. Journal of Public Economics, 91, 849–876.
Booker, T. K., Sass, T., Gill, B., & Zimmer, R. (2009). Achievement and attainment inChicago charter schools. Santa Monica, CA: RAND. Retrieved October 10, 2014, fromhttp://lbr.rand.org/content/dam/rand/pubs/technical_reports/2009/RAND_TR585-1.pdf.
Booker, K., Sass, T., Gill, B., & Zimmer, R. (2011). The effects of charter high schools oneducational attainment. Journal of Labor Economics, 29, 377–415.
Brookhart, M. A., Schneeweiss, S., Rothman, K. J., Glynn, R. J., Avorn, J., & Sturmer, T.(2006). Variable selection for propensity score models. American Journal of Epidemiology,163, 1149–1156.
Butler, J. S., Carr, D., Toma, E. F., & Zimmer, R. (2013). Choice in a world of new schooltypes. Journal of Policy Analysis and Management, 32, 785–806.
Caliendo, M., & Kopeinig, S. (2008). Some practical guidance for the implementation ofpropensity score matching. Journal of Economic Surveys, 22, 31–72.
Chetty, R., Friedman, J.N., & Rockoff, J.E. (2014). Measuring the impacts of teachers II:Teacher value-added and student outcomes in adulthood. American Economic Review,104(9), 2633–2679.
Chingos, M. M., & Peterson, P. E. (2012). The effects of school vouchers on college enroll-ment: Experimental evidence from New York City. Washington, DC: Brown Center onEducation Policy at Brookings and Harvard Kennedy School Program on Education Policyand Governance.
Cook, T. D., Shadish, W. R., & Wong, V. C. (2008). Three conditions under which experimentsand observational studies produce comparable causal estimates: New findings from within-study comparisons. Journal of Policy Analysis and Management, 27, 724–750.
CREDO. (2009). Multiple choice: Charter school performance in 16 states. Stanford, CA:Author.
CREDO. (2013). National Charter school study, 2013. Stanford, CA: Author.
Davis, D. H., & Raymond, M. E. (2012). Choices for studying choice: Assessing charter schooleffectiveness using two quasi-experimental methods. Economics of Education Review, 31,225–236.
Day, J., & Newburger, E. C. (2002). The big payoff: Educational attainment and synthetic esti-mates of work-life earnings, Current Population Reports. Washington, DC: U.S. Census Bu-reau. Retrieved January 5, 2015, from http://www.census.gov/prod/2002pubs/p23-210.pdf.
Deming, D. J., Hastings, J. S., Kane, T. J., & Staiger, D. O. (2014). School choice, schoolquality, and postsecondary attainment. American Economic Review, 104, 991–1013.
Dobbie, W., & Fryer, R. G. Jr. (2013a). Getting beneath the veil of effective schools: Evidencefrom New York City. American Economic Journal: Applied Economics, 5, 28–60.
Dobbie, W., & Fryer, R. G. Jr. (2013b). The medium-term impacts of high-achieving charterschools on non-test score outcomes. Working Paper. Princeton, NJ: Princeton University.
Duckworth, A. L., & Allred, K. M. (2012). Temperament in the classroom. In R. L. Shiner& M. Zentner (Eds.), Handbook of temperament (pp. 627–644). New York, NY: GuilfordPress.
Duckworth, A. L., Tsukayama, E., & Geier, A. B. (2010). Self-controlled children stay leanerin the transition to adolescence. Appetite, 54, 304–308.
Evans, W. N., & Schwab, R. M. (1995). Finishing high school and starting college: Do Catholicschools make a difference. Quarterly Journal of Economics, 110, 941–974.
Furgeson, J., Gill, B., Haimson, J., Killewald, A., McCullough, M., Nichols-Barrer, I., & Lake,R. (2012). Charter-school management organizations: Diverse strategies and diverse stu-dent impacts. Cambridge, MA: Mathematica Policy Research.
Gleason, P., Clark, M., Tuttle, C. C., & Dwoyer, E. (2010). The evaluation of charter schoolimpacts: Final report. NCEE 2010–4029. Washington, DC: U.S. Department of Education,
Journal of Policy Analysis and Management DOI: 10.1002/pamPublished on behalf of the Association for Public Policy Analysis and Management

Charter High Schools’ Effects on Long-Term Attainment and Earnings / 23
Institute of Education Sciences, National Center for Education Evaluation and RegionalAssistance.
Glomm, G., Harris, D., & Lo, T. (2005). Charter school location. Economics of EducationReview, 24, 451–57.
Grogger, J., & Neal, D. (2000). Further evidence on the effects of Catholic secondary schooling.Brookings-Wharton Papers on Urban Affairs (pp. 151–201). Washington, D.C.: BrookingsInstitution Press.
Hanushek, E. A., Kain, J. F., Rivkin, S. G., & Branch, G. F. (2007). Charter school quality andparental decision making with school choice. Journal of Public Economics, 91, 823–848.
Harris, D. N., & Larsen, M. (2015). What schools do families want (and why?). TechnicalReport. Tulane University, New Orleans, LA: Education Research Alliance for New Orleans.
Heckman, J. J. (1979). Sample selection bias as a specification error. Econometrica, 47,153–161.
Hoxby, C. M., & Murarka, S. (2007). Charter schools in New York City: Who en-rolls and how they affect their students’ achievement. Cambridge, MA: National Bu-reau of Economic Research. Retrieved November 5, 2008, from http://www.nber.org/�schools/charterschoolseval/nyc_charter_schools_technical_report_july2007.pdf.
Hoxby, C. M., & Rockoff, J. E. (2004). The impact of charter schools on student achievement.Unpublished paper. Harvard University, Cambridge, MA: Department of Economics.
Imberman, S. A. (2011). Achievement and behavior in charter schools: Drawing a morecomplete picture. Review of Economics and Statistics, 93, 416–435.
Lee, D. S. (2009). Training, wages, and sample selection: Estimating sharp bounds on treat-ment effects. Review of Economic Studies, 76, 1071–1102.
Neal, D. (1997). The effects of Catholic secondary schooling on educational achievement.Journal of Labor Economics, 15, 98–123.
Richburg-Hayes, L., Brock, T., LeBlanc, A., Paxson, C. H., Rouse, C. E., & Barrow, L.(2009). Rewarding persistence: Effects of a performance-based scholarship program forlow-income parents (Academic). MDRC, New York, NY. Retrieved on December 15, 2015,from http://www.mdrc.org/sites/default/files/Rewarding%20Persistence%20ES.pdf.
Romer, D., Duckworth, A. L., Sznitman, S., & Park, S. (2010). Can adolescents learn selfcontrol? Delay of gratification in the development of control over risk taking. PreventionScience, 11, 319–330.
Rosenbaum, P. R., & Rubin, D. B. (1983). The central role of the propensity score in obser-vational studies for causal effects. Biometrica, 70, 41–50.
Rubin, D. B. (1977). Assignment to treatment group on the basis of a covariate. Journal ofEducational Statistics, 2, 1–26.
Sander, W., & Krautman, A. C. (1995). Catholic schools, dropout rates and educational at-tainment. Economic Inquiry, 33, 217–233.
Sass, T. R. (2006). Charter schools and student achievement in Florida. Education Financeand Policy, 1, 91–122.
Smith, J. A., & Todd, P. E. (2001). Reconciling conflicting evidence on the performance ofpropensity-score matching methods. American Economic Review, 91, 112–118.
Tsukayama, E., Toomey, S. L., Faith, M., & Duckworth, A. L. (2010). Self-control as a protec-tive factor against overweight status in the transition to adolescence. Archives of Pediatricsand Adolescent Medicine, 164, 631–635.
Tuttle, C., Bing-ru, T., Nichols-Barrer, I., Gill, B. P., & Gleason, P. (2010). Student character-istics and achievement in 22 KIPP middle schools. Washington, DC: Mathematica PolicyResearch.
Tuttle, C. T., Gleason, P., & Clark, M. (2012). Using lotteries to evaluate schools of choice:Evidence from a national study of charter schools. Economics of Education Review, 31,237–253.
Journal of Policy Analysis and Management DOI: 10.1002/pamPublished on behalf of the Association for Public Policy Analysis and Management
24 / Charter High Schools’ Effects on Long-Term Attainment and Earnings
Tuttle, C. T., Gill, B., Gleason, P., Knechtel, V., Nichols-Barrer, I., & Resch, A. (2013). KIPPmiddle schools: Impacts on achievement and other outcomes. Washington, DC: Mathemat-ica Policy Research.
Wolf, P. J., Kasida, B., Gutmann, B., Puma, M., Eissa, N., & Rizzo, L. (2013). School vouchersand student outcomes: Experimental evidence from Washington, DC. Journal of PolicyAnalysis and Management, 32, 246–270.
Zimmer, R., & Buddin, R. (2006). Charter school performance in urban districts. Journal ofUrban Economics, 60, 307–326.
Zimmer, R., & Engberg, J. (2016). Can broad inferences be drawn from lottery analyses ofschool choice programs? An exploration of appropriate sensitivity analyses. School ChoiceJournal, 10(1), 48–72.
Zimmer, R., Buddin, R., Chau, D., Gill, B., Guarino, C., Hamilton, L., & Brewer, D. (2003).Charter school operation and performance: Evidence from California. MR-1700. SantaMonica, CA: RAND.
Zimmer, R., Gill, B., Booker, K., Lavertu, S., Sass, T., & Witte, J. (2009). Charter schools ineight states: Effects on achievement, attainment, integration, and competition. MG–869.Pittsburgh, PA: RAND.
Zimmer, R., Gill, B., Booker, K., Lavertu, S., & Witte, J. (2012). Examining charter schoolachievement in seven states. Economics of Education Review, 31, 213–224.
Zimmer, R., Gill, B., Attridge, J., & Obenauf, K. (2014). Charter school authorizers and studentachievement. Education, Finance, and Policy, 9, 59–85.
Journal of Policy Analysis and Management DOI: 10.1002/pamPublished on behalf of the Association for Public Policy Analysis and Management

Charter High Schools’ Effects on Long-Term Attainment and Earnings
APPENDIX
DETAILS OF THE BIVARIATE PROBIT AND IV APPROACHES
Here, we provide further details of bivariate probit and IV approach used as sen-sitivity analyses, including the first stage results and our results from the exclusiontest.
Determinants of High School Choice
Whether one attends a charter school could be a function of parental/student pref-erences, as well proximity to school alternatives, including charter, private, andtraditional public schools (Butler et al., 2013). Most private schools predate char-ters in our sample, and competition from private schools likely had an impact onthe operation of traditional public schools even before charters came on the scene.Similarly, charter school entrants would likely take into account the availability andcharacteristics of nearby private schools when designing their schools. In a simpleproduct variety model of competition, private schools would initially offer a mix ofattributes that differs significantly from that of traditional public schools. If char-ters enter an environment with significant private school penetration, they wouldtend to locate “closer” to traditional public schools in product attribute space thanif no private-school competitors existed.25 Therefore, we would expect that, in areaswhere there is vibrant competition from private high schools, students would beless likely to choose a charter high school over a traditional high school because thecharters would be more similar to the traditional public schools.26
We measure the physical proximity of other charter high schools by the minimumlinear distance from a student’s eighth-grade charter to a different charter schooloffering grade 9 and by the number of other charter high schools within variousradii. Similarly, we capture the time cost of attending a traditional public schoolby the distance to the nearest traditional public high school. Because traditionalpublic school students usually are assigned based on residential location, we donot include a count of the number of nearby traditional public high schools. Onefactor that would affect whether a student attends a charter school for high schoolis whether the middle school the student is currently attending offers high schoolgrades, including grade 9. In this case, the distance would be zero.
In Table A1, we present probit estimates of the choice of attending a charter schoolin grade 9 as a function of both the grade offerings of a student’s middle school andthe availability of other school alternatives. We measure the grade configurationsof charter schools by an indicator for whether or not a student’s grade 8 charterschool offered grade 9 in the year after the student attended eighth grade. As onewould expect, the availability of ninth grade in the same school a student attendedin eighth grade has a large positive impact on the likelihood of attending a charterschool in grade 9. The availability of ninth grade in the same school raises theprobability of attending a charter high school by 31 percentage points. Holding
25 Glomm, Harris, and Lo (2005) also use a product differentiation approach and similar reasoning toempirically analyze the location decisions of charter schools.26 Depending on the size of the private sector and the distribution of consumer preferences, chartersmay choose to adopt attributes similar to those of private schools. We would, however, expect charters tobe at least somewhat more similar to publics than are privates to publics. If public schools responded topreexisting private school competition by making their product “closer” to the offerings of privates, therewould be less “distance” between publics and privates, which would also reduce the expected enrollmentin charters.
Journal of Policy Analysis and Management DOI: 10.1002/pamPublished on behalf of the Association for Public Policy Analysis and Management

Charter High Schools’ Effects on Long-Term Attainment and Earnings
Table A1. Probit estimates of attending a charter high school in grade 9, based on minimumdistance and number of schools of given type within five miles offering grade 9 in relevantyear (coefficient estimates are marginal effects).
Distance to nearest traditional public school 0.0041(0.0206)
Distance to nearest other charter −0.0029(0.0037)
Eighth-grade charter offers grade 9 0.3126*
(0.1589)Number of other charters 0.0490
(0.0479)Number of private schools −0.0395
*
(0.0218)
Observations 4,216Pseudo R-squared 0.27
Notes: †significant at 10 percent; * significant at 5 percent; ** significant at 1 percent. Standard errorsadjusted for clustering at the school level are in parentheses.
constant the number of charter schools within a given area, an increase in thedistance to the nearest charter high school decreases the likelihood of attending acharter high school, as one would expect, although the estimates are imprecise andnever statistically significant. Similarly, as expected, increases in the distance to thenearest traditional public high school are positively correlated with the likelihoodof attending a charter school in grade 9, although (once again) the effects are notstatistically significant. Consistent with competition on product variety, the numberof private schools is negatively correlated with the probability of attending a charterschool in ninth grade.
The possibility exists that the determinants of high school choice also affect theoutcome of interest (educational attainment or earnings). For example, if combiningmiddle and high school grades improves student learning or fosters greater schoolattachment, then schools that offer both grades 8 and 9 may have positive effectson both the likelihood of attending a charter school in grade 9 and the probabilityof graduating from high school. In Table A2, we present Wald tests of exclusionrestrictions in the attainment and earnings equations for combinations of the ex-planatory variables used in the high school choice equation.27 The distance to thenearest charter school, the number of charter schools and the number of privateschools within five miles can be excluded from the graduation equation. For thecollege attendance equation, all of the variables predicting charter high school en-rollment can be excluded except for the number of charter schools within five miles.For both the unconditional college persistence equation and the earnings equationall determinants of charter high school choice can be excluded from the outcomeequation. All of the variables that are used to predict charter high school enrollment,
27 Formally, a test of exclusion restrictions requires an overidentified system where all instruments arevalid. However, it is common practice in the empirical literature to conduct the sort of informal tests weuse here.
Journal of Policy Analysis and Management DOI: 10.1002/pamPublished on behalf of the Association for Public Policy Analysis and Management

Charter High Schools’ Effects on Long-Term Attainment and Earnings
Table A2. Wald tests of exclusion restrictions in attainment equations.
Model/exclusion Chi-squared (df) Prob. value
High school graduation 24.85 0.0001—All variables (5)High school graduation 17.09 0.0019—All variables except distance to nearest
traditional public school(4)
High school graduation 24.58 0.0001—All variables except distance to nearest other
charter school(4)
High school graduation 22.76 0.0001—All variables except G8 charter offers grade 9 (4)High school graduation 24.22 0.0001—All variables except number of other charters (4)High school graduation 19.92 0.0005—All variables except number of private schools (4)High school graduation 11.80 0.0081—G8 charter offers G9, number of other charters,
number of privates(3)
High school graduation 7.62 0.0545—Distance to nearest other charter, number of
other charters, number of privates(3)
High school graduation 12.29 0.0064—Distance to nearest other charter, G8 charter
offers G9, number of privates(3)
High school graduation 16.42 0.0009—Distance to nearest other charter, G8 charter
offers G9, number of other charters(3)
High school graduation 22.65 0.0000—Distance to nearest traditional, number of other
charters, number of privates(3)
High school graduation 24.20 0.0000—Distance to nearest traditional, G8 charter
offers G9, number of privates(3)
High school graduation 18.46 0.0004—Distance to nearest traditional, G8 charter
offers G9, number of other charters(3)
High school graduation 22.73 0.0000—Distance to nearest traditional, distance to
nearest other charter, number of privates(3)
High School Graduation 16.55 0.0009—Distance to nearest traditional, distance to
nearest other charter, number of other charters(3)
High school graduation 17.82 0.0000—Distance to nearest traditional, distance to
nearest other charter, G8 charter offers G9(3)
College attendance 15.47 0.0085—All variables (5)College attendance 12.99 0.0113—All variables except distance to nearest
traditional public school(4)
College attendance 11.44 0.0220—All variables except distance to nearest other
charter school(4)
Journal of Policy Analysis and Management DOI: 10.1002/pamPublished on behalf of the Association for Public Policy Analysis and Management

Charter High Schools’ Effects on Long-Term Attainment and Earnings
Table A2. Continued.
Model/exclusion Chi-squared (df) Prob. value
College attendance 15.45 0.0039—All variables except G8 charter offers grade 9 (4)College attendance 6.43 0.1695—All variables except number of other charters (4)Persist in college at least two years
(unconditional)9.34 0.0964
—All variables (5)Persist in college at least two years (conditional on
attending college)15.22 0.0095
—All variables (5)Persist in college at least two years (conditional on
attending college)10.88 0.0279
—All variables except distance to nearesttraditional public school
(4)
Persist in college at least two years (conditional onattending college)
13.43 0.0094
—All variables except distance to nearest othercharter school
(4)
Persist in college at least two years (conditional onattending college)
8.01 0.0914
—All variables except G8 charter offers grade 9 (4)Persist in college at least two years (conditional on
attending college)14.92 0.0049
—All variables except number of other charters (4)Persist in college at least two years (conditional on
attending college)15.21 0.0043
—All variables except number of private schools (4)Maximum earnings 10 to 12 years after grade 8 1.58 0.1660—All variables (5)
except for offering grade 9, can be excluded from the conditional college persistenceequation.
Journal of Policy Analysis and Management DOI: 10.1002/pamPublished on behalf of the Association for Public Policy Analysis and Management
Related Documents