Saskia Ossen, and Piet Daas Introduction in the Data hyperdimension

Saskia Ossen, and Piet Daas Introduction in the Data hyperdimension.
Dec 24, 2015
Welcome message from author
This document is posted to help you gain knowledge. Please leave a comment to let me know what you think about it! Share it to your friends and learn new things together.
Transcript

Saskia Ossen, and Piet Daas
Introduction in the Data hyperdimension

Purpose of the module
- Introduction in Data hyperdimension
- Introduction of indicators for data evaluation (implemented in R software package)• Developed within European BLUE ETS project• Theory and practical examples• Group exercise in which groups determine whether a source
should be used based on the results for the data hyperdimension.
- Introduction of Quality Report Card

Data: quality of the input
– Input quality of administrative data• After evaluation of Source and Metadata hyperdimension
– Data hyperdimension studies• Quality of the facts (values) in the source• Data are part of every delivery!
• Time needed for evaluation is a serious issue• Evaluate every delivery thoroughly?• Evaluation may differ depending on the use intended (output)• Relation with process (availability and quality of other data sources)
Essential pre-requisites and considerations
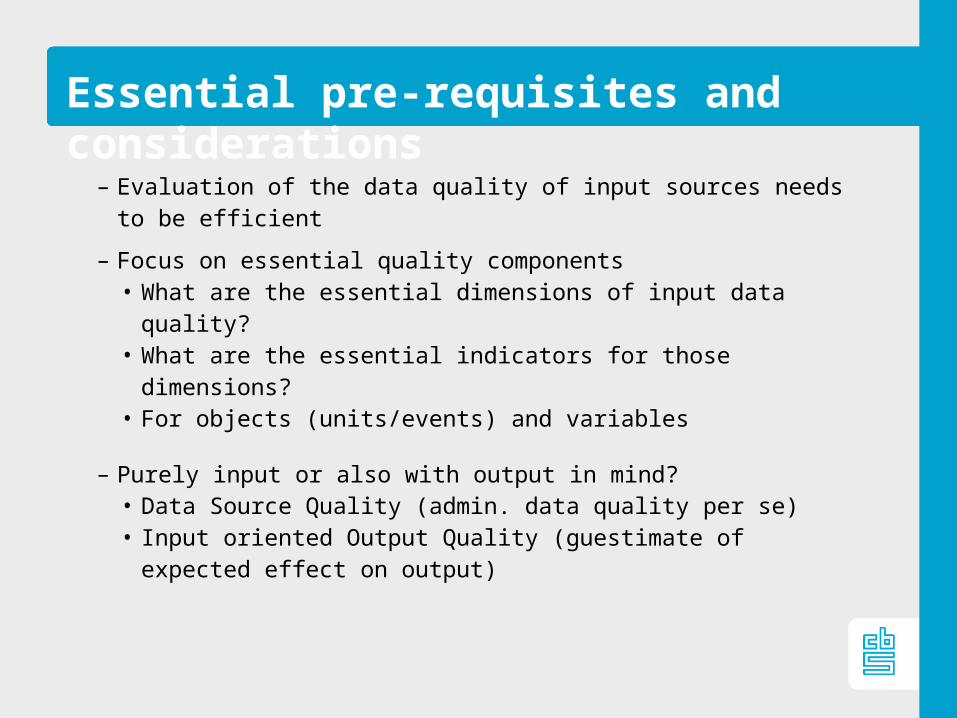
– Evaluation of the data quality of input sources needs to be efficient
– Focus on essential quality components• What are the essential dimensions of input data quality?• What are the essential indicators for those dimensions?• For objects (units/events) and variables
– Purely input or also with output in mind?• Data Source Quality (admin. data quality per se)• Input oriented Output Quality (guestimate of expected effect
on output)
Essential dimensions of input data quality
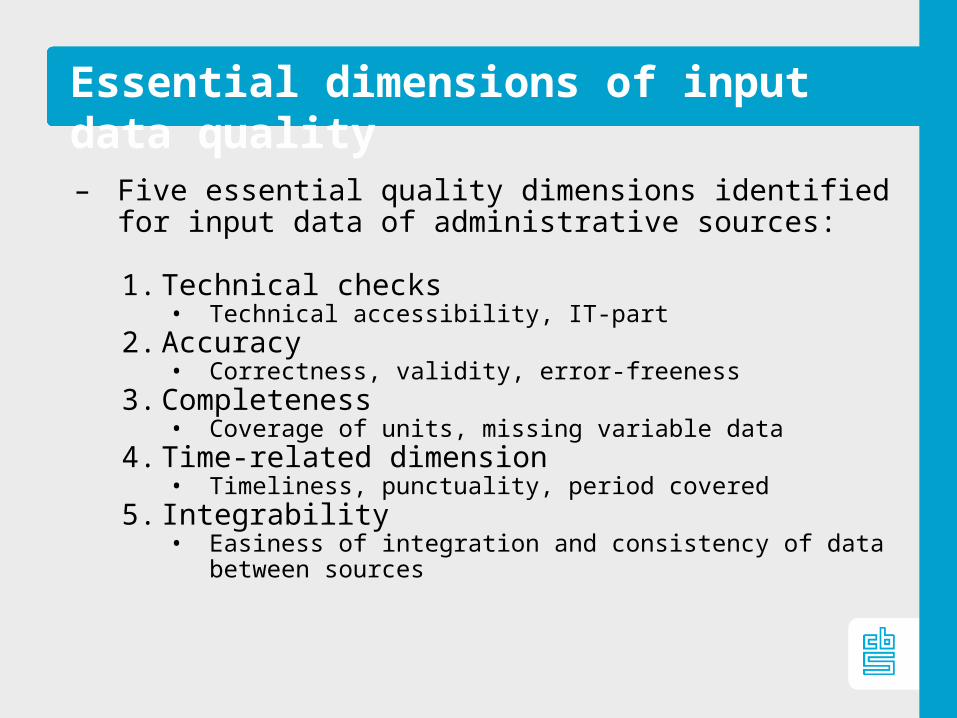
– Five essential quality dimensions identified for input data of administrative sources:
1. Technical checks• Technical accessibility, IT-part
2. Accuracy• Correctness, validity, error-freeness
3. Completeness• Coverage of units, missing variable data
4. Time-related dimension• Timeliness, punctuality, period covered
5. Integrability• Easiness of integration and consistency of data between sources

Technical checks: Theory
Indicators Description 1. Technical checks Technical usability of the file and data in the file
1.1 Readability Accessability of the file and data in the file
1.2 File declaration Compliance of the data in the file to the metadata compliance agreements
1.3 Convertability Conversion of the file to the NSI-standard format
Technical checks dimension

Technical checks: Examples
– Very important for new sources, becomes somewhat less essential later on‐ Corrupt files‐ Encoded files of which decoding password is missing‐ Files of which the data is not compliant to the metadata
description‐ Files with errors during/after conversion
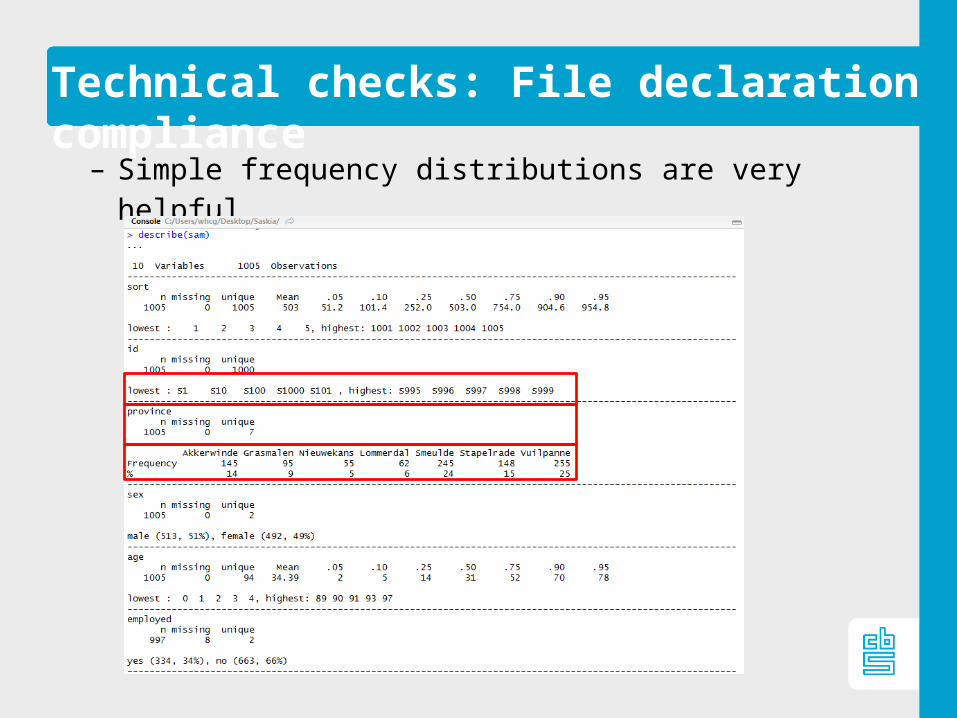
Technical checks: File declaration compliance
– Simple frequency distributions are very helpful
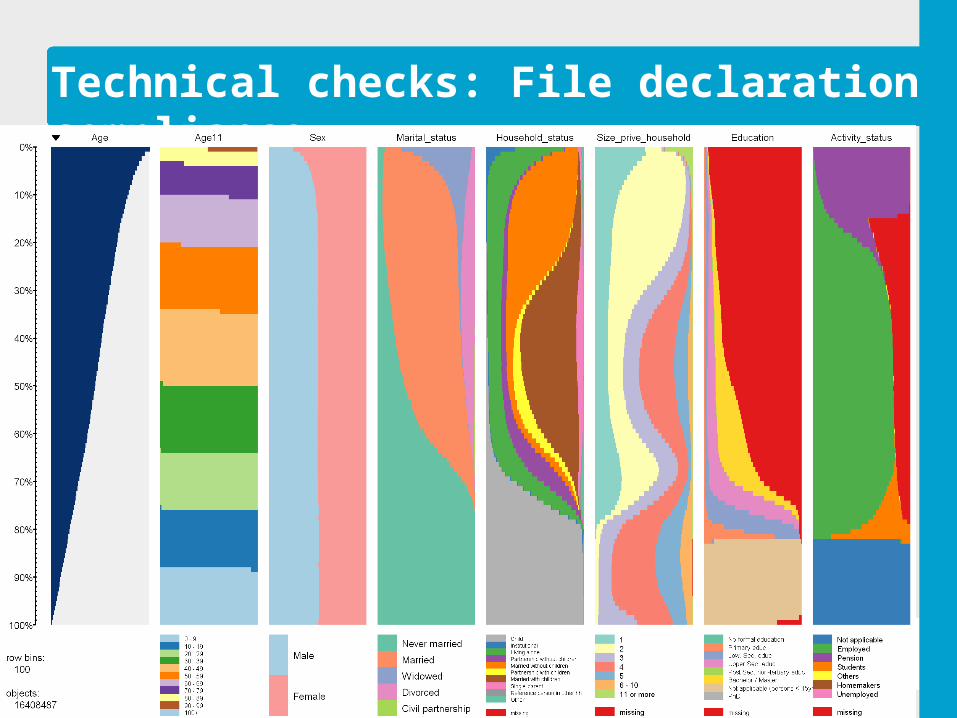
Technical checks: File declaration compliance

Accuracy: Theory
Indicators Description
2. Accuracy The extent to which data are correct, reliable, and certified
Objects 2.1 Authenticity Legitimacy of objects 2.2 Inconsistent objects Extent of erroneous objects in source 2.3 Dubious objects Presence of untrustworthy objects
Variables 2.4 Measurement errors Deviation of actual data value from ideal error-free
measurements 2.5 Inconsistent values Extent of inconsistent combinations of variable values 2.6 Dubious values Presence of implausible values or combinations of
values for variables
Accuracy dimension
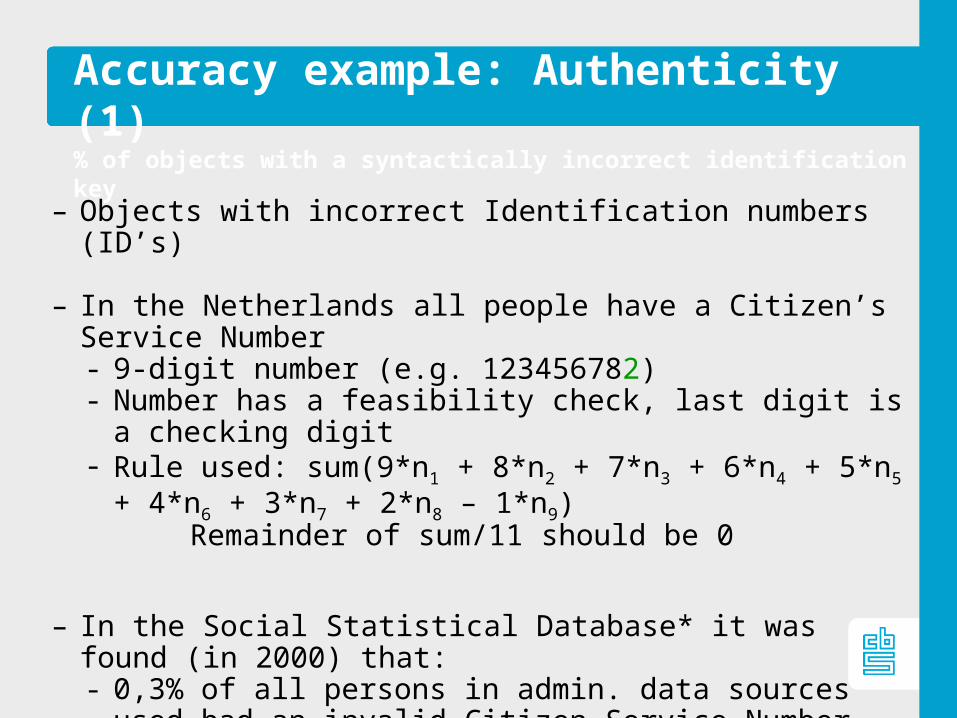
– Objects with incorrect Identification numbers (ID’s)
– In the Netherlands all people have a Citizen’s Service Number‐ 9-digit number (e.g. 123456782)‐ Number has a feasibility check, last digit is a checking digit‐ Rule used: sum(9*n1 + 8*n2 + 7*n3 + 6*n4 + 5*n5 + 4*n6 + 3*n7 +
2*n8 – 1*n9)Remainder of sum/11 should be 0
– In the Social Statistical Database* it was found (in 2000) that:‐ 0,3% of all persons in admin. data sources used had an invalid
Citizen Service Number
*set of integrated admin. data sources and surveys (then ~100 million admin records) Arts et al. (2000) Netherlands Official Statistics 15, pp. 16-22.
Accuracy example: Authenticity (1)% of objects with a syntactically incorrect identification key
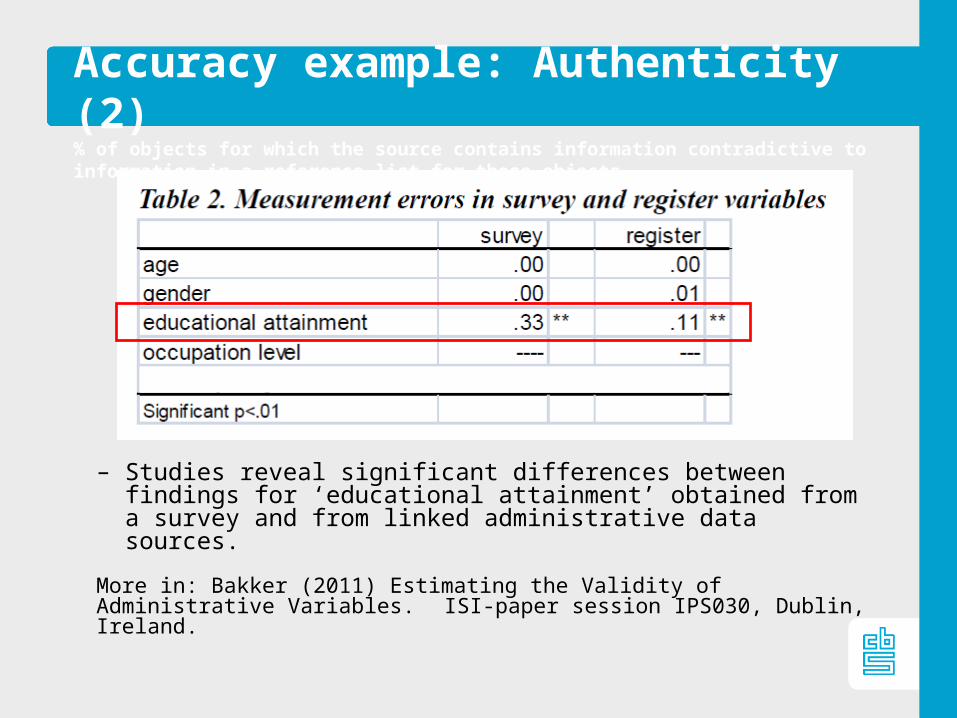
Accuracy example: Authenticity (2)% of objects for which the source contains information contradictive to information in a reference list for those objects
– Studies reveal significant differences between findings for ‘educational attainment’ obtained from a survey and from linked administrative data sources.
More in: Bakker (2011) Estimating the Validity of Administrative Variables. ISI-paper session IPS030, Dublin, Ireland.
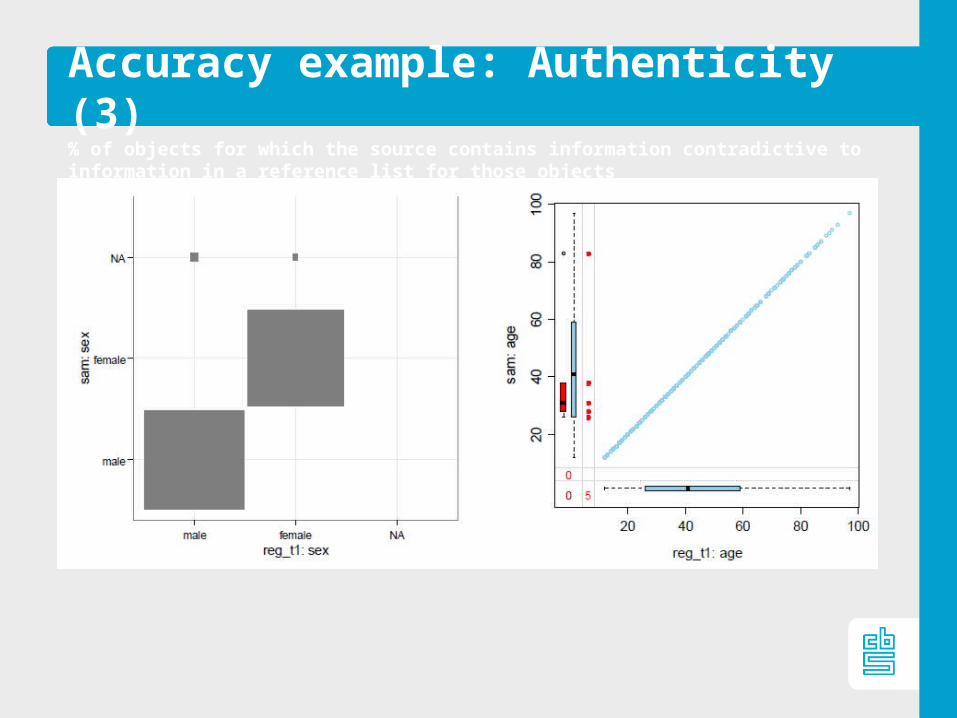
Accuracy example: Authenticity (3)% of objects for which the source contains information contradictive to information in a reference list for those objects

Accuracy example: Inconsistent objects
Rule: a person is part of exactly one household

Accuracy example: Dubious valuesCross tabulation of the variable “Current activity status” versus age group

Completeness: Theory
Indicators Description
3. Completeness Degree to which a data source includes data describing the corresponding set of real-world objects and variables
Objects 3.1 Undercoverage Absence of target objects (missing objects) in the source 3.2 Overcoverage Presence of non-target objects in the source 3.3 Selectivity Statistical coverage and representativity of objects 3.4 Redundancy Presence of multiple registrations of objects
Variables 3.5 Missing values Absent values for (key) variables
3.6 Imputed values Presence of values resulting from imputation actions by data source holder
Completeness dimension

Completeness example: Selectivity (1)

Completeness example: Selectivity (2)
The education register has age-related undercoverage of educational attainment (56,3% is missing)
Explanation:1) Children <15 age have a known level of education2) Level of education of young adults is usually stored in recently created admin. data sources 3) Information from ‘middle-aged’ people is obtained from LFS-survey (small compared to admin. data info)4) Information of ‘elderly’ people (≥65 year) almost completely missing (not surveyed and hardly registered)

Pre-evaluation and input quality of administrative data sources (Part 2)
Completeness example: Selectivity (3)

Time related: Theory
Indicators Description 4. Time-related dimension Indicators that are time and/or stability related
4.1 Timeliness Lapse of time between the end of the reference period and the moment of receipt of the data source
4.2 Punctuality Possible time lag between the actual delivery date of the source and the date it should have been delivered
4.3 Overall time lag Overall time difference between the end of the reference period and the moment it is concluded that it can definitely be used
4.4 Delay Extent of delays in registrationObjects
4.5 Dynamics of objects Changes in the population of objects (new and dead objects) over time
Variables 4.6 Stability of variables Changes of variables or values over time
Time-related dimension
Time-related example: Delay
– Events recorded some time after they have occurred• Events are missing (or erroneously recorded)• Particularly important for sources used immediately
– Examples:• Marriages contracted in immigrants’ country of origin are
sometimes recorded two or three years after the event (Bakker et al. AIOS-paper 2008)
• Part of VAT-data is reported later than is needed for monthly estimates (Vlag, ISI-paper 2011)

Time-related example: Stability of variables (1)
Type of comparison used in the Dutch Short term Statistics

Time-series for a single company
Time-related example: Stability of variables (2)

Integrability: Theory
Indicators Description 5. Integrability Extent to which the data source is capable of
undergoing integration or of being integrated.Objects 5.1 Comparability of objects Similarity of objects in source -at the proper level of
detail- with the objects used by NSI 5.2 Alignment of objects Linking-ability (align-ability) of objects in source with
those of NSI
Variables 5.3 Linking variable Usefulness of linking variables (keys) in source 5.4 Comparability of variables Proximity (closeness) of variables
Integrability dimension

Integrability example: Alignment of objects
export
import
VAT-turnover (€)
ICP-
turn
over
(€)
Finding:- Differences between two admin.
Data sources (ICP and VAT) both used for International trade statistics
- Export aligns good but import is much more problematic!
Explanation:- ICP import units are difficult to
identify and can therefore not always by linked correctly
- ICP export data can be integrated well.
VAT-turnover (€)
ICP-
turn
over
(€)

Quality Report Card: Step 1 Indicator level
– Step 1: Determine one score per indicator

Quality Report Card: Step 2 Dimensional level
– Step 2: Determine one score per dimension

Quality Report Card: Step 3 General level
– Step 3: Determine a general score

Questions?
Any questions or comments?

Exercise
– Let’s try to interpret some data quality findings!– To ease the exercise, every indicator has a single score

Group exercise
– Participants will be split into groups and each group is provided with:‐ The Source, Metadata and Data results for the administrative
data source discussed in the previous exercise‐ An intended use
– Each group will be asked to discuss:‐ whether the data in the source could be used for the purpose
intended/• If yes, why is everything OK? • If not, what is the problem that prevents its use and how can
it be solved?
Related Documents