SAS 3: Comparing Means University of Guelph Revised June 2011

Welcome message from author
This document is posted to help you gain knowledge. Please leave a comment to let me know what you think about it! Share it to your friends and learn new things together.
Transcript

SAS 3:
Comparing Means
University of Guelph
Revised June 2011
SAS3 Workshop Notes © AME 2011
1
Table of Contents SAS Availability .............................................................................................................................. 2 Goals of the workshop ................................................................................................................... 2 Data for SAS sessions .................................................................................................................... 3 Statistical Background ................................................................................................................... 4 T-test ............................................................................................................................................. 8
1. Independent samples t-test ......................................................................................................................................................... 8 2. Paired samples t-test ................................................................................................................................................................ 12 3. One-Sample T-test .................................................................................................................................................................... 16
Analysis of Variance (ANOVA) ...................................................................................................... 19 Npar1way analysis ....................................................................................................................... 25 Appendix A: Revised SAS code and associated Output with a survey weight variable: ................. 32
1. Independent samples t-test: ...................................................................................................................................................... 32 2. Paired samples t-test: ............................................................................................................................................................... 33 3. One sample t-test: .................................................................................................................................................................... 35 4. Analysis of Variance – ANOVA .................................................................................................................................................... 36

SAS3 Workshop Notes © AME 2011
2
SAS Availability
Faculty, staff and students at the University of Guelph may access SAS three different ways:
1. Library computers
On the library computers, SAS is installed on all machines.
2. Acquire a copy for your own computer If you are faculty, staff or a student at the University of Guelph, you may obtain the site-licensed standalone copy of SAS at a cost. However, it may only be used while you are employed or a registered student at the University of Guelph. To obtain a copy, go to the CCS Software Distribution Site (www.uoguelph.ca/ccs/download).
3. Central statistical computing server
SAS is available in batch mode on the UNIX servers (stats.uoguelph.ca) or through X-Windows.
Goals of the workshop
This workshop builds on the skills and knowledge develop in "Getting your data into SAS". Participants are expected to have basic SAS skills and statistical knowledge. Specific goals of this workshop:
• Review statistical concepts: data types and associated tests • Decide which test is the most appropriate one to use based on the study and data being analyzed • Learn SAS coding and interpretation of three different t-tests analyses, the one-way ANOVA and the non-parametric equivalents • Pull together what you learned about Normality, transformations and ANOVA to conduct an analysis and report results.
SAS3 Workshop Notes © AME 2011
3
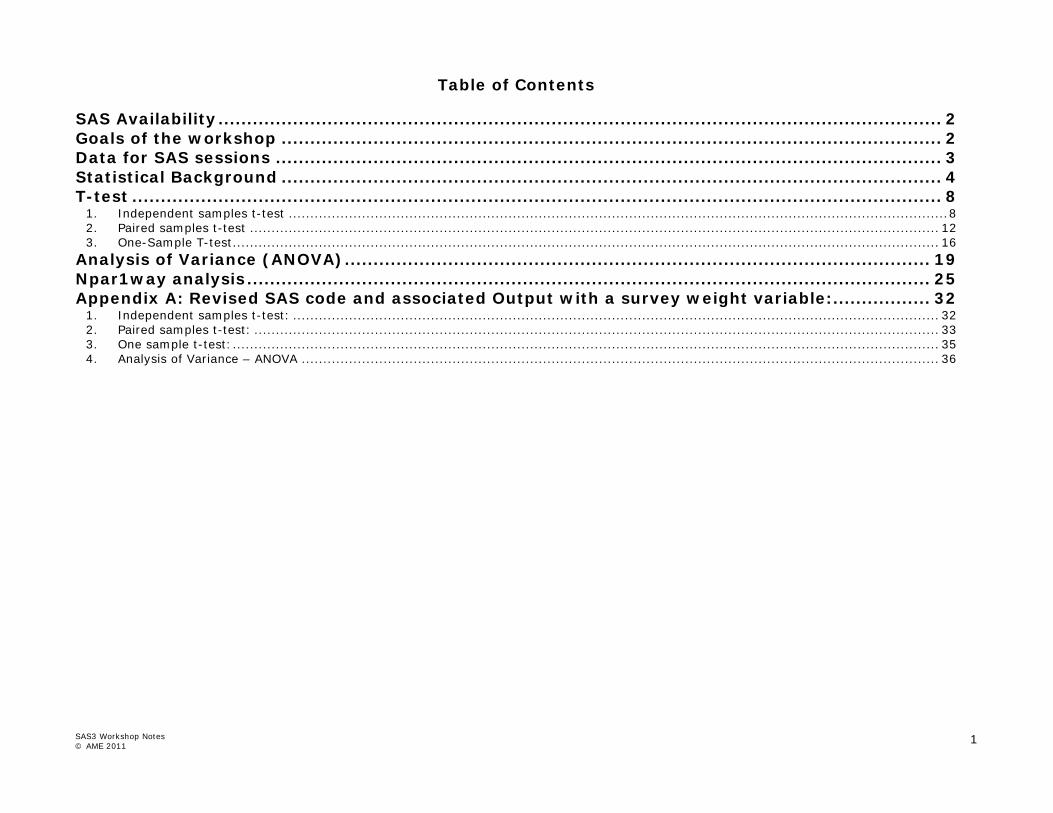
Data for SAS sessions
Dataset: Canadian Tobacco Use Monitoring Survey 2010 – Person File
This survey tracks changes in smoking status, especially for populations most at risk such as the 15- to 24-year-olds. It allows Health Canada to estimate smoking prevalence for the 15- to 24-year-old and the 25-and-older groups by province and by gender on a semi-annual basis.
The sample data used for this series of SAS workshops only includes respondents from the province of Quebec and only 14 of a possible 202 variables are being used.
To view the data, open the Excel spreadsheet entitled CTUMS_2010.xls Variable Name Label for Variable PUMFID Individual identification number PROV Province of the respondent DVURBAN Characteristic of the community HHSIZE Number of people in the household HS_Q20 Number of people that smoke inside the house DVAGE Age of respondent SEX Respondent’s sex DVMARST Grouped marital status of respondent PS_Q30 Age smoked first cigarette PS_Q40 Age begin smoking cigarettes daily WP_Q10A Number of cigarettes smoked – Monday WP_Q10B Number of cigarettes smoked – Tuesday WP_Q10C Number of cigarettes smoked – Wednesday WP_Q10D Number of cigarettes smoked – Thursday WP_Q10E Number of cigarettes smoked – Friday WP_Q10F Number of cigarettes smoked – Saturday WP_Q10G Number of cigarettes smoked – Sunday SC_Q100 What was the main reason you began to smoke again? WTPP Person weight (survey weight variable)

SAS3 Workshop Notes © AME 2011
4
Statistical Background
Types of Statistics
Two broad types of statistics exists which are descriptive and inferential. Descriptive statistics describe the basic characteristics of the data in a study. Usually generated through an Exploratory Data Analysis (EDA), they provide simple numerical and graphical summaries about the sample and the measures. Inferential statistics allows you to make conclusions regarding the data ie significant differences, relationships between variables, etc. Here are some examples of descriptive and inferential statistics:
Descriptives Inferential • Frequencies • Means • Standard Deviations • Ranges • Medians • Modes
• T-tests • Chi-squares • ANOVA • Friedman
Which test to perform on your data largely depends on a number of factors including:
1. What type of data you are working with?
2. Are you samples related or independent?
3. How many samples are you comparing?
Types of Variables
Variable types can be distinguished by various levels of measurement which are Nominal, Ordinal, Interval or Ratio. Nominal
Have data values that identify group membership. The only comparisons that can be made between variable values are equality and inequality. Examples of nominal measurement include gender, race, religious affiliation, telephone area codes or country of residence. Ordinal
Have data values arranged in a rank ordering with an unknown difference between adjacent values. Comparisons of greater and less can be made and in addition to equality and inequality. Examples include: results of a horse race, level of education or satisfaction/attitude questions.

SAS3 Workshop Notes © AME 2011
5
Interval
Are measured on a scale such that a one-unit change represents the same difference throughout the scale. These variables do not have true zero points. Examples include: temperature in the Celsius or Fahrenheit scale, year date in a calendar or IQ test results. Ratio
Have the same properties as interval variables plus the additional property of a true zero. Examples include: temperature measured in Kelvins, most physical quantities such as mass, length or energy, age, length of residence in a given place. Interval and Ratio will be considered identical thus yielding three types of measurement scales.
Parametric Tests versus Non-Parametric Tests
Parametric Tests are “techniques especially those involving continuous distributions, have stressed the underlying assumptions for which the techniques are valid. These techniques are for the estimation of parameters and for testing hypotheses concerning them.” (Steele et al., 1997) Non-Parametric Test “a considerable amount of data the underlying distribution is not easily specified. To handle such data, we need distribution-free statistics; that is, we need procedures that are not dependent on a specific parent distribution. If we do not specify the nature of the parent distribution, then we will not ordinarily deal with parameters. Non-parametric statistics compare distributions rather than parameters” (Steele et al., 1997)
Related versus Independent Samples
Related Samples
• Measures taken on the same individual or responses given by the same individual • For example:
o Scores provided by a panel of judges on several products o Survey responses o Measures taken pre and post treatment
Independent Samples
• Measures taken on a number of individuals • For example:
o Scores provided by people in a mall on a product o Measures on different treatments
SAS3 Workshop Notes © AME 2011
6
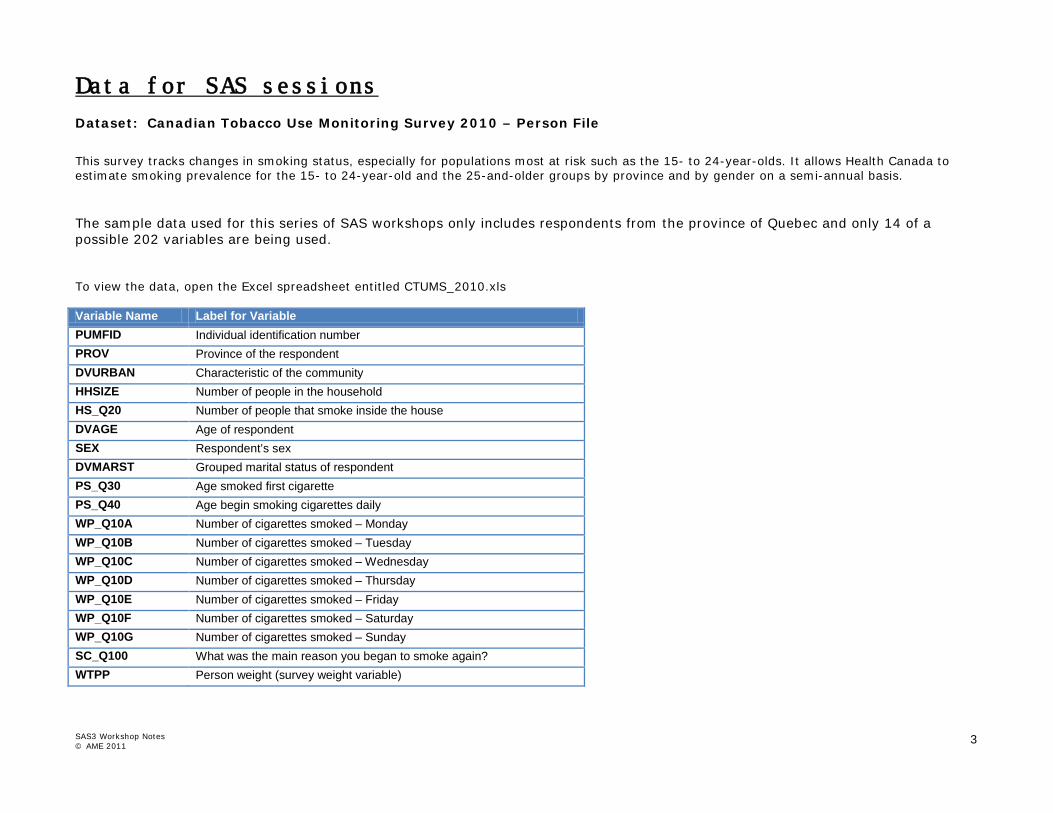
Choosing a statistical test
Comparing two groups
Independent Related
Nominal
Chi-square
McNemar Test
Ordinal
Mann-Whitney
Wilcoxon Rank Sums
Sign Test
Wilcoxon Test
Interval/Ratio/Scale/Continuous
Independent sample
T-test
Related sample
T-test

SAS3 Workshop Notes © AME 2011
7
Comparing more than Two Samples
Independent Related 2 or more factors Correlation
Nominal Chi-square Cochran Q-test
Ordinal Kruskal-Wallis Friedman 2-way ANOVA
Friedman 2-way ANOVA
Spearman’s Rank Correlation
Interval/Ratio/
Scale/Continuous
2+ factor ANOVA 2+ factor ANOVA 2+ factor ANOVA Pearson’s Product Correlation

SAS3 Workshop Notes © AME 2011
8
T-test
T-tests are used to test the null hypothesis that two population means are equal – that there are no differences between the two populations. There are three types of t-tests:
1. Independent sample t-test 2. Paired sample t-test 3. One-sample t-test
1. Independent samples t-test The independent samples t-test is also referred to as unpaired or unrelated samples t-test. It allows us to compare the means observed for one variable for two independent samples. Research Question: We are interested in determining whether there is a difference between the age at which females and males first smoked. Null hypothesis:
Ho : µfemales = µmales Alternate hypothesis:
Ha : µfemales ≠ µmales

SAS3 Workshop Notes © AME 2011
9
Exercise – Determining the appropriate test. Name
How many
levels? Type of data Related?
Independent Variable :
Dependent Variable :
What test?
SAS3 Workshop Notes © AME 2011
10
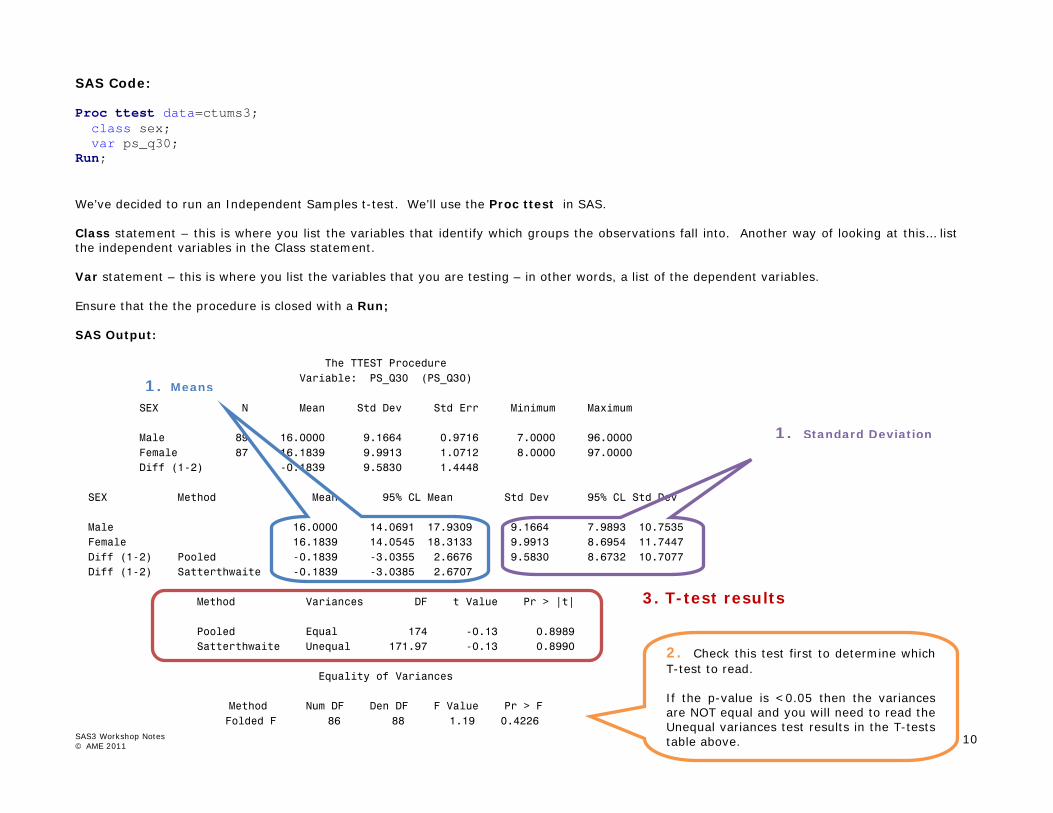
SAS Code: Proc ttest data=ctums3; class sex; var ps_q30; Run; We’ve decided to run an Independent Samples t-test. We’ll use the Proc ttest in SAS. Class statement – this is where you list the variables that identify which groups the observations fall into. Another way of looking at this… list the independent variables in the Class statement. Var statement – this is where you list the variables that you are testing – in other words, a list of the dependent variables. Ensure that the the procedure is closed with a Run; SAS Output: The TTEST Procedure Variable: PS_Q30 (PS_Q30) SEX N Mean Std Dev Std Err Minimum Maximum Male 89 16.0000 9.1664 0.9716 7.0000 96.0000 Female 87 16.1839 9.9913 1.0712 8.0000 97.0000 Diff (1-2) -0.1839 9.5830 1.4448 SEX Method Mean 95% CL Mean Std Dev 95% CL Std Dev Male 16.0000 14.0691 17.9309 9.1664 7.9893 10.7535 Female 16.1839 14.0545 18.3133 9.9913 8.6954 11.7447 Diff (1-2) Pooled -0.1839 -3.0355 2.6676 9.5830 8.6732 10.7077 Diff (1-2) Satterthwaite -0.1839 -3.0385 2.6707 Method Variances DF t Value Pr > |t| Pooled Equal 174 -0.13 0.8989 Satterthwaite Unequal 171.97 -0.13 0.8990 Equality of Variances Method Num DF Den DF F Value Pr > F
Folded F 86 88 1.19 0.4226
1. Means
1. Standard Deviation
3. T-test results
2. Check this test first to determine which T-test to read. If the p-value is <0.05 then the variances are NOT equal and you will need to read the Unequal variances test results in the T-tests table above.

SAS3 Workshop Notes © AME 2011
11
Research Question: We are interested in determining whether there is a difference between the age at which females and males first smoked. Do we accept or reject the Null hypothesis? Null hypothesis:
Ho : µfemales = µmales
Alternate hypothesis:
Ha : µfemales ≠ µmales Conclusion: How do we write the results of this analysis? How do we answer the research question? Do we present a table for our results? If so – what do we present? If not, why and what do we report?

SAS3 Workshop Notes © AME 2011
12
2. Paired samples t-test The paired samples t-test is also referred to as the dependent or related samples t-test. It is useful for testing if a significant difference occurs between the means of two variables that represent the same group at different times (before or after) or related groups (husband and wife). For example in medical research, a paired t-test is used to compare the means on a measure before (pre) and after (post) a treatment. Looking at market research, this test could be used to compare the rating an individual gives a product they usually purchase and a competing product on some characteristic. Research Question: We are interested in determining whether there is a difference between the age respondents first smoked and the age at which they began smoking cigarettes daily. Null hypothesis:
Ho : µfirstsm = µsmokedly
Alternate hypothesis:
Ha : µfirstsm ≠ µsmokedly
Exercise – Determining the appropriate test. Name
How many
levels? Type of data Related?
Independent Variable :
Dependent Variable :
What test?
SAS3 Workshop Notes © AME 2011
13
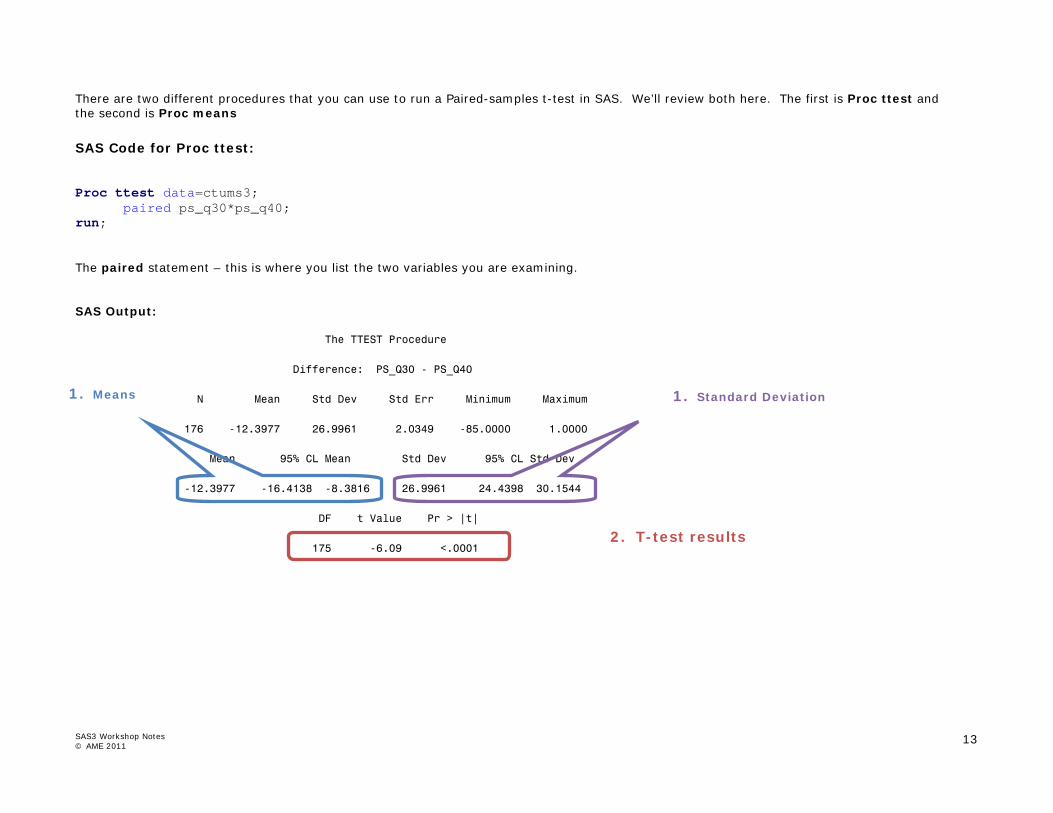
There are two different procedures that you can use to run a Paired-samples t-test in SAS. We’ll review both here. The first is Proc ttest and the second is Proc means
SAS Code for Proc ttest: Proc ttest data=ctums3; paired ps_q30*ps_q40; run; The paired statement – this is where you list the two variables you are examining. SAS Output: The TTEST Procedure Difference: PS_Q30 - PS_Q40 N Mean Std Dev Std Err Minimum Maximum 176 -12.3977 26.9961 2.0349 -85.0000 1.0000 Mean 95% CL Mean Std Dev 95% CL Std Dev -12.3977 -16.4138 -8.3816 26.9961 24.4398 30.1544 DF t Value Pr > |t| 175 -6.09 <.0001
1. Means
1. Standard Deviation
2. T-test results

SAS3 Workshop Notes © AME 2011
14
SAS code for Proc means: Data ctums3; set ctums3; agediff = ps_q40 - ps_q30; Run; Proc print data=ctums3 (obs=10); var ps_q40 ps_q30 agediff; Run; Proc means mean t prt stderr data=ctums3; var agediff; Run; There are two steps to using Proc Means to run a t-test: 1. Create a new variable that represents the difference between the two variables of interest. In this case, ps_q40 and ps_q30. To do this use a Data step, create a new variable called agediff which is equal to ps_q40-ps_q30. 2. Run a Proc means and request the means, standard error, t-statistic, and the probability associated with the t-statistic. SAS Output: The MEANS Procedure Analysis Variable : agediff Mean t Value Pr > |t| Std Error ƒƒƒƒƒƒƒƒƒƒƒƒƒƒƒƒƒƒƒƒƒƒƒƒƒƒƒƒƒƒƒƒƒƒƒƒƒƒƒƒƒƒƒƒƒƒƒƒƒƒƒ 12.3977273 6.09 <.0001 2.0349077 ƒƒƒƒƒƒƒƒƒƒƒƒƒƒƒƒƒƒƒƒƒƒƒƒƒƒƒƒƒƒƒƒƒƒƒƒƒƒƒƒƒƒƒƒƒƒƒƒƒƒƒ

SAS3 Workshop Notes © AME 2011
15
Research Question: We are interested in determining whether there is a difference between the age respondents first smoked and the age at which they began smoking cigarettes daily. Do we accept or reject the Null hypothesis? Null hypothesis:
Ho : µfirstsm = µsmokedly
Alternate hypothesis:
Ha : µfirstsm ≠ µsmokedly Conclusion: How do we write the results of this analysis? How do we answer the research question? Do we present a table for our results? If so – what do we present? If not, why and what do we report? Are the results from the Proc ttest and the Proc means the same? If the results are found to be different, why?

SAS3 Workshop Notes © AME 2011
16
3. One-Sample T-test A one sample t-test procedure tests whether the mean of a single variable differs from a specified constant. Research Question: We are interested in determining whether the age that most people first smoked is 18 yrs of age. Null hypothesis:
Ho : µfirstsm = 18
Alternate hypothesis:
Ha : µfirstsm ≠ 18 Exercise – Determining the appropriate test. Name
How many
levels? Type of data Related?
Independent Variable :
Dependent Variable :
What test?

SAS3 Workshop Notes © AME 2011
17
SAS Code for Proc ttest: Proc ttest data=ctums3 h0=18; var ps_q30; run; We’re continuing to use the Procedure ttest in SAS. h0 is the specified constant we want to compare our data to. h0 is our Null hypothesis value. var is our test variable. SAS Output: The TTEST Procedure Variable: PS_Q30 (PS_Q30) N Mean Std Dev Std Err Minimum Maximum 176 16.0909 9.5560 0.7203 7.0000 97.0000 Mean 95% CL Mean Std Dev 95% CL Std Dev 16.0909 14.6693 17.5125 9.5560 8.6511 10.6740 DF t Value Pr > |t| 175 -2.65 0.0088 Research Question: We are interested in determining whether the age that most people first smoked is 18 yrs of age. Do we accept or reject the Null hypothesis? Null hypothesis:
Ho : µfirstsm = 18
Alternate hypothesis:
Ha : µfirstsm ≠ 18
1. Means
1. Standard Deviation
2. T-test results
SAS3 Workshop Notes © AME 2011
18
Conclusion: How do we write the results of this analysis? How do we answer the research question? Do we present a table for our results? If so – what do we present? If not, why and what do we report?

SAS3 Workshop Notes © AME 2011
19
Analysis of Variance (ANOVA)
This procedure compares the means from several samples and tests whether they are all the same or whether one or more of them are significantly different. This is an extension of the t-test for datasets containing more than two samples. Research Question: We are interested in determining whether there are differences between age that respondents first smoked and the number of people that smoke in the house. Null hypothesis:
Ho : µhs_q20i = µhs_q20j Alternate hypothesis:
Ha : µhs_q20i ≠ µhs_q20j
Exercise – Determining the appropriate test. Name
How many
levels? Type of data Related?
Independent Variable :
Dependent Variable :
What test?

SAS3 Workshop Notes © AME 2011
20
SAS Code for Proc glm:
Proc glm data=ctums3; class hhsize; model ps_q30 = hhsize; Run; Proc glm is one of the many Procedures in SAS where you can conduct an analysis of variance. Class statement – this is where you list the variables that identify which groups the observations fall into. Another way of looking at this… list the independent variables in the Class statement. We’ve already seen this statement in the Proc ttest and is a common statement used in many procedures model statement – This is where you tell SAS what your dependent and independent variables are. For a one-way ANOVA – you are telling SAS that you want to determine if the average weight between the age_groups differs significantly. When you move away from the one-way ANOVA, developing a model for the analysis is most appropriate – Please see the notes or attend the workshop for Data Analysis in SAS 3 – Strip-plot and Repeated Measures – for more information – or visit a Statistics textbook. SAS Output: The GLM Procedure Class Level Information Class Levels Values HHSIZE 5 1 person 2 people 3 people 4 people 5 or more Number of Observations Read 177 Number of Observations Used 177
The first page of the output describes the variables listed in your Class statement. There are 5 different household size groups There were 177 observations read, and all 177 observations were used
SAS3 Workshop Notes © AME 2011
21
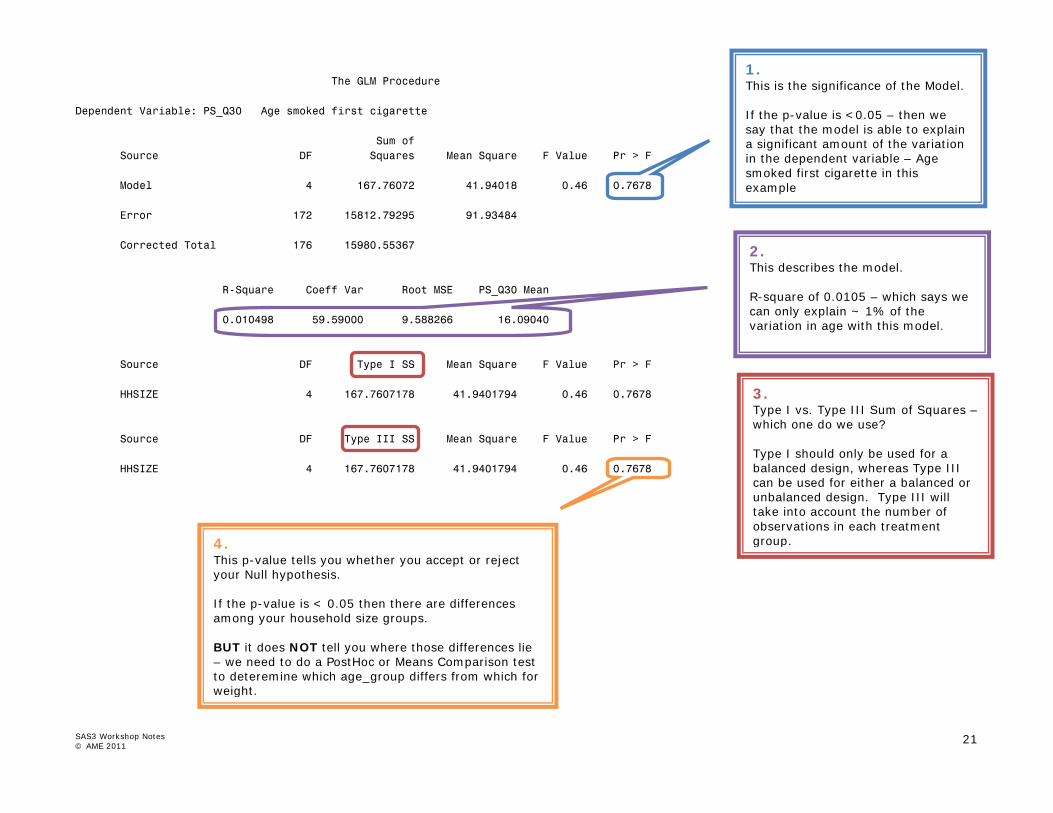
The GLM Procedure Dependent Variable: PS_Q30 Age smoked first cigarette Sum of Source DF Squares Mean Square F Value Pr > F Model 4 167.76072 41.94018 0.46 0.7678 Error 172 15812.79295 91.93484 Corrected Total 176 15980.55367 R-Square Coeff Var Root MSE PS_Q30 Mean 0.010498 59.59000 9.588266 16.09040 Source DF Type I SS Mean Square F Value Pr > F HHSIZE 4 167.7607178 41.9401794 0.46 0.7678 Source DF Type III SS Mean Square F Value Pr > F HHSIZE 4 167.7607178 41.9401794 0.46 0.7678
1. This is the significance of the Model. If the p-value is <0.05 – then we say that the model is able to explain a significant amount of the variation in the dependent variable – Age smoked first cigarette in this example
2. This describes the model. R-square of 0.0105 – which says we can only explain ~ 1% of the variation in age with this model.
3. Type I vs. Type III Sum of Squares – which one do we use? Type I should only be used for a balanced design, whereas Type III can be used for either a balanced or unbalanced design. Type III will take into account the number of observations in each treatment group.
4. This p-value tells you whether you accept or reject your Null hypothesis. If the p-value is < 0.05 then there are differences among your household size groups. BUT it does NOT tell you where those differences lie – we need to do a PostHoc or Means Comparison test to deteremine which age_group differs from which for weight.
SAS3 Workshop Notes © AME 2011
22
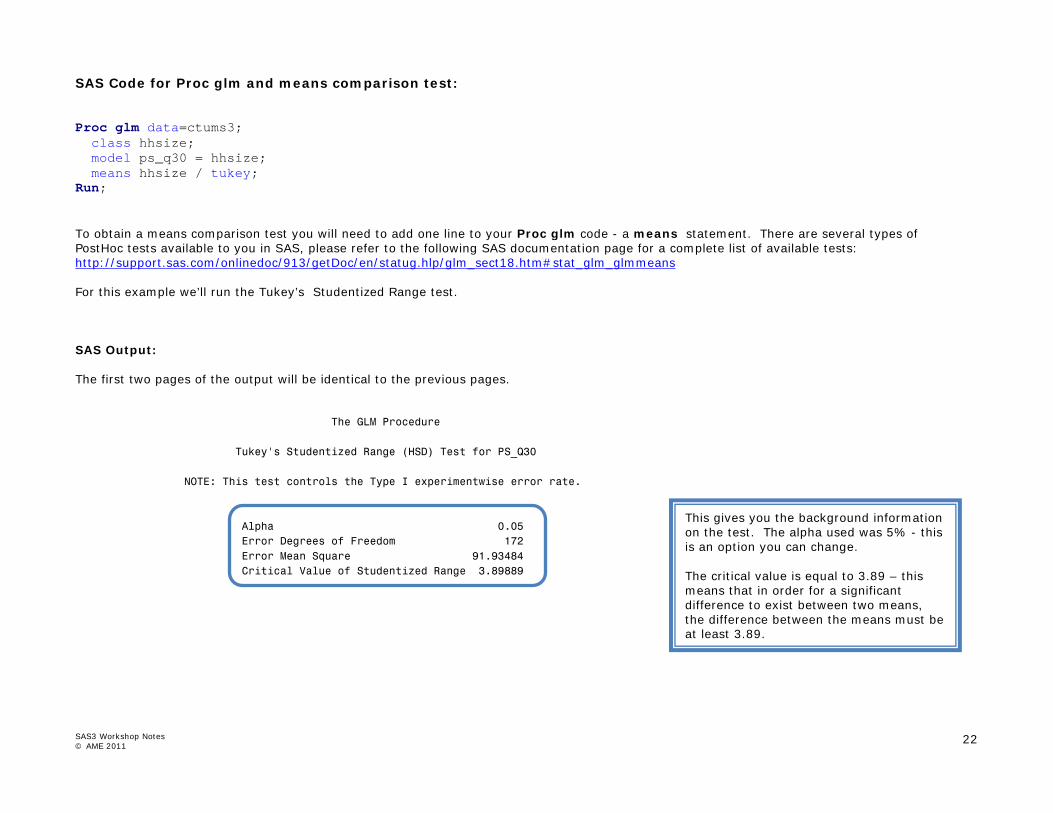
SAS Code for Proc glm and means comparison test: Proc glm data=ctums3; class hhsize; model ps_q30 = hhsize; means hhsize / tukey; Run; To obtain a means comparison test you will need to add one line to your Proc glm code - a means statement. There are several types of PostHoc tests available to you in SAS, please refer to the following SAS documentation page for a complete list of available tests: http://support.sas.com/onlinedoc/913/getDoc/en/statug.hlp/glm_sect18.htm#stat_glm_glmmeans For this example we’ll run the Tukey’s Studentized Range test. SAS Output: The first two pages of the output will be identical to the previous pages. The GLM Procedure Tukey's Studentized Range (HSD) Test for PS_Q30 NOTE: This test controls the Type I experimentwise error rate. Alpha 0.05 Error Degrees of Freedom 172 Error Mean Square 91.93484 Critical Value of Studentized Range 3.89889
This gives you the background information on the test. The alpha used was 5% - this is an option you can change. The critical value is equal to 3.89 – this means that in order for a significant difference to exist between two means, the difference between the means must be at least 3.89.

SAS3 Workshop Notes © AME 2011
23
Comparisons significant at the 0.05 level are indicated by ***. Difference Simultaneous HHSIZE Between 95% Confidence Comparison Means Limits 5 or more - 2 people 1.507 -5.087 8.101 5 or more - 3 people 1.531 -4.845 7.907 5 or more - 1 person 2.903 -5.561 11.366 5 or more - 4 people 3.090 -3.792 9.972 2 people - 5 or more -1.507 -8.101 5.087 2 people - 3 people 0.024 -5.289 5.338 2 people - 1 person 1.396 -6.298 9.090 2 people - 4 people 1.583 -4.328 7.494 3 people - 5 or more -1.531 -7.907 4.845 3 people - 2 people -0.024 -5.338 5.289 3 people - 1 person 1.372 -6.137 8.880 3 people - 4 people 1.559 -4.108 7.226 1 person - 5 or more -2.903 -11.366 5.561 1 person - 2 people -1.396 -9.090 6.298 1 person - 3 people -1.372 -8.880 6.137 1 person - 4 people 0.188 -7.755 8.130 4 people - 5 or more -3.090 -9.972 3.792 4 people - 2 people -1.583 -7.494 4.328 4 people - 3 people -1.559 -7.226 4.108 4 people - 1 person -0.188 -8.130 7.755
This table (which I’ve truncated) contains each comparison. It shows you the comparison in question, along with the difference between the two means and the confidence limits around that mean. If the difference is equal to or greater then 3.89 then it is marked with *** to show that it is indeed significant
Please note that this output may differ. Depending on the number of levels and where the differences lie, you may be presented with one table with a mean for each level and letters showing you where the differences exist.

SAS3 Workshop Notes © AME 2011
24
Research Question: We are interested in determining whether there are differences between age that respondents first smoked and the number of people that smoke in the house. Null hypothesis:
Ho : µhs_q20i = µhs_q20j Alternate hypothesis:
Ha : µhs_q20i ≠ µhs_q20j Conclusion: How do we write the results of this analysis? How do we answer the research question? Do we present a table for our results? If so – what do we present? If not, why and what do we report?
SAS3 Workshop Notes © AME 2011
25
Npar1way analysis
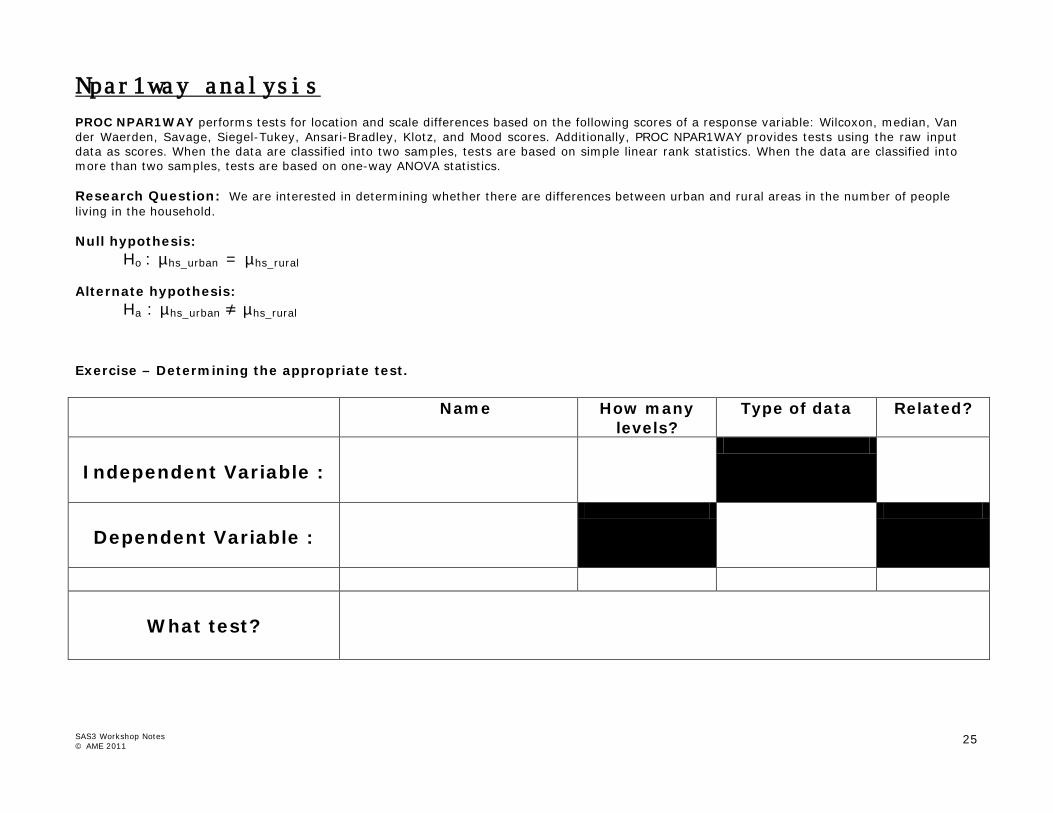
PROC NPAR1WAY performs tests for location and scale differences based on the following scores of a response variable: Wilcoxon, median, Van der Waerden, Savage, Siegel-Tukey, Ansari-Bradley, Klotz, and Mood scores. Additionally, PROC NPAR1WAY provides tests using the raw input data as scores. When the data are classified into two samples, tests are based on simple linear rank statistics. When the data are classified into more than two samples, tests are based on one-way ANOVA statistics. Research Question: We are interested in determining whether there are differences between urban and rural areas in the number of people living in the household. Null hypothesis:
Ho : µhs_urban = µhs_rural Alternate hypothesis:
Ha : µhs_urban ≠ µhs_rural
Exercise – Determining the appropriate test. Name
How many
levels? Type of data Related?
Independent Variable :
Dependent Variable :
What test?

SAS3 Workshop Notes © AME 2011
26
SAS Code: Proc npar1way data=ctums3; class dvurban; var hhsize; exact; Run; We’ve decided to run a non-parametric test, since our dependent variable, household size is an ordinal variable and we are comparing 2 groups: urban and rural. We’ll use the Proc npar1way in SAS. Class statement – this is where you list the variables that identify which groups the observations fall into. Another way of looking at this… list the independent variables in the Class statement. Var statement – this is where you list the variables that you are testing – in other words, a list of the dependent variables. Exact statement – request specific tests to be run. The Wilcoxon test is the one we are interested in but SAS will give us a few more tests to browse. Ensure that the the procedure is closed with a Run; SAS Output: The NPAR1WAY Procedure Analysis of Variance for Variable HHSIZE Classified by Variable DVURBAN DVURBAN N Mean ƒƒƒƒƒƒƒƒƒƒƒƒƒƒƒƒƒƒƒƒƒƒƒƒƒƒƒƒƒƒƒƒƒƒƒƒƒƒƒƒ Urban 135 3.074074 Rural 36 3.055556 Not stated 6 2.500000 Source DF Sum of Squares Mean Square F Value Pr > F ƒƒƒƒƒƒƒƒƒƒƒƒƒƒƒƒƒƒƒƒƒƒƒƒƒƒƒƒƒƒƒƒƒƒƒƒƒƒƒƒƒƒƒƒƒƒƒƒƒƒƒƒƒƒƒƒƒƒƒƒƒƒƒƒƒƒƒƒ Among 2 1.894225 0.947112 0.6792 0.5084 Within 174 242.648148 1.394530 Average scores were used for ties.
Notice that this is an ANOVA. P-value is greater than 0.05 suggesting that there are no differences among the 5 household size groups.
SAS3 Workshop Notes © AME 2011
27
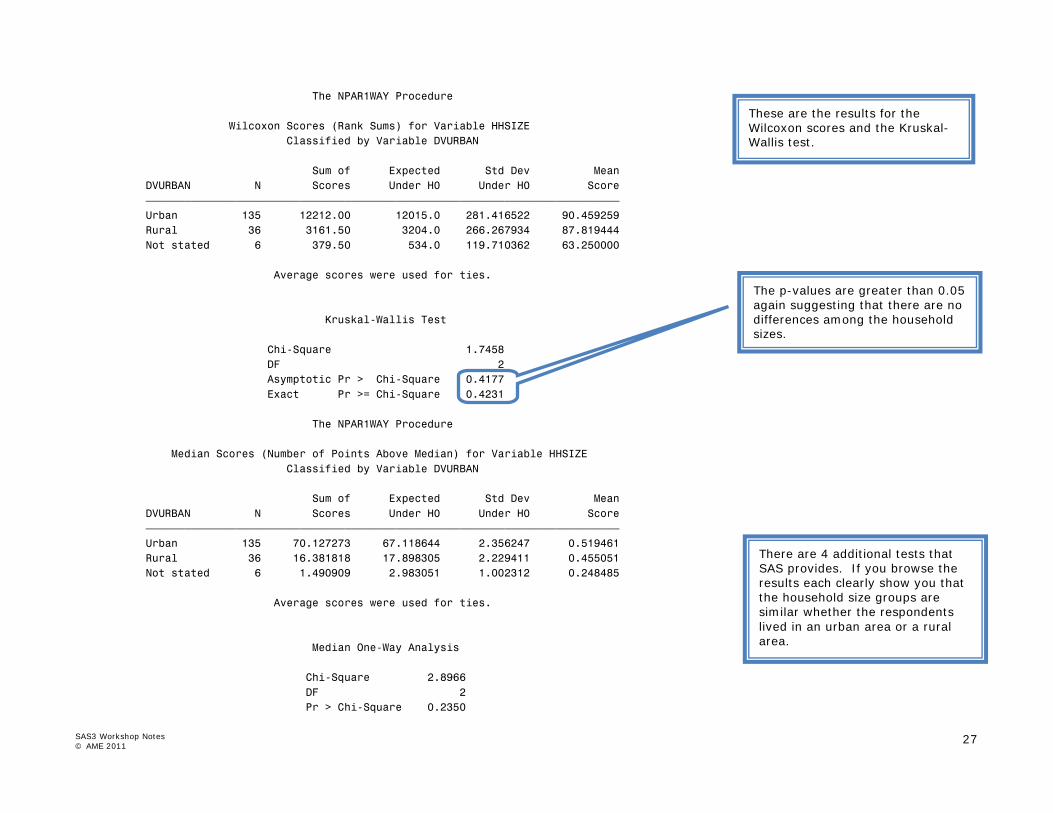
The NPAR1WAY Procedure Wilcoxon Scores (Rank Sums) for Variable HHSIZE Classified by Variable DVURBAN Sum of Expected Std Dev Mean DVURBAN N Scores Under H0 Under H0 Score ƒƒƒƒƒƒƒƒƒƒƒƒƒƒƒƒƒƒƒƒƒƒƒƒƒƒƒƒƒƒƒƒƒƒƒƒƒƒƒƒƒƒƒƒƒƒƒƒƒƒƒƒƒƒƒƒƒƒƒƒƒƒƒƒƒƒƒƒƒƒƒƒƒƒ Urban 135 12212.00 12015.0 281.416522 90.459259 Rural 36 3161.50 3204.0 266.267934 87.819444 Not stated 6 379.50 534.0 119.710362 63.250000 Average scores were used for ties. Kruskal-Wallis Test Chi-Square 1.7458 DF 2 Asymptotic Pr > Chi-Square 0.4177 Exact Pr >= Chi-Square 0.4231 The NPAR1WAY Procedure Median Scores (Number of Points Above Median) for Variable HHSIZE Classified by Variable DVURBAN Sum of Expected Std Dev Mean DVURBAN N Scores Under H0 Under H0 Score ƒƒƒƒƒƒƒƒƒƒƒƒƒƒƒƒƒƒƒƒƒƒƒƒƒƒƒƒƒƒƒƒƒƒƒƒƒƒƒƒƒƒƒƒƒƒƒƒƒƒƒƒƒƒƒƒƒƒƒƒƒƒƒƒƒƒƒƒƒƒƒƒƒƒ Urban 135 70.127273 67.118644 2.356247 0.519461 Rural 36 16.381818 17.898305 2.229411 0.455051 Not stated 6 1.490909 2.983051 1.002312 0.248485 Average scores were used for ties. Median One-Way Analysis Chi-Square 2.8966 DF 2 Pr > Chi-Square 0.2350
These are the results for the Wilcoxon scores and the Kruskal-Wallis test.
The p-values are greater than 0.05 again suggesting that there are no differences among the household sizes.
There are 4 additional tests that SAS provides. If you browse the results each clearly show you that the household size groups are similar whether the respondents lived in an urban area or a rural area.

SAS3 Workshop Notes © AME 2011
28
The NPAR1WAY Procedure Van der Waerden Scores (Normal) for Variable HHSIZE Classified by Variable DVURBAN Sum of Expected Std Dev Mean DVURBAN N Scores Under H0 Under H0 Score ƒƒƒƒƒƒƒƒƒƒƒƒƒƒƒƒƒƒƒƒƒƒƒƒƒƒƒƒƒƒƒƒƒƒƒƒƒƒƒƒƒƒƒƒƒƒƒƒƒƒƒƒƒƒƒƒƒƒƒƒƒƒƒƒƒƒƒƒƒƒƒƒƒƒ Urban 135 2.081955 0.0 5.322017 0.015422 Rural 36 0.524749 0.0 5.035534 0.014576 Not stated 6 -2.606705 0.0 2.263906 -0.434451 Average scores were used for ties. Van der Waerden One-Way Analysis Chi-Square 1.3258 DF 2 Pr > Chi-Square 0.5154 The NPAR1WAY Procedure Savage Scores (Exponential) for Variable HHSIZE Classified by Variable DVURBAN Sum of Expected Std Dev Mean DVURBAN N Scores Under H0 Under H0 Score ƒƒƒƒƒƒƒƒƒƒƒƒƒƒƒƒƒƒƒƒƒƒƒƒƒƒƒƒƒƒƒƒƒƒƒƒƒƒƒƒƒƒƒƒƒƒƒƒƒƒƒƒƒƒƒƒƒƒƒƒƒƒƒƒƒƒƒƒƒƒƒƒƒƒ Urban 135 -0.815492 0.0 5.146134 -0.006041 Rural 36 2.355687 0.0 4.869119 0.065436 Not stated 6 -1.540194 0.0 2.189088 -0.256699 Average scores were used for ties. Savage One-Way Analysis Chi-Square 0.6707 DF 2 Pr > Chi-Square 0.7151

SAS3 Workshop Notes © AME 2011
29
The NPAR1WAY Procedure Kolmogorov-Smirnov Test for Variable HHSIZE Classified by Variable DVURBAN EDF at Deviation from Mean DVURBAN N Maximum at Maximum ƒƒƒƒƒƒƒƒƒƒƒƒƒƒƒƒƒƒƒƒƒƒƒƒƒƒƒƒƒƒƒƒƒƒƒƒƒƒƒƒƒƒƒƒƒƒƒƒƒƒƒƒƒƒƒ Urban 135 0.325926 -0.217354 Rural 36 0.361111 0.098870 Not stated 6 0.666667 0.788819 Total 177 0.344633 Maximum Deviation Occurred at Observation 78 Value of HHSIZE at Maximum = 2.0 Kolmogorov-Smirnov Statistics (Asymptotic) KS 0.061948 KSa 0.824168 Cramer-von Mises Test for Variable HHSIZE Classified by Variable DVURBAN Summed Deviation DVURBAN N from Mean ƒƒƒƒƒƒƒƒƒƒƒƒƒƒƒƒƒƒƒƒƒƒƒƒƒƒƒƒƒƒƒƒƒƒƒƒƒƒƒƒƒƒ Urban 135 0.054006 Rural 36 0.100662 Not stated 6 0.221189 Cramer-von Mises Statistics (Asymptotic) CM 0.002123 CMa 0.375856

SAS3 Workshop Notes © AME 2011
30
Final Note:
We’ve been using data from a survey collected by Statistics Canada and we’ve restricted our data to only individuals living in Quebec. What type of conclusions can we draw? Can we extrapolate our results to all individuals living in Quebec and beyond to Canada? Why or why not? What can we do to address this?
SAS3 Workshop Notes © AME 2011
31
Exercise:
Research Question: We are interested in determining whether there are differences between sex and the total number of cigarettes the respondents smoked during the week. Null hypothesis:
Ho : µmale_totcig = µfemale_totcig Alternate hypothesis:
Ha : µmale_totcig ≠ µfemale_totcig Conclusion: How do we write the results of this analysis? How do we answer the research question? Do we present a table for our results? If so – what do we present? If not, why and what do we report?
SAS3 Workshop Notes © AME 2011
32
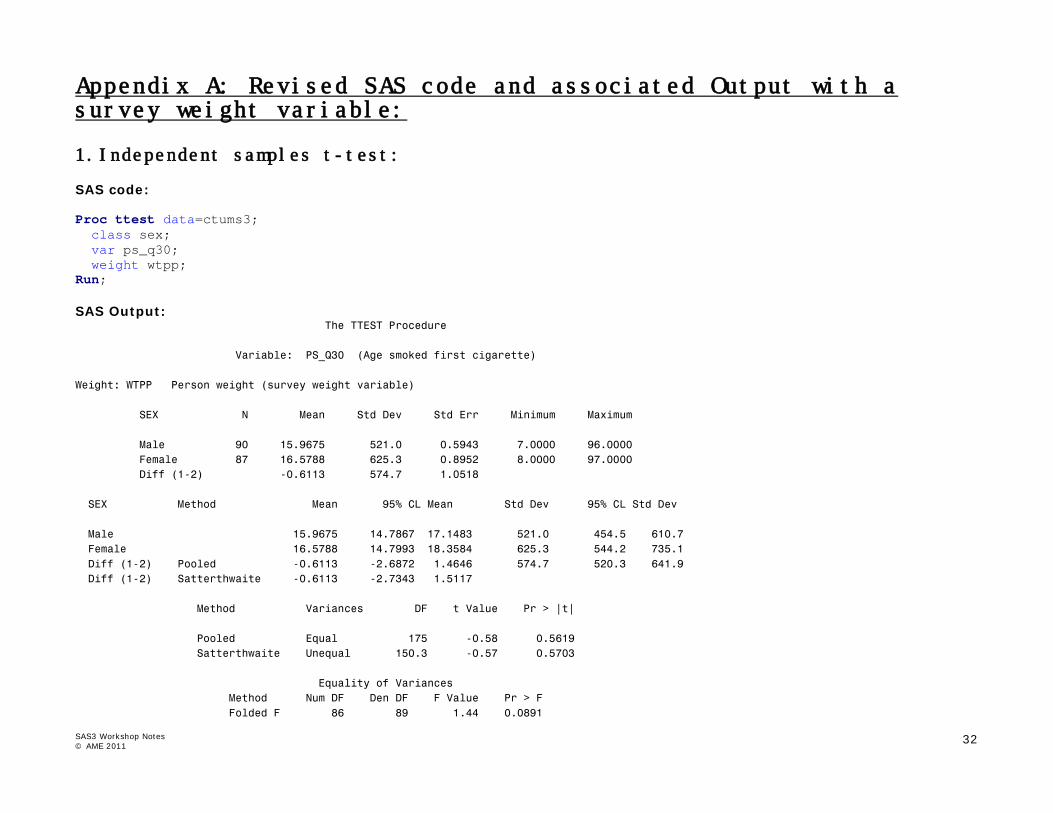
Appendix A: Revised SAS code and associated Output with a survey weight variable:
1. Independent samples t-test:
SAS code: Proc ttest data=ctums3; class sex; var ps_q30; weight wtpp; Run; SAS Output: The TTEST Procedure Variable: PS_Q30 (Age smoked first cigarette) Weight: WTPP Person weight (survey weight variable) SEX N Mean Std Dev Std Err Minimum Maximum Male 90 15.9675 521.0 0.5943 7.0000 96.0000 Female 87 16.5788 625.3 0.8952 8.0000 97.0000 Diff (1-2) -0.6113 574.7 1.0518 SEX Method Mean 95% CL Mean Std Dev 95% CL Std Dev Male 15.9675 14.7867 17.1483 521.0 454.5 610.7 Female 16.5788 14.7993 18.3584 625.3 544.2 735.1 Diff (1-2) Pooled -0.6113 -2.6872 1.4646 574.7 520.3 641.9 Diff (1-2) Satterthwaite -0.6113 -2.7343 1.5117 Method Variances DF t Value Pr > |t| Pooled Equal 175 -0.58 0.5619 Satterthwaite Unequal 150.3 -0.57 0.5703 Equality of Variances Method Num DF Den DF F Value Pr > F Folded F 86 89 1.44 0.0891

SAS3 Workshop Notes © AME 2011
33
2. Paired samples t-test: SAS code for Proc ttest: Proc ttest data=ctums3; paired ps_q30*ps_q40; weight wtpp; run; SAS Output: The TTEST Procedure Difference: PS_Q30 - PS_Q40 Weight: WTPP Person weight (survey weight variable) N Mean Std Dev Std Err Minimum Maximum 177 -10.3701 2067.1 1.8439 -85.0000 1.0000 Mean 95% CL Mean Std Dev 95% CL Std Dev -10.3701 -14.0091 -6.7311 2067.1 1871.8 2308.1 DF t Value Pr > |t| 176 -5.62 <.0001

SAS3 Workshop Notes © AME 2011
34
SAS code for Proc means: Proc means mean t prt stderr data=ctums3; var agediff; weight wtpp; Run; SAS Output: The MEANS Procedure Analysis Variable : agediff Mean t Value Pr > |t| Std Error ƒƒƒƒƒƒƒƒƒƒƒƒƒƒƒƒƒƒƒƒƒƒƒƒƒƒƒƒƒƒƒƒƒƒƒƒƒƒƒƒƒƒƒƒƒƒƒƒƒƒƒ 10.3700630 5.62 <.0001 1.8438996 ƒƒƒƒƒƒƒƒƒƒƒƒƒƒƒƒƒƒƒƒƒƒƒƒƒƒƒƒƒƒƒƒƒƒƒƒƒƒƒƒƒƒƒƒƒƒƒƒƒƒƒ

SAS3 Workshop Notes © AME 2011
35
3. One sample t-test: SAS code: Proc ttest data=ctums3 h0=18; var ps_q30; weight wtpp; run; SAS Output: The TTEST Procedure Variable: PS_Q30 (Age smoked first cigarette) Weight: WTPP Person weight (survey weight variable) N Mean Std Dev Std Err Minimum Maximum 177 16.2049 573.6 0.5117 7.0000 97.0000 Mean 95% CL Mean Std Dev 95% CL Std Dev 16.2049 15.1951 17.2147 573.6 519.4 640.5 DF t Value Pr > |t| 176 -3.51 0.0006

SAS3 Workshop Notes © AME 2011
36
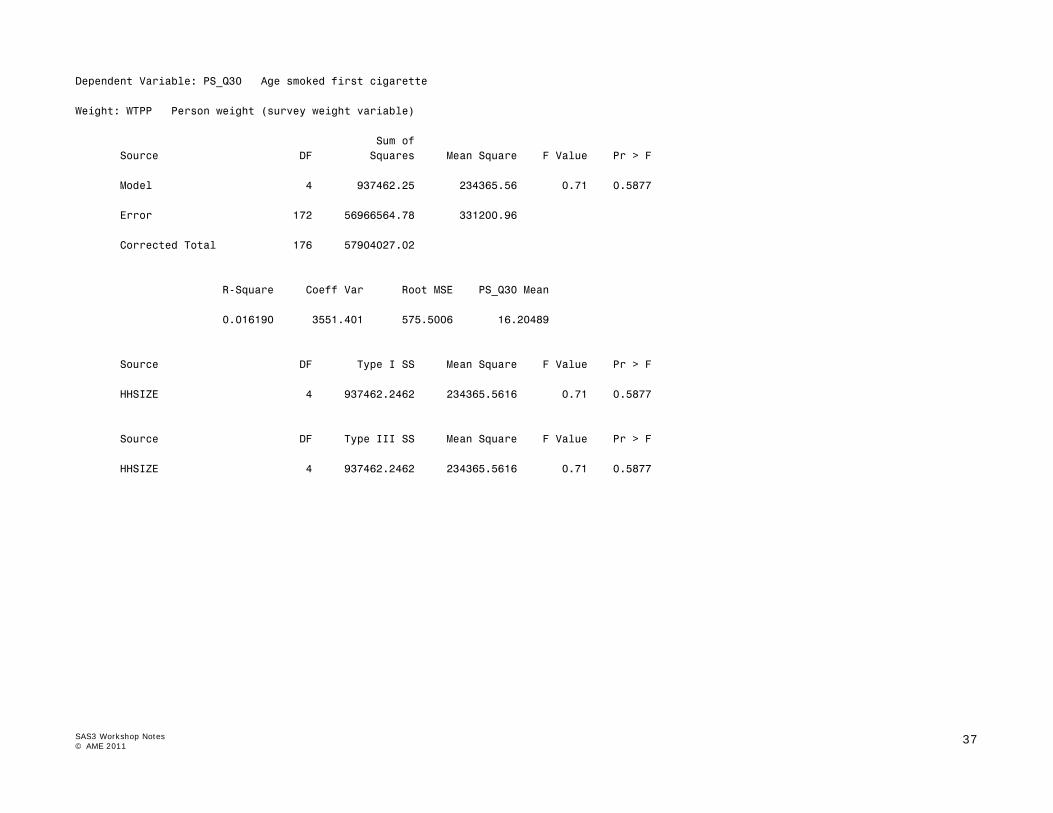
4. Analysis of Variance – ANOVA SAS code: Proc glm data=ctums3; class hhsize; model ps_q30 = hhsize; means hhsize / tukey; weight wtpp; Run; SAS Output: Class Level Information Class Levels Values HHSIZE 5 1 person 2 people 3 people 4 people 5 or more Number of Observations Read 177 Number of Observations Used 177
SAS3 Workshop Notes © AME 2011
37
Dependent Variable: PS_Q30 Age smoked first cigarette Weight: WTPP Person weight (survey weight variable) Sum of Source DF Squares Mean Square F Value Pr > F Model 4 937462.25 234365.56 0.71 0.5877 Error 172 56966564.78 331200.96 Corrected Total 176 57904027.02 R-Square Coeff Var Root MSE PS_Q30 Mean 0.016190 3551.401 575.5006 16.20489 Source DF Type I SS Mean Square F Value Pr > F HHSIZE 4 937462.2462 234365.5616 0.71 0.5877 Source DF Type III SS Mean Square F Value Pr > F HHSIZE 4 937462.2462 234365.5616 0.71 0.5877

SAS3 Workshop Notes © AME 2011
38
The GLM Procedure Tukey's Studentized Range (HSD) Test for PS_Q30 NOTE: This test controls the Type I experimentwise error rate. Alpha 0.05 Error Degrees of Freedom 172 Error Mean Square 331201 Critical Value of Studentized Range 3.89889 Comparisons significant at the 0.05 level are indicated by ***. Difference Simultaneous HHSIZE Between 95% Confidence Comparison Means Limits 2 people - 5 or more 0.528 -4.538 5.595 2 people - 3 people 1.331 -2.242 4.903 2 people - 4 people 1.943 -2.162 6.048 2 people - 1 person 2.595 -3.009 8.199 5 or more - 2 people -0.528 -5.595 4.538 5 or more - 3 people 0.803 -4.288 5.893 5 or more - 4 people 1.414 -4.063 6.892 5 or more - 1 person 2.067 -4.608 8.742 3 people - 2 people -1.331 -4.903 2.242 3 people - 5 or more -0.803 -5.893 4.288 3 people - 4 people 0.612 -3.523 4.747 3 people - 1 person 1.264 -4.362 6.890 4 people - 2 people -1.943 -6.048 2.162 4 people - 5 or more -1.414 -6.892 4.063 4 people - 3 people -0.612 -4.747 3.523 4 people - 1 person 0.652 -5.326 6.631 1 person - 2 people -2.595 -8.199 3.009 1 person - 5 or more -2.067 -8.742 4.608 1 person - 3 people -1.264 -6.890 4.362 1 person - 4 people -0.652 -6.631 5.326
Related Documents