FUNDAMENTALS VALUATION SARDA ENERGY & MINERALS LIMITED March 20, 2013

Welcome message from author
This document is posted to help you gain knowledge. Please leave a comment to let me know what you think about it! Share it to your friends and learn new things together.
Transcript
FUNDAMENTALS VALUATION
SARDA ENERGY & MINERALS
LIMITED
March 20, 2013

ANALYTICAL CONTACT
Ms. Revati Kasture +91-22-6754 3465 [email protected]
BUSINESS DEVELOPMENT CONTACTS
MUMBAI
Mr. R. Suryanarayan +91-22-6754 3602 [email protected]
KOLKATA
Ms. Priti Agarwal +91-33- 40181600 [email protected]
CHENNAI
Mr. V Pradeep Kumar +91-44-2849 7812 [email protected]
AHMEDABAD
Mr. Mehul Pandya +91-79-40265656 [email protected]
NEW DELHI
Ms. Swati Agrawal +91- 11- 2331 8701 [email protected]
BANGALORE
Mr. Dinesh Sharma +91-80-2211 7140 [email protected]
HYDERABAD
Mr. Saikat Roy +91-40-40102030 [email protected]
PUNE
Mr. Rahul Patni +91-20-40009000 [email protected]
CARE EQUITY RESEARCH OFFERS
Independent Research of equities on fundamentals or valuations or both
IPO Grading
White Label Research
Valuation of companies for Institutional Investors, Asset Managers and Corporates
Sector Write-ups for Offer Documents of securities

SARDA ENERGY & MINERALS LIMITED
1 www.careratings.com
EQUIGRADE
Consolidated Financial Snapshot
(Rs. Crores) FY11 FY12 FY13E FY14E
Total Revenues 891 1,108 1,444 1,884
EBITDA 138 168 291 402
PAT 56 84 73 101
Fully Diluted EPS* (Rs.) 15.6 23.4 20.3 28.1
Dividend Per Share (Rs.) 3.0 3.5 3.5 3.5
P/E (x) 6.9 4.6 5.3 3.8
EV/EBITDA (x) 8.4 8.6 4.9 3.1
*Calculated on Current Face Value of Rs.10/- per share
EQUIGRADE – Analytical Power for Investment Decision
SARDA ENERGY & MINERALS LIMITED METALS, POWER & MINERALS
Good Fundamentals, Considerable Upside Potential CMP: 108/ CIV: 1781 Sensex: 19, 008
CARE Equity Research assigns 3/5 on fundamental grade to Sarda Energy & Minerals Limited (SEML) CARE Equity Research assigns a fundamental grade of 3/5 to SEML. This indicates ‘Good Fundamentals’. SEML is an integrated steel and ferro alloys producer with diversification plans into power and natural resources. The company is primarily engaged in the manufacturing and selling of pellets, sponge iron, steel billets, wire rods, wire and ferro alloys from its plant located at Raipur, Chhattisgarh. The operations of the facility are supported by 81.5 MW captive thermal power plant and an operational coal mine (production capacity of 1.2 MTPA). The company is further expanding its ferro alloy business, focused primarily at exports and has commissioned a 2x33 MVA ferro alloy plant along with 80 MW captive power plant in Vishakhapatnam in Q4FY13. In an attempt to diversify and also be further self sufficient in terms of raw materials, the company has entered into power and natural resources business through its various subsidiaries and joint ventures. SEML through its subsidiaries has around 1780 MW of total ongoing power projects. The company also has obtained a total of around 10 mining licenses for prospecting, surveying and mining of coal, iron ore and manganese and acquired economic interest in coal mines in Indonesia. However, most of these projects are at early stages of development and currently the company lacks complete backward integration and is exposed to raw material price volatility. On the operational front, SEML has also taken steps to improve its efficiency by setting up a 0.6 MTPA iron pellet plant, a coal washery at its operational coal mine and fly ash brick manufacturing facilities for waste management. Valuation CARE Equity Research values equity shares of SEML at a Current Intrinsic Value (CIV) of Rs.178 per share. The valuation is arrived at by using the EV/EBITDA valuation methodology. We have assigned an EV/EBITDA multiple of 4.15 times to the consolidated 1-yr forward EBITDA of Rs.402 crore. At the Current Market Price (CMP) of Rs.108 per share; the CIV results in a valuation grade of 5/5, indicating the shares of SEML have ‘Considerable Upside Potential’.
March 20, 2013

SARDA ENERGY & MINERALS LIMITED
www.careratings.com 2
EQUIGRADE
Midsized, integrated steel and ferro alloy manufacturer primarily focused on domestic market;
increased capacity of ferro alloys to help boost exports
Sarda Energy & Minerals Ltd (SEML) is a midsized integrated steel, power and ferro alloys producer. The
company is engaged in the manufacturing and selling of pellets, sponge iron, steel billets, wire rods, wire, wire
ferro alloys and power primarily in the domestic market. SEML’s plant is located at Raipur, Chhattisgarh. The
company has its own captive coal mines with a production capacity of 1.2 million tons per annum (MTPA) and
captive power plant (81.5 MW). The company also has an iron ore mine with a production capacity of 1.5
MTPA however; currently the same is not operational due to Maoists issues in the areas. While, revenues for
the steel business are primarily from domestic market, SEML is a leading exporter of ferro alloys and enjoys
the status of Star Export House from the Ministry of Commerce. The company is set to commission a
greenfield ferro alloys plant of 2x33 MVA capacity backed by captive power plant of 80 MW in Visakhapatnam
in Q4FY13 under its subsidiary Sarda Metals and Alloys Ltd. (SMAL). The company plans to export major
quantity of ferro alloy produced at this plant. Post this plant getting operational the company’s ferro alloy
production capacity will increase to 200,000 MTPA.
Chart 1: Current Installed Capacity
Note: Iron Ore mine is currently not operational Source: Company and CARE Equity Research
FUNDAMENTAL GRADE Good Fundamentals 3/5
Power (81.5MW)
(200,000 MTPA)
p.a)

SARDA ENERGY & MINERALS LIMITED
3 www.careratings.com
EQUIGRADE
Chart 2: Domestic sales constitute bulk of total revenues currently
Source: Company and CARE Equity Research
While, over the last three years i.e. FY09 to FY12 SEML witnessed a strong growth in its steel revenues
(Compound Annual Growth Rate (CAGR) of 59.9 per cent), this was mainly on account of new pellet and steel
wire rods capacity coming on stream, which lead to a volume growth of 15 per cent and blended realization
growth of 29 per cent (due to change in product mix). During the same period domestic finished steel and
steel raw materials industry witnessed a growth of 8.95 per cent. With no new capacity additions in steel
business over the next few years and also limited scope for further increase in capacity utilization, we believe
the growth rate in steel business for SEML will taper down to around 8 - 9 per cent. This growth would be
primarily supported by the overall growth in finished steel consumption in India. CARE Research foresees the
domestic finished steel consumption in India to grow at a CAGR of around 6.7 per cent in the next five years
from about 69 million (mn) tonnes in FY11 to around 103 mn tonnes by FY16. On the other hand, ferro alloy
business is expected to drive the volume growth for the company on the back of increased capacity.
Shift in product mix towards higher value products coupled with increased efficiency due to pellet plant
and coal washery to help improve EBITDA margin going ahead
In order to move up the value chain and have better control over costs SEML adopted a strategy to produce
higher value products and improve cost efficiencies. The company set up wire rods capacity in FY10 in order
to improve profitability. Rolled steel products (wire rods) command higher per ton value as compared to
sponge iron ore. As a result of which, contribution of rolled products increased from 4.3 per cent in FY10 to
86.2% 86.5% 89.4%
13.8% 13.5% 10.6%
0.0%
10.0%
20.0%
30.0%
40.0%
50.0%
60.0%
70.0%
80.0%
90.0%
100.0%
FY10 FY11 FY12
Domestic Exports

SARDA ENERGY & MINERALS LIMITED
www.careratings.com 4
EQUIGRADE
32.2 per cent in FY12. The company also put up a 0.6 MTPA pelletisation plant to convert iron fines into
pellets (substitute for iron lump in sponge iron production) in order to reduce costs, as the cost of iron ore
fines are lower by at least around Rs.4000 per ton as compared to iron ore lumps. Further, the company also
set up a 0.96 MTPA coal washery in order to improve the quality of coal. We believe that foray into higher
value products with increased efficiency due to pellet plant and coal washery and revenues from sale of coal
middling (which directly flow into EBITDA) will help improve profitability. We expect the company’s EBITDA
margin to improve from 15.2 per cent in FY12 to 20.1 per cent in FY13 and further to 21.4 per cent in FY14.
Chart 3: Contribution of steel in revenue has increased due to setting up of wire rods capacity
Source: Company and CARE Equity Research
Raw material price continues to impact SEML given the lack of complete backward integration
While SEML meets about 80% of its current coal requirements from captive mines at Raigarh, Chattisgarh
(production of ~1.2 MTPA), the company is still not self sufficient for its requirements of iron ore and
manganese ore and relies on open market procurements for the same. Further, currently there is no long-
term linkage for manganese ore, which is largely imported at prevailing international prices. However, to
tide over the variability as a result of procurement of these from the market, the company has executed
several licenses in Chhattisgarh, Goa and Madhya Pradesh, most of which are still in initial stages of
prospecting and pending various clearances and permissions. Hence, at present, the company continues to
rely on open market purchases which hamper its profitability as compared to some of its fully integrated
peers.
Ferro Alloy Sponge Iron SteelManganese
Ore and CoalPower Pellets
FY10 ₹ 196.8 ₹ 278.4 ₹ 23.7 ₹ 10.6 ₹ 46.5 ₹ -
FY11 ₹ 391.4 ₹ 258.4 ₹ 224.1 ₹ 41.6 ₹ 27.0 ₹ 3.6
FY12 ₹ 362.0 ₹ 347.1 ₹ 382.4 ₹ 5.8 ₹ 46.0 ₹ 42.5
₹ -
₹ 50.0
₹ 100.0
₹ 150.0
₹ 200.0
₹ 250.0
₹ 300.0
₹ 350.0
₹ 400.0
₹ 450.0 In Crores.

SARDA ENERGY & MINERALS LIMITED
5 www.careratings.com
EQUIGRADE
Table 1: Most of the domestic mines are currently under early development stage
Note: Mg. Ore refers to manganese ore
Source: Company and CARE Equity Research
Fungible business model helps cushion profitability margins
Like most sponge iron manufacturing companies, SEML too has a flexible model, wherein company can
trade off between selling sponge iron & power OR processing into billets or wire rods. Such trade off is
triggered by spot rates of power. As billets/wire rods making involves significant power usage, companies
can opt for selling power rather than processing into billets/wire rods. We believe such flexible business
model will help the company to cushion its profitability margins from volatility in metal prices.
Chart 4: In FY10, the company chose to sell higher sponge iron as compared to billets
Source: Company and CARE Equity Research
Segment Holding Co.
% share of SEML
Capacity/ Reserve
Status
Mines India (Raigarh) Coal Standalone - 280 MT Operational.
Production rate of 1.2 MTPA. India (Rajnandgaon) Iron Ore Standalone - 20 MT Operations suspended. India (Chhattisgarh) Iron Ore Standalone - 230 MT Prospecting license & forest
clearance received. India (Goa) Iron Ore Standalone - 3 MT Mining license obtained India (Balaghat) Mg. Ore Standalone - To be
ascertained Prospecting license / Reconnaissance Permit received
India (Goa) Mg. Ore Standalone - 6 MT Mining license received India (Chhattisgarh) Coal SPV 20.6 36 MT Allotted, clearances awaited
200
250
300
350
400
450
500
550
600
0.00
0.05
0.10
0.15
0.20
0.25
0.30
FY08 FY09 FY10 FY11 FY12
mn
Kw
h
mn
to
ns
Sponge Iron (LHS) Steel Billets (LHS) Power (RHS)

SARDA ENERGY & MINERALS LIMITED
www.careratings.com 6
EQUIGRADE
Diversification into power generation and international natural resources through subsidiaries route;
gearing to remain at moderate levels
In order to reduce its dependence on its core metals business SEML is currently in process of developing
power projects of total 1,780 MW and has also acquired economic interest in a coal mine in Indonesia
(having reserves of 300 MTPA) through its wholly owned subsidiary Sarda Global Ventures Pte. Ltd.
(SGVPL). However, most of its power projects including 1,320 MW and 350 MW power plants in state of
Chhattisgarh are currently at early stage of development and as on March 31, 2012, SEML had only invested
around Rs.73 crores cumulatively in the power projects. For its coal mines in Indonesia, the subsidiary
SGVPL has got the mining license, environmental and forest clearance and is currently acquiring land for the
mines. The company expects the Indonesian mine to be operational by 2013.
While, SEML has large expansion plans in place (including various thermal and hydro power projects,
Indonesian coal mine, Chhattisgarh coal mines), given the spaced out timelines of execution, coupled with
good cash generation from the core steel and ferro alloy business (post stabilization of pellet plant and
commissioning of the new ferro alloy plant) the company’s net debt-equity levels are expected to decline
from 1.18 times at the end of FY12 to around 0.84 times by the end of FY14.

SARDA ENERGY & MINERALS LIMITED
7 www.careratings.com
EQUIGRADE
Table 2: Current status of power projects and Indonesian Coal Mine
Source: Company and CARE Equity Research Note: SMAL- Sarda Metals and Alloys Ltd, PPL- Parvatiya Power Ltd, MBPCL- Madhya Bharat Power Corporation Ltd, CHPLLP- Chhattisgarh Hydro Power LLP, SEL- Sarda Energy Ltd, SHPPL- Sarda Hydro Power Pvt.Ltd, SRELLP- Shri Ram Electricity LLP, SGVPL- Sarda Global Venture Pte Ltd, SHP- Small Hydro Project
Segment Holding Co.
% share of SEML
Capacity Status
Power Projects Raipur Thermal Standalone - 81.5 MW
(Captive) Operational.
Vishakhapatnam Thermal SMAL 100% 80 MW (Captive)
To be commissioned in Q3FY13.
Loharkhet (Uttarakhand)
SHP PPL 51% 4.8 MW Operational.
Rongnichu, (Sikkim) Hydro MBPCL 58.48% 96MW Civil construction under progress. To be commissioned by July 2015.
Gullu, Rehar, Mand, Jelha, (Chhattisgarh)
SHP CHPLLP 60.92% 24MW, 24MW, 24MW, 5MW
Civil construction under progress.
Chattisgarh Thermal SEL 100% 1320 MW
Land acquisition in progress, environmental clearance awaited
Kotaiveera, Ganeshpur, (Chhattisgarh)
SHP SHPPL 60% 24MW, 9 MW
Statutory clearances awaited
Chattisgarh Thermal SRELLP 51% 40 MW Techno-economic study under way
Indonesia (Sumatra) Coal SGVPL 100 300 MT Mining license, environmental clearance, forest clearance obtained. Land acquisition in process. Expect commissioning in 2013
SARDA ENERGY & MINERALS LIMITED
www.careratings.com 8
EQUIGRADE
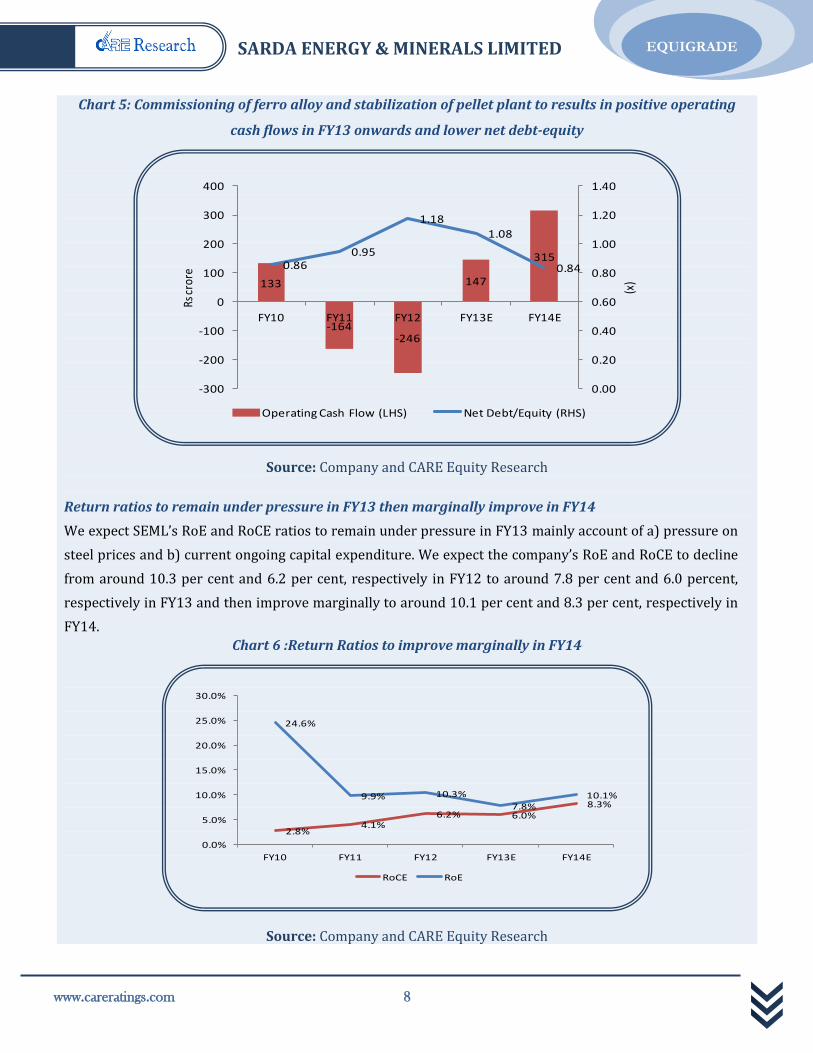
Chart 5: Commissioning of ferro alloy and stabilization of pellet plant to results in positive operating
cash flows in FY13 onwards and lower net debt-equity
Source: Company and CARE Equity Research
Return ratios to remain under pressure in FY13 then marginally improve in FY14
We expect SEML’s RoE and RoCE ratios to remain under pressure in FY13 mainly account of a) pressure on
steel prices and b) current ongoing capital expenditure. We expect the company’s RoE and RoCE to decline
from around 10.3 per cent and 6.2 per cent, respectively in FY12 to around 7.8 per cent and 6.0 percent,
respectively in FY13 and then improve marginally to around 10.1 per cent and 8.3 per cent, respectively in
FY14.
Chart 6 :Return Ratios to improve marginally in FY14
Source: Company and CARE Equity Research
133
-164-246
147
3150.86
0.95
1.18
1.08
0.84
0.00
0.20
0.40
0.60
0.80
1.00
1.20
1.40
-300
-200
-100
0
100
200
300
400
FY10 FY11 FY12 FY13E FY14E
(x)
Rs c
rore
Operating Cash Flow (LHS) Net Debt/Equity (RHS)
2.8%4.1%
6.2% 6.0%8.3%
24.6%
9.9% 10.3%
7.8%10.1%
0.0%
5.0%
10.0%
15.0%
20.0%
25.0%
30.0%
FY10 FY11 FY12 FY13E FY14E
RoCE RoE

SARDA ENERGY & MINERALS LIMITED
9 www.careratings.com
EQUIGRADE
Experienced promoters and in compliance with the listing agreement 49
SEML has experienced promoters and top management with its promoters and directors having more than
two decades of experience in the industry. The company has ten members in the Board, with four of them
being in executive positions, and six of them being Non-Executive and Independent Directors.
The Board has formed four sub-committees for audit, remuneration, shareholders/investor’s grievance, and
corporate governance. As per the annual report, the same is in compliance with the listing agreement of the
stock exchanges.
Table 3: SEML: Board of Directors
Source: Company and CARE Equity Research
Name Designation Category of Director Mr. K. K. Sarda Promoter Promoter, Executive & Non Independent Mr. G. K. Chhanghani Whole Time Director Executive & Non Independent
Mr. Pankaj Sarda Whole Time Director Executive & Non Independent
Mr. G. D. Mundra Whole Time Director Executive & Non Independent
Mr. Rakesh Mehra Director Independent Mr. A. K. Basu Director Independent Mr. P. R. Tripathi Director Independent Mr. G. S. Sahni Director Independent Mr.. Lakshminarayanan Director Independent Mr.Balakrishnan Director Independent

SARDA ENERGY & MINERALS LIMITED
www.careratings.com 10
EQUIGRADE
CARE Equity Research assigns a valuation grade of 5/5 to SEML
CARE Equity Research values equity shares of SEML Ltd. at a Current Intrinsic Value (CIV) of Rs. 178 per
share. The valuation has been arrived using EV/EBITDA valuation methodology. We have assigned an
EV/EBITDA multiple of 4.15 times to the one year forward consolidated EBITDA of Rs. 402 crores. While, in
past the company has traded at higher EV/EBITDA multiple; five year average one year forward rolling
EV/EBITDA multiple of 10.4 times, however, during the same period SEML earned an average Return on
Equity of around 18.3 percent, which going ahead (for FY13 – FY17) is expected to be much lower at around
10.3 per cent. While assigning the EV/EBITDA multiple of 4.15, we have discounted for the decline in RoE as
well the future growth in profits, which is expected to be lower at around 7 – 8 per cent.
Table 4 SEML: Valuation snapshot
Source: CARE Equity Research
The following ongoing power projects and mining projects have not been valued, while arriving at the above
CIV, since they are still at a nascent stage of development. Any positive material development in these
projects will provide further upside to SEML’s valuation over the currently assigned CIV of Rs. 178 per
share.
Table 5 List of projects excluded
Source: CARE Equity Research
VALUATION GRADE Considerable Potential Upside 5/5
1-year Forward EBITDA 402
Assigned EV/EBITDA x 4.15
Implied EV (Rs.cr) (a) 1,670
Less: Net Debt (Rs.cr) (b) 1,032
Implied Equity Value (a-b) 638
No. of Shares (crores) 3.6
CIV per share 178
Name of subsidiary/JV Segment Capacity Subsidiary/JV % Stake Sarda Energy Ltd Thermal Power 1320 MW Subsidiary 100.0 Madhya Bharat Power Corp Thermal Power 96 MW Subsidiary 58.5 Chattisgarh Hydro Power LLP Hydro Power 77 MW Subsidiary 60.9 Sarda Hydro Power Pvt. Ltd Hydro Power 24 MW Subsidiary 60.0 Shree Ram Elec. LLP Thermal Power 40 MW Subsidiary 51.0 Madanpur South Coal Ltd Coal Mine 36 MTPA Joint Venture 20.6

SARDA ENERGY & MINERALS LIMITED
11 www.careratings.com
EQUIGRADE
At the current market price (CMP) of Rs.108 per share, the CIV of Rs.178 per share results in a valuation
grade of 5/5, indicating equity shares of SEML have ‘Considerable Upside Potential’.
Chart 7: SEML: One-year forward rolling price bands
Source: Capitaline and CARE Equity Research
-80
20
120
220
320
420
520
620
5-Apr-07 5-Apr-08 5-Apr-09 5-Apr-10 5-Apr-11
Rs/
sha
re
1-yr fwd rolling P/E
1x 4x 7x 10x 13x Price
0
500
1000
1500
2000
2500
3000
3500
4000
5-Apr-07 5-Apr-08 5-Apr-09 5-Apr-10 5-Apr-11
Rs C
rore
1-yr fwd rolling EV/EBITDA
4x 6x 8x 10x 12x EV
0
100
200
300
400
500
600
700
800
5-Apr-07 5-Apr-08 5-Apr-09 5-Apr-10 5-Apr-11
Rs/
sha
re
1-yr fwd P/B
0.5x 1.0x 1.5x 2.0x 2.5x Price
SARDA ENERGY & MINERALS LIMITED
www.careratings.com 12
EQUIGRADE
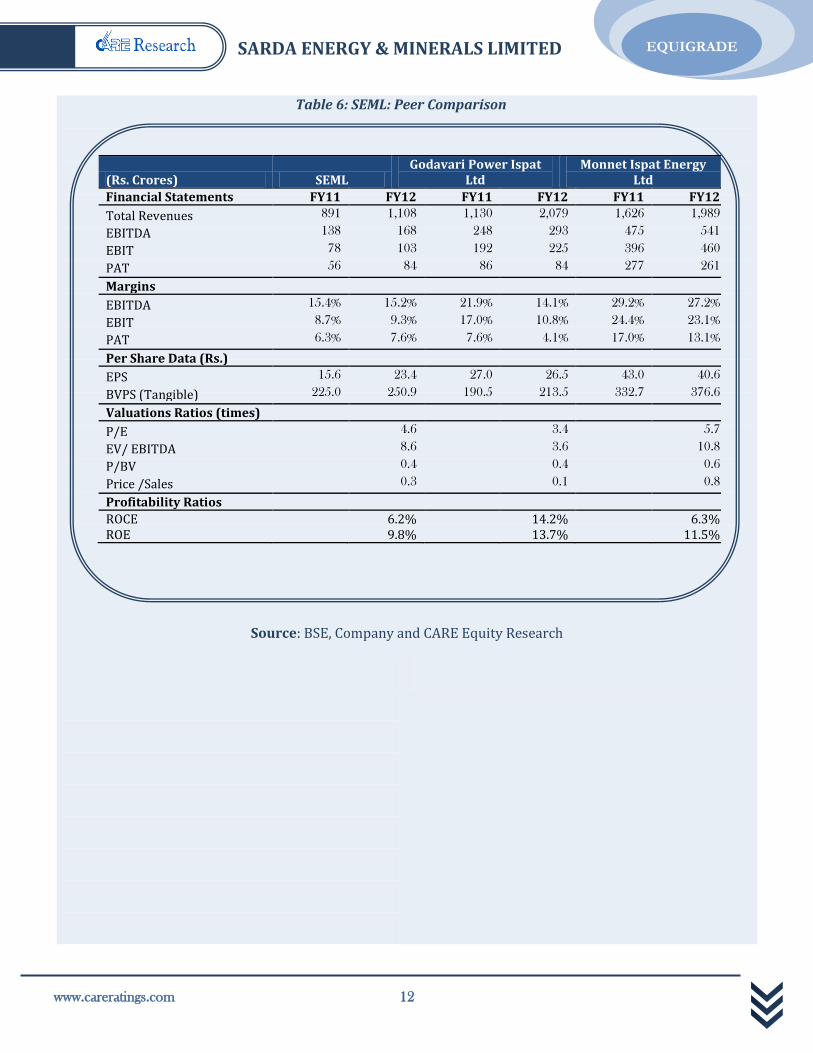
Table 6: SEML: Peer Comparison
Source: BSE, Company and CARE Equity Research
(Rs. Crores) SEML Godavari Power Ispat
Ltd Monnet Ispat Energy
Ltd
Financial Statements FY11 FY12 FY11 FY12 FY11 FY12
Total Revenues 891 1,108 1,130 2,079 1,626 1,989
EBITDA 138 168 248 293 475 541
EBIT 78 103 192 225 396 460
PAT 56 84 86 84 277 261
Margins
EBITDA 15.4% 15.2% 21.9% 14.1% 29.2% 27.2%
EBIT 8.7% 9.3% 17.0% 10.8% 24.4% 23.1%
PAT 6.3% 7.6% 7.6% 4.1% 17.0% 13.1%
Per Share Data (Rs.)
EPS 15.6 23.4 27.0 26.5 43.0 40.6
BVPS (Tangible) 225.0 250.9 190.5 213.5 332.7 376.6
Valuations Ratios (times)
P/E
4.6
3.4
5.7
EV/ EBITDA
8.6
3.6
10.8
P/BV
0.4
0.4
0.6
Price /Sales
0.3
0.1
0.8
Profitability Ratios
ROCE
6.2%
14.2%
6.3% ROE 9.8% 13.7% 11.5%

SARDA ENERGY & MINERALS LIMITED
13 www.careratings.com
EQUIGRADE
Sarda Energy & Minerals Ltd (SEML) earlier known as Raipur Wires & Steel Limited was incorporated in 1973 by the
Mumbai based Tejpaul Group. The Sarda group purchased Raipur Wires & Steel Limited in 1979 and renamed it as
Raipur Alloys & Steel Ltd (RASL). Further, in August 2007, the company rechristened itself as SEML post the merger
of Chhattisgarh Electricity Company Ltd (CECL) with RASL.
SEML is an integrated steel (manufacturing products across the value chain i.e. sponge iron, iron pellets, billets, ingots,
wire rods, TMT bars) and ferro alloy manufacturer and exporter. The company also has an operational coal mine to
support the raw material requirements for steel manufacturing and power generation.
The steel manufacturing facilities and coal mines are primarily located at Raipur & Raigarh, respectively in
Chhattisgarh state. Ferro alloy facility which is focused towards exports (commissioned in Q4FY13) is located at
Vishakhapatnam.
SEML through its subsidiaries and joint ventures has also invested in various power generation projects (thermal,
hydro and solar), which are at various stages of development and a coal mine in Sumatra region of Indonesia. SEML
also has obtained around a total of 10 licenses from the state and central government bodies for surveying,
prospecting & mining of iron and manganese ore.
COMPANY BACKGROUND

SARDA ENERGY & MINERALS LIMITED
www.careratings.com 14
EQUIGRADE
Table 7: Operational capacity and ongoing projects
Segment Holding Co. % share of SEML
Capacity/ Reserve
Status
Mines Indonesia (Sumatra)
Coal SGVPL 100% 300 MT Mining license, environmental clearance, forest clearance obtained. Land acquisition in progress. Expected commissioning in FY14.
India (Raigarh) Coal Standalone - 280 MT Operational. Production rate of 1.2 MTPA.
India (Rajnandgaon)
Iron Ore Standalone - 20 MT Operations suspended.
India (Chhattisgarh) Iron Ore Standalone - 230 MT Prospecting license & forest clearance received.
India (Goa) Iron Ore Standalone - 3 MT Mining license obtained India (Balaghat) Mg. Ore Standalone - To be ascertained Prospecting license /
Reconnaissance Permit received India (Goa) Mg. Ore Standalone - 6 MT Mining license received India (Chhattisgarh) Coal SPV 20.6 36 MT Allotted, clearances awaited
Power Projects Raipur Thermal Standalone - 81.5 MW
(Captive) Operational.
Vishakhapatnam Thermal SMAL 100% 80 MW (Captive) To be commissioned in Q3FY13. Loharkhet (Uttarakhand)
SHP PPL 51% 4.8 MW Operational.
Rongnichu, (Sikkim) Hydro MBPCL 58.48% 96MW Civil construction under progress. To be commissioned by July 2015.
Gullu, Rehar, Mand, Jelha, (Chhattisgarh)
SHP CHPLLP 60.92% 24MW, 24MW, 24MW, 5MW
Civil construction under progress.
Kotaiveera, Ganeshpur, (Chhattisgarh)
SHP SHPPL 60% 24MW, 9 MW Statutory clearances awaited
Chhattisgarh Thermal SEL 100% 1,320 MW Land acquisition in progress, environmental clearance awaited
Raigarh, Chhattisgarh
Pithead Thermal
Standalone - 350 MW
Metals Raipur Sponge Iron Standalone - 360,000 TPA Operational Steel - 240,000 TPA Operational Wire Rod - 180,000 TPA Operational Wire Drawing - 30,000 TPA Operational Pellets - 600,000 TPA Operational Ferro alloy Standalone - 82,500 TPA Operational Ferro alloy
SMAL 100% 66,000 TPA To be commissioned in Q3FY13.
Waste recycling Raipur Fly ash bricks Standalone - 960,000 Operational
Note: SMAL- Sarda Metals and Alloys Ltd, PPL- Parvatiya Power Ltd, MBPCL- Madhya Bharat Power Corporation Ltd, CHPLLP- Chhattisgarh Hydro Power LLP, SEL- Sarda Energy Ltd, SHPPL- Sarda Hydro Power Pvt.Ltd, SRELLP- Shri Ram Electricity LLP, SGVPL- Sarda Global Venture Pte Ltd, SHP- Small Hydro Project

SARDA ENERGY & MINERALS LIMITED
15 www.careratings.com
EQUIGRADE
The Indian steel industry ranks fifth in the world with a crude steel production capacity of 89 mn tonnes in FY12.
Integrated steel producers contributed to 55 per cent of the total crude steel production while the rest was
contributed by secondary producers. During the period from FY98 to FY01, steel production witnessed a marginal
growth of 3 per cent CAGR. However, during FY02 to FY08, owing to boom in the infrastructure and automobile
sectors, the industry witnessed a sharp turnaround and registered a CAGR of 13 per cent.
Domestic steel consumption to grow at a CAGR of 6.7 percent during FY12– FY16
Despite the gloom in the advanced economies and the European countries, domestic finished steel industry
continued to register a strong growth during FY03 to FY11. Amid a sharp slowdown in the global demand (in the
aftermath of the global financial crisis during FY09), the domestic finished steel industry along with China strongly
contributed in the recovery in the global demand for the finished steel industry. Going ahead, CARE Research
estimates the domestic finished steel consumption to grow at a Compound Annual Growth Rate (CAGR) of around
6.7 per cent during period FY12-FY17.
Structure of Indian steel Industry
Source: CARE Research
Global finished steel production to witness steady growth in demand
CARE Research expects the global steel demand to grow at a CAGR of 3.2 percent from about 1484 mn tonnes in
CY11 to about 1788 mn tonnes in CY14. Despite an expected slowdown in Chinese demand, China is likely to
continue its dominance in the global metals demand followed by India and the other emerging economies. CARE
Research expects global supply of steel will continue to adjust itself with the change in global demand. Global steel
production is likely to increase at a CAGR of around 2 percent during CY11 to CY14. However, being in a surplus
SNAPSHOT OF THE INDUSTRY

SARDA ENERGY & MINERALS LIMITED
www.careratings.com 16
EQUIGRADE
situation, any increase in global steel capacity is likely to negatively impact the capacity utilization rate and the
prices of finished steel products
Trends in global finished steel:
Capacities & Capacity utilization Production and Demand
Source: CARE Research
Sectors driving the domestic demand for the steel industry
During FY03 to FY11, domestic steel consumption has almost doubled up, growing at a CAGR of about 9.5 percent
from 34 mn tonnes to 69 mn tonnes. The Indian steel industry has been closely following the robust growth in
demand by increasing the domestic capacity at an almost similar pace from 40 mn tonnes to about 80 mn tonnes
during the same period. Domestic steel production also increased at a CAGR of 7.5% from 37 mn tonnes to 66 mn
tones.
Sectoral demand for long products (FY11) Sectoral demand for long products (FY15E)
Source: CARE Research

SARDA ENERGY & MINERALS LIMITED
17 www.careratings.com
EQUIGRADE
Consolidated Income Statement
(Rs Crores) FY09 FY10 FY11 FY12 FY13E FY14E
Operating Income 949 528 891 1,108 1,444 1,884 EBITDA 224 81 138 168 291 402
Depreciation and amortisation 28 41 60 65 96 128
EBIT 196 40 78 103 195 275
Interest 1 0 36 72 107 149
PBT 159 159 93 79 108 144
Ordinary PAT (After minority interest) 133 144 72 88 73 101
PAT (After minority interest) 129 80 56 84 73 101
Fully Diluted Earnings Per Share* (Rs.) 37.8 23.4 15.6 23.4 20.3 28.1
Dividend, including tax 10 10 11 13 13 13
* Calculated based on ordinary PAT on Current Face Value of Rs. 10/- per share
Consolidated Balance Sheet
(Rs Crores) FY09 FY10 FY11 FY12 FY13E FY14E
Tangible Net worth (incl. Minority Interest) 525 677 834 957 1,018 1,106
Debt (incl. Preference Shares) 744 622 782 1,139 1,293 1,255
Deferred Liabilities / (Assets) 28 29 36 50 50 50
Capital Employed 1,297 1,328 1,653 2,146 2,360 2,411
Net Fixed Assets, incl. Capital WIP, net of reval reserve 714 906 1,097 1,413 1,317 1,189
Investments 377 211 198 379 379 379
Loans and Advances 107 73 146 194 194 194
Inventory 100 152 259 227 379 487
Receivables 23 23 53 44 62 81
Cash and Cash Equivalents 37 63 16 80 261 377
Current Assets, Loans and Advances 266 311 473 544 896 1,139
Less: Current Liabilities and Provisions 60 100 115 190 232 297
Total Assets 1,297 1,328 1,653 2,146 2,360 2,411
Ratios based on Consolidated Financials
FY09 FY10 FY11 FY12 FY13E FY14E
Growth in Operating Income 51.8% -44.4% 68.9% 24.4% 30.3% 30.5%
Growth in EBITDA 32.2% -63.7% 69.3% 22.3% 73.0% 38.3%
Growth in PAT 9.0% 8.9% -50.1% 22.4% -17.5% 38.8%
Growth in EPS 7.8% -38.0% -33.6% 50.1% -13.1% 38.8%
EBITDA Margin 23.6% 15.4% 15.4% 15.2% 20.1% 21.4%
PAT Margin 13.6% 15.1% 6.3% 7.6% 5.0% 5.4%
RoCE 16.0% 2.8% 4.1% 6.2% 6.0% 8.3%
RoE 27.8% 13.6% 7.7% 9.8% 7.8% 10.1%
Net Debt-Equity (times) 1.3 0.9 1.0 1.2 1.1 0.8
Interest Coverage (times) 340.3 253.9 3.9 2.3 2.7 2.7
Current Ratio (times) 4.4 3.1 4.1 2.9 3.9 3.8
Inventory Days 50 124 125 88 120 120
Receivable Days 9 16 22 14 16 16
Price / Earnings (P/E) Ratio 6.9 4.6 5.3 3.8
Price / Book Value(P/BV) Ratio
0.5 0.4 0.4 0.4
Enterprise Value (EV)/EBITDA 8.4 8.6 4.9 3.1
Source: Company, CARE Equity Research
FINANCIAL ANALYSIS

SARDA ENERGY & MINERALS LIMITED
www.careratings.com 18
EQUIGRADE
CARE EquiGrade Grid (CEG)
Through CEG, CARE Equity Research addresses two critical factors considered by an investor while investing in a particular
company’s equity shares:
1. Fundamentals: Whether the company is fundamentally sound with respect to its business, its financial position, its
management and its prospects.
2. Valuation: What is the Current Intrinsic Value (CIV) of the stock and how it compares vis-a-vis its Current Market Price
(CMP).
These factors are answered assigning quantitative grades to both these parameters. CEG is the snapshot of ‘Fundamental Grade’
and ‘Valuation Grade’ assigned by CARE Equity Research.
Fundamental Grade
This grade represents how sound the company is fundamentally, vis-à-vis other listed companies in India. This grade captures:
1. Business Fundamentals and Prospects
2. Financial Soundness
3. Management Quality
4. Corporate Governance Practices
The grade is assigned on a five-point scale as under:
CARE Fundamental Grade Evaluation
5/5 Strong Fundamentals
4/5 Very Good Fundamentals
3/5 Good Fundamentals
2/5 Modest Fundamentals
1/5 Weak Fundamentals
Valuation Grade
This grade represents the potential value in the company’s equity share for the investor over a 1-year period. The Current
Intrinsic Value (CIV) or the price arrived by CARE Equity Research on fundamental basis is compared with the Current Market
Price (CMP) of the stock and the grade is assigned based on the gap between CIV and CMP of the stock.
The grade is assigned on a five-point scale as under:
CARE Valuation Grade Evaluation
5/5 Considerable Upside Potential (>25% upside from CMP)
4/5 Moderate Upside Potential (10-25% upside from CMP)
3/5 Fairly Priced (+/-10% from CMP)
2/5 Moderate Downside Potential (10-25% downside from CMP)
1/5 Considerable Downside Potential (>25% downside from CMP)
Grading determination is a matter of experienced and holistic judgment, based on relevant quantitative and qualitative
factors of the company in relation to other listed companies.
EXPLANATION OF GRADES

SARDA ENERGY & MINERALS LIMITED
19 www.careratings.com
EQUIGRADE
DISCLOSURES
Each member of the team involved in the preparation of this grading report, hereby affirms that there
exists no conflict of interest that can bias the grading recommendation of the company.
This report has been sponsored by the company.
DISLCLAIMER
This report is prepared by Credit Analysis & REsearch Limited [CARE]. CARE has taken utmost care to ensure
accuracy and objectivity while developing this report based on information available in public domain or from
sources considered reliable. However, neither the accuracy nor completeness of information contained in this
report is guaranteed. Opinions expressed herein are our current opinions as on the date of this report.
CARE’s valuation of the security is mainly based on company-specific fundamental factors. Equity prices are
affected by both fundamental factors as well as market factors such as – liquidity, sentiment, broad market
direction etc. The impact of market factors can distort the price of the security thereby deviating from the
intrinsic value for extended period of time. CARE EquiGrade on a security should not be construed as
recommendation to buy, sell or hold a security; also it is not a comment on the suitability of the investment to
the reader. The subscriber / user assume the entire risk of any use made of this report or data herein. CARE
specifically states that it or any of its divisions or employees do not have any financial liabilities whatsoever to
the subscribers / users of this report. This report is for personal information only of the authorised recipient
in India only. This report or part of it should not be reproduced or redistributed or communicated directly or
indirectly in any form to any other person, especially outside India or published or copied for any purpose.
Published by Credit Analysis & REsearch Ltd., 4th Floor Godrej Coliseum, Off Eastern Express
Highway, Somaiya Hospital Road, Sion East, Mumbai – 400 022.
CARE is not responsible for any errors or omissions in analysis/inferences/views or for results obtained from
the use of information contained in this report and especially states that CARE (including all divisions) has no
financial liability whatsoever to the user of this product. This report is for the information of the intended
recipients only and no part of this report may be published or reproduced in any form or manner without
prior written permission of CARE.

SARDA ENERGY & MINERALS LIMITED
www.careratings.com 20
EQUIGRADE
Credit Analysis & REsearch Ltd. (CARE) is a full-service rating company that offers a wide range of rating and
grading services across sectors. CARE has an unparallel depth of expertise. CARE Ratings methodologies are in
line with the best international practices.
CREDIT ANALYSIS & RESEARCH LTD
HEAD OFFICE |Mr. R Suryanarayan | Cell: +91-9867365827| Tel: +91-22-6754 3602 | E-mail: [email protected] | 4th Floor, Godrej Coliseum, Somaiya Hospital Road, Off Eastern Express Highway, Sion (East), Mumbai - 400 022 | Tel: +91-022- 6754 3456 | E-mail: [email protected] | Fax: +91-022- 6754 3457
KOLKATA | Ms. Priti Agarwal | Cell: +91-98319 67110 | Tel: +91-33- 4018 1600/ 1602 | E- mail: [email protected] | 3rd Flr., Prasad Chambers (Shagun Mall Bldg), 10A, Shakespeare Sarani, Kolkata -700 071
CHENNAI | Mr. V Pradeep Kumar | Cell: +91 9840754521 | Tel: +91-44-2849 7812/2849 0811 | Fax: +91-44-2849 0876 | Email: [email protected] | Unit No. O-509/C, Spencer Plaza, 5th Floor, No. 769, Anna Salai, Chennai - 600 002
AHMEDABAD | Mr. Mehul Pandya | Cell: +91-98242 56265 | Tel: +91-79-40265656 | Fax: +91-79-40265657 | E-mail:[email protected] | 32, Titanium, Prahaladnagar Corporate Road, Satellite, Ahmedabad - 380 015.
NEW DELHI | Ms. Swati Agrawal | Cell: +91-98117 45677 | Tel: +91- 11- 2331 8701/ 2371 6199 | E-mail: [email protected] | 3rd Floor, B -47, Inner Circle, Near Plaza Cinema, Connaught Place, New Delhi - 110 001.
BENGALURU | Mr. Dinesh Sharma | Cell: +91-9900041975| Tel: +91-80-22117140 |
E-mail: [email protected] | Unit No. 8, I floor, Commander's Place, No. 6, Raja Ram Mohan Roy Road, (Opp. P F Office), Richmond Circle, Bangalore - 560 025.
HYDERABAD | Mr. Saikat Roy | Cell: +91-9820998779| Tel: +91-40-40102030 | E-mail: [email protected] | 401, Ashoka Scintilla | 3-6-520, Himayat Nagar | Hyderabad - 500 029.
PUNE | Mr. Rahul Patni | Cell: +91-78754 33355 | Tel: +91-20- 4000 9000 | E-mail: [email protected] | 9th Floor, Pride Kumar Senate, Plot No. 970, Bhamburda, Senapati Bapat Road, Shivaji Nagar, Pune - 411 015.
JAIPUR | Mr. Rahul Jain| Cell: +91 – 9314921496 | Tel: +91-0141-4020213/14 | E-mail: [email protected] | 304, Pashupati Akshat Heights, Plot No. D-91, Madho Singh Road, Near Collectorate Circle, Bani Park, Jaipur - 302016.
ABOUT US
Related Documents


