Resea r ch Re p o r t SARA Reading Components Tests, RISE Forms: Technical Adequacy and Test Design, 3rd Edition ETS RR–19-36 John Sabatini Jonathan Weeks Tenaha O’Reilly Kelly Bruce Jonathan Steinberg Szu-Fu Chao December 2019

Welcome message from author
This document is posted to help you gain knowledge. Please leave a comment to let me know what you think about it! Share it to your friends and learn new things together.
Transcript
Research
Rep
ort
SARA Reading ComponentsTests, RISE Forms: TechnicalAdequacy and Test Design,
3rd EditionETS RR–19-36
John SabatiniJonathan Weeks
Tenaha O’ReillyKelly Bruce
Jonathan SteinbergSzu-Fu Chao
December 2019
ETS Research Report Series
EIGNOR EXECUTIVE EDITOR
James CarlsonPrincipal Psychometrician
ASSOCIATE EDITORS
Beata Beigman KlebanovSenior Research Scientist
Heather BuzickResearch Scientist
Brent BridgemanDistinguished Presidential Appointee
Keelan EvaniniResearch Director
Marna Golub-SmithPrincipal Psychometrician
Shelby HabermanDistinguished Presidential Appointee
Anastassia LoukinaResearch Scientist
John MazzeoDistinguished Presidential Appointee
Donald PowersPrincipal Research Scientist
Gautam PuhanPrincipal Psychometrician
John SabatiniManaging Principal Research Scientist
Elizabeth StoneResearch Scientist
Rebecca ZwickDistinguished Presidential Appointee
PRODUCTION EDITORS
Kim FryerManager, Editing Services
Ayleen GontzSenior Editor
Since its 1947 founding, ETS has conducted and disseminated scientific research to support its products and services, andto advance the measurement and education fields. In keeping with these goals, ETS is committed to making its researchfreely available to the professional community and to the general public. Published accounts of ETS research, includingpapers in the ETS Research Report series, undergo a formal peer-review process by ETS staff to ensure that they meetestablished scientific and professional standards. All such ETS-conducted peer reviews are in addition to any reviews thatoutside organizations may provide as part of their own publication processes. Peer review notwithstanding, the positionsexpressed in the ETS Research Report series and other published accounts of ETS research are those of the authors andnot necessarily those of the Officers and Trustees of Educational Testing Service.
The Daniel Eignor Editorship is named in honor of Dr. Daniel R. Eignor, who from 2001 until 2011 served the Research andDevelopment division as Editor for the ETS Research Report series. The Eignor Editorship has been created to recognizethe pivotal leadership role that Dr. Eignor played in the research publication process at ETS.
ETS Research Report Series ISSN 2330-8516
RESEARCH REPORT
SARA Reading Components Tests, RISE Forms: TechnicalAdequacy and Test Design, 3rd Edition
John Sabatini, Jonathan Weeks, Tenaha O’Reilly, Kelly Bruce, Jonathan Steinberg, & Szu-Fu Chao
Educational Testing Service, Princeton, NJ
In this research report, we describe the conceptual foundation and measurement properties of the Reading Inventory and ScholasticEvaluation (RISE). The RISE is a 6-subtest, Web-administered reading skills components battery. We review the theoretical and empir-ical foundations of each subtest in the battery, as well as item designs. The results included in this report feature a calibrated item poolbased on a national sample of students, an extension of the vertical scale to span Grades 3–12, psychometric analyses of the data for eachsubtest, an item response theory scaling study for each of the subtests across the entire grade span, an evaluation of multidimensionality,an evaluation of differential item functioning for gender and race/ethnicity, and an expanded review of validity evidence.
Keywords Reading assessment; reading components; adolescent reading; Reading Inventory and Scholastic Evaluation (RISE);Web-administered assessment
doi:10.1002/ets2.12269
The Reading Inventory and Scholastic Evaluation (RISE) assessment is a Web-based assessment of foundational readingskills. The RISE is part of a larger componential reading assessment system called the Study Aid and Reading Assessment(SARA). It contains six subtests, each of which targets a specific component of reading that may be affecting a student’sprogress toward higher levels of reading comprehension proficiency. Reading components are defined here as foundationalsubskills related to reading comprehension performance. The enhanced RISE battery described in this report featuresmultiple forms arranged in grade bands and is appropriate for students in Grades 3–12.
Reading Comprehension and Foundational Reading Skills
Reading comprehension is a complex construct that involves the coordination of a number of theoretically integratedprocesses (Perfetti & Adlof, 2012). From recent reviews of the research literature (O’Reilly & Sabatini, 2013; O’Reilly &Sheehan, 2009; Sabatini & O’Reilly, 2013; Sabatini, O’Reilly, & Deane, 2013), the Common Core State Standards (Councilof Chief State School Officers [CCSSO] & National Governors Association [NGA], 2010), the Partnership for 21st CenturySkills (2004, 2008), and other seminal efforts in assessment innovation (Bennett, 2011; Bennett & Gitomer, 2009; GordonCommission, 2013; Pellegrino, Chudowsky, & Glaser, 2001), Sabatini and O’Reilly (2013) extracted a number of commonthemes in the reading research literature that are articulated in six principles to guide development of a reading assessmentframework. The first three principles are particularly relevant to the design of the RISE battery.
• Principle 1: Print skills and linguistic comprehension are both necessary components of reading comprehensionproficiency, though neither individually is sufficient to ensure proficiency (Adlof, Catts, & Little, 2006; Duke &Carlisle, 2011; Gough & Tunmer, 1986; Hoover & Gough, 1990; Vellutino, Tunmer, Jaccard, & Chen, 2007).
• Principle 2: Both breadth and depth of vocabulary knowledge are essential for understanding (Anderson & Free-body, 1981; Deane, 2012; Nagy & Scott, 2000; Ouellet, 2006).
• Principle 3: Readers construct mental models of text meaning at multiple levels, from literal to gist to complexsituation models (Kintsch, 1988, 1998; McNamara & Kintsch, 1996).
What do we mean by foundational skills? Following Principle 1, foundational reading skills enable students to decodeprinted text, recognize words, and read fluently. Following Principle 2, it is foundational to have an extensive generalvocabulary and knowledge of morphological variants or families of words. Finally, following Principle 3, students should
Corresponding author: J. Sabatini, E-mail: [email protected]
ETS Research Report No. RR-19-36. © 2019 Educational Testing Service 1
J. Sabatini et al. SARA Reading Components Tests, RISE Forms
be able to build a mental model of text meaning at various levels of sophistication. At a basic comprehension level, studentsneed to be able to understand and encode the meaning of single sentences—which themselves might be quite complex.They should be able to read continuous text fluently and efficiently (at an appropriate rate for their grade levels) to get thegist of the meanings. They should also be able to build more complex mental representations of continuous text that mayinclude identifying main ideas, locating details, or making cross-sentence inferences. These are the skills targeted in theRISE assessment.1
Ideally, all U.S.-educated students would have robust foundational reading skills in place by around the end of Grade3 or the beginning of Grade 4. Grade 4 is an important milestone in U.S. schools because the nature and demands ofreading change qualitatively. This grade typically marks what Chall (1967) referred to as the transition from learning toread to reading to learn. From Grade 4 on, U.S. students can expect to see an increasing quantity of content area readingand learning in academic subjects such as literature, science, and social studies.
For the typically progressing, on-grade-level, college-ready/bound learner, the reading load will increase every yearthrough primary, middle, and secondary school. Students will be assigned more pages to read in more diverse topicsand content areas. Consequently, they will need to learn a wider range of vocabulary. They will find that sentences havegreater linguistic complexity; that is, the sentences are longer and include multiple phrases and clauses, and the syntacticstructures are also more complex. Not only are the texts getting longer and more complex but so also are the tasks anddemands placed on students to understand and think critically about the content of those texts.
Remarkably, on-grade-level readers keep up with the accelerating reading demands of school curricula. Unfortunately,those with weak foundational skills are likely to fall further and further behind, unless they are provided appropriatehelp. The intention of the RISE battery is to identify relative weaknesses in foundational reading skills that may impedeexpected grade-level progress toward higher standards of reading proficiency.
Conceptual Framework and Test Design
Conceptual Framework
The sequence of six subtests in the RISE assessment forms a rough continuum of foundational skills from recognizingor decoding words to understanding the meanings of words and sentences to building meaning from passages. Readingand psycholinguistic research has documented the nature of processing and its importance to reading or language com-prehension; only some of this research is cited in this report (for more comprehensive reviews, see Carlisle & Rice, 2002;García & Cain, 2014; Snow, 2002).
Even though these components form a continuum theoretically, it would be a mistake to think of the reading process asstrictly hierarchical in practice, nor do the foundational skills develop in isolation. Students do not need to master wordrecognition and decoding skills fully before they can construct some meaning from text. It takes only recognition of anoun and a verb to begin to construct a meaningful proposition. In fact, individuals reading a passage will likely bringto bear all of their language, reading, and thinking skills as well as relevant world knowledge in understanding texts. Thisinteractive reading process that combines bottom-up skills (such as word decoding) and top-down processes (such asmaking an inference based on one’s knowledge of the context) is characteristic of reading at any developmental or abilitylevel (Rumelhart & McClelland, 1982).
One might see it as an advantage that one can leverage skills at any level of processing toward understanding text.Unfortunately, there is a price to pay when some of those skills are weak or inefficient. A substantial body of research hassupported the basic tenets of Perfetti’s (1985, 1993) verbal efficiency theory, which posits that weak lower level skills willdiminish cognitive resources that can be applied to higher level comprehension and reasoning (e.g., Walczyk, Marsiglia,Bryan, & Naquin, 2001).
One of the key findings from this line of research is that although both skilled and unskilled readers could makeinferences from sentence context in identifying (recognizing) a word that was already in their mental lexicons (i.e., aword that they already knew the meaning of when they heard it in speech), skilled readers could recognize the wordrapidly, with ease, and with minimal attention, that is, with automaticity (LaBerge & Samuels, 1974), without any context.This efficiency of word recognition conserves processing resources that the skilled reader could deploy for higher levelprocesses, such as making inferences or reasoning about the text (Perfetti, 1993). Less skilled readers, on the other hand,relied more on the context, thus expending cognitive effort and attention that were no longer available for higher level
2 ETS Research Report No. RR-19-36. © 2019 Educational Testing Service
J. Sabatini et al. SARA Reading Components Tests, RISE Forms
reasoning and understanding of text (Perfetti, 1985, 1995). On the basis of the stability over time of this research-basedtenet of reading development, we concluded that it would be worthwhile to measure the foundational skills separatelyand in addition to overall reading comprehension ability. We determined that this was especially important for studentsat risk of falling behind grade-level expectations, to isolate whether specific barriers were impeding expected growth inreading comprehension.
Measuring discrete component skills, however, requires designing test items that minimize the individual’s ability toborrow skills and knowledge from other strengths the individual may possess. This approach is somewhat contrary tothe expectation of interactive processing in typical reading for understanding but necessary if one wants to be confidentabout the level of an individual’s foundational subskills. Thus the RISE subtests target (a) decoding and recognizing wordsin isolation; (b) recognizing meaning or semantic relationships of individual words; (c) using knowledge of word parts(morphosyntactics) to identify which word fits the meaning and syntax of a sentence; (d) building meaning from sentencesby understanding causal connectors, pronouns, and relationships among terms; (e) reading for basic understanding withfluency; and finally, (f) comprehending the basic meaning of passages.
Note that some overlap of skills is inevitable, especially as each subsequent component skill requires some prerequisiteknowledge and skills to support its execution. One cannot build meaning from a sentence if one does not understand orrecognize most of the words in the sentence. We have taken some steps to minimize this overlap. For example, the wordsin sentence items were chosen to be of high frequency; therefore, it is more likely that even poor readers will know all ofthe words. When the design works, most of the processing will be directed toward the targeted cognitive skill of buildingsentence meaning, not toward recognizing the words. However, one can expect that the sentence task is also partiallymeasuring the recognition of words, and that will impact overall performance. For this reason, as we describe later, it isbest to interpret scores from most distal (i.e., decoding and word recognition) to more proximal (i.e., sentence or basicreading efficiency) to reading comprehension. In this way, one can take into account the impact weak lower level skillsmay be exerting on subsequent subtest performances.
In the following sections, each of the RISE subtests is described in more detail, accompanied by a brief explanatorynote citing some of the pertinent empirical research.
Subtest Content Framework
Overall, the content of the RISE subtests is modeled on the kinds of academic materials (words, sentences, and passages)that students could encounter in their school curricula, as determined by a review of formal and informal curricularmaterials targeted for this population. Other batteries designed for clinical use (e.g., Woodcock–Johnson III; Wood-cock, McGrew, & Mather, 2001) utilize similar subtest constructs and item designs. However, most of these batterieswere designed to be administered to students in a one-on-one setting and are usually administered and interpreted byeducational psychologists for high-stakes diagnostic purposes, such as identification of specific reading disabilities. Theindividualized and usually paper-based administration of these batteries further limits their efficiency in larger scalesettings.
In contrast, the RISE assessment was designed to target a wider range of below-grade-level at-risk readers. Its comput-erized administration, relatively brief subtest and session duration (i.e., 45–60 min), and automated scoring and reportingsupport scalable applications at the classroom, school, or district level. It is not intended to replace clinical instruments butrather to supplement these by providing evidence of instructionally malleable targets of readers’ strengths and weaknesses(e.g., Kim et al., 2017). It can also be an indicator that a particular student should be referred for further clinical diagnostictesting. In line with this broader purpose, item content is drawn primarily from curricular content that one might find inU.S. schools. The theoretical foundations for each construct were reviewed; however, choices for specific items also tookinto consideration the likelihood that students might encounter reading content similar to that in the RISE subtests. Inthe following sections, we provide brief reviews of the literature and form of each subtest.
Subtest 1: Word Recognition and Decoding
Most models of reading development recognize the centrality of rapid, automatic, visual word recognition skills andknowledge to reading ability (Adams, 1990; Ehri, 2005; García & Cain, 2014; Perfetti, 1985; Verhoeven & Perfetti, 2011).Two basic behavioral skills are indicative of proficiency in word recognition: (a) the accumulation of sight word knowledge
ETS Research Report No. RR-19-36. © 2019 Educational Testing Service 3
J. Sabatini et al. SARA Reading Components Tests, RISE Forms
of real words in the language and (b) (phonological) decoding, which enables the generation of plausible pronunciationsof printed words and, conversely, plausible phonetic spellings of heard words. Decoding has been described as the fun-damental word learning mechanism in alphabetic languages (Share, 1997) and therefore as an essential component tomeasure directly.
Many non–reading specialists think of decoding as a simple skill mastered by most children in first or second grade,consisting primarily of mappings of individual letters to sounds. True, the mapping of sight–sound correspondencesis a fundamental premise of decoding. However, in English, the underlying cognitive ability needs to be much morecomputationally complex because of the highly irregular sight–sound correspondence patterns of the English languageand the influence on pronunciation of different stress patterns in multisyllabic words (Venezky, 1995, 1999). In fact, it islikely that decoding skills develop across the life-span, as the cognitive system adapts to reading the hundreds of thousandsof words in texts such as those borrowed from languages other than English (e.g., entrée). In fact, the primary symptom ofreading disability or dyslexia is weakness in the accuracy and automaticity of decoding words (Olson, 2007; Seidenberg,2017).
We reserve the term decoding for sounding out novel words that the reader has never or rarely seen before encoun-tering these in a text. This may include dictionary terms or proper nouns, such as product, person, or place names (e.g.,Atorvastatin or Benin). In the RISE task, to ensure that the reader has never encountered a word before, we use made-upnonwords (e.g., plign).
Reading words that have never been encountered before is one kind of decoding; another is reading a word that is inone’s spoken mental lexicon for the first time. In this instance, the processing goal is to sound out the word based on itsspelling and match the pronunciation to a word one knows when one hears it. Because we learn words both from readingand from hearing them, it is beneficial to have skills in matching spellings to sounds of words. In the RISE assessment, weuse pseudohomophones to test this ability. Pseudohomophones use nonconventional spellings that would sound like realwords when pronounced out loud to oneself (e.g., maik–make).
We use the term word recognition (sight words) when readers have likely encountered the word in print numerous timesand have built up a memory representation that allows them to identify the word automatically, without the consciouseffort of sounding it out to themselves (Ehri, 2005; Rayner, 1997; Reynolds, 2000). Over time, with a wide experience ofreading, many of the frequent words in the language become sight words. This allows word reading to become highlyefficient, as the reader does not require context to help identify words and can therefore use the additional cognitiveresources for comprehension (Tannenbaum, Torgesen, & Wagner, 2006). In the RISE assessment, we chose words likelyto be encountered in late elementary and middle grade subject areas or literary texts.
Thus, the RISE Word Recognition and Decoding subtest uses three item types to measure a student’s ability both torecognize sight words and to decode nonwords: (a) real words, selected to cover a wide frequency range, with a bias towardincluding the kinds of content area words that middle school students will encounter in their school curricula (examplesof real words are elect, mineral, and symbolic); (b) nonwords,2 selected to cover a range of spelling and morphologicalpatterns (examples of nonwords are clort, plign, and phadintry); and (c) pseudohomophones, nonwords that nonethelesswhen pronounced sound exactly like real English words (examples of pseudohomophones are whissle, brane, and rooler).Students are presented with one of the item types on the screen at a time and are asked to decide if what they see (a)is a real word, (b) is not a real word, or (c) sounds exactly like a real word. Students are given practice and examples tounderstand how to complete the task successfully.
Subtest 2: Vocabulary
Knowing the meanings of words is essential to the reading process (Beck & McKeown, 1991; Carroll, 1993; Cunningham &Stanovich, 1997; Daneman, 1988; Hirsch, 2003; Perfetti, 1994), with correlations between vocabulary and reading compre-hension assessments ranging from .6 to .7 (Anderson & Freebody, 1981). Individual differences in vocabulary knowledgeemerge as early as preschool, and these differences tend to grow over time (Graves, Brunetti, & Slater, 1982; Graves &Slater, 1987; Hart & Risley, 1995). Vocabulary development is a critical part of learning to read well and appears to be asignificant aspect of the gap between competent and struggling readers (National Center for Education Statistics, 2012).
In middle school, students begin to encounter general purpose academic words as well as more specialized contentarea words. Beck, McKeown, and Kucan (2002, 2008) distinguished these in their tier word system, a concept specificallyreferred to in the Common Core State Standards (CCSSO & NGA, 2010). Specifically, Tier 1 words are those used in
4 ETS Research Report No. RR-19-36. © 2019 Educational Testing Service
J. Sabatini et al. SARA Reading Components Tests, RISE Forms
everyday conversation, Tier 2 words are general academic words, and Tier 3 words are found in specific domains andless frequently in non-discipline-specific usage (Beck et al., 2002, 2008; Coleman & Pimentel, 2011). All three tiers arenecessary to academic content learning, but the strategies for learning these may differ. The RISE Vocabulary subtest itemset includes both Tier 2 and Tier 3 words. The response sets were designed such that the correct answer was either asynonym of the target or a meaning associate (e.g., tree–forest).
Another challenge of academic reading is the prevalence of polysemous words, that is, words with more than one mean-ing (Gernsbacher & Faust, 1991; Kang, 1993; McNamara & McDaniel, 2004). Papamihiel, Lake, and Rice (2005) specificallydiscussed the difficulties of content-specific polysemous words, where the more common meanings may lead to miscon-ceptions when using those meanings to infer the more specific content meanings (e.g., prime meaning “high quality”versus referring to prime numbers in mathematics). RISE vocabulary items often probe these secondary meanings.
Learning word meanings is not entirely distinct from learning their spellings and pronunciations. Perfetti and Hart(2001) described word knowledge as a complex assemblage of representations that vary both in the information thesecontain and in the degree to which these have been fully specified (i.e., in terms of orthographic, phonemic, syntactic, andsemantic quality), which they refer to as the lexical quality hypothesis. Thus, an expected relationship exists between theword recognition and decoding subtest and the vocabulary subtest.
As noted, in the RISE Vocabulary subtest, the response sets were designed such that the correct answer for each itemwas either a synonym of the target or a meaning associate3:
• An example of a synonym item is data (information, schedule, star).• An example of a meaning associate item is thermal (heat, bridge, evil).
Students are given practice and examples to understand how to complete the task successfully.
Subtest 3: Morphology
Morphemes are the basic building blocks of meaning in language. Anglin (1993) and Nagy and Anderson (1984) estimatedthat more than half of English words are morphologically complex, that is, made up of more than one morpheme.
Morphological awareness is the extent to which students recognize the role that morphemes play in words—both ina semantic and syntactic sense. A growing body of research suggests that morphological awareness is related to readingcomprehension and the subskills that underlie reading (e.g., Carlisle, 2000; Carlisle & Stone, 2003; Fowler & Lieberman,1995; Hogan, Bridges, Justice, & Cain, 2011; Kuo & Anderson, 2006; Tong, Deacon, Kirby, Cain, & Parrila, 2011). Nagy,Berninger, and Abbott (2006) concluded that the results of various studies are “consistent with a model of written wordlearning in which we draw on computations of the interrelationships among phonological, morphological, and ortho-graphic word forms and their parts” (p. 136).
Poor morphological awareness can be a source of reading comprehension difficulties among native speakers of English(Berninger, Abbott, Nagy, & Carlisle, 2010; Carlisle, 2000; Deacon & Kirby, 2004; Nagy et al., 2006; Stahl & Nagy, 2006)and even more so among English learners (Carlo et al., 2004; Kieffer & Lesaux, 2007, 2008). Morphological learningactivities should address both roots and affixes and can occur both in isolation and in a reading context where meaningcan be derived or guessed (Proctor et al., 2011). Evidence has supported the teaching of morphological structure,especially with English language learners (Carlo et al., 2004; Kieffer & Lesaux, 2007; Lesaux, Kieffer, Faller, & Kelley,2010; Proctor et al., 2011).
The RISE Morphology subtest focuses on derivational morphology—those words that have prefixes and/or suffixesattached to a root. We use the cloze (fill in the blank) item type for this subtest. Thus, one might also consider these itemsmorphosyntactic in that some items can be answered correctly by understanding how a suffix alters the part of speechof a word and how that would fit a sentence context grammatically. However, understanding how the affixes affect themeaning of the word in the sentence context is always sufficient for answering the item correctly.
The sentences we designed featured straightforward syntactic structures and relatively easy ancillary vocabulary so thatthe students would concentrate on the derived words. See the following examples.
The target derived form is of high frequency:For many people, birthdays can be times of great __________.(happiness, unhappy, happily)
ETS Research Report No. RR-19-36. © 2019 Educational Testing Service 5
J. Sabatini et al. SARA Reading Components Tests, RISE Forms
The target derived form is of medium frequency:She is good at many sports, but her __________ is basketball.(specialty, specialize, specialist)
The target derived form is of low frequency:That man treats everyone with respect and __________.(civility, civilization, civilian)
Students are given practice and examples to understand how to complete the task successfully.
Subtest 4: Sentence Processing
A variety of research studies have shown that the sentence is a natural breakpoint in the reading of continuous text (e.g.,Kintsch, 1998). A skilled reader will generally pause at the end of each sentence to encode the propositions of the sentence,make anaphoric inferences, relate meaning units to background knowledge and to previous memory of the passage as itunfolds, and decide which meaning elements to hold in working memory. Thus, every sentence requires some syntacticand semantic processing. In middle school, students encounter texts that contain sentences of a variety of lengths andsyntactic structures.
Carlisle and Rice (2002) noted several ways in which compound and complex sentences may pose difficulty for strug-gling readers. Perhaps most obviously, complex sentences are often longer, and this places increased demands on workingmemory. Also, complex sentences often have multiple embedded phrases and clauses that increase the distance betweensubjects and predicates, a feature known to increase processing demands (e.g., Mann, Shankweiler, & Smith, 1984). Keyto understanding complex sentences is efficient processing of connectors. Relationships that are signaled may be tempo-ral (e.g., before), causal (e.g., because), adversative (e.g., although), or conditional (e.g., if). Empirical studies have beenconducted examining the difficulties learners often have in adequately processing these kinds of relations (e.g., McClure& Steffensen, 1985).
In the RISE Sentence Processing subtest, we chose to focus on the student’s ability to construct basic meaning fromprint at the sentence level. The cloze items in the subtest require the student to process all parts of the sentence to selectthe correct answer among three choices. Some examples follow.
The dog that chased the cat around the yard spent all night __________.(barking, meowing, writing)Shouting in a voice louder than her friend Cindy’s, Tonya asked Joe to unlock the door, but __________ didn’trespond.(he, she, they)
Students are given practice and examples to understand how to complete the task successfully.
Subtest 5: Efficiency of Basic Reading Comprehension—Maze
Skilled reading is rapid, efficient, and fluent (silent or aloud). In recent research, a silent reading assessment taskdesign—known as the maze selection technique—has gained empirical support as an indicator of basic reading effi-ciency and comprehension (Fuchs & Fuchs, 1992; Shin, Deno, & Espin, 2000; Wayman, Wallace, Wiley, Ticha, & Espin,2007). The design uses a forced-choice cloze paradigm—that is, in each sentence within a passage, one of the words hasbeen replaced with three choices, only one of which makes sense in the sentence.
Fuchs and Fuchs (1992) found correlations of .83 between scores on maze and a read-aloud task and .77 betweenscores on maze and the reading comprehension subtest of the Stanford Achievement Test (Gardner, Rudman, Karlsen, &Merwin, 1982). In their extensive review of curriculum-based measures, Wayman et al. (2007) concluded that the evidencesupported the use of the maze-style task structure with older middle school students, whereas word identification andreading aloud were more appropriate for younger readers.
While the empirical support for the maze selection task has been strong, less has been written about the underlying con-struct the task represents. This partially stems from its utilitarian origins as a quick, efficient progress monitoring indicator
6 ETS Research Report No. RR-19-36. © 2019 Educational Testing Service
J. Sabatini et al. SARA Reading Components Tests, RISE Forms
of whether students in special education programs were responding to instruction or needed further support. Our analysisof the task demands has led us to label the task as efficiency of basic reading comprehension and position it as an aspect ofbuilding models of text at various levels of sophistication. In the case of the maze task, this level of sophistication is shallow.Accurately selecting the correct response for each item does require that the reader is comprehending each sentence andlikely building a cross-sentence general model of the passage’s gist. However, because the task is timed, the simultaneousdemand that students read quickly also captures an indicator of silent reading fluency or efficiency. In fact, Espin, Deno,Maruyama, and Cohen (1989) reported correlations with oral reading fluency of .77–.86 for third to fifth graders.
The RISE Efficiency of Basic Reading Comprehension subtest comprises expository texts. Students have 3 minutes tocomplete each passage. The following is an excerpt from a passage:
During the Neolithic Age, humans developed agriculture—what we think of as farming. Agriculture meant thatpeople stayed in one place to grow their crops / baskets / rings. They stopped moving from place to place to followherds of animals or to find new wild plants to eat / win / cry. And because they were settling down, people builtpermanent shelters / planets / secrets.
Students are given practice and examples to understand how to complete the task successfully.
Subtest 6: Reading Comprehension
Kintsch’s (1998) Construction Integration model focuses on three levels of understanding: the surface level (a verbatimunderstanding of the words and phrases), the textbase (the “gist” understanding of what is being read), and the situationmodel (McNamara & Kintsch, 1996), which is the deepest level of understanding. In the reading literacy assessment frame-work developed by Sabatini, O’Reilly, and Deane (2013), five dimensions of reading are described: print, verbal, discourse,conceptual, and social. The reading comprehension subtest targets the discourse level. That is, an attempt was made tolimit the number of deeper conceptual or social reasoning questions on the subtest. That does not mean that all the ques-tions are easy. In fact, the items show a range of difficulties. However, the reading comprehension subtest does not attemptto cover the broader range of task demands that are addressed in scenario-based assessments (O’Reilly & Sabatini, 2013).
In the RISE Reading Comprehension subtest, the task focuses on the first two levels of understanding. An excerpt froma passage and two related questions follow:
To build their houses, the people of this Age often stacked mud bricks together to make rectangular or round build-ings. At first, these houses had one big room. Gradually, they changed to include several rooms that could be usedfor different purposes. People dug pits for cooking inside the houses, and they may have filled the pits with waterand dropped in hot stones to boil it. You can think of these as the first kitchens.
The emergence of permanent shelters had a dramatic effect on humans. They gave people more protection fromthe weather and from wild animals. Along with the crops that provided more food than hunting and gathering,permanent housing allowed people to live together in larger communities.
Example Question 1 (Locate/Paraphrase): What did people use to heat water in Neolithic houses? (hot rocks, burn-ing sticks, the sun, mud)
Example Question 2 (Low-Level Inference): In the sentence “They gave people more protection from the weatherand from wild animals,” the word “they” refers to: (permanent shelters, caves, herds, agriculture)
In summary, the RISE battery includes a wide range of foundational skills. Not only are these subskills supported bythe empirical literature but they are also potentially useful for diagnosis and subsequent intervention. In the next section,we describe the details of the current study, including the methods, sample, analyses, and results.
Methods
Sample
Samples were collected over three phases. Phase I and II data comprise students from a large, urban school district in theMid-Atlantic region of the United States. Phase I occurred in Winter–Spring 2011 and continued each fall and spring
ETS Research Report No. RR-19-36. © 2019 Educational Testing Service 7
J. Sabatini et al. SARA Reading Components Tests, RISE Forms
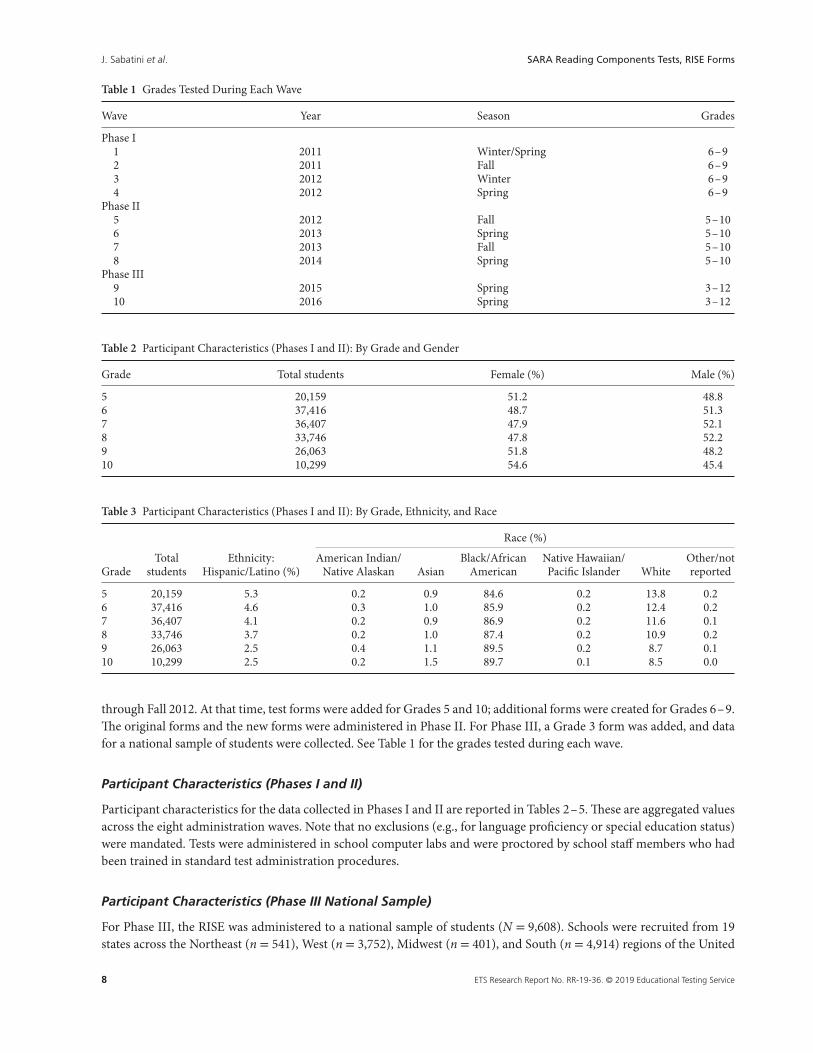
Table 1 Grades Tested During Each Wave
Wave Year Season Grades
Phase I1 2011 Winter/Spring 6–92 2011 Fall 6–93 2012 Winter 6–94 2012 Spring 6–9
Phase II5 2012 Fall 5–106 2013 Spring 5–107 2013 Fall 5–108 2014 Spring 5–10
Phase III9 2015 Spring 3–1210 2016 Spring 3–12
Table 2 Participant Characteristics (Phases I and II): By Grade and Gender
Grade Total students Female (%) Male (%)
5 20,159 51.2 48.86 37,416 48.7 51.37 36,407 47.9 52.18 33,746 47.8 52.29 26,063 51.8 48.210 10,299 54.6 45.4
Table 3 Participant Characteristics (Phases I and II): By Grade, Ethnicity, and Race
Race (%)
GradeTotal
studentsEthnicity:
Hispanic/Latino (%)American Indian/
Native Alaskan AsianBlack/African
AmericanNative Hawaiian/Pacific Islander White
Other/notreported
5 20,159 5.3 0.2 0.9 84.6 0.2 13.8 0.26 37,416 4.6 0.3 1.0 85.9 0.2 12.4 0.27 36,407 4.1 0.2 0.9 86.9 0.2 11.6 0.18 33,746 3.7 0.2 1.0 87.4 0.2 10.9 0.29 26,063 2.5 0.4 1.1 89.5 0.2 8.7 0.110 10,299 2.5 0.2 1.5 89.7 0.1 8.5 0.0
through Fall 2012. At that time, test forms were added for Grades 5 and 10; additional forms were created for Grades 6–9.The original forms and the new forms were administered in Phase II. For Phase III, a Grade 3 form was added, and datafor a national sample of students were collected. See Table 1 for the grades tested during each wave.
Participant Characteristics (Phases I and II)
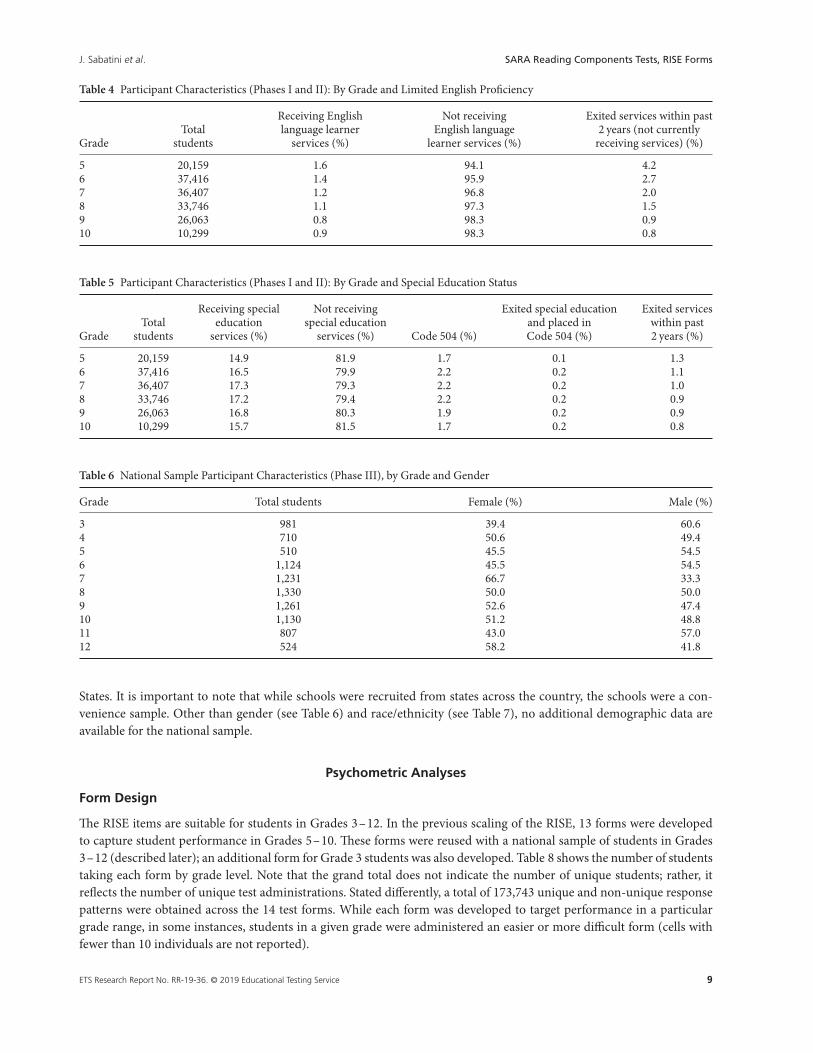
Participant characteristics for the data collected in Phases I and II are reported in Tables 2–5. These are aggregated valuesacross the eight administration waves. Note that no exclusions (e.g., for language proficiency or special education status)were mandated. Tests were administered in school computer labs and were proctored by school staff members who hadbeen trained in standard test administration procedures.
Participant Characteristics (Phase III National Sample)
For Phase III, the RISE was administered to a national sample of students (N = 9,608). Schools were recruited from 19states across the Northeast (n = 541), West (n = 3,752), Midwest (n = 401), and South (n = 4,914) regions of the United
8 ETS Research Report No. RR-19-36. © 2019 Educational Testing Service
J. Sabatini et al. SARA Reading Components Tests, RISE Forms
Table 4 Participant Characteristics (Phases I and II): By Grade and Limited English Proficiency
GradeTotal
students
Receiving Englishlanguage learner
services (%)
Not receivingEnglish language
learner services (%)
Exited services within past2 years (not currently
receiving services) (%)
5 20,159 1.6 94.1 4.26 37,416 1.4 95.9 2.77 36,407 1.2 96.8 2.08 33,746 1.1 97.3 1.59 26,063 0.8 98.3 0.910 10,299 0.9 98.3 0.8
Table 5 Participant Characteristics (Phases I and II): By Grade and Special Education Status
GradeTotal
students
Receiving specialeducation
services (%)
Not receivingspecial education
services (%) Code 504 (%)
Exited special educationand placed inCode 504 (%)
Exited serviceswithin past2 years (%)
5 20,159 14.9 81.9 1.7 0.1 1.36 37,416 16.5 79.9 2.2 0.2 1.17 36,407 17.3 79.3 2.2 0.2 1.08 33,746 17.2 79.4 2.2 0.2 0.99 26,063 16.8 80.3 1.9 0.2 0.910 10,299 15.7 81.5 1.7 0.2 0.8
Table 6 National Sample Participant Characteristics (Phase III), by Grade and Gender
Grade Total students Female (%) Male (%)
3 981 39.4 60.64 710 50.6 49.45 510 45.5 54.56 1,124 45.5 54.57 1,231 66.7 33.38 1,330 50.0 50.09 1,261 52.6 47.410 1,130 51.2 48.811 807 43.0 57.012 524 58.2 41.8
States. It is important to note that while schools were recruited from states across the country, the schools were a con-venience sample. Other than gender (see Table 6) and race/ethnicity (see Table 7), no additional demographic data areavailable for the national sample.
Psychometric Analyses
Form Design
The RISE items are suitable for students in Grades 3–12. In the previous scaling of the RISE, 13 forms were developedto capture student performance in Grades 5–10. These forms were reused with a national sample of students in Grades3–12 (described later); an additional form for Grade 3 students was also developed. Table 8 shows the number of studentstaking each form by grade level. Note that the grand total does not indicate the number of unique students; rather, itreflects the number of unique test administrations. Stated differently, a total of 173,743 unique and non-unique responsepatterns were obtained across the 14 test forms. While each form was developed to target performance in a particulargrade range, in some instances, students in a given grade were administered an easier or more difficult form (cells withfewer than 10 individuals are not reported).
ETS Research Report No. RR-19-36. © 2019 Educational Testing Service 9
J. Sabatini et al. SARA Reading Components Tests, RISE Forms
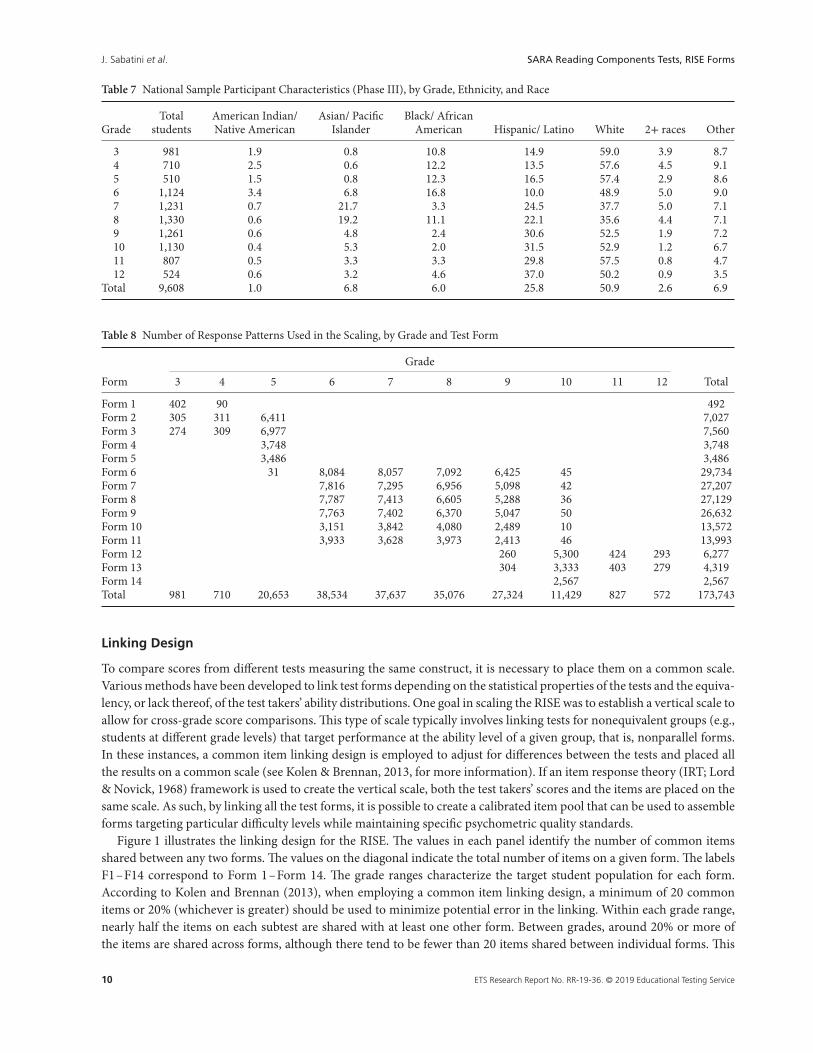
Table 7 National Sample Participant Characteristics (Phase III), by Grade, Ethnicity, and Race
GradeTotal
studentsAmerican Indian/Native American
Asian/ PacificIslander
Black/ AfricanAmerican Hispanic/ Latino White 2+ races Other
3 981 1.9 0.8 10.8 14.9 59.0 3.9 8.74 710 2.5 0.6 12.2 13.5 57.6 4.5 9.15 510 1.5 0.8 12.3 16.5 57.4 2.9 8.66 1,124 3.4 6.8 16.8 10.0 48.9 5.0 9.07 1,231 0.7 21.7 3.3 24.5 37.7 5.0 7.18 1,330 0.6 19.2 11.1 22.1 35.6 4.4 7.19 1,261 0.6 4.8 2.4 30.6 52.5 1.9 7.210 1,130 0.4 5.3 2.0 31.5 52.9 1.2 6.711 807 0.5 3.3 3.3 29.8 57.5 0.8 4.712 524 0.6 3.2 4.6 37.0 50.2 0.9 3.5
Total 9,608 1.0 6.8 6.0 25.8 50.9 2.6 6.9
Table 8 Number of Response Patterns Used in the Scaling, by Grade and Test Form
Grade
Form 3 4 5 6 7 8 9 10 11 12 Total
Form 1 402 90 492Form 2 305 311 6,411 7,027Form 3 274 309 6,977 7,560Form 4 3,748 3,748Form 5 3,486 3,486Form 6 31 8,084 8,057 7,092 6,425 45 29,734Form 7 7,816 7,295 6,956 5,098 42 27,207Form 8 7,787 7,413 6,605 5,288 36 27,129Form 9 7,763 7,402 6,370 5,047 50 26,632Form 10 3,151 3,842 4,080 2,489 10 13,572Form 11 3,933 3,628 3,973 2,413 46 13,993Form 12 260 5,300 424 293 6,277Form 13 304 3,333 403 279 4,319Form 14 2,567 2,567Total 981 710 20,653 38,534 37,637 35,076 27,324 11,429 827 572 173,743
Linking Design
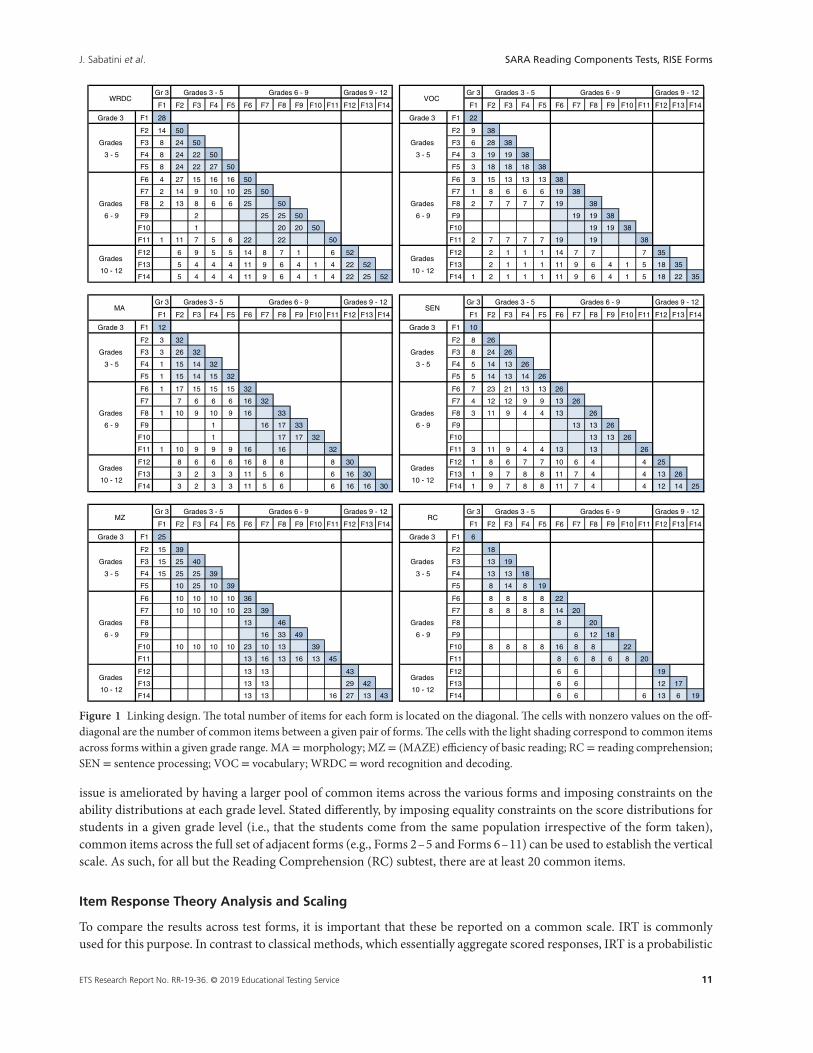
To compare scores from different tests measuring the same construct, it is necessary to place them on a common scale.Various methods have been developed to link test forms depending on the statistical properties of the tests and the equiva-lency, or lack thereof, of the test takers’ ability distributions. One goal in scaling the RISE was to establish a vertical scale toallow for cross-grade score comparisons. This type of scale typically involves linking tests for nonequivalent groups (e.g.,students at different grade levels) that target performance at the ability level of a given group, that is, nonparallel forms.In these instances, a common item linking design is employed to adjust for differences between the tests and placed allthe results on a common scale (see Kolen & Brennan, 2013, for more information). If an item response theory (IRT; Lord& Novick, 1968) framework is used to create the vertical scale, both the test takers’ scores and the items are placed on thesame scale. As such, by linking all the test forms, it is possible to create a calibrated item pool that can be used to assembleforms targeting particular difficulty levels while maintaining specific psychometric quality standards.
Figure 1 illustrates the linking design for the RISE. The values in each panel identify the number of common itemsshared between any two forms. The values on the diagonal indicate the total number of items on a given form. The labelsF1–F14 correspond to Form 1–Form 14. The grade ranges characterize the target student population for each form.According to Kolen and Brennan (2013), when employing a common item linking design, a minimum of 20 commonitems or 20% (whichever is greater) should be used to minimize potential error in the linking. Within each grade range,nearly half the items on each subtest are shared with at least one other form. Between grades, around 20% or more ofthe items are shared across forms, although there tend to be fewer than 20 items shared between individual forms. This
10 ETS Research Report No. RR-19-36. © 2019 Educational Testing Service
J. Sabatini et al. SARA Reading Components Tests, RISE Forms
Gr 3 Gr 3
F1 F2 F3 F4 F5 F6 F7 F8 F9 F10 F11 F12 F13 F14 F1 F2 F3 F4 F5 F6 F7 F8 F9 F10 F11 F12 F13 F14
Grade 3 F1 28 Grade 3 F1 22
F2 14 50 F2 9 38
F3 8 24 50 F3 6 28 38
F4 8 24 22 50 F4 3 19 19 38
F5 8 24 22 27 50 F5 3 18 18 18 38
F6 4 27 15 16 16 50 F6 3 15 13 13 13 38
F7 2 14 9 10 10 25 50 F7 1 8 6 6 6 19 38
F8 2 13 8 6 6 25 50 F8 2 7 7 7 7 19 38
F9 2 25 25 50 F9 19 19 38
F10 1 20 20 50 F10 19 19 38
F11 1 11 7 5 6 22 22 50 F11 2 7 7 7 7 19 19 38
F12 6 9 5 5 14 8 7 1 6 52 F12 2 1 1 1 14 7 7 7 35
F13 5 4 4 4 11 9 6 4 1 4 22 52 F13 2 1 1 1 11 9 6 4 1 5 18 35
F14 5 4 4 4 11 9 6 4 1 4 22 25 52 F14 1 2 1 1 1 11 9 6 4 1 5 18 22 35
Gr 3 Gr 3
F1 F2 F3 F4 F5 F6 F7 F8 F9 F10 F11 F12 F13 F14 F1 F2 F3 F4 F5 F6 F7 F8 F9 F10 F11 F12 F13 F14
Grade 3 F1 12 Grade 3 F1 10
F2 3 32 F2 8 26
F3 3 26 32 F3 8 24 26
F4 1 15 14 32 F4 5 14 13 26
F5 1 15 14 15 32 F5 5 14 13 14 26
F6 1 17 15 15 15 32 F6 7 23 21 13 13 26
F7 7 6 6 6 16 32 F7 4 12 12 9 9 13 26
F8 1 10 9 10 9 16 33 F8 3 11 9 4 4 13 26
F9 1 16 17 33 F9 13 13 26
F10 1 17 17 32 F10 13 13 26
F11 1 10 9 9 9 16 16 32 F11 3 11 9 4 4 13 13 26
F12 8 6 6 6 16 8 8 8 30 F12 1 8 6 7 7 10 6 4 4 25
F13 3 2 3 3 11 5 6 6 16 30 F13 1 9 7 8 8 11 7 4 4 13 26
F14 3 2 3 3 11 5 6 6 16 16 30 F14 1 9 7 8 8 11 7 4 4 12 14 25
Gr 3 Gr 3
F1 F2 F3 F4 F5 F6 F7 F8 F9 F10 F11 F12 F13 F14 F1 F2 F3 F4 F5 F6 F7 F8 F9 F10 F11 F12 F13 F14
Grade 3 F1 25 Grade 3 F1 6
F2 15 39 F2 18
F3 15 25 40 F3 13 19
F4 15 25 25 39 F4 13 13 18
F5 10 25 10 39 F5 8 14 8 19
F6 10 10 10 10 36 F6 8 8 8 8 22
F7 10 10 10 10 23 39 F7 8 8 8 8 14 20
F8 13 46 F8 8 20
F9 16 33 49 F9 6 12 18
F10 10 10 10 10 23 10 13 39 F10 8 8 8 8 16 8 8 22
F11 13 16 13 16 13 45 F11 8 6 8 6 8 20
F12 13 13 43 F12 6 6 19
F13 13 13 29 42 F13 6 6 12 17
F14 13 13 16 27 13 43 F14 6 6 6 13 6 19
Grades
10 - 12
Grades
10 - 12
Grades 3 - 5 Grades 6 - 9 Grades 9 - 12
Grades
3 - 5
Grades
3 - 5
Grades
6 - 9
Grades
6 - 9
Grades
10 - 12
Grades
10 - 12
MZGrades 3 - 5 Grades 6 - 9 Grades 9 - 12
RC
Grades 3 - 5 Grades 6 - 9 Grades 9 - 12
Grades
3 - 5
Grades
3 - 5
Grades
6 - 9
Grades
6 - 9
Grades
10 - 12
Grades
10 - 12
MAGrades 3 - 5 Grades 6 - 9 Grades 9 - 12
SEN
Grades 6 - 9 Grades 9 - 12
Grades
3 - 5
Grades
3 - 5
Grades
6 - 9
Grades
6 - 9
WRDCGrades 3 - 5 Grades 6 - 9 Grades 9 - 12
VOCGrades 3 - 5
Figure 1 Linking design. The total number of items for each form is located on the diagonal. The cells with nonzero values on the off-diagonal are the number of common items between a given pair of forms. The cells with the light shading correspond to common itemsacross forms within a given grade range. MA = morphology; MZ = (MAZE) efficiency of basic reading; RC = reading comprehension;SEN = sentence processing; VOC = vocabulary; WRDC = word recognition and decoding.
issue is ameliorated by having a larger pool of common items across the various forms and imposing constraints on theability distributions at each grade level. Stated differently, by imposing equality constraints on the score distributions forstudents in a given grade level (i.e., that the students come from the same population irrespective of the form taken),common items across the full set of adjacent forms (e.g., Forms 2–5 and Forms 6–11) can be used to establish the verticalscale. As such, for all but the Reading Comprehension (RC) subtest, there are at least 20 common items.
Item Response Theory Analysis and Scaling
To compare the results across test forms, it is important that these be reported on a common scale. IRT is commonlyused for this purpose. In contrast to classical methods, which essentially aggregate scored responses, IRT is a probabilistic
ETS Research Report No. RR-19-36. © 2019 Educational Testing Service 11
J. Sabatini et al. SARA Reading Components Tests, RISE Forms
approach that relies on the pattern of item responses and item characteristics to obtain estimates of examinee ability. Letthe variable Xij represent the response of examinee i to item j, where Xij = 1 for a correct item response and Xij = 0 foran incorrect response. The item response curve for the two-parameter logistic (2PL) model (Birnbaum, 1968) takes thefollowing form:
P(
Xij = 1|θi, aj, bj
)=
exp[
1.7aj
(θi − bj
)]1 + exp
[1.7aj
(θi − bj
)] ,where θi is the individual’s ability on a single construct, aj is the item discrimination (slope), and bj is the item difficulty.
The forms for each of the six subtests were scaled using the 2PL. The end result was a set of six unidimensional verticalscales spanning Grades 3–12. The item parameters for each scale were estimated using marginal maximum likelihoodvia a multigroup extension of the 2PL (Bock & Zimowski, 1997) where the item parameters for the common items wereconstrained to be equal across groups. Each grade was treated as a separate group for the purpose of the item parameterestimation. The Grade 7 test from the Fall 2012 administration was treated as the reference point. Sampling weights wereused such that each region had the same representation in the item parameter estimation. After item parameters wereestimated, examinee abilities were estimated using the expected a posteriori (EAP) method. The item and ability param-eters were estimated using the software program MDLTM (von Davier, 2015). As a final step, the scores for all six scaleswere rescaled to have a mean of 250 and a standard deviation of 15. The scale is also constrained to have a minimum valueof 190 and a maximum value of 310.
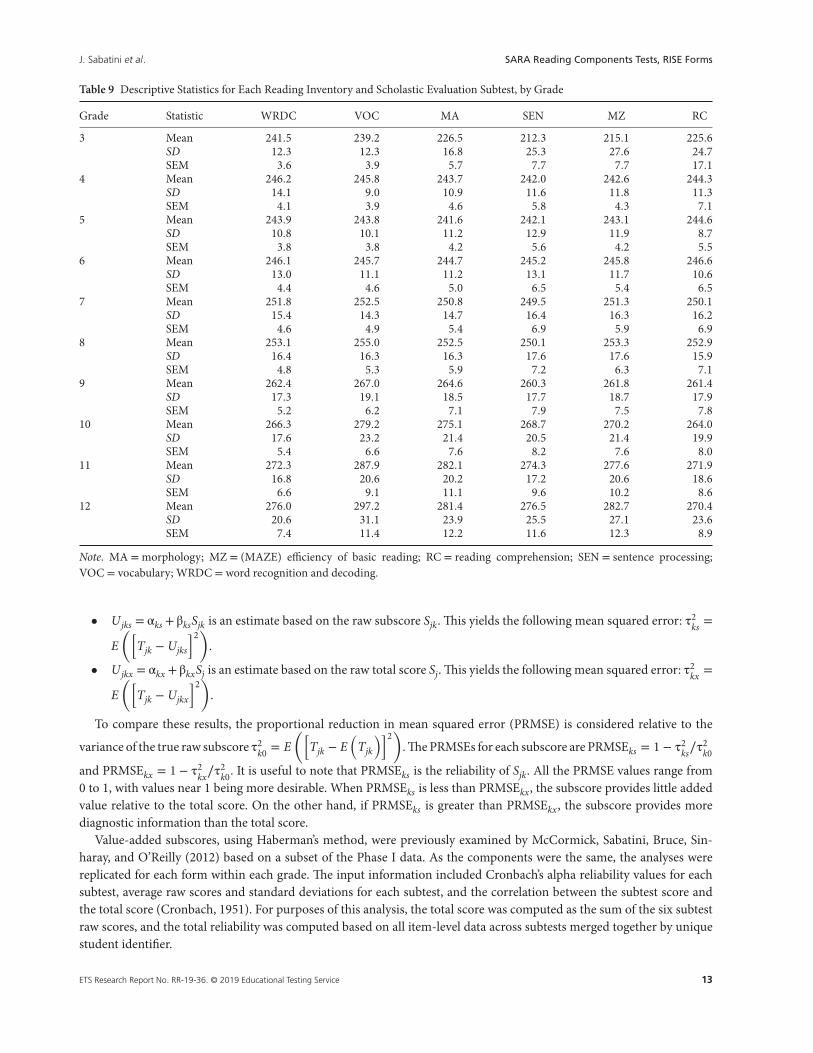
The grade-by-scale standard deviations (SD), and standard errors of measurement (SEM), aggregated across wavesand forms are reported in Table 9. These descriptive statistics reflect developmental differences in ability with respect toperformance across subtests. For example, the lowest scores are in Grade 3 and generally increase up through Grade 12.To provide a sense of the variability in scale scores within grade levels, Table 10 shows scale scores at the 10th, 25th, 50th,75th, and 90th percentiles.
Reliability
IRT marginal reliabilities were estimated for each subtest within each administration, form, and grade. Table 11 showsthe mean reliability of the scores at each grade. While there are some values around or below .7, the majority of the valuesare between .8 and .9.4 These values are at acceptable levels given the number of items for each subtest.
Validity
As noted in the theoretical descriptions, it would be predicted that the various subtests would be moderately to stronglycorrelated with each other. Each subtest construct represents a somewhat distinct component or subskill. Conversely,each would be expected to have some dependency on other components, and one would expect that individuals wouldexhibit some comparability in performance across the subtests, as all are measuring aspects of reading ability. Correlationcoefficients were computed between subtest scores within grade across forms and administrations, and where appropriate,ranges are reported (see Tables A1–A10 in the appendix). The values in the lower triangle in these tables are the observedcorrelations; the values in the upper triangle are the correlations after correcting for attenuation.
Subscore Utility
Since it has been established that each subtest has adequate reliability and apparent discrimination from the other subtests(i.e., disattenuated intercorrelations below .81), it is worthwhile to examine the overall utility of each subtest within thecomponent battery. Haberman (2008) and Sinharay, Haberman, and Puhan (2007) are the seminal works in demonstratinggeneral subscore utility in place of just reporting a total score. Haberman’s approach relies on different regression-basedestimates of true subscores and a comparison of the associated mean square error terms. Consider an examinee j witha total raw score Sj and a raw subscore Sjk for skill k. The true score Tj associated with Sj can be conceptualized as theaverage score for the examinee over repeated administrations of the same test or parallel forms of the test. Similarly, Tjkis the true subscore associated with Sjk. Haberman uses two main approaches5 to obtain estimates of the true subscoresand the true subscore variance:
12 ETS Research Report No. RR-19-36. © 2019 Educational Testing Service
J. Sabatini et al. SARA Reading Components Tests, RISE Forms
Table 9 Descriptive Statistics for Each Reading Inventory and Scholastic Evaluation Subtest, by Grade
Grade Statistic WRDC VOC MA SEN MZ RC
3 Mean 241.5 239.2 226.5 212.3 215.1 225.6SD 12.3 12.3 16.8 25.3 27.6 24.7SEM 3.6 3.9 5.7 7.7 7.7 17.1
4 Mean 246.2 245.8 243.7 242.0 242.6 244.3SD 14.1 9.0 10.9 11.6 11.8 11.3SEM 4.1 3.9 4.6 5.8 4.3 7.1
5 Mean 243.9 243.8 241.6 242.1 243.1 244.6SD 10.8 10.1 11.2 12.9 11.9 8.7SEM 3.8 3.8 4.2 5.6 4.2 5.5
6 Mean 246.1 245.7 244.7 245.2 245.8 246.6SD 13.0 11.1 11.2 13.1 11.7 10.6SEM 4.4 4.6 5.0 6.5 5.4 6.5
7 Mean 251.8 252.5 250.8 249.5 251.3 250.1SD 15.4 14.3 14.7 16.4 16.3 16.2SEM 4.6 4.9 5.4 6.9 5.9 6.9
8 Mean 253.1 255.0 252.5 250.1 253.3 252.9SD 16.4 16.3 16.3 17.6 17.6 15.9SEM 4.8 5.3 5.9 7.2 6.3 7.1
9 Mean 262.4 267.0 264.6 260.3 261.8 261.4SD 17.3 19.1 18.5 17.7 18.7 17.9SEM 5.2 6.2 7.1 7.9 7.5 7.8
10 Mean 266.3 279.2 275.1 268.7 270.2 264.0SD 17.6 23.2 21.4 20.5 21.4 19.9SEM 5.4 6.6 7.6 8.2 7.6 8.0
11 Mean 272.3 287.9 282.1 274.3 277.6 271.9SD 16.8 20.6 20.2 17.2 20.6 18.6SEM 6.6 9.1 11.1 9.6 10.2 8.6
12 Mean 276.0 297.2 281.4 276.5 282.7 270.4SD 20.6 31.1 23.9 25.5 27.1 23.6SEM 7.4 11.4 12.2 11.6 12.3 8.9
Note. MA = morphology; MZ = (MAZE) efficiency of basic reading; RC = reading comprehension; SEN = sentence processing;VOC = vocabulary; WRDC = word recognition and decoding.
• Ujks = αks +βksSjk is an estimate based on the raw subscore Sjk. This yields the following mean squared error: τ2ks =
E([
Tjk − Ujks
]2)
.
• Ujkx = αkx +βkxSj is an estimate based on the raw total score Sj. This yields the following mean squared error: τ2kx =
E([
Tjk − Ujkx
]2)
.
To compare these results, the proportional reduction in mean squared error (PRMSE) is considered relative to the
variance of the true raw subscore τ2k0 = E
([Tjk − E
(Tjk
)]2)
. The PRMSEs for each subscore are PRMSEks = 1 − τ2ks∕τ
2k0
and PRMSEkx = 1 − τ2kx∕τ
2k0. It is useful to note that PRMSEks is the reliability of Sjk. All the PRMSE values range from
0 to 1, with values near 1 being more desirable. When PRMSEks is less than PRMSEkx, the subscore provides little addedvalue relative to the total score. On the other hand, if PRMSEks is greater than PRMSEkx, the subscore provides morediagnostic information than the total score.
Value-added subscores, using Haberman’s method, were previously examined by McCormick, Sabatini, Bruce, Sin-haray, and O’Reilly (2012) based on a subset of the Phase I data. As the components were the same, the analyses werereplicated for each form within each grade. The input information included Cronbach’s alpha reliability values for eachsubtest, average raw scores and standard deviations for each subtest, and the correlation between the subtest score andthe total score (Cronbach, 1951). For purposes of this analysis, the total score was computed as the sum of the six subtestraw scores, and the total reliability was computed based on all item-level data across subtests merged together by uniquestudent identifier.
ETS Research Report No. RR-19-36. © 2019 Educational Testing Service 13
J. Sabatini et al. SARA Reading Components Tests, RISE Forms
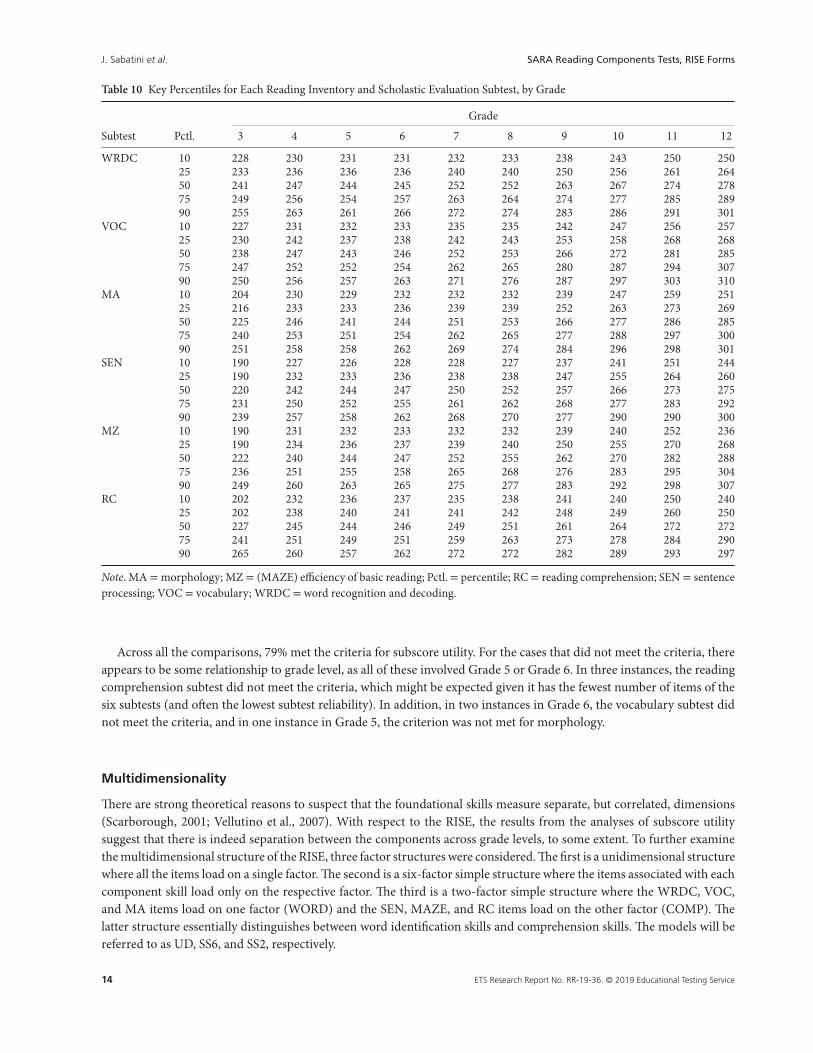
Table 10 Key Percentiles for Each Reading Inventory and Scholastic Evaluation Subtest, by Grade
Grade
Subtest Pctl. 3 4 5 6 7 8 9 10 11 12
WRDC 10 228 230 231 231 232 233 238 243 250 25025 233 236 236 236 240 240 250 256 261 26450 241 247 244 245 252 252 263 267 274 27875 249 256 254 257 263 264 274 277 285 28990 255 263 261 266 272 274 283 286 291 301
VOC 10 227 231 232 233 235 235 242 247 256 25725 230 242 237 238 242 243 253 258 268 26850 238 247 243 246 252 253 266 272 281 28575 247 252 252 254 262 265 280 287 294 30790 250 256 257 263 271 276 287 297 303 310
MA 10 204 230 229 232 232 232 239 247 259 25125 216 233 233 236 239 239 252 263 273 26950 225 246 241 244 251 253 266 277 286 28575 240 253 251 254 262 265 277 288 297 30090 251 258 258 262 269 274 284 296 298 301
SEN 10 190 227 226 228 228 227 237 241 251 24425 190 232 233 236 238 238 247 255 264 26050 220 242 244 247 250 252 257 266 273 27575 231 250 252 255 261 262 268 277 283 29290 239 257 258 262 268 270 277 290 290 300
MZ 10 190 231 232 233 232 232 239 240 252 23625 190 234 236 237 239 240 250 255 270 26850 222 240 244 247 252 255 262 270 282 28875 236 251 255 258 265 268 276 283 295 30490 249 260 263 265 275 277 283 292 298 307
RC 10 202 232 236 237 235 238 241 240 250 24025 202 238 240 241 241 242 248 249 260 25050 227 245 244 246 249 251 261 264 272 27275 241 251 249 251 259 263 273 278 284 29090 265 260 257 262 272 272 282 289 293 297
Note. MA = morphology; MZ = (MAZE) efficiency of basic reading; Pctl. = percentile; RC = reading comprehension; SEN = sentenceprocessing; VOC = vocabulary; WRDC = word recognition and decoding.
Across all the comparisons, 79% met the criteria for subscore utility. For the cases that did not meet the criteria, thereappears to be some relationship to grade level, as all of these involved Grade 5 or Grade 6. In three instances, the readingcomprehension subtest did not meet the criteria, which might be expected given it has the fewest number of items of thesix subtests (and often the lowest subtest reliability). In addition, in two instances in Grade 6, the vocabulary subtest didnot meet the criteria, and in one instance in Grade 5, the criterion was not met for morphology.
Multidimensionality
There are strong theoretical reasons to suspect that the foundational skills measure separate, but correlated, dimensions(Scarborough, 2001; Vellutino et al., 2007). With respect to the RISE, the results from the analyses of subscore utilitysuggest that there is indeed separation between the components across grade levels, to some extent. To further examinethe multidimensional structure of the RISE, three factor structures were considered. The first is a unidimensional structurewhere all the items load on a single factor. The second is a six-factor simple structure where the items associated with eachcomponent skill load only on the respective factor. The third is a two-factor simple structure where the WRDC, VOC,and MA items load on one factor (WORD) and the SEN, MAZE, and RC items load on the other factor (COMP). Thelatter structure essentially distinguishes between word identification skills and comprehension skills. The models will bereferred to as UD, SS6, and SS2, respectively.
14 ETS Research Report No. RR-19-36. © 2019 Educational Testing Service
J. Sabatini et al. SARA Reading Components Tests, RISE Forms
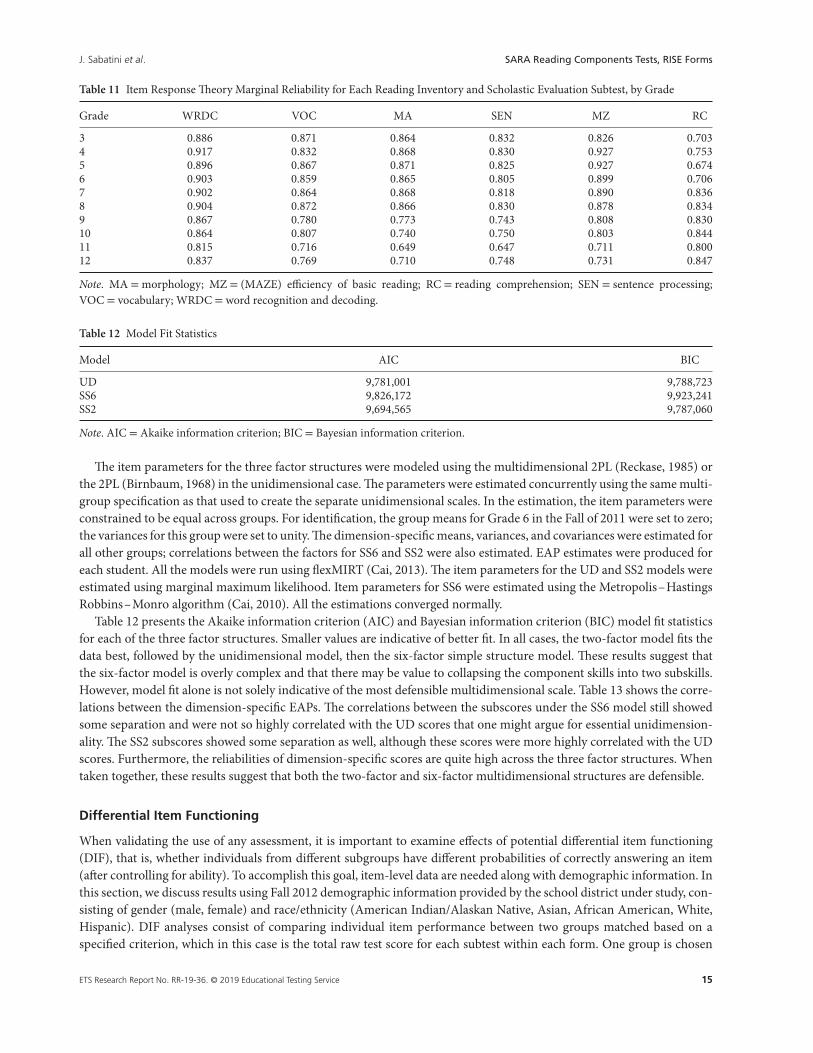
Table 11 Item Response Theory Marginal Reliability for Each Reading Inventory and Scholastic Evaluation Subtest, by Grade
Grade WRDC VOC MA SEN MZ RC
3 0.886 0.871 0.864 0.832 0.826 0.7034 0.917 0.832 0.868 0.830 0.927 0.7535 0.896 0.867 0.871 0.825 0.927 0.6746 0.903 0.859 0.865 0.805 0.899 0.7067 0.902 0.864 0.868 0.818 0.890 0.8368 0.904 0.872 0.866 0.830 0.878 0.8349 0.867 0.780 0.773 0.743 0.808 0.83010 0.864 0.807 0.740 0.750 0.803 0.84411 0.815 0.716 0.649 0.647 0.711 0.80012 0.837 0.769 0.710 0.748 0.731 0.847
Note. MA = morphology; MZ = (MAZE) efficiency of basic reading; RC = reading comprehension; SEN = sentence processing;VOC = vocabulary; WRDC = word recognition and decoding.
Table 12 Model Fit Statistics
Model AIC BIC
UD 9,781,001 9,788,723SS6 9,826,172 9,923,241SS2 9,694,565 9,787,060
Note. AIC = Akaike information criterion; BIC = Bayesian information criterion.
The item parameters for the three factor structures were modeled using the multidimensional 2PL (Reckase, 1985) orthe 2PL (Birnbaum, 1968) in the unidimensional case. The parameters were estimated concurrently using the same multi-group specification as that used to create the separate unidimensional scales. In the estimation, the item parameters wereconstrained to be equal across groups. For identification, the group means for Grade 6 in the Fall of 2011 were set to zero;the variances for this group were set to unity. The dimension-specific means, variances, and covariances were estimated forall other groups; correlations between the factors for SS6 and SS2 were also estimated. EAP estimates were produced foreach student. All the models were run using flexMIRT (Cai, 2013). The item parameters for the UD and SS2 models wereestimated using marginal maximum likelihood. Item parameters for SS6 were estimated using the Metropolis–HastingsRobbins–Monro algorithm (Cai, 2010). All the estimations converged normally.
Table 12 presents the Akaike information criterion (AIC) and Bayesian information criterion (BIC) model fit statisticsfor each of the three factor structures. Smaller values are indicative of better fit. In all cases, the two-factor model fits thedata best, followed by the unidimensional model, then the six-factor simple structure model. These results suggest thatthe six-factor model is overly complex and that there may be value to collapsing the component skills into two subskills.However, model fit alone is not solely indicative of the most defensible multidimensional scale. Table 13 shows the corre-lations between the dimension-specific EAPs. The correlations between the subscores under the SS6 model still showedsome separation and were not so highly correlated with the UD scores that one might argue for essential unidimension-ality. The SS2 subscores showed some separation as well, although these scores were more highly correlated with the UDscores. Furthermore, the reliabilities of dimension-specific scores are quite high across the three factor structures. Whentaken together, these results suggest that both the two-factor and six-factor multidimensional structures are defensible.
Differential Item Functioning
When validating the use of any assessment, it is important to examine effects of potential differential item functioning(DIF), that is, whether individuals from different subgroups have different probabilities of correctly answering an item(after controlling for ability). To accomplish this goal, item-level data are needed along with demographic information. Inthis section, we discuss results using Fall 2012 demographic information provided by the school district under study, con-sisting of gender (male, female) and race/ethnicity (American Indian/Alaskan Native, Asian, African American, White,Hispanic). DIF analyses consist of comparing individual item performance between two groups matched based on aspecified criterion, which in this case is the total raw test score for each subtest within each form. One group is chosen
ETS Research Report No. RR-19-36. © 2019 Educational Testing Service 15
J. Sabatini et al. SARA Reading Components Tests, RISE Forms
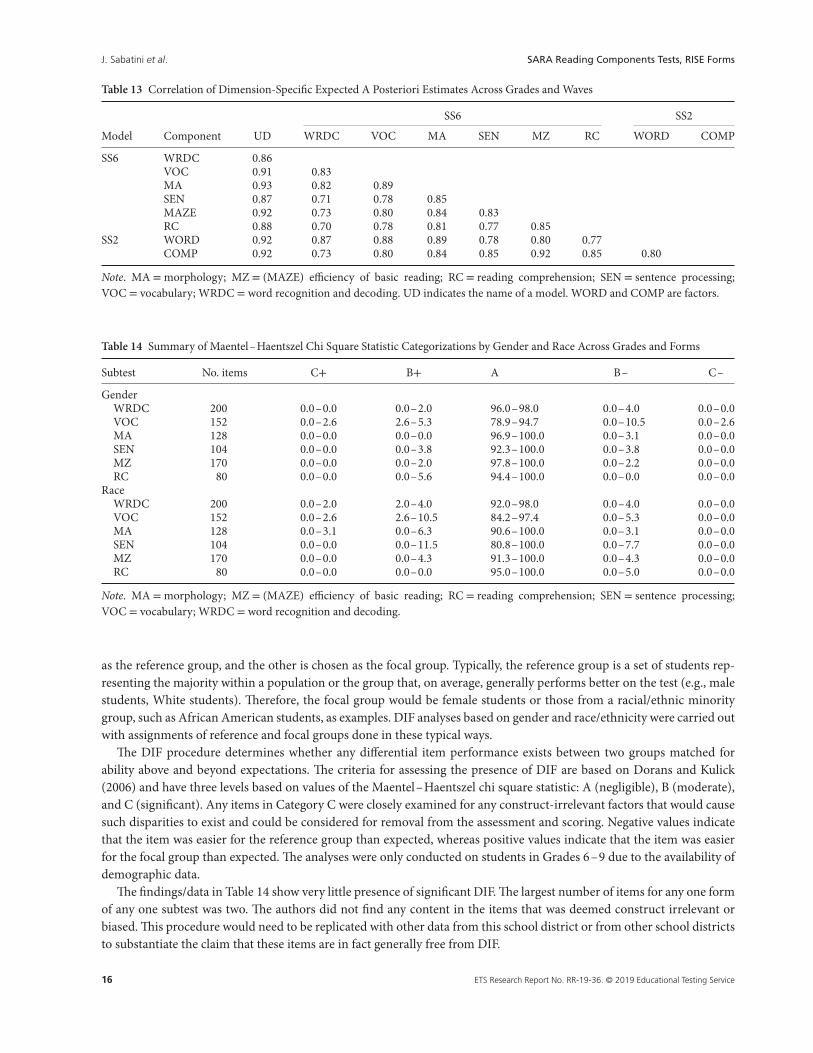
Table 13 Correlation of Dimension-Specific Expected A Posteriori Estimates Across Grades and Waves
SS6 SS2
Model Component UD WRDC VOC MA SEN MZ RC WORD COMP
SS6 WRDC 0.86VOC 0.91 0.83MA 0.93 0.82 0.89SEN 0.87 0.71 0.78 0.85MAZE 0.92 0.73 0.80 0.84 0.83RC 0.88 0.70 0.78 0.81 0.77 0.85
SS2 WORD 0.92 0.87 0.88 0.89 0.78 0.80 0.77COMP 0.92 0.73 0.80 0.84 0.85 0.92 0.85 0.80
Note. MA = morphology; MZ = (MAZE) efficiency of basic reading; RC = reading comprehension; SEN = sentence processing;VOC = vocabulary; WRDC = word recognition and decoding. UD indicates the name of a model. WORD and COMP are factors.
Table 14 Summary of Maentel–Haentszel Chi Square Statistic Categorizations by Gender and Race Across Grades and Forms
Subtest No. items C+ B+ A B– C–
GenderWRDC 200 0.0–0.0 0.0–2.0 96.0–98.0 0.0–4.0 0.0–0.0VOC 152 0.0–2.6 2.6–5.3 78.9–94.7 0.0–10.5 0.0–2.6MA 128 0.0–0.0 0.0–0.0 96.9–100.0 0.0–3.1 0.0–0.0SEN 104 0.0–0.0 0.0–3.8 92.3–100.0 0.0–3.8 0.0–0.0MZ 170 0.0–0.0 0.0–2.0 97.8–100.0 0.0–2.2 0.0–0.0RC 80 0.0–0.0 0.0–5.6 94.4–100.0 0.0–0.0 0.0–0.0
RaceWRDC 200 0.0–2.0 2.0–4.0 92.0–98.0 0.0–4.0 0.0–0.0VOC 152 0.0–2.6 2.6–10.5 84.2–97.4 0.0–5.3 0.0–0.0MA 128 0.0–3.1 0.0–6.3 90.6–100.0 0.0–3.1 0.0–0.0SEN 104 0.0–0.0 0.0–11.5 80.8–100.0 0.0–7.7 0.0–0.0MZ 170 0.0–0.0 0.0–4.3 91.3–100.0 0.0–4.3 0.0–0.0RC 80 0.0–0.0 0.0–0.0 95.0–100.0 0.0–5.0 0.0–0.0
Note. MA = morphology; MZ = (MAZE) efficiency of basic reading; RC = reading comprehension; SEN = sentence processing;VOC = vocabulary; WRDC = word recognition and decoding.
as the reference group, and the other is chosen as the focal group. Typically, the reference group is a set of students rep-resenting the majority within a population or the group that, on average, generally performs better on the test (e.g., malestudents, White students). Therefore, the focal group would be female students or those from a racial/ethnic minoritygroup, such as African American students, as examples. DIF analyses based on gender and race/ethnicity were carried outwith assignments of reference and focal groups done in these typical ways.
The DIF procedure determines whether any differential item performance exists between two groups matched forability above and beyond expectations. The criteria for assessing the presence of DIF are based on Dorans and Kulick(2006) and have three levels based on values of the Maentel–Haentszel chi square statistic: A (negligible), B (moderate),and C (significant). Any items in Category C were closely examined for any construct-irrelevant factors that would causesuch disparities to exist and could be considered for removal from the assessment and scoring. Negative values indicatethat the item was easier for the reference group than expected, whereas positive values indicate that the item was easierfor the focal group than expected. The analyses were only conducted on students in Grades 6–9 due to the availability ofdemographic data.
The findings/data in Table 14 show very little presence of significant DIF. The largest number of items for any one formof any one subtest was two. The authors did not find any content in the items that was deemed construct irrelevant orbiased. This procedure would need to be replicated with other data from this school district or from other school districtsto substantiate the claim that these items are in fact generally free from DIF.
16 ETS Research Report No. RR-19-36. © 2019 Educational Testing Service
J. Sabatini et al. SARA Reading Components Tests, RISE Forms
Research That Supports External Validity of Reading Inventory and Scholastic Evaluation Scores
Validity is viewed not as a property of the test but rather in terms of the strength of arguments that support the claimsintended by the user (Kane, 1992, 2006). In other words, no one piece of evidence can determine that a test is “valid”;rather, validity is supported with evidence collected over time. With respect to the RISE, we have been gathering evidenceof its validity since its initial development. For instance, in this report and elsewhere (Sabatini, Bruce, & Steinberg, 2013;Sabatini, Bruce, Steinberg, & Weeks, 2015), we have outlined the constructs, their theoretical support akin to an evidence-centered design process (Mislevy & Haertel, 2006; Mislevy, Steinberg, & Almond, 2003); that is, we considered elementsof validity before the test was constructed (validity by design). We have also aligned the constructs as measured by the sixsubtests with evidence-based practices and interventions designed to address students’ reading skill weaknesses.
In this section, we review evidence on how the RISE relates to assessments that measure component measures ofreading, outcome measures that relate to reading comprehension, the identification of students at risk of comprehen-sion failure, and the sensitivity of RISE to detect reading intervention effects. We describe each of these facets in moredetail.
Relations to Other Component Measures of Reading (Proximal)
In a series of studies, we examined the relations between the RISE subtests to other assessments of foundational skillsaligned with RISE subtest constructs. Foorman, Koon, Petscher, Mitchell, and Truckenmiller (2015) administered twoRISE subtest forms (vocabulary and morphology) to more than 1,700 students in 4th–10th grades. They also adminis-tered other clinical psychology reading assessments that were designed to measure foundational reading skills, includinga measure of word-reading efficiency (Test of Word Reading Efficiency [TOWRE]; Torgesen, Wagner, & Rashotte, 1999),vocabulary (Peabody Picture Vocabulary Test [PPVT]; Dunn & Dunn, 1997), and language (Clinical Evaluation of Lan-guage Fundamentals, Recalling Sentences subtest; Semel, Wiig, & Secord, 2003; the Comprehensive Assessment of SpokenLanguage, Grammatical Judgment subtest; Carrow-Woolfolk, 2008). The RISE vocabulary and morphology tests were cor-related with the TOWRE (Torgesen et al., 1999) from r = .36–.56, the PPVT from r = .52–.57, and the language measuresfrom r = .38–.51; that is, RISE vocabulary and morphology subtests demonstrated moderate correlations to proximalconstructs of word identification, vocabulary, and oral language.
Relations to Outcome Measures of Reading Comprehension (Distal)
O’Reilly, Sabatini, Bruce, Pillarisetti, and McCormick (2012) examined the relations between each of the six subtestsin RISE and middle school students’ performance on their preceding years’ state language arts test. In this study, with asample of more than 3,000 students, the authors examined whether the six subtests of RISE were related to state test scores,dividing the sample into two groups: students who fell below the “proficient” classification on the state test and studentswho were classified as “above proficient.” The regressions were significant for both groups, but the RISE accounted formore variance in language arts scores for students who were below proficient (R2 = .41), as compared to students whowere classified as above proficient (R2 = .21). For both groups of students, each RISE subtest uniquely predicted variancein the state test scores. These data are consistent with the intended purpose of the test—to help diagnose weaknesses incomponent reading skills for less skilled readers. More importantly, the results also indicate that each subtest is valuableand that weaknesses in each of the component skills are also associated with a real literacy outcome—state language artsscores.
Converging evidence about the important role of the RISE components measures of reading comprehension was alsofound in other studies. For instance, Foorman et al. (2015) found evidence that two of the component subtests in theRISE were predictive of reading comprehension. In particular, they found that the vocabulary and morphology sectionscorrelated with a state English language arts test at r = .60 and r = .69, respectively. The authors also found that theRISE vocabulary and morphology subtests, respectively, correlated with the Gates–MacGinitie reading test at r = .50 andr = .65. In short, both subtests are related to reading comprehension as defined by a state English language arts test anda widely used measure of reading comprehension. In a separate study, Sabatini, O’Reilly, Weeks, and Wang (2019) foundevidence that the RISE RC subtest correlated with external measures of reading comprehension. In particular, they foundthat the RISE RC subtest correlated with a standard reading comprehension test, the Gates–MacGinitie reading test at
ETS Research Report No. RR-19-36. © 2019 Educational Testing Service 17
J. Sabatini et al. SARA Reading Components Tests, RISE Forms
r = .77, and a scenario-based assessment of reading comprehension at r = .65. The relatively moderate to high correlationof the RISE to the scenario-based assessment is notable, as the scenario-based assessment is designed to cover higher levelcomprehension constructs, such as multiple text comprehension, synthesis, critical thinking, perspective taking, and dig-ital literacy. The fact that these higher level constructs are related to foundational comprehension as measured by the RISEunderscores its significance. The predictive relationship between the RISE RC subtest to a scenario-based assessment wasalso evident in a different context conducted by another research group (Goldman et al., 2019). In summary, the RISEshows concurrent and predictive validity to published reading components and comprehension measures.
Identification of Students at Risk of Comprehension Failure
The preceding sections provide evidence of the relative importance of component skills on both proximal and distal out-comes. In this section, we focus on the potential consequences of having weak foundational skills and the use of the RISEto identify students who are at risk. In particular, we examine the impact of one particular foundational skill measured inRISE (decoding/word recognition) and its relationship with reading comprehension over time. Wang, Sabatini, O’Reilly,and Weeks (2019) administered the RISE to more than 10,000 students in a sample of 5th–12th graders. In this paper,the authors examined the relations between students’ performance on the decoding subtest and their reading comprehen-sion. Although the comprehension measure used in this analysis is from the RISE, the results are striking. Using quantileregression, classification analysis (receiver operating characteristics), and broken-line regression, the authors found evi-dence for a decoding threshold. Below the threshold, there was little to no correlation between decoding and readingcomprehension, but above the threshold, a significant relationship was observed. In other words, weaknesses in decod-ing ability limited a student’s ability to comprehend a text. Notably, this effect occurred for students in 5th through 12thgrades, a period when decoding ability is not taught and is believed to have been mastered.
In a second study reported in the same paper, the authors tracked students over the course of their development in alongitudinal design with a sample of more than 30,000 fifth to ninth graders. The authors found that students who initiallyfell below the threshold in the early grades showed little to no growth in reading comprehension over time. This papernot only underscored the relative importance of the RISE decoding measure but also provided a technique to potentiallyidentify and track students who might have comprehension problems because of weak decoding skills. Knowledge ofwhether a student falls above or below the threshold would lead to differential recommendations for instruction. If astudent’s decoding skills are adequate, then instruction in comprehension strategies might be effective. However, if astudent’s decoding is lacking (e.g., falls below the threshold), then a combination of decoding training and comprehensiontraining would be more appropriate. In short, the utility and arguably validity of the RISE is enhanced by the existenceand detection of a decoding threshold because of its practical implication for instruction.
Sensitivity of the Reading Inventory and Scholastic Evaluation to Detect Reading Intervention Effects
Here and elsewhere, we have claimed that the RISE constructs are malleable and open to instruction; that is, the value ofany instructional tool (including an assessment) should be judged in part by its ability to improve reading outcomes. Inother words, interventions that are designed to improve foundational skills should result in increased scores on the RISEafter the intervention has been successfully implemented. Support for this claim comes from a study conducted by Kimet al. (2017) evaluating a reading intervention called the Strategic Adolescent Reading Intervention (STARI). STARI isan intervention that targets students’ word-reading skills, reading fluency, vocabulary development, and comprehension.In a sample of more than 400 sixth- to eighth-grade students, the authors found that students who participated in theSTARI intervention scored higher than control students on RISE subtests of word recognition (Cohen’s d = 0.20), mor-phology (Cohen’s d = 0.18), and efficiency of basic reading comprehension (Cohen’s d = 0.21). In other words, the RISEwas sensitive to the effects of the reading intervention. In short, the value of the RISE is in part bolstered by the fact thatinterventions that are designed to improve foundational reading skills show gains on some subtests of the RISE.
In summary, results from proximal and distal measures of reading indicate that the RISE is related to concurrent mea-sures, and it is predictive of reading comprehension and state test scores. The RISE is also useful in identifying studentswho are at risk for comprehension failure and can help diagnose particular skill weaknesses that might guide instruction.The fact that the RISE is also sensitive to reading intervention effects underscores its utility for instruction.
18 ETS Research Report No. RR-19-36. © 2019 Educational Testing Service
J. Sabatini et al. SARA Reading Components Tests, RISE Forms
Conclusion
The six-subtest RISE assessment was designed to address a practical educational need by applying a theory-based approachto assessment development. The need was for better assessment information of struggling middle-grades students—thosestudents who typically score below proficient on state English language arts tests. The theoretical and empirical literaturehas suggested that overall reading comprehension skills are built on a foundation of componential reading skills, such asdecoding, word recognition, vocabulary, morphology, sentence processing, and efficiency of basic reading. Weaknesses inone or more of these skills could underlie poor reading comprehension performance. Such componential score informa-tion is not derivable from traditional reading comprehension tests. We designed subtests targeting these six components.
Further design considerations were imposed to meet practicality and feasibility constraints, specifically, the need forefficient administration (e.g., a 45- to 60-minute limit) and rapid, inexpensive turnaround of scores. Together, the presenceof these constraints supported the argument for electronic delivery and scoring.
The results of extensive field testing demonstrate that the RISE battery exhibits adequate subtest reliability and utility,moderate to strong correlations between the subtests, and minimal DIF for each of the grade levels. The sample includedmultiple waves of students, collected over three phases, including a national sample spanning Grades 3–12. Evidencefor the validity of scores includes strong, but not statistically indistinguishable, intercorrelations among the subtests (seealso Mislevy & Sabatini, 2012; O’Reilly et al., 2012; Sabatini, 2009; Sabatini, Bruce, & Pillarisetti, 2010; Sabatini, Bruce,Pillarisetti, & McCormick, 2010; Sabatini, Bruce, & Sinharay, 2009). The subtest means and percentiles demonstrate howthe relative difficulty and variability of the subtest distributions vary within and across grades.
The adequacy of the measurement properties of the RISE assessment provides the basis for school administrators andteachers to interpret test scores as part of the evidence available for making educational decisions. For example, schooladministrators might use prevalence estimates of how many students are scoring at low levels on subtests of decodingor word recognition to determine how to plan and allocate resources for interventions targeting those basic subskills(which are usually implemented as supplements to subject-area classes; Wang et al., 2019). Classroom teachers can lookat evidence of relative strengths and weaknesses across a range of their students to make adjustments to their instructionalemphases in teaching vocabulary or morphological patterns or in assigning reading practice to enhance reading fluencyand efficiency. We continue to work with pilot schools and districts to develop professional development packages to assistteachers and administrators in using score evidence to make sound decisions aligned with their instructional knowledgeand practices (for other applications, see Mislevy & Sabatini, 2012; O’Reilly et al., 2012; Sabatini et al., 2009).
A large pool of items was established and placed on a common scale to allow for the development of forms targetingspecific difficulty levels in addition to enabling users to make comparisons across grades with respect to growth or changein skills. Thus the scores can be used to gather evidence of the effectiveness of different instructional programs in helpingstudents progress or accelerate their reading skill growth. The battery can also be used for benchmarking and summativepurposes, such as tracking student progress within and across school years.
The next steps, now under way, are conducting research that takes the RISE and SARA system in new directions. First,we are designing a wider range of items for each form. This broader item pool should enhance the discrimination across awide grade and ability range. Second, we are continuing to expand the range of the RISE assessment by building and pilot-ing forms for use in elementary, secondary, and adult literacy settings. Third, we are continuing to evaluate the propertiesof the tests with special populations, such as English language learners. Fourth, we are expanding and elaborating on theitem types within each of the componential constructs. Fifth, we are expanding our research on providing interpretativeguidance for using results to inform decision-making at the teacher and school levels, for which the development of pro-ficiency levels and profiles will be useful. Finally, we are working on versions of the RISE and SARA system that can beused in more formative contexts for students and teachers.
In conclusion, the RISE forms of the SARA fill an important gap in assessment of reading difficulties in the middlegrades. The RISE forms are a proof of concept that theory-based instruments can be designed to be practically imple-mented, scored, and interpreted in middle-grades contexts. We are hopeful that the information the RISE assessmentprovides is of practical utility to educators above and beyond scores obtained on state exams and traditional readingcomprehension tests. The ongoing research agenda is to design items and collect evidence to enhance and improve theutility and validity of the RISE and SARA system in a wide range of contexts.
ETS Research Report No. RR-19-36. © 2019 Educational Testing Service 19
J. Sabatini et al. SARA Reading Components Tests, RISE Forms
Edition History
This third edition of the RISE technical report is intended to extend and supersede the “SARA Reading ComponentsTests, RISE Forms: Technical Adequacy and Test Design, 2nd Edition.”6 The conceptual framework and six-subtest batterystructure of the RISE assessment remain the same as those presented in the first edition. The main changes described inthis report include the following:
• inclusion of a national sample of students,• extension of the Grades 5–10 vertical scale to include Grades 3–4 and Grades 11–12, and• development of a calibrated item pool that can be used to create forms with varying difficulty, in addition to forms
for use in a multistage adaptive test.
The expansion of the item pool for the RISE battery and the use of a national sample for calibrating the item parametersfor each subtest are intended to enhance its utility and value for use in schools.7
The second edition of the RISE technical report, entitled SARA Reading Components Tests, RISE Form: Technical Ade-quacy and Test Design,8 included the following changes relative to the first edition:
• vertical extension from the original Grades 6–8 form to Grades 5 and 9–10,• development and psychometric analysis of parallel forms of each subtest,• construction of IRT scales for each of the subtests across the entire grade span, and• evaluation of DIF for gender and race/ethnicity.
Acknowledgments
The research reported here was supported by the U.S. Department of Education Institute of Education Sciences, AwardNos. R305G040065 & R305F100005, to Educational Testing Service. The opinions expressed are those of the authors anddo not represent views of the U.S. Department of Education or Educational Testing Service. Special thanks to Kietha Big-gers and Kelsey Dreier and for their assistance with this work. John Sabatini is currently a distinguished research professorat the Institute of Intelligent Systems and Department of Psychology, University of Memphis, Memphis, Tennessee.
Notes1 Of course, higher level reading comprehension includes even more complex skills that might include interpreting and evaluating
texts with respect to an author’s intentions or one’s own purposes, critical thinking, or making inferences across multiple texts.2 Nonwords are sometimes also called pseudowords in the research literature, because the logic of their spelling lends itself to a
pronunciation—compared to random letter strings such xrmtzu—that would not appear in a typical English word.3 Correct answers are underlined and placed in the first position in the following examples for this and for all subsequent subtest
examples.4 Grades 11 and 12 show some of the lowest reliabilities. We would recommend more caution in using and interpreting RISE scores
with Grade 11–12 students.5 A third approach based on a weighted average of the total score and subscores is also presented in Haberman (2008). This
approach is associated with augmented subscores.6 This report can be retrieved online (https://onlinelibrary.wiley.com/doi/epdf/10.1002/ets2.12076).7 The original RISE battery was a joint project of Educational Testing Service and the Strategic Educational Research Partnership.
To find out more about the original RISE version, please visit http://rise.serpmedia.org/ or send an e-mail to [email protected] current system of assessments and scales described in this report supersedes and replaces the original RISE battery.
8 This report can be retrieved online (http://www.ets.org/Media/Research/pdf/RR-13-08.pdf).
References
Adams, M. J. (1990). Beginning to read: Thinking and learning about print. Cambridge, MA: MIT Press.Adlof, S. M., Catts, H. W., & Little, T. D. (2006). Should the simple view of reading include a fluency component? Reading and Writing,
19, 933–958. https://doi.org/10.1007/s11145-006-9024-zAnderson, R. C., & Freebody, P. (1981). Vocabulary knowledge. In J. T. Guthrie (Ed.), Comprehension and teaching: Research reviews
(pp. 77–117). Newark, DE: International Reading Association.
20 ETS Research Report No. RR-19-36. © 2019 Educational Testing Service
J. Sabatini et al. SARA Reading Components Tests, RISE Forms
Anglin, J. M. (1993). Vocabulary development: A morphological analysis. Monographs of the Society of Research in Child Development,58(10), 1–186. https://doi.org/10.2307/1166112
Beck, I. L., & McKeown, M. G. (1991). Social studies texts are hard to understand: Mediating some of the difficulties. Language Arts,68, 482–490.
Beck, I. L., McKeown, M. G., & Kucan, L. (2002). Bringing words to life: Robust vocabulary instruction. New York, NY: Guilford.Beck, I. L., McKeown, M. G., & Kucan, L. (2008). Creating robust vocabulary: Frequently asked questions and extended examples. New
York, NY: Guilford.Bennett, R. E. (2011). CBAL: Results from piloting innovative K–12 assessments (Research Report No. RR-11-23). Princeton, NJ: Edu-
cational Testing Service. https://doi.org/10.1002/j.2333-8504.2011.tb02259.xBennett, R. E., & Gitomer, D. H. (2009). Transforming K–12 assessment: Integrating accountability testing, formative assessment and
professional support. In C. Wyatt-Smith & J. J. Cumming (Eds.), Educational assessment in the 21st century (pp. 43–62). https://doi.org/10.1007/978-1-4020-9964-9_3
Berninger, V. W., Abbott, R. D., Nagy, W., & Carlisle, J. (2010). Growth in phonological, orthographic, and morphological awarenessin grades 1 to 6. Journal of Psycholinguistic Research, 39, 141–163. https://doi.org/10.1007/s10936-009-9130-6
Birnbaum, A. (1968). Some latent trait models and their use in inferring an examinee’s ability. In F. M. Lord & M. R. Novick (Eds.),Statistical theories of mental test scores (pp. 395–479). Reading, MA: Addison-Wesley.
Bock, R. D., & Zimowski, M. F. (1997). Multiple group IRT. In W. J. van der Linden & R. K. Hambleton (Eds.), Handbook of modernitem response theory (pp. 433–448). https://doi.org/10.1007/978-1-4757-2691-6_25
Cai, L. (2010). Metropolis–Hastings Robbins–Monro algorithm for confirmatory item factor analysis. Journal of Educational andBehavioral Statistics, 35, 307–335. https://doi.org/10.3102/1076998609353115
Cai, L. (2013). flexMIRT® version 2: Flexible multilevel multidimensional item analysis and test scoring [Computer software]. ChapelHill, NC: Vector Psychometric Group.
Carlisle, J. F. (2000). Awareness of the structure and meaning of morphologically complex words: Impact on reading. Reading andWriting: An Interdisciplinary Journal, 12, 169–190. https://doi.org/10.1023/A:1008131926604
Carlisle, J. F., & Rice, M. S. (2002). Improving reading comprehension: Research-based principles and practices. Baltimore, MD: York Press.Carlisle, J. F., & Stone, C. A. (2003). The effects of morphological structure on children’s reading of derived words. In E. Assink &
D. Sandra (Eds.), Reading complex words: Cross-language studies (pp. 27–52). https://doi.org/10.1007/978-1-4757-3720-2_2Carlo, M. S., August, D., McLaughlin, B., Snow, C. E., Dressler, C., Lippmann, D. N., … White, C. E. (2004). Closing the gap: Addressing
the vocabulary needs of English-language learners in bilingual and mainstream classrooms. Reading Research Quarterly, 39, 188–215.https://doi.org/10.1598/RRQ.39.2.3
Carroll, J. B. (1993). Human cognitive abilities: A survey of factor analytic studies. https://doi.org/10.1017/CBO9780511571312Carrow-Woolfolk, E. (2008). Comprehensive assessment of spoken language. Torrance, CA: Western Psychological Services.Chall, J. S. (1967). Stages of reading development. New York, NY: McGraw-Hill.Coleman, D., & Pimentel, S. (2011). Revised publishers’ criteria for the Common Core State Standards in English language arts and literacy,
Grades 3–12. Retrieved from http://www.corestandards.org/assets/Publishers_Criteria_for_3-12.pdfCouncil of Chief State School Officers & National Governors Association. (2010). Common Core State Standards for English language
arts. Retrieved from http://www.corestandards.org/assets/CCSSI_ELA%20Standards.pdfCronbach, L. J. (1951). Coefficient alpha and the internal structure of tests. Psychometrika, 16, 297–334. https://doi.org/10.1007/
BF02310555Cunningham, A. E., & Stanovich, K. E. (1997). Early reading acquisition and its relation to reading experience and ability 10 years later.
Developmental Psychology, 33, 934–945. https://doi.org/10.1037/0012-1649.33.6.934Daneman, M. (1988). Word knowledge and reading skill. In M. Daneman, G. E. Mackinnon, & T. G. Waller (Eds.), Reading research:
Advances in theory and practice (Vol. 6, pp. 145–175). San Diego, CA: Academic Press.Deacon, S. H., & Kirby, J. (2004). Morphological awareness: Just “more phonological”? The roles of morphological and phonological
awareness in reading development. Applied PsychoLinguistics, 25, 223–238. https://doi.org/10.1017/S0142716404001110Deane, P. (2012). Natural language processing methods for supporting vocabulary analysis. In J. P. Sabatini, E. R. Albro, & T. O’Reilly
(Eds.), Reaching an understanding: Innovations in how we view reading assessment (pp. 117–144). Lanham, MD: Rowman and Lit-tlefield Education.
Dorans, N. J., & Kulick, E. (2006). Differential item functioning on the MMSE: An application of the Mantel–Haenzel and standard-ization procedures. Medical Care, 44(S3), S107– S114. https://doi.org/10.1097/01.mlr.0000245182.36914.4a
Duke, N. K., & Carlisle, J. F. (2011). The development of comprehension. In M. L. Kamil, P. D. Pearson, E. B. Moje, & P. Afflerbach(Eds.), Handbook of reading research (Vol. 4, pp. 199–228). London, England: Routledge.
Dunn, L. M., & Dunn, D. (1997). PPVT–III: Peabody picture vocabulary test. https://doi.org/10.1037/t15145-000Ehri, L. C. (2005). Learning to read words: Theory, findings, and issues. Scientific Studies of Reading, 9, 167–188. https://doi.org/10
.1207/s1532799xssr0902_4
ETS Research Report No. RR-19-36. © 2019 Educational Testing Service 21
J. Sabatini et al. SARA Reading Components Tests, RISE Forms
Espin, C. A., Deno, S. L., Maruyama, G., & Cohen, C. (1989, March). The Basic Academic Skills Samples (BASS): An instrument forthe screening and identification of children at risk for failure in regular education classrooms. Paper presented at the meeting of theAmerican Educational Research Association, San Francisco, CA.
Foorman, B. R., Koon, S., Petscher, Y., Mitchell, A., & Truckenmiller, A. (2015). Examining general and specific factors in the dimen-sionality of oral language and reading in 4th–10th grades. Journal of Educational Psychology, 107, 884. https://doi.org/10.1037/edu0000026, 899
Fowler, A. E., & Lieberman, I. Y. (1995). The role of phonology and orthography in morphological awareness. In L. Feldman (Ed.),Morphological aspects of language processing (pp. 189–209). Hillsdale, NJ: Erlbaum.
Fuchs, L. S., & Fuchs, D. (1992). Identifying a measure for monitoring student reading progress. School Psychology Review, 21, 45–58.García, J. R., & Cain, K. (2014). Decoding and reading comprehension: A meta-analysis to identify which reader and assessment char-
acteristics influence the strength of the relationship in English. Review of Educational Research, 84, 74–111. https://doi.org/10.3102/0034654313499616
Gardner, E. F., Rudman, H. C., Karlsen, B., & Merwin, J. C. (1982). Stanford achievement test. Iowa City, IA: Harcourt Brace Jovanovich.Gernsbacher, M. A., & Faust, M. (1991). The role of suppression in sentence compression. In G. B. Simpson (Ed.), Comprehending word
and sentence (pp. 97–128). https://doi.org/10.1016/S0166-4115(08)61531-9Goldman, S. R., Greenleaf, C., Yukhymenko-Lescroart, M., Brown, W., Ko, M. L. M., Emig, J. M., George M.A., Wallace P., Blaum D.
& Britt, M. A. (2019). Explanatory modeling in science through text-based investigation: Testing the efficacy of the Project READIintervention approach. American Educational Research Journal https://doi.org/10.3102/0002831219831041, 56, 1148, 1216.
Gordon Commission. (2013). To assess, to teach, to learn: A vision for the future of assessment. Retrieved from https://www.ets.org/Media/Research/pdf/technical_report_executive_summary.pdf
Gough, P. B., & Tunmer, W. E. (1986). Decoding, reading, and reading disability. Remedial and Special Education, 7, 6–10. https://doi.org/10.1177/074193258600700104
Graves, M. F., Brunetti, G. J., & Slater, W. H. (1982). The reading vocabularies of primary-grade children of varying geographic andsocial backgrounds. In J. A. Niles & L. A. Harris (Eds.), New inquiries in reading research and instruction: Thirty-first yearbook of theNational Reading Conference (pp. 99–104). Rochester, NY: National Reading Conference.
Graves, M., & Slater, W. (1987, April). The development of reading vocabularies in rural disadvantaged students, inner-city disadvantagedstudents, and middle-class suburban students. Paper presented at the meeting of the American Educational Research Association,Washington, DC.
Haberman, S. J. (2008). When can subscores have value? Journal of Educational and Behavioral Statistics, 33, 204–229. https://doi.org/10.3102/1076998607302636
Hart, B., & Risley, T. R. (1995). Meaningful differences in the everyday experience of young American children. Baltimore, MD: Paul H.Brookes.
Hirsch, E. D. (2003). Reading comprehension requires knowledge of words and the world. American Educator, 27, 10–31.Hogan, T. P., Bridges, M. S., Justice, L. M., & Cain, K. (2011). Increasing higher level language skills to improve reading comprehension.
Focus on Exceptional Children, 44, 1–20. https://doi.org/10.17161/foec.v44i3.6688Hoover, W. A., & Gough, P. B. (1990). The simple view of reading. Reading and Writing: An Interdisciplinary Journal, 2, 127–160. https://
doi.org/10.1007/BF00401799Kane, M. T. (1992). An argument-based approach to validity. Psychological Bulletin, 112(3), 527. https://doi.org/10.1037/0033-2909.112
.3.527, 535Kane, M. (2006). Validation. In R. J. Brennan (Ed.), Educational measurement (4th ed., pp. 18–64). Lanham, MD: Rowman and Little-
field Education.Kang, H.-W. (1993). How can a mess be fine? Polysemy and reading in a foreign language. Mid-Atlantic Journal of Foreign Language
Pedagogy, 1, 35–49.Kieffer, M. J., & Lesaux, N. K. (2007). Breaking down words to build meaning: Morphology, vocabulary, and reading comprehension
in the urban classroom. Reading Teacher, 61, 134–144. https://doi.org/10.1598/RT.61.2.3Kieffer, M. J., & Lesaux, N. K. (2008). The role of derivational morphological awareness in the reading comprehension of Spanish-
speaking English language learners. Reading and Writing: An Interdisciplinary Journal, 21, 783–804. https://doi.org/10.1007/s11145-007-9092-8
Kim, J. S., Hemphill, L., Troyer, M., Thomson, J. M., Jones, S. M., LaRusso, M. D., & Donovan, S. (2017). Engaging struggling adolescentreaders to improve reading skills. Reading Research Quarterly, 52, 357–382. https://doi.org/10.1002/rrq.171
Kintsch, W. (1988). The role of knowledge in discourse comprehension: A construction-integration model. Psychological Review, 95,163–182. https://doi.org/10.1037/0033-295X.95.2.163
Kintsch, W. (1998). Comprehension: A paradigm for cognition. Cambridge, England: Cambridge University Press.Kolen, M. J., & Brennan, R. L. (2013). Test equating: Methods and practices. Berlin, Germany: Springer Science and Business Media.
22 ETS Research Report No. RR-19-36. © 2019 Educational Testing Service
J. Sabatini et al. SARA Reading Components Tests, RISE Forms
Kuo, L., & Anderson, R. C. (2006). Morphological awareness and learning to read: A cross-language perspective. Educational Psychol-ogist, 41, 161–180. https://doi.org/10.1207/s15326985ep4103_3
LaBerge, D., & Samuels, S. J. (1974). Toward a theory of automatic information processing in reading. Cognitive Psychology, 6, 293–323.https://doi.org/10.1016/0010-0285(74)90015-2
Lesaux, N. K., Kieffer, M. J., Faller, S. E., & Kelley, J. (2010). The effectiveness and ease of implementation of an academic vocabularyintervention for linguistically diverse students in urban middle schools. Reading Research Quarterly, 45, 198–230. https://doi.org/10.1598/RRQ.45.2.3
Lord, F. M., & Novick, M. R. (1968). Statistical theories of mental test scores. Reading, MA: Addison-Wesley.Mann, V. A., Shankweiler, D., & Smith, S. T. (1984). The association between comprehension of spoken sentences and early reading
ability: The role of phonetic representation. Journal of Child Language, 11, 627–643. https://doi.org/10.1017/S0305000900005997McClure, E., & Steffensen, M. (1985). A study of the use of conjunctions across grades and ethnic groups. Research in the Teaching of
English, 19, 217–236.McCormick, C., Sabatini, J., Bruce, K., Sinharay, S., & O’Reilly, T. (2012, July). Subscore evaluation for a test of reading skills. Paper
presented at the meeting of the Psychometric Society, Lincoln, NE.McNamara, D., & Kintsch, W. (1996). Learning from texts: Effects of prior knowledge and text coherence. Discourse Processes, 22,
247–288. https://doi.org/10.1080/01638539609544975McNamara, D. S., & McDaniel, M. A. (2004). Suppressing irrelevant information: Knowledge activation or inhibition? Journal of Exper-
imental Psychology: Learning, Memory, and Cognition, 30, 465–482. https://doi.org/10.1037/0278-7393.30.2.465Mislevy, R. J., & Haertel, G. D. (2006). Implications of evidence-centered design for educational testing. Educational Measurement:
Issues and Practice, 25(4), 6–20. https://doi.org/10.1111/j.1745-3992.2006.00075.xMislevy, R. J., & Sabatini, J. P. (2012). How research on reading and research on assessment are transforming reading assessment (or
if they aren’t, how they ought to). In J. P. Sabatini, E. Albro, & T. O’Reilly (Eds.), Measuring up: Advances in how we assess readingability (pp. 119–134). Lanham, MD: Rowman and Littlefield.
Mislevy, R. J., Steinberg, L. S., & Almond, R. G. (2003). Focus article: On the structure of educational assessments. Measurement:Interdisciplinary Research and Perspectives, 1(1), 3–62. https://doi.org/10.1207/S15366359MEA0101_02
Nagy, W., & Anderson, R. C. (1984). The number of words in printed school English. Reading Research Quarterly, 19, 304–330. https://doi.org/10.2307/747823
Nagy, W., Berninger, V. W., & Abbott, R. D. (2006). Contributions of morphology beyond phonology to literacy outcomes of upperelementary and middle-school students. Journal of Educational Psychology, 98, 134–147. https://doi.org/10.1037/0022-0663.98.1.134
Nagy, W., & Scott, J. A. (2000). Vocabulary processes. In M. L. Kamil, P. B. Mosenthal, P. D. Pearson, & R. Barr (Eds.), Handbook ofreading research (Vol. 3, pp. 269–284). Mahwah, NJ: Erlbaum.
National Center for Education Statistics. (2012). Vocabulary results from the 2009 and 2011 NAEP reading assessments (Report No.2013–452). Washington, DC: U.S. Department of Education, Institute of Education Sciences, National Center for EducationStatistics.
Olson, R. (2007). Introduction to the special issue on genes, environment, and reading. Reading and Writing, 20, 1–11. https://doi.org/10.1007/s11145-006-9015-0
O’Reilly, T., & Sabatini, J. (2013). Reading for understanding: How performance moderators and scenarios impact assessment design(Research Report No. RR-13-31). Princeton, NJ: Educational Testing Service. https://doi.org/10.1002/j.2333-8504.2013.tb02338.x
O’Reilly, T., Sabatini, J., Bruce, K., Pillarisetti, S., & McCormick, C. (2012). Middle school reading assessment: Measuring what mattersunder an RTI framework. Journal of Reading Psychology, 33, 162–189. https://doi.org/10.1080/02702711.2012.631865
O’Reilly, T., & Sheehan, K. M. (2009). Cognitively based assessment of, for and as learning: A framework for assessing reading competency(Research Report No. RR-09-26). Princeton, NJ: Educational Testing Service. https://doi.org/10.1002/j.2333-8504.2009.tb02183.x
Ouellet, G. P. (2006). What’s meaning got to do with it: The role of vocabulary in word reading and reading comprehension. Journal ofEducational Psychology, 98, 554–566. https://doi.org/10.1037/0022-0663.98.3.554
Papamihiel, N. E., Lake, V., & Rice, D. (2005). Adapting a social studies lesson to include English language learners. Social Studies andthe Young Learner, 17, 4–7.
Partnership for 21st Century Skills. (2004). Learning for the 21st century: A report and mile guide for 21st century skills. Retrieved fromhttp://www.p21.org/storage/documents/P21_Report.pdf
Partnership for 21st Century Skills. (2008). 21st century skills and English map. Retrieved from http://www.p21.org/storage/documents/21st_century_skills_english_map.pdf
Pellegrino, J. W., Chudowsky, N., & Glaser, R. (2001). Knowing what students know: The science and design of educational assessment.Washington, DC: National Academy Press.
Perfetti, C. A. (1985). Reading ability. New York, NY: Oxford University Press.Perfetti, C. A. (1993). Why inferences might be restricted. Discourse Processes, 16, 181–192. https://doi.org/10.1080/01638539309544836
ETS Research Report No. RR-19-36. © 2019 Educational Testing Service 23
J. Sabatini et al. SARA Reading Components Tests, RISE Forms
Perfetti, C. A. (1994). Psycholinguistics and reading ability. In M. A. Gernsbacher (Ed.), Handbook of psycholinguistics (pp. 849–894).San Diego, CA: Academic Press.
Perfetti, C. A. (1995). Cognitive research can inform reading education. Journal of Research in Reading, 18, 106–115. https://doi.org/10.1111/j.1467-9817.1995.tb00076.x
Perfetti, C. A., & Adlof, S. M. (2012). Reading comprehension: A conceptual framework from word meaning to text meaning. In J. P.Sabatini, E. Albro, & T. O’Reilly (Eds.), Measuring up: Advances in how we assess reading ability (pp. 3–20). Lanham, MD: Rowmanand Littlefield Education.
Perfetti, C. A., & Hart, L. (2001). The lexical bases of comprehension skill. In D. S. Gorfien (Ed.), On the consequences of meaningselection: Perspectives on resolving lexical ambiguity (pp. 67–86). https://doi.org/10.1037/10459-004
Proctor, C. P., Dalton, B., Uccelli, P., Biancarosa, G., Mo, E., Snow, C., & Neugebauer, S. (2011). Improving comprehension online:Effects of deep vocabulary instruction with bilingual and monolingual fifth graders. Reading and Writing, 24, 517–544. https://doi.org/10.1007/s11145-009-9218-2
Rayner, K. (1997). Understanding eye movements in reading. Scientific Studies of Reading, 1, 317–339. https://doi.org/10.1207/s1532799xssr0104_2
Reckase, M. D. (1985). The difficulty of test items that measure more than one ability. Applied Psychological Measurement, 9, 401–412.https://doi.org/10.1177/014662168500900409
Reynolds, R. E. (2000). Attentional resource emancipation: Toward understanding the interaction of word identification. ScientificStudies of Reading, 4, 169–195. https://doi.org/10.1207/S1532799XSSR0403_1
Rumelhart, D. E., & McClelland, J. L. (1982). An interactive activation model of context effects in letter perception: Part 2. The contextenhancement effect and some tests and extensions of the model. Psychological Review, 89, 60–94. https://doi.org/10.1037/0033-295X.89.1.60
Sabatini, J. P. (2009). From health/medical analogies to helping struggling middle school readers: Issues in applying research to practice.In S. Rosenfield & V. Berninger (Eds.), Translating science-supported instruction into evidence-based practices: Understanding andapplying the implementation process (pp. 285–316). New York, NY: Oxford University Press. https://doi.org/10.1093/med:psych/9780195325355.003.0010
Sabatini, J., Bruce, K., & Pillarisetti, S. (2010, May). Designing and implementing school level assessments with district input. Paper pre-sented at the meeting of the American Educational Research Association, Denver, CO.
Sabatini, J., Bruce, K., Pillarisetti, S., & McCormick, C. (2010, July). Investigating the range and variability in reading subskills of middleschool students: Relationships between reading subskills and reading comprehension for non-proficient and proficient readers. Paperpresented at the meeting of the Society for the Scientific Study of Reading, Berlin, Germany.
Sabatini, J. P., Bruce, K., & Sinharay, S. (2009, June). Heterogeneity in the skill profiles of adolescent readers. Paper presented at the meetingof the Society for the Scientific Study of Reading, Boston, MA.
Sabatini, J., Bruce, K., & Steinberg, J. (2013). SARA reading components tests, RISE form: Test design and technical adequacy (ResearchReport No. RR-13-08). Princeton, NJ: Educational Testing Service. https://doi.org/10.1002/j.2333-8504.2013.tb02315.x
Sabatini, J., Bruce, K., Steinberg, J., & Weeks, J. (2015). SARA reading components tests, RISE forms: Technical adequacy and test design,2nd edition (Research Report No. RR-15-32). Princeton, NJ: Educational Testing Service. https://doi.org/10.1002/ets2.12076
Sabatini, J., & O’Reilly, T. (2013). Rationale for a new generation of reading comprehension assessments. In B. Miller, L. Cutting,& P. McCardle (Eds.), Unraveling the behavioral, neurobiological, and genetic components of reading comprehension (pp. 100–111).Baltimore, MD: Brookes.
Sabatini, J., O’Reilly, T., & Deane, P. (2013). Preliminary reading literacy assessment framework: Foundation and rationale for assessmentand system design (Research Report No. RR-13-30). Princeton, NJ: Educational Testing Service. https://doi.org/10.1002/j.2333-8504.2013.tb02337.x
Sabatini, J., O’Reilly, T., Weeks, J., & Wang, Z. (2019). Engineering a 21st century reading comprehension assessment system uti-lizing scenario-based assessment techniques. Advance online publication. International Journal of Testing https://doi.org/10.1080/15305058.2018.1551224
Scarborough, H. S. (2001). Connecting early language and literacy to later reading (dis)abilities: Evidence, theory, and practice. InS. Neuman & D. Dickinson (Eds.), Handbook for research in early literacy (Vol. 1, pp. 97–110). New York, NY: Guilford Press.
Seidenberg, M. (2017). Language at the speed of sight: How we read, why so many can’t, and what can be done about it. New York, NY:Basic Books.
Semel, E., Wiig, E., & Secord, W. (2003). The clinical evaluation of language fundamentals, 4th ed.: Examiner’s manual. San Antonio, TX:Pearson.
Share, D. L. (1997). Understanding the significance of phonological deficits in dyslexia. English Teacher’s Journal, 51, 50–54.Shin, J., Deno, S. L., & Espin, C. A. (2000). Technical adequacy of the maze task for curriculum-based measurement of reading growth.
Journal of Special Education, 34, 164–172. https://doi.org/10.1177/002246690003400305
24 ETS Research Report No. RR-19-36. © 2019 Educational Testing Service
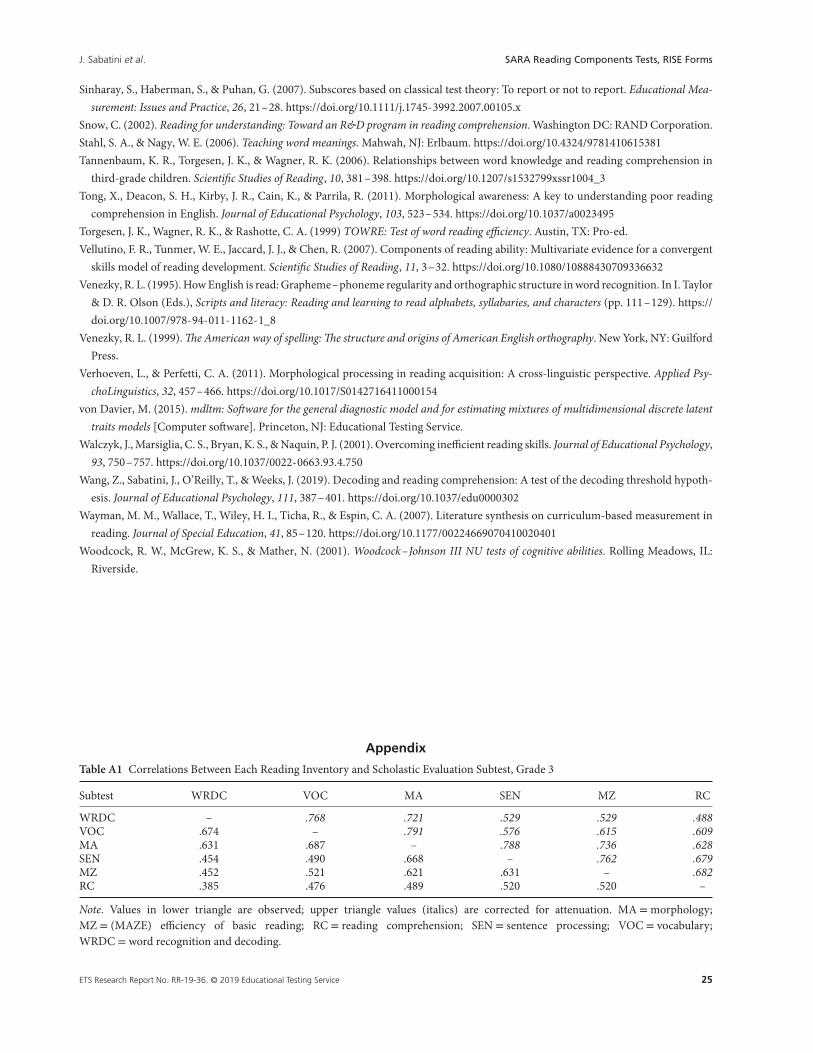
J. Sabatini et al. SARA Reading Components Tests, RISE Forms
Sinharay, S., Haberman, S., & Puhan, G. (2007). Subscores based on classical test theory: To report or not to report. Educational Mea-surement: Issues and Practice, 26, 21–28. https://doi.org/10.1111/j.1745-3992.2007.00105.x
Snow, C. (2002). Reading for understanding: Toward an R&D program in reading comprehension. Washington DC: RAND Corporation.Stahl, S. A., & Nagy, W. E. (2006). Teaching word meanings. Mahwah, NJ: Erlbaum. https://doi.org/10.4324/9781410615381Tannenbaum, K. R., Torgesen, J. K., & Wagner, R. K. (2006). Relationships between word knowledge and reading comprehension in
third-grade children. Scientific Studies of Reading, 10, 381–398. https://doi.org/10.1207/s1532799xssr1004_3Tong, X., Deacon, S. H., Kirby, J. R., Cain, K., & Parrila, R. (2011). Morphological awareness: A key to understanding poor reading
comprehension in English. Journal of Educational Psychology, 103, 523–534. https://doi.org/10.1037/a0023495Torgesen, J. K., Wagner, R. K., & Rashotte, C. A. (1999) TOWRE: Test of word reading efficiency. Austin, TX: Pro-ed.Vellutino, F. R., Tunmer, W. E., Jaccard, J. J., & Chen, R. (2007). Components of reading ability: Multivariate evidence for a convergent
skills model of reading development. Scientific Studies of Reading, 11, 3–32. https://doi.org/10.1080/10888430709336632Venezky, R. L. (1995). How English is read: Grapheme–phoneme regularity and orthographic structure in word recognition. In I. Taylor
& D. R. Olson (Eds.), Scripts and literacy: Reading and learning to read alphabets, syllabaries, and characters (pp. 111–129). https://doi.org/10.1007/978-94-011-1162-1_8
Venezky, R. L. (1999). The American way of spelling: The structure and origins of American English orthography. New York, NY: GuilfordPress.
Verhoeven, L., & Perfetti, C. A. (2011). Morphological processing in reading acquisition: A cross-linguistic perspective. Applied Psy-choLinguistics, 32, 457–466. https://doi.org/10.1017/S0142716411000154
von Davier, M. (2015). mdltm: Software for the general diagnostic model and for estimating mixtures of multidimensional discrete latenttraits models [Computer software]. Princeton, NJ: Educational Testing Service.
Walczyk, J., Marsiglia, C. S., Bryan, K. S., & Naquin, P. J. (2001). Overcoming inefficient reading skills. Journal of Educational Psychology,93, 750–757. https://doi.org/10.1037/0022-0663.93.4.750
Wang, Z., Sabatini, J., O’Reilly, T., & Weeks, J. (2019). Decoding and reading comprehension: A test of the decoding threshold hypoth-esis. Journal of Educational Psychology, 111, 387–401. https://doi.org/10.1037/edu0000302
Wayman, M. M., Wallace, T., Wiley, H. I., Ticha, R., & Espin, C. A. (2007). Literature synthesis on curriculum-based measurement inreading. Journal of Special Education, 41, 85–120. https://doi.org/10.1177/00224669070410020401
Woodcock, R. W., McGrew, K. S., & Mather, N. (2001). Woodcock–Johnson III NU tests of cognitive abilities. Rolling Meadows, IL:Riverside.
Appendix
Table A1 Correlations Between Each Reading Inventory and Scholastic Evaluation Subtest, Grade 3
Subtest WRDC VOC MA SEN MZ RC
WRDC – .768 .721 .529 .529 .488VOC .674 – .791 .576 .615 .609MA .631 .687 – .788 .736 .628SEN .454 .490 .668 – .762 .679MZ .452 .521 .621 .631 – .682RC .385 .476 .489 .520 .520 –
Note. Values in lower triangle are observed; upper triangle values (italics) are corrected for attenuation. MA = morphology;MZ = (MAZE) efficiency of basic reading; RC = reading comprehension; SEN = sentence processing; VOC = vocabulary;WRDC = word recognition and decoding.
ETS Research Report No. RR-19-36. © 2019 Educational Testing Service 25
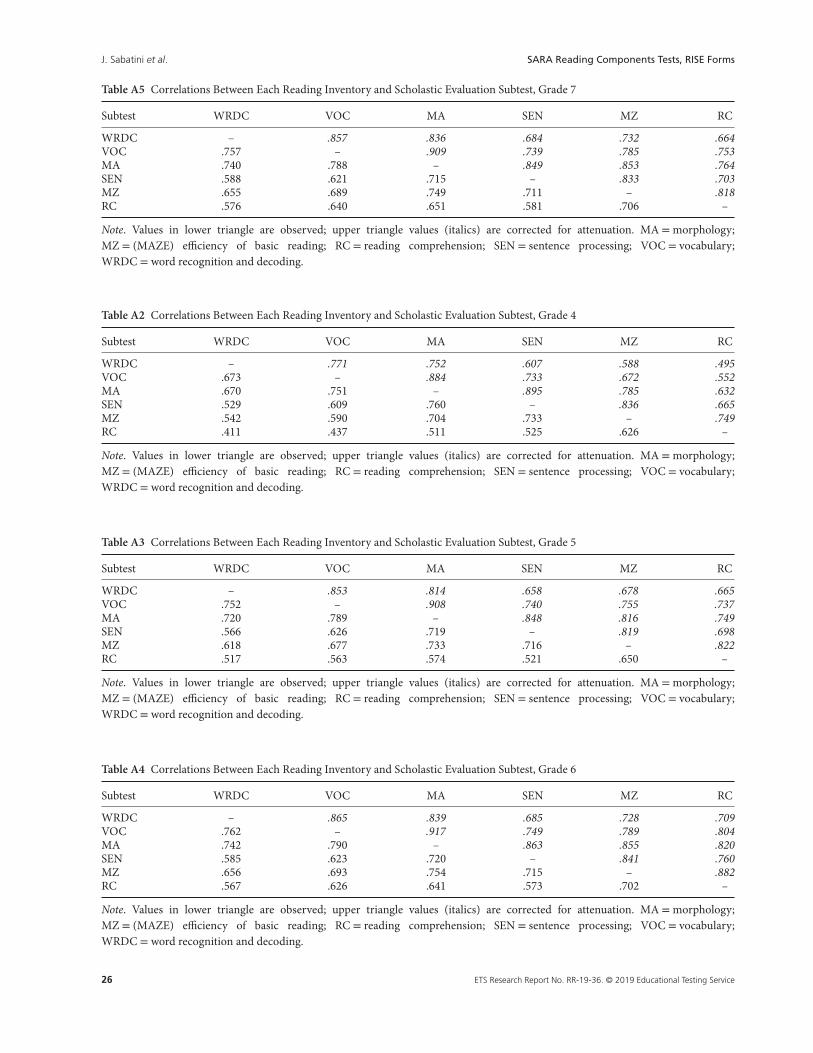
J. Sabatini et al. SARA Reading Components Tests, RISE Forms
Table A5 Correlations Between Each Reading Inventory and Scholastic Evaluation Subtest, Grade 7
Subtest WRDC VOC MA SEN MZ RC
WRDC – .857 .836 .684 .732 .664VOC .757 – .909 .739 .785 .753MA .740 .788 – .849 .853 .764SEN .588 .621 .715 – .833 .703MZ .655 .689 .749 .711 – .818RC .576 .640 .651 .581 .706 –
Note. Values in lower triangle are observed; upper triangle values (italics) are corrected for attenuation. MA = morphology;MZ = (MAZE) efficiency of basic reading; RC = reading comprehension; SEN = sentence processing; VOC = vocabulary;WRDC = word recognition and decoding.
Table A2 Correlations Between Each Reading Inventory and Scholastic Evaluation Subtest, Grade 4
Subtest WRDC VOC MA SEN MZ RC
WRDC – .771 .752 .607 .588 .495VOC .673 – .884 .733 .672 .552MA .670 .751 – .895 .785 .632SEN .529 .609 .760 – .836 .665MZ .542 .590 .704 .733 – .749RC .411 .437 .511 .525 .626 –
Note. Values in lower triangle are observed; upper triangle values (italics) are corrected for attenuation. MA = morphology;MZ = (MAZE) efficiency of basic reading; RC = reading comprehension; SEN = sentence processing; VOC = vocabulary;WRDC = word recognition and decoding.
Table A3 Correlations Between Each Reading Inventory and Scholastic Evaluation Subtest, Grade 5
Subtest WRDC VOC MA SEN MZ RC
WRDC – .853 .814 .658 .678 .665VOC .752 – .908 .740 .755 .737MA .720 .789 – .848 .816 .749SEN .566 .626 .719 – .819 .698MZ .618 .677 .733 .716 – .822RC .517 .563 .574 .521 .650 –
Note. Values in lower triangle are observed; upper triangle values (italics) are corrected for attenuation. MA = morphology;MZ = (MAZE) efficiency of basic reading; RC = reading comprehension; SEN = sentence processing; VOC = vocabulary;WRDC = word recognition and decoding.
Table A4 Correlations Between Each Reading Inventory and Scholastic Evaluation Subtest, Grade 6
Subtest WRDC VOC MA SEN MZ RC
WRDC – .865 .839 .685 .728 .709VOC .762 – .917 .749 .789 .804MA .742 .790 – .863 .855 .820SEN .585 .623 .720 – .841 .760MZ .656 .693 .754 .715 – .882RC .567 .626 .641 .573 .702 –
Note. Values in lower triangle are observed; upper triangle values (italics) are corrected for attenuation. MA = morphology;MZ = (MAZE) efficiency of basic reading; RC = reading comprehension; SEN = sentence processing; VOC = vocabulary;WRDC = word recognition and decoding.
26 ETS Research Report No. RR-19-36. © 2019 Educational Testing Service
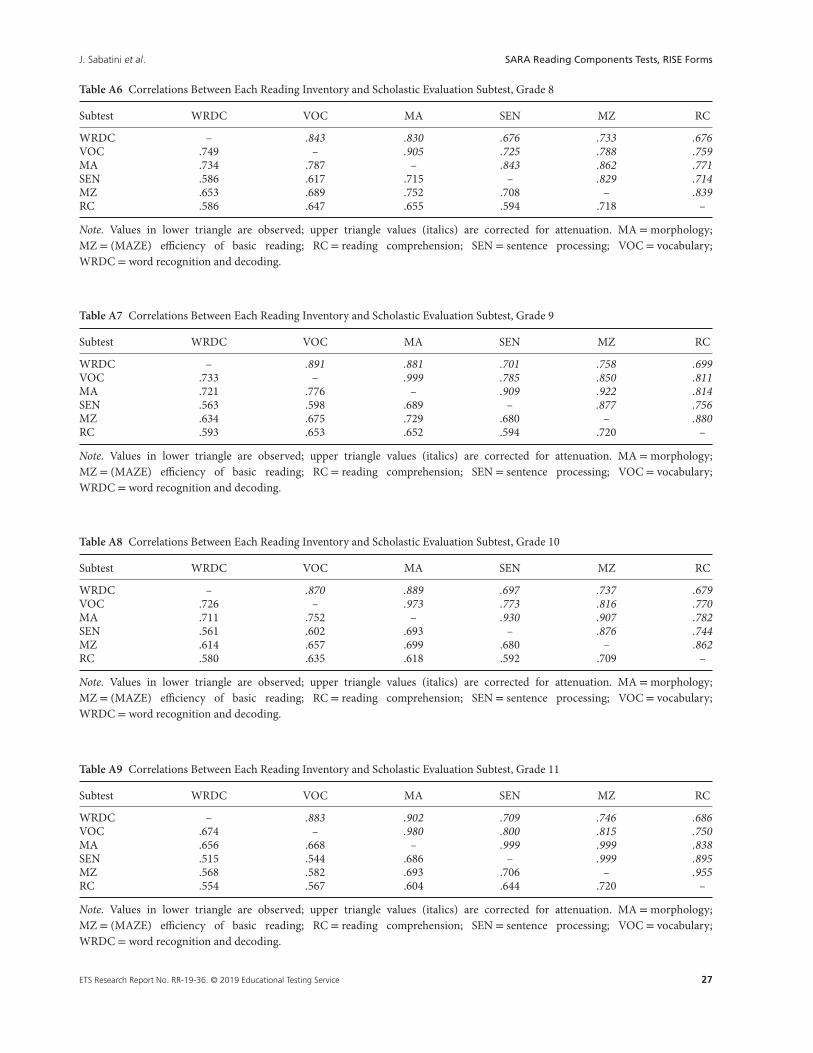
J. Sabatini et al. SARA Reading Components Tests, RISE Forms
Table A6 Correlations Between Each Reading Inventory and Scholastic Evaluation Subtest, Grade 8
Subtest WRDC VOC MA SEN MZ RC
WRDC – .843 .830 .676 .733 .676VOC .749 – .905 .725 .788 .759MA .734 .787 – .843 .862 .771SEN .586 .617 .715 – .829 .714MZ .653 .689 .752 .708 – .839RC .586 .647 .655 .594 .718 –
Note. Values in lower triangle are observed; upper triangle values (italics) are corrected for attenuation. MA = morphology;MZ = (MAZE) efficiency of basic reading; RC = reading comprehension; SEN = sentence processing; VOC = vocabulary;WRDC = word recognition and decoding.
Table A7 Correlations Between Each Reading Inventory and Scholastic Evaluation Subtest, Grade 9
Subtest WRDC VOC MA SEN MZ RC
WRDC – .891 .881 .701 .758 .699VOC .733 – .999 .785 .850 .811MA .721 .776 – .909 .922 .814SEN .563 .598 .689 – .877 .756MZ .634 .675 .729 .680 – .880RC .593 .653 .652 .594 .720 –
Note. Values in lower triangle are observed; upper triangle values (italics) are corrected for attenuation. MA = morphology;MZ = (MAZE) efficiency of basic reading; RC = reading comprehension; SEN = sentence processing; VOC = vocabulary;WRDC = word recognition and decoding.
Table A8 Correlations Between Each Reading Inventory and Scholastic Evaluation Subtest, Grade 10
Subtest WRDC VOC MA SEN MZ RC
WRDC – .870 .889 .697 .737 .679VOC .726 – .973 .773 .816 .770MA .711 .752 – .930 .907 .782SEN .561 .602 .693 – .876 .744MZ .614 .657 .699 .680 – .862RC .580 .635 .618 .592 .709 –
Note. Values in lower triangle are observed; upper triangle values (italics) are corrected for attenuation. MA = morphology;MZ = (MAZE) efficiency of basic reading; RC = reading comprehension; SEN = sentence processing; VOC = vocabulary;WRDC = word recognition and decoding.
Table A9 Correlations Between Each Reading Inventory and Scholastic Evaluation Subtest, Grade 11
Subtest WRDC VOC MA SEN MZ RC
WRDC – .883 .902 .709 .746 .686VOC .674 – .980 .800 .815 .750MA .656 .668 – .999 .999 .838SEN .515 .544 .686 – .999 .895MZ .568 .582 .693 .706 – .955RC .554 .567 .604 .644 .720 –
Note. Values in lower triangle are observed; upper triangle values (italics) are corrected for attenuation. MA = morphology;MZ = (MAZE) efficiency of basic reading; RC = reading comprehension; SEN = sentence processing; VOC = vocabulary;WRDC = word recognition and decoding.
ETS Research Report No. RR-19-36. © 2019 Educational Testing Service 27
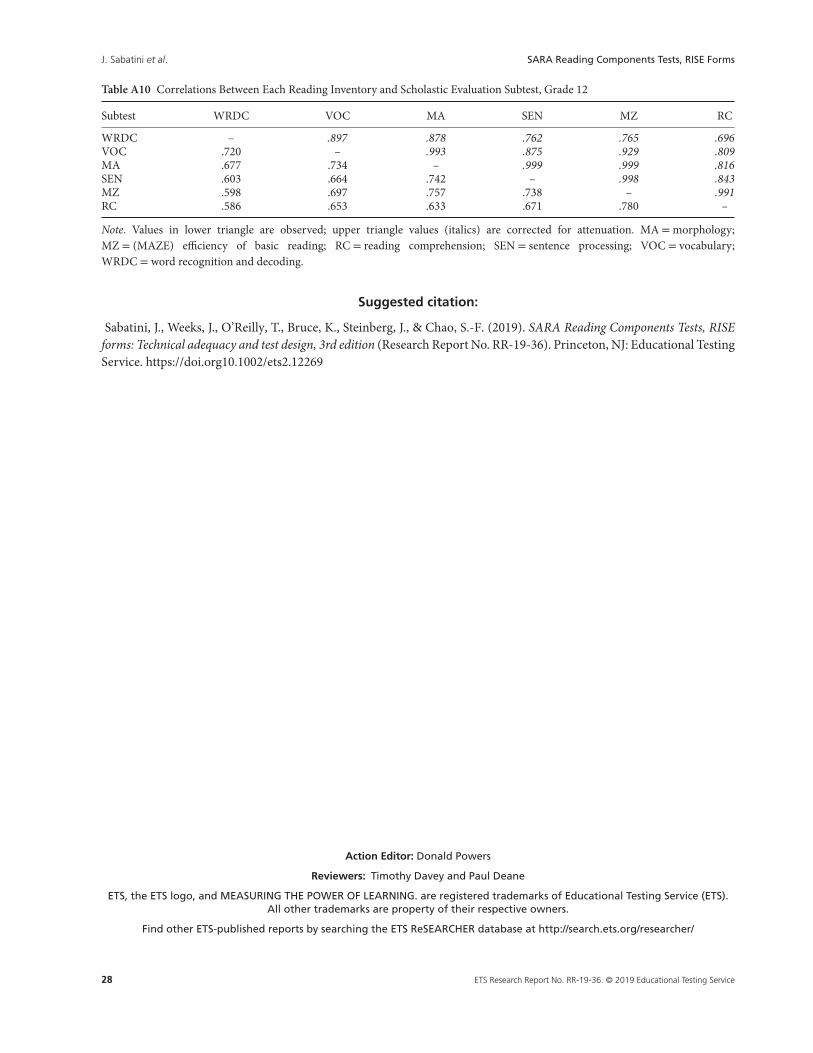
J. Sabatini et al. SARA Reading Components Tests, RISE Forms
Table A10 Correlations Between Each Reading Inventory and Scholastic Evaluation Subtest, Grade 12
Subtest WRDC VOC MA SEN MZ RC
WRDC – .897 .878 .762 .765 .696VOC .720 – .993 .875 .929 .809MA .677 .734 – .999 .999 .816SEN .603 .664 .742 – .998 .843MZ .598 .697 .757 .738 – .991RC .586 .653 .633 .671 .780 –
Note. Values in lower triangle are observed; upper triangle values (italics) are corrected for attenuation. MA = morphology;MZ = (MAZE) efficiency of basic reading; RC = reading comprehension; SEN = sentence processing; VOC = vocabulary;WRDC = word recognition and decoding.
Suggested citation:
Sabatini, J., Weeks, J., O’Reilly, T., Bruce, K., Steinberg, J., & Chao, S.-F. (2019). SARA Reading Components Tests, RISEforms: Technical adequacy and test design, 3rd edition (Research Report No. RR-19-36). Princeton, NJ: Educational TestingService. https://doi.org10.1002/ets2.12269
Action Editor: Donald Powers
Reviewers: Timothy Davey and Paul Deane
ETS, the ETS logo, and MEASURING THE POWER OF LEARNING. are registered trademarks of Educational Testing Service (ETS).All other trademarks are property of their respective owners.
Find other ETS-published reports by searching the ETS ReSEARCHER database at http://search.ets.org/researcher/
28 ETS Research Report No. RR-19-36. © 2019 Educational Testing Service
Related Documents