+91 022 67522300 [email protected] www.sapphirefoods.in 702, Prism Tower, A-Wing, Mindspace, Link Road, Goregaon (W), Mumbai- 400062 Sapphire Foods India Limited (formerly known as Sapphire Foods India Private Limited) CIN: L55204MH2009PLC197005 Date: May 17, 2022 To, National Stock Exchange of India Limited Exchange Plaza, Block G, C/1, Bandra Kurla Complex, Bandra (E), Mumbai – 400051 Symbol: SAPPHIRE BSE Limited Phiroze Jeejeebhoy Towers, Dalal Street, Mumbai – 40001 Scrip Code: 543397 Dear Sir/Madam, Subject: Investor Presentation (Revised) This has a reference to our intimation letter dated May 17, 2022, wherein the Company has submitted Earnings Presentation, inter-alia, to the Stock Exchanges. In connection herewith, please find enclosed herewith revised earning presentation, for the purpose of revision carried out in the following slides: Slide No. Particulars Old Disclosure Revised Disclosure 21 Rest. Count (FY21) – KFC India 261 203 29 Rest. Count (FY21) – Pizza Hut India 221 162 The Investor’s Presentation will be available on Company’s website (www.sapphirefoods.in/investors-relation/financial-information ). Request you to kindly take the same on record. Thanking you, For Sapphire Foods India Limited Sachin Dudam Company Secretary and Compliance Officer Encl: a/a

Welcome message from author
This document is posted to help you gain knowledge. Please leave a comment to let me know what you think about it! Share it to your friends and learn new things together.
Transcript
+91 022 67522300 [email protected] www.sapphirefoods.in 702, Prism Tower, A-Wing, Mindspace, Link
Road, Goregaon (W), Mumbai- 400062
Sapphire Foods India Limited (formerly known as Sapphire Foods India Private Limited) CIN: L55204MH2009PLC197005
Date: May 17, 2022
To,
National Stock Exchange of India Limited
Exchange Plaza, Block G, C/1, Bandra Kurla Complex, Bandra (E), Mumbai – 400051
Symbol: SAPPHIRE
BSE Limited
Phiroze Jeejeebhoy Towers, Dalal Street, Mumbai – 40001
Scrip Code: 543397
Dear Sir/Madam, Subject: Investor Presentation (Revised) This has a reference to our intimation letter dated May 17, 2022, wherein the Company has submitted Earnings Presentation, inter-alia, to the Stock Exchanges. In connection herewith, please find enclosed herewith revised earning presentation, for the purpose of revision carried out in the following slides:
Slide No. Particulars Old Disclosure Revised Disclosure 21 Rest. Count (FY21) – KFC India 261 203 29 Rest. Count (FY21) – Pizza Hut India 221 162
The Investor’s Presentation will be available on Company’s website (www.sapphirefoods.in/investors-relation/financial-information ). Request you to kindly take the same on record. Thanking you, For Sapphire Foods India Limited Sachin Dudam Company Secretary and Compliance Officer Encl: a/a
Sapphire Foods India Limited3Q FY22 Earnings Presentation
February 2022
SAPPHIRE FOODS INDIA LIMITED
Q4 FY22 AND FY22 EARNINGS PRESENTATION
MAY 2022
SAFE HARBOR
This presentation and the accompanying slides (the “Presentation”), which have been prepared by Sapphire Foods India Limited (the “Company”), have been prepared
solely for information purposes and do not constitute any offer, recommendation or invitation to purchase or subscribe for any securities, and shall not form the basis or be
relied on in connection with any contract or binding commitment what so ever. No offering of securities of the Company will be made except by means of a statutory offering
document containing detailed information about the Company.
This Presentation has been prepared by the Company based on information and data which the Company considers reliable, but the Company makes no representation or
warranty, express or implied, whatsoever, and no reliance shall be placed on, the truth, accuracy, completeness, fairness and reasonableness of the contents of this
Presentation. This Presentation may not be all inclusive and may not contain all of the information that you may consider material. Any liability in respect of the contents of, or
any omission from, this Presentation is expressly excluded
Certain matters discussed in this Presentation may contain statements regarding the Company’s market opportunity and business prospects that are individually and
collectively forward-looking statements. Such forward-looking statements are not guarantees of future performance and are subject to known and unknown risks,
uncertainties and assumptions that are difficult to predict. These risks and uncertainties include, but are not limited to, the performance of the Indian economy and of the
economies of various international markets, the performance of the industry in India and world-wide, competition, the company’s ability to successfully implement its strategy,
the Company’s future levels of growth and expansion, technological implementation, changes and advancements, changes in Restaurant Sales, income or cash flows, the
Company’s market preferences and its exposure to market risks, as well as other risks. The Company’s actual results, levels of activity, performance or achievements could
differ materially and adversely from results expressed in or implied by this Presentation. The Company assumes no obligation to update any forward-looking information
contained in this Presentation. Any forward-looking statements and projections made by third parties included in this Presentation are not adopted by the Company and the
Company is not responsible for such third party statements and projections.
2
We are pleased to announce our Q4FY22 & Full Year FY22 financial results.
In spite of operational disruptions on account of 3rd wave of the Covid pandemic, we have delivered a strong performance in
Q4FY22. We have added 29 new restaurants, Revenue has grown by 46%, EBITDA by 66% (up 260 bps) and PAT of 5.4%
(as against the loss of 4.1% in Q4FY21). Adjusted EBITDA (Pre-IND AS 116) rose to 12.9% (up 470 bps).
From a financial year perspective this has been by far the best year in Sapphire Foods short operating history. We added
142 new restaurants during the year, Revenue grew by 69%, EBITDA by 82% (up 130 bps) and PAT of 2.7% (as against loss
of 9.8% in FY21). Adjusted EBITDA (Pre-IND AS 116) has risen to 10.5% (up 670 bps).
Looking back to Mar-20 when the Covid pandemic struck, we expected it to have a detrimental impact on our
fledgling business. However, in reality, the last 2 years have helped us to transform our business and significantly improve the
financial performance. This positive outcome is a consequence of the values and resilience shown by each and every
employee of Sapphire Foods in responding to the travails of the pandemic.
All 3 businesses have seen a step change in performance in FY22. KFC has become Rs.1,000+ Cr Brand for Sapphire
with its highest ever Restaurant EBITDA of 19.5%. Our Omnichannel strategy on Pizza Hut is playing out with the
brand delivering double digit Restaurant EBITDA of 13.4%, with the more compact omnichannel stores opened from Apr-
18 onwards delivering mid-teens Restaurant EBITDA. The Sri Lanka business continues to be the biggest and best QSR
chain in the country despite the difficult macro economic conditions. In FY22 it has delivered best ever performance with 25
new restaurant additions, SSSG of 42%, Revenue growth of 60% and Restaurant EBITDA of 23.2% (up 360 bps).
Over the last few months, we are witnessing inflationary pressures on all our inputs, thereby requiring a fine balancing
act between increasing prices, minimizing the impact on consumer wallets, sustaining revenue & profitability growth.
However as operating conditions have normalized to pre Covid levels, we are seeing strong consumer demand for our
brands. Given our organizational ability to cope with volatile situations and find ways to get better, we are confident about our
future growth prospects.
WHOLE TIME DIRECTOR & GROUP CEO’S
COMMENTARY
3
Sanjay Purohit
Whole time Director and
Group CEO
COMPANY OVERVIEW Page 44-515
BUSINESS PERFORMANCE▪ KFC INDIA Page 16-22
▪ PIZZA HUT INDIA Page 24-30
▪ SRI LANKA Page 32-37
3
Q4 & FY22 CONSOLIDATED FINANCIAL HIGHLIGHTS Page 7-142
ESG & OTHER KEY INITIATIVES Page 39-424
TABLE OF CONTENTS
4
THE SAPPHIRE STORY Page 51
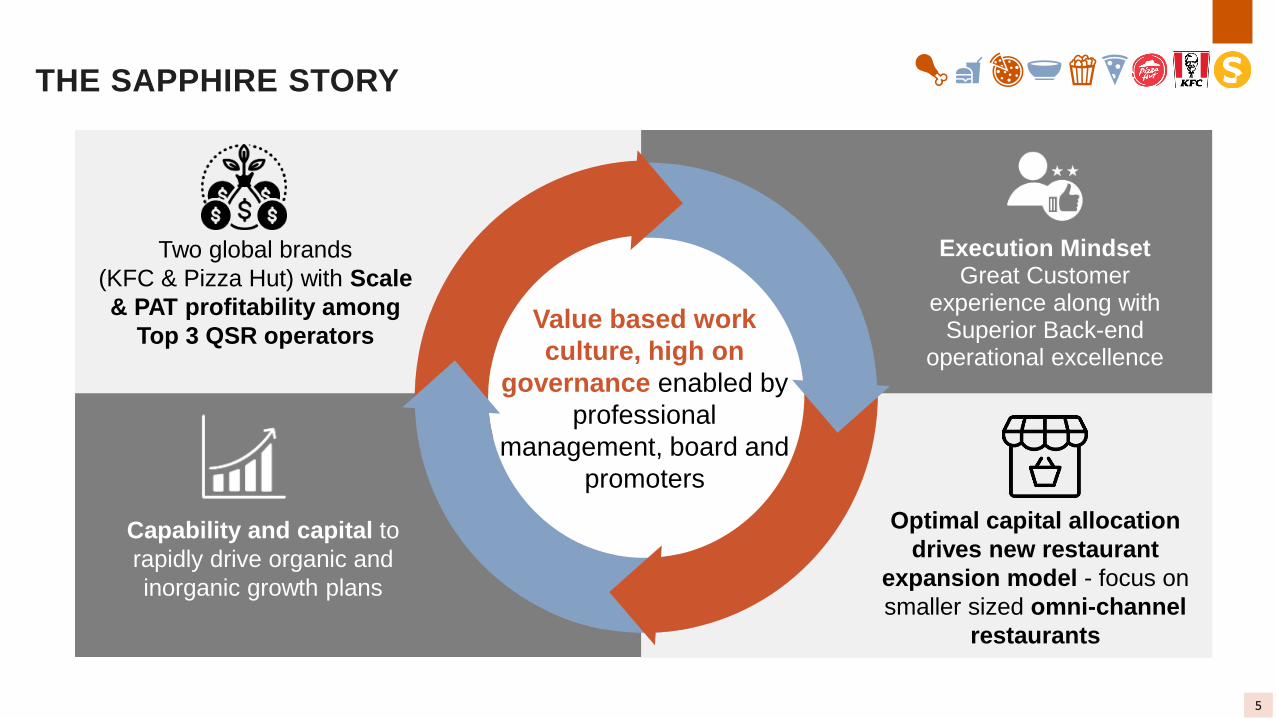
THE SAPPHIRE STORY
Capability and capital to
rapidly drive organic and
inorganic growth plans
Execution Mindset Great Customer
experience along with Superior Back-end
operational excellence
Two global brands
(KFC & Pizza Hut) with Scale
& PAT profitability among
Top 3 QSR operators
Optimal capital allocation
drives new restaurant
expansion model - focus on
smaller sized omni-channel
restaurants
Value based work
culture, high on
governance enabled by
professional
management, board and
promoters
5
Q4 FY22 & FY22
CONSOLIDATED FINANCIAL HIGHLIGHTS
SUMMARY CONSOLIDATED FINANCIALS
Q4 & FY22
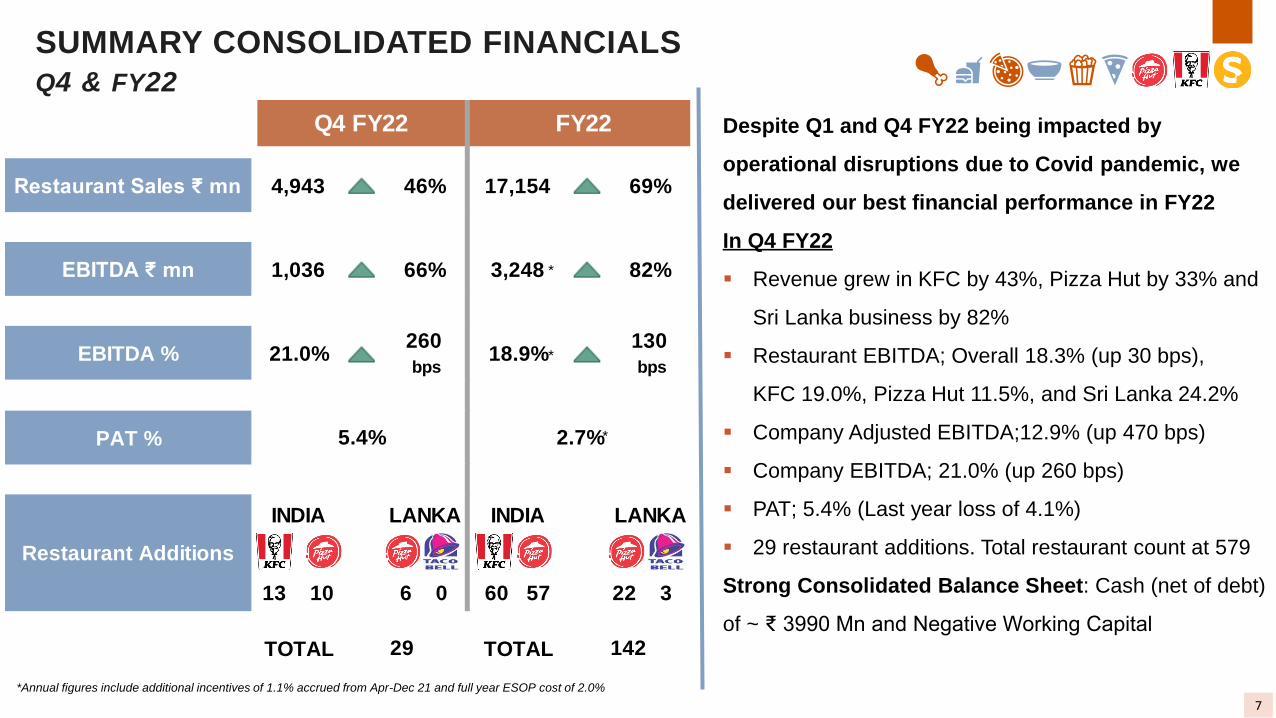
Despite Q1 and Q4 FY22 being impacted by
operational disruptions due to Covid pandemic, we
delivered our best financial performance in FY22
In Q4 FY22
▪ Revenue grew in KFC by 43%, Pizza Hut by 33% and
Sri Lanka business by 82%
▪ Restaurant EBITDA; Overall 18.3% (up 30 bps),
KFC 19.0%, Pizza Hut 11.5%, and Sri Lanka 24.2%
▪ Company Adjusted EBITDA;12.9% (up 470 bps)
▪ Company EBITDA; 21.0% (up 260 bps)
▪ PAT; 5.4% (Last year loss of 4.1%)
▪ 29 restaurant additions. Total restaurant count at 579
Strong Consolidated Balance Sheet: Cash (net of debt)
of ~ ₹ 3990 Mn and Negative Working Capital
*Annual figures include additional incentives of 1.1% accrued from Apr-Dec 21 and full year ESOP cost of 2.0%
7
Restaurant Sales ₹ mn 4,943 46% 17,154 69%
EBITDA ₹ mn 1,036 66% 3,248 82%
260 130
bps bps
PAT %
INDIA LANKA INDIA LANKA
13 10 6 0 60 57 22 3
TOTAL TOTAL29 142
EBITDA % 21.0%
Restaurant Additions
18.9%
5.4%
Q4 FY22 FY22
2.7%
*
*
*
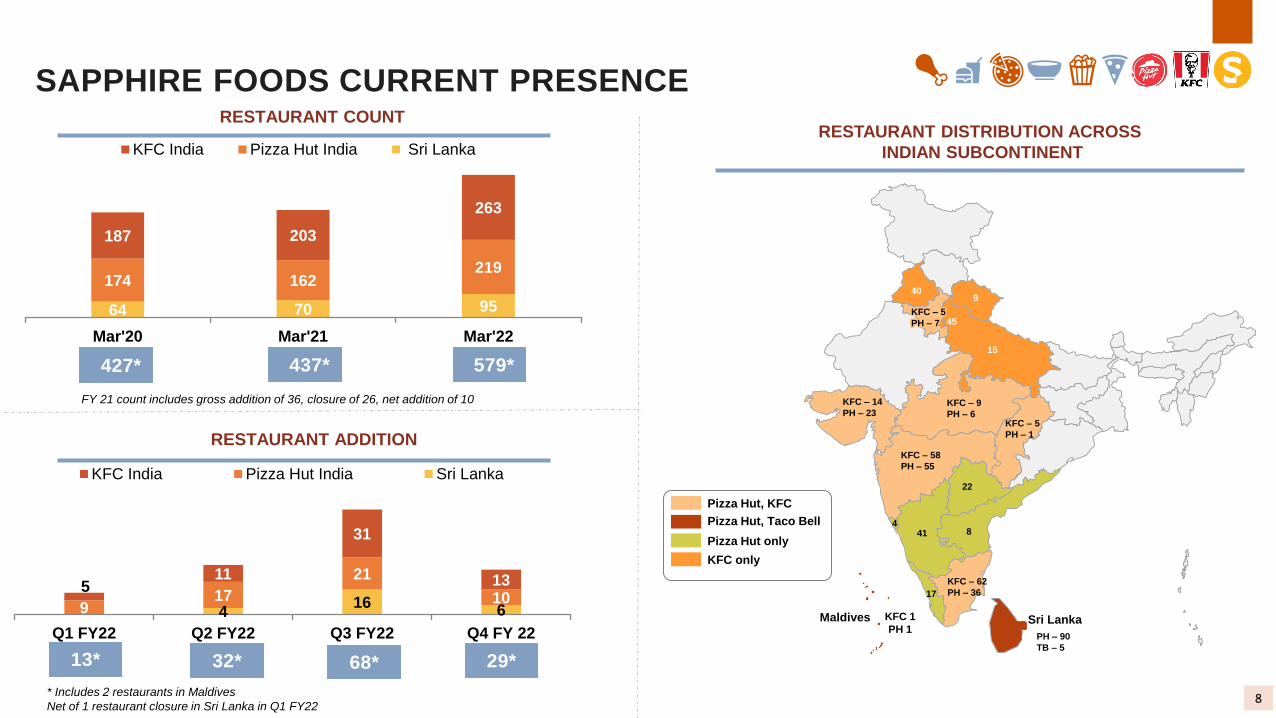
64 70 95
174 162219
187 203
263
Mar'20 Mar'21 Mar'22
KFC India Pizza Hut India Sri Lanka
SAPPHIRE FOODS CURRENT PRESENCE
Pizza Hut, KFC
Pizza Hut, Taco Bell
Pizza Hut only
KFC only
Maldives Sri Lanka
KFC – 9
PH – 6
KFC – 14
PH – 23
KFC – 58
PH – 55
KFC – 5
PH – 1
KFC – 62
PH – 36
8
22
414
17
15
45
940
PH – 90
TB – 5
KFC – 5
PH – 7
RESTAURANT COUNT
RESTAURANT ADDITION
* Includes 2 restaurants in Maldives
Net of 1 restaurant closure in Sri Lanka in Q1 FY22
KFC 1
PH 1
RESTAURANT DISTRIBUTION ACROSS
INDIAN SUBCONTINENT
8
427* 437* 579*
13* 32* 68* 29*
416
6917
21
105
11
31
13
Q1 FY22 Q2 FY22 Q3 FY22 Q4 FY 22
KFC India Pizza Hut India Sri Lanka
FY 21 count includes gross addition of 36, closure of 26, net addition of 10
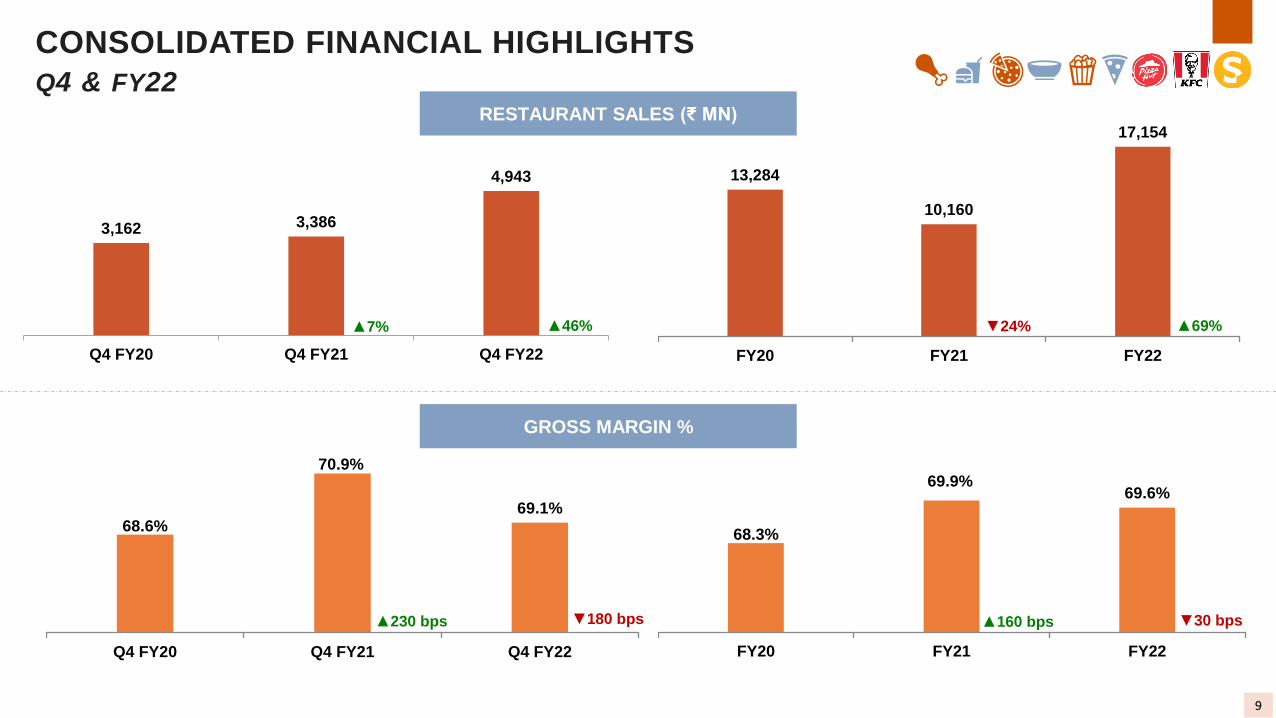
CONSOLIDATED FINANCIAL HIGHLIGHTS
Q4 & FY22RESTAURANT SALES (₹ MN)
GROSS MARGIN %
9
13,284
10,160
17,154
▼24% ▲69%
FY20 FY21 FY22
3,162 3,386
4,943
▲7% ▲46%
Q4 FY20 Q4 FY21 Q4 FY22
68.6%
70.9%
69.1%
▲230 bps ▼180 bps
Q4 FY20 Q4 FY21 Q4 FY22
68.3%
69.9%69.6%
▲160 bps ▼30 bps
FY20 FY21 FY22
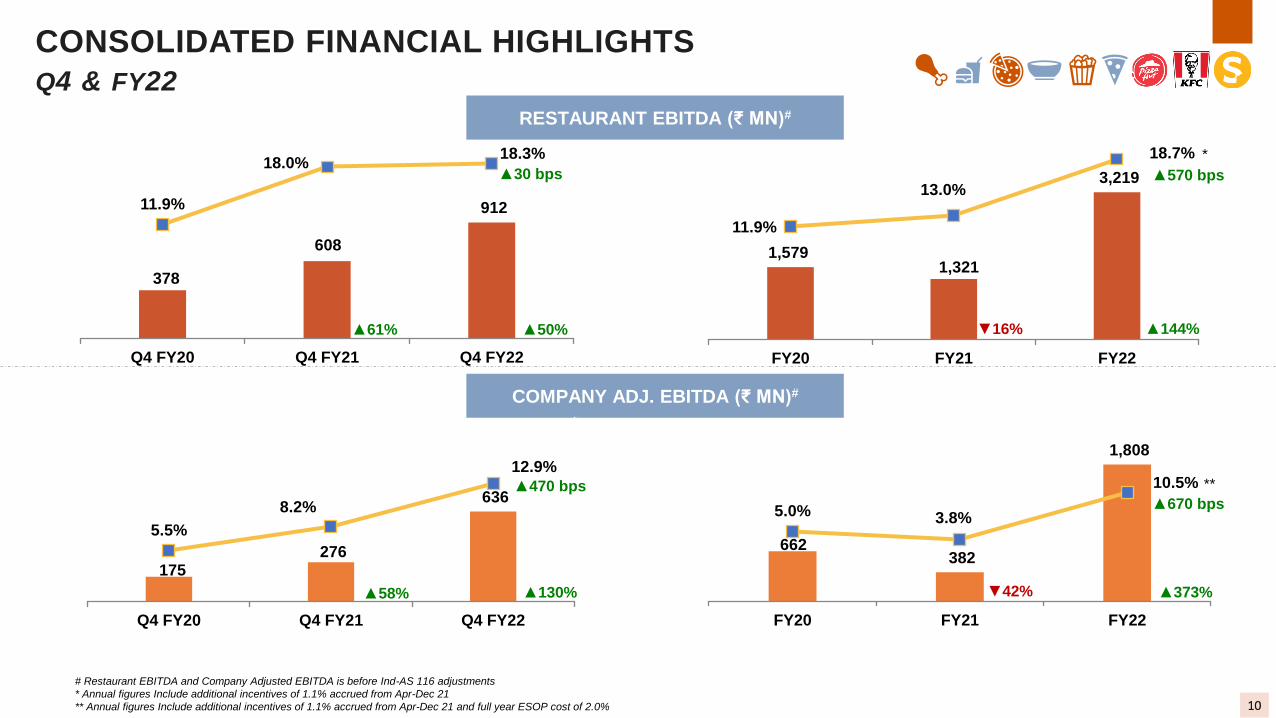
COMPANY ADJ. EBITDA (₹ MN)#
RESTAURANT EBITDA (₹ MN)#
# Restaurant EBITDA and Company Adjusted EBITDA is before Ind-AS 116 adjustments
* Annual figures Include additional incentives of 1.1% accrued from Apr-Dec 21
** Annual figures Include additional incentives of 1.1% accrued from Apr-Dec 21 and full year ESOP cost of 2.0%
CONSOLIDATED FINANCIAL HIGHLIGHTS
Q4 & FY22
10
378
608
912
▲61% ▲50%
11.9%
18.0%18.3%
0.0%
2.0%
4.0%
6.0%
8.0%
10.0%
12.0%
14.0%
16.0%
18.0%
20.0%
Q4 FY20 Q4 FY21 Q4 FY22
1,579 1,321
3,219
▼16% ▲144%
11.9%
13.0%
18.7%
-1.0%
1.0%
3.0%
5.0%
7.0%
9.0%
11.0%
13.0%
15.0%
17.0%
19.0%
FY20 FY21 FY22
*
175 276
636
▲58% ▲130%
5.5%
8.2%
12.9%
0.0%
2.0%
4.0%
6.0%
8.0%
10.0%
12.0%
14.0%
16.0%
18.0%
20.0%
Q4 FY20 Q4 FY21 Q4 FY22
662 382
1,808
▼42% ▲373%
5.0% 3.8%
10.5%
-5.0%
0.0%
5.0%
10.0%
15.0%
20.0%
FY20 FY21 FY22
**
▲30 bps ▲570 bps
▲470 bps▲670 bps
▲1250 bps
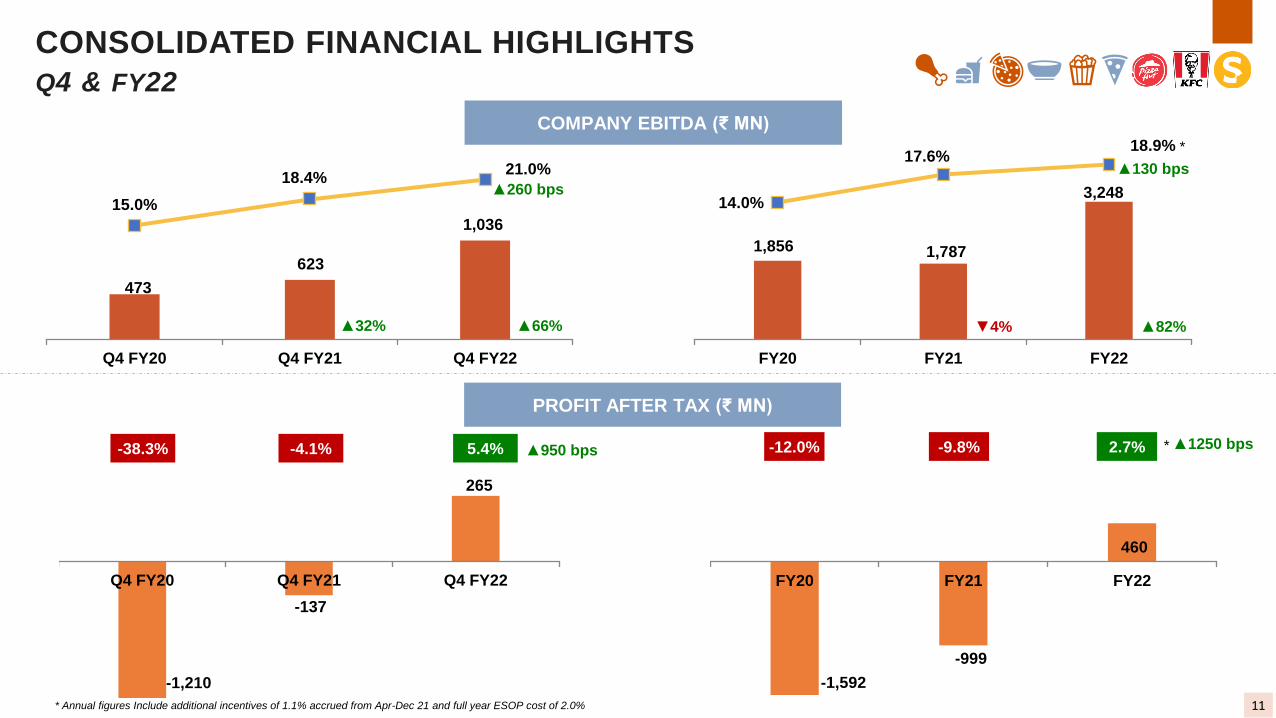
-1,592
-999
460
-12.0% -9.8% 2.7%
FY20 FY21 FY22
*
-1,210
-137
265
-38.3% -4.1% 5.4%
Q4 FY20 Q4 FY21 Q4 FY22
* Annual figures Include additional incentives of 1.1% accrued from Apr-Dec 21 and full year ESOP cost of 2.0%
PROFIT AFTER TAX (₹ MN)
CONSOLIDATED FINANCIAL HIGHLIGHTS
Q4 & FY22
COMPANY EBITDA (₹ MN)
11
473
623
1,036
▲32% ▲66%
15.0%
18.4%21.0%
0.0%
5.0%
10.0%
15.0%
20.0%
25.0%
Q4 FY20 Q4 FY21 Q4 FY22
1,856 1,787
3,248
▼4% ▲82%
14.0%
17.6%18.9%
-4.0%
1.0%
6.0%
11.0%
16.0%
21.0%
FY20 FY21 FY22
*
▲260 bps
▲130 bps
▲950 bps
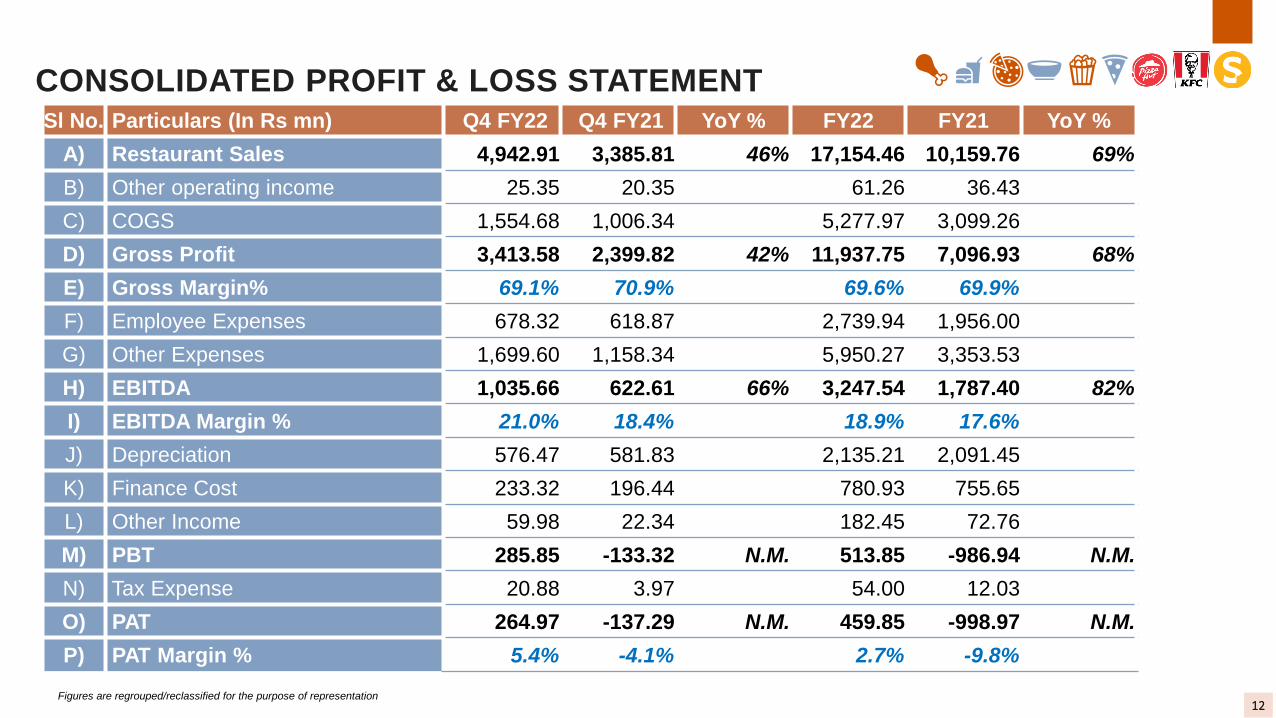
CONSOLIDATED PROFIT & LOSS STATEMENTSl No. Particulars (In Rs mn) Q4 FY22 Q4 FY21 YoY % FY22 FY21 YoY %
A) Restaurant Sales 4,942.91 3,385.81 46% 17,154.46 10,159.76 69%
B) Other operating income 25.35 20.35 61.26 36.43
C) COGS 1,554.68 1,006.34 5,277.97 3,099.26
D) Gross Profit 3,413.58 2,399.82 42% 11,937.75 7,096.93 68%
E) Gross Margin% 69.1% 70.9% 69.6% 69.9%
F) Employee Expenses 678.32 618.87 2,739.94 1,956.00
G) Other Expenses 1,699.60 1,158.34 5,950.27 3,353.53
H) EBITDA 1,035.66 622.61 66% 3,247.54 1,787.40 82%
I) EBITDA Margin % 21.0% 18.4% 18.9% 17.6%
J) Depreciation 576.47 581.83 2,135.21 2,091.45
K) Finance Cost 233.32 196.44 780.93 755.65
L) Other Income 59.98 22.34 182.45 72.76
M) PBT 285.85 -133.32 N.M. 513.85 -986.94 N.M.
N) Tax Expense 20.88 3.97 54.00 12.03
O) PAT 264.97 -137.29 N.M. 459.85 -998.97 N.M.
P) PAT Margin % 5.4% -4.1% 2.7% -9.8%
12Figures are regrouped/reclassified for the purpose of representation
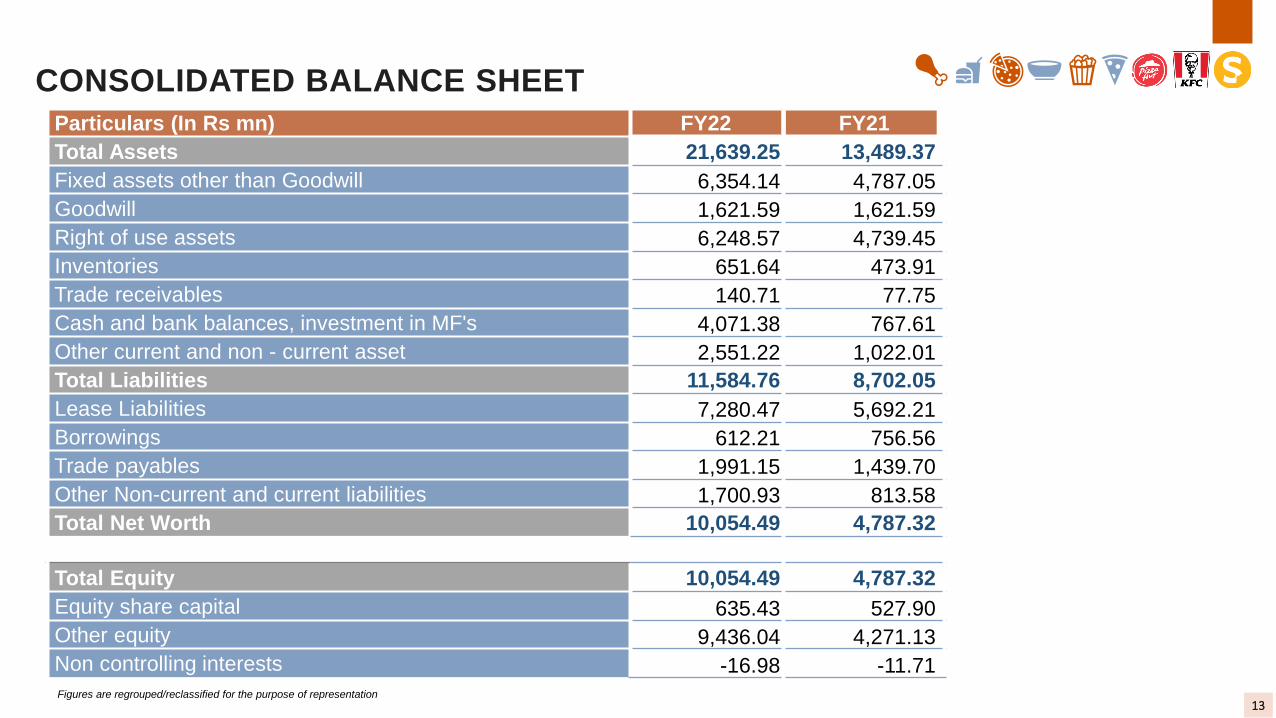
CONSOLIDATED BALANCE SHEET
13Figures are regrouped/reclassified for the purpose of representation
Particulars (In Rs mn) FY22 FY21
Total Assets 21,639.25 13,489.37
Fixed assets other than Goodwill 6,354.14 4,787.05
Goodwill 1,621.59 1,621.59
Right of use assets 6,248.57 4,739.45
Inventories 651.64 473.91
Trade receivables 140.71 77.75
Cash and bank balances, investment in MF's 4,071.38 767.61
Other current and non - current asset 2,551.22 1,022.01
Total Liabilities 11,584.76 8,702.05
Lease Liabilities 7,280.47 5,692.21
Borrowings 612.21 756.56
Trade payables 1,991.15 1,439.70
Other Non-current and current liabilities 1,700.93 813.58
Total Net Worth 10,054.49 4,787.32
Total Equity 10,054.49 4,787.32
Equity share capital 635.43 527.90
Other equity 9,436.04 4,271.13
Non controlling interests -16.98 -11.71
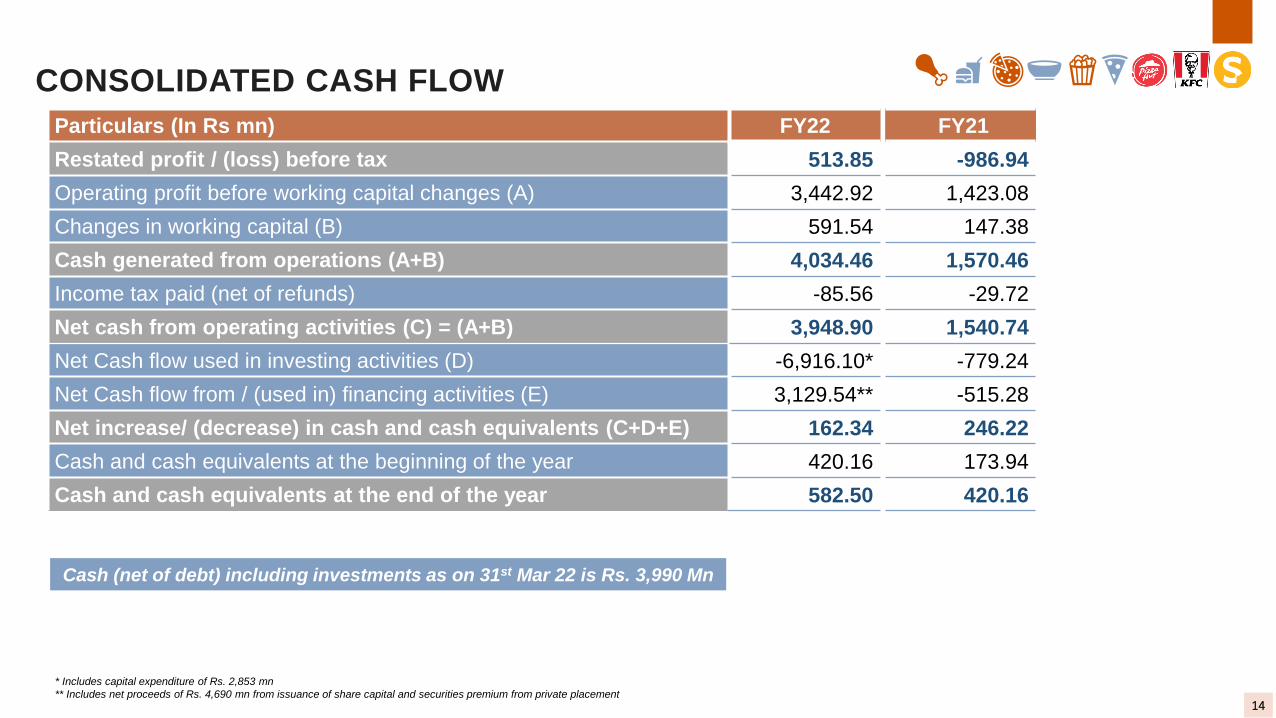
CONSOLIDATED CASH FLOW
14
* Includes capital expenditure of Rs. 2,853 mn
** Includes net proceeds of Rs. 4,690 mn from issuance of share capital and securities premium from private placement
Particulars (In Rs mn) FY22 FY21
Restated profit / (loss) before tax 513.85 -986.94
Operating profit before working capital changes (A) 3,442.92 1,423.08
Changes in working capital (B) 591.54 147.38
Cash generated from operations (A+B) 4,034.46 1,570.46
Income tax paid (net of refunds) -85.56 -29.72
Net cash from operating activities (C) = (A+B) 3,948.90 1,540.74
Net Cash flow used in investing activities (D) -6,916.10* -779.24
Net Cash flow from / (used in) financing activities (E) 3,129.54** -515.28
Net increase/ (decrease) in cash and cash equivalents (C+D+E) 162.34 246.22
Cash and cash equivalents at the beginning of the year 420.16 173.94
Cash and cash equivalents at the end of the year 582.50 420.16
Cash (net of debt) including investments as on 31st Mar 22 is Rs. 3,990 Mn
KFC India
Business Performance
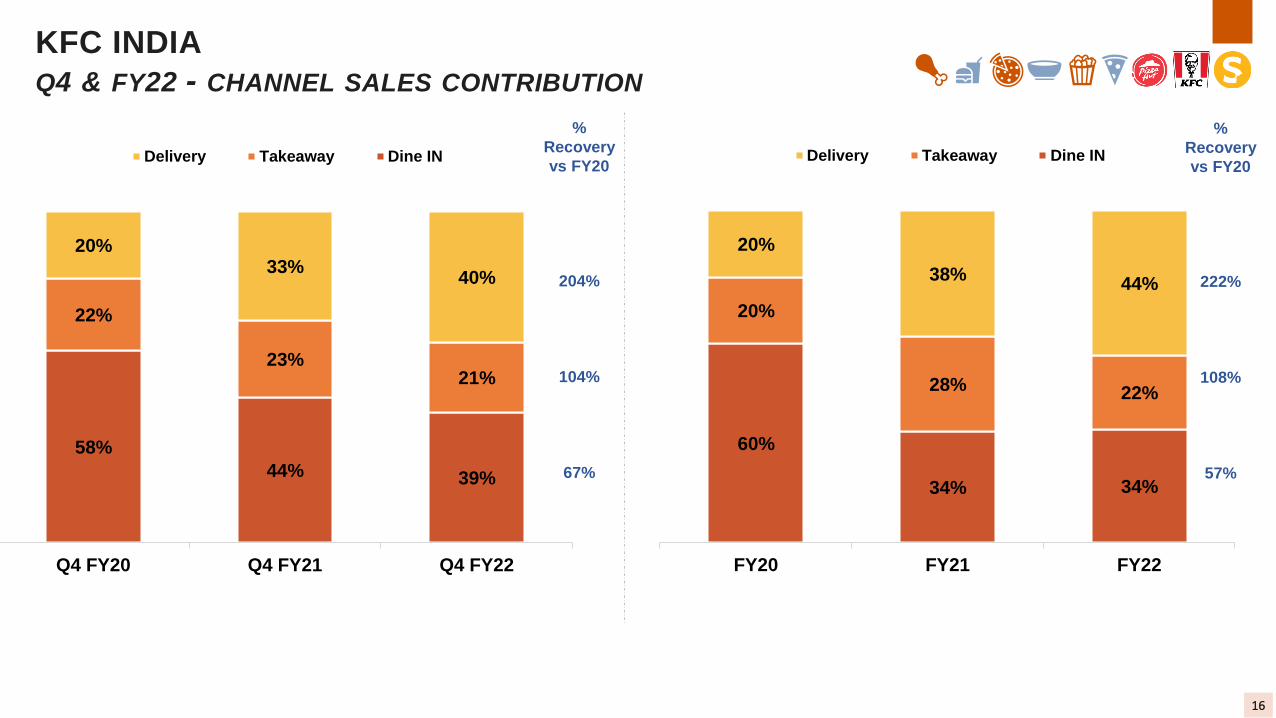
KFC INDIA
Q4 & FY22 - CHANNEL SALES CONTRIBUTION
%
Recovery
vs FY20
204%
104%
67%
16
58%
44% 39%
22%
23%21%
20%33%
40%
Q4 FY20 Q4 FY21 Q4 FY22
Delivery Takeaway Dine IN
60%
34% 34%
20%
28% 22%
20%
38%44%
FY20 FY21 FY22
Delivery Takeaway Dine IN
%
Recovery
vs FY20
222%
108%
57%
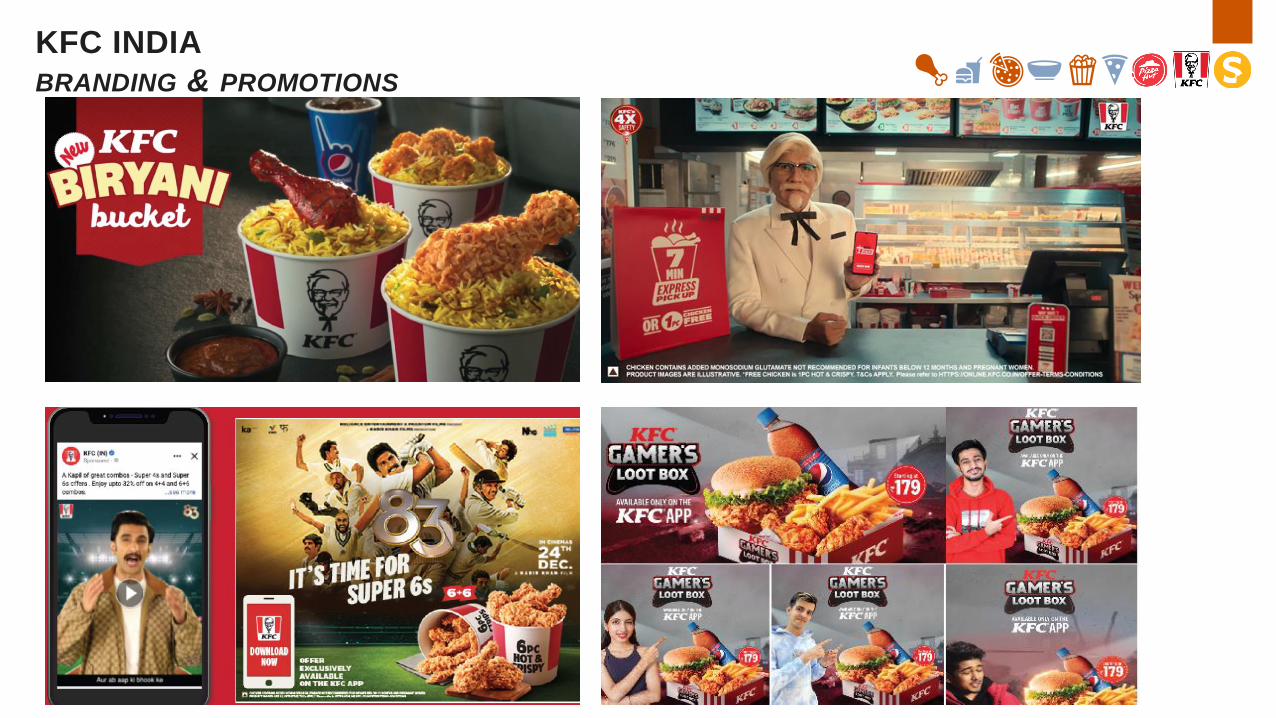
KFC INDIA
BRANDING & PROMOTIONS
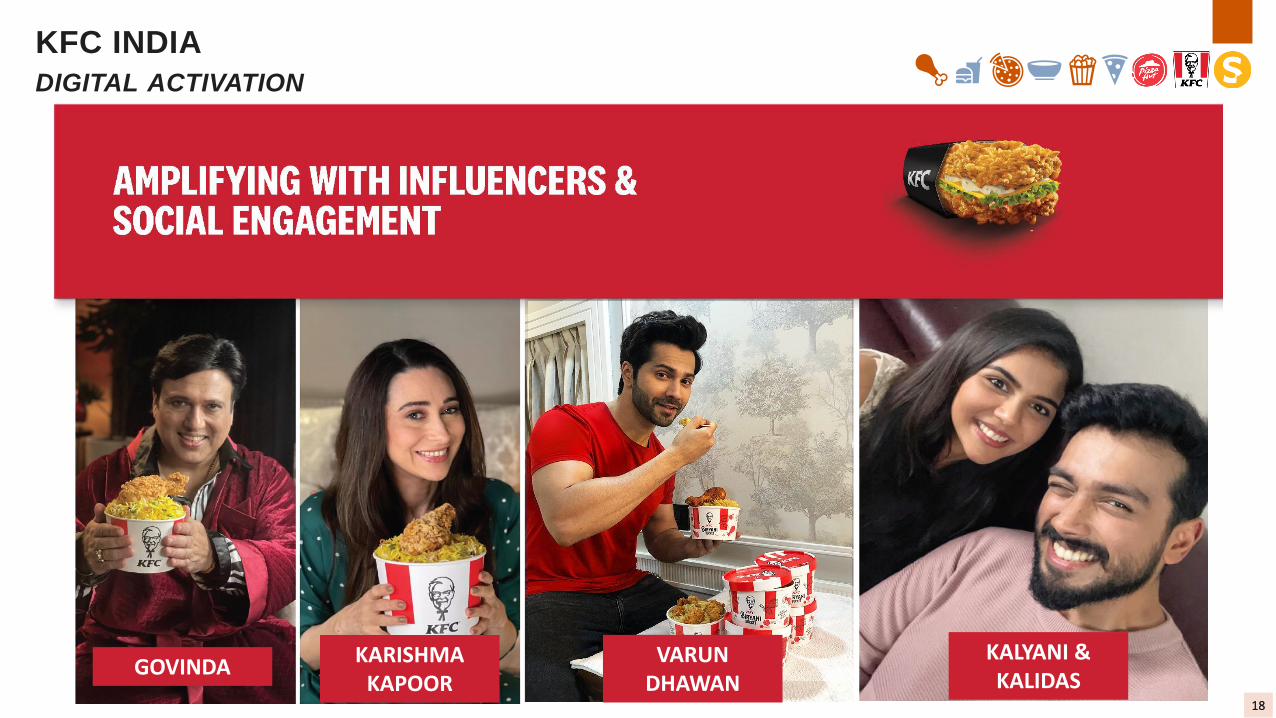
KFC INDIA
DIGITAL ACTIVATION
18
GOVINDAKALYANI &KALIDAS
VARUN DHAWAN
KARISHMA KAPOOR
KFC INDIA
AWARDS
19
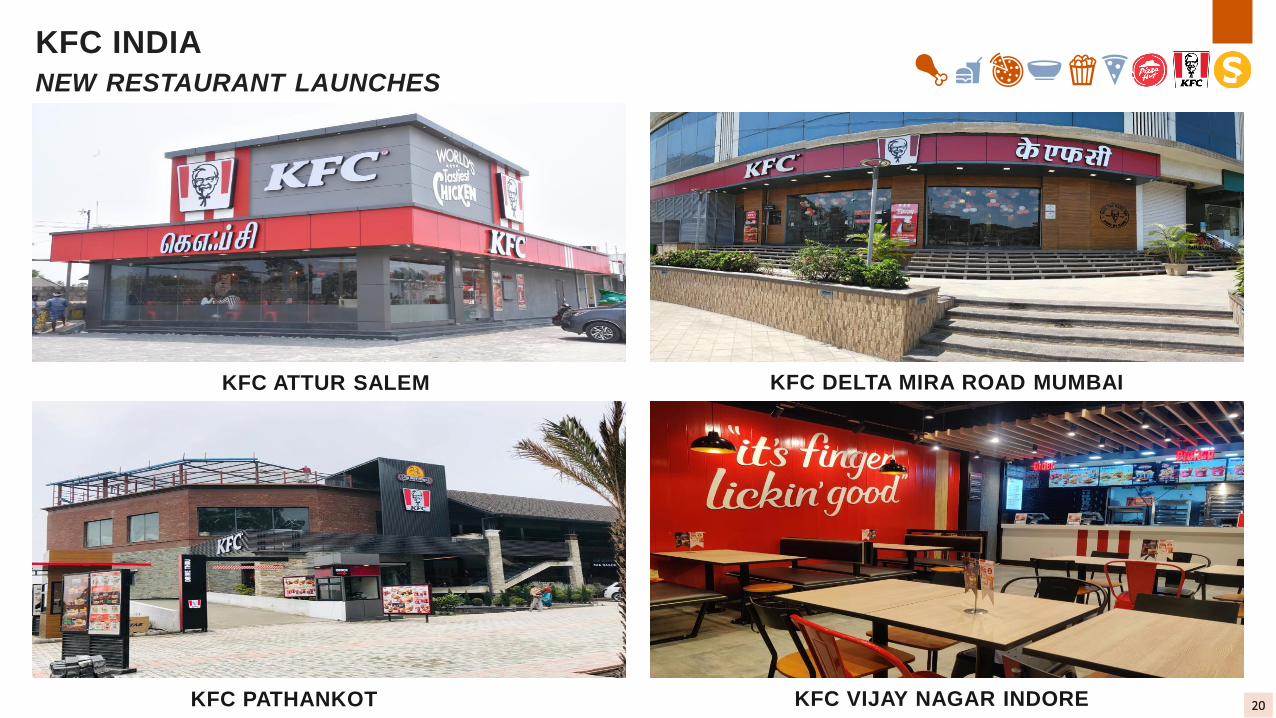
KFC INDIA
NEW RESTAURANT LAUNCHES
20
KFC DELTA MIRA ROAD MUMBAIKFC ATTUR SALEM
KFC PATHANKOT KFC VIJAY NAGAR INDORE
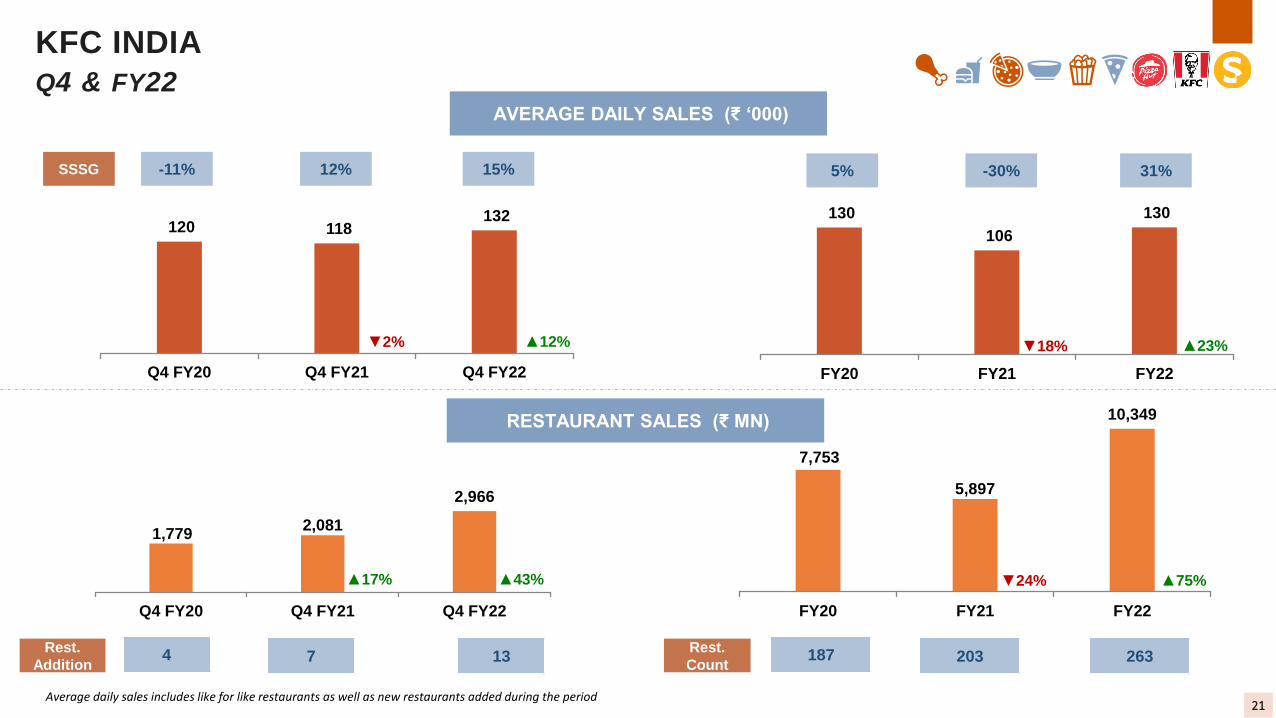
AVERAGE DAILY SALES (₹ ‘000)
RESTAURANT SALES (₹ MN)
SSSG
Rest.
Count
Rest.
Addition
KFC INDIA
Q4 & FY22
21
4 7 13 187 263
120 118 132
▼2% ▲12%
-11% 12% 15%
Q4 FY20 Q4 FY21 Q4 FY22
130
106
130
▼18% ▲23%
5% -30% 31%
FY20 FY21 FY22
1,7792,081
2,966
▲17% ▲43%
Q4 FY20 Q4 FY21 Q4 FY22
7,753
5,897
10,349
▼24% ▲75%
FY20 FY21 FY22
Average daily sales includes like for like restaurants as well as new restaurants added during the period
203
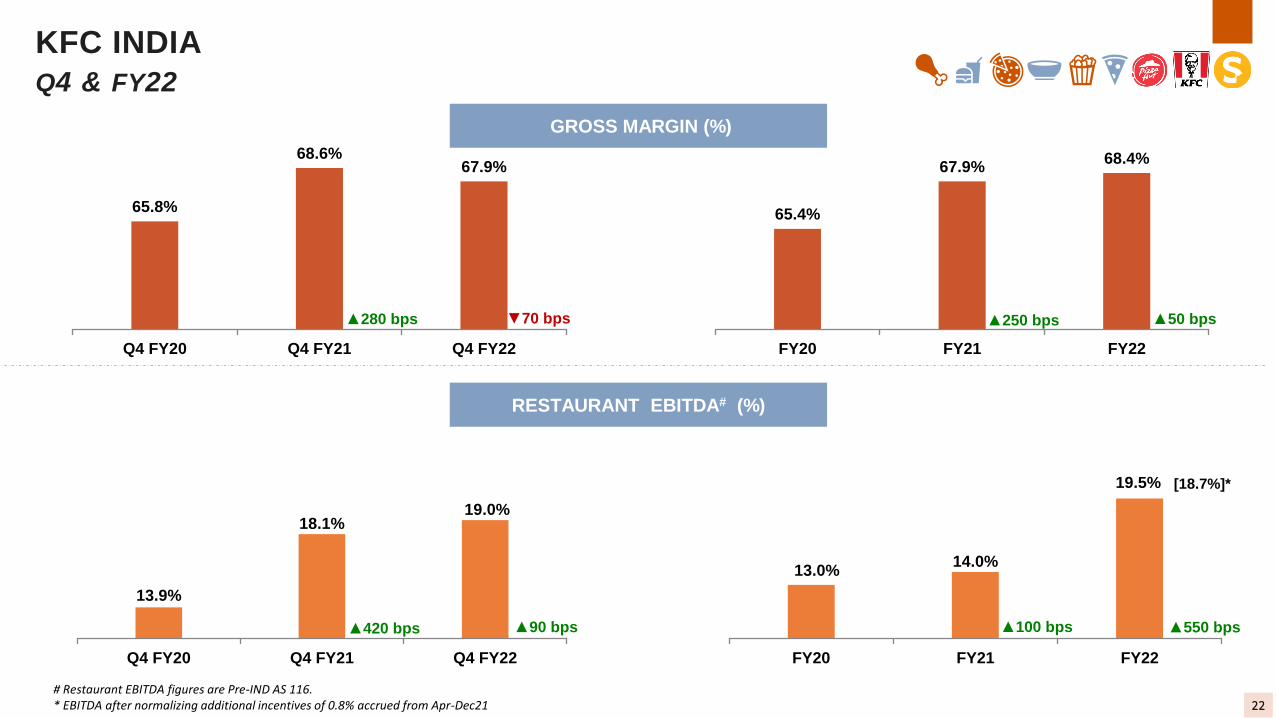
KFC INDIA
Q4 & FY22
# Restaurant EBITDA figures are Pre-IND AS 116.* EBITDA after normalizing additional incentives of 0.8% accrued from Apr-Dec21
GROSS MARGIN (%)
RESTAURANT EBITDA# (%)
22
65.8%
68.6%67.9%
▲280 bps ▼70 bps
Q4 FY20 Q4 FY21 Q4 FY22
65.4%
67.9%68.4%
▲250 bps ▲50 bps
FY20 FY21 FY22
13.9%
18.1%19.0%
▲420 bps ▲90 bps
Q4 FY20 Q4 FY21 Q4 FY22
13.0%14.0%
19.5%
▲100 bps ▲550 bps
FY20 FY21 FY22
[18.7%]*
Pizza Hut India
Business Performance
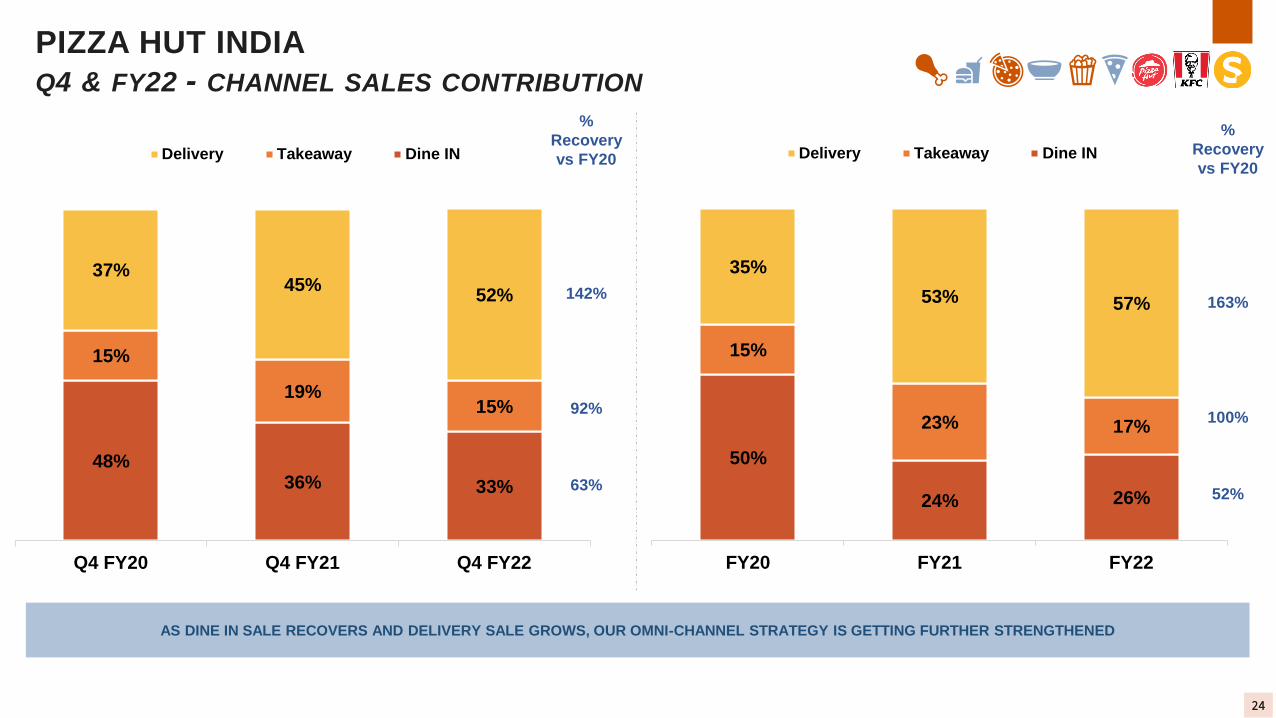
AS DINE IN SALE RECOVERS AND DELIVERY SALE GROWS, OUR OMNI-CHANNEL STRATEGY IS GETTING FURTHER STRENGTHENED
PIZZA HUT INDIA
Q4 & FY22 - CHANNEL SALES CONTRIBUTION
%
Recovery
vs FY20
142%
92%
63%
24
48%36% 33%
15%
19%15%
37%45%
52%
Q4 FY20 Q4 FY21 Q4 FY22
Delivery Takeaway Dine IN
50%
24% 26%
15%
23% 17%
35%
53% 57%
FY20 FY21 FY22
Delivery Takeaway Dine IN
%
Recovery
vs FY20
163%
100%
52%
25
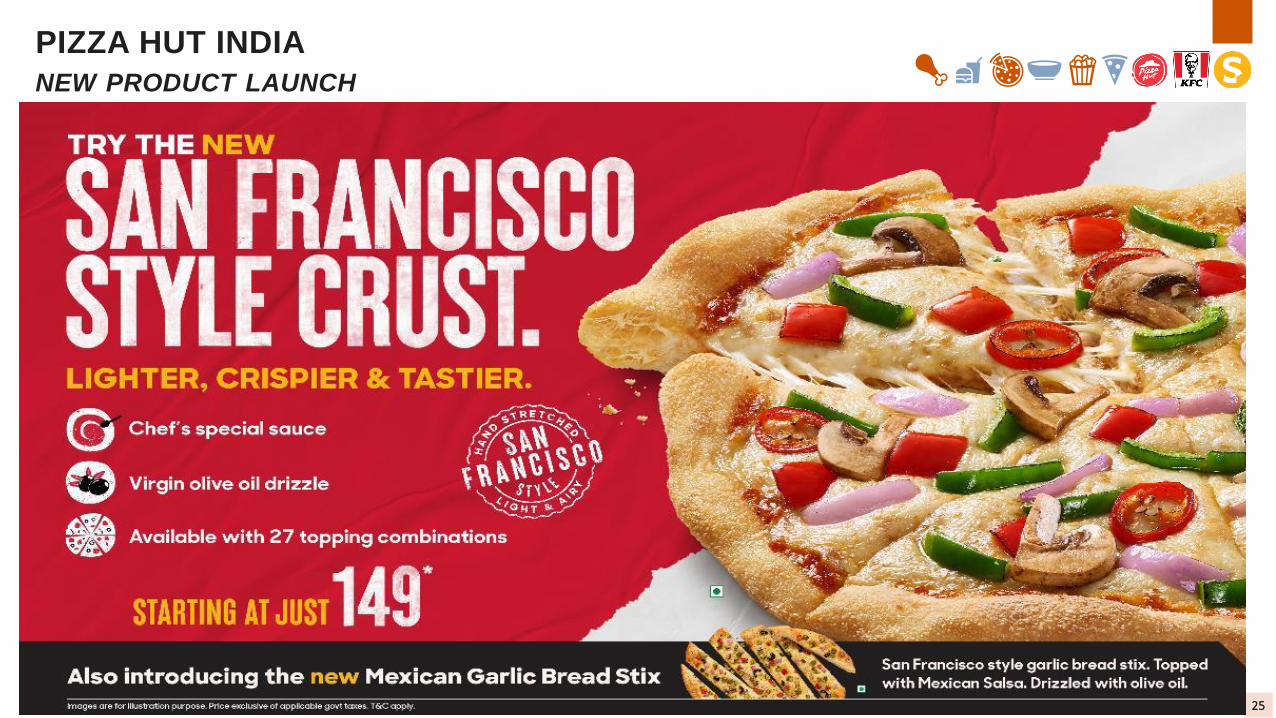
PIZZA HUT INDIA
NEW PRODUCT LAUNCH
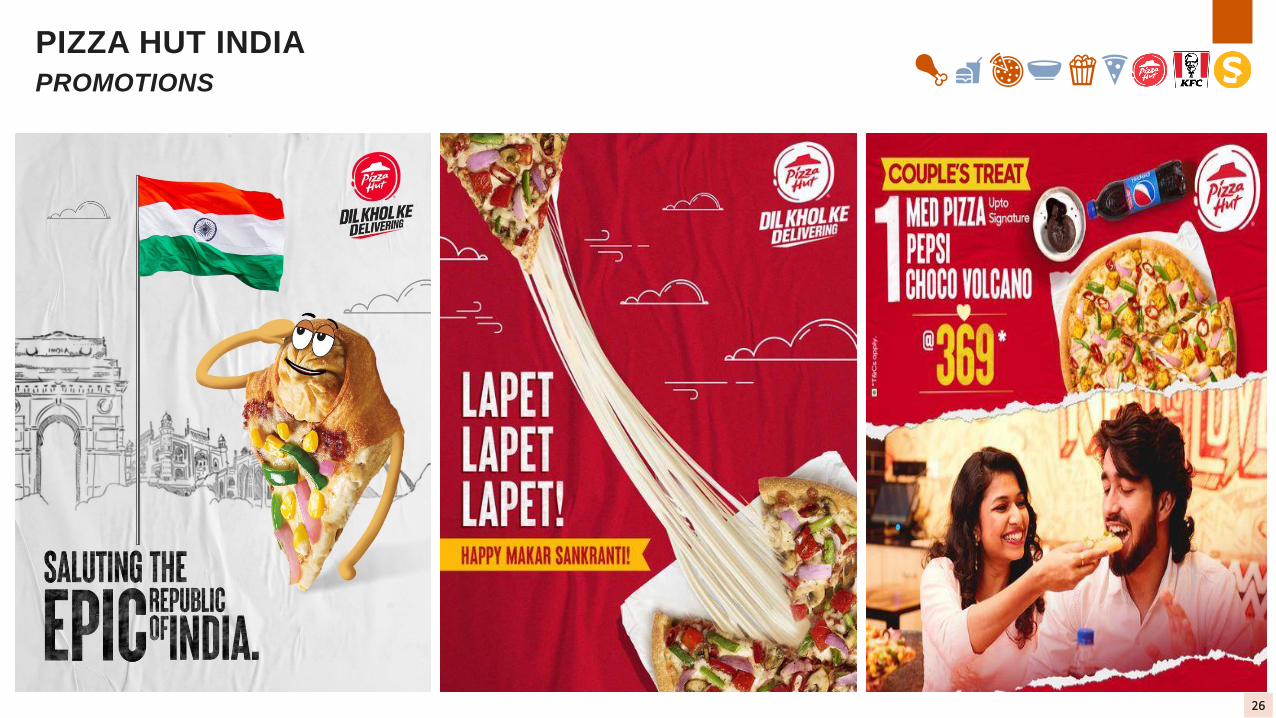
PIZZA HUT INDIA
PROMOTIONS
26
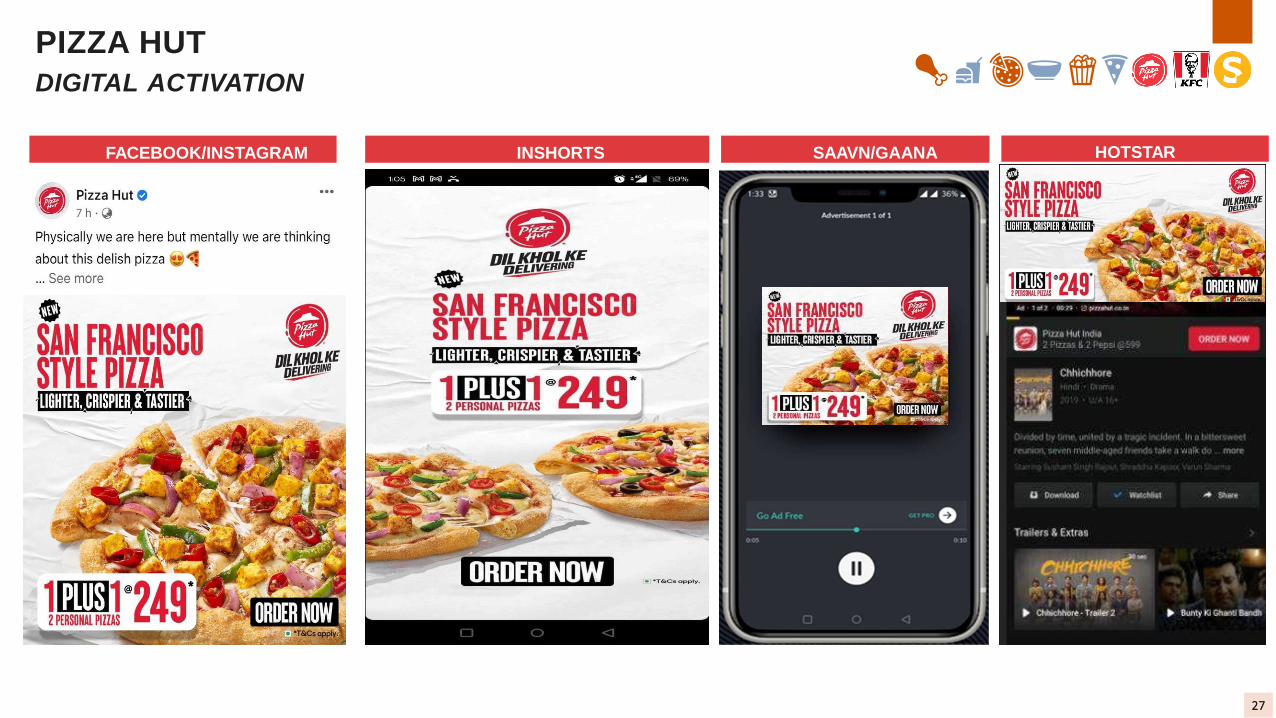
PIZZA HUT
DIGITAL ACTIVATION
27
FACEBOOK/INSTAGRAM INSHORTS SAAVN/GAANA HOTSTAR
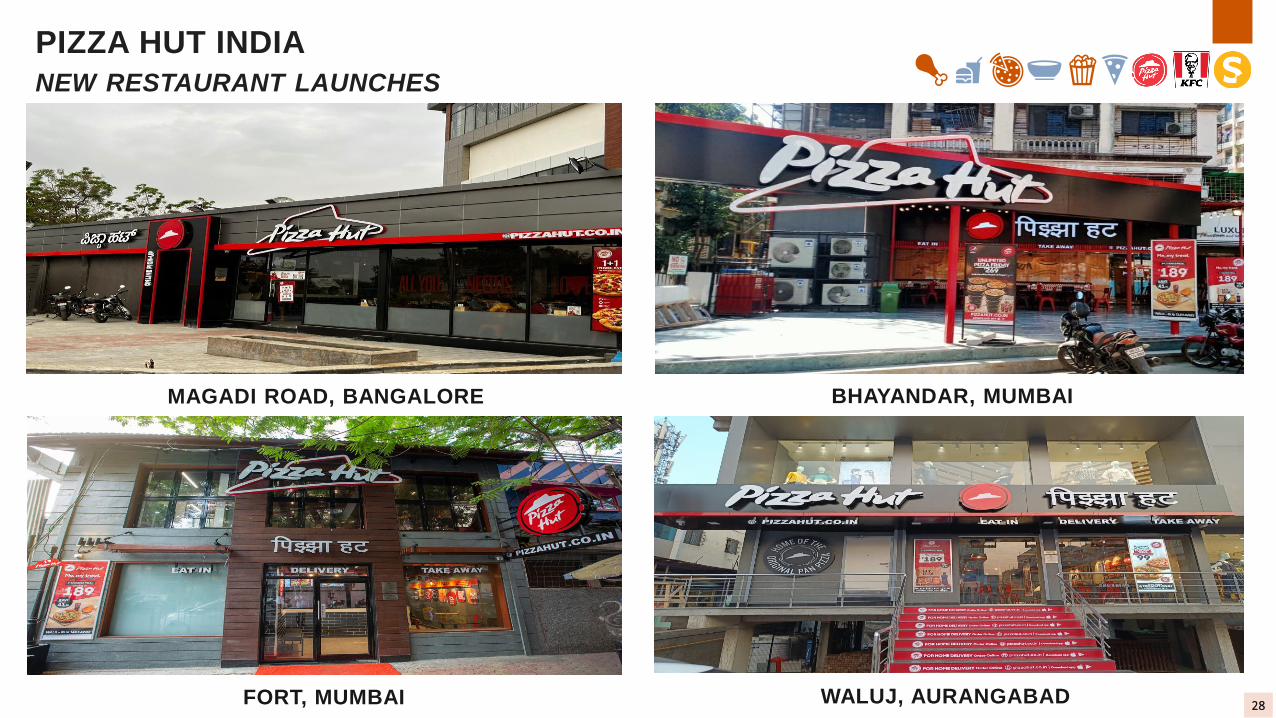
PIZZA HUT INDIA
NEW RESTAURANT LAUNCHES
28
MAGADI ROAD, BANGALORE
FORT, MUMBAI
BHAYANDAR, MUMBAI
WALUJ, AURANGABAD
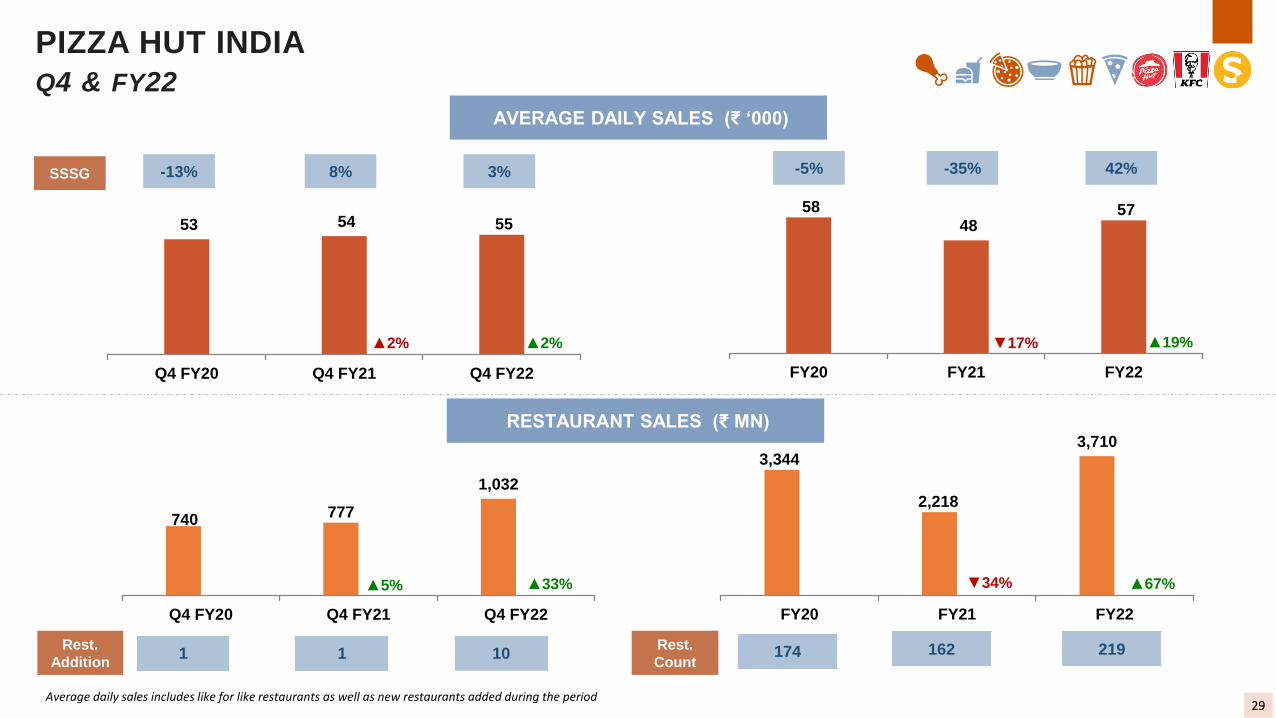
PIZZA HUT INDIA
Q4 & FY22
AVERAGE DAILY SALES (₹ ‘000)
RESTAURANT SALES (₹ MN)
SSSG
Rest.
Addition
Rest.
Count
29
1 1 10 174 219
53 54 55
▲2% ▲2%
-13% 8% 3%
Q4 FY20 Q4 FY21 Q4 FY22
58
48 57
-5% -35% 42%
▼17% ▲19%
FY20 FY21 FY22
740 777
1,032
▲5% ▲33%
Q4 FY20 Q4 FY21 Q4 FY22
3,344
2,218
3,710
▼34% ▲67%
FY20 FY21 FY22
Average daily sales includes like for like restaurants as well as new restaurants added during the period
162
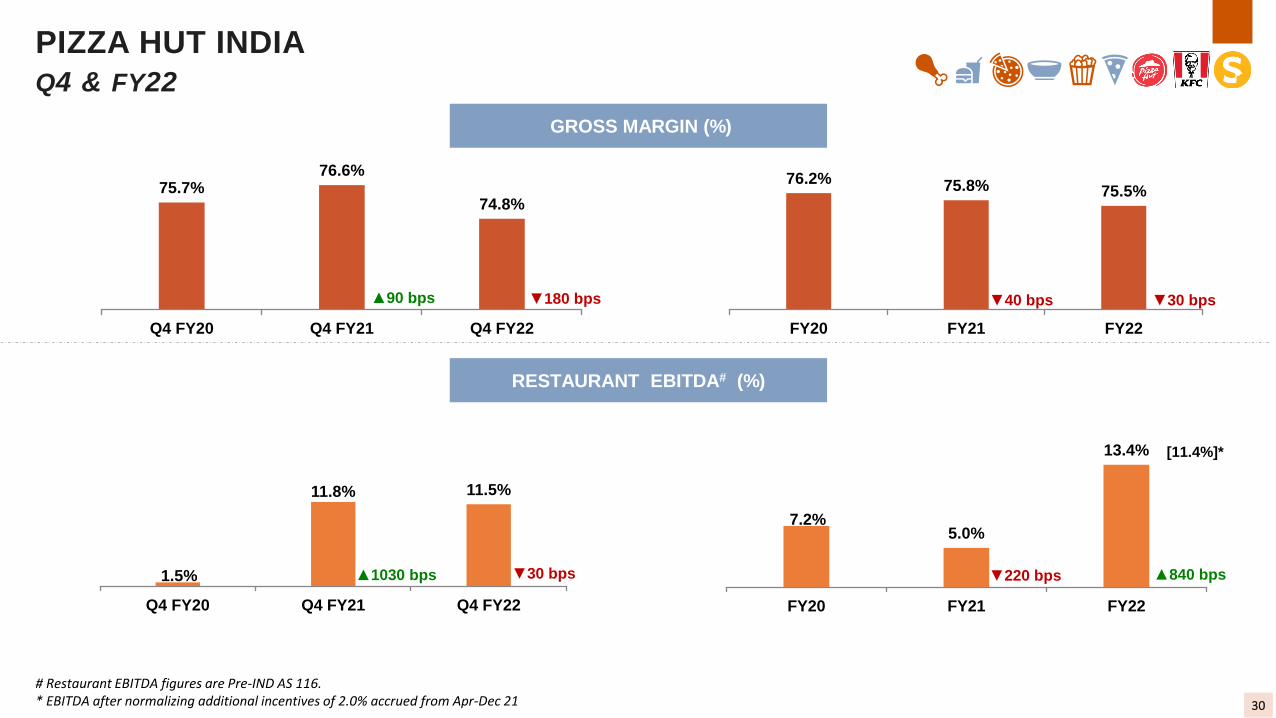
# Restaurant EBITDA figures are Pre-IND AS 116.* EBITDA after normalizing additional incentives of 2.0% accrued from Apr-Dec 21
PIZZA HUT INDIA
Q4 & FY22
GROSS MARGIN (%)
RESTAURANT EBITDA# (%)
30
75.7%76.6%
74.8%
▲90 bps ▼180 bps
Q4 FY20 Q4 FY21 Q4 FY22
76.2% 75.8% 75.5%
▼40 bps ▼30 bps
FY20 FY21 FY22
1.5%
11.8% 11.5%
▲1030 bps ▼30 bps
Q4 FY20 Q4 FY21 Q4 FY22
7.2%5.0%
13.4%
▼220 bps ▲840 bps
FY20 FY21 FY22
[11.4%]*
Sri Lanka
Business Performance
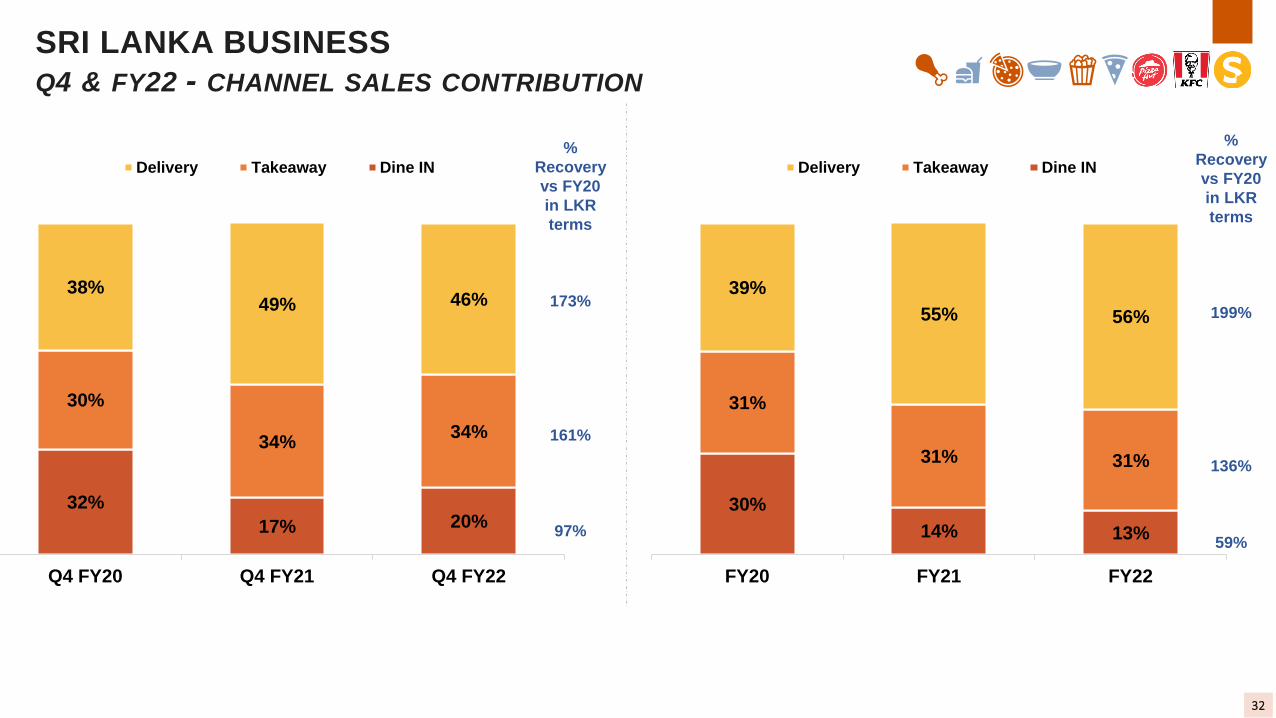
SRI LANKA BUSINESS
Q4 & FY22 - CHANNEL SALES CONTRIBUTION
%
Recovery
vs FY20
in LKR
terms
173%
161%
97%
32
32%
17% 20%
30%
34%34%
38%49% 46%
Q4 FY20 Q4 FY21 Q4 FY22
Delivery Takeaway Dine IN
30%
14% 13%
31%
31% 31%
39%
55% 56%
FY20 FY21 FY22
Delivery Takeaway Dine IN
%
Recovery
vs FY20
in LKR
terms
199%
136%
59%
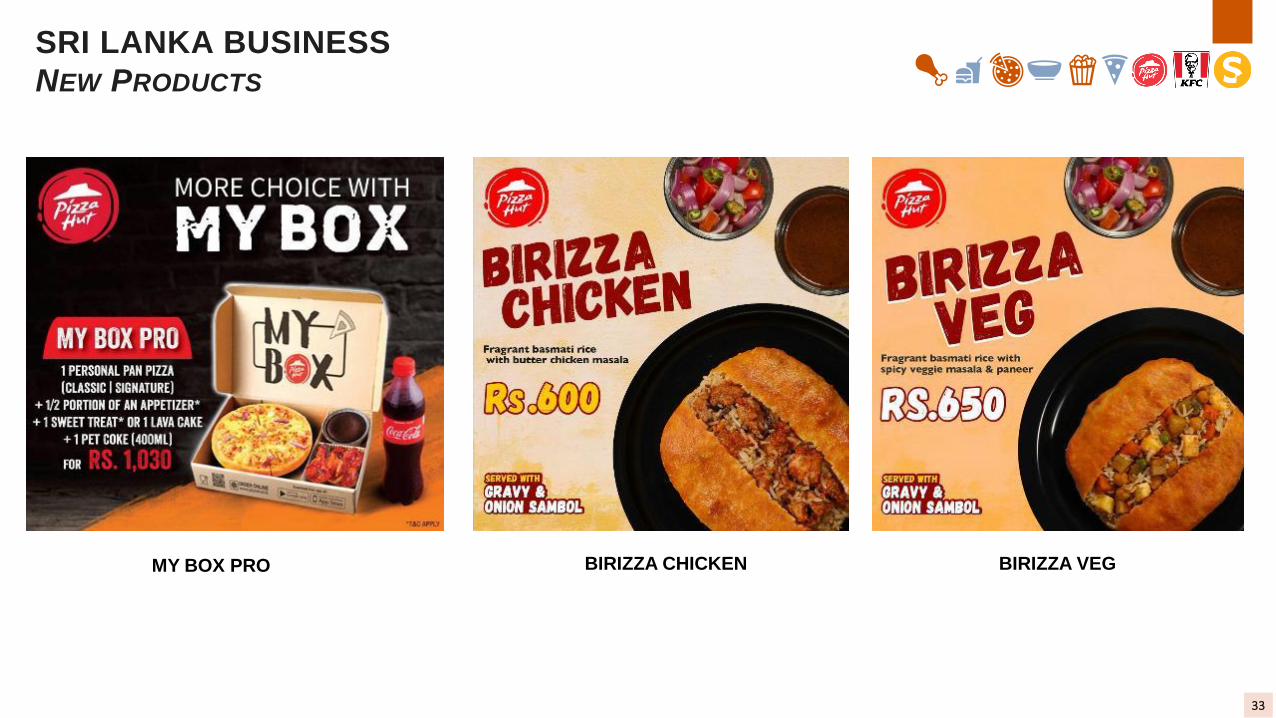
SRI LANKA BUSINESS
NEW PRODUCTS
33
MY BOX PRO BIRIZZA VEGBIRIZZA CHICKEN
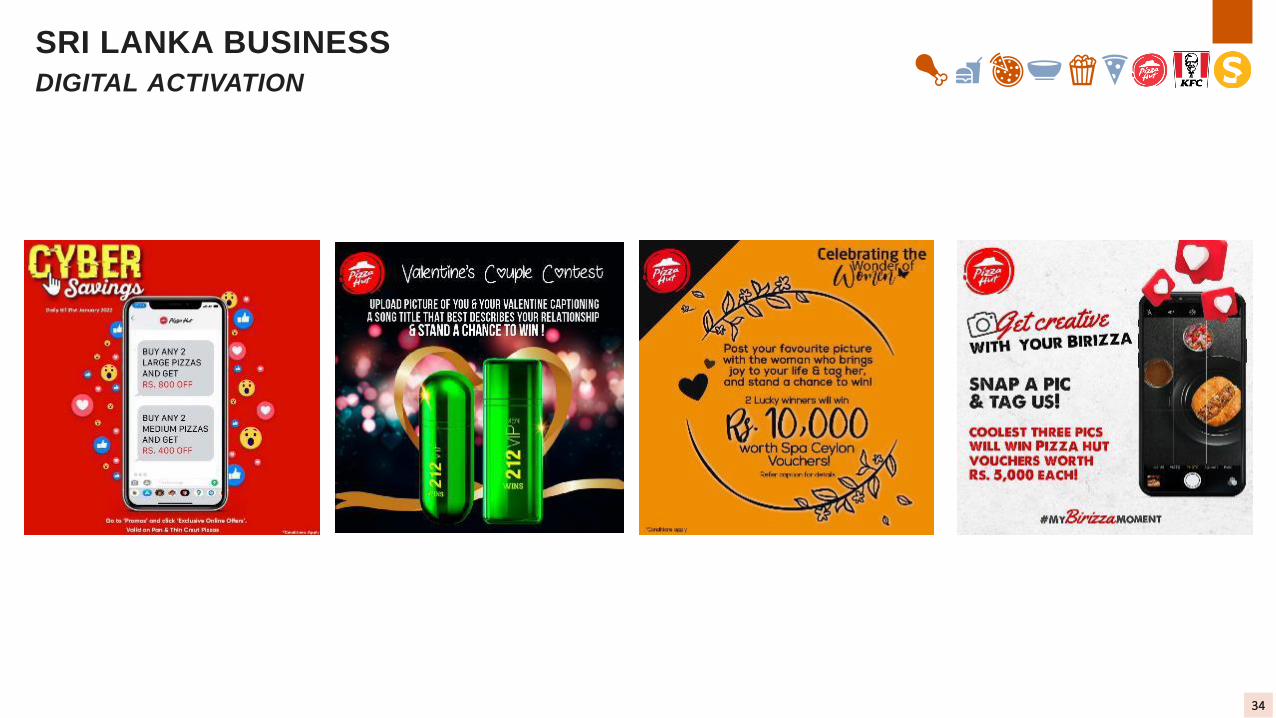
SRI LANKA BUSINESS
DIGITAL ACTIVATION
34
SRI LANKA BUSINESS
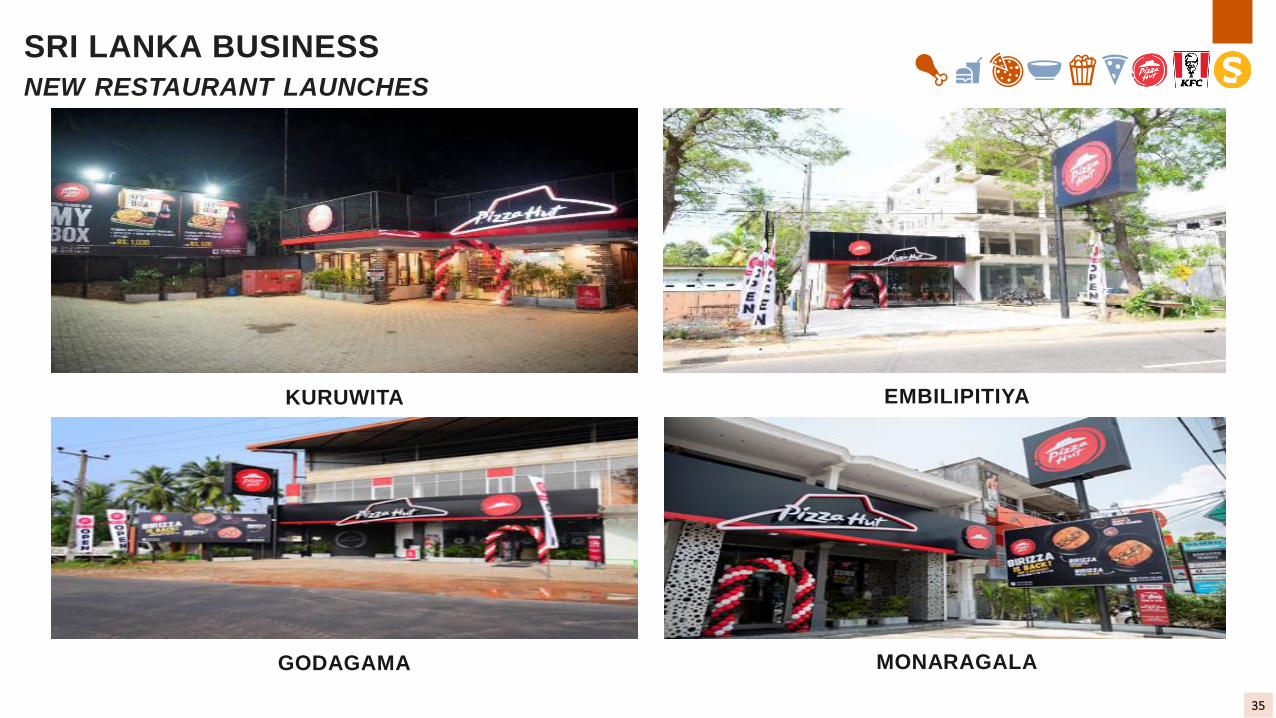
NEW RESTAURANT LAUNCHES
35
KURUWITA EMBILIPITIYA
GODAGAMA MONARAGALA
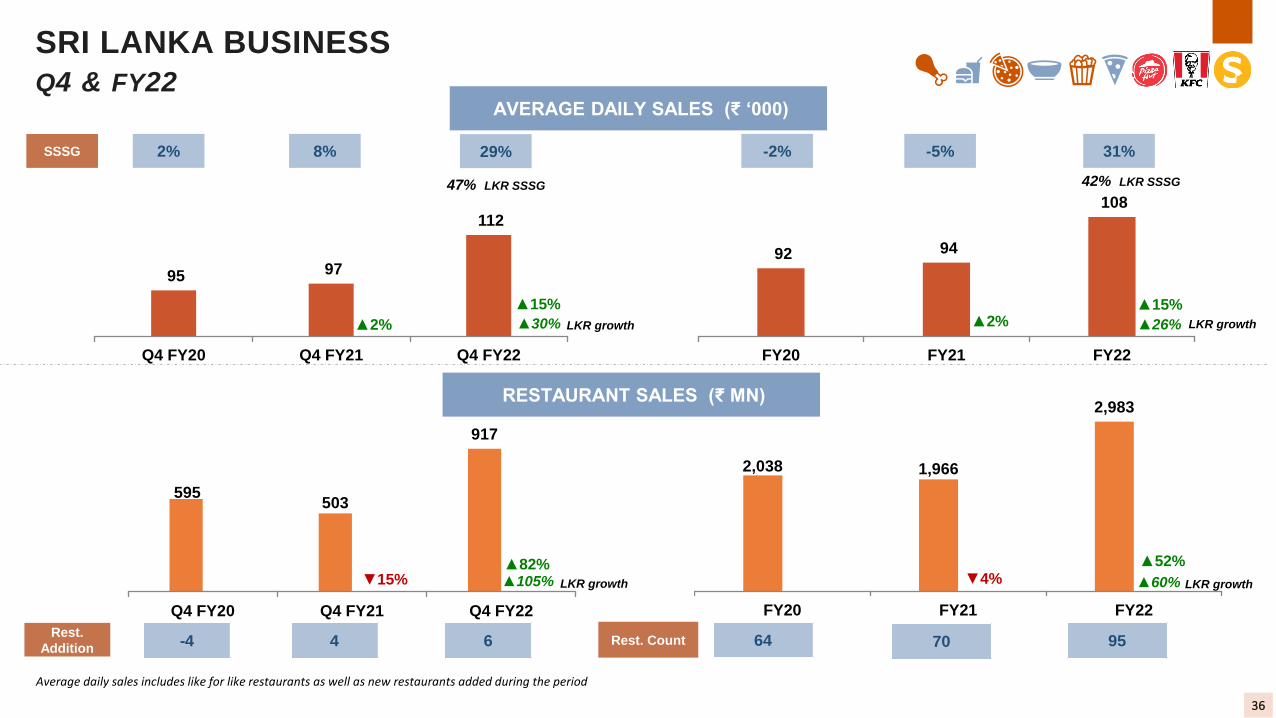
SRI LANKA BUSINESS
Q4 & FY22AVERAGE DAILY SALES (₹ ‘000)
RESTAURANT SALES (₹ MN)
SSSG
Rest.
AdditionRest. Count
36
-4 4 6 64 95
95 97
112
2% 8% 29%
▲2%
▲15%
Q4 FY20 Q4 FY21 Q4 FY22
47% LKR SSSG
▲30%
92 94
108
-2% -5% 31%
▲2%▲15%
FY20 FY21 FY22
42% LKR SSSG
▲26%
595503
917
▼15%▲82%
Q4 FY20 Q4 FY21 Q4 FY22
▲105%
2,038 1,966
2,983
▼4%▲52%
FY20 FY21 FY22
▲60%
Average daily sales includes like for like restaurants as well as new restaurants added during the period
70
LKR growth LKR growth
LKR growth LKR growth
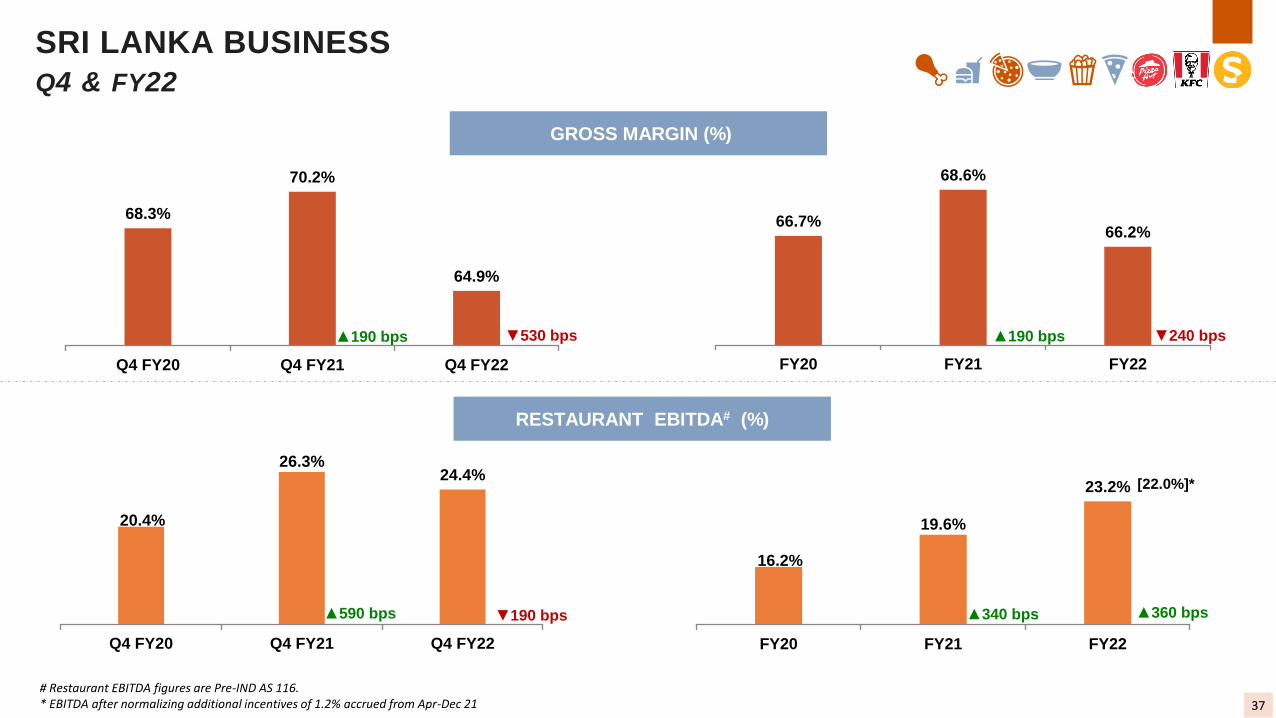
# Restaurant EBITDA figures are Pre-IND AS 116.* EBITDA after normalizing additional incentives of 1.2% accrued from Apr-Dec 21
SRI LANKA BUSINESS
Q4 & FY22
GROSS MARGIN (%)
RESTAURANT EBITDA# (%)
37
68.3%
70.2%
64.9%
▲190 bps ▼530 bps
Q4 FY20 Q4 FY21 Q4 FY22
66.7%
68.6%
66.2%
▲190 bps ▼240 bps
FY20 FY21 FY22
20.4%
26.3%24.4%
▲590 bps ▼190 bps
Q4 FY20 Q4 FY21 Q4 FY22
16.2%
19.6%
23.2%
▲340 bps ▲360 bps
FY20 FY21 FY22
[22.0%]*
ESG AND OTHER INITIATIVES
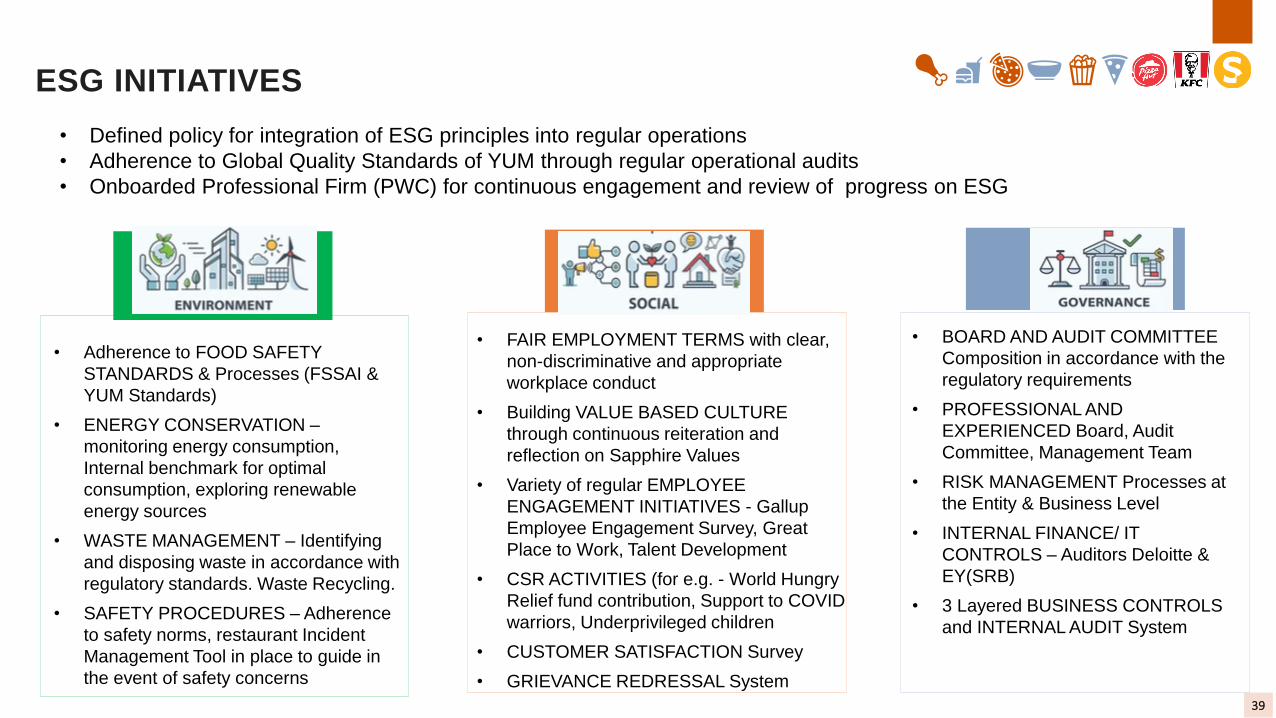
ESG INITIATIVES
• Defined policy for integration of ESG principles into regular operations
• Adherence to Global Quality Standards of YUM through regular operational audits
• Onboarded Professional Firm (PWC) for continuous engagement and review of progress on ESG
• Adherence to FOOD SAFETY
STANDARDS & Processes (FSSAI &
YUM Standards)
• ENERGY CONSERVATION –
monitoring energy consumption,
Internal benchmark for optimal
consumption, exploring renewable
energy sources
• WASTE MANAGEMENT – Identifying
and disposing waste in accordance with
regulatory standards. Waste Recycling.
• SAFETY PROCEDURES – Adherence
to safety norms, restaurant Incident
Management Tool in place to guide in
the event of safety concerns
• FAIR EMPLOYMENT TERMS with clear,
non-discriminative and appropriate
workplace conduct
• Building VALUE BASED CULTURE
through continuous reiteration and
reflection on Sapphire Values
• Variety of regular EMPLOYEE
ENGAGEMENT INITIATIVES - Gallup
Employee Engagement Survey, Great
Place to Work, Talent Development
• CSR ACTIVITIES (for e.g. - World Hungry
Relief fund contribution, Support to COVID
warriors, Underprivileged children
• CUSTOMER SATISFACTION Survey
• GRIEVANCE REDRESSAL System
• BOARD AND AUDIT COMMITTEE
Composition in accordance with the
regulatory requirements
• PROFESSIONAL AND
EXPERIENCED Board, Audit
Committee, Management Team
• RISK MANAGEMENT Processes at
the Entity & Business Level
• INTERNAL FINANCE/ IT
CONTROLS – Auditors Deloitte &
EY(SRB)
• 3 Layered BUSINESS CONTROLS
and INTERNAL AUDIT System
39
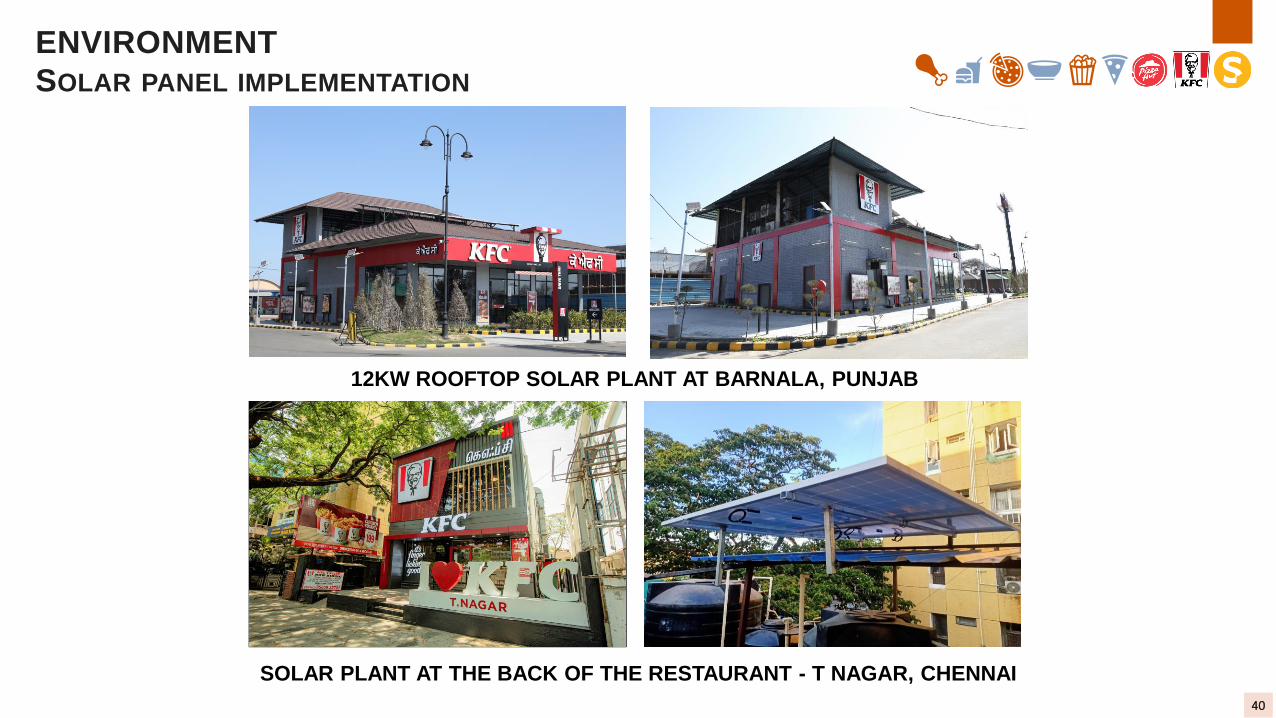
ENVIRONMENT
SOLAR PANEL IMPLEMENTATION
40
12KW ROOFTOP SOLAR PLANT AT BARNALA, PUNJAB
SOLAR PLANT AT THE BACK OF THE RESTAURANT - T NAGAR, CHENNAI
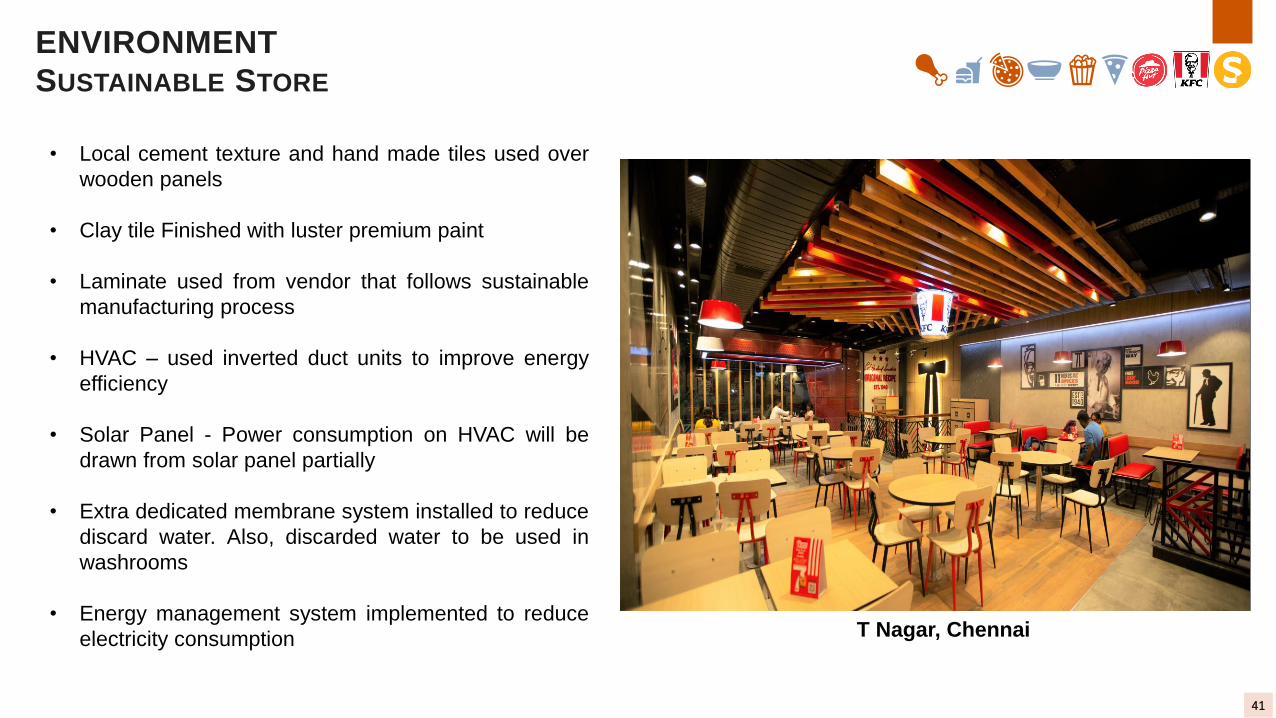
ENVIRONMENT
SUSTAINABLE STORE
41
• Local cement texture and hand made tiles used over
wooden panels
• Clay tile Finished with luster premium paint
• Laminate used from vendor that follows sustainable
manufacturing process
• HVAC – used inverted duct units to improve energy
efficiency
• Solar Panel - Power consumption on HVAC will be
drawn from solar panel partially
• Extra dedicated membrane system installed to reduce
discard water. Also, discarded water to be used in
washrooms
• Energy management system implemented to reduce
electricity consumption T Nagar, Chennai
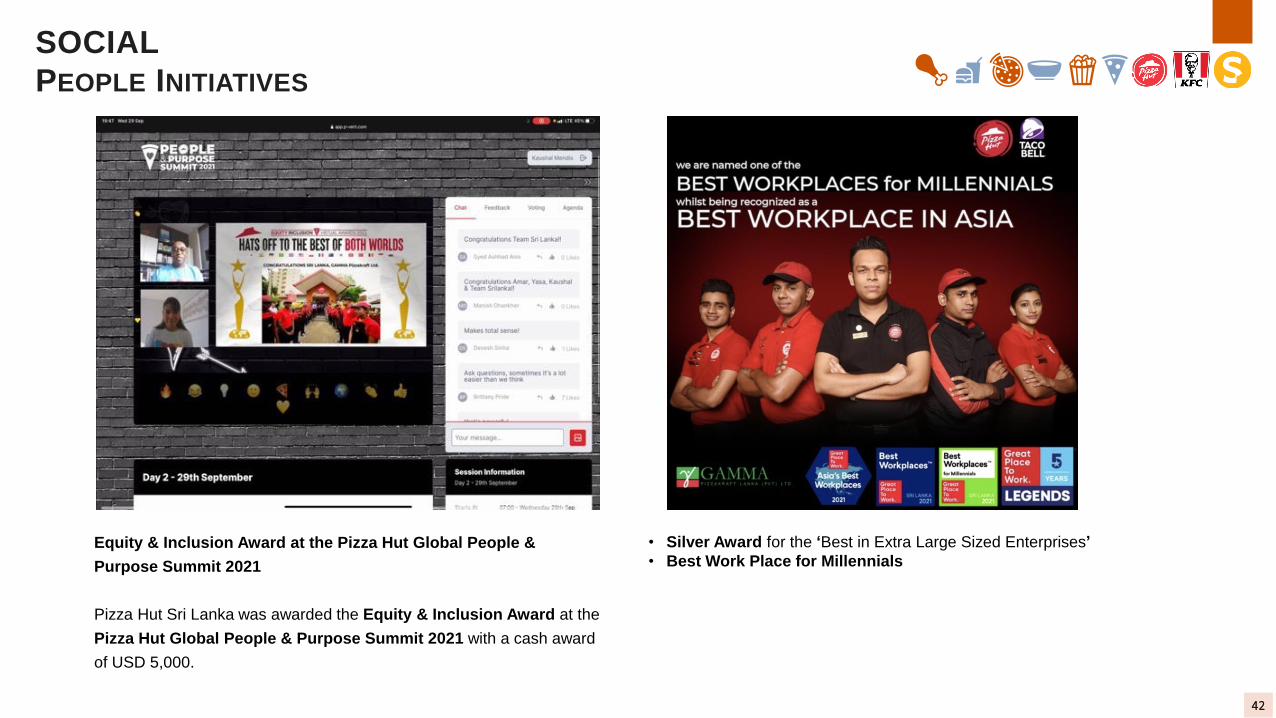
SOCIAL
PEOPLE INITIATIVES
42
Equity & Inclusion Award at the Pizza Hut Global People &
Purpose Summit 2021
Pizza Hut Sri Lanka was awarded the Equity & Inclusion Award at the
Pizza Hut Global People & Purpose Summit 2021 with a cash award
of USD 5,000.
• Silver Award for the ‘Best in Extra Large Sized Enterprises’
• Best Work Place for Millennials

COMPANY OVERVIEW
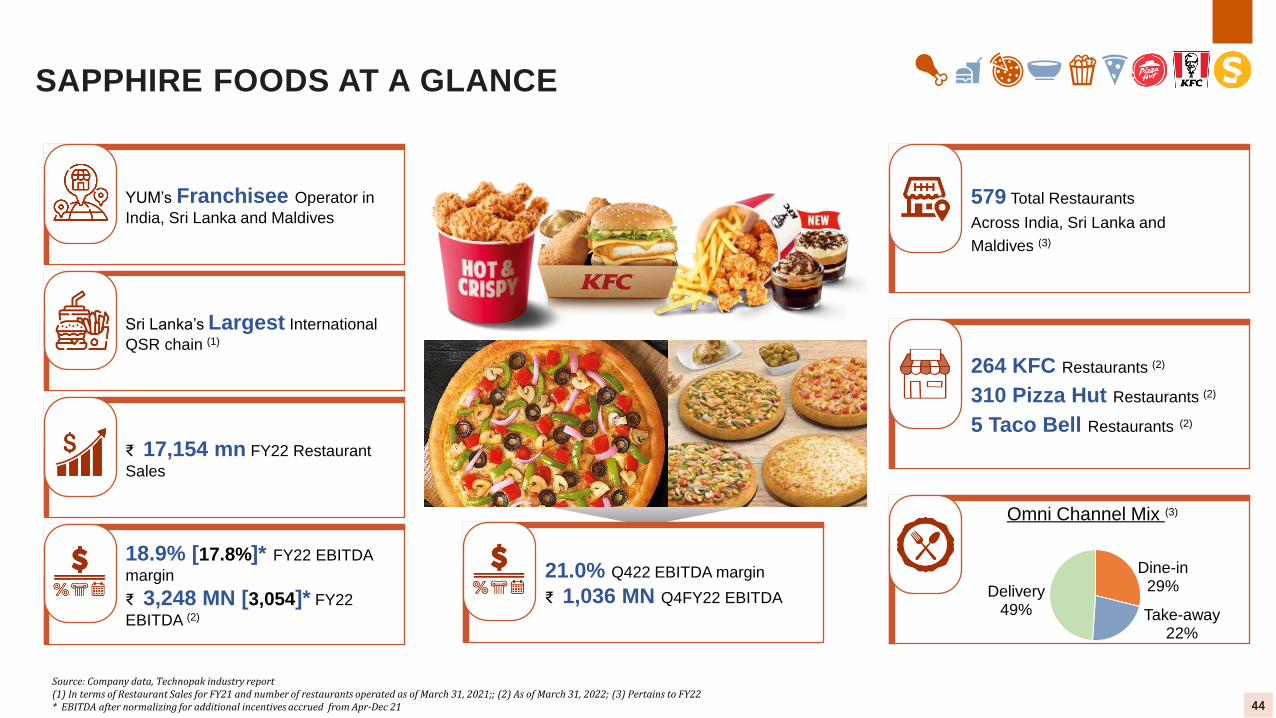
SAPPHIRE FOODS AT A GLANCE
18.9% [17.8%]* FY22 EBITDA
margin
₹ 3,248 MN [3,054]* FY22
EBITDA (2)
YUM’s Franchisee Operator in
India, Sri Lanka and Maldives
Sri Lanka’s Largest International
QSR chain (1)
₹ 17,154 mn FY22 Restaurant
Sales
Source: Company data, Technopak industry report(1) In terms of Restaurant Sales for FY21 and number of restaurants operated as of March 31, 2021;; (2) As of March 31, 2022; (3) Pertains to FY22* EBITDA after normalizing for additional incentives accrued from Apr-Dec 21
579 Total Restaurants
Across India, Sri Lanka and
Maldives (3)
264 KFC Restaurants (2)
310 Pizza Hut Restaurants (2)
5 Taco Bell Restaurants (2)
Omni Channel Mix (3)
Dine-in29%
Take-away22%
Delivery49%
44
21.0% Q422 EBITDA margin
₹ 1,036 MN Q4FY22 EBITDA
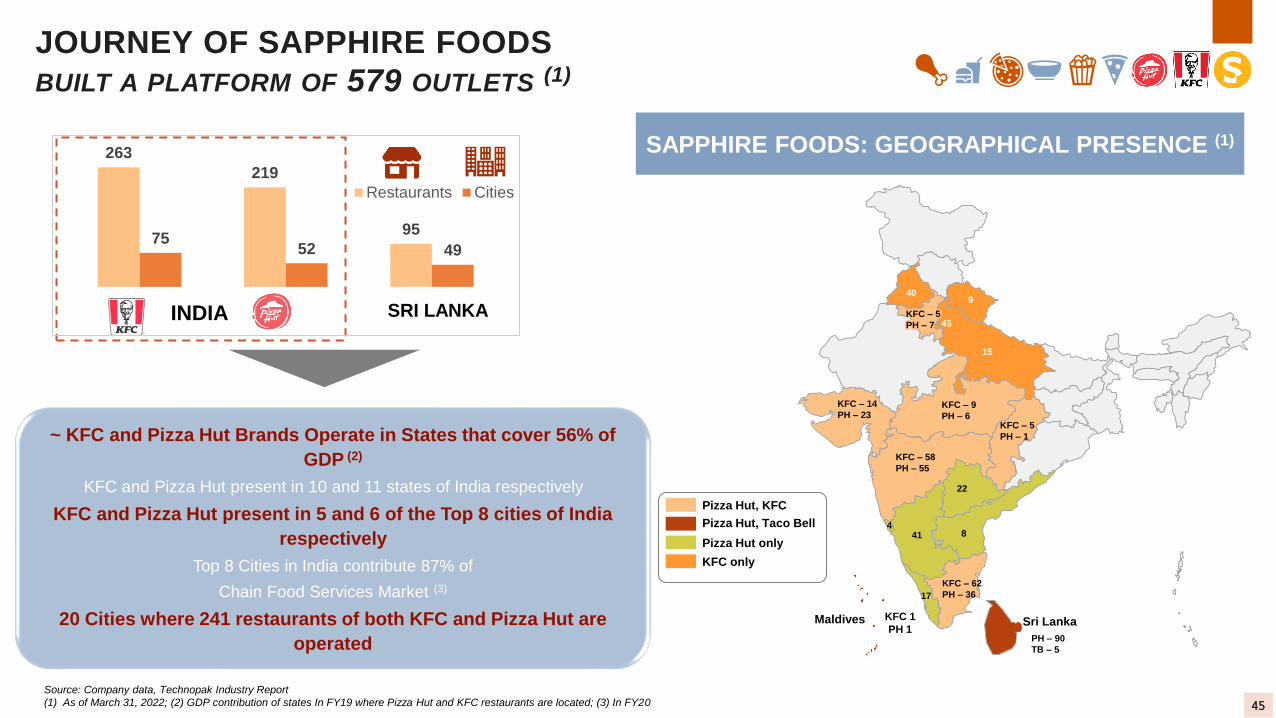
SAPPHIRE FOODS: GEOGRAPHICAL PRESENCE (1)
~ KFC and Pizza Hut Brands Operate in States that cover 56% of
GDP (2)
KFC and Pizza Hut present in 10 and 11 states of India respectively
KFC and Pizza Hut present in 5 and 6 of the Top 8 cities of India
respectively
Top 8 Cities in India contribute 87% of
Chain Food Services Market (3)
20 Cities where 241 restaurants of both KFC and Pizza Hut are
operated
Source: Company data, Technopak Industry Report
(1) As of March 31, 2022; (2) GDP contribution of states In FY19 where Pizza Hut and KFC restaurants are located; (3) In FY20
263
219
9575
52 49
Restaurants Cities
INDIA SRI LANKA
KFC 1
PH 1
JOURNEY OF SAPPHIRE FOODS
BUILT A PLATFORM OF 579 OUTLETS (1)
45
Pizza Hut, KFC
Pizza Hut, Taco Bell
Pizza Hut only
KFC only
Maldives Sri Lanka
KFC – 9
PH – 6
KFC – 14
PH – 23
KFC – 58
PH – 55
KFC – 5
PH – 1
KFC – 62
PH – 36
8
22
414
17
15
45
940
PH – 90
TB – 5
KFC – 5
PH – 7

THE SAPPHIRE STORY
Capability and capital to
rapidly drive organic and
inorganic growth plans
Execution Mindset Great Customer
experience along with Superior Back-end
operational excellence
Two global brands
(KFC & Pizza Hut) with Scale
& PAT profitability among
Top 3 QSR operators
Optimal capital allocation
drives new restaurant
expansion model - focus on
smaller sized omni-channel
restaurants
Value based work
culture, high on
governance enabled by
professional
management, board and
promoters
46
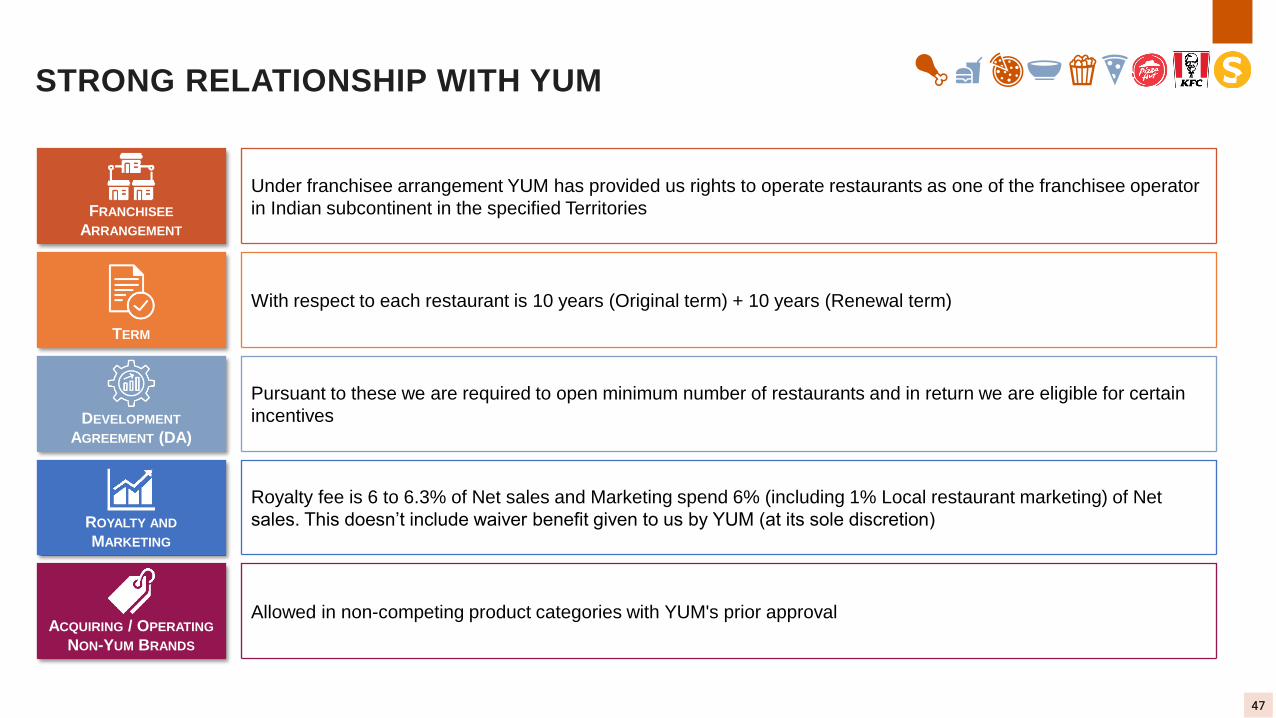
STRONG RELATIONSHIP WITH YUM
FRANCHISEE
ARRANGEMENT
TERM
DEVELOPMENT
AGREEMENT (DA)
ROYALTY AND
MARKETING
ACQUIRING / OPERATING
NON-YUM BRANDS
Under franchisee arrangement YUM has provided us rights to operate restaurants as one of the franchisee operator
in Indian subcontinent in the specified Territories
With respect to each restaurant is 10 years (Original term) + 10 years (Renewal term)
Pursuant to these we are required to open minimum number of restaurants and in return we are eligible for certain
incentives
Royalty fee is 6 to 6.3% of Net sales and Marketing spend 6% (including 1% Local restaurant marketing) of Net
sales. This doesn’t include waiver benefit given to us by YUM (at its sole discretion)
Allowed in non-competing product categories with YUM's prior approval
47
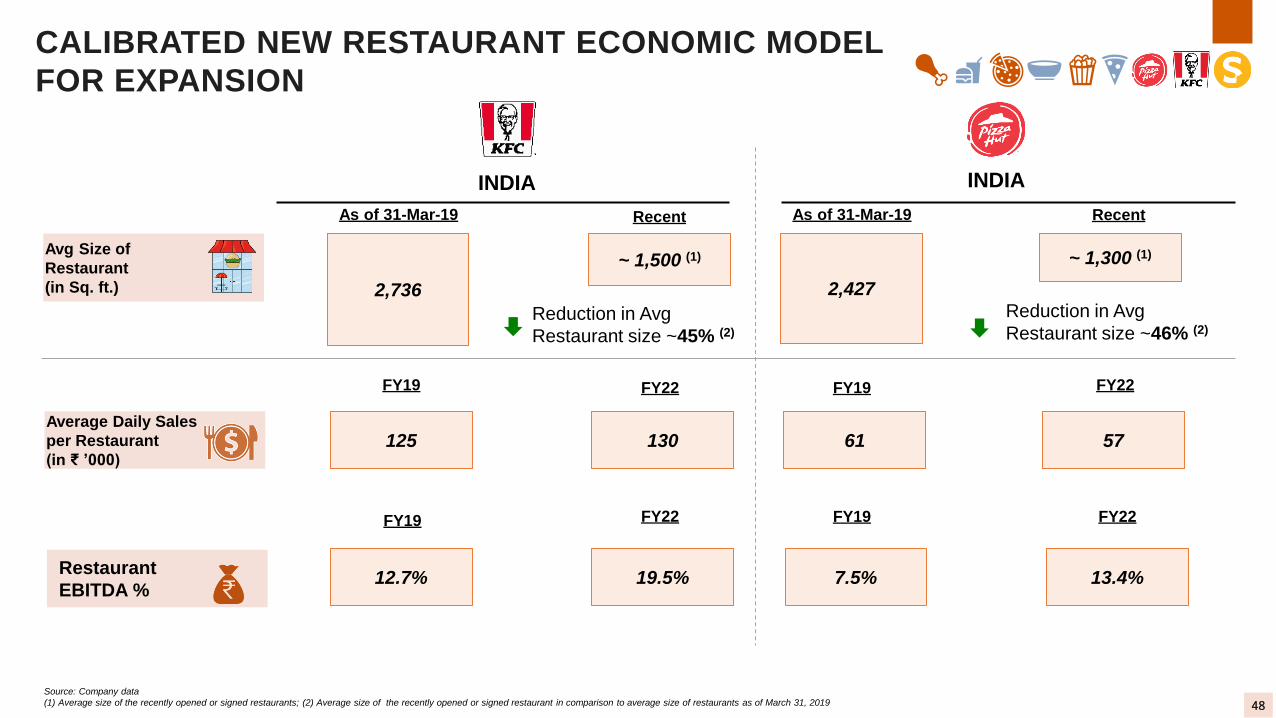
CALIBRATED NEW RESTAURANT ECONOMIC MODEL
FOR EXPANSION
Source: Company data
(1) Average size of the recently opened or signed restaurants; (2) Average size of the recently opened or signed restaurant in comparison to average size of restaurants as of March 31, 2019
As of 31-Mar-19 Recent
2,736
~ 1,500 (1)
As of 31-Mar-19
2,427
~ 1,300 (1)Avg Size of
Restaurant
(in Sq. ft.)
FY19 FY22 FY19 FY22
125 130 61 57Average Daily Sales
per Restaurant
(in ₹ ’000)
Reduction in Avg
Restaurant size ~45% (2)
Reduction in Avg
Restaurant size ~46% (2)
Restaurant
EBITDA %
FY22
12.7% 19.5% 7.5% 13.4%
FY22FY19FY19
INDIA INDIA
48
Recent
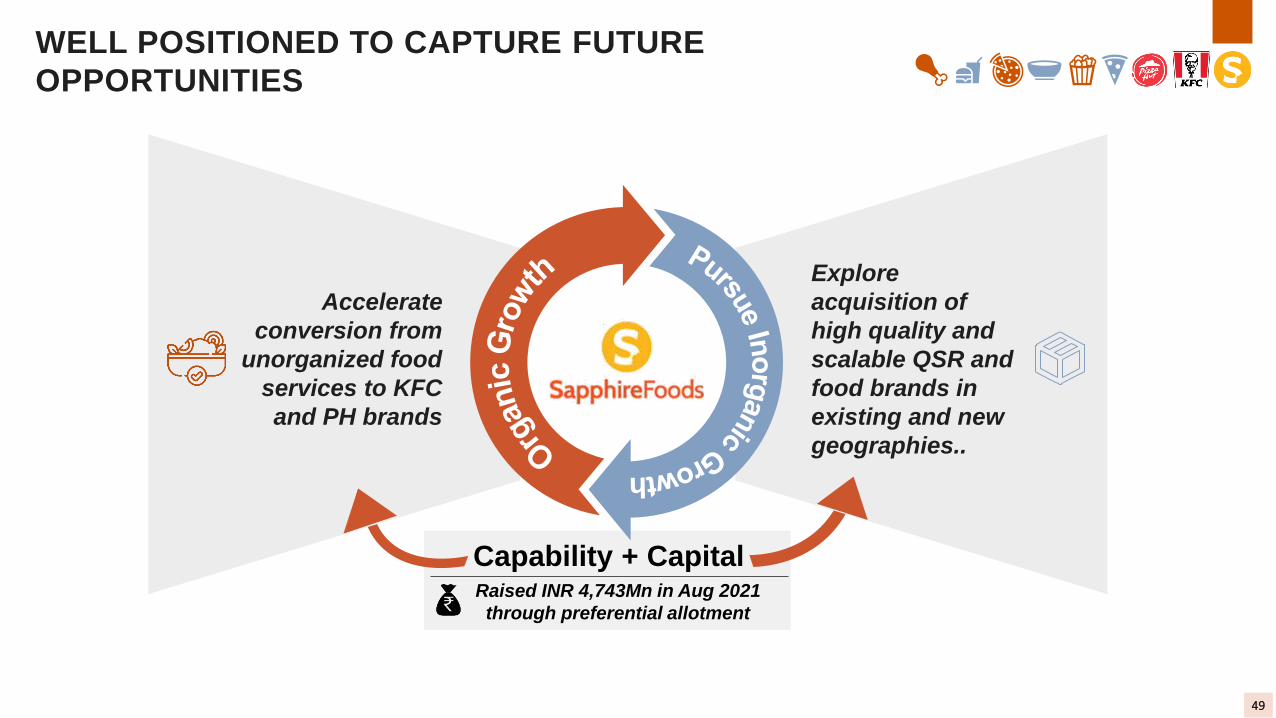
WELL POSITIONED TO CAPTURE FUTURE
OPPORTUNITIES
Capability + CapitalRaised INR 4,743Mn in Aug 2021
through preferential allotment
Accelerate
conversion from
unorganized food
services to KFC
and PH brands
Explore
acquisition of
high quality and
scalable QSR and
food brands in
existing and new
geographies..
49
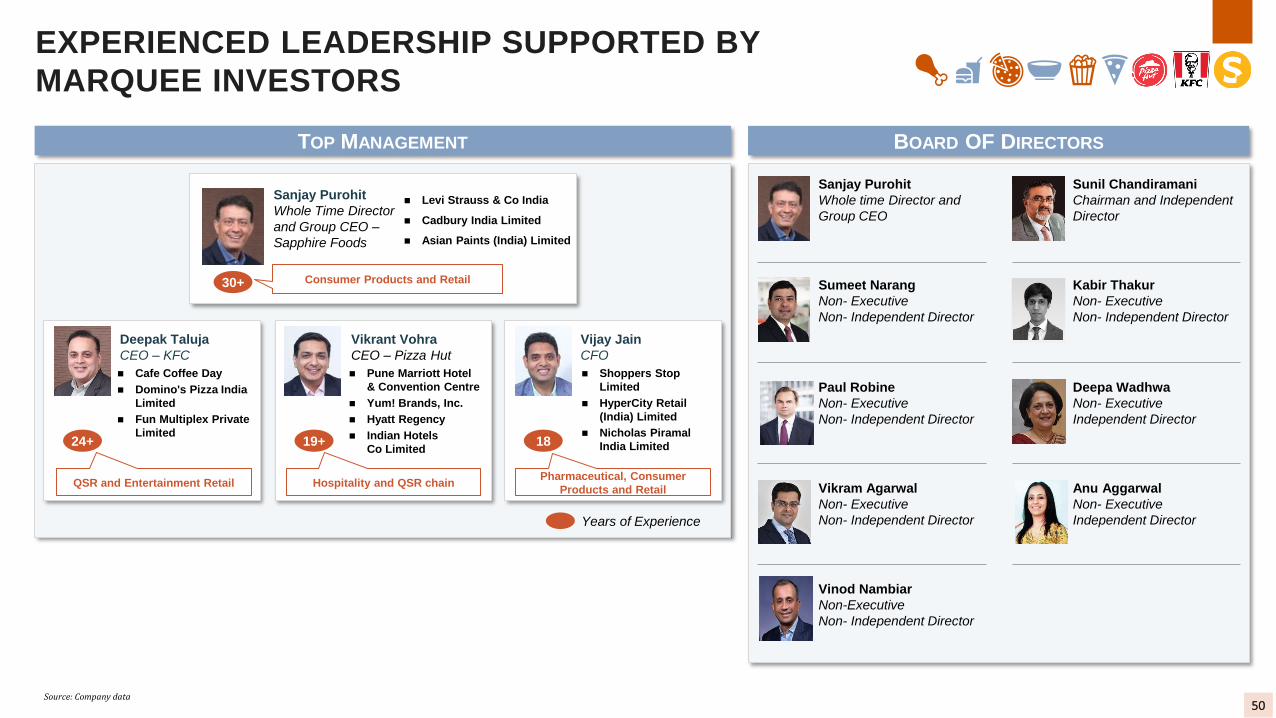
EXPERIENCED LEADERSHIP SUPPORTED BY
MARQUEE INVESTORS
Sanjay Purohit
Whole Time Director
and Group CEO –
Sapphire Foods
Vijay Jain
CFO
Years of Experience
TOP MANAGEMENT BOARD OF DIRECTORS
Sanjay Purohit
Whole time Director and
Group CEO
Sumeet Narang
Non- Executive
Non- Independent Director
Paul Robine
Non- Executive
Non- Independent Director
Deepa Wadhwa
Non- Executive
Independent Director
Vikram Agarwal
Non- Executive
Non- Independent Director
Anu Aggarwal
Non- Executive
Independent Director
Vinod Nambiar
Non-Executive
Non- Independent Director
Vikrant Vohra
CEO – Pizza Hut
Deepak Taluja
CEO – KFC
Source: Company data
Sunil Chandiramani
Chairman and Independent
Director
Kabir Thakur
Non- Executive
Non- Independent Director
◼ Levi Strauss & Co India
◼ Cadbury India Limited
◼ Asian Paints (India) Limited
◼ Cafe Coffee Day
◼ Domino's Pizza India
Limited
◼ Fun Multiplex Private
Limited
◼ Pune Marriott Hotel
& Convention Centre
◼ Yum! Brands, Inc.
◼ Hyatt Regency
◼ Indian Hotels
Co Limited
◼ Shoppers Stop
Limited
◼ HyperCity Retail
(India) Limited
◼ Nicholas Piramal
India Limited1819+24+
Consumer Products and Retail
QSR and Entertainment Retail
30+
Hospitality and QSR chainPharmaceutical, Consumer
Products and Retail
50
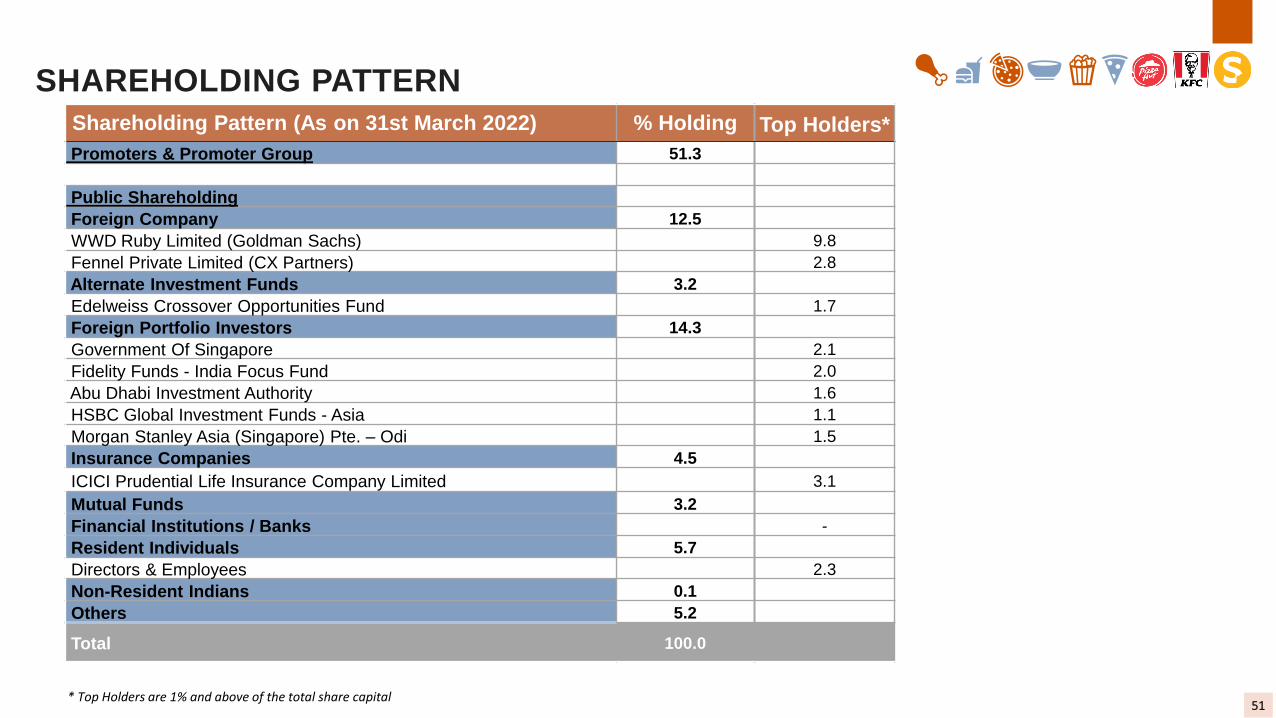
SHAREHOLDING PATTERN
Shareholding Pattern (As on 31st March 2022) % Holding Top Holders*
Promoters & Promoter Group 51.3
Public Shareholding
Foreign Company 12.5
WWD Ruby Limited (Goldman Sachs) 9.8
Fennel Private Limited (CX Partners) 2.8
Alternate Investment Funds 3.2
Edelweiss Crossover Opportunities Fund 1.7
Foreign Portfolio Investors 14.3
Government Of Singapore 2.1
Fidelity Funds - India Focus Fund 2.0
Abu Dhabi Investment Authority 1.6
HSBC Global Investment Funds - Asia 1.1
Morgan Stanley Asia (Singapore) Pte. – Odi 1.5
Insurance Companies 4.5
ICICI Prudential Life Insurance Company Limited 3.1
Mutual Funds 3.2
Financial Institutions / Banks -
Resident Individuals 5.7
Directors & Employees 2.3
Non-Resident Indians 0.1
Others 5.2
Total 100.0
* Top Holders are 1% and above of the total share capital51
THANK YOU
Sapphire Foods India Limited
CIN: L55204MH2009PLC197005
Mr. Rahul Kapoor
Email ID: [email protected]
www.sapphirefoods.in
Orient Capital (a division of Link Group)
Mr. Nachiket Kale
Email ID: [email protected]
+91 9920940808
www.orientcap.com
Company: Investor Relations Partner:
Related Documents