SOUTHERN AFRICAN POWER POOL 1 The Southern African Power Pool www.sapp.co.zw SAPP Experience in Regional Integration And Power Pooling Dr. Lawrence Musaba & Mr. Musara Beta Coordination Centre Manager Chief Market Analyst iPAD East Africa Dar es Salaam, TANZANIA 11-13 August 2009

Welcome message from author
This document is posted to help you gain knowledge. Please leave a comment to let me know what you think about it! Share it to your friends and learn new things together.
Transcript

SOUTHERN AFRICAN POWER POOL1
The Southern African Power Pool
www.sapp.co.zw
SAPP Experience in Regional Integration And Power Pooling
Dr. Lawrence Musaba & Mr. Musara Beta
Coordination Centre Manager Chief Market Analyst
iPAD East Africa
Dar es Salaam, TANZANIA
11-13 August 2009
SOUTHERN AFRICAN POWER POOL2
1. INTRODUCTION TO THE SAPP
2. HISTORY OF SAPP INTERCONNECTIONS
3. POWER POOLING & ENERGY TRADING
4. CROSS BORDER PROJECTS
5. CONCLUSION
CONTENTS

SOUTHERN AFRICAN POWER POOL3
1. INTRODUCTION TO THE SAPP
DR CongoTanzania
Zambia
Angola Malawi
Zimbabwe
MozambiqueBotswanaNamibia
South AfricaLesotho
Swaziland
� 12 SADC Member
Countries
� 230 Million people
� Regional Average
Electricity growth
rate 4.6% p.a.
1.1 Geographic

SOUTHERN AFRICAN POWER POOL4
� The SAPP was created in August 1995 through the signing of the Inter-Governmental MOU.
� The Aim was to optimise the use of available energy resources in the region and support one another during emergencies.
� 12 SADC Members:� 9 Operating Members� 3 Non-Operating Members
1.2 SAPP Creation and Aim

SOUTHERN AFRICAN POWER POOL5
The SAPP Vision is to:
� Facilitate the development of a competitive electricity market in the Southern African region.
� Give the end user a choice of electricity supply.
� Ensure that the southern African region is the region of choice for investment by energy intensive users.
� Ensure sustainable energy developments through sound economic, environmental & social practices.
1.3 SAPP Vision
SOUTHERN AFRICAN POWER POOL6
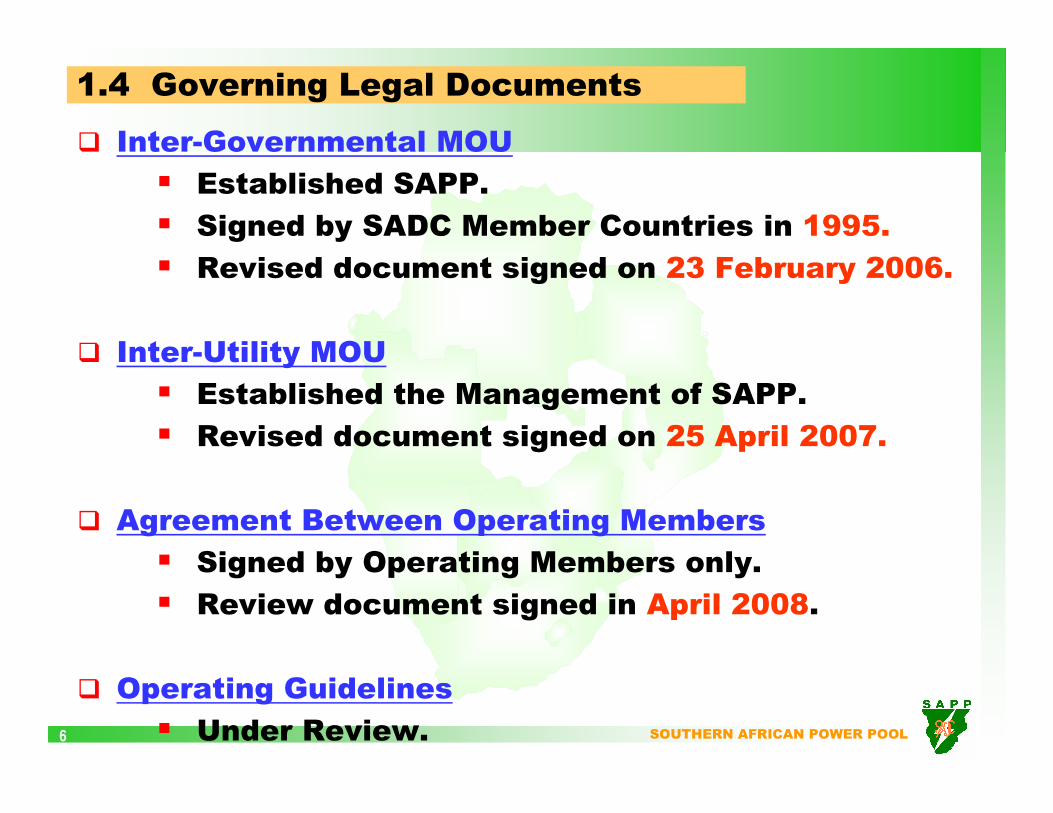
1.4 Governing Legal Documents
� Inter-Governmental MOU
� Established SAPP.
� Signed by SADC Member Countries in 1995.
� Revised document signed on 23 February 2006.
� Inter-Utility MOU
� Established the Management of SAPP.
� Revised document signed on 25 April 2007.
� Agreement Between Operating Members
� Signed by Operating Members only.
� Review document signed in April 2008.
� Operating Guidelines
� Under Review.

SOUTHERN AFRICAN POWER POOL7
1.5 Management & Governance Structure
SADC-DISSADC-DIS
Executive CommitteeExecutive Committee
Management CommitteeManagement Committee
Planning Sub-
Committee
Planning Sub-
Committee
Operating Sub-
Committee
Operating Sub-
Committee
Coordination Centre Board
Coordination Centre Board
Coordination Centre
Coordination Centre
Environmental Sub-
Committee
Environmental Sub-
Committee
Markets Sub-
Committee
Markets Sub-
Committee
SOUTHERN AFRICAN POWER POOL8
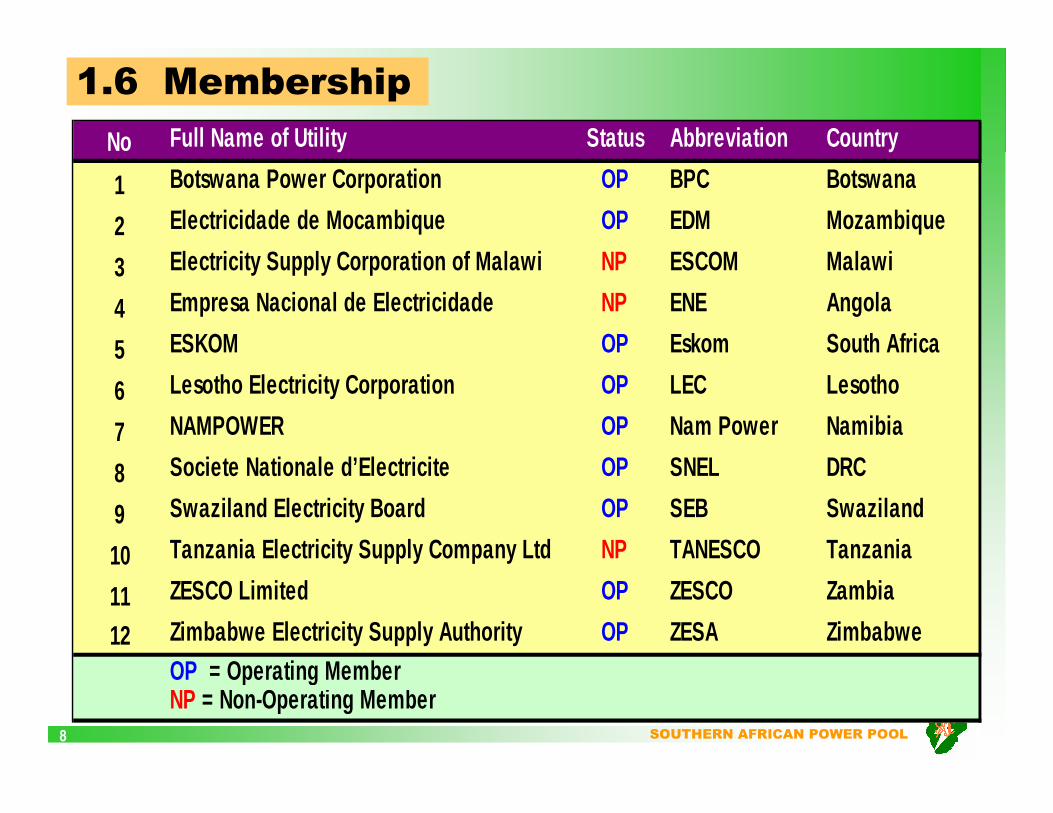
No Full Name of Utility Status Abbreviation Country
1 Botswana Power Corporation OP BPC Botswana
2 Electricidade de Mocambique OP EDM Mozambique
3 Electricity Supply Corporation of Malawi NP ESCOM Malawi
4 Empresa Nacional de Electricidade NP ENE Angola
5 ESKOM OP Eskom South Africa
6 Lesotho Electricity Corporation OP LEC Lesotho
7 NAMPOWER OP Nam Power Namibia
8 Societe Nationale d’Electricite OP SNEL DRC
9 Swaziland Electricity Board OP SEB Swaziland
10 Tanzania Electricity Supply Company Ltd NP TANESCO Tanzania
11 ZESCO Limited OP ZESCO Zambia
12 Zimbabwe Electricity Supply Authority OP ZESA ZimbabweOP = Operating MemberNP = Non-Operating Member
1.6 Membership

SOUTHERN AFRICAN POWER POOL9
1950s: DRC-Zambia500kV HVDC 1700km
1x220kV AC
1960s: Zambia – Zimbabwe
2x330kV AC
1975: Mozambique – South Africa
533kV HVDC – 1400km
DRCDRC
TanzaniaTanzania
AngolaAngola
ZambiaZambia
MalawiMalawi
MozambiqueMozambique
ZimbabweZimbabwe
BotswanaBotswana
NamibiaNamibia
South AfricaSouth Africa
SwazilandSwaziland
LesothoLesotho
1.2 Historic2. HISTORY OF SAPP INTERCONNECTIONS
SOUTHERN AFRICAN POWER POOL10
Thermal Southern Network
DRC
Tanzania
Angola
Zambia
Malawi
Mozambique
Zimbabwe
Botswana
Namibia
South Africa
Swaziland
Lesotho
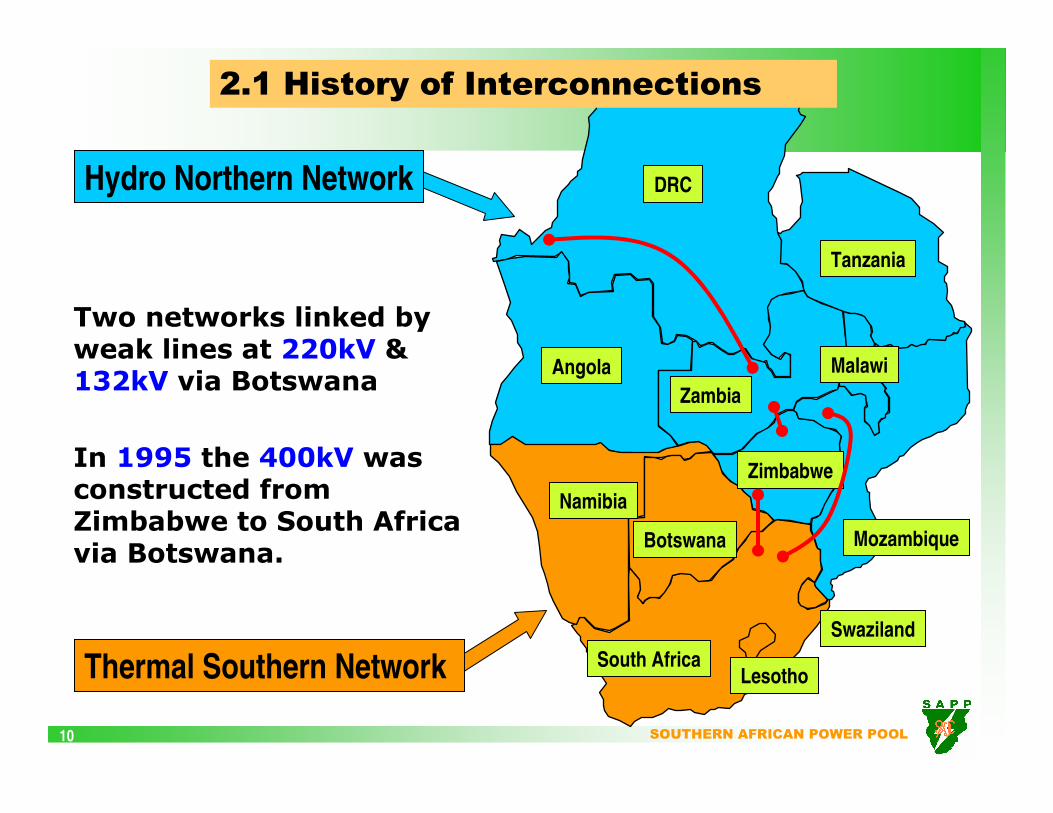
Hydro Northern Network
Two networks linked by weak lines at 220kV & 132kV via Botswana
In 1995 the 400kV was constructed from Zimbabwe to South Africa via Botswana.
2.1 History of Interconnections

SOUTHERN AFRICAN POWER POOL11
� The interconnection of the northern and southern networks created a platform for regional trade and cooperation.
� In 1995, the Ministers responsible for energy in the Southern African Development Community (SADC) signed Inter-Government MOU that lead to the creation of a power pool under the name, Southern African Power Pool(SAPP).
2.1 History of Interconnections

SOUTHERN AFRICAN POWER POOL12
2.2 Completed Interconnections
Since 1995, the following transmission lines have been commissioned by the SAPP:
1. The 400kV Matimba-Insukamini Interconnector linking Eskom of South Africaand ZESA of Zimbabwe in 1995.
2. The 330kV Interconnector between Mozambique and Zimbabwe was commissioned in 1997.
3. BPC Phokoje substation was tapped into the Matimba line to allow for Botswana’s tapping into the SAPP grid at 400kV in 1998.

SOUTHERN AFRICAN POWER POOL13
4. Restoration of the 533kV DC lines between Cahora Bassa in Mozambique and Apollo substation in South Africa was completed in 1998.
5. 400kV line between Camden in South Africavia Edwaleni in Swaziland to Maputo in Mozambique in 2000.
6. 400kV line between Arnot in South Africa and Maputo in Mozambique in 2001.
7. 400kV line between Aggeneis in South Africaand Kookerboom in Namibia in 2001.
8. 220kV line from Zambia to Namibia in 2007.
2.2 Completed Interconnections
SOUTHERN AFRICAN POWER POOL14
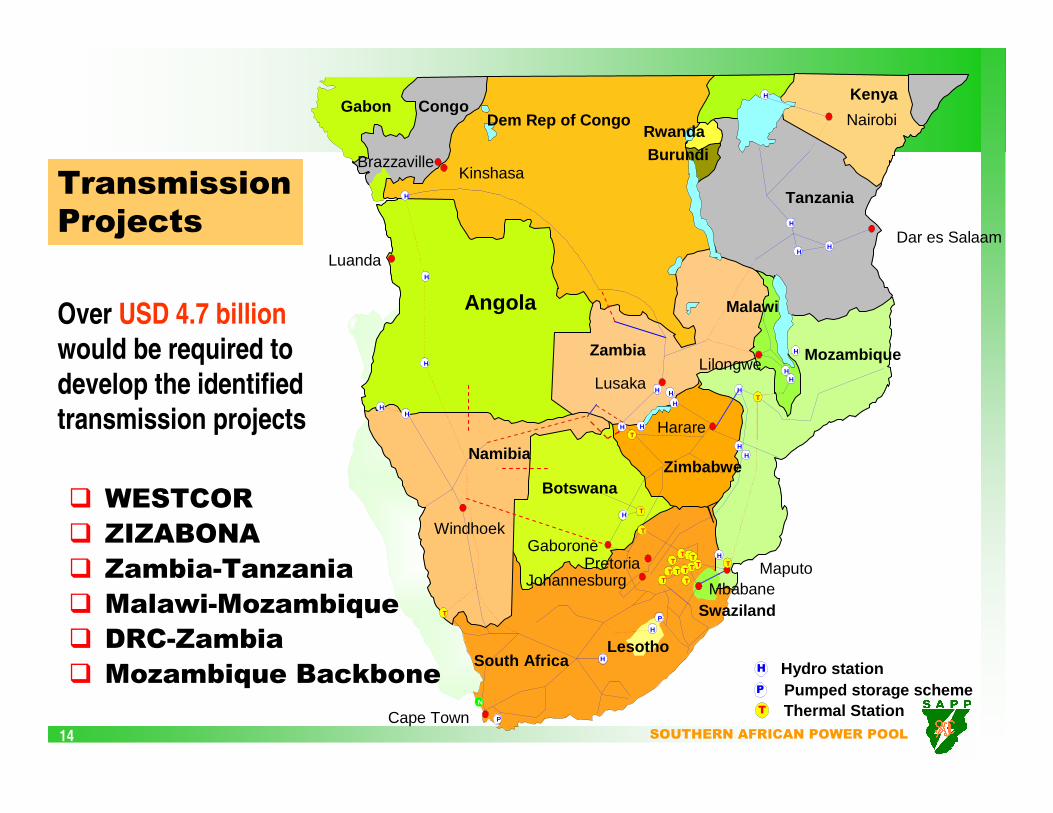
� WESTCOR
� ZIZABONA
� Zambia-Tanzania
� Malawi-Mozambique
� DRC-Zambia
� Mozambique Backbone
Over USD 4.7 billion
would be required to
develop the identified
transmission projects
Transmission
Projects
Dem Rep of CongoCongoGabon
Luanda
Windhoek
Lusaka
Harare
Lilongwe
Nairobi
Dar es Salaam
GaboronePretoria
Johannesburg
Cape Town
MaputoMbabane
KinshasaBrazzaville
Angola
Tanzania
Kenya
Mozambique
South Africa
Swaziland
Lesotho
Namibia
Zambia
BotswanaZimbabwe
Malawi
RwandaBurundi
H
H
H
H
H
H
H
H
H
HH
H
H
HH
H
P
H
H
T
T
T
T
T
T TT
TTTTT T
T
T
HH
H
TH
P
N
HH
H
T
Hydro stationPumped storage schemeThermal Station
P

SOUTHERN AFRICAN POWER POOL15
3. POWER POOLING AND ENERGY TRADING
� Linking utilities electricity production facilitates the dispatch of excess capacity from one system to another.
� Thus the output from different power plants is pooled, scheduled according to increasing marginal cost, and dispatched according to merit order to meet demand.
� The benefits and platform created by power pooling include:
1. Increased security and reliability of supply� Provision of emergency support� Sharing spinning reserve capacity� Balancing generation mix (74% coal, 20% hydro, 4%
nuclear, 2% gas/diesel)
2. Improved sector investment environment� Aggregation of individual power markets� Improved access to creditworthy� Diversification
3.1 Power Pooling

SOUTHERN AFRICAN POWER POOL16
3. Reduced operating costs� Merit order dispatching� Balancing non-coincidental peak-loads� Optimization of generation resources
4. Reduced & deferred investment costs� Advantage of economies of scale� Reduced total reserve requirements (SAPP has
managed from 20% to 10%)� Postponed investments in new peak power
capacity� Reduced investment in hydro system
3.1 Power Pooling - 2
SOUTHERN AFRICAN POWER POOL17
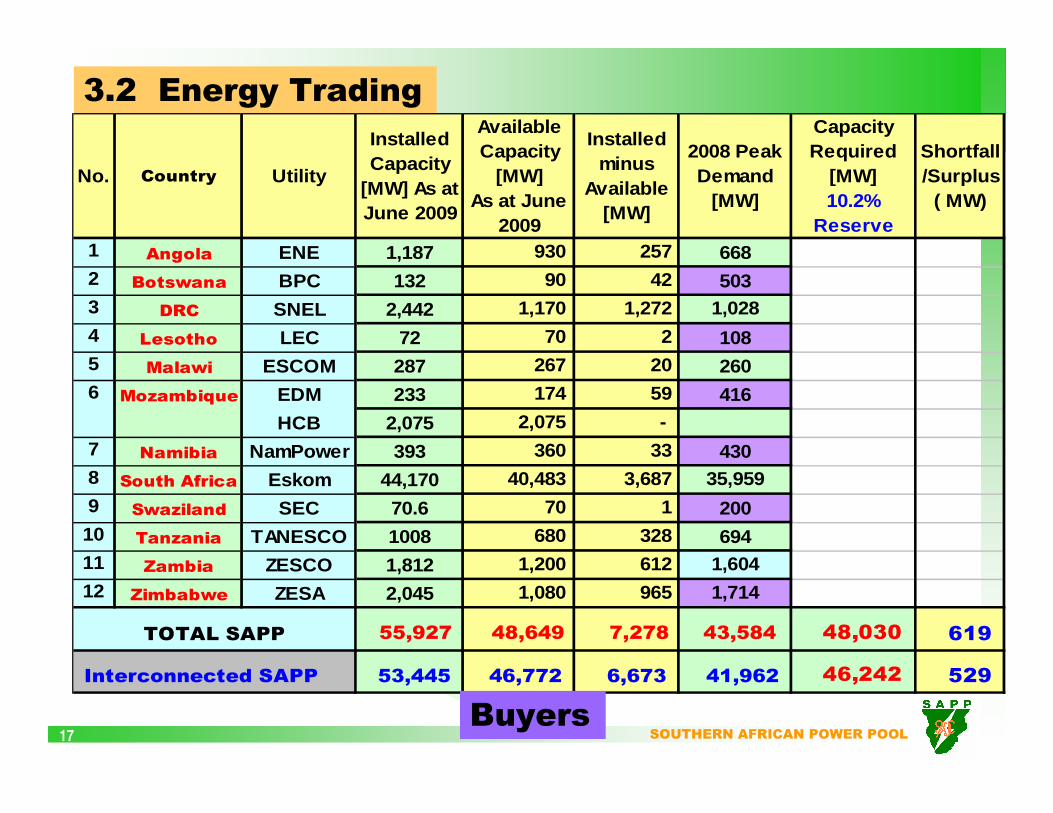
3.2 Energy Trading
No. Country Utility
Installed Capacity
[MW] As at June 2009
Available Capacity
[MW] As at June
2009
Installed minus
Available [MW]
2008 Peak Demand
[MW]
Capacity Required
[MW] 10.2%
Reserve
Shortfall /Surplus
( MW)
1 Angola ENE 1,187 930 257 6682 Botswana BPC 132 90 42 5033 DRC SNEL 2,442 1,170 1,272 1,0284 Lesotho LEC 72 70 2 1085 Malawi ESCOM 287 267 20 2606 Mozambique EDM 233 174 59 416
HCB 2,075 2,075 - 7 Namibia NamPower 393 360 33 4308 South Africa Eskom 44,170 40,483 3,687 35,9599 Swaziland SEC 70.6 70 1 20010 Tanzania TANESCO 1008 680 328 69411 Zambia ZESCO 1,812 1,200 612 1,60412 Zimbabwe ZESA 2,045 1,080 965 1,714
55,927 48,649 7,278 43,584 48,030 619
53,445 46,772 6,673 41,962 46,242 529 Interconnected SAPP
TOTAL SAPP
Buyers

SOUTHERN AFRICAN POWER POOL18
� Energy trading has been facilitated by the fact that some members have excess power supply and others are in a deficit.
� Balancing supply and demand is done via energy trading arrangements:
3.2 Energy Trading - 2
� Bilateral contracts� Bilateral contracts
PREVIOUSLYPREVIOUSLY
� Bilateral contracts
� Short-Term Energy Market (STEM) - 2001
� Post STEM (Balancing Market) - 2002
� Bilateral contracts
� Short-Term Energy Market (STEM) - 2001
� Post STEM (Balancing Market) - 2002
CURRENTCURRENT
� Bilateral contracts
� Day-Ahead Market (DAM) - 2008
� Ancillary Services Market - 2009
� Balancing Mechanism - 2008
� Bilateral contracts
� Day-Ahead Market (DAM) - 2008
� Ancillary Services Market - 2009
� Balancing Mechanism - 2008
FUTUREFUTURE

SOUTHERN AFRICAN POWER POOL19
� Bilateral trading has been increasing year by year.
� Demand in the SAPP is rising by 3% annually.
� Small reduction in 2004 – rehabilitation projects
- 5,000 10,000 15,000 20,000
2002
2003
2004
2005Y
ear
Energy Traded in GWh
3.3 Bilateral Trading

SOUTHERN AFRICAN POWER POOL20
96
210
200
950
100
1,370
400
150
110
100
80
796
1,390
918
230
2,500
3,375
793
770
700
280
5,875
0 1,000 2,000 3,000 4,000 5,000 6,000
Eskom-SEB
Eskom-BPC
Eskom-Nampower
Eskom-EDM
Eskom-LEC
HCB-ESKOM
HCB-ZESA
Eskom-ZESA
SNEL -ZESA
SNEL-ESKOM
ZESCO -ESKOM Energy (GWh)Capacity (MW)
Negotiated Utility Contracts HCB supply (hydro) – 1770 MWESKOM supply (thermal) – 1706 MW
SAPP Bilateral Agreements - 2003

SOUTHERN AFRICAN POWER POOL21
96
210
200
950
100
1,370
250
150
110
100
80
868
1,606
1,045
230
2,500
1,800
793
770
700
280
5,875
0 1,000 2,000 3,000 4,000 5,000 6,000
Eskom-SEB
Eskom-BPC
Eskom-Nampower
Eskom-EDM
Eskom-LEC
HCB-ESKOM
HCB-ZESA
Eskom-ZESA
SNEL -ZESA
SNEL-ESKOM
ZESCO -ESKOM Energy (GWh)Capacity (MW)
HCB supply (hydro) - 1770 MW, ESKOM supply (thermal) -1706 MW
Bilateral Contracts - 2005

SOUTHERN AFRICAN POWER POOL22
2008 Bilateral Contracts in SAPP
96
210
200
120
100
250
1370
100
150
40
45
40
40
950
270
0 200 400 600 800 1000 1200 1400
Eskom-SEC
Eskom-BPC
Eskom-NamPower
Eskom-EdM
Eskom-LEC
HCB-ZESA
HCB-Eskom
SNEL-ZESA
SNEL-Eskom
ZESA-NamPower
EdM-BPC
EdM-NamPower
EdM-SEC
Eskom -MOZAL
HCB-EdM
Capacity [MW]

SOUTHERN AFRICAN POWER POOL23
� There has been no energy trading on the
short-term energy market (STEM) from June
2007 due to:
� Lack of power supply in the market
� Constrained transmission paths.
� Bilateral trading has however continued.
3.4 STEM Trading

SOUTHERN AFRICAN POWER POOL24
STEM TRADING: Supply & Demand
-
500
1,000
1,500
2,000
2,500
3,000
3,500
4,000
4,500
2001 2002 2003 2004 2005
Year
Ene
rgy
in G
WhSupply Demand

SOUTHERN AFRICAN POWER POOL25
-
500
1,000
1,500
2,000
2,500
3,000
3,500
4,000
2001 2002 2003 2004 2005
Energy Traded [GWh] Monetary Value [US$x1000]
STEM TRADING: Energy Traded & Cost
0.41 Usc/kWh
0.39 Usc/kWh
0.50 Usc/kWh 0.74
Usc/kWh
1.08 Usc/kWh
SOUTHERN AFRICAN POWER POOL26
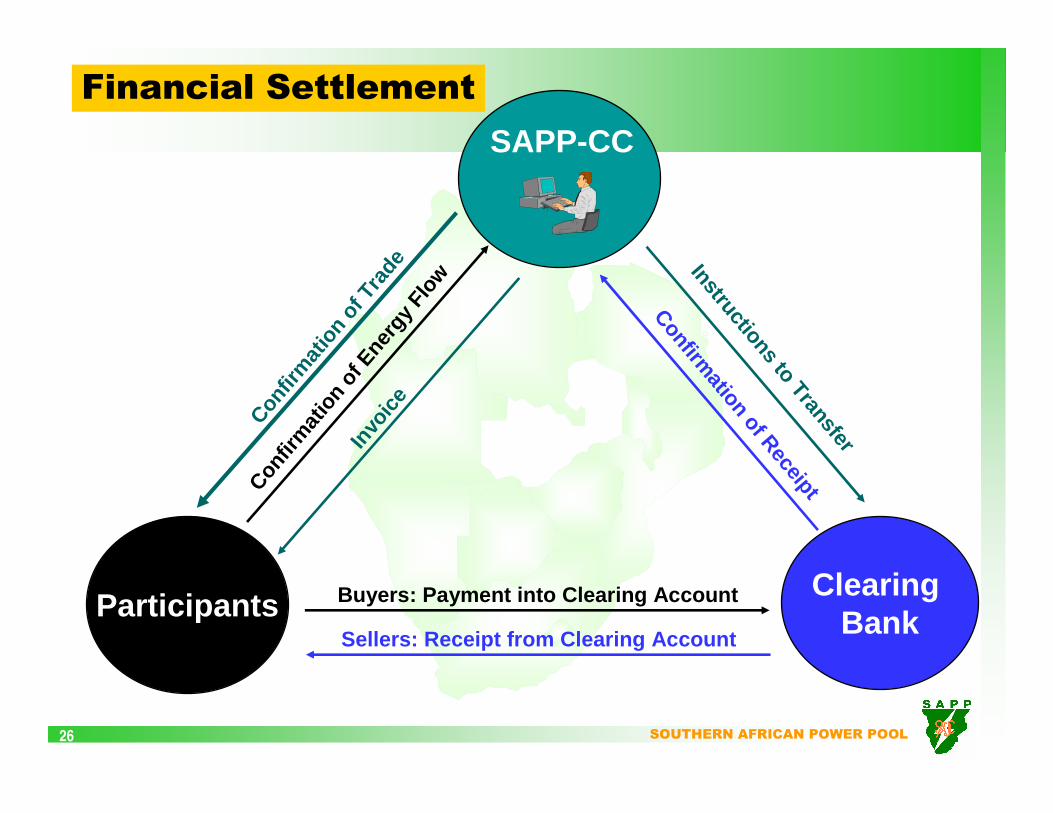
Clearing BankParticipants Buyers: Payment into Clearing Account
Confirmation of ReceiptCon
firm
atio
n of
Tra
de
SAPP-CC
Confir
mat
ion
of E
nerg
y Fl
ow
Invo
ice
Sellers: Receipt from Clearing Account
Instructions to Transfer
Financial Settlement

SOUTHERN AFRICAN POWER POOL27
GOALS of the SAPP DAM design:� Establish an efficient and competitive marketplace� Ensure that consumers benefit from the market
METHODOLOGY:� Development of consistent market mechanisms.� Efficient price signals for the procurement and
transmission of electricity.� Assurance of fair and open access to the
transmission system. � Optimization of generation & transmission capacity.
Goals and Methodology
3.5 SAPP Competitive Market

SOUTHERN AFRICAN POWER POOL28
� Supports an auction-trading model
� All sales & demand bids are aggregated at a fixed time
� The balance price is valid for all trades
� Tool for managing grid congestion
� System price (no grid congestion)
� Area prices (if transmission capacity is exceeded)
DAM Features

SOUTHERN AFRICAN POWER POOL29
SAPP believes that the creation of a competitive ma rket would:
� Help to optimise the use of regional resources
� Assist in determining the correct electricity price in the pool
� Send signals for investments and real time utilization of existing assets; transmission, generation and consu mption.
� Enable the demand side to respond to the supply sid e price signals.
� Designing a market is not simply a matter of copy a nd paste exercise, but hands on experience is necessary to know possible solutions of practical problems.
Advantages of a Competitive Market

SOUTHERN AFRICAN POWER POOL3030
Institutional
Framework
Project preparation,
structuring &
implementation
capability
• Project Preparation, Structuring/Implementation• Currently not at the required standard• No understanding of bankability• No regional coordinated planning/execution
• Institutional Framework• SAPP mandate & structure inappropriate• SADC historical focus on politics• No institution accountable for delivery
• Regulatory Framework• No clarity on cross-border trade• No clarity on cost pass through• No framework to encourage competition• No security of supply
• Weak project sponsors/ developers• No capacity to implement• Need to be reconstituted
• Transaction advisors role
Dependence On
PPAs To Get
Projects
Finance
• Market in each country too small relative to size of projects• Offtaker
• Single buyer model – only utility• Credibilty/ creditworthiness • Impact on balance sheet • Need energy intensive private users
• Dominant Role of Eskom as Major Buyer
• Ratings downgrade • Reduced borrowing capacity • Inability to enter into PPAs
• Risk allocation (currency risk, etc)• Complex negotiations, learning curve
• Too long to close PPAs• Too long to financial close• Need standardisation
• Tariff gap
Political
commitment
• Endorsement at Heads of State level• Reduce bureaucracy• Comfort of Govt underwriting
• Lack of a Project Champion• Strong oversight & accountability
• Low Tariffs• Tariff gap • Need govt underwriting
Progress (Years) towards financial close
Rollin
g
Priorities
4. MAJOR ISSUES AFFECTING CROSS-
BORDER PROJECT CLOSURECompleteness
(relative to checklist)
SOUTHERN AFRICAN POWER POOL31
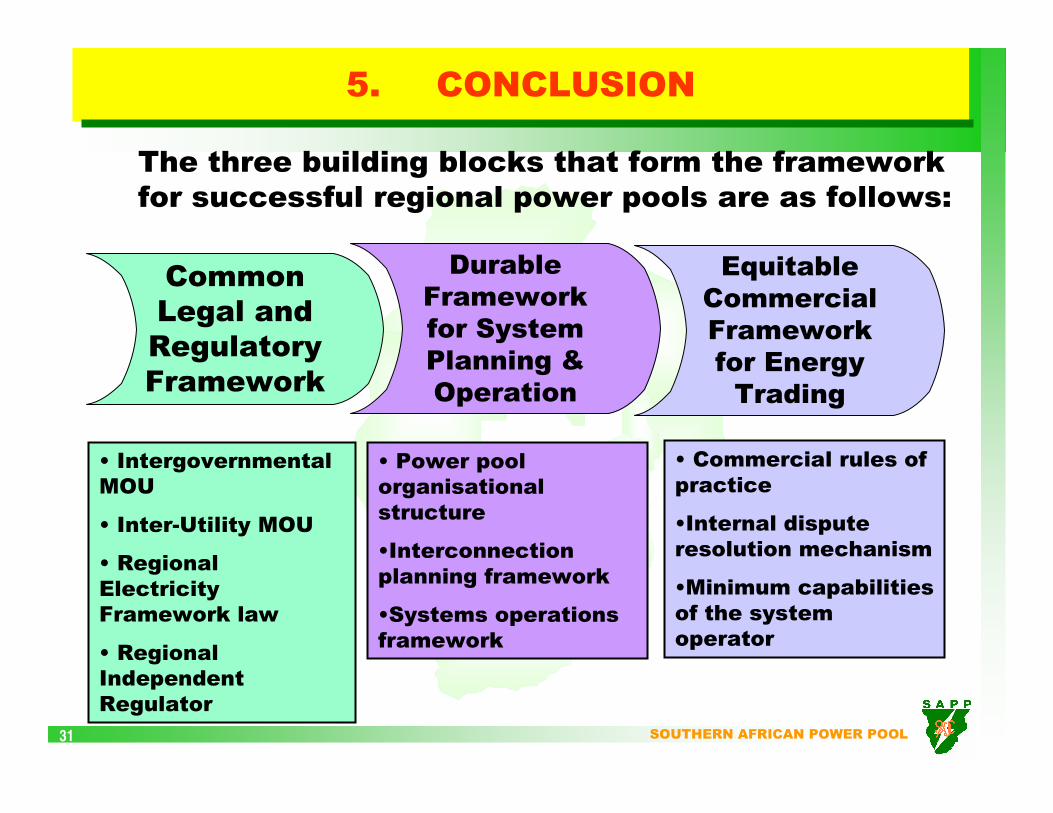
5. CONCLUSION
Common
Legal and
Regulatory
Framework
• Intergovernmental
MOU
• Inter-Utility MOU
• Regional
Electricity
Framework law
• Regional
Independent
Regulator
Durable
Framework
for System
Planning &
Operation
• Power pool
organisational
structure
•Interconnection
planning framework
•Systems operations
framework
Equitable
Commercial
Framework
for Energy
Trading
• Commercial rules of
practice
•Internal dispute
resolution mechanism
•Minimum capabilities
of the system
operator
The three building blocks that form the framework
for successful regional power pools are as follows:

SOUTHERN AFRICAN POWER POOL32
THANK YOU
Related Documents