DX70010A01 May 2021 Santos CSG Pty Ltd Towrie Development Water Assessment Report

Welcome message from author
This document is posted to help you gain knowledge. Please leave a comment to let me know what you think about it! Share it to your friends and learn new things together.
Transcript

DX70010A01
May 2021
Santos CSG Pty Ltd
Towrie Development
Water Assessment Report
Santos GLNG Pty Ltd Towrie Development Area
Water Assessment Report
Page iDX70010A01
EXECUTIVE SUMMARY
KCB Australia Pty Ltd (KCB) was commissioned by Santos Ltd (Santos), to undertake an assessment of potential water-related impacts because of proposed coal seam gas production associated with the Towrie Development Area (the Project).
The assessment has been undertaken to consider the potential impact to water resources and water-dependent assets under the Environment Protection and Biodiversity Conservation Act 1999 (EPBC Act). This assessment has been conducted with reference to the ‘Significant impact guidelines 1.3: Coal seam gas and large coal mining developments – impacts on water resources’, ‘Significant impact guidelines 1.1 – Matters of National Environmental Significance’ and the Independent Expert Scientific Committee on Coal Seam Gas and Large Coal Mining Development (the IESC) information guidelines.
The assessment has been prepared for submission to accompany Santos’ EPBC Act Referral for the Project to the Commonwealth of Australia’s Department of Agriculture, Water and the Environment (DAWE).
Description of the Proposal
The Project area comprises approximately 87 km2 and is approximately 90 km south of the township of Rolleston, Central Queensland. Proposed production activities include: the installation of up to 116 gas production wells, their connection to gas and water gathering lines; hydraulic stimulation as part of the development and ancillary infrastructure.
The Project is located within the Surat Cumulative Management Area (CMA). The Office of Groundwater Impact Assessment (OGIA) was established under the Queensland Water Act 2000 and is responsible for: predicting impacts on water pressures in aquifers; developing water monitoring and spring management strategies; and assigning responsibility to individual petroleum tenure holders for implementing specific parts of the strategies within the Surat CMA. These predictions, strategies and responsibilities are set out in the Surat CMA Underground Water Impact Report (UWIR), prepared and maintained by OGIA.
Hydrology and Hydrogeology Context
The Project is located within the Comet River catchment; a sub-basin of the Fitzroy Basin. Key watercourses within the vicinity of the Project include Nogoa, Comet, Mackenzie and Dawson Rivers. Watercourse flows in the Project area forms stable single channels bounded by the Expedition and Shotover Ranges in the east, the Carnarvon Range in the south and the Buckland Tableland in the west.
The target gas producing formation for the Project is the Bandanna Formation, of the Permo-Triassic Bowen Basin. Groundwater systems in the Project include: Quaternary deposits comprising alluvium associated with the Arcadia Creek; Cenozoic sediments; Triassic Clematis Group and Rewan Group; and Permian coal measures.
Groundwater is predominantly used for stock and domestic purposes, with most third-party bores (within a 25 km radius) screened within the Quaternary alluvium located to the north of the Project. One bore within the Rewan Group, used for stock and domestic purposes, is located within the Project area.

Santos GLNG Pty Ltd Towrie Development Area
Water Assessment Report
Page iiDX70010A01
There are limited potential groundwater dependent ecosystems (GDE) within the vicinity of the Project. Potential terrestrial GDEs (identified from GDE mapping datasets) are located outside the vicinity of the Project and are listed as moderate-and low-confidence GDEs. Available groundwater levels indicate the depth to groundwater is greater than 20 mbGL, supporting the low to moderate-confidence GDE category.
Impact Assessment
Outputs from the Surat CMA numerical model, used for the 2019 Surat CMA UWIR, have been used to consider potential drawdown impacts to groundwater.
Potential impacts to water-dependent assets have been considered with respect to the Queensland Water Act 2000 trigger threshold for springs (0.2 m drawdown) and bores (5 m drawdown in consolidated aquifers; 2 m drawdown in unconsolidated aquifers) using the predicted drawdown outputs from the Surat CMA numerical model.
No bores predicted drawdown, that would trigger the threshold for an unconsolidated aquifer (2 m) or a consolidated aquifer (5 m).
The mandatory requirements under the Water Act 2000 to ‘make good’ potential drawdown impacts to bores, impacts to existing groundwater users are considered unlikely. Impacts to potential terrestrial GDEs are considered unlikely based on the limited and localised magnitude of drawdown predicted in the hydrostratigraphic units that could provide groundwater to the potential GDEs and the low to moderate-confidence status of the GDEs (supported by groundwater level data). Based on the proposed project activities, no discernible impacts to surface water are considered.
Monitoring, Mitigation and Management
In addition to the mandatory baseline bore assessments and ‘make good’ requirements of the Water Act 2000, the following measure will be adopted in accordance with Queensland legislation requirements and Project-specific requirements:
Production wells will be designed, constructed and decommissioned in accordance with the “Code of Practice for the construction and abandonment of coal seam gas and petroleum wells, and associated bores in Queensland Version 2”. This code outlines mandatory requirements and good practice including hydraulic isolation of gas producing formations.
Based on the outcomes of the Chemical Risk Assessment production wells will not be installed within 90 m of a landholder bore unless a site specific assessment determines that a closer distance is appropriate.
Beneficial use and management of produced water in accordance with approvals under the Waste Reduction and Recycling Act 2011 and/or Environmental Protection Act 1994 including ANZECC water quality limits for irrigation.
Storage of produced water and waste in accordance with the Australian standards for tanks such as AS 3735-2001 (Concrete structures for retaining liquids).
All chemicals on site will be stored and managed in contained areas in accordance with legislative and regulatory requirements to prevent releases to the environment.

Santos GLNG Pty Ltd Towrie Development Area
Water Assessment Report
Page iiiDX70010A01
Preparation of a UWIR inclusive of the Project in accordance with the Water Act 2000 for approval by the Department of Environment and Science (DES). This will be undertaken by OGIA as part of the three-yearly periodic update of the Surat UWIR.
All chemical transport vehicles are to travel on approved roads and driver behaviour is to be monitored by an in vehicle monitoring system (IVMS). SDSs and risk dossiers will be available to emergency responders, health and safety managers, and environmental hazard clean-up teams.
Monitoring of groundwater in accordance with the UWIR approved under the Water Act 2000.
Monitoring and reporting of the volume of produced water in accordance with the Petroleum and Gas (Production and Safety) Act 2004.
Conclusion
A water assessment of the Project has been undertaken to consider the potential impacts with respect to the EPBC Act. Water resources and water-dependent assets have been considered in the context of the hydrological and hydrogeological systems, as well as the potential impacts associated with this development.
It is concluded that the proposed development of the Project will not have a significant impact on water resources.

Santos GLNG Pty Ltd Towrie Development Area
Water Assessment Report
TABLE OF CONTENTS
Page ivDX70010A01
EXECUTIVE SUMMARY....................................................................................................................I
1 INTRODUCTION..................................................................................................................11.1 Project Overview.................................................................................................11.2 Report Structure .................................................................................................3
1.2.1 IESC Checklist .......................................................................................3
2 STAUTORY CONTEXT........................................................................................................132.1 Commonwealth legislation ...............................................................................13
2.1.1 Environment Protection and Conservation Act 1999.........................132.2 State Legislation................................................................................................15
2.2.1 Petroleum and Gas (Production and Safety) Act 2004.......................152.2.2 Water Act 2000 ..................................................................................162.2.3 Environmental Protection Act 1994...................................................182.2.4 Water Supply (safety and Reliability) Act 2008..................................18
2.3 Environmental Values and Water Resource Management...............................192.3.1 Environmental Values ........................................................................192.3.2 Water Resource and Resource Operations Plans...............................21
3 PROPOSAL DESCRIPTION .................................................................................................223.1 Project Overview...............................................................................................22
3.1.1 Project Location and Regional Overview ...........................................223.2 Project Approval Status ....................................................................................223.3 Project Components .........................................................................................23
3.3.1 Project Activities and infrastructure ..................................................23
4 ASSESSMENT METHODOLOGY.........................................................................................314.1 Methodology and Data Sources........................................................................31
4.1.1 Assessment Area................................................................................314.1.2 Information and Data Sources ...........................................................31
4.2 Impact Assessment ...........................................................................................324.2.1 Groundwater......................................................................................324.2.2 Surface water .....................................................................................33
4.3 Risk Assessment................................................................................................33
5 EXISITING ENVIRONMENT ...............................................................................................345.1 Topography.......................................................................................................345.2 Climate..............................................................................................................345.3 Land Use............................................................................................................37
6 HYDROLOGICAL CONTEXT AND CONCEPTUALISATION ...................................................396.1 Location and Catchment Context .....................................................................396.2 Watercourses....................................................................................................39

Santos GLNG Pty Ltd Towrie Development Area
Water Assessment Report
Page vDX70010A01
6.3 Wetlands...........................................................................................................416.4 Flood Regime ....................................................................................................446.5 Surface Water Flow...........................................................................................46
6.5.1 Watercourse Classification.................................................................466.5.2 Levels and Flow ..................................................................................46
6.6 Surface Water Quality.......................................................................................486.7 Aquatic Ecology.................................................................................................506.8 Existing Surface Water Users ............................................................................50
7 HYDROGEOLOGICAL CONTEXT AND CONCEPTUALISATION ............................................527.1 Geological Setting .............................................................................................52
7.1.1 Geological Structures .........................................................................527.2 Regional Hydrostratigraphy ..............................................................................537.3 Local Hydrogeology...........................................................................................59
7.3.1 Local Structure ...................................................................................667.4 Aquifer / Aquitard Hydraulic Properties ...........................................................677.5 Groundwater Recharge.....................................................................................697.6 Groundwater Levels and Flow ..........................................................................707.7 Groundwater Chemistry ...................................................................................807.8 Groundwater-Surface Water Interactions ........................................................837.9 Groundwater Dependent Ecosystems ..............................................................84
7.9.1 Spring Complexes...............................................................................847.9.2 Potential Terrestrial GDEs ..................................................................867.9.3 Subterranean Fauna...........................................................................90
7.10 Existing Third-Party Groundwater Users...........................................................907.10.1 Registered Groundwater Bores..........................................................907.10.2 Bore Baseline Assessment..................................................................917.10.3 Groundwater Use and Purpose..........................................................94
7.11 Conceptual Model Summary ............................................................................96
8 NUMERICAL GROUNDWATER MODELLING .....................................................................988.1 Overview...........................................................................................................988.2 Model Parameters, Boundary Conditions and Calibration .............................101
8.2.1 Model Parameters ...........................................................................1018.2.2 Groundwater Abstraction – Boundary Conditions...........................1018.2.3 Model Calibration ............................................................................102
8.3 Project Model Scenarios .................................................................................1028.4 Scenario Results ..............................................................................................1028.5 Uncertainty Analysis .......................................................................................106
9 IMPACT ASSESSMENT ....................................................................................................1079.1 Potential Project Impacts................................................................................107
9.1.1 Groundwater....................................................................................1079.1.2 Surface Water ..................................................................................108

Santos GLNG Pty Ltd Towrie Development Area
Water Assessment Report
Page viDX70010A01
9.2 Potential Impacts to Water Dependent Assets...............................................1099.2.1 Potential Impacts to Third-Party Groundwater Users......................1099.2.2 Potential Impacts to Spring Complexes ...........................................1119.2.3 Potential Impacts to Terrestrial GDEs ..............................................1119.2.4 Potential Impacts to Subterranean Fauna .......................................1149.2.5 Potential Impacts to Surface Water-Dependent Assets...................114
9.3 Potential Impacts from Subsidence ................................................................1149.4 Potential Cumulative Impacts .........................................................................1159.5 Risk Assessment..............................................................................................117
10 MITIGATION, MANAGEMENT AND MONITORING.........................................................12110.1 Production Wells and General Project Activities ............................................12110.2 Water Production ...........................................................................................123
10.2.1 Production Well monitoring.............................................................12310.2.2 Groundwater Monitoring.................................................................12310.2.3 Surface Water Monitoring ...............................................................12310.2.4 Bore Impact Management Measures ..............................................12410.2.5 Water Management.........................................................................124
10.3 Other Environmental Management Practices ................................................12410.4 Reporting ........................................................................................................125
11 ASSESSMENT AGAINST THE SIGNIGICANT IMPACT CRITERIA ........................................126
12 CLOSING.........................................................................................................................130
REFERENCES...............................................................................................................................131
List of Tables
Table 1.1 IESC Checklist and Sections Addressed in this Report ..........................................5Table 2.1 Environmental Values for the Comet River Sub-Basin waters within the vicinity
of the Project area (State of Queensland 2013a; 2013b; 2013c) .......................20Table 2.2 Draft Environmental Values for the Fitzroy Basin Groundwater within the
vicinity of the Project area (State of Queensland 2018f; 2018g; 2018h; 2018i; 2018a).................................................................................................................20
Table 3.1 Median Produced Water Quality........................................................................25Table 5.1 Climate Statistics for Injune and Rolleston, Site Numbers 43015 and 035059
(BOM 2020b; 2020c) ..........................................................................................34Table 5.2 Summary of the Current Land Use within the Project Development Area ........37Table 6.1 Stream Order Classification................................................................................39Table 6.2 Summary of Surface Water Gauges (Open and Closed) .....................................46Table 6.3 Summary of Surface Water Quality for Brown River (Brown River at Lake
Brown– 130502B)...............................................................................................48Table 6.4 Flow Management Locations for Water Allocation (DNRM 2015) .....................50Table 6.5 Summary of Surface Water Users in the Vicinity of the Project.........................51Table 7.1 Stratigraphic column for the Project area (OGIA 2019c)....................................56

Santos GLNG Pty Ltd Towrie Development Area
Water Assessment Report
Page viiDX70010A01
Table 7.2 Summary of Hydraulic Properties for Hydrostratigraphic Units in the Towrie Development Area .............................................................................................69
Table 7.3 Surat CMA Groundwater Chemistry Summary (sourced from OGIA 2019c)......80Table 7.4 Details of Spring Complexes in the Vicinity of the Project (Queensland
Herbarium 2019) ................................................................................................86Table 7.5 GWDB Registered Bore Statistics for the Towrie Development Area and a 25 km
Buffer (DNRME 2019a) .......................................................................................90Table 7.6 Baseline Assessment Plan...................................................................................92Table 7.7 Aquifer Attribution and Number of Water Supply Bores ...................................94Table 8.1 Summary of the OGIA Regional Groundwater Flow Model (after OGIA 2019c) 98Table 9.1 Summary of the Drawdown Predictions for Groundwater Bores ....................109Table 9.2 Summary of TGDE Coinciding Regional Ecosystem Mapping (Queensland
Herbarium 2016) ..............................................................................................112Table 9.3 Likelihood of Risk (Criteria) ..............................................................................117Table 9.4 Consequence of Risk (Criteria) .........................................................................117Table 9.5 Significance of Risk (Criteria) ...........................................................................117Table 9.6 Risk Assessment Results ...................................................................................119Table 11.1 Summary of Potential Impacts Against the Significant Impact Criteria 1.3,
Changes to Hydrological Characteristics (DoEE 2013b)....................................127Table 11.2 Summary of Potential Impacts Against the Significant Impact Criteria 1.4,
Changes to Water Quality (DoEE 2013c) ..........................................................128
List of Figures
Figure 1.2 Project Location....................................................................................................2Figure 3.1 Predicted Water Production Rate ......................................................................24Figure 3.2 Predicted Annual Water Production and Cumulative Volume...........................25Figure 3.3 Produced Water Process Flow Diagram .............................................................26Figure 5.1 Topography Within the Vicinity of the Project area...........................................35Figure 5.2 Daily Rainfall and Rainfall Excess / Deficit Trend (Rolleston #035059) ..............36Figure 5.3 Project area Current Land Use ...........................................................................38Figure 6.1 Watercourses in the Vicinity of the Project area................................................40Figure 6.2 Location of Wetlands Within Proximity to the Project.......................................42Figure 6.3 Location of Lacustrine and Palustrine Wetlands ................................................43Figure 6.4 Floodplain Assessment Overlay – Flood Extent for 1% AEP ...............................45Figure 6.5 Monthly Mean Daily Discharge at Brown river at Lake Brown (130502B), 1984
to 2020 ...............................................................................................................47Figure 6.6 Stage Height at Brown River at Lake Brown (130502B), Downstream of the
Project area ........................................................................................................47Figure 6.7 Cumulative Exceedance Probability for Recorded Daily Discharge at Brown
River (130502B – Brown River at Lake Brown)...................................................48Figure 6.8 EC at Brown River at Lake Brown (130502B)......................................................49Figure 6.9 Piper and Durov Diagram for Surface Water Samples from Brown River at Lake
Brown (130502B)................................................................................................50Figure 7.1 Surface Geology in Proximity to the Project (State Surface Geology (DNRME
2015)) .................................................................................................................54

Santos GLNG Pty Ltd Towrie Development Area
Water Assessment Report
Page viiiDX70010A01
Figure 7.2 Solid Geology in Proximity to the Project (Solid Geology (Bowen Basin) (DEEDI 2011)) .................................................................................................................55
Figure 7.3 North-South Oriented Cross Section ..................................................................61Figure 7.4 West-East Oriented Cross Section......................................................................62Figure 7.5 Location of Mapped Alluvium ............................................................................64Figure 7.6 Isopachs of Rewan Group and Bandanna Formation (DNRME 2019a) ..............65Figure 7.7 Seismic Survey – Northern Survey Section.........................................................66Figure 7.8 Seismic Survey – Central-Northern Survey Section ............................................66Figure 7.9 Seismic Survey – Southern Survey Section.........................................................67Figure 7.10 UWIR Hydraulic Conductivity Estimations (OGIA 2019c) ...................................68Figure 7.11 Location of Bores in the Vicinity of the Project ..................................................71Figure 7.12 Alluvium Groundwater Elevation Hydrograph (RN62791) .................................72Figure 7.13 Alluvium Groundwater Elevation (GWDB Data).................................................73Figure 7.14 Precipice Sandstone Groundwater Elevation Hydrograph (RN123453).............74Figure 7.15 Precipice Sandstone Groundwater Elevation (GWDB Data)...............................75Figure 7.16 Rewan Group Groundwater Elevation Hydrograph ...........................................76Figure 7.17 Rewan Group Groundwater Elevation (GWDB Data) .........................................77Figure 7.18 Bandanna Formation Groundwater Elevation Hydrograph (RN160817) ...........78Figure 7.19 Bandanna Formation Groundwater Elevation (GWDB Data) .............................79Figure 7.20 GWDB Bores with Chemistry Data .....................................................................81Figure 7.21 Piper and Durov Diagram – Alluvium .................................................................82Figure 7.22 Piper and Durov Diagram – Precipice Sandstone ...............................................82Figure 7.23 Piper and Durov Diagram – Clematis Sandstone................................................83Figure 7.24 Piper and Durov Diagram – Rewan Group..........................................................83Figure 7.25 Location of Springs Vent / Complexes in Vicinity of the Project area ................85Figure 7.26 Location of Potential Terrestrial GDEs in the Vicinity of the Project area..........88Figure 7.27 Potential Terrestrial GDEs by Rule Set and Depth to Groundwater (GWDB) .....89Figure 7.28 Location of Bores within the Project area and Bores Prior Baseline Assessment
............................................................................................................................93Figure 7.29 Location of Existing ‘Water Supply’ Bores and Attributed Aquifer (OGIA
Dataset) ..............................................................................................................95Figure 7.30 Conceptual Model of Towrie Development Area (not to scale).........................97Figure 8.1 Location of the Surat CMA Regional Flow Model Domain and the Project area99Figure 8.2 Model Layers and Corresponding Hydrostratigraphic Units Represented in the
OGIA Regional Groundwater Flow Model (after OGIA 2019c) .........................100Figure 8.3 Maximum Drawdown Pattern for Model Layers 1, and 24 to 28 – Alluvium /
Quaternary-Tertiary Unit and Moolayember Formation to Upper Bandanna Formation.........................................................................................................104
Figure 8.4 Maximum Drawdown Pattern for Model Layers 29 and 32 – Lower Bandanna Formation to Upper Cattle Creek Formation ...................................................105
Figure 9.1 Location of Bandanna Formation Bore (RN22182) Predicted to have an induced drawdown in the Vicinity of the Project...........................................................110
Figure 9.2 Regional Ecosystem Mapping in the vicinity of Rewan Group Outcrop and the Dawson River....................................................................................................113
Figure 9.3 Predicted Cumulative Drawdown in Bandanna Formation ..............................116

Santos GLNG Pty Ltd Towrie Development Area
Water Assessment Report
Page ixDX70010A01
List of Appendices
Appendix I Stimulation Impact Monitoring Program (SIMP)
Appendix II UWIR Model Parameters
Appendix III Predicted Drawdown Extent – Project Scenario
Appendix IV Modelled Groundwater Elevation Contours
Appendix V Uncertainty Analysis Results

Santos GLNG Pty Ltd Towrie Development Area
Water Assessment Report
Page 1DX70010A01 May 2021
1 INTRODUCTION
KCB Australia Pty Ltd (KCB) has been commissioned by Santos Ltd (Santos), to undertake an assessment of potential water-related impacts of proposed gas production associated with the Towrie Development Area (the Project).
The objective of this report is to assess the potential impact to water resources and water-dependent assets under the Environment Protection and Biodiversity Conservation Act 1999 (EPBC Act) (Commonwealth of Australia 2018) as a result of the proposed activities associated with the Project. This assessment is conducted with reference to the following guidelines:
Significant impact criteria provided in ‘Significant impact guidelines 1.3: Coal seam gas and large coal mining developments – impacts on water resources’ (DoEE 2013b) (Section 2.1.1);
‘Significant impact guidelines 1.1: Matters of National Environmental Significance’ (DoEE 2013a) (Section 2.1.1); and
The Independent Expert Scientific Committee on Coal Seam Gas and Large Coal Mining Developments (IESC) ‘Information guidelines for proponents preparing coal seam gas and large coal mining development proposals’ (IESC 2018b).
This assessment was prepared to accompany Santos’ EPBC Act 1999 Referral for the Project to the Commonwealth of Australia’s Department of Agriculture, Water and the Environment (DAWE).
1.1 Project Overview
The Project is located approximately 90 km south of the township of Rolleston, as shown in Figure 1.1, and located on Petroleum Lease (PL) 1059, which is under application at the time of writing. PL 1059 will replace all sub-blocks of Authority to Prospect (ATP) 2033, the underlying tenure.
The gas target for the Project is the Bandanna Formation, of the Permo-Triassic Bowen Basin.
Gas production activities are planned to commence in mid-2022 (pending approval). The Project will involve the progressive development of gas infrastructure including the following activities:
116 gas production wells;
Ancillary linear infrastructure including gas and water gathering/pipelines, access tracks, power lines, and communication lines; and
Other ancillary activities and facilities including laydown, stockpile and storage areas, camp site with associated treated effluent irrigation area, and tanks for the temporary storage of water, to support the Towrie development.

Santos GLNG Pty Ltd Towrie Development Area
Water Assessment Report
Page 2DX70010A01 May 2021
Figure 1.1 Project Location
ROMAMILES
DALBY
MOONIE
INJUNE
WANDOAN
EMERALD
TOOWOOMBA
ST GEORGE
ROLLESTON
GLADSTONE
CHINCHILLA
BLACKWATER
ROCKHAMPTON
148 150 152-2
8-2
6-2
4
0 50 100 150 200
km
PROJECTION1. Horizontal Datum: GDA94 2. Vertical Datum: Mean Sea Level3. Scale: 1:4,500,000
Town
Principal Road
Towrie Development Area
Petroleum Lease
Surat Cumulative Managment Area
NOTES: 1. Topographic features sourced GEODATA TOPO 250k series 3 Geoscience Australia2. Surat CMA boundary sourced from QSpatial, State of Queensland (2011)3. Project Boundary (ATP 1191) sourced from DNRME, 2018
3/04/2
020,
NCo
etze
e, \\in
t.kloh
n.com
\Pro
jData
\D\B
NE\D
X700
10A0
1 - To
wrie
GW A
sses
smen
t\400
Dra
wing
s\Iss
ued\F
IG_X
_Tow
rieLo
catio
n.mxd
Towrie Development Area
BRISBANE

Santos GLNG Pty Ltd Towrie Development Area
Water Assessment Report
Page 3DX70010A01 May 2021
1.2 Report Structure
This report has been prepared to accompany the Santos Project EPBC Act 1999 Referral to be submitted to the Department of Agriculture, Water and the Environment (DAWE) and the IESC (if deemed required). This report is structured to include:
Section 1: Introduction to the Project, report purpose, and structure.
Section 2: Statutory Context, including an overview of the relevant Commonwealth and Queensland legislation related to water and gas development/ production.
Section 3: Proposal Description.
Section 4: Assessment Methodology, including the existing environment and environmental values, and impact assessment.
Section 5: Existing Environment, including a review of the topography, climate, and land use.
Section 6: Hydrological Context and Conceptualisation.
Section 7: Hydrogeological Context and Conceptualisation.
Section 8: Numerical Groundwater Modelling, including predicted extent of drawdown.
Section 9: Impact Assessment.
Section 10: Mitigation, Management, and Monitoring.
Section 11: Assessment against the Significant Impact Criteria.
1.2.1 IESC Checklist
The IESC is a statutory body under the EPBC Act (Commonwealth of Australia 2018). The IESC’s key function is to provide scientific advice to the Commonwealth Environment Minister and relevant state ministers in relation to coal seam gas (CSG) or large coal mining development proposals that are likely to have a significant impact on water resources.
To allow the IESC to provide robust scientific advice to government regulators on water-related impacts of CSG, an information guideline (IESC 2018a) has been developed outlining the information considered necessary for the IESC to undertake the relevant assessment. Table 1.1 provides the information checklist and the relevant sections of this report that address each checklist item. It should be noted that some items in the guideline are not required for this Project, which include: Final landform and voids – coal mines and Acid-forming materials and other contaminants of concern. Some checklist items are also addressed in supporting reports as indicated in the table.
This assessment has been undertaken using the Office of Groundwater Impact Assessment’s (OGIA) assessment and associated modelling tools to identify project specific risks and impacts and to make reference to cumulative assessment and management in the Surat Cumulative Management Area (CMA) Underground Water Impact Report (UWIR) (OGIA 2019c) (further detail is provided in Section 2.2.2).
The IESC published a fact sheet in 2019 (IESC 2019), which outlines considerations related to using OGIA’s outputs for environmental assessments. Consideration has been given to the information detailed in the fact sheet during the preparation of this assessment.

Santos GLNG Pty Ltd Towrie Development Area
Water Assessment Report
Page 4DX70010A01 May 2021
A risk assessment of chemicals proposed to be used in gas activities has been completed separately to this water assessment report by EHS Support (2021). The chemical risk assessment summarised the proposed chemicals to be used for drilling fluids and treatments of produced water. Potential water-related impacts associated with chemicals as part of the project have not been included in the report and are addressed in the chemical risk assessment report. However, the risk assessment outcome identifies that there will be no risk of adverse impact to MNES and that a minimum of 90 m buffer will be applied to water bores.

Santos GLNG Pty Ltd Towrie Development Area
Water Assessment Report
Page 5DX70010A01 May 2021
Table 1.1 IESC Checklist and Sections Addressed in this Report
Checklist Title Checklist Item Section Addressed
Description of the ProposalProvide a regional overview of the proposed Project area including: a description of the geological basin; coal resource; surface water catchments; groundwater systems; water-dependent assets; and past, present and reasonably foreseeable coal mining and CSG developments. Section 3.1
Describe the proposal’s location, purpose, scale, duration, disturbance area, and the means by which it is likely to have a significant impact on water resources and water-dependent assets. Section 3
Describe the statutory context, including information on the proposal’s status within the regulatory assessment process and any applicable water management policies or regulations.
Sections 2 and 3.2
Description of the Proposal
Describe how impacted water resources are currently being regulated under state or Commonwealth law, including whether there are any applicable standard conditions. Section 2
Risk AssessmentIdentify and assess all potential environmental risks to water resources and water-related assets, and their possible impacts. In selecting a risk assessment approach consideration should be given to the complexity of the project, and the probability and potential consequences of risks.Incorporate causal mechanisms and pathways identified in the risk assessment in conceptual and numerical modelling. Use the results of these models to update the risk assessment.Assess risks following the implementation of any proposed mitigation and management options to determine if these will reduce risks to an acceptable level based on the identified environmental objectives.
Risk Assessment
The risk assessment should include an assessment of:- all potential cumulative impacts which could affect water resources and water-related assets; and - mitigation and management options which the proponent could implement to reduce these impacts.
Sections 4.3 9.5 and 11
GroundwaterDescribe and map geology at an appropriate level of horizontal and vertical resolution including: - definition of the geological sequence(s) in the area, with names and descriptions of the formations and accompanying surface geology, cross-sections and any relevant field data.- geological maps appropriately annotated with symbols that denote fault type, throw and the parts of sequences the faults intersect or displace.Provide data to demonstrate the varying depths to the hydrogeological units and associated standing water levels or potentiometric heads, including direction of groundwater flow, contour maps, and hydrographs. All boreholes used to provide this data should have been surveyed.Define and describe or characterise significant geological structures (e.g. faults, folds, intrusives) and associated fracturing in the area and their influence on groundwater – particularly groundwater flow, discharge or recharge. - Site-specific studies (e.g. geophysical, coring / wireline logging etc.) should give consideration to characterising and detailing the local stress regime and fault structure (e.g. damage zone size, open/closed along fault plane, presence of clay/shale smear, fault jogs or splays).- Discussion on how this fits into the fault’s potential influence on regional-scale groundwater conditions should also be included.
Context and Conceptualisation
Provide hydrochemical (e.g. acidity/alkalinity, electrical conductivity, metals, and major ions) and environmental tracer (e.g. stable isotopes of water, tritium, helium, strontium isotopes, etc.) characterisation to identify sources of water, recharge rates, transit times in aquifers, connectivity between geological units and groundwater discharge locations.
Section 7
Santos GLNG Pty Ltd Towrie Development Area
Water Assessment Report
Page 6DX70010A01 May 2021
Checklist Title Checklist Item Section Addressed
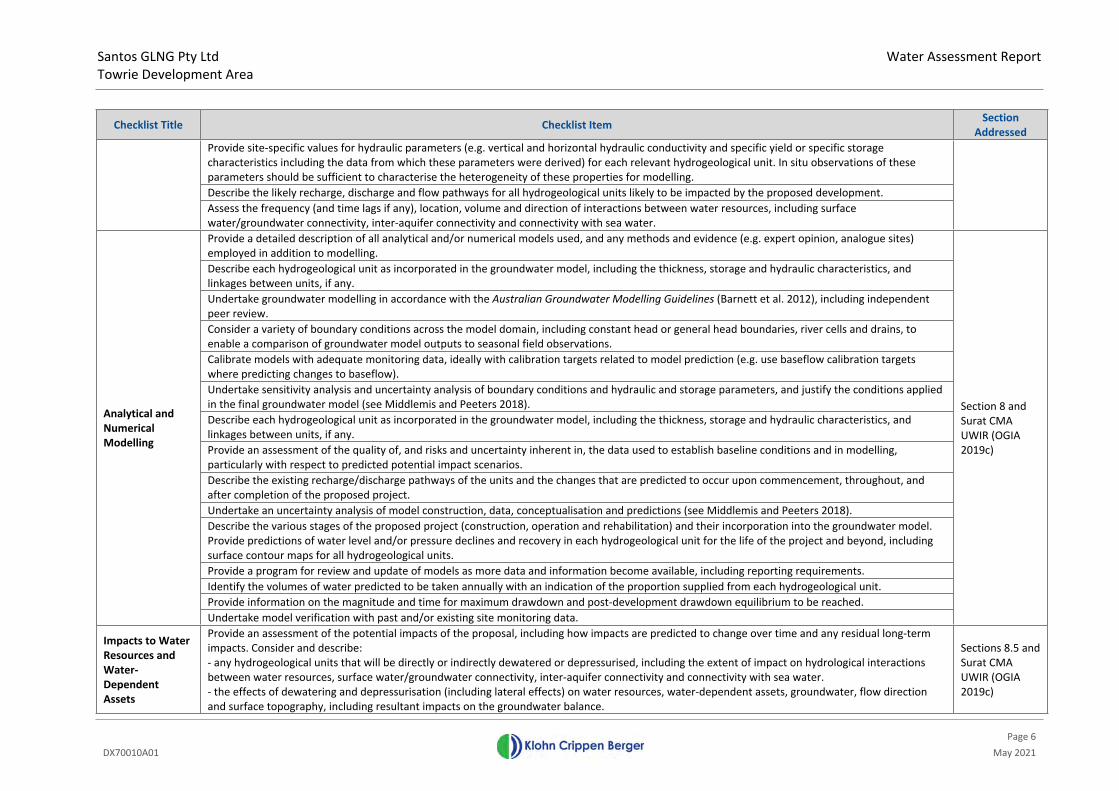
Provide site-specific values for hydraulic parameters (e.g. vertical and horizontal hydraulic conductivity and specific yield or specific storage characteristics including the data from which these parameters were derived) for each relevant hydrogeological unit. In situ observations of these parameters should be sufficient to characterise the heterogeneity of these properties for modelling.Describe the likely recharge, discharge and flow pathways for all hydrogeological units likely to be impacted by the proposed development.Assess the frequency (and time lags if any), location, volume and direction of interactions between water resources, including surface water/groundwater connectivity, inter-aquifer connectivity and connectivity with sea water.Provide a detailed description of all analytical and/or numerical models used, and any methods and evidence (e.g. expert opinion, analogue sites) employed in addition to modelling.Describe each hydrogeological unit as incorporated in the groundwater model, including the thickness, storage and hydraulic characteristics, and linkages between units, if any.Undertake groundwater modelling in accordance with the Australian Groundwater Modelling Guidelines (Barnett et al. 2012), including independent peer review.Consider a variety of boundary conditions across the model domain, including constant head or general head boundaries, river cells and drains, to enable a comparison of groundwater model outputs to seasonal field observations.Calibrate models with adequate monitoring data, ideally with calibration targets related to model prediction (e.g. use baseflow calibration targets where predicting changes to baseflow).Undertake sensitivity analysis and uncertainty analysis of boundary conditions and hydraulic and storage parameters, and justify the conditions applied in the final groundwater model (see Middlemis and Peeters 2018).Describe each hydrogeological unit as incorporated in the groundwater model, including the thickness, storage and hydraulic characteristics, and linkages between units, if any.Provide an assessment of the quality of, and risks and uncertainty inherent in, the data used to establish baseline conditions and in modelling, particularly with respect to predicted potential impact scenarios.Describe the existing recharge/discharge pathways of the units and the changes that are predicted to occur upon commencement, throughout, and after completion of the proposed project.Undertake an uncertainty analysis of model construction, data, conceptualisation and predictions (see Middlemis and Peeters 2018).Describe the various stages of the proposed project (construction, operation and rehabilitation) and their incorporation into the groundwater model. Provide predictions of water level and/or pressure declines and recovery in each hydrogeological unit for the life of the project and beyond, including surface contour maps for all hydrogeological units.Provide a program for review and update of models as more data and information become available, including reporting requirements. Identify the volumes of water predicted to be taken annually with an indication of the proportion supplied from each hydrogeological unit.Provide information on the magnitude and time for maximum drawdown and post-development drawdown equilibrium to be reached.
Analytical and Numerical Modelling
Undertake model verification with past and/or existing site monitoring data.
Section 8 and Surat CMA UWIR (OGIA 2019c)
Impacts to Water Resources and Water-Dependent Assets
Provide an assessment of the potential impacts of the proposal, including how impacts are predicted to change over time and any residual long-term impacts. Consider and describe:- any hydrogeological units that will be directly or indirectly dewatered or depressurised, including the extent of impact on hydrological interactions between water resources, surface water/groundwater connectivity, inter-aquifer connectivity and connectivity with sea water.- the effects of dewatering and depressurisation (including lateral effects) on water resources, water-dependent assets, groundwater, flow direction and surface topography, including resultant impacts on the groundwater balance.
Sections 8.5 and Surat CMA UWIR (OGIA 2019c)

Santos GLNG Pty Ltd Towrie Development Area
Water Assessment Report
Page 7DX70010A01 May 2021
Checklist Title Checklist Item Section Addressed
- the potential impacts on hydraulic and storage properties of hydrogeological units, including changes in storage, potential for physical transmission of water within and between units, and estimates of likelihood of leakage of contaminants through hydrogeological units.- the possible fracturing of and other damage to confining layers.- For each relevant hydrogeological unit, the proportional increase in groundwater use and impacts as a consequence of the proposed project, including an assessment of any consequential increase in demand for groundwater from towns or other industries resulting from associated population or economic growth due to the proposal.Describe the water resources and water-dependent assets that will be directly impacted by mining or CSG operations, including hydrogeological units that will be exposed/partially removed by open cut mining and/or underground mining. Sections 6 and 7
For each potentially impacted water resource, provide a clear description of the impact to the resource, the resultant impact to any water-dependent assets dependent on the resource, and the consequence or significance of the impact. Section 9
Describe existing water quality guidelines, environmental flow objectives and other requirements (e.g. water planning rules) for the groundwater basin(s) within which the development proposal is based. Section 2
Provide an assessment of the cumulative impact of the proposal on groundwater when all developments (past, present and/or reasonably foreseeable) are considered in combination Section 9.4
Provide a description and assessment of the adequacy of proposed measures to prevent / minimise impacts on water resources and water-dependent assets. Section 10
Provide sufficient data on physical aquifer parameters and hydrogeochemistry to establish pre-development conditions, including fluctuations in groundwater levels at time intervals relevant to aquifer processes. Section 7
Provide long-term groundwater monitoring data, including a comprehensive assessment of all relevant chemical parameters to inform changes in groundwater quality and detect potential contamination events. Section 7
Develop and describe a robust groundwater monitoring program using dedicated groundwater monitoring wells – including nested arrays where there may be connectivity between hydrogeological units – and targeting specific aquifers, providing an understanding of the groundwater regime, recharge and discharge processes and identifying changes over time.
Section 10
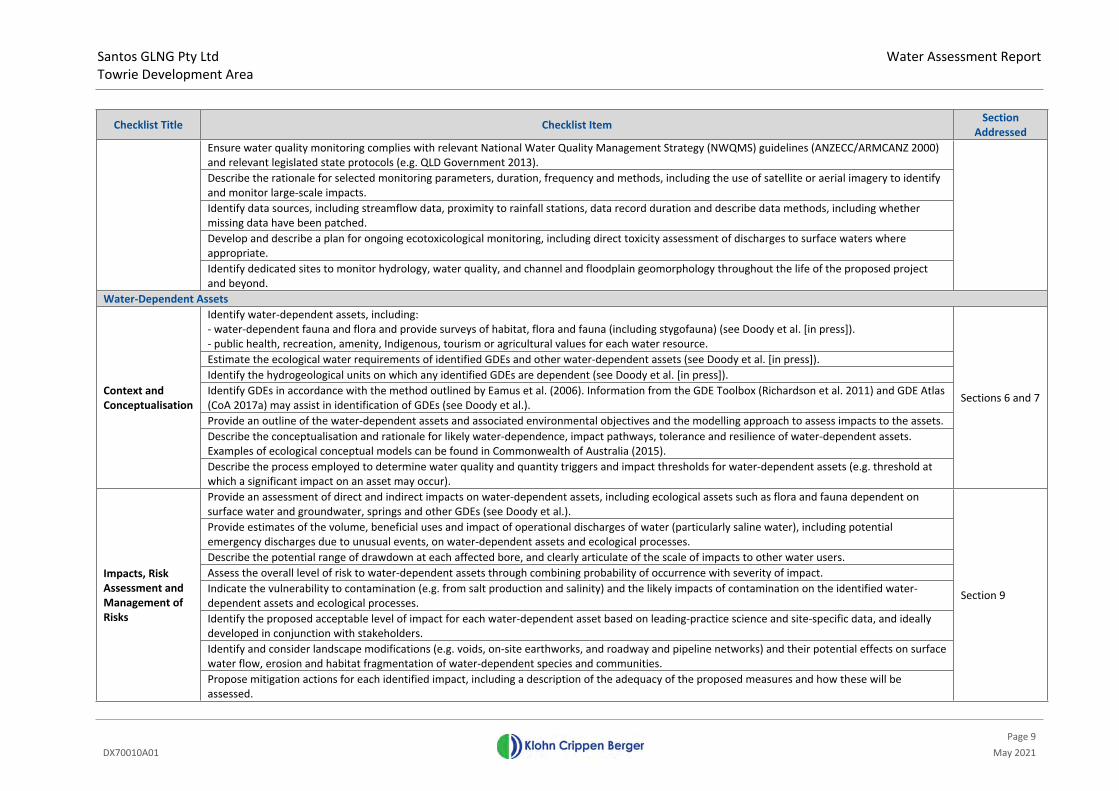
Ensure water quality monitoring complies with relevant National Water Quality Management Strategy (NWQMS) guidelines (ANZECC/ARMCANZ 2000) and relevant legislated state protocols (e.g. QLD Government 2013). Section 10
Data and Monitoring
Develop and describe proposed targeted field programs to address key areas of uncertainty, such as the hydraulic connectivity between geological formations, the sources of groundwater sustaining GDEs, the hydraulic properties of significant faults, fracture networks and aquitards in the impacted system, etc., where appropriate.
Section 10
Surface WaterDescribe the hydrological regime of all watercourses, standing waters and springs across the site including:- geomorphology, including drainage patterns, sediment regime and floodplain features;- spatial, temporal and seasonal trends in streamflow and/or standing water levels;- spatial, temporal and seasonal trends in water quality data (such as turbidity, acidity, salinity, relevant organic chemicals, metals, metalloids and radionuclides); and- current stressors on watercourses, including impacts from any currently approved projects.
Context and Conceptualisation
Describe the existing flood regime, including flood volume, depth, duration, extent and velocity for a range of annual exceedance probabilities. Provide flood hydrographs and maps identifying peak flood extent, depth and velocity. This assessment should be informed by topographic data that has been acquired using lidar or other reliable survey methods with accuracy stated.
Section 6

Santos GLNG Pty Ltd Towrie Development Area
Water Assessment Report
Page 8DX70010A01 May 2021
Checklist Title Checklist Item Section Addressed
Provide an assessment of the frequency, volume, seasonal variability and direction of interactions between water resources, including surface water/ groundwater connectivity and connectivity with sea water.Provide conceptual models at an appropriate scale, including water quality, stores, flows and use of water by ecosystems.Describe and justify model assumptions and limitations and calibrate with appropriate surface water monitoring data.Use methods in accordance with the most recent publication of Australian Rainfall and Runoff (Ball et al. 2016).Provide an assessment of the risks and uncertainty inherent in the data used in the modelling, particularly with respect to predicted scenarios.Develop and describe a program for review and update of the models as more data and information becomes available.
Analytical and Numerical Modelling
Provide a detailed description of any methods and evidence (e.g. expert opinion, analogue sites) employed in addition to modelling.
Section 4.2.2
Describe all potential impacts of the proposed project on surface waters. Include a clear description of the impact to the resource, the resultant impact to any assets dependent on the resource (including water-dependent ecosystems such as riparian zones and floodplains), and the consequence or significance of the impact. Consider:- impacts on streamflow under the full range of flow conditions.- impacts associated with surface water diversions.- impacts to water quality, including consideration of mixing zones.- the quality, quantity and ecotoxicological effects of operational discharges of water (including saline water), including potential emergency discharges, and the likely impacts on water resources and water-dependent assets.- landscape modifications such as subsidence, voids, post rehabilitation landform collapses, on-site earthworks (including disturbance of acid-forming or sodic soils, roadway and pipeline networks) and how these could affect surface water flow, surface water quality, erosion, sedimentation and habitat fragmentation of water-dependent species and communities.
Section 9
Discuss existing water quality guidelines, environmental flow objectives and requirements for the surface water catchment(s) within which the development proposal is based. Section 2
Identify processes to determine surface water quality guidelines and quantity thresholds which incorporate seasonal variation but provide early indication of potential impacts to assets.Propose mitigation actions for each identified significant impact.Describe the adequacy of proposed measures to prevent or minimise impacts on water resources and water-dependent assets.Describe the cumulative impact of the proposal on surface water resources and water-dependent assets when all developments (past, present and reasonably foreseeable) are considered in combination.
Impacts to Water Resources and Water-Dependent Assets
Provide an assessment of the risks of flooding (including channel form and stability, water level, depth, extent, velocity, shear stress and stream power), and impacts to ecosystems, project infrastructure and the final project landform.Identify monitoring sites representative of the diversity of potentially affected water-dependent assets and the nature and scale of potential impacts, and match with suitable replicated control and reference sites (BACI design) to enable detection and monitoring of potential impacts.
Data and Monitoring
Develop and describe a surface water monitoring program that will collect sufficient data to detect and identify the cause of any changes from established baseline conditions and assess the effectiveness of mitigation and management measures. The program will:- include baseline monitoring data for physico-chemical parameters, as well as contaminants (e.g. metals); - comparison of physico-chemical data to national/regional guidelines or to site-specific guidelines derived from reference condition monitoring if available; and - identify baseline contaminant concentrations and compare these to national guidelines, allowing for local background correction if required.
Section 4.2.2
Santos GLNG Pty Ltd Towrie Development Area
Water Assessment Report
Page 9DX70010A01 May 2021
Checklist Title Checklist Item Section Addressed
Ensure water quality monitoring complies with relevant National Water Quality Management Strategy (NWQMS) guidelines (ANZECC/ARMCANZ 2000) and relevant legislated state protocols (e.g. QLD Government 2013).Describe the rationale for selected monitoring parameters, duration, frequency and methods, including the use of satellite or aerial imagery to identify and monitor large-scale impacts.Identify data sources, including streamflow data, proximity to rainfall stations, data record duration and describe data methods, including whether missing data have been patched.Develop and describe a plan for ongoing ecotoxicological monitoring, including direct toxicity assessment of discharges to surface waters where appropriate.Identify dedicated sites to monitor hydrology, water quality, and channel and floodplain geomorphology throughout the life of the proposed project and beyond.
Water-Dependent AssetsIdentify water-dependent assets, including: - water-dependent fauna and flora and provide surveys of habitat, flora and fauna (including stygofauna) (see Doody et al. [in press]).- public health, recreation, amenity, Indigenous, tourism or agricultural values for each water resource.Estimate the ecological water requirements of identified GDEs and other water-dependent assets (see Doody et al. [in press]).Identify the hydrogeological units on which any identified GDEs are dependent (see Doody et al. [in press]).Identify GDEs in accordance with the method outlined by Eamus et al. (2006). Information from the GDE Toolbox (Richardson et al. 2011) and GDE Atlas (CoA 2017a) may assist in identification of GDEs (see Doody et al.).Provide an outline of the water-dependent assets and associated environmental objectives and the modelling approach to assess impacts to the assets.Describe the conceptualisation and rationale for likely water-dependence, impact pathways, tolerance and resilience of water-dependent assets. Examples of ecological conceptual models can be found in Commonwealth of Australia (2015).
Context and Conceptualisation
Describe the process employed to determine water quality and quantity triggers and impact thresholds for water-dependent assets (e.g. threshold at which a significant impact on an asset may occur).
Sections 6 and 7
Provide an assessment of direct and indirect impacts on water-dependent assets, including ecological assets such as flora and fauna dependent on surface water and groundwater, springs and other GDEs (see Doody et al.).Provide estimates of the volume, beneficial uses and impact of operational discharges of water (particularly saline water), including potential emergency discharges due to unusual events, on water-dependent assets and ecological processes.Describe the potential range of drawdown at each affected bore, and clearly articulate of the scale of impacts to other water users.Assess the overall level of risk to water-dependent assets through combining probability of occurrence with severity of impact.Indicate the vulnerability to contamination (e.g. from salt production and salinity) and the likely impacts of contamination on the identified water-dependent assets and ecological processes.Identify the proposed acceptable level of impact for each water-dependent asset based on leading-practice science and site-specific data, and ideally developed in conjunction with stakeholders.Identify and consider landscape modifications (e.g. voids, on-site earthworks, and roadway and pipeline networks) and their potential effects on surface water flow, erosion and habitat fragmentation of water-dependent species and communities.
Impacts, Risk Assessment and Management of Risks
Propose mitigation actions for each identified impact, including a description of the adequacy of the proposed measures and how these will be assessed.
Section 9

Santos GLNG Pty Ltd Towrie Development Area
Water Assessment Report
Page 10DX70010A01 May 2021
Checklist Title Checklist Item Section Addressed
Identify an appropriate sampling frequency and spatial coverage of monitoring sites to establish pre-development (baseline) conditions and test potential responses to impacts of the proposal (see Doody et al.).Develop and describe a monitoring program that identifies impacts, evaluates the effectiveness of impact prevention or mitigation strategies, measures trends in ecological responses and detects whether ecological responses are within identified thresholds of acceptable change (see Doody et al. [in press]).Consider concurrent baseline monitoring from unimpacted control and reference sites to distinguish impacts from background variation in the region (e.g. BACI design, see Doody et al. [in press]).Describe the proposed process for regular reporting, review and revisions to the monitoring program.
Data and Monitoring
Ensure ecological monitoring complies with relevant state or national monitoring guidelines (e.g. the DSITI guideline for sampling stygofauna (QLD Government 2015)).
Section 10
Water and Salt Balance, and Water QualityProvide a quantitative site water balance model describing the total water supply and demand under a range of rainfall conditions and allocation of water for mining activities (e.g. dust suppression, coal washing etc.), including all sources and uses.Provide estimates of the quality and quantity of operational discharges under dry, median and wet conditions, potential emergency discharges due to unusual events and the likely impacts on water-dependent assets.Describe the water requirements and on-site water management infrastructure, including modelling to demonstrate adequacy under a range of potential climatic conditions.
Water and Salt Balance, and Water Quality
Provide salt balance modelling that includes stores and the movement of salt between stores and takes into account seasonal and long-term variation.
Section 3.3.1.2
Cumulative ImpactsProvide cumulative impact analysis with sufficient geographic and temporal boundaries to include all potentially significant water-related impacts.
Context and Conceptualisation
Consider all past, present and reasonably foreseeable actions, including development proposals, programs and policies that are likely to impact on the water resources of concern in the cumulative impact analysis. Where a proposed project is located within the area of a bioregional assessment consider the results of the bioregional assessment.Provide an assessment of the condition of affected water resources which includes:- identification of all water resources likely to be cumulatively impacted by the proposed development;- a description of the current condition and quality of water resources and information on condition trends; - identification of ecological characteristics, processes, conditions, trends and values of water resources; - adequate water and salt balances; and - identification of potential thresholds for each water resource and its likely response to change and capacity to withstand adverse impacts (e.g. altered water quality, drawdown).
Impacts Assess the cumulative impacts to water resources considering:- the full extent of potential impacts from the proposed project, (including whether there are alternative options for infrastructure and mine configurations which could reduce impacts), and encompassing all linkages, including both direct and indirect links, operating upstream, downstream, vertically and laterally;- all stages of the development, including exploration, operations and post closure / decommissioning;- appropriately robust, repeatable and transparent methods;- the likely spatial magnitude and timeframe over which impacts will occur, and significance of cumulative impacts; and - opportunities to work with other water users to avoid, minimise or mitigate potential cumulative impacts.
Section 9 and Surat CMA UWIR (OGIA 2019c)

Santos GLNG Pty Ltd Towrie Development Area
Water Assessment Report
Page 11DX70010A01 May 2021
Checklist Title Checklist Item Section Addressed
Identify modifications or alternatives to avoid, minimise or mitigate potential cumulative impacts. Evidence of the likely success of these measures (e.g. case studies) should be provided.Identify cumulative impact environmental objectives.Identify measures to detect and monitor cumulative impacts, pre and post development, and assess the success of mitigation strategies.Describe appropriate reporting mechanisms.
Mitigation, Monitoring and Management
Propose adaptive management measures and management responses.Subsidence – Underground Coal Mines and Coal Seam Gas
Provide predictions of subsidence impact on surface topography, water-dependent assets, groundwater (including enhanced connectivity between aquifers) and the movement of water across the landscape (See CoA 2014b; CoA 2014c). Consider multiple methods of predictions and apply the most appropriate method. Consider the limitations of each method including the adequacy of empirical data and site-specific geological conditions and justify the selected method. Describe subsidence monitoring methods, including the use of remote or on-ground techniques and explain the predicted accuracy of such techniques.Provide an assessment of both conventional and unconventional subsidence. For project expansions, an evaluation of past or current effects of geological structures on subsidence and implications for water resources and water-dependent assets should be provided.
Subsidence – Underground Coal Mines and Coal Seam Gas
Consider geological strata and their properties (strength/hardness/fracture propagation) in the subsidence analysis and/or modelling. Anomalous and near-surface ground movements with implications for water resources and compaction of unconsolidated sediment should also be considered.
Section 9.3
CSG Well Construction and OperationDescribe the scale of fracturing (number of wells, number of fracturing events per well), types of wells to be stimulated (vertical versus horizontal), and other forms of well stimulation (cavitation, acid flushing).Describe proposed measuring and monitoring of fracture propagation.Identify water source for drilling and hydraulic stimulation and outline the volume of fluid and mass balance (quantities/volumes).Describe the rules (e.g. water sharing plans) covering access to each water source used for drilling and hydraulic stimulation and how the project proposes to comply with them.Quantify and describe the quality and toxicity of flowback and produced water and how it will be treated and managed.Assess the potential for inter-aquifer leakage or contamination.The use of drilling and hydraulic fracturing chemicals should be informed by appropriately tiered deterministic and/or probabilistic hazard and risk assessments, based on ecotoxicological testing consistent with Australian Government testing guidelines (see CoA 2012; MRMMC-EPHC-NHMRC 2009).Propose waste management measures (including salt and brines) during both operations and legacy after closure.
CSG Well Construction and Operation
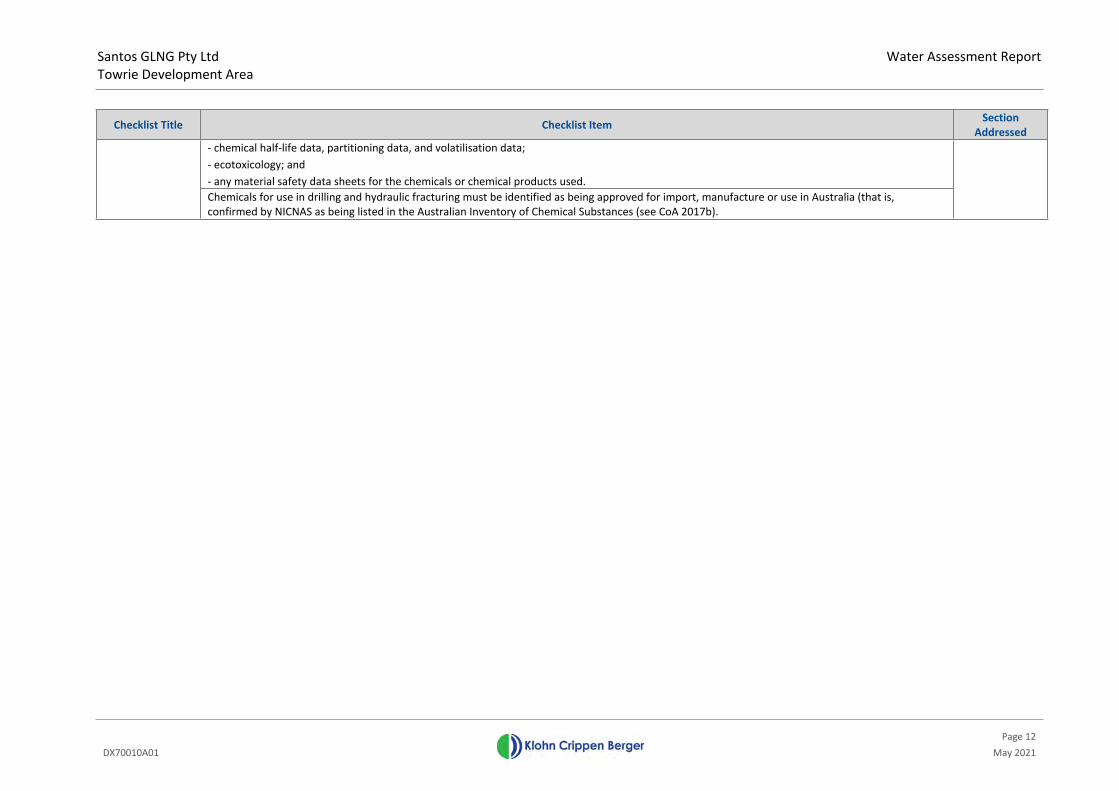
List the chemicals proposed for use in drilling and hydraulic stimulation including:- names of the companies producing fracturing fluids and associated products;- proprietary names (trade names) of compounds (fracturing fluid additives) being produced;- chemical names of each additive used in each of the fluids;- Chemical Abstract Service (CAS) numbers of each of the chemical components used in each of the fluids;- general purpose and function of each of the chemicals used;- mass or volume proposed for use;- maximum concentration (mg / L or g / kg) of the chemicals used;
Section 3.3.1.2
Chemical Risk Assessment Report (EHS Support 2020)
Stimulation Impact Monitoring Program (0007-650-PLA-0012) (Santos 2020a)
Santos GLNG Pty Ltd Towrie Development Area
Water Assessment Report
Page 12DX70010A01 May 2021
Checklist Title Checklist Item Section Addressed
- chemical half-life data, partitioning data, and volatilisation data;- ecotoxicology; and - any material safety data sheets for the chemicals or chemical products used.Chemicals for use in drilling and hydraulic fracturing must be identified as being approved for import, manufacture or use in Australia (that is, confirmed by NICNAS as being listed in the Australian Inventory of Chemical Substances (see CoA 2017b).

Santos GLNG Pty Ltd Towrie Development Area
Water Assessment Report
Page 13DX70010A01 May 2021
2 STAUTORY CONTEXT
This water assessment report has been prepared with consideration to key policies and legislation from the Commonwealth of Australia and the State of Queensland. This section provides an overview of applicable legislation and policies to this assessment.
2.1 Commonwealth legislation
2.1.1 Environment Protection and Conservation Act 1999
The Environment Protection and Biodiversity Conservation Act 1999 (EPBC Act) (Commonwealth of Australia 2018) is the central piece of environmental legislation at the Commonwealth level. It provides for the protection of environmental values, including matters of national environmental significance (MNES). Actions that are likely to have a significant impact on MNES are subject to the assessment and approval process under this Act. Water resources in relation to large coal mining and CSG development projects are a MNES. The Project constitutes a CSG development under the EPBC Act, and as such is being referred to the DAWE.
The regulatory guideline relevant to the Project, developed from the amendment to the EPBC Act identifying water resources as being a MNES, is the Significant impact guidelines 1.3: Coal seam gas and large coal mining developments – impacts on water resources (DoEE 2013b).
Significant Impact Guidelines 1.3: Coal Seam Gas and Large Coal Mining Developments – Impacts on Water Resources
The ‘Significant impact guidelines 1.3: Coal seam gas and large coal mining developments – impacts on water resources’ (DoEE 2013b) identify a ‘significant impact’ as ‘an impact which is important, notable, or of consequence, having regard to its context or intensity’.
Section 5.2 and 5.3 of the guidelines, identify that for a water resource a ‘significant impact’ may occur where, as a result of the action, one of the following changes to the hydrological characteristics of a water resource are of a sufficient scale or intensity to significantly reduce the current or future utility of the water resource for third party users, including environmental and other public benefit outcomes:
a. Changes in the water quantity, including the timing of variations in water quantity;
b. Changes in the integrity of hydrological or hydrogeological connections, including substantial structural damage (e.g. large-scale subsidence); and
c. Changes in the area or extent of a water resource.
DAWE have identified the following aspects that may need to be considered when assessing the above hydrological characteristics:
Flow regimes (volume, timing, duration and frequency of surface water flows);
Recharge rates to groundwater;
Aquifer pressure or pressure relationships between aquifers;
Groundwater table and potentiometric surface levels;
Groundwater-surface water interactions;

Santos GLNG Pty Ltd Towrie Development Area
Water Assessment Report
Page 14DX70010A01 May 2021
River-floodplain connectivity;
Inter-aquifer connectivity; and
Coastal processes including changes to sediment movement or accretion, water circulation patterns, permanent alterations in tidal patterns, or substantial changes to water flows or water quality in estuaries.
Section 5.4 of the ‘Significant impact guidelines 1.3: Coal seam gas and large coal mining developments – impacts on water resources’ (DoEE 2013b) provides guidance on changes to water quality, and states that a significant impact on a water resource may occur where, as a result of the action:
There is a risk that the ability to achieve relevant local or regional water quality objectives would be materially compromised, and as a result the action:
Creates risks to human or animal health or to the condition of the natural environment as a result of the change in water quality;
Substantially reduces the amount of water available for human consumptive uses or for other uses, including environmental uses, which are dependent on water of the appropriate quality;
Causes persistent organic chemicals, heavy metals, salt or other potentially harmful substances to accumulate in the environment;
Seriously affects the habitat or lifecycle of a native species dependent on a water resource;
Causes the establishment of an invasive species (or the spread of an existing invasive species) that is harmful to the ecosystem function of the water resource; or
There is a significant worsening of local water quality (where current local water quality is superior to local or regional water quality objectives); or
High quality water is released into an ecosystem which is adapted to a lower quality of water.
Changes to both the hydrological characteristics and water quality, as a result of the proposed activities, have been assessed as part of this assessment for the identification of potential impacts. Where required, management and mitigation measures will be implemented to avoid potential impacts. These measures are discussed in Section 10.
Significant Impact Guidelines 1.1: Matters of National Environmental Significance
The ‘Significant impact guidelines 1.1: Matters of National Environmental Significance’ (DoEE 2013a) identify a ‘significant impact’ as an “impact which is important, notable, or of consequence, having regard to its context or intensity”. A ‘significant impact’ on a critically endangered or endangered species may occur where, as a result of the action, there is a real chance or possibility that it will:
Lead to a long-term decrease in the size of a population;
Reduce the area of occupancy of the species;
Fragment an existing population into two or more populations;
Santos GLNG Pty Ltd Towrie Development Area
Water Assessment Report
Page 15DX70010A01 May 2021
Adversely affect habitat critical to the survival of a species;
Disrupt the breeding cycle of a population;
Modify, destroy, remove, isolate or decrease the availability or quality of habitat to the extent that the species is likely to decline;
Result in invasive species that are harmful to a critically endangered or endangered species becoming established in the endangered or critically endangered species’ habitat;
Introduce disease that may cause the species to decline; or
Interfere with the recovery of the species.
For critically endangered or endangered ecological communities, a ‘significant impact’ may occur where, as a result of the action, there is a real chance or possibility that it will:
Reduce the extent of an ecological community;
Fragment or increase fragmentation of an ecological community, for example by clearing vegetation for roads or transmission lines;
Adversely affect habitat critical to the survival of an ecological community;
Modify or destroy abiotic (non-living) factors (such as water, nutrients, or soil) necessary for an ecological community’s survival, including reduction of groundwater levels, or substantial alteration of surface water drainage patterns;
Cause a substantial change in the species composition of an occurrence of an ecological community, including causing a decline or loss of functionally important species, for example through regular burning or flora or fauna harvesting;
Cause a substantial reduction in the quality or integrity of an occurrence of an ecological community, including, but not limited to:
Assisting invasive species, that are harmful to the listed ecological community, to become established; or
Causing regular mobilisation of fertilisers, herbicides or other chemicals or pollutants into the ecological community which kill or inhibit the growth of species in the ecological community; or
Interfere with the recovery of an ecological community.
The assessment against the significant impacts for the Project area are discussed in Section 11.
2.2 State Legislation
2.2.1 Petroleum and Gas (Production and Safety) Act 2004
The Petroleum and Gas (Production and Safety) Act 2004 (State of Queensland 2019d) is an Act relevant to exploring for, recovering and transporting by pipeline, petroleum and fuel gas, and ensuring the safe and efficient undertaking of those activities. The key purpose of this Act is to facilitate and regulate the undertaking of responsible petroleum activities and the development of a safe, efficient and viable petroleum and fuel gas industry.

Santos GLNG Pty Ltd Towrie Development Area
Water Assessment Report
Page 16DX70010A01 May 2021
This Act identifies underground water rights for petroleum tenures, and states that the holder of a petroleum tenure may take or interfere with underground water in the area of the tenure if the taking or interference happens during the course of, or results from, the carrying out of another authorised activity for the tenure.
The Act prescribes mandatory compliance with the Queensland Department of Natural Resources, Mines, and Energy’s (DNRME) ‘Code of Practice for the construction and abandonment of coal seam gas and petroleum wells, and associated bores in Queensland Version 2’ (DNRME 2019b). The purpose of this Code is to ensure that all petroleum wells, CSG wells and associated bores are constructed, maintained and abandoned to a minimum acceptable standard resulting in long-term well integrity, containment of petroleum and gas and the protection of groundwater resources.
2.2.2 Water Act 2000
General Purpose of the Water Act
The Water Act 2000 (State of Queensland 2019c) is an Act to provide for the sustainable management of water and the management of impacts on underground water, among other purposes. This Act provides a framework for:
The sustainable management of Queensland’s water resources by establishing a system for the planning, allocation and use of water;
The sustainable and secure water supply and demand management for designated regions;
The management of impacts on underground water caused by the exercise of underground water rights by the resource sector; and
The effective operation of water authorities.
This Act covers water in a watercourse, lake or spring, underground water (or groundwater), overland flow water, or water that has been collected in a dam.
Water Act and Petroleum and Gas Activities
The Water Act 2000 provides for the identification and management of potential impacts on underground water caused by the exercise of underground water rights by resource tenure holders, which are regulated under the Petroleum and Gas (Production and Safety) Act 2004. The Act also outlines the requirements for make good agreements, if required, associated with the impacts to underground water.
Chapter 3 of the Water Act 2000 has a stated purpose to provide for the management of impacts on underground water caused by the exercise of underground water rights by resource tenure holders, which includes petroleum tenure holders. To achieve the stated purpose, a regulatory framework is provided which requires:
Resource tenure holders to monitor and assess the impacts of the exercise of undergroundwater rights on water bores and to enter into make good agreements with the owners ofthe groundwater bores as necessary;
The preparation of underground water impact reports (UWIR) that establish undergroundwater obligations, including obligations to monitor and manage impacts on aquifers andsprings; and
Santos GLNG Pty Ltd Towrie Development Area
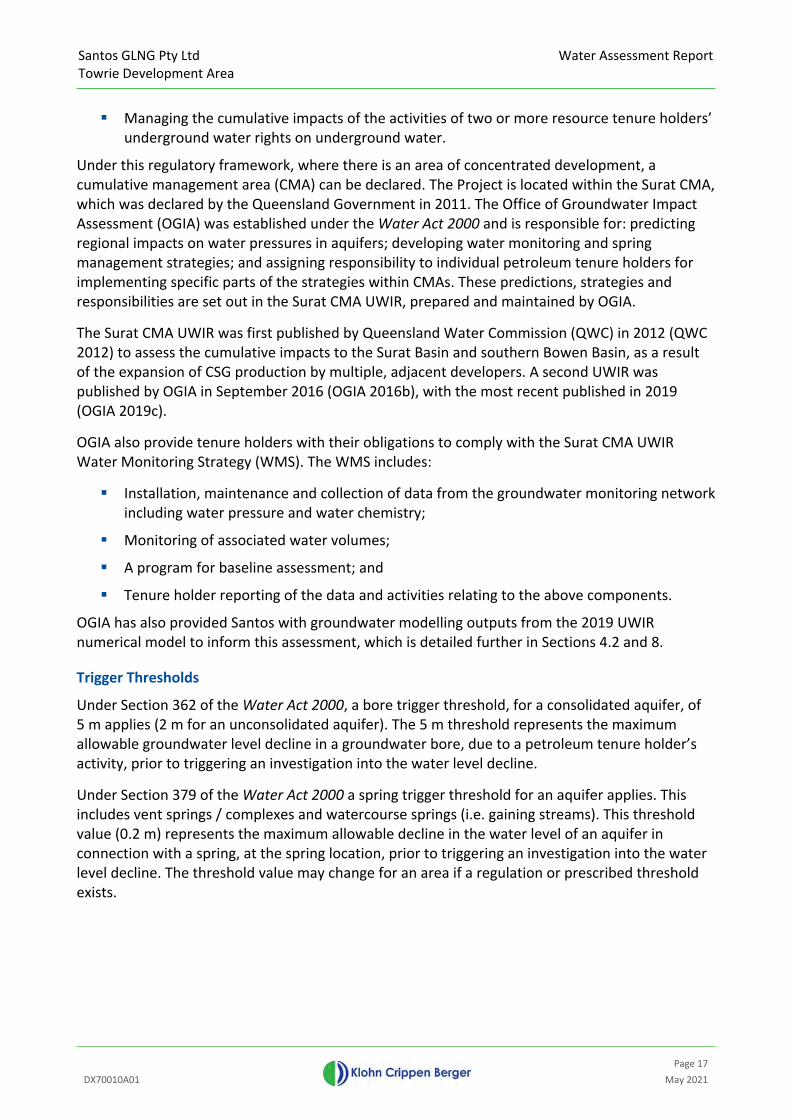
Water Assessment Report
Page 17DX70010A01 May 2021
Managing the cumulative impacts of the activities of two or more resource tenure holders’underground water rights on underground water.
Under this regulatory framework, where there is an area of concentrated development, a cumulative management area (CMA) can be declared. The Project is located within the Surat CMA, which was declared by the Queensland Government in 2011. The Office of Groundwater Impact Assessment (OGIA) was established under the Water Act 2000 and is responsible for: predicting regional impacts on water pressures in aquifers; developing water monitoring and spring management strategies; and assigning responsibility to individual petroleum tenure holders for implementing specific parts of the strategies within CMAs. These predictions, strategies and responsibilities are set out in the Surat CMA UWIR, prepared and maintained by OGIA.
The Surat CMA UWIR was first published by Queensland Water Commission (QWC) in 2012 (QWC 2012) to assess the cumulative impacts to the Surat Basin and southern Bowen Basin, as a result of the expansion of CSG production by multiple, adjacent developers. A second UWIR was published by OGIA in September 2016 (OGIA 2016b), with the most recent published in 2019 (OGIA 2019c).
OGIA also provide tenure holders with their obligations to comply with the Surat CMA UWIR Water Monitoring Strategy (WMS). The WMS includes:
Installation, maintenance and collection of data from the groundwater monitoring network including water pressure and water chemistry;
Monitoring of associated water volumes;
A program for baseline assessment; and
Tenure holder reporting of the data and activities relating to the above components.
OGIA has also provided Santos with groundwater modelling outputs from the 2019 UWIR numerical model to inform this assessment, which is detailed further in Sections 4.2 and 8.
Trigger Thresholds
Under Section 362 of the Water Act 2000, a bore trigger threshold, for a consolidated aquifer, of 5 m applies (2 m for an unconsolidated aquifer). The 5 m threshold represents the maximum allowable groundwater level decline in a groundwater bore, due to a petroleum tenure holder’s activity, prior to triggering an investigation into the water level decline.
Under Section 379 of the Water Act 2000 a spring trigger threshold for an aquifer applies. This includes vent springs / complexes and watercourse springs (i.e. gaining streams). This threshold value (0.2 m) represents the maximum allowable decline in the water level of an aquifer in connection with a spring, at the spring location, prior to triggering an investigation into the water level decline. The threshold value may change for an area if a regulation or prescribed threshold exists.

Santos GLNG Pty Ltd Towrie Development Area
Water Assessment Report
Page 18DX70010A01 May 2021
2.2.3 Environmental Protection Act 1994
The Environmental Protection Act 1994 (State of Queensland 2019h) is an Act with the objective to protect Queensland’s environment while allowing for development that improves the total quality of life, both now and in the future, in a way that maintains the ecological processes on which life depends (ecologically sustainable development).
This Act states that ‘to carry out an environmentally relevant activity (ERA) an environmental authority (EA) is required’. A resource activity, specifically a petroleum and/or gas activity, is defined as an ERA.
Environmental Authority
Santos currently holds an EA (EA0001254) authorising petroleum exploration activity within ATP 2033 underlying the Towrie Development Area. A new EA will be sought under the Environmental Protection Act 1994 (State of Queensland 2018b) to seek authorisation for production within PL1059 (under application), including the full scope of the Project described in Section 1.1.
2.2.3.1 Environmental Protection Regulation 2019
The Environmental Protection Regulation 2019 (State of Queensland 2019b) is a subordinate legislation which supports the operation of the Environmental Protection Act 1994 and prescribes the detail for the processes contained in the Act.
Section 28 of the Environmental Protection Regulation 2019 is relevant to this application and includes the documents prescribed for an application for an environmental authority for a CSG activity.
2.2.3.2 Coal Seam Gas Water Management Policy 2012
The primary objective of the Queensland Department of Environment and Science’s (DES’s) Coal Seam Gas Water Management Policy 2012 (DEHP 2012) relates to the management and use of CSG water under the Environmental Protection Act 1994. The role of the policy is to:
Clearly state the government’s position on the management and use of CSG water;
Guide CSG operators in managing CSG water under their EA; and
Ensure community understanding about the government’s preferred approach to managing CSG water.
The End of Waste Code Irrigation of Associated Water (including coal seam gas water) (DES 2019c) and End of Waste Code Associated Water (including coal seam gas water) (DES 2019b) support the objective of the Coal Seam Gas Water Management Policy 2012, by specifying the standards required to be met where associated water is to be used for beneficial purposes.
2.2.4 Water Supply (safety and Reliability) Act 2008
The Water Supply (Safety and Reliability) Act 2008 (State of Queensland 2017a) is an Act that provides for the safety and reliability of water supply. The purpose of this Act is achieved primarily by providing:

Santos GLNG Pty Ltd Towrie Development Area
Water Assessment Report
Page 19DX70010A01 May 2021
A regulatory framework for providing water and sewerage services in the State, including functions and powers of service providers;
A regulatory framework for providing recycled water and drinking water quality, primarily for protecting public health;
The regulation of referable dams;
Flood mitigation responsibilities; and
The protection of the interests of customers of service providers.
The key component of the Act relevant to the Project relates to the regulation of referable dams.
2.3 Environmental Values and Water Resource Management
2.3.1 Environmental Values
The Environmental Protection Act 1994 (State of Queensland 2018c) defines an Environmental Value (EV) as:
A quality or physical characteristic of the environment that is conducive to ecological health or public amenity or safety; or
Another quality of the environment identified and declared to be an environmental value under an environmental protection policy or regulation.
Under the Environmental Protection Act 1994, the Environmental Protection (Water and Wetland Biodiversity) Policy 2019 (State of Queensland 2019a) is established as subordinate legislation to achieve the object of the Act in relation to Queensland waters. The purpose of the Environmental Protection (Water and Wetland Biodiversity) Policy 2019 is achieved by:
Identifying environmental values and management goals for Queensland waters;
Stating water quality guidelines and water quality objectives to enhance or protect the environmental values;
Providing a framework for making consistent, equitable and informed decisions about Queensland waters; and
Monitoring and reporting on the condition of Queensland waters.
The Project area is located within the western tributaries of the Comet River Sub-Basin. The Environmental Protection (Water) Policy 2009 (DEHP 2011) provides defined EVs and water quality objectives (WQOs) for the Comet River Sub-Basin under Schedule 1 of the policy. EVs for the Comet River Sub-Basin are presented in Table 2.1 and include both the values for surface water and groundwater.

Santos GLNG Pty Ltd Towrie Development Area
Water Assessment Report
Page 20DX70010A01 May 2021
Table 2.1 Environmental Values for the Comet River Sub-Basin waters within the vicinity of the Project area (State of Queensland 2013a; 2013b; 2013c)
Environmental Values
Water
Aqua
tic E
cosy
stem
Irrig
atio
n
Farm
Sup
ply
/ U
se
Stoc
k W
ater
Aqua
cultu
re
Hum
an c
onsu
mer
Prim
ary
recr
eatio
n
Seco
ndar
y re
crea
tion
Visu
al re
crea
tion
Drin
king
wat
er
Indu
stria
l use
Cultu
ral a
nd sp
iritu
al
Comet River Sub-Basin (WQ1307) Comet western tributaries – developed areas Comet eastern tributaries – developed areas Comet main channel – developed areas (including Comet weir waters)
Fresh waters in undeveloped areas Groundwater denotes the EV is selected for protection. Blank indicates that the EV is not chosen for protection.
Draft EVs have also been prepared for the Fitzroy Basin groundwater systems (State of Queensland 2018j). The draft EVs have been developed for alluvial and fractured rock systems, and the deposits overlying the Great Artesian Basin (GAB). Units underlying the GAB are also considered. Table 2.2 presents the draft groundwater EVs for each of the categories outlined in the plan (State of Queensland 2018f; 2018g; 2018h; 2018i; 2018a).
Table 2.2 Draft Environmental Values for the Fitzroy Basin Groundwater within the vicinity of the Project area (State of Queensland 2018f; 2018g; 2018h; 2018i; 2018a)
Environmental Values
Water
Aqua
tic E
cosy
stem
Irrig
atio
n
Farm
Sup
ply
/ U
se
Stoc
k W
ater
Aqua
cultu
re
Hum
an c
onsu
mer
Prim
ary
recr
eatio
n
Seco
ndar
y re
crea
tion
Visu
al re
crea
tion
Drin
king
wat
er
Indu
stria
l use
Cultu
ral a
nd sp
iritu
al
Comet (Fitzroy Alluvium) – GWQ1301 Eastern Basement with Basalt Remnants (Fitzroy Fractured Rock) – GWQ1302
Tertiary Sediments overlying the GAB and Bowen Basin (Fitzroy Cainozoic deposits) – GWQ1303
Upper Dawson uncertain Area (Fitzroy mid GAB – GWQ1306
Bowen Non-Coal Bearing (Fitzroy earlier basins) – GWQ1309
Lower Bowen continued – GWQ1309 denotes the EV is selected for protection. Blank indicates that the EV is not chosen for protection.
WQOs to protect the EVs are defined in DEHP (2011) and include separate WQOs to protect the aquatic ecosystem EV and other EVs (e.g. human use EVs). As the plan is still in draft, no WQOs are currently available for the Fitzroy Basin groundwater.
Santos GLNG Pty Ltd Towrie Development Area
Water Assessment Report
Page 21DX70010A01 May 2021
2.3.2 Water Resource and Resource Operations Plans
Water Plan (Fitzroy Basin) 2011
The surface water resource of the Comet River Sub-Basin is managed under the Queensland Water Resource Plan framework as part of the Water Plan (Fitzroy Basin) 2011 (State of Queensland 2017b). The purpose of the plan is to:
Define the availability of water in the plan area;
Provide a framework for sustainably managing water and the taking of water;
Identify priorities and mechanisms for dealing with future water requirements;
Provide a framework for establishing water allocations;
Provide a framework for reversing, where practicable, degradation in natural ecosystems;
Regulate the taking of overland flow water; and
Regulate the taking of groundwater.
Fitzroy Basin Resource Operations Plan
The Fitzroy Basin Resource Operations Plan (ROP) (DNRM 2015) provides the process to implement the Water Plan (Fitzroy Basin) 2011. The key function of the ROP is to provide the operating and environmental management rules and monitoring requirements to resource operations licence holders.
Santos GLNG Pty Ltd Towrie Development Area
Water Assessment Report
Page 22DX70010A01 May 2021
3 PROPOSAL DESCRIPTION
3.1 Project Overview
3.1.1 Project Location and Regional Overview
The Towrie Development Area covers an area of approximately 87 km2 and is located ~90 km south of the township of Rolleston, Central Queensland. The Project is within PL 1059, as shown in Figure 1.1.
A summary of the regional Project setting is provided below, with further detail included in the remainder of the report:
The gas producing targets for the Project are within the Bandanna Formation, of thePermo-Triassic Bowen Basin (Section 7.1).
The Project is located in the Comet River Sub-Basin, which forms part of the larger FitzroyBasin (Section 6).
Groundwater systems within the vicinity of the Project area include Quaternary depositscomprising alluvium associated with the Arcadia Creek, as well as the Bowen Basin units.Within the Project area, Cenozoic sediments are also present (Section 7).
Water-dependent assets identified in the Project area include third-party groundwaterbores, third-party surface water users and potential terrestrial groundwater dependentecosystems (GDEs) (Section 7.9 and 7.10).
Other Developments
The Project is located in the vicinity of other resource tenures, including:
The Gladstone Liquefied Natural Gas (GLNG) Project and expanded Gas Field Development(GFD) Project located to the east of the Project area. The Santos GLNG project (EPBC2008/4059) and expanded GFD project (EPBC 2012/6615) were approved followingcomprehensive environmental assessments under the bilateral agreement between theCommonwealth and Queensland governments. These approvals authorisedunconventional gas field development with potential for future expansion.
Conventional gas fields located adjacent the Project area on PL 220, PL 421, and PL 219.
3.2 Project Approval Status
The Petroleum and Gas (Production and Safety) Act 2004 (State of Queensland 2018d) identifies underground water rights for petroleum tenures, and in summary, states that the holder of a petroleum tenure may take or interfere with underground water. Santos intends to exercise its underground water rights for the Towrie Development Area.
A summary of the Project’s approval status within the legislative / regulatory framework is provided in:
Santos has been authorised to conduct exploration and appraisal petroleum activities inthe Towrie Development Area (ATP2033) in accordance with its EA (EA0001254), under theEnvironmental Protection Act 1994 (State of Queensland 2018b).

Santos GLNG Pty Ltd Towrie Development Area
Water Assessment Report
Page 23DX70010A01 May 2021
Santos is currently preparing to apply for a Site Specific EA for PL1059 under theEnvironmental Protection Act 1994 to authorise production activities.
The Project is now being referred to the DAWE for consideration under the EnvironmentProtection and Biodiversity Conservation Act 1999 (EPBC Act) (Commonwealth of Australia2018). This assessment report has been prepared to support Santos’ referral under theEPBC Act.
As previously discussed, the Project is located within the Surat CMA, which was declared in 2011 by the Queensland Government. OGIA is responsible for: predicting regional impacts on water pressures in aquifers; developing water monitoring and spring management strategies; and assigning responsibility to individual petroleum tenure holders for implementing specific parts of the strategies within CMAs. These predictions, strategies and responsibilities are set out in the Surat CMA UWIR, prepared and maintained by OGIA.
Production within the Towrie Development Area was recently planned, and therefore production from the Project was not included in the 2019 UWIR (OGIA 2019c). OGIA will assess the adequacy of the UWIR during the annual evaluation / review process. At this time, OGIA will then assess and decide whether a new UWIR is required. Regardless, a new UWIR is required no later than 2022, which will include the proposed production within the Towrie Development Area.
3.3 Project Components
The Project will involve the progressive development of gas infrastructure, planned to commence in late 2022, including the following activities:
116 gas production wells;
Ancillary linear infrastructure including gas and water pipelines, access tracks, power lines,and communication lines; and
Ancillary activities including laydown area, stockpiles, storage areas, camp with sewagetreatment plant and associated treated effluent irrigation area, and water managementinfrastructure comprising tanks.
3.3.1 Project Activities and infrastructure
3.3.1.1 Gas Production and Wells and Water Production
Groundwater abstraction is required as part of the gas production process. Groundwater is abstracted (pumped) from production wells to depressurise the target production coal seams. Depressurisation generates gas flow and sustains groundwater flow from the well to maintain the target producing operational pressure for each production well. A summary of the proposed production wells is provided in the following:
Production wells will be drilled and constructed in accordance with the ‘Code of Practicefor the construction and abandonment of coal seam gas and petroleum wells, andassociated bores in Queensland Version 1’ (DNRME 2019b). The purpose of this code is toensure that all petroleum wells, CSG wells and associated bores are constructed,maintained and abandoned to a minimum acceptable standard resulting in long-term wellintegrity, containment of petroleum and the protection of groundwater resources.

Santos GLNG Pty Ltd Towrie Development Area
Water Assessment Report
Page 24DX70010A01 May 2021
Hydraulic stimulation is proposed to be undertaken as part of the Project. This will beconducted in accordance with the ‘Code of Practice for the construction and abandonmentof coal seam gas and petroleum wells, and associated bores in Queensland Version 1’(DNRME 2019b). Monitoring of the stimulation process prior- and post- activities will beconducted in accordance with Santos’s SIMP (Appendix I).
Subject to relevant approvals, gas production and its associated water extraction willcommence in 2022.
The operating life of individual CSG production wells is anticipated to be approximately 20to 30 years. Gas production is planned to cease by approximately 2057.
Produced water volumes and rates are predicted using a stochastic reservoir modelling tool which produces probabilistic distributions applied to several key reservoir parameters (i.e. permeability, porosity and net coal). The model predictions generate production profiles (type curves). These production profiles are used in field development planning to provide a water forecast. Type curves are updated during the life of the project as more information (e.g. further and refined key reservoir parameters) becomes available.
Figure 3.1 presents the predicted water extraction rate for the Project. Peak water production is predicted to occur at the end of Year 7 (2029) of the Project, with a peak rate of ~2.2 ML/day. The estimated annual water production volume for the life of the Project, as well as the cumulative water production volume, is presented in Figure 3.2. The total groundwater that will be abstracted for the duration of the Project is estimated at ~2.3 GL.
Figure 3.1 Predicted Water Production Rate
0
0.5
1
1.5
2
2.5
ML/
D
Year

Santos GLNG Pty Ltd Towrie Development Area
Water Assessment Report
Page 25DX70010A01 May 2021
Figure 3.2 Predicted Annual Water Production and Cumulative Volume
The Arcadia Field (PL 220/PL421) is approximately 16 km to the southwest of the Towrie Development Area, with gas extraction also from the Bandanna Formation. Water quality sampling for Arcadia Field during 2019 is summarised in Table 3.1. The electrical conductivity (EC) from all of the samples ranges between 7,690 to 15,100 μS/cm, which is considered representative of the expected water quality for the Towrie Development Area.
Table 3.1 Median Produced Water Quality
Sample Location Na (mg/L) Ca (mg/L) Mg (mg/L) K (mg/L) Cl (mg/L) SO4 (mg/L) TDS1
(mg/L) EC (µS/cm)
PL 420/421 2,125 17 2 21 2,215 1 5,235 10,250NOTES: 1 – Total Dissolved Solids;
3.3.1.2 Produced Water Management
Produced water will predominantly be transferred off the Towrie Project area for management using existing and operational infrastructure authorised under the GLNG and GFD approvals. Produced water management has been developed to meet the requirements of the CSG Water Management Policy (DEHP 2012) and to maximise the beneficial use of produced water.
Santos’ strategy for produced water management is based on the CSG Water Management Policy prioritisation hierarchy (DEHP 2012). The prioritisation hierarchy for managing and using CSG water is:
0
100
200
300
400
500
600
700
800
0
0.5
1
1.5
2
2.5
Annu
al V
olum
e (M
L)
Cum
ulat
ive V
olum
e (G
L)
Year
Annual Volume Cumulative Volume (GL)
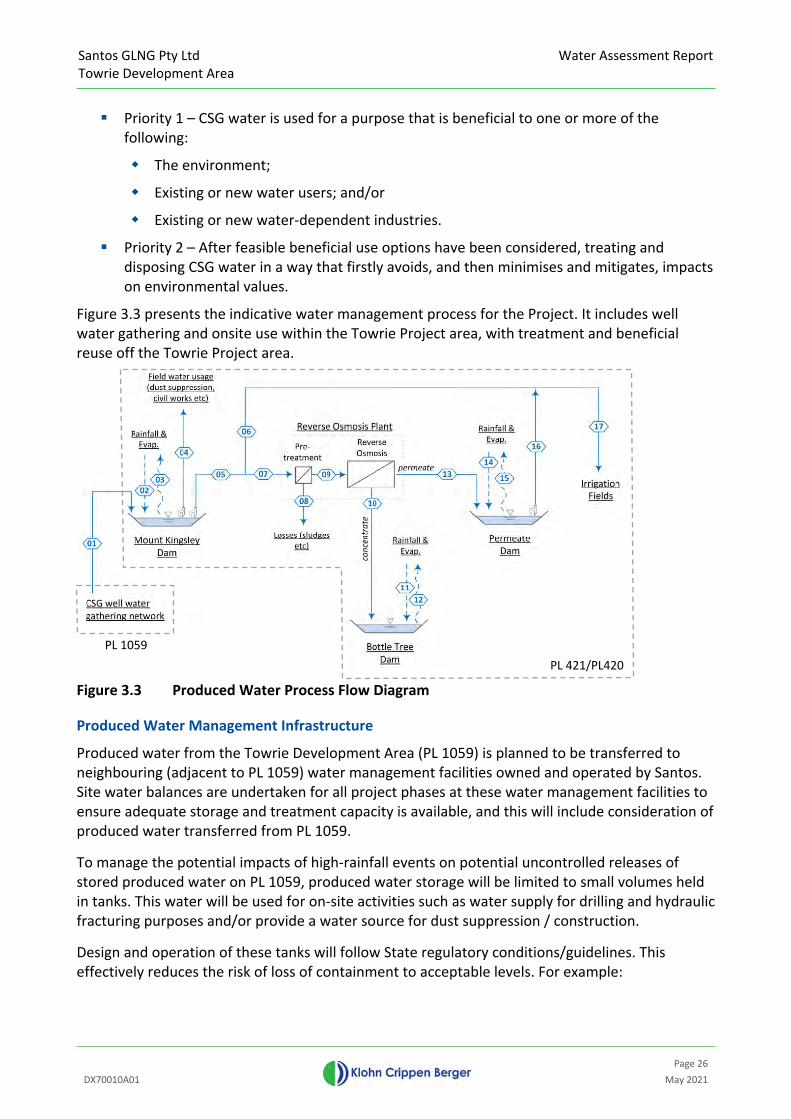
Santos GLNG Pty Ltd Towrie Development Area
Water Assessment Report
Page 26DX70010A01 May 2021
Priority 1 – CSG water is used for a purpose that is beneficial to one or more of the following:
The environment;
Existing or new water users; and/or
Existing or new water-dependent industries.
Priority 2 – After feasible beneficial use options have been considered, treating and disposing CSG water in a way that firstly avoids, and then minimises and mitigates, impacts on environmental values.
Figure 3.3 presents the indicative water management process for the Project. It includes well water gathering and onsite use within the Towrie Project area, with treatment and beneficial reuse off the Towrie Project area.
Figure 3.3 Produced Water Process Flow Diagram
Produced Water Management Infrastructure
Produced water from the Towrie Development Area (PL 1059) is planned to be transferred to neighbouring (adjacent to PL 1059) water management facilities owned and operated by Santos. Site water balances are undertaken for all project phases at these water management facilities to ensure adequate storage and treatment capacity is available, and this will include consideration of produced water transferred from PL 1059.
To manage the potential impacts of high-rainfall events on potential uncontrolled releases of stored produced water on PL 1059, produced water storage will be limited to small volumes held in tanks. This water will be used for on-site activities such as water supply for drilling and hydraulic fracturing purposes and/or provide a water source for dust suppression / construction.
Design and operation of these tanks will follow State regulatory conditions/guidelines. This effectively reduces the risk of loss of containment to acceptable levels. For example:
PL 1059PL 421/PL420

Santos GLNG Pty Ltd Towrie Development Area
Water Assessment Report
Page 27DX70010A01 May 2021
All tanks for the temporary storage of produced water will be fabricated or manufacturedtanks or containers, designed and constructed to an Australian Standard that deals withstrength and structural integrity of that tank or container.
Regular maintenance and inspection.
Remote level sensors.
Leak detection will be installed as required.
Subject to integrity checks.
Produced water tanks will not be situated in surface watercourses or surface water flowpaths.
Water will be transferred at low pressure through underground HDPE pipelines designed and installed in accordance with Australian Pipelines and Gas Association (APGA) Code of Practice Upstream Polyethylene Gathering Networks-CSG Industry Version 4.0 (APGA 2017).
The planning of the development activities and associated infrastructure locations, are bound to the Environmental Protocol for Constraints Planning and Field Development (Santos 2021b) as per the Environmental Management Plan (Santos 2021a).
This Environmental Protocol for Constraints Planning and Field Development has been developed to guide infrastructure siting within the Project area. The main considerations for infrastructure siting incorporate:
The consideration of Matters of National Environmental Significance (MNES) listed under the EPBC Act when selecting the location of project activities;
The avoidance or minimisation of disturbance to MNES wherever practicable; and,
To ensure that upper disturbance limits for MNES are not exceeded.
The five constraint categories identified within the protocol include:
1. No-go areas:
Development permitted
No petroleum activities
Constraint
Western Ridgeline
Middle Hill
Threatened ecological communities (TECs) except where otherwise listed in otherconstraint categories
2. High constraint area:
Development permitted
Low impact petroleum activities
Linear infrastructure
Constraint
Santos GLNG Pty Ltd Towrie Development Area
Water Assessment Report
Page 28DX70010A01 May 2021
The Public Reserve
Brigalow (dominant or co-dominant) TEC
Poplar Box Grassy Woodland on Alluvial Plains TEC
Mature vegetation along mapped watercourses
3. Construction water source:
Development permitted
Extraction of dam water for construction purposes where lawful and permitted bythe landholder
Constraint
Farm dams, where extraction from dams is lawful and permitted by landholder
4. Moderate constraint area:
Development permitted
All petroleum activities
Constraint
MNES and its habitat, including threatened species and communities; andmigratory species (except where otherwise listed in other constraint categories)
5. Low constraint area:
Development permitted
All petroleum activities
Constraint
Areas of non-remnant vegetation without potential to contain MNES and its habitat
Existing Santos infrastructure
Existing roads and other infrastructure
Beneficial Uses
Produced water management for the Project includes beneficial use of water at neighbouring (adjacent to PL 1059) water management facilities, which may include:
Project activities, such as drilling and completions, construction, compaction, heatexchange, rehabilitation, dust suppression etc.
Meeting ‘Make Good’ arrangements under the Water Act 2000, if required.
Landowner activities, including water for irrigation and stock watering.
Regional water users which may include irrigators, feed lots, industry, local governmentcivil works including road construction and mining activities.
Substitution of water allocation by making produced water available to third parties.

Santos GLNG Pty Ltd Towrie Development Area
Water Assessment Report
Page 29DX70010A01 May 2021
Produced water used in any beneficial use will be fit for purpose and in compliance with existing Queensland regulatory requirements, including the conditions of the Towrie Development Area EA once granted or end of waste codes under the ‘Waste Reduction and Recycling Act 2001’ (State of Queensland 2019e), including compliance with ANZECC water quality limits for irrigation beneficial uses on PL 1059.
Brine and Salt Management
The proposed action does not include produced water treatment within the Towrie Project area. Therefore, no brine or salt will be generated, stored or otherwise managed within the Towrie Project area.
Produced water from the Project area will be transferred to storage and treatment facilities (reverse osmosis) on PL 420 and PL 421, under the relevant GLNG and GFD EPBC approvals and EAs. The resulting treated water permeate will be stored in a dam and used for beneficial purposes. The brine will be stored in a regulated brine storage facility which will naturally concentrate the brine over time. The final stage will be crystallisation of a solid salt for beneficial reuse or disposal to a licensed landfill. The treatment processes, and storage and management of brine and salt, are not located within the Towrie Project area and are therefore not part of the proposed action.
Hydraulic Stimulation
Hydraulic stimulation is proposed to be undertaken as part of the Towrie Development Area. The chemicals additives and procedures related to stimulation proposed are derived from multiple Santos projects across the Surat and Bowen Basins where stimulation has previously been undertaken. The proposed methodology used during this process is outlined in the SIMP (Santos 2020a) (Appendix I).
The stimulation process as detailed in the IESC’s hydraulic fracturing techniques (2014a), comprises a series of operations performed on gas production wells to increase the permeability of the target coal seams in the immediate surrounds of the well. The process consists of pumping fluid at a high pressure down the well and into the target coal seam; the pressure of the fluid widens existing fractures within the coal seam. As the pressure is sustained, the fractures propagate radially from the well, through the coal seam. Once optimal fracture propagation has been achieved, uniform fine-grained sand or other propping material, referred to as “proppant” is pumped into the open fractures. The stimulation fluid carries the proppant in suspension. Once the pumping ceases, the proppant is deposited in the coal seam fractures. As induced pressure on the coal seam is removed, the fractures are held open by the proppant, thus the permeability within the coal seam is increased.
Hydraulic fracturing fluids will be extracted from the well via fluid circulation and will either be captured in a HDPE lined tank at the well site and then trucked to a produced water storage pond located at a neighbouring (adjacent to PL 1059) water management facilities owned and operated by Santos, or if the well is already connected to the gathering network, piped to the produced water storage pond. In the storage pond fluids undergo degradation and mixed and diluted by large volumes of produced water. The mixed water can be further treated via the water-treatment plant (reverse osmosis) prior to beneficial reuse at the neighbouring water
Santos GLNG Pty Ltd Towrie Development Area
Water Assessment Report
Page 30DX70010A01 May 2021
management facilities. Hydraulic fracturing fluids are monitored throughout the process in accordance with the SIMP.
Santos GLNG Pty Ltd Towrie Development Area
Water Assessment Report
Page 31DX70010A01 May 2021
4 ASSESSMENT METHODOLOGY
4.1 Methodology and Data Sources
4.1.1 Assessment Area
The existing environment within the vicinity of the Towrie Development Area, for this Water Assessment Report, was considered through a desktop assessment to establish the baseline groundwater conditions, EVs and potential receptors.
The assessment area, for the purposes of this report, includes surface water features, hydrogeological units underlying the Project within the Bowen Basin and overlying Quaternary units / deposits. For the identification of groundwater receptors relevant to this Project, a 25 km buffer around the Towrie Development Area was established to capture potential adjacent groundwater receptors that may be impacted by the proposed development.
4.1.2 Information and Data Sources
A preliminary desktop assessment utilised data and information provided by Santos, OGIA and publicly available reports and data. Primary data and information utilised in this assessment includes:
Registered bore data from the Queensland Department of Natural Resources, Mines andEnergy (DNRME) Groundwater Database (GWDB) (DNRME 2020)
Queensland Spring Register, published by the Queensland Herbarium (QueenslandHerbarium 2019)
Potential Groundwater Dependent Ecosystem (GDE) mapping published by theDepartment of Environment and Science (DES 2018b)
Surface water flow and quality data sourced from the Queensland Government WaterMonitoring Information Portal (State of Queensland 2020a)
Local Climate, including temperature, precipitation and evaporation data from The Bureauof meteorology (BOM 2020d)
Surat CMA aquifer attribution dataset, provided by OGIA (OGIA 2019d)
Petroleum well completion reports, sourced from Queensland QDEX database
Reports
Underground Water Impact Report (UWIR) for the Surat CMA (OGIA 2019c)
Hydrogeological Conceptualisation Report for the Surat CMA (OGIA 2016a)
Environmental Protection Policy (Water) 2009 – Comet River Sub-Basin EnvironmentalValues and Water Quality Objectives (DEHP 2011)

Santos GLNG Pty Ltd Towrie Development Area
Water Assessment Report
Page 32DX70010A01 May 2021
4.2 Impact Assessment
4.2.1 Groundwater
OGIA simulated the predictive model scenario for Santos using the regional groundwater flow model that underpins the Surat CMA UWIR (OGIA 2019c), and based on the proposed development information provided by Santos (e.g. number and location of wells, production scheduling and durations). At the time of undertaking the predictive model scenario the OGIA numerical groundwater model was presented in the 2019 UWIR for the Surat CMA (OGIA 2019c), which was issued as a Draft for Consultation. Between the issue of the Draft for Consultation UWIR and the final 2019 UWIR (OGIA 2019f) the OGIA groundwater model was unaltered, therefore, the model scenario results from which the potential groundwater impacts have been assessed have not changed from the draft and final versions of the UWIR.
Modelling included simulations to provide impact predictions from the Project as well as cumulative impact predictions from other approved CSG developments, as defined in the 2019 UWIR for the Surat CMA (OGIA 2019f). Coal mines have not been simulated in the OGIA numerical groundwater model, however, feedback from OGIA indicates that coal mines will be captured in the model and considered in the 2021 UWIR for the Surat CMA. However, potential cumulative drawdown impact contributions from the coal mines proximal to the Project area not considered for the following reasons:
Existing coal mines are between ~90 km and ~130 km away from the Project area(Rolleston ~90 km north-northwest, Meteor Downs South ~100 km north-northwest,Dawson Mining Complex ~130 km east);
Two coal prospects (Ridgeland, Hutton) are located ~50 km to the south of the Projectarea, however, these prospects are not approved and have been inactive for more thanfive years;
Coal mining drawdown impacts are typically localised due to the shallow nature of the coalseam being mined and the limited propagation of drawdown due to changes in the storageof hydrostratigraphic units due to mining activity; and,
Communications with the OGIA regarding the preliminary model results for the 2021 UWIRof the Surat CMA have identified that there are limited contributions to the cumulativedrawdown impacts from coal mines simulated in the OGIA model.
Therefore, the assessment of coal mining groundwater level drawdown impacts as part of the cumulative impact assessment for this Project are not undertaken.
Outputs from the modelling have been processed by KCB and considered as part of this assessment (Section 8 and 8.5).
The assessment criteria used to consider the groundwater drawdown impacts associated with the Project refers to the Water Act 2000, trigger thresholds, as outlined in Section 2.2.2:
Bore trigger threshold, represents the maximum allowable groundwater level decline in agroundwater bore, due to petroleum tenure holders’ activities, prior to triggering aninvestigation into the water level decline.

Santos GLNG Pty Ltd Towrie Development Area
Water Assessment Report
Page 33DX70010A01 May 2021
For a consolidated aquifer – 5 m
For an unconsolidated aquifer – 2 m
Spring trigger threshold represents the maximum allowable decline in the water level of anaquifer in connection with a spring, at the spring location, prior to triggering aninvestigation into the water level decline.
Spring – 0.2 m
Potential impacts to the source aquifers for GDEs and spring complexes have been assessed using the predicted drawdown from the UWIR numerical model with consideration to hydrogeological conceptual understanding of the system. Groundwater and surface water interactions have also been considered through the conceptual understanding of the system.
Other potential impacts associated with the Project in relation to groundwater are presented in Section 9.1.1, with the relevant mitigation, management and monitoring measures to address these potential impacts provided in Section 10.
4.2.2 Surface water
The IESC checklist identifies that analytical and/or numerical modelling is to be undertaken for the assessment of impacts to surface water. The proposed Project does not include any extraction from, or discharges to surface water, or significant interaction with surface waterbodies and therefore direct impacts to surface water are not anticipated. Therefore, as a result, modelling was not deemed necessary as part of this assessment.
A review of other potential indirect impacts to surface water as a potential result of the Project are discussed in Section 6.5. Relevant mitigation, management and monitoring measures to address these potential impacts are provided in Section 10.
4.3 Risk Assessment
The IESC checklist identifies that a risk assessment should be conducted from an early stage of the Project area. Throughout the assessment, risks and uncertainties associated with the Project area have been considered and appropriate mitigation and management strategies developed. Section 9.5 presents the risk assessment results with both pre- and post-mitigation risks assessed.

Santos GLNG Pty Ltd Towrie Development Area
Water Assessment Report
Page 34DX70010A01 May 2021
5 EXISITING ENVIRONMENT
5.1 Topography
The topography of the Towrie Development Area ranges in elevation between ~620 mAHD towards the west and 315 mAHD in the east, as shown in Figure 5.1. The elevation of the wider Project area shows similar elevation ranges between ~300 mAHD and 600 mAHD, associated with the valley. The lower lying drainage is associated with the watercourses discussed later in Section 6.
5.2 Climate
The climate of the Project is classified as subtropical with a moderately dry winter, based on the modified Köppen classification system (BOM 2005). Climate statistics sourced from the Bureau of Meteorology (BOM) are presented in Table 5.1 for the climate station Injune Post Office (43015), and Rolleston (035059). Injune and Rolleston climate stations are located 85 km south and 84 km northwest of the Project, respectively. The locations of the climate stations are shown on Figure 5.1.
Table 5.1 Climate Statistics for Injune and Rolleston, Site Numbers 43015 and 035059 (BOM 2020b; 2020c)
Rolleston (035059) Injune Post Office (43015)
Statistic Element
Mean Maximum
Temperature (°C)
Mean Minimum
Temperature (°C)
Mean Rainfall (mm)
Mean Maximum
Temperature (°C)
Mean Minimum
Temperature (°C)
Mean Rainfall (mm)
Period of Record 1987 - 2010 1987 – 2010 1987 – 2010 1967 - 2019 1967 - 2019 1925 - 2019
January 34.8 21 93.2 33.8 19.7 86.8
February 33.7 20.8 94 32.3 19.1 88.3
March 32.8 18.4 61.3 31 16.6 63
April 29.7 14.8 41.1 27.7 12 40.9
May 26.1 10.6 35.4 23.6 7.7 31.9
June 23 7.1 36.2 20.4 4.6 30.1
July 22.9 5.6 28.9 20.2 3.3 28.8
August 24.8 6.8 23.2 22.5 4.4 25.1
September 28.5 10.6 26.7 26.3 8.2 26.6
October 31.7 15 46 29.5 12.8 48.8
November 33 17.7 63.8 31.6 16 72
December 34.3 19.8 88.4 33.3 18.2 89.6
Annual 29.6 14 635.8 27.7 11.9 631.9

Santos GLNG Pty Ltd Towrie Development Area
Water Assessment Report
Page 35DX70010A01 May 2021
Figure 5.1 Topography Within the Vicinity of the Project area

Santos GLNG Pty Ltd Towrie Development Area
Water Assessment Report
Page 36DX70010A01 May 2021
Mean maximum temperatures range between ~35°C in the summer months and ~23°C in the winter months. Mean minimum temperatures range between ~21°C in the summer months and ~6°C in the winter months. The highest rainfall occurs during December to February, with the lowest rainfall occurring during May to September.
Evaporation data is not available for any nearby climate stations. Based on a review of the BOM evaporation spatial data for Australia (BOM 2020a), the average annual evaporation in the vicinity of the Project is between 2,000 and 2,400 mm. The highest evaporation occurs during the summer months (December to February; 200 to 300 mm (total evaporation for the period)), while the lowest evaporation occurs during the winter months (June to August; 100 to 200 mm (total evaporation for the period)).
Figure 5.2 presents daily rainfall between 1960 and 2020 for the Rolleston climate station1, and a rainfall excess / deficit trend for the same period. Rainfall excess / deficit trends present a running deviation of long-term actual rainfall against the average. This provides seasonal-scale identification of trends (wet / dry) and longer term (e.g. decadal) deviation from average conditions. These trends result in a natural tempering of peaks for rainfall events, and therefore support the correlation of rainfall events to aquifer responses
Figure 5.2 Daily Rainfall and Rainfall Excess / Deficit Trend (Rolleston #035059)
Observations from the rainfall / excess deficit trend include:
The overall rainfall trend is characterised by the cyclic nature of the wet and dry seasons,with fluctuations of ~250 mm evident across the record.
Large rainfall seasons occurred in 1974 and 2010, resulting in the increase in the rainfalltrend in ~200 mm, whereas the 2010/11 event occurrent as a result of several months ofabove average rainfall.
1 Rolleston airport (035059) station
-500
-250
0
250
500
750
1000
1250
1500
0
50
100
150
200
250
300
350
400
Jan-60 Jan-70 Jan-80 Jan-90 Jan-00 Jan-10 Jan-20
Rain
fall
Exce
ss /
Defic
it Tr
end
(mm
)
Daily
Rai
nfal
l (m
m)
Daily Rainfall Rainfall Excess / Deficit Trent
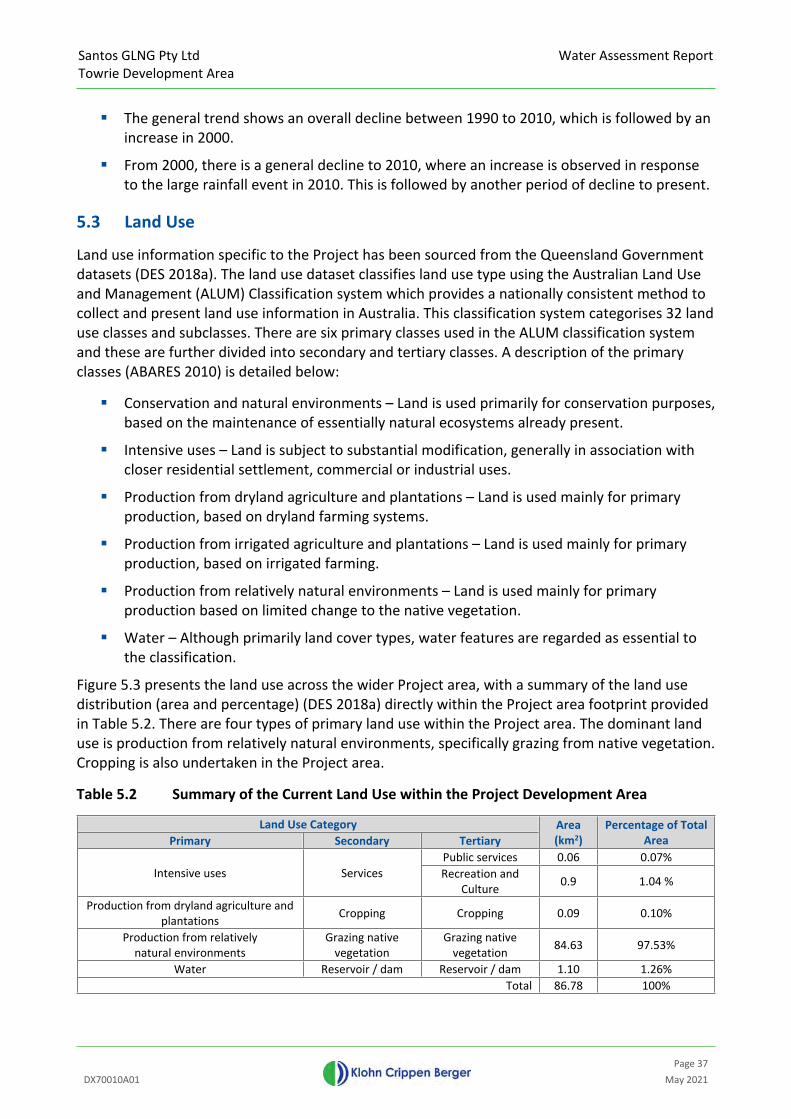
Santos GLNG Pty Ltd Towrie Development Area
Water Assessment Report
Page 37DX70010A01 May 2021
The general trend shows an overall decline between 1990 to 2010, which is followed by anincrease in 2000.
From 2000, there is a general decline to 2010, where an increase is observed in responseto the large rainfall event in 2010. This is followed by another period of decline to present.
5.3 Land Use
Land use information specific to the Project has been sourced from the Queensland Government datasets (DES 2018a). The land use dataset classifies land use type using the Australian Land Use and Management (ALUM) Classification system which provides a nationally consistent method to collect and present land use information in Australia. This classification system categorises 32 land use classes and subclasses. There are six primary classes used in the ALUM classification system and these are further divided into secondary and tertiary classes. A description of the primary classes (ABARES 2010) is detailed below:
Conservation and natural environments – Land is used primarily for conservation purposes,based on the maintenance of essentially natural ecosystems already present.
Intensive uses – Land is subject to substantial modification, generally in association withcloser residential settlement, commercial or industrial uses.
Production from dryland agriculture and plantations – Land is used mainly for primaryproduction, based on dryland farming systems.
Production from irrigated agriculture and plantations – Land is used mainly for primaryproduction, based on irrigated farming.
Production from relatively natural environments – Land is used mainly for primaryproduction based on limited change to the native vegetation.
Water – Although primarily land cover types, water features are regarded as essential tothe classification.
Figure 5.3 presents the land use across the wider Project area, with a summary of the land use distribution (area and percentage) (DES 2018a) directly within the Project area footprint provided in Table 5.2. There are four types of primary land use within the Project area. The dominant land use is production from relatively natural environments, specifically grazing from native vegetation. Cropping is also undertaken in the Project area.
Table 5.2 Summary of the Current Land Use within the Project Development Area
Land Use CategoryPrimary Secondary Tertiary
Area (km2)
Percentage of Total Area
Public services 0.06 0.07%Intensive uses Services Recreation and
Culture 0.9 1.04 %
Production from dryland agriculture and plantations Cropping Cropping 0.09 0.10%
Production from relativelynatural environments
Grazing native vegetation
Grazing native vegetation 84.63 97.53%
Water Reservoir / dam Reservoir / dam 1.10 1.26%Total 86.78 100%
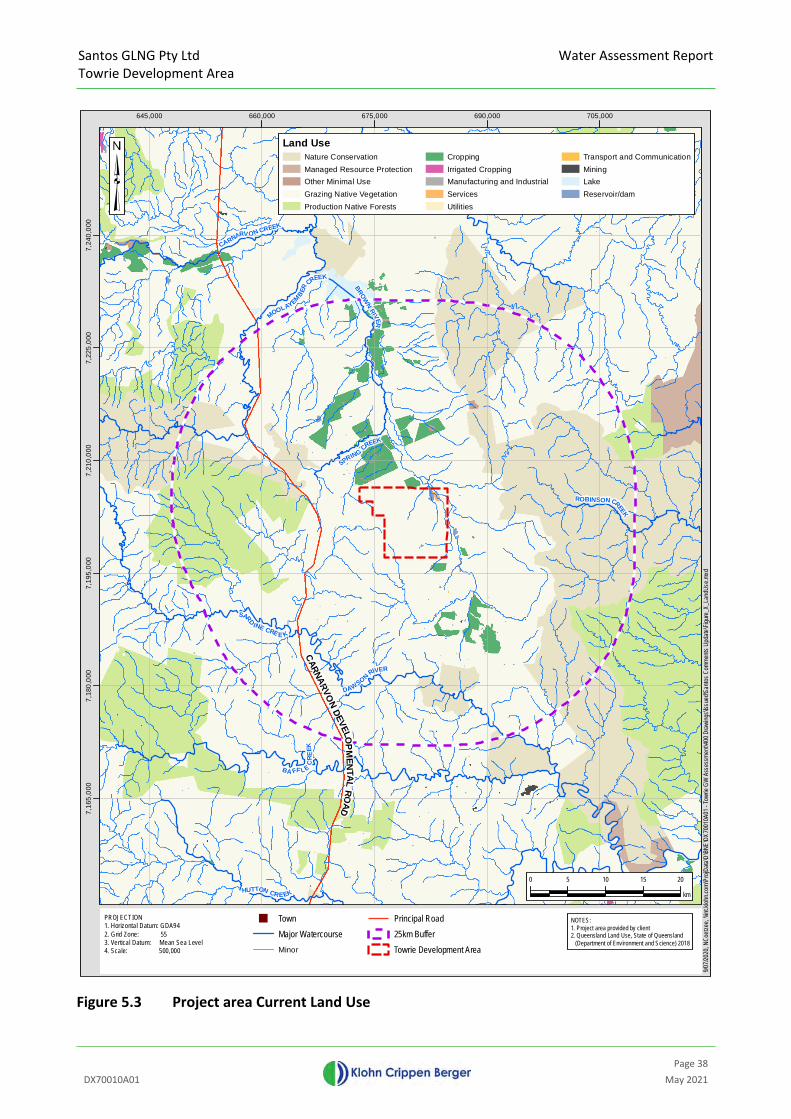
Santos GLNG Pty Ltd Towrie Development Area
Water Assessment Report
Page 38DX70010A01 May 2021
Figure 5.3 Project area Current Land Use
CARNARVONDEVELO
PMEN T AL
ROAD
ROBINSON CREEK
HUTTON CREEK
DAWSON RIVER
BROWN
RIVER
SARD
INE CRE E K
CLEM
ATISCREEK
BA FF LE
CRE
EK
SPRING
CREEK
CARNARV ON CREEK
MOOLAYEMBER
CREEK
645,000 660,000 675,000 690,000 705,000
7,16
5,00
07,
180,
000
7,19
5,00
07,
210,
000
7,22
5,00
07,
240,
000
0 5 10 15 20
km
PROJECTION1. Horizontal Datum: GDA942. Grid Zone: 553. Vertical Datum: Mean Sea Level4. Scale: 500,000
Land UseNature ConservationManaged Resource ProtectionOther Minimal UseGrazing Native VegetationProduction Native Forests
CroppingIrrigated CroppingManufacturing and IndustrialServicesUtilities
Transport and CommunicationMiningLakeReservoir/dam
NOTES:1. Project area provided by client2. Queensland Land Use, State of Queensland
(Department of Environment and Science) 2018
9/07/2
020,
NCo
etze
e, \\in
t.kloh
n.com
\Pro
jData
\D\B
NE\D
X700
10A0
1 - To
wrie
GW A
sses
smen
t\400
Dra
wing
s\Iss
ued\S
anto
s Com
ment
s Upd
ate\F
igure
_X_L
andU
se.m
xd
TownMajor WatercourseMinor
Principal Road25km BufferTowrie Development Area
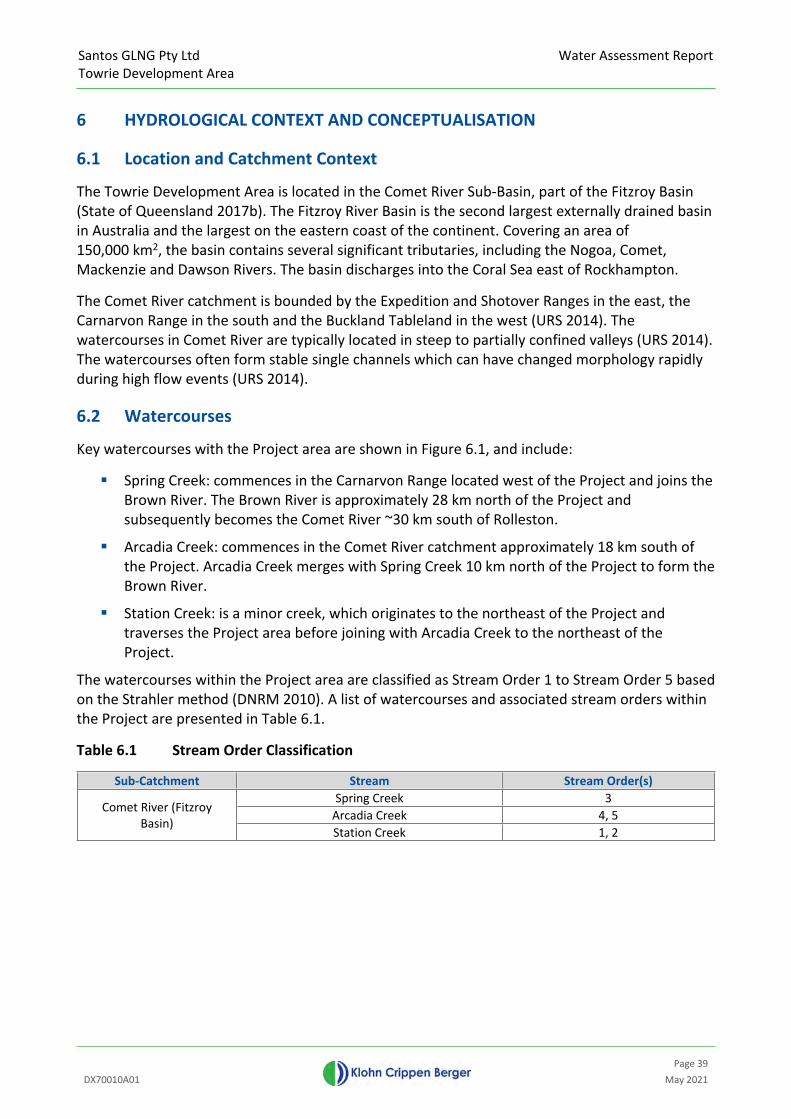
Santos GLNG Pty Ltd Towrie Development Area
Water Assessment Report
Page 39DX70010A01 May 2021
6 HYDROLOGICAL CONTEXT AND CONCEPTUALISATION
6.1 Location and Catchment Context
The Towrie Development Area is located in the Comet River Sub-Basin, part of the Fitzroy Basin (State of Queensland 2017b). The Fitzroy River Basin is the second largest externally drained basin in Australia and the largest on the eastern coast of the continent. Covering an area of 150,000 km2, the basin contains several significant tributaries, including the Nogoa, Comet, Mackenzie and Dawson Rivers. The basin discharges into the Coral Sea east of Rockhampton.
The Comet River catchment is bounded by the Expedition and Shotover Ranges in the east, the Carnarvon Range in the south and the Buckland Tableland in the west (URS 2014). The watercourses in Comet River are typically located in steep to partially confined valleys (URS 2014). The watercourses often form stable single channels which can have changed morphology rapidly during high flow events (URS 2014).
6.2 Watercourses
Key watercourses with the Project area are shown in Figure 6.1, and include:
Spring Creek: commences in the Carnarvon Range located west of the Project and joins theBrown River. The Brown River is approximately 28 km north of the Project andsubsequently becomes the Comet River ~30 km south of Rolleston.
Arcadia Creek: commences in the Comet River catchment approximately 18 km south ofthe Project. Arcadia Creek merges with Spring Creek 10 km north of the Project to form theBrown River.
Station Creek: is a minor creek, which originates to the northeast of the Project andtraverses the Project area before joining with Arcadia Creek to the northeast of theProject.
The watercourses within the Project area are classified as Stream Order 1 to Stream Order 5 based on the Strahler method (DNRM 2010). A list of watercourses and associated stream orders within the Project are presented in Table 6.1.
Table 6.1 Stream Order Classification
Sub-Catchment Stream Stream Order(s)Spring Creek 3
Arcadia Creek 4, 5Comet River (Fitzroy Basin)
Station Creek 1, 2
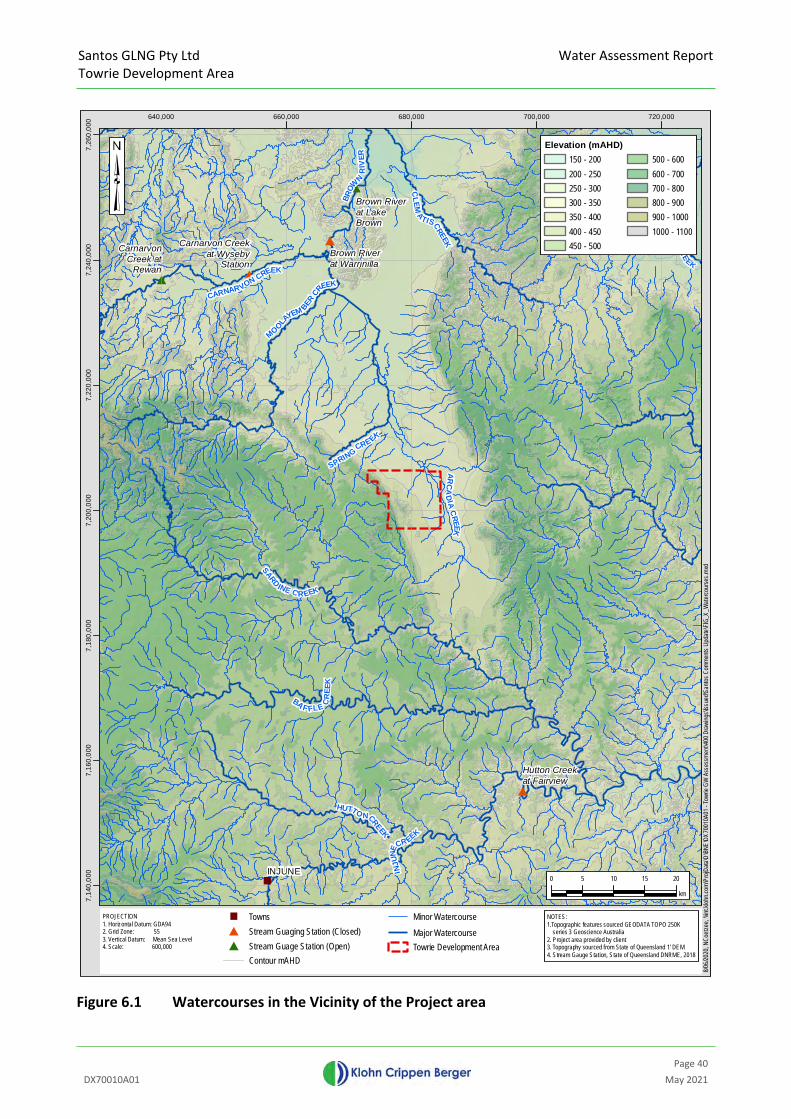
Santos GLNG Pty Ltd Towrie Development Area
Water Assessment Report
Page 40DX70010A01 May 2021
Figure 6.1 Watercourses in the Vicinity of the Project area
ARCA
DIAC
REEK
INJU
NE
CR EEK
HUTTO NCREEK
SARD INE C REEK
CLEM
ATISCREEK
BA F FLE CR
EEK
SPRINGCREEK
BROW
NR
IVER
CARNARVON CREEK
ZAMIA
CR
EEK
MOOLAYEM BER
CREEK
Hutton Creekat Fairview
Brown Riverat Warrinilla
Carnarvon Creekat Wyseby
Station
INJUNE
Brown Riverat LakeBrown
CarnarvonCreek at
Rewan
640,000 660,000 680,000 700,000 720,000
7,14
0,00
07,
160,
000
7,18
0,00
07,
200,
000
7,22
0,00
07,
240,
000
7,26
0,00
0
0 5 10 15 20
km
PROJECTION1. Horizontal Datum: GDA942. Grid Zone: 553. Vertical Datum: Mean Sea Level4. Scale: 600,000
Elevation (mAHD)150 - 200200 - 250250 - 300300 - 350350 - 400400 - 450450 - 500
500 - 600600 - 700700 - 800800 - 900900 - 10001000 - 1100
NOTES:1.Topographic features sourced GEODATA TOPO 250K series 3 Geoscience Australia
2. Project area provided by client 3. Topography sourced from State of Queensland 1' DEM4. Stream Gauge Station, State of Queensland DNRME, 2018
8/06/2
020,
NCo
etze
e, \\in
t.kloh
n.com
\Pro
jData
\D\B
NE\D
X700
10A0
1 - To
wrie
GW A
sses
smen
t\400
Dra
wing
s\Iss
ued\S
anto
s Com
ment
s Upd
ate\F
IG_X
_Wat
erco
urse
s.mxd
TownsStream Guaging Station (Closed)Stream Guage Station (Open)Contour mAHD
Minor Watercourse
Major WatercourseTowrie Development Area

Santos GLNG Pty Ltd Towrie Development Area
Water Assessment Report
Page 41DX70010A01 May 2021
The Comet River sub-catchment is heavily influenced by anthropogenic pressures. The State of Rivers Survey (DNRM 2000) identified that the catchment was regarded as being in a moderate to poor condition, with prominent bank instability caused by the presence of stock within the riparian zone, runoff, and vegetation clearing.
6.3 Wetlands
The Project area does not include any wetlands listed in the ‘Directory of Important Wetlands in Australia’ (Environment Australia 2001). However, there is one wetland listed in proximity to the Project, as shown on Figure 6.2:
Lake Nuga Nuga, located ~ 25 km north of the Towrie Development Area. The wetland liesin the broad valley between the Expedition and Carnarvon ranges with Mount Warrinilla atits northern extent. The significance of the wetland is listed as a large water body in anotherwise semi-arid area (DoEE 2019).
Lake Nuga Nuga is an inland seasonal and intermittent freshwater lake / flood plain. This wetland is considered geographically unusual as it is a large lake with a river levee and the main river (Brown River) blocked by a smaller tributary (Moolayember Creek).
A review of the Project area on the DES ‘Wetland Info’ website (DES 2019a) was undertaken. The Project area includes lacustrine, riverine and minor palustrine wetlands; and are presented in Figure 6.3. Lacustrine wetlands are open water dominated systems (e.g. dams and lakes). In turn, palustrine wetlands lack open or flowing water (e.g. marsh or bogs).
The wetlands identified within the Project area are larger farm dams associated with naturally occurring watercourses and drainage lines (AECOM 2021). These wetlands usually had raised banks on one or two sides and were also regularly accessed by cattle. However, small areas of wetland vegetation were commonly present on the low-lying fringes and riparian zones of the associated drainage line, providing refuge and foraging opportunities for other fauna. Cattle disturbance is present at these farm dams, including pugging at the water’s edge as well as sedimentation and reduced water quality.
The constructed wetland located in the northeast of the Project area, provides higher quality wetland habitat for a variety of fauna species (AECOM 2021). This constructed wetland is expansive during the wet season, and the one of largest in the local valley area, however, despite its relatively good condition, the wetland is regularly accessed by surrounding landholders as an agricultural water source. This combined with natural fluctuation in water levels during the dry season results in high variations in the wetland extent. Considerable modification has also occurred historically to this wetland. The entire western length was previously cleared and extensive damming works including the construction of an embankment has occurred at the north eastern extent. Outside of the embankment, the banks of the wetland are gentle slopes and large areas of shallow water with aquatic fringing vegetation occur especially in the south. Constructed embankments within the constructed wetland also provide narrow, low-lying vegetated islands when the wetland is fully inundated

Santos GLNG Pty Ltd Towrie Development Area
Water Assessment Report
Page 42DX70010A01 May 2021
Figure 6.2 Location of Wetlands Within Proximity to the Project
Lake NugaNuga
MOOLAYE
MBER CREE
K
CARNARVON CREEK
SARDI NE CREEK
CLEMATISCREEK
BULLAROOCREEK
ROBINSONCREEK
BAFFLE CREEK
DAWSONRIVER
SPRING CREEK
HUTTONCREEK
BR
OW
NRIVER
WALANGA RA
CREEK
BROW
NRI VER
DAW SONRI VER
640,000 660,000 680,000 700,000
7,16
0,00
07,
180,
000
7,20
0,00
07,
220,
000
7,24
0,00
07,
260,
000
0 5 10 15 20
km
PROJECTION1. Horizontal Datum: GDA942. Grid Zone: 553. Vertical Datum: Mean Sea Level4. Scale: 1:500,000
TownMajor WatercourseMinor
Wetland Location Towrie Development Area
NOTES:1. Topographic features sourced from GEODATA TOPO 250k series 3 Geosciene Australia2. Project area provided by client3. Background image courtesy of ESRI ArcGIS4. Wetlands described in A Directory of Important Wetlands in Australia, 3rd EditionEnvironment Australia 2001 by Wetland Inventory Team, Northern Region, EPA. Updated by Resource Assessment Unit, Qld. EPA 2005. (Qspatial)
9/07/2
020,
NCo
etze
e, \\in
t.kloh
n.com
\Pro
jData
\D\B
NE\D
X700
10A0
1 - To
wrie
GW A
sses
smen
t\400
Dra
wing
s\Iss
ued\S
anto
s Com
ment
s Upd
ate\F
IG_X
_Tow
rieW
etlan
dsPr
oject.
mxd

Santos GLNG Pty Ltd Towrie Development Area
Water Assessment Report
Page 43DX70010A01 May 2021
Figure 6.3 Location of Lacustrine and Palustrine Wetlands
Lake NugaNuga
HUT T ONC REEK
MOO
LAYEMBE
R CREEK
CARNARVON CREEK
SA RDINE CRE EK
CLEMATISCREEK
BULLAROOCREEK
BAFFLE CREEK
SPRING CREEK
BROW
NRIVERWALANGA RA
CREEK
ROBINSONCREEK
HUT TONCR EEK
DAW SONR IVER
BR
OWN
RIVER
640,000 650,000 660,000 670,000 680,000 690,000 700,000 710,000
7,15
0,00
07,
160,
000
7,17
0,00
07,
180,
000
7,19
0,00
07,
200,
000
7,21
0,00
07,
220,
000
7,23
0,00
07,
240,
000
7,25
0,00
0
0 5 10 15 20
km
PROJECTION1. Horizontal Datum: GDA942. Grid Zone: 553. Vertical Datum: Mean Sea Level4. Scale: 600,000
NOTES:1.Topographic features sourced GEODATA TOPO 250K series 3 Geoscience Australia
2. Project area provided by client 3. Topography sourced from State of Queensland 1' DEM4. Stream Gauge Station, State of Queensland DNRME, 2018
7/06/2
020,
NCo
etze
e, \\in
t.kloh
n.com
\Pro
jData
\D\B
NE\D
X700
10A0
1 - To
wrie
GW A
sses
smen
t\400
Dra
wing
s\Iss
ued\W
etlan
ds.m
xd
TownMajor WatercourseMinor
Wetland Location Towrie Development Area
WETLAND AREAS
01-50 RE
L REL WBP REP WBR RER WB
Santos GLNG Pty Ltd Towrie Development Area
Water Assessment Report
Page 44DX70010A01 May 2021
6.4 Flood Regime
Floodplain mapping sourced from the Queensland Government (DNRM 2013) is presented in Figure 6.4. The mapped data indicates that the Arcadia Creek and Station Creek floodplain areas cover a portion of the northeast corner of the Project area.
Flood modelling maps are available through Queensland Globe (DNRM 2017). Flood modelling mapping for a 1% annual exceedance probability (AEP), are available. The mapping indicates that for a 1% AEP flood event, flooding may occur in the Brown River as well as branching tributaries Arcadia Creek, Moolayember Creek and Station Creek.

Santos GLNG Pty Ltd Towrie Development Area
Water Assessment Report
Page 45DX70010A01 May 2021
Figure 6.4 Floodplain Assessment Overlay – Flood Extent for 1% AEP
DAWSO
N RIV
ER
SP
RI NGC RE
EK
BROW
NRIVER
SAR
D IN ECREEK
MOOL
AYEM
BER
CREEK
660,000 670,000 680,000 690,000 700,000
7,18
0,00
07,
190,
000
7,20
0,00
07,
210,
000
7,22
0,00
07,
230,
000
0 2 4 6 8 10
km
PROJECTION1. Horizontal Datum: GDA942. Grid Zone: 553. Vertical Datum: Mean Sea Level4. Scale: 300,000
NOTES:1. Topographic features sourced from GEODATA TOPO 250K series 3 Geoscience Australia
2. Project area provided by client3. Floodplain Assessment Overlay sourced from
DNRME, 2018
9/07/2
020,
NCo
etze
e, \\in
t.kloh
n.com
\Pro
jData
\D\B
NE\D
X700
10A0
1 - To
wrie
GW A
sses
smen
t\400
Dra
wing
s\Iss
ued\S
anto
s Com
ment
s Upd
ate\F
IG_X
_Floo
dplai
n.mxd
Major Watercourse
Minor Watercourse
Floodplain Assessment Overlay
Towrie Development Area
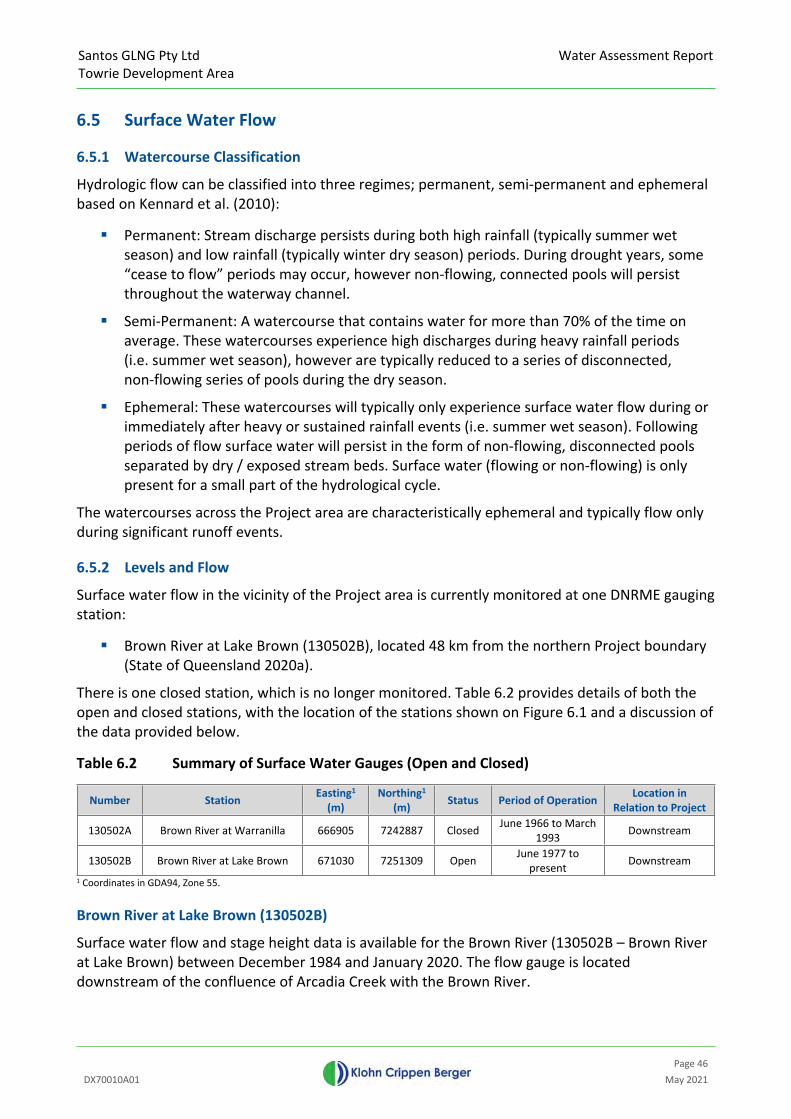
Santos GLNG Pty Ltd Towrie Development Area
Water Assessment Report
Page 46DX70010A01 May 2021
6.5 Surface Water Flow
6.5.1 Watercourse Classification
Hydrologic flow can be classified into three regimes; permanent, semi-permanent and ephemeral based on Kennard et al. (2010):
Permanent: Stream discharge persists during both high rainfall (typically summer wetseason) and low rainfall (typically winter dry season) periods. During drought years, some“cease to flow” periods may occur, however non-flowing, connected pools will persistthroughout the waterway channel.
Semi-Permanent: A watercourse that contains water for more than 70% of the time onaverage. These watercourses experience high discharges during heavy rainfall periods(i.e. summer wet season), however are typically reduced to a series of disconnected,non-flowing series of pools during the dry season.
Ephemeral: These watercourses will typically only experience surface water flow during orimmediately after heavy or sustained rainfall events (i.e. summer wet season). Followingperiods of flow surface water will persist in the form of non-flowing, disconnected poolsseparated by dry / exposed stream beds. Surface water (flowing or non-flowing) is onlypresent for a small part of the hydrological cycle.
The watercourses across the Project area are characteristically ephemeral and typically flow only during significant runoff events.
6.5.2 Levels and Flow
Surface water flow in the vicinity of the Project area is currently monitored at one DNRME gauging station:
Brown River at Lake Brown (130502B), located 48 km from the northern Project boundary(State of Queensland 2020a).
There is one closed station, which is no longer monitored. Table 6.2 provides details of both the open and closed stations, with the location of the stations shown on Figure 6.1 and a discussion of the data provided below.
Table 6.2 Summary of Surface Water Gauges (Open and Closed)
Number Station Easting1 (m)
Northing1 (m) Status Period of Operation Location in
Relation to Project
130502A Brown River at Warranilla 666905 7242887 Closed June 1966 to March 1993 Downstream
130502B Brown River at Lake Brown 671030 7251309 Open June 1977 to present Downstream
1 Coordinates in GDA94, Zone 55.
Brown River at Lake Brown (130502B)
Surface water flow and stage height data is available for the Brown River (130502B – Brown River at Lake Brown) between December 1984 and January 2020. The flow gauge is located downstream of the confluence of Arcadia Creek with the Brown River.

Santos GLNG Pty Ltd Towrie Development Area
Water Assessment Report
Page 47DX70010A01 May 2021
The monthly median daily discharge is shown in Figure 6.5 and indicates the majority of the flow occurs during January to March in response to wet season rainfall events, highlighting the ephemeral nature of the watercourse. The stage height is presented in Figure 6.6 and highlights the seasonality in the response.
Figure 6.5 Monthly Mean Daily Discharge at Brown river at Lake Brown (130502B), 1984 to 2020
Figure 6.6 Stage Height at Brown River at Lake Brown (130502B), Downstream of the Project area
0
10
20
30
40
50
60
70
80
90
100
Med
ian
Daily
Dis
char
ge (M
L / d
ay)
238
240
242
244
246
248
250
252
Jan-84 Dec-87 Dec-91 Dec-95 Dec-99 Dec-03 Dec-07 Dec-11 Dec-15 Dec-19
Stag
e He
ight
(mAH
D)
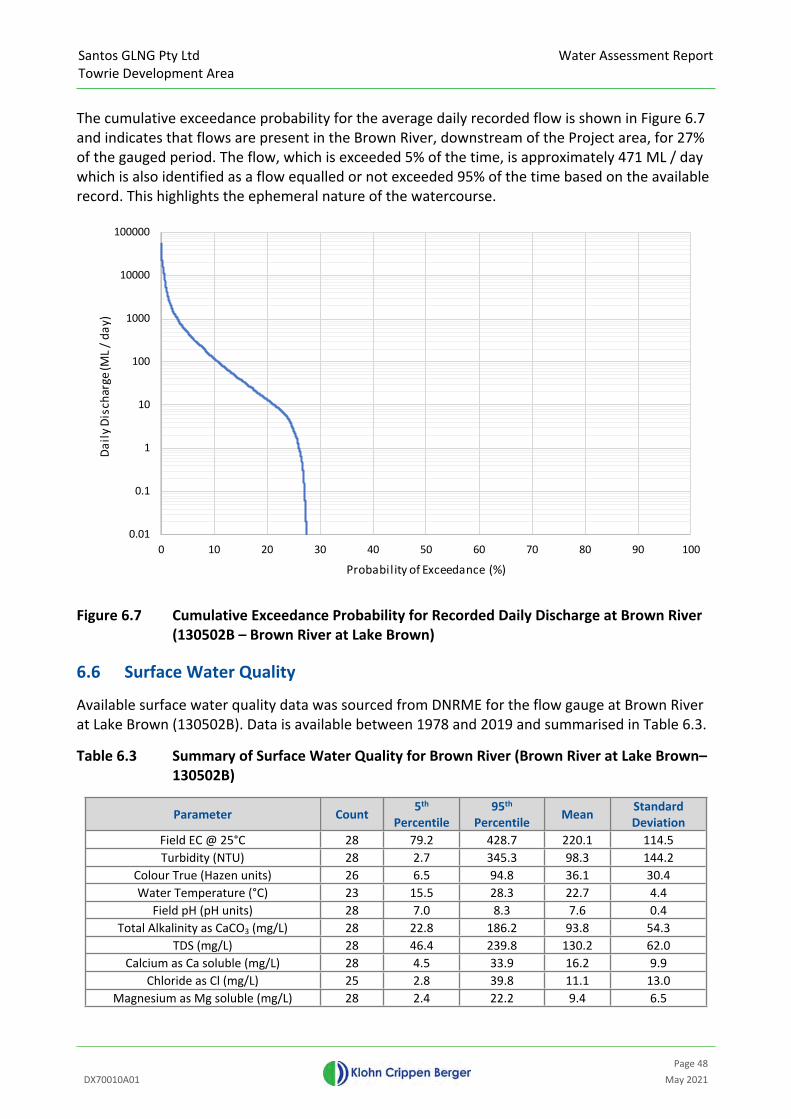
Santos GLNG Pty Ltd Towrie Development Area
Water Assessment Report
Page 48DX70010A01 May 2021
The cumulative exceedance probability for the average daily recorded flow is shown in Figure 6.7 and indicates that flows are present in the Brown River, downstream of the Project area, for 27% of the gauged period. The flow, which is exceeded 5% of the time, is approximately 471 ML / day which is also identified as a flow equalled or not exceeded 95% of the time based on the available record. This highlights the ephemeral nature of the watercourse.
Figure 6.7 Cumulative Exceedance Probability for Recorded Daily Discharge at Brown River (130502B – Brown River at Lake Brown)
6.6 Surface Water Quality
Available surface water quality data was sourced from DNRME for the flow gauge at Brown River at Lake Brown (130502B). Data is available between 1978 and 2019 and summarised in Table 6.3.
Table 6.3 Summary of Surface Water Quality for Brown River (Brown River at Lake Brown– 130502B)
Parameter Count 5th Percentile
95th Percentile Mean Standard
DeviationField EC @ 25°C 28 79.2 428.7 220.1 114.5Turbidity (NTU) 28 2.7 345.3 98.3 144.2
Colour True (Hazen units) 26 6.5 94.8 36.1 30.4Water Temperature (°C) 23 15.5 28.3 22.7 4.4
Field pH (pH units) 28 7.0 8.3 7.6 0.4Total Alkalinity as CaCO3 (mg/L) 28 22.8 186.2 93.8 54.3
TDS (mg/L) 28 46.4 239.8 130.2 62.0Calcium as Ca soluble (mg/L) 28 4.5 33.9 16.2 9.9
Chloride as Cl (mg/L) 25 2.8 39.8 11.1 13.0Magnesium as Mg soluble (mg/L) 28 2.4 22.2 9.4 6.5
0.01
0.1
1
10
100
1000
10000
100000
0 10 20 30 40 50 60 70 80 90 100
Daily
Dis
char
ge (M
L / d
ay)
Probability of Exceedance (%)
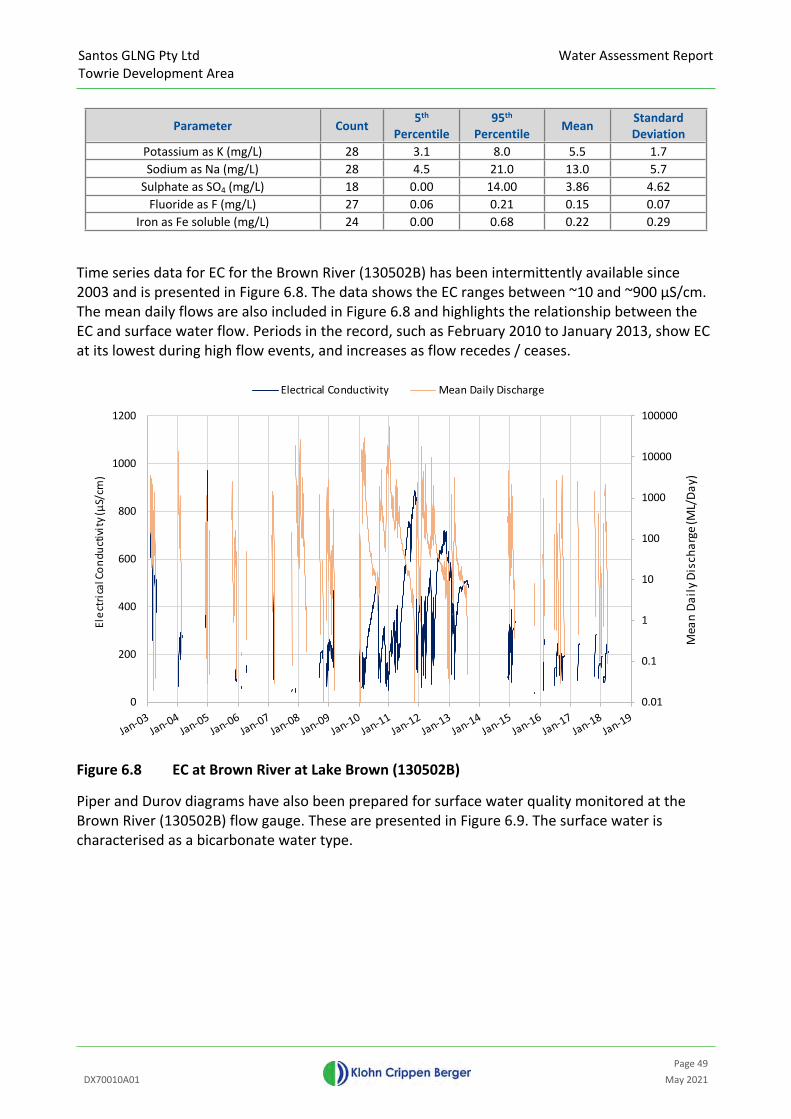
Santos GLNG Pty Ltd Towrie Development Area
Water Assessment Report
Page 49DX70010A01 May 2021
Parameter Count 5th Percentile
95th Percentile Mean Standard
DeviationPotassium as K (mg/L) 28 3.1 8.0 5.5 1.7Sodium as Na (mg/L) 28 4.5 21.0 13.0 5.7
Sulphate as SO4 (mg/L) 18 0.00 14.00 3.86 4.62Fluoride as F (mg/L) 27 0.06 0.21 0.15 0.07
Iron as Fe soluble (mg/L) 24 0.00 0.68 0.22 0.29
Time series data for EC for the Brown River (130502B) has been intermittently available since 2003 and is presented in Figure 6.8. The data shows the EC ranges between ~10 and ~900 µS/cm. The mean daily flows are also included in Figure 6.8 and highlights the relationship between the EC and surface water flow. Periods in the record, such as February 2010 to January 2013, show EC at its lowest during high flow events, and increases as flow recedes / ceases.
Figure 6.8 EC at Brown River at Lake Brown (130502B)
Piper and Durov diagrams have also been prepared for surface water quality monitored at the Brown River (130502B) flow gauge. These are presented in Figure 6.9. The surface water is characterised as a bicarbonate water type.
0.01
0.1
1
10
100
1000
10000
100000
0
200
400
600
800
1000
1200
Mea
n Da
ily D
isch
arge
(ML/
Day)
Elec
tric
al C
ondu
ctiv
ity (
μS/c
m)
Electrical Conductivity Mean Daily Discharge
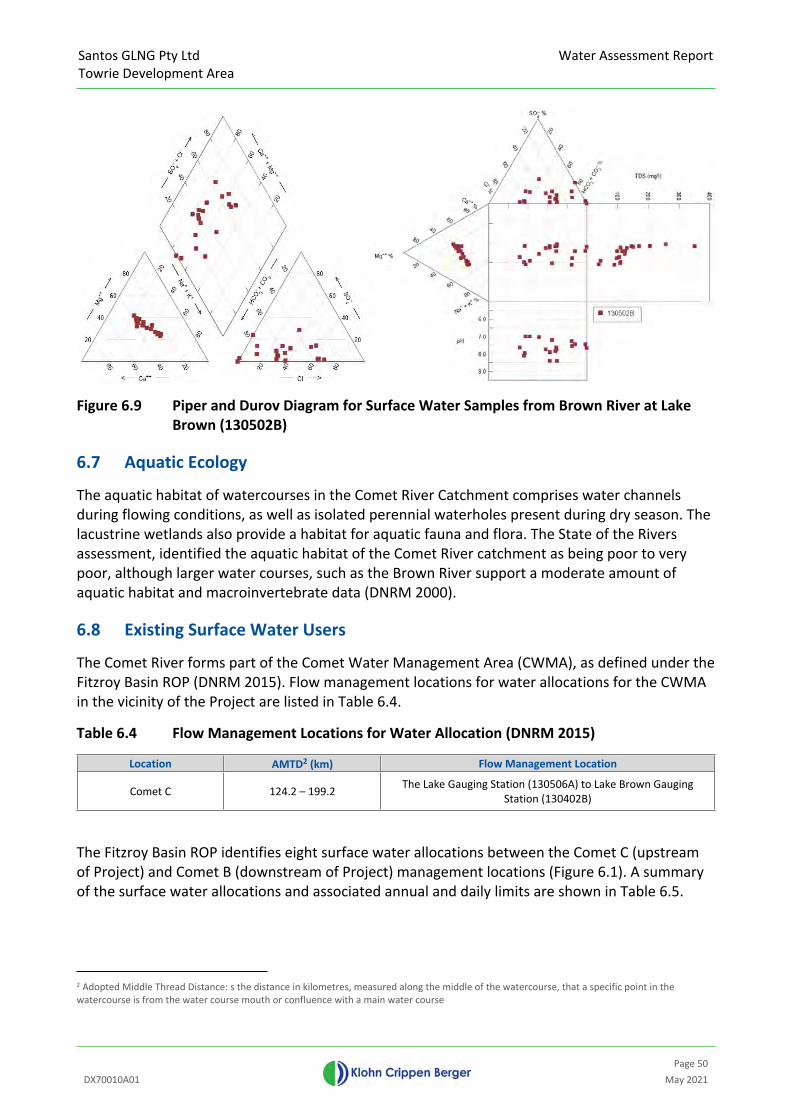
Santos GLNG Pty Ltd Towrie Development Area
Water Assessment Report
Page 50DX70010A01 May 2021
Figure 6.9 Piper and Durov Diagram for Surface Water Samples from Brown River at Lake Brown (130502B)
6.7 Aquatic Ecology
The aquatic habitat of watercourses in the Comet River Catchment comprises water channels during flowing conditions, as well as isolated perennial waterholes present during dry season. The lacustrine wetlands also provide a habitat for aquatic fauna and flora. The State of the Rivers assessment, identified the aquatic habitat of the Comet River catchment as being poor to very poor, although larger water courses, such as the Brown River support a moderate amount of aquatic habitat and macroinvertebrate data (DNRM 2000).
6.8 Existing Surface Water Users
The Comet River forms part of the Comet Water Management Area (CWMA), as defined under the Fitzroy Basin ROP (DNRM 2015). Flow management locations for water allocations for the CWMA in the vicinity of the Project are listed in Table 6.4.
Table 6.4 Flow Management Locations for Water Allocation (DNRM 2015)
Location AMTD2 (km) Flow Management Location
Comet C 124.2 – 199.2 The Lake Gauging Station (130506A) to Lake Brown Gauging Station (130402B)
The Fitzroy Basin ROP identifies eight surface water allocations between the Comet C (upstream of Project) and Comet B (downstream of Project) management locations (Figure 6.1). A summary of the surface water allocations and associated annual and daily limits are shown in Table 6.5.
2 Adopted Middle Thread Distance: s the distance in kilometres, measured along the middle of the watercourse, that a specific point in the watercourse is from the water course mouth or confluence with a main water course

Santos GLNG Pty Ltd Towrie Development Area
Water Assessment Report
Page 51DX70010A01 May 2021
Table 6.5 Summary of Surface Water Users in the Vicinity of the Project
Water Allocation Number Location Nominal Volume (ML/water year) Daily Volumetric Limit (ML/day)1151 Comet C 3,192 1901152 Comet C 1,596 951153 Comet C 1,596 951154 Comet C 1 1.51155 Comet C 236 86.41156 Comet C 435 25.91157 Comet C 175 10.41158 Comet C 4,590 389
Santos GLNG Pty Ltd Towrie Development Area
Water Assessment Report
Page 52DX70010A01 May 2021
7 HYDROGEOLOGICAL CONTEXT AND CONCEPTUALISATION
7.1 Geological Setting
The regional geology of the Project area comprises sediments from the Early Permian to Late Triassic age Bowen Basin. The Bowen Basin is an elongated, north to south trending basin extending over 160,000 km2 from central Queensland, south beneath the Surat Basin, and into New South Wales, where it connects with the Gunnedah and Sydney basins (OGIA 2019c).
The Bowen Basin contains up to 10 km of terrestrial and shallow-marine sediments (PM Green 1997; R. Korsch and Totterdell 2009). The southern Queensland and northernmost New South Wales portion of the basin is overlaid by up to 2.5 km of Early Jurassic to Early Cretaceous Surat Basin sedimentary sequences (Fielding et al. 2000; R. Korsch and Totterdell 2009).
The Project is located in the west of the Surat Cumulative Management Area, situated on Comet Ridge, and flanked by the Taroom Trough to the east and the Denison Trough to the west (P. Grech 2001; R. Korsch and Totterdell 2009). Having developed inbound of an active convergence margin during the New England Orogeny, the Bowen Basin formed within a backarc tectonic setting (R. Korsch and Totterdell 2009), concurrently with the Gunnedah Basin.
Regionally, Cenozoic sedimentary deposits overlay the Bowen Basin units, formed through subsidence-related faulting and erosion, in conjunction with fluvial sedimentary depositional processes (Laronne and Shlomi 2007; Nichols and Fisher 2007; R. J. Korsch et al. 2009). Crustal thinning due to extensional tectonic events resulted in magma upwelling and intermittent volcanism, expressed as basaltic lava flows throughout the Bowen Basin as well as interbedded tuff and volcanolithic fragments within the Cenozoic sedimentary sequences (R. Korsch and Totterdell 2009).
7.1.1 Geological Structures
The Project area is situated in the eastern extent of the north-northwest to south-southeast trending Denison Trough (Olgers et al. 1963; Totterdell 1990), which is bounded by the Anakie Inlier and the Collinsville, Springsure and Roma shelves in the west, and the Comet Platform to the east (Totterdell 1990).
Early Permian east-west or northeast-southwest extensions formed a series of half-grabens across the Denison Trough (McLoughlin 1986). Recent studies have indicated that a complex interplay of volcanism, mechanical extension, thermal cooling, thrust-related flexuring of the lithosphere and dynamic platform tilting resulted in block subsidence during the Late Carboniferous to Early Permian, resulting in rapid sedimentary infill forming a thin veneer across the trough (R. Korsch and Totterdell 2009). Extension was followed by mid-Permian mild compression, then more intense northeast-southwest oriented compression in the Late Triassic (McLoughlin 1986; R. J. Korsch et al. 2009; R. Korsch and Totterdell 2009).
Various northwest to southeast trending extensional bounding-faults of half-grabens, resulting from block subsidence during the Late Carboniferous to Early Permian, occur regionally across the Denison Trough (R. Korsch and Totterdell 2009; R. J. Korsch et al. 2009).
In addition to faulting, a series of regional scale, meridional en échelon synclines and anticlines occur adjacent to the faulting in a north-northwest to south-southeast orientation (McLoughlin

Santos GLNG Pty Ltd Towrie Development Area
Water Assessment Report
Page 53DX70010A01 May 2021
1986). Folds such as the Springsure Anticline, Inglis Serocold Anticline, Rewan Syncline and Consuelo Anticline are located to the southwest of the Project, and the Mimosa Syncline to the southeast (McLoughlin 1986; R. Korsch and Totterdell 2009; R. J. Korsch et al. 2009). Small-scale, discontinuous folds occur sporadically across the Project area, and are likely parasitic to the larger folds previously mentioned (McLoughlin 1986). The structural history of this area (Denison Trough) indicates that the major folding event effecting the Permian rocks occurred between the Triassic and Jurassic (Power 1967; McLoughlin 1986). The Arcadia anticline also runs through the Towrie Development Area, and transitions into the Purbrook anticline in the north.
Further discussion related to the structural elements directly within the Project area is included in Section 7.3.
7.2 Regional Hydrostratigraphy
The mapped geology within the vicinity of the Project is presented in Figure 7.1 and
Figure 7.2. Stratigraphic units of relevance to the Project include:
Quaternary alluvial deposits located along the Brown River and major tributaries;
Early to Middle Triassic sediments of the Clematis Group;
Early Triassic sediments of the Rewan Group;
Late Permian sediments of the Bandanna Formation; and
Late Permian sediments of the Back Creek Group.

Santos GLNG Pty Ltd Towrie Development Area
Water Assessment Report
Page 54DX70010A01 May 2021
Figure 7.1 Surface Geology in Proximity to the Project (State Surface Geology (DNRME 2015))
CARNARVONCRE E KCLEM
ATI S CREEK
BR
OWN
RIV
ER
Rm
RmRm
Rm
Rm
Rm
TQrTQr
TQr
TQr
TQr
TQr
TQr
TQr
TQr
TQr
TQr
TQr
TQr
Re
Re
Re
Re
Re
Re
Re
Qa
ReQa
QaQa
Qa
Qa
Qa
Qa
Qa
Tm
Tm
Tm
Tm
Tv
W
W
Rr
Rr
RrRr
RrRr
Jb
Jb
ROBINSONCREEK
DAW SON
RIVER
BROWN RIVER
S ARDINE C REEK
CLE
MATIS CREEK
BAFF L ECR
E EK
SPRING
CREEK
CARNARVON CREEK
MOO LAYEMB
ERCREEK
650,000 700,000
7,20
0,00
07,
250,
000
PROJECTION1. Horizontal Datum: GDA942. Grid Zone: 553. Vertical Datum: Mean Sea Level4. Scale: 1: 800,000
Town
Major Watercourse
Minor
Cross Section
Towrie Development Area
25km Buffer
NOTES1. Project area provided by client 2. State Surface Geology (1:2m), sourced from DNRME, 2015
8/06/2
020,
NCo
etze
e, \\in
t.kloh
n.com
\Pro
jData
\D\B
NE\D
X700
10A0
1 - To
wrie
GW A
sses
smen
t\400
Dra
wing
s\Iss
ued\S
anto
s Com
men
ts Up
date\
FIG_
X_Su
rface
Geolo
gy.m
xd
0 5 10 15 20
km
N
S
W E
Fault
Structure
Surface GeologyQuaternary alluvium and lacustrine deposits(Qa)
Geological Boundary
AnticlineAnticline ConcealedSynclineLake, Lagoon or Waterhole
TQr-QLD (TQr)
Oligocene-Miocene sediments (Tm)
Td-QLD (Td)Tertiary volcanics; some plugs (Tv)Paleocene-Oligocene sediments (Tl)
Moolayember Formation (Rm)Clematis Group (Re)Rewan Group (Rr)Blackwater Group (Pw)Back Creek Group (Pb)Water body (W)
Hutton Sandstone, Evergreen Formation,Precipice Sandstone (Jb)
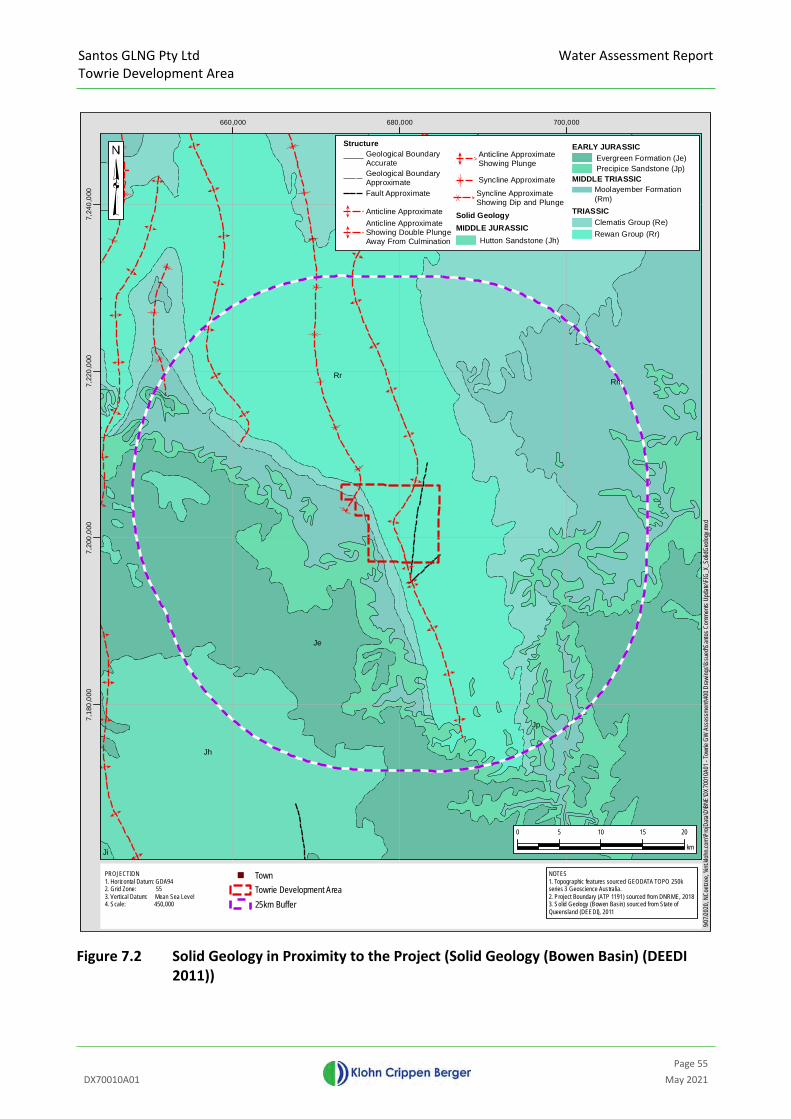
Santos GLNG Pty Ltd Towrie Development Area
Water Assessment Report
Page 55DX70010A01 May 2021
Figure 7.2 Solid Geology in Proximity to the Project (Solid Geology (Bowen Basin) (DEEDI 2011))
Re
Rr
Ji
Jh
Je
Rm
Jp
660,000 680,000 700,000
7,18
0,00
07,
200,
000
7,22
0,00
07,
240,
000
PROJECTION1. Horizontal Datum: GDA942. Grid Zone: 553. Vertical Datum: Mean Sea Level4. Scale: 450,000
TownTowrie Development Area25km Buffer
NOTES1. Topographic features sourced GEODATA TOPO 250k series 3 Geoscience Australia. 2. Project Boundary (ATP 1191) sourced from DNRME, 20183. Solid Geology (Bowen Basin) sourced from State of Queensland (DEEDI), 2011
9/07/2
020,
NCo
etze
e, \\in
t.kloh
n.com
\Pro
jData
\D\B
NE\D
X700
10A0
1 - To
wrie
GW A
sses
smen
t\400
Dra
wing
s\Iss
ued\S
anto
s Com
men
ts Up
date\
FIG_
X_So
lidGe
ology
.mxd
0 5 10 15 20
km
Moolayember Formation(Rm)
Structure
TRIASSIC
Geological BoundaryAccurateGeological BoundaryApproximateFault Approximate
Anticline ApproximateAnticline ApproximateShowing Double PlungeAway From Culmination
Anticline ApproximateShowing Plunge
Syncline Approximate
Syncline ApproximateShowing Dip and Plunge
Clematis Group (Re)Solid Geology
Rewan Group (Rr)MIDDLE JURASSIC
MIDDLE TRIASSIC
EARLY JURASSICEvergreen Formation (Je)Precipice Sandstone (Jp)
Hutton Sandstone (Jh)

Santos GLNG Pty Ltd Towrie Development Area
Water Assessment Report
Page 56DX70010A01 May 2021
Table 7.1 presents the hydrostratigraphic column for the units occurring in the vicinity of the Project. The table also identifies the hydrogeological characteristic of each unit as presented by OGIA (OGIA 2019c), as well as the relevance to the Towrie Development Area.
Table 7.1 Stratigraphic column for the Project area (OGIA 2019c)
Age FormationHydrostratigraphic Description (OGIA
2019b)
Relevance to Towrie Development Area
Quaternary Alluvium Aquifer Mapped associated with watercourses
Hutton Sandstone AquiferOutcrops ~20 km to the southwest of the Project
area Middle
Evergreen Formation Aquitard Outcrops to the south and west of the Project area
Jurassic
Early Precipice Sandstone Aquifer Outcrops to the south, west and east of the Project area
Moolayember Formation Tight Aquitard Outcrops along the western boundary of Project area
MiddleClematis Group Aquifer Outcrops along the western
boundary of Project area
Rewan Group Tight Aquitard Outcrops within Project area
Triassic
Early
Bandanna Formation Interbedded Aquitard Target CSG formation
Black Alley Shale
Permian LateBack Creek Group
Peawaddy Formation
- Sub-crops northwest of Towrie Development Area
A summary of each of these units is provided in the following sections (from youngest to oldest).
Alluvium
Within the Fitzroy Basin, Quaternary Alluvium is associated with the Comet River, downstream of the Project area. The alluvium consists of fine- to coarse-grained gravels and channel sands interbedded with clays. The sediments are typically between 14 - 26 m thick and narrow (OGIA 2019a). The sediments are described as unconsolidated to semi consolidated and are mapped extending south from Comet River concurrent with Brown River and Spring Creek, to the north of the Project area. Associated with the Brown River within the Arcadia valley the alluvial plains are dominated by clayey soils (URS 2010).
Hutton Sandstone
The Hutton Sandstone was deposited in a non-marine environment by meandering streams on a broad floodplain (Exon 1976). Floodplains consists mainly of sandstone with interbedded siltstone, shale, minor mudstone and coal. The sandstone is white to light grey, fine to medium-grained,
Santos GLNG Pty Ltd Towrie Development Area
Water Assessment Report
Page 57DX70010A01 May 2021
well sorted, generally quartz-rich, partly porous with some pebble bands, shale, and siltstone clasts in the lower part. Siltstones and shales are micaceous, carbonaceous and commonly interlaminated with very fine-grained sandstone (P Green 1997). It is highly heterogeneous, with limited sand bodies in the vertical and lateral extent.
Evergreen Formation
The Evergreen Formation conformably overlies the Precipice Sandstone and separates the Precipice Sandstone from the Hutton Sandstone. The Evergreen Formation is considered an aquitard and generally consists of mudstones laminated with fine-grained sandstone, siltstone and shale (P Green 1997).
Precipice Sandstone
The Precipice Sandstone is the basal unit of the Surat Basin, which overlies the Moolayember Formation and sedimentary sequences of the Bowen Basin. Lower and upper sub-units are often separated by a siltstone or shale unit. The layers with the coarsest grain sizes were deposited by transverse bars in a braided stream system and the sediment layers with finer grain sizes were deposited in a lower energy fluviatile meandering system (Martin 1981). The lower sub-unit, also known as the Precipice Braided Stream Facies (or Precipice BSF), consists of white, fine to very coarse-grained, in part pebbly, thin to very thickly bedded, porous, quartz rich sandstone with a white clay matrix (Exon 1976).
Moolayember Formation
The Middle to Upper Triassic Moolayember Formation comprises interbedded mudstones, lithic, medium to coarse-grained sandstone, carbonaceous shales, siltstones, and conglomerates, and is the youngest formation within the Bowen Basin (PM Green et al. 1997; PM Green 1997). The lower part of the Moolayember Formation was deposited in a lacustrine depositional environment that grades upwards into an alluvial plain with alluvial fans on the eastern margin (Golin and Smyth 1986). The thickness of this formation varies from 200 m on the Springsure Shelf to nearly 1,500 m in the centre of the Taroom Trough (Radke et al. 2000). The Moolayember Formation is characterised as a tight aquitard (OGIA 2019c). The formation is absent for most of the Project area.
Clematis Group
The Lower to Middle Triassic Clematis Group (formally, Clematis Sandstone) consists of medium to coarse-grained, cross-bedded, quartzose to sub-labile and micaceous sandstone; siltstone, mudstone and granule to pebble conglomerate; some fine conglomerate; and grey and red mudstone, deposited within a fluvial environment. The Clematis Group includes two geological formations within the Denison Trough: the Expedition Sandstone (a quartzose sandstone, conglomerate, siltstone and mudstone package) and the Glenidal Formation (thinly bedded, very fine to medium-grained sandstone with common siltstones and mudstones), which conformably overlies the Early Triassic Rewan Group (Brakel et al. 2009). The Expedition Sandstone is equivalent to the Showgrounds Sandstone in the Taroom Trough (Hoffmann, Green, and Gray 1997).

Santos GLNG Pty Ltd Towrie Development Area
Water Assessment Report
Page 58DX70010A01 May 2021
The Clematis Group is considered to be a major aquifer that forms part of the Bowen Basin Sequence. The formation is limited or absent across most of the Project area. Outcrops of the Clematis Group are located east of the Project within the Expedition Range (Olgers et al. 1963; Brakel et al. 2009). It is not considered a relevant aquifer in this study, in terms of third-party groundwater use, and generally occurs at elevations greater than typical ground levels of proposed CSG wells, however it is the source of a number of spring complexes (Section 7.9.1) (Queensland Herbarium 2018a), which are located greater than 10 km away to the west-northwest of the Project area. The Clematis Group is separated from the Bandanna Formation (target for CSG production) by a thick sequence of the Rewan Group aquitard.
Rewan Group
The Early Triassic Rewan Group conformably overlies Permian sediments, and predominantly consists of lithic sandstone, pebbly lithic sandstone, green to reddish brown mudstone and minor volcanolithic pebble conglomerate (at base), deposited in a fluvial-lacustrine environment (Brakel et al. 2009). This sedimentary sequence thickens towards the centre of the Taroom Trough, east of the Project, and outcrops to the northeast.
The Rewan Group is considered to be a tight aquitard (OGIA 2019c).
Bandanna Formation
The Late Permian Bandanna Formation conformably overlies the Late Permian Back Creek Group (McLoughlin 1986), and consists of calcareous sandstone, calcareous shale, mudstone, permeable coal seams, and concretionary limestone (Huleatt 1991).
The calcareous sediments of the Bandanna Formation are interbedded with regionally discontinuous coal seams, which are the target for the Project CSG production, as well as much of the coal mining in the Bowen Basin (Huleatt 1991).
The sedimentary sequences of the Bandanna Formation deepen towards the southeast, and outcrop north of the Project area (Huleatt 1991). The Bandanna Formation is one of the most widespread and youngest coal-bearing Permian sequences in the Bowen Basin, and correlates with the upper sections of the Baralaba Coal Measures in the southeast and the upper part of the Rangal Coal Measures in the southwest of the basin (Huleatt 1991). The Bandanna Formation is considered as an interbedded aquitard (OGIA 2019c).
Back Creek Group
The Late Permian Back Creek Group comprises quartzose to lithic sandstone, siltstone, mudstone, carbonaceous shale, calcareous sandstone and siltstone, conglomerate, coal, limestone and sandy coquinite. The Back Creek Group contains various Permian sedimentary units, most notably the Black Alley Shale, Aldebaran Sandstone, the Cattle Creek Formation, and the Reids Dome Beds (Bowen Basin basement sequence).
Directly underlying the Bandanna Formation (and confining the earlier successions of the Back Creek Group) is the Black Alley Shale, composed of marine mudstone facies, which becomes increasingly sandy northwards of the northern Taroom Trough (Ayaz et al. 2016). The Black Alley Shale varies in thickness between 7 and 200 m in the southern extents of the Bowen Basin, and thickens into the Denison Trough (Ayaz et al. 2016). The Black Alley Shale is most likely the result

Santos GLNG Pty Ltd Towrie Development Area
Water Assessment Report
Page 59DX70010A01 May 2021
of deposition from an eastward progradation of deltaic lobes during a minor transgression or restricted marine event in the Bowen Basin.
The Aldebaran Sandstone is a thick sequence of sandstones, conglomerates and minor mudstones and coals which accumulated within, and eventually beyond, the Denison Trough during the early Permian (Olgers et al. 1963). The unit reaches a maximum thickness of over 700 m and is covered by up to 1,400 m of Permo-Triassic strata of the upper Bowen Basin, Jurassic strata of the Surat Basin and Cenozoic basalt and alluvium. In the far south, it directly overlies the Reids Dome Beds (Baker 1991). The Aldebaran Sandstone represents a deltaic depositional environment that gradually replaced the marine environment of the Cattle Creek Formation (Dickins and Malone 1973).
Horizons of the Cattle Creek Formation comprises dark grey, poorly sorted and poorly bedded conglomeratic silty sandstone and mudstone containing scattered large angular boulders, with thin interbeds of limestone and calcareous sandstone (Dickins and Malone 1973). Coal is also present within the Cattle Creek Formation, and has recently been a target for CSG exploration (OGIA 2019c). The Cattle Creek Formation was deposited within a shallow marine shelf to prodelta depositional environment (Dickins and Malone 1973; Jackson, Hawkins, and Bennett 1980).
The Reids Dome Beds, the lowest unit of the Back Creek Group, outcrop in areas of the Springsure Anticline and as a thin sequence approximately 110 km west of Springsure (Dickins and Malone 1973). These beds have a maximum thickness of approximately 2,760 m, and consist of: a basal unit of black shale and mudstone with coal seams interbedded with hard carbonaceous sandstones and orthoquartzites; a middle unit of black to grey carbonaceous micaceous shale, siltstone and sandstone with minor coal and thin dolomite beds with local thick beds of polymictic conglomerate (particularly in the south); and an upper unit of interbedded fine- to coarse-grained carbonaceous sandstone, dark carbonaceous siltstone, shale and coal (Olgers et al. 1963; Dickins and Malone 1973).
7.3 Local Hydrogeology
The Towrie Development Area is underlain by a surficial covering of Cenozoic-aged residual and colluvial deposits (TQr), associated with Arcadia Creek. The Jurassic Precipice Sandstone is mapped as outcropping in the southwest corner of the Project area; while the Hutton Sandstone, Evergreen Formation and Precipice Sandstone are mapped on the surface to the west, south and east of the Project area. Underlying the Cenozioc-aged sediments, and the Jurassic units, are the Triassic Moolayember Formation, Clematis Group and Rewan Group. These Triassic units’ outcrop within the Project area with the Moolayember Formation and Clematis Group mapped as outcropping in the southwest region of the Project area; while the Rewan Group is the most prominent unit mapped as outcropping through the Project area.
Two cross sections, oriented north-south and west-east through the Project area are presented in Figure 7.3 and Figure 7.4. The location of the cross sections is shown on
Figure 7.2. The sections have been prepared using the OGIA groundwater model geometry (OGIA 2019e).

Santos GLNG Pty Ltd Towrie Development Area
Water Assessment Report
Page 60DX70010A01 May 2021
The north-south section shows the Bandanna Formation slightly dipping to the south, with Rewan Group extent present across the entire Project area. The west-east section highlights the Rewan Group outcropping across the majority of the Arcadia Valley. Rewan Group thickness within the vicinity of the Project area ranges from ~250 m to ~700 m.
Discussion related to the local hydrogeology and conceptual understanding is provided in the following sections.

Santos GLNG Pty Ltd Towrie Development Area
Water Assessment Report
Page 61DX70010A01 May 2021
Figure 7.3 North-South Oriented Cross Section
-1400
-1200
-1000
-800
-600
-400
-200
0
200
400
600
800
Elev
atio
n (m
AHD
)
0 2 4 6 8 10 12 14 16 18 20 22 24 26 28 30 32 34 36 38 40 42 44 46 48 50 52 54 56 58 60Chainage (km)
Alluvuim
L23 Precipice Sandstone
L24 Moolayember Formation
L25 Clematis Group
L26 Rewan Group
L28 Upper Bandanna Formation
L29 Lower Bandanna Formation
L30 Lower Bowen 1
L31 Cattle Creek Formation Non-productive Zone
L32 Upper Cattle Creek Formation
L33 Lower Cattle Creek Formation
Brow
n Ri
ver
Sprin
g Cr
eek
Daw
son
Rive
r
N S
Towrie Development Area
\\in
t.klo
hn.c
om\P
rojD
ata\
D\BN
E\D0
9620
A00
- Orig
in P
roje
cts 2
019\
D096
20A8
1 - F
DA W
ater
Ass
essm
ents
\400
Dra
win
gs\G
raph
er\M
embr
ance
\Iss
ued\
FIG_
X_De
niso
n_Cr
ossS
ectio
n_A4
_Lan
dsca
pe_N
W_S
E.gr
f

Santos GLNG Pty Ltd Towrie Development Area
Water Assessment Report
Page 62DX70010A01 May 2021
Figure 7.4 West-East Oriented Cross Section
-1800
-1600
-1400
-1200
-1000
-800
-600
-400
-200
0
200
400
600
800
Elev
atio
n (m
AHD
)
0 2 4 6 8 10 12 14 16 18 20 22 24 26 28 30 32 34 36 38 40 42 44 46 48 50 52 54 56 58 60Chainage (km)
Alluvium
L24 Moolayember Formation
L25 Clematis Group
L26 Rewan Group
L27 Bandanna Formation Non-productive Zone
L28 Upper Bandanna Formation
L29 Lower Bandanna Formation
L30 Lower Bowen 1
L31 Cattle Creek Formation Non-productive Zone
L32 Upper Cattle Creek Formation
L33 Lower Cattle Creek Formation
L34 Lower Bowen 2
Robi
nson
Cre
ek
W E
Towrie Development Area
\\in
t.klo
hn.c
om\P
rojD
ata\
D\BN
E\D0
9620
A00
- Orig
in P
roje
cts 2
019\
D096
20A8
1 - F
DA W
ater
Ass
essm
ents
\400
Dra
win
gs\G
raph
er\M
embr
ance
\Iss
ued\
FIG_
X_De
niso
n_Cr
ossS
ectio
n_A4
_Lan
dsca
pe_N
W_S
E.gr
f

Santos GLNG Pty Ltd Towrie Development Area
Water Assessment Report
Page 63DX70010A01 May 2021
The mapped alluvium located in the vicinity of the Project area is to the north of the Project area and is associated with the Brown River, Spring Creek and Arcadia Creek. A review of available data from the GWDB ‘stratigraphy table’ (DNRME 2019a) indicates the alluvium associated with these alluvial deposits can be up to 29 m thick. Figure 7.5 presents the available thickness data from the GWDB for the alluvium and also includes the location of bores inferred to have intersected alluvium.
The surficial Quaternary and Tertiary units mapped within the vicinity of the Project area are separated from the Bandanna Formation by the Rewan Group aquitard. Within the Project area, the Rewan Group outcrops, and occurs as an elevation high, dipping away in all directions, as identified in the north-south (Figure 7.3) and east-west (Figure 7.4) orientated cross-sections. Isopachs for the Rewan Group and Bandanna Formation are presented in Figure 7.6. The Rewan Group aquitard is laterally extensive within and beyond the extents of the Project area, with a thickness of up to ~600 m directly beneath underlying the tenure. The Bandanna Formation is up to ~300 m thick within the Project area.
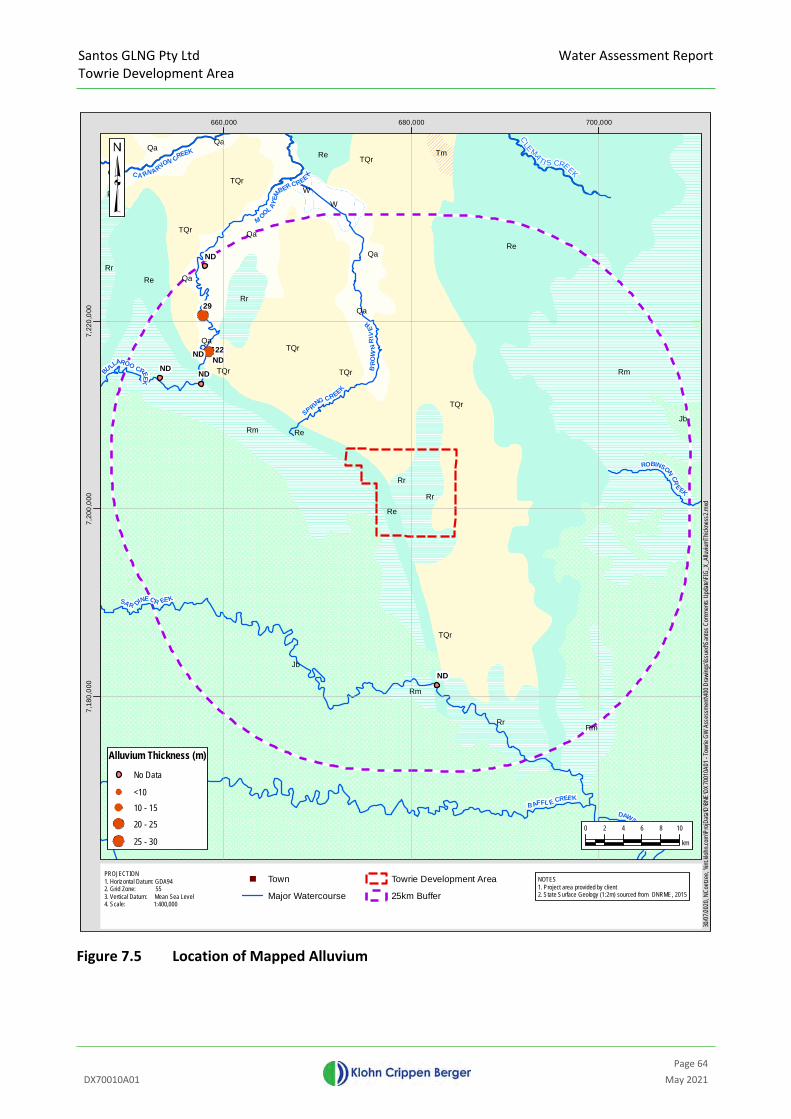
Santos GLNG Pty Ltd Towrie Development Area
Water Assessment Report
Page 64DX70010A01 May 2021
Figure 7.5 Location of Mapped Alluvium
CLEMA
TI S CREEK
Rm
Rm
Rm
Rm
TQr
TQr
TQr
TQr
TQr
TQr
TQr
TQr
TQr
Re
Re
Re
Re
Qa
Re
Qa
Qa
Qa
Qa
Qa
Qa
Qa
Tm
W
W
Rr
Rr
Rr
Rr
Rr
Rr
Jb
Jb
M OOL AY
EM
BERCREE K
ROBINSONCR
EEK
SA R DINECR EEK
BU
LLAROO CREEK
B AFFL E CREEK
SPRINGCREEK
DAWSONRI VER
BRO
WN
RIV
E
R
CA RN ARVON CR
EEK
29
NDND
ND
22ND
ND
ND
660,000 680,000 700,000
7,18
0,00
07,
200,
000
7,22
0,00
0
PROJECTION1. Horizontal Datum: GDA942. Grid Zone: 553. Vertical Datum: Mean Sea Level4. Scale: 1:400,000
NOTES1. Project area provided by client 2. State Surface Geology (1:2m) sourced from DNRME, 2015
30/0
7/202
0, N
Coet
zee,
\\int.k
lohn.c
om\P
rojD
ata\D
\BNE
\DX7
0010
A01 -
Towr
ie GW
Ass
essm
ent\4
00 D
rawi
ngs\I
ssue
d\San
tos C
omm
ents
Upda
te\FI
G_X_
Alluv
iumTh
ickne
ss2.m
xd
0 2 4 6 8 10
km
Alluvium Thickness (m)
No Data
<1010 - 15
20 - 25
25 - 30
Town
Major Watercourse
Towrie Development Area
25km Buffer
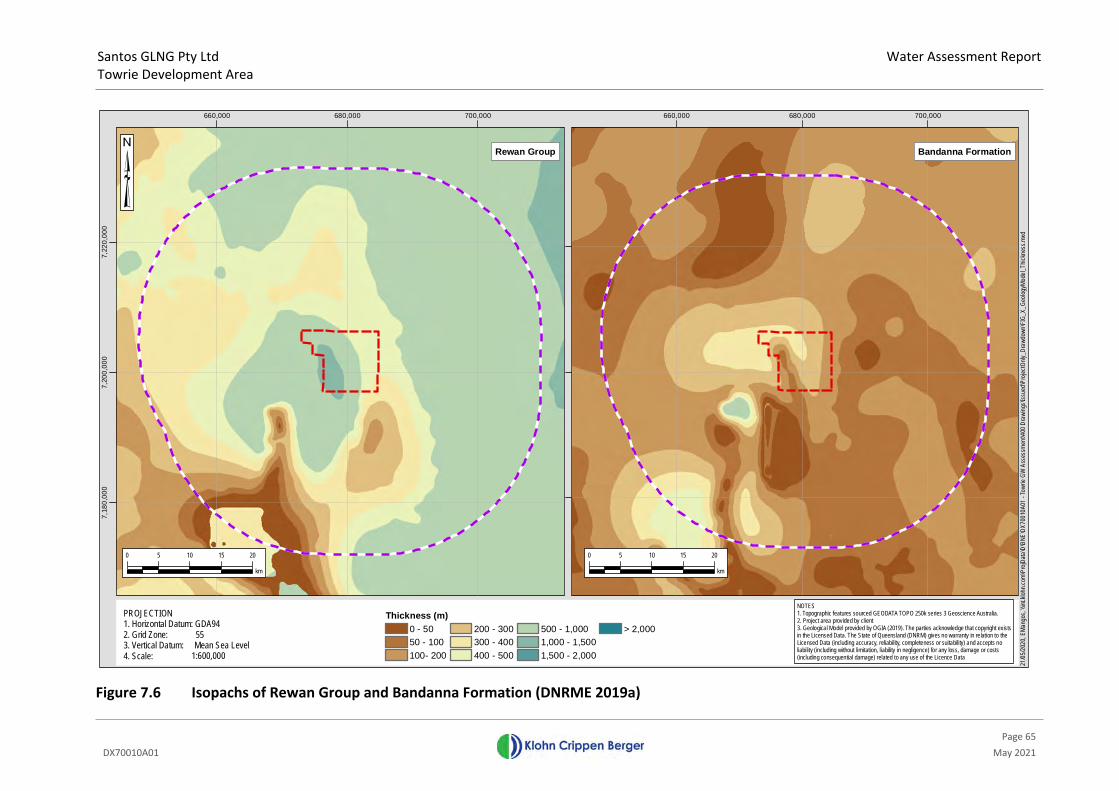
Santos GLNG Pty Ltd Towrie Development Area
Water Assessment Report
Page 65DX70010A01 May 2021
Figure 7.6 Isopachs of Rewan Group and Bandanna Formation (DNRME 2019a)
660,000 680,000 700,000
7,18
0,00
07,
200,
000
7,22
0,00
0
PROJECTION1. Horizontal Datum: GDA942. Grid Zone: 553. Vertical Datum: Mean Sea Level4. Scale: 1:600,000
NOTES1. Topographic features sourced GEODATA TOPO 250k series 3 Geoscience Australia. 2. Project area provided by client 3. Geological Model provided by OGIA (2019). The parties acknowledge that copyright existsin the Licensed Data. The State of Queensland (DNRM) gives no warranty in relation to the Licensed Data (including accuracy, reliability, completeness or suitability) and accepts no liability (including without limitation, liability in negligence) for any loss, damage or costs (including consequential damage) related to any use of the Licence Data
660,000 680,000 700,000
7,18
0,00
07,
200,
000
7,22
0,00
0
21/0
5/20
20, E
Man
gos,
\\int
.kloh
n.co
m\P
rojD
ata\
D\BN
E\DX
7001
0A01
- To
wrie
GW A
sses
smen
t\400
Dra
wing
s\Iss
ued\
Proj
ectO
nly_D
rawd
own\
FIG_
X_Ge
olog
yMod
el_T
hickn
ess.m
xd
0 5 10 15 20
km
Rewan Group Bandanna Formation
Thickness (m)0 - 5050 - 100100- 200
200 - 300300 - 400400 - 500
500 - 1,0001,000 - 1,5001,500 - 2,000
> 2,000
0 5 10 15 20
km

Santos GLNG Pty Ltd Towrie Development Area
Water Assessment Report
Page 66DX70010A01 May 2021
7.3.1 Local Structure
The structural geological mapping of the local area approximates a fault structure in the eastern area of the Project area; and several small-scale, discontinuous anticlines and synclines. Figure 7.7 to Figure 7.9 presents seismic surveys completed in the northern, central-northern and southern portions of the Project. These sections identify the discontinuous fold structures located along the western extent of the Project area, while the mapped fault structure in the eastern area of the Project can be inferred in the southern seismic line. The inferred fault indicates a displacement of ~100 m but is only observed to displace the Early Permian unit with limited vertical propagation to the overlying Bandanna Formation and Rewan Group. As a result, this fault is interpreted to not influence hydraulic connection from the coal seam to the overlying strata.
Figure 7.7 Seismic Survey – Northern Survey Section
Figure 7.8 Seismic Survey – Central-Northern Survey Section
Base of Rewan Group
Bandanna Formation
Early Permian Units
Base of Rewan Group
Bandanna Formation
Early Permian Units
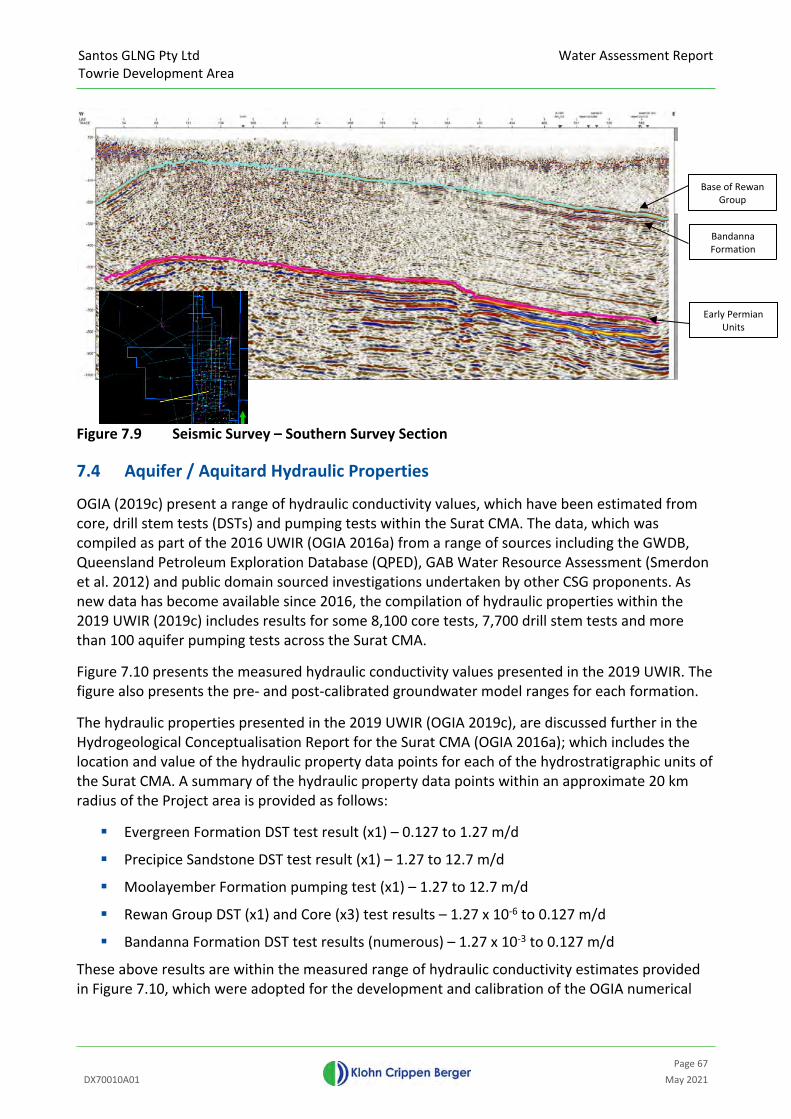
Santos GLNG Pty Ltd Towrie Development Area
Water Assessment Report
Page 67DX70010A01 May 2021
Figure 7.9 Seismic Survey – Southern Survey Section
7.4 Aquifer / Aquitard Hydraulic Properties
OGIA (2019c) present a range of hydraulic conductivity values, which have been estimated from core, drill stem tests (DSTs) and pumping tests within the Surat CMA. The data, which was compiled as part of the 2016 UWIR (OGIA 2016a) from a range of sources including the GWDB, Queensland Petroleum Exploration Database (QPED), GAB Water Resource Assessment (Smerdon et al. 2012) and public domain sourced investigations undertaken by other CSG proponents. As new data has become available since 2016, the compilation of hydraulic properties within the 2019 UWIR (2019c) includes results for some 8,100 core tests, 7,700 drill stem tests and more than 100 aquifer pumping tests across the Surat CMA.
Figure 7.10 presents the measured hydraulic conductivity values presented in the 2019 UWIR. The figure also presents the pre- and post-calibrated groundwater model ranges for each formation.
The hydraulic properties presented in the 2019 UWIR (OGIA 2019c), are discussed further in the Hydrogeological Conceptualisation Report for the Surat CMA (OGIA 2016a); which includes the location and value of the hydraulic property data points for each of the hydrostratigraphic units of the Surat CMA. A summary of the hydraulic property data points within an approximate 20 km radius of the Project area is provided as follows:
Evergreen Formation DST test result (x1) – 0.127 to 1.27 m/d
Precipice Sandstone DST test result (x1) – 1.27 to 12.7 m/d
Moolayember Formation pumping test (x1) – 1.27 to 12.7 m/d
Rewan Group DST (x1) and Core (x3) test results – 1.27 x 10⁻⁶ to 0.127 m/d
Bandanna Formation DST test results (numerous) – 1.27 x 10⁻³ to 0.127 m/d
These above results are within the measured range of hydraulic conductivity estimates provided in Figure 7.10, which were adopted for the development and calibration of the OGIA numerical
Bandanna Formation
Base of Rewan Group
Early Permian Units
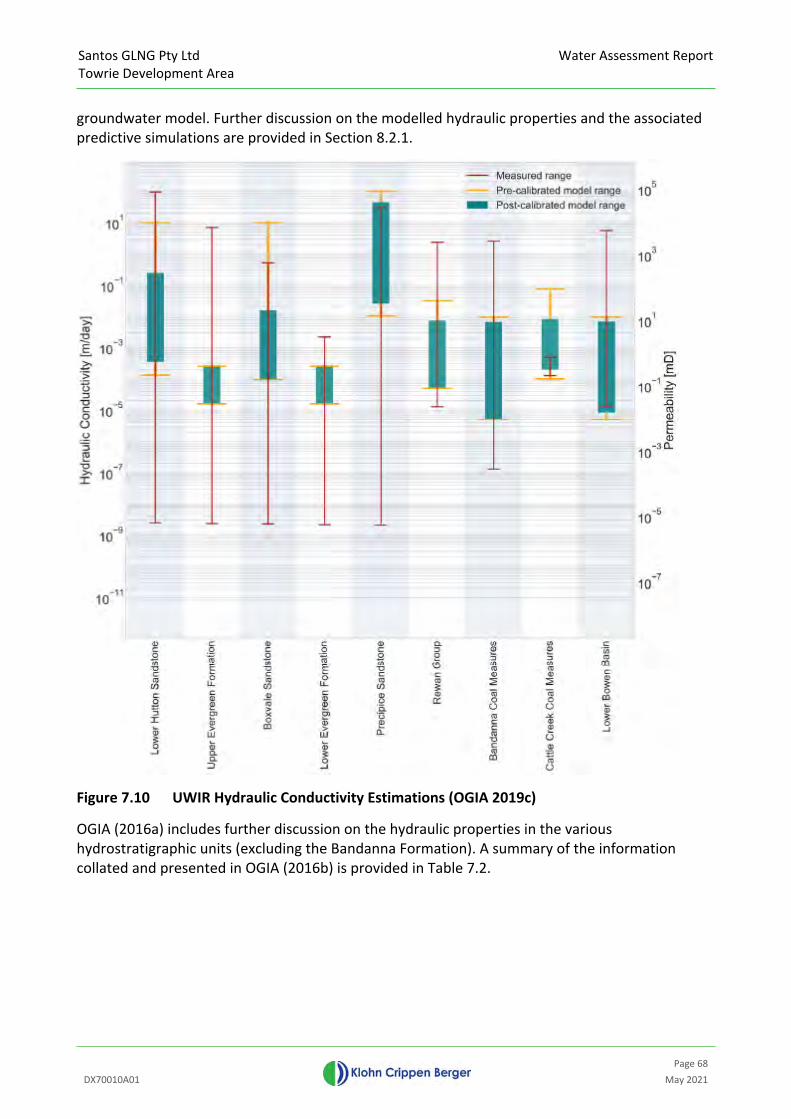
Santos GLNG Pty Ltd Towrie Development Area
Water Assessment Report
Page 68DX70010A01 May 2021
groundwater model. Further discussion on the modelled hydraulic properties and the associated predictive simulations are provided in Section 8.2.1.
Figure 7.10 UWIR Hydraulic Conductivity Estimations (OGIA 2019c)
OGIA (2016a) includes further discussion on the hydraulic properties in the various hydrostratigraphic units (excluding the Bandanna Formation). A summary of the information collated and presented in OGIA (2016b) is provided in Table 7.2.

Santos GLNG Pty Ltd Towrie Development Area
Water Assessment Report
Page 69DX70010A01 May 2021
Table 7.2 Summary of Hydraulic Properties for Hydrostratigraphic Units in the Towrie Development Area
Unit Summary
Alluvium Hydraulic conductivity of alluvial aquifers ranges between 2 and 116 m/day (10th and 90th percentiles), with a median value of 16 m/day.
Hutton Sandstone Horizontal hydraulic conductivity is reported between 1.0 x 10⁻² and 1.3 x 10⁻¹ m/day (median of DST and pumping tests).
Evergreen Formation
Horizontal hydraulic conductivity values are reported between 4.2 x 10⁻⁴ and 1 m/day (median of core, DST and pumping tests).
Precipice Sandstone
Median hydraulic conductivity values are reported between 1.3 x 10⁻² and 4 m/day (median of core, DST and pumping tests).
Moolayember Formation
Horizontal hydraulic conductivity is reported between 1.4 x 10⁻⁴ and 4.3 x 10⁻¹ m/day (median of core, DST and pumping tests). Wide ranging hydraulic conductivity values are associated with a permeability-depth
relationship, with lower values reported for the formation occurring in deeper parts of the basin.
Clematis Group
Horizontal hydraulic conductivity values are reported between 2 x 10⁻⁶ and 15 m/day, with median values estimated between of 1.6 x 10⁻⁴ and 4.2 x 10⁻¹ m/day (from the different testing methods). A permeability-depth relationship also exists within the Clematis Group, with lower permeability associated with greater
depth.
Rewan GroupMedian horizontal hydraulic conductivity is reported between 4.0 x 10⁻⁵ and 4.2 x 10⁻⁴ m/day. Low values are consistent with the interpretation of the Rewan Group as a primary aquitard overlying the Bandanna
Formation.Units underlying
the Bandanna Formation
Horizontal hydraulic conductivity for the older Permian units is reported between 1.4 x 10⁻⁵ and 1.2 x 10⁻⁴ m/day.
The hydraulic conductivity of the Rewan Group adopted for the OGIA Surat CMA groundwater model, and the results of the hydraulic testing of the Rewan Group completed within the vicinity of the Project area identifies this unit as an aquitard. This characteristic is of particular importance for this assessment as this unit directly overlies the producing seam of the Bandanna Formation, which hydraulically isolates the Bandanna Formation from the shallower hydrostratigraphic units. This is further supported by data and findings in the Hydrogeological Conceptualisation Report for the Surat CMA (OGIA 2016a), and field investigations completed by Santos, which identifies:
Measured hydraulic parameters for the Rewan Group throughout the Surat CMA are consistently very low hydraulic conductivity;
Independent data sets, comprising downhole geophysical survey data, characterise the Rewan Group lithology, which demonstrates the unit to be a regionally thick and pervasive aquitard; and,
Seismic survey results completed by Santos and presented in Section 7.3.1, highlight the laterally extensive and isotropic nature of the Rewan Group overlying the Bandanna Formation across the Project area.
7.5 Groundwater Recharge
Recharge processes within the Surat CMA are summarised in the 2019 UWIR (OGIA 2019c). Key processes of recharge include localised recharge, preferential pathway flow and diffuse recharge:
Localised recharge occurs beneath drainage features including rivers, and free-draining unconsolidated sedimentary cover, such as alluvium.
Santos GLNG Pty Ltd Towrie Development Area
Water Assessment Report
Page 70DX70010A01 May 2021
Preferential pathway flow arises from changes in permeability within aquifers and in overlying regolith, providing conduits for water to infiltrate. Zones of higher permeability may include fissures, faults, joints, tree roots and high-permeability beds within individual formations and along bedding planes (Kellett et al. 2003; Sucklow et al. 2016). This mechanism is considered the dominant recharge process in the GAB (Kellett et al. 2003).
Diffuse recharge is the process by which rainfall infiltrates directly into outcropping hydrostratigraphic units. This is expected to occur within all outcrop areas and therefore this process applies to the largest spatial extent across the Surat CMA (Kellett et al. 2003).
Recharge in the Project area will occur as diffuse recharge with rainfall infiltration occurring at outcropping hydrostratigraphic units within, and surrounding, the Project. Estimates of long-term average recharge rates have been made by OGIA as part of the 2016 UWIR (OGIA 2016a) using the chloride mass balance recharge estimation method. For the units outcropping within the vicinity of the Project, the following recharge rates were estimated by OGIA:
Precipice Sandstone (outcrop to the south) – 20.8 mm/year
Moolayember Formation (outcrops to west) – 2.5 mm/year
Clematis Group (outcrops to west) – 26.9 mm/year
Rewan Group (outcrops to within and to the west) – 1.2 mm/year
7.6 Groundwater Levels and Flow
Groundwater levels in the vicinity of the Project have been considered using available records from the GWDB. There are limited transient groundwater level records available. Several monitoring bores installed and monitored by the DNRME are present in the vicinity of the Project (Figure 7.11). The following section provides a summary of the available groundwater monitoring data from the GWDB.

Santos GLNG Pty Ltd Towrie Development Area
Water Assessment Report
Page 71DX70010A01 May 2021
Figure 7.11 Location of Bores in the Vicinity of the Project
C LEMA
TIS
CREEK
Rm
Rm
Rm
Rm
TQr
TQr
TQr
TQr
TQr
TQr
TQr
TQr
TQr
TQr
TQr
Re
Re
Re
Re
Re
ReQa
QaQa
Qa
Qa
Qa
Tm
Tm Tm
W
W
Rr
Rr
Rr
Rr
Rr
Jb
Jb
Jb
M OOL AY
EM
BERCREE K
DA WSONRIVER
SA R DINEC REEK
BULLAR OOCREEK
BAF
FLE CR EEK
SPRING CREEK
ROBINSO
NCREEK
CLEMATIS C RE EK
BRO
WN
RIV
E
R
CARN ARVON CREEK
11670
11671
11672
57787
620626257562791
158462
160817
180008
22036
13050010
8467
8546
23008
37066
37721
43418
44095
84212
90054
165174
9114
58584
58585
168069
58583
4913
123585
4911
9110
9111911215749
24937
33543
4885958198
58413
58568
58569
58821
37508
33544
38626
12626
58556
58570
123453
15679
11669
26247
31424
31832
158846
158847
31426
31425
32509
34060
34360
34361
44430
4882190226
100147
158164
160475160476 160477
160478
130303701303037113030372
13030373
1303037413030375
13030376
130500021305000313050004
13050005
1305000613050007
1305000813050009
14502
22182
13050001
160816
660,000 680,000 700,000
7,18
0,00
07,
200,
000
7,22
0,00
07,
240,
000
PROJECTION1. Horizontal Datum: GDA942. Grid Zone: 553. Vertical Datum: Mean Sea Level4. Scale: 1:400,000
NOTES1. Topographic features sourced GEODATA TOPO 250k series 3 Geoscience Australia. 2. Project area provided by client 3. State Surface Geology (1:2m) sourced from DNRME, 2015
8/06/2
020,
NCo
etze
e, \\in
t.kloh
n.com
\Pro
jData
\D\B
NE\D
X700
10A0
1 - To
wrie
GW A
sses
smen
t\400
Dra
wing
s\Iss
ued\S
anto
s Com
men
ts Up
date\
FIG_
X_Aq
uifer
Attr
ibutio
n.mxd
0 2 4 6 8 10
km
Aquifer Attribution (OGIA,2019)AlluviumHutton SandstoneUpper Evergreen FormationLower Evergreen FormationPrecipice SandstoneMoolayember FormationClematis SandstoneRewan GroupBandanna Formation
Town
Major Watercourse
Towrie Development Area
25km Buffer
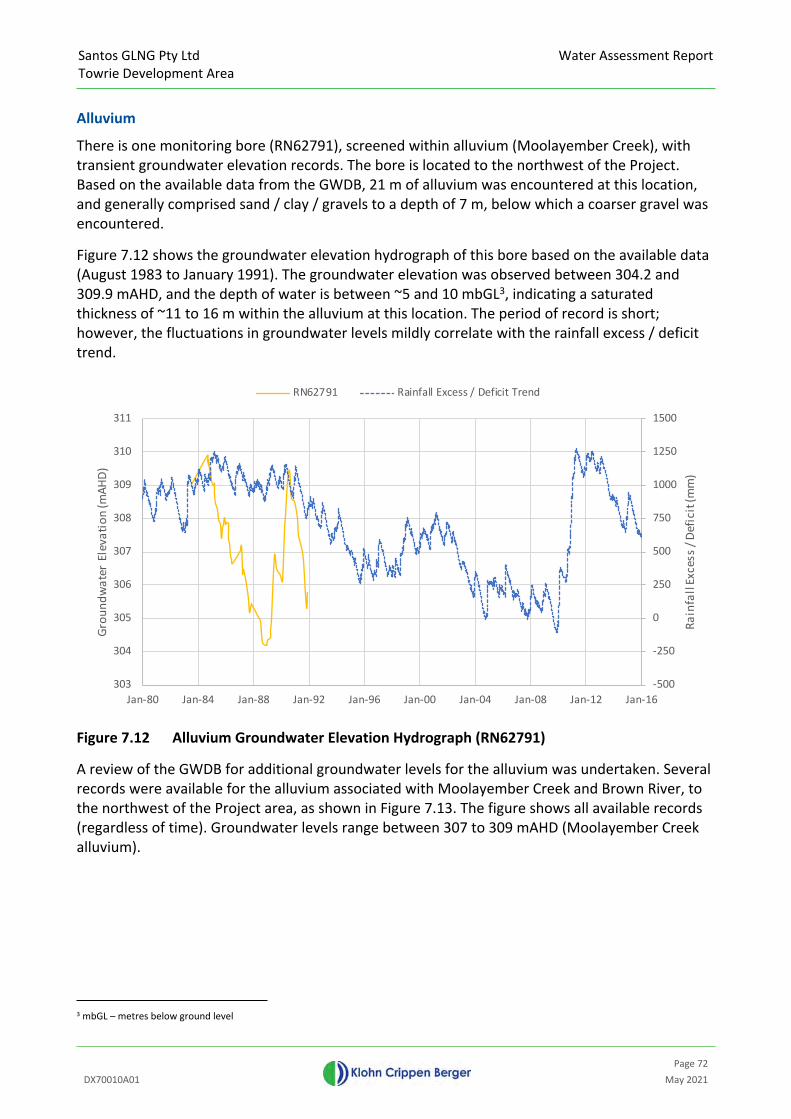
Santos GLNG Pty Ltd Towrie Development Area
Water Assessment Report
Page 72DX70010A01 May 2021
Alluvium
There is one monitoring bore (RN62791), screened within alluvium (Moolayember Creek), with transient groundwater elevation records. The bore is located to the northwest of the Project. Based on the available data from the GWDB, 21 m of alluvium was encountered at this location, and generally comprised sand / clay / gravels to a depth of 7 m, below which a coarser gravel was encountered.
Figure 7.12 shows the groundwater elevation hydrograph of this bore based on the available data (August 1983 to January 1991). The groundwater elevation was observed between 304.2 and 309.9 mAHD, and the depth of water is between ~5 and 10 mbGL3, indicating a saturated thickness of ~11 to 16 m within the alluvium at this location. The period of record is short; however, the fluctuations in groundwater levels mildly correlate with the rainfall excess / deficit trend.
Figure 7.12 Alluvium Groundwater Elevation Hydrograph (RN62791)
A review of the GWDB for additional groundwater levels for the alluvium was undertaken. Several records were available for the alluvium associated with Moolayember Creek and Brown River, to the northwest of the Project area, as shown in Figure 7.13. The figure shows all available records (regardless of time). Groundwater levels range between 307 to 309 mAHD (Moolayember Creek alluvium).
3 mbGL – metres below ground level
-500
-250
0
250
500
750
1000
1250
1500
303
304
305
306
307
308
309
310
311
Jan-80 Jan-84 Jan-88 Jan-92 Jan-96 Jan-00 Jan-04 Jan-08 Jan-12 Jan-16Ra
infa
ll Ex
cess
/ De
ficit
(mm
)
Grou
ndw
ater
Ele
vatio
n (m
AHD)
RN62791 Rainfall Excess / Deficit Trend

Santos GLNG Pty Ltd Towrie Development Area
Water Assessment Report
Page 73DX70010A01 May 2021
Figure 7.13 Alluvium Groundwater Elevation (GWDB Data)
Rm
Rm
Rm
Rm
TQr
TQr
TQr
TQr
TQr
TQr
TQr
TQr
Re
Re
Re
Qa
Re
QaQa
Qa
W
Rr
Rr
Rr
Rr
Rr
Rr
Jb
Jb
MOO
LAYE
MBE
R C RE
EK
SA R DINECREEK
ROBINSONCR
E EK
B ULLARO O CREEK
HUTTO
N CREEK
BAFF LECREEK
SPRING CREEK
DA
W SONRIVER
BRO
WN
RIV
E
R
307.74308.19
309.02
660,000 680,000 700,000
7,16
0,00
07,
180,
000
7,20
0,00
07,
220,
000
PROJECTION1. Horizontal Datum: GDA942. Grid Zone: 553. Vertical Datum: Mean Sea Level4. Scale: 1:400,000
NOTES1. Topographic features sourced GEODATA TOPO 250k series 3 Geoscience Australia. 2. Project area provided by client 3. State Surface Geology (1:2m) sourced from DNRME, 2015
8/06/2
020,
NCo
etze
e, \\in
t.kloh
n.com
\Pro
jData
\D\B
NE\D
X700
10A0
1 - To
wrie
GW A
sses
smen
t\400
Dra
wing
s\Iss
ued\S
anto
s Com
men
ts Up
date\
FIG_
X_AA
_Aluv
ium.m
xd
0 5 10 15 20
km
Alluvium
Minor Watercourse
Major Watercourse
Towrie Development Area
25km Buffer
Qa
TQr
62791
62575
62062

Santos GLNG Pty Ltd Towrie Development Area
Water Assessment Report
Page 74DX70010A01 May 2021
Precipice Sandstone
One monitoring bore (RN123453), with transient groundwater elevations, screened within Precipice Sandstone, is located to the south of the Project. Based on the available data from the GWDB, the majority of the formation encountered comprised variations of white and grey sandstone.
Figure 7.14 presents the groundwater elevation hydrograph of this bore based on the available data (January 2016 to November 2016). The groundwater elevations recorded from this bore fluctuate between 386.5 to 387.5 mAHD, at a depth of water below ground surface of 110 m.
Figure 7.14 Precipice Sandstone Groundwater Elevation Hydrograph (RN123453)
A review of the GWDB for additional groundwater levels for the Precipice Sandstone was undertaken for bores within the vicinity of the Project. Several records were available for the Precipice Sandstone, located to the southwest of the Project, as shown in Figure 7.15. These results indicate that the groundwater level elevations range from ~386 mAHD to 496 mAHD, with lower groundwater level elevations occurring at lower surface topographies.
-1000
-750
-500
-250
0
250
500
750
1000
1250
1500
383
383.5
384
384.5
385
385.5
386
386.5
387
387.5
388
Jan-10 Jan-11 Jan-12 Dec-12 Jan-14 Jan-15 Jan-16 Dec-16 Jan-18 Jan-19 Jan-20
Rain
fall
Exce
ss /
Defic
it (m
m)
Grou
ndw
ater
Ele
vatio
n (m
AHD)
RN123453 Rainfall Excess / Deficit Trend

Santos GLNG Pty Ltd Towrie Development Area
Water Assessment Report
Page 75DX70010A01 May 2021
Figure 7.15 Precipice Sandstone Groundwater Elevation (GWDB Data)
Rm
Rm
Rm
Rm
TQr
TQr
TQr
TQr
TQr
TQr
TQr
TQr
Re
Re
Re
Qa
Re
QaQa
Qa
Qa
W
Rr
Rr
Rr
Rr
Rr
Rr
Jb
Jb
M OOL AYEM
BER
CR
EEK
SA R DINECREEK
ROBINSONCR
EEK
B ULLARO O CREEK
HUTT
ON CREEK
BAFF LEC REEK
SPRING CREEK
DA
W SON RIVER
BRO
WN
RIV
E
R
389
411.97
477.5
495.5
386.45
660,000 680,000 700,000
7,16
0,00
07,
180,
000
7,20
0,00
07,
220,
000
PROJECTION1. Horizontal Datum: GDA942. Grid Zone: 553. Vertical Datum: Mean Sea Level4. Scale: 1:400,000
NOTES1. Topographic features sourced GEODATA TOPO 250k series 3 Geoscience Australia. 2. Project area provided by client 3. State Surface Geology (1:2m) sourced from DNRME, 2015
8/06/2
020,
NCo
etze
e, \\in
t.kloh
n.com
\Pro
jData
\D\B
NE\D
X700
10A0
1 - To
wrie
GW A
sses
smen
t\400
Dra
wing
s\Iss
ued\S
anto
s Com
men
ts Up
date\
FIG_
X_AA
_Pre
cipice
.mxd
0 5 10 15 20
km
Town
Precipice Sandstone
Minor Watercourse
Major Watercourse
Towrie Development Area
25km Buffer

Santos GLNG Pty Ltd Towrie Development Area
Water Assessment Report
Page 76DX70010A01 May 2021
Rewan Group
Groundwater elevations recorded at five DNRME monitoring bores (locations presented in Figure 7.11) screened within the Rewan Group are presented in Figure 7.16. The groundwater elevations, from the available data (1968 to 1988) range between ~360 and ~369 mAHD. One bore (RN13050003) located in the projects area screened within the Rewan, had only one groundwater elevation measurement of 285.24 mAHD (1969). No other records for this bore exist. The five hydrographs for the Rewan Group bores indicate some influence from the rainfall events, however the correlation with the overall trend is weak.
Figure 7.16 Rewan Group Groundwater Elevation Hydrograph
-500
-250
0
250
500
750
1000
1250
1500
357
359
361
363
365
367
369
371
373
Jan-63 Jan-68 Jan-73 Jan-78 Jan-83 Jan-88 Jan-93 Jan-98 Jan-03
Rain
fall
Exce
ss /
Defic
it (m
m)
Grou
ndw
ater
Ele
vatio
n (m
AHD)
RN13030371 RN13030372 RN13030373RN13030374 RN13030376 Rainfall Excess / Deficit Trend

Santos GLNG Pty Ltd Towrie Development Area
Water Assessment Report
Page 77DX70010A01 May 2021
Figure 7.17 Rewan Group Groundwater Elevation (GWDB Data)
Rm
Rm
Rm
Rm
TQr
TQr
TQr
TQr
TQr
TQr
TQr
TQr
Re
Re
Re
Re
Qa
Re
Qa
QaQa
Qa
Qa
Qa
W
W
Rr
Rr
Rr
Rr
Rr
Rr
Jb
Jb
M OO
L AYEM
BERCREE K
ROBINSONCR
EEK
SA R DINEC R EEK
BAFFL EC REEK
SPRINGCREEK
DAWSONRIVER
CLEMATI S C REEK
BRO
WN
RIV
E
R
367.36367.68 361.11
361.11360.77
285.24
660,000 680,000 700,000
7,16
0,00
07,
180,
000
7,20
0,00
07,
220,
000
PROJECTION1. Horizontal Datum: GDA942. Grid Zone: 553. Vertical Datum: Mean Sea Level4. Scale: 1:400,000
NOTES1. Topographic features sourced GEODATA TOPO 250k series 3 Geoscience Australia. 2. Project area provided by client 3. State Surface Geology (1:2m) sourced from DNRME, 2015
9/06/2
020,
NCo
etze
e, \\in
t.kloh
n.com
\Pro
jData
\D\B
NE\D
X700
10A0
1 - To
wrie
GW A
sses
smen
t\400
Dra
wing
s\Iss
ued\S
anto
s Com
men
ts Up
date\
FIG_
X_AA
_Rew
an.m
xd
0 5 10 15 20
km
Town
Rewan Group
Minor Watercourse
Major Watercourse
Towrie Development Area
25km Buffer
Rr
TQr
360.77
361.11361.11
367.68367.36

Santos GLNG Pty Ltd Towrie Development Area
Water Assessment Report
Page 78DX70010A01 May 2021
Bandanna Formation
One monitoring bore (RN160817), with transient groundwater elevations and screened within the Bandanna Formation, is located to the east of the Project.
Figure 7.18 presents the groundwater elevation hydrograph of this bore based on the available data (January 2014 to November 2018). This hydrograph of groundwater level records indicates that an error in the resolution of the monitoring records (likely automated data-logger error) is present in the data set. Although this resolution error is likely present, the records provide a general understanding of groundwater level conditions within the Bandanna Formation. The recorded groundwater elevation is between 306.4 to 314.9 mAHD, which correlates with a depth of water below ground surface between 102 to 111 m. The groundwater elevation fluctuations show no correlation with the rainfall excess / deficit trend.
Figure 7.18 Bandanna Formation Groundwater Elevation Hydrograph (RN160817)
-500
-250
0
250
500
750
1000
1250
1500
300
302
304
306
308
310
312
314
316
Jan-14 Jan-15 Jan-16 Jan-17 Jan-18 Jan-19Ra
infa
ll Ex
cess
/ De
ficit
(mm
)
Grou
ndw
ater
Ele
vatio
n (m
AHD)
RN160817 Rainfall Excess / Deficit Trend

Santos GLNG Pty Ltd Towrie Development Area
Water Assessment Report
Page 79DX70010A01 May 2021
Figure 7.19 Bandanna Formation Groundwater Elevation (GWDB Data)
Rm
Rm
Rm
Rm
TQr
TQr
TQr
TQr
TQr
TQr
TQr
TQr
Re
Re
Re
Re
Qa
Re
Qa
QaQa
Qa
Qa
Qa
W
W
Rr
Rr
Rr
Rr
Rr
Rr
Jb
Jb
M OO
L AYEM
BERCREE K
ROBINSONCR
EEK
SA R DINEC R EEK
BAFFL EC REEK
SPRINGCREEK
DAWSONRIVER
CLEMATI S C REEK
BRO
WN
RIV
E
R
314.88
660,000 680,000 700,000
7,16
0,00
07,
180,
000
7,20
0,00
07,
220,
000
PROJECTION1. Horizontal Datum: GDA942. Grid Zone: 553. Vertical Datum: Mean Sea Level4. Scale: 1:400,000
NOTES1. Topographic features sourced GEODATA TOPO 250k series 3 Geoscience Australia. 2. Project area provided by client 3. State Surface Geology (1:2m) sourced from DNRME, 2015
8/06/2
020,
NCo
etze
e, \\in
t.kloh
n.com
\Pro
jData
\D\B
NE\D
X700
10A0
1 - To
wrie
GW A
sses
smen
t\400
Dra
wing
s\Iss
ued\S
anto
s Com
men
ts Up
date\
FIG_
X_AA
_Ban
dann
a.mxd
0 5 10 15 20
km
Town
Bandanna Formation
Minor Watercourse
Major Watercourse
Towrie Development Area
25km Buffer
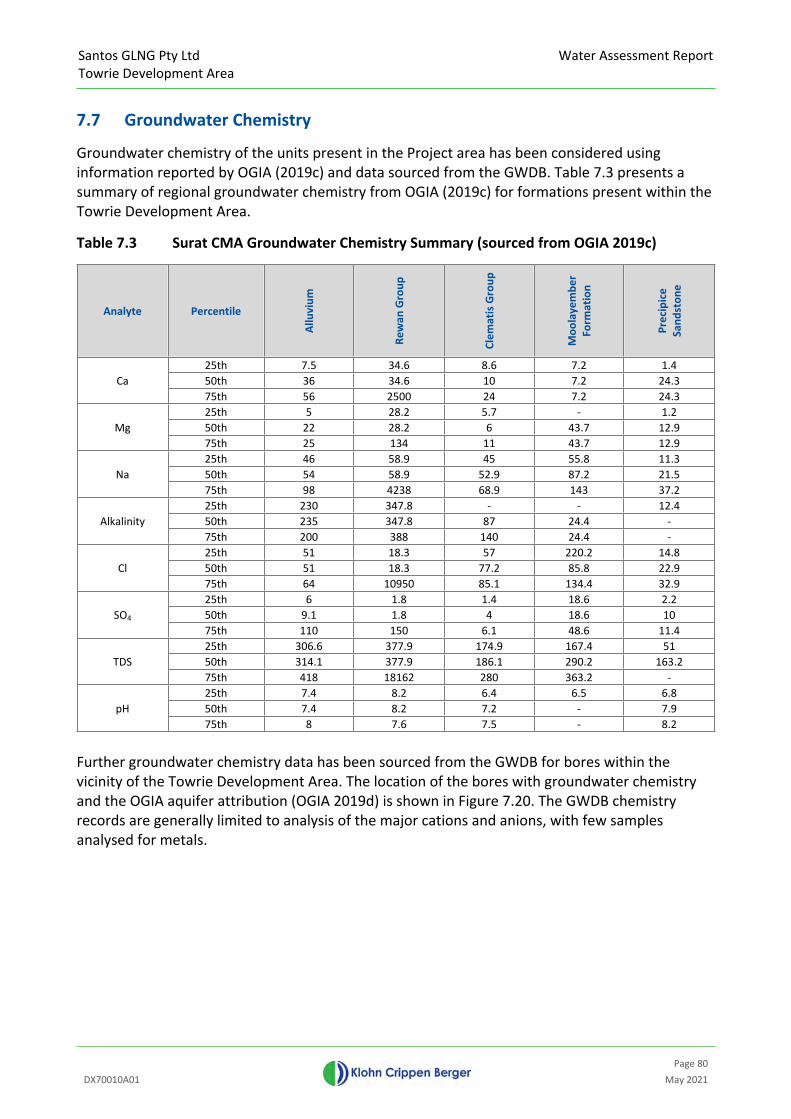
Santos GLNG Pty Ltd Towrie Development Area
Water Assessment Report
Page 80DX70010A01 May 2021
7.7 Groundwater Chemistry
Groundwater chemistry of the units present in the Project area has been considered using information reported by OGIA (2019c) and data sourced from the GWDB. Table 7.3 presents a summary of regional groundwater chemistry from OGIA (2019c) for formations present within the Towrie Development Area.
Table 7.3 Surat CMA Groundwater Chemistry Summary (sourced from OGIA 2019c)
Analyte PercentileAl
luvi
um
Rew
an G
roup
Clem
atis
Gro
up
Moo
laye
mbe
r Fo
rmat
ion
Prec
ipic
e Sa
ndst
one
25th 7.5 34.6 8.6 7.2 1.450th 36 34.6 10 7.2 24.3Ca75th 56 2500 24 7.2 24.325th 5 28.2 5.7 - 1.250th 22 28.2 6 43.7 12.9Mg75th 25 134 11 43.7 12.925th 46 58.9 45 55.8 11.350th 54 58.9 52.9 87.2 21.5Na75th 98 4238 68.9 143 37.225th 230 347.8 - - 12.450th 235 347.8 87 24.4 -Alkalinity75th 200 388 140 24.4 -25th 51 18.3 57 220.2 14.850th 51 18.3 77.2 85.8 22.9Cl75th 64 10950 85.1 134.4 32.925th 6 1.8 1.4 18.6 2.250th 9.1 1.8 4 18.6 10SO4
75th 110 150 6.1 48.6 11.425th 306.6 377.9 174.9 167.4 5150th 314.1 377.9 186.1 290.2 163.2TDS75th 418 18162 280 363.2 -25th 7.4 8.2 6.4 6.5 6.850th 7.4 8.2 7.2 - 7.9pH75th 8 7.6 7.5 - 8.2
Further groundwater chemistry data has been sourced from the GWDB for bores within the vicinity of the Towrie Development Area. The location of the bores with groundwater chemistry and the OGIA aquifer attribution (OGIA 2019d) is shown in Figure 7.20. The GWDB chemistry records are generally limited to analysis of the major cations and anions, with few samples analysed for metals.

Santos GLNG Pty Ltd Towrie Development Area
Water Assessment Report
Page 81DX70010A01 May 2021
Figure 7.20 GWDB Bores with Chemistry Data
C LEMA TIS
CREEK
Rm
Rm
Rm
Rm
TQr
TQr
TQr
TQr
TQr
TQr
TQr
TQr
TQr
TQr
TQr
Re
Re
Re
Re
Qa
ReQa
QaQa
Qa
Qa
Qa
Tm
WW
Rr
Rr
Rr
Rr
Rr
Rr
Jb
Jb
DAW
SO N RIVERMOO
LAYEM
B ER C REEK
SA R DINEC REEK
BAF FLE CREEK
ROBINSONCREEK
SPRING CREEK
CLEMATI S CREEK
BRO
WN
RIV
E
R
CARN ARVON CREEK
660,000 680,000 700,000
7,18
0,00
07,
200,
000
7,22
0,00
07,
240,
000
PROJECTION1. Horizontal Datum: GDA942. Grid Zone: 553. Vertical Datum: Mean Sea Level4. Scale:
TownMinor WatercourseMajor Waterway
Towrie Development Area25km Buffer
1:400,000
NOTES1. Project area provided by client 2. State Surface Geology (1:2m) sourced from DNRME, 2015 3. Spring data GDE from State of Queensland, DSITI (2018) Version 1.5.1
8/06/2
020,
NCo
etze
e, \\in
t.kloh
n.com
\Pro
jData
\D\B
NE\D
X700
10A0
1 - To
wrie
GW A
sses
smen
t\400
Dra
wing
s\Iss
ued\S
anto
s Com
men
ts Up
date\
FIG_
X_Aq
uifer
Attr
ibutio
nChe
mistr
y.mxd
0 5 10 15 20
km
(See Surface Geology Figure for Geology Legend)
911
Aquifer Attribution (OGIA, 2019)AlluviumPrecipice SandstoneMoolayember FormationClematis SandstoneRewan Group

Santos GLNG Pty Ltd Towrie Development Area
Water Assessment Report
Page 82DX70010A01 May 2021
Figure 7.21 to Figure 7.22 present Durov and Piper diagrams for each hydrostratigraphic unit. The following observations are made for the local hydrochemistry:
The majority of the samples (regardless of formation) show either a sodium-bicarbonate or a magnesium-bicarbonate signature water type.
Fresh groundwater, based on the TDS concentrations (salinity indicator) is observed in the majority of formations.
Figure 7.21 Piper and Durov Diagram – Alluvium
Figure 7.22 Piper and Durov Diagram – Precipice Sandstone

Santos GLNG Pty Ltd Towrie Development Area
Water Assessment Report
Page 83DX70010A01 May 2021
Figure 7.23 Piper and Durov Diagram – Clematis Sandstone
Figure 7.24 Piper and Durov Diagram – Rewan Group
7.8 Groundwater-Surface Water Interactions
Groundwater-surface water interaction within the Towrie Development Area may occur as a result of two key processes:
Discharge of groundwater to watercourses as baseflow; and
Recharge of aquifers as leakage from watercourses.
Recharge to groundwater systems from watercourses may occur within the Towrie Development Area, however this only occurs when there are conditions of sufficient saturation and hydraulic head to allow water to infiltrate into groundwater aquifers. Many of the watercourses in the Towrie Development Area are ephemeral, and streamflow only occurs following rainfall events.
There is no mapped Quaternary-age alluvium (Qa) within the Project area. Cenozoic sediments comprising Quaternary-Tertiary aged residual / colluvium is present adjacent to the watercourses in the north and the east of the Project area. Alluvial aquifers deposited by fluvial processes in

Santos GLNG Pty Ltd Towrie Development Area
Water Assessment Report
Page 84DX70010A01 May 2021
river channels or floodplains are found along the Brown River to the north, and associated tributaries.
7.9 Groundwater Dependent Ecosystems
Potential GDEs have been mapped within the vicinity of the Project area by the State of Queensland, Department of Science and Environment (DES 2018b). GDEs are defined in water-related responses to coal seam gas extraction and coal mining (DoEE 2015) as:
‘Natural ecosystems which require access to groundwater on a permanent or intermittent basis to meet all or some of their water requirements so as to maintain their communities of plants and animals, ecological processes and ecosystem services (Richardson et al. 2011). The broad types of GDE are (Eamus et al. 2006):
Ecosystems dependent on surface expression of groundwater;
Ecosystems dependent on subsurface presence of groundwater; and
Subterranean ecosystems.’
OGIA (2019c) provides further terminology relating to surface expression GDE’s, which include spring vents / complexes:
Spring vents are described as a single location in the landscape where groundwaterdischarges at the surface. A spring vent can be mounded or flat and can also present aswetland vegetation, with no visible water at the location of the spring.
A spring complex is a group of spring vents located close to each other. The spring ventsare located in the same surface geology and share the same source aquifer and landscapeposition. No adjacent pair of spring vents in the complex is more than 10 km apart.
A watercourse spring is a section of a watercourse where groundwater from an aquiferenters the stream through the streambed. This includes waterholes and flowing sections ofstreams dependent on groundwater. This type of spring is also referred to as a baseflow-fed section of a watercourse.
Spring group, a collection of complexes and/or watercourse springs, which share the samesource aquifer and are in the same geographic area.
Potential terrestrial GDEs (TGDEs), as well as a number of spring complexes, are mapped as present in the vicinity of the Project and are discussed in the following sections.
7.9.1 Spring Complexes
No spring complexes, as recorded in the Queensland spring database (Queensland Herbarium 2018b), are mapped in the Project area. A 25 km buffer around the Project area was used to search for springs which are proximal to the Project area. The location of these complexes is shown on Figure 7.25, with details of spring complexes summarised in Table 7.4. Springs are evenly distributed around the Project area, within a 25 km buffer the majority of the springs source water from the Precipice Sandstone. Immediately in the vicinity of the Project, springs source water dominantly from the Clematis Formation and the Precipice Sandstone. The nearest spring complex (317) is ~6 km North West of the Project area.

Santos GLNG Pty Ltd Towrie Development Area
Water Assessment Report
Page 85DX70010A01 May 2021
Figure 7.25 Location of Springs Vent / Complexes in Vicinity of the Project area
Rm
Rm
Rm
Rm
TQr
TQr
TQr
TQr
TQr
TQr
TQr
TQr
Re
Re
Re
Re
Re
Qa
Re
Qa
QaQa
Qa
Qa
Qa
Tm
WW
W
Rr
Rr
Rr
Rr
Rr
Rr
Jb
Jb
ROB INSONCREEK
SARDINEC REE K
CLEMATIS CREEK
BAFFLE CREEK
SPRING
CREEK
BROWNRIVER
DA WSON R IVER
MOOLAYEMBE
R CREE K
660,000 680,000 700,000
7,16
0,00
07,
180,
000
7,20
0,00
07,
220,
000
PROJECTION1. Horizontal Datum: GDA942. Grid Zone: 553. Vertical Datum: Mean Sea Level4. Scale:
Minor WatercourseMajor Watercourse
Towrie Development Area25 km Buffer
1:400,000
NOTES1. Topographic features sourced GEODATA TOPO 250k series 3 Geoscience Australia. 2. Project area provided by client 3. State Surface Geology (1:2m) sourced from DNRME, 2015 4. Spring data GDE from State of Queensland, DSITI (2018) Version 1.5.1
8/06/2
020,
NCo
etze
e, \\in
t.kloh
n.com
\Pro
jData
\D\B
NE\D
X700
10A0
1 - To
wrie
GW A
sses
smen
t\400
Dra
wing
s\Iss
ued\S
anto
s Com
men
ts Up
date\
FIG_
X_To
wrieS
pring
.mxd
0 5 10 15 20
km
Spring ComplexInjuryLonely Eddie
MoolayemberRobin
(See Surface Geology Figure for Geology Legend)
Robin
Lonely Eddie
Injury
Moolayember

Santos GLNG Pty Ltd Towrie Development Area
Water Assessment Report
Page 86DX70010A01 May 2021
Table 7.4 Details of Spring Complexes in the Vicinity of the Project (Queensland Herbarium 2019)
Group Name
Source Aquifer
Complex Number
Complex Name
No. of Vents
Conservation Rank
Rationale for Conservation Rank
EPBC Listed
Distance from Project (km)
233 Moolayember 3 2
Spring # 676: Cyperus laevigatus,
Schoenoplectus validus, Ampelopteris prolifera
No 17Clematis
Group
317 Injury 1 3Spring # 705: Cyperus
trinervis, Youngia japonica
No 6
327 Robin 1 - - No 23
Springsure Supergroup
Precipice Sandstone 339 Lonely Eddie 4 2 Spring # 709: Isolepis
inundata, Isolepis cernua No 16
Table 7.4 also presents the conservation ranking for each of the complexes. The conservation categories as reported in Fensham et al. (2012) are:
Category 1a – Contains at least one GAB endemic species not known from any other location beyond this spring complex.
Category 1b – Contains endemic species known from more than one spring complex or has populations of threatened species listed under State or Commonwealth legislation that do not conform to Category 1a.
Category 2 – Provides habitat for populations of plant and/or animal species not known from habitat other than spring wetlands within 250 km.
Category 3 – Spring wetland vegetation without isolated populations (Category 2) with at least one native plant species that is not a widespread coloniser of disturbed areas.
Category 4a – Spring wetland vegetation comprised of exotic and/or only native species that are widespread colonisers of disturbed areas.
Category 4b – The original spring wetland is destroyed by impoundment or excavation. The probability of important biological values being identified in the future is very low.
Category 5 – All springs inactive.
Three spring complexes within the vicinity of the Project have been given a conservation rating of 3 or lower, with the other one not having a conservation rating. None of the spring complexes are EPBC listed (DoEE 2014).
7.9.2 Potential Terrestrial GDEs
The distribution of potential Terrestrial GDEs, as mapped by DES (2018b), within the vicinity of the Project is presented in Figure 7.26.

Santos GLNG Pty Ltd Towrie Development Area
Water Assessment Report
Page 87DX70010A01 May 2021
The potential GDEs are generally located outside the vicinity of the Project. The majority of the potential GDEs are mapped as being ‘moderate confidence’ with some ‘low confidence’ TGDEs and are all derived from expert opinion. The moderate confidence TGDEs almost entirely occur outside the Project and outside the Arcadia Valley. Low confidence TGDEs are coincident with Arcadia Creek and its tributaries within both the Project and Arcadia Valley.
Figure 7.27 presents the potential terrestrial TGDEs using the GDE mapping rule sets as defined by the Queensland Government (2017) in ‘Groundwater dependent ecosystem mapping rule-sets for the Comet, Dawson and Mackenzie River Catchments’. The rule sets occurring in the vicinity of the Project include:
SURAT_RS_01A: Quaternary alluvial aquifers overlying sandstone ranges with fresh, intermittent groundwater connectivity regime.
SURAT_RS_01C: Quaternary alluvial aquifers with fresh, intermittent groundwater connectivity regime.
SURAT_RS_03A: Permeable consolidated sedimentary rock aquifers with fresh, intermittent groundwater connectivity regime.
Further discussion of the potential terrestrial GDEs, in the context of impacts, is provided in Section 9.2.3.

Santos GLNG Pty Ltd Towrie Development Area
Water Assessment Report
Page 88DX70010A01 May 2021
Figure 7.26 Location of Potential Terrestrial GDEs in the Vicinity of the Project area
MOOLAYEMBE
R CREEK
ROBINSONCREE
K
SA RDINE CREEK
CLEMATISCRE EK
BAFF LE CREEK
SP RING
CREEK
CARNARVON CREEK
BROW
NRIV
ER
D AWSON RIV ER
660,000 680,000 700,000
7,18
0,00
07,
200,
000
7,22
0,00
07,
240,
000
PROJECTION1. Horizontal Datum: GDA942. Grid Zone: 553. Vertical Datum: Mean Sea Level4. Scale:
Minor WatercourseMajor Watercourse
Towrie Development Area25km Buffer
1:400,000
NOTES:1.Topographic features sourced GEODATA TOPO 250k series 3 Geoscience Australia2. Groundwater Dependent Ecosystems sourced from State of Queensland, DSITI (2018) Version 1.5.1
8/06/2
020,
NCo
etze
e, \\in
t.kloh
n.com
\Pro
jData
\D\B
NE\D
X700
10A0
1 - To
wrie
GW A
sses
smen
t\400
Dra
wing
s\Iss
ued\S
anto
s Com
men
ts Up
date\
FIG_
X_PL
1059
_GDE
.mxd
GDE Surface LineDerived GDE - High ConfidenceDerived GDE - Moderate ConfidenceDerived GDE - Low Confidence
GDE Surface Area81-100 Derived GDE - Moderate Confidence
GDE Terrestrial81-100 Derived GDE - High Confidence
81-100 Derived GDE - Moderate Confidence81-100 Derived GDE - Low Confidence01-80 Derived GDE - Moderate Confidence01-80 Derived GDE - Low Confidence
0 5 10 15 20
km

Santos GLNG Pty Ltd Towrie Development Area
Water Assessment Report
Page 89DX70010A01 May 2021
Figure 7.27 Potential Terrestrial GDEs by Rule Set and Depth to Groundwater (GWDB)
-21.4
-14.1
-45.7
-5.98-5.15
-8.94
-13.35-13.18
-14.26-14.61
-225.5
-71.02
Jb
Re
TQr
Rm
Rm
TQr
TQr
Rr
Qa
Re
TQr
Rr
Qa
Rm
Rr
Re
TQr
Rr
Re
W
TQr
Qa
QaTQr
Rm
Re
Qa
W
Re
TQr
Qa
W
Tm
SPRING CREEK
MOOLAYEMBER CREEK
BR
OW
NR
IVER
BAFFLE CR EEK
SARD I NE CREEK
DAWSON RIVER
ROBINSON CREEK
DAWSO
N RIVER
SARDINE CREEK
BAFFLE CREEK
DAWSON RIVER
BAFFLE CREEK
MOOLAYEMBER CREEK
BAFFLE CREEK
BR
OW
N R
IVER
BAFFLE CREEK
DAWSON RIVER
BAFFLE CREEK
DAWSON RIVER
DAWSON RIVER
149 149 149
-25
-25
-25
0 5 10 15 20
km
PROJECTION1. Horizontal Datum: GDA942. Grid Zone: 553. Vertical Datum: Mean Sea Level4. Scale: 1:400,000
GDE TERRESTRIALSURAT RS 01ASURAT RS 01CSURAT RS 01DSURAT RS 01FSURAT RS 02BSURAT RS 03ASURAT RS 05
NOTES1. Project area provided by client 2. Groundwater Dependent Ecosystems sourced from State of Queensland, DSITI (2018) Version 1.5.1
28/0
8/202
0, N
Coet
zee,
\\int.k
lohn.c
om\P
rojD
ata\D
\BNE
\DX7
0010
A01 -
Towr
ie GW
Ass
essm
ent\4
00 D
rawi
ngs\I
ssue
d\San
tos C
omm
ents
Upda
te\FI
G_X_
GDET
erre
strial
.mxd
Minor WatercourseMajor Watercourse
Towrie Development Area
Alluvium Depth to GW (m)
Clematis Sandstone Depth to GW (m)
Rewan Group Depth to GW (m)
SURFACE GEOLOGY
Quaternary alluvium and lacustrine deposits (Qa)
TQr-QLD (TQr)
Oligocene-Miocene sediments (Tm)
Hutton Sandstone, Evergreen Formation, Precipice Sandstone (Jb)
Moolayember Formation (Rm)
Clematis Group (Re)
Rewan Group (Rr)
Water body (W)

Santos GLNG Pty Ltd Towrie Development Area
Water Assessment Report
Page 90DX70010A01 May 2021
7.9.3 Subterranean Fauna
Stygofauna are predominantly crustaceans that are between 0.3 mm and 15 mm in length (Humphreys 2006). They are predominantly found in aquifers with large (mm or greater) pore spaces, especially alluvial, karstic and some fractured rock aquifers (Hose et al. 2015). The size of the pore spaces is a key determinant of the suitability of an aquifer as stygofauna habitat. Stygofauna have been recorded occasionally in coal seam aquifers, particularly where those aquifers are hydrologically connected to a shallow alluvial aquifer (Hose et al. 2015). Hose et al. (2015) indicates the following related to the presence of stygofauna:
‘The abundance and diversity of stygofauna typically decreases with depth below ground. Fauna are rarely found more than 100 m below ground level.
Stygofauna are found across a range of water quality conditions (from fresh to saline), but most common in fresh and brackish water (electrical conductivity less than 5,000 µS/cm).
Stygofauna are rarely found in hypoxic groundwater (< 0.3 mg O2/L).
Stygofauna are more abundant in areas of surface water-groundwater exchange, compared to deeper areas or those further along the groundwater flow path remote from areas of exchange or recharge.’
In the context of the Project, it is unlikely that stygofauna will be present within the target coal seams due to the depth below ground level and relatively high EC. However, potential habitat for stygofauna exists within the alluvium, which are shallower in depth, and exhibit relatively fresh EC. Further discussion of stygofauna, in the context of impacts, is provided in Section 9.2.4.
7.10 Existing Third-Party Groundwater Users
7.10.1 Registered Groundwater Bores
Within the vicinity of the Project (within the Lease and a 25 km buffer outside), there are 94 registered groundwater bores recorded in the GWDB, as of January 2020 (DNRME 2019a). Of these registered bores, 49 are existing bores, including water supply or monitoring bores, with the remainder either abandoned or decommissioned. A summary of registered bores is presented in Table 7.5 along with their type and status, as derived from GWDB.
Table 7.5 GWDB Registered Bore Statistics for the Towrie Development Area and a 25 km Buffer (DNRME 2019a)
Type Abandoned and Destroyed (AD)
Abandoned but Usable (AU)
Existing (EX) Total
Condition Unknown (AB) - - 2 2Controlled Flow (AF) - - 1 1Artesian
Uncontrolled Flow (AU) - - - -Sub-Artesian (SF) 40 5 46 91
Total 40 5 49 94AB: artesian condition unknown; AC: artesian bores, which have ceased to flow; AF: bores that are under artesian pressure and capped to control free flow; AU: artesian bores, which are uncontrolled; SF: bores which do not flow under any condition and where active pumping is required to abstract water.
Santos GLNG Pty Ltd Towrie Development Area
Water Assessment Report
Page 91DX70010A01 May 2021
Other groundwater bores may also be present within the Towrie Development Area that are not registered in the GWDB (e.g. installed prior to the requirement to register water bores with the DNRME). It is not known how many unregistered bores may exist; however these bores may be identified during future bore baseline assessments. The data from baseline assessments is provided to OGIA and DNRME for incorporation into future updates to the GWDB.
7.10.2 Bore Baseline Assessment
Under the Water Act 2000, petroleum tenure holders are required to undertake baseline assessments of water bores prior to commencement of production. Baseline assessments are undertaken in accordance with the ‘Baseline Assessment Guideline’ (DES 2017a), to obtain information such as: bore status, type and purpose; information related to the construction of the bore, including depth installed, screen interval and source aquifer; groundwater level and quality and field gas measurement; and bore equipment including pump depth, pumping frequency and flow rate.
There are six registered bores located within the Project tenure area. Baseline Assessments were undertaken in 2018 for the registered bores listed in Table 7.6. The location of the bores could not be confirmed by landholders and bores were not found at the identified locations. Therefore, none of the bores were used for water supply purposes and were considered abandoned (Figure 7.28)
As required under the Water Act 2000 and the Surat CMA UWIR WMS, no further baseline assessments will be undertaken prior to production activities as there are no current bores located within the area used for water supply.

Santos GLNG Pty Ltd Towrie Development Area
Water Assessment Report
Page 92DX70010A01 May 2021
Table 7.6 Baseline Assessment Plan
Bore Registration
Number (RN)
Bore Name Property Lot / Plan Easting (GDA94)
Northing (GDA94) Tenement
Date of Existing Baseline
Assessment
Priority Area
Baseline Assessment
Date
13050002 B3S1 12CP864585 682793.5 7205755 14/6/2018
13050003 Arcadia No.2 Bore 12CP864585 683072.1 7205659 14/06/2018
13050004 B2S2 12CP864585 682934.3 7205814 14/06/2018
13050005 B1S3
Central Highlands regional LGA –
reserve12CP864585 683159.3 7205931 14/06/2018
22036 OSL OSL 3 (Arcadia) 3TR12 676275.7 7202718 27/09/2018
14502 AAO AAO 7 (Arcadia)
Brumby3TR12 680830.8 7200995
ATP2033
Completed – bores
abandoned and could
not be found
1
27/09/2018

Santos GLNG Pty Ltd Towrie Development Area
Water Assessment Report
Page 93DX70010A01 May 2021
Figure 7.28 Location of Bores within the Project area and Bores Prior Baseline Assessment
ARCADIACREEK
ARC
ADIA
CREE
K
BR
OW
NR
I VER
DAWSONR IVER
SPR ING CREEK
22036
1305000213050003
1305000413050005
14502
670,000 680,000 690,000
7,19
0,00
07,
200,
000
7,21
0,00
07,
220,
000
0 2 4 6 8 10
km
PROJECTION1. Horizontal Datum: GDA942. Grid Zone: 553. Vertical Datum: Mean Sea Level4. Scale: 1:200,000
NOTES:1. Topographic features sourced from GEODATA TOPO 250k series 3 Geosciene Australia 2. Project area provided by client 3. Background image courtesy of ESRI ArcGIS
9/07/2
020,
NCo
etze
e, \\in
t.kloh
n.com
\Pro
jData
\D\B
NE\D
X700
10A0
1 - To
wrie
GW A
sses
smen
t\400
Dra
wing
s\Iss
ued\S
anto
s Com
ment
s Upd
ate\F
IG_X
_Tow
rieBa
selin
e.mx
d
Baseline Assessment BoreRegistered, Abandoned and Destroyed
Registered BoreAbandoned and DestroyedExisting
Major WatercourseMinor WatercourseTowrie Development Area

Santos GLNG Pty Ltd Towrie Development Area
Water Assessment Report
Page 94DX70010A01 May 2021
7.10.3 Groundwater Use and Purpose
Groundwater is used for a number of purposes in the Surat CMA, including stock and domestic; agriculture, including general agriculture, irrigation and stock intensive; town water supplies; and industrial / mining purposes. Groundwater abstraction for stock and domestic purposes is likely to be the dominant water use within the vicinity of the Project.
OGIA completed an assessment to estimate groundwater use within the Surat CMA as part of the UWIR (OGIA 2019c). This estimate forms part of the non-CSG water component within the regional groundwater flow model which predicts impacts associated with CSG (Section 8.5).
As part of the UWIR, OGIA also completed an assessment to assign an aquifer to each bore within the Surat CMA. Their approach sourced data from the GWDB, tenure holder bore assessments, research projects, DNRME datasets, previous aquifer attribution for the 2012 and 2016 UWIR (QWC 2012; OGIA 2016b) and the 2018 Surat CMA geological model (OGIA 2019b). The approach used a hierarchical approach to estimate the source aquifer, with the hierarchy taking into account the confidence level of the data source. OGIA have provided this dataset to Santos to use as part of this assessment of existing groundwater users within the vicinity of the Project.
A summary of aquifer attribution for water supply bores in the Towrie Development Area (and within a 25 km buffer of the Project area) is provided in Table 7.7, with the location of the bores and attributed aquifer presented on Figure 7.29. The highest number of bores are attributed to the alluvium aquifer to the north of the Towrie Development Area.
Table 7.7 Aquifer Attribution and Number of Water Supply Bores
Formation Number of BoresAlluvium 10
Hutton Sandstone 1Lower Evergreen Formation 1
Moolayember Formation 4Clematis Group 6Rewan Group 1
Bandanna Formation 1
It should be noted that three bores are screened across multiple formations. This could be due to an improper seal or may be intentionally constructed to intersect multiple aquifers. For assessment purposes (and in Table 7.7 and Figure 7.29), these have been attributed to the deepest unit, or unit closest to the Bandanna Formation.
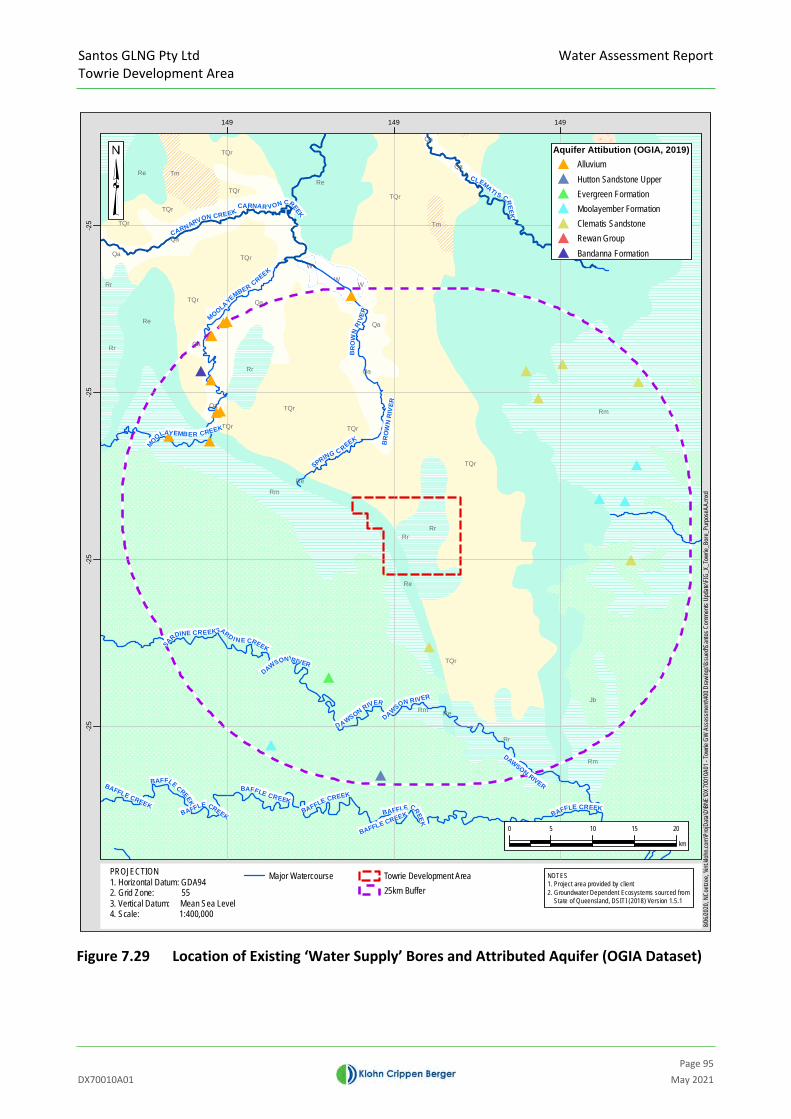
Santos GLNG Pty Ltd Towrie Development Area
Water Assessment Report
Page 95DX70010A01 May 2021
Figure 7.29 Location of Existing ‘Water Supply’ Bores and Attributed Aquifer (OGIA Dataset)
Jb
Re
Rm
TQr
Rm
Qa
Re
TQr
Re
TQr
Rr
TQr
TQr
Rr
Qa
Rm
Re
Rr
Rr
TQr
Qa
Re
Rr
TQr
Re
W
TQr
Tv
Tm
Qa
TQr
Qa
Qa
Tm
Rm
Rr
TQr
Qa
W
Re
TQr
TQr
Qa
W
Qa
SPRING C REEK
CARNARVON CREEK
MOOLAYEMBER CREEK
CLEMATI S CREEK
BR
OW
NRI V
ER
BAFFLE CREEK
SARD I NE CREEK
DAWSON RIVER
BAFFLE CREEK
SARDINE CREEK
BAFFLE CREEK
BR
OW
N R
IVER
DAWSON RIVER
BAFFLE CREEK
MOOLAYEMBER CREEK
BAFFLE CREEK
DAWSON RIVER
DAWSON RIVER
BAFFLE CREEKBAFFLE CREEK
DAWSON RIVER
CARNAR VON CREEK
BAFFLE CREEK
149 149 149
-25
-25
-25
-25
0 5 10 15 20
km
PROJECTION1. Horizontal Datum: GDA942. Grid Zone: 553. Vertical Datum: Mean Sea Level4. Scale: 1:400,000
NOTES1. Project area provided by client 2. Groundwater Dependent Ecosystems sourced from State of Queensland, DSITI (2018) Version 1.5.1
8/06/2
020,
NCo
etze
e, \\in
t.kloh
n.com
\Pro
jData
\D\B
NE\D
X700
10A0
1 - To
wrie
GW A
sses
smen
t\400
Dra
wing
s\Iss
ued\S
anto
s Com
men
ts Up
date\
FIG_
X_To
wrie_
Bore
_Pur
pose
AA.m
xd
Major Watercourse Towrie Development Area25km Buffer
Aquifer Attibution (OGIA, 2019)AlluviumHutton Sandstone UpperEvergreen FormationMoolayember FormationClematis SandstoneRewan GroupBandanna Formation

Santos GLNG Pty Ltd Towrie Development Area
Water Assessment Report
Page 96DX70010A01 May 2021
An estimate of stock and domestic water use for each formation, based on abstraction estimates from the UWIR (OGIA 2019c), is provided below:
Alluvium, Cenozoic or Basalt – 1 ML/year/bore
Moolayember Formation – 2.9 ML/year/bore
Clematis Group – 2.5 ML/year/bore
Rewan Group – 1.9 ML/year/bore
Bandanna Formation – 1.8 ML/year/bore
Bowen Basin sediments (Permian Upper / Bowen Basin Lower) – 1.3 ML/year/bore
Cattle Creek Formation – 1 ML/year/bore
7.11 Conceptual Model Summary
This section summarises the information of the previous sections in terms of the conceptual models for the hydrological and hydrogeological systems and identifies the water dependent assets for consideration in the impact assessment. A summary of the conceptual model is as follows:
The target for gas production for the Project is the Bandanna Formation, which occurs at ~150 to over 1,000 mbGL.
Geology within the vicinity of the Project area comprises Quaternary-age alluvium associated with the watercourses (Brown River, Moolayember Creek, Spring Creek and Arcadia Creek), with Cenozoic-age residual / colluvium adjacent to the water courses along the valley floor. The Rewan Group aquitard sub-crops directly beneath the Quaternary-Tertiary aged residual / colluvium within the Project area towards the east and north, but predominantly outcrops throughout the remainder of the Project area. Moolayember Formation and Clematis Group outcrop along the western extent of the Project area.
The watercourses within the Towrie Development Area are characteristically ephemeral and typically flow only during significant rainfall events.
Potential TGDEs associated with the watercourses, if groundwater dependent at least in part, would likely be sourcing groundwater from the shallow unconsolidated sediments within and adjacent to water courses within the Project area (Arcadia Creek). Other potential TGDEs located in the area of the Quaternary-Tertiary cover are considered unlikely to be groundwater dependent based on the depth to the groundwater from the surface (greater than 20 mbGL).
Spring complexes are present to the west of the Towrie Development Area and are associated with the Clematis Group and Precipice Sandstone. These springs are geologically isolated springs and range from ~10 km to ~25 km from the Towrie Development Area. There is a significant thickness of the Rewan Group aquitard (between 50 to 200 m) which separates the Clematis Group from the Bandanna Formation.
Groundwater use is predominately associated with the Clematis Group.
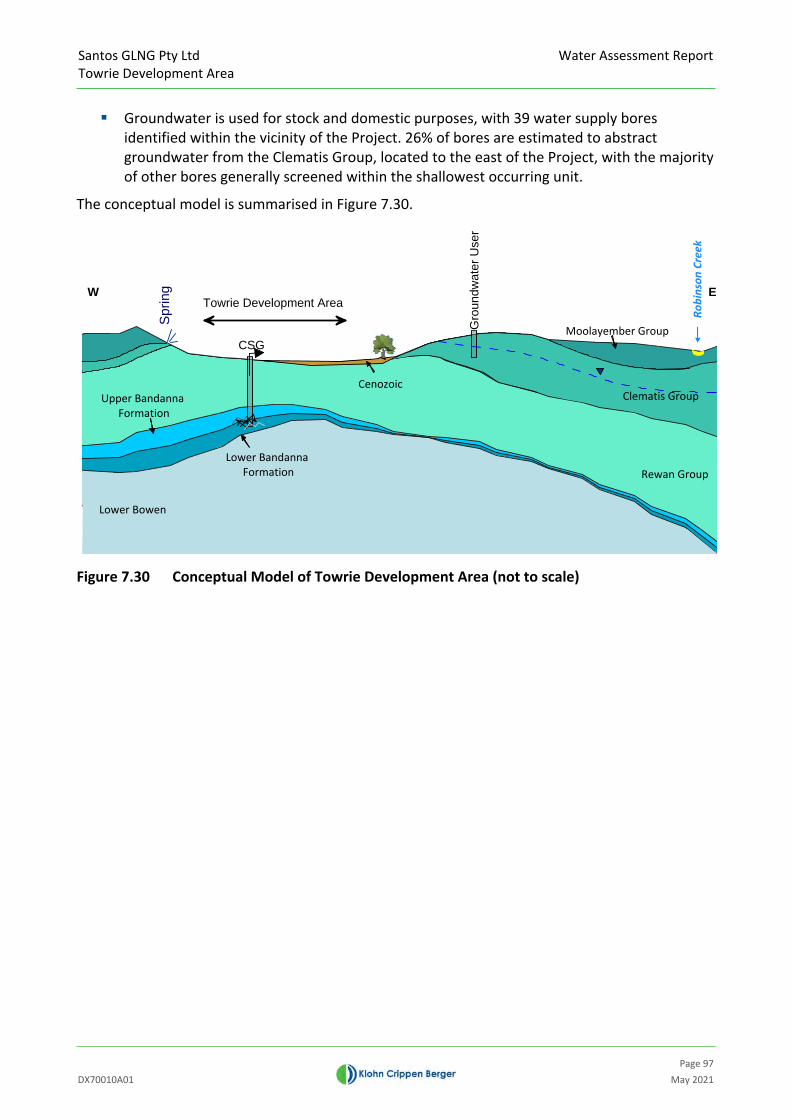
Santos GLNG Pty Ltd Towrie Development Area
Water Assessment Report
Page 97DX70010A01 May 2021
Groundwater is used for stock and domestic purposes, with 39 water supply bores identified within the vicinity of the Project. 26% of bores are estimated to abstract groundwater from the Clematis Group, located to the east of the Project, with the majority of other bores generally screened within the shallowest occurring unit.
The conceptual model is summarised in Figure 7.30.
Figure 7.30 Conceptual Model of Towrie Development Area (not to scale)
-1800
-1600
-1400
-1200
-1000
-800
-600
-400
-200
0
200
400
600
800
Elev
atio
n (m
AHD
)
0 2 4 6 8 10 12 14 16 18 20 22 24 26 28 30 32 34 36 38 40 42 44 46 48 50 52 54 56 58 60Chainage (km)
Robi
nson
Cre
ek
W ETowrie Development Area
Rewan Group
Clematis Group
Gro
undw
ater
Use
r
CSG
Sprin
g
Lower Bowen
Moolayember Group
Cenozoic
Lower BandannaFormation
Upper BandannaFormation
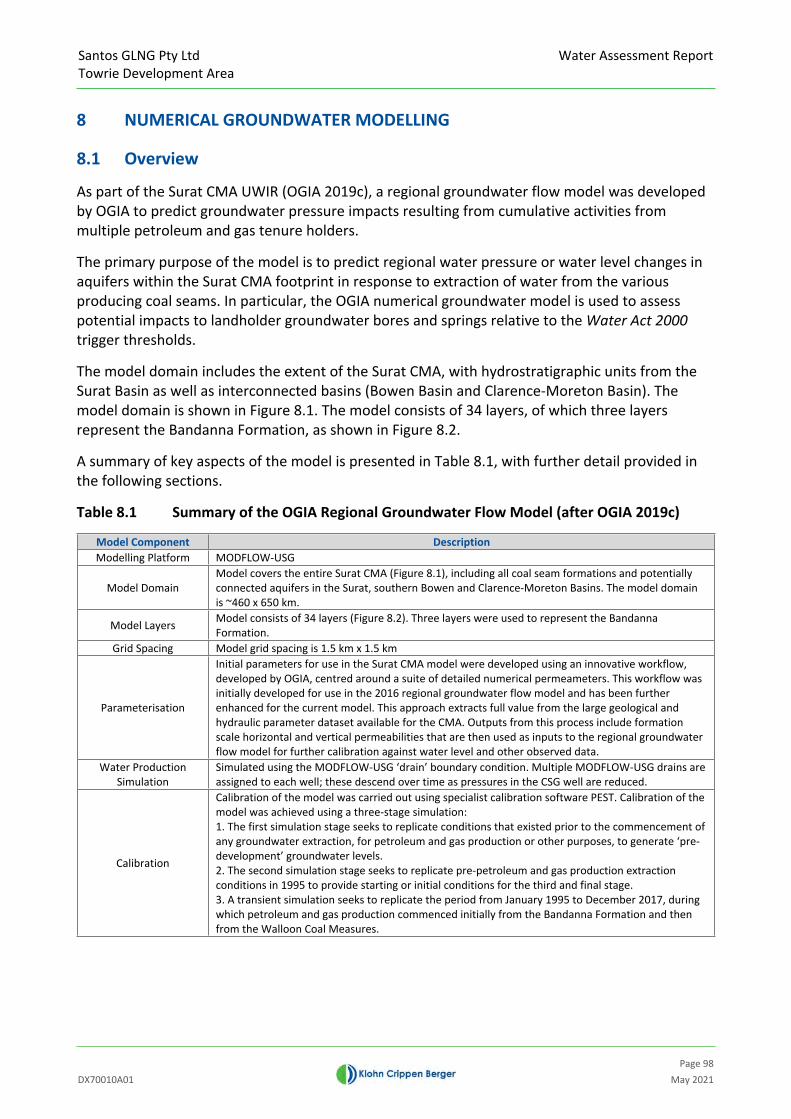
Santos GLNG Pty Ltd Towrie Development Area
Water Assessment Report
Page 98DX70010A01 May 2021
8 NUMERICAL GROUNDWATER MODELLING
8.1 Overview
As part of the Surat CMA UWIR (OGIA 2019c), a regional groundwater flow model was developed by OGIA to predict groundwater pressure impacts resulting from cumulative activities from multiple petroleum and gas tenure holders.
The primary purpose of the model is to predict regional water pressure or water level changes in aquifers within the Surat CMA footprint in response to extraction of water from the various producing coal seams. In particular, the OGIA numerical groundwater model is used to assess potential impacts to landholder groundwater bores and springs relative to the Water Act 2000 trigger thresholds.
The model domain includes the extent of the Surat CMA, with hydrostratigraphic units from the Surat Basin as well as interconnected basins (Bowen Basin and Clarence-Moreton Basin). The model domain is shown in Figure 8.1. The model consists of 34 layers, of which three layers represent the Bandanna Formation, as shown in Figure 8.2.
A summary of key aspects of the model is presented in Table 8.1, with further detail provided in the following sections.
Table 8.1 Summary of the OGIA Regional Groundwater Flow Model (after OGIA 2019c)
Model Component DescriptionModelling Platform MODFLOW-USG
Model DomainModel covers the entire Surat CMA (Figure 8.1), including all coal seam formations and potentially connected aquifers in the Surat, southern Bowen and Clarence-Moreton Basins. The model domain is ~460 x 650 km.
Model Layers Model consists of 34 layers (Figure 8.2). Three layers were used to represent the Bandanna Formation.
Grid Spacing Model grid spacing is 1.5 km x 1.5 km
Parameterisation
Initial parameters for use in the Surat CMA model were developed using an innovative workflow, developed by OGIA, centred around a suite of detailed numerical permeameters. This workflow was initially developed for use in the 2016 regional groundwater flow model and has been further enhanced for the current model. This approach extracts full value from the large geological and hydraulic parameter dataset available for the CMA. Outputs from this process include formation scale horizontal and vertical permeabilities that are then used as inputs to the regional groundwater flow model for further calibration against water level and other observed data.
Water Production Simulation
Simulated using the MODFLOW-USG ‘drain’ boundary condition. Multiple MODFLOW-USG drains are assigned to each well; these descend over time as pressures in the CSG well are reduced.
Calibration
Calibration of the model was carried out using specialist calibration software PEST. Calibration of the model was achieved using a three-stage simulation: 1. The first simulation stage seeks to replicate conditions that existed prior to the commencement of any groundwater extraction, for petroleum and gas production or other purposes, to generate ‘pre-development’ groundwater levels. 2. The second simulation stage seeks to replicate pre-petroleum and gas production extraction conditions in 1995 to provide starting or initial conditions for the third and final stage. 3. A transient simulation seeks to replicate the period from January 1995 to December 2017, during which petroleum and gas production commenced initially from the Bandanna Formation and then from the Walloon Coal Measures.

Santos GLNG Pty Ltd Towrie Development Area
Water Assessment Report
Page 99DX70010A01 May 2021
Figure 8.1 Location of the Surat CMA Regional Flow Model Domain and the Project area
ROMAMILES
DALBY
MOONIE
INJUNE
WANDOAN
EMERALD
TOOWOOMBA
ST GEORGE
ROLLESTON
GLADSTONE
CHINCHILLA
BLACKWATER
ROCKHAMPTON
148 150 152
-28
-26
-24
0 50 100 150 200
km
PROJECTION1. Horizontal Datum: GDA94 2. Vertical Datum: Mean Sea Level3. Scale: 1:4,500,000
Town
Principal Road
Towrie Development Area
Petroleum Lease
Surat Cumulative Managment Area
NOTES: 1. Topographic features sourced GEODATA TOPO 250k series 3 Geoscience Australia2. Surat CMA boundary sourced from QSpatial, State of Queensland (2011)3. Project Boundary (ATP 1191) sourced from DNRME, 2018
3/04/2
020,
NCo
etze
e, \\in
t.kloh
n.com
\Pro
jData
\D\B
NE\D
X700
10A0
1 - To
wrie
GW A
sses
smen
t\400
Dra
wing
s\Iss
ued\F
IG_X
_Tow
rieLo
catio
n.mxd
Towrie Development Area
BRISBANE

Santos GLNG Pty Ltd Towrie Development Area
Water Assessment Report
Page 100DX70010A01 May 2021
Figure 8.2 Model Layers and Corresponding Hydrostratigraphic Units Represented in the OGIA Regional Groundwater Flow Model (after OGIA 2019c)

Santos GLNG Pty Ltd Towrie Development Area
Water Assessment Report
Page 101DX70010A01 May 2021
8.2 Model Parameters, Boundary Conditions and Calibration
The information provided in the following sections has been summarised from the Underground Water Impact Report for the Surat CMA (OGIA 2019c).
8.2.1 Model Parameters
OGIA improved their approach to assigning initial numerical groundwater model parameters as part of the update to the regional model for the 2016 UWIR (OGIA 2016b) and have continued to further enhance the model for the 2019 UWIR (OGIA 2019c).
The approach included three steps, as described in OGIA (2019c):
‘Initial values of hydraulic conductivity for each of six lithology types (clean sand, dirty sand, siltstone, mudstone, carbonaceous shale and coal) from geophysical logs are derived from expert knowledge, literature and analysis of geophysical logs.
These initial values are then input to a stochastic permeability model and calibrated (or ‘conditioned’) through comparison with around 13,000 hydraulic test results at three different scales (i.e. pump tests, core test and geophysical measurement).
Once calibrated, these values are then used to populate numerical permeameters – detailed 21 x 21 km numerical models of each stratigraphic unit, generated using lithological data for about 6,000 CSG wells and covering the full extent of the 12 stratigraphic units modelled. In total, more than 138,000 model runs were carried out during this part of the process.’
Final model calibrated vertical and horizontal hydraulic conductivity values in the vicinity of the Project are provided in Appendix II.
Specific to the Project area, the hydraulic conductivity values adopted for the groundwater model calibration and associated uncertainty analyses are considered conservative. Measured hydraulic conductivity values within the vicinity of the Project area (Section 7.4) are lower than the values adopted in the model, therefore the model will over-estimate connectivity and drawdown effects in connected formations to the producing seam.
8.2.2 Groundwater Abstraction – Boundary Conditions
Optimal flow conditions for gas production are typically achieved when water pressures within the production well are equivalent to 25 to 80 m of water head (OGIA 2019c). To simulate water production, OGIA have used the MODFLOW-USG ‘drain’ boundary condition, with multiple drains assigned to each production well descending over time as pressures in the CSG production well reduce. The simulation using the drain boundary condition, is based on the sequencing of development and production well spacing provided by tenure holders across the model domain. Water is removed from the model to achieve the optimal head conditions (25 to 80 m), rather than removing a volume predicted using a modelling tool (e.g. estimated abstraction volume in Section 3.3.1.1).
Groundwater abstraction for non-petroleum and gas purposes, such as stock and domestic, are simulated using the MODFLOW-USG ‘well’ boundary condition.

Santos GLNG Pty Ltd Towrie Development Area
Water Assessment Report
Page 102DX70010A01 May 2021
8.2.3 Model Calibration
Calibration of the 2019 model was achieved using a three-stage simulation (OGIA 2019c). The first simulation was to replicate conditions that existed prior to the commencement of any groundwater extraction, for petroleum, gas or other purposes. The second simulation was to replicate pre-petroleum and gas extraction conditions in 1995 to provide starting or initial conditions for the third and final stage. The third stage was a transient simulation to replicate the period from January 1995 to December 2017, during which petroleum and gas production commenced initially from the Bandanna Formation and then from the Walloon Coal Measures.
The calibration was undertaken using the automated calibration software PEST, with a range of qualitative and quantitative measures used to assess each calibration iteration, consistent with the Australian Groundwater Modelling Guidelines (Barnett et al. 2012).
8.3 Project Model Scenarios
Santos has recently planned to advance development of the Project area, and as such the tenure has not been included in previous versions of the UWIR (including the recently published 2019 UWIR).
To assist Santos with approval applications, and to maintain consistency with the UWIR 2019 predictions, OGIA agreed to simulate the proposed CSG production for the Project within the UWIR model based on information provided by Santos. These outputs have been provided for use and processed as part of this assessment. All processing and analysis of model outputs was undertaken by KCB based on raw model outputs provided by OGIA. Scenarios simulated by OGIA include:
Scenario A – Base case: the baseline run of the OGIA 2019 model and does not include any CSG water production associated with the proposed development.
Scenario B – A case including the proposed Project: a cumulative CSG production model scenario that includes all current and proposed developments (i.e. for Senex, APLNG, QGC, Arrow and Santos / GLNG).
Drawdown occurring as a result of CSG production associated with the proposed development is estimated based on the difference in the results from Scenario A and Scenario B, to provide a Project only scenario. There are no other active CSG projects in the vicinity of the Project, and therefore the outputs for the cumulative and Project only scenarios are the same for this Project in terms of CSG-related impacts.
The UWIR model does not include the two coal mines in this area, and therefore numerical groundwater model cumulative drawdown predictions, which include both the Towrie Development Area and the coal mine drawdown extents, are not available. Further discussion of non-CSG related cumulative impacts are provided in Section 9.4.
8.4 Scenario Results
Numerical model outputs provided by OGIA, for the scenarios detailed in the previous section, have been used by KCB to assess the extent and magnitude of drawdown related to CSG production from the Project.

Santos GLNG Pty Ltd Towrie Development Area
Water Assessment Report
Page 103DX70010A01 May 2021
Appendix III includes the predicted drawdown for the individual model layers, which represent the modelled hydrostratigraphic units (detailed in Figure 8.2). The figures in Appendix III present the drawdown during field development and post-development. Summary figures are presented in Figure 8.3 and Figure 8.4 showing the maximum drawdown pattern (occurring at any time in the future). Observations include:
Drawdown greater than 0.2 m (spring trigger threshold) is predicted in model layer 26 (Rewan Group) to model layer 31 (Cattle Creek Formation).
There is no drawdown predicted in the surficial unconsolidated Quaternary and Quaternary-Tertiary units (layer 1), Moolayember Formation (layer 24) or the Clematis Group (layer 25).
Drawdown in the Rewan Group (layer 26) is predicted to be less than 1 m.
Drawdown greater than 5 m (consolidated bore trigger threshold) is predicted in model layers 28 and 29 (Upper Bandanna Formation and Lower Bandanna Formation).
The highest drawdown is predicted in model layers 28 to 29, which represent the Bandanna Formation (target for CSG production).
As indicated, Appendix III presents the predicted drawdown during field development and post-development. The post-development timesteps presented are for 2067 (10-years after the end of production), 2099 (43-years after the end of production) and 2299 (243-years after the end of production. These figures show groundwater level recovery within the Bandanna Formation, and in the later timesteps, the propagation of drawdown in the overlying / underlying layers. Appendix IV provides the modelled groundwater elevation contours for each of the layers.
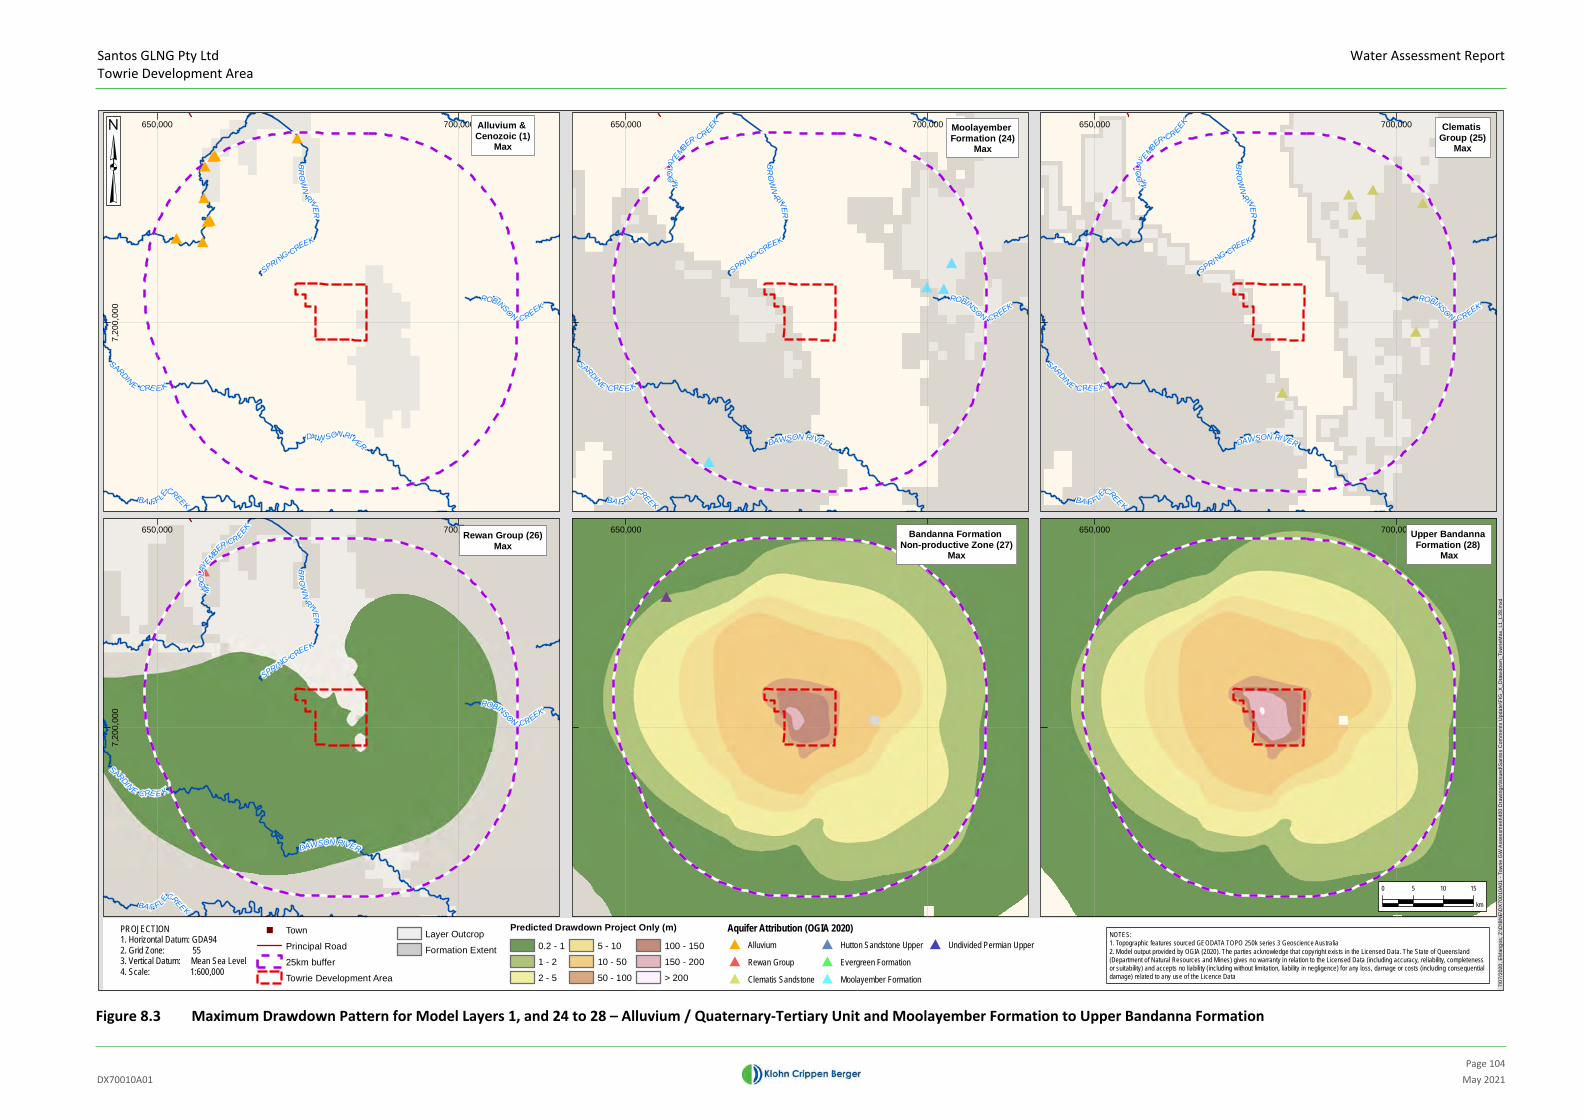
Santos GLNG Pty Ltd Towrie Development Area
Water Assessment Report
Page 104DX70010A01 May 2021
Figure 8.3 Maximum Drawdown Pattern for Model Layers 1, and 24 to 28 – Alluvium / Quaternary-Tertiary Unit and Moolayember Formation to Upper Bandanna Formation
SARDINE CRE E K
SPRI NGCRE
EK
ROBINSON CREEK
BR
OW
N
RIVER
DA W SON RIV
ER
BA FFLECREEK
650,000 700,0007,
200,
000
NOTES:1. Topographic features sourced GEODATA TOPO 250k series 3 Geoscience Australia2. Model output provided by OGIA (2020). The parties acknowledge that copyright exists in the Licensed Data. The State of Queensland (Department of Natural Resources and Mines) gives no warranty in relation to the Licensed Data (including accuracy, reliability, completenessor suitability) and accepts no liability (including without limitation, liability in negligence) for any loss, damage or costs (including consequential damage) related to any use of the Licence Data
MOO
LAYEMBER
CR EEK
SARDINE CRE E K
SPRI NGCRE
EK
BR
OW
N
RIVER
ROBINSON CREEK
DAWSON RIVER
BA FFLECREEK
650,000 700,000
7,20
0,00
0
MOO
LAYEMBER
CR EEK
SARDINE CRE E K
SPRI NGCRE
EK
BR
OW
N
RIVER
ROBINSON CREEK
DAWSON RIVER
BA FFLECREEK
650,000 700,000
MOO
LAYEMBER
CR EEK
SARDINE CRE E K
SPRI NGCRE
EK
BR
OW
N
RIVER
ROBINSON CREEK
DAWSON RIVER
BA FFLECREEK
650,000 700,000
650,000 700,000 650,000 700,000
PROJECTION1. Horizontal Datum: GDA942. Grid Zone: 553. Vertical Datum: Mean Sea Level4. Scale: 1:600,000
7/07
/202
0, E
Man
gos,
Z:\D
\BN
E\D
X70
010A
01 -
Tow
rie G
W A
sses
smen
t\400
Dra
win
gs\Is
sued
\San
tos
Com
men
ts U
pdat
e\FI
G_X
_Dra
wdo
wn_
Tow
rieM
ax_L
1_L2
8.m
xd
Alluvium & Cenozoic (1)
Max
Rewan Group (26)Max
Clematis Group (25)
Max
Moolayember Formation (24)
Max
Bandanna Formation Non-productive Zone (27)
Max
Upper Bandanna Formation (28)
Max
0 5 10 15
km
Aquifer Attribution (OGIA 2020)Alluvium
Rewan Group
Clematis Sandstone
Hutton Sandstone Upper
Evergreen Formation
Moolayember Formation
Undivided Permian Upper
Predicted Drawdown Project Only (m)
0.2 - 1
1 - 2
2 - 5
5 - 10
10 - 50
50 - 100
100 - 150
150 - 200
> 200
Layer Outcrop
Formation Extent
Town
Principal Road
Towrie Development Area
25km buffer

Santos GLNG Pty Ltd Towrie Development Area
Water Assessment Report
Page 105DX70010A01 May 2021
Figure 8.4 Maximum Drawdown Pattern for Model Layers 29 and 32 – Lower Bandanna Formation to Upper Cattle Creek Formation
650,000 700,0007,
200,
000
NOTES:1. Topographic features sourced GEODATA TOPO 250k series 3 Geoscience Australia2. Model output provided by OGIA (2019). The parties acknowledge that copyright exists in the Licensed Data. The State of Queensland (Department of Natural Resources and Mines) gives no warranty in relation to the Licensed Data (including accuracy, reliability, completenessor suitabili ty) and accepts no liabil ity (including without l imitation, l iability in negligence) for any loss, damage or costs (including consequential damage) related to any use of the Licence Data
650,000 700,000
7,20
0,00
0650,000 700,000650,000 700,000
650,000 700,000 650,000 700,000
PROJECTION1. Horizontal Datum: GDA942. Grid Zone: 553. Vertical Datum: Mean Sea Level4. Scale: 1:600,000
5/06
/202
0, N
Coe
tzee
, \\in
t.klo
hn.c
om\P
rojD
ata\
D\B
NE\
DX70
010A
01 -
Tow
rie G
W A
sses
smen
t\400
Dra
win
gs\Is
sued
\San
tos
Com
men
ts U
pdat
e\FI
G_X
_Dra
wdo
wn_
Tow
rieM
ax_L
29_L
32.m
xd
Lower BandannaFormation (29)
Max
Upper Cattle Creek Formation (32)
Max
Cattle Creek Formation Non-Productive Zone (31)
Max
Lower Bowen 1 (30)Max
0 5 10 15
km
Predicted Drawdown Project Only (m)
0.2 - 1
1 - 2
2 - 5
5 - 10
10 - 50
50 - 100
100 - 150
150 - 200
> 200
Layer Outcrop
Formation Extent
Town
Principal Road
Towrie Development Area
25km buffer

Santos GLNG Pty Ltd Towrie Development Area
Water Assessment Report
Page 106DX70010A01 May 2021
8.5 Uncertainty Analysis
As part of the 2019 UWIR model, OGIA have undertaken predictive uncertainty analysis on the model simulations. Potential uncertainties in groundwater flow model predictions have been assessed using a ‘null space Monte Carlo’ (NSMC) methodology, which is identified in the IESC explanatory note (Middlemis and Peeters 2018) as being the most complex of the three levels of uncertainty analysis outlined. This methodology involves generating a large number of alternative parameter sets, which are then partially calibrated to ensure consistency with both current hydrogeological understanding in the area and observations. Effectively, this generates different versions of the model, each of which could fit the historical data. These alternative models are then used to generate alternative predictions. OGIA have provided outputs from the uncertainty analysis for use in this assessment. The outputs have been processed by KCB and show the maximum drawdown pattern for each model layer for the 5th and 95th percentiles. Outputs of the uncertainty analysis are provided in Appendix V, with discussion in the following sections.
Additional data in the vicinity the Project area, particularly from exploration holes and seismic surveys (Figure 7.7 to Figure 7.9) has been reviewed in the context of the hydrogeological conceptual model. The area of interest is underlain by Rewan Group, separating the gas target seams from the upper aquifers.
Despite the presence of a mapped fault structure in the east of the Project area, only ~100 m displacement is observed in the Early Permian unit. It is considered that the aquitard thickness (Rewan Group) is sufficient to limit further vertical propagation of drawdown into the shallow layers.

Santos GLNG Pty Ltd Towrie Development Area
Water Assessment Report
Page 107DX70010A01 May 2021
9 IMPACT ASSESSMENT
9.1 Potential Project Impacts
9.1.1 Groundwater
Groundwater abstraction occurs as part of the gas production process. Groundwater is removed via production wells to depressurise the coal seams, which liberates gas flow. This depressurisation, and associated gas flow, sustains a groundwater flow to maintain the target operational pressure for gas production.
Water production is authorised under the Petroleum and Gas (Production and Safety) Act 2004 (Section 2.2.1). Potential impacts as a result of water production may include:
Decline in groundwater level / pressure at water bores, reducing water availability and potentially impacting groundwater EVs;
Reduction in groundwater head resulting in a reduction of groundwater discharge at spring complexes, potentially causing degradation of GDEs; and
Reduction of baseflow to watercourses, potentially resulting in reduced availability of water to GDEs and reduced water availability to potential users downstream.
The potential for impacts to occur, where receptors exist within the vicinity of the Project, are assessed against the Water Act 2000 trigger thresholds as outlined in Section 2.2.2.
Without adequate management and practices in place, other mechanisms to impact groundwater include:
Potential to introduce a connection between hydrostratigraphic units, which were previously isolated units, through drilling and construction of production wells, resulting in the potential for alteration of groundwater flow regimes and quality.
Drilling fluids are used during the drilling process and chemicals during hydraulic stimulation, which have the potential to impact groundwater quality.
Produced water storage facilities have the potential to impact groundwater levels and quality, through seepage or unplanned releases from temporary storage facilities (i.e. tanks).
Localised incidental activities have the potential to impact shallow groundwater systems, such as fuel spills or improper storage of chemicals.
Beneficial use activities, such as irrigation and stock watering, have the potential to impact shallow groundwater systems should over-irrigating occur, or the relevant beneficial use quality guidelines are not adhered to.
Monitoring, management and mitigation practices associated with the above activities are discussed further in Section 10. A risk assessment, which considers these potential impacts, is provided in Section 9.5.
Impacts associated with chemicals used during drilling have been considered in a separate chemical risk assessment (EHS Support 2020).
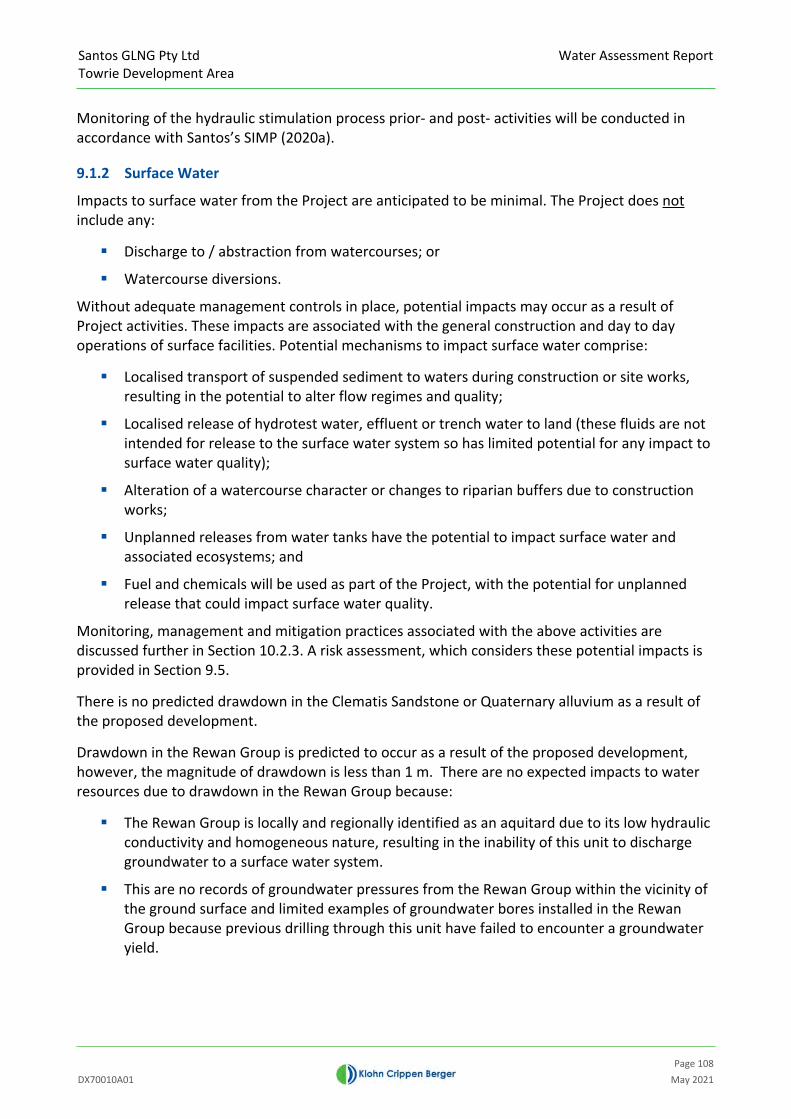
Santos GLNG Pty Ltd Towrie Development Area
Water Assessment Report
Page 108DX70010A01 May 2021
Monitoring of the hydraulic stimulation process prior- and post- activities will be conducted in accordance with Santos’s SIMP (2020a).
9.1.2 Surface Water
Impacts to surface water from the Project are anticipated to be minimal. The Project does not include any:
Discharge to / abstraction from watercourses; or
Watercourse diversions.
Without adequate management controls in place, potential impacts may occur as a result of Project activities. These impacts are associated with the general construction and day to day operations of surface facilities. Potential mechanisms to impact surface water comprise:
Localised transport of suspended sediment to waters during construction or site works, resulting in the potential to alter flow regimes and quality;
Localised release of hydrotest water, effluent or trench water to land (these fluids are not intended for release to the surface water system so has limited potential for any impact to surface water quality);
Alteration of a watercourse character or changes to riparian buffers due to construction works;
Unplanned releases from water tanks have the potential to impact surface water and associated ecosystems; and
Fuel and chemicals will be used as part of the Project, with the potential for unplanned release that could impact surface water quality.
Monitoring, management and mitigation practices associated with the above activities are discussed further in Section 10.2.3. A risk assessment, which considers these potential impacts is provided in Section 9.5.
There is no predicted drawdown in the Clematis Sandstone or Quaternary alluvium as a result of the proposed development.
Drawdown in the Rewan Group is predicted to occur as a result of the proposed development, however, the magnitude of drawdown is less than 1 m. There are no expected impacts to water resources due to drawdown in the Rewan Group because:
The Rewan Group is locally and regionally identified as an aquitard due to its low hydraulic conductivity and homogeneous nature, resulting in the inability of this unit to discharge groundwater to a surface water system.
This are no records of groundwater pressures from the Rewan Group within the vicinity of the ground surface and limited examples of groundwater bores installed in the Rewan Group because previous drilling through this unit have failed to encounter a groundwater yield.
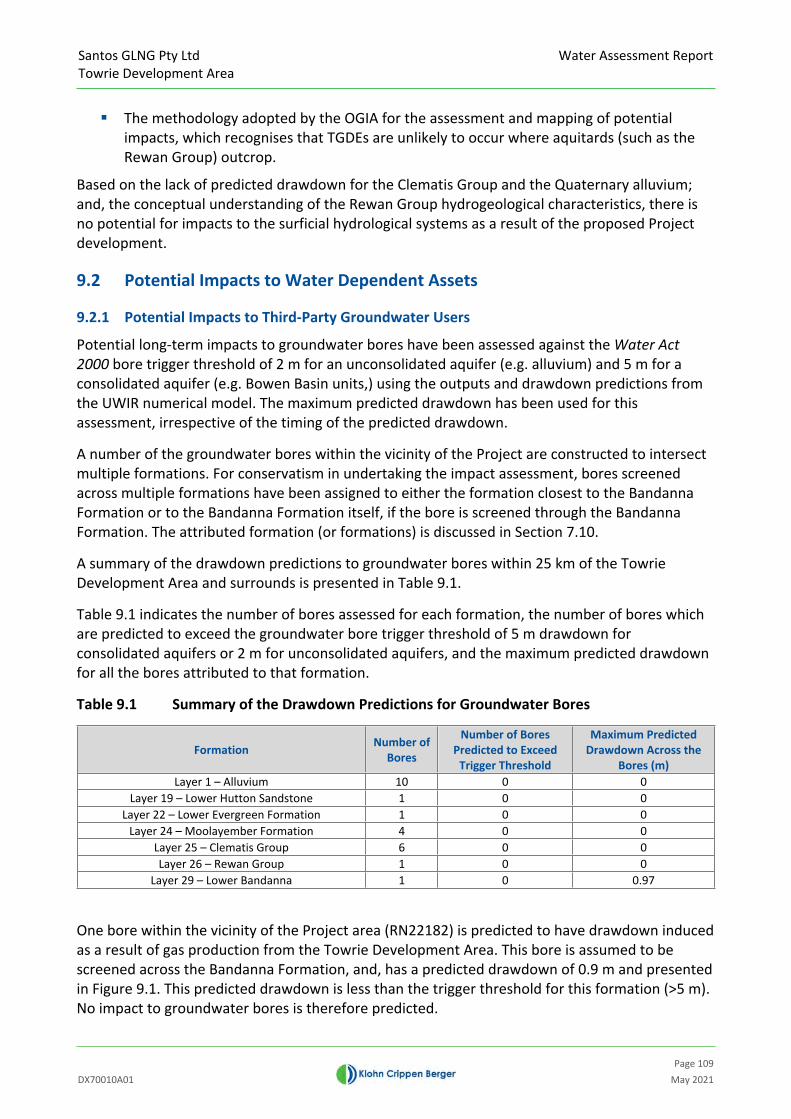
Santos GLNG Pty Ltd Towrie Development Area
Water Assessment Report
Page 109DX70010A01 May 2021
The methodology adopted by the OGIA for the assessment and mapping of potential impacts, which recognises that TGDEs are unlikely to occur where aquitards (such as the Rewan Group) outcrop.
Based on the lack of predicted drawdown for the Clematis Group and the Quaternary alluvium; and, the conceptual understanding of the Rewan Group hydrogeological characteristics, there is no potential for impacts to the surficial hydrological systems as a result of the proposed Project development.
9.2 Potential Impacts to Water Dependent Assets
9.2.1 Potential Impacts to Third-Party Groundwater Users
Potential long-term impacts to groundwater bores have been assessed against the Water Act 2000 bore trigger threshold of 2 m for an unconsolidated aquifer (e.g. alluvium) and 5 m for a consolidated aquifer (e.g. Bowen Basin units,) using the outputs and drawdown predictions from the UWIR numerical model. The maximum predicted drawdown has been used for this assessment, irrespective of the timing of the predicted drawdown.
A number of the groundwater bores within the vicinity of the Project are constructed to intersect multiple formations. For conservatism in undertaking the impact assessment, bores screened across multiple formations have been assigned to either the formation closest to the Bandanna Formation or to the Bandanna Formation itself, if the bore is screened through the Bandanna Formation. The attributed formation (or formations) is discussed in Section 7.10.
A summary of the drawdown predictions to groundwater bores within 25 km of the Towrie Development Area and surrounds is presented in Table 9.1.
Table 9.1 indicates the number of bores assessed for each formation, the number of bores which are predicted to exceed the groundwater bore trigger threshold of 5 m drawdown for consolidated aquifers or 2 m for unconsolidated aquifers, and the maximum predicted drawdown for all the bores attributed to that formation.
Table 9.1 Summary of the Drawdown Predictions for Groundwater Bores
Formation Number of Bores
Number of Bores Predicted to Exceed
Trigger Threshold
Maximum Predicted Drawdown Across the
Bores (m)Layer 1 – Alluvium 10 0 0
Layer 19 – Lower Hutton Sandstone 1 0 0Layer 22 – Lower Evergreen Formation 1 0 0
Layer 24 – Moolayember Formation 4 0 0Layer 25 – Clematis Group 6 0 0Layer 26 – Rewan Group 1 0 0
Layer 29 – Lower Bandanna 1 0 0.97
One bore within the vicinity of the Project area (RN22182) is predicted to have drawdown induced as a result of gas production from the Towrie Development Area. This bore is assumed to be screened across the Bandanna Formation, and, has a predicted drawdown of 0.9 m and presented in Figure 9.1. This predicted drawdown is less than the trigger threshold for this formation (>5 m). No impact to groundwater bores is therefore predicted.

Santos GLNG Pty Ltd Towrie Development Area
Water Assessment Report
Page 110DX70010A01 May 2021
Figure 9.1 Location of Bandanna Formation Bore (RN22182) Predicted to have an induced drawdown in the Vicinity of the Project
Rm
Rm
Rm
Rm
TQr
TQr
TQr
TQr
TQr
TQr
TQr
TQr
Re
Re
Re
Re
Qa
Re
Qa
QaQa
Qa
Qa
Qa
W
W
Rr
Rr
Rr
Rr
Rr
Rr
Jb
Jb
M OO
L AYEM
BERCREE K
ROBINSONCR
EEK
CLEMATI S C REEK
SA R DINEC R EEK
BAFFL EC REEK
SPRINGCREEK
DAWSONRIVER
BRO
WN
RIV
E
R
22182
660,000 680,000 700,000
7,16
0,00
07,
180,
000
7,20
0,00
07,
220,
000
PROJECTION1. Horizontal Datum: GDA942. Grid Zone: 553. Vertical Datum: Mean Sea Level4. Scale: 1:400,000
NOTES1. Topographic features sourced GEODATA TOPO 250k series 3 Geoscience Australia. 2. Project area provided by client 3. State Surface Geology (1:2m) sourced from DNRME, 2015
28/0
8/202
0, N
Coet
zee,
\\int.k
lohn.c
om\P
rojD
ata\D
\BNE
\DX7
0010
A01 -
Towr
ie GW
Ass
essm
ent\4
00 D
rawi
ngs\I
ssue
d\San
tos C
omm
ents
Upda
te\FI
G_X_
AA_B
anda
nna.m
xd
0 5 10 15 20
km
Bandanna Formation
Minor Watercourse
Major Watercourse
Towrie Development Area
25km Buffer

Santos GLNG Pty Ltd Towrie Development Area
Water Assessment Report
Page 111DX70010A01 May 2021
9.2.2 Potential Impacts to Spring Complexes
The drawdown associated with the development of the Project will not have an impact on nearby Spring Complexes. Results of the numerical modelling (including the results of the uncertainty analysis) did not predict any drawdown in the Clematis Group (Layer 25), and therefore there is no drawdown or impact predicted on the spring complexes (i.e. Injury spring complex) that rely on groundwater from that formation. Drawdown was also not predicted in the Precipice Sandstone, therefore, the spring complexes to the south of the Project area sourcing from the Precipice Sandstone are not interpreted to be impacted by the Project development.
9.2.3 Potential Impacts to Terrestrial GDEs
The drawdown associated with the development of the Project will not have an impact on surrounding potential TGDEs.
As discussed in Section 7.9.2, potential TGDEs are mapped within the vicinity of the Towrie Development Area as occurring adjacent to the watercourses, which are potentially reliant on groundwater within the shallow Quaternary-Tertiary residual / colluvium. Potential TGDEs are also mapped in areas where the Clematis Group, Moolayember Formation and Rewan Group outcrop.
The numerical model drawdown predictions presented in Figure 8.3 and Figure 8.4 identify that drawdown is not predicted in the Clematis Group or Moolayember Formation; however, drawdown (up to 1 m) is predicted for the Rewan Group. A correlation of the predicted drawdown extent with the mapped potential TGDEs associated with the outcropping Rewan Group (Figure 8.3) indicates that the extent of drawdown does not intersect the mapped potential TGDEs.
Uncertainty analysis results presented in Appendix V indicates that the 95th percentile maximum drawdown extent (based on the 0.2 m drawdown contour) for the Rewan Group extends to the Rewan Group outcrop adjacent to the Dawson River to the south-southeast of the Project area. This area also coincides with mapped potential TGDEs as identified in Figure 7.27. Groundwater bores within the vicinity of this area are presented in Figure 7.17 (RN13030370, RN13030371, RN13030372, RN13030373, RN13030374, RN13030375, RN13030376), and have been identified to have a source aquifer of the Rewan Group, in accordance with the OGIA Aquifer Attribution information. However, a review of the bore cards from the GWDB for these bores, identify the bores to be open holes with unconsolidated material (sand and gravel) overlying interpreted Rewan Group (shale). Although not mapped on the surface geology map, due to the proximity of the bores to the Dawson River, it is interpreted that the unconsolidated material overlying the Rewan Group observed in the bores are likely to be deposits of unconsolidated sediments associated with the Dawson River. This is further supported by the topography adjacent to the Dawson River, which is representative of an alluvial terrace.
Queensland Regional Ecosystem Mapping (Queensland Herbarium 2016) that coincides with the mapped TGDE (Figure 7.27) within the vicinity of the Dawson River is presented in Figure 9.2, while a summary of the coinciding regional ecosystem is provided in Table 9.2. These mapped Regional Ecosystems identify the vegetation associated with the potential TGDEs to be associated with an alluvial plain / valley floor sandy soil setting; or coarse-grained sedimentary rock or sandstone tablelands settings. These settings are not representative of the identified lithologies of the Rewan Group (Section 7.2).

Santos GLNG Pty Ltd Towrie Development Area
Water Assessment Report
Page 112DX70010A01 May 2021
The potential TGDEs adjacent to the Dawson River are interpreted to be sourcing groundwater water from unconsolidated alluvial material. They are not interpreted as being dependent on groundwater from the Rewan Group because generally it would not be considered as water-bearing.
Table 9.2 Summary of TGDE Coinciding Regional Ecosystem Mapping (Queensland Herbarium 2016)
RE ID Short Description Regulation11.3.2 Eucalyptus populnea woodland on alluvial plains
11.3.17 Eucalyptus populnea woodland with Acacia harpophylla and/or Casuarina cristata on alluvial plains
11.3.39 Eucalyptus melanophloia +/- E. chloroclada open woodland on undulating plains and valleys with sandy soils
11.10.7 Eucalyptus crebra woodland on coarse-grained sedimentary rocks
11.10.13 Eucalyptus spp. and/or Corymbia spp. open forest on scarps and sandstone tablelands
This determination is consistent with the methodology adopted by OGIA for the assessment of potential impacts of the CSG within the Surat CMA to TGDEs (OGIA 2019c). This methodology identifies outcrop areas where a drawdown of more than 0.2 m, but less than 1 m, as low risk impacts; which represents the area of concern associated with this assessment. The OGIA methodology assesses potential TGDEs associated with outcropping aquifers. The Rewan Group is an aquitard, therefore, in accordance with the OGIA methodology any drawdown observed in the Rewan Group outcrop is not considered for impacts to potential TGDEs mapped on this outcrop.
Three areas of Gilgai are located within the vicinity of the Project and are considered a habitat for the Ornamental Snake (Denisonia maculate). The potential impacts to these areas of Gilgai as a result of groundwater level drawdown are provided as follows:
Gilgais form as a result of surficial geomorphological processes where depressions are formed on the ground surface due to the repeated swelling and cracking cycles of clay, above which surface water will pool.
The accumulation of water (wetting) on the Gilgai areas results from rainfall events, while the drying of the ponded water results from prolonged dry weather. Groundwater is not a source of water for Gilgais.
As discussed in Section 9.1.2, there is no potential for groundwater level drawdown impacts and no hydraulic connection between the groundwater of the outcropping hydrostratigraphic units (Rewan Group, Clematis Sandstone, Quaternary alluvium) and the ground surface / watercourses.
Therefore, based on the conceptual understanding of the Gilgai occurrence, the predicted drawdown in the hydrostratigraphic units as a result of the proposed Project development and the conceptual understanding of the outcropping hydrostratigraphic units, there is no predicted impacts to the three areas of Gilgai within the vicinity of the Project as a result of the proposed development.

Santos GLNG Pty Ltd Towrie Development Area
Water Assessment Report
Page 113DX70010A01 May 2021
Figure 9.2 Regional Ecosystem Mapping in the vicinity of Rewan Group Outcrop and the Dawson River
DAW
SO N RIVER
SP
RING
GULLY
GRATZ GULLY
11.3.39
11.3.27
11.9.4
11.3.2511.3.2
11.10.13
11.9.1011.9.5
11.3.17
non-rem
685,000 687,500 690,000 692,500 695,000 697,500
7,17
5,00
07,
177,
500
7,18
0,00
0
NOTES:1. Project area provided by client 2. State Surface Geology (1:2m), sourced from DNRME, 2015
LegendMajor WatercourseMinor Watercourse
Towrie Development Area25km Buffer
11.3.1711.10.1311.3.2
11.3.2511.3.2711.3.39
11.9.1011.9.411.9.5
non-rem
6/08
/202
0, N
Turn
er, Z
:\D\B
NE\D
X700
10A0
1 - T
owrie
GW
Ass
essm
ent\4
00 D
rawi
ngs\I
ssue
d\Fi
g_X_
Daws
onRi
ver_
RE.m
xd
PROJECTION1. Horizontal Datum: GDA942. Grid Zone: 543. Vertical Datum: Mean Sea Level4. Scale: 1:75,000
DAWSONRIVER
MO
OLAY
EMBER CREE
K
RUINEDCASTL
E CREE
K
ROBINSON
CR EE K
S ARD INE CREEK
BULLAROO CREEK
BAFFLE CREEK
SPR ING CREEK
BROWNR
IVE
R
ME
RIV
ALE
RIV
ER
CARNARVONCR E EK
SAN
DY
CREE
K
620,000 640,000 660,000 680,000 700,000 720,000
7,18
0,00
07,
200,
000
7,22
0,00
0
11.3.39
11.3.27
11.9.4
11.3.2511.3.2
11.10.13
DAW SONRIVE
R
SP
RIN
GG
ULLY
GRATZ GULLY
11.9.1011.9.5
11.3.17
non-rem
685,000 687,500 690,000 692,500 695,000 697,500
7,17
5,00
07,
177,
500
7,18
0,00
0
0.2
0.3DAW
SO N RIVER
SPR
ING
GULLY
GRATZ GULLY
11.3.39
11.3.27
11.9.4
11.3.2511.3.2
11.10.13
11.9.1011.9.5
11.3.17
non-rem
11.9.1011.9.5
11.3.17non-rem
685,000 687,500 690,000 692,500 695,000 697,500
7,17
5,00
07,
177,
500
7,18
0,00
0
0 5 10 15 20
km
Project Area
Rewan Outcrop
Terrestrial GDE and Regional Ecosystem
95th Percentile Drawdown
Regional Ecosystem
Area of Interest
0 0.5 1 1.5 2
km
0 0.5 1 1.5 2
km
0 0.5 1 1.5 2
km
Drawdown (m)0.2 - 11 - 2
GeologyRewan Group Outcrop
Groundwater Dependent EcosystemSURAT RS 01ASURAT RS 03A
DrawdownDrawdown Contour (0.1m)

Santos GLNG Pty Ltd Towrie Development Area
Water Assessment Report
Page 114DX70010A01 May 2021
9.2.4 Potential Impacts to Subterranean Fauna
Potential impacts to subterranean fauna are related to the groundwater impacts identified in Section 9.1. No potential impacts to subterranean fauna have been identified.
No drawdown is predicted in the model in the area of the mapped alluvium to the north of the Project area or the shallow Quaternary-Tertiary residual / colluvium within the vicinity of the Project area, therefore subterranean fauna that depend on groundwater potentially within these aquifers are not considered to be impacted.
Subterranean fauna is unlikely to be present in the Bandanna Formation (target coal seam where maximum drawdown is predicted to occur). This interpretation is based on studies completed by Hose et al. (2015) which identifies:
“Stygofauna are found in aquifers across Australia, predominantly in aquifers with large (mm or greater) pore spaces, especially alluvial, karstic and some fractured rock aquifers. The size of the pore spaces is a key determinant of the suitability of an aquifer as stygofauna habitat. Stygofauna have been recorded occasionally in coal seam aquifers, particularly where those aquifers are hydrologically connected to a shallow alluvial aquifer.
Stygofauna are rarely found more than 100 m below ground level nor where dissolved oxygen concentrations in the groundwater are less than 0.3 mg O2/L. Stygofauna are found across a range of water quality conditions (from fresh to saline), but most common in fresh and brackish water (electrical conductivity (EC) less than 5,000 µS/cm).”
The relevant characteristics of the Bandanna Formation across the Project area include:
At the shallowest location, the Bandanna Formation is approximately 400 m below the ground surface; and,
The average EC concentration of produced water from the Bandanna Formation is 10,250 µS/cm.
Therefore, no potential impacts to subterranean fauna are predicted for the Bandanna Formation because this unit is not considered a subterranean habitat for stygofauna.
9.2.5 Potential Impacts to Surface Water-Dependent Assets
No potential impacts to surface water-dependent assets have been identified.
The Project does not include any planned discharge to, or abstraction, from the watercourses or watercourse diversions. The risk for other potential impacts, as outlined in Section 9.1.2, are managed through implementation of the appropriate management, mitigation and monitoring practices associated with construction and operation. Impacts to surface water users are considered unlikely.
9.3 Potential Impacts from Subsidence
Potential risk of impact to water resources due to subsidence is considered to be negligible.
As part of gas production, groundwater and gas are extracted from the Bandanna Formation. This is achieved by a reduction in water pressure, which can result in compaction of the producing

Santos GLNG Pty Ltd Towrie Development Area
Water Assessment Report
Page 115DX70010A01 May 2021
seams of the Bandanna Formation. Desorption of gas from the coal seams can also result in additional compaction (IESC 2014b). This compaction can result in subsidence, which is a localised lowering of the land surface (IESC 2014c).
Predicted surface subsidence impacts associated with gas production have been calculated previously for the Bandanna Formation by Santos GLNG (Santos 2014). The estimated subsidence from the previous study was 0.05 m for the coal seams and 0.1 m for the remaining thickness of the formation, and was based on a drawdown of ~1,000 m. The predicted drawdown for this Project is ~250 m, which is considerably less than the previous study. Applying the same methodology but using the adjusted drawdown, results in an estimated subsidence of 0.01 m (total coal seams and overlying formation).
9.4 Potential Cumulative Impacts
As detailed in Section 2.2.2, the Project is located within the Surat CMA, which was declared under the Water Act 2000 as a result of concentrated development by multiple tenure holders. The Towrie Development Area is located in the northern portion of the Surat CMA and is located adjacent to any other active or planned CSG developments.
OGIA, established under the Water Act 2000, is responsible for predicting regional impacts on water pressures in the hydrostratigraphic units of the Surat CMA and identifying potentially impacted groundwater bores and springs as presented in the UWIR, which is updated and published every three years. Should additional development be planned in this area, these will be incorporated into future versions of the UWIR.
As identified in Section 3.1.1, other petroleum tenures are located adjacent to the Project area, which extract gas from the Bandanna Formation. Dewatering is undertaken as part of these established CSG operations, in order to depressurise the gas bearing strata, allowing gas to flow to surface. Due to the proximity of these activities to the Project area, there is potential for these established operations to interact with the Project.
These surrounding CSG operations are incorporated in the OGIA UWIR model, along with the Towrie Development Area, to allow prediction of the cumulative drawdown within the vicinity of the Project area.
For the purposes of this assessment, the inclusion of drawdown impacts from the surrounding coal mines to the cumulative drawdown impacts is not interpreted to be warranted as the drawdown from the surrounding coal mining activity is not predicted to contribute to the cumulative drawdown due to the distance of the coal mines away from the Project (~90 km to ~130 km) and the anticipated localised drawdown extent from coal mines. This is also discussed in Section 4.2.1.
Figure 9.3 presents the maximum cumulative drawdown in the Bandanna Formation predicted from the UWIR model.
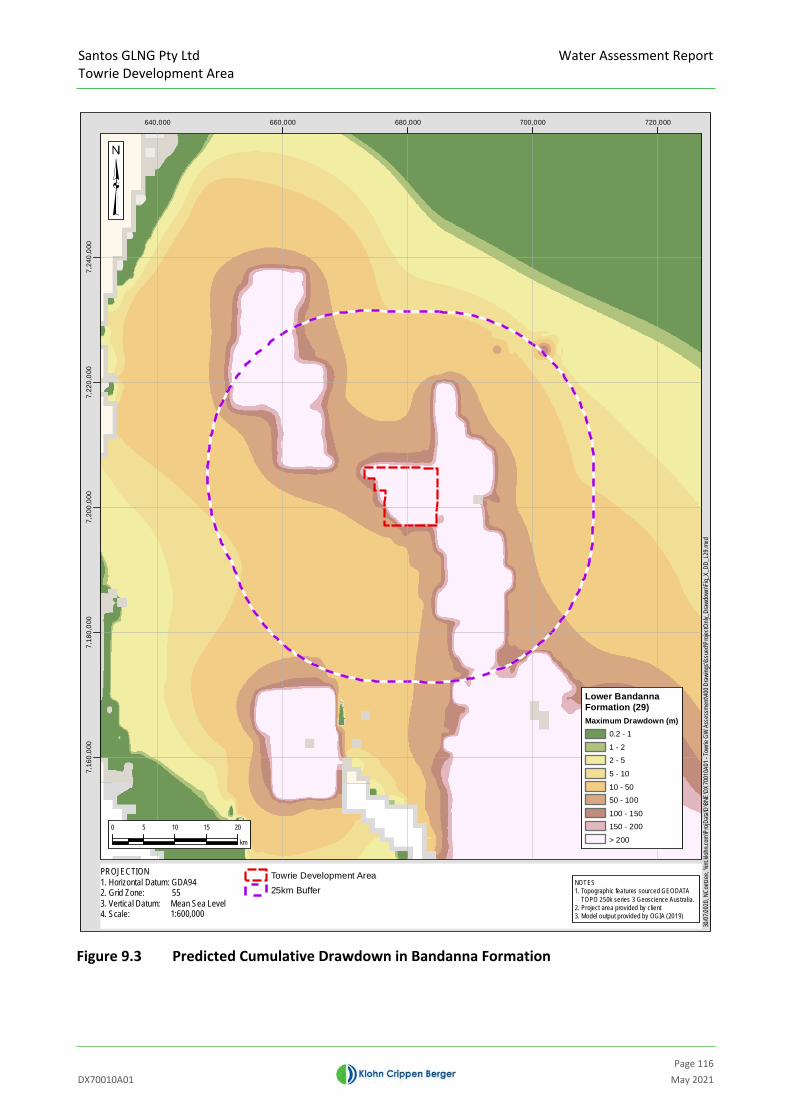
Santos GLNG Pty Ltd Towrie Development Area
Water Assessment Report
Page 116DX70010A01 May 2021
Figure 9.3 Predicted Cumulative Drawdown in Bandanna Formation
640,000 660,000 680,000 700,000 720,000
7,16
0,00
07,
180,
000
7,20
0,00
07,
220,
000
7,24
0,00
0
PROJECTION1. Horizontal Datum: GDA942. Grid Zone: 553. Vertical Datum: Mean Sea Level4. Scale:
Towrie Development Area25km Buffer
1:600,000
NOTES1. Topographic features sourced GEODATA TOPO 250k series 3 Geoscience Australia. 2. Project area provided by client 3. Model output provided by OGIA (2019)
30/0
7/202
0, N
Coet
zee,
\\int.k
lohn.c
om\P
rojD
ata\D
\BNE
\DX7
0010
A01 -
Towr
ie GW
Ass
essm
ent\4
00 D
rawi
ngs\I
ssue
d\Pro
jectO
nly_D
rawd
own\
Fig_X
_DD_
L29.
mxd
0 5 10 15 20
km
Lower Bandanna Formation (29)Maximum Drawdown (m)
0.2 - 1
1 - 22 - 5
5 - 10
10 - 5050 - 100
100 - 150150 - 200
> 200

Santos GLNG Pty Ltd Towrie Development Area
Water Assessment Report
Page 117DX70010A01 May 2021
9.5 Risk Assessment
A risk assessment has been conducted for the proposed Project activities. Using the information presented in earlier sections, and the likelihood of occurrence and the consequence of risk tables presented in Table 9.3 and Table 9.4, the significance of the risks was identified using Table 9.5.
Table 9.3 Likelihood of Risk (Criteria)
Rank Likelihood Description
1 Highly unlikely An event that has not previously been experienced in the industry but may occur in exceptional circumstances
2 Unlikely An event not likely to occur in the industry over 10 years3 Possible An event that may occur in the industry over 10 years4 Likely An event likely to occur more than once a year in the industry5 Very likely A common event that is likely to occur in the industry many times per year
Table 9.4 Consequence of Risk (Criteria)
Magnitude DescriptionNegligible Minimal impact on ecosystem; contained on petroleum lease, reversible in 1 year
Low Moderate impact on ecosystem; contained on petroleum lease, reversible in 1 to 5 years Moderate Significant impact on ecosystem; impact contained on petroleum lease, reversible in ~10 years
High Significant harm or irreversible impact (for example to World Heritage area); widespread, catchment area, long term, greater than 10 years
Severe Incident(s) due to unforeseen circumstances causing significant harm or irreversible impact (for example to World Heritage area); widespread, long term
Table 9.5 Significance of Risk (Criteria)
LikelihoodHighly Unlikely (1) Unlikely (2) Possible (3) Likely (4) Highly Likely (5)
Severe Insignificant Low High High HighHigh Insignificant Low Moderate High High
Moderate Insignificant Low Moderate Moderate ModerateLow Insignificant Low Low Low Low
Cons
eque
nce
Negligible Insignificant Insignificant Insignificant Insignificant Insignificant
This risk assessment will be used as a live document to support infrastructure design, construction, operations and decommissioning to reduce risk and identify appropriate risk mitigation strategies.
This approach is consistent with AS/NZS 4360:2004 – Risk Management and AS/NZS ISO 31000:2009 – Risk Management – Principals and Guidelines (AS/NZS 2009), with environmental consequence adapted from Ford et al. (2016). The significance of the risks is described below:
High significance: Significant risk with high likelihood of impact. The risk is considered unacceptable or intolerable and may be irreversible or persistent;
Moderate significance: Level of risk is not acceptable with moderate severity with impacts persisting over time but that can be mitigated;
Low significance: The risk is low with any impacts short in duration and reversible; and
Insignificant: An insignificant risk and any potential impacts are acceptable, and no risk treatment is necessary with the impact restricted to the immediate area of activity.

Santos GLNG Pty Ltd Towrie Development Area
Water Assessment Report
Page 118DX70010A01 May 2021
The results of the risk assessment are detailed in Table 9.6. Note that a separate chemical risk assessment has been undertaken and therefore risks associated with chemicals are not included in this assessment. The hydraulic stimulation monitoring program is provided in the SIMP. This outlines the monitoring overview including the groundwater baseline monitoring (pre-stimulation), stimulation source water, stimulation fluid and flow back monitoring, and post-stimulation.
The risk assessment results include pre-mitigated risk ratings, which consider the relevant statutory and legislative obligations for the specific activity / risk (e.g. Code of Practice for the construction and abandonment of petroleum wells, and associated bores in Queensland (DNRME 2019b)). Residual risk ratings, following application of the relevant mitigation and management controls to reduce the risk of an adverse impact to MNES, are also provided. Management controls are described further in Section 10.

Santos GLNG Pty Ltd Towrie Development Area
Water Assessment Report
Page 119DX70010A01 May 2021
Table 9.6 Risk Assessment Results
Pre-Mitigated Risk Rating Residual Risk Rating
Potential Impact
Like
lihoo
d
Cons
eque
nce
Risk
Ra
ting Management Controls
Like
lihoo
d
Cons
eque
nce
Risk
Ra
ting
Decline in groundwater level / pressure at water bores, reducing water availability and potentially
impacting groundwater EVs (e.g. stock water)2 Low Low 2 Low Low
Reduction in groundwater head resulting in reduced availability of water, potentially causing
degradation of GDEs1 Moderate Insignificant 1 Moderate Insignificant
Reduction of baseflow to watercourses, potentially resulting in degradation of GDEs and reduced availability of water to potential users
downstream
1 Moderate Insignificant 1 Moderate Insignificant
Aquifer depressurisation
Subsidence 1 Moderate Insignificant 1 Moderate Insignificant
Drilling and construction of
production wells
Potential to introduce a connection between hydrostratigraphic units, which were previously isolated units, through drilling and construction
of production wells, resulting in the potential for alteration of groundwater flow regimes and
quality
3 Low Low 2 Low Low
Produced water has the potential to impact groundwater levels and quality, through seepage or unplanned releases from water management
infrastructure
2 Low Low 1 Low InsignificantProduced water management infrastructure
Unplanned releases from water management infrastructure 2 Low Low 1 Low Insignificant
Beneficial use activities
Beneficial use activities, such as irrigation and stock watering, have the potential to impact shallow groundwater systems (e.g. alluvium) should over-irrigating occur, or the relevant
beneficial use quality guidelines are not adhered to
2 Low Low
Surat CMA UWIR (OGIA 2019c)
Surat CMA UWIR Water Monitoring Strategy (OGIA 2019c)
Water Act 2000 (State of Queensland 2019c) bore baseline assessments and make good requirements
Joint Industry Plan for Early Warning System for EPBC springs (JIP) (QGC, Santos, Origin 2013).
Towrie Development Area /Environmental Management Plan (Santos 2020c)
Code of Practice for the construction and abandonment of coal seam gas and petroleum wells, and associated bores in Queensland Version 2 (DNRME 2019b)
Queensland End of Waste Codes (DES 2019b; 2019d)
Queensland CSG Water Management Policy (DEHP 2012)
Queensland Manual for Assessing Consequence Categories and Hydraulic Performance of Structures (DES 2016a)
Queensland Streamlined Model Conditions for Petroleum Activities (DES 2016b)
2 Low Low

Santos GLNG Pty Ltd Towrie Development Area
Water Assessment Report
Page 120DX70010A01 May 2021
Pre-Mitigated Risk Rating Residual Risk Rating
Potential Impact
Like
lihoo
d
Cons
eque
nce
Risk
Ra
ting Management Controls
Like
lihoo
d
Cons
eque
nce
Risk
Ra
ting
Localised transport of suspended sediment to waters during construction or site works,
resulting in the potential to alter flow regimes and quality and ecosystems
3 Low Low 2 Low Low
Localised release of hydrotest water, effluent or trench water to land 3 Low Low 2 Low Low
Alteration of a watercourse character or changes to riparian buffers due to construction works 2 Low Low 2 Low Low
Construction activities
Localised incidental activities have the potential to impact shallow groundwater systems, such as
fuel spills or improper storage of chemicals3 Low Low
Queensland Environmental Protection (Water) Policy 2009 (State of Queensland 2016)
Queensland CSG water management: Measurable criteria (DES 2013)
Towrie Environmental Authority
2 Low Low

Santos GLNG Pty Ltd Towrie Development Area
Water Assessment Report
Page 121DX70010A01 May 2021
10 MITIGATION, MANAGEMENT AND MONITORING
This section provides further detail on Santos’ proposed mitigation, management and monitoring practices for the Project.
10.1 Production Wells and General Project Activities
Measures to avoid and manage the risk of impacts to groundwater quality and avoid introducing connectivity between formations during the construction of production wells, include the following:
Production wells will be designed, constructed and decommissioned in accordance with the “Code of Practice for the construction and abandonment of coal seam gas and petroleum wells, and associated bores in Queensland Version 2” (DNRME 2019b). This code outlines mandatory requirements and good practice to reduce the risk of environmental harm. Production wells will be designed to:
Prevent any interconnection between target hydrocarbon-bearing formations and aquifers;
Ensure that gas is contained within the well and associated pipework and equipment without leakage;
Ensure zonal isolation between different aquifers is achieved; and
Not introduce substances that may cause environmental harm.
Production wells will not be installed within 90 m of a landholder bore unless a site-specific assessment determined that a closer distance is appropriate, and the updated plan is approved by the Minister.
Drilling fluids and additives used during drilling activities will be used in accordance with the mandatory requirements and good practice guidelines outlined in the code of practice (DNRME 2019b), as well as the Safety Data Sheets (SDS) provided with each fluid / additive. With relation to drilling fluids, the mandatory requirements include:
Drilling fluids must be selected and managed to ensure all manufactured products used during well procedures are in accordance with the manufacturer’s recommendations and relevant SDS.
The name, type and quantity of each chemical used on each well throughout the life of the well must be recorded.
Good industry practice for drilling includes:
Drilling fluid should be a carefully monitored and controlled mixture designed to:
Achieve best drilling results and ensure efficient removal of formation cuttings;
Control formation pressures; and
Minimise damage to formations.

Santos GLNG Pty Ltd Towrie Development Area
Water Assessment Report
Page 122DX70010A01 May 2021
Petroleum tenure holders should ensure that the drilling fluid selected is appropriate for the well design to manage any locally experienced drilling problems and the geological conditions likely to be encountered.
The use of biodegradable substances in the drilling fluid is preferred.
The source of water for all well procedures (drilling, completion, workover and abandonment) should be recorded for future well monitoring purposes.
Products should be chosen, stored, and used at concentrations that minimise the risk of causing environmental harm.
Personnel, including contractors, should be aware of the environmental impact and emergency spill procedures for the products and substances in use on site.
Petroleum tenure holders should use established, effective drilling practices to achieve a stable, uniform and, as far as possible, in-gauge hole.
The SIMP emphasises that when stimulation activities were designed and undertaken in accordance with the hydraulic stimulation procedures, the zone of hydraulic stimulation is contained entirely with the coal layer or target seam. The fluids are monitored throughout the process in accordance with the SIMP (Santos 2020a). An overview of the stimulation process, fluid and flowback monitoring and post -stimulation groundwater bore monitoring, is provided in Appendix I. The hydraulic stimulation procedures and processes include:
Casing and cementing are installed as barriers during well construction;
A formal design and plan process where fracture geometry is modelled;
Assess for indications of casing integrity loss into overlying formations:
Monitoring casing and wellhead pressures during stimulation activity;
Monitor injection flow rates and total volumes of hydraulic fracturing fluids and comparing to predicted performance.
Monitoring of stimulation fluids during the stimulation activity is to be performed at sufficient frequency and which represents the quality and quantity of source water;
Source water to be used for stimulation activities is to be sampled prior to the commencement of the stimulation operations;
One stimulation fluid sample per stimulation activity on each well is to be taken from the pad volume prior to the addition of the slurry volume; and
A flowback or produced water sample is be collected post stimulation and to be analysed.
The efficacy of the management and mitigation measures provided in these procedures will be monitored to ensure that no unacceptable residual risk remains. This will include:
Baseline soils assessment of each representative soil type within the Project Stage development area for which land application of residual drilling material is proposed;
Characterisation samples of the residual drilling material to be applied (typical frequency of 10% of wells drilled);

Santos GLNG Pty Ltd Towrie Development Area
Water Assessment Report
Page 123DX70010A01 May 2021
Visual verification monitoring of soil stability and plant health (typical frequency of 10% of wells drilled), nominally 12 months post application, but only after a wet season occurs;
Soil chemistry monitoring (typical frequency of 10% of wells drilled). This will occur nominally 12 months post application, but only after a wet season occurs; and,
The reporting of stimulation records to DNRME, following stimulation activities, and in accordance with the Code of Practice for the Construction and Abandonment of Petroleum Wells and Associated Bores in Queensland (DNRME 2019b). These records include the name, type and quantity of each product (including chemical names) used on each well as part of the hydraulic stimulation process.
Further details on the management practices associated with chemical and fuel storage are provided in Section 10.3.
10.2 Water Production
10.2.1 Production Well monitoring
As per the requirements outlined in the Petroleum and Gas (Production and Safety) Act 2004 (State of Queensland 2018e), the volume of produced water will be monitored and recorded and provided to the DNRME in accordance with statutory obligations.
10.2.2 Groundwater Monitoring
The groundwater monitoring requirements for petroleum tenure holders within the Surat CMA are provided as part of the UWIR WMS (OGIA 2019c), which establishes baseline trends, identifies any changes within or near petroleum development areas or locations of interest and informs future improvement of groundwater modelling.
Santos under the Water Act 2000 developed and implemented a Water Management Strategy (WMS) as stipulated in the UWIR for the Surat CMA. This comprises of groundwater monitoring at over 150 monitoring locations throughout the Surat CMA. Revisions of the UWIR may amend the WMS according to the improved understanding and certainty of groundwater risks.
During baseline assessments, conducted in 2018, not in use landholder bores were identified. Therefore, there are no landholder bores for on-going monitoring. Groundwater monitoring will be undertaken in accordance with the statutory Groundwater Monitoring Strategy as prepared by the OGIA and Approved by DES.
10.2.3 Surface Water Monitoring
No surface water monitoring is proposed as the Project does not involve discharges to, or abstractions from, surface water. Downstream monitoring of watercourses is not considered an appropriate risk control, and therefore not deemed necessary. Preventative measures incorporated into the Project design, operational standards and management plans are preferred over downstream monitoring.
Further discussion of mitigation and management associated with surface water systems is provided in Section 10.3.
Santos GLNG Pty Ltd Towrie Development Area
Water Assessment Report
Page 124DX70010A01 May 2021
10.2.4 Bore Impact Management Measures
The Water Act 2000 outlines requirements for make good obligations of a resource tenure holder for a bore located in immediately affected areas. Tenure holders must carry out a bore assessment and enter into a make good agreement with the bore owner if the bores are located within an immediately affected area. The UWIR assigns bores to tenure holders located within immediately affected areas.
Santos will comply with make good agreements required in future updates of the UWIR and undertake bore assessments as required as a result of make good obligations. Any required bore assessments will be undertaken in accordance with the DES ‘Bore Assessment Guideline’ (DES 2017b). However, as no bores have been assessed to be impacted by the proposed Project development, make good agreements for this Project are not anticipated.
10.2.5 Water Management
Water management will be undertaken in accordance with the Environmental Management Plan (Santos 2020c), which has been developed to meet the requirements of the CSG Water Management Policy (DEHP 2012), as outlined in Section 3.3.1.2. Water management infrastructure will be based on the Australian Standard for tanks, to be used as water storages across the Project site.
Produced water quality will be monitored in accordance with the EMP (Santos 2020c), SIMP (Santos 2020a) and as required, in accordance with the ‘End of Waste Code – Irrigation of Associated Water (including coal seam gas water)’ (DES 2019).
10.3 Other Environmental Management Practices
The Towrie Environmental Management Plan (Santos 2020c) and the Environmental Protocol for Constraints Planning and Field Development (Santos 2020d) provides environmental management protocols for the Project, including the following:
Additional ecological assessment to confirm the location and extent of the MNES.
Locating infrastructure in accordance with the Environmental Constraints Protocol.
Undertake rehabilitation in accordance with the Towrie Rehabilitation Management Plan (add information from the EA after finalised)
Undertake Significant Species Management Plan (pending Ecological assess)
Undertake general fauna management measures including; utilise a fauna spotter-catcher; install fauna egress devices (e.g. matting, ladders) in all excavations left open overnight; and inspect excavations and trenches, prior to backfilling, for the presence of fauna and evidence of burrowing fauna or breeding places, with relocation of fauna, if present.
Implement dust controls during construction including beneficial use of produced water for dust suppression, timing of works, minimisation of disturbance, and progressive rehabilitation of disturbed areas.
Implement noise and lighting controls including use of noise attenuation devices (e.g. mufflers) and directional lighting or shrouding of lights to minimise light spill.
Santos GLNG Pty Ltd Towrie Development Area
Water Assessment Report
Page 125DX70010A01 May 2021
Implement fire mitigation measures including fire extinguishers fitted to site vehicles, designation of smoking areas, and permit requirements for hot works.
Implement weed, pest and hygiene controls including implementation of a weed, pest and biosecurity management plan including compliance with obligations under the Queensland Biosecurity Act 2014 (State of Queensland 2020b), meeting the risk minimisation requirements of the Queensland Department of Agriculture and Fisheries’ Queensland Biosecurity Manual (State of Queensland 2019g), and weed surveys and controls.
Implementation of erosion and sediment controls during construction to minimise the risk of potential sedimentation to surface water.
All waste will be stored, handled, and transported in accordance with the Towrie Project EAs, and the waste and resource management principles and hierarchy prescribed by the Waste Reduction and Recycling Act 2011 (State of Queensland 2019f).
All chemical transport vehicles are to travel on approved roads and driver behaviour is to be monitored by an in vehicle monitoring system (IVMS). SDSs and risk dossiers will be available to emergency responders, health and safety managers, and environmental hazard clean-up teams.
All chemicals on site will be stored and managed in contained areas in accordance with legislative and regulatory requirements to prevent releases to the environment.
10.4 Reporting
Santos will report to the state and federal governments in compliance with:
Relevant conditions and approvals issued by DAWE (Commonwealth approval conditions) and DES (EA conditions); and
Surat CMA UWIR requirements in accordance with the QLD Water Act.

Santos GLNG Pty Ltd Towrie Development Area
Water Assessment Report
Page 126DX70010A01 May 2021
11 ASSESSMENT AGAINST THE SIGNIGICANT IMPACT CRITERIA
A water resource assessment of the Towrie Development Area has been undertaken to consider the potential impacts associated with the Project with respect to the Environment Protection and Biodiversity Conservation Act 1994 (Commonwealth of Australia 2018). A summary of the findings of this assessment is provided, with consideration to the criteria outlined in the ‘Significant impact guidelines 1.3: Coal seam gas and large coal mining developments – impacts on water resources’ (DoEE 2013b).
The ‘Significant impact guidelines 1.3: Coal seam gas and large coal mining developments – impacts on water resources’ (DoEE 2013b) identify a ‘significant impact’ as ‘an impact which is important, notable, or of consequence, having regard to its context or intensity’.
The general criteria (5.2) (DoEE 2013b) identifies that an action is likely to have a significant impact on a water resource if there is a real, or not remote, chance or possibility that it will directly or indirectly result in a change to: the hydrology of a water resource and/or the water quality of a water resource, that is of sufficient scale or intensity as to reduce the current or future utility of the water resource for third party users, including environmental and other public benefit outcomes, or to create a material risk of such reduction in utility occurring.
The Project will produce gas from the Bandanna Formation. In the vicinity of the Project, groundwater from the Bowen Basin units, Surat Basin units, and alluvium is accessed by third-party groundwater users. Uses of this groundwater, relevant to the Project, include agriculture use, and stock and domestic use. Stock and domestic is the most commonly recorded use / purpose within this area.
The results of the impact assessment have indicated that no bores are predicted to experience a water level decline that exceeds the Water Act 2000 trigger thresholds as a result of the Project development.
Impacts to potential GDEs are considered unlikely based on the magnitude and extent of drawdown (or lack thereof) predicted in the hydrostratigraphic units that potentially provide groundwater to the ecosystems (conservatively identified as hydrostratigraphic units with surface exposures). Based on the proposed Project activities, impacts to surface water are also considered unlikely.
A summary of the potential impacts against the DoEE (2013b) Significant Impact Criteria 1.3, Changes to Hydrological Characteristics has been provided in Table 11.1 and Significant Impact Criteria 1.4, Changes to Water Quality provided in Table 11.2.
It is concluded that the proposed development of the Towrie Development Area will not have a significant impact on water resources.

Santos GLNG Pty Ltd Towrie Development Area
Water Assessment Report
Page 127DX70010A01 May 2021
Table 11.1 Summary of Potential Impacts Against the Significant Impact Criteria 1.3, Changes to Hydrological Characteristics (DoEE 2013b)
Parameter Comments
Flow Regime (volume, timing, duration and frequency of surface
water flows)
The Project does not include any abstraction from, or discharges to surface water or watercourses. Notwithstanding minor / localised erosion and sediment controls, the Project does not include the interception or diversion of surface water flows.
Non-linear infrastructure would not be constructed within watercourses in the Towrie Development Area. Construction of linear infrastructure (e.g. pipelines and access tracks) would be undertaken in accordance with the ‘Accepted development requirements for operational work that is constructing or raising waterway barrier works’ (DAF 2018) under the Fisheries Act 1994 and Planning Act 2016.
Recharge rates to groundwater
The Project is located in an area where alluvium, Quaternary-Tertiary residual / colluvium, Surat Basin units, as well as a number of Bowen Basin units’ outcrop at surface. These outcrop areas are considered to be the location where diffuse rainfall recharge occurs. It is unlikely that recharge rates will be significantly modified as a result of Project activities given the small footprint of gas activities relative to the recharge area and existing rehabilitation requirements of EA10001254 (Condition PESCC 38) and the rehabilitation requirements of any future EA.
Aquifer pressure or pressure relationship
between aquifers.
Groundwater table and potentiometric surface
levels
Inter-aquifer connectivity
Water production for the Project is limited to the coal seams of the Bandanna Formation. In order to produce gas, the formation pressure must be reduced, which as a result may induce leakage into the formation from overlying or underlying formations.
Modelling outputs from the UWIR model, reviewed as part of this assessment predicted a groundwater pressure decline in the target gas producing Bandanna Formation, Rewan Group and underlying Permian units as a result of gas production from the Project. The Rewan Group provides a thick aquitard sequence between the coal seams and the overlying aquifer units. Based on the magnitude and extent of drawdown predicted in this Project area, there is limited potential for a change in the pressure relationship between the Bandanna Formation and overlying and underlying aquifers.
Production wells will be drilled and constructed in accordance with the ‘Code of Practice for the construction and abandonment of coal seam gas and petroleum wells, and associated bores in Queensland Version 2’ (DNRME 2019b). This code outlines the mandatory requirements and good practice to reduce the risk of environmental harm throughout the drilling process from overlying aquifers. Therefore, the impact to inter-aquifer connectivity is not considered significant.
Groundwater / surface water interactions
River / floodplain connectivity
Groundwater and surface water interactions are unlikely to be affected given that the watercourses are not considered to receive baseflow from groundwater.
Water production for the Project is limited to the coal seams of the Bandanna Formation and the Project does not involve any abstraction or discharge from / to watercourses. Groundwater abstracted as a result of gas production from the Project will be managed in accordance with the Environmental Management Plan (Santos 2020c).
Coastal processesThe Project is located in central Queensland. Given the distance to the coast and no potential impacts to surface water from the Project, changes to coastal processes will not occur.

Santos GLNG Pty Ltd Towrie Development Area
Water Assessment Report
Page 128DX70010A01 May 2021
Table 11.2 Summary of Potential Impacts Against the Significant Impact Criteria 1.4, Changes to Water Quality (DoEE 2013c)
Parameter Comments
Create risks to human or animal health or to the condition of the natural environment as a result of the change in water
quality
Changes to groundwater or surface water quality as a result of water production are not anticipated.
Produced water will be stored in tanks, which will be designed and constructed in accordance with relevant Australian standards / guidelines.
Produced water would be used for onsite activities (e.g., drilling and hydraulic fracturing, dust suppression / construction) or transferred to off-site neighbouring water management facilities owned and operated by Santos for treatment and beneficial reuse in accordance with the relevant EA(s) and the approvals under the Waste Reduction and Recycling Act 2014 including irrigation water quality limits in accordance with the ANZECC guidelines. Beneficial use of the produced water will split across the GLNG / GFD project tenures; and potentially the Project area pending approval of a new EA.
Production wells will be drilled and constructed in accordance with the Code of Practice for the construction and abandonment of coal seam gas and petroleum wells, and associated bores in Queensland Version 2 (DNRME 2019b). This code outlines the mandatory requirements and good practice to reduce the risk of environmental harm throughout the drilling process from overlying aquifers.
It is not likely that the Project would result in a risk to human or animal health, or to the condition of the environment as a result of a change in water quality.
Substantially reduces the amount of water available for
human consumptive uses or for other uses, including
environmental uses which are dependent on water of the
appropriate quality
Groundwater within the vicinity of the Project is utilised by a number of third-party users, with stock and domestic use being the dominant purpose.
Drawdown of a significant magnitude is limited to the gas target of the Bandanna Formation. Groundwater supply bores surrounding the Project are not predicted to experience a water level decline greater than the Water Act 2000 trigger threshold. Therefore, impacts to existing groundwater users as a result of the Project development are not predicted.
Surface water volumes are not anticipated to be impacted and based on the conceptual understanding of the Project area; it is unlikely that groundwater provides baseflow to the watercourses within the Project area.
Impacts to potential GDEs are considered unlikely as the predicted drawdown extent from the proposed development does not coincide with the mapped GDE areas.
It is not anticipated that the Project would substantially reduce the amount of water available or impact the water quality.
Causes persistent organic chemicals, heavy metals, salt or
other potentially harmful substances to accumulate in
the environment
The majority of produced water will be transferred to an adjoining petroleum lease for management. No brine or salt would be generated, stored or otherwise managed within the Towrie Project area. Produced water that is to be beneficially reused on site for construction or other purposes would be stored in tanks designed and constructed in accordance with relevant Australian standards / guidelines. Any produced water beneficially reused on site would be done so in accordance with EA1001254 (Conditions PESCC 29 to 31) and the approvals under the Waste Reduction and Recycling Act 2014 including irrigation water quality limits in accordance with the ANZECC guidelines.
Fuel and chemicals used during drilling and operations will be stored and handled in accordance with the relevant Australian Standards (e.g. AS 3780:2008, AS 1940:2004, AS 3833:2007) and regulatory requirements.

Santos GLNG Pty Ltd Towrie Development Area
Water Assessment Report
Page 129DX70010A01 May 2021
Parameter Comments
All CSG production wells will be designed and constructed in accordance with ‘Code of Practice for the construction and abandonment of coal seam gas and petroleum wells, and associated bores in Queensland Version 2’ (DNRME 2019b). This code outlines the mandatory requirements and good practice to reduce the risk of environmental harm. CSG production wells will be designed to prevent any interconnection between hydrocarbon bearing formations and aquifers, ensure that gas is contained within the well and associated pipework and equipment without leakage, ensure zonal isolation between different aquifers is achieved and not introduce substances that may cause environmental harm.
Hydraulic stimulation is proposed to be undertaken as part of the Project development. Santos exclusively uses hydraulic fracturing fluids that do not contain benzene, toluene, ethybenzene or xylenes (BTEX) or polycyclic aromatic hydrocarbons (PAHs); and has developed, and implements, very stringent procedures for its Hydraulic Fracture Stimulation activities, which comply with Queensland Government regulations.
Activities associated with the Project are unlikely to introduce organic chemicals, heavy metals, salt or other potentially harmful substances to the environment. However, it is noted that BTEX and PAHs occur naturally in coal and therefore it is possible that certain PAHs may naturally be present in the produced water used in the hydraulic fracturing process and will be addressed in the treatment process.
Seriously affects the habitat or lifecycle of a native species
dependent on a water resource
Surface water is not anticipated to be impacted and based on the conceptual understanding of the Project area; it is unlikely that groundwater provides baseflow to the watercourses within the Project area. Therefore, any surface water baseflow volumes and species that may potentially be dependent on water resources are not predicted to be impacted.
No changes to groundwater or surface water quality have been identified as a result of the Project, therefore, no changes to habitat or lifecycle of a native species dependent on a water resource are expected.
Causes the establishment of an invasive species (or the spread of an existing invasive species)
that is harmful to the ecosystem function of the
water resource
No changes to groundwater and surface water quality have been identified as a result of the Project. Therefore, no changes to the water resource that may cause the establishment of an invasive species (or the spread of an existing invasive species) are expected.
There is a significant worsening of local water quality (where current local water quality is superior to local or regional
water quality objectives)
Impacts to the surface water and groundwater resource as a result of the Project development is not predicted, which include no impacts to the quality of the water resources. Therefore, no significant worsening of local water quality is anticipated.
High quality water is released into an ecosystem which is
adapted to a lower quality of water
Produced water will be stored in tanks, which will be designed and constructed in accordance with relevant Australian standards / guidelines. Produced water would be exclusively beneficially used in accordance with the relevant EA(s) and / or the relevant approvals under the Waste Reduction and Recycling Act 2014 including irrigation water quality limits in accordance with the ANZECC guidelines.
The Project does not include the discharge to surface water. Therefore, no changes to ecosystem water qualities are anticipated.
Santos GLNG Pty Ltd Towrie Development Area
Water Assessment Report
Page 130DX70010A01 May 2021
12 CLOSING
This report is an instrument of service of KCB Australia Pty Ltd (KCB). The report has been prepared for the exclusive use of Santos GLNG Pty Ltd (Santos) for the specific application to the Towrie Development Area, and it may not be relied upon by any other party without KCB's written consent.
KCB has prepared this report in a manner consistent with the level of care, skill and diligence ordinarily provided by members of the same profession for projects of a similar nature at the time and place the services were rendered. KCB makes no warranty, express or implied.
Use of or reliance upon this instrument of service by Santos is subject to the following conditions:
1. The report is to be read in full, with sections or parts of the report relied upon in the context of the whole report.
2. The Executive Summary is a selection of key elements of the report. It does not include details needed for the proper application of the findings and recommendations in the report.
3. The report is based on information provided to KCB by Santos or by other parties on behalf of the Santos (Santos-supplied information). KCB has not verified the correctness or accuracy of such information and makes no representations regarding its correctness or accuracy. KCB shall not be responsible to Santos for the consequences of any error or omission contained in Santos-supplied information.
KCB AUSTRALIA PTY LTD.
Chris Strachotta, RPGeoPrincipal Hydrogeologist

Santos GLNG Pty Ltd Towrie Development Area
Water Assessment Report
Page 131DX70010A01 May 2021
REFERENCES
ABARES. 2010. “The Australian Land Use and Management Classification Version 7.” Canberra: Australian Bureau of Agricultural and Resource Economics and Sciences.
AECOM. 2021. “Matters of National Environmental Significance - Ecology, Towrie Development.” Technical report prepared for Santos.
APGA. 2017. “Code of Practice: Upstream Polyethylene Gathering Networks - CSG Industry Version 4.0.” The Australian Pipelines and Gas Association.
AS/NZS. 2009. “ISO 31000:2009 Risk Management - Principals and Guidelines.”Ayaz, SA, M Martin, J Esterle, Y Amelin, and RS Nicoll. 2016. “Age of the Yarrabee and Accessory
Tuffs: Implications for the Upper Permian Sediment-Accumulation Rates across the Bowen Basin.” Australian Journal of Earth Sciences 63 (7): 843–56.
Baker, Julian C. 1991. “Diagenesis and Reservoir Quality of the Aldebaran Sandstone, Denison Trough, East-Central Queensland, Australia.” Sedimentology 38 (5): 819–38.
Barnett et al. 2012. “Australian Groundwater Modelling Guidelines.” Waterlines Report. Canberra: National Water Commission.
BOM. 2005. “Climate Classification of Australia.” Australian Government Bureau of Meteorology. http://www.bom.gov.au/jsp/ncc/climate_averages/climate-classifications/index.jsp?maptype=kpngrp#maps.
———. 2020a. “Average Annual, Monthly and Seasonal Evaporation.” Bureau of Meteorology. 2020. http://www.bom.gov.au/jsp/ncc/climate_averages/evaporation/index.jsp.
———. 2020b. “Climate Statistics for Rolleston, Site Number 035059.” Bureau of Meteorology. 2020. http://www.bom.gov.au/.
———. 2020c. “Climate Statistics for Springsure Comet Street, Site Number 035065.” Bureau of Meteorology. 2020. http://www.bom.gov.au/.
———. 2020d. “Weather Station Directory.” Bureau of Meteorology. 2020. http://www.bom.gov.au/climate/data/stations/.
Brakel, AT, JM Totterdell, AT Wells, and MG Nicoll. 2009. “Sequence Stratigraphy and Fill History of the Bowen Basin, Queensland.” Australian Journal of Earth Sciences 56 (3): 401–32.
Commonwealth of Australia. 2018. Environment Protection and Biodiversity Conservation Act 1999. https://www.legislation.gov.au/Details/C2018C00440.
DAF. 2018. “Accepted Development Requirements for Operational Work That Is Constructing or Raising Waterway Barrier Works.” State of Queensland, Department of Agriculture and Fisheries.
DEHP. 2011. “Environmental Protection (Water) Policy 2009; Comet River Sub-Basin Environmental Values and Water Quality Objectives; Basin No.130 (Part), Including All Waters of the Comet River Sub-Basin.” State of Queensland, Department of Environment and Heritage Protection - Prepared by Environmental Policy and Planning. https://environment.des.qld.gov.au/water/policy/pdf/plans/fitzroy_comet_river_wqo_290911.pdf.
———. 2012. “Coal Seam Gas Water Management Policy.” State of Queensland, Department of Environment and Heritage Protection.
DES. 2013. “CSG Water Management: Measurable Criteria Version 1.01.” State of Queensland, Department of Environment and Heritage Protection. https://www.ehp.qld.gov.au/assets/documents/regulation/rs-is-csg-water-measurable-criteria.pdf.

Santos GLNG Pty Ltd Towrie Development Area
Water Assessment Report
Page 132DX70010A01 May 2021
———. 2016a. “Manual for Assessing Consequence Categories and Hydraulic Performance of Structures. Version 5.01.” ESR/2016/1933. State of Queensland, Department of Environment and Heritage Protection, Prepared by: Resource Sector Regulation and Support. https://www.ehp.qld.gov.au/assets/documents/regulation/era-mn-assessing-consequence-hydraulic-performance.pdf.
———. 2016b. “Streamlined Model Conditions for Petroleum Activities: Guideline, Environmental Protection Act 1994.” ESR/2016/1989, Version 2.02. State of Queensland, Department of Environment and Science. https://environment.des.qld.gov.au/assets/documents/regulation/rs-gl-streamlined-model-conditions-petroleum.pdf.
———. 2017a. “Baseline Assessments: Guideline, Version 3.02.” ESR/2016/1999. State of Queensland, Department of Environment and Science.
———. 2017b. “Bore Assessments: Guideline.” ESR/2016/2005 Version 5.02. State of Queensland, Department of Environment and Science.
———. 2018a. “Land Use Mapping - Queensland Version 6.13.” State of Queensland, Department of Environment and Science.
———. 2018b. “Queensland Groundwater Dependent Ecosystems and Potential GDE Aquifer Mapping, Version 1.5.” State of Queensland, Department of Environment and Science. https://wetlandinfo.ehp.qld.gov.au/wetlands/ecology/aquatic-ecosystems-natural/groundwater-dependent/.
———. 2019a. “WetlandInfo Verson 5.0.” Queensland Government Department of Environment and Science. 2019. https://www.ehp.qld.gov.au/wetlandmaps/?bbox=149.5,-26,150,-26.5.
———. 2019b. “End of Waste Code - Associated Water (Including Coal Seam Gas Water) (ENEW07547018).” ESR/2019/4713 Version 1.00. State of Queensland, Department of Environment and Science. https://environment.des.qld.gov.au/assets/documents/regulation/wr-eowc-associated-water.pdf.
———. 2019c. “End of Waste Code - Irrigation of Associated Water (Including CSG Water) (ENEW07546918).” ESR/2019/4712 Version 1.00. State of Queensland, Department of Environment and Science. https://environment.des.qld.gov.au/assets/documents/regulation/wr-eowc-irrigation-associated-water.pdf.
———. 2019d. “End of Waste Code - Irrigation of Associated Water (Including CSG Water) (ENEW07546918).” ESR/2019/4712 Version 1.00. State of Queensland, Department of Environment and Science. https://environment.des.qld.gov.au/assets/documents/regulation/wr-eowc-irrigation-associated-water.pdf.
Dickins, James MacGregor, and Edmund James Malone. 1973. Geology of the Bowen Basin, Queensland. Australian Government Publishing Service.
DNRM. 2000. “State of the Rivers: Comet, Nogoa and Mackenzie Rivers, Queensland.” Queensland Government, Department of Natural Resources and Mines.
———. 2010. “Ordered Drainage - Queensland.” State of Queensland, Department of Natural Resources and Mines. http://qldspatial.information.qld.gov.au/catalogue/custom/search.page?q=%22Ordered drainage 100K - Queensland - by area of interest%22.

Santos GLNG Pty Ltd Towrie Development Area
Water Assessment Report
Page 133DX70010A01 May 2021
———. 2013. “Queensland Floodplain Assessment Overlay.” https://data.qld.gov.au/dataset/queensland-floodplain-assessment-overlay Accessed 22/06/2017.
———. 2015. “Fitzroy Basin Resource Operation Plan.” State of Queensland, Department of Natural Resources and Mines. https://www.dnrm.qld.gov.au/__data/assets/pdf_file/0003/298650/fitzroy-rop-amendment-2015.pdf.
———. 2017. “Queensland Globe.” data.qld.gov.au. http://data.qld.gov.au/dataset/queensland-globe, https://researchdata.ands.org.au/queensland-globe.
DNRME. 2019a. “Queensland Groundwater Database - July 2019.” Queensland Government, Department of Natural Resources, Mines and Energy.
———. 2019b. “Code of Practice for the Construction and Abandonment of Petroleum Wells, and Associated Bores in Queensland - Version 2.” State of Queensland, Department of Natural Resources, Mines and Energy. https://www.dnrme.qld.gov.au/__data/assets/pdf_file/0006/1461093/code-of-practice-petroleum-wells-bores.pdf.
———. 2020. “Queensland Groundwater Database.” Queensland Government, Department of Natural Resources, Mines and Energy.
DoEE. 2013a. “Matters of National Environmental Significance, Significant Impact Guidelines 1.1, Environment Protection and Biodiversity Conservation Act 1999.” Canberra: Commonwealth of Australia, Department of the Environment and Energy. https://www.environment.gov.au/system/files/resources/42f84df4-720b-4dcf-b262-48679a3aba58/files/nes-guidelines_1.pdf.
———. 2013b. “Significant Impact Guidelines 1.3: Coal Seam Gas and Large Mining Developments – Impact on Water Resources.” Commonwealth of Australia, Department of the Environment and Energy.
———. 2013c. “Significant Impact Guidelines 1.3: Coal Seam Gas and Large Mining Developments – Impact on Water Resources.” Commonwealth of Australia, Department of the Environment and Energy.
———. 2014. “Ecological and Hydrogeological Survey of the Great Artesian Basin Springs - Springsure, Eulo, Bourke and Bogan River Supergroups. Volume 1: History, Ecology and Hydrogeology, Knowledge Report.” Prepared by UniQuest for the Department of the Environment, Commonwealth of Australia.
———. 2015. “Modelling Water-Related Ecological Responses to Coal Seam Gas Extraction and Coal Mining.” Canberra: Commonwealth of Australia, Department of the Environment and Energy.
———. 2019. “Directory of Important Wetlands in Australia - Information Sheet.” Australian Government, Department of Environment and Energy. http://www.environment.gov.au/cgi-bin/wetlands/search.pl?smode=DOIW.
Eamus, D, R Froend, R Loomes, G Hose, and B Murray. 2006. “A Functional Methodology for Determining the Groundwater Regime Needed to Maintain the Health of Groundwater-Dependent Vegetation.” Australian Journal of Botany 54: 97–114.
EHS Support. 2020. “Chemical Risk Assessment Petroleum Leace (PL) 1059.”Environment Australia. 2001. “A Directory of Important Wetlands in Australia.” Canberra.Exon, NF. 1976. “Geology of the Surat Basin, Queensland.” Bulletin 166. Bureau of Mineral
Resources, Geology and Geophysics.

Santos GLNG Pty Ltd Towrie Development Area
Water Assessment Report
Page 134DX70010A01 May 2021
Fensham, RJ, C Pennay, and J Drimer. 2012. “Ecological and Botanical Survey of Springs in the Surat Cumulative Management Area.” Prepared for the Queensland Water Commission By Queensland Herbarium.
Fielding, Christopher R, Renate Sliwa, Rodney J Holcombe, and Jochen Kassan. 2000. “A New Palaeogeographic Synthesis of the Bowen Basin of Central Queensland.” In Bowen Basin Symposium, 287–302. Geological Society of Australia Brisbane.
Ford, JH, KR Hayes, BL Henderson, S Lewis, PA Baker, and RK Schmidt. 2016. “Systematic Analysis of Water-Related Hazards Associated with Coal Resource Development: Submethodology M11 from the Bioregional Assessment Technical Programme.” Australia: Department of Environment and Energy, Bureau of Meteorology, CSIRO, Geoscience Australia. https://www.bioregionalassessments.gov.au/methods/systematic-analysis-water-related-hazards-associated-coal-resource-development.
Golder. 2019. “Produced Water Management Plan - Mahalo Development Area.” 19115894–005. Prepared by Golder Associates Pty Ltd for Australia Pacific LNG Upstream Operator.
Golin, V, and M Smyth. 1986. “Depositional Environments and Hydrocarbon Potential of the Evergreen Formation, ATP 145P, Surat Basin, Queensland.” The APPEA Journal 26 (1): 156–71.
Green, P. 1997. “The Surat and Bowen Basins, South-East Queensland.” Queensland Department of Mines and Energy.
Green, PM. 1997. “The Surat and Bowen Basins, South-East Queensland.” Brisbane: Queensland Department of Mines and Energy.
Green, PM, DC Carmichael, TJ Brain, CG Murray, JL McKellar, JW Beeston, ARG Gray, and P Green. 1997. “Lithostratigraphic Units in the Bowen and Surat Basins, Queensland.” The Surat and Bowen Basins, Southeast Queensland’. Queensland Minerals and Energy Review Series.(Ed. PM Green.) Pp, 41–108.
Hoffmann, KL, PM Green, and ARG Gray. 1997. “Stratigraphic Implications of Seismic-Based Sequence Stratigraphy.” The Surat and Bowen Basins, South-East Queensland 1: 109–36.
Hose, G, J Sreekanth, O Barron, and C Pollino. 2015. “Stygofauna in Australian Groundwater Systems: Extent of Knowledge.” Australia: CSIRO.
Huleatt, Michael B. 1991. Handbook of Australian Black Coals: Geology, Resources, Seam Properties and Product Specifications. Australian Government Publ. Service.
Humphreys, W. 2006. “Groundwater Fauna.” State of Queensland, Department of Environment and Heritage Protection.
IESC. 2014a. “Hydraulic Fracturing ('fraccing") Techniques, Including Reporting Requirements and Governance Arrangements, Background Review.” www.iesc.environment.gov.au.
———. 2014b. “Subsidence in Coal Seam Gas Extraction; Fact Sheet.”———. 2014c. “Subsidence in Coal Seam Gas Extraction; Fact Sheet.”———. 2018a. “Information Guidelines for the Independent Expert Scientific Committee Advice
on Coal Seam Gas and Large Coal Mining Development Proposals - Consultation Draft.” http://www.iesc.environment.gov.au/system/files/pages/b0d7d714-6d6e-4cec-adeb-a27012871522/files/draft-update-iesc-information-guidelines.pdf.
———. 2018b. “Information Guidelines for Proponents Preparing Coal Seam Gas and Large Coal Mining Development Proposals.” Commonwealth of Australia. http://www.iesc.environment.gov.au/publications/information-guidelines-independent-expert-scientific-committee-advice-coal-seam-gas.

Santos GLNG Pty Ltd Towrie Development Area
Water Assessment Report
Page 135DX70010A01 May 2021
———. 2019. “Environmental Assessments - Fact Sheet.” Independent Expert Scientific Committee on Coal Seam Gas and Large Coal Mining Developments.
Jackson, KS, PJ Hawkins, and AJR Bennett. 1980. “Regional Facies and Geochemical Evaluation of the Southern Denison Trough, Queensland.” The APPEA Journal 20 (1): 143–58.
Kellett, JR, TR Ransley, J Coram, J Jaycock, D Barclay, G McMahon, L Foster, and J Hillier. 2003. “Groundwater Recharge in the Great Artesian Basin Intake Beds, Queensland.” NHT Project# 982713. Bureau of Rural Science, Natural Resources and Mines, Queensland.
Kennard, MJ, BJ Pusey, JD Olden, SJ Mackay, and N Marsh. 2010. “Classification of Natural Flow Regimes in Australia to Support Environmental Flow Management.” Freshwater Biology, no. 55: 171–93.
Korsch, R. J., J. M. Totterdell, D. L. Cathro, and M. G. Nicoll. 2009. “Early Permian East Australian Rift System.” Australian Journal of Earth Sciences 56 (3): 381–400. https://doi.org/10.1080/08120090802698703.
Korsch, RJ, and JM Totterdell. 2009. “Subsidence History and Basin Phases of the Bowen, Gunnedah and Surat Basins, Eastern Australia.” Australian Journal of Earth Sciences 56 (3): 335–53.
Laronne, Jonathan B., and Yanai Shlomi. 2007. “Depositional Character and Preservation Potential of Coarse-Grained Sediments Deposited by Flood Events in Hyper-Arid Braided Channels in the Rift Valley, Arava, Israel.” Sedimentary Geology 195 (1): 21–37. https://doi.org/10.1016/j.sedgeo.2006.07.008.
Martin, KR. 1981. “Deposition of the Precipice Sandstone and the Evolution of the Surat Basin in the Early Jurassic.” The APEA Journal, no. 21: 16–23.
McLoughlin, Stephen. 1986. Geology of the Inglis Dome, Denison Trough, East Central Queensland. University of Queensland.
Middlemis, H, and LJM Peeters. 2018. “Uncertainty Analysis—Guidance for Groundwater Modelling within a Risk Management Framework. A Report Prepared for the Independent Expert Scientific Committee on Coal Seam Gas and Large Coal Mining Development through the Department of the Environment and Energy.” Department of Environment and Energy, Commonwealth of Australia.
Nichols, G. J., and J. A. Fisher. 2007. “Processes, Facies and Architecture of Fluvial Distributary System Deposits.” Sedimentary Geology 195 (1): 75–90. https://doi.org/10.1016/j.sedgeo.2006.07.004.
OGIA. 2016a. “Hydrogeological Conceptualisation Report for the Surat Cumulative Management Area.” State of Queensland, The Office of Groundwater Impact Assessment, Department of Natural Resources and Mines.
———. 2016b. “Underground Water Impact Report for the Surat Cumulative Management Area.” Brisbane: State of Queensland, The Office of Groundwater Impact Assessment, Department of Natural Resources and Mines.
———. 2019a. “Updated Geology and Geological Model for the Surat Cumulative Management Area.” The Office of Groundwater Impact Assessment, Department of Natural Resources, Mines and Energy,.
———. 2019b. “Updated Geology and Geological Model for the Surat Cumulative Management Area.” The Office of Groundwater Impact Assessment, Department of Natural Resources, Mines and Energy,.

Santos GLNG Pty Ltd Towrie Development Area
Water Assessment Report
Page 136DX70010A01 May 2021
———. 2019c. “Underground Water Impact Report for the Surat Cumulative Management Area - Consultation Draft.” State of Queensland, The Office of Groundwater Impact Assessment, Department of Natural Resources, Mines and Energy.
———. 2019d. “Surat CMA Aquifer Attribution.” State of Queensland, The Office of Groundwater Impact Assessment, Department of Natural Resources and Mines.
———. 2019e. “Surat CMA Groundwater Model Geometry.” The Office of Groundwater Impact Assessment, Department of Natural Resources, Mines and Energy,.
———. 2019f. “Underground Water Impact Report for the Surat Cumulative Management Area.” State of Queensland, The Office of Groundwater Impact Assessment, Department of Natural Resources, Mines and Energy.
Olgers, F, A W Webb, J A J Smit, and B A Coxhead. 1963. “1:250,000 Geological Series Sheet SG 55-4.” Predavec Enterprises, Sydney.
P. Grech. 2001. “Sedimentology and Sequence Stratigraphy of the Early Triassic Rewan Group, Bowen Basin.” University of Adelaide.
Power, PE. 1967. “Geology and Hydrocarbons, Denison Trough, Australia.” AAPG Bulletin 51 (7): 1320–45.
QGC, Santos, Origin. 2013. “Joint Industry Plan (JIP) for an Early Warning System for the Monitoring and Protection of EPBC Springs.”
Queensland Government. 2017. “Groundwater Dependent Ecosystem Mapping Rule-Sets for the Comet, Dawson and Mackenzie River Catchments: Version 1.5.” Brisbane: Queensland Government.
Queensland Herbarium. 2016. “Regional Ecosystem Description Database (REDD). Version 10.0.” State of Queensland, Department of Science, Information Technology and Innovation. https://www.qld.gov.au/environment/plants-animals/plants/ecosystems/.
———. 2018a. “Spring Database.”———. 2018b. “Spring Database.”———. 2019. “Spring Database.”
https://www.data.qld.gov.au/dataset/springs/resource/4cdc89ef-b583-446e-a5c7-0836a91a3767.
QWC. 2012. “Underground Water Impact Report for the Surat Cumulative Management Area.” State of Queensland, Coal Seam Gas Water, Queensland Water Commission.
Radke, BM, J Ferguson, RG Cresswell, TR Ransley, and MA Habermehl. 2000. “Hydrochemistry and Implied Hydrodynamics of the Cadna-Owie-Hooray Aquifer, Great Artesian Basin.”
Richardson, E, E Irvine, R Froend, P Book, S Barber, and B Bonneville. 2011. “Australian Groundwater Dependent Ecosystems Toolbox Part 2: Assessment Tools.” Canberra: National Water Commission.
Santos. 2014. “CSG Fields Ground Deformation Monitoring and Management Program.” Santos GLNG Project. http://eisdocs.dsdip.qld.gov.au/Santos%20GLNG%20Gas%20Field%20Development/EIS/Appendices/appendix-ae-e-ground-deformation-monitoring-and-management-plan.pdf.
———. 2020a. “Eastern Queensland Stimulation Impact Monitoring Program.” 0007-650-PLA-0012.
———. 2020b. “Environmental Mangement Plan. Towrie Development.”———. 2020c. “Environmental Protocol for Constraints Planning and Field Development. Towrie
Development.”———. 2021a. “Environmental Management Plan. Towrie Development.”

Santos GLNG Pty Ltd Towrie Development Area
Water Assessment Report
Page 137DX70010A01 May 2021
———. 2021b. “Environmental Protocol for Constraints Planning and Field Development. Towrie Development.”
Smerdon, BD, TR Ransley, BM Radke, and JR Kellett. 2012. “Water Resource Assessment for the Great Artesian Basin: A Report for the Australian Government from the CSIRO Great Artesian Basin Water Resource Assessment.”
State of Queensland. 2013a. “GWQ1301 Comet River Sub-Basin.” 2013. https://environment.des.qld.gov.au/water/policy/pdf/plans/comet_plan_300811.pdf.
———. 2013b. “WQ1307 Comet River Sub-Basin.” 2013. https://environment.des.qld.gov.au/water/policy/pdf/plans/comet_plan_300811.pdf.
———. 2013c. “WQ1310 - Fitzroy Basin Groundwater Zones Basin 130.” https://environment.des.qld.gov.au/__data/assets/pdf_file/0030/88815/fitzroy_groundwater_plan_300811.pdf.
———. 2016. Environmental Protection (Water) Policy 2009, Environmental Protection Act 1994. https://www.legislation.qld.gov.au/view/html/inforce/current/sl-2009-0178.
———. 2017a. Water Supply (Safety and Reliability) Act 2008.———. 2017b. “Water Plan (Fitzroy Basin) 2011, Water Act 2000.”
https://www.legislation.qld.gov.au/view/pdf/current/sl-2011-0283.———. 2018a. “GWQ1306 - Fitzroy Basin Groundwater Mid Gab Aquifer Zones.”
https://environment.des.qld.gov.au/__data/assets/pdf_file/0033/87387/fitzroy-groundwater-mid-gab.pdf.
———. 2018b. Environmental Protection Act 1994. https://www.legislation.qld.gov.au/view/pdf/inforce/current/act-1994-062.
———. 2018c. Environmental Protection Act 1994. https://www.legislation.qld.gov.au/view/pdf/inforce/current/act-1994-062.
———. 2018d. Petroleum and Gas (Production and Safety) Act 2004. https://www.legislation.qld.gov.au/view/pdf/current/act-2004-025.
———. 2018e. Petroleum and Gas (Production and Safety) Act 2004. https://www.legislation.qld.gov.au/view/pdf/current/act-2004-025.
———. 2018f. “GWQ1301 - Fitzroy Basin Groundwater Alluvium - Part of Basin 130 (Draft).” Environmental Protection (Water) Policy 2009. Central Queensland Map Series. https://environment.des.qld.gov.au/water/policy/pdf/fitzroy-groundwater-alluvium.pdf.
———. 2018g. “GWQ1302 - Fitzroy Basin Groundwater Fractured Rock - Part of Basin 130 (Draft).” Environmental Protection (Water) Policy 2009. Central Queensland Map Series. https://environment.des.qld.gov.au/water/policy/pdf/fitzroy-groundwater-fractured-rock.pdf.
———. 2018h. “GWQ1303 - Fitzroy Basin Groundwater Cainozoic Deposits Overlying the GAB Zones - Part of Basin 130 (Draft).” Environmental Protection (Water) Policy 2009. Central Queensland Map Series. https://environment.des.qld.gov.au/water/policy/pdf/fitzroy-groundwater-cainozoic-deposits.pdf.
———. 2018i. “GWQ1309 - Fitzroy Basin Groundwater Basins Partially Underlying the GAB Zones - Part of Basin 130 (Draft).” Environmental Protection (Water) Policy 2009. Central Queensland Map Series. https://environment.des.qld.gov.au/water/policy/pdf/fitzroy-groundwater-basins-underlying-gab.pdf.
———. 2018j. “Regional Groundwater Chemistry Zones: Fitzroy-Capricorn-Curtis Coast and Burdekin-Haughton-Don Regions: Summary and Results. Draft for Consultation.”

Santos GLNG Pty Ltd Towrie Development Area
Water Assessment Report
Page 138DX70010A01 May 2021
Environmental Protection (Water) Policy 2009. Queensland Government, Department of Environment and Science, Water Planning Ecology.
———. 2019a. Environmental Protection (Water and Wetland Biodiversity) Policy 2019. https://www.legislation.qld.gov.au/view/pdf/published.exp/sl-2019-0156.
———. 2019b. Environmental Protection Regulation 2008. https://www.legislation.qld.gov.au/view/html/inforce/current/sl-2008-0370.
———. 2019c. Water Act 2000. https://www.legislation.qld.gov.au/view/pdf/inforce/current/act-2000-034.
———. 2019d. Petroleum and Gas (Production and Safety) Act 2004.———. 2019e. Waste Reduction and Recycling Act 2011.
https://www.legislation.qld.gov.au/view/html/inforce/current/act-2011-031.———. 2019f. “Waste Reduction and Recycling Act 2011.”
https://www.legislation.qld.gov.au/view/pdf/inforce/current/act-2011-031.———. 2019g. “Queensland Biodiversity Manual, Version 12.” Department of Agriculture and
Fisheries. https://www.daf.qld.gov.au/__data/assets/pdf_file/0004/379138/qld-biosecurity-manual.pdf.
———. 2019h. Environmental Protection Act 1994. https://www.legislation.qld.gov.au/view/pdf/inforce/current/act-1994-062.
———. 2020a. “Water Monitoring Information Portal.” 2020. https://water-monitoring.information.qld.gov.au/.
———. 2020b. “Biosecurity Act 2014.” https://www.legislation.qld.gov.au/view/pdf/inforce/current/act-2014-007.
Sucklow, Axel, Andrew Taylor, Phil Davies, and Fred Leaney. 2016. “Geochemical Baseline Monitoring. Final Report.” Gas Industry Social and Environmental Research Alliance, CSIRO, Australia. https://gisera.org.au/wp-content/uploads/2012/06/Project-4-Geochemical-Baseline-Report-201602.pdf.
Totterdell, JM. 1990. “Notes to Accompany a 1:5 000 000 Scale Permian Structure Map of Australia.” Record 1990/040. Canberra: Bureau of Mineral Resources, Geology and Geophysics. http://www.ga.gov.au/metadata-gateway/metadata/record/14331/.
URS. 2010. “GLNG Project Environmental Impact Statement Section 7.” https://www.santos.com/media/3894/030-706-groundwater.pdf.
———. 2014. “Surface Water Technical Report Santos GLNG Gas Field Development Project.” Prepared for Santos GLNG.
Related Documents