This is an electronic reprint of the original article. This reprint may differ from the original in pagination and typographic detail. Powered by TCPDF (www.tcpdf.org) This material is protected by copyright and other intellectual property rights, and duplication or sale of all or part of any of the repository collections is not permitted, except that material may be duplicated by you for your research use or educational purposes in electronic or print form. You must obtain permission for any other use. Electronic or print copies may not be offered, whether for sale or otherwise to anyone who is not an authorised user. Sangodoyin, Seun; Virk, Usman Tahir; Burghal, Daoud; Haneda, Katsuyuki; Molisch, Andreas F. System Performance Assessment in Dual-Band Device-to-Device MIMO Channels Published in: 2019 IEEE International Conference on Communications, ICC 2019 - Proceedings DOI: 10.1109/ICC.2019.8761219 Published: 01/05/2019 Document Version Peer reviewed version Please cite the original version: Sangodoyin, S., Virk, U. T., Burghal, D., Haneda, K., & Molisch, A. F. (2019). System Performance Assessment in Dual-Band Device-to-Device MIMO Channels. In 2019 IEEE International Conference on Communications, ICC 2019 - Proceedings [8761219] (IEEE International Conference on Communications). IEEE. https://doi.org/10.1109/ICC.2019.8761219

Welcome message from author
This document is posted to help you gain knowledge. Please leave a comment to let me know what you think about it! Share it to your friends and learn new things together.
Transcript

This is an electronic reprint of the original article.This reprint may differ from the original in pagination and typographic detail.
Powered by TCPDF (www.tcpdf.org)
This material is protected by copyright and other intellectual property rights, and duplication or sale of all or part of any of the repository collections is not permitted, except that material may be duplicated by you for your research use or educational purposes in electronic or print form. You must obtain permission for any other use. Electronic or print copies may not be offered, whether for sale or otherwise to anyone who is not an authorised user.
Sangodoyin, Seun; Virk, Usman Tahir; Burghal, Daoud; Haneda, Katsuyuki; Molisch, AndreasF.System Performance Assessment in Dual-Band Device-to-Device MIMO Channels
Published in:2019 IEEE International Conference on Communications, ICC 2019 - Proceedings
DOI:10.1109/ICC.2019.8761219
Published: 01/05/2019
Document VersionPeer reviewed version
Please cite the original version:Sangodoyin, S., Virk, U. T., Burghal, D., Haneda, K., & Molisch, A. F. (2019). System Performance Assessmentin Dual-Band Device-to-Device MIMO Channels. In 2019 IEEE International Conference on Communications,ICC 2019 - Proceedings [8761219] (IEEE International Conference on Communications). IEEE.https://doi.org/10.1109/ICC.2019.8761219

System Performance Assessment in Dual-BandDevice-to-Device MIMO Channels
Seun Sangodoyin1, Member, IEEE, Usman Tahir Virk2, Daoud Burghal1, Student Member, IEEE,Katsuyuki Haneda2 Member, IEEE, and Andreas F. Molisch1, Fellow, IEEE,
1 University of Southern California, Los Angeles, CA USA.2 Aalto University, Espoo, Finland.
Email: 1{sangodoy, burghal, molisch}@usc.edu; 2{usman.virk, katsuyuki.haneda}@aalto.fi
Abstract—Device-to-Device (D2D) communications has beenembraced as a novel approach for extending coverage in fifth-generation (5G and beyond) wireless networks. Throughput andreliability assessment of such wireless networks are thereforeof utmost importance for D2D communication systems design.In this paper, we consider the capacity results of wirelesspropagation channels in two 5G modes namely the sub-6 GHzcentimeter-wave (cm-wave) and 60 GHz millimeter-wave (mm-wave) bands for a multiple-input-multiple-output (MIMO) D2Dfading channel. Results presented in this paper were obtainedfrom propagation channel measurements jointly conducted inboth cm-wave (2-6 GHz) and mm-wave (59-63 GHz) bands usingan 8 ⇥ 8 MIMO virtual array setup in an outdoor environment.These measurements were conducted at the exact same locations(with constituents unchanged) in both cm-wave and mm-wavebands for comparability of results. Capacity values were com-puted using two power policies (with and without channel stateinformation (CSI)). We also investigated the eigenmode spectralstructure to understand the spatial correlatedness of the channeland the Rician K-factor to analyze small-scale fading in thechannel. The results presented in this paper can be used bywireless systems designer for assessing the performance of D2Dsystems operating in the cm-wave and/or mm-wave bands forthis type of environment.
I. INTRODUCTION
Device-to-Device (D2D) communication has been moti-vated by the search for a complementary communicationarchitecture to the infrastructure-based wireless communi-cation (traditional cellular communication) so as to satisfythe increasing demands for higher data rate and improvedoverall wireless coverage by consumers. One way to increasethe capacity of a cellular network system is by allowingdirect communication between closely located user deviceswhen they intend to communicate with each other instead ofconveying data from one device to the other via the radioand core network. Organizations such as the Third GenerationPartnership Project (3GPP) are actively pursuing the standard-ization of D2D communication [1]. An exhaustive referencelist and detailed discussion on D2D related applications havebeen provided in [2].
The centimeter wave (cm-wave) and millimeter wave (mm-wave) bands have been proposed as complimentary frequencybands to be used for next-generation communication systems.Advantages afforded by the cm-wave band include; bettercoverage due to smaller pathloss and ability to penetrate
walls, while the mm-wave band allows higher data-rate due tolarge spectrum availability and less interference. An extensivediscourse on the joint characterization of wireless propagationin both cm-wave and mm-wave bands has been provided in[3] and [4].
System performance assessment is generally very importantfor wireless system design and deployment. For example incellular networks, cell capacity and coverage performanceanalysis are the driving metrics for determining possiblesubscriber population as well as governing the number ofAccess Points (AP) required to deliver a desired level ofthroughput with a certain reliability value. Similarly, suchan analysis would be of great importance to D2D wirelesscommunication system design. Recently, [5] even discusseda way of harnessing and using available systems informationsuch as the correlation between two bands (cm-wave and mm-wave) to enhance communication if both bands are simultane-ously available to the user. With all this in mind, quantifiableperformance metrics of the propagation channels in whichthese D2D systems will be deployed will certainly be valuableto network planners and system designers alike.
A number of works [6]–[13] have tackled system perfor-mance in D2D networks while the band assignment problemin dual-band systems was discussed in [14]. These works suchas [6]–[9] have discussed ways to improve system performancein cm-wave D2D networks while works such as [10], [11] havemainly focused on D2D simulation and perfomance evaluationin mm-wave bands. The performance of a mm-wave D2Dsystem for the case of a picocell operating in the 60 GHz bandwas evaluated in [12] through simulation while the effect ofpower allocation on D2D and cellular user throughputs in mm-wave E-band 5G-underlay networks is discussed in [13]. Notethat most of these works are based on D2D communicationsystems embedded (influenced or controlled) in traditionalcellular networks. While a number of papers have comparedmm-wave and cm-wave systems for cellular setups, D2Dsetups, which correspond to situations where Transmitter (TX)and Receiver (RX) are at the same height, have drawn lessattention. We are unaware of any works which comparedthe performance of D2D communication systems in a jointly
(multi-band) measured propagation channel with TX and RXat the same height.

Fig. 1: Measurement points at the quad
In this paper, we fill this gap by investigating systemperformance parameters such as the channel capacity valuesat cm-wave and mm-wave bands in Line-of-sight (LOS) andNon-line-of-sight (NLOS) channels measured in an outdoorenvironment. We also investigated the eigenmode spectralstructure of the propagation channel by providing the dis-tribution of eigenvalues and corresponding spreads in bothbands and scenario. This was done to understand the spatialcorrelatedness of the channel. The small-scale fading in thepropagation channel was also investigated with the Rician K-factors obtained from both bands and scenarios presented inthis paper.
The rest of the paper is organized as follows. A shortdescription of the channel measurement campaign and cor-responding data evaluation procedure is provided in SectionII. The small-scale fading analysis is discussed in SectionIII. Eigenvalue characteristics of the propagation channel isdiscussed in Section IV. Results from the channel capacityevaluations is provided in Section VI while the summary andconclusion is inferred in Section VII.
II. MEASUREMENT CAMPAIGN
With the aid of a vector network analyzer, a dual-bandchannel sounder system, which uses an 8 ⇥ 8 virtual multiple-input-multiple-output (MIMO) antenna1 array configurationand operates in both cm-wave (2 � 6 GHz) and mm-wave(59� 63 GHz) frequency range was constructed and used forthe measurement campaign. The channel measurements wereperformed for LOS and NLOS scenarios in and around anopen-square i.e., a quadrangle (quad) in front of the NorrisMedical Library on the Health science campus (HSC) of
1 Two vertically polarized Bicone antennas were used for the cm-wave andmm-wave measurements. The gain of these antennas were 2 dBi (at cm-wave)and 1 dBi gain (mm-wave) respectively.
the University of Southern California (USC) in Los Angeles.The quadrangle and the measurement locations are shown inFig.1. The quad is a 33 ⇥ 33 m open space surrounded bybuildings and trees. At the center of the quad is a 15 ⇥ 15 mdemarcation, where trees and flowers were planted. Additionaldetails about the channel measurement setup and environmenthave been provided in [3] and [4].
The measurements were conducted with TX-RX separationof 5, 10, 15, 24 and 27 m respectively. Multiple measurementswere taken for each distance measured, by placing the TXand RX array at different positions (as shown in Fig. 1).For each TX-RX separation, four positions were selected,respectively for the LOS and NLOS scenarios. These positionsprovide different realization of shadowing (power-variationsdue to blockage) effects. We will hence refer to these positionsas shadowing points in the rest of the paper. A total of80 positions were measured in our campaign. The exactsame locations (with constituents unchanged) were measuredfor both cm-wave and mm-wave bands for comparability ofresults.
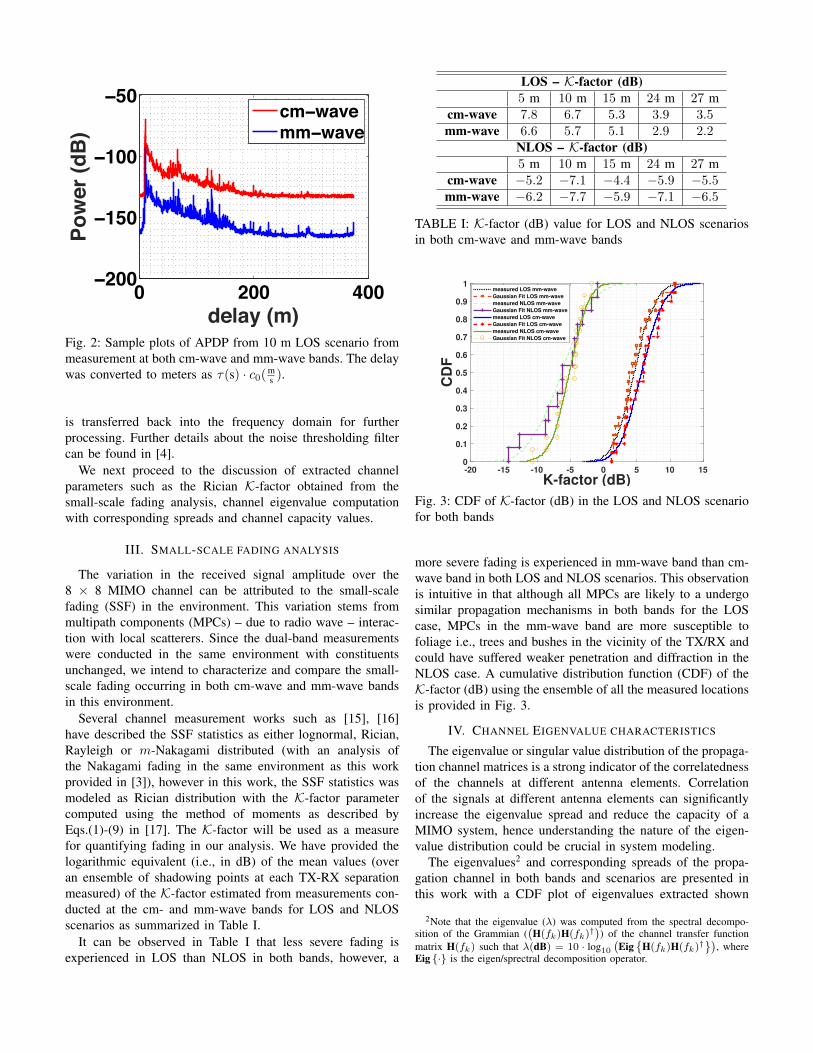
The channel transfer function (H) obtained from the mea-surements was transformed to the delay domain by usingan inverse Fourier transform thereby resulting in an impulseresponse – with the square of its magnitude as the instanta-neous power-delay-profile (PDP). For each shadowing locationmeasured, the influence of small-scale fading was removedby averaging the instantaneous PDPs over the 8 ⇥ 8 TX/RXvirtual antenna element positions in the array to obtain theaverage-power-delay-profile (APDP). A sample of the APDPplot at a selected distance for both cm-wave and mm-waveLOS measurements is shown in Fig. 2.
A noise thresholding filter was implemented such that allPDP samples with magnitudes below a certain threshold areset to zero. After this noise filtering, the impulse response
0 200 400−200
−150
−100
−50
delay (m)
Pow
er (d
B)
cm−wavemm−wave
Fig. 2: Sample plots of APDP from 10 m LOS scenario frommeasurement at both cm-wave and mm-wave bands. The delaywas converted to meters as ⌧(s) · c0(m
s ).
is transferred back into the frequency domain for furtherprocessing. Further details about the noise thresholding filtercan be found in [4].
We next proceed to the discussion of extracted channelparameters such as the Rician K-factor obtained from thesmall-scale fading analysis, channel eigenvalue computationwith corresponding spreads and channel capacity values.
III. SMALL-SCALE FADING ANALYSIS
The variation in the received signal amplitude over the8 ⇥ 8 MIMO channel can be attributed to the small-scalefading (SSF) in the environment. This variation stems frommultipath components (MPCs) – due to radio wave – interac-tion with local scatterers. Since the dual-band measurementswere conducted in the same environment with constituentsunchanged, we intend to characterize and compare the small-scale fading occurring in both cm-wave and mm-wave bandsin this environment.
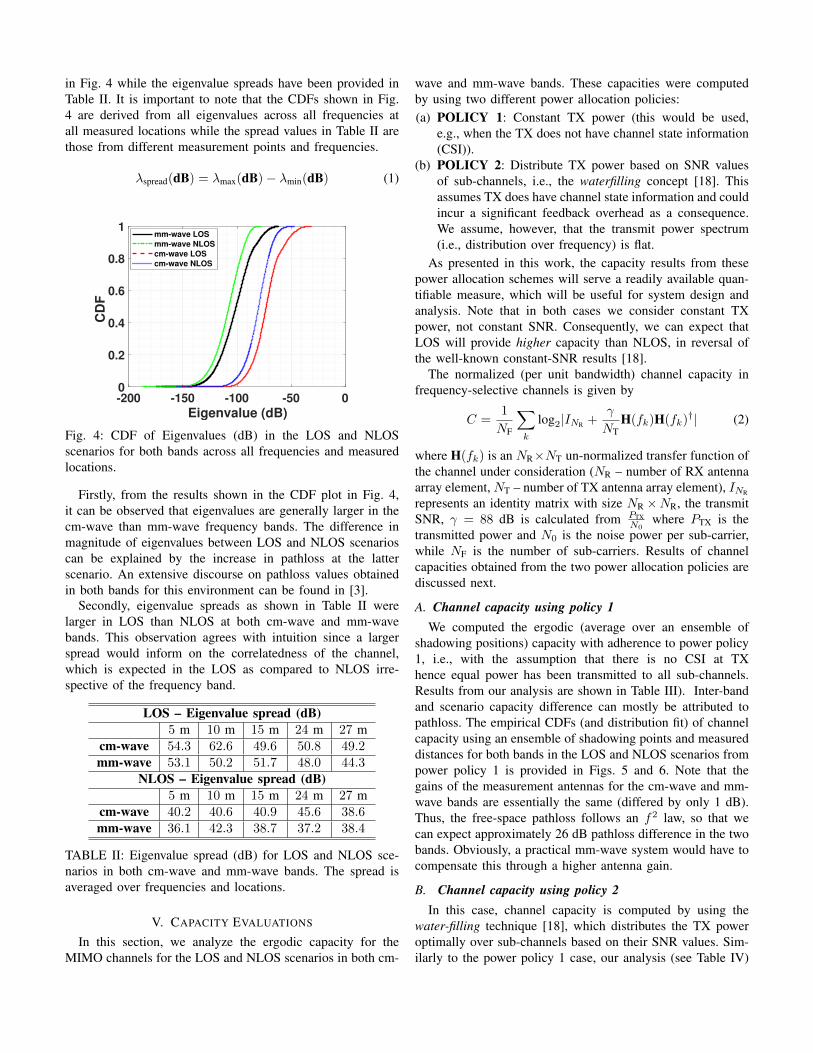
Several channel measurement works such as [15], [16]have described the SSF statistics as either lognormal, Rician,Rayleigh or m-Nakagami distributed (with an analysis ofthe Nakagami fading in the same environment as this workprovided in [3]), however in this work, the SSF statistics wasmodeled as Rician distribution with the K-factor parametercomputed using the method of moments as described byEqs.(1)-(9) in [17]. The K-factor will be used as a measurefor quantifying fading in our analysis. We have provided thelogarithmic equivalent (i.e., in dB) of the mean values (overan ensemble of shadowing points at each TX-RX separationmeasured) of the K-factor estimated from measurements con-ducted at the cm- and mm-wave bands for LOS and NLOSscenarios as summarized in Table I.
It can be observed in Table I that less severe fading isexperienced in LOS than NLOS in both bands, however, a
LOS – K-factor (dB)5 m 10 m 15 m 24 m 27 m
cm-wave 7.8 6.7 5.3 3.9 3.5mm-wave 6.6 5.7 5.1 2.9 2.2
NLOS – K-factor (dB)5 m 10 m 15 m 24 m 27 m
cm-wave �5.2 �7.1 �4.4 �5.9 �5.5mm-wave �6.2 �7.7 �5.9 �7.1 �6.5
TABLE I: K-factor (dB) value for LOS and NLOS scenariosin both cm-wave and mm-wave bands
-20 -15 -10 -5 0 5 10 15
K-factor (dB)
0
0.1
0.2
0.3
0.4
0.5
0.6
0.7
0.8
0.9
1
CD
F
measured LOS mm-wave
Gaussian Fit LOS mm-wave
measured NLOS mm-wave
Gaussian Fit NLOS mm-wave
measured LOS cm-wave
Gaussian Fit LOS cm-wave
measured NLOS cm-wave
Gaussian Fit NLOS cm-wave
Fig. 3: CDF of K-factor (dB) in the LOS and NLOS scenariofor both bands
more severe fading is experienced in mm-wave band than cm-wave band in both LOS and NLOS scenarios. This observationis intuitive in that although all MPCs are likely to a undergosimilar propagation mechanisms in both bands for the LOScase, MPCs in the mm-wave band are more susceptible tofoliage i.e., trees and bushes in the vicinity of the TX/RX andcould have suffered weaker penetration and diffraction in theNLOS case. A cumulative distribution function (CDF) of theK-factor (dB) using the ensemble of all the measured locationsis provided in Fig. 3.
IV. CHANNEL EIGENVALUE CHARACTERISTICS
The eigenvalue or singular value distribution of the propaga-tion channel matrices is a strong indicator of the correlatednessof the channels at different antenna elements. Correlationof the signals at different antenna elements can significantlyincrease the eigenvalue spread and reduce the capacity of aMIMO system, hence understanding the nature of the eigen-value distribution could be crucial in system modeling.
The eigenvalues2 and corresponding spreads of the propa-gation channel in both bands and scenarios are presented inthis work with a CDF plot of eigenvalues extracted shown
2Note that the eigenvalue (�) was computed from the spectral decompo-sition of the Grammian (
�H(fk)H(fk)†
�) of the channel transfer function
matrix H(fk) such that �(dB) = 10 · log10�Eig
�H(fk)H(fk)†
�, where
Eig {·} is the eigen/sprectral decomposition operator.
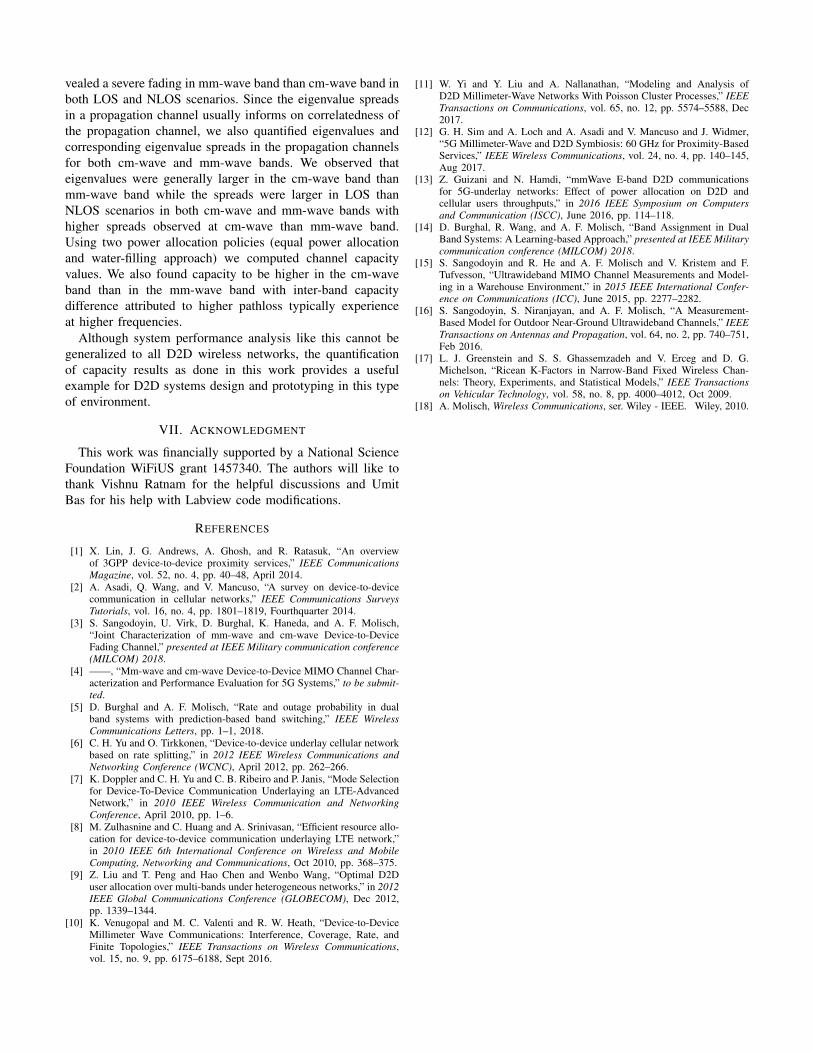
in Fig. 4 while the eigenvalue spreads have been provided inTable II. It is important to note that the CDFs shown in Fig.4 are derived from all eigenvalues across all frequencies atall measured locations while the spread values in Table II arethose from different measurement points and frequencies.
�spread(dB) = �max(dB)� �min(dB) (1)
-200 -150 -100 -50 0Eigenvalue (dB)
0
0.2
0.4
0.6
0.8
1
CD
F
mm-wave LOSmm-wave NLOScm-wave LOScm-wave NLOS
Fig. 4: CDF of Eigenvalues (dB) in the LOS and NLOSscenarios for both bands across all frequencies and measuredlocations.
Firstly, from the results shown in the CDF plot in Fig. 4,it can be observed that eigenvalues are generally larger in thecm-wave than mm-wave frequency bands. The difference inmagnitude of eigenvalues between LOS and NLOS scenarioscan be explained by the increase in pathloss at the latterscenario. An extensive discourse on pathloss values obtainedin both bands for this environment can be found in [3].
Secondly, eigenvalue spreads as shown in Table II werelarger in LOS than NLOS at both cm-wave and mm-wavebands. This observation agrees with intuition since a largerspread would inform on the correlatedness of the channel,which is expected in the LOS as compared to NLOS irre-spective of the frequency band.
LOS – Eigenvalue spread (dB)5 m 10 m 15 m 24 m 27 m
cm-wave 54.3 62.6 49.6 50.8 49.2mm-wave 53.1 50.2 51.7 48.0 44.3
NLOS – Eigenvalue spread (dB)5 m 10 m 15 m 24 m 27 m
cm-wave 40.2 40.6 40.9 45.6 38.6mm-wave 36.1 42.3 38.7 37.2 38.4
TABLE II: Eigenvalue spread (dB) for LOS and NLOS sce-narios in both cm-wave and mm-wave bands. The spread isaveraged over frequencies and locations.
V. CAPACITY EVALUATIONS
In this section, we analyze the ergodic capacity for theMIMO channels for the LOS and NLOS scenarios in both cm-
wave and mm-wave bands. These capacities were computedby using two different power allocation policies:(a) POLICY 1: Constant TX power (this would be used,
e.g., when the TX does not have channel state information(CSI)).
(b) POLICY 2: Distribute TX power based on SNR valuesof sub-channels, i.e., the waterfilling concept [18]. Thisassumes TX does have channel state information and couldincur a significant feedback overhead as a consequence.We assume, however, that the transmit power spectrum(i.e., distribution over frequency) is flat.
As presented in this work, the capacity results from thesepower allocation schemes will serve a readily available quan-tifiable measure, which will be useful for system design andanalysis. Note that in both cases we consider constant TXpower, not constant SNR. Consequently, we can expect thatLOS will provide higher capacity than NLOS, in reversal ofthe well-known constant-SNR results [18].
The normalized (per unit bandwidth) channel capacity infrequency-selective channels is given by
C =1
NF
X
k
log2|INR +�
NTH(fk)H(fk)
†| (2)
where H(fk) is an NR⇥NT un-normalized transfer function ofthe channel under consideration (NR – number of RX antennaarray element, NT – number of TX antenna array element), INR
represents an identity matrix with size NR ⇥NR, the transmitSNR, � = 88 dB is calculated from PTX
N0where PTX is the
transmitted power and N0 is the noise power per sub-carrier,while NF is the number of sub-carriers. Results of channelcapacities obtained from the two power allocation policies arediscussed next.
A. Channel capacity using policy 1We computed the ergodic (average over an ensemble of
shadowing positions) capacity with adherence to power policy1, i.e., with the assumption that there is no CSI at TXhence equal power has been transmitted to all sub-channels.Results from our analysis are shown in Table III). Inter-bandand scenario capacity difference can mostly be attributed topathloss. The empirical CDFs (and distribution fit) of channelcapacity using an ensemble of shadowing points and measureddistances for both bands in the LOS and NLOS scenarios frompower policy 1 is provided in Figs. 5 and 6. Note that thegains of the measurement antennas for the cm-wave and mm-wave bands are essentially the same (differed by only 1 dB).Thus, the free-space pathloss follows an f2 law, so that wecan expect approximately 26 dB pathloss difference in the twobands. Obviously, a practical mm-wave system would have tocompensate this through a higher antenna gain.
B. Channel capacity using policy 2In this case, channel capacity is computed by using the
water-filling technique [18], which distributes the TX poweroptimally over sub-channels based on their SNR values. Sim-ilarly to the power policy 1 case, our analysis (see Table IV)

LOS – (normalized) Capacity (b/s/Hz)5 m 10 m 15 m 24 m 27 m
cm-wave 37.4 27.6 25.4 19.9 18.8mm-wave 3.8 2.8 1.8 1.1 0.4
NLOS – (normalized) Capacity (b/s/Hz)5 m 10 m 15 m 24 m 27 m
cm-wave 24.0 14.6 10.0 7.4 5.5mm-wave 0.5 0.2 0.1 0.06 0.03
TABLE III: Normalized capacity for LOS and NLOS scenariosin both cm-wave and mm-wave bands using policy 1
0 10 20 30 40 50capacity (b/s/Hz)
0
0.2
0.4
0.6
0.8
1
CD
F
Gaussian fit mm-wavemeasured mm-waveGaussian fit cm-wavemeasured cm-wave
Fig. 5: CDF of normalized capacity over an ensemble ofmeasured locations and shadowing points in LOS scenario forcm-wave and mm-wave using power policy 1
0 10 20 30capacity (b/s/Hz)
0
0.2
0.4
0.6
0.8
1
CD
F
Gaussian fit mm-wavemeasured mm-waveGaussian fit cm-wavemeasured cm-wave
Fig. 6: CDF of normalized capacity over an ensemble ofmeasured locations and shadowing points in NLOS scenariofor cm-wave and mm-wave using power policy 1
shows inter-band and scenario capacity difference that can bemostly attributed to pathloss increase at higher frequencies andin NLOS cases.
The empirical CDFs (and distribution fit) of channel ca-pacity using an ensemble of shadowing points and measureddistances for both bands in the LOS and NLOS scenarios frompower policy 2 is provided in Figs. 7 and 8.
LOS – (normalized) Capacity (b/s/Hz)5 m 10 m 15 m 24 m 27 m
cm-wave 38.6 29.2 27.1 21.8 20.7mm-wave 6.2 4.8 3.6 2.6 1.1
NLOS – (normalized) Capacity (b/s/Hz)5 m 10 m 15 m 24 m 27 m
cm-wave 25.4 16.4 11.9 9.3 7.4mm-wave 1.2 0.7 0.3 0.2 0.1
TABLE IV: Normalized capacity for LOS and NLOS scenariosin both cm-wave and mm-wave bands using policy 2
0 10 20 30 40 50capacity (b/s/Hz)
0
0.2
0.4
0.6
0.8
1
CD
F
Gaussian fit mm-wavemeasured mm-waveGaussian fit cm-wavemeasured cm-wave
Fig. 7: CDF of normalized capacity over an ensemble ofmeasured locations and shadowing points in LOS scenario forcm-wave and mm-wave using power policy 2
0 10 20 30 40capacity (b/s/Hz)
0
0.2
0.4
0.6
0.8
1
CD
F
Gaussian fit mm-wavemeasured mm-waveGaussian fit cm-wavemeasured cm-wave
Fig. 8: CDF of normalized capacity over an ensemble ofmeasured locations and shadowing points in NLOS scenariofor cm-wave and mm-wave using power policy 2
VI. SUMMARY AND CONCLUSION
In this work, we embarked on a system performance eval-uation of a multi-band (cm-wave and mm-wave) D2D MIMOpropagation channel measurements jointly (both bands) con-ducted in an outdoor environment. The small-scale fading inthe propagation channel was modeled using a Rician distribu-tion. The K-factor (dB) parameter of the Rician distribution re-
vealed a severe fading in mm-wave band than cm-wave band inboth LOS and NLOS scenarios. Since the eigenvalue spreadsin a propagation channel usually informs on correlatedness ofthe propagation channel, we also quantified eigenvalues andcorresponding eigenvalue spreads in the propagation channelsfor both cm-wave and mm-wave bands. We observed thateigenvalues were generally larger in the cm-wave band thanmm-wave band while the spreads were larger in LOS thanNLOS scenarios in both cm-wave and mm-wave bands withhigher spreads observed at cm-wave than mm-wave band.Using two power allocation policies (equal power allocationand water-filling approach) we computed channel capacityvalues. We also found capacity to be higher in the cm-waveband than in the mm-wave band with inter-band capacitydifference attributed to higher pathloss typically experienceat higher frequencies.
Although system performance analysis like this cannot begeneralized to all D2D wireless networks, the quantificationof capacity results as done in this work provides a usefulexample for D2D systems design and prototyping in this typeof environment.
VII. ACKNOWLEDGMENT
This work was financially supported by a National ScienceFoundation WiFiUS grant 1457340. The authors will like tothank Vishnu Ratnam for the helpful discussions and UmitBas for his help with Labview code modifications.
REFERENCES
[1] X. Lin, J. G. Andrews, A. Ghosh, and R. Ratasuk, “An overviewof 3GPP device-to-device proximity services,” IEEE Communications
Magazine, vol. 52, no. 4, pp. 40–48, April 2014.[2] A. Asadi, Q. Wang, and V. Mancuso, “A survey on device-to-device
communication in cellular networks,” IEEE Communications Surveys
Tutorials, vol. 16, no. 4, pp. 1801–1819, Fourthquarter 2014.[3] S. Sangodoyin, U. Virk, D. Burghal, K. Haneda, and A. F. Molisch,
“Joint Characterization of mm-wave and cm-wave Device-to-DeviceFading Channel,” presented at IEEE Military communication conference
(MILCOM) 2018.[4] ——, “Mm-wave and cm-wave Device-to-Device MIMO Channel Char-
acterization and Performance Evaluation for 5G Systems,” to be submit-
ted.[5] D. Burghal and A. F. Molisch, “Rate and outage probability in dual
band systems with prediction-based band switching,” IEEE Wireless
Communications Letters, pp. 1–1, 2018.[6] C. H. Yu and O. Tirkkonen, “Device-to-device underlay cellular network
based on rate splitting,” in 2012 IEEE Wireless Communications and
Networking Conference (WCNC), April 2012, pp. 262–266.[7] K. Doppler and C. H. Yu and C. B. Ribeiro and P. Janis, “Mode Selection
for Device-To-Device Communication Underlaying an LTE-AdvancedNetwork,” in 2010 IEEE Wireless Communication and Networking
Conference, April 2010, pp. 1–6.[8] M. Zulhasnine and C. Huang and A. Srinivasan, “Efficient resource allo-
cation for device-to-device communication underlaying LTE network,”in 2010 IEEE 6th International Conference on Wireless and Mobile
Computing, Networking and Communications, Oct 2010, pp. 368–375.[9] Z. Liu and T. Peng and Hao Chen and Wenbo Wang, “Optimal D2D
user allocation over multi-bands under heterogeneous networks,” in 2012
IEEE Global Communications Conference (GLOBECOM), Dec 2012,pp. 1339–1344.
[10] K. Venugopal and M. C. Valenti and R. W. Heath, “Device-to-DeviceMillimeter Wave Communications: Interference, Coverage, Rate, andFinite Topologies,” IEEE Transactions on Wireless Communications,vol. 15, no. 9, pp. 6175–6188, Sept 2016.
[11] W. Yi and Y. Liu and A. Nallanathan, “Modeling and Analysis ofD2D Millimeter-Wave Networks With Poisson Cluster Processes,” IEEE
Transactions on Communications, vol. 65, no. 12, pp. 5574–5588, Dec2017.
[12] G. H. Sim and A. Loch and A. Asadi and V. Mancuso and J. Widmer,“5G Millimeter-Wave and D2D Symbiosis: 60 GHz for Proximity-BasedServices,” IEEE Wireless Communications, vol. 24, no. 4, pp. 140–145,Aug 2017.
[13] Z. Guizani and N. Hamdi, “mmWave E-band D2D communicationsfor 5G-underlay networks: Effect of power allocation on D2D andcellular users throughputs,” in 2016 IEEE Symposium on Computers
and Communication (ISCC), June 2016, pp. 114–118.[14] D. Burghal, R. Wang, and A. F. Molisch, “Band Assignment in Dual
Band Systems: A Learning-based Approach,” presented at IEEE Military
communication conference (MILCOM) 2018.[15] S. Sangodoyin and R. He and A. F. Molisch and V. Kristem and F.
Tufvesson, “Ultrawideband MIMO Channel Measurements and Model-ing in a Warehouse Environment,” in 2015 IEEE International Confer-
ence on Communications (ICC), June 2015, pp. 2277–2282.[16] S. Sangodoyin, S. Niranjayan, and A. F. Molisch, “A Measurement-
Based Model for Outdoor Near-Ground Ultrawideband Channels,” IEEE
Transactions on Antennas and Propagation, vol. 64, no. 2, pp. 740–751,Feb 2016.
[17] L. J. Greenstein and S. S. Ghassemzadeh and V. Erceg and D. G.Michelson, “Ricean K-Factors in Narrow-Band Fixed Wireless Chan-nels: Theory, Experiments, and Statistical Models,” IEEE Transactions
on Vehicular Technology, vol. 58, no. 8, pp. 4000–4012, Oct 2009.[18] A. Molisch, Wireless Communications, ser. Wiley - IEEE. Wiley, 2010.
Related Documents


![Mendel’s Manuscript of ‘Versuche über Pflanzenhybriden ...UH/Simu... · Größe“ [Our Contribution to the Common Greatness] and Molisch, H. (1934) Erinnerungen und Welteindrücke](https://static.cupdf.com/doc/110x72/5e099f451ca39074d4783d62/mendelas-manuscript-of-aversuche-ber-pflanzenhybriden-uhsimu-greaoe.jpg)


