Sand dynamics in Darwin Harbour: a tool for coastal management Silvia Gabrina Tonyes Master of Science, Ghent University, Belgium A thesis submitted for the degree of Doctor of Philosophy Research Institute for the Environment and Livelihoods College of Engineering, IT and Environment Charles Darwin University Darwin, Northern Territory 2018

Welcome message from author
This document is posted to help you gain knowledge. Please leave a comment to let me know what you think about it! Share it to your friends and learn new things together.
Transcript
Sand dynamics in Darwin Harbour: a tool for coastal management
Silvia Gabrina Tonyes
Master of Science, Ghent University, Belgium
A thesis submitted for the degree of Doctor of Philosophy
Research Institute for the Environment and Livelihoods
College of Engineering, IT and Environment
Charles Darwin University
Darwin, Northern Territory
2018
i
Declaration by author
This work contains no material which has been accepted for the award of any other
degree or diploma in any university or other tertiary institution and, to the best of my
knowledge and belief, contains no material previously published or written by
another person, except where due reference has been made in the text.
I give consent to this copy of my thesis, when deposited in Charles Darwin
University Library, being made available for loan and photocopying, and online via
the University’s Open Access repository eSpace.
Silvia G. Tonyes
Aspects of this work have been presented and published as follows.
Tonyes, SG, Wasson, RJ, Munksgaard, NC, Evans, KG, Brinkman, R & Williams,
DK 2015, ‘Sand Dynamics as a Tool for Coastal Erosion Management: A Case
Study in Darwin Harbour, Northern Territory, Australia’, Procedia Engineering, vol.
125, pp. 220–228.
Tonyes, SG, Wasson, RJ, Munksgaard, NC, Evans, K., Brinkman, R & Williams,
DK 2017, ‘Understanding coastal processes to assist with coastal erosion
management in Darwin Harbour, Northern Territory, Australia’, IOP Conference
Series: Earth and Environmental Sciences 55, Bali, Indonesia.

ii
For F. Tönjes & M.J. Tönjes-Toelle
They paved the way for the science & engineering curiosity in me
iii
Acknowledgement
The years spent doing this PhD was like a long marathon and I have been supported
by many people. I would like to take this opportunity to express my sincere gratitude
to my supervisors and advisor: Professor Robert J. Wasson, Professor Ken G. Evans,
Dr. Niels C. Munksgaard, Dr. Richard Brinkman and David Williams. Your
guidance, constructive feedback, support, encouragement, patience and practical
suggestions helped me navigate unorthodox situations that arose along the way. Bob
boosted my passion for multi-disciplinary approaches for environmental problems.
Ken was always available for advice and made time for supervisory meetings on
short notice, even during holidays. Niels provided expertise and attention to detail in
geochemistry, Richard and David provided access to the Australian Institute of
Marine Science (AIMS) repository, modelling and field work support.
Richard, and later Dr. Edward Butler, made it possible for me to be an AIMS visitor
at the Arafura Timor Research Facility (ATRF) during my candidacy period. Thanks
must also go to Professor Eric Valentine, Professor Chris Austin, Professor Andrew
Campbell and Professor Karen Edyvane for assisting me at the beginning of my
candidature. I gratefully acknowledge the support of DIKTI, CDU and AIMS in
finalising this programme.
Deep appreciation goes to Professor Ian King for his tireless support on modelling
and quick responses to my questions even during his trips and holidays. Ruth
Patterson and Mitch Proudfoot were instrumental in tutoring me on modelling
technicalities.
Florencia Cerutti, the fieldwork would have been completely different without you!
Flo and Matthew Gray made the sand sampling less challenging. They also
introduced me to the “Darwin Harbour sampling good-sense”: tide, sandflies,
crocodile and jelly fish warnings included. I am also grateful to the wonderful
fieldwork squad: Muhammad Nawaz, Patrick Viane, Mark Li, Jonathan Windsor,
Kirsty McAllister, Muditha Kumari Heenkenda and Evi Warintan Saragih.
My Lab work was greatly eased thanks to Judy Manning, Anna Skillington, Dylan
Campbell, Francoise Lecrenier, Anna Padovan, Ellie Hayward, Yolande Yep, Quan
Tien, Matthew Northwood, Mara Gray and all the tech office staff in Yellow 2.
iv
Thank you to Professor Karen Gibb, Dr. Mirjam Kaestli, Dionisia Lambrinidis and
Zairinah Abdul Sani for their support during my time in ECMU.
For their help, motivation, inspiration and support, I would also like to thank, in no
particular order, Stephen Garnet, Mick Guinea, Ian Leiper, Jayshree Mamtora,
Marilyn Kell, Julie Mastin, Ron Ninis, Judy Opitz, Farha Sattar, Rabia Tabassum,
Patrick Gray, Mike Saynor, Julia Fortune, Simon Townsend, Lynda Radke
(previously Geoscience Australia) and Paul Davill (National Data Centre, Bureau of
Meteorology). Profound gratitude to the late Jim Mitroy and Wayne Erskine for their
hands-on advice. When the going was tough Penny Wurm, Karen Gibb, Tracy
Hooker, Judith Austin, Kristen Deveraux, Kat Savvas, Evi Saragih, Linda Dolok and
Muditha Heenkenda provided much needed time and advice. To my office mates:
Sharon Every, Abilio Fonseca, José Quintas, James Moore and the wonderful people
in ATRF, a big thank you for the friendship, encouragement and time you provided
for those PhD moans and keeping me sane. Plus the fantastic morning teas!
Rosanne Lee Koo and Asnat Rihi provided a wonderfully homey environment. The
Darwin “Diktiers & comrades”, too many to name each of you here, I will always
remember your friendship, our ups and downs, tears and laughter, not to mention
your culinary expertise.
Unending thanks to the continual support and encouragement from my family and
friends. With their invariable ‘when are you going to finish’ type of comments, they
unfailingly kept their unwavering belief that the finish line was near. In particular to
my better half Patrick Viane for putting up with me during this PhD journey. Your
support was invaluable in finalising this thesis. We can now revisit the to-do list and
move forward.
v
Abstract
Coastal management has evolved from being mainly concerned with a coastal
engineering approach to deal with coastal erosion, to a wider range of coastal
morphodynamics assessments to aid in understanding the processes occurring in a
coastal environment. Sandy beaches are particularly susceptible to erosion due to
natural and human-induced activities and Darwin Harbour, a tropical, macro-tidal
environment in northern Australia, is not an exception.
This study investigates sand-sized sediment sources and pathways in Darwin
Harbour using a multidisciplinary approach, combining numerical modelling and
geochemical analysis. Sand transport pathways were inferred using a 2D
hydrodynamic model (RMA-2) coupled with a sand transport model (RMA-11) from
Resource Modelling Associates. Simulations were also carried out on the
hypothetical dredging of a sandbar that was once partially dredged to supply sand for
a development project. The calcium carbonate and trace element content were used
to complement the simulation results, inferring the sources and depositional area of
sand independently of the modelling.
The sand-sized sediment in Darwin Harbour displays a mix of marine and
terrigenous sources with the offshore derived sand-sized sediment deposited in the
Harbour significantly greater than the fluvially derived sediment. The primary source
of sand-sized sediment in the Outer Harbour and the eastern beaches originates from
the continental shelf and the reworking of Harbour sediment while the fluvial
sediment shows the best correlation with the Inner Harbour and the western beaches.
Factors influencing the sand transport pathways are the low catchment to estuary
ratio, the dumbbell shape of the Harbour/embayment and high tidal current
velocities. The modelling simulations on the hypothetical sandbar dredging resulted
in up to 30% decrease of deposition in the adjacent beach and intertidal area.
This study suggests that any development in the Harbour requires a thorough study
of the changes in sediment movement patterns that could affect the dynamics of
nearshore – beach – dune systems and the erosion – deposition rates on the beaches.
Future studies should be directed to coastal compartment determination, providing an
analysis of coastal resilience and coastal setback as the precautions against coastal
erosion and storm-induced flooding.
vi
Table of Contents
Declaration by author .................................................................................................... i
Acknowledgement....................................................................................................... iii
Abstract ............ ........................................................................................................... v
Table of Contents ........................................................................................................ vi
List of Figures .............................................................................................................. x
List of Tables............................................................................................................. xiv
Abbreviations and Acronyms ..................................................................................... xv
Chapter 1 Introduction ................................................................................................. 1
1.1. Overview ........................................................................................................... 1
1.1.1 Research context ......................................................................................... 1
1.1.2 The study area ............................................................................................. 2
1.1.3 Problem statement ....................................................................................... 5
1.1.4 Research questions ...................................................................................... 6
1.2 Summary of methods ......................................................................................... 6
1.3 Organisation of the thesis ................................................................................... 7
Chapter 2 The international significance of studies of sand for coastal management . 8
2.1 The significance of studies of sand for coastal management ............................. 8
2.1.1 Understanding sand dynamics in coastal processes .................................. 10
2.1.2 A Multi-disciplinary approach for coastal erosion management .............. 13
2.2 Sand-sized sediment characteristics ................................................................. 15
2.3 Sand provenance .............................................................................................. 17
2.4 Sand transport................................................................................................... 21
2.5 Coastal erosion management in Darwin Harbour ............................................ 25
Chapter 3 Site description .......................................................................................... 28
3.1 Physical setting................................................................................................. 28
3.2 Topography and morphology of Darwin Harbour and its catchment .............. 29
3.3 Geology and soils of Darwin Harbour and its catchment ................................ 33
3.4 Sediment characteristics in Darwin Harbour ................................................... 35
3.5 Climate of Darwin Harbour ............................................................................. 37
3.6 Physical oceanography of Darwin Harbour ..................................................... 41
3.7 The development, environmental and socio-economic issues in Darwin
Harbour ............................................................................................................. 42
3.8 Previous coastal related studies in Darwin Harbour ........................................ 44
vii
Chapter 4 Sand-sized sediment provenance in Darwin Harbour ............................... 46
4.1 Introduction ...................................................................................................... 46
4.2 Methods ............................................................................................................ 49
4.2.1 Sample collection ...................................................................................... 49
4.2.2 Analytical techniques ................................................................................ 52
4.2.3 Data analysis ............................................................................................. 54
4.2.3.1 Grain size distribution analysis .......................................................... 54
4.2.3.2 Statistical analyses ............................................................................. 57
4.3 Results .............................................................................................................. 57
4.3.1 Grain size parameters ................................................................................ 57
4.3.1.1 Mean grain size .................................................................................. 58
4.3.1.2 Sorting ................................................................................................ 60
4.3.1.3 Skewness ............................................................................................ 62
4.3.1.4 Kurtosis .............................................................................................. 64
4.3.2 Calcium carbonate ..................................................................................... 68
4.3.3 Sediment elemental composition .............................................................. 71
4.3.3.2 Large-Ion Lithophile Elements (LILE) .............................................. 73
4.3.3.3 High-Field Strength Elements (HFSE) .............................................. 77
4.3.3.4 Rare Earth Elements (REE) ............................................................... 82
4.3.3.4.1 REE abundance ........................................................................... 82
4.3.3.4.2 REE distribution profile .............................................................. 87
4.4 Discussion ........................................................................................................ 93
4.4.1 Grain size distribution ............................................................................... 93
4.4.2 Calcium carbonate ..................................................................................... 95
4.4.3 Elemental composition .............................................................................. 97
4.5 Conclusion...................................................................................................... 100
Chapter 5 Sand transport pathways in Darwin Harbour .......................................... 102
5.1 Introduction .................................................................................................... 102
5.2 Model description and configuration ............................................................. 103
5.2.1 RMA modelling suite .............................................................................. 104
5.2.2 The model mesh ...................................................................................... 104
5.2.3 Modelling procedure ............................................................................... 107
5.2.3.1 Hydrodynamic simulations .............................................................. 107
5.2.3.2 Sand transport simulation ................................................................. 108
5.3 Modelling scenarios ....................................................................................... 110
viii
5.4 Modelling results ............................................................................................ 113
5.4.1 Hydrodynamic modelling results ............................................................ 113
5.4.1.1 Tidal current patterns based on the original model network ............ 113
5.4.1.2 Tidal current patterns based on the modified model network .......... 117
5.4.2 Sand transport modelling results ............................................................. 122
5.4.2.1 General sand transport pathways in Darwin Harbour ...................... 134
5.4.2.1.1 Sand deposition patterns on the beaches ................................... 138
5.4.2.1.2 Sand deposition patterns in Fannie Bay area ............................ 141
5.4.2.1.3 Comparison of sand deposition in Darwin Harbour from
offshore and the rivers............................................................... 144
5.4.2.2 Sand transport pathways based on the hypothetical dredging of
Cullen Bay sandbar .......................................................................... 146
5.4.2.2.1 Changes of sand transport pathways due to the hypothetical
dredging of the Cullen Bay sandbar .......................................... 147
5.4.2.2.2 Changes to sand transport pathways in Fannie Bay due to the
hypothetical dredging of the Cullen Bay sandbar ..................... 150
5.5 Discussion ...................................................................................................... 153
5.5.1 Sand transport pathways in Darwin Harbour .......................................... 153
5.5.2 Coastal erosion management implications due to the hypothetical
dredging of Cullen Bay sandbar ............................................................. 155
5.6 Conclusions .................................................................................................... 157
Chapter 6 Sand-sized sediment sources and pathways for coastal erosion
management in Darwin Harbour, Northern Territory, Australia ............. 159
6.1 Introduction .................................................................................................... 159
6.2 Sand-sized sediment dynamics in Darwin Harbour ....................................... 159
6.3 Influence on sand dynamics in Darwin Harbour of hypothetical dredging of
a sandbar ......................................................................................................... 163
6.4 Implications of the sand dynamic study for coastal erosion management in
Darwin Harbour .............................................................................................. 164
6.5 Strengths and limitations ................................................................................ 167
6.5.1 Strengths .................................................................................................. 167
6.5.2 Limitations and uncertainties .................................................................. 167
6.5.2.1 Sand transport simulation ................................................................. 167
6.5.2.2 Provenance analysis ......................................................................... 170
6.6 Recommendations and future research .......................................................... 171
6.6.1 Improvement in numerical modelling ..................................................... 171
6.6.2 Improvement of the provenance analysis ................................................ 172
6.6.3 Recommendations for better coastal erosion management approaches .. 172

ix
6.7 Global significance of the study ..................................................................... 174
6.8 Concluding remarks ....................................................................................... 174
References ................................................................................................................ 176
Appendices ............................................................................................................... 208
Appendix A – Photographs of coastal erosion in Darwin Harbour beaches ........ 208
Appendix B – Photographs of selected coarse sand samples in Darwin Harbour 211
Appendix C – Concentration of LILEs, HFSEs, REEs, CaCO3 and grain size
distribution of sand-sized samples in Darwin Harbour .................................. 213
x
List of Figures
Figure 1.1 Darwin Harbour (Map source: Geoscience Australia) ............................... 3
Figure 3.1 Location of Darwin Harbour (Map source: Geoscience Australia) .......... 28
Figure 3.2 Land units in Darwin Harbour catchment area (Haig and Townsend,
2003) ............................................................................................................... 31
Figure 3.3 Annual rainfall and temperature in Darwin Harbour (Bureau of
Meteorology, 2016) ........................................................................................ 38
Figure 3.4 Annual mean wind speed in Darwin Harbour (Bureau of Meteorology,
2016) ............................................................................................................... 39
Figure 4.1 Study area and the sampling points .......................................................... 50
Figure 4.2 Percentage of mean grain size for the samples in Darwin Harbour ......... 60
Figure 4.3 Percentage of sorting category for the samples in Darwin Harbour ......... 62
Figure. 4.4 Skewness percentage for the samples in Darwin Harbour ...................... 64
Figure 4.5 Kurtosis percentage of the samples in Darwin Harbour ........................... 66
Figure 4.6 Principal Coordinate Analysis of the grain size distribution .................... 67
Figure 4.7 Principal Coordinate Analysis of the grain size parameters ..................... 67
Figure 4.8 Distribution of calcium carbonate content in Darwin Harbour sediment . 69
Figure 4.9 Calcium carbonate content (% by weight) in Darwin Harbour sediment . 70
Figure 4.10 Multi-Dimensional Scaling of elements and sand grain size
characteristics. Euclidean distance of 12 (green clusters), 16 (blue clusters)
and 18 (red clusters) denote approximately 50%, 30% and 20% respectively72
Figure 4.11 a – c Range of Ba, Cs and K concentration of all sample types ............. 74
Figure 4.11 d – f Range of Rb, Pb and Sr concentration of all sample types ............ 75
Figure 4.12 Principal Coordinate Analysis of LILEs in all sample types. Distances
of 2 (green clusters) and 4 (dashed-blue clusters) denote approximately
90% and 80% similarity respectively. The vectors represents the direction
and strength of the correlation between the variable and the axes ................. 76
Figure 4.13 Principal Coordinate Analysis of LILEs in a reduced sample number.
Distances of 3.6 (green clusters) and 4.8 (dashed-blue clusters) denote
approximately 70% and 60% similarity respectively ..................................... 77
Figure 4.14 a – d Range of Hf, Zr, Th and Nb of all sample types ............................ 78
Figure 4.14 e – h Range of Ti, U, P and Y concentrations of all sample types ......... 79
xi
Figure 4.14 i and j Range of Ta and W concentrations of all sample types .............. 80
Figure 4.15 Principal Coordinate Analysis of HFSEs in all sample types. Distances
of 3 (green clusters) and 5 (dashed-blue clusters) denote approximately
80% and 70% similarity respectively. The vectors represent the direction
and strength of the correlation between the variables and the axes ................ 81
Figure 4.16 Principal Coordinate Analysis of HFSEs in a reduced sample number.
Distance of 4 (green clusters) denote approximately 70% similarity ............. 82
Figure 4.17 a – c Range of REE abundance (REE), L-REE and H-REE of all
sample types .................................................................................................... 83
Figure 4.18 REE abundance ( REE) in Darwin Harbour sediment ......................... 84
Figure 4.19 Principal Coordinate Analysis of REEs in all sample types. Distances
of 4 (green clusters) and 7 (dashed blue clusters) denote approximately
90% and 80% similarity respectively. The vectors represent the direction
and strength of the correlation between the variable and the axes ................. 85
Figure 4.20 Principal Coordinate Analysis of REEs in a reduced sample number.
Distances of 3 (green clusters), 5 (dashed-blue clusters) and 6 (red clusters)
denote approximately 80%, 70% and 60% similarity respectively ................ 86
Figure 4.21 Median chondrite-normalised REE concentration of all sample types .. 87
Figure 4.22 Chondrite-normalised REE concentration of (the potential sources of
sand-sized sediment in Darwin Harbour): fluvial, rock and inner continental
shelf/Outer Harbour samples .......................................................................... 88
Figure 4.23 Median chondrite-normalised REE concentration of subtidal Inner
and Outer Harbour samples ............................................................................ 89
Figure 4.24 Median chondrite-normalised REE concentration of the sediment sink
area: beach, dunes and sandbar samples ......................................................... 90
Figure 4.25 Median chondrite-normalised REE concentration of selected fluvial
and rock samples compared to the beach, sandbar and subtidal samples ....... 91
Figure 4.26 Compilation of the Principal Component Analysis of LILEs (left
panels), HFSEs (middle panels) and REEs (right panels) displaying the
pattern of similarity of all samples ................................................................. 92
Figure 5.1 Darwin Harbour model mesh (based on AIMS 2012) ............................ 105
Figure 5.2 Element types in Darwin Harbour model mesh (based on AIMS 2012) 106
Figure 5.3 Darwin Harbour bathymetry (based on AIMS 2012) ............................. 106
Figure 5.4 Schematic of the sand load simulations .................................................. 107
Figure 5.5 Bathymetry at Cullen Bay sandbar area in Fannie Bay; the original
model mesh (a) and after hypothetical dredging of the Cullen Bay sandbar
(b) .................................................................................................................. 112
Figure 5.6 The beginning of flood spring tide pattern in Darwin Harbour .............. 113
xii
Figure 5.7 Maximum flood (a) and ebb (b) tide pattern (current pathways) in
Darwin Harbour ............................................................................................ 115
Figure 5.8 Refracted current directions due to Nightcliff and East Point
promontories ................................................................................................. 116
Figure 5.9 Eddies in Fannie Bay, West Point and the wharves area ........................ 117
Figure 5.10 a – h The development of tidal current patterns in the Cullen Bay
sandbar area during the outgoing tide in 30-minute stages; comparison
between the original mesh with the Cullen Bay sandbar (red) and the
modified model mesh representing removal of the Cullen Bay sandbar
(blue) ............................................................................................................. 118
Figure 5.11 Locations of several nodes in the Outer Harbour, Inner Harbour and
an embayment adjacent to Charles Point headland ...................................... 123
Figure 5.12 Deposition and tide/water level at nodes 150, 197 and 249 (Outer
Harbour), 543, 770 and 935 (Inner Harbour) and 97, 98 and 99 (adjacent
to Charles Point headland) in the first 2 months of simulations (May and
June 2012) ..................................................................................................... 125
Figure 5.13a Deposition and tide/water level at nodes 150, 197 and 249 (Outer
Harbour), 543, 770 and 935 (Inner Harbour) and 97, 98 and 99 (adjacent
to Charles Point headland) at the end of the 12th month of simulation
(April 2013) .................................................................................................. 127
Figure 5.13b Deposition and tide/water level at nodes 150, 197 and 249 (Outer
Harbour) and node 543 (Inner Harbour) at the end of the 12th month of
simulation (April 2013) ................................................................................ 128
Figure 5.14a Deposition and tide/water level at nodes 150, 197 and 249 (Outer
Harbour), 543, 770 and 935 (Inner Harbour) and 97, 98 and 99 (adjacent
to Charles Point headland) at the end of the 36th month of simulation
(April 2015) .................................................................................................. 129
Figure 5.14b Deposition and tide/water level at nodes 150, 197 and 249 (Outer
Harbour) and 543, 770 and 935 (Inner Harbour) at the end of the 36th
month of simulation (April 2015) ................................................................. 130
Figure 5.15 a Deposition and tide/water level at nodes 150, 197 and 249 (Outer
Harbour), 543, 770 and 935 (Inner Harbour) and 97, 98 and 99 (adjacent
to Charles Point headland) at the end of the 48th month of simulation
(April 2016) .................................................................................................. 131
Figure 5.15b Deposition and tide/water level at nodes 150, 197 and 249 (Outer
Harbour) and 543, 770 and 935 (Inner Harbour) at the end of the 48th
month of simulation (April 2016) ................................................................. 132
Figure 5.16 Contour percentile rank colours for each sand size .............................. 133
Figure 5.17 Sand pathways from offshore, depicted in percent-rank; (a) Fine sand,
(b) Medium sand, (c) Coarse sand ................................................................ 136
Figure 5.18 Sand pathways from rivers, depicted in percent-rank; (a) Fine sand,
(b) Medium sand, (c) Coarse sand ................................................................ 137
xiii
Figure 5.19 Depositional patterns of sand from offshore on Darwin Harbour
beaches, depicted in percent-rank; (a) Fine sand, (b) Medium sand, (c)
Coarse sand. Only part of the depositional pattern is shown to emphasise
the nearshore results...................................................................................... 139
Figure 5.20 River sand depositional patterns on Darwin Harbour beaches,
depicted in percent-rank; (a) Fine sand, (b) Medium sand, (c) Coarse sand.
Only part of the depositional pattern is shown to emphasise the nearshore
results ............................................................................................................ 140
Figure 5.21 Depositional patterns of sand from offshore at Fannie Bay, depicted in
percent-rank; (a) Fine sand, (b) Medium sand, (c) Coarse sand ................... 142
Figure 5.22 Depositional patterns of sand from the rivers at Fannie Bay, depicted
in percent-rank; (a) Fine sand, (b) Medium sand, (c) Coarse sand ............... 143
Figure 5.23 Offshore sand transported into Darwin Harbour in 12 months ............ 144
Figure 5.24 River sand transported into Darwin Harbour in 12 months .................. 145
Figure 5.25 Offshore to river sand ratio transported into Darwin Harbour in 12
months ........................................................................................................... 145
Figure 5.26 Offshore sand deposition ratio: modified to original model mesh; (a)
Fine sand, (b) Medium sand, (c) Coarse sand............................................... 148
Figure 5.27 River sand deposition ratio in Darwin Harbour: modified to original
model mesh; (a) Fine sand, (b) Medium sand, (c) Coarse sand.................... 149
Figure 5.28 Offshore sand deposition ratio in Fannie Bay: modified to original
model mesh; (a) Fine sand, (b) Medium sand, (c) Coarse sand.................... 151
Figure 5.29 River sand deposition ratio in Fannie Bay area: modified to original
model mesh; (a) Fine sand, (b) Medium sand, (c) Coarse sand....................153
Figure 6.1 Sand-sized sediment pathways in Darwin Harbour ................................ 163

xiv
List of Tables
Table 3.1 Climate statistics 1941 – 2016 recorded at Darwin Airport (Bureau of
Meteorology 2017) ..................................................................................... 40
Table 4.1 Mean grain size of the samples .................................................................. 59
Table 4.2 Sorting of the samples ................................................................................ 61
Table 4.3 Skewness of the samples ............................................................................ 63
Table 4.4 Kurtosis of the samples .............................................................................. 65
xv
Abbreviations and Acronyms
AHD Australian Height Datum
AIMS Australian Institute of Marine Science
ALS Australian Laboratory Services
Ba Barium
Ca Calcium
CaCO3 Calcium carbonate
CCNT Conservation Commission of the Northern Territory
Cd Cadmium
CRM Certified Reference Materials
Cs Caesium
DENR Department of Environment and Natural Resources
DHAC Darwin Harbour Advisory Committee
ECMU Environmental Chemistry and Microbiology Unit
Eu Europium
Gd Gadolinium
GIS Geographic Information Systems
HCl Hydrochloric acid
HClO4 Perchloric acid
HF Hydrofluoric acid
Hf Hafnium
HFSE High Field Strength Element
HNO3 Nitric acid
Ho Holmium
H-REE Heavy Rare Earth Element
ICP-MS Inductively Coupled Plasma-Mass Spectrometer
IMOS Integrated Marine Observing System
INAA Instrumental Neutron Activation Analysis
K Potassium (Kalium)
La Lanthanum
LIDAR Light Detection and Ranging
LILE Large Ion Lithophile Elements
L-REE Light Rare Earth Element
Lu Lutetium
MDS Multi-Dimensional Scaling
Mg Magnesium
Mn Manganese
M-REE Medium Rare Earth Element
Na Sodium (Natrium)
Nb Niobium
Nd Neodymium
NRETAS Department of Natural Resources, Environment, the Arts and Sport
NTCAC Northern Territory Catchment Advisory Committee
xvi
NT EPA Northern Territory Environment Protection Authority
Pb Lead
PCoA Principal Coordination Analysis
QGIS Quantum Geographic Information Systems
Rb Rubidium
REE Rare Earth Elements
RMA Resource Modelling Associates, Resource Management Associates
Sn Tin (Stannum)
Sr Strontium
Ta Tantalum
Tb Terbium
Th Thorium
Ti Titanium
USACE US Army Corps of Engineers
W Tungsten (Wolfram)
WRL Water Research Laboratory
Y Yttrium
Yb Ytterbium
Zr Zirconium
1
Chapter 1 Introduction
1.1. Overview
1.1.1 Research context
The coastal zone, the area where the land meets the sea, is composed of different
complex environments shaped by coastal processes, coastal geology, variations in
coastline characteristics and coastal sediment budgets (Woodroffe 2003). The key
coastal processes are tides, waves, currents and winds that act upon and shape the
coastline, while coastal geology, geomorphology and soils determine the origin,
structure and characteristics of the sediments that make up the coastal region, from
the uplands and river catchments to the nearshore region.
Interactions between local coastal rocks, soils and coastal processes result in regional
variations in time of coastlines that might be short-term, seasonal, or long-term,
depending on local coastal characteristics. Cooper et al. (2001) suggested that to
assess the correlation between coastal processes and shoreline morphology and
dynamics, it is also necessary to identify the sediment budget components, namely
the sources that provide new sediment, the sinks where sediment is deposited, and
the transport pathways between the sources and the sink areas of the coastal system.
The constant movement of sediment in coastal areas delivers a fundamental
challenge to the prediction of coastal processes and behaviour. Sediment movement
shapes shorelines by erosion and accretion over a broad spatial range and influenced
by wide morphological and environmental variation, which can take place in a few
hours, due to storms or floods, or in months or years, because of waves and the
action of currents, and even over decades and beyond, because of climate change and
natural or human influences (Reeve, Chadwick & Fleming 2004). Non-cohesive
sediments (sand) influence beach shape and orientation, thereby playing a significant
role in coastal morphodynamics (Pethick 1984; Bird 2000; Woodroffe 2003). The
availability of sand and local oceanography determine the sensitivity of the beach to
erosion and accretion.
Coastal erosion, which indicates an imbalance in the sediment supply and removal in
the area, is controlled by the interaction of local hydrodynamics and the coastal
morphology. Conventionally, coastal erosion is managed locally using hard
2
engineering approaches such as building sea walls and groynes at the affected areas.
This approach does not guarantee good outcomes, often creating new coastal hazards
such as property damage, accelerated down-drift erosion and environmental damage
(European Commission 2004; Govaerts & Lauwaert 2009). These consequences
often stem from engineering decisions that only consider the immediately affected
area, underestimating the natural processes that are occurring in the wider coastal
zone and the related environmental impacts. Conforming to the sustainable
management of coastal environments, the global trend for coastal erosion
management is currently based on the general principle of “working with nature”.
This principle combines ‘hard’ and ‘soft’ engineering measures such as beach
nourishment and sand dune management based on the local conditions, through
understanding the type of coastline, the coastal processes and the natural
environment (Salman, Lombardo & Doody 2004a; Waterman 2007). Understanding
the key processes of coastal dynamics and how the coast functions, both spatially and
temporally, is essential for managing coastal erosion.
Coastal processes and sediment budget studies are ideally obtained from sediment
dynamics studies in a well specified and confined coastal area called a
sediment/littoral cell where sedimentation, sediment sources, and the transport paths
and sinks are identified (Salman, Lombardo & Doody 2004b; Cooper & Pontee
2006; Gelfenbaum & Kaminsky 2010; Anfuso, Pranzini & Vitale 2011; Cope &
Wilkinson 2014). The boundaries of a sediment cell can be marked by several
features such as headlands, submarine canyons, or river mouths within which the
sediment budget is balanced, providing the framework for the quantitative analysis of
coastal erosion and accretion (Woodroffe 2003; Berman 2011). Apart from the
problems in defining the coastal sediment cell boundaries, sediment budget studies
also face inherent uncertainties due to limited data availability and the often complex
natural morphology of the coastline, where there are numerous possible sediment
sources and sinks. Nonetheless, a sediment dynamics study is critical in providing
tools for coastal erosion management.
1.1.2 The study area
Darwin Harbour, a drowned river valley system (Michie 1987b; Woodroffe &
Bardsley 1987), is located in the wet and dry tropics of northern Australia. It
3
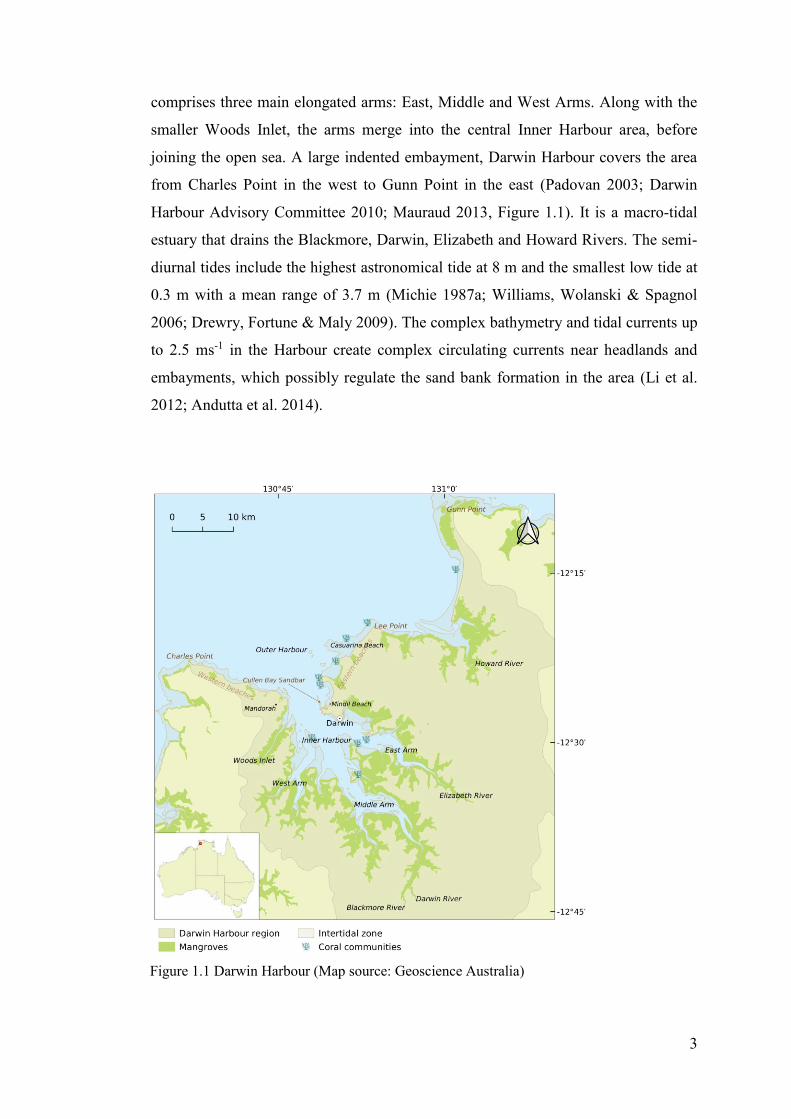
comprises three main elongated arms: East, Middle and West Arms. Along with the
smaller Woods Inlet, the arms merge into the central Inner Harbour area, before
joining the open sea. A large indented embayment, Darwin Harbour covers the area
from Charles Point in the west to Gunn Point in the east (Padovan 2003; Darwin
Harbour Advisory Committee 2010; Mauraud 2013, Figure 1.1). It is a macro-tidal
estuary that drains the Blackmore, Darwin, Elizabeth and Howard Rivers. The semi-
diurnal tides include the highest astronomical tide at 8 m and the smallest low tide at
0.3 m with a mean range of 3.7 m (Michie 1987a; Williams, Wolanski & Spagnol
2006; Drewry, Fortune & Maly 2009). The complex bathymetry and tidal currents up
to 2.5 ms-1 in the Harbour create complex circulating currents near headlands and
embayments, which possibly regulate the sand bank formation in the area (Li et al.
2012; Andutta et al. 2014).
Figure 1.1 Darwin Harbour (Map source: Geoscience Australia)
4
The western part of Darwin Harbour consists of mainly rocky shore platforms
interspersed by sandy pocket beaches. The eastern part of Darwin Harbour comprises
long stretches of sandy beach and less extensive rock platforms. The beaches are
backed by rocky cliffs or sand dunes and sand ridges built by storm surges. The
coastal cliffs are deeply weathered with parts being lateritised (Nott 1994, 2003) and
in parts are eroding (Gray 1999; Jones, Baban & Pathirana 2008). Coral communities
can be found in the nearshore of the eastern beaches and the Inner Harbour
(Wolstenholme, Dinesen & Alderslade 1997; Smit 2003). Mangrove forests and salt
flats border the intertidal areas and subtidal mud flats and terrestrial environments of
the Inner Harbour and to a lesser extent the western and the eastern beach areas
(Brocklehurst & Edmeades 1996; McGuinness 2003).
The sediment of Darwin Harbour is spatially distributed according to the tidal
currents and the bathymetry (Michie 1987b; Fortune 2006; Williams 2009). The
main channel floor within the Harbour and its arms are composed of coarse sand and
gravel. These arms are fringed successively by fine sand and extensive intertidal and
subtidal mud flats in the more sheltered parts of the Harbour (Padovan 2003; Skinner
et al. 2009).
Darwin Harbour is viewed as one of the world’s most undisturbed marine and
estuarine ecosystems (Working Group to the Darwin Harbour Advisory Committee
2003). It has a high number of tropical marine biota and is socially and culturally
significant to the local community. Being located adjacent to the fast-growing
Darwin City, there is currently a significant amount of research interest in Darwin
Harbour, focused on ensuring the maintenance of its conservation values and near-
pristine coastal and marine environments. Hence, any coastal development in the
region needs to be supported by a thorough understanding of estuarine processes.
Coastal sediment studies are best conducted with the aid of sediment/littoral cells.
Considering that there are no defined sediment cells in Darwin Harbour, this study
will be carried out within certain noticeable coastal features in the area. Therefore,
two prominent headlands of the Harbour, namely Charles Point in the west and Lee
Point in the east, are selected as the boundaries of the study area (Figure 1.1).
5
1.1.3 Problem statement
Like other areas in the world, such as Miami Beach in the USA, beaches in the
Mediterranean and Gold Coast in Australia, coastal problems encountered in Darwin
Harbour arise from mixed uses of the area and conflicting concerns among the
stakeholders, ranging from the concerned citizens, academics, government and
business institutions (Kraatz 1992; Blair 2003; Dean 2003; Brewer 2014). Previous
coastal erosion studies mainly focused on the eastern part of the Harbour. Studies
since the1970s reported that the erosion problems occurring in Darwin Harbour
beaches were mostly related to the mismanagement of the beach – dune system due
to human interference (Wilkinson 1974, 1976; Coaldrake 1976; Brown 1986; Kraatz
& Letts 1990). Subsequent studies documented coastal cliff erosion rates averaging
30 cm y-1 (Jones, Baban & Pathirana 2008), while the sandy beaches experience
seasonal changes during both climatic and oceanographic events (Comley 1996;
Goad 2001; Gray 2004). Visual observations at several sites and previous studies
indicate that the dunes backing both the eastern and western beaches have
experienced substantial erosion in recent decades. Sand bars are permanent features
in the Harbour. The Cullen Bay sandbar, considered as one of the iconic destinations
by the locals, was reported as being stable with slight reduction of total volume five
years after being dredged for the Cullen Bay Marina development project and
underwent incidences of cyclones passing near Darwin (Conservation Commission
of the Northern Territory 1993; Kinhill Engineers 1999).
Sand dynamic studies have been carried out in relatively small areas in the Harbour
for specific purposes, such as shipping channels development work (Williams 2009;
Williams & Patterson 2014; Young 2017). Despite long term beach erosion, no study
of sand dynamics, incorporating coastal processes, has been carried out for the entire
Darwin Harbour. This study is an attempt to fill this gap and aims to contribute to
understanding the role of coastal processes occurring in the area, i.e. to infer the
sources of sand and its pathways in the Harbour, and thereby assist the coastal and
shoreline management of Darwin Harbour.
6
1.1.4 Research questions
Considering the broad issues of sediment dynamics in Darwin Harbour and within
the broader programme aims, the research will address the following specific
research questions:
1. What are the characteristics and origin of sand in Darwin Harbour?
2. What are the principal transport pathways of sand within Darwin Harbour?
3. How can this sand dynamics study assist with coastal erosion management in
Darwin Harbour?
By answering these questions, this research aims to improve the understanding of
sand dynamics in a tropical, macro-tidal environment.
1.2 Summary of methods
This research adopts a multi-disciplinary approach, combining numerical modelling
and geochemical methods. The numerical modelling is a simplification of physical
processes influencing sand behaviour in the study area, while the sand geochemistry
infers/indicates both physical and chemical processes occurring on sand from the
sources to the depositional area. A 2-D depth-averaged hydrodynamic (RMA-2) and
a sand transport modelling (RMA-11) software package from Resource Modelling
Associates (King 2013, 2015) was used to simulate the hydrodynamics of the study
area and to infer the sources and sinks of sand in Darwin Harbour. A 2D modelling
approach is valid for Darwin Harbour hydrodynamic simulation as numerous surveys
of tidal currents profiling by the Australian Institute of Marine Science (AIMS)
showed that the vertical profile of currents are of similar magnitude and direction as
the tidal cycle with no evidence of current shear zones. The sand transport method
used in the modelling simulation was intended to infer qualitative and conceptual
sand transport pathways in the Harbour. The geochemical analysis was used to
complement the simulation results, to determine the sources and sinks of sand
independently of the modelling. This study is an attempt to test whether geochemical
analysis can be used to verify the numerical modelling results.
7
1.3 Organisation of the thesis
Chapter 2 reviews the literature regarding the significance of sand dynamic studies in
coastal management. It provides discussion of the importance in understanding sand
characteristics and behaviour in relation to coastal processes and coastal morphology,
thereby assisting coastal management decision makers.
Chapter 3 presents a description of Darwin Harbour and its catchment, including
environmental and socio-economic issues, climate, topography, geology, soils and
oceanography.
Chapter 4 presents an analysis that permits inferences about the sources of sand in
Darwin Harbour based on the sand particle properties and their geochemical
characteristics. The results are discussed to address research questions 1 and 2.
Chapter 5 provides the sand transport simulations based on several modelling
scenarios to infer the sand transport pathways in Darwin Harbour. The results are
discussed to address research question 2.
Chapter 6 synthesizes the study results discussed in Chapter 4 and 5. This chapter is
intended to address research question 3, summarises the conclusions of the study and
provides recommendations for future research.
8
Chapter 2 The international significance of studies of sand for coastal management
This chapter provides the context for the research questions within the framework of
coastal management. The discussion is mainly aimed at current understanding of the
importance of studies of sand in relation to coastal processes and coastal
geomorphology to assist in coastal erosion management.
Studies of sand comprise many aspects, covering the geological setting of the sand
source, weathering and diagenesis during transport, and the shape and mineralogy of
the sand, some of which are beyond the scope of this study. The discussion in this
chapter will focus on the sand characteristics, its provenance, the transport pathways
and the processes of sand transport that are included in this study. Sediment sources
and sinks can be inferred by linking numerical modelling and geochemical analysis
of the sediment. A multi-disciplinary approach in a tropical, macro-tidal embayment
environment will contribute to the study of the dynamics of sand-sized sediments in
coastal areas.
2.1 The significance of studies of sand for coastal management
Understanding sediment movement in coastal environments is essential to assist with
coastal management. Historically, coastal management has been synonymous with
coastal engineering (Kamphuis 2000) and was understood as efforts and techniques
to provide protection of transportation facilities in the coastal area and defence
against coastal hazards such as flooding and coastal erosion leading to loss of lands
with high economic and ecological value.
From a conventional engineering point of view, coastal management is narrowly
defined as being mainly concerned with coastal defence, which includes 'hard' and
'soft' engineering construction and planning approaches. Hard engineering
construction, such as breakwaters and seawalls, are built to reduce wave energy from
eroding shorelines, whereas soft engineering approaches tend to lower the erosion
rate by softening the land-water boundary (Nicholls et al. 2007; Waterman 2007; De
Vriend & Van Koningsveld 2012). Breakwaters are designed to reduce wave energy
in nearshore waters and thereby decrease shoreline erosion, while seawalls are built
9
to deflect wave energy from eroding the shoreline. Soft engineering approaches such
as artificial reefs, saltmarsh restoration, dune regeneration and beach nourishment
use ecological principles and practices to reduce erosion by using vegetation and
other materials to soften the land-water interface, thereby improving ecological
characteristics while maintaining engineering principles and goals (Roberts 2006;
Saleh & Weinstein 2016; Stark et al. 2016; Vuik et al. 2016).
In the past decades, coastal management has evolved to cover a wider range of
environmental and social-economic aspects, with the movement of sediment
regarded as one of the most important factors to consider for management decisions
due to its significant role in coastal morphodynamics (Kamphuis 2000; Kay & Alder
2005; Harvey & Caton 2010). Coastal sediment movement is part of complex
processes influenced by sea hydrodynamics, the impact of human activities along the
coast and in river catchments and offshore, covering a range of spatial and temporal
scales (Salman, Lombardo & Doody 2004b; Thom & Lazarow 2006).
Sandy beaches are particularly susceptible to erosion because the sediment is
constantly moved around by waves, currents and wind. Being a relatively narrow
strip of land along the coast, the beach is a fragile environment, with the most
dynamic, sensitive and delicately balanced mechanisms among other coastal types of
morphology (Pethick 1984; Bird 1996; Woodroffe 2003). Based on data from 127
countries, Bird (2000) stated that more than 70% of sandy coastlines worldwide were
eroding due to natural and human-induced activities. A more recent study based on
satellite images from 1984 to 2016 indicated that 24% of the world’s sandy beaches
are eroding at a rate higher than 0.5m year-1 (Luijendijk et al. 2018). Widely
predicted sea level rise, to which Darwin Harbour is susceptible, may increase
coastal erosion in the future (Zhang, Douglas & Leatherman 2004; Smith 2010;
Lopes et al. 2011; Toimil et al. 2017).
Diverse measures designed to deal with coastal erosion have had various degrees of
success. This mostly stems from the lack of understanding of coastal dynamics.
Coastal erosion is a natural phenomenon. In fact, coastlines change continually,
controlled by the interaction of local hydrodynamics and morphology (Niesing 2005;
Adamo et al. 2014), hence understanding the dynamic nature of the shoreline is the
key factor to deal with erosion. Coastal change is a longstanding problem that
10
mankind has had to deal with to provide safety from flooding and to protect human
settlements, transportation and infrastructure.
A more sustainable approach to manage coastal erosion is to identify the ability of
each affected area to withstand the physical processes as well as the predicted hazard
risk (European Commission 2004; Marchand et al. 2011; Sánchez-Arcilla, Jiménez
& Marchand 2011; Western Australian Planning Commission 2014, 2017; NCCARF
2016). The hazard risk and adaptation planning are often implemented in coastal
setback regulations to define a buffer area behind the shoreline to provide natural
coastal resilience against coastal hazards and to avoid possible damage to coastal
infrastructure (Sanò, Marchand & Lescinski 2010; Short & Jackson 2013).
Essentially, including a setback line in coastal management is a trade-off between
human safety, environmental protection and public use, and accommodating short
term and long term coastal hazard risks (Sanò et al. 2011; Harper 2013; Western
Australian Planning Commission 2013). Although this approach might result in a
short-term economic drawback, in general it will gain more positive advantages for
the entire coastal area. Therefore, understanding the key processes of coastal
dynamics and how the coast functions, on both spatial and temporal scales, is
essential for coastal erosion management (Kamphuis 2000; Salman, Lombardo &
Doody 2004b; Thom 2014).
2.1.1 Understanding sand dynamics in coastal processes
The coastal zone is composed of different complex environments shaped by coastal
processes, coastal geology, variations in coastline characteristics, and coastal
sediment (Pethick 1984; Bird 2000; Woodroffe 2003). Cohesive sediments (mud and
silt) play an important role in transporting water borne pollutants, whereas non-
cohesive sediments (sand, pebbles and boulders) influence beach shape and
orientation. Coastal processes relate to the physical processes of tides, waves,
currents and winds that act upon the sediment and shape the coastline, thereby
playing a significant role in coastal morphodynamics (Bird 2000; Reeve, Chadwick
& Fleming 2004; Davidson-Arnott 2010). Interactions between local coastal geology
and coastal processes will result in regional variations of coastlines that might be
short-term, seasonal, or long-term, depending on local characteristics.
11
Approximately 40 % of the world’s coastline consists of beaches containing sand and
gravel (Bird 2000) and 31% of the ice-free shoreline worldwide is sandy (Luijendijk
et al. 2018). Coastal sand-sized sediments can be of terrestrial origin delivered to the
coast by rivers, eroded from coastal landforms, or marine sediment that has been
reworked from offshore sources onto the coast.
There is a close linkage between the morphology of the nearshore and the beach face
up to the dune in a coastal zone (Aagaard et al. 2004; Masselink et al. 2008;
Anthony, Mrani-Alaoui & Héquette 2010). Under most natural conditions, sandbars
are commonly found in the nearshore zone, where there is sand available with
sufficient currents inducing bedload movements (Davis 1978; Bastos, Paphitis &
Collins 2007; Levoy et al. 2013). The sand accumulation is generally generated by
reversal in sand transport direction which creates bedload convergence and/or
decrease of bed shear stress (Besio et al. 2008; Van der Veen & Hulscher 2009). The
incidence of sandbars is reduced when there is a steep bed slope/gradient,
diminishing supply of sand and/or when currents are not strong enough, thus
incapable of inducing bedload movement.
Due to the variability of sediment supply and local hydrodynamics, most beaches
show changes both in plan and profile, rapidly over periods of a few hours or days,
or slowly over several decades or centuries. Physical weathering of sand (and gravel)
particles may smoothen grains and reduce the sediment volume due to rounding and
attrition processes. Aeolian processes can blow dry beach sand inland to form sand
dunes, while wave and tidal action can move it into an inlet or drift it alongshore or
offshore (De Vriend 2003; De Swart & Zimmerman 2009; Alsina et al. 2012).
Coastal dunes provide exceptional functions ranging from forming a physical barrier
to protect the landward area from extreme coastal events, providing sand to replenish
beach sand to providing ecological functions such as nesting sites for sea turtles and
birds and assisting fresh water retention (Borsje et al. 2011; Hanley et al. 2014; Nel
et al. 2014). As a part of the dynamic coastal zone, sand dunes undergo cycles of
erosion and accretion by wind and waves. Sand dunes develop when there is enough
supply of sand from a dry beach and the prevailing wind is strong enough to move
the sand landward (Shepard & Young 1961; Goldsmith 1978; Bird 1987). When the
wind reverses and blows offshore, sand in the dunes is transported back to the beach.
Stormy weather erodes more dune sand and high waves move the sand further
12
offshore to be deposited in the nearshore bars. These nearshore bars act as storage for
sand to be transported by calm period waves back to the beach. When left to a natural
cycle, a dynamic equilibrium profile will prevail (Kamphuis 2000; Komar 2011). An
example of (near) dynamic equilibrium was described for Le Touquet beaches
located in northern France – facing the English Channel. Despite the macrotidal
environment and regular winter storms, there was negligible shoreline retreat in 50
years due to limited human influence on the coastal system (Corbau, Tessier &
Chamley 1999; Battiau-Queney et al. 2003). On the other hand, beaches protected by
hard engineering construction such as seawalls often fail to recover well after storm
attacks. Seawalls are often constructed because the shoreline is retreating, however,
when the design overlooks the local coastal processes causing the erosion, the
problem might persist or even worsen (Griggs & Fulton-Bennett 1987; Lasagna et al.
2011; Van Rijn 2011; Irvine 2014). The affected beach might disappear altogether,
due to even a single extreme storm event, because the hard surface of the
construction reflects storm waves and displaces sediment seaward or in the drift
direction (Bernatchez et al. 2011; Sorensen et al. 2016). Furthermore, seawalls
prevent sediment exchange between beach and dunes, disrupting the natural sediment
dynamics in the area (Hill et al. 2004; Hanley et al. 2014).
Longshore drift occurs by wave, tide and wind induced currents (Komar 1976;
Sorensen 1978; Fredsøe & Deigaard 1994). Longshore currents accelerate around
headlands due to refraction and decelerate in bays, leading to erosion of erodible
headland materials and embayment deposition (Rosati, Walton & Bodge 2002;
Eversole & Fletcher 2003; Haas & Hanes 2004; Van Rijn 2005). Interactions of
longshore and on-shore currents generate a variety of coastal landforms. Wave
induced currents influence the formation of longshore sandbars, while the tidal range
and currents affect the formation of deltas, sand ridges, tidal flats and salt marshes
(Boothroyd 1978; Besio, Blondeaux & Vittori 2006; Masselink et al. 2008). The
interaction and adjustment of shorelines and sediment movement due to
hydrodynamic processes of the sea determine coastal morphodynamics, the study of
which provides the framework to study/understand the processes occurring in the
area.
13
2.1.2 A Multi-disciplinary approach for coastal erosion management
Coastal management is essentially the management of conflicts between the different
kinds of utilisations of the coastal area (Kamphuis 2000; Kay & Alder 2005; Harvey
& Caton 2010). With 60% of world population living within 50 km of a coastline
(UNEP 2006), coastal areas suffer increasing pressures to provide sufficient services
for much needed infrastructure and livelihoods. Inappropriate coastal protection and
planning of structures, and development of settlements and infrastructure in the dune
areas are typical reasons for coastal erosion.
Hard engineering construction can influence sediment transport, reduce the ability of
the shoreline to respond to natural forcing factors, and separate the natural coastal
compartments. This may result in loss of habitats, disrupting species distribution and
invasion of non-indigenous species (Lercari & Defeo 2003; Airoldi et al. 2005;
Glasby et al. 2007; Lasagna et al. 2011). Sandy beaches, sandbars and dunes provide
habitat and biological environments that can increase the ability of the coastal area to
abate coastal erosion and flooding (Waterman 2007; Koch et al. 2009; Hanley et al.
2014). Certain coastal flora and fauna play an important role as bio-engineers to
stabilise the seabed and beach surface (Dafforn et al. 2015; Waltham 2016), while
bio-geomorphological interactions influence ripple height, critical bed shear stress
and grain size distribution of sand-wave formation and stabilisation (Besio,
Blondeaux & Frisina 2003; Hulscher 1996). Some plants provide protection from
coastal flooding and stabilise the sand dunes (King & Lester 1995; Williams &
Feagin 2010; Rupprecht et al. 2017).
Hard engineering structures, such as wharves and jetties to load and unload cargo
and passengers or concrete breakwaters and groynes to provide coastal protection,
provide major roles to support shipping and tourism. However, there are numerous
studies which argue that the application of engineering and technology by themselves
are not sufficient to provide sustainable coastal development (Lefeuvre & Bouchard
2002; Van Bohemen 2004; Pilkey et al. 2011). To design appropriate coastal
protection, it is imperative to consider the sediment processes in the larger coastal
system. The conventional coastal protection approaches in Europe showed that
extreme events often undermine and/or overtop constructions such as seawalls
(European Commission 2004). Furthermore, added to the costly investment, the
14
long-term trends of the impact, both locally and beyond, influence coastal protection
decades afterwards (Doody et al. 2004; Van Rijn 2011; Nordstrom 2014).
Since the end of the 1960s, due to the shortcomings of conventional engineering to
counter coastal erosion, many coastal scientists suggest a multi-disciplinary approach
in understanding coastal processes as the basis of coastal management (Komar 1976;
Kamphuis 2006; Nordstrom 2014). The recent concept of ‘working with nature’ is
being adopted world-wide in solving engineering problems, for example
implementing eco-engineering principles on hard engineering structures (Van
Bohemen 2004; Waterman 2007; De Vriend & Van Koningsveld 2012; Firth et al.
2014). This concept, together with multi-disciplinary approaches such as linking
geomorphology and engineering, was also implemented in coastal erosion
management in, for example, the United Kingdom and the Netherlands (Hooke 1999;
French & Burningham 2009; Stive et al. 2013). The eco-engineering concept
assumes that humans are integral parts of biophysical systems and any changes, both
directly and indirectly, will affect both parties (Millennium Ecosystem Assessment
2005).
Any decision made in coastal management should be based on a comprehensive
understanding of processes occurring in the area of concern, covering both physical
and non-physical factors, such as economic impact and socio-cultural factors
(Kamphuis 2000; Kay & Alder 2005; Harvey & Caton 2010). A particularly difficult
problem is that coastal sediment dynamics might overlap with administrative
jurisdictions, which can be poorly coordinated between and within several levels of
government, even among countries (Cicin-Sain & Belfiore 2005; Dovers 2006). To
overcome this problem the European Commission (2004) proposed the concept of
‘strategic sediment reservoirs’, i.e. the sediment sources for a certain coastal zone,
either in the coastal area itself and/or the hinterland, which might cross
administrative boundaries. These sources should be maintained, for example to
compensate sediment loss after extreme events, and/or in the long term for
sustainable management. A contribution from ecological engineering is also needed
to maintain sediment balance and mitigate coastal erosion, for example by increasing
the role of coastal biota in sediment trapping or wave attenuation (Latief & Hadi
2007; Bouma et al. 2009; Koch et al. 2009; Keijsers, De Groot & Riksen 2015). In
conclusion, besides a fundamental knowledge of coastal environments and a
15
multidisciplinary effort, the identification of the sources of coastal sediment is
equally important for coastal erosion management.
2.2 Sand-sized sediment characteristics
The source/origin and the history of sediment movement can often be deduced from
petrographic or geochemical properties/characteristics (Pell, Chivas & Williams
2001; Collins et al. 2017). Petrography deals with the textural and mineralogical
characteristics of rocks and sediments. The mineralogy and geochemistry of a
sediment sample indicates the composition of the parent rock material, and the
particle size characteristics reflect the environmental conditions impacting it.
Petrographical techniques are widely applied in various sedimentary environments
(Folk 1954, 1980). However, McLennan et al. (1993) argued that this approach is not
adequately applicable to fine-grained and very coarse-grained sediment provenance
studies and that geochemical approaches are better in identifying the compositional
variability in sediment mixture with varied grain sizes compared to petrographical
methods. Therefore, they suggested combining petrographic and geochemical
methods covering the major and trace elements content for sediment provenance
studies.
Sand, an unconsolidated and non-cohesive material, is defined as sediment with grain
diameters in the range of 0.063 to 2mm. It can be composed of rock fragments and
mineral grains and originates from the weathering of parent rock material or from
biogenic sources. There are various sources of beach sediments ranging from fluvial
sand, sand dunes, cliffs and rocky shores, offshore origin, or artificial nourishment.
Sand may be eroded from the beach due to wind and water forces or human
intervention such as sand mining (Bird 1996; Pilkey et al. 2011).
The particle size characteristics of sand, such as the grain size, degree of sorting,
skewness and kurtosis, can be used to infer the geomorphic setting and the sediment
transport mechanism (Folk 1980; Abuodha 2003; Cheetham et al. 2008; Blott & Pye
2012). It is commonly understood that due to selective sorting, finer sediment can be
transported further from sources compared to coarser sediment. However Folk
(1980) argued that the main factor influencing the grain size in a certain environment
is generally the available grain size of the parent material in the source area,
16
regardless of the strength of the transport medium. According to Folk (1980), it is
important to firstly identify the sources of sediment and then study the potential
pathways of the sediment from the sources to the depositional area. He further
pointed out that, if a coastline is comprised of a sedimentary environment composed
of fine-grained sand, then no matter how energetic the wave action imposed on the
beach, the beach sand will still be composed of fine sand. On the contrary, if the
coastline is composed of coarse grain outcrops that are easily weathered, the beach
will be composed of coarse sand even in an area of low energy.
Sorting, measured as the standard deviation from the mean, is the measure of the
degree of scatter by which the grain sizes differ. A well-sorted sediment sample
shows that it is composed of particles of nearly the same grain size, while a poorly
sorted sediment sample indicates that it is composed of a wide range of grain sizes.
Sorting is mostly affected by how the sand was transported to its present location: a
high velocity transport medium will result in poorly sorted sediment, while sediment
moved by wind is usually well sorted (Pettijohn 1954; Folk & Ward 1957; Folk
1980).
Skewness indicates the degree of asymmetry of the grain size distribution in
comparison with the normal distribution. Samples that are weighted towards the
coarse end-member are categorised as positively skewed (toward the negative phi
values) and the opposite is negatively skewed (toward the positive phi values).
Kurtosis shows the degree of grain sorting of the central population compared to the
two tails, i.e. showing a degree of ‘flat-toppedness’ which is greater or less than that
of the normal curve of statistical distribution (Westfall 2014). Leptokurtic is when
the peak of the curve is higher than the normal distribution; the opposite is
platykurtic. Kurtosis and skewness are important indicators of the bimodality of a
distribution and the sedimentary origin (Folk & Ward 1957). Non-normal
distributions shown by the skewness and kurtosis indicate that the sediment is
composed of two or more superimposed modal fractions. High skewness and kurtosis
values indicate that the sediment underwent high energy reworking in and/or
adjacent to the depositional area (Cadigan 1961). Extreme kurtosis values indicate
that the sediment experienced more sorting in the previous environment before being
deposited in the present environment.
17
2.3 Sand provenance
The word ‘provenance’, from the Latin word ‘provenire’, means ‘to come from’ or
‘to originate’ (Weltje & von Eynatten 2004). With regard to sediment, the term
provenance refers to a tool/method to trace sediment sources in earth and ocean
sciences (Owens et al. 2016). The term is applied more comprehensively in geology
and sedimentology, which is to interpret the history of sediment movement over
time, from the initial production of the sediment from parent rocks, the physiography
and climate of the area where the sediment originates, including changes during
transportation, to diagenesis in the depositional areas. Identification of sediment
sources and pathways is important in coastal management, particularly when dealing
with sediment budgets and coastal compartment determination (Slaymaker 2003;
Denny et al. 2013; Carvalho & Woodroffe 2014; Thom 2015).
In general, coastal sediment is classified into four major categories according to its
origin: lithogenic, biogenic, hydrogenic and cosmogenic (Sverdrup, Johnson &
Fleming 1942; Trujillo & Thurman 2008). The lithogenic sediment is composed of
detrital material of terrestrial origin and glacial particles, while the biogenic
sediments originate from the hard skeletal structures of marine organisms that can be
calcareous or siliceous depending on the species. Marine sediments that are classified
as hydrogenic are the product of chemical precipitation occurring in sea water, for
example oolites, evaporites, phosphorites, manganese nodules and metal sulfides.
The occurrence of cosmogenic sediment in the marine environment is very rare. It is
usually found as microscopic spherules, i.e. small globular materials containing
silicate rock with extra-terrestrial signatures, and macroscopic meteor debris. Among
these four categories, lithogenic and biogenic sediments make up most of the
sediments found on the continental shelves and beaches. Many sedimentologists
suggest that the terrestrial sediments found in continental shelves are relict sediment
drowned in the last sea level rise following the Last Glacial period (Pethick 1984;
Bird 2000).
The primarily granitic composition of continental crust and basaltic composition of
oceanic crust weathers to form the mineral content in sand. Sediment originating
from the continental crust is classified as felsic sediment. It is enriched with
Potassium (K), Sodium (Na), Aluminium (Al) and Silica (Si) forming alkali feldspar
and quartz. Sediment originating from the oceanic crust is classified as mafic and
18
enriched in Magnesium (Mg) and Iron (Fe), forming minerals such as plagioclase
feldspar, pyroxene and olivine. Lithogenic sediment in the coastal zone is almost all
of continental origin.
Biogenic sand sources are composed, among others, of the exoskeletons or bone
fragments of sea creatures such as corals, foraminifera, clams, molluscs, red algae,
echinoids, sponges and bio-mineralising annelids such as Serpulidae, which are
made up of mostly carbonate material. Other than carbonate sand, sponges also
contain silicate spicules that may produce silicate biogenic sand. It should be noted
that not all carbonate sand is of biogenic origins. Another source may be lithic sand
composed of limestone rock fragments or ooid sand that formed by crystallisation of
calcite or aragonite in supersaturated warm, wave-agitated water (Siever 1988;
Trujillo & Thurman 2008).
A wide range of geochemical indicators has been used in sediment fingerprinting
analysis for determination of provenance. An ideal sediment tracer should be able to
distinguish the dominant sediment characteristics in the source areas, be chemically
immobile during transport, and be easily and reliably measured/identified
(Rosenbauer et al. 2013). Methods that are commonly used in estuarine and coastal
environments include mineral magnetic properties (Yu & Oldfield 1993; Jenkins,
Duck & Rowan 2005; Rotman et al. 2008), isotopic fingerprints such as Lead
(208Pb/207Pb), Neodymium (143Nd/144Nd) and Strontium (87Sr/86Sr) (Bertram &
Elderfield 1993; Rosenbauer et al. 2013; Rao et al. 2017), radiometric dating such as
radiocarbon, potassium-argon and uranium-lead dating (Cowell, Roy & Jones 1995;
White 2013) and other geochemical characteristics. In practice, a selection of
methods is usually applied to achieve the most suitable results.
Elements most frequently used to characterise provenance are high-field strength
elements (HFSEs) and large-ion lithophile elements (LILEs). HFSEs and LILEs are
trace elements that are categorised as incompatible elements. Trace elements are
elements that occur in very low concentrations in common rocks and tend to
concentrate in fewer minerals compared to major elements. LILEs are trace elements
with large ionic radii and have low charges while HFSEs are elements with high
electrical field strength due to their small ionic radius compared to their high cationic
charge. Both element groups are enriched in the earth crust, hence can be used to
characterise the rock source(s).
19
Some caution should be taken in using LILEs as provenance indicators because they
are more sensitive to weathering compared to HFSEs and therefore may not maintain
their signatures during transport. Among the HFSEs, rare earth elements (REEs) are
excellent provenance indicators due to their exceptionally consistent behaviour
during weathering and their stability when subjected to secondary processes such as
diagenesis, metamorphism and heavy mineral fractionation (Pease & Tchakerian
2003; Armstrong-Altrin 2009; Prego et al. 2012; Zhang et al. 2012; Kasper-Zubillaga
et al. 2013). While the total concentration might change during transportation, REEs
tend to retain certain properties as a group from source to sink (Haskin & Paster
1984; Taylor & McLennan 1985).
Determination of REE concentration often involves high cost because of the specific
laboratory methods required. Moreover, REE fractionation during weathering and
diagenesis requires extensive sampling and understanding of the whole sedimentary
provinces in the study area (Santos et al. 2007; Zhou et al. 2010; Fei et al. 2017).
Despite its limitations, REE fingerprinting is widely used to infer sediment sources,
and is often supported by other geochemical fingerprinting analyses. The
determination of REEs in marine sediment is very important for coastal sediment
studies since REEs contain the fingerprints/characteristics of their continental source
and transport pathways, imprinting the erosion and weathering history from source to
the depositional area (Piper 1974).
REEs have most affinity with clay minerals, therefore REE fingerprinting is more
commonly used to determine fine sediment provenance (Aagaard 1974; Araújo,
Corredeira & Gouveia 2007; Nagarajan et al. 2007). The application of REE for
sediment sourcing in coastal environments was generally used to identify placer
deposits for commercial heavy mineral mining (Mudd & Jowitt 2016; Naidu et al.
2016). However, since the general patterns of REE in fine and coarse sediments are
similar (Taylor & McLennan 1985; McLennan 2001), there are wide applications for
REE fingerprinting to describe a sedimentary environment, ranging from identifying
the transport pathways of sand in a desert to sand provenance study of river,
estuaries, beach and continental shelf sand.
Pease and Tchakerian (2002) used REE characteristics in combination with other
incompatible elements such as Th, Rb, Sr, Ba and Zr to distinguish the sand
characteristics and sources of the sand ramps and their transportation corridors in the
20
Mojave Desert, California. The REE fingerprinting method was also used to support
river sand provenance studies in the Ganga River (Singh 2009, 2010), Irrawaddy
River (Garzanti et al. 2016), and several rivers in western Uganda (Schneider et al.
2016).
Studies in determining sediment composition and provenance in marine
environments using REE fingerprints have been carried out worldwide. A study by
Rosenbauer et al. (2013) used REE patterns, 87Sr/86Sr and 143Nd/144Nd isotopes to
infer the provenance and transport pathways of beach sand as a part of an integrated
sediment analysis by the USGS, incorporating geochemical tracers, bedform
asymmetry and numerical modelling in the San Francisco Bay coastal system
(Barnard, et al. 2013). In less extensive studies, Prego (2012), Zhou et al. (2010) and
Zhang et al. (2012) used REE fingerprints to infer the sources of sediment in the
estuaries and continental shelf of the north Galicia, Spain and South China Sea
respectively. The studies by Armstrong-Altrin (2009) and Kasper-Zubilanga (2013)
on sand provenance in Mexican bays using REE fingerprints supported by
mineralogical characteristics to infer that the beach sand inherits its characteristics
from the adjacent sediment provinces. REE fingerprinting was also used as the
preferred method to describe the sediment characteristics in varied sediment
environments such as in Florida Bay (Caccia & Millero 2007), Admiralty Bay,
Antarctica (Santos et al. 2007), Bohai Bay, China (Zhang & Gao 2015), the Iberian
continental shelf (Araújo, Corredeira & Gouveia 2007), Cochin estuary and the Bay
of Bengal, India (Deepulal, Kumar & Sujatha 2012; Naidu et al. 2016), Trengganu,
Malaysia (Khadijeh et al. 2009; Antonina et al. 2013) and northern Australia
(Munksgaard, Lim & Parry 2003).
Other than REEs, carbonate mineral constituents such as calcite and aragonite,
supported by mineralogical identification can be used to distinguish whether a
sediment is of marine or of terrestrial origins (Siever 1988; Pilkey et al. 2011).
Carbonate minerals, together with biogenic sand identification, are particularly useful
to infer sand sources in warm climates (Kendall & Skipwith 1969; Al-Mikhlafi 2008;
Takesue, Bothner & Reynolds 2009; Ishikawa, Uda & San-nami 2015).
21
2.4 Sand transport
The movement of sediment is one of the most important issues in coastal
management (Kamphuis 2000; Van Rijn 2011). Coastal sediments are continuously
being eroded, transported and deposited by currents initiated by waves, tides and
winds, or by both currents and waves acting together. This will result in
morphological responses in the form of erosion and accretion. Additionally, sediment
transport drives the changes in the physical properties and consequently the chemical
and biological composition of the coastal zone, which could further influence the
wider biophysical functions and human uses of the area.
Coastal sediment movement is commonly divided into cross-shore and alongshore
sediment transport (Sorensen 1978; Fredsøe & Deigaard 1994; Soulsby 1997; Reeve,
Chadwick & Fleming 2004). Cross-shore sediment transport occurs when bed
sediments are suspended by breaking waves and turbulence, and are carried onto or
away from the beach. Under storm conditions, high waves with short periods result
in movement of beach sand offshore. On sandy beaches, the sand that is moved
offshore is often deposited seaward of the breaker line, forming nearshore sandbars
in the form of a ridge and runnel system. The formation of the sandbars beyond the
initial breaker line will cause waves to break further offshore from the beach, thereby
reducing the storm impact on the beach. The subsequent swell will gradually bring
sand back to the beach. Under natural conditions, the changes of shoreline can be
substantial due to these storm – calm cycles, but the long-term net changes may be
quite small. This condition is called dynamic equilibrium.
Longshore sediment transport occurs in littoral currents in the breaker zone, moving
parallel to the shore. It is usually generated by waves breaking at an angle to the
shoreline inducing longshore currents. The wave- and wind-induced longshore
currents have a typical mean value of 0.3ms-1 or less but can exceed 1ms-1 in stormy
conditions (Smith 2003). On sandy coasts, the combination of waves and currents
may move a considerable amount of sand along the coast.
The sediment transport direction (and transport rate) can be determined using direct
and indirect measurements. The transport direction can be determined using sediment
tracers, drifters or remote sensing techniques based on fixed monitoring devices such
as ARGUS (Alexander & Holman 2004; Turner, Aarninkhof & Holman 2006; Black
22
et al. 2007; Turner et al. 2011; Oliveira et al. 2017) or mobile devices such as side-
scan sonar/multi-beam echo sounder systems, and high-resolution earth observation
satellites and LIDAR (Anıl Ari et al. 2007; Sridhar et al. 2008; Klemas 2013; Liu et
al. 2013)
Sediment transport direction can also be inferred indirectly using sediment grain
characteristics and geomorphic approaches. Gao and Collins (1985) and Haslett et al.
(2000) used the characteristics of foraminifera as transport indicators in tidal as well
as wave-dominated environments. The grain size trend analysis (GSTA) method uses
mean grain size, sorting and skewness of bed sediment to infer the net sediment
transport pathways. Despite some critics, this method successfully depicted sand
transport pathways in many coastal studies (McLaren & Bowles 1985; Gao et al.
1994; Pedreros, Howa & Michel 1996; Van Lancker et al. 2004). Geomorphic
approaches such as bedform asymmetry were used to infer the net sediment transport
direction based on the understanding that the crest of bed ripples is orthogonal to the
principal ebb and flood current directions, while the asymmetrical shape is due to the
unequal ebb and flood current strength (Ryan et al. 2007; Barnard et al. 2013).
Surveys of sediment movement in coastal environments often encounter difficult
challenges due to the dynamic processes of the area and the cost related to the direct
measurement with spatial and temporal coverage. Therefore, many studies were
carried out indirectly based on analytical theories and engineering judgement using
empirical formulas and physical and numerical models (White 1998; Collins &
Balson 2007). Physical scale models can be constructed to represent as close as
possible the original/prototype conditions and can be used to study the processes
occurring in detail. Challenges in physical models include the scaling and costs
related to the development and maintenance of the laboratory.
With the development of computers and software, sediment transport studies
incorporate both physical and numerical modelling. However, contrary to physical
models, a problem/prototype must be clearly understood before the numerical model
is formulated (Kamphuis 2013). Coastal numerical models usually couple
hydrodynamic and transport models to represent the interactions of waves, water
levels, currents and the sediment characteristics in the form of mathematical
equations. Varied numerical modelling suites have been developed using 1-, 2- or 3-
dimensional model approaches, measuring suspended or bed load transport, based on
23
steady or non-steady flows (Papanicolaou et al. 2008; James et al. 2010). The
modelling is performed on a computational grid covering the study area, driven by
input parameters and specified conditions such as the boundary conditions and the
advective and/or diffusive processes (Winter 2007). Hydrodynamic models should be
sufficiently calibrated and validated prior to being coupled with models of sediment
transport to avoid uncertainties in the outcome (Davies et al. 2002).
Formulae used in the models should depend on the specific case and under specific
conditions of the area being studied (Schoonees & Theron 1995). Different formulae
are available in numerical modelling, which Camenen and Larraude (2003)
compared to a set of experimental or field data, hence, the results could lead to
different results for sediment movements. For example, Bijker (1971), Bailard (1981)
and Bailard and Inman (1981) compared their formulae with field data for littoral
drift, while Dibajnia and Watanabe (1992), Dibajnia (1995) and Ribberink and Al
Salem (1995) compared and fitted their formulae to experimental flume data. Van
Rijn compared a large variety of data, from laboratory studies to field data, using a
wide range of data from different grain sizes with assessment of interactions with
Shield parameters (Van Rijn 2005, 2007a, 2007b). The Van Rijn formulae originated
from research in rivers and were later adapted to coastal environments. More
recently, an alternative modelling paradigm using artificial neural network (ANN)
was introduced to infer longshore sediment transport (Papanicolaou et al. 2008; Ari
Güner, Yüksel & Özkan Ҫevik 2013).
One-dimensional (1D) models have mostly been developed to solve the differential
conservation equations of mass and momentum of flow, using finite-difference
schemes to model water elevation, bed elevation variation and sediment transport
load. Examples of 1D models are MIKE 11 and HEC-6. Two-dimensional (2D)
models can be laterally or vertically integrated and can simulate spatial variations on
water depth and bed elevations. These models are mostly based on the Navier-Stokes
equations with sediment balance using finite-difference, finite element or finite
volume methods. Some examples of 2-D models are TABS-2, UNIBEST, DELFT-
2D, MIKE-21, RMA-2 and TELEMAC 2D. Three-dimensional modelling is selected
when both the horizontal and vertical components of sediment processes are
considered and the stratification is evident, for example when dealing with the
modelling of flows near hydraulic structures for engineering applications. Three-
24
dimensional models are usually based on the Reynold average Navier-Stokes
(RANS) approach. Examples of 3-D models are DELFT-3D, RMA-10, MIKE 3,
CH3D-SED and TELEMAC 3D.
Amongst the available modelling software available, the RMA modelling suite was
used for hydrodynamic, sediment transport and water quality modelling in Darwin
Harbour since 1993 (Water Research Laboratory 2000). The RMA modelling suite is
a far-field model, therefore a model mesh with small element sizes is required when
it is intended to simulate an area in detail. Alternatively, a far-field model can be
coupled with a near-field model to get more comprehensive results (Ahmadian,
Falconer & Bockelmann-Evans 2012; Zhou, Pan & Falconer 2014).
The RMA modelling suite was initially developed in the early 1970s, with the
creation of the RMA-2 and RMA-4 models, under contract to the US Army Corps of
Engineers (USACE) (King n.d.). RMA-2, a two-dimensional, depth averaged, finite
element hydrodynamic numerical model was developed for the Walla Walla District
of the USACE (Norton & King 1977) and later used as the base for the San
Francisco Bay Delta model (Resource Management Associates 2005). RMA-2 can be
used to simulate the hydrodynamics of complex riverine environments such as bridge
crossings, estuaries, embayments, and other systems where the assumption of two-
dimensional flow regimes is valid (King 2013). RMA-2 computes a finite element
solution of the Reynolds form of the Navier-Stokes equations for turbulent flows.
Friction is calculated with Manning’s or Chezy’s equations, and eddy viscosity
coefficients are used to define turbulence characteristics.
Further development of RMA-2 was carried out by the University of California,
Davis, Resource Management Associates (RMA) and the Coastal and Hydraulics
Laboratory (CHL) of the Waterways Experiment Station (WES, now the Engineering
Research and Development Center – ERDC) under the name of TABS-MD (Donnel
et al. 2006). A three-dimensional hydrodynamic module: RMA-10, was later created
as a development from RMA-2 to accommodate vertical variations of parameter
values such as salinity and vertical acceleration (King n.d.).
Initially a simplified water quality model, RMA-4, was later developed to RMA-4Q,
incorporating SED-2D, a two-dimensional sediment transport module capable of
simulating cohesive and non-cohesive sediment including settling velocities and bed
25
evolution (Pankow 1988). The SED-2D module was previously known as STUDH
which was developed by the USACE in the 1990s (Thomas & McAnally, Jr. 1985)
based on a study by Ariathurai (1974). RMA-4Q was further developed to be RMA-
11 by adding fully 3D simulations using advection-diffusion settling capability.
Other than simulating water quality components, RMA-11 also has the capability to
simulate transport and erosion or deposition of cohesive or non-cohesive sediments
including tracking bed changes. It is fully compatible with the hydrodynamic
modules RMA-2 and RMA-10.
RMA models have been applied in various coastal, estuarine and riverine settings
worldwide such as in San Francisco Bay (Resource Management Associates 2005;
MacWilliams et al. 2016), Coffs Harbour, Shoalhaven River, Lake Macquarie, NSW,
Australia (Manly Hydraulics Laboratory 1995), Atchafalaya estuary, Mississippi
River, Louisiana USA (Mashriqui 2003), Keelung River estuary, Taiwan (Liu, Hsu
& Wang 2003), Wadden Sea, Germany (Albers & von Lieberman 2010) and Lake
Michigan watershed (Selegean et al. 2010). Non-cohesive sediment transport
modelling using RMA-11 was used in Port Songkhla, Thailand (Nielsen et al. 2001),
Gold Coast Seaway (Andrews & Nielsen 2001), and Darwin Harbour (Tonyes et al.
2015, 2017; Williams 2009). Examples of the application of cohesive sediment and
water quality modelling include Mary River, Northern Territory (Roizenblit, Wyllie
& King 1997), Daly River (Miloshis & Valentine 2011), Alqueva reservoir, Portugal
(Fontes 2010), Darwin Harbour (Fortune & Maly 2009; Valentine & Totterdell 2009;
Williams & Patterson 2014), Port of Hay Point, Queensland (GHD Pty. Ltd. 2005),
and in Moreton Bay, Australia (Bell & McEwan 2010).
2.5 Coastal erosion management in Darwin Harbour
Coastal management in Darwin Harbour falls within two areas of administrative
responsibility: The Northern Territory Government and Darwin City Council. Both
institutions commissioned the initial studies regarding erosion of Darwin beaches.
Early reports on coastal erosion of Darwin Harbour beaches appeared in the 1970s,
particularly for Mindil Beach and Casuarina Beach (Wilkinson 1974, 1976).
Although of a smaller scale, the beach erosion on the Cox Peninsula, particularly at
Mandorah, Wagait and Imaluk beaches in the western part of Darwin Harbour, was
26
also brought to public attention in the 1980s (Letts & Kraatz 1989). The erosion
problems were mostly related to the mismanagement of the beach – dune system due
to human interference, which in general was due to uncontrolled pedestrian and
vehicular access to the beach (Kraatz 1992). While erosion of Casuarina Beach was
identified to be primarily due to (dune) sand mining, Coaldrake (1976) stated that
Mindil Beach presented ‘virtually every type of mistake possible in foreshore
management’. Aerial photographs of Mindil Beach from 1944 to 1975 show that
beach erosion had started to develop since 1969, after a caravan park was constructed
3 years earlier on the foredune (Wilkinson 1976). Although advice was received to
relocate away from the dune, the caravan park was further developed in the early
1980s. The eroded area was protected by a rock revetment that was later extended
with geo-synthetic sand-filled bags. Beach and dune erosion on the northern part of
Mindil Beach was remedied by beach scraping and dune reconstruction.
Unfortunately, beach and dune erosion are still ongoing problems, encroaching on
the end of the rock revetment (Comley 1996).
A beach monitoring programme was initiated by the Conservation Commission of
the Northern Territory (CCNT) in 1989 to better understand sediment movement at
Mindil, Vesteys and Casuarina beaches. The study, which continued until 2001,
suggested that in general there was a net loss of sediment volume from Mindil and
Vesteys beaches, whereas Casuarina Beach experienced both decreases and increases
in different areas (Goad 2001; Gray 2004). Kraatz (1992) and Manly Hydraulics
Laboratory (2000) recommended that understanding of coastal dynamics and
sediment transport are important for more informed decision making for coastal
planning.
Darwin city is located only a few metres above sea level. The ongoing coastal
erosion, exacerbated by probable climate change impacts, such as sea level rise, more
intense cyclones and storm surges, particularly when occurring at high tide, could
potentially devastate the Darwin area. Mindil Beach and the neighbouring Vesteys
Beach would be at greater risk due to the high value properties that were built near
the high-water mark and on top of the foredune. Despite the potential impacts, there
have been no comprehensive studies of coastal processes of the whole Darwin
Harbour area. Furthermore, the studies conducted so far have not specifically

27
attempted to infer the sources and pathways of sand-sized sediment in Darwin
Harbour.
The review in this chapter demonstrates the need and approaches that can be used to
understand coastal processes as the basis for sustainable coastal planning and coastal
(erosion) management. The following chapters will discuss the physical
characteristics and the analysis of sediment sources and transport pathways in
Darwin Harbour.
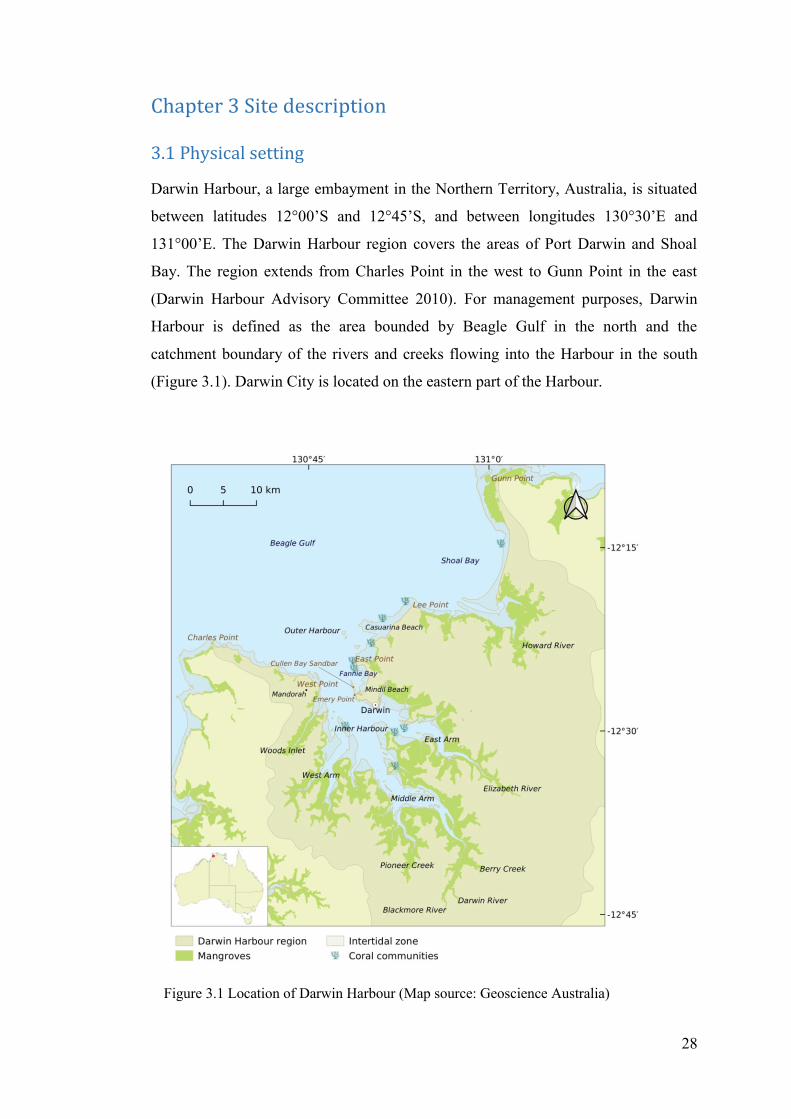
28
Chapter 3 Site description
3.1 Physical setting
Darwin Harbour, a large embayment in the Northern Territory, Australia, is situated
between latitudes 12°00’S and 12°45’S, and between longitudes 130°30’E and
131°00’E. The Darwin Harbour region covers the areas of Port Darwin and Shoal
Bay. The region extends from Charles Point in the west to Gunn Point in the east
(Darwin Harbour Advisory Committee 2010). For management purposes, Darwin
Harbour is defined as the area bounded by Beagle Gulf in the north and the
catchment boundary of the rivers and creeks flowing into the Harbour in the south
(Figure 3.1). Darwin City is located on the eastern part of the Harbour.
Figure 3.1 Location of Darwin Harbour (Map source: Geoscience Australia)
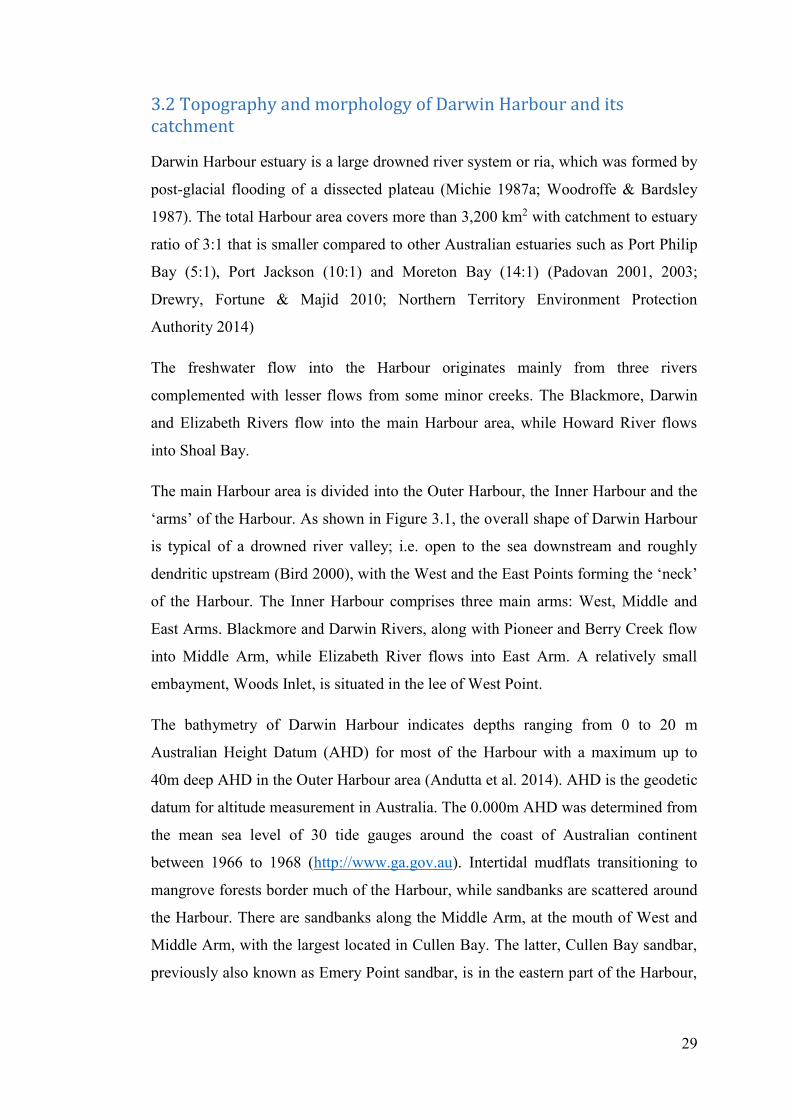
29
3.2 Topography and morphology of Darwin Harbour and its catchment
Darwin Harbour estuary is a large drowned river system or ria, which was formed by
post-glacial flooding of a dissected plateau (Michie 1987a; Woodroffe & Bardsley
1987). The total Harbour area covers more than 3,200 km2 with catchment to estuary
ratio of 3:1 that is smaller compared to other Australian estuaries such as Port Philip
Bay (5:1), Port Jackson (10:1) and Moreton Bay (14:1) (Padovan 2001, 2003;
Drewry, Fortune & Majid 2010; Northern Territory Environment Protection
Authority 2014)
The freshwater flow into the Harbour originates mainly from three rivers
complemented with lesser flows from some minor creeks. The Blackmore, Darwin
and Elizabeth Rivers flow into the main Harbour area, while Howard River flows
into Shoal Bay.
The main Harbour area is divided into the Outer Harbour, the Inner Harbour and the
‘arms’ of the Harbour. As shown in Figure 3.1, the overall shape of Darwin Harbour
is typical of a drowned river valley; i.e. open to the sea downstream and roughly
dendritic upstream (Bird 2000), with the West and the East Points forming the ‘neck’
of the Harbour. The Inner Harbour comprises three main arms: West, Middle and
East Arms. Blackmore and Darwin Rivers, along with Pioneer and Berry Creek flow
into Middle Arm, while Elizabeth River flows into East Arm. A relatively small
embayment, Woods Inlet, is situated in the lee of West Point.
The bathymetry of Darwin Harbour indicates depths ranging from 0 to 20 m
Australian Height Datum (AHD) for most of the Harbour with a maximum up to
40m deep AHD in the Outer Harbour area (Andutta et al. 2014). AHD is the geodetic
datum for altitude measurement in Australia. The 0.000m AHD was determined from
the mean sea level of 30 tide gauges around the coast of Australian continent
between 1966 to 1968 (http://www.ga.gov.au). Intertidal mudflats transitioning to
mangrove forests border much of the Harbour, while sandbanks are scattered around
the Harbour. There are sandbanks along the Middle Arm, at the mouth of West and
Middle Arm, with the largest located in Cullen Bay. The latter, Cullen Bay sandbar,
previously also known as Emery Point sandbar, is in the eastern part of the Harbour,
30
between Emery Point and East Point. The sandbar is a permanent feature in the
Harbour and has a significant influence on the local hydrodynamics (Byrne 1987).
The topography of Darwin Harbour catchment is of low relief with gently undulating
surfaces not higher than 140 m above sea level (Nott 1994). In the upstream area
most of the hillslopes are connected to the creeks through dambos some of which
contain chains of ponds (Nawaz 2010). Being a tide-dominated estuary, Darwin
Harbour’s extensive mudflats and sandbanks, which are regularly inundated at high
tide, provide a favourable environment for seabirds and shorebirds (Chatto 2003).
Darwin Harbour is characterized by a complex shoreline, dense mangrove forests,
rocky headlands, rivers and creeks and a relatively flat catchment. The western part
of Darwin Harbour comprises mainly rocky shores with a variety of rocky cliffs,
platforms, rock pools and boulder fields. The rocky shores are interspersed with
sandy pocket beaches, while the eastern part comprises longer stretches of sandy
beach, less extensive rock flats and distinct cheniers in the Shoal Bay area. The
beaches are backed by either sand dunes or coastal cliffs. The cliff heights reach
more than 30 m in the western beaches area. Mangrove forests, covering about
20,000 hectares, border the intertidal areas of Shoal Bay and the Inner Harbour, and
to a lesser extent the western and eastern beaches.
The landforms of Darwin Harbour and its catchment can be categorised in seven
different land units (Figure 3.2) in terms of geology, drainage and soil type (Pietsch
1983, 1986; Pietsch & Stuart-Smith 1988). The land units are:
1. Littoral complex: intertidal terrain composed of beach sand and shells. There
are also chenier ridges on the area facing the open shore. In the Inner Harbour
and the ‘arms’ areas, this complex contains mangrove forests that grow on
marine mud and clay. In places, bare supra-tidal flats comprising silt and
clay, occur on the landward side of the mangrove area.
2. Paludal estuarine plains: flat lying plains less than 3m above the high-tide
level, found mostly in the Shoal Bay area. They are poorly-drained with
seasonally flooded swamps and marshes of paperbarks and grass resistant to
brackish water, with sediment of organic silt and clay.
3. Plateaus: flat to undulating plains with gradual slopes located in the inland
regions from Cox Peninsula to Shoal Bay. They are underlain by horizontal
31
Cretaceous sediments with a predominantly loamy to sandy and gravelly soil
mantle. This unit contains widespread broad drainage channels, infilled with
colluvial sand, silt and clay deposited by sheetwash and alluvial processes.
4. Alluvial plains: deep sandy or silty sediments deposited on estuarine and
terrestrial sediments. This unit is distributed on flood plains where channels
are bounded by levees.
5. Dissected foothills and uplands: north-south trending ridges up to 140m
metres above sea level. This unit contains skeletal, gravelly soils and
redistributed and lateritic pisoliths, laying on Early Proterozoic to Tertiary
rocks.
6. Ephemeral and perennial lagoons and broad drainage channels: broad low-
lying areas located in the plateaus and dissected plains, fed by perennial and
ephemeral spring flow and rainfall runoff. They contain colluvial and alluvial
sand, silt and clay.
7. Undulating granitic and detrital lowlands: moderate to low relief in an
advanced stage of denudation. The soils are sandy, podsolic and in places
lateritic. The drainage pattern is commonly radial-dendritic with shallow and
wide drainage channels.
Figure 3.2 Land units in Darwin Harbour catchment area
(Haig and Townsend, 2003)
32
Semeniuk (1985) also distinguished seven geomorphic units in the embayment of
Darwin Harbour as follows:
1. Hinterland margin: 10 – 50 m wide margin, forming the junction of
hinterland and tidal flat and are inundated only on the highest tide. This unit
is subject to freshwater seepage and underlain by reworked colluvium or
muddy sand washed off the hinterland.
2. Alluvial fan: accumulations of alluvial sediment, fan to deltoid in shape, is
formed in high tidal environments where creek and streams debouch onto
tidal flats. The substrates are sandy/gravelly and mixed with mud, and are
subject to freshwater seepage.
3. Tidal flats: 100 m to more than 1 km units that have a gently sloped surface,
underlain by sand in low tidal levels and mud or muddy sand/sand in mid-
high tidal levels. Mud is the more common substrate in mid-high tidal levels,
but sand is common where tidal flats front a spit/chenier system.
4. Tidal creeks: erosional channels 3 – 100 m wide and approximately 2 – 10 m
deep that meander and bifurcate across tidal flats. These creeks may be
clogged with shoals.
5. Spit/cheniers: elongate, narrow (10 – 50 m wide) sand/gravel deposits that are
wave-developed features. Spits typically emanate from exposed to semi-
exposed headlands, while cheniers are detached from headlands.
6. Rocky shores: steeply inclined, fissured to boulder rocky shores that
generally of wave-exposed environments.
7. Subtidal channels and bays: permanently inundated environments that adjoin
the tidal zone units listed above. The units are underlain by rock, sand or mud
depending upon which tidal zone the unit is adjoining.
Cheniers in Darwin Harbour are commonly composed of poorly sorted, medium to
coarse sand and shell fragments (Woodroffe & Grime 1999)
A more recent study using acoustic multibeam backscatter data, supported by
underwater video, sediment samples analyses and bed shear stress modelling in
Darwin Harbour revealed that the Harbour comprises of complex and irregular
seabed covering channels, banks, ridges and plains (Siwabessy et al. 2018). The main
feature of the 178 km2 subtidal research area is the 40 m deep channel in the middle
33
of the Outer Harbour that splits into narrower and shallower channels of Wood Inlet,
West Arm, Middle Arm and East Arm. As much as 23% of the mapped area is
classified as hard seabed with varied mud and sand veneers. The channels are
bordered by plains of 3 – 5 m water depth which reach onto the intertidal area. The
banks and ridges rise to less than 3 m water depth shoals that typically have slope of
approximately 10°. This typical steep flank was found in outer Fannie Bay, west of
the harbour entrance channel and in between West and Middle Arms.
3.3 Geology and soils of Darwin Harbour and its catchment
The Darwin Harbour region lays on a Precambrian craton, overlain by Cretaceous
sedimentary rocks (Pietsch 1983; Nott 2003). Pietsch (1983) also noted that the post-
orogenic Proterozoic or Palaeozoic strata are not found in the Darwin Harbour
region, so that Nott (1994) inferred that there is a 2-billion-year gap of geological
history in the area. The city of Darwin lays on the Cretaceous strata, while the Early
Proterozoic unit (i.e. part of the Proterozoic that is older than 1800 m.y.), namely the
Burell Creek Formation, can be found in low lying areas as rubbly outcrops and at
the base of coastal cliffs such as Talc Head near Woods Inlet, and the cliffs landward
of Stokes Hill Wharf. The resistant arenaceous and conglomeratic units of this
formation are now exposed as small islands south of Quarantine Island (now East
Arm Wharf). The outcrops consist of reworked sands and gravels of shale, siltstone,
sandstone and metamorphic rocks.
The flat-lying Cretaceous sediments were originally classified as the Mullaman Beds
and later were reclassified as the Darwin Member. This unit is now considered as the
basal member of the Bathurst Island Formation of Early Cretaceous age. The Darwin
Member crops out as coastal cliffs, while in other places the unit is generally covered
by a layer of ferricrete/laterite. Pietsch (1983) described the Darwin Member as
comprising granule to cobble-sized, angular to rounded quartz and angular lithic
fragments in a matrix of sand, silt and clay in the forms of radiolarian claystone,
sandy claystone, clayey sandstone, quartz-sandstone, ferruginous sandstone,
glauconitic sandstone and basal conglomerate. Outcrops of this unit sometimes lie on
a bioturbated bed, which contains a disorderly array of belemnites and worm
burrows, interbedded with phosphorite nodules (Pietsch 1983; Nott 1994).
34
Palaeogene, Neogene and Quaternary sediments and soils of the Cainozoic Era
overlay the Cretaceous units as lateritic, marine and non-marine deposits (Pietsch
1983). The Palaeogene and Neogene sediments consist of soil and lateritic layers,
which can be further divided into four types, namely detrital, pisolitic, mottled-zone
and concretionary laterite. The Quaternary sediments cover mostly the coastal and
intertidal areas, and to a lesser extent the colluvial and alluvial units of the shallow
slopes and creek valleys respectively.
The marine deposits of the Quaternary period are divided into three categories:
1. Coastal alluvium
Coastal alluvium sediments consist of poorly-sorted quartz sand, shell,
limonite and lithic fragments that are deposited in the swash zone, while mud,
clay and silt can be found in the tidal flats. Shelly-marine mud is commonly
found in the mangrove swamps.
2. Beach rock
Beach rock in the Darwin Harbour region can be found on the upper beach
and under sand ridges/cheniers. It consists of tabular broken slabs of
conglomerate which comprises quartz sand, shells, coral fragments, limonite
pisolites, lithic fragments, and is bonded by calcareous cement.
3. Cheniers
Cheniers in Darwin Harbour are generally located within 2 km of the
coastline. They can be found as marine swash zone deposits along the
western and eastern beaches of Darwin Harbour, and consist of sand, shelly
sand and coral fragments.
The non-marine deposits of the Quaternary units are divided into four categories:
1. Black-soil plain
This is usually found in the transitional environment from the estuarine to the
paludal areas, which is often only inundated in the wet seasons. These
seasonally exposed flats consist of brown to dark grey, organic-rich, heavy
clay soils which dry out in the dry season.
35
2. Colluvium
Colluvium sediment in the form of sand, silt and clay that was deposited by
sheetwash, occurs in broad drainage areas that often contain no defined
drainage channels. This sediment also appears on gentle slopes in estuarine
and littoral areas.
3. Alluvium
This unit is found in the active drainage channels, and consists of rock
fragments, gravel, sand, silt and clay. It is also found on active floodplains.
4. Talus and scree
This unit consists of unconsolidated clay, quartz, sand and rock fragments
that have been deposited at the cliff bases at the western fringe of Woods
Inlet. The sediment is derived from lateritic Lower Cretaceous claystone and
sandstone.
3.4 Sediment characteristics in Darwin Harbour
The particle size distribution of sediments in Darwin Harbour is influenced by
several processes, such as tidal movements, bathymetry, sediment characteristics and
availability of different size classes. Coarser sediments are generally found in high
velocity areas while the finer sediments are deposited where the velocities are
relatively low. Therefore, silt and clay size sediments tend to be deposited in the
intertidal zones and the mangrove areas, resulting in extensive mudflats being
exposed at low tide.
Michie (1987a, 1987b) suggested that Darwin Harbour sediments are largely of
terrestrial origin with local biogenic carbonates originating from in-situ biogenic
sand sources and continental shelf. On the other hand, based on analysis of Pb and Cs
isotope ratios, rare earth elements (REE) and other metals such as Fe, As, Cd and Zn
in the <63μm fraction, the Ecosystem Research Group of the Darwin Harbour
Advisory Committee (2006) inferred that up to 60% of Darwin Harbour sediment
might be of offshore origin. As there was insufficient analysis of REE profiles of the
source materials, this study also noted that the results should be considered tentative
until further analysis is conducted. Darwin Harbour and the adjacent Beagle Gulf
36
were land during the Last Glacial Maximum (19 – 23 ka BP) (Radke et al. 2017),
therefore, the sediment in the area might be a mix of marine and terrestrial origin that
is now being reworked back into the Harbour.
With regards to sediment size distribution, Michie (1987b) reported that there are
four categories of sediment in Darwin Harbour. Firstly, terrigenous gravels that were
found in the scour zone of the Harbour’s main channel. Secondly, terrigenous sand
containing up to 50% carbonate was found in East Arm channel, the shallow area
west of the Harbour channel and Fannie Bay Beach. The sand was mainly composed
of quartz with a variable amount of molluscan shell grit and clay with accessory
mica. The next sediment type was calcareous sand and gravels with more than 50%
of biogenic carbonate fragments, which was mainly found adjacent to coral reefs at
East Point, Lee Point and Channel Island. This kind of sediment was also found at
the sand spit in Shoal Bay and Emery Point sandbar, where it was continuously being
reworked and transported further according to the tide currents. Lastly, mud and fine
sand was found in the intertidal and shallow subtidal environments of the small
creeks entering East Arm and Ludmilla Bay. There were no reports of sediment types
in Middle Arm, West Arm and Woods Inlet channels, as well as the western beaches
area and the adjacent submerged/offshore area.
Fortune (2006) reported that most submerged sediment in Darwin Harbour consists
of sand size particles and some gravel. This result was based on a survey of sediment
grain size distribution carried out by the then Northern Territory University in July
1993 (Parry & Munksgaard 1997). The sampling site covered a wider area compared
to that of Michie (1987b), covering Middle and West Arm, including Woods Inlet
and the offshore area off West Point. There is no information whether the sampling
area covered the sandy environment, such as the hinterland margin and alluvial fan
as described by Semeniuk (1985) that are inundated at high tide. The results of the
Fortune (2006) study revealed that on average, more than 90% of sediment in
Darwin Harbour is sand size or larger. Within this category, the proportion of gravel
(larger than 2mm diameter) size sediment varies from approximately 5% in Fannie
Bay to 35% in the Central Harbour area, i.e. part of the Harbour main channel. This
high gravel composition in the Central Harbour agrees with the findings of Michie
(1987b). With the highest gravel fraction of 35%, the sand fraction in the Central
Harbour is the lowest compared to the other areas, averaging 61% with an average of
37
4% fine sediment (smaller than 63μm diameter). The maximum sand fraction of
approximately 90% was found in the submerged area between East Point and Lee
Point. The highest proportion of fine sediment at approximately 13% is in the City
area, which covers the wharves area up to Sadgrove Creek. Added to the 13% of fine
sediment, the sand fraction in the City area was found to be on average 82%, leaving
5% of gravel, which also agrees with the results of Michie (1987b), who categorised
the sediment facies in the area as terrigenous sand and mud flats.
3.5 Climate of Darwin Harbour
Darwin Harbour’s climate is tropical wet-dry (Köppen: Aw) and monsoonal with a
distinct wet and dry season. The dry season runs from May to October, while the wet
season, which lasts from November to April, is associated with monsoonal rains and
tropical cyclones. Most of the rain (80%) falls between January and March, with a
monthly average of more than 300 mm. Consequently, the maximum discharge of
fresh water into the Harbour occurs within the first three months of the year. Only a
small amount of fresh water flow occurs in May and none or only minor amounts
from groundwater seepage from September until the start of the wet season (Michie
1987b). The mean annual rainfall recorded at Darwin Airport weather station
covering the period of 1941 to 2016 is approximately 1700 mm (Bureau of
Meteorology 2014).
The mean annual maximum temperature is approximately similar all year round at
around 32°C. The dry season experiences cooler temperatures that once reached a
minimum of 10.4°C in 1942 (Table 3.1). Conversely, Darwin Harbour experiences a
period of warm temperatures during the wet season, where the temperature can reach
up to 37°C, particularly during the ‘build-up’ between the months of October to
December (Figure 3.3, Table 3.1).
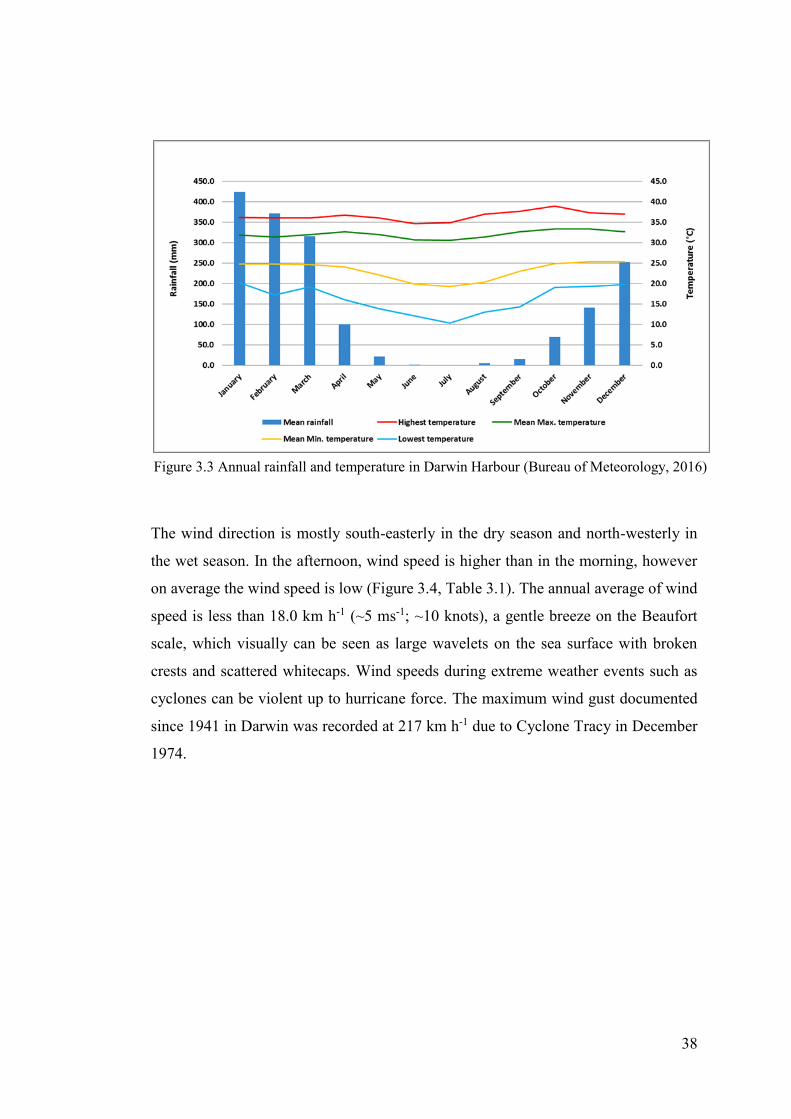
38
The wind direction is mostly south-easterly in the dry season and north-westerly in
the wet season. In the afternoon, wind speed is higher than in the morning, however
on average the wind speed is low (Figure 3.4, Table 3.1). The annual average of wind
speed is less than 18.0 km h-1 (~5 ms-1; ~10 knots), a gentle breeze on the Beaufort
scale, which visually can be seen as large wavelets on the sea surface with broken
crests and scattered whitecaps. Wind speeds during extreme weather events such as
cyclones can be violent up to hurricane force. The maximum wind gust documented
since 1941 in Darwin was recorded at 217 km h-1 due to Cyclone Tracy in December
1974.
Figure 3.3 Annual rainfall and temperature in Darwin Harbour (Bureau of Meteorology, 2016)
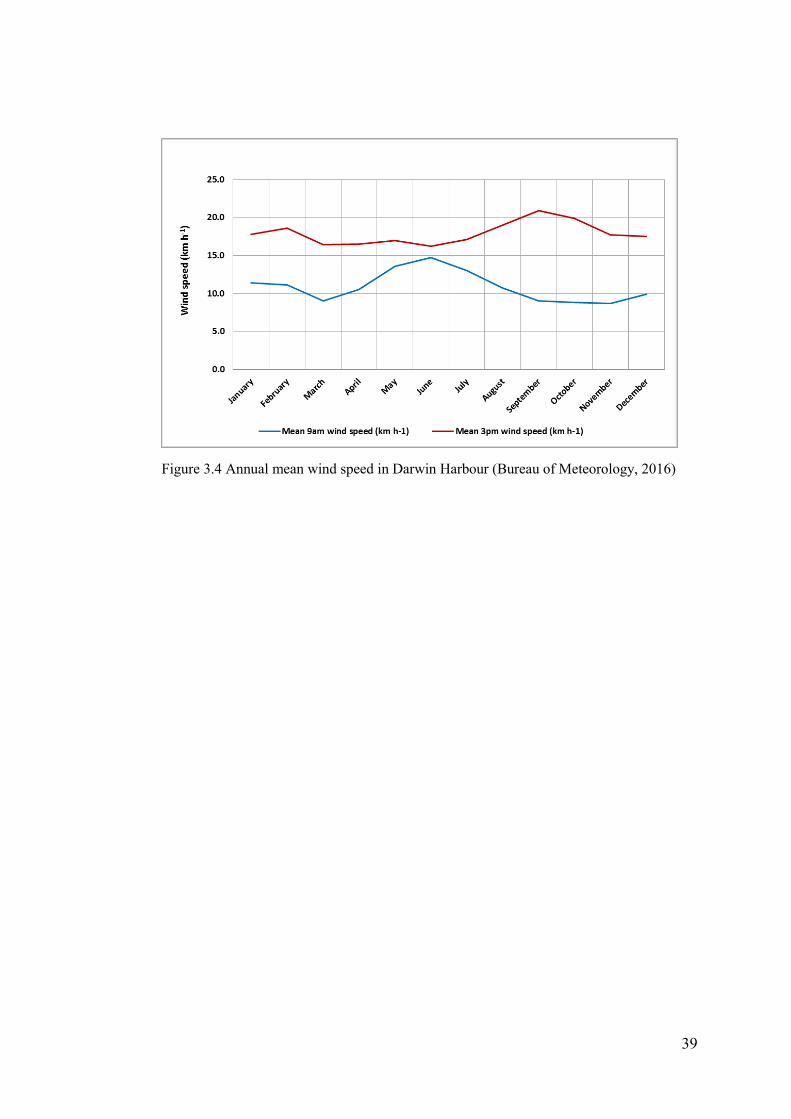
39
Figure 3.4 Annual mean wind speed in Darwin Harbour (Bureau of Meteorology, 2016)
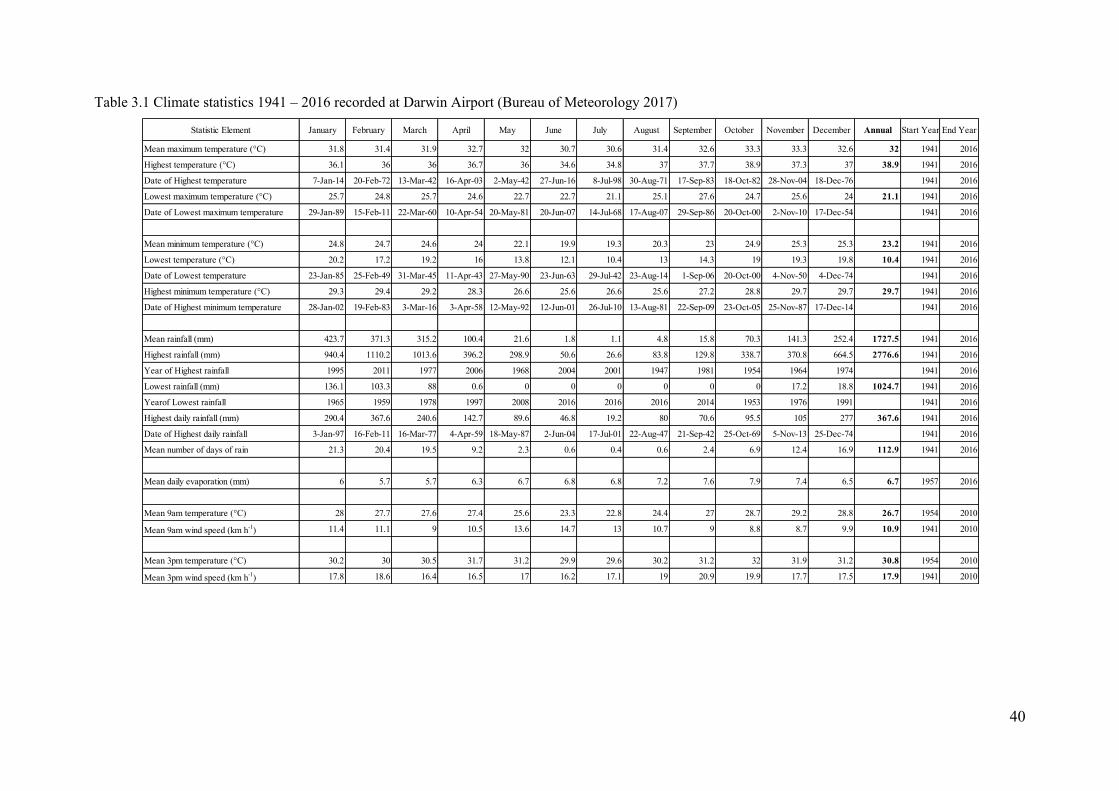
40
Table 3.1 Climate statistics 1941 – 2016 recorded at Darwin Airport (Bureau of Meteorology 2017)
Statistic Element January February March April May June July August September October November December Annual Start Year End Year
Mean maximum temperature (°C) 31.8 31.4 31.9 32.7 32 30.7 30.6 31.4 32.6 33.3 33.3 32.6 32 1941 2016
Highest temperature (°C) 36.1 36 36 36.7 36 34.6 34.8 37 37.7 38.9 37.3 37 38.9 1941 2016
Date of Highest temperature 7-Jan-14 20-Feb-72 13-Mar-42 16-Apr-03 2-May-42 27-Jun-16 8-Jul-98 30-Aug-71 17-Sep-83 18-Oct-82 28-Nov-04 18-Dec-76 1941 2016
Lowest maximum temperature (°C) 25.7 24.8 25.7 24.6 22.7 22.7 21.1 25.1 27.6 24.7 25.6 24 21.1 1941 2016
Date of Lowest maximum temperature 29-Jan-89 15-Feb-11 22-Mar-60 10-Apr-54 20-May-81 20-Jun-07 14-Jul-68 17-Aug-07 29-Sep-86 20-Oct-00 2-Nov-10 17-Dec-54 1941 2016
Mean minimum temperature (°C) 24.8 24.7 24.6 24 22.1 19.9 19.3 20.3 23 24.9 25.3 25.3 23.2 1941 2016
Lowest temperature (°C) 20.2 17.2 19.2 16 13.8 12.1 10.4 13 14.3 19 19.3 19.8 10.4 1941 2016
Date of Lowest temperature 23-Jan-85 25-Feb-49 31-Mar-45 11-Apr-43 27-May-90 23-Jun-63 29-Jul-42 23-Aug-14 1-Sep-06 20-Oct-00 4-Nov-50 4-Dec-74 1941 2016
Highest minimum temperature (°C) 29.3 29.4 29.2 28.3 26.6 25.6 26.6 25.6 27.2 28.8 29.7 29.7 29.7 1941 2016
Date of Highest minimum temperature 28-Jan-02 19-Feb-83 3-Mar-16 3-Apr-58 12-May-92 12-Jun-01 26-Jul-10 13-Aug-81 22-Sep-09 23-Oct-05 25-Nov-87 17-Dec-14 1941 2016
Mean rainfall (mm) 423.7 371.3 315.2 100.4 21.6 1.8 1.1 4.8 15.8 70.3 141.3 252.4 1727.5 1941 2016
Highest rainfall (mm) 940.4 1110.2 1013.6 396.2 298.9 50.6 26.6 83.8 129.8 338.7 370.8 664.5 2776.6 1941 2016
Year of Highest rainfall 1995 2011 1977 2006 1968 2004 2001 1947 1981 1954 1964 1974 1941 2016
Lowest rainfall (mm) 136.1 103.3 88 0.6 0 0 0 0 0 0 17.2 18.8 1024.7 1941 2016
Yearof Lowest rainfall 1965 1959 1978 1997 2008 2016 2016 2016 2014 1953 1976 1991 1941 2016
Highest daily rainfall (mm) 290.4 367.6 240.6 142.7 89.6 46.8 19.2 80 70.6 95.5 105 277 367.6 1941 2016
Date of Highest daily rainfall 3-Jan-97 16-Feb-11 16-Mar-77 4-Apr-59 18-May-87 2-Jun-04 17-Jul-01 22-Aug-47 21-Sep-42 25-Oct-69 5-Nov-13 25-Dec-74 1941 2016
Mean number of days of rain 21.3 20.4 19.5 9.2 2.3 0.6 0.4 0.6 2.4 6.9 12.4 16.9 112.9 1941 2016
Mean daily evaporation (mm) 6 5.7 5.7 6.3 6.7 6.8 6.8 7.2 7.6 7.9 7.4 6.5 6.7 1957 2016
Mean 9am temperature (°C) 28 27.7 27.6 27.4 25.6 23.3 22.8 24.4 27 28.7 29.2 28.8 26.7 1954 2010
Mean 9am wind speed (km h-1
) 11.4 11.1 9 10.5 13.6 14.7 13 10.7 9 8.8 8.7 9.9 10.9 1941 2010
Mean 3pm temperature (°C) 30.2 30 30.5 31.7 31.2 29.9 29.6 30.2 31.2 32 31.9 31.2 30.8 1954 2010
Mean 3pm wind speed (km h-1
) 17.8 18.6 16.4 16.5 17 16.2 17.1 19 20.9 19.9 17.7 17.5 17.9 1941 2010
41
3.6 Physical oceanography of Darwin Harbour
Darwin Harbour is a macro-tidal estuary with a maximum tidal range up to 8.0m
(Michie 1987a; Drewry, Fortune & Maly 2009). The tide is semi-diurnal, which
means two highs and lows occur in a single day. The mean tidal range is 3.7 m while
the mean spring and mean neap tidal ranges are 5.7 m and 1.8 m respectively. The
large tidal variations produce strong tidal current velocities that at times can reach
2.5 m s-1 in some parts of the Harbour, particularly during spring tides (Li et al. 2011,
2012, 2014; Andutta et al. 2014). There is a 1.5h lag of the tidal front between the
mouth and the upper reaches of Blackmore River. As they propagate into the
Harbour, the tides also become asymmetric, which is indicated by the ebb tide that
lasts one hour longer compared to the flood tide (Williams, Wolanski & Spagnol
2006). This in turn leads to the peak tidal currents being about 25% higher at flood
tides than at ebb tides.
Darwin Harbour is protected from ocean swells due to its orientation and
geographical location because it is protected by Melville and Bathurst Islands (Byrne
1987; URS Australia 2002a). In fact, due to the macro-tidal environment and
relatively low prevailing wind velocity, the wave conditions in Darwin Harbour are
less significant hydrodynamically than the tidal-related forces. While occasional
monsoonal winds may create high turbidity and move sediment into the Harbour,
previous studies revealed that, except in extreme weather conditions, the
hydrodynamics in Darwin Harbour are mostly determined/controlled by tidal factors
(Makarynskyy & Makarynska 2011; Li et al. 2012; Li 2013; Andutta et al. 2014).
Byrne (1987) calculated that the wave height off Emery Point is typically less than
0.5 m with periods of 2 to 5 seconds, while the calculated cyclone-related wave
height can reach up to 3.5 m. Extreme wave modelling based on wind data of
Cyclone Tracy (1974) predicted a wave height of 4.5 m with average period of 7.5 s
at the entrance of the Harbour but is reduced to 0.7 m adjacent to Wickham Point in
Middle Arm due to the bathymetry of the Harbour (URS Australia 2002b).
Therefore, it is reasonable to suggest that the hydrodynamics in Darwin Harbour are
tidally driven (Li et al. 2014), except during cyclones.
Due to the relatively small catchment area and low annual rainfall, the fresh water
inflows into the Harbour are significantly lower compared to the tidal influx. The
peak tidal influx into the Harbour at spring tides reached 1.2 x 10⁵ m3s-1. It is
42
approximately two orders of magnitude compared to the largest measured cumulative
catchment discharge into the Harbour during an exceptional flood (Williams,
Wolanski & Spagnol 2006; Northern Territory Environment Protection Authority
2014).
3.7 The development, environmental and socio-economic issues in Darwin Harbour
Darwin Harbour, and its catchment, has diverse environments comprising terrestrial,
wetland, coastal and marine areas that are ecologically, socially, culturally and
economically important for local communities, industry and government. The
mangrove forest in the Harbour represents roughly 5% of all mangrove areas in the
Northern Territory and was identified as containing the most diverse species in
Australia. From 50 mangrove species documented worldwide, 36 species can be
found in Darwin Harbour (Brocklehurst & Edmeades 1996). This mangrove forest is
also home to hundreds of species of fauna and other flora, both endemic and
threatened species. Some parts of Darwin Harbour beaches provide feeding areas and
roosting sites for shorebirds as well as marine turtle nesting areas (Chatto 2003).
Corals, seagrass, sponges and a wide variety of invertebrate species are found in the
marine areas. Darwin Harbour is also home to dugongs, dolphins, marine turtles and
a large variety of tropical fish.
Other than the ecological value, the Darwin Harbour region is also socially,
culturally and economically significant to the local community. People use the
Harbour for fishing, boating and other recreational activities, both in the water and
on the beaches. Many sites in the Harbour region are sacred to the indigenous
communities, such as the Old Man Rock adjacent to Lee Point. Heritage places and
historic sites related to World War II are also found in the region.
Located in the proximity of important marine resources and as a gateway to South
East Asia, Darwin Harbour also has strategic, economic, industrial and military
importance. Darwin Harbour hosts infrastructure supporting commercial shipping,
Timor Sea natural gas mining, and a naval base, all of which directly and indirectly
increase local population. The population growth demands more residential areas to
be built. The Darwin Harbour coastal area is a preferred location for high quality
residential areas such as Bayview Haven, Darwin Waterfront and Cullen Bay.
43
The tropical climate and natural resources of the Northern Territory are a magnet for
economic activities in the region, which in turn increases the population in the area.
Furthermore, with the start of natural gas exploration north-west of Darwin,
economic development has significantly increased. As also occurs in many other
parts of the world, the development and economic activity cause population growth
that is accompanied by problems ranging from environmental to socio-economic
issues. The challenges are encountered in both the catchment and the coastal areas.
Coastal developments, as are evident in Darwin Harbour, often require mangrove
forest clearance, dredging and reclamation activities. Large dredging and reclamation
works were required to build the Cullen Bay Marina development project, East Arm
Wharves and the LNG Plants at Wickham Point and Blaydin Point. These projects
underwent rigorous community consultation.
As the first waterfront property development in Darwin Harbour, the Cullen Bay
Marina project attracted considerable public attention because the project required
large sand supply (that proposed to be dredged from the Cullen Bay sandbar) for the
project as well as for the creation of an artificial beach in front of the seawall
protecting the marina. One of the proposed sand supply sources was the Cullen Bay
sandbar, to which, there was public opposition. Most of the petitions submitted
against the project were focused on the potential impacts of the dredging on the
coastal processes in the Harbour, particularly on the interaction between the sandbar
and Fannie Bay beaches. Generally, petitioners were concerned that the dredging
would influence the form and functions of the sandbar in protecting Fannie Bay,
particularly Mindil Beach, from extreme events. Furthermore, there were also
concerns about the changes in sandbar morphology, in case regular dredging of the
sandbar was required for sand replenishment of the artificial beach.
It is the intention of the local communities that Darwin Harbour’s significant
ecological, heritage and sacred sites are protected despite the economic and industrial
development in the area. Therefore, in 2002 the NT Government established a
community-based organization, namely the Darwin Harbour Advisory Committee
(DHAC), to manage the development and implementation of the Darwin Harbour
management plan. The committee initiated a series of public consultations in order to
compile the Darwin Harbour stakeholders’ ideas in 2003 and issued regular
newsletters and advice to the government. Together with the Aquatic Health Unit of
44
the Department of Natural Resources, Environment, the Arts and Sport (NRETAS,
now DENR: Department of Environment and Natural Resources), DHAC has also
delivered the annual Darwin Harbour Region Report Card since 2009. The report
supplied information on surface water quality and other monitoring projects in the
region. The committee was dismantled in 2013 and replaced by a new committee:
The Northern Territory Catchment Advisory Committee (NTCAC), which oversees
the entire body of water resources and catchments in the Northern Territory.
3.8 Previous coastal related studies in Darwin Harbour
A substantial number of coastal studies have been completed and are being carried
out in the Darwin Harbour region, particularly in relation to, water quality, marine
biology, and fine sediment dynamics (Padovan 2001; Whiting 2002; Padovan 2003;
McKinnon et al. 2006; Drewry, Fortune & Majid 2010; Munksgaard et al. 2013;
Andutta et al. 2014; Greiner 2014; Fortune & Patterson 2016). Water quality related
studies are by far the main focus of investigations occurring in Darwin Harbour.
Consequently, research on coastal sediments is primarily focused on fine sediment
dynamics, rather than sand dynamics, notwithstanding the ongoing beach erosion
problems.
Beach erosion in Darwin Harbour was officially documented as a problem in the
early 1970s (Wilkinson 1974; Coaldrake 1976; Wilkinson 1976; Richards & Fogarty
1978). Since then, beach erosion studies covering the beaches from Cox Peninsula to
Lee Point, initiated by the Conservation Commission of the Northern Territory
(CCNT), were regularly conducted until the early 2000s (Brown 1986; Letts &
Kraatz 1989; Kraatz & Letts 1990; Comley 1996; Gray 1999). Sand mining on the
dunes in Casuarina Beach between Dripstone Cliffs and Sandy Creek, which
occurred in the 1960s, led to erosion in adjacent areas, while the western beaches
suffered relatively less erosion compared to the eastern beaches. Coaldrake (1976)
indicated that the cause of the erosion is due to the buildings that have been allowed
to be built on, or close to, the foredune. Sand dunes are natural sand sources for the
seasonal beach dynamics. Failure to keep the dunes in their natural state will
adversely impact the dynamic equilibrium of the shoreline. Due to extended erosion
problems, particularly in the eastern beaches area, the NT Government initiated a
beach monitoring programme covering Fannie Bay Beach and Casuarina Beach. The
45
study was intended to better understand beach dynamics in the area, and conclusively
suggested that there was net erosion on Mindil Beach, while Vesteys Beach and
Casuarina Beach were approximately stable (Comley 1996; Gray 2004).
Beside beach erosion, the cliffs in the coastal area of Darwin Harbour are also
receding. Jones and Pathirana (2008) suggested that there is an average of 0.3 my-1
cliff erosion occurring in the East Point and Nightcliff coastal area. This study was
based on the historical changes of the cliffs using aerial photographs of different
dates. Considering that there is undercutting of cliffs occurring in both areas and
there has been mass failure of cliffs, the infrastructure behind the cliffs might be
vulnerable in the long term. Following a storm in January 2012 that resulted in more
beach erosion and cliff failure at East Point and Nightcliff, Darwin City Council
initiated a study to implement a management plan to control beach erosion at Mindil
Beach and Vesteys Beach, and cliff erosion at East Point and Nightcliff (Andrews &
Eliot 2013). The study recommended continuing the use of the rock- and geofabric-
seawall at Mindil and Vesteys Beaches, redirecting concentrated surface water
drainage and establishing cliff-foot protection at East Point and Nightcliff.
46
Chapter 4 Sand-sized sediment provenance in Darwin Harbour
4.1 Introduction
The analysis in this chapter is to address the first and second research questions, to
infer the provenance of sand-sized sediment in Darwin Harbour based on sand
properties and geochemical characteristics. Two research questions were addressed,
(1) What are the characteristics and origin of sand in Darwin Harbour? (2) What are
the principal transport pathways of sand within Darwin Harbour? The potential
sources of sand-sized sediment are terrestrial sediment, i.e. fluvial and weathered
(coastal) rocks along the beaches, as well as the inner continental shelf. Sandbars,
dunes and subtidal sediment might act as both the sink/depositional area and as the
transitional sources of sand to the beaches. The results of this chapter will be used to
complement the numerical modelling outcomes (Chapter 5).
In earth and ocean sciences, the method used to infer trace sediment sources is called
sediment provenance. A comprehensive sediment provenance analysis covers all
factors influencing the production of the sediment from its parent rocks, the
physiography and climate of the area from where the sediment has originated,
including all alteration, both mechanical and chemical, occurred upon the sediment
during transportation to the depositional areas (Weltje & von Eynatten 2004). In a
more limited way, provenance analysis principles can also be used to identify the
primary source of sediment and the transport pathways in, for example, a coastal
system.
The study of sand-sized sediment provenance is essential for coastal management,
particularly concerning the relationships between coastal processes in shaping the
shoreline morphology (Cooper, Hooke & Bray 2001; Eliot, Gozzard & Nutt 2010).
The most apparent and problematic change in coastal morphology is erosion,
particularly of sandy beaches. Since coastal erosion occurs when there is depletion of
sediment supply to the beach area, due to the interaction of local hydrodynamics and
the coastal morphology, it is important to identify the sediment sources, transport
pathways and the depositional areas of the sediment (Komar 1976; Kamphuis 2000;
Barnard et al. 2013).
47
With regards to identifying the sediment movement, grain-size distribution/textural
characteristics can be useful to infer sand depositional factors, such as the forces and
environment the sediment was exposed to during transport and deposition (Davis
1978; Pyökäri 1997). However, grain size properties alone might lead to
misinterpretation of provenance analysis due to sediment sorting and/or mechanical
and chemical alteration during transport (Ingersoll et al. 1984). On the other hand,
sediment geochemical attributes, such as certain trace elements and isotope ratios
tend to be preserved in the sediment during transport and diagenesis (Taylor &
McLennan 1985; Munksgaard, Lim & Parry 2003; Rosenbauer et al. 2013).
Therefore, complementing sediment textural properties with geochemical signatures
is a preferable method in provenance analysis.
Frequently used chemical elements in provenance studies are high-field strength
elements (HFSEs) and large-ion lithophile elements (LILEs). HFSEs and LILEs are
trace elements that are categorised as incompatible, i.e. elements that are unsuitable
in size and/or charge to the cation sites of minerals during the mantle melting process
and eventually enriched in the earth crust. Sand grains are composed of rock
fragments and/or minerals originating from the weathering of parent rock material or
from biogenic sources, hence LILEs and HFSEs are suitable trace elements to infer
the sources. LILEs are more fluid-mobile, i.e. less resistant to metamorphism and
hydrothermal alteration than HFSEs, hence are suitable to identify ‘immature’ sand
derived from ‘fresh rock’.
HFSEs are less sensitive to weathering processes, therefore they are most likely be
representative of the original rock. Elements categorised as LILEs are Barium (Ba),
Caesium (Cs), Potassium (K), Lead (Pb), Rubidium (Rb) and Strontium (Sr), while
the HFSEs are Hafnium (Hf), Niobium (Nb), Phosphorus (P), Lead (Pb), Tantalum
(Ta), Thorium (Th), Titanium (Ti), Uranium (U), Tungsten (W), Yttrium (Y),
Zirconium (Zr) and the REEs.
Among the HFSEs, rare earth elements (REEs) are considered excellent provenance
indicators due to their exceptionally coherent character as a group. Despite changes
in the total concentration, REEs tend to retain their properties as a group along the
pathways from source to sink (Haskin & Paster 1984; Munksgaard, Lim & Parry
2003; Prego et al. 2012). The REE abundance is commonly presented as a
normalised REE distribution pattern to eliminate the ‘Oddo-Harkins effect’ where
48
even atomic numbered elements are more abundant than odd atomic numbered
elements, resulting in a saw-tooth pattern. Thus, the normalisation is intended to
smooth out the saw-tooth effect.
The REEs are 15 lanthanide elements, ranging from the lightest, Lanthanum (La), to
the heaviest, Lutetium (Lu). However, usually only 14 elements are recognised as
REE, since Promethium (Pm) is often excluded due to its radioactive character and it
is not found in nature (Hoatson, Jaireth & Miezitis 2011). The elements La to
Gadolinium (Gd) are classified as light-REE (L-REE), while Terbium (Tb) to Lu are
classified as heavy-REE (H-REE). Additionally, some authors classify Samarium
(Sm) to Holmium (Ho) as medium/middle-REE (M-REE) (Dubinin 2004).
REEs are mainly contained in fine sediment due to their affinity for clay minerals
(Haskin & Paster 1984; Taylor & McLennan 1985), hence they are less commonly
used for sand provenance analysis. However, while their absolute abundance in
coarse sediment is generally lower, the general patterns of REE in fine and coarse
sediment are similar (Taylor & McLennan 1985; McLennan 2001), hence they can
also be used in sand provenance analysis. There are diverse applications of REEs in
sand geochemical studies, ranging from studies of desert sand ramps (Pease &
Tchakerian 2003) to beach and marine sand (Araújo, Corredeira & Gouveia 2007;
Armstrong-Altrin 2009; Zhou et al. 2010; Prego et al. 2012; Rosenbauer et al. 2013).
The presence of REEs in sand-sized sediment is indicated by the presence of heavy
minerals such as zircon, ilmenite, rutile or monazite, hence they are often used as a
placer deposit proxy for heavy mineral sand mining. Zircon minerals in sand can be
identified by the Zr content, ilmenite and rutile by Ti content, while Monazite
minerals can be identified by the REE, Th and P content. In the Northern Territory,
heavy mineral sand mining for zircon and rutile, was carried out in 2006 on the Tiwi
Islands approximately 50 km north of Darwin Harbour. In the Harbour region itself,
Pietsch (1986) reported of tin (Sn) and tantalum (Ta) mineralisation within the
pegmatites south of Darwin Harbour in the West Arm-Bynoe Harbour-Mount Finniss
area. While both elements can form the heavy minerals cassiterite (SnO2) and
tantalite ((Fe, Mn) (Ta, Nb)2O6), there are no reports of heavy mineral content in the
sand-sized sediment in the Harbour region.
49
In this study, the grain size distribution and the geochemical characteristics of sand-
sized sediment (diameter 0.063 – 2mm) were analysed from sediment collected in
each region in Darwin Harbour. Darwin Harbour is divided in two main sub-systems
i.e. the Outer and the Inner Harbour. The Inner Harbour is further divided into the
central-Inner Harbour and the Harbour arms, i.e. East Arm, Mid Arm, West Arm and
Woods Inlet (Figure 4.1).
As also encountered in other coastal areas world-wide, Darwin Harbour experiences
coastal erosion due to natural processes and human intervention. Several studies have
been carried out to mitigate the problems, particularly in parts of the Harbour
affected by the Port Darwin development work for example the Mindil Beach area.
However, no study on sand-sized sediment dynamics incorporating coastal processes
has been carried out for the whole Darwin Harbour region. This study is an attempt
to make a start at filling this gap and aims to contribute to determining the sand
pathways in the Harbour, inferring the sources of beach sand, in Darwin Harbour.
4.2 Methods
4.2.1 Sample collection
The sediment sampling locations were designed to represent the potential sand-sized
sediment sources and the depositional areas/sinks in Darwin Harbour, covering the
outer and the Inner Harbour areas. Samples were collected from the beach, dune,
sub-tidal, sandbar and fluvial areas. In case the beach was backed by rock cliffs
instead of dunes, loose rockfall from the cliffs was collected as a possible source of
sand-sized particles to the Harbour. Limited resources constrained a more complete
rock sampling and analysis.
The sampling area for beach, dune and rock samples encompasses the western to the
eastern beach areas, from Charles Point in the west to Lee Point in the east, including
some sections in the Inner Harbour, i.e. Doctor’s Gully, Lameroo, Silversands Beach,
Channel Island and Catalina Island. Subtidal samples were collected from the outer
and Inner Harbour areas (Figure 4.1).
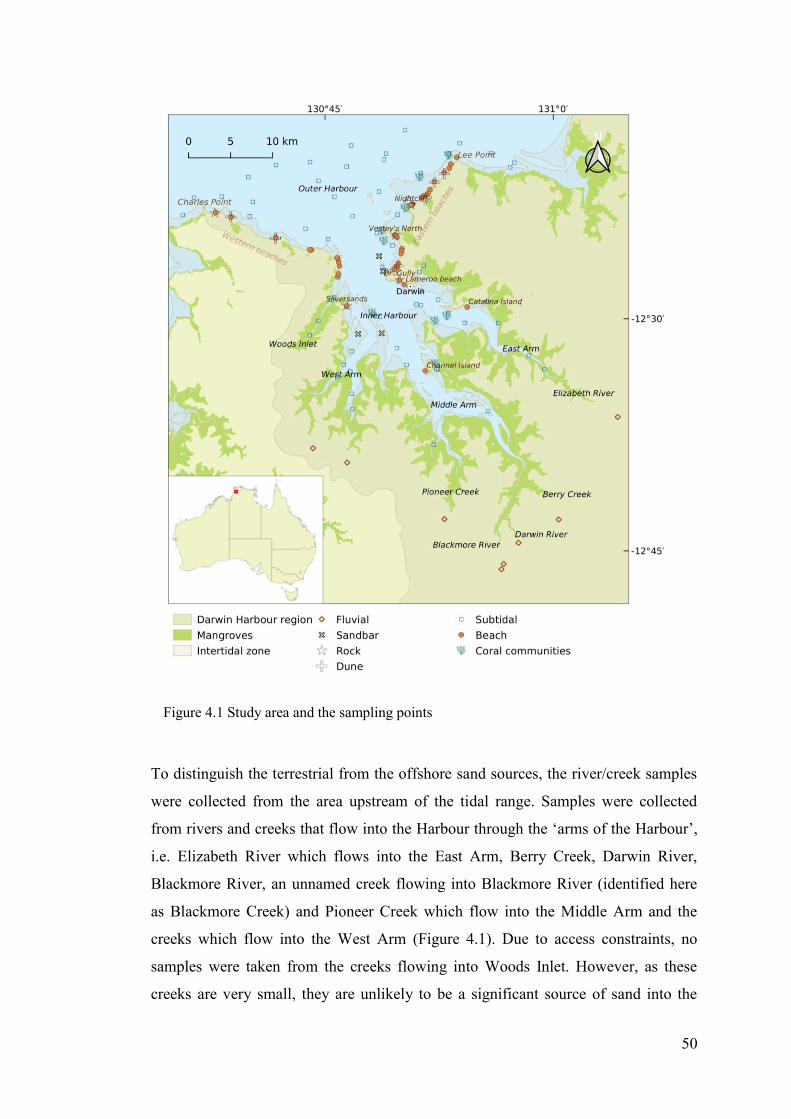
50
To distinguish the terrestrial from the offshore sand sources, the river/creek samples
were collected from the area upstream of the tidal range. Samples were collected
from rivers and creeks that flow into the Harbour through the ‘arms of the Harbour’,
i.e. Elizabeth River which flows into the East Arm, Berry Creek, Darwin River,
Blackmore River, an unnamed creek flowing into Blackmore River (identified here
as Blackmore Creek) and Pioneer Creek which flow into the Middle Arm and the
creeks which flow into the West Arm (Figure 4.1). Due to access constraints, no
samples were taken from the creeks flowing into Woods Inlet. However, as these
creeks are very small, they are unlikely to be a significant source of sand into the
Figure 4.1 Study area and the sampling points
51
Harbour. The main sample collection took place in the dry season of 2012, but some
sampling activities for the western beaches and submerged areas continued until
February 2013. The late arrival of the 2013 wet season allowed for a successful
conclusion of the sampling activities.
Samples from beaches, dunes, sandbars and rivers/creeks were collected using a
plastic spatula, while the submerged samples were acquired using a 5-kg Van Veen
sediment grab sampler. To avoid metal contamination, sub samples from the middle
of the grab were retained for chemical analysis. The remaining sub samples were
used for grain size and calcium carbonate analysis. In total, there were 36 and 55
samples respectively collected from the outer and the Inner Harbour. Upon
collection, all samples were transferred to double zip-lock plastic bags and
transported in a cool container to the laboratory, where they were stored at 4°C until
further analysis.
The beach samples were taken from the foreshore up to the backshore, from
approximately the upper 10 cm of surface and bulked. Depending on beach width, up
to 1000 grams of sediment from 3 to 9 sub-samples was collected at each sample
point. In total, 39 beach samples were taken, of which 11 samples were taken from
the western beach area, 5 samples from the beaches in the Inner Harbour and 23
samples from the eastern beach area. Fewer sample points were taken from the
western beach areas due to the poorer accessibility compared to the eastern beach
areas.
The dune samples were collected along the whole dune slope, with 3 dune samples
taken from the western beach and 6 dune samples from the eastern beach areas. Up
to 300 grams of dune sediment was collected from each point. Where the beach was
backed by rock cliff instead of sand dunes, loose rocks from the outcrops up to the
pebble size (approximately up to 10 cm Ø), were collected for chemical analysis.
This type of sample was collected as a possible source of sand-sized particles eroded
from the outcrops, considering that the strata in the coastal cliffs in Darwin Harbour
are deeply weathered. In total, rock samples were collected from five locations: the
Charles Point lighthouse (western beach area), Silversands Beach, Doctor’s Gully
Beach (Inner Harbour beach), North Vestey’s Beach and Nightcliff Beach (eastern
beach).
52
The sandbar samples were taken around low tide from the exposed parts of the
sandbars. Five sandbar samples, each bulked from 5 to 10 sub-samples were
collected, i.e. 3 samples from the Inner Harbour and 2 samples covering the north
and the south part of Cullen Bay/Emery Point sandbar.
The stream bed samples were collected from 8 rivers and creeks in the catchment
area. To ensure that samples were representative, multiple sub-samples were
collected along the reaches approximately five times the channel width. Depending
on the river/creek width, up to 15 sub-samples from each channel were collected and
bulked.
4.2.2 Analytical techniques
The sediment samples were divided into three subsamples that were subjected to
particle size distribution analysis, geochemical analysis and calcium carbonate
analysis. Particle size distributions were derived using the dry and wet sieving
methods following a sample-splitting procedure according to the US Army
Engineering Manual No. 1110-2-1996 (MacIver & Hale 1986). The sediments
samples were classified into granules/fine gravel (> 2mm, φ scale: < ‒1φ), sand
(0.063mm-2mm, φ scale: ‒1φ-4φ) and mud (i.e. coarse to very coarse silt, <
0.063mm, φ scale: > 4φ) according to the Udden-Wentworth scale. The sand fraction
was further divided into very fine sand (0.063mm-0.125mm, φ scale: 4φ-3φ), fine
sand (0.125mm-0.250mm, φ scale: 3φ-2φ), medium sand (0.250mm-0.500mm,
φscale: 2φ-1φ), coarse sand (0.500mm-1.00mm, φ scale: 1φ-0φ) and very coarse
sand (1.00mm-2.00mm, φ scale: 0φ- ‒1φ). A grain size distribution and statistics
software package, Gradistat® (Blott & Pye 2001), was used to calculate the sample
grain size parameters based on the Krumbein and Pettijohn classification (Krumbein
& Pettijohn 1938) and the geometric (modified) Folk and Ward graphical measures
(Folk & Ward 1957).
The second and the third sets of sub-samples were wet-sieved to >63μm and <2 mm
and then oven-dried at 60°C for 24 hours for calcium carbonate (CaCO3) and
geochemical analysis. The rock samples were crushed using a rubber-head mallet
into finer grain size (< 2mm) and were only subjected to geochemical and CaCO3
analyses.
53
The calcium carbonate concentration was determined using the cold 1M HCl
procedure. In this procedure, the 1M HCl was added drop-wise onto approximately
5g of oven-dried sample. The presence of carbonate minerals was indicated by the
creation of carbon dioxide (CO2) gas in the form of bubbles due to the reaction of
HCl and the minerals. The cessation of effervescence indicated that all carbonate
minerals that were susceptible to the cold acid reaction, i.e. calcite and aragonite,
were completely digested. The remaining samples were then decanted and oven-
dried. The carbonate content was calculated from the weight difference of the oven-
dried sample before and after the acid treatment.
The geochemical analysis was carried out at two different laboratories: The
Environmental Chemistry and Microbiology Unit (ECMU) Laboratory at Charles
Darwin University for REE analysis using a partial-digestion method and the
Australian Laboratory Services (ALS) Minerals Laboratory, Brisbane, Queensland
for analysis of the other elements using a near-total digestion method. Both acid
digestions are intended to release metal from the sediment matrix, however the near-
total digestion method is more accurate to digest silicate minerals but not necessarily
surpasses the partial-digest method for REE determination in clay minerals and
quartz dominated sediment (Munksgaard, Lim & Parry 2003).
The analysis in the ECMU Laboratory was carried out using an Agilent 7700
Inductively Coupled Plasma Mass Spectrometer (ICP-MS). To dissolve the analytes,
an acid-digestion procedure was carried out preceding the ICP-MS analysis. The
oven-dried and homogenised samples (of approximately 30g) were treated firstly
with 1.0mL of nitric acid (HNO3) and then with 4.0mL of perchloric acid (HClO4) in
a series of temperature stages. This partial acid digestion method using HNO3 and
HClO4 was preferred due to its simplicity, safety and relatively low cost. This
method was used by Munksgaard et al (2003) in a coastal sediment provenance study
to deliberately target REEs associated with clay minerals and other minerals in clay-
dominated coastal sediment, excluding the heavy mineral contents. Nonetheless,
since REEs are transported/mobilised as a group, when used as a comparative
parameter within a certain sample group, the REEs are sufficient to discriminate the
source-sink relationship, including for a sand dominated sediment.
Following digestion, the samples were cooled down and diluted with high-purity
water, and then further processed for ICP-MS analysis. For precision and accuracy,
54
the analysis also included digest blanks, sample spikes, duplicates and a marine
sediment certified reference material (CRM) MESS-3 (National Research Council of
Canada) for quality control. The MESS-3 certificate does not include REEs,
therefore the accuracy of REE determination was confirmed using the REE
concentrations provided by Begum et al. (2007). The recovery was between 97% to
102% for L-REE, 65% to 114% for M-REE, and 48% to 55% for H-REE (Er, Tm,
Yb and Lu). The low recovery for M-REE and H-REE was to be expected because
HNO3 and HClO4 do not completely digest the H-REE containing minerals
(Munksgaard, Lim & Parry 2003). Notwithstanding the low recovery of the H-REEs,
the results are sufficiently capable to discriminate the source-sink relationships of the
sand-sized sediment, due to the coherent characteristics of REEs during transport
pathways from source to sink.
The near-total digestion analysis in the ALS Laboratory was carried out by means of
four-acid ICP-MS method i.e. nitric acid (HNO3), perchloric acid (HClO4),
hydrofluoric acid (HF) and hydrochloric acid (HCl). This procedure is particularly
useful for silicates, however, it might not recover resistive elements such as Zr and
Ti very well, hence is inadequate to detect commonly found heavy minerals in sand
such as zircon, ilmenite, titanite or rutile. Precision and accuracy of the analysis were
verified using four Certified Reference Materials (CRM), blanks and duplicates. The
CRM used were GBM-908-10, GEOMS-03, MRGeo08 and OGGeo08. The results
of the measurements are all within the lower and upper boundaries of the CRMs. It is
important to note that the geochemical analysis was carried out only on the sand
sized fraction of the samples (>63μm and <2mm), which represents more than 85%
of all the samples.
4.2.3 Data analysis
4.2.3.1 Grain size distribution analysis
The statistics for the grain size distribution analysis were calculated using the
Gradistat® software (Blott & Pye 2001) covering 1) grain size and mean grain size
(MG), 2) the standard deviation/spread (sorting: σG) from the mean value, 3) the
tendency of the spread/asymmetry (skewness: SkG) from the mean value, and 4) the
degree of concentration of the grains relative to the mean value (kurtosis: KG). The
results were presented according to the Geometric Folk and Ward graphical method
55
(metric size values), with Pn denoting grain diameter. The subscript n (5, 16, 25, 50,
84 and 95) denotes the nth percentile of the grain distribution.
The mean grain size (MG) was calculated according to the formula:
𝑀𝐺 = 𝑒𝑥𝑝𝑙𝑛𝑃16 + 𝑙𝑛𝑃50 + 𝑙𝑛𝑃84
3
The grain size categories based on the mean grain size are defined as follows:
Categories μm φ
Granules/very fine gravel 2000 – 4000 ‒1 ~ ‒2
Very coarse sand 1000 – 2000 0 ~ ‒1
Coarse sand 500 – 1000 1 ~ 0
Medium sand 250 – 500 2 ~ 1
Fine sand 125 – 250 3 ~ 2
Very fine sand 63 – 125 4 ~ 3
Mud (silt & clay) < 63 > 4
The standard deviation from the mean value/sorting (σG) was calculated according to
the following formula:
𝜎𝐺 = 𝑒𝑥𝑝 (𝑙𝑛𝑃16 − 𝑃84
4+
𝑙𝑛𝑃5 + 𝑙𝑛𝑃95
6.6)
The sorting categories are defined as follows:
Categories σG
Very well sorted < 1.27
Well sorted 1.27 – 1.41
Moderately well sorted 1.41 – 1.62
Moderately sorted 1.62 – 2.00
Poorly sorted 2.00 – 4.00
Very poorly sorted 4.00 – 16.00
Extremely poorly sorted >16.00
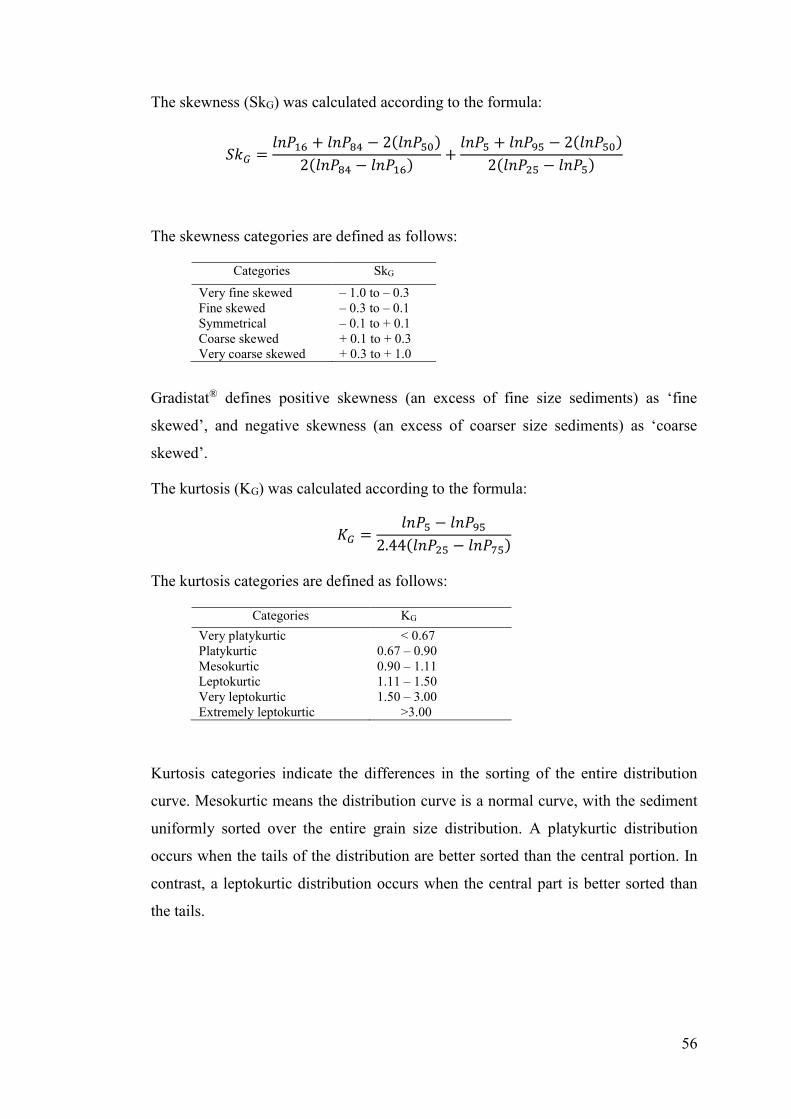
56
The skewness (SkG) was calculated according to the formula:
𝑆𝑘𝐺 =𝑙𝑛𝑃16 + 𝑙𝑛𝑃84 − 2(𝑙𝑛𝑃50)
2(𝑙𝑛𝑃84 − 𝑙𝑛𝑃16)+
𝑙𝑛𝑃5 + 𝑙𝑛𝑃95 − 2(𝑙𝑛𝑃50)
2(𝑙𝑛𝑃25 − 𝑙𝑛𝑃5)
The skewness categories are defined as follows:
Categories SkG
Very fine skewed ‒ 1.0 to ‒ 0.3
Fine skewed ‒ 0.3 to ‒ 0.1
Symmetrical ‒ 0.1 to + 0.1
Coarse skewed + 0.1 to + 0.3
Very coarse skewed + 0.3 to + 1.0
Gradistat® defines positive skewness (an excess of fine size sediments) as ‘fine
skewed’, and negative skewness (an excess of coarser size sediments) as ‘coarse
skewed’.
The kurtosis (KG) was calculated according to the formula:
𝐾𝐺 =𝑙𝑛𝑃5 − 𝑙𝑛𝑃95
2.44(𝑙𝑛𝑃25 − 𝑙𝑛𝑃75)
The kurtosis categories are defined as follows:
Categories KG
Very platykurtic < 0.67
Platykurtic 0.67 – 0.90
Mesokurtic 0.90 – 1.11
Leptokurtic 1.11 – 1.50
Very leptokurtic 1.50 – 3.00
Extremely leptokurtic >3.00
Kurtosis categories indicate the differences in the sorting of the entire distribution
curve. Mesokurtic means the distribution curve is a normal curve, with the sediment
uniformly sorted over the entire grain size distribution. A platykurtic distribution
occurs when the tails of the distribution are better sorted than the central portion. In
contrast, a leptokurtic distribution occurs when the central part is better sorted than
the tails.
57
4.2.3.2 Statistical analyses
The PRIMER data analysis package (v6, Primer-E Ltd.)(Clarke & Gorley 2006), was
used to display and examine the relationships among the sample types and sediment
elemental composition. The data set that consists of more than 46 elements was
assessed using multivariate methods, covering data reduction and grouping and using
similarity/resemblance analysis to identify the most dominant elements. Since the
variables consist of different measurement units, the data set was standardised based
on the mean and standard deviation of each variable prior to the similarity analysis.
This step is termed as normalisation in the PRIMER® analysis package.
Hierarchical cluster and non-metric Multi-Dimensional Scaling (MDS) analyses
based on similarity matrix that is calculated from the Euclidean distance were
performed to infer the pattern of similarities among the elements. Elemental
composition was categorised in the three provenance indicator groups: LILEs,
HFSEs and REEs. Only elements with the closest similarity, as indicated by
small/short Euclidean distances, were included in the subsequent data analysis. The
source-sink relationships among the sample types and sample locations were inferred
using ordination analysis i.e. Principal Coordination Analysis (PCoA) based on the
resemblance matrix of the samples. PCoA visually presents similarities between
samples based on the inter-object comparisons of a multi-element dataset in a low-
dimensional Euclidean space. Samples that are clustered within short (Euclidean)
distances indicate similarities and hence are inferred as originating from similar
source(s). Additionally, the source-sink relationships among all samples were also
analysed based on the chondrite-normalised REE concentrations.
4.3 Results
4.3.1 Grain size parameters
The grain size distributions of the samples ranged widely from clay and silt
(classified herein as ‘mud’) to granules/very fine gravel. Based on the proportion of
each grain size, the textural group of all samples varied from slightly gravelly mud to
gravel (Folk 1954, 1980). The grain size distribution data, including the mean grain
size, sorting, skewness and kurtosis, is presented in the following sub-chapters.
58
4.3.1.1 Mean grain size
The grain size classification of the 152 samples based on the mean grain size ranged
from mud (<63μm) to granules/very fine gravel (2 – 4mm) with 86% classified as
sand (Table 4.1). In general, the finer grained sediment was found in the Inner
Harbour subtidal samples, while the larger grain sizes were found in the sandbars, the
central-Inner Harbour and the fluvial samples.
Of the 86% of samples categorised as sand, medium and fine sand together made up
approximately 47%, while very fine sand constituted less than 8%. The coarser grain
sizes were comprised of 17% coarse sand, 13% very coarse sand and less than 4%
granules/very fine gravel.
Beach samples varied from fine to very coarse sand, with samples from the eastern
beaches generally finer grained than the western and the Inner Harbour beaches. The
very coarse beach sand samples were collected from the area adjacent to a rocky
headland, i.e. from Nightcliff Beach in the east and Doctor’s Gully and Silversands
Beach in the Inner Harbour. The Inner Harbour beach sample grain sizes varied from
fine sand to (very fine) gravel. The fine sand was collected from a west-facing
Channel Island beach, while the sample that was classified as gravel was collected
from Catalina Island, adjacent to East Arm Wharf. Other samples that were classified
as gravel were collected from sandbars located on the western part of Inner Harbour
and subtidal samples located nearby East Arm Wharf.
The 10% of samples that are classified as mud were all collected from subtidal
locations, with a majority found in the Harbour arms and along the mangrove fringes.
The mud samples from the Outer Harbour area were collected from areas adjacent to
mangrove-lined shorelines at the western and eastern beaches and adjacent to Buoy 1
in the middle of the Outer Harbour.
Fluvial sediment varied from very fine to very coarse sand. The sample collected
from Elizabeth River that flows into East Arm was classified as medium sand, while
the samples taken from the rivers and creeks flowing into the Middle Arm varied
from fine to coarse sand. The samples collected from West Arm showed a
contrasting character: the sample collected from the eastern branch of the creek was
classified as very fine sand, while the sand collected from the western branch was
classified as very coarse sand.
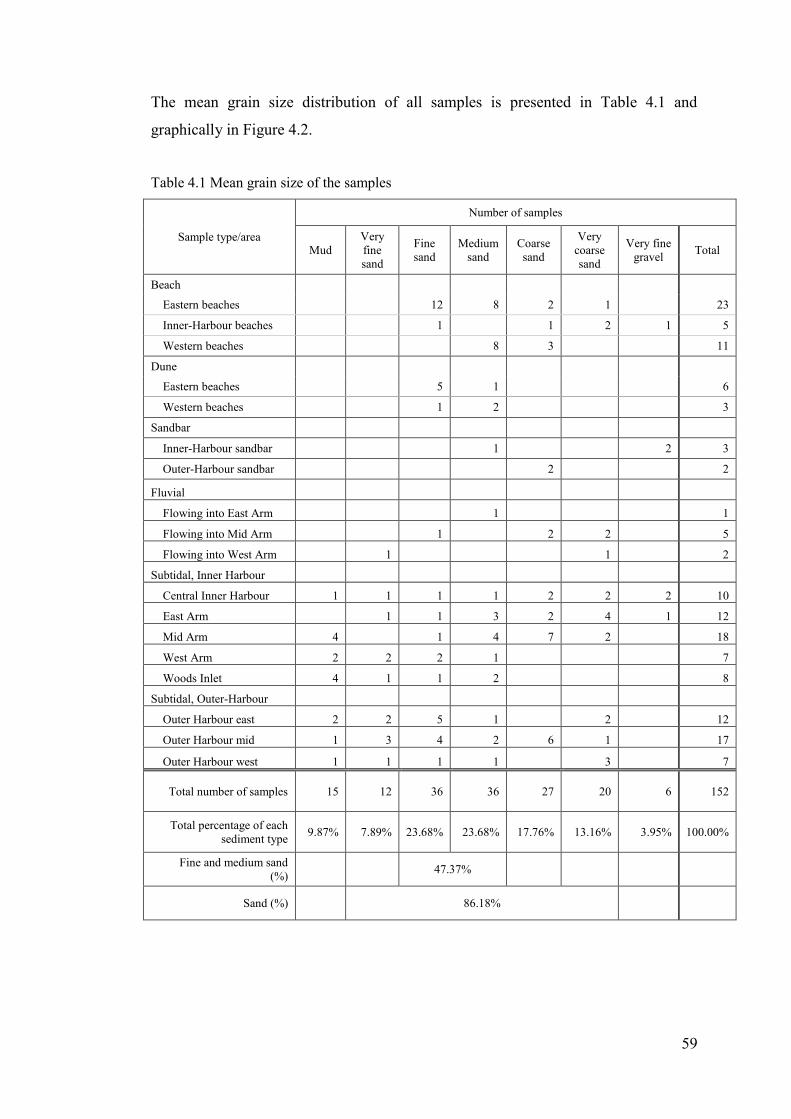
59
The mean grain size distribution of all samples is presented in Table 4.1 and
graphically in Figure 4.2.
Table 4.1 Mean grain size of the samples
Sample type/area
Number of samples
Mud
Very
fine
sand
Fine
sand
Medium
sand
Coarse
sand
Very
coarse
sand
Very fine
gravel Total
Beach
Eastern beaches 12 8 2 1 23
Inner-Harbour beaches 1 1 2 1 5
Western beaches 8 3 11
Dune
Eastern beaches 5 1 6
Western beaches 1 2 3
Sandbar
Inner-Harbour sandbar 1 2 3
Outer-Harbour sandbar 2 2
Fluvial
Flowing into East Arm 1 1
Flowing into Mid Arm 1 2 2 5
Flowing into West Arm 1 1 2
Subtidal, Inner Harbour
Central Inner Harbour 1 1 1 1 2 2 2 10
East Arm 1 1 3 2 4 1 12
Mid Arm 4 1 4 7 2 18
West Arm 2 2 2 1 7
Woods Inlet 4 1 1 2 8
Subtidal, Outer-Harbour
Outer Harbour east 2 2 5 1 2 12
Outer Harbour mid 1 3 4 2 6 1 17
Outer Harbour west 1 1 1 1 3 7
Total number of samples 15 12 36 36 27 20 6 152
Total percentage of each
sediment type 9.87% 7.89% 23.68% 23.68% 17.76% 13.16% 3.95% 100.00%
Fine and medium sand
(%) 47.37%
Sand (%) 86.18%
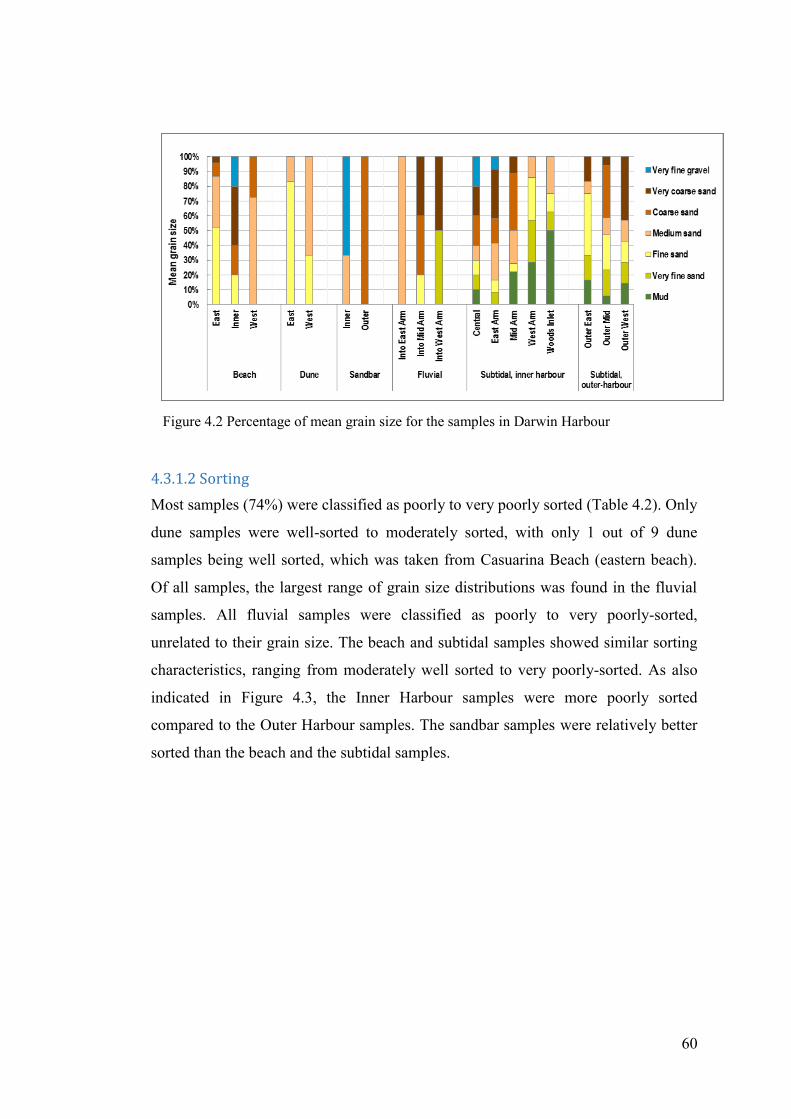
60
4.3.1.2 Sorting
Most samples (74%) were classified as poorly to very poorly sorted (Table 4.2). Only
dune samples were well-sorted to moderately sorted, with only 1 out of 9 dune
samples being well sorted, which was taken from Casuarina Beach (eastern beach).
Of all samples, the largest range of grain size distributions was found in the fluvial
samples. All fluvial samples were classified as poorly to very poorly-sorted,
unrelated to their grain size. The beach and subtidal samples showed similar sorting
characteristics, ranging from moderately well sorted to very poorly-sorted. As also
indicated in Figure 4.3, the Inner Harbour samples were more poorly sorted
compared to the Outer Harbour samples. The sandbar samples were relatively better
sorted than the beach and the subtidal samples.
Figure 4.2 Percentage of mean grain size for the samples in Darwin Harbour
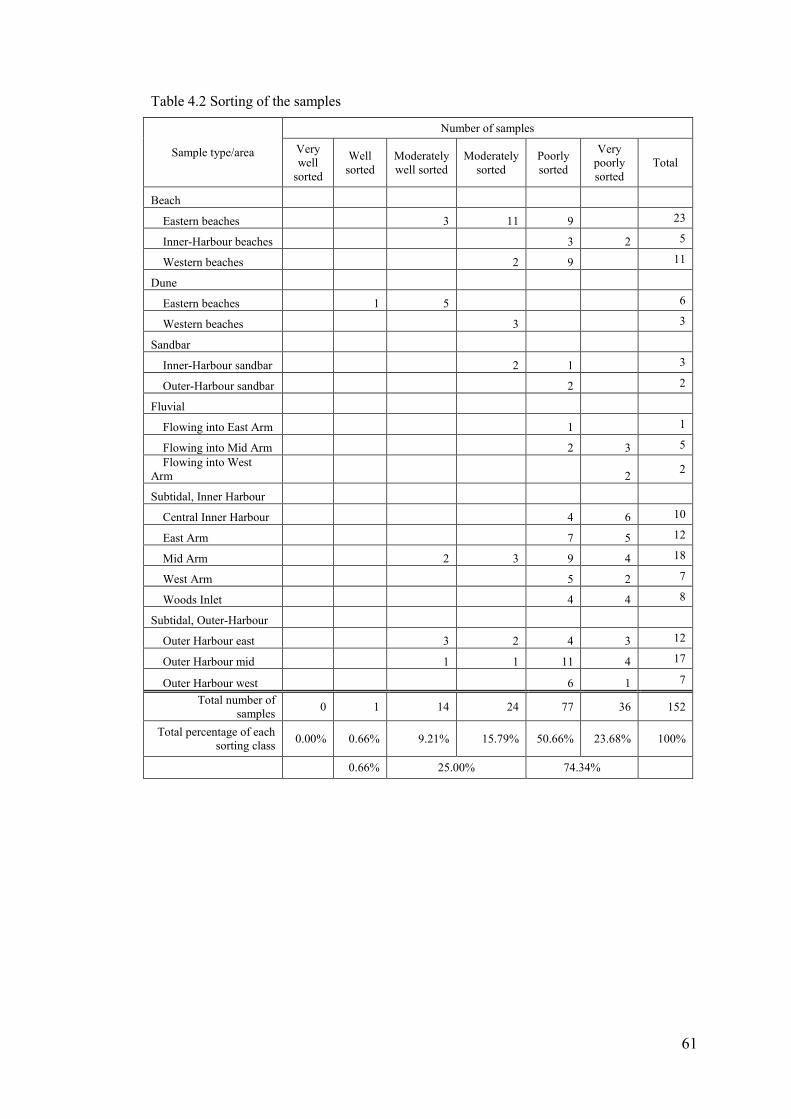
61
Table 4.2 Sorting of the samples
Sample type/area
Number of samples
Very
well
sorted
Well
sorted
Moderately
well sorted
Moderately
sorted
Poorly
sorted
Very
poorly
sorted
Total
Beach
Eastern beaches 3 11 9 23
Inner-Harbour beaches 3 2 5
Western beaches 2 9 11
Dune
Eastern beaches 1 5 6
Western beaches 3 3
Sandbar
Inner-Harbour sandbar 2 1 3
Outer-Harbour sandbar 2 2
Fluvial
Flowing into East Arm 1 1
Flowing into Mid Arm 2 3 5
Flowing into West
Arm 2 2
Subtidal, Inner Harbour
Central Inner Harbour 4 6 10
East Arm 7 5 12
Mid Arm 2 3 9 4 18
West Arm 5 2 7
Woods Inlet 4 4 8
Subtidal, Outer-Harbour
Outer Harbour east 3 2 4 3 12
Outer Harbour mid 1 1 11 4 17
Outer Harbour west 6 1 7
Total number of
samples 0 1 14 24 77 36 152
Total percentage of each
sorting class 0.00% 0.66% 9.21% 15.79% 50.66% 23.68% 100%
0.66% 25.00% 74.34%
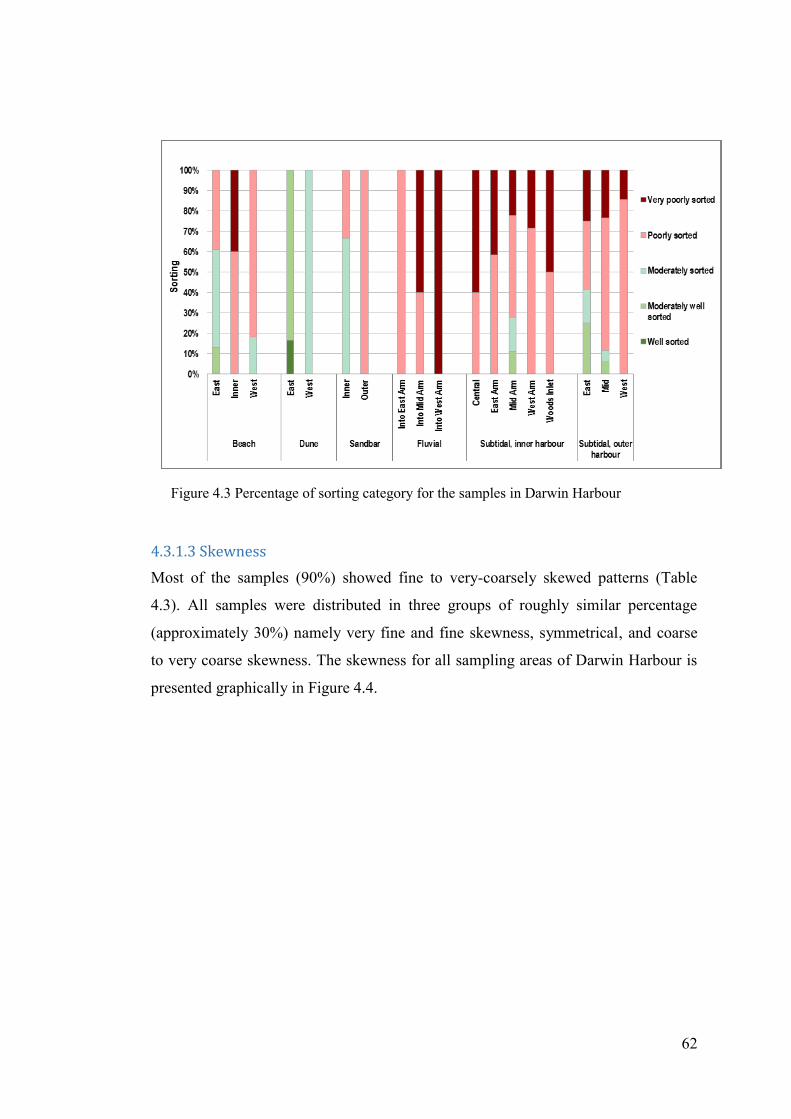
62
4.3.1.3 Skewness
Most of the samples (90%) showed fine to very-coarsely skewed patterns (Table
4.3). All samples were distributed in three groups of roughly similar percentage
(approximately 30%) namely very fine and fine skewness, symmetrical, and coarse
to very coarse skewness. The skewness for all sampling areas of Darwin Harbour is
presented graphically in Figure 4.4.
Figure 4.3 Percentage of sorting category for the samples in Darwin Harbour
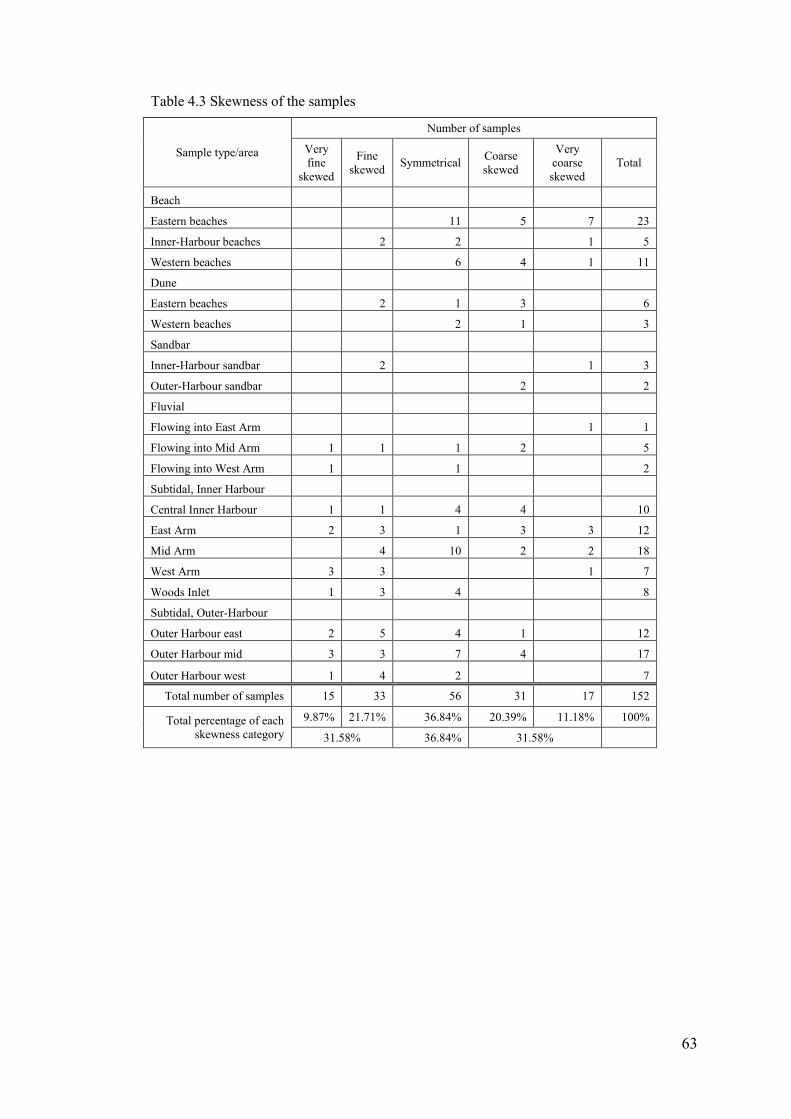
63
Table 4.3 Skewness of the samples
Sample type/area
Number of samples
Very
fine
skewed
Fine
skewed Symmetrical
Coarse
skewed
Very
coarse
skewed
Total
Beach
Eastern beaches 11 5 7 23
Inner-Harbour beaches 2 2 1 5
Western beaches 6 4 1 11
Dune
Eastern beaches 2 1 3 6
Western beaches 2 1 3
Sandbar
Inner-Harbour sandbar 2 1 3
Outer-Harbour sandbar 2 2
Fluvial
Flowing into East Arm 1 1
Flowing into Mid Arm 1 1 1 2 5
Flowing into West Arm 1 1 2
Subtidal, Inner Harbour
Central Inner Harbour 1 1 4 4 10
East Arm 2 3 1 3 3 12
Mid Arm 4 10 2 2 18
West Arm 3 3 1 7
Woods Inlet 1 3 4 8
Subtidal, Outer-Harbour
Outer Harbour east 2 5 4 1 12
Outer Harbour mid 3 3 7 4 17
Outer Harbour west 1 4 2 7
Total number of samples 15 33 56 31 17 152
Total percentage of each
skewness category
9.87% 21.71% 36.84% 20.39% 11.18% 100%
31.58% 36.84% 31.58%
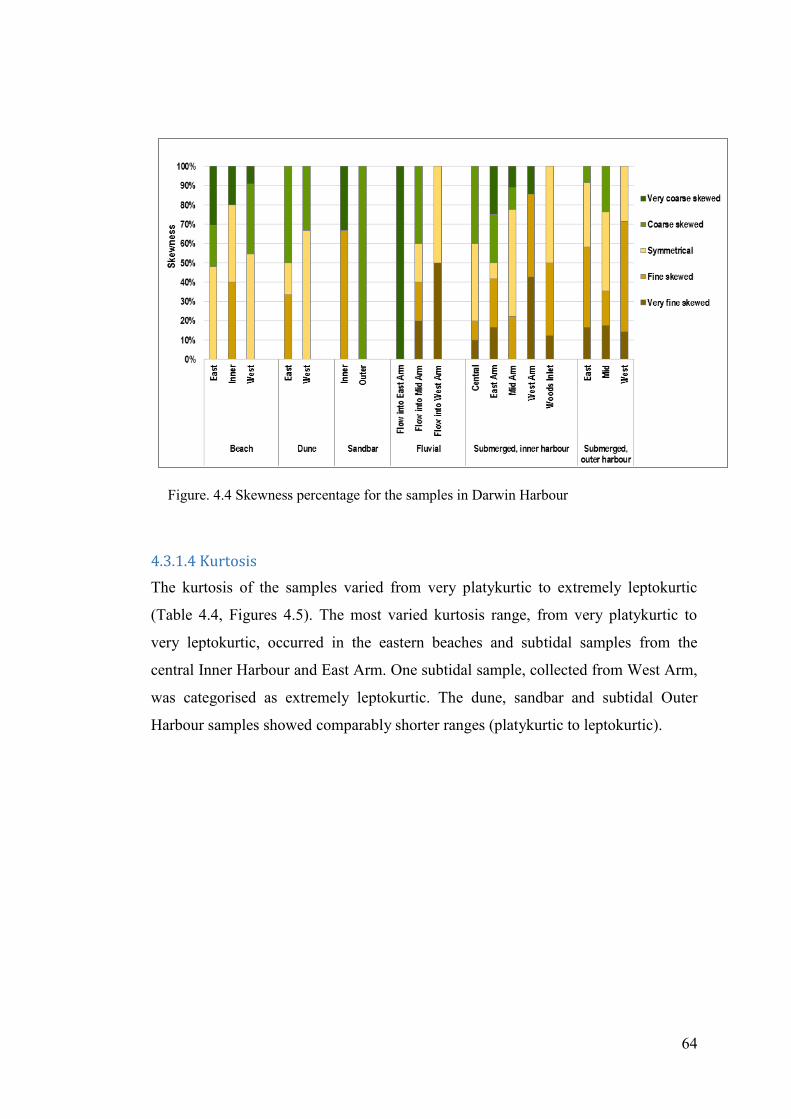
64
4.3.1.4 Kurtosis
The kurtosis of the samples varied from very platykurtic to extremely leptokurtic
(Table 4.4, Figures 4.5). The most varied kurtosis range, from very platykurtic to
very leptokurtic, occurred in the eastern beaches and subtidal samples from the
central Inner Harbour and East Arm. One subtidal sample, collected from West Arm,
was categorised as extremely leptokurtic. The dune, sandbar and subtidal Outer
Harbour samples showed comparably shorter ranges (platykurtic to leptokurtic).
Figure. 4.4 Skewness percentage for the samples in Darwin Harbour
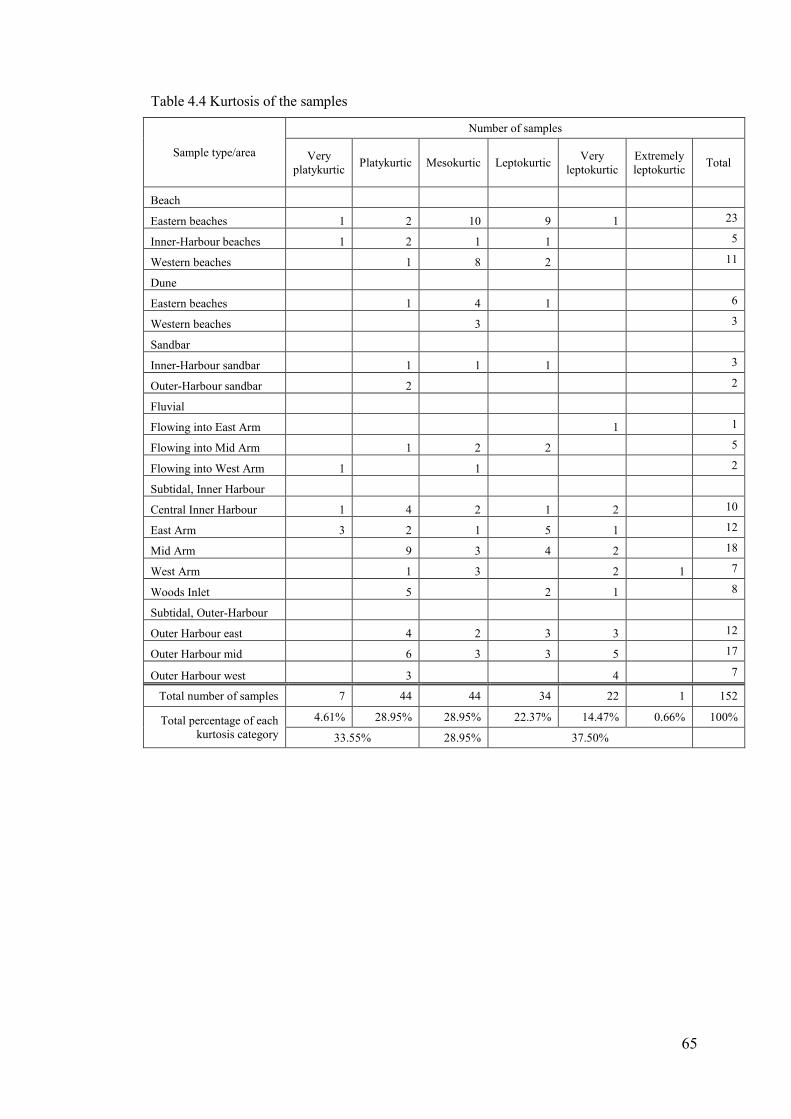
65
Table 4.4 Kurtosis of the samples
Sample type/area
Number of samples
Very
platykurtic Platykurtic Mesokurtic Leptokurtic Very
leptokurtic Extremely
leptokurtic Total
Beach
Eastern beaches 1 2 10 9 1 23
Inner-Harbour beaches 1 2 1 1 5
Western beaches 1 8 2 11
Dune
Eastern beaches 1 4 1 6
Western beaches 3 3
Sandbar
Inner-Harbour sandbar 1 1 1 3
Outer-Harbour sandbar 2 2
Fluvial
Flowing into East Arm 1 1
Flowing into Mid Arm 1 2 2 5
Flowing into West Arm 1 1 2
Subtidal, Inner Harbour
Central Inner Harbour 1 4 2 1 2 10
East Arm 3 2 1 5 1 12
Mid Arm 9 3 4 2 18
West Arm 1 3 2 1 7
Woods Inlet 5 2 1 8
Subtidal, Outer-Harbour
Outer Harbour east 4 2 3 3 12
Outer Harbour mid 6 3 3 5 17
Outer Harbour west 3 4 7
Total number of samples 7 44 44 34 22 1 152
Total percentage of each
kurtosis category 4.61% 28.95% 28.95% 22.37% 14.47% 0.66% 100%
33.55% 28.95% 37.50%
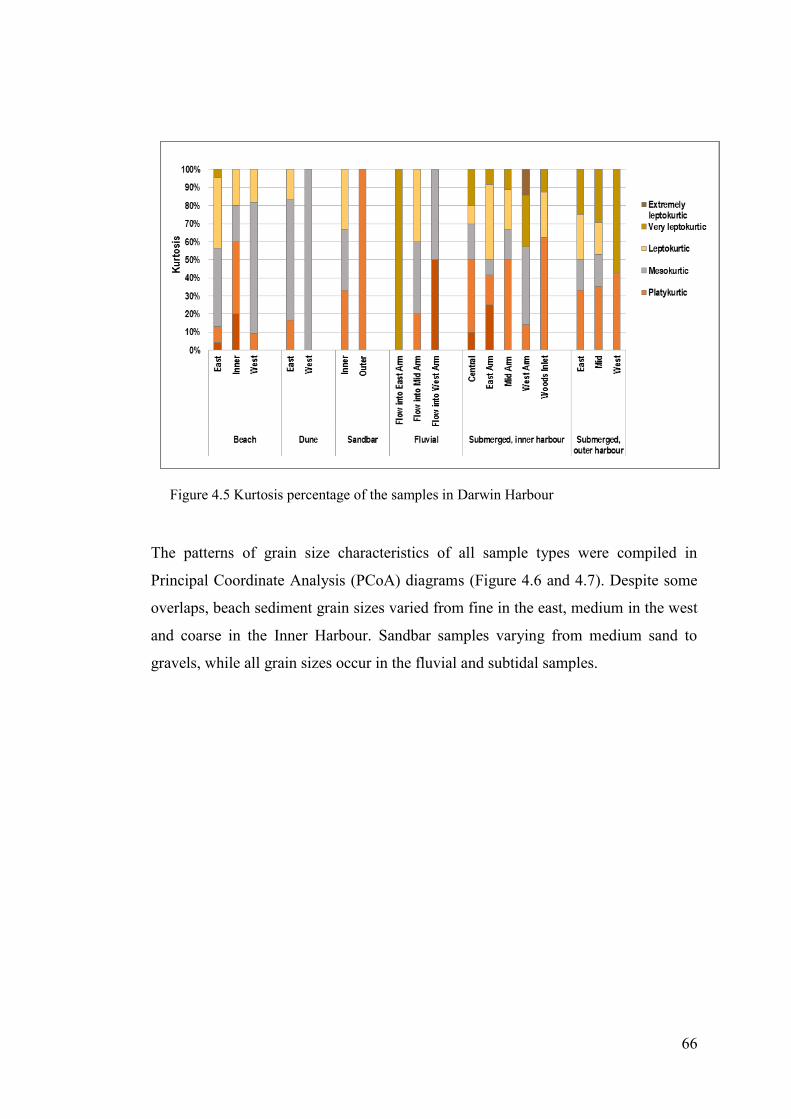
66
The patterns of grain size characteristics of all sample types were compiled in
Principal Coordinate Analysis (PCoA) diagrams (Figure 4.6 and 4.7). Despite some
overlaps, beach sediment grain sizes varied from fine in the east, medium in the west
and coarse in the Inner Harbour. Sandbar samples varying from medium sand to
gravels, while all grain sizes occur in the fluvial and subtidal samples.
Figure 4.5 Kurtosis percentage of the samples in Darwin Harbour
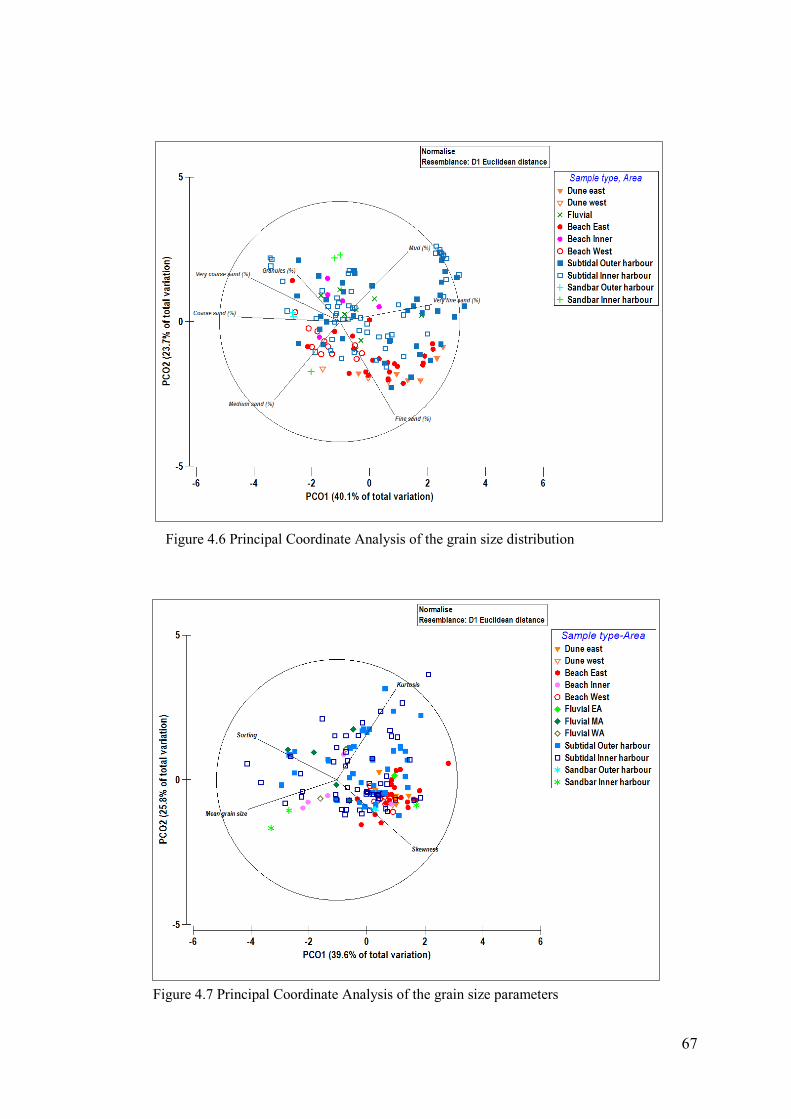
67
Figure 4.6 Principal Coordinate Analysis of the grain size distribution
Figure 4.7 Principal Coordinate Analysis of the grain size parameters
68
The PCoA in Figure 4.6 confirms that the finer grain size tends to reside in the
eastern beaches and a large part of the Outer Harbour, while Figure 4.7 shows that
the grain size parameters of Darwin Harbour sediment are not well related. The
coarser grain sizes tend to occur in the western beaches with the coarsest grain sizes
presenting in the Inner Harbour beaches, sandbars and most of the fluvial and Inner
Harbour sediment.
4.3.2 Calcium carbonate
The calcium carbonate (CaCO3) content of the samples ranged widely, from 1% to
almost 90% (Figure 4.7 and 4.8). The lowest CaCO3 content was found in the fluvial
samples. The rock samples also showed low CaCO3, particularly those from the
Inner Harbour (i.e. from Doctor’s Gully and Silversands Beach) and from the
western beaches (i.e. adjacent to the Charles Point Lighthouse).
The subtidal samples have variable CaCO3 content. The Inner Harbour samples,
particularly from upstream sections of the creeks and Harbour arms, contain less
CaCO3 compared to the Outer Harbour sand. However, the samples collected
between Channel Island and the mainland have high values of CaCO3, the highest of
all samples. On the other hand, the samples collected from the western beaches and
dunes, as well as the Inner Harbour beaches, contain much less CaCO3 compared to
the eastern beaches. Many of the samples with high CaCO3 content are located close
to the coral communities in Darwin Harbour (Fig 4.8).
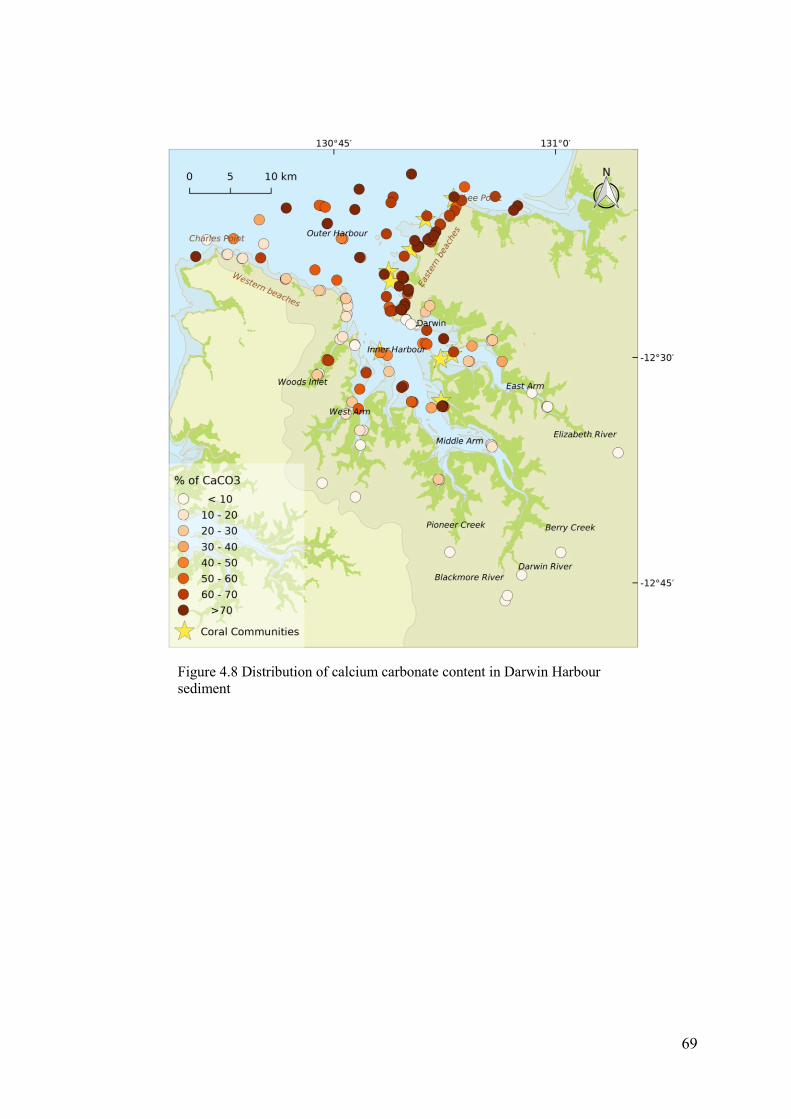
69
Figure 4.8 Distribution of calcium carbonate content in Darwin Harbour
sediment
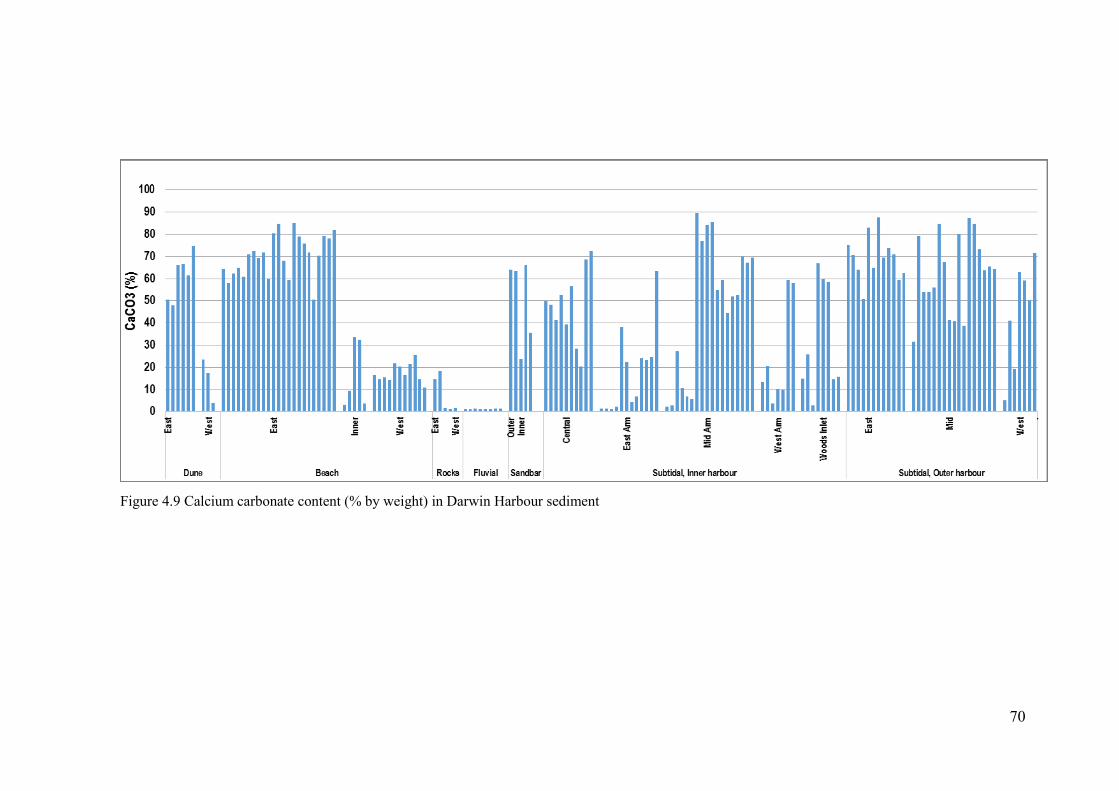
70
Figure 4.9 Calcium carbonate content (% by weight) in Darwin Harbour sediment
71
4.3.3 Sediment elemental composition
The results of the sediment elemental composition will be presented firstly in
comparison with the sand grain size distributions to infer the correlations between
the geochemical characteristics and the sand-sized grain size distributions. The
analysis was based on the Euclidean distances among the variables: the further the
distance, the less similar the variables, meaning less correlation between them. As
the first step, the variables used in the analyses were all the elements, the CaCO3
concentration and the grain size distribution variables. Using a similarity matrix and
a clustering analysis, the correlation among the variables is visually presented in a
non-metric multidimensional scaling (MDS) diagram.
Secondly the similarity among the sample types, from which source-sink
relationships have been inferred were determined using a metric multidimensional
scaling analysis namely Principal Coordinate Analysis (PCoA). Sample types that are
clustered closely infer a possible source and sink relationships. Beaches, dunes and
sandbars are the potential sand-sized sediment sinks for sand originating from the
fluvial, rocks and inner continental shelf/Outer Harbour. Sandbars and dunes can be
considered as both sink and transitional sources of sediment to the nearby beaches
(and dunes).
The correlation of the geochemical elements and the sand-sized grain size
distributions is presented as an MDS diagram (2D configuration, Kruskal Stress
Formula 1) in Figure 4.10.
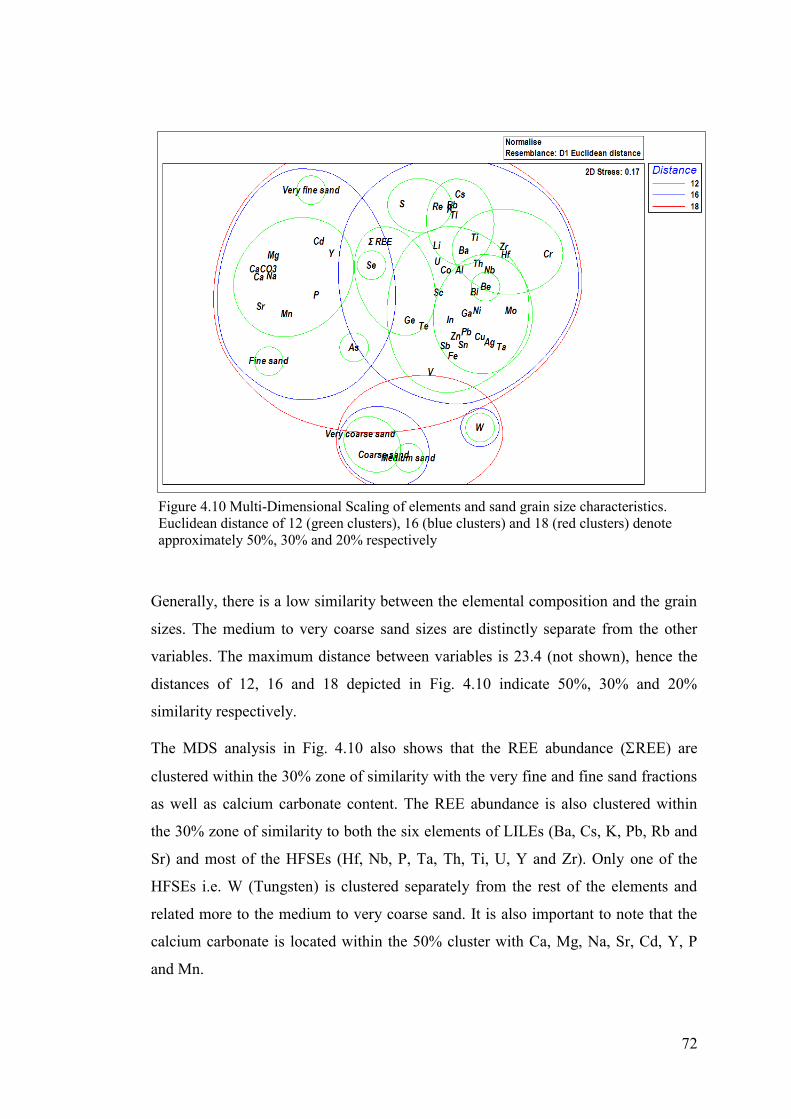
72
Generally, there is a low similarity between the elemental composition and the grain
sizes. The medium to very coarse sand sizes are distinctly separate from the other
variables. The maximum distance between variables is 23.4 (not shown), hence the
distances of 12, 16 and 18 depicted in Fig. 4.10 indicate 50%, 30% and 20%
similarity respectively.
The MDS analysis in Fig. 4.10 also shows that the REE abundance (REE) are
clustered within the 30% zone of similarity with the very fine and fine sand fractions
as well as calcium carbonate content. The REE abundance is also clustered within
the 30% zone of similarity to both the six elements of LILEs (Ba, Cs, K, Pb, Rb and
Sr) and most of the HFSEs (Hf, Nb, P, Ta, Th, Ti, U, Y and Zr). Only one of the
HFSEs i.e. W (Tungsten) is clustered separately from the rest of the elements and
related more to the medium to very coarse sand. It is also important to note that the
calcium carbonate is located within the 50% cluster with Ca, Mg, Na, Sr, Cd, Y, P
and Mn.
Figure 4.10 Multi-Dimensional Scaling of elements and sand grain size characteristics.
Euclidean distance of 12 (green clusters), 16 (blue clusters) and 18 (red clusters) denote
approximately 50%, 30% and 20% respectively
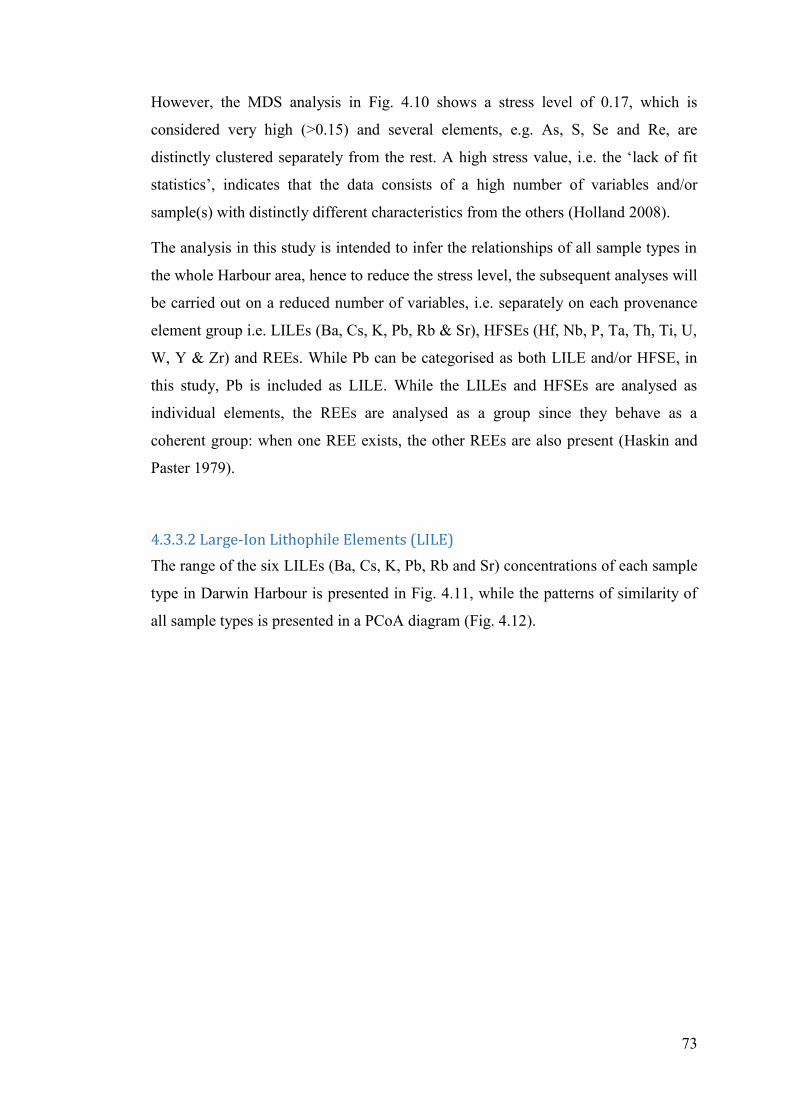
73
However, the MDS analysis in Fig. 4.10 shows a stress level of 0.17, which is
considered very high (>0.15) and several elements, e.g. As, S, Se and Re, are
distinctly clustered separately from the rest. A high stress value, i.e. the ‘lack of fit
statistics’, indicates that the data consists of a high number of variables and/or
sample(s) with distinctly different characteristics from the others (Holland 2008).
The analysis in this study is intended to infer the relationships of all sample types in
the whole Harbour area, hence to reduce the stress level, the subsequent analyses will
be carried out on a reduced number of variables, i.e. separately on each provenance
element group i.e. LILEs (Ba, Cs, K, Pb, Rb & Sr), HFSEs (Hf, Nb, P, Ta, Th, Ti, U,
W, Y & Zr) and REEs. While Pb can be categorised as both LILE and/or HFSE, in
this study, Pb is included as LILE. While the LILEs and HFSEs are analysed as
individual elements, the REEs are analysed as a group since they behave as a
coherent group: when one REE exists, the other REEs are also present (Haskin and
Paster 1979).
4.3.3.2 Large-Ion Lithophile Elements (LILE)
The range of the six LILEs (Ba, Cs, K, Pb, Rb and Sr) concentrations of each sample
type in Darwin Harbour is presented in Fig. 4.11, while the patterns of similarity of
all sample types is presented in a PCoA diagram (Fig. 4.12).
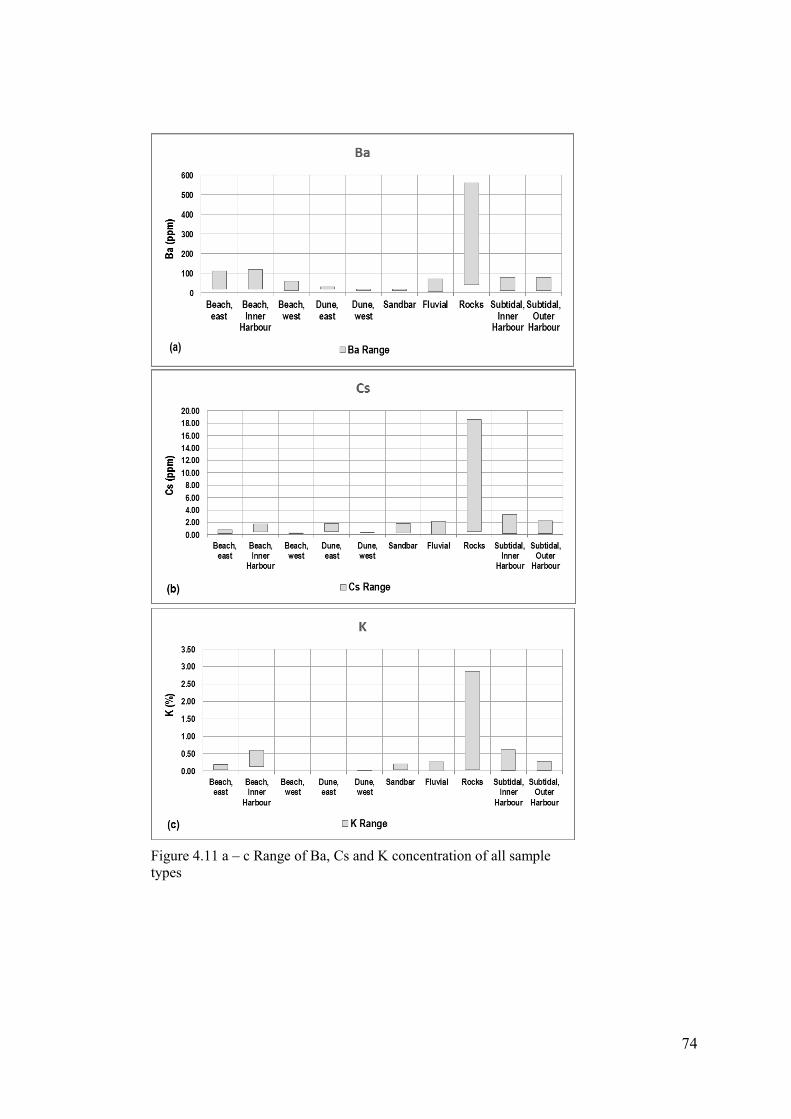
74
Figure 4.11 a – c Range of Ba, Cs and K concentration of all sample
types
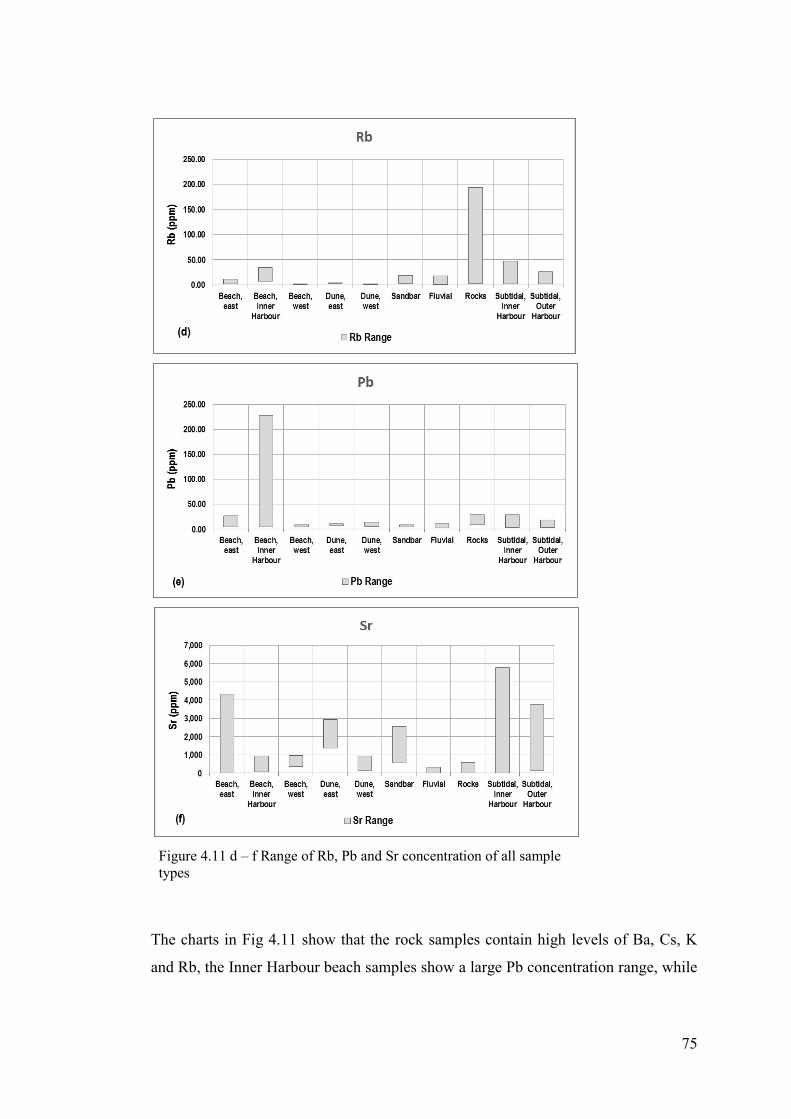
75
The charts in Fig 4.11 show that the rock samples contain high levels of Ba, Cs, K
and Rb, the Inner Harbour beach samples show a large Pb concentration range, while
Figure 4.11 d – f Range of Rb, Pb and Sr concentration of all sample
types
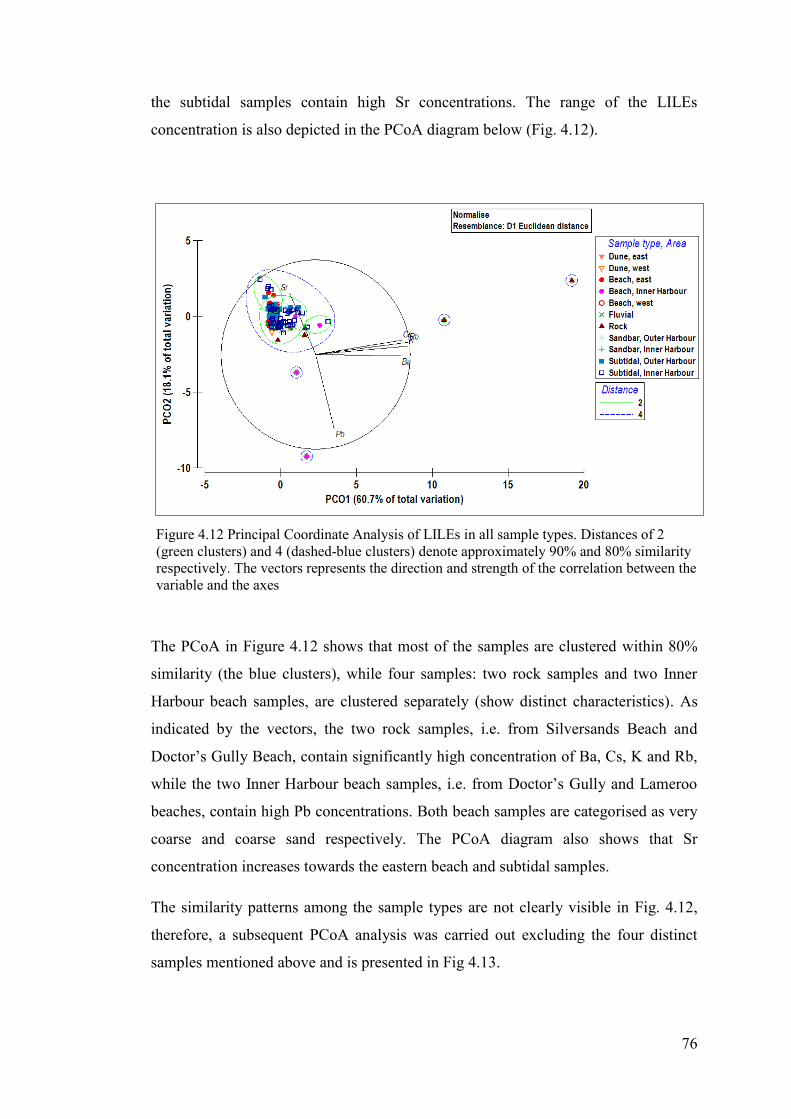
76
the subtidal samples contain high Sr concentrations. The range of the LILEs
concentration is also depicted in the PCoA diagram below (Fig. 4.12).
The PCoA in Figure 4.12 shows that most of the samples are clustered within 80%
similarity (the blue clusters), while four samples: two rock samples and two Inner
Harbour beach samples, are clustered separately (show distinct characteristics). As
indicated by the vectors, the two rock samples, i.e. from Silversands Beach and
Doctor’s Gully Beach, contain significantly high concentration of Ba, Cs, K and Rb,
while the two Inner Harbour beach samples, i.e. from Doctor’s Gully and Lameroo
beaches, contain high Pb concentrations. Both beach samples are categorised as very
coarse and coarse sand respectively. The PCoA diagram also shows that Sr
concentration increases towards the eastern beach and subtidal samples.
The similarity patterns among the sample types are not clearly visible in Fig. 4.12,
therefore, a subsequent PCoA analysis was carried out excluding the four distinct
samples mentioned above and is presented in Fig 4.13.
Figure 4.12 Principal Coordinate Analysis of LILEs in all sample types. Distances of 2
(green clusters) and 4 (dashed-blue clusters) denote approximately 90% and 80% similarity
respectively. The vectors represents the direction and strength of the correlation between the
variable and the axes
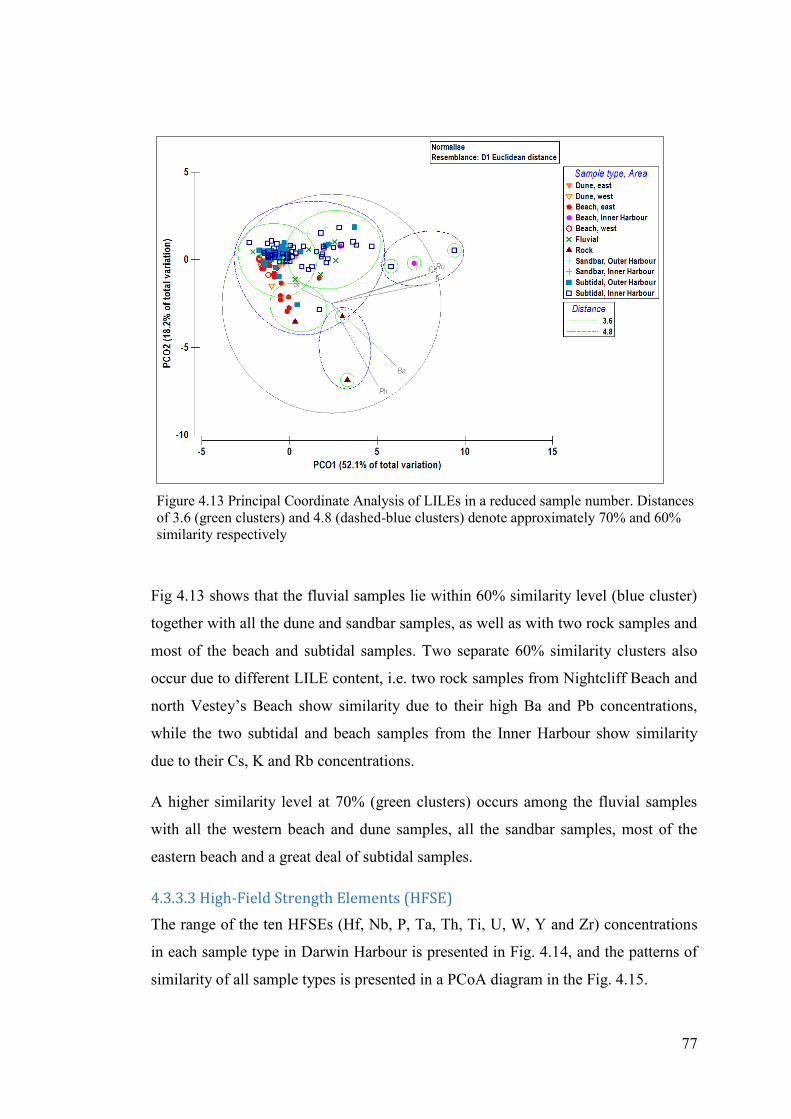
77
Fig 4.13 shows that the fluvial samples lie within 60% similarity level (blue cluster)
together with all the dune and sandbar samples, as well as with two rock samples and
most of the beach and subtidal samples. Two separate 60% similarity clusters also
occur due to different LILE content, i.e. two rock samples from Nightcliff Beach and
north Vestey’s Beach show similarity due to their high Ba and Pb concentrations,
while the two subtidal and beach samples from the Inner Harbour show similarity
due to their Cs, K and Rb concentrations.
A higher similarity level at 70% (green clusters) occurs among the fluvial samples
with all the western beach and dune samples, all the sandbar samples, most of the
eastern beach and a great deal of subtidal samples.
4.3.3.3 High-Field Strength Elements (HFSE)
The range of the ten HFSEs (Hf, Nb, P, Ta, Th, Ti, U, W, Y and Zr) concentrations
in each sample type in Darwin Harbour is presented in Fig. 4.14, and the patterns of
similarity of all sample types is presented in a PCoA diagram in the Fig. 4.15.
Figure 4.13 Principal Coordinate Analysis of LILEs in a reduced sample number. Distances
of 3.6 (green clusters) and 4.8 (dashed-blue clusters) denote approximately 70% and 60%
similarity respectively
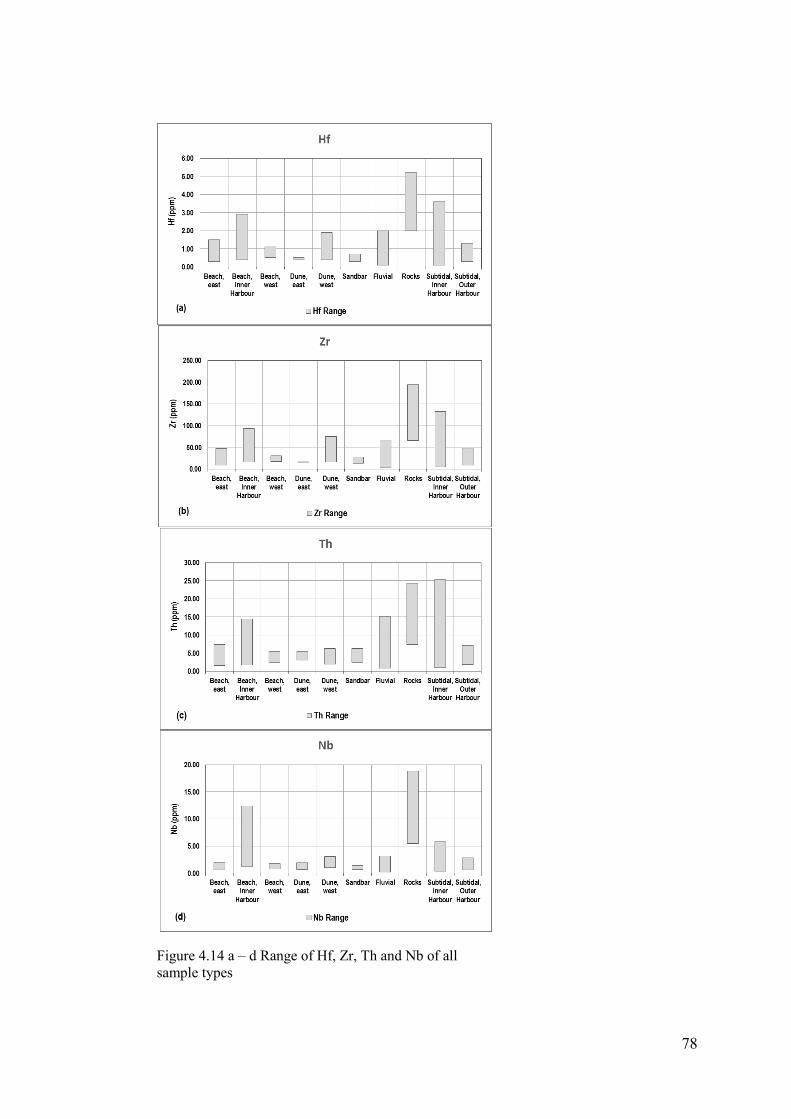
78
Figure 4.14 a – d Range of Hf, Zr, Th and Nb of all
sample types
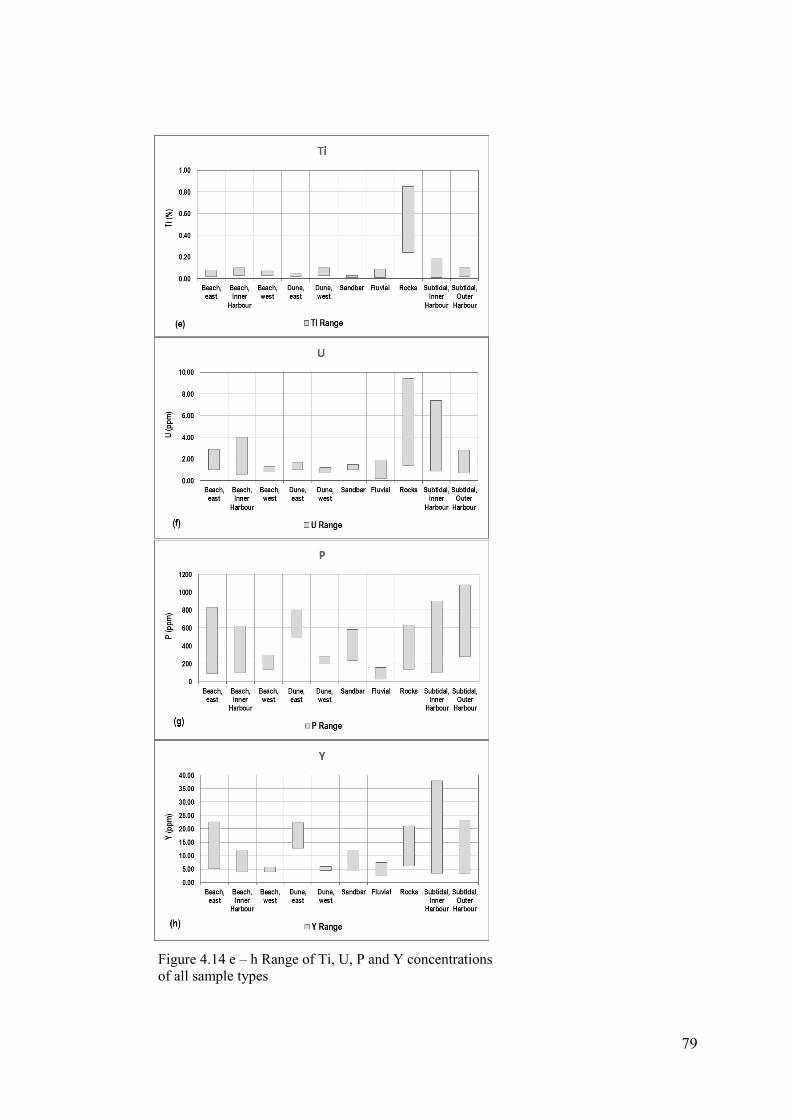
79
Figure 4.14 e – h Range of Ti, U, P and Y concentrations
of all sample types
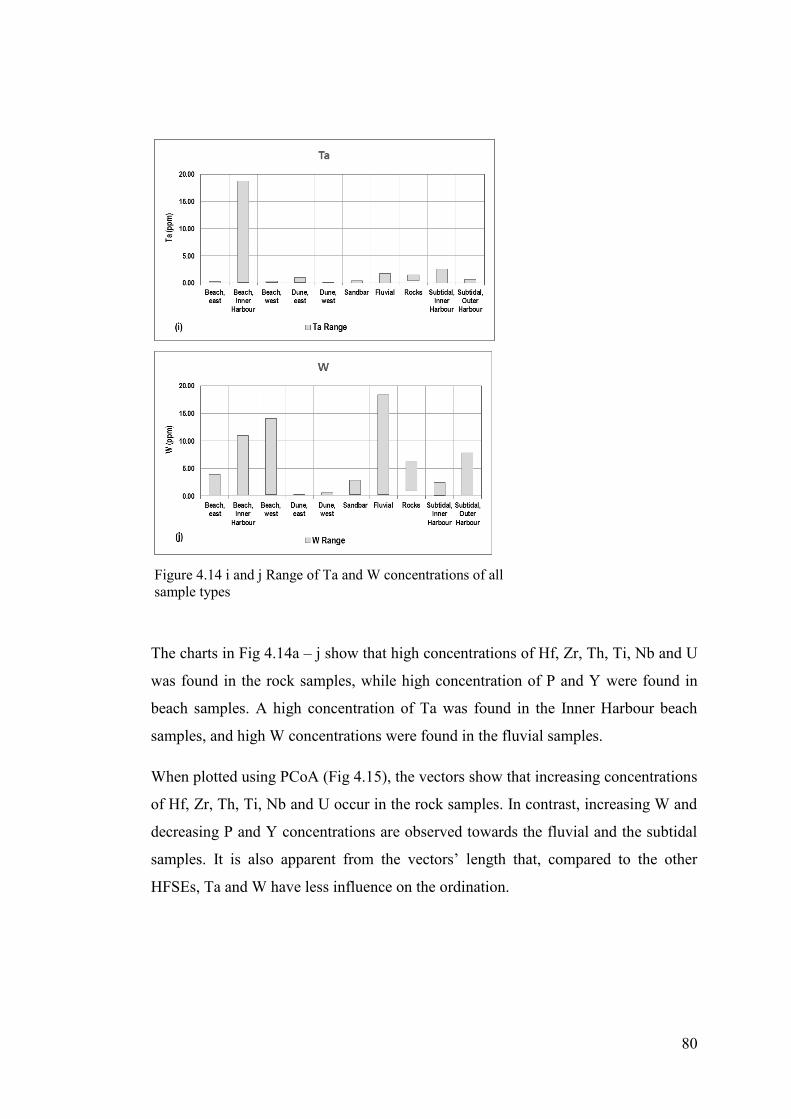
80
The charts in Fig 4.14a – j show that high concentrations of Hf, Zr, Th, Ti, Nb and U
was found in the rock samples, while high concentration of P and Y were found in
beach samples. A high concentration of Ta was found in the Inner Harbour beach
samples, and high W concentrations were found in the fluvial samples.
When plotted using PCoA (Fig 4.15), the vectors show that increasing concentrations
of Hf, Zr, Th, Ti, Nb and U occur in the rock samples. In contrast, increasing W and
decreasing P and Y concentrations are observed towards the fluvial and the subtidal
samples. It is also apparent from the vectors’ length that, compared to the other
HFSEs, Ta and W have less influence on the ordination.
Figure 4.14 i and j Range of Ta and W concentrations of all
sample types
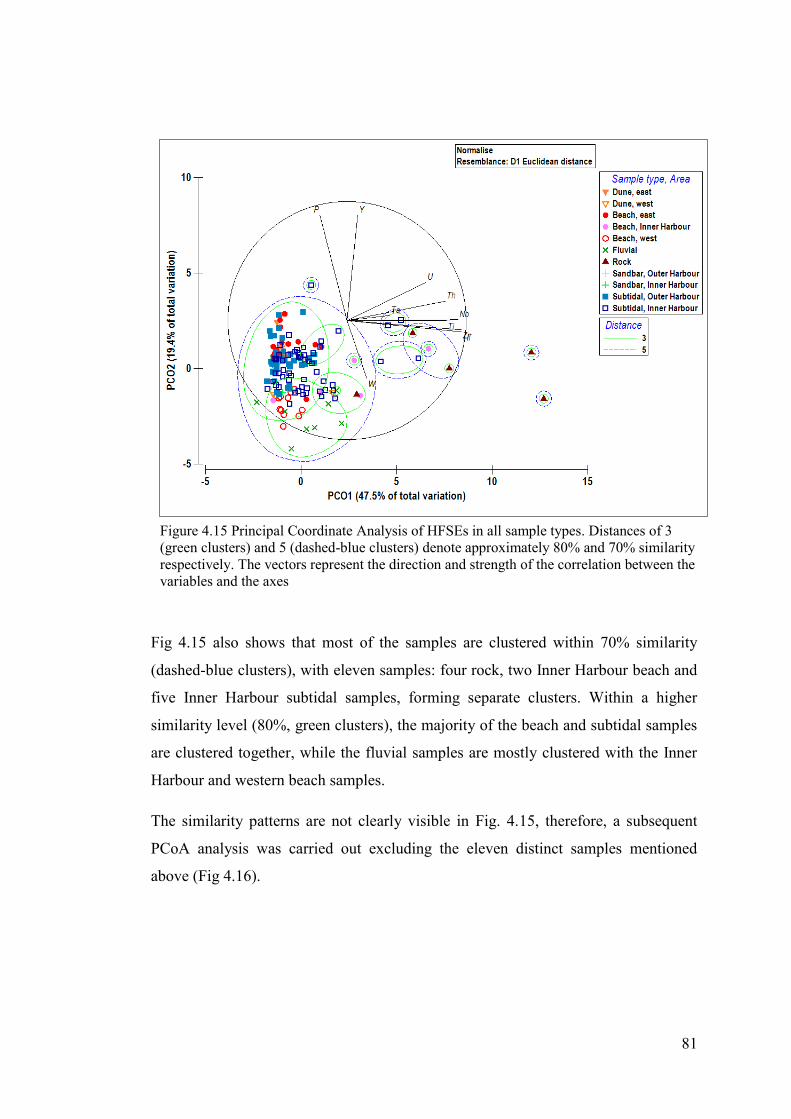
81
Fig 4.15 also shows that most of the samples are clustered within 70% similarity
(dashed-blue clusters), with eleven samples: four rock, two Inner Harbour beach and
five Inner Harbour subtidal samples, forming separate clusters. Within a higher
similarity level (80%, green clusters), the majority of the beach and subtidal samples
are clustered together, while the fluvial samples are mostly clustered with the Inner
Harbour and western beach samples.
The similarity patterns are not clearly visible in Fig. 4.15, therefore, a subsequent
PCoA analysis was carried out excluding the eleven distinct samples mentioned
above (Fig 4.16).
Figure 4.15 Principal Coordinate Analysis of HFSEs in all sample types. Distances of 3
(green clusters) and 5 (dashed-blue clusters) denote approximately 80% and 70% similarity
respectively. The vectors represent the direction and strength of the correlation between the
variables and the axes
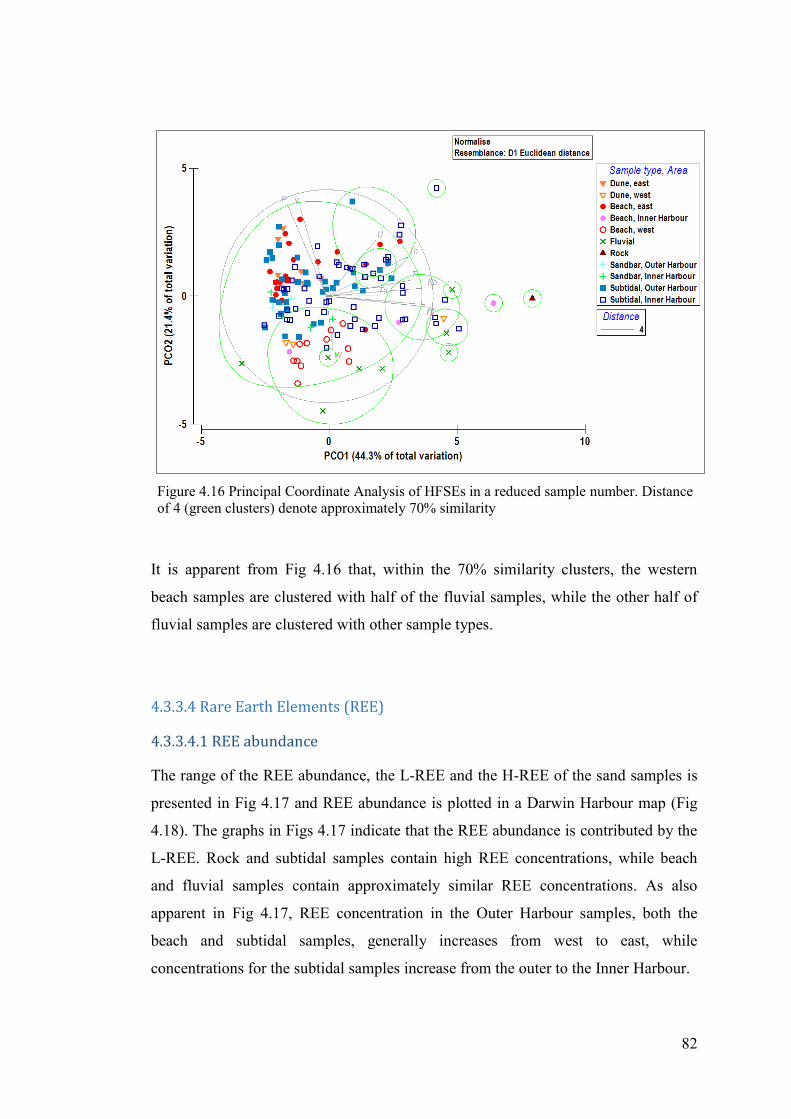
82
It is apparent from Fig 4.16 that, within the 70% similarity clusters, the western
beach samples are clustered with half of the fluvial samples, while the other half of
fluvial samples are clustered with other sample types.
4.3.3.4 Rare Earth Elements (REE)
4.3.3.4.1 REE abundance
The range of the REE abundance, the L-REE and the H-REE of the sand samples is
presented in Fig 4.17 and REE abundance is plotted in a Darwin Harbour map (Fig
4.18). The graphs in Figs 4.17 indicate that the REE abundance is contributed by the
L-REE. Rock and subtidal samples contain high REE concentrations, while beach
and fluvial samples contain approximately similar REE concentrations. As also
apparent in Fig 4.17, REE concentration in the Outer Harbour samples, both the
beach and subtidal samples, generally increases from west to east, while
concentrations for the subtidal samples increase from the outer to the Inner Harbour.
Figure 4.16 Principal Coordinate Analysis of HFSEs in a reduced sample number. Distance
of 4 (green clusters) denote approximately 70% similarity
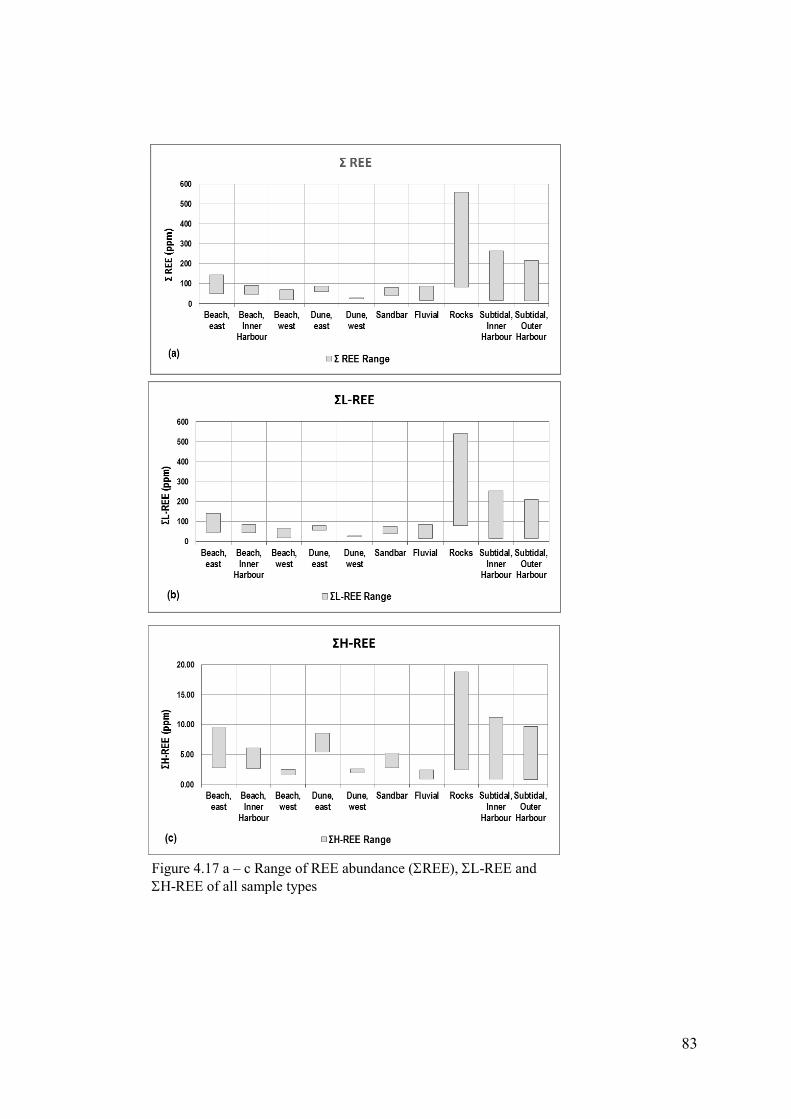
83
Figure 4.17 a – c Range of REE abundance (REE), L-REE and
H-REE of all sample types
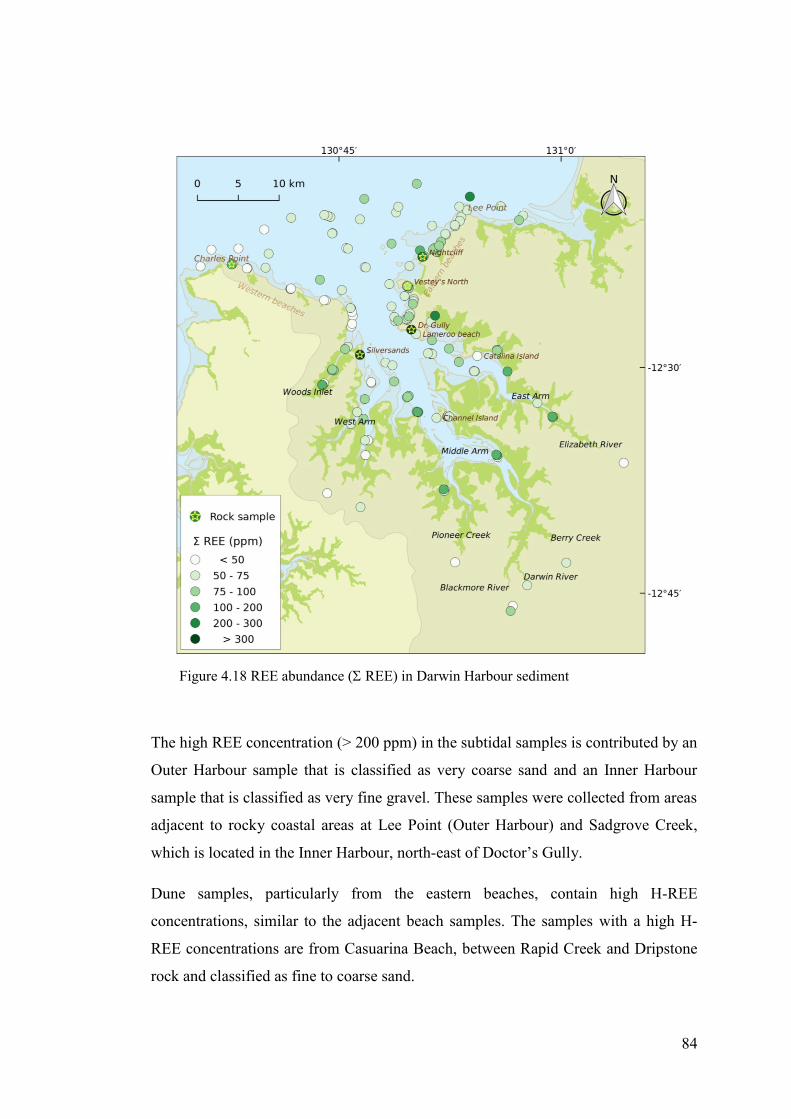
84
The high REE concentration (> 200 ppm) in the subtidal samples is contributed by an
Outer Harbour sample that is classified as very coarse sand and an Inner Harbour
sample that is classified as very fine gravel. These samples were collected from areas
adjacent to rocky coastal areas at Lee Point (Outer Harbour) and Sadgrove Creek,
which is located in the Inner Harbour, north-east of Doctor’s Gully.
Dune samples, particularly from the eastern beaches, contain high H-REE
concentrations, similar to the adjacent beach samples. The samples with a high H-
REE concentrations are from Casuarina Beach, between Rapid Creek and Dripstone
rock and classified as fine to coarse sand.
Figure 4.18 REE abundance ( REE) in Darwin Harbour sediment
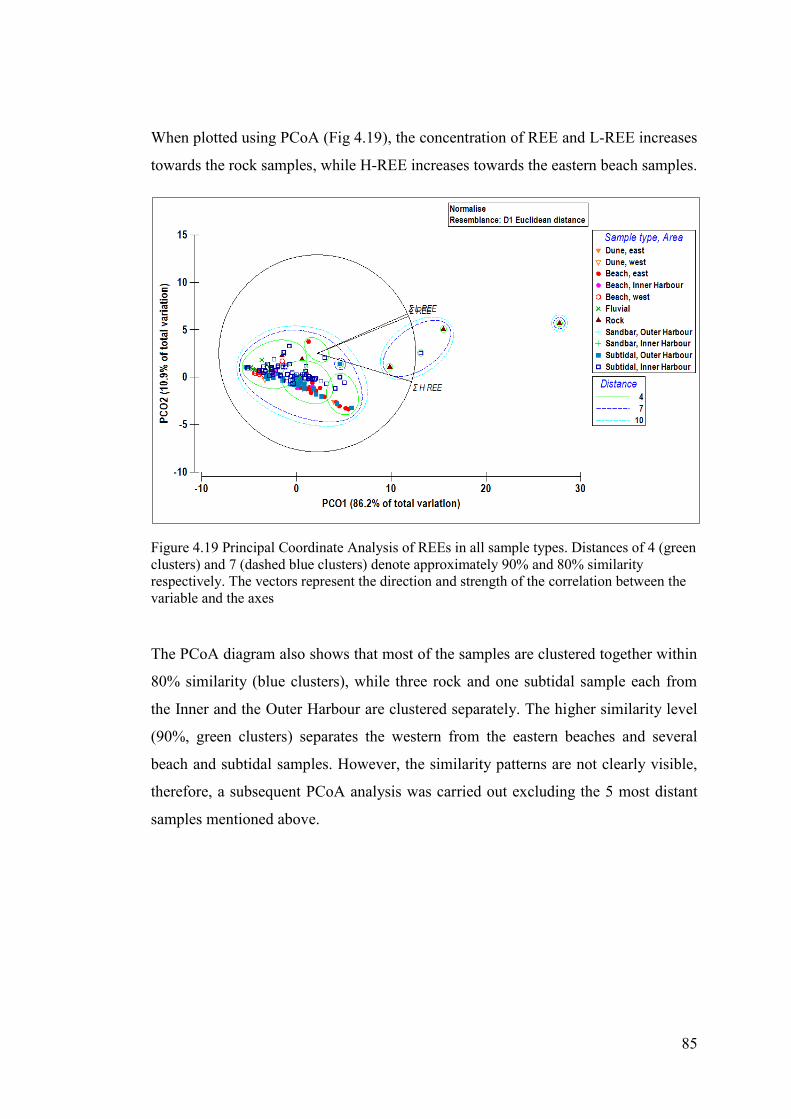
85
When plotted using PCoA (Fig 4.19), the concentration of REE and L-REE increases
towards the rock samples, while H-REE increases towards the eastern beach samples.
Figure 4.19 Principal Coordinate Analysis of REEs in all sample types. Distances of 4 (green
clusters) and 7 (dashed blue clusters) denote approximately 90% and 80% similarity
respectively. The vectors represent the direction and strength of the correlation between the
variable and the axes
The PCoA diagram also shows that most of the samples are clustered together within
80% similarity (blue clusters), while three rock and one subtidal sample each from
the Inner and the Outer Harbour are clustered separately. The higher similarity level
(90%, green clusters) separates the western from the eastern beaches and several
beach and subtidal samples. However, the similarity patterns are not clearly visible,
therefore, a subsequent PCoA analysis was carried out excluding the 5 most distant
samples mentioned above.
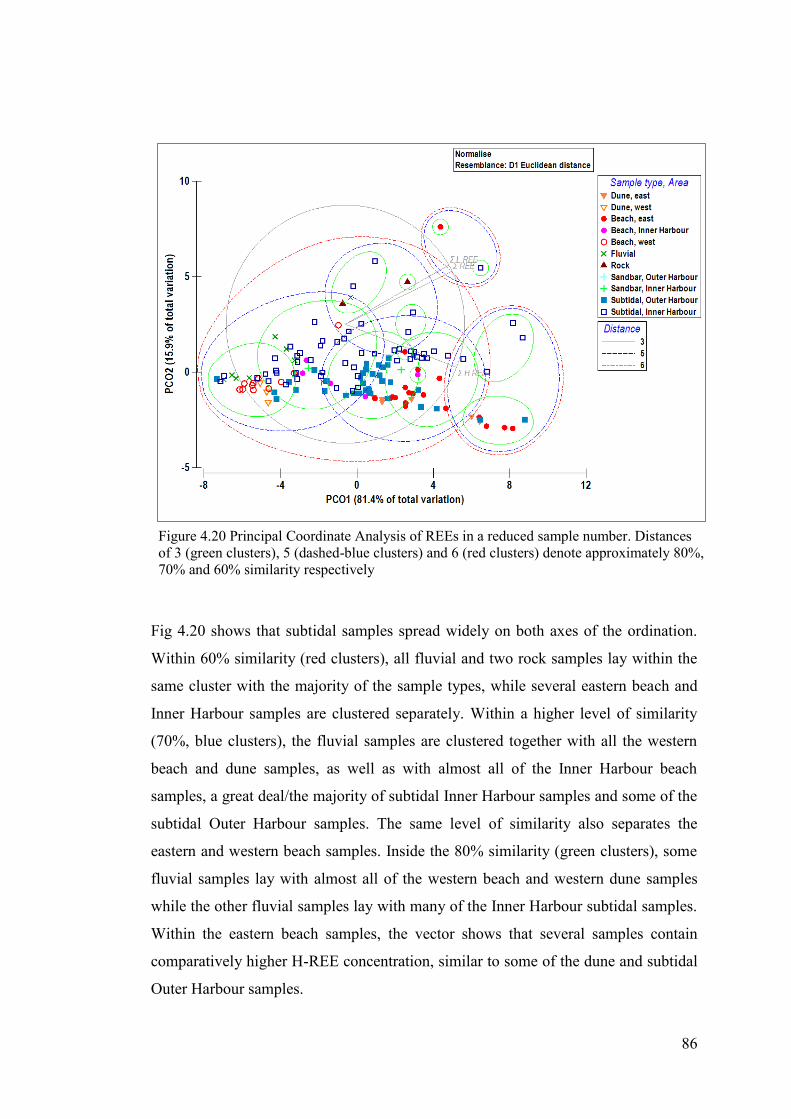
86
Fig 4.20 shows that subtidal samples spread widely on both axes of the ordination.
Within 60% similarity (red clusters), all fluvial and two rock samples lay within the
same cluster with the majority of the sample types, while several eastern beach and
Inner Harbour samples are clustered separately. Within a higher level of similarity
(70%, blue clusters), the fluvial samples are clustered together with all the western
beach and dune samples, as well as with almost all of the Inner Harbour beach
samples, a great deal/the majority of subtidal Inner Harbour samples and some of the
subtidal Outer Harbour samples. The same level of similarity also separates the
eastern and western beach samples. Inside the 80% similarity (green clusters), some
fluvial samples lay with almost all of the western beach and western dune samples
while the other fluvial samples lay with many of the Inner Harbour subtidal samples.
Within the eastern beach samples, the vector shows that several samples contain
comparatively higher H-REE concentration, similar to some of the dune and subtidal
Outer Harbour samples.
Figure 4.20 Principal Coordinate Analysis of REEs in a reduced sample number. Distances
of 3 (green clusters), 5 (dashed-blue clusters) and 6 (red clusters) denote approximately 80%,
70% and 60% similarity respectively
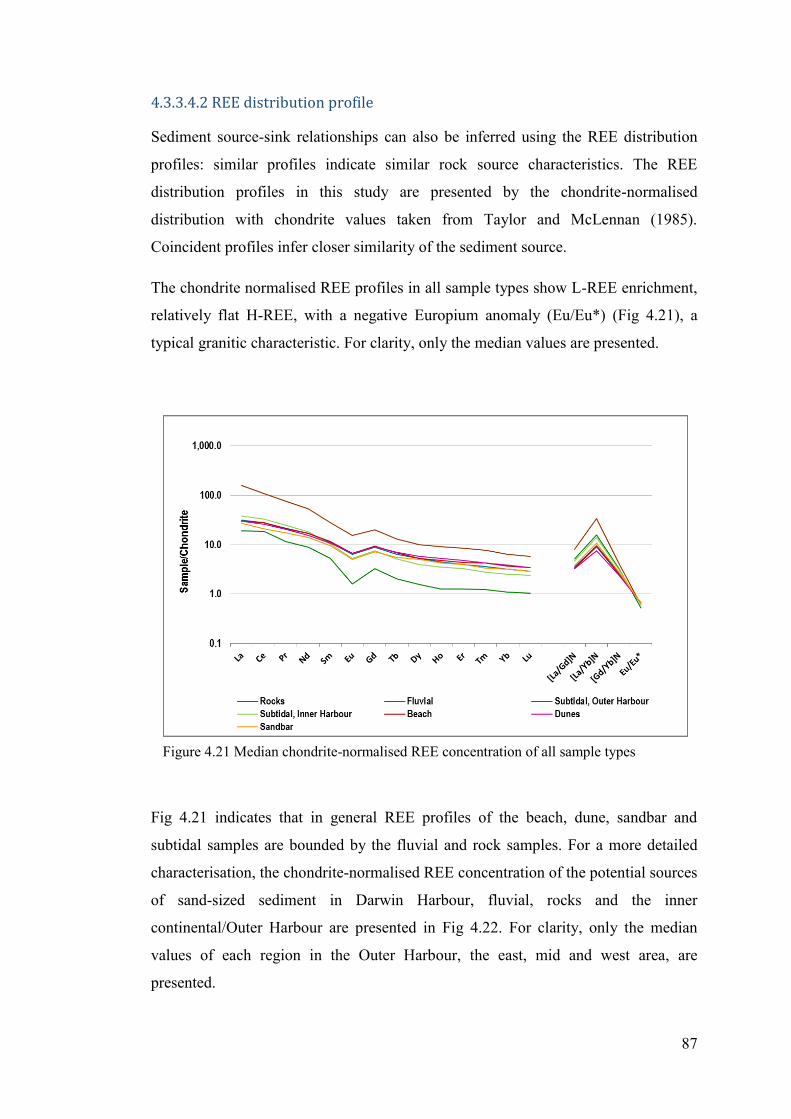
87
4.3.3.4.2 REE distribution profile
Sediment source-sink relationships can also be inferred using the REE distribution
profiles: similar profiles indicate similar rock source characteristics. The REE
distribution profiles in this study are presented by the chondrite-normalised
distribution with chondrite values taken from Taylor and McLennan (1985).
Coincident profiles infer closer similarity of the sediment source.
The chondrite normalised REE profiles in all sample types show L-REE enrichment,
relatively flat H-REE, with a negative Europium anomaly (Eu/Eu*) (Fig 4.21), a
typical granitic characteristic. For clarity, only the median values are presented.
Fig 4.21 indicates that in general REE profiles of the beach, dune, sandbar and
subtidal samples are bounded by the fluvial and rock samples. For a more detailed
characterisation, the chondrite-normalised REE concentration of the potential sources
of sand-sized sediment in Darwin Harbour, fluvial, rocks and the inner
continental/Outer Harbour are presented in Fig 4.22. For clarity, only the median
values of each region in the Outer Harbour, the east, mid and west area, are
presented.
Figure 4.21 Median chondrite-normalised REE concentration of all sample types
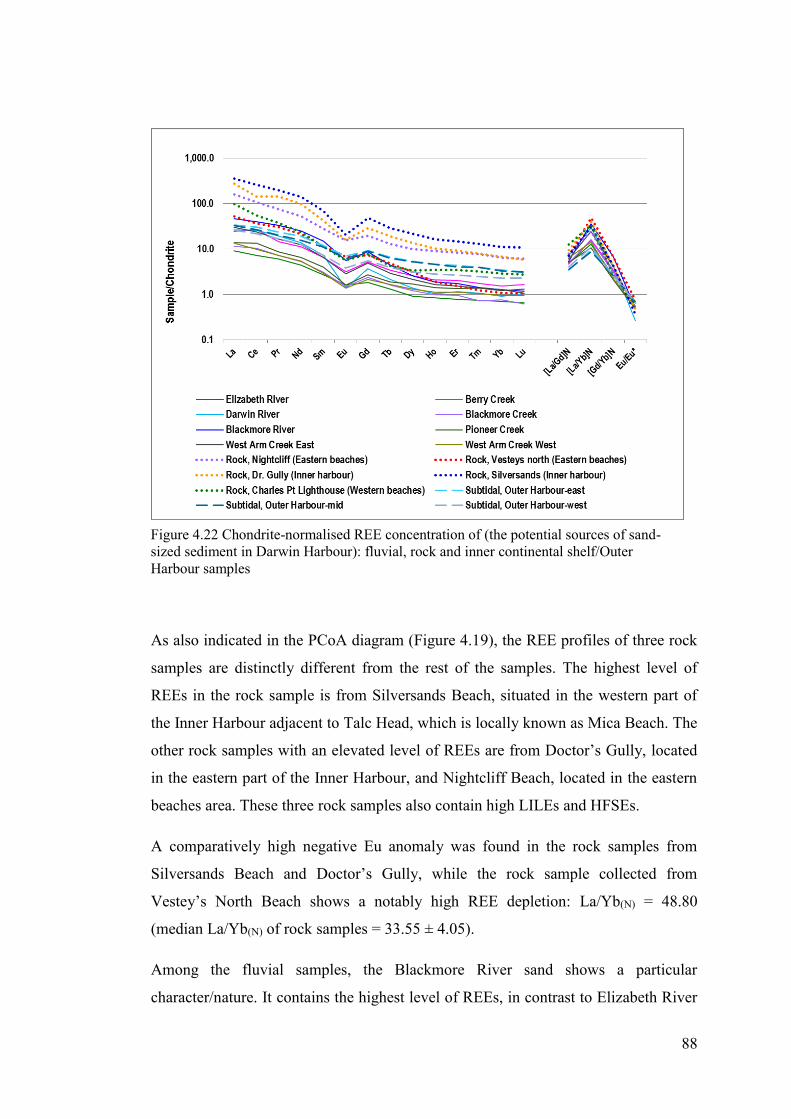
88
As also indicated in the PCoA diagram (Figure 4.19), the REE profiles of three rock
samples are distinctly different from the rest of the samples. The highest level of
REEs in the rock sample is from Silversands Beach, situated in the western part of
the Inner Harbour adjacent to Talc Head, which is locally known as Mica Beach. The
other rock samples with an elevated level of REEs are from Doctor’s Gully, located
in the eastern part of the Inner Harbour, and Nightcliff Beach, located in the eastern
beaches area. These three rock samples also contain high LILEs and HFSEs.
A comparatively high negative Eu anomaly was found in the rock samples from
Silversands Beach and Doctor’s Gully, while the rock sample collected from
Vestey’s North Beach shows a notably high REE depletion: La/Yb(N) = 48.80
(median La/Yb(N) of rock samples = 33.55 ± 4.05).
Among the fluvial samples, the Blackmore River sand shows a particular
character/nature. It contains the highest level of REEs, in contrast to Elizabeth River
Figure 4.22 Chondrite-normalised REE concentration of (the potential sources of sand-
sized sediment in Darwin Harbour): fluvial, rock and inner continental shelf/Outer
Harbour samples
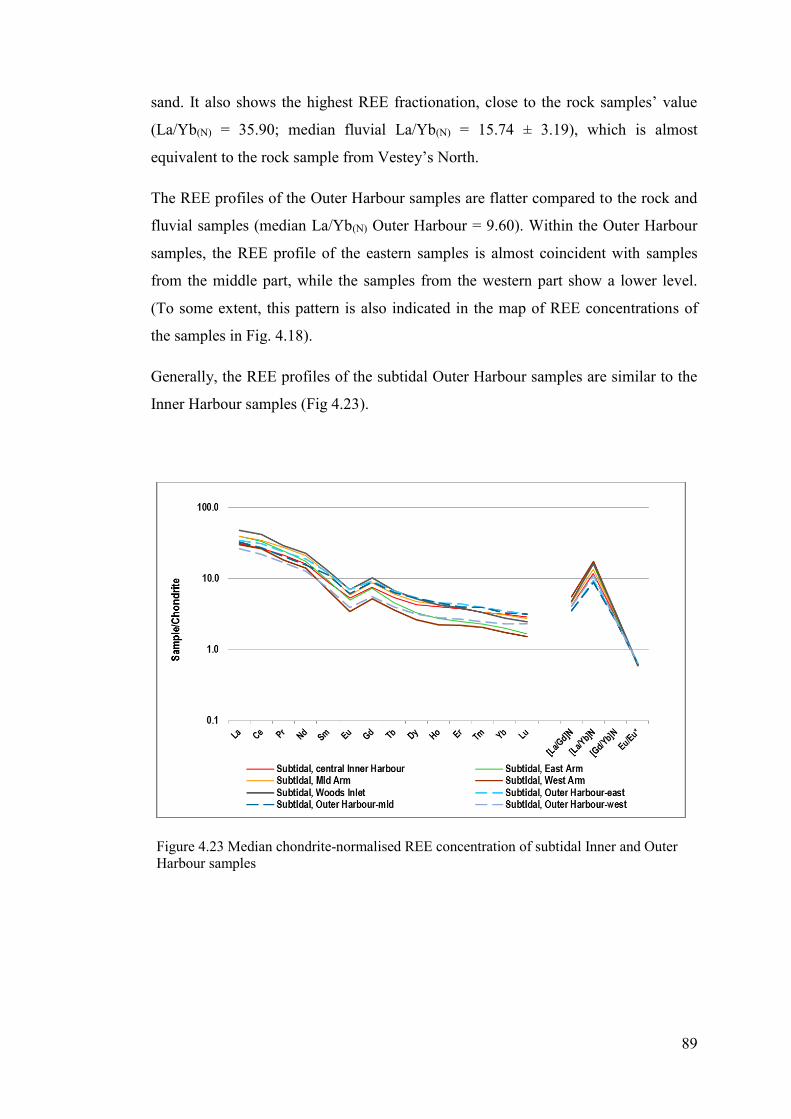
89
sand. It also shows the highest REE fractionation, close to the rock samples’ value
(La/Yb(N) = 35.90; median fluvial La/Yb(N) = 15.74 ± 3.19), which is almost
equivalent to the rock sample from Vestey’s North.
The REE profiles of the Outer Harbour samples are flatter compared to the rock and
fluvial samples (median La/Yb(N) Outer Harbour = 9.60). Within the Outer Harbour
samples, the REE profile of the eastern samples is almost coincident with samples
from the middle part, while the samples from the western part show a lower level.
(To some extent, this pattern is also indicated in the map of REE concentrations of
the samples in Fig. 4.18).
Generally, the REE profiles of the subtidal Outer Harbour samples are similar to the
Inner Harbour samples (Fig 4.23).
Figure 4.23 Median chondrite-normalised REE concentration of subtidal Inner and Outer
Harbour samples
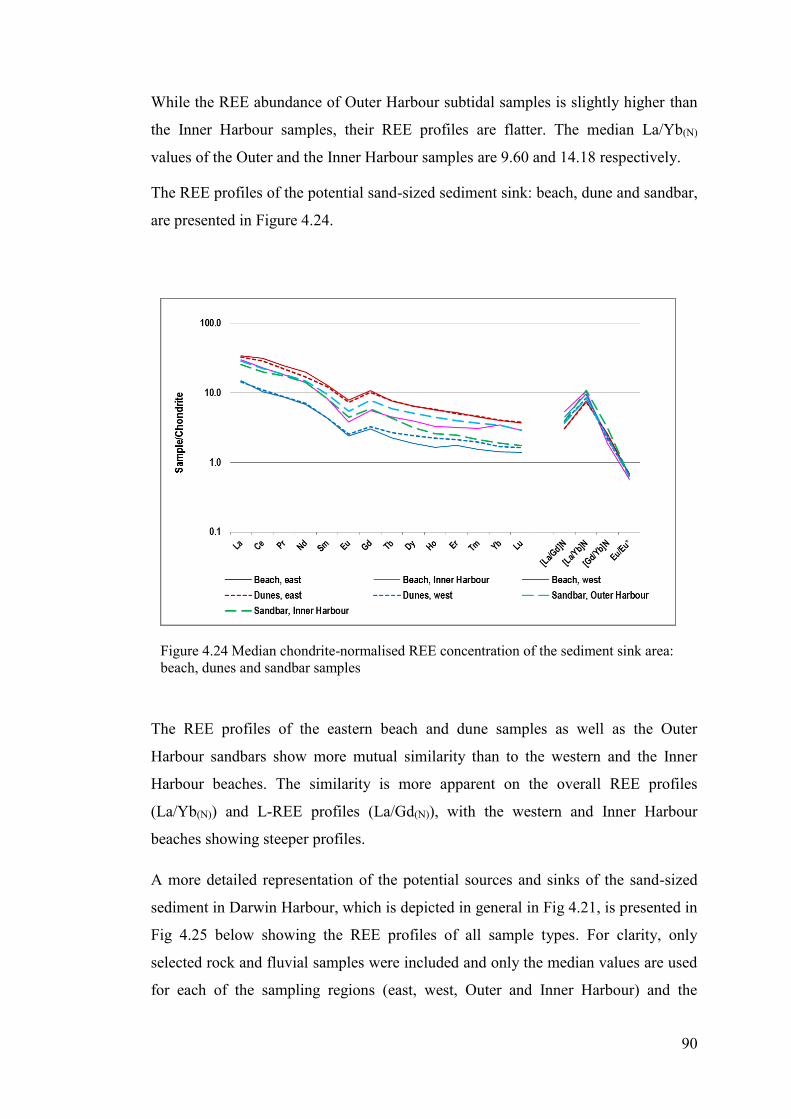
90
While the REE abundance of Outer Harbour subtidal samples is slightly higher than
the Inner Harbour samples, their REE profiles are flatter. The median La/Yb(N)
values of the Outer and the Inner Harbour samples are 9.60 and 14.18 respectively.
The REE profiles of the potential sand-sized sediment sink: beach, dune and sandbar,
are presented in Figure 4.24.
The REE profiles of the eastern beach and dune samples as well as the Outer
Harbour sandbars show more mutual similarity than to the western and the Inner
Harbour beaches. The similarity is more apparent on the overall REE profiles
(La/Yb(N)) and L-REE profiles (La/Gd(N)), with the western and Inner Harbour
beaches showing steeper profiles.
A more detailed representation of the potential sources and sinks of the sand-sized
sediment in Darwin Harbour, which is depicted in general in Fig 4.21, is presented in
Fig 4.25 below showing the REE profiles of all sample types. For clarity, only
selected rock and fluvial samples were included and only the median values are used
for each of the sampling regions (east, west, Outer and Inner Harbour) and the
Figure 4.24 Median chondrite-normalised REE concentration of the sediment sink area:
beach, dunes and sandbar samples
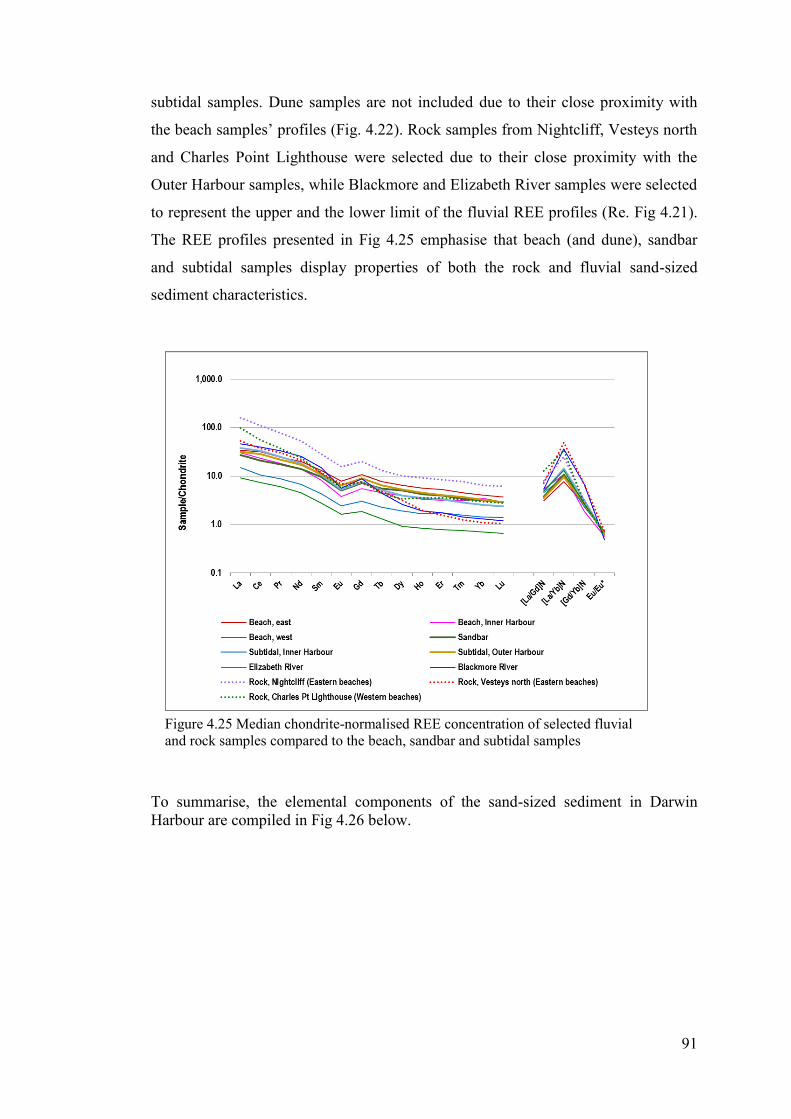
91
subtidal samples. Dune samples are not included due to their close proximity with
the beach samples’ profiles (Fig. 4.22). Rock samples from Nightcliff, Vesteys north
and Charles Point Lighthouse were selected due to their close proximity with the
Outer Harbour samples, while Blackmore and Elizabeth River samples were selected
to represent the upper and the lower limit of the fluvial REE profiles (Re. Fig 4.21).
The REE profiles presented in Fig 4.25 emphasise that beach (and dune), sandbar
and subtidal samples display properties of both the rock and fluvial sand-sized
sediment characteristics.
To summarise, the elemental components of the sand-sized sediment in Darwin
Harbour are compiled in Fig 4.26 below.
Figure 4.25 Median chondrite-normalised REE concentration of selected fluvial
and rock samples compared to the beach, sandbar and subtidal samples
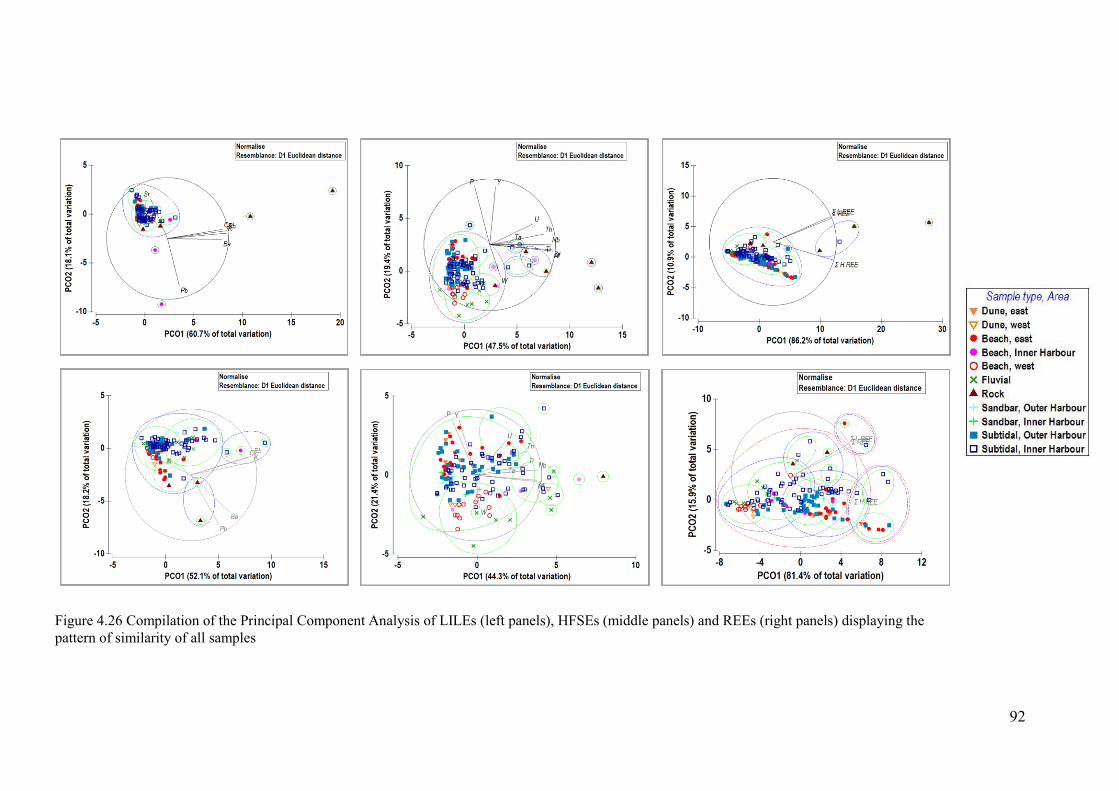
92
Figure 4.26 Compilation of the Principal Component Analysis of LILEs (left panels), HFSEs (middle panels) and REEs (right panels) displaying the
pattern of similarity of all samples
93
4.4 Discussion
The sediment in Darwin Harbour is subject to complex hydrodynamic sorting and
mixing during transport and deposition that results in spatially heterogeneous grain
size distribution and elemental composition. As a major sediment depositional area
in a coastal system (Bird 2000), beach sediment characteristics can be used to track
the pathways and sources of the coastal sediment.
4.4.1 Grain size distribution
The sand-sized sediment in Darwin Harbour is predominantly classified as poorly-
sorted, which can be observed in all sample types. While general knowledge, based
on fluvial studies, suggests that fine sediment depositional location is further from
the source compared to the coarser sized sediment, and high transport medium
velocity produces a better sorted sediment, previous studies advised that the inter-
relationship of grain size distribution parameters is environmentally sensitive (Folk
& Ward 1957; Friedman 1962; Folk 1980; McLaren & Bowles 1985; Le Roux
2005). In particular, mean grain size and sorting conditions are largely determined by
the size range available in the source area and transport medium characteristics. Folk
(1980) argued that beside the fact that finer sediment is inherently carried further
away from the source, the first factor influencing the grain size in a certain
environment is generally the available grain size of the source rocks and soils,
regardless of the strength of the transport medium. Furthermore, Folk also deduced
that, apart from the size range of sediment available in the source area, the transport
medium characteristics are a large factor determining the sediment sorting. For
example, beach sand originating from an eroded cliff can be poorly-sorted when the
continual supply of poorly-sorted rock fragments/detritus is greater than the ability of
waves/currents to transport the sediment further away. Additionally, an area with a
constant strength of current velocity, whether low or high, will result in a better
sorting of sediment than currents that fluctuate rapidly from weak to strong, such as
in a swash zone. When the size range availability of the source area is not a prevalent
factor, the best sorting of sediment occurs when flow velocity is of intermediate
strength and of constant strength (Folk 1980).
Darwin Harbour is subject to a high and fluctuating tidal current velocity due to its
semi-diurnal and macro-tidal characteristics. Previous studies found that a maximum
94
tidal current velocity of up to 2.0 ms-1 can take place in the middle of the Harbour,
particularly in the Middle Arm area (Williams 2009; Li 2013). This high current and
fluctuating velocity due to flood and ebb tide, along with the tidal asymmetry
(Williams, Wolanski & Spagnol 2006; Li et al. 2012; Andutta et al. 2014), fit the
environmental factors indicated by Folk (1980) and result in predominantly poorly
sorted sediment in the Harbour.
The fluvial sediment that ranges from very fine to very coarse sand is classified as
poorly to very poorly-sorted. Heavy storms during the monsoonal wet season
frequently cause floods in the Darwin Harbour catchment area that bring sediment
downstream into the Harbour and deposit the sediment in the low current velocity
areas, such as the mangrove fringes (Padovan 2003; McKinnon et al. 2006).
However, the Inner Harbour sediment, while similarly classified as poorly to very
poorly-sorted, ranges from mud to very fine gravel sediment. While the mud fraction
might be both continental shelf and/or fluvial origin (Darwin Harbour Advisory
Committee 2006), the very fine gravel sediment is likely to be locally derived,
possibly from the eroded rock bordering the Inner Harbour area.
More than 50% of beaches in Darwin Harbour contain sediment that is categorised as
medium sand to very fine gravel, poorly to very poorly-sorted. This condition
reflects a mix of varied sediment sources into the Harbour and the general feature of
a tidally-dominated environment that tends to be a sediment sink for both terrestrial
and offshore sediment (Harris & Heap 2003). Since the Beagle Gulf was part of the
land that was drowned as rising sea levels stabilised after the Last Glacial Maximum
(Lewis et al. 2013), there is also a possibility that terrigenous sediment that derived
from subaerial erosion and weathering processes in Gulf during the last ice age is
reworked back into the Harbour. Furthermore, these beaches are mostly backed by
rock cliff of Quaternary to Proterozoic geological units that also contain clayey
sandstone, sandy claystone, quartz sandstone and ferruginous sandstone (Pietsch
1983). These rock types, when exposed to water/environmental impact, could be a
source of sand-sized sediment on the adjacent beach and the intertidal area (Scoffin
& Stoddart 1983; Pethick 1984; Bird 2000). Much of the rocky coasts in Darwin
Harbour have been weathered substantially (Nott 1994; Young & Bryant 1998; Nott
2003), however, a more detailed study is necessary to ascertain the role of rock
coasts in providing sediment to the adjacent beaches.
95
In conclusion, given the sampling point density in this study, the grain size
distribution characteristics are not sufficient to determine the sources and sinks of
sediment in Darwin Harbour. Grain size distributions could be used as indicators of
sediment transport pathways in diverse hydrodynamic condition (McLaren & Bowles
1985; Gao & Collins 2001; Van Lancker et al. 2004; Le Roux & Rojas 2007).
However, the macro-tidal regime and complex bathymetry of Darwin Harbour that
leads to complex hydrodynamic processes is a significant factor impeding the use of
grain size distribution parameters to infer sediment behaviour in the area.
4.4.2 Calcium carbonate
The eastern beaches in Darwin Harbour contain significantly higher calcium
carbonate compared to the western and the Inner Harbour beaches (Fig 4.8). The
dunes backing the eastern and western beaches show calcium carbonate levels
similar to the adjacent beaches. These characteristics are also mirrored in the subtidal
Outer Harbour: the calcium carbonate concentration is generally higher in the east
and decreases westward. The patterns are different in the Inner Harbour, where the
highest carbonate sand level is concentrated in the central Inner Harbour around
Channel Island, one of the coral communities in Darwin Harbour (Michie 1987b;
URS Australia 2002b).
Calcium carbonate is often found as a main component of beach sand in the tropics,
and known as carbonate sand (Siever 1988; Pilkey et al. 2011). Carbonate grains are
composed of aragonite and calcite minerals and originate from biologic and
inorganic sources. Visually, more biogenic sediments in the form of broken corals,
shells and spines are found in the samples from the eastern beaches compared to the
western and the Inner Harbour beaches in Darwin Harbour.
Two potential sources for the high calcium carbonate content in Darwin Harbour
sediment are, firstly, the in-situ sources of carbonate sand, and secondly, imported
biogenic sand from the continental shelf. Channel Island and East Point are two
significant coral communities in Darwin Harbour, while Lee Point and Nightcliff are
also recognised as coral colonies (Wolstenholme, Dinesen & Alderslade 1997; Smit
2003). It might be possible that Channel Island, East Point and Lee Point are a source
of carbonate sediment to the adjacent areas. Other than corals, Darwin Harbour is
also home to several organisms that can be sources of carbonate sand. Smit (2003)
96
and Padovan (2012) reported various species of marine fauna in the Harbour, such as
molluscs, sponges, foraminifera, echinoderms and algae.
Longshore currents, particularly during strong monsoonal waves, might deliver
carbonate sediment from the continental shelf into the Harbour, considering that the
majority of sediment in Beagle Gulf is composed of carbonate sand (Smit, Billyard
& Ferns 2000). Furthermore, Michie (1987) reported that there were several
foraminifera biotopes identified in Darwin Harbour, with the majority of tests being
from species which typically live on the shallow continental shelf. The dumbbell
shape of Darwin Harbour, which is wider on the eastern part of the Outer Harbour
and more inclined in a north-west direction, might result in the eastern part of the
Outer Harbour being the depositional area of a greater amount of
offshore/continental shelf carbonate sediment compared to the other areas of the
Harbour.
It is important to note that the CaCO3 concentration of the samples was determined
using cold acid dilution, in which only the calcite and aragonite components of
carbonate minerals are dissolved. However, the elemental analysis revealed that the
calcium carbonate concentration in Darwin Harbour sediment was moderately related
to Mg, Na, Cd, Sr, Mn, P, Y and H-REE (Fig. 4.9), which may indicate the presence
of other calcium related minerals or heavy minerals such as monazite and zircon.
Of all the samples, the fluvial and rock samples showed significantly low calcium
carbonate content, with the rock samples collected from Nightcliff Beach and
Vestey’s north beach containing substantially higher CaCO3 compared to the other
rock samples. The rock samples with low CaCO3 content were collected from
Doctor’s Gully and Silversands Beach in the Inner Harbour and Charles Point Beach
in the western beach area. Interestingly, the samples collected from the beaches
adjacent to the rock sample locations also show low CaCO3 content, and visually
contain more rock fragments than biogenic sediment fractions, inferring a possible
depositional area of the adjacent weathered rocks.
In conclusion, the calcium carbonate concentration in sand-sized sediment in Darwin
Harbour suggests that sand in Darwin Harbour is derived from both the local
biogenic sediment sources and the continental shelf. The eastern beaches contain
substantially more carbonate sediment compared to the western and Inner Harbour
97
beaches due to their proximity to biogenic sediment sources and they might receive
more sediment originating from the continental shelf due to the shape and inclination
of the physiography of the Harbour.
4.4.3 Elemental composition
Among the three trace element groups used to infer the sand-sized sediment sources
in this study: LILEs, HFSEs and REEs, the REE attributes are the most suitable to
infer the sand-sized sediment sources. REEs are the least soluble and most immobile
elements during weathering compared to many other trace elements (Taylor &
McLennan 1985; Sholkovitz, Landing & Lewis 1994; White 2013), hence they are
extensively used as geochemical tracer to determine sediment sources.
In general, the highest levels of LILEs, HFSEs & REEs in this study are contained in
the rock samples (Figs 4.11 – 4.17). Statistically, the samples with exceptionally high
values could be considered as outliers. However, there are studies (Osborne &
Overbay 2004; Templ, Filzmoser & Reimann 2008) claiming that, while outliers
should be removed for detailed statistical analysis, the outliers cannot be ignored
because they may contain specific information about the environmental processes
occurring in the sampled area. The coastal rocks in Darwin Harbour are deeply
weathered (Pietsch 1983; Nott 1994, 2003), thus the high REE content in the rock
samples might be related with the high level of residual immobile elements as the
results of the weathering processes.
Interestingly, elevated levels of REEs are observed in samples with a high proportion
of mud as well as in samples categorised as coarse sand and (very fine) gravel. This
observation is unusual since many studies suggest that REE abundance tends to be
higher in finer grain size sediment compared to coarser grain size sediment (e.g.
Haskin and Paster 1979, McLennan 2001). Fine sand might contain heavy minerals
as indicated by the high H-REE content in a number of beach, dune and Outer
Harbour samples (Fig. 4.18). However, Salminem et al. (2005) advised that while
REE signatures in sediment generally increase with the increase of clay mineral
content, they can also be attributed to the rock fragments component in the sediment.
Indeed, while none of the samples with high proportions of mud contain very low
levels of LILEs, HFSEs and REEs (i.e. REE abundance: 65 – 130ppm, median value:
90ppm), the coarse sized sediment samples containing high levels of LILEs, HFSEs
98
and REEs are mostly beach samples taken close to rocky headlands and/or exposed
geological units, such as in Nightcliff, Vesteys North, Doctor’s Gully, Lameroo
Beach, Francis Bay, and Silversands Beach. The (very fine) gravel samples with high
REE abundance content (79 – 265 ppm) are subtidal samples from East Arm and
Sadgrove Creek in Francis Bay, where the rock cliffs are exposed and eroded as
rubbly outcrops (Pietsch 1983). These results suggest that the sand-sized sediment in
Darwin Harbour may, at least partly, be composed of rock fragments/lithic sand that
might be originated from the breakdown of rock materials that still contained a high
level of residual immobile elements. Previous studies indicated that coastal rocks in
Darwin Harbour, from Cox Peninsula to the Shoal Bay area, are deeply weathered
(Pietsch 1983; Nott 1994, 2003) and can be the source of coarse-sized sediment into
the Harbour. The results suggest that with regard to sediment geochemical
characteristics in depositional areas, mechanical weathering is an important factor to
consider alongside chemical weathering (Whitmore, Crook & Johnson 2004).
In Darwin Harbour, most of the high REE content in the samples is associated with
high concentrations of LILEs and HFSEs, while others are associated with either
high LILEs and/or HFSEs or with elements frequently associated with carbonate
sediment: Ca, Mg, Mn, Na, Sr and CaCO3. This outcome suggests that sediment in
Darwin Harbour is of mixed origins.
The geochemical analysis in this study does not cover mineralogical analysis, hence
the LILEs, HFSEs and REEs content are used indirectly to infer the samples’
mineralogical characteristics. Nevertheless, the REE signatures of the samples are
sufficient in discriminating the different sample types as indicated in Fig. 4.16 and
4.17. Although varying widely, in general, the REE signatures of the fluvial and rock
fragments show a better correlation with the Inner Harbour and the western beaches
sediment (Fig 4.18). While the range of the LILE and HFSE values in the fluvial
samples is larger and higher than the western beaches, the low REE abundance
values in the fluvial sediment (17 – 86 ppm) are comparable with the western
beaches (19 – 69 ppm). This value range indicates that either the western beaches
sediment might be of fluvial origin, or the source of sediment of both the western
beaches and the fluvial samples has similar geological characteristics.
Compared to the LILEs and HFSEs, the REE abundance is better in discerning the
eastern and western beaches, inferring different sediment sources. The Inner Harbour
99
beaches shows a mix of both characteristics with generally higher concentration of
LILEs and HFSEs. In contrast, the eastern beaches sediment contains higher levels of
elements that are frequently associated with carbonate sediment (Ca, Mg, Mn and Sr)
compared to the Inner Harbour and western beaches. Considering that the eastern
Outer Harbour is the location of coral reef communities, these elements that related
to carbonate sediment might, at least in part, have a local origin.
The subtidal Inner Harbour sediment shows varied REE abundance that reaches
higher than the maximum REE abundance of the fluvial samples, indicating a mix of
sources. Most of the fluvial and Inner Harbour samples contain higher LILEs and
HFSEs, in contrast to the Outer Harbour samples. While several samples show
elevated LILEs and/or HFSEs content, in general sediment from the eastern and
middle of the Outer Harbour contains higher Ca, Mg, Mn and Sr concentrations
compared to the sediment from the western Outer Harbour. This result suggests that
the eastern and middle Outer Harbour sediment contains elevated carbonate and/or
biogenic sediment originating from either in-situ biogenic sand sources such as the
coral reef communities in the Harbour or imported carbonate sand from the
continental shelf brought in by longshore transport and tidal inflow, or a mixture of
both.
To discriminate sediment origins and deposition processes, REE abundance is
frequently supported by the normalised REE profiles and the ratio of light- to heavy-
REE ratio (La/Yb(N)) (e.g. Xu 2011, Prego et al. 2012, Zhang 2012). In general, most
samples show similar chondrite-normalised REE distribution patterns with L-REE
enrichment, relatively flat H-REE, with a negative Europium (Eu) anomaly,
suggesting granite characteristics (e.g. Taylor and McLennan 1985, Salminem et al.
2005).
High La/Yb(N) values were found in the rock samples, most of the fluvial samples
and subtidal Inner Harbour samples, while most of the beach and subtidal Outer
Harbour samples show low La/Yb(N) values indicating H-REE enrichment. The local
hydrodynamics influenced by the macrotidal environment might play a role in the
REE fractionation during transport, so that the finer grain sizes containing heavy
minerals tend to be sorted and deposit in the lower velocity areas. Except in the rock
samples, the high La/Yb(N) values in the samples are not necessarily related to high
REE abundance, LILEs or HFSEs content. Some samples with high La/Yb(N) values
100
show low REE abundance or low LILEs and HFSEs contents, obscuring sediment
depositional patterns, because like REE abundance, the ratio of LREEs to HRREs
tends to increase according to the clay mineral and rock fragment contents in
sediment (e.g. Salminem et al. 2005).
The high La/Yb(N) values of the samples occur in samples of all grain size categories.
In general, the highest La/Yb(N) was found in samples ranging from very fine sand to
(very fine) gravel. Low La/Yb(N) values are observed in very fine to very coarse sand
samples and mostly found in beach and subtidal Outer Harbour samples. This
outcome confirms that sediment in Darwin Harbour is composed of mixed mineral
and rock fragments.
4.5 Conclusion
The purpose of this study is to identify the characteristics and origin of sand-sized
sediment, complementing the sand transport numerical modelling, to assist with
beach erosion management in Darwin Harbour. The elemental components of the
sand-sized sediment in Darwin Harbour, particularly the REE signatures, have been
used to discriminate sediment sources and processes.
Based on the elemental composition, sand-sized sediment in Darwin Harbour appears
to show a mix of marine and terrigenous sources. Calcium carbonate concentration in
the eastern beaches sand is substantially higher compared to the western beaches,
inferring more marine characteristics. Similarly, the Outer Harbour and the middle of
the Inner Harbour sediment shows higher calcium carbonate levels compared to
sediment from the Arms of the Harbour. The carbonate content in the sand-sized
sediment is likely derived from in-situ sources and sediment brought into the
Harbour from the continental shelf. The local sources of carbonate sand in Darwin
Harbour include coral reef colonies near East Point, Nightcliff and Channel Island.
The geochemical characteristics of the beach, dune and sandbar sediment shows
different proportions of the sediment sources i.e. the fluvial, rocks and the inner
continental shelf/Outer Harbour. Provenance analysis based on REE concentration
and REE profiles clearly discriminates the eastern beaches from the western beaches
sand, inferring different proportions of the sediment sources. The eastern beaches
sediment has a closer relationship with the Outer Harbour sediment. Although
101
varying widely, in general, the REE signatures of the fluvial sediment show a better
correlation with the Inner Harbour and the western beaches sediment.
The fluvial sediment is mainly delivered to the Inner Harbour and from there
reworked and redistributed to other parts of the Harbour. Due to the high tidal
currents, the fluvial sediment is mixed with sediment from coastal marine sources
supplied to the Outer Harbour by ebb tidal currents. The dumbbell shape of Darwin
Harbour that is more inclined in the north-west direction might be a factor in
directing fluvial sediment to be distributed more to the western beaches. An
important additional sediment source is the erosion of coastal cliff materials.
This study is the first attempt to analyse the grainsize and geochemical
characteristics of sand-sized sediment across Darwin Harbour, and is intended to
provide evidence of sedimentary provenance to complement the numerical
simulation of sediment transport in the Harbour (Chapter 5). The geochemical results
offer valuable insights into the complexity of the hydrodynamic and sedimentary
environment in a macrotidal estuary.
102
Chapter 5 Sand transport pathways in Darwin Harbour
5.1 Introduction
In this chapter the numerical models, the relative model parameters and the simulated
sand transport pathways in Darwin Harbour are discussed. This chapter addresses the
second and third research questions: ‘What are the principal transport pathways of
sand within Darwin Harbour?’ and ‘How can this sand dynamics study assist with
coastal erosion management in Darwin Harbour?’ A numerical modelling was used
to identify the key sources and transport pathways of sand-sized sediment in Darwin
Harbour with one of the modelling scenario was used to address the third research
question on how knowledge of the sand transport pathways can assist with coastal
erosion and sediment management.
The simulations were run based on a design sand concentration instead of the actual
sand concentration in the water column. This approach was adopted as actual sand
concentration data are unavailable and their determination would involve a
considerable amount of fieldwork outside the scope of this study. The sand
concentration was applied in the two main potential sand sources, namely offshore
and rivers. The simulation results are then used to depict the transport pathways in
the model domain. Coupled with the results of the geochemical analysis of the sand
samples (Chapter 4), the sand transport pathways can be inferred. As a first attempt
to address the determination of the sand-sized sediment sources and transport
pathways, an experimental approach to transport pathways is considered suitable to
assist with coastal erosion management in the area. Once the pathways are confirmed
in more detail, a future and more detailed study involving field programmes can be
designed to quantitatively determine sand transport in sensitive areas such as
recreational beaches and sandbars.
The sand transport pathways were inferred using RMA-11, a finite element water
quality model that also incorporates the modelling of cohesive and/or non-cohesive
sediment transport and erosion/deposition, developed by Resource Modelling
Associates (King 2015). The simulations of RMA-11 are run based on the velocity
fields derived from the hydrodynamic simulations of the Harbour using RMA-2, a
two-dimensional depth-averaged hydrodynamic modelling software package, also
developed by Resource Modelling Associates (King 2013). A two-dimensional
103
modelling approach is valid for the Darwin Harbour hydrodynamic simulation as
numerous surveys of tidal profiling by the Australian Institute of Marine Science
(AIMS) since 2010 have shown that the vertical profiles of currents are of similar
magnitude and direction during the tidal cycle. Furthermore, AIMS’ studies revealed
that the computation of bed shear stress gives values like those of a three-
dimensional model.
5.2 Model description and configuration
Numerical modelling in Darwin Harbour was initiated in 1993 by the Northern
Territory Government in partnership with the Water Research Laboratory (WRL),
University of New South Wales (Water Research Laboratory 2000; Williams,
Wolanski & Spagnol 2006; Fortune & Maly 2009). The modelling work was
conducted for hydrodynamics, sediment transport and water quality using the RMA
modelling suite. The RMA suite uses an irregular mesh comprising nodes and
elements representing topography and substrate characteristics. For Darwin Harbour
there are several meshes that have been refined, calibrated and validated by the
Northern Territory Government, Charles Darwin University (CDU), and the
Australian Institute of Marine Science (AIMS). The various meshes were created for
specific and varying projects, such as effluent dispersal studies and Port Darwin
development (Drewry, Fortune & Maly 2009; Valentine & Totterdell 2009; Patterson
& Valentine 2011; Patterson 2014; Williams & Patterson 2014; Proudfoot et al.
2018). The simulations in this study were carried out using the calibrated and
validated Darwin Harbour model mesh created by AIMS based on 2012 bathymetry.
The mesh was calibrated using different bed friction values and was validated with
sea level surfaces at three different locations, covering the Outer and the Inner
Harbour areas (Valentine, Patterson & Morgan 2011; Li 2013; Patterson 2014).
The model domain (Fig. 5.1) covers the Darwin Harbour Region area with the
seaward boundary represented by a curved line joining Charles Point in the west and
Lee Point in the east. The landward boundaries are situated on the watersheds of the
rivers and creeks flowing into the Harbour. Mesh refinement was carried out in the
channels of the upper reaches of the rivers debouching into the Harbour and the
Cullen Bay sandbar area to refine modelling scenarios.
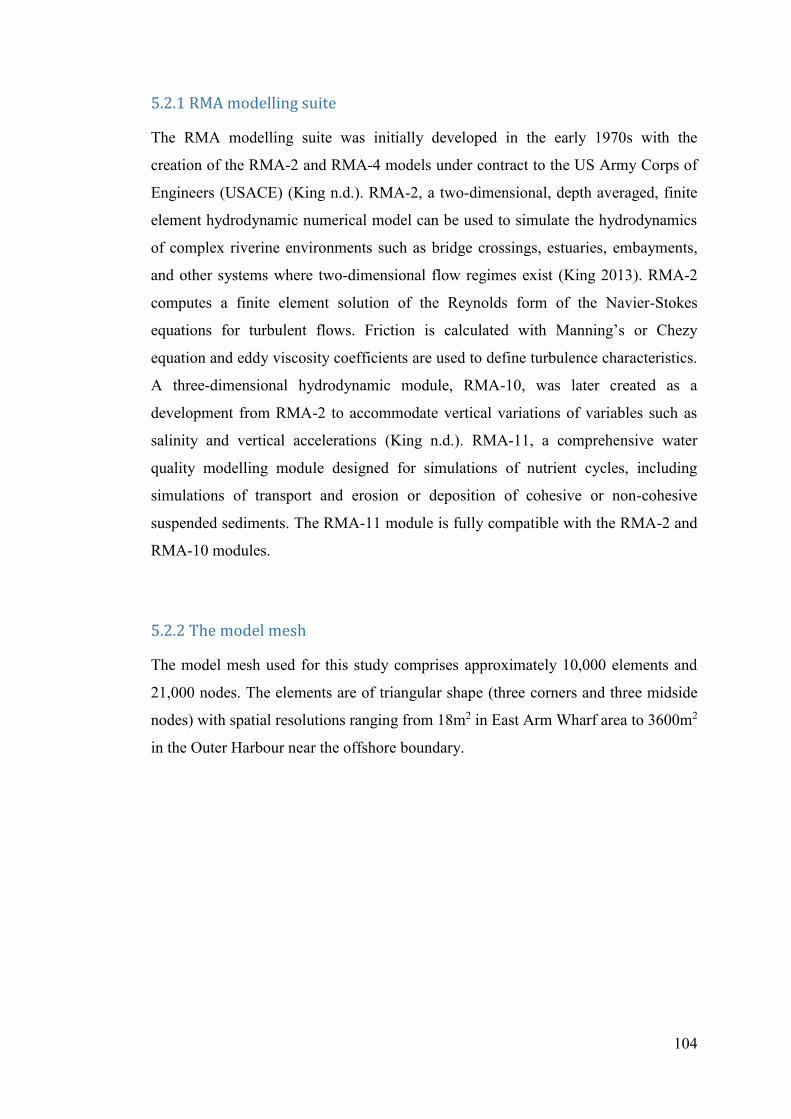
104
5.2.1 RMA modelling suite
The RMA modelling suite was initially developed in the early 1970s with the
creation of the RMA-2 and RMA-4 models under contract to the US Army Corps of
Engineers (USACE) (King n.d.). RMA-2, a two-dimensional, depth averaged, finite
element hydrodynamic numerical model can be used to simulate the hydrodynamics
of complex riverine environments such as bridge crossings, estuaries, embayments,
and other systems where two-dimensional flow regimes exist (King 2013). RMA-2
computes a finite element solution of the Reynolds form of the Navier-Stokes
equations for turbulent flows. Friction is calculated with Manning’s or Chezy
equation and eddy viscosity coefficients are used to define turbulence characteristics.
A three-dimensional hydrodynamic module, RMA-10, was later created as a
development from RMA-2 to accommodate vertical variations of variables such as
salinity and vertical accelerations (King n.d.). RMA-11, a comprehensive water
quality modelling module designed for simulations of nutrient cycles, including
simulations of transport and erosion or deposition of cohesive or non-cohesive
suspended sediments. The RMA-11 module is fully compatible with the RMA-2 and
RMA-10 modules.
5.2.2 The model mesh
The model mesh used for this study comprises approximately 10,000 elements and
21,000 nodes. The elements are of triangular shape (three corners and three midside
nodes) with spatial resolutions ranging from 18m2 in East Arm Wharf area to 3600m2
in the Outer Harbour near the offshore boundary.
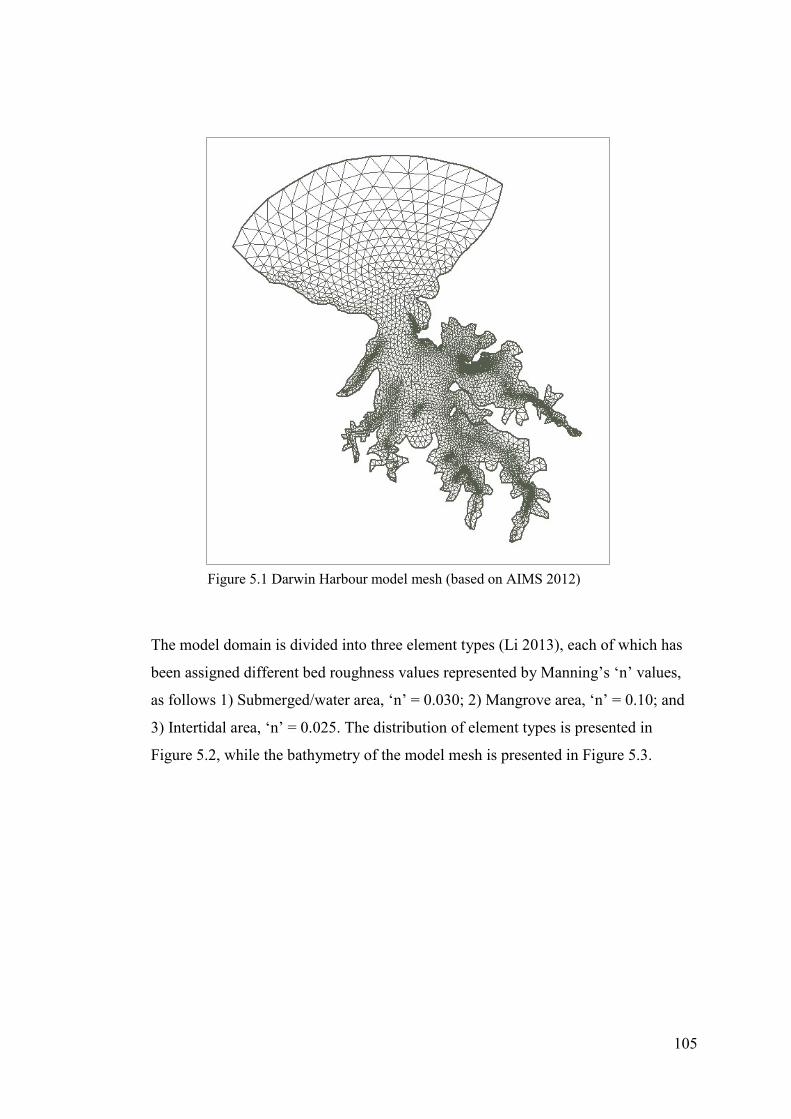
105
The model domain is divided into three element types (Li 2013), each of which has
been assigned different bed roughness values represented by Manning’s ‘n’ values,
as follows 1) Submerged/water area, ‘n’ = 0.030; 2) Mangrove area, ‘n’ = 0.10; and
3) Intertidal area, ‘n’ = 0.025. The distribution of element types is presented in
Figure 5.2, while the bathymetry of the model mesh is presented in Figure 5.3.
Figure 5.1 Darwin Harbour model mesh (based on AIMS 2012)
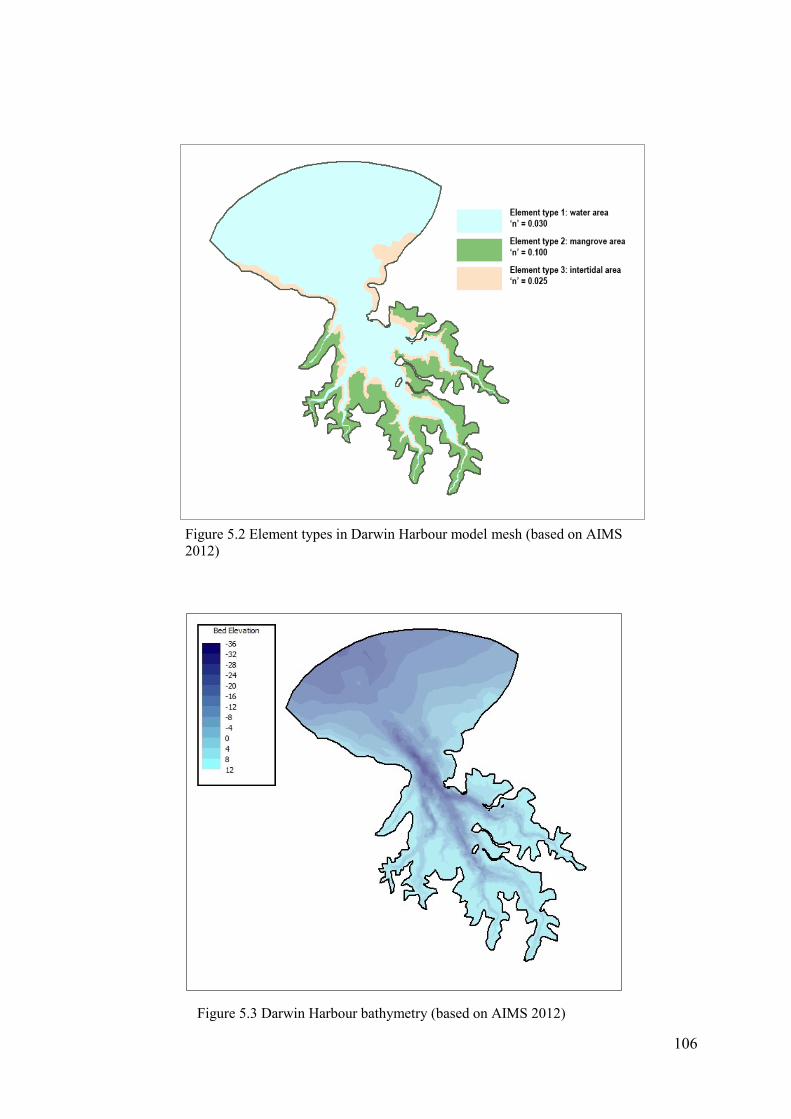
106
Figure 5.2 Element types in Darwin Harbour model mesh (based on AIMS
2012)
Figure 5.3 Darwin Harbour bathymetry (based on AIMS 2012)
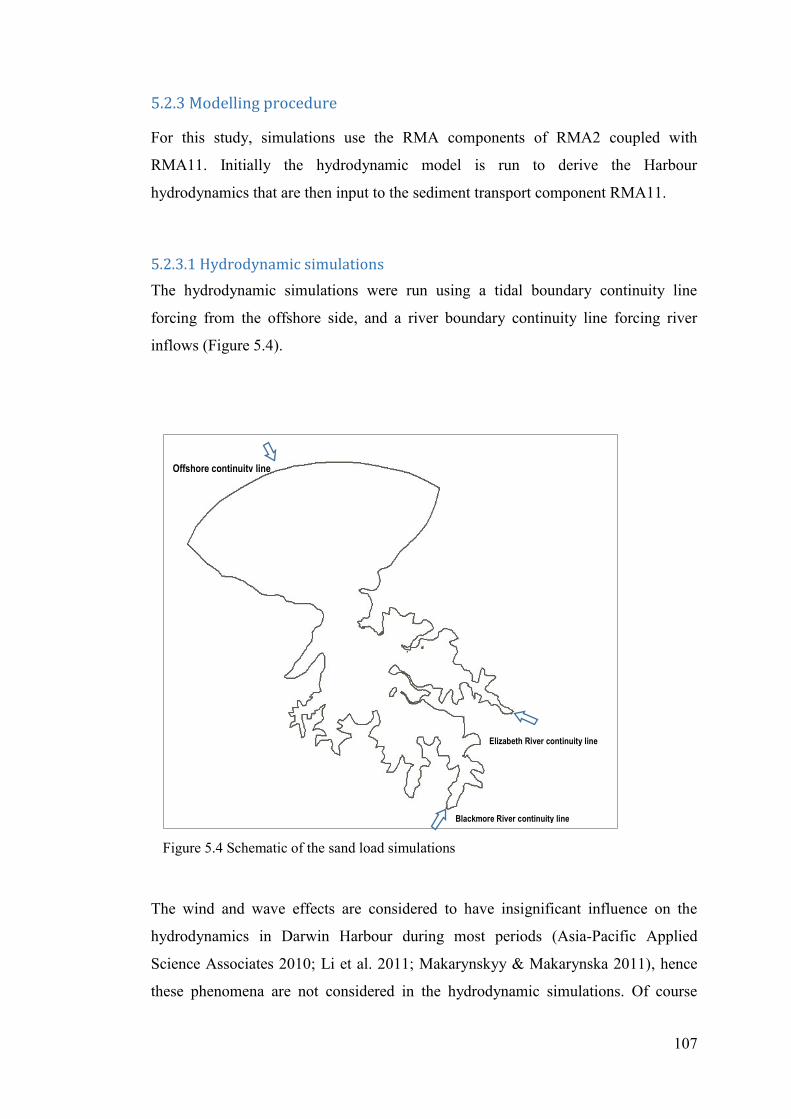
107
5.2.3 Modelling procedure
For this study, simulations use the RMA components of RMA2 coupled with
RMA11. Initially the hydrodynamic model is run to derive the Harbour
hydrodynamics that are then input to the sediment transport component RMA11.
5.2.3.1 Hydrodynamic simulations
The hydrodynamic simulations were run using a tidal boundary continuity line
forcing from the offshore side, and a river boundary continuity line forcing river
inflows (Figure 5.4).
The wind and wave effects are considered to have insignificant influence on the
hydrodynamics in Darwin Harbour during most periods (Asia-Pacific Applied
Science Associates 2010; Li et al. 2011; Makarynskyy & Makarynska 2011), hence
these phenomena are not considered in the hydrodynamic simulations. Of course
Figure 5.4 Schematic of the sand load simulations
Elizabeth River continuity line
Elizabeth River continuity line
Elizabeth River continuity line
Elizabeth River continuity line
Elizabeth River continuity line
Elizabeth River continuity line
Elizabeth River continuity line
Elizabeth River continuity line
Blackmore River continuity line
Blackmore River continuity line
Blackmore River continuity line
Blackmore River continuity line
Blackmore River continuity line
Blackmore River continuity line
Offshore continuity line
Figure 5.5
Bathymetry at
Cullen Bay
sandbar area in
Fannie Bay; the
original model
mesh (a) and
after
hypothetical
dredging of the
Cullen Bay
sandbar
(b)Offshore continuity
line
Figure 5.5
Bathymetry at
Cullen Bay
sandbar area in
Fannie Bay; the
original model
mesh (a) and
after
hypothetical
dredging of the
Cullen Bay
sandbar
(b)Offshore continuity
line
Figure 5.5
Bathymetry at
108
cyclones will induce waves, that may be important, but the effect of
cyclones/extreme weather events is beyond the scope of this study. The Outer
Harbour boundary forcing was simulated using tidal elevations from the National
Tidal Centre, Australian Bureau of Meteorology (2014). The river discharge was
applied to the Elizabeth and Blackmore Rivers using the inflow data obtained from
the Northern Territory Government water data portal
(https://nt.gov.au/environment/water/water-data-portal). The other rivers draining
into the Harbour are very small and are unlikely to have a significant input of water
or sediment. Both tidal elevation data and river inflow data covered the same time-
frame, i.e. from May 2012 to April 2013. The hydrodynamic simulations were run
for a 12-month period, covering both the dry and the wet seasons with a 15 minute
time step.
5.2.3.2 Sand transport simulation
In order to simulate the sand transport pathways in Darwin Harbour, the velocity
field and water surface level output from RMA-2 hydrodynamic simulations were
used as the input to run RMA-11 using the same model mesh and time step. The fine,
medium and coarse sand transport rates were simulated using the sand transport
potential method based on Van Rijn’s computation (Van Rijn 1984a, 1984b). The
sand transport potential method is most suitable for simulating sand with a diameter
larger than 0.100 mm (fine sand size and greater) (King 2015). The sand potential
method is based on the equilibrium concentration (i.e. the transport potential) of sand
in a water column, which depends on the sand and flow parameters. In general, the
bed source or sink term is given by the formula:
𝑆 = 𝐶𝑒𝑞 − 𝐶
𝑡𝑐
where:
S = Source term [g s-1 m-2 per meter depth],
Ceq = Equilibrium concentration (transport potential) [mgl-1],
C = Sand concentration in the water, and
tc = Characteristic time for affecting the transition.
The selection of tc as the input parameter is a function of sand fall velocity, which is
the empirical step of the analysis, while C is an input value. In general, this method is
similar to the method used in STUDH of the US Army Corps of Engineers (Thomas

109
& McAnally, Jr. 1985). There are two options available to determine the value of tc.
The first option treats the time step as a limiting value in determining the source
term, while the second option uses an input characteristic time as a limiting value.
When the computed equilibrium sand concentration in the water column is less than
the concentration in suspension, deposition will occur, and vice versa. The
computation of tc is as follows:
Sand deposition:
𝑡𝑐 = 𝐶𝑑
𝑑
𝑉𝑠
𝑤ℎ𝑒𝑛: 𝐶𝑑
𝑑
𝑉𝑠 > Δ𝑡, 𝑡ℎ𝑒𝑛 𝑡𝑐 = Δ𝑡
where:
Cd: coefficient for deposition; typical value = 1.0; d: flow depth; Vs: settling
velocity [m s-1]; Δt: Computation time step [s]
Sand erosion:
𝑡𝑐 ≥ 𝐶𝑒
𝑑
𝑣 𝑜𝑟 Δ𝑡
𝑤ℎ𝑒𝑛 𝐶𝑒
𝑑
𝑢 > Δ𝑡, 𝑡ℎ𝑒𝑛 𝑡𝑐 = Δ𝑡
where:
Ce: Coefficient for erosion; typical value = 10.0;
d: flow depth; and
u: water velocity [m s-1]
The settling velocity was calculated using the formula derived by Soulsby (1997):
𝑊𝑠 = 𝜐
𝑑 [(10.362 + 1.049 𝐷∗
3)1
2⁄ − 10.36]
110
𝐷∗ = [𝑔(𝑠 − 1)
𝜐2]
13⁄
𝑑
where:
Ws: settling velocity; υ = kinematic viscosity of water;
d = D50, median sieve diameter of grains;
D* = dimensionless grain size;
g = acceleration due to gravity = 9.81 m s-2; and
s = ratio of densities of grain and water.
5.3 Modelling scenarios
In order to identify the potential distribution of sand entering the Harbour, a 5 mgl-1
sand concentration for each sand grain size, (small, medium and coarse) was
introduced at the model continuity lines. As the actual/field sand concentration data
is unavailable, the 5 mgl-1 was selected to avoid excessive sand deposition at the
boundary lines. Values of higher concentrations up to 1000 mgl-1 were also tested
and gave similar sand pathways results with most sand being deposited at the
boundary/continuity lines. The primary mode of transport for sand sized-sediment is
bedload transport, hence high sand deposition normally occurs in and adjacent to the
boundary lines.
Two separate simulations were run as follows: 1) from the offshore continuity line,
and 2) the rivers’ continuity lines to distinguish whether the sand sources are of
offshore or terrestrial origin. In order to identify the pathways from the rivers and
offshore sand, no initial bed thickness (initial bed thickness = 0mm) or initial sand
concentration in the water column was applied in the model domain. Consequently,
any deposition from each sand source simulation can be determined with certainty.
Simulations on simultaneous loading from both the offshore and the rivers were also
conducted with results very similar to the offshore sand loading, hence are not
included in the analysis. The river sand concentration was applied simultaneously to
the Elizabeth and Blackmore Rivers, the major rivers flowing into the Harbour. The
sand transport pathways were inferred from the bed level changes in the modelling
area. Positive bed change indicates sand deposition, which shows the sand sink
111
locations. Therefore, any positive bed change in the model domain can be inferred as
the sand direction/pathway from the sources to the sinks.
The sand characteristic parameters used to simulate the sand-sized transport were:
Specific gravity = 2.65,
Grain shape factor = 0.70, and
D50
In order to assist with coastal erosion and sedimentation management in Darwin
Harbour, simulations were also conducted on a modified model mesh. The
modification was made to the bathymetry of the Cullen Bay sandbar to simulate
dredging of the area. The reason for this simulation is to examine the impact of
Cullen Bay sandbar dredging on sand transport pathways, particularly on the beaches
in Fannie Bay. Cullen Bay sandbar was dredged in the early1990s in order to supply
sand for the Cullen Bay Marina project, which caused a major public concern on the
potential impacts of the sandbar protective function on Fannie Bay, particularly
Mindil and Vestey’s beaches (Conservation Commission of the Northern Territory
1993). In general, people were concerned about the potential impact of dredging on
the form and functions of the sandbar in protecting Fannie Bay in particular Mindil
Beach from coastal hazards, as well as the continuation sand replenishment for the
proposed artificial beach to protect the seawall around the marina. The bathymetry of
the sandbar was modified to be lower than the actual level, incrementally
from -10.00 m on the western part of the sandbar eastward, reaching -1.00 m on the
eastern edge of the sandbar, forming a slowly rising plain which, due to its shape,
provided minimum impact on the original morphology of the sandbar. The
bathymetry of the area for both the original model mesh and the mesh after the
hypothetical dredging of the Cullen Bay sandbar are shown in Figure 5.5.
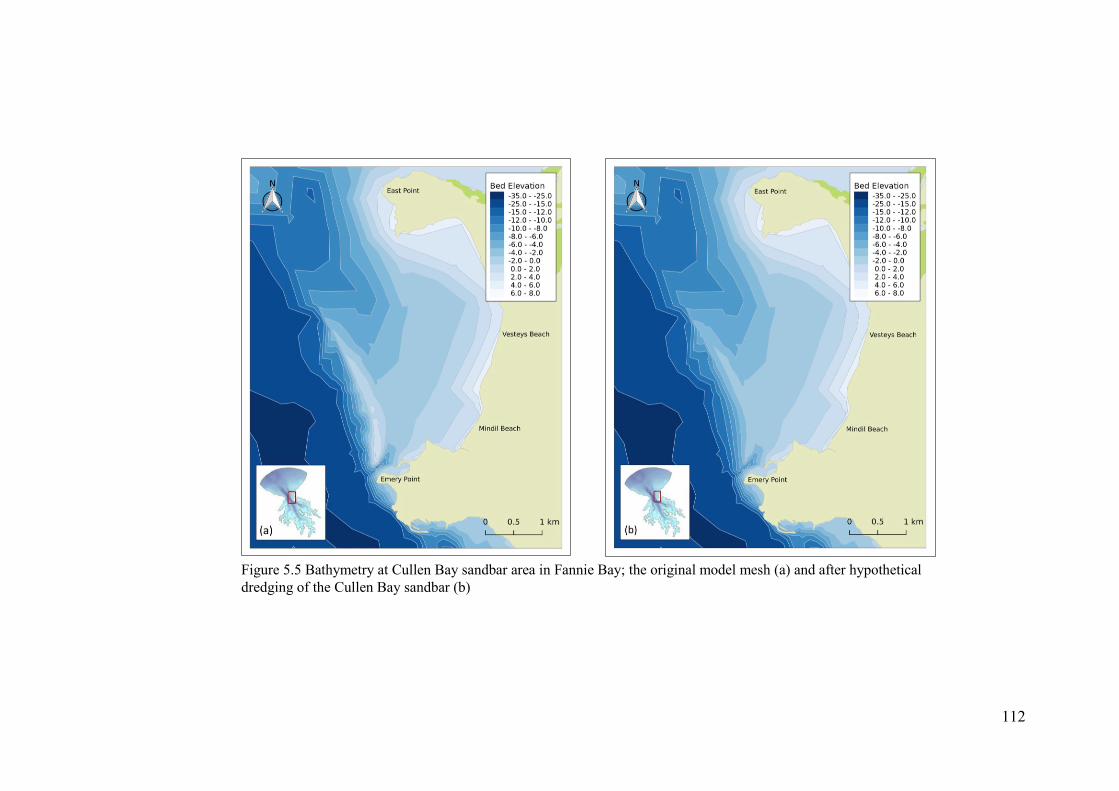
112
Figure 5.5 Bathymetry at Cullen Bay sandbar area in Fannie Bay; the original model mesh (a) and after hypothetical
dredging of the Cullen Bay sandbar (b)
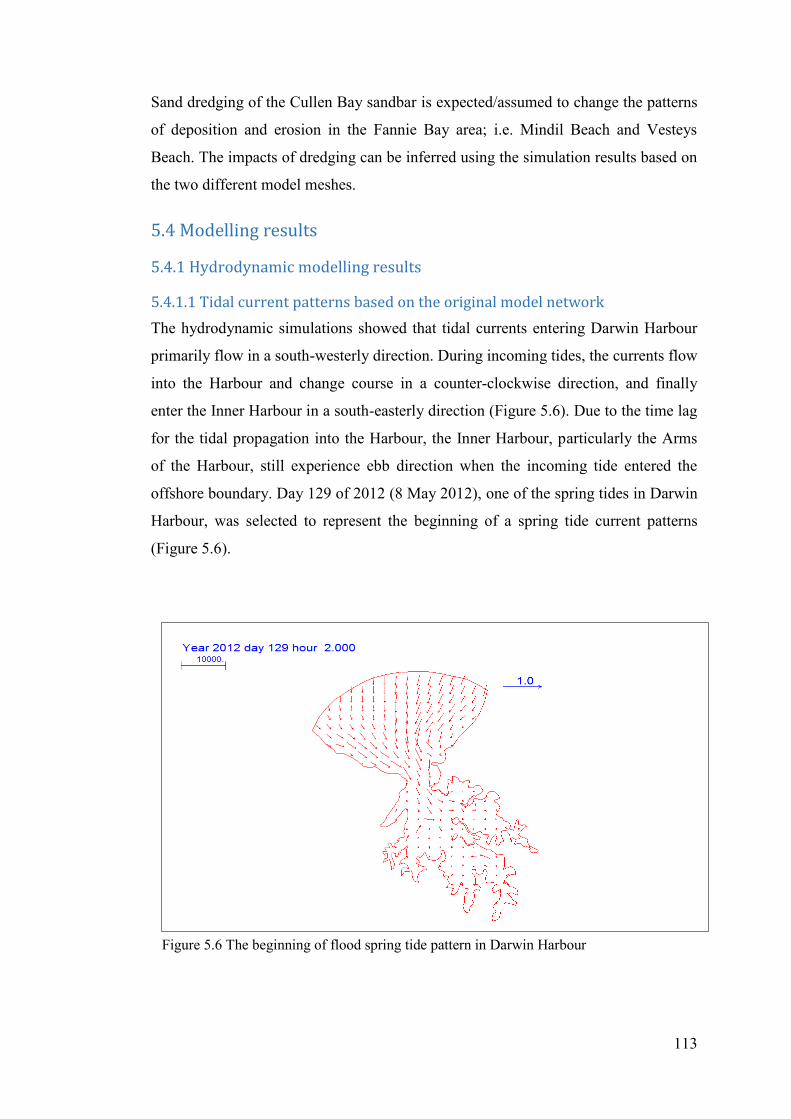
113
Sand dredging of the Cullen Bay sandbar is expected/assumed to change the patterns
of deposition and erosion in the Fannie Bay area; i.e. Mindil Beach and Vesteys
Beach. The impacts of dredging can be inferred using the simulation results based on
the two different model meshes.
5.4 Modelling results
5.4.1 Hydrodynamic modelling results
5.4.1.1 Tidal current patterns based on the original model network
The hydrodynamic simulations showed that tidal currents entering Darwin Harbour
primarily flow in a south-westerly direction. During incoming tides, the currents flow
into the Harbour and change course in a counter-clockwise direction, and finally
enter the Inner Harbour in a south-easterly direction (Figure 5.6). Due to the time lag
for the tidal propagation into the Harbour, the Inner Harbour, particularly the Arms
of the Harbour, still experience ebb direction when the incoming tide entered the
offshore boundary. Day 129 of 2012 (8 May 2012), one of the spring tides in Darwin
Harbour, was selected to represent the beginning of a spring tide current patterns
(Figure 5.6).
Figure 5.6 The beginning of flood spring tide pattern in Darwin Harbour

114
The eight-metre maximum tide range and low river inflow bring about strong tidal
currents into and out of the Harbour with velocities of up to 2.3 ms-1. The highest
tidal current occurs in the Middle Arm/the lower reaches of Blackmore River, where
the flood tidal flow produces slightly lower current velocities compared to the ebb
tidal flow (Figures 5.7a and 5.7b). In contrast, very low tidal current velocities occur
in the intertidal areas, particularly in the mangrove areas.
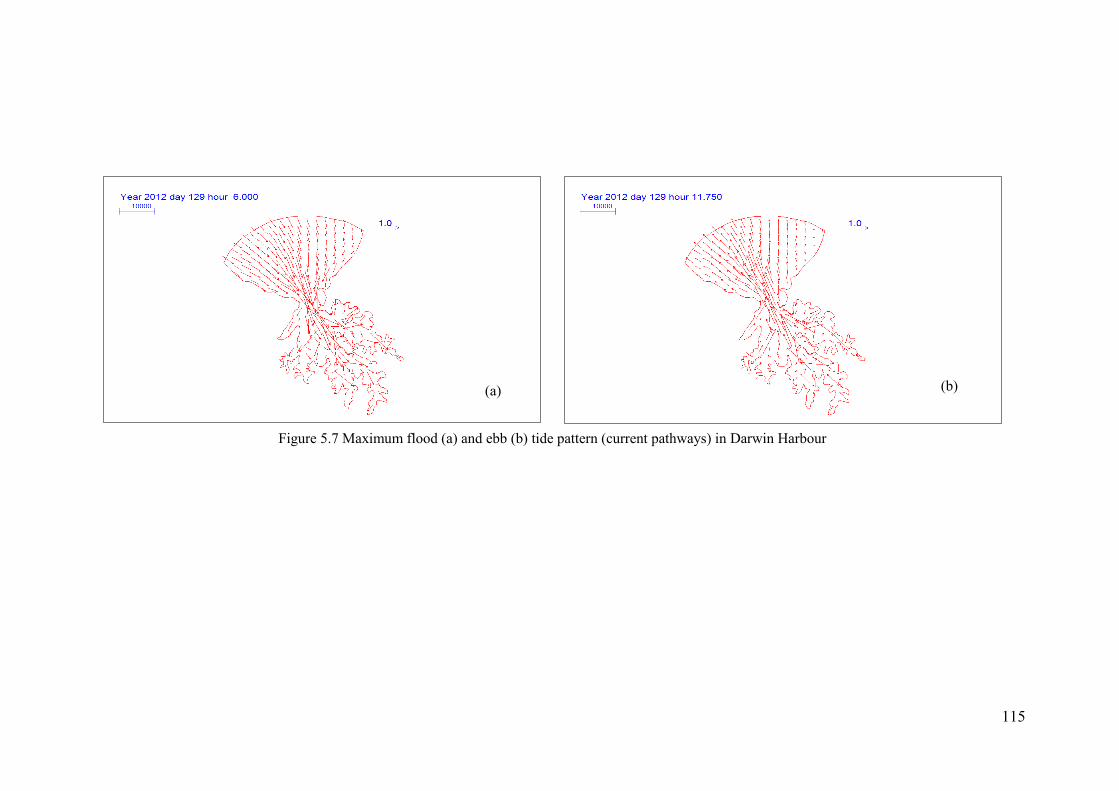
115
(a)
(a)
(a)
(a)
(a)
(a)
(b)
Fi
gu
re
5.
7
M
ax
im
u
m
flo
od
(a)
Figure 5.7 Maximum flood (a) and ebb (b) tide pattern (current pathways) in Darwin Harbour
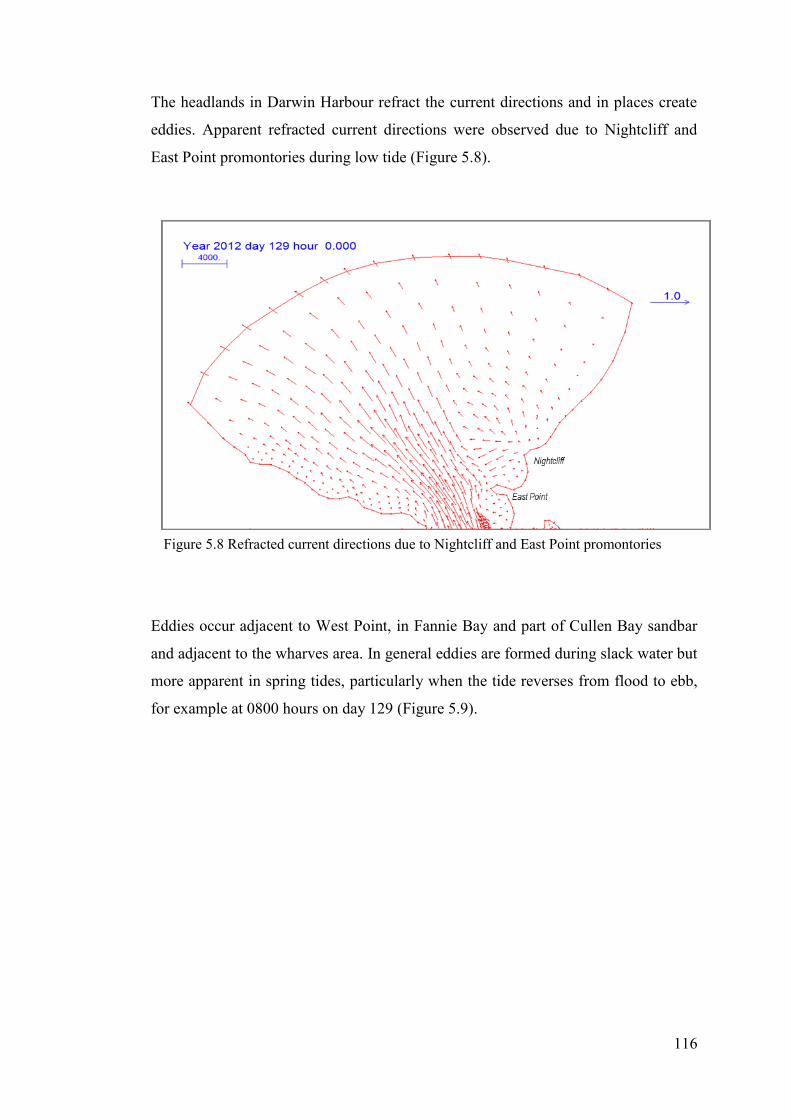
116
The headlands in Darwin Harbour refract the current directions and in places create
eddies. Apparent refracted current directions were observed due to Nightcliff and
East Point promontories during low tide (Figure 5.8).
Eddies occur adjacent to West Point, in Fannie Bay and part of Cullen Bay sandbar
and adjacent to the wharves area. In general eddies are formed during slack water but
more apparent in spring tides, particularly when the tide reverses from flood to ebb,
for example at 0800 hours on day 129 (Figure 5.9).
Figure 5.8 Refracted current directions due to Nightcliff and East Point promontories
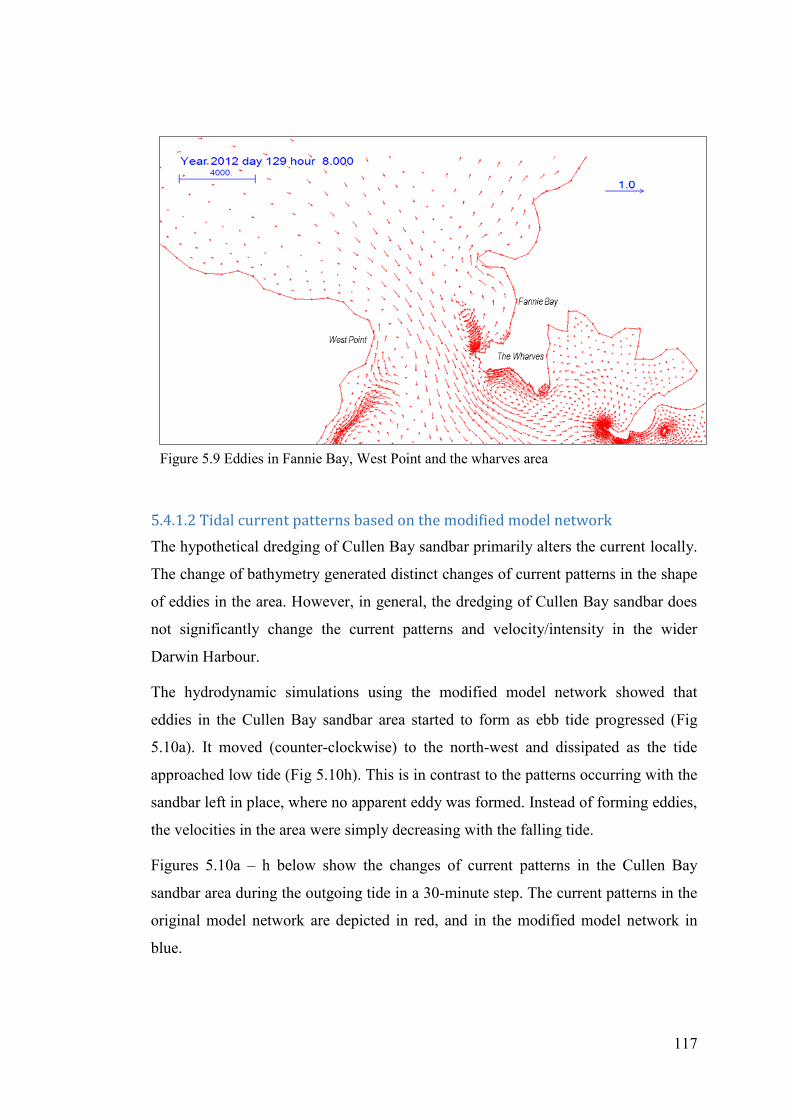
117
5.4.1.2 Tidal current patterns based on the modified model network
The hypothetical dredging of Cullen Bay sandbar primarily alters the current locally.
The change of bathymetry generated distinct changes of current patterns in the shape
of eddies in the area. However, in general, the dredging of Cullen Bay sandbar does
not significantly change the current patterns and velocity/intensity in the wider
Darwin Harbour.
The hydrodynamic simulations using the modified model network showed that
eddies in the Cullen Bay sandbar area started to form as ebb tide progressed (Fig
5.10a). It moved (counter-clockwise) to the north-west and dissipated as the tide
approached low tide (Fig 5.10h). This is in contrast to the patterns occurring with the
sandbar left in place, where no apparent eddy was formed. Instead of forming eddies,
the velocities in the area were simply decreasing with the falling tide.
Figures 5.10a – h below show the changes of current patterns in the Cullen Bay
sandbar area during the outgoing tide in a 30-minute step. The current patterns in the
original model network are depicted in red, and in the modified model network in
blue.
Figure 5.9 Eddies in Fannie Bay, West Point and the wharves area
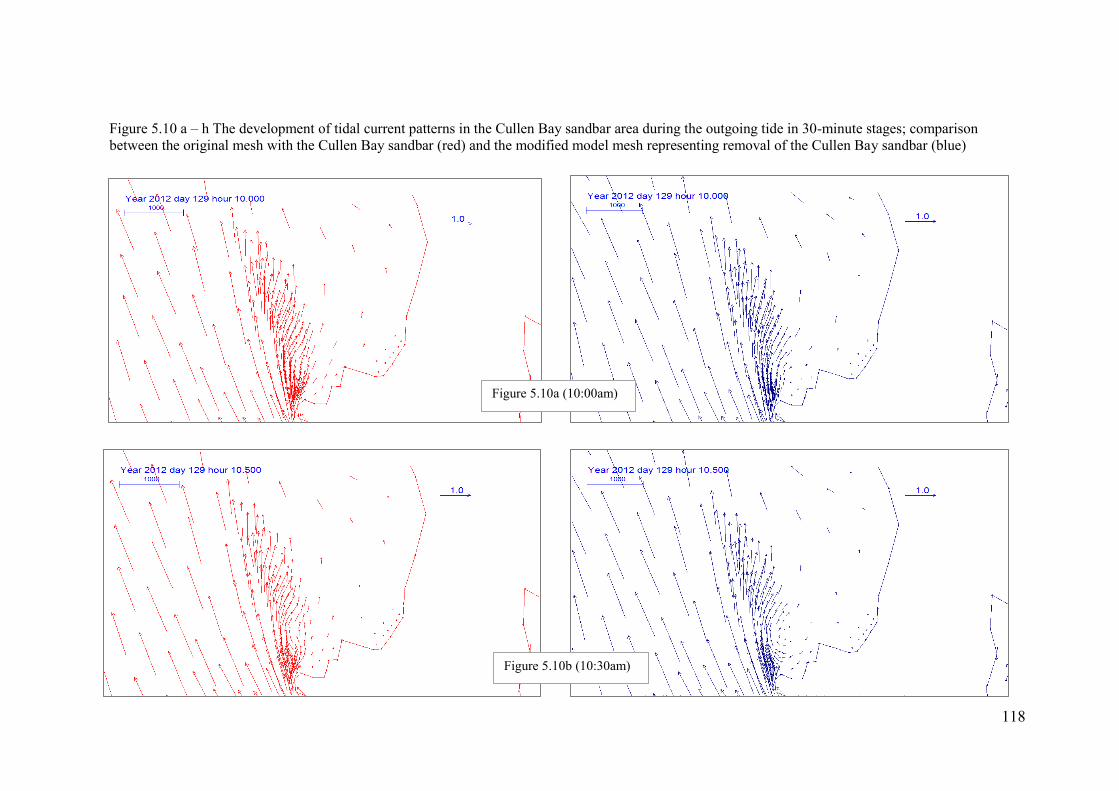
118
Figure 5.10a (10:00am)
Figure 5.10a (10:00am)
Figure 5.10a (10:00am)
Figure 5.10a (10:00am)
Figure 5.10a (10:00am)
Figure 5.10a (10:00am)
Figure 5.10a (10:00am)
Figure 5.10a (10:00am)
Figure 5.10b (10:30am)
Figure 5.10b (10:30am)
Figure 5.10b (10:30am)
Figure 5.10 a – h The development of tidal current patterns in the Cullen Bay sandbar area during the outgoing tide in 30-minute stages; comparison
between the original mesh with the Cullen Bay sandbar (red) and the modified model mesh representing removal of the Cullen Bay sandbar (blue)
Figure 5.10a (10:00am)
Figure 5.10a (10:00am)
Figure 5.10a (10:00am)
Figure 5.10a (10:00am)
Figure 5.10a (10:00am)
Figure 5.10a (10:00am)
Figure 5.10a (10:00am)
Figure 5.10a (10:00am)
Figure 5.10b (10:30am)
Figure 5.10b (10:30am)
Figure 5.10b (10:30am)
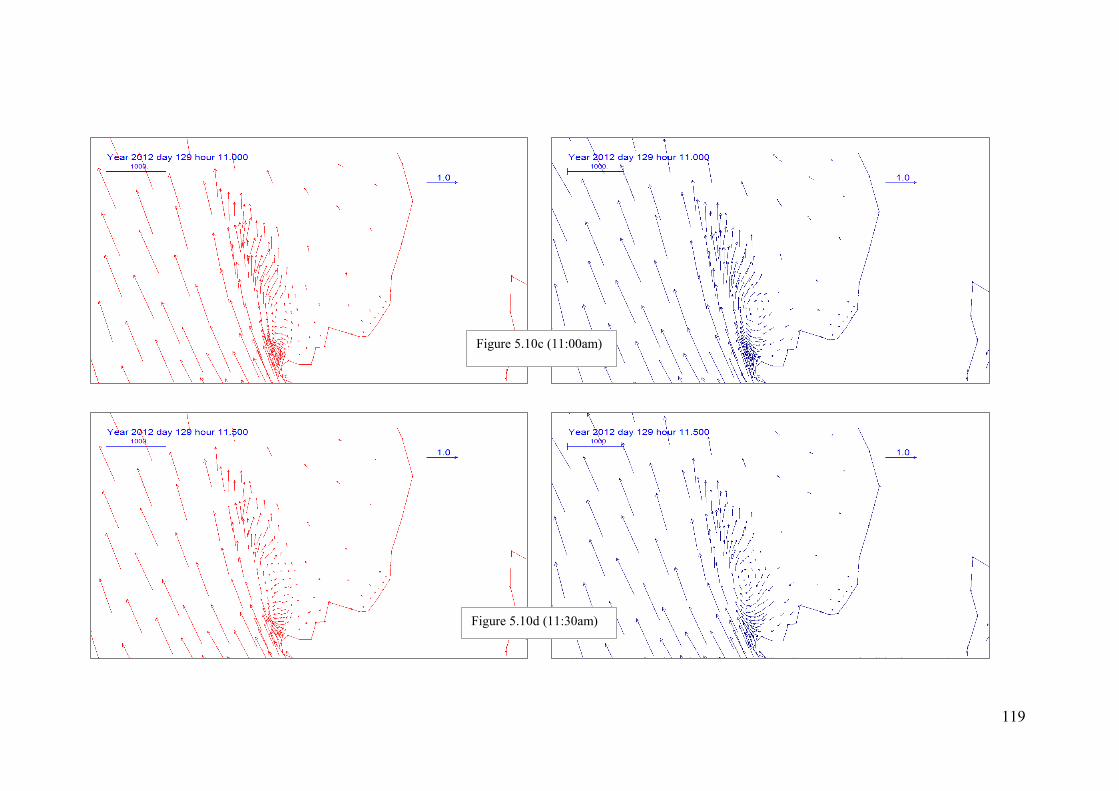
119
Figure 5.10c (11:00am)
Figure 5.10c (11:00am)
Figure 5.10c (11:00am)
Figure 5.10c (11:00am)
Figure 5.10c (11:00am)
Figure 5.10c (11:00am)
Figure 5.10c (11:00am)
Figure 5.10c (11:00am)
Figure 5.10d (11:30am)
Figure 5.10d (11:30am)
Figure 5.10d (11:30am)
Figure 5.10d (11:30am)
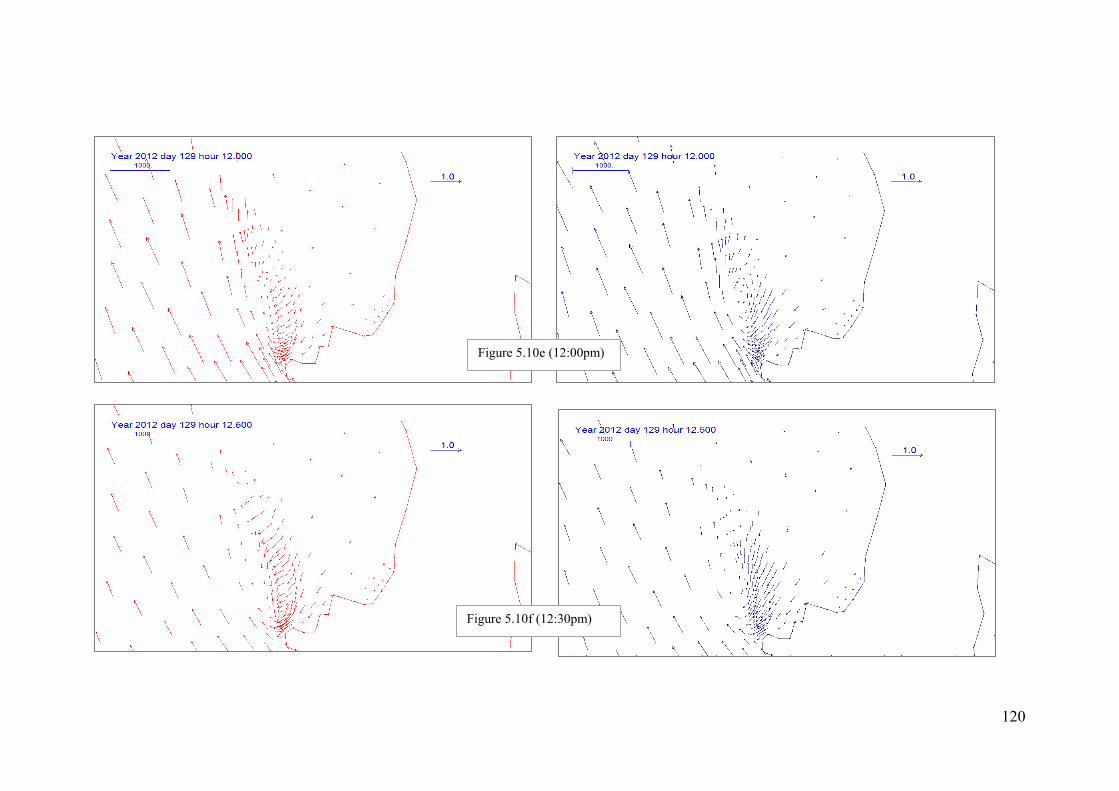
120
Figure 5.10e (12:00pm)
Figure 5.10e (12:00pm)
Figure 5.10e (12:00pm)
Figure 5.10e (12:00pm)
Figure 5.10e (12:00pm)
Figure 5.10e (12:00pm)
Figure 5.10e (12:00pm)
Figure 5.10e (12:00pm)
Figure 5.10f (12:30pm)
Figure 5.10f (12:30pm)
Figure 5.10f (12:30pm)
Figure 5.10f (12:30pm)
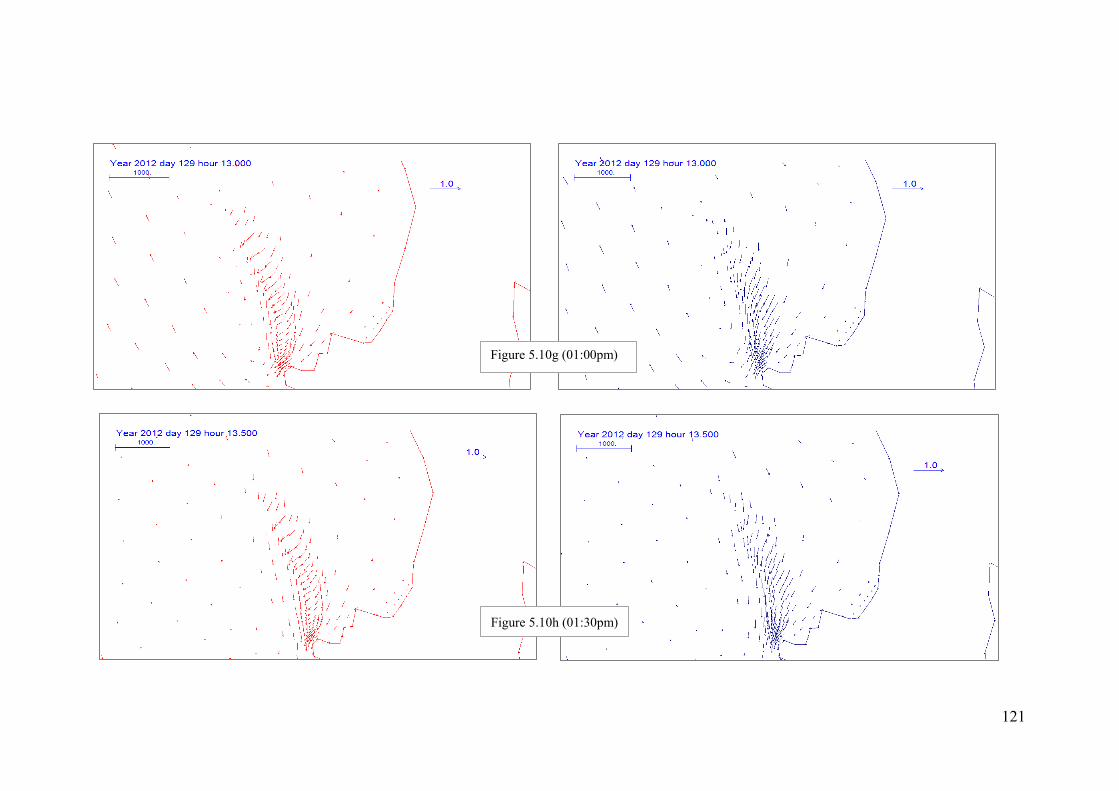
121
Figure 5.10g (01:00pm)
Figure 5.10g (01:00pm)
Figure 5.10g (01:00pm)
Figure 5.10g (01:00pm)
Figure 5.10g (01:00pm)
Figure 5.10g (01:00pm)
Figure 5.10g (01:00pm)
Figure 5.10g (01:00pm)
Figure 5.10h (01:30pm)
122
5.4.2 Sand transport modelling results
The adopted sand concentration of 5 mgl-1 from the continuity lines, combined with
the high tidal currents, resulted in a low sand accumulation in the Harbour. Sand
originating from offshore flows into the Harbour with the incoming/flood tide, then
deposits when the tidal current is slowing down. Due to the low rivers’ inflow, sand
entering the Harbour from the rivers tends to deposit in and near the river mouths.
The net deposition of sand during the sediment transport simulation using the RMA
modelling suite is represented by the bed changes at the model nodes. The simulated
bed level change is the difference in bed elevation between the final simulated
elevation and the initial bed elevation at the start of the simulation.
Since the simulations were carried out without an initial bed thickness, in which
there was no sand to erode and to bring into suspension and be distributed, the model
tends to transport and deposit the incoming sand initially in the entire Harbour.
Consequently, while indicating a clear pathway pattern/trend, the high tidal velocity
caused a very low net deposition.
The primary sand transport mode is bed load transport, hence most of the incoming
sand drops out from suspension and deposits on and adjacent to the boundary lines.
The suspended sand that is brought into the Harbour by the high velocity tidal
currents, deposits when the velocity slows down, is picked up again into suspension
by the next tide and deposits along the transport pathways. The high tidal currents,
together with the unavailability of sand on the bed, prevents bed deposition
development. Hence during the early stages of simulation, sand deposition increases
until reaches a certain depth and then the bed thickness starts fluctuating according to
the tide, with zero net increase in deposition. This depositional pattern, which is
more apparent in the spring tides and ceases during the neap tidal periods, occurs
first at nodes closer to the boundary line and progresses further along the transport
pathways.
The results of the four-year/48-month simulations (May 2012 – April 2016) show
that the highest deposition/bed changes from the 5 mgl-1 sand input are
approximately 75μm for fine sand, 150μm for medium sand and 300μm for coarse
sand. These patterns occurred due to sand input from both offshore and the rivers.
Some exceptions to this depositional pattern occur where the local morphology
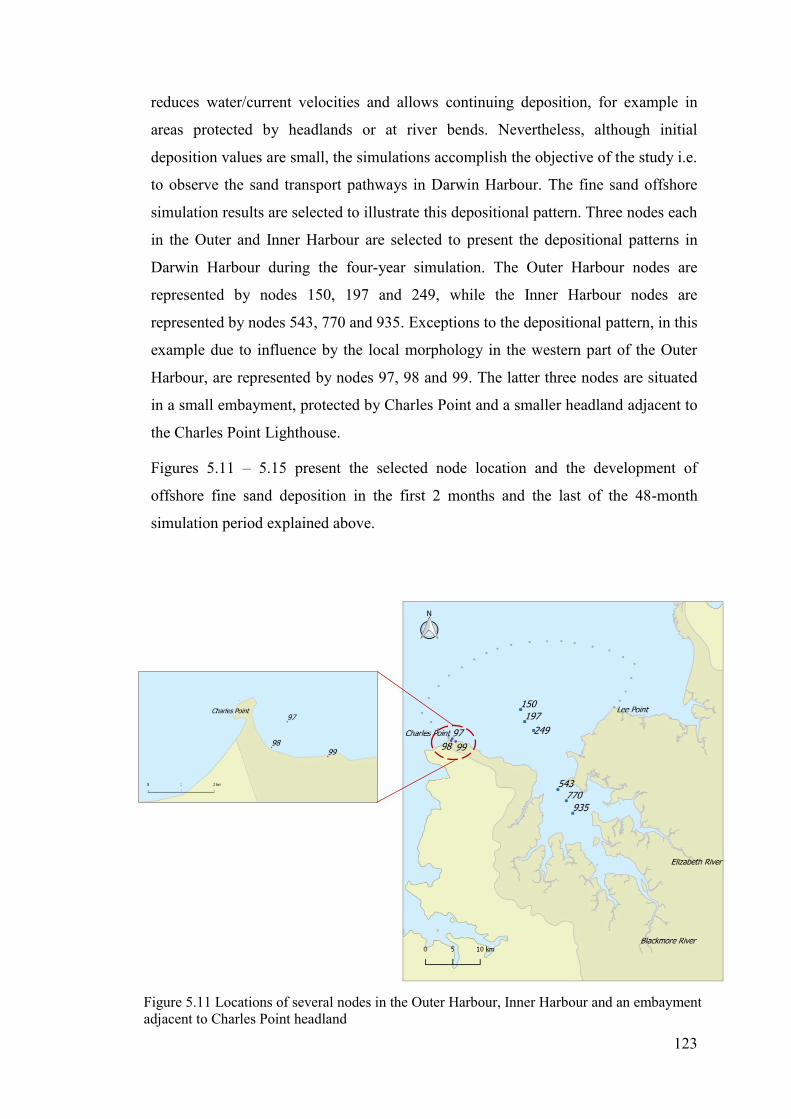
123
reduces water/current velocities and allows continuing deposition, for example in
areas protected by headlands or at river bends. Nevertheless, although initial
deposition values are small, the simulations accomplish the objective of the study i.e.
to observe the sand transport pathways in Darwin Harbour. The fine sand offshore
simulation results are selected to illustrate this depositional pattern. Three nodes each
in the Outer and Inner Harbour are selected to present the depositional patterns in
Darwin Harbour during the four-year simulation. The Outer Harbour nodes are
represented by nodes 150, 197 and 249, while the Inner Harbour nodes are
represented by nodes 543, 770 and 935. Exceptions to the depositional pattern, in this
example due to influence by the local morphology in the western part of the Outer
Harbour, are represented by nodes 97, 98 and 99. The latter three nodes are situated
in a small embayment, protected by Charles Point and a smaller headland adjacent to
the Charles Point Lighthouse.
Figures 5.11 – 5.15 present the selected node location and the development of
offshore fine sand deposition in the first 2 months and the last of the 48-month
simulation period explained above.
Figure 5.11 Locations of several nodes in the Outer Harbour, Inner Harbour and an embayment
adjacent to Charles Point headland
124
As presented in Figure 5.12, fine sand originating from offshore flows into the
Harbour with the incoming/flood tide, then deposits at slack water period. After
reaching the maximum bed level at 75μm, the deposition reaches a ‘zero net bed
change/depositional pattern’. The maximum bed change (and the start of the
fluctuating behaviour according to the tides) at node 150 occurs towards the end of
the 1st month of simulation (May 2012). Similar patterns form slightly inward from
node 150 at node 197, at the beginning of the 2nd month of simulation and at node
249 towards the end of the 2nd month of simulation (June 2012), while the
deposition at the other representative nodes are increasing.
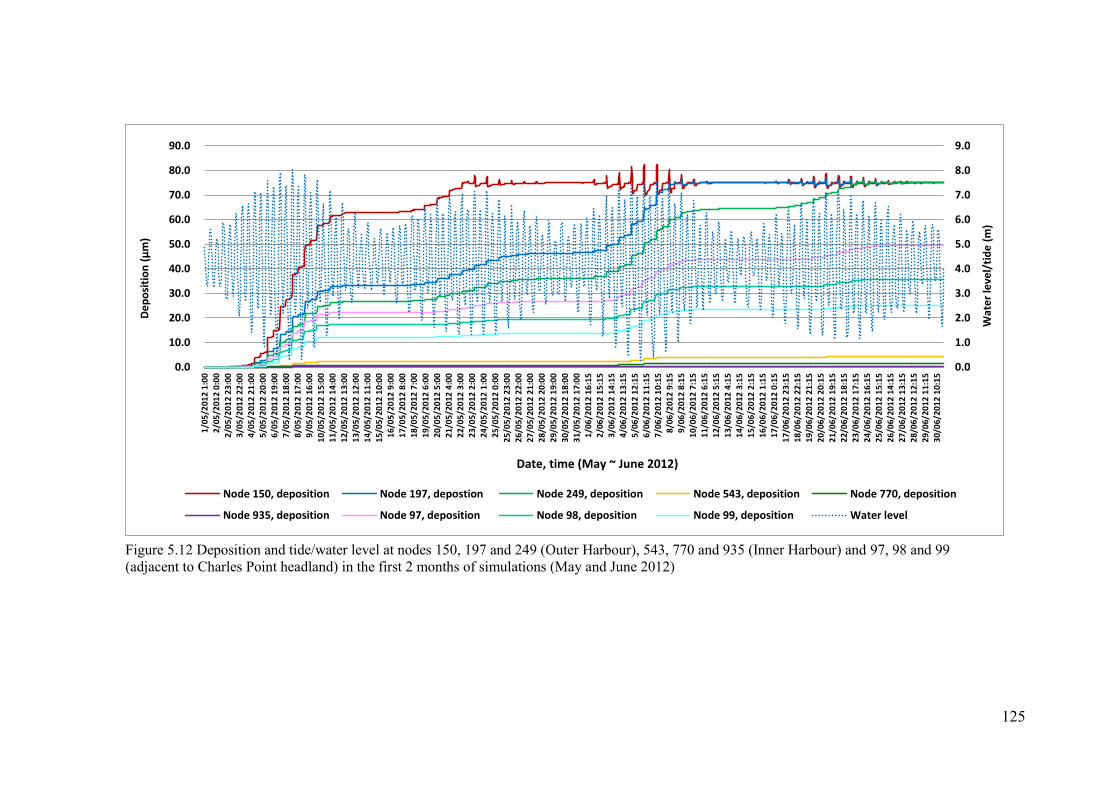
125
0.0
1.0
2.0
3.0
4.0
5.0
6.0
7.0
8.0
9.0
0.0
10.0
20.0
30.0
40.0
50.0
60.0
70.0
80.0
90.0
1/0
5/2
012
1:0
0
2/0
5/2
012
0:0
0
2/0
5/2
012
23
:00
3/0
5/2
012
22
:00
4/0
5/2
012
21
:00
5/0
5/2
012
20
:00
6/0
5/2
012
19
:00
7/0
5/2
012
18
:00
8/0
5/2
012
17
:00
9/0
5/2
012
16
:00
10/
05/
2012
15:
00
11/
05/
2012
14:
00
12/
05/
2012
13:
00
13/
05/
2012
12:
00
14/
05/
2012
11:
00
15/
05/
2012
10:
00
16/
05/
2012
9:0
0
17/
05/
2012
8:0
0
18/
05/
2012
7:0
0
19/
05/
2012
6:0
0
20/
05/
2012
5:0
0
21/
05/
2012
4:0
0
22/
05/
2012
3:0
0
23/
05/
2012
2:0
0
24/
05/
2012
1:0
0
25/
05/
2012
0:0
0
25/
05/
2012
23:
00
26/
05/
2012
22:
00
27/
05/
2012
21:
00
28/
05/
2012
20:
00
29/
05/
2012
19:
00
30/
05/
2012
18:
00
31/
05/
2012
17:
00
1/0
6/2
012
16
:15
2/0
6/2
012
15
:15
3/0
6/2
012
14
:15
4/0
6/2
012
13
:15
5/0
6/2
012
12
:15
6/0
6/2
012
11
:15
7/0
6/2
012
10
:15
8/0
6/2
012
9:1
5
9/0
6/2
012
8:1
5
10/
06/
2012
7:1
5
11/
06/
2012
6:1
5
12/
06/
2012
5:1
5
13/
06/
2012
4:1
5
14/
06/
2012
3:1
5
15/
06/
2012
2:1
5
16/
06/
2012
1:1
5
17/
06/
2012
0:1
5
17/
06/
2012
23:
15
18/
06/
2012
22:
15
19/
06/
2012
21:
15
20/
06/
2012
20:
15
21/
06/
2012
19:
15
22/
06/
2012
18:
15
23/
06/
2012
17:
15
24/
06/
2012
16:
15
25/
06/
2012
15:
15
26/
06/
2012
14:
15
27/
06/
2012
13:
15
28/
06/
2012
12:
15
29/
06/
2012
11:
15
30/
06/
2012
10:
15
Wat
er
leve
l/ti
de
(m
)
De
po
siti
on
(μ
m)
Date, time (May ~ June 2012)
Node 150, deposition Node 197, depostion Node 249, deposition Node 543, deposition Node 770, deposition
Node 935, deposition Node 97, deposition Node 98, deposition Node 99, deposition Water level
Figure 5.12 Deposition and tide/water level at nodes 150, 197 and 249 (Outer Harbour), 543, 770 and 935 (Inner Harbour) and 97, 98 and 99
(adjacent to Charles Point headland) in the first 2 months of simulations (May and June 2012)
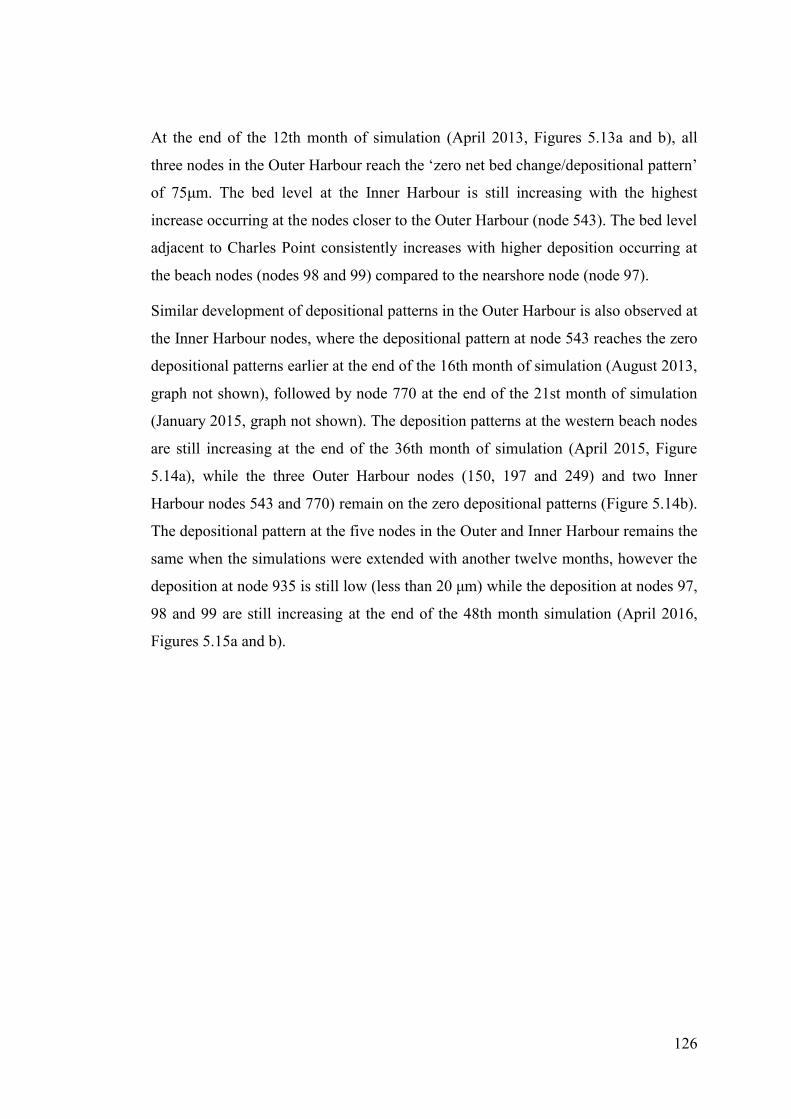
126
At the end of the 12th month of simulation (April 2013, Figures 5.13a and b), all
three nodes in the Outer Harbour reach the ‘zero net bed change/depositional pattern’
of 75μm. The bed level at the Inner Harbour is still increasing with the highest
increase occurring at the nodes closer to the Outer Harbour (node 543). The bed level
adjacent to Charles Point consistently increases with higher deposition occurring at
the beach nodes (nodes 98 and 99) compared to the nearshore node (node 97).
Similar development of depositional patterns in the Outer Harbour is also observed at
the Inner Harbour nodes, where the depositional pattern at node 543 reaches the zero
depositional patterns earlier at the end of the 16th month of simulation (August 2013,
graph not shown), followed by node 770 at the end of the 21st month of simulation
(January 2015, graph not shown). The deposition patterns at the western beach nodes
are still increasing at the end of the 36th month of simulation (April 2015, Figure
5.14a), while the three Outer Harbour nodes (150, 197 and 249) and two Inner
Harbour nodes 543 and 770) remain on the zero depositional patterns (Figure 5.14b).
The depositional pattern at the five nodes in the Outer and Inner Harbour remains the
same when the simulations were extended with another twelve months, however the
deposition at node 935 is still low (less than 20 μm) while the deposition at nodes 97,
98 and 99 are still increasing at the end of the 48th month simulation (April 2016,
Figures 5.15a and b).
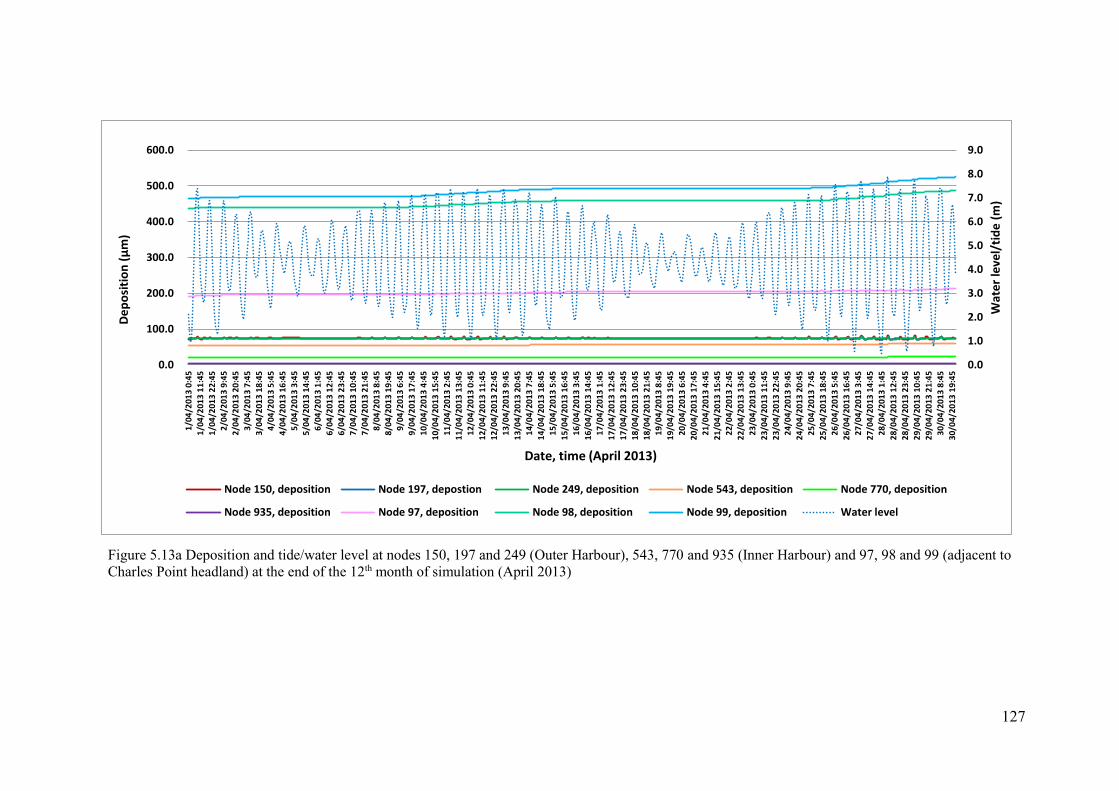
127
0.0
1.0
2.0
3.0
4.0
5.0
6.0
7.0
8.0
9.0
0.0
100.0
200.0
300.0
400.0
500.0
600.0
1/0
4/2
013
0:4
5
1/0
4/2
013
11
:45
1/0
4/2
013
22
:45
2/0
4/2
013
9:4
5
2/0
4/2
013
20
:45
3/0
4/2
013
7:4
5
3/0
4/2
013
18
:45
4/0
4/2
013
5:4
5
4/0
4/2
013
16
:45
5/0
4/2
013
3:4
5
5/0
4/2
013
14
:45
6/0
4/2
013
1:4
5
6/0
4/2
013
12
:45
6/0
4/2
013
23
:45
7/0
4/2
013
10
:45
7/0
4/2
013
21
:45
8/0
4/2
013
8:4
5
8/0
4/2
013
19
:45
9/0
4/2
013
6:4
5
9/0
4/2
013
17
:45
10/
04/
2013
4:4
5
10/
04/
2013
15:
45
11/
04/
2013
2:4
5
11/
04/
2013
13:
45
12/
04/
2013
0:4
5
12/
04/
2013
11:
45
12/
04/
2013
22:
45
13/
04/
2013
9:4
5
13/
04/
2013
20:
45
14/
04/
2013
7:4
5
14/
04/
2013
18:
45
15/
04/
2013
5:4
5
15/
04/
2013
16:
45
16/
04/
2013
3:4
5
16/
04/
2013
14:
45
17/
04/
2013
1:4
5
17/
04/
2013
12:
45
17/
04/
2013
23:
45
18/
04/
2013
10:
45
18/
04/
2013
21:
45
19/
04/
2013
8:4
5
19/
04/
2013
19:
45
20/
04/
2013
6:4
5
20/
04/
2013
17:
45
21/
04/
2013
4:4
5
21/
04/
2013
15:
45
22/
04/
2013
2:4
5
22/
04/
2013
13:
45
23/
04/
2013
0:4
5
23/
04/
2013
11:
45
23/
04/
2013
22:
45
24/
04/
2013
9:4
5
24/
04/
2013
20:
45
25/
04/
2013
7:4
5
25/
04/
2013
18:
45
26/
04/
2013
5:4
5
26/
04/
2013
16:
45
27/
04/
2013
3:4
5
27/
04/
2013
14:
45
28/
04/
2013
1:4
5
28/
04/
2013
12:
45
28/
04/
2013
23:
45
29/
04/
2013
10:
45
29/
04/
2013
21:
45
30/
04/
2013
8:4
5
30/
04/
2013
19:
45
Wat
er
leve
l/ti
de
(m
)
De
po
siti
on
(μ
m)
Date, time (April 2013)
Node 150, deposition Node 197, depostion Node 249, deposition Node 543, deposition Node 770, deposition
Node 935, deposition Node 97, deposition Node 98, deposition Node 99, deposition Water level
Figure 5.13a Deposition and tide/water level at nodes 150, 197 and 249 (Outer Harbour), 543, 770 and 935 (Inner Harbour) and 97, 98 and 99 (adjacent to
Charles Point headland) at the end of the 12th month of simulation (April 2013)
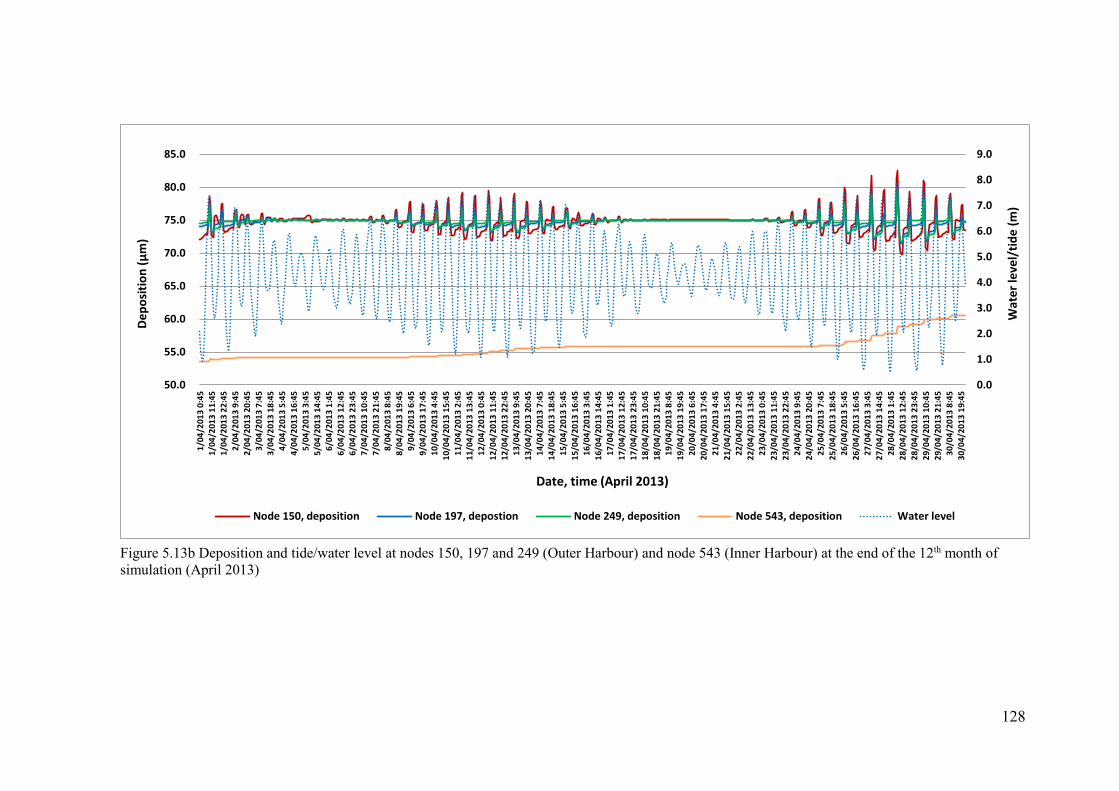
128
0.0
1.0
2.0
3.0
4.0
5.0
6.0
7.0
8.0
9.0
50.0
55.0
60.0
65.0
70.0
75.0
80.0
85.0
1/0
4/2
013
0:4
5
1/0
4/2
013
11
:45
1/0
4/2
013
22
:45
2/0
4/2
013
9:4
5
2/0
4/2
013
20
:45
3/0
4/2
013
7:4
5
3/0
4/2
013
18
:45
4/0
4/2
013
5:4
5
4/0
4/2
013
16
:45
5/0
4/2
013
3:4
5
5/0
4/2
013
14
:45
6/0
4/2
013
1:4
5
6/0
4/2
013
12
:45
6/0
4/2
013
23
:45
7/0
4/2
013
10
:45
7/0
4/2
013
21
:45
8/0
4/2
013
8:4
5
8/0
4/2
013
19
:45
9/0
4/2
013
6:4
5
9/0
4/2
013
17
:45
10/
04/
2013
4:4
5
10/
04/
2013
15:
45
11/
04/
2013
2:4
5
11/
04/
2013
13:
45
12/
04/
2013
0:4
5
12/
04/
2013
11:
45
12/
04/
2013
22:
45
13/
04/
2013
9:4
5
13/
04/
2013
20:
45
14/
04/
2013
7:4
5
14/
04/
2013
18:
45
15/
04/
2013
5:4
5
15/
04/
2013
16:
45
16/
04/
2013
3:4
5
16/
04/
2013
14:
45
17/
04/
2013
1:4
5
17/
04/
2013
12:
45
17/
04/
2013
23:
45
18/
04/
2013
10:
45
18/
04/
2013
21:
45
19/
04/
2013
8:4
5
19/
04/
2013
19:
45
20/
04/
2013
6:4
5
20/
04/
2013
17:
45
21/
04/
2013
4:4
5
21/
04/
2013
15:
45
22/
04/
2013
2:4
5
22/
04/
2013
13:
45
23/
04/
2013
0:4
5
23/
04/
2013
11:
45
23/
04/
2013
22:
45
24/
04/
2013
9:4
5
24/
04/
2013
20:
45
25/
04/
2013
7:4
5
25/
04/
2013
18:
45
26/
04/
2013
5:4
5
26/
04/
2013
16:
45
27/
04/
2013
3:4
5
27/
04/
2013
14:
45
28/
04/
2013
1:4
5
28/
04/
2013
12:
45
28/
04/
2013
23:
45
29/
04/
2013
10:
45
29/
04/
2013
21:
45
30/
04/
2013
8:4
5
30/
04/
2013
19:
45
Wat
er
leve
l/ti
de
(m
)
De
po
siti
on
(μ
m)
Date, time (April 2013)
Node 150, deposition Node 197, depostion Node 249, deposition Node 543, deposition Water level
Figure 5.13b Deposition and tide/water level at nodes 150, 197 and 249 (Outer Harbour) and node 543 (Inner Harbour) at the end of the 12th month of
simulation (April 2013)
129
0.0
1.0
2.0
3.0
4.0
5.0
6.0
7.0
8.0
9.0
0.0
500.0
1,000.0
1,500.0
2,000.0
2,500.0
1/0
4/2
015
0:4
5
1/0
4/2
015
14
:45
2/0
4/2
015
4:4
5
2/0
4/2
015
18
:45
3/0
4/2
015
8:4
5
3/0
4/2
015
22
:45
4/0
4/2
015
12
:45
5/0
4/2
015
2:4
5
5/0
4/2
015
16
:45
6/0
4/2
015
6:4
5
6/0
4/2
015
20
:45
7/0
4/2
015
10
:45
8/0
4/2
015
0:4
5
8/0
4/2
015
14
:45
9/0
4/2
015
4:4
5
9/0
4/2
015
18
:45
10
/04/
2015
8:4
5
10/
04/
2015
22:
45
11/
04/
2015
12:
45
12
/04/
2015
2:4
5
12/
04/
2015
16:
45
13
/04/
2015
6:4
5
13/
04/
2015
20:
45
14/
04/
2015
10:
45
15
/04/
2015
0:4
5
15/
04/
2015
14:
45
16
/04/
2015
4:4
5
16/
04/
2015
18:
45
17
/04/
2015
8:4
5
17/
04/
2015
22:
45
18/
04/
2015
12:
45
19
/04/
2015
2:4
5
19/
04/
2015
16:
45
20
/04/
2015
6:4
5
20/
04/
2015
20:
45
21/
04/
2015
10:
45
22
/04/
2015
0:4
5
22/
04/
2015
14:
45
23
/04/
2015
4:4
5
23/
04/
2015
18:
45
24
/04/
2015
8:4
5
24/
04/
2015
22:
45
25/
04/
2015
12:
45
26
/04/
2015
2:4
5
26/
04/
2015
16:
45
27
/04/
2015
6:4
5
27/
04/
2015
20:
45
28/
04/
2015
10:
45
29
/04/
2015
0:4
5
29/
04/
2015
14:
45
30
/04/
2015
4:4
5
30/
04/
2015
18:
45
Wat
er
leve
l/ti
de
(m
)
De
po
siti
on
(μ
m)
Date, time (April 2015)
Node 150, deposition Node 197, depostion Node 249, deposition Node 543, deposition
Node 770, deposition Node 935, deposition Node 97, deposition Node 98, deposition
Node 99, deposition Water level
Figure 5.14a Deposition and tide/water level at nodes 150, 197 and 249 (Outer Harbour), 543, 770 and 935 (Inner Harbour) and 97,
98 and 99 (adjacent to Charles Point headland) at the end of the 36th month of simulation (April 2015)
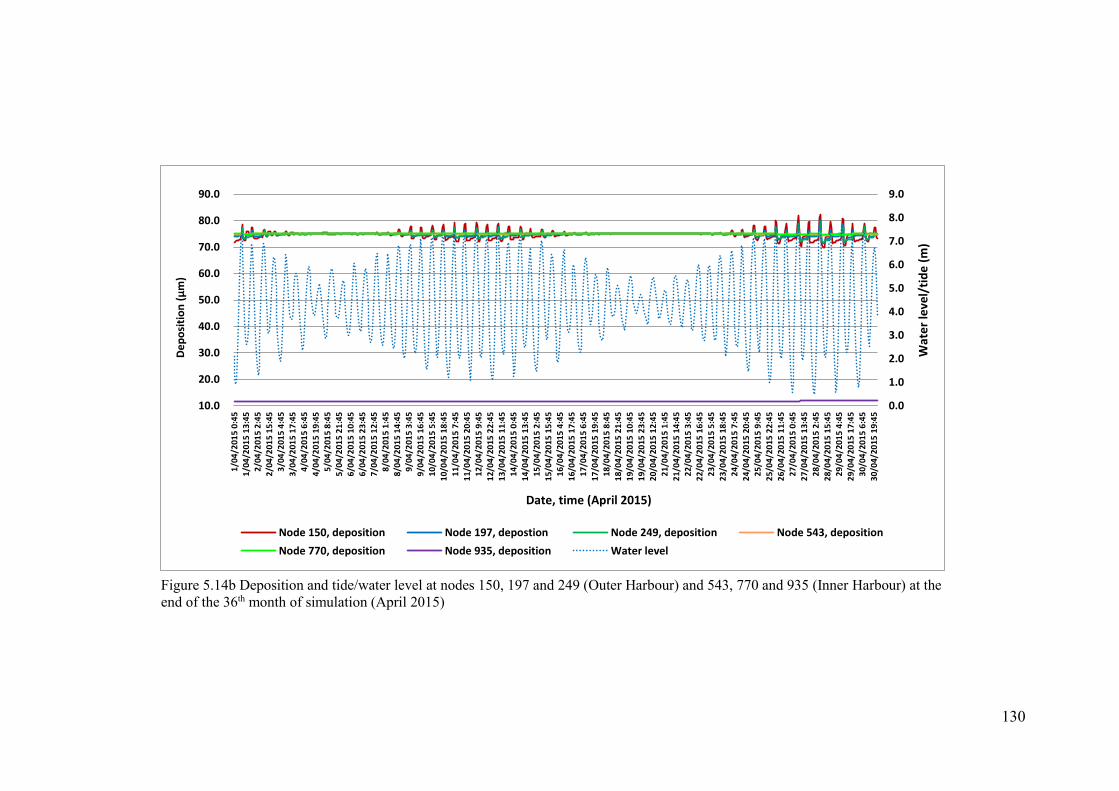
130
0.0
1.0
2.0
3.0
4.0
5.0
6.0
7.0
8.0
9.0
10.0
20.0
30.0
40.0
50.0
60.0
70.0
80.0
90.0
1/0
4/2
015
0:4
5
1/0
4/2
015
13
:45
2/0
4/2
015
2:4
5
2/0
4/2
015
15
:45
3/0
4/2
015
4:4
5
3/0
4/2
015
17
:45
4/0
4/2
015
6:4
5
4/0
4/2
015
19
:45
5/0
4/2
015
8:4
5
5/0
4/2
015
21
:45
6/0
4/2
015
10
:45
6/0
4/2
015
23
:45
7/0
4/2
015
12
:45
8/0
4/2
015
1:4
5
8/0
4/2
015
14
:45
9/0
4/2
015
3:4
5
9/0
4/2
015
16
:45
10/
04/
2015
5:4
5
10/
04/
2015
18:
45
11/
04/
2015
7:4
5
11/
04/
2015
20:
45
12/
04/
2015
9:4
5
12/
04/
2015
22:
45
13/
04/
2015
11:
45
14/
04/
2015
0:4
5
14/
04/
2015
13:
45
15/
04/
2015
2:4
5
15/
04/
2015
15:
45
16/
04/
2015
4:4
5
16/
04/
2015
17:
45
17/
04/
2015
6:4
5
17/
04/
2015
19:
45
18/
04/
2015
8:4
5
18/
04/
2015
21:
45
19/
04/
2015
10:
45
19/
04/
2015
23:
45
20/
04/
2015
12:
45
21/
04/
2015
1:4
5
21/
04/
2015
14:
45
22/
04/
2015
3:4
5
22/
04/
2015
16:
45
23/
04/
2015
5:4
5
23/
04/
2015
18:
45
24/
04/
2015
7:4
5
24/
04/
2015
20:
45
25/
04/
2015
9:4
5
25/
04/
2015
22:
45
26/
04/
2015
11:
45
27/
04/
2015
0:4
5
27/
04/
2015
13:
45
28/
04/
2015
2:4
5
28/
04/
2015
15:
45
29/
04/
2015
4:4
5
29/
04/
2015
17:
45
30/
04/
2015
6:4
5
30/
04/
2015
19:
45
Wat
er
leve
l/ti
de
(m
)
De
po
siti
on
(μ
m)
Date, time (April 2015)
Node 150, deposition Node 197, depostion Node 249, deposition Node 543, deposition
Node 770, deposition Node 935, deposition Water level
Figure 5.14b Deposition and tide/water level at nodes 150, 197 and 249 (Outer Harbour) and 543, 770 and 935 (Inner Harbour) at the
end of the 36th month of simulation (April 2015)
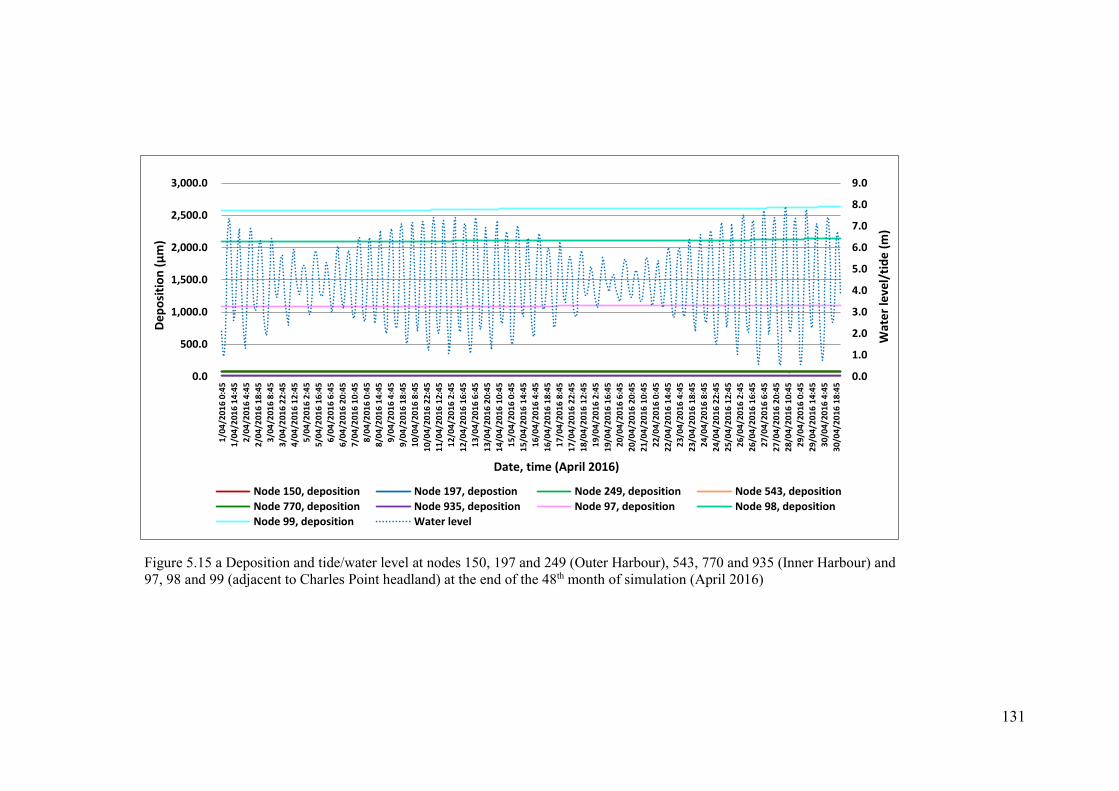
131
0.0
1.0
2.0
3.0
4.0
5.0
6.0
7.0
8.0
9.0
0.0
500.0
1,000.0
1,500.0
2,000.0
2,500.0
3,000.0
1/0
4/2
016
0:4
5
1/0
4/2
016
14
:45
2/0
4/2
016
4:4
5
2/0
4/2
016
18
:45
3/0
4/2
016
8:4
5
3/0
4/2
016
22
:45
4/0
4/2
016
12
:45
5/0
4/2
016
2:4
5
5/0
4/2
016
16
:45
6/0
4/2
016
6:4
5
6/0
4/2
016
20
:45
7/0
4/2
016
10
:45
8/0
4/2
016
0:4
5
8/0
4/2
016
14
:45
9/0
4/2
016
4:4
5
9/0
4/2
016
18
:45
10/
04/
2016
8:4
5
10/
04/
2016
22:
45
11/
04/
2016
12:
45
12/
04/
2016
2:4
5
12/
04/
2016
16:
45
13/
04/
2016
6:4
5
13/
04/
2016
20:
45
14/
04/
2016
10:
45
15/
04/
2016
0:4
5
15/
04/
2016
14:
45
16/
04/
2016
4:4
5
16/
04/
2016
18:
45
17/
04/
2016
8:4
5
17/
04/
2016
22:
45
18/
04/
2016
12:
45
19/
04/
2016
2:4
5
19/
04/
2016
16:
45
20/
04/
2016
6:4
5
20/
04/
2016
20:
45
21/
04/
2016
10:
45
22/
04/
2016
0:4
5
22/
04/
2016
14:
45
23/
04/
2016
4:4
5
23/
04/
2016
18:
45
24/
04/
2016
8:4
5
24/
04/
2016
22:
45
25/
04/
2016
12:
45
26/
04/
2016
2:4
5
26/
04/
2016
16:
45
27/
04/
2016
6:4
5
27/
04/
2016
20:
45
28/
04/
2016
10:
45
29/
04/
2016
0:4
5
29/
04/
2016
14:
45
30/
04/
2016
4:4
5
30/
04/
2016
18:
45
Wat
er
leve
l/ti
de
(m
)
De
po
siti
on
(μ
m)
Date, time (April 2016)
Node 150, deposition Node 197, depostion Node 249, deposition Node 543, deposition
Node 770, deposition Node 935, deposition Node 97, deposition Node 98, deposition
Node 99, deposition Water level
Figure 5.15 a Deposition and tide/water level at nodes 150, 197 and 249 (Outer Harbour), 543, 770 and 935 (Inner Harbour) and
97, 98 and 99 (adjacent to Charles Point headland) at the end of the 48th month of simulation (April 2016)
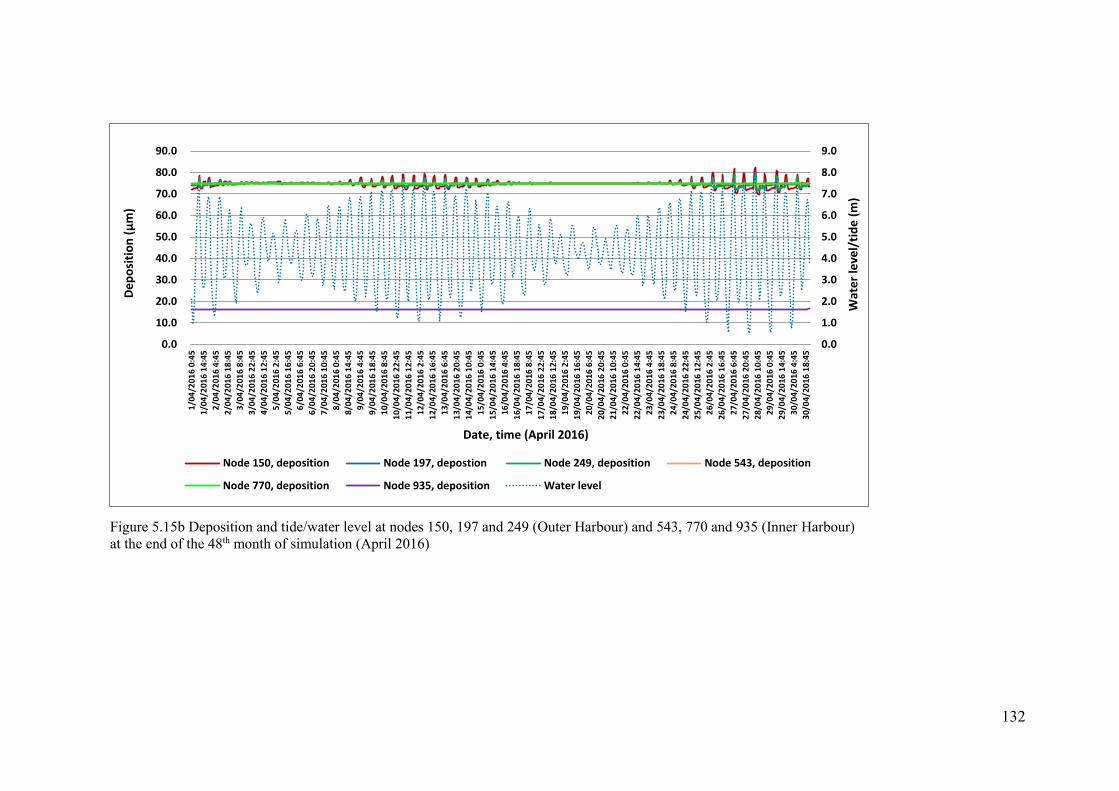
132
0.0
1.0
2.0
3.0
4.0
5.0
6.0
7.0
8.0
9.0
0.0
10.0
20.0
30.0
40.0
50.0
60.0
70.0
80.0
90.0
1/0
4/2
016
0:4
5
1/0
4/2
016
14
:45
2/0
4/2
016
4:4
5
2/0
4/2
016
18
:45
3/0
4/2
016
8:4
5
3/0
4/2
016
22
:45
4/0
4/2
016
12
:45
5/0
4/2
016
2:4
5
5/0
4/2
016
16
:45
6/0
4/2
016
6:4
5
6/0
4/2
016
20
:45
7/0
4/2
016
10
:45
8/0
4/2
016
0:4
5
8/0
4/2
016
14
:45
9/0
4/2
016
4:4
5
9/0
4/2
016
18
:45
10/
04/
2016
8:4
5
10/
04/
2016
22:
45
11/
04/
2016
12:
45
12/
04/
2016
2:4
5
12/
04/
2016
16:
45
13/
04/
2016
6:4
5
13/
04/
2016
20:
45
14/
04/
2016
10:
45
15/
04/
2016
0:4
5
15/
04/
2016
14:
45
16/
04/
2016
4:4
5
16/
04/
2016
18:
45
17/
04/
2016
8:4
5
17/
04/
2016
22:
45
18/
04/
2016
12:
45
19/
04/
2016
2:4
5
19/
04/
2016
16:
45
20/
04/
2016
6:4
5
20/
04/
2016
20:
45
21/
04/
2016
10:
45
22/
04/
2016
0:4
5
22/
04/
2016
14:
45
23/
04/
2016
4:4
5
23/
04/
2016
18:
45
24/
04/
2016
8:4
5
24/
04/
2016
22:
45
25/
04/
2016
12:
45
26/
04/
2016
2:4
5
26/
04/
2016
16:
45
27/
04/
2016
6:4
5
27/
04/
2016
20:
45
28/
04/
2016
10:
45
29/
04/
2016
0:4
5
29/
04/
2016
14:
45
30/
04/
2016
4:4
5
30/
04/
2016
18:
45
Wat
er
leve
l/ti
de
(m
)
De
po
siti
on
(μ
m)
Date, time (April 2016)
Node 150, deposition Node 197, depostion Node 249, deposition Node 543, deposition
Node 770, deposition Node 935, deposition Water level
Figure 5.15b Deposition and tide/water level at nodes 150, 197 and 249 (Outer Harbour) and 543, 770 and 935 (Inner Harbour)
at the end of the 48th month of simulation (April 2016)
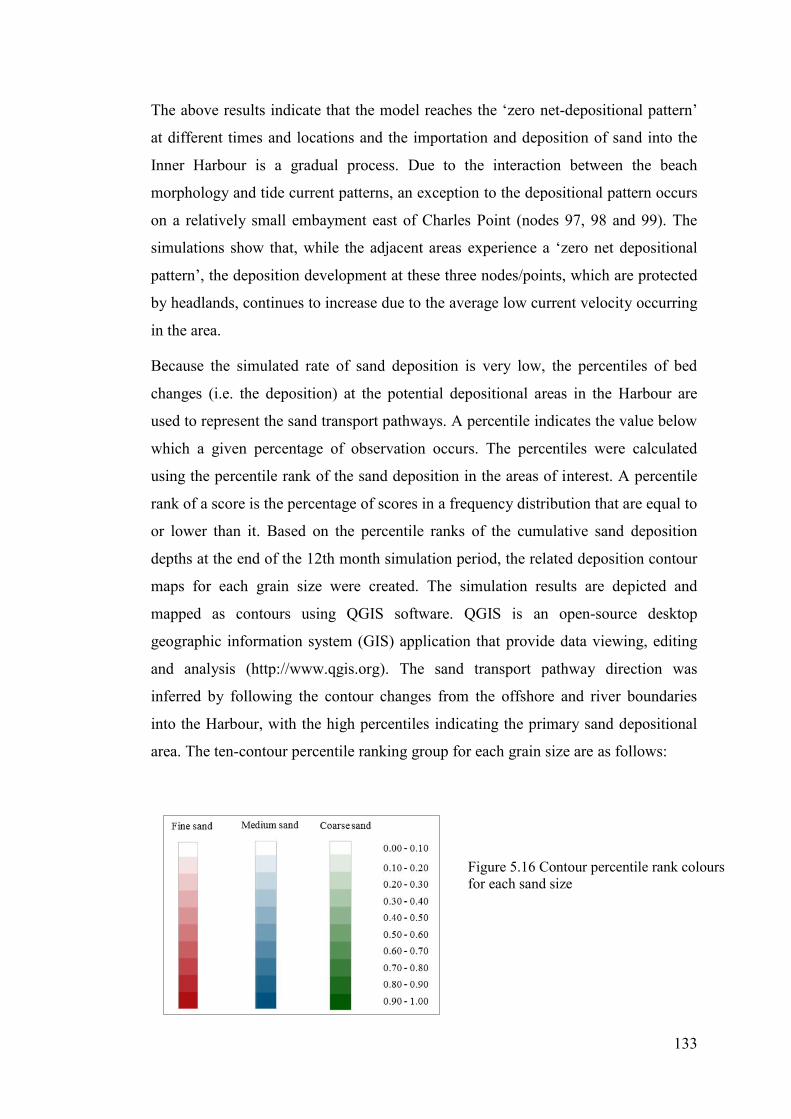
133
The above results indicate that the model reaches the ‘zero net-depositional pattern’
at different times and locations and the importation and deposition of sand into the
Inner Harbour is a gradual process. Due to the interaction between the beach
morphology and tide current patterns, an exception to the depositional pattern occurs
on a relatively small embayment east of Charles Point (nodes 97, 98 and 99). The
simulations show that, while the adjacent areas experience a ‘zero net depositional
pattern’, the deposition development at these three nodes/points, which are protected
by headlands, continues to increase due to the average low current velocity occurring
in the area.
Because the simulated rate of sand deposition is very low, the percentiles of bed
changes (i.e. the deposition) at the potential depositional areas in the Harbour are
used to represent the sand transport pathways. A percentile indicates the value below
which a given percentage of observation occurs. The percentiles were calculated
using the percentile rank of the sand deposition in the areas of interest. A percentile
rank of a score is the percentage of scores in a frequency distribution that are equal to
or lower than it. Based on the percentile ranks of the cumulative sand deposition
depths at the end of the 12th month simulation period, the related deposition contour
maps for each grain size were created. The simulation results are depicted and
mapped as contours using QGIS software. QGIS is an open-source desktop
geographic information system (GIS) application that provide data viewing, editing
and analysis (http://www.qgis.org). The sand transport pathway direction was
inferred by following the contour changes from the offshore and river boundaries
into the Harbour, with the high percentiles indicating the primary sand depositional
area. The ten-contour percentile ranking group for each grain size are as follows:
Figure 5.16 Contour percentile rank colours
for each sand size
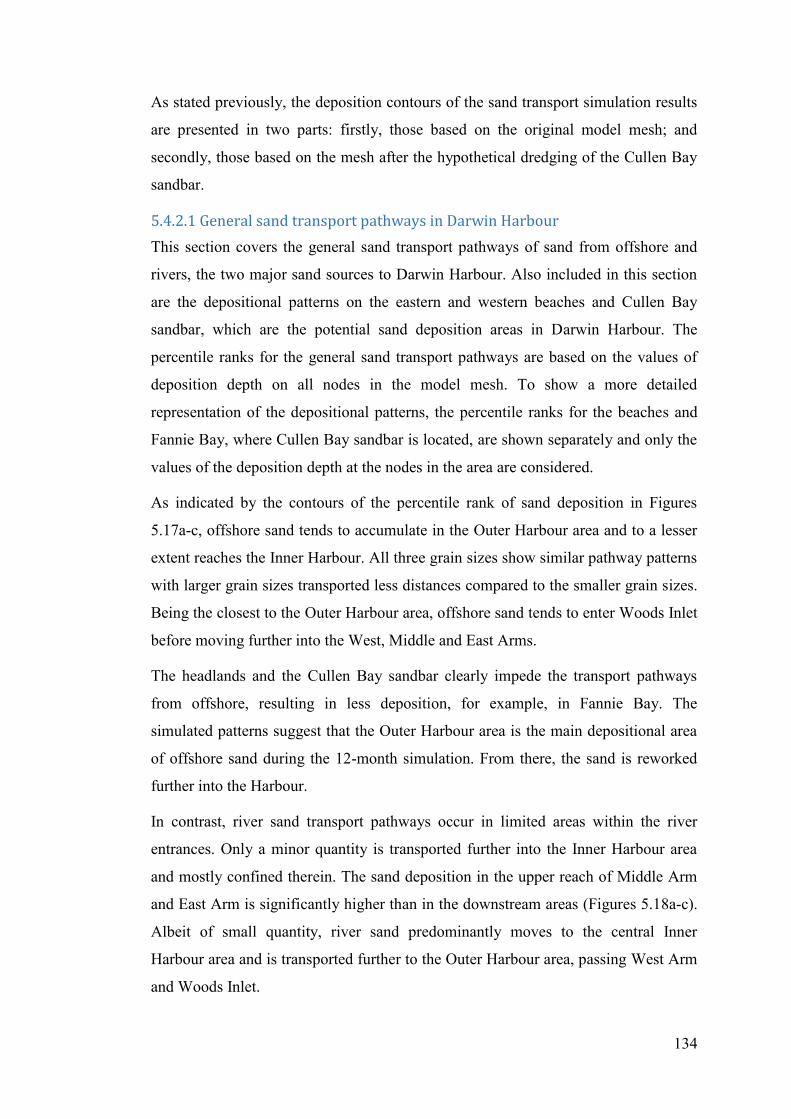
134
As stated previously, the deposition contours of the sand transport simulation results
are presented in two parts: firstly, those based on the original model mesh; and
secondly, those based on the mesh after the hypothetical dredging of the Cullen Bay
sandbar.
5.4.2.1 General sand transport pathways in Darwin Harbour
This section covers the general sand transport pathways of sand from offshore and
rivers, the two major sand sources to Darwin Harbour. Also included in this section
are the depositional patterns on the eastern and western beaches and Cullen Bay
sandbar, which are the potential sand deposition areas in Darwin Harbour. The
percentile ranks for the general sand transport pathways are based on the values of
deposition depth on all nodes in the model mesh. To show a more detailed
representation of the depositional patterns, the percentile ranks for the beaches and
Fannie Bay, where Cullen Bay sandbar is located, are shown separately and only the
values of the deposition depth at the nodes in the area are considered.
As indicated by the contours of the percentile rank of sand deposition in Figures
5.17a-c, offshore sand tends to accumulate in the Outer Harbour area and to a lesser
extent reaches the Inner Harbour. All three grain sizes show similar pathway patterns
with larger grain sizes transported less distances compared to the smaller grain sizes.
Being the closest to the Outer Harbour area, offshore sand tends to enter Woods Inlet
before moving further into the West, Middle and East Arms.
The headlands and the Cullen Bay sandbar clearly impede the transport pathways
from offshore, resulting in less deposition, for example, in Fannie Bay. The
simulated patterns suggest that the Outer Harbour area is the main depositional area
of offshore sand during the 12-month simulation. From there, the sand is reworked
further into the Harbour.
In contrast, river sand transport pathways occur in limited areas within the river
entrances. Only a minor quantity is transported further into the Inner Harbour area
and mostly confined therein. The sand deposition in the upper reach of Middle Arm
and East Arm is significantly higher than in the downstream areas (Figures 5.18a-c).
Albeit of small quantity, river sand predominantly moves to the central Inner
Harbour area and is transported further to the Outer Harbour area, passing West Arm
and Woods Inlet.
135
Similar to the sand pathways from offshore, the transport of river sand is impeded by
headlands and the Cullen Bay sandbar after passing the ‘neck’ of the Harbour. Emery
Point and Cullen Bay sandbar prevent river sand from moving to and depositing in
Fannie Bay. Furthermore, it is apparent from Figures 5.18a-c that East Point impedes
the transport of river sand to the eastern beaches.
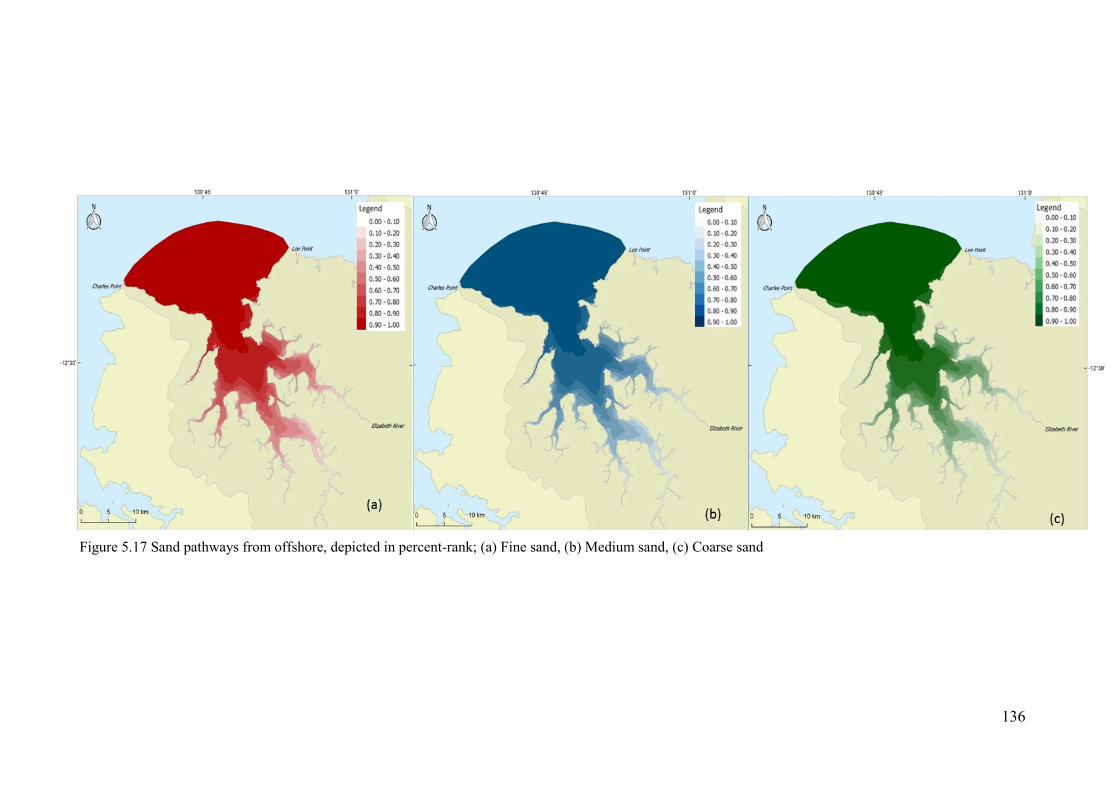
136
Figure 5.17 Sand pathways from offshore, depicted in percent-rank; (a) Fine sand, (b) Medium sand, (c) Coarse sand
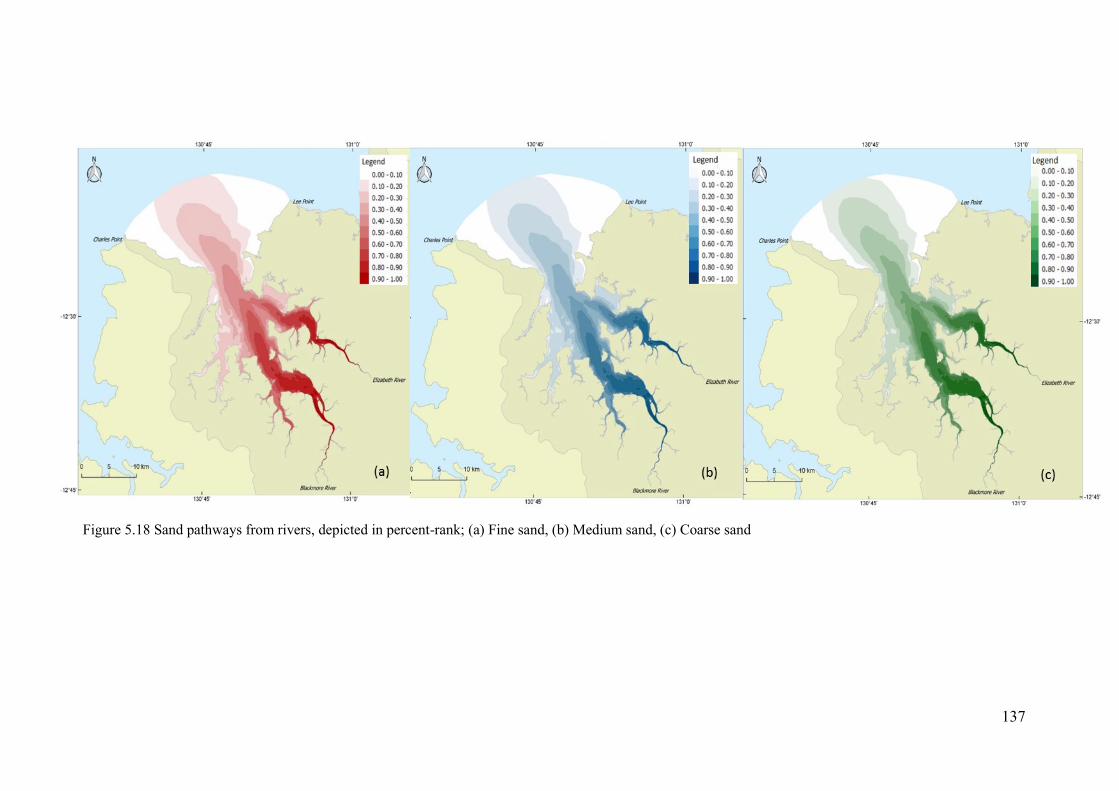
137
Figure 5.18 Sand pathways from rivers, depicted in percent-rank; (a) Fine sand, (b) Medium sand, (c) Coarse sand
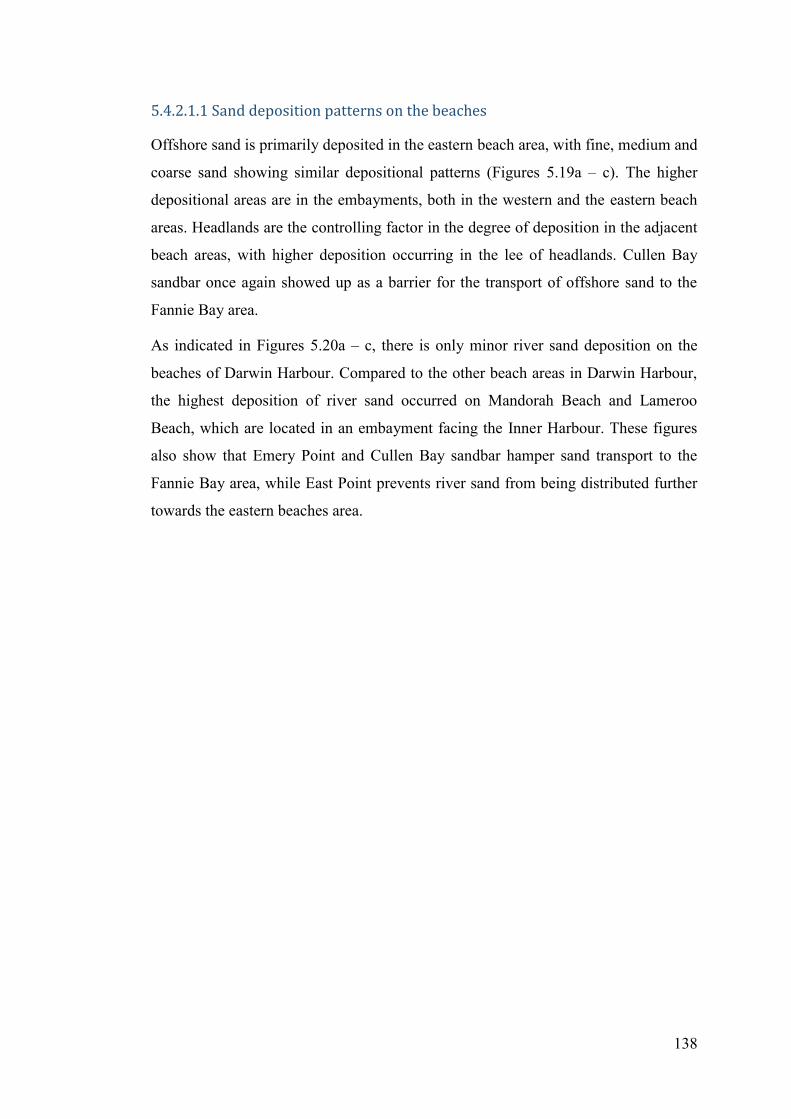
138
5.4.2.1.1 Sand deposition patterns on the beaches
Offshore sand is primarily deposited in the eastern beach area, with fine, medium and
coarse sand showing similar depositional patterns (Figures 5.19a – c). The higher
depositional areas are in the embayments, both in the western and the eastern beach
areas. Headlands are the controlling factor in the degree of deposition in the adjacent
beach areas, with higher deposition occurring in the lee of headlands. Cullen Bay
sandbar once again showed up as a barrier for the transport of offshore sand to the
Fannie Bay area.
As indicated in Figures 5.20a – c, there is only minor river sand deposition on the
beaches of Darwin Harbour. Compared to the other beach areas in Darwin Harbour,
the highest deposition of river sand occurred on Mandorah Beach and Lameroo
Beach, which are located in an embayment facing the Inner Harbour. These figures
also show that Emery Point and Cullen Bay sandbar hamper sand transport to the
Fannie Bay area, while East Point prevents river sand from being distributed further
towards the eastern beaches area.
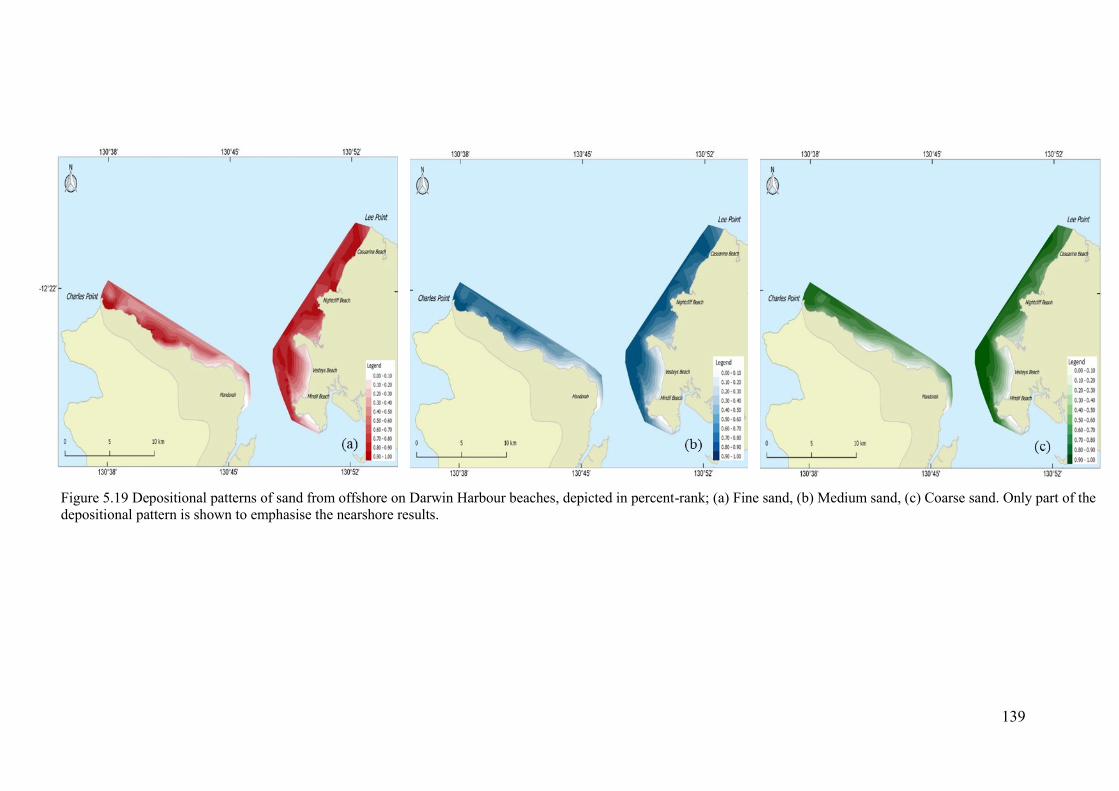
139
Figure 5.19 Depositional patterns of sand from offshore on Darwin Harbour beaches, depicted in percent-rank; (a) Fine sand, (b) Medium sand, (c) Coarse sand. Only part of the
depositional pattern is shown to emphasise the nearshore results.
140
Figure 5.20 River sand depositional patterns on Darwin Harbour beaches, depicted in percent-rank; (a) Fine sand, (b) Medium sand, (c) Coarse sand. Only part of the
depositional pattern is shown to emphasise the nearshore results
141
5.4.2.1.2 Sand deposition patterns in Fannie Bay area
The sand from offshore tends to be deposited primarily on the western part of the
Cullen Bay sandbar (Figures 5.21a – c), with all three grain sizes showing similar
patterns. The deposition level is highest on the northern part of the sandbar and
incrementally decreases southward. This trend is particularly obvious for the medium
and the coarse sand sizes. Additionally, as clearly observed on the southern part of
the sandbar, the depositional patterns are influenced by the bathymetry of the area.
Being the shallowest part of the sandbar, the lowest depositional area occurs at the
southern-most part.
Similar to offshore sand, river sand tends to be deposited on the western part of the
Cullen Bay sandbar (Figures 5.22a – c). However, unlike offshore sand, the degree of
river sand deposition decreases eastward. Furthermore, albeit slightly, river sand has
a tendency of depositing on the southern part of the sandbar, entering a short distance
over Emery Point and distributed northward on the eastern part of the sandbar.
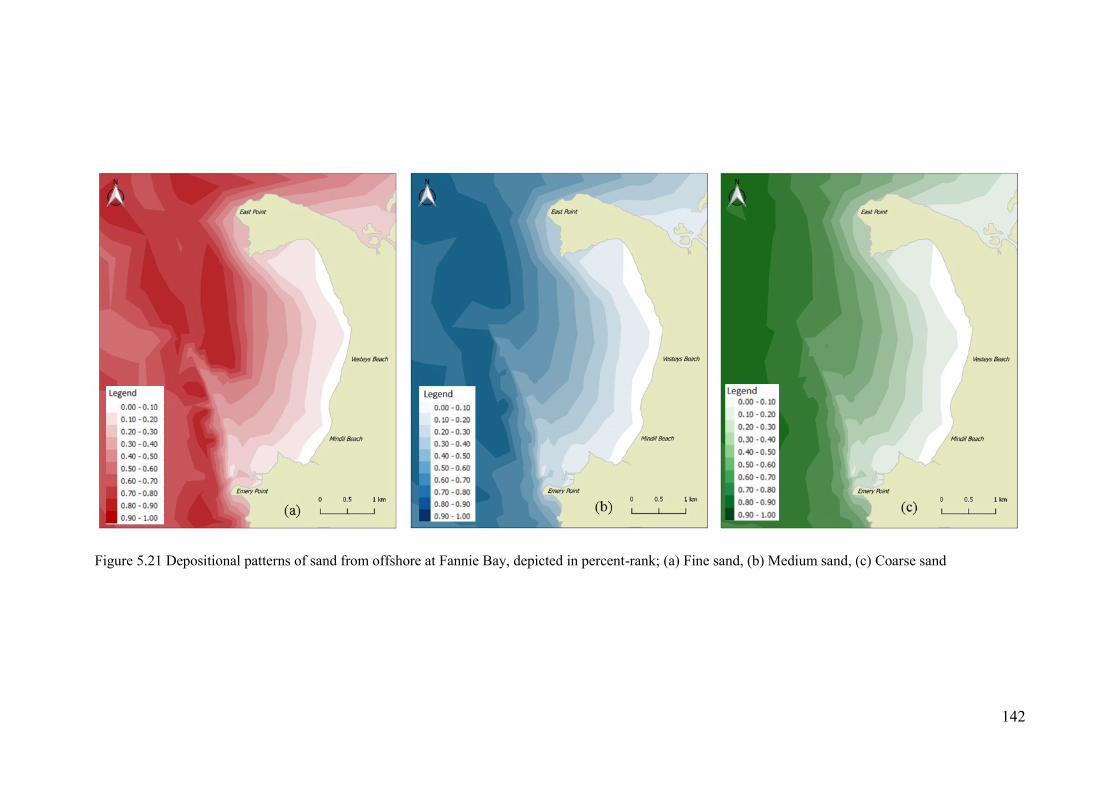
142
Figure 5.21 Depositional patterns of sand from offshore at Fannie Bay, depicted in percent-rank; (a) Fine sand, (b) Medium sand, (c) Coarse sand
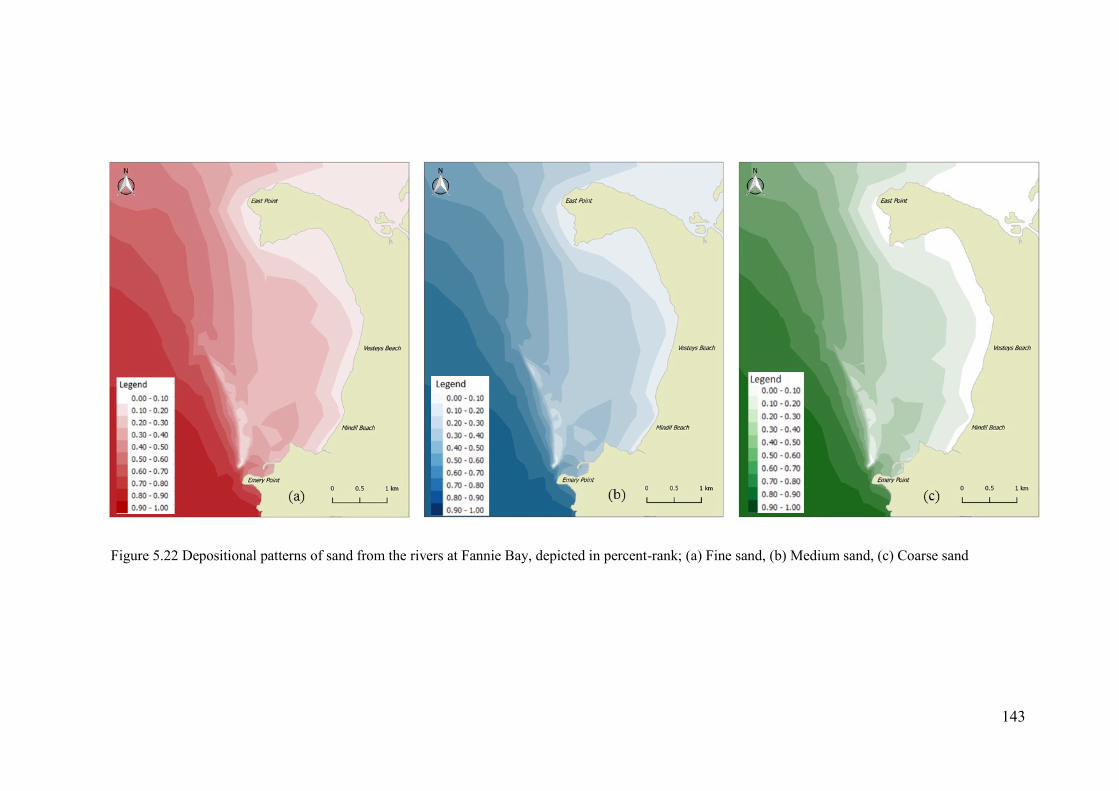
143
Figure 5.22 Depositional patterns of sand from the rivers at Fannie Bay, depicted in percent-rank; (a) Fine sand, (b) Medium sand, (c) Coarse sand
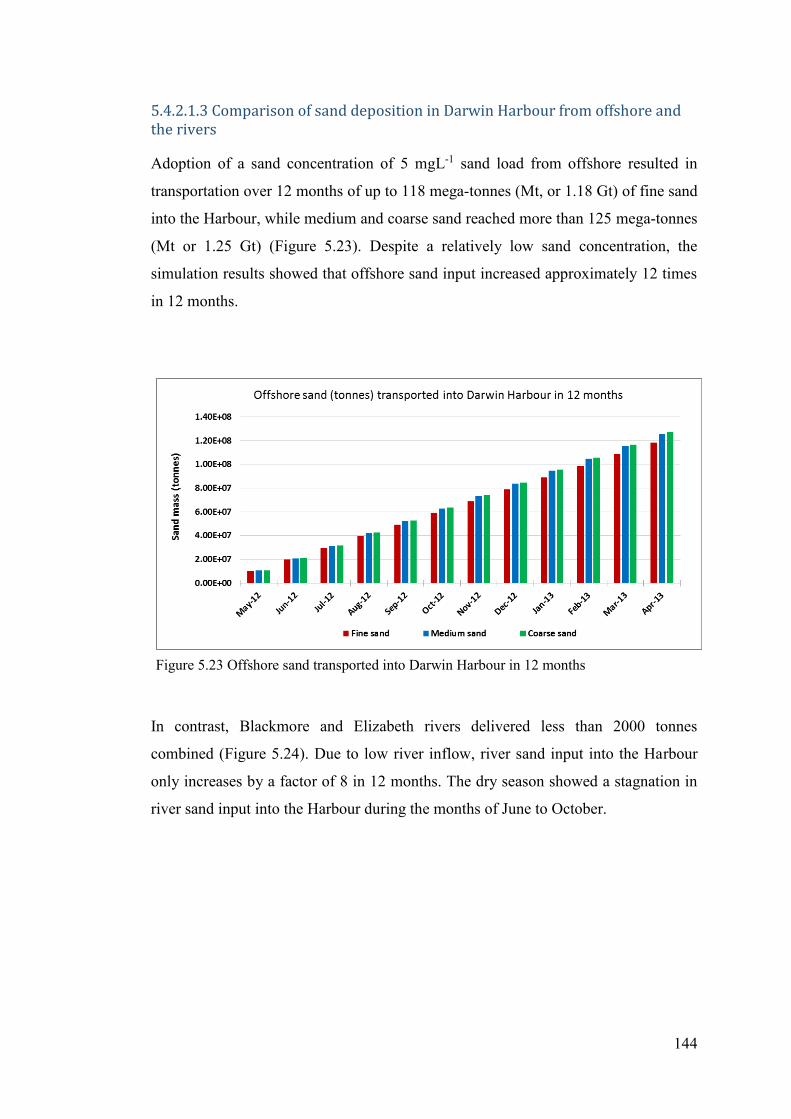
144
5.4.2.1.3 Comparison of sand deposition in Darwin Harbour from offshore and the rivers
Adoption of a sand concentration of 5 mgL-1 sand load from offshore resulted in
transportation over 12 months of up to 118 mega-tonnes (Mt, or 1.18 Gt) of fine sand
into the Harbour, while medium and coarse sand reached more than 125 mega-tonnes
(Mt or 1.25 Gt) (Figure 5.23). Despite a relatively low sand concentration, the
simulation results showed that offshore sand input increased approximately 12 times
in 12 months.
In contrast, Blackmore and Elizabeth rivers delivered less than 2000 tonnes
combined (Figure 5.24). Due to low river inflow, river sand input into the Harbour
only increases by a factor of 8 in 12 months. The dry season showed a stagnation in
river sand input into the Harbour during the months of June to October.
Figure 5.23 Offshore sand transported into Darwin Harbour in 12 months
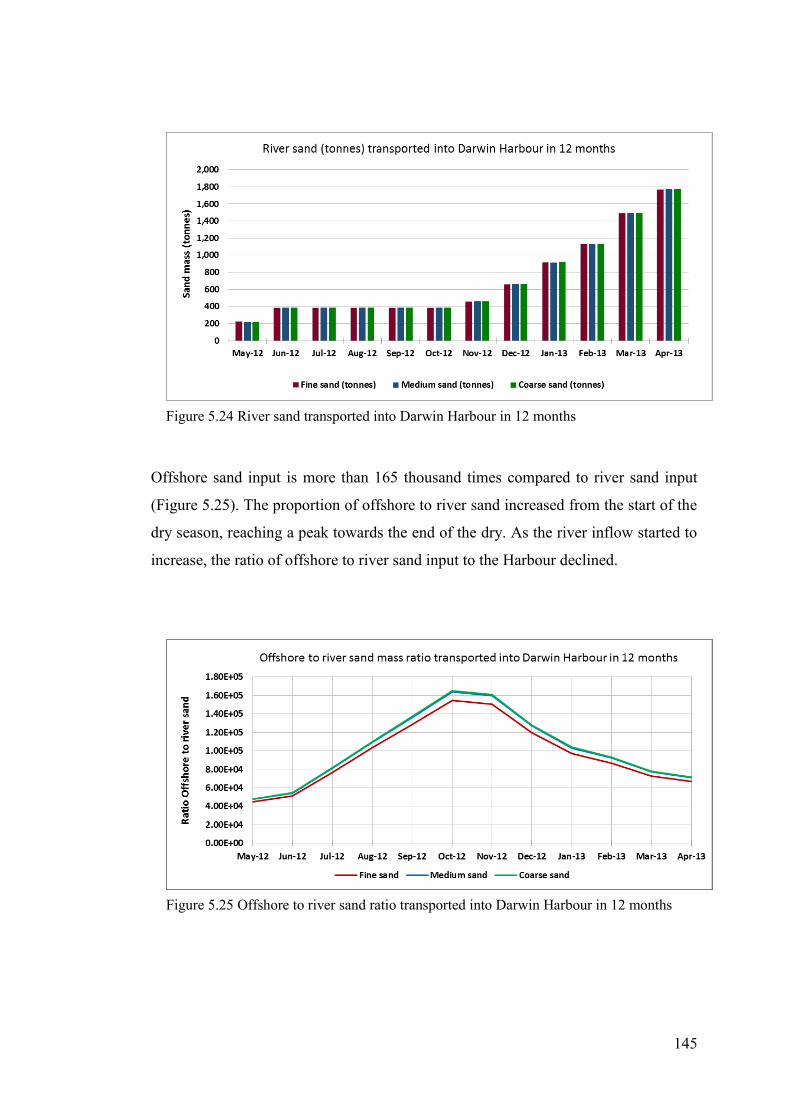
145
Offshore sand input is more than 165 thousand times compared to river sand input
(Figure 5.25). The proportion of offshore to river sand increased from the start of the
dry season, reaching a peak towards the end of the dry. As the river inflow started to
increase, the ratio of offshore to river sand input to the Harbour declined.
Figure 5.25 Offshore to river sand ratio transported into Darwin Harbour in 12 months
Figure 5.24 River sand transported into Darwin Harbour in 12 months
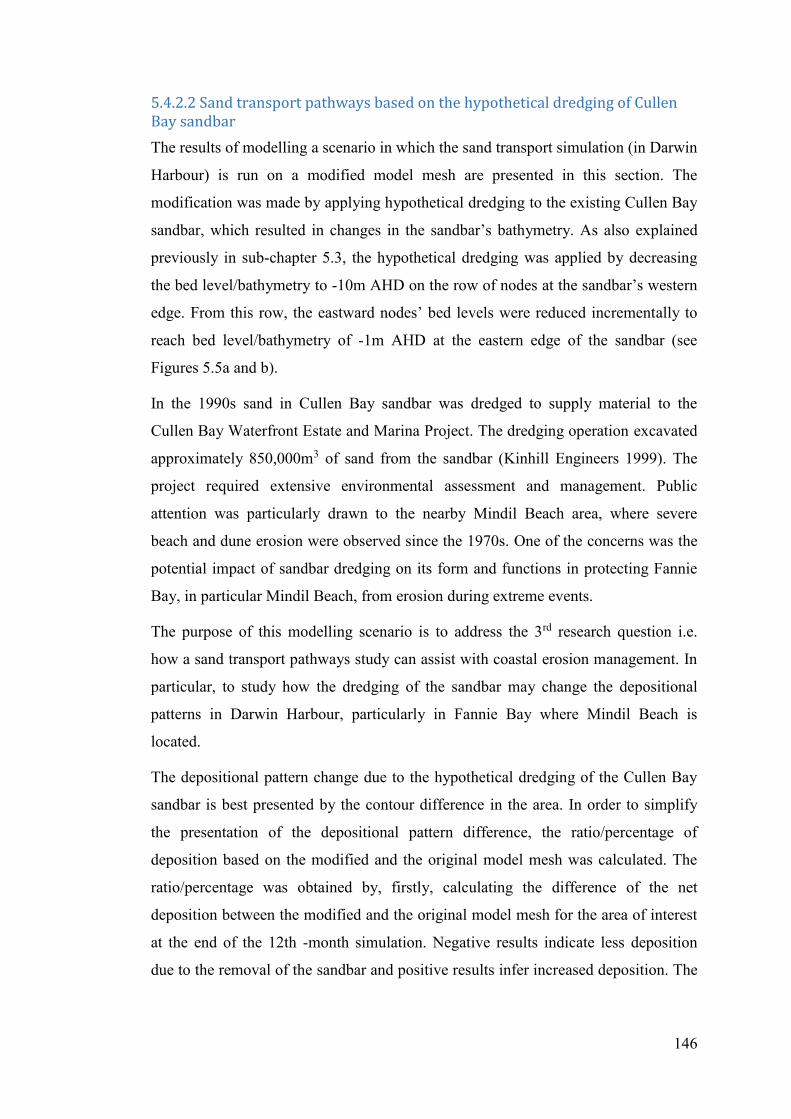
146
5.4.2.2 Sand transport pathways based on the hypothetical dredging of Cullen Bay sandbar
The results of modelling a scenario in which the sand transport simulation (in Darwin
Harbour) is run on a modified model mesh are presented in this section. The
modification was made by applying hypothetical dredging to the existing Cullen Bay
sandbar, which resulted in changes in the sandbar’s bathymetry. As also explained
previously in sub-chapter 5.3, the hypothetical dredging was applied by decreasing
the bed level/bathymetry to -10m AHD on the row of nodes at the sandbar’s western
edge. From this row, the eastward nodes’ bed levels were reduced incrementally to
reach bed level/bathymetry of -1m AHD at the eastern edge of the sandbar (see
Figures 5.5a and b).
In the 1990s sand in Cullen Bay sandbar was dredged to supply material to the
Cullen Bay Waterfront Estate and Marina Project. The dredging operation excavated
approximately 850,000m3 of sand from the sandbar (Kinhill Engineers 1999). The
project required extensive environmental assessment and management. Public
attention was particularly drawn to the nearby Mindil Beach area, where severe
beach and dune erosion were observed since the 1970s. One of the concerns was the
potential impact of sandbar dredging on its form and functions in protecting Fannie
Bay, in particular Mindil Beach, from erosion during extreme events.
The purpose of this modelling scenario is to address the 3rd research question i.e.
how a sand transport pathways study can assist with coastal erosion management. In
particular, to study how the dredging of the sandbar may change the depositional
patterns in Darwin Harbour, particularly in Fannie Bay where Mindil Beach is
located.
The depositional pattern change due to the hypothetical dredging of the Cullen Bay
sandbar is best presented by the contour difference in the area. In order to simplify
the presentation of the depositional pattern difference, the ratio/percentage of
deposition based on the modified and the original model mesh was calculated. The
ratio/percentage was obtained by, firstly, calculating the difference of the net
deposition between the modified and the original model mesh for the area of interest
at the end of the 12th -month simulation. Negative results indicate less deposition
due to the removal of the sandbar and positive results infer increased deposition. The
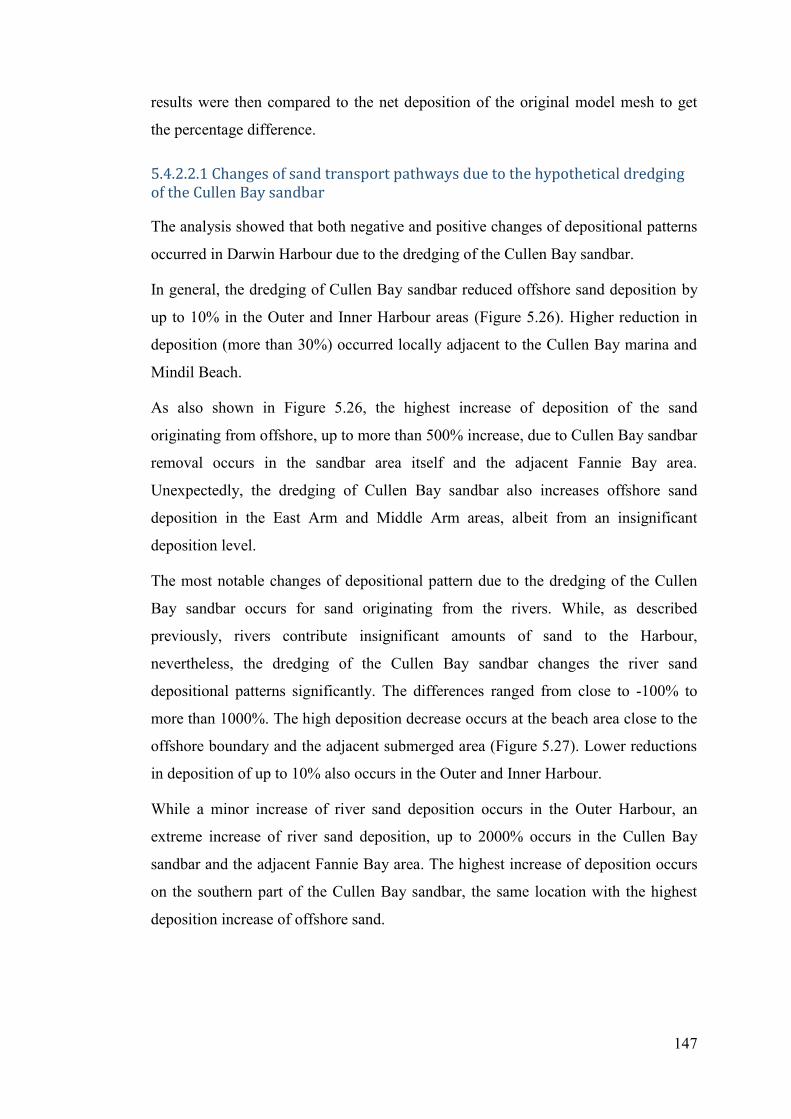
147
results were then compared to the net deposition of the original model mesh to get
the percentage difference.
5.4.2.2.1 Changes of sand transport pathways due to the hypothetical dredging of the Cullen Bay sandbar
The analysis showed that both negative and positive changes of depositional patterns
occurred in Darwin Harbour due to the dredging of the Cullen Bay sandbar.
In general, the dredging of Cullen Bay sandbar reduced offshore sand deposition by
up to 10% in the Outer and Inner Harbour areas (Figure 5.26). Higher reduction in
deposition (more than 30%) occurred locally adjacent to the Cullen Bay marina and
Mindil Beach.
As also shown in Figure 5.26, the highest increase of deposition of the sand
originating from offshore, up to more than 500% increase, due to Cullen Bay sandbar
removal occurs in the sandbar area itself and the adjacent Fannie Bay area.
Unexpectedly, the dredging of Cullen Bay sandbar also increases offshore sand
deposition in the East Arm and Middle Arm areas, albeit from an insignificant
deposition level.
The most notable changes of depositional pattern due to the dredging of the Cullen
Bay sandbar occurs for sand originating from the rivers. While, as described
previously, rivers contribute insignificant amounts of sand to the Harbour,
nevertheless, the dredging of the Cullen Bay sandbar changes the river sand
depositional patterns significantly. The differences ranged from close to -100% to
more than 1000%. The high deposition decrease occurs at the beach area close to the
offshore boundary and the adjacent submerged area (Figure 5.27). Lower reductions
in deposition of up to 10% also occurs in the Outer and Inner Harbour.
While a minor increase of river sand deposition occurs in the Outer Harbour, an
extreme increase of river sand deposition, up to 2000% occurs in the Cullen Bay
sandbar and the adjacent Fannie Bay area. The highest increase of deposition occurs
on the southern part of the Cullen Bay sandbar, the same location with the highest
deposition increase of offshore sand.
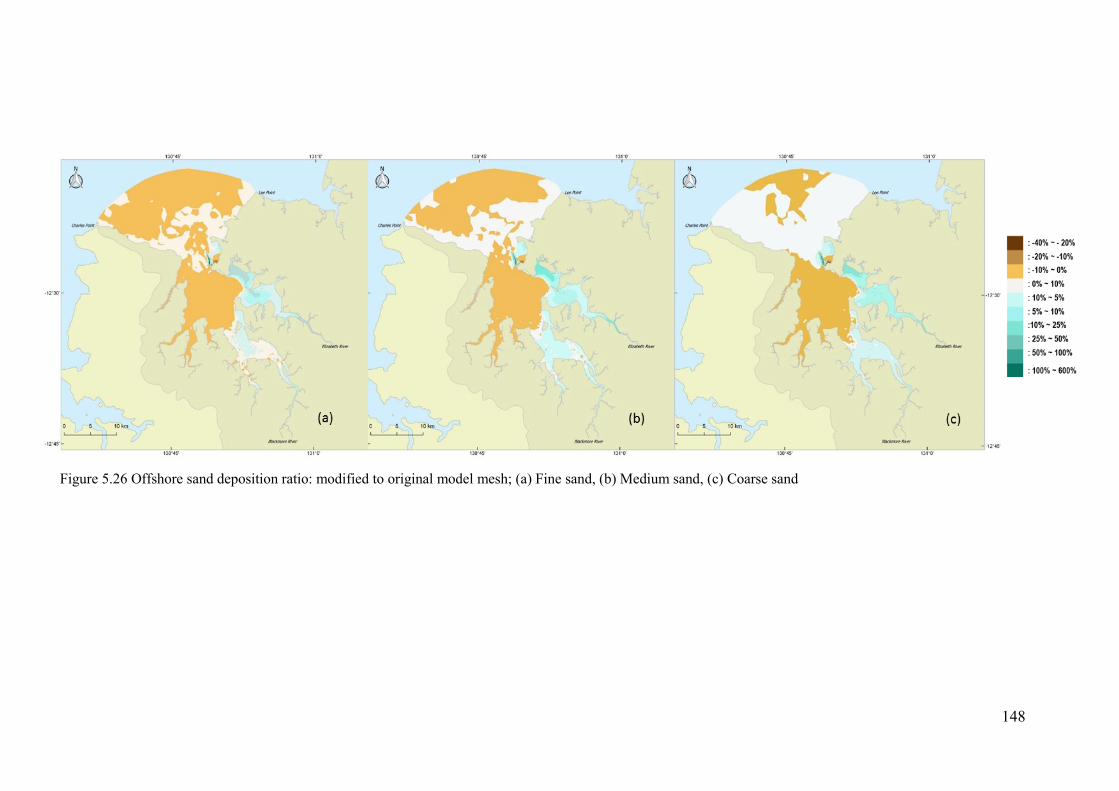
148
Figure 5.26 Offshore sand deposition ratio: modified to original model mesh; (a) Fine sand, (b) Medium sand, (c) Coarse sand
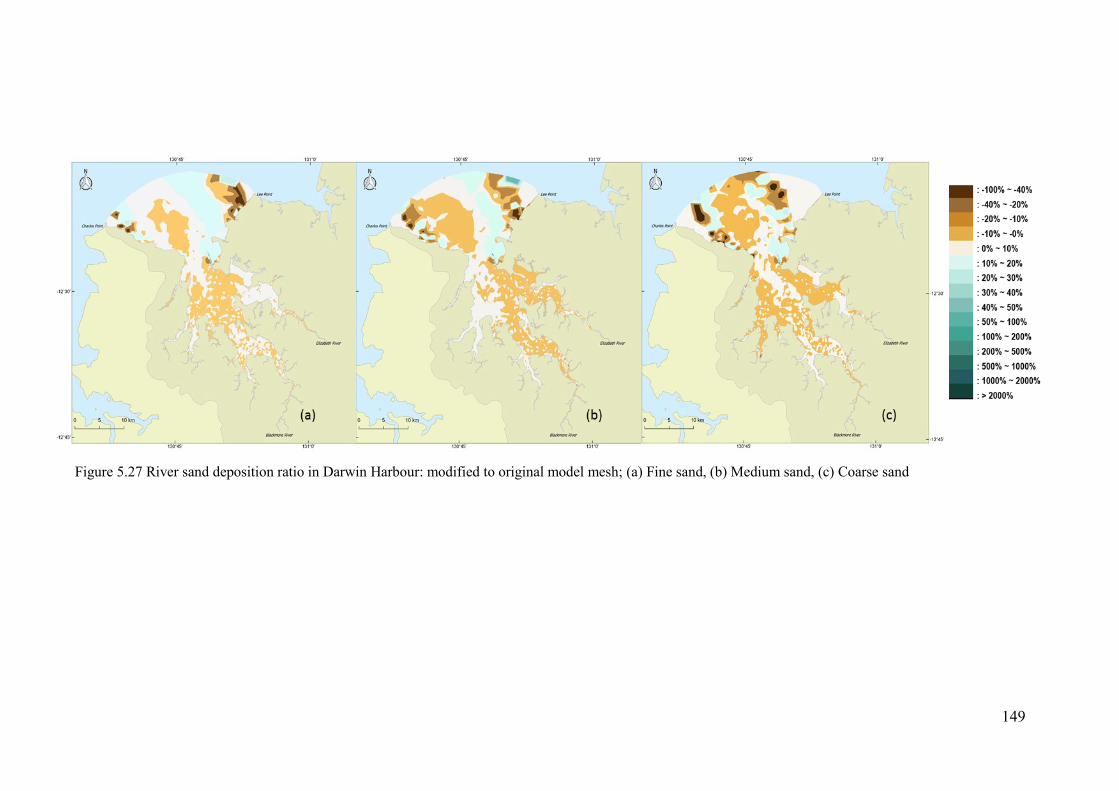
149
Figure 5.27 River sand deposition ratio in Darwin Harbour: modified to original model mesh; (a) Fine sand, (b) Medium sand, (c) Coarse sand
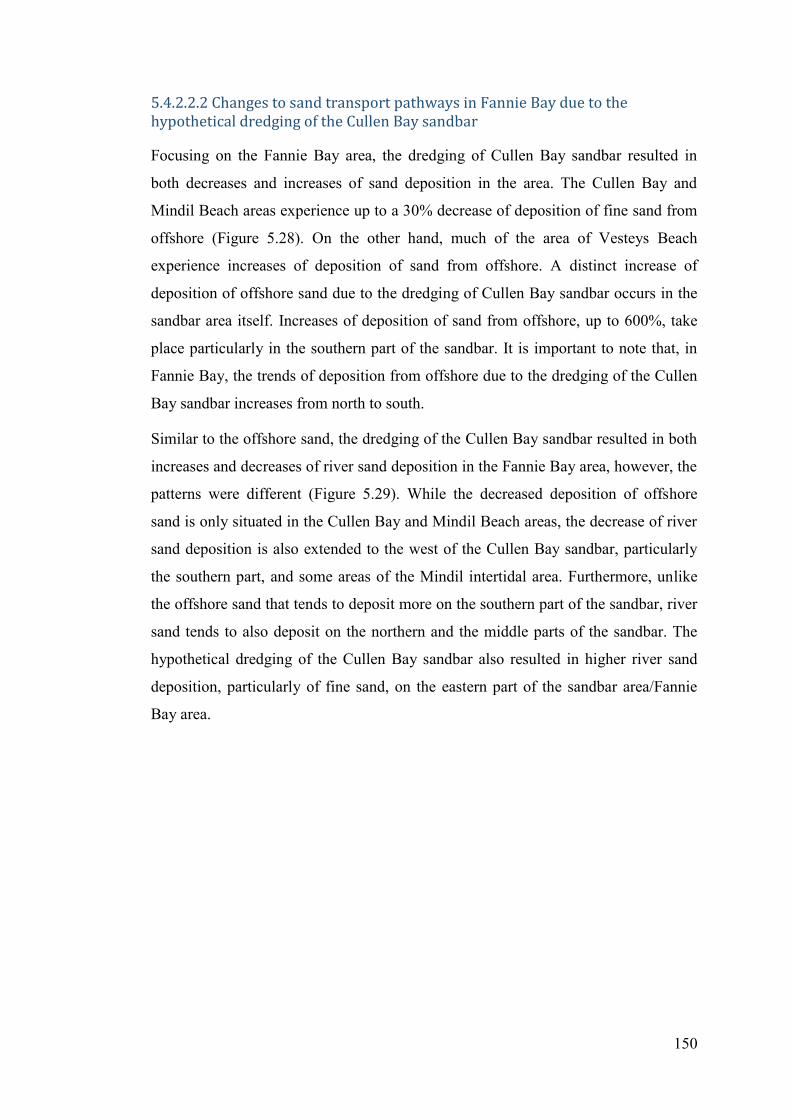
150
5.4.2.2.2 Changes to sand transport pathways in Fannie Bay due to the hypothetical dredging of the Cullen Bay sandbar
Focusing on the Fannie Bay area, the dredging of Cullen Bay sandbar resulted in
both decreases and increases of sand deposition in the area. The Cullen Bay and
Mindil Beach areas experience up to a 30% decrease of deposition of fine sand from
offshore (Figure 5.28). On the other hand, much of the area of Vesteys Beach
experience increases of deposition of sand from offshore. A distinct increase of
deposition of offshore sand due to the dredging of Cullen Bay sandbar occurs in the
sandbar area itself. Increases of deposition of sand from offshore, up to 600%, take
place particularly in the southern part of the sandbar. It is important to note that, in
Fannie Bay, the trends of deposition from offshore due to the dredging of the Cullen
Bay sandbar increases from north to south.
Similar to the offshore sand, the dredging of the Cullen Bay sandbar resulted in both
increases and decreases of river sand deposition in the Fannie Bay area, however, the
patterns were different (Figure 5.29). While the decreased deposition of offshore
sand is only situated in the Cullen Bay and Mindil Beach areas, the decrease of river
sand deposition is also extended to the west of the Cullen Bay sandbar, particularly
the southern part, and some areas of the Mindil intertidal area. Furthermore, unlike
the offshore sand that tends to deposit more on the southern part of the sandbar, river
sand tends to also deposit on the northern and the middle parts of the sandbar. The
hypothetical dredging of the Cullen Bay sandbar also resulted in higher river sand
deposition, particularly of fine sand, on the eastern part of the sandbar area/Fannie
Bay area.
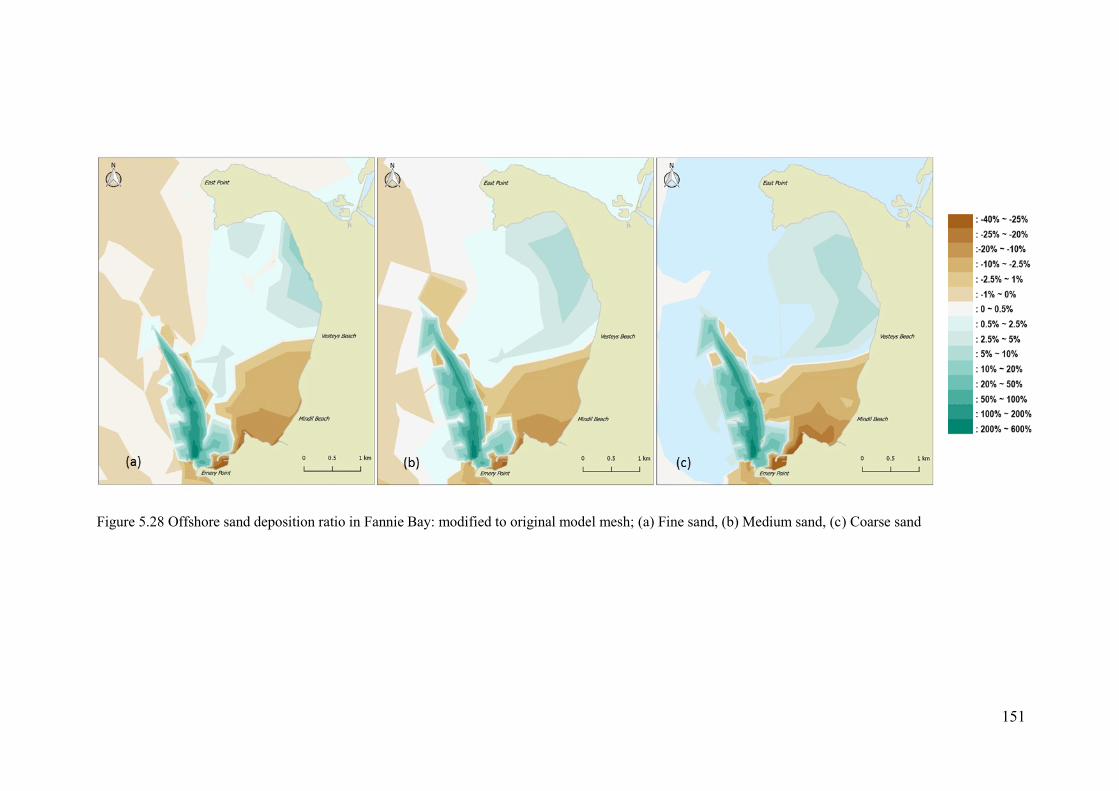
151
Figure 5.28 Offshore sand deposition ratio in Fannie Bay: modified to original model mesh; (a) Fine sand, (b) Medium sand, (c) Coarse sand
152
Figure 5.29 River sand deposition ratio in Fannie Bay area: modified to original model mesh; (a) Fine sand, (b) Medium sand, (c) Coarse sand
153
5.5 Discussion
5.5.1 Sand transport pathways in Darwin Harbour
The numerical modelling results using similar sand load quantity from offshore and
fluvial sources indicate that most of the sand in Darwin Harbour is transported from
offshore. Fine, medium and coarse sand sizes showed similar pathways with the
coarser sizes transported shorter distances compared to the smaller sizes. On the
other hand, the sand pathways originating from the rivers covered mostly a limited
area within the lower reaches of the rivers, with a low proportion transported further
into the Inner and the Outer Harbour areas. The pattern noted above confirms
conclusions drawn in related research, that a net landward sediment movement is a
common occurrence in a tide-dominated estuary (Bird 2000; Woodroffe 2003).
The adoption of a sand concentration of 5 mgl-1 sand load resulted in very low net
deposition in the Harbour. Other than due to the zero initial bed thickness and sand
concentration in the water column, the very low net deposition is also attributed to
the high tidal velocity of up to 2.3 ms-1 in Middle Arm. The high tidal velocity in the
Inner Harbour is a common occurrence in a macro-tidal environment. Similar results
have been reported on the east coast of Australia (Roy et al. 2001; Wheeler et al.
2009). This is confirmed by Harris and Heap (2003), who suggested that in tide-
dominated estuaries, the tidal energy attains its highest velocity inside the estuary.
Furthermore, a high velocity could keep sediment in suspension, thus prevent it from
settling. In a study on the continental shelf adjacent to King Sound, Western
Australia where the tidal range can reach up to 10m, Porter-Smith et al. (2004)
suggested that sand with a grain size up to 0.35mm (medium sand) stays in
suspension all the time. While the study result is based on modelling, the study
confirms that high tidal currents might prevent deposition in Darwin Harbour.
The morphology of Darwin Harbour influences the sand transport pathways and
depositional patterns. While the overall shape of Darwin Harbour can be considered
as a dumbbell shape, Charles Point and Lee Point form the Harbour entrance and the
Outer Harbour as a funnel shape allowing sand deposition in the embayments and
beach areas. West Point and East Point create a relatively narrow entrance into the
Inner Harbour, creating a tidal choking effect that results in high current velocity (Li
et al. 2011; Li 2013). The rocky headlands impede the sand transport pathways from
154
both offshore and rivers. The most apparent is the position of Emery Point and East
Point. These headlands, exacerbated by the Cullen Bay sandbar, hinder sand
deposition in Fannie Bay. The impact occurs primarily at the Mindil Beach area.
The simulation results showed that offshore sand deposited predominantly in the
northern parts of the Harbour and decreased further into the Harbour. In general,
offshore sand deposited more on the eastern compared to the western beaches area.
The extent of deposition was governed by beach morphology, i.e. more deposition
occurring in embayment areas, particularly on the lee side of the headlands due to
their sheltering effect (Komar 1976; Reeve, Chadwick & Fleming 2004; Van Rijn
2011). This trend was most apparent in the western beach areas, on the lee side of
Charles Point. The deposition level at this point was significantly higher compared to
other beach areas. Apart from the deposition at this node, the long-term deposition of
offshore sand at the western and eastern beaches showed an analogous trend,
inferring similar pathway patterns of offshore sand to the beach area.
The sand transport simulation results suggested that parts of the Outer Harbour area
are the main depositional area of offshore sand. This is to be expected, considering
the varied bathymetry and funnel shape of the Outer Harbour, which is a suitable
location to trap sediment in the slow velocity areas (Bird 2000). After entering the
Inner Harbour, the strong ebb tidal flow carries much of the sand back offshore.
Rivers provide minor sand contributions to Darwin Harbour. This low input is likely
due to the small drainage basin area, and consequently overall small discharges. One
important characteristic of Darwin Harbour is the small catchment area relative to the
Harbour, i.e. about 3:1, which is smaller than most other Australian Harbours. This
ratio is 14:1 for Moreton Bay in Queensland and 10:1 for Port Jackson/Sydney
Harbour (Padovan 2003; Northern Territory Environment Protection Authority
2014). Furthermore, the river inflow into the Harbour is negligible for most of the
year (up to approximately 8 months every year). Most river inflows only occur from
January to April every year. Other factors are the low erosion rates in the low relief
catchment and its ability to trap and retain sediment (Nawaz 2010). The size and
macro-tidal nature of Darwin Harbour also prevent river inflows extending to the
Outer Harbour. The maximum recorded cumulative catchment discharge into the
Harbour during floods was estimated to be 103 m3s-1 or about 1% of the peak spring
tide discharge that reaches 1.2x10⁵ m3s-1 (Williams, Wolanski & Spagnol 2006;
155
Northern Territory Environment Protection Authority 2014). It suggests that the river
sand is transported by the strong ebb tidal flow towards the Outer Harbour.
After passing Emery Point, the river sand is transported more to the western beaches
rather than eastward. The Cullen Bay sandbar and East Point constrain the sand
transport pathways eastward, and these pathways are obviously influenced by the
current strength and directions, while the location of the largest rivers, which are on
the east side of the Harbour, is another important factor.
It should be noted that the transport pathway simulations only consider tidal flow, as
the hydrodynamics of Darwin Harbour are mainly driven by the tides (Li 2013). The
case is likely to be completely different during cyclones and extreme events such as
intense monsoonal swell in the wet season. While this study does not cover such
extreme events, very high waves and/or storm surges due to cyclone activity will
surely reach the dunes and beach ridges, as well as the areas behind the dunes and
beach ridges. This might result in coastal flooding and severe erosion on the near
shore and the beach area. In 1974, the catastrophic Cyclone Tracy with recorded
peak gusts up to 217 kmh-1 (Bureau of Meteorology 1977) resulted in a sea water
level surge of up to 2m in Fannie Bay, with the maximum surge, including the effects
of waves breaking at the coast at Casuarina Beach, reached 4 m above the predicted
tide. Fortunately, the cyclone hit Darwin on the neap tide, otherwise the storm surge
would certainly have been worse. In this event, Cullen Bay sandbar was flattened
(Conservation Commission of the Northern Territory 1993), but there is no
information on the sand quantity that was lost from the sandbar and where the sand
was transported to.
On the other hand, cyclone activity may also carry marine sediment onshore that
could be deposited on or lost to the inner continental shelf. In case it is deposited on
the inner continental shelf, it would be available to feed the near shore and the beach
area when hydrodynamic conditions are more favourable (Kamphuis 2000).
5.5.2 Coastal erosion management implications due to the hypothetical dredging of Cullen Bay sandbar
The hypothetical dredging of Cullen Bay sandbar primarily influenced the local
hydrodynamics and sand transport pathways in Fannie Bay. Eddies formed on the
sandbar area after dredging, creating sediment deposition areas. Due to this, a
156
significant increase of deposition occurred in the sandbar area, both from offshore
and river sand. The increase of deposition occurred on the whole dredged area, with
the highest increase of offshore sand taking place in the southern part of the sandbar,
near the location indicated by the Darwin Port Authority as the shallowest part of the
sandbar at high tide. It is important to note that, albeit quantitatively small, the
increase of river sand deposition in the area was significantly higher when the
sandbar was dredged.
Offshore sand deposition decreased by approximately 30% in the areas adjacent to
the Cullen Bay Marina and Mindil Beach in Fannie Bay. Similarly, albeit of
insignificant deposition level, the hypothetical dredging of Cullen Bay sandbar
reduced the deposition of river sand more than 20%.
In contrast, the dredging increased offshore sand deposition markedly in the Cullen
Bay sandbar area itself. The increase reached more than 500% for fine sand and more
than 400% for medium and coarse sand. The highest increase was primarily located
on the southern part of the sandbar. The dredging increased the deposition of river
sand up to 2000% in the Cullen Bay sandbar area itself. It should be noted that the
simulations were carried out without considering the Cullen Bay Marina breakwaters
that might influence the erosion and deposition pattern in Mindil Beach and the
artificial beach in Cullen Bay.
Although the hypothetical dredging of the Cullen Bay sandbar did not influence the
general transport pathways of the Harbour area as a whole, the removal of the Cullen
Bay sandbar did increase offshore sand deposition in the East Arm area.
Interestingly, the increase in deposition of coarse sand was higher compared to the
medium and fine sand. However, the higher ratio of deposition of coarse sand
compared to fine and medium sand from offshore in the East Arm area when the
Cullen Bay sandbar was dredged does not imply that coarse sand was transported
more landward compared to the smaller grain sizes. It is the ratio that is higher, not
the net deposition level. The ratio is intended to infer the tendency of sand transport
pathways in the East Arm area when the Cullen Bay sandbar is dredged. Once the
offshore sand was transported into the Inner Harbour area, it was then transported
further during flood tides into the Arms of the Harbour. Due to the morphology of
East Arm, offshore sand could reach deeper ‘inland’ into the arms compared to, say,
the Middle Arm. Furthermore, East Arm experienced lower tidal current velocities
157
compared to the other arms in Darwin Harbour, hence when the tide turned to ebb,
the tidal flow was not strong enough to ‘push back’ the deposited sand
outward/offshore.
The significant increase of sand re-deposition in the Cullen Bay sandbar area
suggests that the Cullen Bay sandbar area is the sand sink area of offshore and river
sand in Darwin Harbour. On the other hand, the dredging also adversely affects the
depositional patterns at the beach area nearby. Up to 30% less deposition occurs in
the Cullen Bay and Mindil Beach area when the sandbar is dredged, both on the
beach and in the intertidal area. As the nearshore sediment plays an important role in
beach-dune sediment dynamics (Aagaard et al. 2004; Ruessink et al. 2007; Aagaard
2011), this simulation result suggests that the existence of the Cullen Bay sandbar is
very important in protecting Fannie Bay areas from erosion. A decision on further
dredging of the sandbar should be based on a detailed study of the effects it will have
on coastal processes and morphological changes in the area.
5.6 Conclusions
Sand transport pathways based on two-dimensional hydrodynamic (RMA-2) and
sand transport (RMA-11) simulations showed that sand in Darwin Harbour is mainly
of offshore origin. The sand transport simulations were run using an experimental
sand concentration of 5 mgl-1 from the potential sand sources: offshore and rivers,
which were run separately. Despite the relatively low sand input, the simulation
results showed that sand in Darwin Harbour is primarily of offshore origin. Offshore
sand tends to firstly be deposited in the Outer Harbour area, where it is then
transported further into the Inner Harbour. Due to the lag time between the flood and
ebb tide in the Outer and the Inner Harbour area, the latter acts as the secondary sand
trap/sand sink area in Darwin Harbour.
The deposition on the beach area was quite low, except on the embayments and in
the lee of headlands. However, in the bigger picture, headlands hinder sand
pathways, from both offshore and rivers, as shown by the low deposition in Fannie
Bay.
River sand does not travel far into Darwin Harbour. The low river inflow and small
catchment to estuary area ratio along with low erosion rates and high sediment
retention rates in the terrestrial catchment, resulted in low contributions of sand to
158
Darwin Harbour. Essentially, the river sand is transported into the Inner Harbour and
partly distributed further to the Outer Harbour area by the ebb tide. Nevertheless, the
pathways of river sand into the Harbour are primarily determined by the morphology
of the lower reaches of the rivers. It tends to be deposited in the Inner Harbour and
on the embayment east of the Inner Harbour. After passing the ‘neck’ of the Harbour,
river sand tends to be transported more to the western beaches, rather than eastward,
confirming that Cullen Bay sandbar and East Point constrain the sand transport
pathways.
The hypothetical dredging of Cullen bay sandbar does not change the general sand
transport pathways in Darwin Harbour. It does, however, influence the degree of
sand deposition in the Harbour, both positively and negatively. Hydrodynamically,
the bathymetry changes generated different current patterns creating eddies in the
area, leading to changes in depositional patterns in the sandbar. The depositional
changes particularly occurred in the area of the Cullen Bay sandbar and in Fannie
Bay, particularly Mindil Beach. Due to the dredging, sand deposition from both
offshore and rivers increased markedly in the dredged area, suggesting that the
Cullen Bay sandbar is sand sink in Darwin Harbour. In contrast, sand deposition was
decreased on Mindil Beach and the intertidal area due to the dredge of the sandbar.
Nearshore sand is an important sand source replenishing beach and the dune system
(Pethick 1984; Aagaard et al. 2004; Ruessink et al. 2007). Considering the historical
erosion that has occurred in the area, the existence/presence of the Cullen Bay
sandbar is very important for protecting the iconic Mindil Beach from erosion. Any
future dredging of the Cullen Bay sandbar, if any, should be preceded by a detailed
study regarding its effects on coastal processes and morphological changes in the
area, particularly in Mindil Beach and the sandbar itself.
159
Chapter 6 Sand-sized sediment sources and pathways for coastal erosion management in Darwin Harbour, Northern Territory, Australia
6.1 Introduction
This chapter synthesises the results of the sand-sized sediment transport numerical
modelling and provenance analysis from the previous chapters in order to infer the
sand-sized sediment sources, sinks and pathways in Darwin Harbour. Understanding
the sources of beach sediment is important to identify causes of local erosion that
may be a result of reduced sediment supply, hence is a significant knowledge
contribution to coastal erosion management (Patch & Griggs 2006; Barnard et al.
2013; Ouillon 2018).
This study is a first attempt to describe sand-sized sediment movement for the whole
Darwin Harbour area. Previous studies were mostly focused on localised areas
experiencing erosion or as a requirement for a development project’s Environmental
Impact Statement (EIS) (Manly Hydraulics Laboratory 2000; Williams 2009). This
study also, for the first time, combines two different research approaches: numerical
modelling and geochemical analysis to understand sand dynamics in Darwin
Harbour. Effective local and regional sediment management plans can only be
implemented by understanding the processes occurring in the coastal system from
sources to sinks (Hooke 1999; Cooper & Pontee 2006; Marchand et al. 2011).
Coastal processes are also important in coastal hazard risk management studies
particularly in determining coastal resilience and coastal setback analysis (Salman,
Lombardo & Doody 2004a; Western Australian Planning Commission 2014). Also
discussed are the implications of the results for coastal erosion management, as well
as the strengths and limitations of the study and recommendations for future
research.
6.2 Sand-sized sediment dynamics in Darwin Harbour
The macrotidal regime and complex bathymetry (Siwabessy et al. 2018) that lead to
complex hydrodynamic processes (INPEX Browse, Ltd. 2011; Li 2013) are the
significant factors in determining the sand-sized sediment transport pathways in
Darwin Harbour. Nearly 90% of sediment in Darwin Harbour, covering the beaches,
160
subtidal areas, sandbars, creeks and the lower reaches of the rivers flowing into
Darwin Harbour is sand. This sand-sized sediment displays a mix of marine and
terrigenous sources.
The numerical simulation results (Chapter 5, Figures 5.23 – 5.25) show that the
offshore derived sand-sized sediment deposited in Darwin Harbour was significantly
greater, reaching thousands of times higher, than the fluvially derived sediment. To
clearly distinguish between offshore and fluvial contributions, the simulations were
run by applying sand loads from each of the potential sources separately. In reality,
the flows from both sources occur simultaneously and will influence each other. This
interaction can be disregarded due to the minute contribution of the river load on
total deposition, which was confirmed by numerical modelling of both flows
simultaneously.
The parallel geochemical analysis showed that the Outer Harbour sand-sized
sediment contained high levels of calcium carbonate, indicating only minor terrestrial
sediment input. More than 80% of Outer Harbour subtidal samples contained greater
than 50% calcium carbonate, as opposed to less than 40% of the Inner Harbour
samples. Low calcium carbonate (less than 10%) was found in the fluvial and rock
samples, as well as the lower reaches of the rivers and creeks. Most of the carbonate
sand being in the Outer Harbour is in accordance with other sediment studies
covering Beagle Gulf and the north-western Australian continental shelf. Smit et al.
(2000) found that more than 80% of sediment in Beagle Gulf is classified as
carbonate sediment. They classified a calcium carbonate content of 20% and greater
as carbonate sediment. Similarly (CaCO3 >20%), other studies covering Bynoe
Harbour and the Outer Darwin Harbour area found that more than 90% of sediments
are classified as carbonate sediment (Siwabessy et al. 2016, 2017).
Longshore currents outside the modelling mesh could easily transport carbonate
sediment into the Harbour. Furthermore, as a tidal inlet, Darwin Harbour can be
classified as a littoral sediment sink (Sorensen 1978; Woodroffe 2003). Additionally,
the concave shape of the Outer Harbour provides a trap-like environment, capable of
retaining offshore-derived sediment, particularly in areas of low current velocity at
the eastern and the western edges.
161
Among the beach sediments, all the eastern beaches contained more than 50%
calcium carbonate, in contrast to the western beaches, which contained a maximum
of 25% calcium carbonate. The Inner Harbour beach sediment contained less than
35% calcium carbonate, while the beaches adjacent to rock cliffs contained less than
10% calcium carbonate. These results suggest that, besides the carbonate sand from
the inner continental shelf, the local coral communities in the eastern part of the
Outer Harbour are an important sand-sized sediment source to the eastern beaches.
Darwin Harbour is the location of several coral reef colonies, particularly in the
eastern part of the Outer Harbour and adjacent to Channel Island in the Inner
Harbour (Michie 1987a; Wolstenholme, Dinesen & Alderslade 1997; Smit 2003).
These coral communities, together with other sources of biogenic sand-sized
sediment such as molluscs, sponges, foraminifera, echinoderms and algae (Smit
2009; Padovan et al. 2012), might be the in-situ sources for the subtidal area and
beaches nearby. In particular, coral reefs and other biogenic sand source organisms
can be an important sand source to the adjacent beaches (Maragos, Baines &
Beveridge 1973; Woodroffe & Morrison 2001; Kench & Mann 2017; Montaggioni et
al. 2018). A study based on beach profile and aerial photography reported an average
of 0.5 m3m-1a-1 coral sand supply to a pocket beach in Okinawa Island (Ishikawa,
Uda & San-nami 2015).
The continental shelf sediment that is transported into the Outer Harbour by the
incoming tide is partially conveyed into and deposited in the Inner Harbour through
the Harbour ‘neck’. Due to the tidal asymmetry, the Inner Harbour is still
experiencing ebb-tide when the following flood tide starts entering the Outer
Harbour, leading to eddy formation and sediment deposition.
Terrestrial sand-sized sediment originating from the Elizabeth and Blackmore Rivers
is transported only a limited distance into the Inner Harbour. The low river inflow is
clearly overcome by the strong tidal current, so that the Inner Harbour acts as a sink
for the fluvial sand-sized sediment. This transport pattern of net landward sediment
movement is a common occurrence in coastal inlets, particularly for a tide-dominated
estuary (Roy et al. 2001; Wheeler, Peterson & Gordon-Brown 2010; Dalrymple et al.
2012). Nevertheless, the strong ebb tidal currents are capable of transporting some
sediment from the Inner Harbour outward.
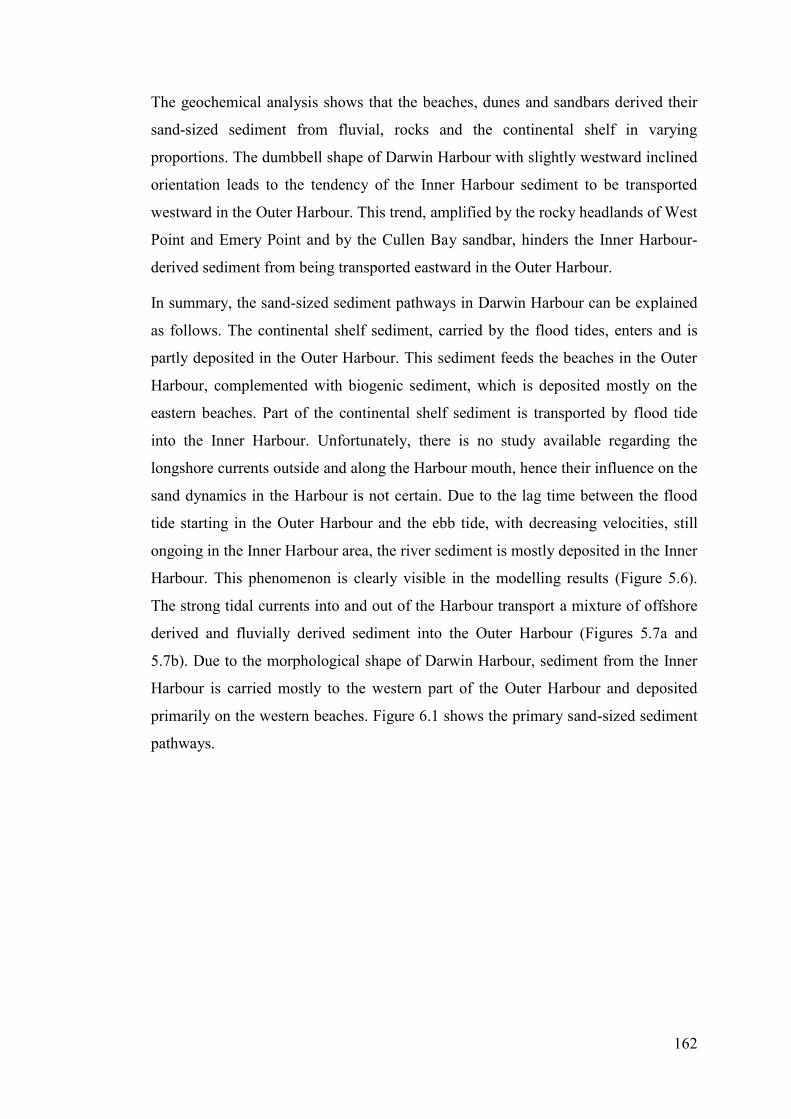
162
The geochemical analysis shows that the beaches, dunes and sandbars derived their
sand-sized sediment from fluvial, rocks and the continental shelf in varying
proportions. The dumbbell shape of Darwin Harbour with slightly westward inclined
orientation leads to the tendency of the Inner Harbour sediment to be transported
westward in the Outer Harbour. This trend, amplified by the rocky headlands of West
Point and Emery Point and by the Cullen Bay sandbar, hinders the Inner Harbour-
derived sediment from being transported eastward in the Outer Harbour.
In summary, the sand-sized sediment pathways in Darwin Harbour can be explained
as follows. The continental shelf sediment, carried by the flood tides, enters and is
partly deposited in the Outer Harbour. This sediment feeds the beaches in the Outer
Harbour, complemented with biogenic sediment, which is deposited mostly on the
eastern beaches. Part of the continental shelf sediment is transported by flood tide
into the Inner Harbour. Unfortunately, there is no study available regarding the
longshore currents outside and along the Harbour mouth, hence their influence on the
sand dynamics in the Harbour is not certain. Due to the lag time between the flood
tide starting in the Outer Harbour and the ebb tide, with decreasing velocities, still
ongoing in the Inner Harbour area, the river sediment is mostly deposited in the Inner
Harbour. This phenomenon is clearly visible in the modelling results (Figure 5.6).
The strong tidal currents into and out of the Harbour transport a mixture of offshore
derived and fluvially derived sediment into the Outer Harbour (Figures 5.7a and
5.7b). Due to the morphological shape of Darwin Harbour, sediment from the Inner
Harbour is carried mostly to the western part of the Outer Harbour and deposited
primarily on the western beaches. Figure 6.1 shows the primary sand-sized sediment
pathways.
163
6.3 Influence on sand dynamics in Darwin Harbour of hypothetical dredging of a sandbar
The hypothetical dredging of Cullen Bay sandbar reduced sand deposition in Cullen
Bay and Mindil Beach. The reduction of deposition reached up to approximately
30% for both offshore and river derived sand-sized sediment. Furthermore, the sand
transport simulations revealed that the removal of up to 10 metre depth of the
western part of the sandbar changed the local hydrodynamics, creating more eddies
locally, resulting in more deposition in the dredged area. The increase of deposition
primarily occurred on the southern part of the sandbar, i.e. the shallowest part of the
sandbar during high tide periods, reaching more than 500% for sand of offshore
Figure 6.1 Sand-sized sediment pathways in Darwin Harbour
164
origin. Albeit contributing an insignificant amount, the dredging of the sandbar
increased river-derived sediment in the dredged area by up to 2000%.
While the removal of the sandbar does not influence the general hydrodynamics and
sand-sized sediment transport pathways in Darwin Harbour, there was a significant
reduction of deposition at Mindil and Vesteys beaches. The north-eastern and
western beaches were only slightly influenced.
The Cullen Bay sandbar was dredged for the development of the Cullen Bay Marina.
The total dredging amount was based on the premise that the sandbar was accreting
at a rate of 50,000 m3 annually. The volume was inferred from volumetric
calculations based of 1938, 1986 and 1991 surveys (Byrne 1987; Conservation
Commission of the Northern Territory 1993). The Environmental Impact Statement
(EIS) considered the sandbar as a sediment sink rather than a source and monitoring
after the dredging operation indicated that the dredging did not have a negative
influence on the beaches in Fannie Bay (Kinhill Engineers 1999). On the other hand,
the sand transport simulation suggested that the Cullen Bay sandbar was an indirect
source replenishing the Fannie Bay area, including Mindil Beach (Tonyes et al.
2015). Parallel geochemical analysis based on REE characteristics also shows that
the sand from the Cullen Bay sandbar showed similarities with the middle Outer
Harbour and the eastern beaches, including Mindil and Vestey beaches. Therefore,
also considering the sheltering effect from storms and cyclones of the sandbar on
Fannie Bay beaches, any plan on dredging of the sandbar should be preceded by a
thorough study of the nearshore processes, including a detailed study of the
morphology of the sandbar and the beaches covering prevailing and extreme events.
6.4 Implications of the sand dynamic study for coastal erosion management in Darwin Harbour
Understanding coastal processes is the key knowledge component for coastal erosion
management in order to identify the sediment sources, the sinks and the pathways
between sources and sinks. Kamphuis (2000) suggested that sediment movement is
often the most important factor to consider in any development in the coastal zone.
Apart from resulting in landform changes, sediment movement also plays an
important role in water quality thereby influencing the biology and chemical
characteristics of coastal waters.
165
Interaction of waves, currents, winds, sediment and coastal morphology are the
crucial factors influencing the sediment pathways that have to be considered in
coastal erosion analysis (Marchand et al. 2011; Van Rijn 2011; Thom 2014;
NCCARF 2016). With the predicted sea level rise, it is imperative to identify the
natural coastal resilience against hazard risks by determining the coastal setback line.
As the buffer zone between the high water mark and coastal development, a setback
line is intended to mitigate risk in coastal zones, protecting coastal infrastructure and
properties by absorbing the impact of severe storms, the fluctuation of natural coastal
processes, allowing shoreline movement, and (predicted) global sea level rise (Sanò
et al. 2011; Woodroffe & Murray-Wallace 2012; Western Australian Planning
Commission 2017). As a cyclone prone area, particularly learning from the
devastating impact of Cyclone Tracy, studies in coastal hazards and coastal setback
are very important for Darwin Harbour, for example incorporating a series of storm
inundation zones in the coastal planning policy.
This study revealed that the primary source of sand-sized sediment in the Outer
Harbour and the eastern beaches is from the continental shelf and the reworking of
Harbour sediment. The sediment reworking can be explained by the sand transport
modelling results (Chapter 5, section 5.4.2) which show that the strong tidal currents
bring the incoming sand into suspension, drop it when the velocity slows down and
picks it up again into suspension by the next tide and redeposit the sand along the
transport pathways. In this regard, any development within the Outer Harbour
requires a thorough study of the changes in sediment movement patterns due to
changes in bathymetry. Changes in bathymetry influence hydrodynamics and
sediment movement patterns that could affect erosion – deposition rates on the
beaches and eventually the dynamics of nearshore – beach – dune systems (Aagaard
et al. 2004; Ruessink et al. 2007; Aagaard 2011).
The low rate of bed deposition in the numerical simulations (Chapter 5, section 5.4.2,
Figures 5.12 – 5.15) suggests the possibility of sediment reworking in the Harbour.
The sediment reworking pathways can occur by cross-shore sediment transport and
deposition on the beaches.
Albeit at a slow rate, and often overlooked in sediment budget analysis, Cowell et al
(2003) indicated that the shoreface is an important sand source for beach accretion.
Studies conducted in varied coastal environments on three continents (i.e. at
166
Tuncurry, south-east Australia by Cowell et al (1995); the northern Dutch coasts by
Stive and De Vriend (1995); and the US Columbia River Pacific coast by Kaminsky
et al (1999), estimated that the shoreface contributes on the order of 1m3a-1 of sand
per metre of shoreline. These studies were carried out using a combination of
methods including decades of bathymetric surveys, sediment dynamics analysis on
the lower shoreface, radiocarbon dating (Cowell, Roy & Jones 1995) and sediment
budget analysis.
There have been no longshore and cross-shore sediment studies in Darwin Harbour
beaches, so that the contribution of shoreface sediment to the beaches remains
unknown. Furthermore, the quantity of beach sediment contributed by biogenic sand
sources is yet to be determined. The high calcium carbonate content in the eastern
beaches, the Outer Harbour and some areas in the Inner Harbour suggests possibly
contributions from the coral reef communities and other biogenic sand sources within
the Harbour and continental shelf (Michie 1987a, 1987b). As noted previously, coral
reefs and other biogenic sand source organisms can be an important sand source to
the beaches. It is therefore important to maintain the health/conservation of biogenic
sand sources in Darwin Harbour, especially considering predicted climate change
and associated sea level rise. Furthermore, coral reef colonies provide an ideal
habitat for a diverse marine ecosystem, a further argument to emphasise the
conservation of coral reef communities in the Harbour (UNEP-WCMC 2006).
Sandbars play an important role in coastal morphodynamics particularly during
storm activity. Sandbar morphology changes due to gradual onshore movement
during calm periods and strong offshore movement during storm conditions
(Gallagher, Elgar & Guza 1998; Elgar, Gallagher & Guza 2001; Ruessink et al.
2007), which influences the dynamics of the nearshore – beach – dune relationship.
Beach profile studies in Darwin Harbour between 1991 and 2001 suggested that,
responding to seasonal changes, some parts of Vesteys Beach and Casuarina Beach
were approximately in dynamic equilibrium while other parts are severely eroded
(Comley 1996; Gray 2004). The study also revealed that the fore-dunes behind these
beaches are clearly eroding, indicating an imbalance of the nearshore – beach – dune
system. Considering that potential sources of dune sediment are beach and back-
dunes (Goldsmith 1978; Anthony, Mrani-Alaoui & Héquette 2010; Eliot 2016;
Claudino-Sales, Wang & Carvalho 2018), the back-dune environment in Darwin
167
Harbour is also an important part of the coastal sedimentary landforms to be
monitored and protected, a project beyond the scope of the present study.
6.5 Strengths and limitations
This section provides discussion of the strength and limitations of the study: the
modelling and the provenance of the sand-sized sediment in Darwin Harbour,
including the possible improvements of the study approaches.
6.5.1 Strengths
The main strength of the study is that geochemistry and numerical modelling
mutually complement each other to infer sand-sized sediment sources and pathways
in Darwin Harbour. Previous sand related studies did not cover the whole area of
Darwin Harbour. Therefore, this study can be used as a starting point to further
understand coastal processes occurring in Darwin Harbour, particularly for coastal
erosion management.
This study showed that the numerical modelling and provenance analysis results
supplement each other, thereby providing a higher degree of confidence in the
accuracy of the estimated sand transport patterns in Darwin Harbour. Furthermore,
this study provides a representation of the dynamics of sand-sized sediment in
Darwin Harbour that can be used for more detailed studies in the future.
6.5.2 Limitations and uncertainties
Both the numerical modelling and geochemical approach faced limitations and
uncertainties in pinpointing sediment sources and pathways.
6.5.2.1 Sand transport simulation
Numerical modelling inherently contains many uncertainties, as it is essentially a
simplification of natural processes involving complex interactions among various
environmental factors that are translated into model parameters (Kamphuis 2006,
2013). In particular, quantification of coastal sediment transport is a common
challenge due to combination of waves, currents and their interaction with the
sediment and bed (Schoonees & Theron 1995; White 1998; Camenen & Larroudé
2003; Winter 2007).
168
Comparison of several sand transport models suggests that the quantification of non-
cohesive sediment transport rates is highly sensitive to water velocity, bed
characteristics (bottom stress/bed roughness) and sediment grain size (Davies et al.
2002; Eidsvik 2004; Pinto, Fortunato & Freire 2006; Idier et al. 2010). Different
models yield different degrees of accuracy compared to the field data, with
increasing inaccuracies from instances of plane beds to instances of rippled beds,
with a difference of 2 to 10 respectively (Davies et al. 2002; Davies & Villaret 2002).
Other studies suggested that greater inaccuracies were found in wave and current
driven transport models compared to current only driven transport models in which
currents alone are included (Pinto, Fortunato & Freire 2006; Silva et al. 2009). While
accurate predictions are necessary for engineering purposes, it is equally important
for morphological modellers that the models have the ability to show at least relative
behaviour to infer morphodynamic predictions (Hooke 1999; Davies et al. 2002;
Cowell et al. 2003; Cowell et al. 2003).
This study reduced the modelling uncertainties by using the actual median grain
sizes, calculated from 152 samples, with the velocity results based on a
hydrodynamic model that was verified and validated in separate studies performed
by Li (2013), Patterson and Williams (2013a), Patterson and Williams (2013b) and
Patterson (2014).
On the other hand, due to the unavailability of sand concentration data, the sand
transport simulations were run based with an assumed sand concentration of 5 mg L-1
at the offshore and the rivers’ boundary lines. Since sand is transported as bed load,
this value was selected in order not to create excessive sand deposition at the
boundary lines. Values of higher concentrations were also tested, which gave similar
sand pathway results.
The numerical simulations (Figures 5.12 – 5.15) showed a very slow development of
the Harbour bed. This might be due to the lack of initial bed thickness in the model
mesh. Sand transport modelling by RMA-11 assumes that the bed is given an initial
thickness, so that the deposition or erosion occurs on the initial bed with increasing
or decreasing deposition computed based on the water velocity, the sand load and
other sand physical characteristics (King 2015). The modelling was set up with no
initial sand bed thickness to clearly distinguish the potential sand sources, thereby
identifying/pinpointing the origin of any bed deposition occurring in the modelling
169
area: offshore or rivers. While it effectively discriminates between the potential
sources, the bed deposition developed very slowly due to both upstream and
downstream boundaries remaining open in each scenario (King 2016, pers. comm.).
In order to show the development of the bed-change more clearly, the direction of
movement was inferred using the percentile of deposition in the modelling area.
Hence, the simulations showed the trends of sediment pathways from both offshore
and rivers satisfactorily.
On the other hand, the low deposition rate in the Outer Harbour is confirmed by the
results of optical dating of a sediment core taken from the Charles Point Patches, in
the western part of the Outer Harbour. The lowest part of the 2.2 metre core was
dated to approximately 25,000 years ago (unpublished report, AIMS 2013). A crude
estimation of the mean deposition rate of the core, by linear interpolation between
the age at the base and the age at the top of the core, provides an estimate of the
deposition rate since the stabilization of sea level rise at about 6000 years ago,
indicating a low sedimentation rate of around 0.3 mm per annum. However, since
there is no data available of the upper layers of the core, it is possible that sediment
deposition in Darwin Harbour is a mixture of slow accumulation during calm periods
and high deposition due to cyclonic disturbances (Wasson 2016 pers. comm.).
It is important to bear in mind that the numerical modelling in this study did not
cover extreme events such as storms and related fluvial floods. While extreme events
might substantially impact the local landscape (Morton & Sallenger Jr 2003;
Castelle, Le Corre & Tomlinson 2008; Sénéchal et al. 2009), frequent events of
moderate magnitude can be the determining factors for morphological
changes(Wolman & Miller 1960). This is, however, highly speculative and requires
more substantial research.
A beach profile study from April 1996 to October 2001 showed that the sediment
volume in Casuarina Beach increased, in contrast to Mindil and Vesteys beaches,
which experienced a net loss (Gray 2004). During this 5-year study, two tropical
cyclones affected Darwin Harbour, i.e. the category 1 Tropical Cyclone Rachel on
January 4, 1997 and the category 5 Tropical Cyclone Thelma on December 8, 1998.
Tropical Cyclone Rachel closely passed Darwin creating a maximum wind speed of
about 20 ms-1, while Tropical Cyclone Thelma passed approximately 185 km north-
northwest of Darwin and created maximum wind gust recorded as 29 ms-1 at Charles
170
Point Automatic Weather Station (Bureau of Meteorology 1997, 1998). These two
cyclones caused different outcomes in Mindil Beach and Casuarina Beach. While
there was increased erosion in Fannie Bay beaches there was no apparent erosion in
Casuarina beaches, indicating that coastal erosion in Darwin is determined by local
processes and morphodynamics.
6.5.2.2 Provenance analysis
The geochemical study of the sediment sources was based on trace element and
calcium carbonate determinations. The particular trace elements used to infer the
sediment sources and pathways in this study are LILEs, HFSEs and REEs, with
REEs providing the most useful information. REEs can be powerful sediment
provenance tracers due to their coherent behaviour during transport, retaining their
properties as a group from sources to sinks (Haskin & Paster 1984; Munksgaard, Lim
& Parry 2003; Prego et al. 2012). However, the transport pathways of sand-sized
sediment are often not obvious from REE results alone (Barnard et al. 2013) because
REEs are mostly contained in fine sediment and/or sand-sized sediment containing
heavy minerals such as zircon and monazite. Therefore, the use of REEs for sand
provenance studies is often accompanied by a mineralogical analysis and/or isotopic
determination (Armstrong-Altrin 2009; Rosenbauer et al. 2013; Fei et al. 2017),
approaches beyond the scope of this study.
An ideal chemical sediment tracer should be able to distinguish the dominant
character(s) of the source materials, be chemically inert during transport, and should
be easily and reliably analysed. The analysis of the REEs in this study was carried
out by means of a partial acid digestion method using HClO4 + HNO3 that in fine
grained sediment can produce results approximately the same as a four-acid digestion
method that provides a complete analysis. One drawback is that the HClO4 + HNO3
method is mainly suitable for digesting the light and middle REEs, but is less
effective for heavy REEs. Notwithstanding this limitation, the HClO4 + HNO3
method has been successfully used to describe sand characteristics in coastal
environments (Caccia & Millero 2007; Antonina et al. 2013) and was suitable to
discriminate the sand-sized sediment characteristics in this study.
171
6.6 Recommendations and future research
Future research recommendations are presented in three parts:
Improvement in numerical modelling
Improvement in provenance analysis
Recommendations for better coastal erosion management approaches
6.6.1 Improvement in numerical modelling
This study has indicated that the offshore sediment is the primary source of sand-
sized sediment in Darwin Harbour. Due to limited field data, the numerical
modelling was based on the sand transport potential method, using calculated bed
shear stress. Improvement in numerical modelling incorporating the actual bed shear
stress would give more accurate quantitative results. Refinement of the model
grid/mesh, particularly near the offshore boundary, would give a more accurate
representation of the offshore sediment inflow.
The modelling software used in this study is a far-field sediment transport model.
While the near-field modelling up to now was mostly used for water quality related
modelling (Bleninger & Jirka 2004; Morelissen, van der Kaaij & Bleninger 2013), a
combination of far- and near-field hydrodynamic modelling could be attempted in
order to get a more detailed representation of sediment behaviour.
Since Darwin Harbour is a tide-dominated estuary, the numerical modelling in this
study only considered tidal influences. While some studies suggest that sediment
transport is mostly influenced by frequent but moderate events (Wolman & Miller
1960; Brunsden & Thornes 1979), more frequent extreme events as a result of
climate change might reduce the natural ability of the coastal area to regain its
dynamic equilibrium, leading to an increase of coastal erosion. The Northern
Territory is a cyclone-prone area; therefore, improvement of the modelling would
include extreme events such as the annual storm activity as well as tropical cyclone
impacts.
There is no detailed geomorphic data regarding most of the coastal cliffs around
Darwin Harbour. But the cliffs at East Point and Nightcliff were reported to recede
on average 30 cm y-1, based on a photogrammetry study (Jones, Baban & Pathirana
2008). The rock cliffs at East Point and Nightcliff visually suffered basal
172
undercutting that can instigate a further collapse of the entire cliff face. Furthermore,
the tops of the cliffs are also sensitive to rainfall and surface water runoff as has been
reported in Darwin Harbour (Kraatz & Letts 1990; Gray 1999). Coastal cliffs in
Darwin Harbour are highly weathered (Nott 1994, 2003), therefore, a more detailed
study of changes, and their causes, in the coastal cliffs, including, cliff stratigraphy,
stability, and geochemistry would contribute to increasing coastal resilience in
Darwin Harbour.
6.6.2 Improvement of the provenance analysis
The concentration of REEs using the HClO4 + HNO3 method as a provenance
indicator in this study was used to infer the sand-sized sediment sources and
pathways in Darwin Harbour. While the results can be used for the relative
comparison of all the samples obtained, a more robust analysis such as instrumental
neutron activation analysis (INAA) could be used to obtain more comprehensive
results. However, INAA is substantially more time consuming and costly. Further
improvement could be made by supporting REE analysis with mineralogical and/or
isotopic analyses.
6.6.3 Recommendations for better coastal erosion management approaches
Coastal erosion indicates an imbalance in the sediment budget of a certain coastal
compartment (Bird 1987; Kamphuis 2000; Marchand et al. 2011; Nordstrom 2014).
This study only covers the sand-sized sediment transport/pathways for the whole
Harbour. Further studies benefitting coastal erosion management in Darwin Harbour
should be directed to sediment budget and coastal compartment sediment budget and.
Such studies could provide an analysis of coastal resilience and coastal setback,
potential applications of ‘working with nature’ and combining hard and soft
engineering principles, also within the framework of a climate change adaptation
policy. The coastal compartment concept enables setting up a sediment budget, i.e.
quantifying the mass balance of inputs, outputs and storage of sediment for each
compartment, while coastal resilience and coastal setback studies are important
features for the success of integrated coastal management (Harvey & Woodroffe
2008; Mulder, Hommes & Horstman 2011; Shanehsazzadeh & Parsa 2013; Cope &
Wilkinson 2014). Studies on the role of dunes and sandbars as possible sediment
sources to the adjacent beaches and their function in coastal protection from coastal
173
hazards are necessary. Furthermore, studies on sand dune resilience are essential to
provide higher adaptive capacity to the possible impacts of sea level rise. The
assessment of hard engineering structures retrofitted with artificial structures such as
eco-concrete surface (Reinders & Van Wesenbeeck 2013), artificial intertidal rock
pools, incorporating vegetation into existing structures (Waltham 2016), etc., are
important to provide ecosystem services as well as having capabilities in coastal
defence and averting coastal erosion more sustainably.
Coastal erosion is essentially a natural phenomenon if there is an imbalance in the
coastal sediment budget that can be intensified by human intervention.
Morphologically, coastal erosion is the landward shift of the shoreline, which
becomes a problem when there is no space available for people to accommodate the
change. Given that environmental disasters require a hazard (coastal erosion in this
case) and impacts on humans, coastal erosion is a disaster in those areas where
people and their infrastructure are concentrated (Kafle & Murshed 2006) such as in
small parts of Darwin Harbour. Hence, coastal erosion in Darwin Harbour is not yet
considered a disaster by comparison with many other parts of Australia, such as at
Collaroy/Narrabeen Beach in New South Wales (Schipp & Palin 2016) and
Geraldton in Western Australia (Taillier 2016). Nonetheless, coastal erosion certainly
impacts the local community in Darwin, and could be exacerbated by the predicted
sea level rise and more intense, albeit less frequent cyclones, that could increase the
impact of erosion, instigate coastal flooding and damage properties and
infrastructure, particularly on the eastern beaches. Therefore, it is of the utmost
importance to have a better understanding of coastal processes, analyse coastal
resilience, define set-back lines, and assess sediment availability to create a more
balanced sediment budget to support coastal resilience (European Commission 2004;
Sánchez-Arcilla, Jiménez & Marchand 2011).
The Australian Government, within the coastal climate risk management framework
(https://coastadapt.com.au), indicated that the coastal compartment approach is
necessary for predicting future shoreline movement and improving coastal risk
assessment, both regionally and nationally (Thom 2014; Thom et al. 2018). The
coastal sediment compartment concept was introduced to Australia in the 1970s
(Davies 1974) and widely applied in Western Australia (Sanderson & Eliot 1999;
Nutt, Gozzard & Eliot 2009; Eliot, Gozzard & Nutt 2010) and later in New South
174
Wales (Mariani et al. 2013). Up to now, there are no defined sediment cells in
Darwin Harbour. This study can be used as the first step towards further research to
determine coastal compartments in Darwin Harbour, complementing coastal erosion
management.
The extent of pocket beaches in Darwin Harbour bounded by more resistant
headlands suggests a particular (lower hierarchical) type of sediment cells or
compartments (Nutt, Gozzard & Eliot 2009; Sammut et al. 2017; Claudino-Sales,
Wang & Carvalho 2018). The beaches might be fed by relict sediment and the
adjacent weathered rock cliffs, hence it is recommended to study the sediment
dynamics of these pocket beaches in detail.
6.7 Global significance of the study
Sandy beaches are particularly susceptible to erosion due to natural and human-
induced activities and Darwin Harbour, a cyclone-prone, tropical, macro-tidal
environment in northern Australia, is not an exception. This study confirmed that
defining the sand sources for beaches is very important in beach erosion
management. Local geomorphology and hydrodynamics are prominent factors in
determining the coastal processes leading to sand dynamics, which influence whether
the offshore and/or river(s) flowing into the coast is the important sand source(s)
onto the beach. The existence of sandbars/shoals and other sand sources such as coral
reef communities, sandy spits/cheniers and weather-prone coastal cliffs should be
considered in any development involving the coastal environment. Furthermore, as
geochemistry is an important tool in inferring sand provenance, the combination of
modelling and tracing, such as used in this study, produces more robust results than
either of the methods could produce alone.
6.8 Concluding remarks
This study investigated sand-sized sediment sources and pathways in Darwin
Harbour using a multidisciplinary approach, combining numerical modelling and
geochemical analysis. The results fulfilled the main objective of the study to
understand sand-sized sediment dynamics in a tropical, macro-tidal environment by
inferring the principal sediment pathways in order to assist with coastal erosion
management in Darwin Harbour.
175
As the first attempt to assess the sand-sized sediment dynamics in Darwin Harbour,
this study shows the importance of understanding the processes occurring in a coastal
environment as an input to coastal erosion management. For example, the stability of
the eastern beaches might be relying on sediment input from the continental shelf and
the local biogenic sand producers in the Harbour. Therefore, coral reefs and other
biogenic sand producers should be protected.
The most notable coastal erosion in Darwin Harbour is caused by the
mismanagement of the beach – dune system, particularly developments on or
adjacent to the fore-dunes. Therefore, it is recommended to study the sediment
budget of the Harbour followed by the analysis of the coastal compartments at the
Harbour beaches. Furthermore, it is necessary to analyse the coastal resilience and
coastal setback so that precautions against coastal erosion and storm-induced
flooding can be implemented in advance of further development in the coastal area.
176
References
Aagaard, P 1974, ‘Rare earth elements adsorption on clay minerals’, Bulletin du
Groupe français Argiles, vol. XXVI, pp. 193–199.
Aagaard, T 2011, ‘Sediment transfer from beach to shoreface: The sediment budget
of an accreting beach on the Danish North Sea Coast’, Geomorphology, vol.
135, no. 1–2, pp. 143–157.
Aagaard, T, Davidson-Arnott, R, Greenwood, B & Nielsen, J 2004, ‘Sediment
supply from shoreface to dunes: linking sediment transport measurements and
long-term morphological evolution’, Geomorphology, vol. 60, no. 1–2, pp.
205–224.
Abuodha, JO. 2003, ‘Grain size distribution and composition of modern dune and
beach sediments, Malindi Bay coast, Kenya’, Journal of African Earth
Sciences, vol. 36, pp. 41–54.
Adamo, F, De Capua, C, Filianoti, P, Lanzolla, AML & Morello, R 2014, ‘A coastal
erosion model to predict shoreline changes’, Measurement, vol. 47, pp. 734–
740.
Ahmadian, R, Falconer, R & Bockelmann-Evans, B 2012, ‘Far-field modelling of the
hydro-environmental impact of tidal stream turbines’, Renewable Energy,
vol. 38, no. 1, pp. 107–116.
Airoldi, L, Abbiati, M, Beck, MW, Hawkins, SJ, Jonsson, PR, Martin, D, Moschella,
PS, Sundelöf, A, Thompson, RC & Åberg, P 2005, ‘An ecological
perspective on the deployment and design of low-crested and other hard
coastal defence structures’, Coastal Engineering, vol. 52, no. 10–11, pp.
1073–1087.
Albers, T & von Lieberman, N 2010, ‘Morphodynamics of Wadden Sea Areas -
Field Measurements and Modeling’, Internatonal Journal of Ocean and
Climate Systems, vol. 1, no. 3, pp. 123–132.
Alexander, PS & Holman, RA 2004, ‘Quantification of nearshore morphology based
on video imaging’, Marine Geology, vol. 208, no. 1, pp. 101–111.
Al-Mikhlafi, AS 2008, ‘Rare earth elements in modern coral sands: an environmental
proxy’, Environmental Geology, vol. 54, pp. 1145–1153.
Alsina, JM, Cáceres, I, Brocchini, M & Baldock, TE 2012, ‘An experimental study
on sediment transport and bed evolution under different swash zone
morphological conditions’, Coastal Engineering, vol. 68, pp. 31–43.
Andrews, M & Nielsen, C 2001, ‘Numerical Modelling of the Gold Coast Seaway’,
Proceedings of the 15th Australasian Coastal and Ocean Engineering
Conference, the 8th Australasian Port and Harbour Conference, Institution
of Engineers, Australia, Barton, A.C.T, pp. 469–474.
177
Andrews, MJ & Eliot, M 2013, City of Darwin Coastal Erosion Management Plan,
City of Darwin, Darwin, Australia, p. 145.
Andutta, FP, Wang, XH, Li, L & Williams, D 2014, ‘Hydrodynamics and sediment
transport in a macro-tidal estuary: Darwin Harbour, Australia’, in E Wolanski
(ed.), Estuaries of Australia in 2050 and Beyond, Estuaries of the World,
Springer, pp. 111–129.
Anfuso, G, Pranzini, E & Vitale, G 2011, ‘An integrated approach to coastal erosion
problems in northern Tuscany (Italy): Littoral morphological evolution and
cell distribution’, Geomorphology, vol. 129, no. 3–4, pp. 204–214.
Anıl Ari, H, Yüksel, Y, Özkan Çevik, E, Güler, I, Cevdet Yalçiner, A & Bayram, B
2007, ‘Determination and control of longshore sediment transport: A case
study’, Ocean Engineering, vol. 34, no. 2, pp. 219–233.
Anthony, EJ, Mrani-Alaoui, M & Héquette, A 2010, ‘Shoreface sand supply and
mid- to late Holocene aeolian dune formation on the storm-dominated
macrotidal coast of the southern North Sea’, Marine Geology, vol. 276, pp.
100–104.
Antonina, AN, Shazili, NAM, Kamaruzzaman, BY, Ong, MC, Rosnan, Y &
Sharifah, FN 2013, ‘Geochemistry of the Rare Earth Elements (REE)
Distribution in Terengganu Coastal Waters: A Study Case from Redang
Island Marine Sediment’, Open Journal of Marine Science, vol. 03, no. 03,
pp. 154–159.
Araújo, MF, Corredeira, C & Gouveia, A 2007, ‘Distribution of the rare earth
elements in sediments of the Northwestern Iberian Continental Shelf’,
Journal of Radioanalytical and Nuclear Chemistry, vol. 271, no. 2, pp. 255–
260.
Ari Güner, HA, Yüksel, Y & Özkan Ҫevik, E 2013, ‘Longshore Sediment Transport
- Field Data and Estimations Using Neural Networks, Numerical Model, and
Empirical Models’, Journal of Coastal Research, vol. 29, no. 2, pp. 311–324.
Ariathurai, R 1974, A Finite Element Model for Sediment Transport in Estuaries,
PhD, University of California, Davis.
Armstrong-Altrin, JS 2009, ‘Provenance of sand from Cazones, Acapulco, and Bahia
Kino beaches, México’, Revista Mexicana de Ciencias Geológicas, vol. 26,
no. 3, pp. 764–782.
Asia-Pacific Applied Science Associates 2010, Ichthys Gas Field Development
Project: Description and validation of hydrodynamic and wave models for
discharges, spills, geomorphology and dredge spoil disposal ground
selection, Report prepared for INPEX Browse, Ltd., Perth, Western Australia.
Bailard, JA 1981, ‘An energetics total load sediment transport model for a plane
sloping beach’, Journal of Geophysical Research, vol. 86 (C11), pp. 10938–
10954.
178
Bailard, JA & Inman, DL 1981, ‘An energetics bedload model for a plane sloping
beach: Local transport’, Journal of Geophysical Research Atmospheres, vol.
86, no. C3, pp. 2035–2043.
Barnard, PL, Erikson, LH, Elias, EPL & Dartnell, P 2013, ‘Sediment transport
patterns in the San Francisco Bay Coastal System from cross-validation of
bedform asymmetry and modeled residual flux’, Marine Geology, vol. 345,
pp. 72–95.
Barnard, PL, Foxgrover, AC, Elias, EPL, Erikson, LH, Hein, JR, McGann, M,
Mizell, K, Rosenbauer, RJ, Swarzenski, PW, Takesue, RK, Wong, FL &
Woodrow, DL 2013, ‘Integration of bed characteristics, geochemical tracers,
current measurements, and numerical modeling for assessing the provenance
of beach sand in the San Francisco Bay Coastal System’, Marine Geology,
vol. 345, pp. 181–206.
Bastos, AC, Paphitis, D & Collins, MB 2007, ‘Short-term dynamics and maintenance
processes of headland-associated sandbanks: Shambles Bank, English
Channel, UK’, Estuarine, Coastal and Shelf Science, vol. 59, pp. 33–47.
Battiau-Queney, Y, Billet, JF, Chaverot, S & Lanoy-Ratel, P 2003, ‘Recent shoreline
mobility and geomorphologic evolution of macrotidal sandy beaches in the
north of France’, Marine Geology, vol. 194, no. 1–2, pp. 31–45.
Begum, Z, Balaram, V, Ahmad, SM, Satyanarayanan, M & Rao, TG 2007,
‘Determination of trace and rare earth elements in marine sediment reference
materials by ICP-MS: comparison of open and closed acid digestion
methods’, Atomic spectroscopy, vol. 28, no. 2, pp. 41–50.
Bell, P & McEwan, J 2010, ‘Finite element water quality modelling of WWTP
discharges and resuspended sediments in the Brisbane River Estuary and
Moreton Bay’, 19th NSW Coastal Conference, Batemans Bay, NSW,
Australia, pp. 12–15.
Berman, G 2011, Longshore Sediment Transport, Cape Cod Massachusetts, Woods
Hole Sea Grant Program and Barnstable Country’s Cape Cod Cooperative
Extension.
Bernatchez, P, Fraser, C, Lefaivre, D & Dugas, S 2011, ‘Integrating anthropogenic
factors, geomorphological indicators and local knowledge in the analysis of
coastal flooding and erosion hazards’, Ocean & Coastal Management, vol.
54, no. 8, pp. 621–632.
Bertram, CJ & Elderfield, H 1993, ‘The geochemical balance of the rare earth
elements and neodymium isotopes in the oceans’, Geochimica et
Cosmochimica Acta, vol. 57, no. 9, pp. 1957–1986.
Besio, G, Blondeaux, P, Brocchini, M, Hulscher, SJMH, Idier, D, Knaapen, MAF,
Németh, AA, Roos, PC & Vittori, G 2008, ‘The morphodynamics of tidal
sand waves: A model overview’, Coastal Engineering, vol. 55, no. 7–8, pp.
657–670.
179
Besio, G, Blondeaux, P & Frisina, P 2003, ‘A note on tidally generated sand waves’,
Journal of Fluid Mechanics, vol. 485, pp. 171–190.
Besio, G, Blondeaux, P & Vittori, G 2006, ‘On the formation of sand waves and sand
banks’, Journal of Fluid Mechanics, vol. 557, pp. 1–27.
Bijker, EW 1971, ‘Longshore transport computations’, Journal of Waterways,
Harbors and Coastal Engineering Division, ASCE, vol. 97 (WW4), pp. 687–
701.
Bird, ECF 1996, Beach Management, John Wiley & Sons Ltd. Chichester.
Bird, ECF 2000, Coastal Geomorphology: An Introduction, John Wiley & Sons, Inc.
Bird, ECF 1987, ‘The modern prevalence of beach erosion’, Marine Pollution
Bulletin, vol. 18, no. 4, pp. 151–157.
Black, KS, Athey, S, Wilson, P & Evans, D 2007, ‘The use of particle tracking in
sediment transport studies: a review’, in PS Balson & MB Collins (eds),
Coastal and Shelf Sediment Transport, Geological Society of London, pp.
73–91.
Blair, K 2003, ‘Recreational use of Darwin Harbour’, in Working Group for the
Darwin Harbour Advisory Committee (ed.), ‘Proceedings: Darwin Harbour
Region: Current knowledge and future needs’, Department of Infrastructure,
Planning and Environment, Darwin, pp. 202–205.
Bleninger, T & Jirka, G 2004, ‘Near- and far-field model coupling methodology for
wastewater discharges’, Proceedings of the 4th International Symposium on
Environmental Hydraulics, Hong Kong, pp. 447–453.
Blott, SJ & Pye, K 2001, ‘GRADISTAT: a grain size distribution and statistics
package for the analysis of unconsolidated sediments’, Earth Surface
Processes and Landforms, vol. 26, no. 11, pp. 1237–1248.
Blott, SJ & Pye, K 2012, ‘Particle size scales and classification of sediment types
based on particle size distributions: Review and recommended procedures’,
Sedimentology, vol. 59, no. 7, pp. 2071–2096.
Boothroyd, JC 1978, ‘Mesotidal Inlets and Estuaries’, Coastal Sedimentary
Environments, Springer-Verlag New York Inc., pp. 287–360.
Borsje, BW, van Wesenbeeck, BK, Dekker, F, Paalvast, P, Bouma, TJ, van Katwijk,
MM & de Vries, MB 2011, ‘How ecological engineering can serve in coastal
protection’, Ecological Engineering, vol. 37, no. 2, pp. 113–122.
Bouma, TJ, Olenin, S, Reise, K & Ysebaert, T 2009, ‘Ecosystem engineering and
biodiversity in coastal sediments: posing hypotheses’, Helgoland Marine
Research, vol. 63, no. 1, pp. 95–106.
180
Brewer, T 2014, Valuing Darwin Harbour: engaging community to quantify
landscape values in a time of change, Northern Institute, Charles Darwin
University, Darwin.
Brocklehurst, P & Edmeades, B 1996, Mangrove Survey of Darwin Harbour,
Northern Territory, Australia, Technical Report, Department of Lands
Planning and Environment : National Forest Inventory (Australia), Northern
Territory, Darwin.
Brown, MR 1986, Darwin Coastal Erosion Survey, Land Conservation Unit,
Conservation Commission of the Northern Territory, Darwin.
Brunsden, D & Thornes, JB 1979, ‘Landscape sensitivity and change’, Transactions
of the Institute of British Geographers, vol. 4, pp. 463–484.
Bureau of Meteorology 2017, ‘Climate Statistics for Australian locations’, Climate
statistics for Darwin Airport 1941-2016.
Bureau of Meteorology 1997, ‘Previous Cyclone’, Severe Tropical Cyclone Rachel,
3-8 January 1998. http://www.bom.gov.au/cyclone/history/rachel.shtml.
Bureau of Meteorology 1998, ‘Previous Cyclone’, Severe Tropical Cyclone Thelma,
1-14 December 1998. http://www.bom.gov.au/cyclone/history/thelma.shtml.
Bureau of Meteorology 1977, Report on Cyclone Tracy December 1974, Australian
Goverment Publishing Service, Canberra.
Byrne, AP 1987, ‘Darwin Harbour - Hydrodynamics and Coastal Processes’, in HK
Larson, MG Michie & JR Hanley (eds), ‘Proceedings of a Workshop on
Research and Management’, Northern Territory Branch of the Australian
Marine Sciences Association and the North Australia Research Unit of the
Australian National University, Darwin, pp. 19–31.
Caccia, VG & Millero, FJ 2007, ‘Distribution of yttrium and rare earths in Florida
Bay sediments’, Marine Chemistry, vol. 104, no. 3–4, pp. 171–185.
Cadigan, RA 1961, ‘Geologic Interpretation of Grain-Size Distribution
Measurements of Colorado Plateau Sedimentary Rocks’, The Journal of
Geology, vol. 69, no. 2, pp. 121–144.
Camenen, B & Larroudé, P 2003, ‘Comparison of sediment transport formulae for
the coastal environment’, Coastal Engineering, vol. 48, no. 2, pp. 111–132.
Carvalho, RC & Woodroffe, CD 2014, ‘The sediment budget as a management tool:
the Shoalhaven Coastal Compartment, south-eastern NSW, Australia’, 23rd
NSW Coastal Conference 2014, Ulladulla, NSW, Australia.
Castelle, B, Le Corre, Y & Tomlinson, R 2008, ‘Can the gold coast beaches
withstand extreme events?’, Geo-Marine Letters, vol. 28, no. 1, pp. 23–30.
Chatto, R 2003, ‘Seabirds and shorebirds of the Darwin Harbour Regional Plan of
Management area’, in Working Group for the Darwin Harbour Advisory
181
Committee (ed.), ‘Proceedings: Darwin Harbour Region: Current knowledge
and future needs’, Department of Infrastructure, Planning and Environment,
Darwin, pp. 231–235.
Cheetham, MD, Keene, AF, Bush, RT, Sullivan, LA & Erskine, WD 2008, ‘A
comparison of grain-size analysis methods for sand-dominated fluvial
sediments’, Sedimentology, vol. 55, pp. 1905–1913.
Cicin-Sain, B & Belfiore, S 2005, ‘Linking marine protected areas to integrated
coastal and ocean management: A review of theory and practice’, Ocean &
Coastal Management, vol. 48, no. 11–12, pp. 847–868.
Clarke, KR & Gorley, RN 2006, PRIMER v6: User Manual/Tutorial, 1st edition.,
PRIMER-E, Plymouth, U.K.
Claudino-Sales, V, Wang, P & Carvalho, AM 2018, ‘Interactions between Various
Headlands, Beaches, and Dunes along the Coast of Ceará State, Northeast
Brazil’, Journal of Coastal Research, vol. 34, no. 2, pp. 413–428.
Coaldrake, JE 1976, Foreshore Problems of Darwin Report to City Corporation of
Darwin, Unpublished report, Land Conservation Unit of the Conservation
Commission of the Northern Territory, Darwin.
Collins, AL, Pulley, S, Foster, IDL, Gellis, A, Porto, P & Horowitz, AJ 2017,
‘Sediment source fingerprinting as an aid to catchment management: A
review of the current state of knowledge and a methodological decision-tree
for end-users’, Journal of Environmental Management, vol. 194, pp. 86–108.
Collins, MB & Balson, PS 2007, ‘Coastal and shelf sediment transport: an
introduction’, Geological Society, London, vol. 274, Special Publication, pp.
1–5.
Comley, BWT 1996, Darwin Beach Erosion Survey, Technical Report, Land
Resource Conservation Branch, Department of Lands, Planning and
Environment, Darwin.
Conservation Commission of the Northern Territory 1993, Cullen Bay Waterfront
Estate and Marina Project: Proposed additional dredging from the Emery
Point sandbar; Environmental Assessment Report and Recommendations,
Assessment Report 17, Conservation Commission of the Northern Territory,
Environment Protection Unit, Darwin, N.T.
Cooper, NJ, Hooke, JM & Bray, MJ 2001, ‘Predicting coastal evolution using a
sediment budget approach: a case study from southern England’, Ocean &
Coastal Management, vol. 44, pp. 711–728.
Cooper, NJ & Pontee, NI 2006, ‘Appraisal and evolution of the littoral “sediment
cell” concept in applied coastal management: Experiences from England and
Wales’, Ocean & Coastal Management, vol. 49, pp. 498–510.
182
Cope, SN & Wilkinson, C 2014, Evolution of Coastal Sediment Stores and Sinks
across the SCOPAC region, Channel Coastal Observatory, Southampton,
U.K.
Corbau, C, Tessier, B & Chamley, H 1999, ‘Seasonal evolution of offshore and
beach system morphology in a macrotidal environment, Dunkerque, Northern
France’, Journal of Coastal Research, vol. 15, no. 1, pp. 97–110.
Cowell, PJ, Roy, PS & Jones, RA 1995, ‘Simulation of large-scale coastal change
using a morphological behaviour model’, Marine Geology, vol. 126, pp. 45–
61.
Cowell, PJ, Stive, MJF, Niedoroda, AW, Swift, DJP, Vriend, HJ de, Buijsman, MC,
Nicholls, RJ, Roy, PS, Kaminsky, GM, Cleveringa, J, Reed, CW & Boer, PL
de 2003, ‘The Coastal-Tract (Part 2): Applications of Aggregated Modeling
of Lower-Order Coastal Change’, Journal of Coastal Research, vol. 19, no. 4,
pp. 828–848.
Cowell, PJ, Stive, MJF, Niedoroda, AW, Vriend, HJ de, Swift, DJP, Kaminsky, GM
& Capobianco, M 2003, ‘The Coastal-Tract (Part 1 ): A Conceptual
Approach to Aggregated Modeling of Low-Order Coastal Change’, Journal
of Coastal Research, vol. 19, no. 4, pp. 812–827.
Cowell, PJ, Stive, MJF, Roy, PS, Kaminsky, GM, Buijsman, MC, Thom, BG &
Wright, LD 2001, ‘Shoreface Sand Supply to Beaches’, in BL Edge (ed.),
Coastal Engineering 2000, American Society of Civil Engineers, pp. 2495–
2508.
Dafforn, KA, Mayer-Pinto, M, Morris, RL & Waltham, NJ 2015, ‘Application of
management tools to integrate ecological principles with the design of marine
infrastructure’, Journal of Environmental Management, vol. 158, pp. 61–73.
Dalrymple, RW, Mackay, DA, Ichaso, AA & Choi, KS 2012, ‘Processes,
Morphodynamics, and Facies of Tide-Dominated Estuaries’, in RA Davis &
RW Dalrymple (eds), Principles of Tidal Sedimentology, Springer
Netherlands, Dordrecht, pp. 79–107.
Darwin Harbour Advisory Committee 2010, Darwin Harbour strategy: a
comprehensive guide for the responsible stewardship and sustainable
development of the Darwin Harbour region, Darwin Harbour Advisory
Committee, Darwin, NT.
Darwin Harbour Advisory Committee 2006, Providing a scientific basis to managing
the region’s development, Darwin Harbour Advisory Committee, Darwin,
NT.
Davidson-Arnott, R 2010, An Introduction to Coastal Processes and
Geomorphology, Cambridge University Press, New York.
Davies, AG, van Rijn, LC, Damgaard, JS, van de Graaff, J & Ribberink, JS 2002,
‘Intercomparison of research and practical sand transport models’, Coastal
Engineering, vol. 46, no. 1, pp. 1–23.
183
Davies, AG & Villaret, C 2002, ‘Prediction of sand transport rates by waves and
currents in the coastal zone’, Continental Shelf Research, vol. 22, no. 18–19,
pp. 2725–2737.
Davies, JL 1974, ‘The coastal sediment compartment’, Australian Geographical
Studies, vol. 12, pp. 139–151.
Davis, RA 1978, ‘Beach and Nearshore Zone’, in Davis (ed.), Coastal Sedimentary
Environments, Springer-Verlag New York Inc., pp. 237–285.
De Swart, HE & Zimmerman, JTF 2009, ‘Morphodynamics of Tidal Inlet Systems’,
Annual Review of Fluid Mechanics, vol. 41, no. 1, pp. 203–229.
De Vriend, H & Van Koningsveld, M 2012, Building with Nature: Thinking, acting
and interacting differently, EcoShape, Building with Nature, Dordrecht, the
Netherlands.
De Vriend, HJ 2003, ‘On the Prediction of Aggregated-Scale Coastal Evolution’,
Journal of Coastal Research, vol. 19, no. 4, pp. 757–759.
Dean, D 2003, ‘Darwin Harbour values and its future’, in Working Group for the
Darwin Harbour Advisory Committee (ed.), ‘Proceedings: Darwin Harbour
Region: Current knowledge and future needs’, Department of Infrastructure,
Planning and Environment, Darwin, pp. 210–212.
Deepulal, PM, Kumar, TG & Sujatha, CH 2012, ‘Behaviour of REEs in a tropical
estuary and adjacent continental shelf of southwest coast of India: Evidence
from anomalies’, Journal of earth system science, vol. 121, no. 5, pp. 1215–
1227.
Denny, JF, Schwab, WC, Baldwin, WE, Barnhardt, WA, Gayes, PT, Morton, RA,
Warner, JC, Driscoll, NW & Voulgaris, G 2013, ‘Holocene sediment
distribution on the inner continental shelf of northeastern South Carolina:
Implications for the regional sediment budget and long-term shoreline
response’, Continental Shelf Research, vol. 56, pp. 56–70.
Dibajnia, M 1995, ‘Sheet Flow Transport Formula Extended and Applied to
Horizontal Plane Problems’, Coastal Engineering in Japan, vol. 38, no. 2, pp.
179–194.
Dibajnia, M & Watanabe, A 1992, ‘Sheet flow under nonlinear waves and currents’,
Coastal Engineering Proceedings, American Society of Civil Engineers,
Venice, pp. 2015–2028.
Donnel, BP, Letter, JV, McAnally, Jr., WH, Thomas, WA, Finnie, JI, King, I &
Roig, LC 2006, Users Guide To RMA2 WES Version 4.5, Coastal and
Hydraulics Laboratory, Waterways Experiment Station, US Army, Engineer
Research and Development Center.
Doody, P, Ferreira, M, Lombardo, S, Lucius, I, Misdorp, R, Niesing, H, Salman, A &
Smallegange, M 2004, Living with coastal erosion in Europe- Sediment and
Space for Sustainability: A guide to coastal erosion management practices in
184
Europe, Office for Official Publications of the European Communities,
Luxembourg.
Dovers, S 2006, ‘Insitutions for ICZM: Insight from elswhere’, in N Lazarow, R
Souter, R Fearon & S Dovers (eds), Coastal management in Australia: Key
institutional and governance issues for coastal natural resource management
and planning, CRC for Coastal Zone, Estuary and Waterway Management,
Indooroopilly, Qld. Australia, pp. 1–10.
Drewry, J, Fortune, J & Majid, M 2010, Flood plume water quality and spatial
distribution of water quality indicators in Elizabeth River estuary, Darwin
Harbour, Department of Natural Resources, Environment, The Arts and
Sport, Darwin.
Drewry, J, Fortune, J & Maly, G 2009, ‘A water quality protection plan for Darwin
Harbour region’, in RS Anderssen, RD Braddock & LTH Newham (eds),
18th World IMACS Congress and MODSIM09 International Congress on
Modelling and Simulation, Modelling and Simulation Society of Australia
and New Zealand and International Association for Mathematics and
Computers in Simulation, Cairns, Australia, pp. 4000–4006.
Dubinin, AV 2004, ‘Geochemistry of Rare Earth Elements in the Ocean’, Lithology
and Mineral Resources, vol. 39, no. 4, pp. 289–307.
Eidsvik, KJ 2004, ‘Some contributions to the uncertainty of sediment transport
predictions’, Continental Shelf Research, vol. 24, pp. 739–754.
Elgar, S, Gallagher, E & Guza, RT 2001, ‘Nearshore sandbar migration’, Journal of
Geophysical Research, vol. 106, no. C6, p. 11,623-11,627.
Eliot, I, Gozzard, B & Nutt, C 2010, ‘Geological and Geomorphological Frameworks
for Marine and Coastal Planning and Management in Western Australia’,
Coast to Coast 2010, Adelaide.
Eliot, M 2016, Coastal sediments, beaches and soft shores, CoastAdapt Information
Manual 8, National Climate Change Adaptation Research Facility, Gold
Coast.
European Commission 2004, Results from the EUROSION Study, Office for Official
Publications of the European Communities, Luxembourg.
Eversole, D & Fletcher, CH 2003, ‘Longshore Sediment Transport Rates on a Reef-
Fronted Beach: Field Data and Empirical Models Kaanapali Beach, Hawaii’,
Journal of Coastal Research, vol. 19.
Fei, G, Maosheng, G, Guohua, H, Sen, L & Jing, W 2017, ‘Source tracing of rare
earth elements: A case study of core 07 on the southern coast of Laizhou
Bay’, Continental Shelf Research, vol. 136, pp. 29–38.
Firth, LB, Thompson, RC, Bohn, K, Abbiati, M, Airoldi, L, Bouma, TJ, Bozzeda, F,
Ceccherelli, VU, Colangelo, MA, Evans, A, Ferrario, F, Hanley, ME, Hinz,
H, Hoggart, SPG, Jackson, JE, Moore, P, Morgan, EH, Perkol-Finkel, S,
185
Skov, MW, Strain, EM, van Belzen, J & Hawkins, SJ 2014, ‘Between a rock
and a hard place: Environmental and engineering considerations when
designing coastal defence structures’, Coastal Engineering, vol. 87, pp. 122–
135.
Folk, RL 1980, Petrology of sedimentary rocks, Hemphill Publishing Company,
Austin, Texas.
Folk, RL 1954, ‘The Distinction between Grain Size and Mineral Composition in
Sedimentary-Rock Nomenclature’, The Journal of Geology, vol. 62, no. 4,
pp. 344–359.
Folk, RL & Ward, WC 1957, ‘Brazos River bar: A Study in the Significance of
Grain Size Parameters’, Journal of Sedimentary Petrology, vol. 27, no. 1, pp.
3–26.
Fontes, CL 2010, Modelling of Water Quality in the Alqueva Reservoir, Portugal,
PhD Thesis, University of Minho, Portugal.
Fortune, J 2006, The grainsize and heavy metal content of sediment in Darwin
Harbour, Aquatic Health Unit, Department of Natural Resources,
Environment and the Arts, Northern Territory Government, Darwin, 74 pp.
Fortune, J & Maly, G 2009, Towards the Development of a Water Quality Protection
Plan for the Darwin Harbour Region, Phase 1 Report, Aquatic Health Unit,
Department of Natural Resources, Environment, the Arts and Sport, Darwin.
Fortune, J & Patterson, RG 2016, Darwin Harbour Region 2015 Report Card: Water
Quality Supplement, Aquatic Health Unit, Department of Land Resource
Management, Darwin, Northern Territory.
Fredsøe, J & Deigaard, R 1994, Mechanics of Coastal Sediment Transport, World
Scientific Press, Singapore.
French, JR & Burningham, H 2009, ‘Coastal geomorphology: trends and challenges’,
Progress in Physical Geography, vol. 33, no. 1, pp. 117–129.
Friedman, GM 1962, ‘On Sorting, Sorting Coefficients, and the Lognormality of the
Grain-Size Distribution of Sandstones’, The Journal of Geology, vol. 70, no.
6, pp. 737–753.
Gallagher, E, Elgar, S & Guza, RT 1998, ‘Observations of sand bar evolution on a
natural beach’, Journal of Geophysical Research, vol. 103, no. C2, pp. 3203–
3215.
Gao, S & Collins, M 2001, ‘The use of grain size trends in marine sediment
dynamics: A review’, Chinese Journal of Oceanology and Limnology, vol.
19, no. 3, pp. 265–271.
Gao, S, Collins, MB, Lanckneus, J, De Moor, G & van Lancker, V 1994, ‘Grain size
trends associated with net sediment transport patterns: An example from the
Belgian continental shelf’, Marine Geology, vol. 121, pp. 171–185.
186
Garzanti, E, Wang, J-G, Vezzoli, G & Limonta, M 2016, ‘Tracing provenance and
sediment fluxes in the Irrawaddy River basin (Myanmar)’, Chemical
Geology, vol. 440, pp. 73–90.
Gelfenbaum, G & Kaminsky, GM 2010, ‘Large-scale coastal change in the Columbia
River littoral cell: An overview’, Marine Geology, vol. 273, no. 1–4, pp. 1–
10.
GHD Pty. Ltd. 2005, Port of Hay Point Apron Area and Departure Path Capital
Dredging, Environmental Impact Statement (draft), Prepared for Ports
Corporation of Queensland, Australia.
Glasby, TM, Connel, SD, Holloway, MG & Hewitt, CL 2007, ‘Nonindigenous biota
on artificial structures: could habitat creation facilitate biological invasions?’,
Marine Biology, vol. 151, pp. 887–895.
Goad, JE 2001, Shoreline Movement and Beach Change in Fannie Bay, Port
Darwin, Honours Thesis, University of Western Australia, Perth, WA.
Goldsmith, V 1978, ‘Coastal Dunes’, Coastal Sedimentary Environments, Springer-
Verlag New York Inc., pp. 171–235.
Govaerts, A & Lauwaert, B 2009, Assessment of the impact of coastal defence
structures, OSPAR Commission, London, UK.
Gray, P 2004, Beach Profile Change on the Eastern Beaches of Port Darwin 1996-
2001, Technical Report, Department of Infrastructure, Planning and
Environment, Northern Territory Government, Palmerston.
Gray, P 1999, Report to Darwin City Council on cliff top erosion at East Point
Reserve, Department of Lands, Planning and Environment, Darwin.
Greiner, R 2014, ‘Applicability of market-based instruments for safeguarding water
quality in coastal waterways: Case study for Darwin Harbour, Australia’,
Journal of hydrology, vol. 509, pp. 1–12.
Griggs, GB & Fulton-Bennett, KW 1987, ‘Failure of coastal protection at Seacliff
State Beach, Santa Cruz County, California, USA’, Environmental
Management, vol. 11, no. 2, pp. 175–182.
Haas, KA & Hanes, DM 2004, ‘Process Based Modeling of Total Longshore
Sediment Transport’, Journal of Coastal Research, vol. 20, no. 3, pp. 853–
861.
Hanley, ME, Hoggart, SPG, Simmonds, DJ, Bichot, A, Colangelo, MA, Bozzeda, F,
Heurtefeux, H, Ondiviela, B, Ostrowski, R, Recio, M, Trude, R, Zawadzka-
Kahlau, E & Thompson, RC 2014, ‘Shifting sands? Coastal protection by
sand banks, beaches and dunes’, Coastal Engineering, vol. 87, pp. 136–146.
Harper, BA 2013, Guidelines for Responding to the Effects of Climate Change in
Coastal and Ocean Engineering, 3rd., Engineers Australia and National
Committee on Coastal and Ocean Engineering, Barton ACT, Australia.
187
Harris, PT & Heap, AD 2003, ‘Environmental management of clastic coastal
depositional environments: inferences from an Australian geomorphic
database’, Ocean & Coastal Management, vol. 46, no. 5, pp. 457–478.
Harvey, N & Caton, B 2010, Coastal Management in Australia, University of
Adelaide Press, Adelaide.
Harvey, N & Woodroffe, CD 2008, ‘Australian approaches to coastal vulnerability
assessment’, Sustainability Science, vol. 3, no. 1, pp. 67–87.
Haskin, LA & Paster, TP 1984, ‘Geochemistry and mineralogy of the rare earths’, in
KA Gschneidner, Jr. & L Eyring (eds), Handbook on the Physiscs and
Chemistry of Rare Earths, North-Holland Physics Publishing, pp. 1–80.
Haslett, SK, Bryant, EA & Curr, RHF 2000, ‘Tracing Beach Sand Provenance and
Transport using Foraminifera: Preliminary Examples from Northwest Europe
and Southeast Australia’, in DL Foster (ed.), Tracers in Geomorphology,
Wiley, pp. 437–452.
Hill, HW, Kelley, JT, Belknap, DF & Dickson, SM 2004, ‘The effects of storms and
storm-generated currents on sand beaches in Southern Maine, USA’, Marine
Geology, vol. 210, pp. 149–168.
Hoatson, DM, Jaireth, S & Miezitis, Y 2011, The major rare-earth-element deposits
of Australia: geological setting, exploration, and resources, Geoscience
Australia.
Holland, SM 2008, ‘Non-Metric Multidimensional Scaling (MDS)’, Lecture notes,
University of Georgia, Athens, GA.
Hooke, JM 1999, ‘Decades of change: contributions of geomorphology to fluvial and
coastal engineering and management’, Geomorphology, vol. 31, no. 1, pp.
373–389.
Hulscher, SJMH 1996, ‘Tidal-induced large-scale regular bed form patterns in a
three-dimensional shallow water model’, Journal of Geophysical Research:
Oceans, vol. 101, no. C9, pp. 20727–20744.
Idier, D, Romieu, E, Pedreros, R & Oliveros, C 2010, ‘A simple method to analyse
non-cohesive sediment mobility in coastal environment’, Continental Shelf
Research, vol. 30, no. 3–4, pp. 365–377.
Ingersoll, RV, Bullard, TF, Ford, RL, Grimm, JP, Pickle, JD & Sares, SW 1984,
‘The effect of grain size on detrital modes: A test of the Gazzi-Dickinson
point-counting method’, Journal of Sedimentary Petrology, vol. 54, no. 1, pp.
0103–0116.
INPEX Browse, Ltd. 2011, Ichthys Gas Field Development Project: supplement to
the draft environmental impact statement, Report prepared by INPEX
Browse, Ltd., Western Australia, for the Commonwealth Government,
Canberra, ACT, and the Northern Territory Government, Darwin, Northern
Territory, Perth, Western Australia.
188
Irvine, RDG 2014, ‘The Happisburgh footprints in time: Environmental change and
human adaptation on the East Anglian coast’, Anthropology Today, vol. 30,
no. 2, pp. 3–6.
Ishikawa, T, Uda, T & San-nami, T 2015, ‘Evaluation of Sand Supply from Coral
Reef - Example of Carbonate Beachesnear Point Kin in Okinawa’, Procedia
Engineering, vol. 116, pp. 470–477.
James, SC, Jones, CA, Grace, MD & Roberts, JD 2010, ‘Advances in sediment
transport modelling’, Journal of Hydraulic Research, vol. 48, no. 6, pp. 754–
763.
Jenkins, PA, Duck, RW & Rowan, J 2005, ‘Fluvial contribution to the sediment
budget of the Tay Estuary, Scotland, assessed using mineral magnetic
fingerprinting’, in DE Walling & AJ Horowitz (eds), Sediment Budgets 1,
IAHS Press, Wallingford, pp. 134–140.
Jones, G, Baban, S & Pathirana, S 2008, Coastal Erosion Issues in the East Point
and Nightcliff areas of Darwin, Southern Cross University, Lismore NSW,
prepared for Darwin City Council.
Kafle, SK & Murshed, Z 2006, Community-based disaster risk management for local
authorities, Asian Disaster Preparedness Center (ADPC), Thailand.
Kaminsky, GM, Buijsman, MC, Gelfenbaum, G, Ruggiero, P, Jol, HM, Gibbs, AE &
Peterson, CD 1999, ‘Synthesizing Geological Observations and Processes–
Response Data for Modeling Coastal Change at Management Scale’, Coastal
Sediments 99, ASCE, pp. 1660–1675.
Kamphuis, JW 2006, ‘Coastal engineering—quo vadis?’, Coastal engineering, vol.
53, no. 2, pp. 133–140.
Kamphuis, JW 2000, Introduction to coastal engineering and management, World
Scientific Press, Singapore.
Kamphuis, JW 2013, ‘Uncertainty, Research, Science and Engineering in Coastal
Dynamics’.
Kasper-Zubillaga, JJ, Armstrong-Altrin, JS, Carranza-Edwards, A, Morton-Bermea,
O & Cruz, RLS 2013, ‘Control in Beach and Dune Sands of the Gulf of
Mexico and the Role of Nearby Rivers’, International Journal of
Geosciences, vol. 04, no. 08, pp. 1157–1174.
Kay, R & Alder, J 2005, Coastal Planning and Management, 2nd ed, Taylor &
Francis, New York.
Keijsers, JGS, De Groot, AV & Riksen, MJPM 2015, ‘Vegetation and sedimentation
on coastal foredunes’, Geomorphology, vol. 228, pp. 723–734.
Kench, PS & Mann, T 2017, ‘Reef Island Evolution and Dynamics: Insight from the
Indian and Pacific Oceans and Perspectives for the Spermonde Archipelago’,
Frontiers in Marine Science, vol. 4, no. 145.
189
Kendall, CGSC & Skipwith, PAD 1969, ‘Holocene Shallow-Water Carbonate and
Evaporite Sediments of Khor al Bazam, Abu Dhabi, Southwest Persian Gulf’,
American Association of Petroleum Geologists Bulletin, vol. 53, no. 4, pp.
841–869.
Khadijeh, RES, Elias, SB, Wood, AK & Reza, AM 2009, ‘Rare earth elements
distribution in marine sediments of Malaysia coasts’, Journal of Rare Earths,
vol. 27, no. 6, pp. 1066–1071.
King, IP n.d., ‘History of RMA Modelling Suite’, History, viewed
<http://ikingrma.iinet.net.au/HISTORY-1.html>.
King, IP n.d., ‘Overview of the RMA Models’, viewed
<http://ikingrma.iinet.net.au/OVERVIEW.html>.
King, IP 2013, RMA-2, a Two Dimensional Finite Element Model for Flow in
Estuaries and Streams, Version 8.4T., Resource Modelling Associates,
Sydney, Australia.
King, IP 2015, RMA-11, a Three Dimensional Finite Element Model for Water
Quality in Estuaries and Streams, Version 9.0G., Resource Modelling
Associates, Sydney, Australia.
King, SE & Lester, JN 1995, ‘The value of salt marsh as a sea defence’, Marine
Pollution Bulletin, vol. 30, no. 3, pp. 180–189.
Kinhill Engineers 1999, Cullen Bay Waterfront Estate and Marine Project - Post-
dredging audit of Emery Point sandbar and Cullen Beach, Kinhill Pty Ltd.,
prepared for Thiess Contractors Pty. Ltd., Darwin.
Klemas, V 2013, ‘Airborne Remote Sensing of Coastal Features and Processes: An
Overview’, Journal of Coastal Research, vol. 29, no. 2, pp. 239–255.
Koch, EW, Barbier, EB, Siliman, BR, Reed, DJ, Perillo, GME, Hacker, SD, Granek,
EF, Primavera, JH, Muthiga, N, Polasky, S, Halpern, BS, Kennedy, CJ,
Kappel, CV & Wolanski, E 2009, ‘Non-linearity in ecosystem services:
temporal and spatial variability in coastal protection’, Frontiers in Ecology
and the Environment, vol. 7, no. 1, pp. 29–37.
Komar, PD 1976, Beach Processes and Sedimentation, Prentice-Hall, Inc.
Komar, PD 2011, ‘Coastal Erosion Processes and Impacts: The Consequences of
Earth’s Changing Climate and Human Modifications of the Environment’,
Treatise on Estuarine and Coastal Science, Academic Press, Waltham, pp.
285–308.
Kraatz, M 1992, ‘Coastal Management in the Northern Territory: A Perspective’, in I
Moffat & A Webb (eds), Conservation and Development Issues in Northern
Australia, North Australia Research Unit, Australian National University.
Kraatz, M & Letts, MA 1990, Coastal Degradation Survey: Gove and Cox
Peninsulas, Gunn Point, Darwin (update), Technical Memorandum, Land
190
Conservation Unit, Conservation Commission of the Northern Territory,
Darwin.
Krumbein, WC & Pettijohn, FJ 1938, Manual of Sedimentary Petrography,
Appleton-Century-Crofts, New York.
Lasagna, R, Montefalcone, M, Albertelli, G, Corradi, N, Ferrari, M, Morri, C &
Bianchi, CN 2011, ‘Much damage for little advantage: Field studies and
morphodynamic modelling highlight the environmental impact of an
apparently minor coastal mismanagement’, Estuarine, Coastal and Shelf
Science, vol. 94, no. 3, pp. 255–262.
Latief, H & Hadi, S 2007, ‘Protection from Tsunamis’, in S Braatz, S Fortuna, J
Broadhead & R Leslie (eds), Coastal protection in the aftermath of the Indian
Ocean tsunami: What role for forests and trees?, FAO Regional Office for
Asia and the Pacific, Khao Lak, Thailand, pp. 5–24.
Le Roux, JP 2005, ‘Grains in motion: A review’, Sedimentary Geology, vol. 178, no.
3–4, pp. 285–313.
Le Roux, JP & Rojas, EM 2007, ‘Sediment transport patterns determined from grain
size parameters: Overview and state of the art’, Sedimentary Geology, vol.
202, no. 3, pp. 473–488.
Lefeuvre, J-C & Bouchard, V 2002, ‘From a civil engineering project to an
ecological engineering project: An historical perspective from the Mont Saint
Michel bay (France)’, Ecological Engineering, vol. 18, no. 5, pp. 593–606.
Lercari, D & Defeo, O 2003, ‘Variation of a sandy beach macrobenthic community
along a human-induced environmental gradient’, Estuarine, Coastal and
Shelf Science, vol. 58S, pp. 17–24.
Letts, MA & Kraatz, M 1989, Darwin Coastal Erosion Survey, Land Conservation
Unit, Conservation Commission of the Northern Territory, Darwin.
Levoy, F, Anthony, EJ, Monfort, O, Robin, N & Bretel, P 2013, ‘Formation and
migration of transverse bars along a tidal sandy coast deduced from multi-
temporal Lidar datasets’, Marine Geology, vol. 342, pp. 39–52.
Lewis, SE, Sloss, CR, Murray-Wallace, CV, Woodroffe, CD & Smithers, SG 2013,
‘Post-glacial sea-level changes around the Australian margin: a review’,
Quaternary Science Reviews, vol. 74, pp. 115–138.
Li, L 2013, Modelling the Tidal and Sediment Dynamics in Darwin Harbour,
Northern Territory, Australia, PhD Thesis, University of New South Wales,
Canberra, A.C.T., Australia.
Li, L, Wang, XH, Andutta, F & Williams, D 2014, ‘Effects of mangroves and tidal
flats on suspended-sediment dynamics: Observational and numerical study of
Darwin Harbour, Australia’, Journal of Geophysical Research: Oceans, vol.
119, no. 9, pp. 5854–5873.
191
Li, L, Wang, XH, Sidhu, H & Williams, D 2011, ‘Modelling of three dimensional
tidal dynamics in Darwin Harbour, Australia’, Proceedings of the 15th
Biennial Computational Technique and Applications Conference, pp. C103–
C123.
Li, L, Wang, XH, Williams, D, Sidhu, H & Song, D 2012, ‘Numerical study of the
effects of mangrove areas and tidal flats on tides: A case study of Darwin
Harbour, Australia’, Journal of Geophysical Research-Oceans, vol. 117, no.
C6.
Liu, W-C, Hsu, M-H & Wang, C-F 2003, ‘Modeling of flow resistance in mangrove
swamp at mouth of tidal Keelung River, Taiwan’, Journal of waterway, port,
coastal, and ocean engineering, vol. 129, no. 2, pp. 86–92.
Liu, Y, Huang, H, Qiu, Z & Fan, J 2013, ‘Detecting coastline change from satellite
images based on beach slope estimation in a tidal flat’, International Journal
of Applied Earth Observation and Geoinformation, vol. 23, pp. 165–176.
Lopes, CL, Silva, PA, Dias, JM, Rocha, A, Picado, A, Plecha, S & Fortunato, AB
2011, ‘Local sea level change scenarios for the end of the 21st century and
potential physical impacts in the lower Ria de Aveiro (Portugal)’, Continental
Shelf Research, vol. 31, no. 14, pp. 1515–1526.
Luijendijk, A, Hagenaars, G, Ranasinghe, R, Baart, F, Donchyts, G & Aarninkhof, S
2018, ‘The State of the World’s Beaches’, Nature, vol. 8, no. 6641.
MacIver, BN & Hale, GP 1986, Laboratory Soils Testing. Change 2, U.S. Army
Corps of Engineer, Washington D.C.
MacWilliams, M, Ateljevich, E, G. Monismith, S & Enright, C 2016, ‘An Overview
of Multi-Dimensional Models of the Sacramento–San Joaquin Delta’, San
Francisco Estuary and Watershed Science, vol. 14, no. 4, Article 2.
Makarynskyy, O & Makarynska, D 2011, ‘Calculating bed shear stresses under
combined currents and waves in Darwin Harbour’, Proceedings of the 20th
Australasian Coastal and Ocean Engineering Conference and the 13th
Australasian Port and Harbour Conference, Engineers Australia, Barton,
A.C.T, pp. 452–457.
Manly Hydraulics Laboratory 2000, Mindil Beach Erosion Scoping Study, NSW
Department of Public Works and Services.
Manly Hydraulics Laboratory 1995, Regional Effluent Management Scheme,
Assessment of Impacts of Releasing Effluent to the Shoalhaven River, NSW
Department of Land and Water Conservation.
Maragos, JE, Baines, GBK & Beveridge, PJ 1973, ‘Tropical Cyclone Bebe Creates a
New Land Formation on Funafuti Atoll’, Science, vol. 181, no. 4105, pp.
1161–1164.
Marchand, M, Sanchez-Arcilla, A, Ferreira, M, Gault, J, Jiménez, JA, Markovic, M,
Mulder, J, van Rijn, L, Stănică, A, Sulisz, W & Sutherland, J 2011, ‘Concepts
192
and science for coastal erosion management – An introduction to the
Conscience framework’, Ocean & Coastal Management, vol. 54, no. 12, pp.
859–866.
Mariani, A, Flocard, F, Carley, JT, Drummond, C, Guerry, N, Gordon, AD, Cox, RJ
& Turner, IL 2013, East Coast Study Project – National Geomorphic
Framework for the Management and Prediction of Coastal Erosion, School
of Civil and Environmental Engineering, UNSW Australia, Manly Vale,
NSW.
Mashriqui, HS 2003, Hydrodynamic and sediment transport modeling of deltaic
sediment processes, PhD Thesis, Louisiana State University, Baton Rouge,
Louisiana, USA.
Masselink, G, Austin, M, Tinker, J, O’Hare, T & Russell, P 2008, ‘Cross-shore
sediment transport and morphological response on a macrotidal beach with
intertidal bar morphology, Truc Vert, France’, Marine Geology, vol. 251, no.
3–4, pp. 141–155.
Mauraud, N 2013, Darwin Harbour Water Quality: Supplement to the 2013 Darwin
Harbour Region Report Cars, Aquatic Health Unit, Water Resources
Division, Darwin.
McGuinness, KA 2003, ‘The mangrove forests of Darwin Harbour: a review of
research on the flora and invertebrate fauna’, in Working Group for the
Darwin Harbour Advisory Committee (ed.), Darwin Harbour Region:
Current Knowledge and Future Needs, Department of Industry, Planning and
Environment, Darwin, Department of Infrastructure, Planning and
Environment, Darwin, pp. 19–36.
McKinnon, AD, Smit, N, Townsend, S & Duggan, S 2006, ‘Darwin Harbour: water
quality and ecosystem structure in a tropical harbour in the early stages of
urban development’, in E Wolanski (ed.), The Environment in Asia Pacific
Harbours, Springer, pp. 433–460.
McLaren, P & Bowles, D 1985, ‘The effects of sediment transport on grain-size
distributions’, Journal of Sedimentary Petrology, vol. 55, no. 4, pp. 0457–
0470.
McLennan, SM 2001, ‘Relationships between the trace element composition of
sedimentary rocks and upper continental crust’, Geochemistry, Geophysics,
Geosystems, vol. 2, no. 4.
Michie, MG 1987a, ‘Distribution of Foraminifera in a macrotidal tropical estuary:
Port Darwin, Northern Territory of Australia’, Marine and Freshwater
Research, vol. 38, no. 2, pp. 249–259.
Michie, MG 1987b, ‘Sediments, Sedimentary Environments and Palaeoenvironments
in Port Darwin’, in HK Larson, MG Michie & ME Hanley (eds),
‘Proceedings of a Workshop on Research and Management’, Northern
Territory Branch of the Australian Marine Sciences Association and the
193
North Australia Research Unit of the Australian National University, Darwin,
pp. 32–41.
Millennium Ecosystem Assessment 2005, Ecosystems and Human Well-being:
Synthesis, Island Press, Washington, DC.
Miloshis, M & Valentine, EM 2011, ‘Sediment transport modelling in a tropical river
system’, 34th IAHR World Congress, 33rd Hydrology & Water Symposium,
10th Hydraulic Conference, Brisbane, Australia.
Montaggioni, LF, Salvat, B, Aubanel, A, Eisenhauer, A & Martin-Garin, B 2018,
‘The mode and timing of windward reef-island accretion in relation with
Holocene sea-level change: A case study from Takapoto Atoll, French
Polynesia’, Geomorphology, vol. 318, pp. 320–335.
Morelissen, R, van der Kaaij, T & Bleninger, T 2013, ‘Dynamic coupling of near
field and far field models for simulating effluent discharges’, Water Science
and Technology: A Journal of the International Association on Water
Pollution Research, vol. 67, no. 10, pp. 2210–2220.
Morton, RA & Sallenger Jr, AH 2003, ‘Morphological Impacts of Extreme Storms
on Sandy Beaches and Barriers’, Journal of Coastal Research, vol. 19, no. 3,
pp. 560–573.
Mudd, GM & Jowitt, SM 2016, ‘Rare earth elements from heavy mineral sands:
assessing the potential of a forgotten resource’, Applied Earth Science, vol.
125, no. 3, pp. 107–113.
Mulder, JPM, Hommes, S & Horstman, EM 2011, ‘Implementation of coastal
erosion management in the Netherlands’, Ocean & Coastal Management, vol.
54, no. 12, pp. 888–897.
Munksgaard, NC, Kaestli, M, Gibb, K, Dostine, P & Townsend, S 2013, Darwin
Harbour Baseline Sediment Survey 2012, Charles Darwin University and
Aquatic Health Unit, Northern Territory Department of Land Resource
Management, Darwin.
Munksgaard, NC, Lim, K & Parry, DL 2003, ‘Rare earth elements as provenance
indicators in North Australian estuarine and coastal marine sediments’,
Estuarine, Coastal and Shelf Science, vol. 57, no. 3, pp. 399–409.
Nagarajan, R, Madhavaraju, J, Nagendra, R, Armstrong-Altrin, JS & Moutte, J 2007,
‘Geochemistry of Neoproterozoic shales of the Rabanpalli Formation, Bhima
Basin, Northern Karnataka, southern India: implications for provenance and
paleoredox conditions’, Revista Mexicana de Ciencias Geológicas, vol. 24,
no. 2, pp. 150–160.
Naidu, KB, Reddy, KSN, Sekhar, CR, Rao, PG & Krishna, KM 2016, ‘REE
geochemistry of monazites from coastal sands between Bhimunipatnam and
Konada, Andhra Pradesh, East coast of India’, Current Science, vol. 110, no.
8, pp. 1550–1559.
194
Nawaz, M 2010, Sediment Sources near the Extreme Ends of the Catchment
Continuum and the Topographic Dependence of Denudation in a Global
Context, PhD Thesis, Charles Darwin University, Darwin, Northern Territory.
NCCARF 2016, Adaptation options for coastal environments: planning, National
Climate Change Adaptation Research Facility, Gold Coast.
Nel, R, Campbell, EE, Harris, L, Hauser, L, Schoeman, DS, McLachlan, A, du Preez,
DR, Bezuidenhout, K & Schlacher, TA 2014, ‘The status of sandy beach
science: Past trends, progress, and possible futures’, Estuarine, Coastal and
Shelf Science, vol. 150, Part A, pp. 1–10.
Nicholls, RJ, Wong, PP, Burkett, V, Codignotto, J, Hay, J, McLean, R, Ragoonaden,
S & Woodroffe, CD 2007, ‘Coastal systems and low-lying areas’, in ML
Parry, OF Canziani, JP Palutikof, PJ Van der Linden & CE Hanson (eds),
Climate Change 2007: Impacts, Adaptation and Vulnerability. Contribution
of Working Group II to the Fourth Assessment Report of the
Intergovernmental Panel on Climate Change, Cambridge University Press,
Cambridge, UK, pp. 315–356.
Nielsen, AF, Kluss, T, Hughes, CE, Sojisuporn, P, Chueinta, S & Adamanditis, CA
2001, ‘Field Verification of Formulations for Sand Transport under Wave and
Current Action’, Proceedings of the 15th Australasian Coastal and Ocean
Engineering Conference, the 8th Australasian Port and Harbour Conference,
Institution of Engineers Australia, Barton, A.C.T, pp. 481–486.
Niesing, H 2005, ‘EUROSION: Coastal erosion measures, knowledge and results
acquired through 60 studies’, in JL Herrier, J Mees, A Salman, J Seys, H Van
Nieuwenhuyse & I Dobbelaere (eds), Dunes and Estuaries 2005, VLIZ,
Koksijde, Belgium, pp. 421–431.
Nordstrom, KF 2014, ‘Living with shore protection structures: A review’, Estuarine,
Coastal and Shelf Science, vol. 150, Part A, pp. 11–23.
Northern Territory Environment Protection Authority 2014, A Stormwater Strategy
for the Darwin Harbour Region, NT EPA, Darwin.
Norton, WR & King, IP 1977, Operating Instructions for the Computer Program
RMA-2V, Resource Management Associates, Lafayette, CA.
Nott, J 1994, ‘The Influence of Deep Weathering on Coastal Landscape and
Landform Development in the Monsoonal Tropics of Northern Australia’,
The Journal of Geology, vol. 102, no. 5, pp. 509–522.
Nott, J 2003, ‘The urban geology of Darwin, Australia’, Quaternary International,
vol. 103, pp. 83–90.
Nutt, C, Gozzard, B & Eliot, I 2009, ‘Western Australian Coastal Compartments
Mapping Project 2008/2009’, Presentation to the WALIS Marine Group.
Oliveira, S, Moura, D, Horta, J, Nascimento, A, Gomes, A & Veiga-Pires, C 2017,
‘The morphosedimentary behaviour of a headland–beach system: Quantifying
195
sediment transport using fluorescent tracers’, Marine Geology, vol. 388, pp.
62–73.
Osborne, JW & Overbay, A 2004, ‘The Power of Outliers (and Why Researches
Should Always Check for Them)’, Practical Assessment, Research, and
Evaluation, vol. 9, no. 6, pp. 1–8.
Ouillon, S 2018, ‘Why and How Do We Study Sediment Transport? Focus on
Coastal Zones and Ongoing Methods’, Water, vol. 10, no. 390.
Owens, PN, Blake, WH, Gaspar, L, Gateuille, D, Koiter, AJ, Lobb, DA, Petticrew,
EL, Raiffarth, D, Smith, HG & Woodward, JC 2016, ‘Fingerprinting and
tracing the sources of soils and sediments: earth and ocean sciences,
geoarchaeological, forensic and human health applications’, Earth Science
Reviews, vol. 162, pp. 1–23.
Padovan, A 2003, ‘Darwin Harbour water and sediment quality’, in Working Group
for the Darwin Harbour Advisory Committee (ed.), ‘Proceedings: Darwin
Harbour Region: Current knowledge and future needs’, Department of
Infrastructure, Planning and Environment, Darwin, pp. 5–17.
Padovan, A 2001, The quality of run-off and contaminant loads to Darwin Harbour,
Department of Infrastructure, Planning and Environment, Natural Resources
Division.
Padovan, A, Munksgaard, N, Alvarez, B, McGuinness, K, Parry, D & Gibb, K 2012,
‘Trace metal concentrations in the tropical sponge Spheciospongia vagabunda
at a sewage outfall: synchrotron X-ray imaging reveals the micron-scale
distribution of accumulated metals’, Hydrobiologia, vol. 687, no. 1, pp. 275–
288.
Pankow, VR 1988, San Francisco Bay: Modeling System for Dredged Material
Disposal and Hydraulic Transport, Technical Report, U.S. Army Engineer
Waterways Experiment Station, Hydraulics Laboratory, Vicksburg, MS
39180-0631.
Papanicolaou, AN, Elhakeem, M, Krallis, G, Prakash, S & Edinger, J 2008,
‘Sediment Transport Modeling Review – Current and Future Development’,
Journal of Hydraulic Engineering, vol. 134, pp. 1–14.
Parry, DL & Munksgaard, NC 1997, Heavy metals, arsenic and grainsize analysis of
surface sediments collected July 1993 from Darwin Harbour, Northern
Territory, Australia, Unpublished report, Northern Territory University,
Darwin.
Patch, K & Griggs, G 2006, Littoral Cells, Sand Budgets, and Beaches:
Understanding California’s Shoreline, Institute of Marine Sciences,
University of California, Santa Cruz.
Patterson, RG 2014, Upper Darwin Harbour Dye Study Palmerston Outfall,
Bachelor of Engineering Thesis, Charles Darwin University, Darwin.
196
Patterson, RG & Valentine, EM 2011, ‘A Field Study for Calibration of a Water
Quality Model for Darwin Harbour’, 34th IAHR World Congress, 33rd
Hydrology & Water Symposium, 10th Hydraulic Conference, Brisbane,
Australia.
Patterson, RG & Williams, DK 2013a, Hydrodynamic and wave modelling of a
proposed multi-user barge facility at East Arm, Darwin Harbour, Australian
Institute of Marine Science, Darwin.
Patterson, RG & Williams, DK 2013b, Proposed Marine Industry Park Modelling
Report. Task 1 - Dredge channel and shoreline development, Australian
Institute of Marine Science, Darwin.
Pease, PP & Tchakerian, VP 2003, ‘Geochemistry of sediments from Quaternary
sand ramps in the southeastern Mojave Desert, California’, Quaternary
International, vol. 104, pp. 19–29.
Pedreros, R, Howa, HL & Michel, D 1996, ‘Application of grain size trend analysis
for the determination of sediment transport pathways in intertidal areas’,
Marine Geology, vol. 135, no. 1–4, pp. 35–49.
Pell, SD, Chivas, AR & Williams, IS 2001, ‘The Mallee Dunefield: development and
sand provenance’, Journal of Arid Environments, vol. 48, pp. 149–170.
Pethick, J 1984, An Introduction to Coastal Geomorphology, Edward Arnold, UK.
Pettijohn, FJ 1954, ‘Classification of Sandstones’, The Journal of Geology, vol. 62,
no. 4, pp. 360–365.
Pietsch, BA 1986, Bynoe 5072, Northern Territory Geological Survey, Department
of Mines and Energy, Darwin, Australia.
Pietsch, BA 1983, Darwin 5073, Northern Territory Geological Survey, Department
of Mines and Energy, Darwin.
Pietsch, BA & Stuart-Smith, PG 1988, Darwin SD52-4, Northern Territory
Geological Survey, Department of Mines and Energy, Darwin, Australia.
Pilkey, OH, Neal, WJ, Kelley, JT & Cooper, JAG 2011, The World’s Beaches: A
Global Guide to the Science of the Shoreline, University of California Press,
Berkeley, CA, USA.
Pinto, L, Fortunato, AB & Freire, P 2006, ‘Sensitivity analysis of non-cohesive
sediment transport formulae’, Continental Shelf Research, vol. 26, pp. 1826–
1839.
Piper, DZ 1974, ‘Rare earth elements in the sedimentary cycle: A summary’,
Chemical Geology, vol. 14, no. 4, pp. 285–304.
Porter-Smith, R, Harris, PT, Andersen, OB, Coleman, R, Greenslade, D & Jenkins,
CJ 2004, ‘Classification of the Australian continental shelf based on predicted
197
sediment threshold exceedance from tidal currents and swell waves’, Marine
Geology, vol. 211, pp. 1–20.
Prego, R, Caetano, M, Bernárdez, P, Brito, P, Ospina-Alvarez, N & Vale, C 2012,
‘Rare earth elements in coastal sediments of the northern Galician shelf:
Influence of geological features’, Continental Shelf Research, vol. 35, pp. 75–
85.
Proudfoot, M, Valentine, EM, Evans, KG & King, I 2018, ‘Calibration of a Marsh-
Porosity Finite Element Model: Case Study from a Macrotidal Creek and
Floodplain in Northern Australia’, Journal of Hydraulic Engineering, vol.
144, no. 2.
Pyökäri, M 1997, ‘The provenance of beach sediments on Rhodes, southeastern
Greece, indicated by sediment texture, composition and roundness’,
Geomorphology, vol. 18, no. 3–4, pp. 315–332.
Radke, L, Smit, N, Li, J, Nicholas, T & Picard, K 2017, Outer Darwin Harbour
Shallow Water Sediment Survey 2016:GA0356, Post-survey report,
Geoscience Australia, Canberra.
Rao, W, Mao, C, Wang, Y, Huang, H & Junfeng, J 2017, ‘Using Nd-Sr isotopes and
rare earth elements to study sediment provenance of the modern radial sand
ridges in the southwestern Yellow Sea’, Applied Geochemistry, vol. 81, pp.
23–35.
Reeve, D, Chadwick, AB & Fleming, C 2004, Coastal Engineering: Processes,
theory and design practice, Spon Press.
Reinders, J & Van Wesenbeeck, B (eds) 2013, ‘Eco-engineering in the Netherlands:
Soft interventions with solid impact’, Rijkswaterstaat, Deltares and
EcoShape.
Resource Management Associates 2005, RMA Delta Model Calibration Report:
Flooded Islands Pre-Feasibility Study, California Department of Water
Resources for California Bay-Delta Authority, Sacramento, CA, USA.
Ribberink, JS & Al-Salem, AA 1995, ‘Sheet flow and suspension of sand in
oscillatory boundary layers’, Coastal Engineering, vol. 25, no. 3–4, pp. 205–
225.
Richards & Fogarty 1978, Darwin Coastal Erosion Survey, Land Conservation
Section; Forestry, Fisheries and Land Conservation Branch, Darwin.
Roberts, S 2006, ‘The National Academies Report on Mitigating Shore Erosion
along Sheltered Coasts’, in SY Erdle, JLD Davis & KG Sellner (eds),
Management, Policy, Science, and Engineering of Nonstructural Erosion
Control in the Chesapeake Bay, Chesapeake Research Consortium,
Williamsburg, Virginia, USA.
Roizenblit, A, Wyllie, S & King, IP 1997, ‘Mathematical Modelling of the Lower
Mary River, NT, Australia’, Pacific Coasts and Ports ’97: Proceedings of the
198
13th Australasian Coastal and Ocean Engineering Conference and the 6th
Australasian Port and Harbour Conference, Volume 1., Christchurch, N.Z.,
pp. 48–53.
Rosati, JD, Walton, TL & Bodge, K 2002, Longshore Sediment Transport, U.S.
Army Corps of Engineers, Washington D.C.
Rosenbauer, RJ, Foxgrover, AC, Hein, JR & Swarzenski, PW 2013, ‘A Sr–Nd
isotopic study of sand-sized sediment provenance and transport for the San
Francisco Bay coastal system’, Marine Geology, vol. 345, pp. 143–153.
Rotman, R, Naylor, L, McDonnel, R & MacNiocaill, C 2008, ‘Sediment transport on
the Freiston Shore managed realignment site: An investigation using
environmental magnetism’, Geomorphology, vol. 100, no. 3–4, pp. 241–255.
Roy, PS, Williams, RJ, Jones, AR, Yassini, I, Gibbs, PJ, Coates, B, West, RJ,
Scanes, PR, Hudson, JP & Nichol, S 2001, ‘Structure and Function of South-
east Australian Estuaries’, Estuarine, Coastal and Shelf Science, vol. 53, pp.
351–384.
Ruessink, BG, Kuriyama, Y, Reniers, AJH., Roelvink, JA & Walstra, DJR 2007,
‘Modeling cross-shore sandbar behavior on the timescale of weeks’, Journal
of Geophysical Research, vol. 112, no. F03010.
Rupprecht, F, Möller, I, Paul, M, Kudella, M, Spencer, T, Van Wesenbeeck, BK,
Wolters, G, Jensen, K, Bouma, TJ, Miranda-Lange, M & Schimmels, S 2017,
‘Vegetation-wave interactions in salt marshes under storm surge conditions’,
Ecological Engineering, vol. 100, pp. 301–315.
Ryan, DA, Brooke, BP, Bostock, HC, Radke, LC, Siwabessy, PJW, Margvelashvili,
N & Skene, D 2007, ‘Bedload sediment transport dynamics in a macrotidal
embayment, and implications for export to the southern Great Barrier Reef
shelf’, Marine Geology, vol. 240, pp. 197–215.
Saleh, F & Weinstein, MP 2016, ‘The role of nature-based infrastructure (NBI) in
coastal resiliency planning: A literature review’, Journal of Environmental
Management, vol. 183, pp. 1088–1098.
Salman, A, Lombardo, S & Doody, P 2004a, Part I: Major Findings and Policy
Recommendations of the EUROSION project, Office for Official Publications
of the European Communities, Luxembourg.
Salman, A, Lombardo, S & Doody, P 2004b, Part IV: A guide to coastal erosion
management practices in Europe: Lessons Learned, Office for Official
Publications of the European Communities, Luxembourg.
Sammut, S, Gauci, R, Drago, A, Gauci, A & Azzopardi, J 2017, ‘Pocket beach
sediment: A field investigation of the geodynamic processes of coarse-clastic
beaches on the Maltese Islands (Central Mediterranean)’, Marine Geology,
vol. 387, pp. 58–73.
199
Sánchez-Arcilla, A, Jiménez, JA & Marchand, M 2011, ‘Managing coastal evolution
in a more sustainable manner. The Conscience approach’, Ocean & Coastal
Management, vol. 54, no. 12, pp. 951–955.
Sanderson, PG & Eliot, I 1999, ‘Compartmentalisation of beachface sediments along
the southwestern coast of Australia.’, Marine Geology, vol. 162, pp. 145–164.
Sanò, M, Jiménez, JA, Medina, R, Stanica, A, Sanchez-Arcilla, A & Trumbic, I
2011, ‘The role of coastal setbacks in the context of coastal erosion and
climate change’, Ocean & Coastal Management, vol. 54, no. 12, pp. 943–
950.
Sanò, M, Marchand, M & Lescinski, J 2010, On the use of setback lines for coastal
protection in Europe and the Mediterranean: Practice, problems and
perspectives, European Commission, 30p., the Netherlands.
Santos, IR, Fávaro, DIT, Schaefer, CEGR & Silva-Filho, EV 2007, ‘Sediment
geochemistry in coastal maritime Antarctica (Admiralty Bay, King George
Island): Evidence from rare earths and other elements’, Marine Chemistry,
vol. 107, no. 4, pp. 464–474.
Schipp, D & Palin, M 2016, ‘Is the Australian dream of a beachfront home really
worth it?’, News.com.au, 8 June 2016.
Schneider, S, Hornung, J, Hinderer, M & Garzanti, E 2016, ‘Petrography and
geochemistry of modern river sediments in an equatorial environment
(Rwenzori Mountains and Albertine rift, Uganda) — Implications for
weathering and provenance’, Sedimentary Geology, vol. 336, pp. 106–119.
Schoonees, JS & Theron, AK 1995, ‘Evaluation of 10 cross-shore sediment
transport/morphological models’, Coastal Engineering, vol. 25, no. 1–2, pp.
1–41.
Scoffin, TP & Stoddart, DR 1983, ‘Beachrock and intertidal cements’, in AS Goudie
& K Pye (eds), Chemical Sediments and Geomorphology: Precipitates and
Residua in the Near-surface Environment, 1st edn., Academic Press Inc., p.
439.
Selegean, J, Nairn, R, Dahl, T & Creech, C 2010, ‘Building a better understanding of
sediment issues through the application of a long-term fluvial and littoral
sediment budget’, The 2nd Joint Federal Interagency Conference, Las vegas,
NV, USA.
Sénéchal, N, Gouriou, T, Castelle, B, Parisot, J-P, Capo, S, Bujan, S & Howa, H
2009, ‘Morphodynamic response of a meso- to macro-tidal intermediate
beach based on a long-term data set’, Geomorphology, vol. 107, no. 3–4, pp.
263–274.
Shanehsazzadeh, A & Parsa, R 2013, ‘Overview of multi-level study on coastal
processes and shoreline evolution at Northern Persian Gulf and Oman Sea’,
Ocean & Coastal Management, vol. 84, pp. 163–173.
200
Shepard, FP & Young, R 1961, ‘Distinguishing between Beach and Dune Sands’,
Journal of Sedimentary Petrology, vol. 31, no. 2, pp. 196–214.
Sholkovitz, ER, Landing, WM & Lewis, BL 1994, ‘Ocean particle chemistry: the
fractionation of rare earth elements between suspended particles and
seawater’, Geochimica et Cosmochimica Acta, vol. 58, no. 6, pp. 1567–1579.
Short, AD & Jackson, DWT 2013, ‘Beach Morphodynamics’, in JF Shroder (ed.),
Treatise on Geomorphology, Academic Press, Elsevier Inc., San Diego, pp.
106–129.
Siever, R 1988, Sand, Scientific American Library, New York.
Silva, PA, Bertin, X, Fortunato, AB & Oliveira, A 2009, ‘Intercomparison of
Sediment Transport Formulas in Current and Combined Wave-Current
Conditions’, Journal of Coastal Research, pp. 559–563.
Singh, P 2010, ‘Geochemistry and provenance of stream sediments of the Ganga
River and its major tributaries in the Himalayan region, India’, Chemical
Geology, vol. 269, no. 3–4, pp. 220–236.
Singh, P 2009, ‘Major, trace and REE geochemistry of the Ganga River sediments:
Influence of provenance and sedimentary processes’, Chemical Geology, vol.
266, no. 3–4, pp. 242–255.
Siwabessy, PJW, Smit, N, Atkinson, I, Dando, N, Harries, S, Howard, FJF, Li, J,
Nicholas, WA, Picard, K, Radke, LC, Tran, M, Williams, D & Whiteway, T
2017, Bynoe Harbour Marine Survey 2016: GA4452/SOL6432, Post-survey
report, Geoscience Australia, Canberra.
Siwabessy, PJW, Smit, N, Atkinson, I, Dando, N, Harries, S, Howard, FJF, Li, J,
Nicholas, WA, Potter, A, Radke, LC, Tran, M, Williams, D & Whiteway, T
2016, Outer Darwin Harbour marine Survey 2015: GA0351/SOL6187 - post
survey report, Geoscience Australia, Canberra.
Siwabessy, PJW, Tran, M, Picard, K, Brooke, BP, Huang, Z, Smit, N, Williams, DK,
Nicholas, WA, Nichol, SL & Atkinson, I 2018, ‘Modelling the distribution of
hard seabed using calibrated multibeam acoustic backscatter data in a
tropical, macrotidal embayment: Darwin Harbour, Australia’, Marine
Geophysical Research, vol. 39, no. 1, pp. 249–269.
Skinner, L, Townsend, SA, Fortune, J & Territory, N 2009, The impact of urban
land-use on total pollutant loads entering Darwin Harbour, Department
Natural Resources, Environment, the Arts and Sport.
Slaymaker, O 2003, ‘The sediment budget as conceptual framework and
management tool’, Hydrobiologia, vol. 494, pp. 71–82.
Smit, N 2009, Dredging of Sand from Darwin Harbour, Hydrographic and Marine
Life Part 2: Benthic Survey, Marine biodiversity Group, Department of
Natural Resources Environments and the Arts, Darwin.
201
Smit, N 2003, ‘Marine invertebrate life in the Darwin Harbour region and
management implications’, in Working Group for the Darwin Harbour
Advisory Committee (ed.), ‘Proceedings: Darwin Harbour Region: Current
knowledge and future needs’, Department of Infrastructure, Planning and
Environment, Darwin, pp. 37–64.
Smit, N, Billyard, R & Ferns, L 2000, Beagle Gulf Benthic Survey: Characterisation
of soft substrates, Technical Report, Parks and Wildlife Commission of the
Northern Territory, Palmerston, NT.
Smith, JM 2003, ‘Surf Zone Hydrodynamics’, Coastal Engineering Manual, Coastal
Hydraulics Laboratory, Engineer Research and Development Center (CHL),
U.S. Army Corps of Engineers, Vicksburg, Mississippi.
Smith, S 2010, Coastal Erosion and Sea Level Rise, Briefing Paper, NSW
Parliamentary Library, Research Service.
Sorensen, C, Dronen, NK, Knudsen, P, Jensen, J & Sorensen, P 2016, ‘An Extreme
Event as a Game Changer in Coastal Erosion Management’, Journal of
Coastal Research, pp. 700–704.
Sorensen, RM 1978, Basic Coastal Engineering, John Wiley & Sons, Inc.
Soulsby, R 1997, Dynamics of marine sands, Thomas Telford Publications, London,
UK.
Sridhar, PN, Ramana, IV, Ali, MM & Veeranarayana, B 2008, ‘Understanding the
suspended sediment dynamics in the coastal waters of the Bay of Bengal
using high resolution ocean colour data’, Current Science, vol. 94, no. 11, pp.
1499–1502.
Stark, J, Plancke, Y, Ides, S, Meire, P & Temmerman, S 2016, ‘Coastal flood
protection by a combined nature-based and engineering approach: Modeling
the effects of marsh geometry and surrounding dikes’, Estuarine, Coastal and
Shelf Science, vol. 175, pp. 34–45.
Stive, MJF, de Schipper, MA, Luijendijk, AP, Aarninkhof, SGJ, van Gelder-Maas,
C, van Thiel de Vries, JSM, de Vries, S, Henriquez, M, Marx, S &
Ranasinghe, R 2013, ‘A New Alternative to Saving Our Beaches from Sea-
Level Rise: The Sand Engine’, Journal of Coastal Research, vol. 290, pp.
1001–1008.
Stive, MJF & de Vriend, HJ 1995, ‘Modelling shoreface profile evolution’, Marine
Geology, vol. 126, pp. 235–248.
Sverdrup, HU, Johnson, MW & Fleming, RH 1942, The Oceans: Their physics,
chemistry, and general biology, Prentice-Hall, New York.
Taillier, S 2016, ‘Coastal erosion claiming one metre of land from Geraldton beach
every year, study reveals’, ABC News, 6 March 2016.
202
Takesue, RK, Bothner, MH & Reynolds, RL 2009, ‘Sources of land-derived runoff
to a coral reef-fringed embayment identified using geochemical tracers in
nearshore sediment traps’, Estuarine, Coastal and Shelf Science, vol. 85, pp.
459–471.
Taylor, SR & McLennan, SM 1985, The Continental Crust: Its Composition and
Evolution, Blackwell Scientific Publications, United States.
Templ, M, Filzmoser, P & Reimann, C 2008, ‘Cluster analysis applied to regional
geochemical data: Problems and possibilities’, Applied Geochemistry, vol.
23, no. 8, pp. 2198–2213.
Thom, B 2015, ‘Coastal Compartments Project: summary for policy makers’,
Department of Environment
http://www.environment.gov.au/system/files/resources/4f288459-423f-43bb-
8c20-87f91adc3e8e/files/coastal-compartments-project.pdf.
Thom, B 2014, ‘Coastal Morphodynamics and Policy: What are the Links?’, 23rd
NSW Coastal Conference, 23rd NSW Coastal Conference, Ulladulla, NSW,
Australia, p. 5.
Thom, B & Lazarow, N 2006, ‘Environmental History and Decision-making’, in N
Lazarow, R Souter, R Fearon & S Dovers (eds), Coastal management in
Australia: Key institutional and governance issues for coastal natural
resource management and planning, CRC for Coastal Zone, Estuary and
Waterway Management, Indooroopilly, Qld. Australia, pp. 117–124.
Thom, BG, Eliot, I, Eliot, M, Harvey, N, Rissik, D, Sharples, C, Short, AD &
Woodroffe, CD 2018, ‘National sediment compartment framework for
Australian coastal management’, Ocean & Coastal Management, vol. 154,
pp. 103–120.
Thomas, WA & McAnally, Jr., WH 1985, User’s Manual for the Generalized
Computer Program System: Open-Channel Flow and Sedimentation TABS-2,
Final Report, U.S. Army Engineer Waterways Experiment Station,
Hydraulics Laboratory, 671p., Vicksburg, MS 39180-0631.
Toimil, A, Losada, IJ, Camus, P & Díaz-Simal, P 2017, ‘Managing coastal erosion
under climate change at the regional scale’, Coastal Engineering, vol. 128,
pp. 106–122.
Tonyes, SG, Wasson, RJ, Munksgaard, NC, Evans, K., Brinkman, R & Williams,
DK 2017, ‘Understanding coastal processes to assist with coastal erosion
management in Darwin Harbour, Northern Territory, Australia’, IOP
Conference Series: Earth and Environmental Sciences 55, Bali, Indonesia.
Tonyes, SG, Wasson, RJ, Munksgaard, NC, Evans, KG, Brinkman, R & Williams,
DK 2015, ‘Sand Dynamics as a Tool for Coastal Erosion Management: A
Case Study in Darwin Harbour, Northern Territory, Australia’, Procedia
Engineering, vol. 125, pp. 220–228.
203
Trujillo, AP & Thurman, HV 2008, Essentials of Oceanography, 9th edn., Pearson
Prentice Hall.
Turner, IL, Aarninkhof, SGJ & Holman, RA 2006, ‘Coastal Imaging Applications
and Research in Australia’, Journal of Coastal Research, vol. 22, no. 1, pp.
37–48.
Turner, IL, Goodwin, ID, Davidson, MA, Short, AD, Pritchard, TR, Lane, C,
Cameron, DW, MacDonald, T, Middleton, J & Splinter, KD 2011, ‘Planning
for an Australian National Coastal Observatory: monitoring and forecasting
coastal erosion in a changing climate’.
UNEP 2006, Marine and coastal ecosystems and human well-being: A synthesis
report based on the findings of the Millennium Ecosystem Assessment, UNEP
World Conservation Monitoring Centre, Cambridge, UK.
UNEP-WCMC 2006, In the front line: shoreline protection and other ecosystem
services from mangroves and coral reefs, UNEP World Conservation
Monitoring Centre, Cambridge, UK.
URS Australia 2002a, Darwin 10 MTPA LNG Facility, Public Environmental Report,
URS Australia Pty Ltd., prepared for Phillips Petroleum Company Australia
Pty Ltd., Perth, Western Australia.
URS Australia 2002b, Geochemical Survey; Construction Dock, Wickham Point,
LNG Plant, Wickham Point, Northern Territory, URS Australia Pty Ltd.,
prepared for Phillips Petroleum Australia Pty Ltd., Perth, Western Australia.
Valentine, E, Patterson, R & Morgan, N 2011, Hydrodynamic Modelling of Darwin
Harbour 2005-2010: History, Development & Interpretation, Charles Darwin
University and Power and Water Corporation, Darwin, Northern Territory.
Valentine, EM & Totterdell, PJ 2009, ‘Water Quality Modelling in a Tropical
Macro-Tidal Creek’, International Association of Hydraulic Engineering &
Research, pp. 4727–4734.
Van Bohemen, HD 2004, Ecological Engineering and Civil Engineering Works: A
Practical Set of Ecological Engineering Principles for Road Infrastructure
and Coastal Management, PhD Thesis, Delft University of Technology, the
Netherlands.
Van der Veen, HH & Hulscher, SMJH 2009, ‘Predicting the occurrence of sand
banks in the North Sea’, Ocean Dynamics, vol. 59, no. 5, pp. 689–696.
Van Lancker, V, Lanckneus, J, Hearn, S, Hoekstra, P, Levoy, F, Miles, J, Moerkerke,
G, Monfort, O & Whitehouse, R 2004, ‘Coastal and nearshore morphology,
bedforms and sediment transport pathways at Teignmouth (UK)’, Continental
Shelf Research, vol. 24, pp. 1171–1202.
Van Rijn, LC 2011, ‘Coastal erosion and control’, Ocean & Coastal Management,
vol. 54, no. 12, pp. 867–887.
204
Van Rijn, LC 2005, Principles of sedimentation and erosion engineering in rivers,
estuaries and coastal seas, Aqua Publications, the Netherlands.
Van Rijn, LC 1984a, ‘Sediment Transport, Part I: Bed Load Transport’, Journal of
Hydraulic Engineering, vol. 110, no. 10, pp. 1431–1456.
Van Rijn, LC 1984b, ‘Sediment Transport, Part II: Suspended Load Transport’,
Journal of Hydraulic Engineering, vol. 110, no. 11, pp. 1613–1641.
Van Rijn, LC 2007a, ‘Unified view of Sediment Transport by Currents and Waves. I:
Initiation of Motion, Bed roughness, and Bed-load Transport’, Journal of
hydraulic engineering, vol. 133, no. 6, pp. 649–667.
Van Rijn, LC 2007b, ‘Unified View of Sediment Transport by Currents and Waves.
II: Suspended Transport’, Journal of Hydraulic Engineering, vol. 133, no. 6,
pp. 668–689.
Vuik, V, Jonkman, SN, Borsje, BW & Suzuki, T 2016, ‘Nature-based flood
protection: The efficiency of vegetated foreshores for reducing wave loads on
coastal dikes’, Coastal Engineering, vol. 116, pp. 42–56.
Waltham, N 2016, Townsville City waterfront priority development area – green
engineering guidelines, Centre for Tropical Water & Aquatic Ecosystem
Research (TropWATER), James Cook University. Prepared for Townsville
City Council, Townsville.
Water Research Laboratory 2000, ‘Modelling of Darwin Harbour’, viewed 31
August, 2012, <http://www.wrl.unsw.edu.au/site/wp-content/uploads/darwin-
harbour.pdf>.
Waterman, RE 2007, ‘Land in water, water in land: Achieving integrated coastal
zone development by Building with Nature’, Terra et Aqua, no. 127, pp. 3–
32.
Weltje, GJ & von Eynatten, H 2004, ‘Quantitative provenance analysis of sediments:
review and outlook’, Sedimentary Geology, vol. 171, no. 1–4, pp. 1–11.
Western Australian Planning Commission 2014, Coastal hazard risk management
and adaptation planning guidelines, Perth, WA.
Western Australian Planning Commission 2017, Draft Planned or Managed Retreat
Guidelines, Department of Planning, Lands and Heritage, Western Australia,
Perth, WA.
Western Australian Planning Commission 2013, State Coastal Planning Policy
Guidelines, Department of Planning, Lands and Heritage, Western Australia,
Perth, WA.
Westfall, PH 2014, ‘Kurtosis as Peakedness, 1905 – 2014. R.I.P.’, The American
Statistician, vol. 68, no. 3, pp. 191–195.
205
Wheeler, PJ, Nguyen, TT, Peterson, J & Gordon-Brown, L 2009, ‘Morphological
Change at the Snowy River Ocean Entrance, Victoria, Australia (1851-
2008)’, Australian Geographer, vol. 40, no. 1, pp. 1–28.
Wheeler, PJ, Peterson, J & Gordon-Brown, L 2010, ‘Flood-tide Delta Morphological
Change at the Gippsland Lakes Artificial Entrance, Australia (1889-2009)’,
Australian Geographer, vol. 41, no. 2, pp. 183–216.
White, TE 1998, ‘Status of measurement techniques for coastal sediment transport’,
Coastal Engineering, vol. 35, no. 1–2, pp. 17–45.
White, WM 2013, Geochemistry, 1st ed., Wiley-Blackwell.
Whiting, SD 2002, ‘Rocky reefs provide foraging habitat for dugongs in the Darwin
region of northern Australia’, Australian Mammalogy, vol. 24, pp. 147–150.
Whitmore, GP, Crook, KAW & Johnson, DP 2004, ‘Grain size control of mineralogy
and geochemistry in modern river sediment, New Guinea collision, Papua
New Guinea’, Sedimentary Geology, vol. 171, pp. 129–157.
Wilkinson, FL 1974, Report on Casuarina Coastal Reserve and Brinkin Lake Estate,
Northern Territory Regional Office, Darwin.
Wilkinson, FL 1976, Report on Foreshore Erosion at Mindil Beach Caravan Park,
Department of Construction Maritime Works Branch, Darwin.
Williams, A & Feagin, R 2010, ‘Sargassum as a Natural Solution to Enhance Dune
Plant Growth’, Environmental Management, vol. 46, pp. 738–747.
Williams, D 2009, Dredging of Sand from Darwin Harbour, Hydrographic and
Marine Life, Part 1: Hydrodynamics and Sediment Transport, Australian
Institute of Marine Science, Arafura Timor Research Facility, Brinkin,
Northern Territory.
Williams, D, Wolanski, E & Spagnol, SA 2006, ‘Hydrodynamics of Darwin
Harbour’, in E Wolanski (ed.), The Environment in Asia Pacific Harbours,
Springer, Dordrecht, the Netherlands, pp. 461–476.
Williams, DK & Patterson, RG 2014, East Arm Multiuser Barge Ramp Sediment and
Dredge Modelling, Report for Land Development Corporation, Northern
Territory Government, Australian Institute of Marine Science, Darwin.
Winter, C 2007, ‘On the evaluation of sediment transport models in tidal
environments’, Sedimentary Geology, vol. 202, no. 3, pp. 562–571.
Wolman, MG & Miller, WP 1960, ‘Magnitude and frequency of forces in
geomorphic processes’, Journal of Geology, vol. 68, pp. 54–74.
Wolstenholme, J, Dinesen, ZD & Alderslade, P 1997, ‘Hard corals of the Darwin
Region, Northern Territory, Australia’, in JR Hanley, G Caswell, D Megirian
& HK Larson (eds), The marine flora and fauna of Darwin Harbour,
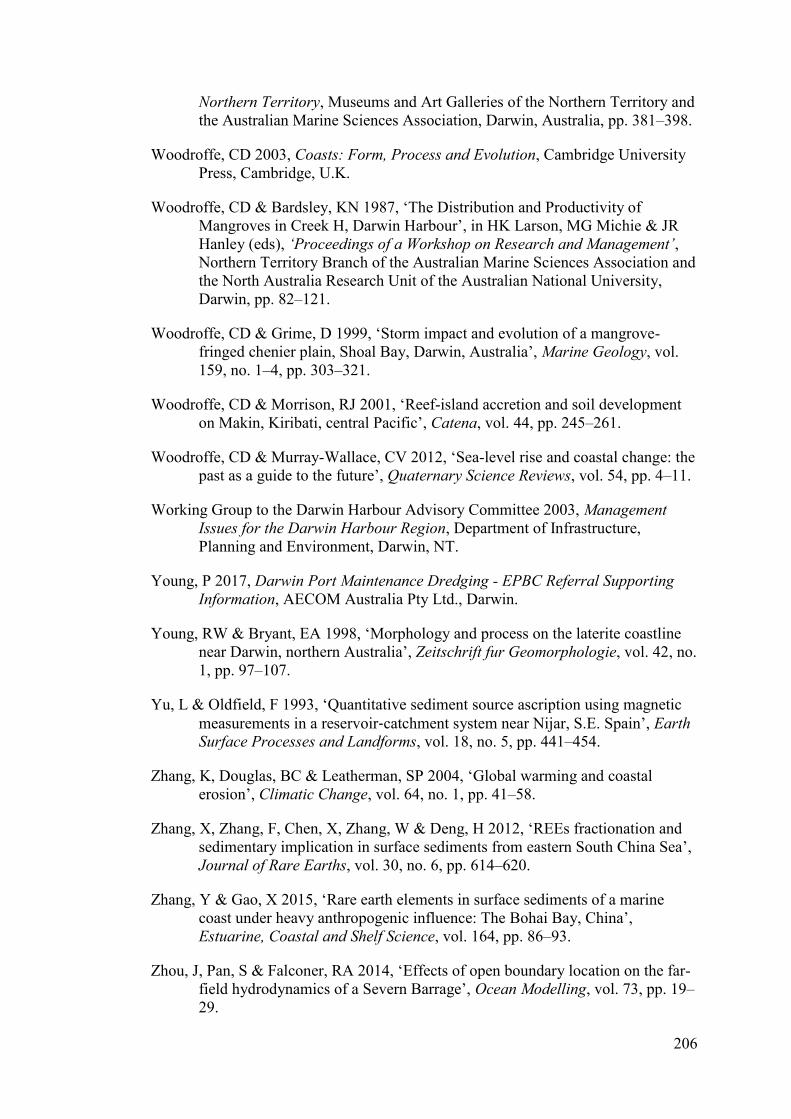
206
Northern Territory, Museums and Art Galleries of the Northern Territory and
the Australian Marine Sciences Association, Darwin, Australia, pp. 381–398.
Woodroffe, CD 2003, Coasts: Form, Process and Evolution, Cambridge University
Press, Cambridge, U.K.
Woodroffe, CD & Bardsley, KN 1987, ‘The Distribution and Productivity of
Mangroves in Creek H, Darwin Harbour’, in HK Larson, MG Michie & JR
Hanley (eds), ‘Proceedings of a Workshop on Research and Management’,
Northern Territory Branch of the Australian Marine Sciences Association and
the North Australia Research Unit of the Australian National University,
Darwin, pp. 82–121.
Woodroffe, CD & Grime, D 1999, ‘Storm impact and evolution of a mangrove-
fringed chenier plain, Shoal Bay, Darwin, Australia’, Marine Geology, vol.
159, no. 1–4, pp. 303–321.
Woodroffe, CD & Morrison, RJ 2001, ‘Reef-island accretion and soil development
on Makin, Kiribati, central Pacific’, Catena, vol. 44, pp. 245–261.
Woodroffe, CD & Murray-Wallace, CV 2012, ‘Sea-level rise and coastal change: the
past as a guide to the future’, Quaternary Science Reviews, vol. 54, pp. 4–11.
Working Group to the Darwin Harbour Advisory Committee 2003, Management
Issues for the Darwin Harbour Region, Department of Infrastructure,
Planning and Environment, Darwin, NT.
Young, P 2017, Darwin Port Maintenance Dredging - EPBC Referral Supporting
Information, AECOM Australia Pty Ltd., Darwin.
Young, RW & Bryant, EA 1998, ‘Morphology and process on the laterite coastline
near Darwin, northern Australia’, Zeitschrift fur Geomorphologie, vol. 42, no.
1, pp. 97–107.
Yu, L & Oldfield, F 1993, ‘Quantitative sediment source ascription using magnetic
measurements in a reservoir‐catchment system near Nijar, S.E. Spain’, Earth
Surface Processes and Landforms, vol. 18, no. 5, pp. 441–454.
Zhang, K, Douglas, BC & Leatherman, SP 2004, ‘Global warming and coastal
erosion’, Climatic Change, vol. 64, no. 1, pp. 41–58.
Zhang, X, Zhang, F, Chen, X, Zhang, W & Deng, H 2012, ‘REEs fractionation and
sedimentary implication in surface sediments from eastern South China Sea’,
Journal of Rare Earths, vol. 30, no. 6, pp. 614–620.
Zhang, Y & Gao, X 2015, ‘Rare earth elements in surface sediments of a marine
coast under heavy anthropogenic influence: The Bohai Bay, China’,
Estuarine, Coastal and Shelf Science, vol. 164, pp. 86–93.
Zhou, J, Pan, S & Falconer, RA 2014, ‘Effects of open boundary location on the far-
field hydrodynamics of a Severn Barrage’, Ocean Modelling, vol. 73, pp. 19–
29.

207
Zhou, X, Li, A, Jiang, F & Meng, Q 2010, ‘A preliminary study on fingerprinting
approach in marine sediment dynamics with the rare earth elements’, Acta
Oceanologica Sinica, vol. 29, no. 4, pp. 62–77.
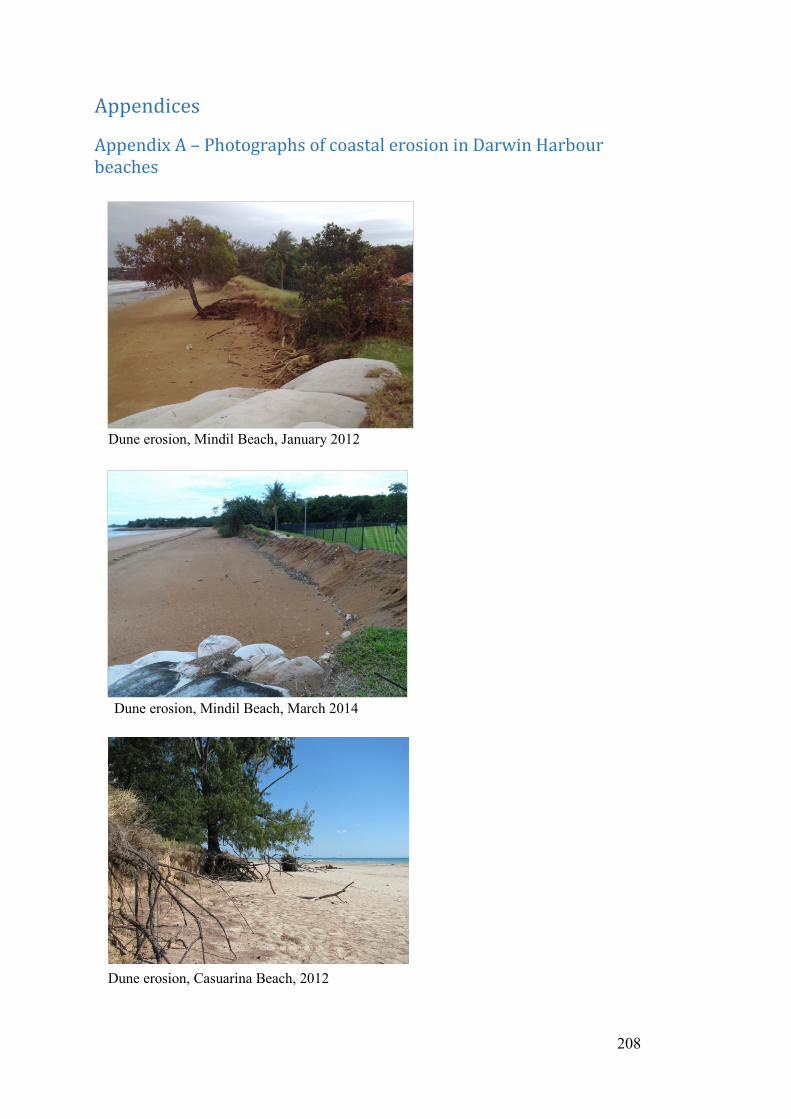
208
Appendices
Appendix A – Photographs of coastal erosion in Darwin Harbour beaches
Dune erosion, Mindil Beach, January 2012
Dune erosion, Mindil Beach, March 2014
Dune erosion, Casuarina Beach, 2012
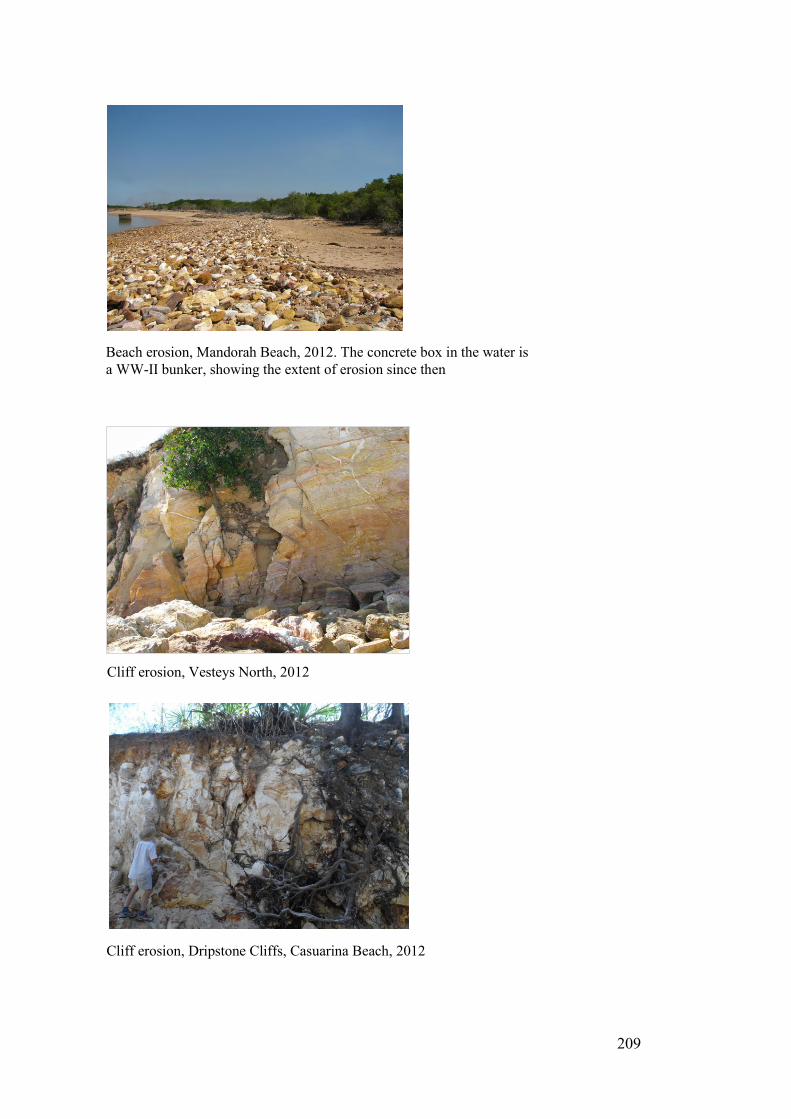
209
Beach erosion, Mandorah Beach, 2012. The concrete box in the water is
a WW-II bunker, showing the extent of erosion since then
Cliff erosion, Dripstone Cliffs, Casuarina Beach, 2012
Cliff erosion, Vesteys North, 2012
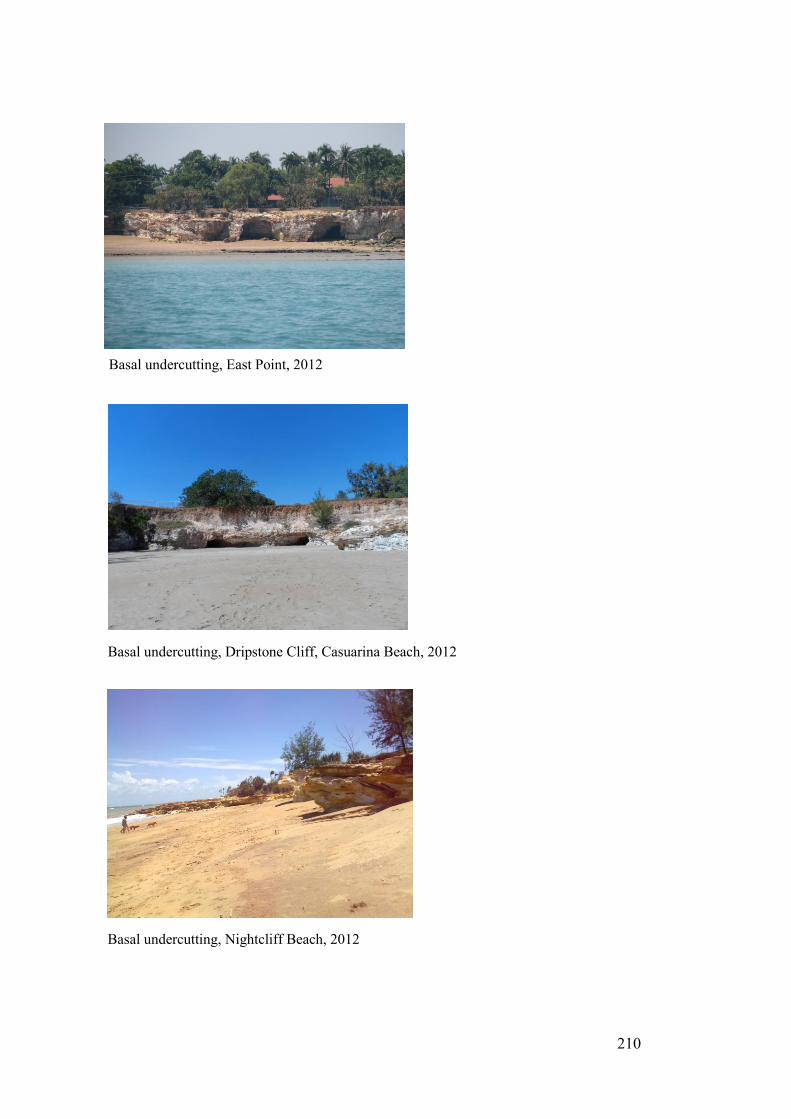
210
Basal undercutting, Dripstone Cliff, Casuarina Beach, 2012
Basal undercutting, East Point, 2012
Basal undercutting, East Point, 2012
Basal undercutting, East Point, 2012
Basal undercutting, East Point, 2012
Basal undercutting, Nightcliff Beach, 2012
Basal undercutting, Nightcliff Beach, 2012
Basal undercutting, Nightcliff Beach, 2012
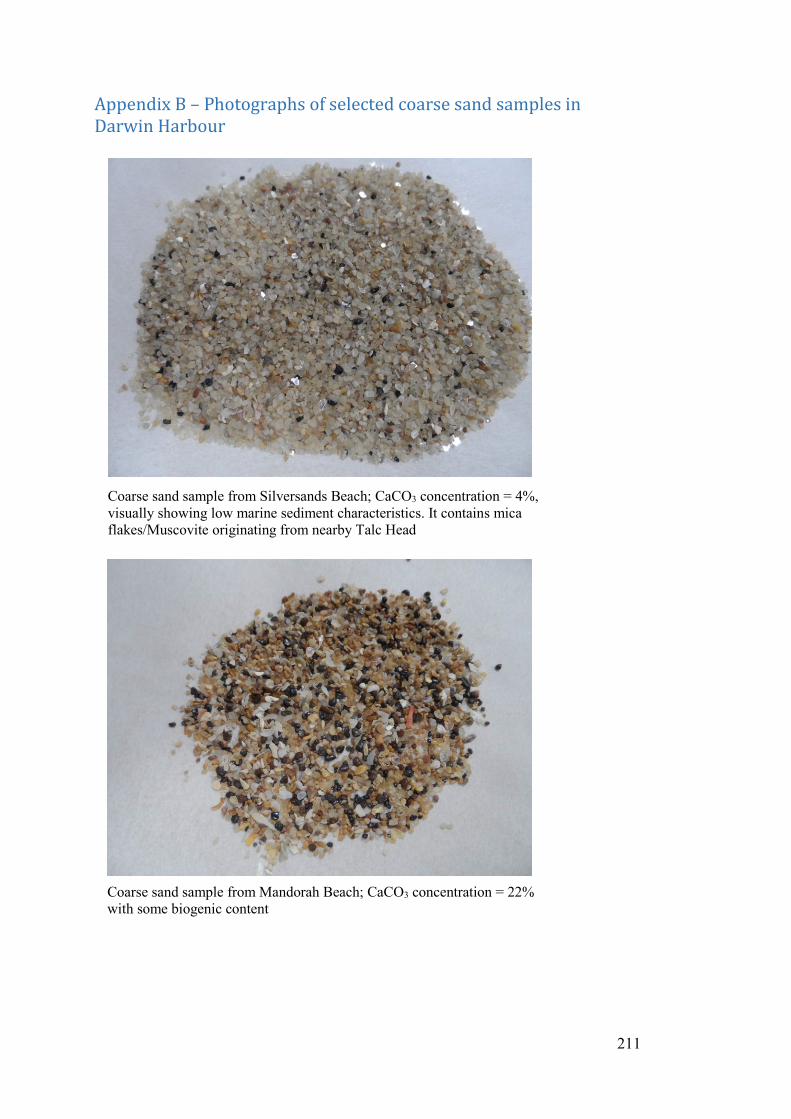
211
Appendix B – Photographs of selected coarse sand samples in Darwin Harbour
Coarse sand sample from Silversands Beach; CaCO3 concentration = 4%,
visually showing low marine sediment characteristics. It contains mica
flakes/Muscovite originating from nearby Talc Head
Coarse sand sample from Mandorah Beach; CaCO3 concentration = 22%
with some biogenic content
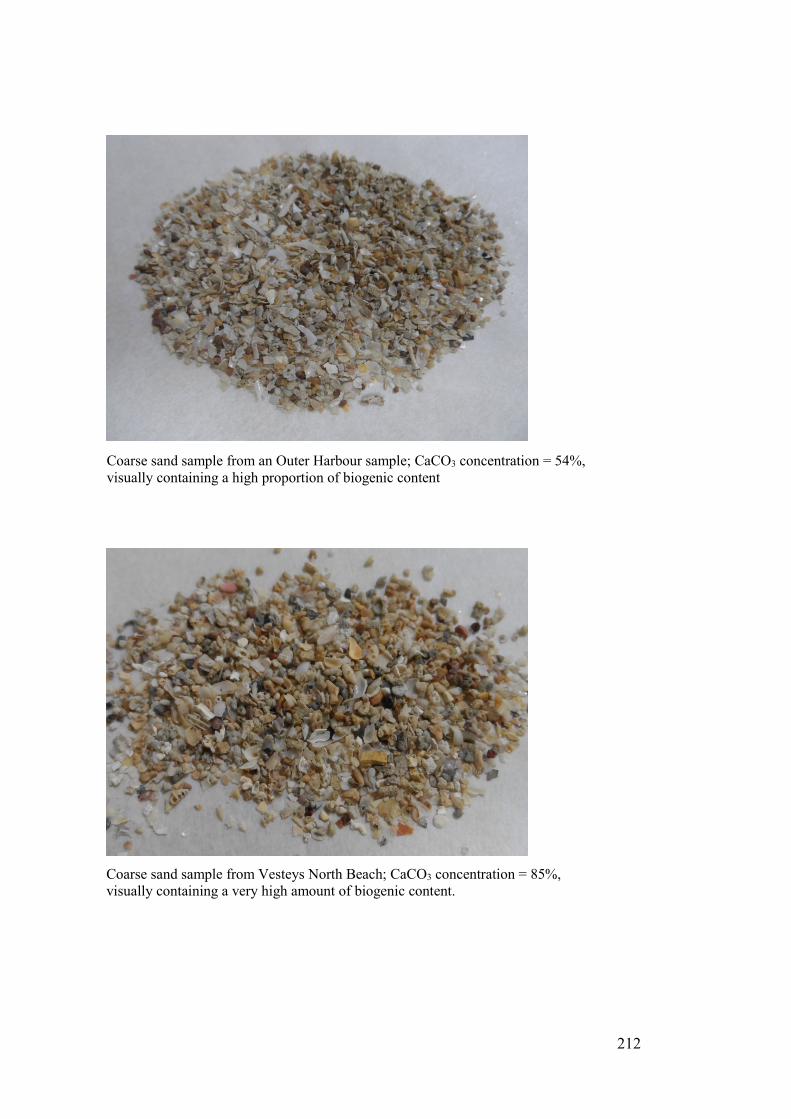
212
Coarse sand sample from Vesteys North Beach; CaCO3 concentration = 85%,
visually containing a very high amount of biogenic content.
Coarse sand sample from an Outer Harbour sample; CaCO3 concentration = 54%,
visually containing a high proportion of biogenic content
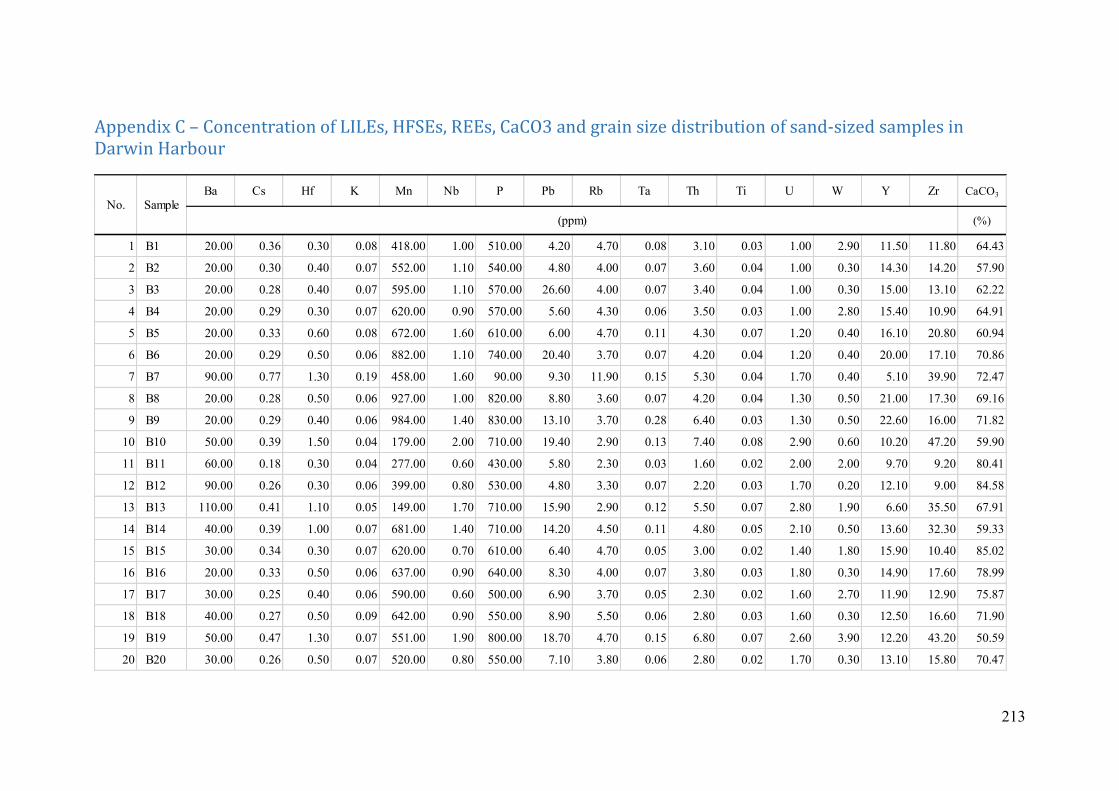
213
Appendix C – Concentration of LILEs, HFSEs, REEs, CaCO3 and grain size distribution of sand-sized samples in Darwin Harbour
Ba Cs Hf K Mn Nb P Pb Rb Ta Th Ti U W Y Zr CaCO3
(%)
1 B1 20.00 0.36 0.30 0.08 418.00 1.00 510.00 4.20 4.70 0.08 3.10 0.03 1.00 2.90 11.50 11.80 64.43
2 B2 20.00 0.30 0.40 0.07 552.00 1.10 540.00 4.80 4.00 0.07 3.60 0.04 1.00 0.30 14.30 14.20 57.90
3 B3 20.00 0.28 0.40 0.07 595.00 1.10 570.00 26.60 4.00 0.07 3.40 0.04 1.00 0.30 15.00 13.10 62.22
4 B4 20.00 0.29 0.30 0.07 620.00 0.90 570.00 5.60 4.30 0.06 3.50 0.03 1.00 2.80 15.40 10.90 64.91
5 B5 20.00 0.33 0.60 0.08 672.00 1.60 610.00 6.00 4.70 0.11 4.30 0.07 1.20 0.40 16.10 20.80 60.94
6 B6 20.00 0.29 0.50 0.06 882.00 1.10 740.00 20.40 3.70 0.07 4.20 0.04 1.20 0.40 20.00 17.10 70.86
7 B7 90.00 0.77 1.30 0.19 458.00 1.60 90.00 9.30 11.90 0.15 5.30 0.04 1.70 0.40 5.10 39.90 72.47
8 B8 20.00 0.28 0.50 0.06 927.00 1.00 820.00 8.80 3.60 0.07 4.20 0.04 1.30 0.50 21.00 17.30 69.16
9 B9 20.00 0.29 0.40 0.06 984.00 1.40 830.00 13.10 3.70 0.28 6.40 0.03 1.30 0.50 22.60 16.00 71.82
10 B10 50.00 0.39 1.50 0.04 179.00 2.00 710.00 19.40 2.90 0.13 7.40 0.08 2.90 0.60 10.20 47.20 59.90
11 B11 60.00 0.18 0.30 0.04 277.00 0.60 430.00 5.80 2.30 0.03 1.60 0.02 2.00 2.00 9.70 9.20 80.41
12 B12 90.00 0.26 0.30 0.06 399.00 0.80 530.00 4.80 3.30 0.07 2.20 0.03 1.70 0.20 12.10 9.00 84.58
13 B13 110.00 0.41 1.10 0.05 149.00 1.70 710.00 15.90 2.90 0.12 5.50 0.07 2.80 1.90 6.60 35.50 67.91
14 B14 40.00 0.39 1.00 0.07 681.00 1.40 710.00 14.20 4.50 0.11 4.80 0.05 2.10 0.50 13.60 32.30 59.33
15 B15 30.00 0.34 0.30 0.07 620.00 0.70 610.00 6.40 4.70 0.05 3.00 0.02 1.40 1.80 15.90 10.40 85.02
16 B16 20.00 0.33 0.50 0.06 637.00 0.90 640.00 8.30 4.00 0.07 3.80 0.03 1.80 0.30 14.90 17.60 78.99
17 B17 30.00 0.25 0.40 0.06 590.00 0.60 500.00 6.90 3.70 0.05 2.30 0.02 1.60 2.70 11.90 12.90 75.87
18 B18 40.00 0.27 0.50 0.09 642.00 0.90 550.00 8.90 5.50 0.06 2.80 0.03 1.60 0.30 12.50 16.60 71.90
19 B19 50.00 0.47 1.30 0.07 551.00 1.90 800.00 18.70 4.70 0.15 6.80 0.07 2.60 3.90 12.20 43.20 50.59
20 B20 30.00 0.26 0.50 0.07 520.00 0.80 550.00 7.10 3.80 0.06 2.80 0.02 1.70 0.30 13.10 15.80 70.47
No. Sample
(ppm)
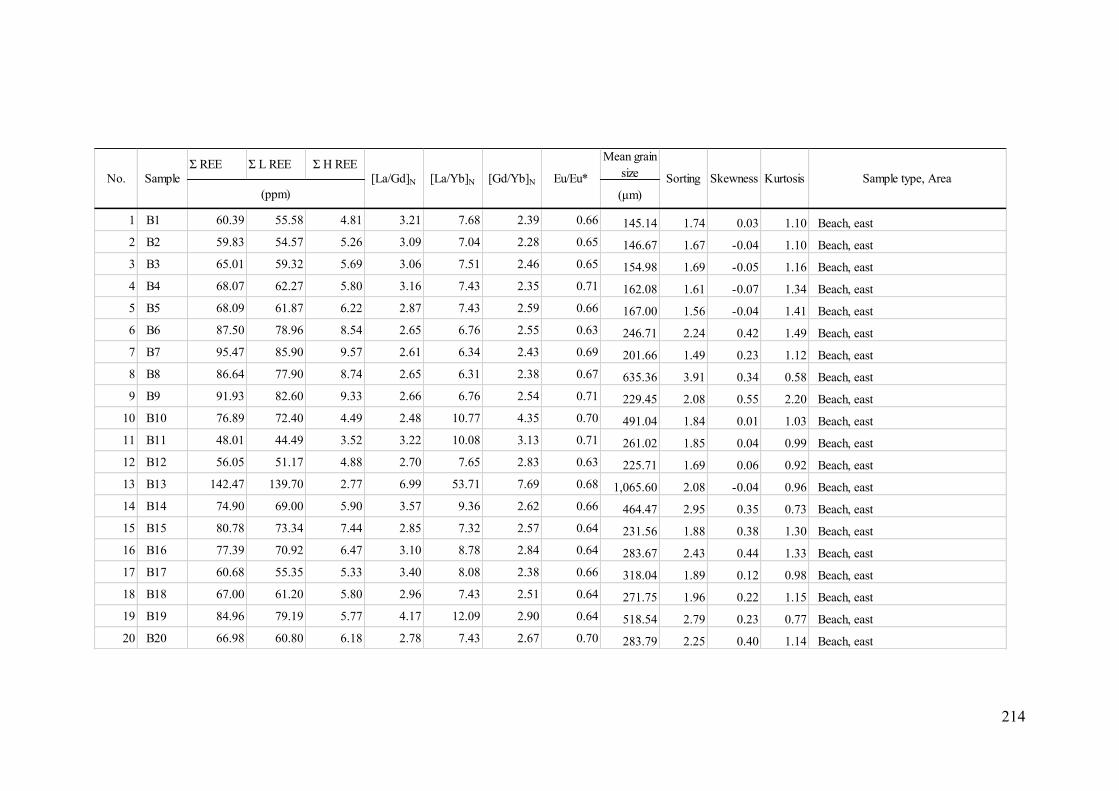
214
Σ REE Σ L REE Σ H REEMean grain
size
(μm)
1 B1 60.39 55.58 4.81 3.21 7.68 2.39 0.66 145.14 1.74 0.03 1.10 Beach, east
2 B2 59.83 54.57 5.26 3.09 7.04 2.28 0.65 146.67 1.67 -0.04 1.10 Beach, east
3 B3 65.01 59.32 5.69 3.06 7.51 2.46 0.65 154.98 1.69 -0.05 1.16 Beach, east
4 B4 68.07 62.27 5.80 3.16 7.43 2.35 0.71 162.08 1.61 -0.07 1.34 Beach, east
5 B5 68.09 61.87 6.22 2.87 7.43 2.59 0.66 167.00 1.56 -0.04 1.41 Beach, east
6 B6 87.50 78.96 8.54 2.65 6.76 2.55 0.63 246.71 2.24 0.42 1.49 Beach, east
7 B7 95.47 85.90 9.57 2.61 6.34 2.43 0.69 201.66 1.49 0.23 1.12 Beach, east
8 B8 86.64 77.90 8.74 2.65 6.31 2.38 0.67 635.36 3.91 0.34 0.58 Beach, east
9 B9 91.93 82.60 9.33 2.66 6.76 2.54 0.71 229.45 2.08 0.55 2.20 Beach, east
10 B10 76.89 72.40 4.49 2.48 10.77 4.35 0.70 491.04 1.84 0.01 1.03 Beach, east
11 B11 48.01 44.49 3.52 3.22 10.08 3.13 0.71 261.02 1.85 0.04 0.99 Beach, east
12 B12 56.05 51.17 4.88 2.70 7.65 2.83 0.63 225.71 1.69 0.06 0.92 Beach, east
13 B13 142.47 139.70 2.77 6.99 53.71 7.69 0.68 1,065.60 2.08 -0.04 0.96 Beach, east
14 B14 74.90 69.00 5.90 3.57 9.36 2.62 0.66 464.47 2.95 0.35 0.73 Beach, east
15 B15 80.78 73.34 7.44 2.85 7.32 2.57 0.64 231.56 1.88 0.38 1.30 Beach, east
16 B16 77.39 70.92 6.47 3.10 8.78 2.84 0.64 283.67 2.43 0.44 1.33 Beach, east
17 B17 60.68 55.35 5.33 3.40 8.08 2.38 0.66 318.04 1.89 0.12 0.98 Beach, east
18 B18 67.00 61.20 5.80 2.96 7.43 2.51 0.64 271.75 1.96 0.22 1.15 Beach, east
19 B19 84.96 79.19 5.77 4.17 12.09 2.90 0.64 518.54 2.79 0.23 0.77 Beach, east
20 B20 66.98 60.80 6.18 2.78 7.43 2.67 0.70 283.79 2.25 0.40 1.14 Beach, east
Sample type, AreaKurtosis[La/Gd]N [La/Yb]N [Gd/Yb]N Eu/Eu* Sorting Skewness
(ppm)
No. Sample
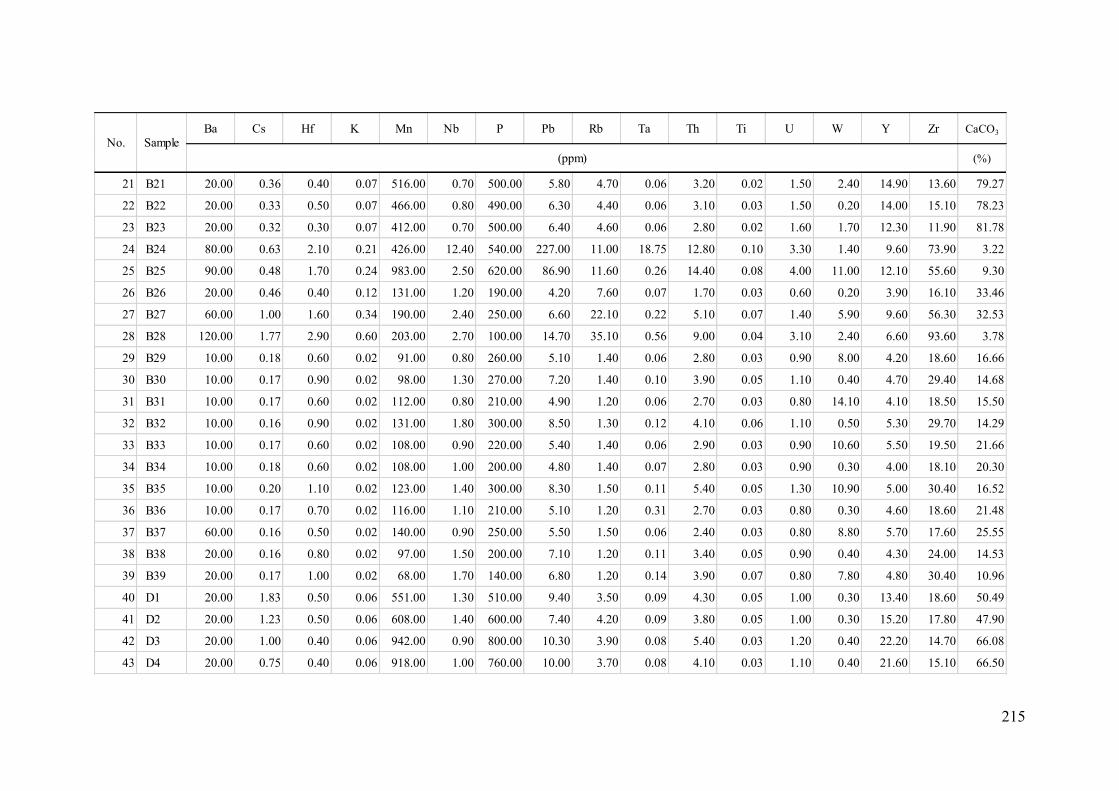
215
Ba Cs Hf K Mn Nb P Pb Rb Ta Th Ti U W Y Zr CaCO3
(%)
21 B21 20.00 0.36 0.40 0.07 516.00 0.70 500.00 5.80 4.70 0.06 3.20 0.02 1.50 2.40 14.90 13.60 79.27
22 B22 20.00 0.33 0.50 0.07 466.00 0.80 490.00 6.30 4.40 0.06 3.10 0.03 1.50 0.20 14.00 15.10 78.23
23 B23 20.00 0.32 0.30 0.07 412.00 0.70 500.00 6.40 4.60 0.06 2.80 0.02 1.60 1.70 12.30 11.90 81.78
24 B24 80.00 0.63 2.10 0.21 426.00 12.40 540.00 227.00 11.00 18.75 12.80 0.10 3.30 1.40 9.60 73.90 3.22
25 B25 90.00 0.48 1.70 0.24 983.00 2.50 620.00 86.90 11.60 0.26 14.40 0.08 4.00 11.00 12.10 55.60 9.30
26 B26 20.00 0.46 0.40 0.12 131.00 1.20 190.00 4.20 7.60 0.07 1.70 0.03 0.60 0.20 3.90 16.10 33.46
27 B27 60.00 1.00 1.60 0.34 190.00 2.40 250.00 6.60 22.10 0.22 5.10 0.07 1.40 5.90 9.60 56.30 32.53
28 B28 120.00 1.77 2.90 0.60 203.00 2.70 100.00 14.70 35.10 0.56 9.00 0.04 3.10 2.40 6.60 93.60 3.78
29 B29 10.00 0.18 0.60 0.02 91.00 0.80 260.00 5.10 1.40 0.06 2.80 0.03 0.90 8.00 4.20 18.60 16.66
30 B30 10.00 0.17 0.90 0.02 98.00 1.30 270.00 7.20 1.40 0.10 3.90 0.05 1.10 0.40 4.70 29.40 14.68
31 B31 10.00 0.17 0.60 0.02 112.00 0.80 210.00 4.90 1.20 0.06 2.70 0.03 0.80 14.10 4.10 18.50 15.50
32 B32 10.00 0.16 0.90 0.02 131.00 1.80 300.00 8.50 1.30 0.12 4.10 0.06 1.10 0.50 5.30 29.70 14.29
33 B33 10.00 0.17 0.60 0.02 108.00 0.90 220.00 5.40 1.40 0.06 2.90 0.03 0.90 10.60 5.50 19.50 21.66
34 B34 10.00 0.18 0.60 0.02 108.00 1.00 200.00 4.80 1.40 0.07 2.80 0.03 0.90 0.30 4.00 18.10 20.30
35 B35 10.00 0.20 1.10 0.02 123.00 1.40 300.00 8.30 1.50 0.11 5.40 0.05 1.30 10.90 5.00 30.40 16.52
36 B36 10.00 0.17 0.70 0.02 116.00 1.10 210.00 5.10 1.20 0.31 2.70 0.03 0.80 0.30 4.60 18.60 21.48
37 B37 60.00 0.16 0.50 0.02 140.00 0.90 250.00 5.50 1.50 0.06 2.40 0.03 0.80 8.80 5.70 17.60 25.55
38 B38 20.00 0.16 0.80 0.02 97.00 1.50 200.00 7.10 1.20 0.11 3.40 0.05 0.90 0.40 4.30 24.00 14.53
39 B39 20.00 0.17 1.00 0.02 68.00 1.70 140.00 6.80 1.20 0.14 3.90 0.07 0.80 7.80 4.80 30.40 10.96
40 D1 20.00 1.83 0.50 0.06 551.00 1.30 510.00 9.40 3.50 0.09 4.30 0.05 1.00 0.30 13.40 18.60 50.49
41 D2 20.00 1.23 0.50 0.06 608.00 1.40 600.00 7.40 4.20 0.09 3.80 0.05 1.00 0.30 15.20 17.80 47.90
42 D3 20.00 1.00 0.40 0.06 942.00 0.90 800.00 10.30 3.90 0.08 5.40 0.03 1.20 0.40 22.20 14.70 66.08
43 D4 20.00 0.75 0.40 0.06 918.00 1.00 760.00 10.00 3.70 0.08 4.10 0.03 1.10 0.40 21.60 15.10 66.50
No. Sample
(ppm)
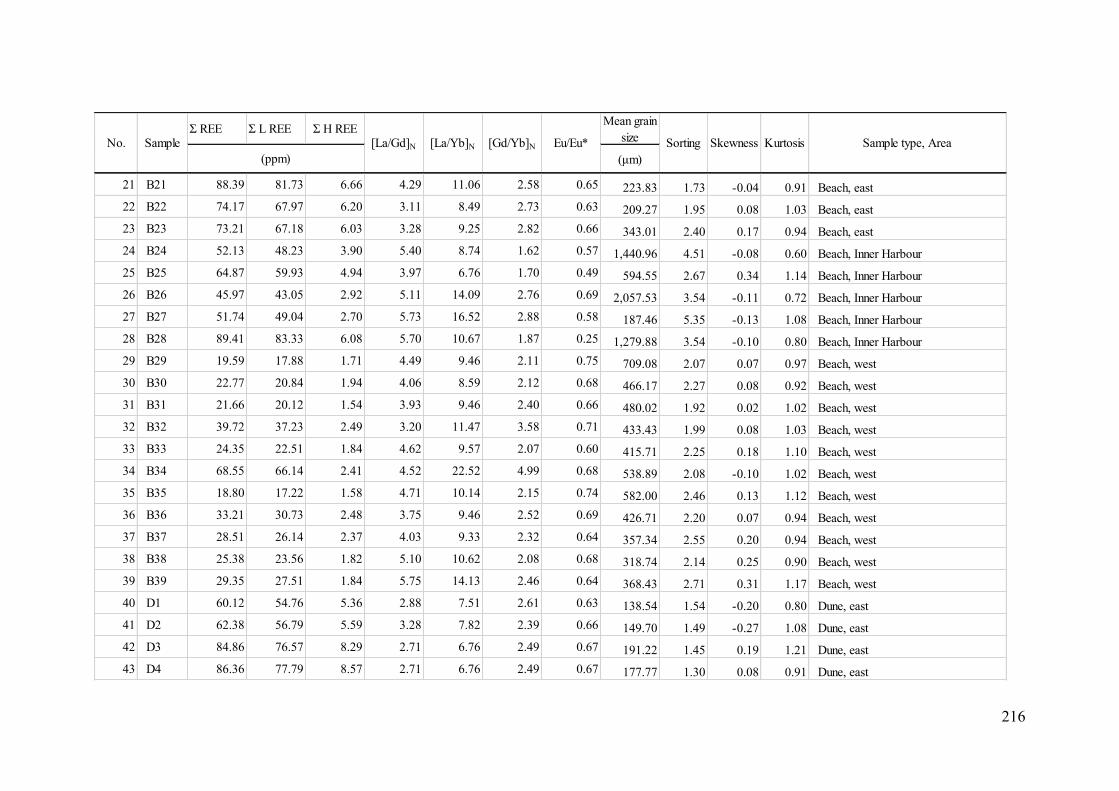
216
Σ REE Σ L REE Σ H REEMean grain
size
(μm)
21 B21 88.39 81.73 6.66 4.29 11.06 2.58 0.65 223.83 1.73 -0.04 0.91 Beach, east
22 B22 74.17 67.97 6.20 3.11 8.49 2.73 0.63 209.27 1.95 0.08 1.03 Beach, east
23 B23 73.21 67.18 6.03 3.28 9.25 2.82 0.66 343.01 2.40 0.17 0.94 Beach, east
24 B24 52.13 48.23 3.90 5.40 8.74 1.62 0.57 1,440.96 4.51 -0.08 0.60 Beach, Inner Harbour
25 B25 64.87 59.93 4.94 3.97 6.76 1.70 0.49 594.55 2.67 0.34 1.14 Beach, Inner Harbour
26 B26 45.97 43.05 2.92 5.11 14.09 2.76 0.69 2,057.53 3.54 -0.11 0.72 Beach, Inner Harbour
27 B27 51.74 49.04 2.70 5.73 16.52 2.88 0.58 187.46 5.35 -0.13 1.08 Beach, Inner Harbour
28 B28 89.41 83.33 6.08 5.70 10.67 1.87 0.25 1,279.88 3.54 -0.10 0.80 Beach, Inner Harbour
29 B29 19.59 17.88 1.71 4.49 9.46 2.11 0.75 709.08 2.07 0.07 0.97 Beach, west
30 B30 22.77 20.84 1.94 4.06 8.59 2.12 0.68 466.17 2.27 0.08 0.92 Beach, west
31 B31 21.66 20.12 1.54 3.93 9.46 2.40 0.66 480.02 1.92 0.02 1.02 Beach, west
32 B32 39.72 37.23 2.49 3.20 11.47 3.58 0.71 433.43 1.99 0.08 1.03 Beach, west
33 B33 24.35 22.51 1.84 4.62 9.57 2.07 0.60 415.71 2.25 0.18 1.10 Beach, west
34 B34 68.55 66.14 2.41 4.52 22.52 4.99 0.68 538.89 2.08 -0.10 1.02 Beach, west
35 B35 18.80 17.22 1.58 4.71 10.14 2.15 0.74 582.00 2.46 0.13 1.12 Beach, west
36 B36 33.21 30.73 2.48 3.75 9.46 2.52 0.69 426.71 2.20 0.07 0.94 Beach, west
37 B37 28.51 26.14 2.37 4.03 9.33 2.32 0.64 357.34 2.55 0.20 0.94 Beach, west
38 B38 25.38 23.56 1.82 5.10 10.62 2.08 0.68 318.74 2.14 0.25 0.90 Beach, west
39 B39 29.35 27.51 1.84 5.75 14.13 2.46 0.64 368.43 2.71 0.31 1.17 Beach, west
40 D1 60.12 54.76 5.36 2.88 7.51 2.61 0.63 138.54 1.54 -0.20 0.80 Dune, east
41 D2 62.38 56.79 5.59 3.28 7.82 2.39 0.66 149.70 1.49 -0.27 1.08 Dune, east
42 D3 84.86 76.57 8.29 2.71 6.76 2.49 0.67 191.22 1.45 0.19 1.21 Dune, east
43 D4 86.36 77.79 8.57 2.71 6.76 2.49 0.67 177.77 1.30 0.08 0.91 Dune, east
Kurtosis Sample type, Area
(ppm)
[La/Yb]N [Gd/Yb]N Eu/Eu* Sorting SkewnessNo. Sample [La/Gd]N
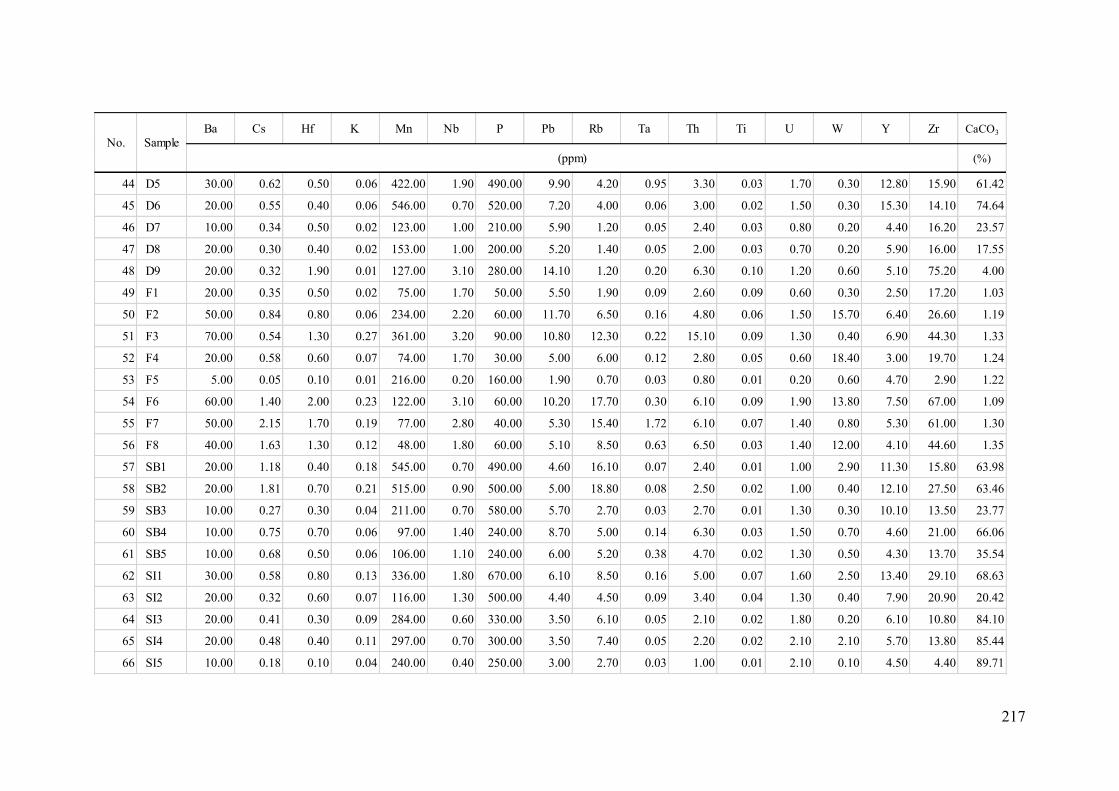
217
Ba Cs Hf K Mn Nb P Pb Rb Ta Th Ti U W Y Zr CaCO3
(%)
44 D5 30.00 0.62 0.50 0.06 422.00 1.90 490.00 9.90 4.20 0.95 3.30 0.03 1.70 0.30 12.80 15.90 61.42
45 D6 20.00 0.55 0.40 0.06 546.00 0.70 520.00 7.20 4.00 0.06 3.00 0.02 1.50 0.30 15.30 14.10 74.64
46 D7 10.00 0.34 0.50 0.02 123.00 1.00 210.00 5.90 1.20 0.05 2.40 0.03 0.80 0.20 4.40 16.20 23.57
47 D8 20.00 0.30 0.40 0.02 153.00 1.00 200.00 5.20 1.40 0.05 2.00 0.03 0.70 0.20 5.90 16.00 17.55
48 D9 20.00 0.32 1.90 0.01 127.00 3.10 280.00 14.10 1.20 0.20 6.30 0.10 1.20 0.60 5.10 75.20 4.00
49 F1 20.00 0.35 0.50 0.02 75.00 1.70 50.00 5.50 1.90 0.09 2.60 0.09 0.60 0.30 2.50 17.20 1.03
50 F2 50.00 0.84 0.80 0.06 234.00 2.20 60.00 11.70 6.50 0.16 4.80 0.06 1.50 15.70 6.40 26.60 1.19
51 F3 70.00 0.54 1.30 0.27 361.00 3.20 90.00 10.80 12.30 0.22 15.10 0.09 1.30 0.40 6.90 44.30 1.33
52 F4 20.00 0.58 0.60 0.07 74.00 1.70 30.00 5.00 6.00 0.12 2.80 0.05 0.60 18.40 3.00 19.70 1.24
53 F5 5.00 0.05 0.10 0.01 216.00 0.20 160.00 1.90 0.70 0.03 0.80 0.01 0.20 0.60 4.70 2.90 1.22
54 F6 60.00 1.40 2.00 0.23 122.00 3.10 60.00 10.20 17.70 0.30 6.10 0.09 1.90 13.80 7.50 67.00 1.09
55 F7 50.00 2.15 1.70 0.19 77.00 2.80 40.00 5.30 15.40 1.72 6.10 0.07 1.40 0.80 5.30 61.00 1.30
56 F8 40.00 1.63 1.30 0.12 48.00 1.80 60.00 5.10 8.50 0.63 6.50 0.03 1.40 12.00 4.10 44.60 1.35
57 SB1 20.00 1.18 0.40 0.18 545.00 0.70 490.00 4.60 16.10 0.07 2.40 0.01 1.00 2.90 11.30 15.80 63.98
58 SB2 20.00 1.81 0.70 0.21 515.00 0.90 500.00 5.00 18.80 0.08 2.50 0.02 1.00 0.40 12.10 27.50 63.46
59 SB3 10.00 0.27 0.30 0.04 211.00 0.70 580.00 5.70 2.70 0.03 2.70 0.01 1.30 0.30 10.10 13.50 23.77
60 SB4 10.00 0.75 0.70 0.06 97.00 1.40 240.00 8.70 5.00 0.14 6.30 0.03 1.50 0.70 4.60 21.00 66.06
61 SB5 10.00 0.68 0.50 0.06 106.00 1.10 240.00 6.00 5.20 0.38 4.70 0.02 1.30 0.50 4.30 13.70 35.54
62 SI1 30.00 0.58 0.80 0.13 336.00 1.80 670.00 6.10 8.50 0.16 5.00 0.07 1.60 2.50 13.40 29.10 68.63
63 SI2 20.00 0.32 0.60 0.07 116.00 1.30 500.00 4.40 4.50 0.09 3.40 0.04 1.30 0.40 7.90 20.90 20.42
64 SI3 20.00 0.41 0.30 0.09 284.00 0.60 330.00 3.50 6.10 0.05 2.10 0.02 1.80 0.20 6.10 10.80 84.10
65 SI4 20.00 0.48 0.40 0.11 297.00 0.70 300.00 3.50 7.40 0.05 2.20 0.02 2.10 2.10 5.70 13.80 85.44
66 SI5 10.00 0.18 0.10 0.04 240.00 0.40 250.00 3.00 2.70 0.03 1.00 0.01 2.10 0.10 4.50 4.40 89.71
No. Sample
(ppm)
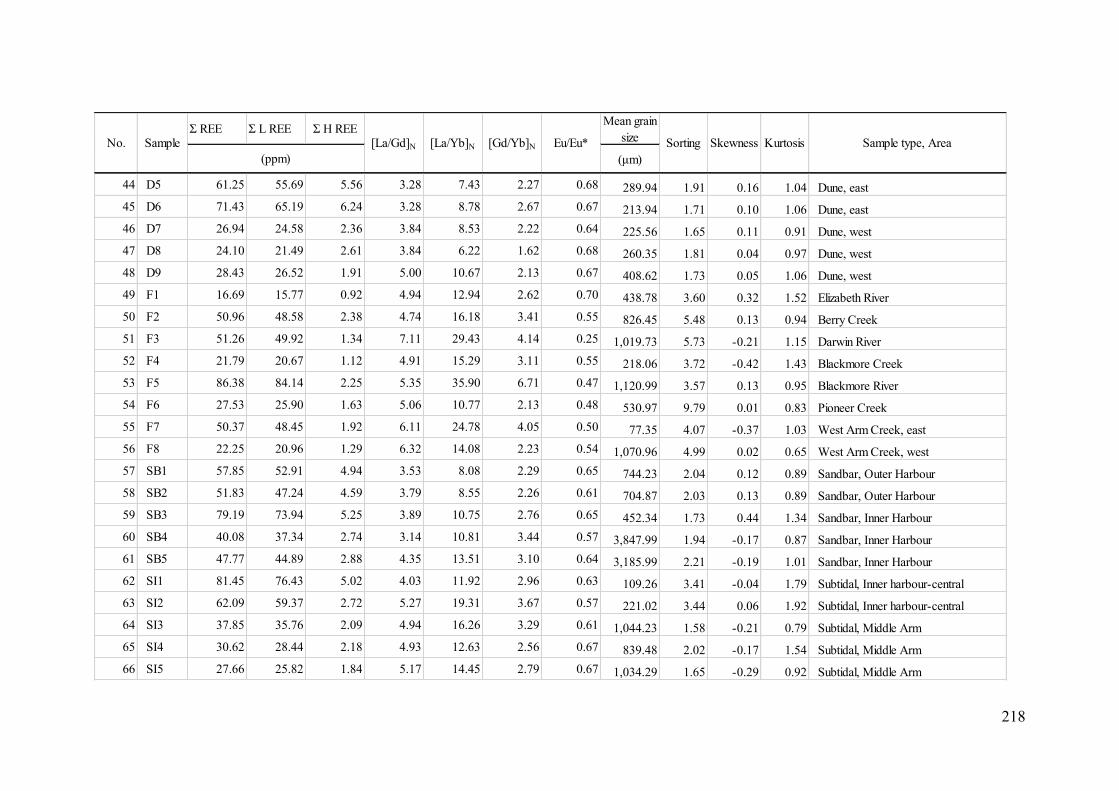
218
Σ REE Σ L REE Σ H REEMean grain
size
(μm)
44 D5 61.25 55.69 5.56 3.28 7.43 2.27 0.68 289.94 1.91 0.16 1.04 Dune, east
45 D6 71.43 65.19 6.24 3.28 8.78 2.67 0.67 213.94 1.71 0.10 1.06 Dune, east
46 D7 26.94 24.58 2.36 3.84 8.53 2.22 0.64 225.56 1.65 0.11 0.91 Dune, west
47 D8 24.10 21.49 2.61 3.84 6.22 1.62 0.68 260.35 1.81 0.04 0.97 Dune, west
48 D9 28.43 26.52 1.91 5.00 10.67 2.13 0.67 408.62 1.73 0.05 1.06 Dune, west
49 F1 16.69 15.77 0.92 4.94 12.94 2.62 0.70 438.78 3.60 0.32 1.52 Elizabeth River
50 F2 50.96 48.58 2.38 4.74 16.18 3.41 0.55 826.45 5.48 0.13 0.94 Berry Creek
51 F3 51.26 49.92 1.34 7.11 29.43 4.14 0.25 1,019.73 5.73 -0.21 1.15 Darwin River
52 F4 21.79 20.67 1.12 4.91 15.29 3.11 0.55 218.06 3.72 -0.42 1.43 Blackmore Creek
53 F5 86.38 84.14 2.25 5.35 35.90 6.71 0.47 1,120.99 3.57 0.13 0.95 Blackmore River
54 F6 27.53 25.90 1.63 5.06 10.77 2.13 0.48 530.97 9.79 0.01 0.83 Pioneer Creek
55 F7 50.37 48.45 1.92 6.11 24.78 4.05 0.50 77.35 4.07 -0.37 1.03 West Arm Creek, east
56 F8 22.25 20.96 1.29 6.32 14.08 2.23 0.54 1,070.96 4.99 0.02 0.65 West Arm Creek, west
57 SB1 57.85 52.91 4.94 3.53 8.08 2.29 0.65 744.23 2.04 0.12 0.89 Sandbar, Outer Harbour
58 SB2 51.83 47.24 4.59 3.79 8.55 2.26 0.61 704.87 2.03 0.13 0.89 Sandbar, Outer Harbour
59 SB3 79.19 73.94 5.25 3.89 10.75 2.76 0.65 452.34 1.73 0.44 1.34 Sandbar, Inner Harbour
60 SB4 40.08 37.34 2.74 3.14 10.81 3.44 0.57 3,847.99 1.94 -0.17 0.87 Sandbar, Inner Harbour
61 SB5 47.77 44.89 2.88 4.35 13.51 3.10 0.64 3,185.99 2.21 -0.19 1.01 Sandbar, Inner Harbour
62 SI1 81.45 76.43 5.02 4.03 11.92 2.96 0.63 109.26 3.41 -0.04 1.79 Subtidal, Inner harbour-central
63 SI2 62.09 59.37 2.72 5.27 19.31 3.67 0.57 221.02 3.44 0.06 1.92 Subtidal, Inner harbour-central
64 SI3 37.85 35.76 2.09 4.94 16.26 3.29 0.61 1,044.23 1.58 -0.21 0.79 Subtidal, Middle Arm
65 SI4 30.62 28.44 2.18 4.93 12.63 2.56 0.67 839.48 2.02 -0.17 1.54 Subtidal, Middle Arm
66 SI5 27.66 25.82 1.84 5.17 14.45 2.79 0.67 1,034.29 1.65 -0.29 0.92 Subtidal, Middle Arm
(ppm)
No. Sample [La/Gd]N [La/Yb]N [Gd/Yb]N Eu/Eu* Sorting Skewness Kurtosis Sample type, Area
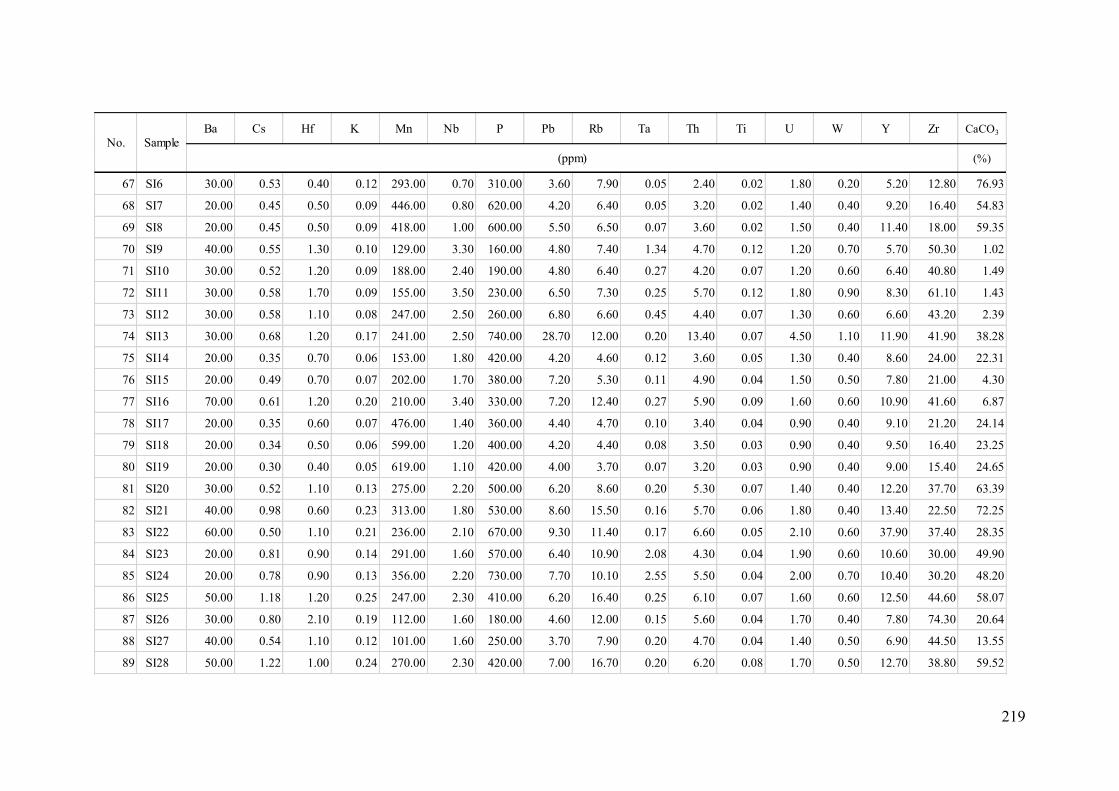
219
Ba Cs Hf K Mn Nb P Pb Rb Ta Th Ti U W Y Zr CaCO3
(%)
67 SI6 30.00 0.53 0.40 0.12 293.00 0.70 310.00 3.60 7.90 0.05 2.40 0.02 1.80 0.20 5.20 12.80 76.93
68 SI7 20.00 0.45 0.50 0.09 446.00 0.80 620.00 4.20 6.40 0.05 3.20 0.02 1.40 0.40 9.20 16.40 54.83
69 SI8 20.00 0.45 0.50 0.09 418.00 1.00 600.00 5.50 6.50 0.07 3.60 0.02 1.50 0.40 11.40 18.00 59.35
70 SI9 40.00 0.55 1.30 0.10 129.00 3.30 160.00 4.80 7.40 1.34 4.70 0.12 1.20 0.70 5.70 50.30 1.02
71 SI10 30.00 0.52 1.20 0.09 188.00 2.40 190.00 4.80 6.40 0.27 4.20 0.07 1.20 0.60 6.40 40.80 1.49
72 SI11 30.00 0.58 1.70 0.09 155.00 3.50 230.00 6.50 7.30 0.25 5.70 0.12 1.80 0.90 8.30 61.10 1.43
73 SI12 30.00 0.58 1.10 0.08 247.00 2.50 260.00 6.80 6.60 0.45 4.40 0.07 1.30 0.60 6.60 43.20 2.39
74 SI13 30.00 0.68 1.20 0.17 241.00 2.50 740.00 28.70 12.00 0.20 13.40 0.07 4.50 1.10 11.90 41.90 38.28
75 SI14 20.00 0.35 0.70 0.06 153.00 1.80 420.00 4.20 4.60 0.12 3.60 0.05 1.30 0.40 8.60 24.00 22.31
76 SI15 20.00 0.49 0.70 0.07 202.00 1.70 380.00 7.20 5.30 0.11 4.90 0.04 1.50 0.50 7.80 21.00 4.30
77 SI16 70.00 0.61 1.20 0.20 210.00 3.40 330.00 7.20 12.40 0.27 5.90 0.09 1.60 0.60 10.90 41.60 6.87
78 SI17 20.00 0.35 0.60 0.07 476.00 1.40 360.00 4.40 4.70 0.10 3.40 0.04 0.90 0.40 9.10 21.20 24.14
79 SI18 20.00 0.34 0.50 0.06 599.00 1.20 400.00 4.20 4.40 0.08 3.50 0.03 0.90 0.40 9.50 16.40 23.25
80 SI19 20.00 0.30 0.40 0.05 619.00 1.10 420.00 4.00 3.70 0.07 3.20 0.03 0.90 0.40 9.00 15.40 24.65
81 SI20 30.00 0.52 1.10 0.13 275.00 2.20 500.00 6.20 8.60 0.20 5.30 0.07 1.40 0.40 12.20 37.70 63.39
82 SI21 40.00 0.98 0.60 0.23 313.00 1.80 530.00 8.60 15.50 0.16 5.70 0.06 1.80 0.40 13.40 22.50 72.25
83 SI22 60.00 0.50 1.10 0.21 236.00 2.10 670.00 9.30 11.40 0.17 6.60 0.05 2.10 0.60 37.90 37.40 28.35
84 SI23 20.00 0.81 0.90 0.14 291.00 1.60 570.00 6.40 10.90 2.08 4.30 0.04 1.90 0.60 10.60 30.00 49.90
85 SI24 20.00 0.78 0.90 0.13 356.00 2.20 730.00 7.70 10.10 2.55 5.50 0.04 2.00 0.70 10.40 30.20 48.20
86 SI25 50.00 1.18 1.20 0.25 247.00 2.30 410.00 6.20 16.40 0.25 6.10 0.07 1.60 0.60 12.50 44.60 58.07
87 SI26 30.00 0.80 2.10 0.19 112.00 1.60 180.00 4.60 12.00 0.15 5.60 0.04 1.70 0.40 7.80 74.30 20.64
88 SI27 40.00 0.54 1.10 0.12 101.00 1.60 250.00 3.70 7.90 0.20 4.70 0.04 1.40 0.50 6.90 44.50 13.55
89 SI28 50.00 1.22 1.00 0.24 270.00 2.30 420.00 7.00 16.70 0.20 6.20 0.08 1.70 0.50 12.70 38.80 59.52
No. Sample
(ppm)
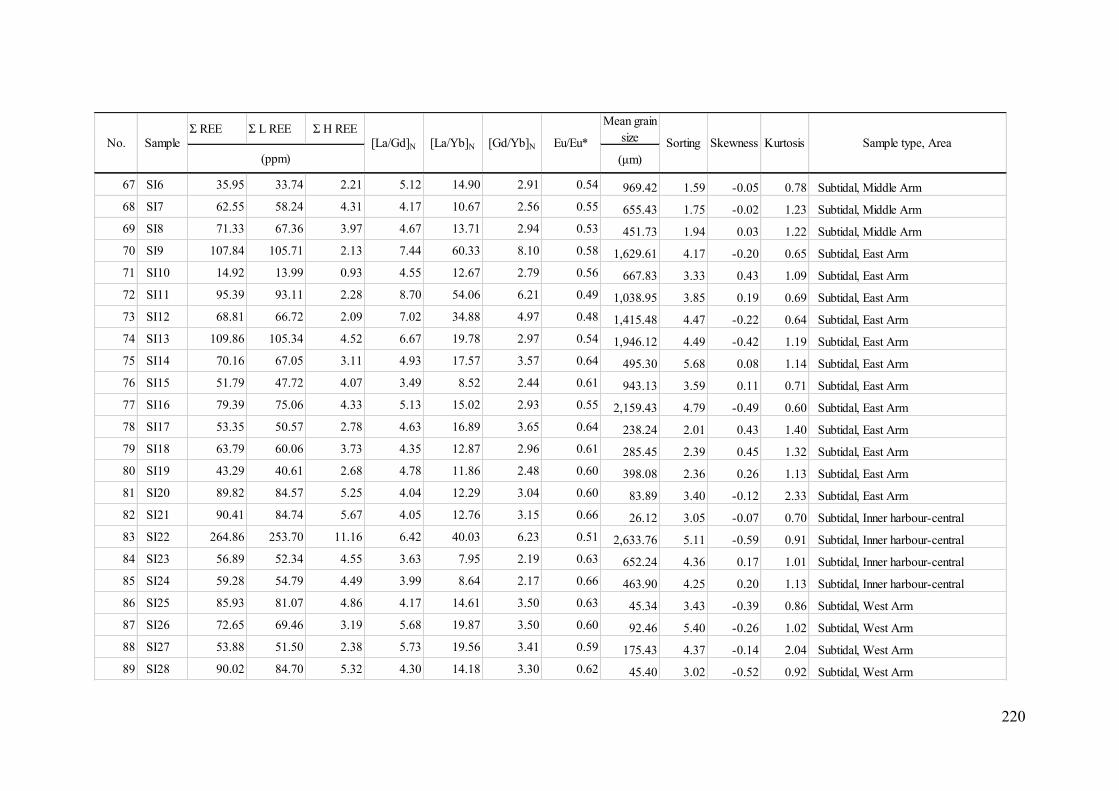
220
Σ REE Σ L REE Σ H REEMean grain
size
(μm)
67 SI6 35.95 33.74 2.21 5.12 14.90 2.91 0.54 969.42 1.59 -0.05 0.78 Subtidal, Middle Arm
68 SI7 62.55 58.24 4.31 4.17 10.67 2.56 0.55 655.43 1.75 -0.02 1.23 Subtidal, Middle Arm
69 SI8 71.33 67.36 3.97 4.67 13.71 2.94 0.53 451.73 1.94 0.03 1.22 Subtidal, Middle Arm
70 SI9 107.84 105.71 2.13 7.44 60.33 8.10 0.58 1,629.61 4.17 -0.20 0.65 Subtidal, East Arm
71 SI10 14.92 13.99 0.93 4.55 12.67 2.79 0.56 667.83 3.33 0.43 1.09 Subtidal, East Arm
72 SI11 95.39 93.11 2.28 8.70 54.06 6.21 0.49 1,038.95 3.85 0.19 0.69 Subtidal, East Arm
73 SI12 68.81 66.72 2.09 7.02 34.88 4.97 0.48 1,415.48 4.47 -0.22 0.64 Subtidal, East Arm
74 SI13 109.86 105.34 4.52 6.67 19.78 2.97 0.54 1,946.12 4.49 -0.42 1.19 Subtidal, East Arm
75 SI14 70.16 67.05 3.11 4.93 17.57 3.57 0.64 495.30 5.68 0.08 1.14 Subtidal, East Arm
76 SI15 51.79 47.72 4.07 3.49 8.52 2.44 0.61 943.13 3.59 0.11 0.71 Subtidal, East Arm
77 SI16 79.39 75.06 4.33 5.13 15.02 2.93 0.55 2,159.43 4.79 -0.49 0.60 Subtidal, East Arm
78 SI17 53.35 50.57 2.78 4.63 16.89 3.65 0.64 238.24 2.01 0.43 1.40 Subtidal, East Arm
79 SI18 63.79 60.06 3.73 4.35 12.87 2.96 0.61 285.45 2.39 0.45 1.32 Subtidal, East Arm
80 SI19 43.29 40.61 2.68 4.78 11.86 2.48 0.60 398.08 2.36 0.26 1.13 Subtidal, East Arm
81 SI20 89.82 84.57 5.25 4.04 12.29 3.04 0.60 83.89 3.40 -0.12 2.33 Subtidal, East Arm
82 SI21 90.41 84.74 5.67 4.05 12.76 3.15 0.66 26.12 3.05 -0.07 0.70 Subtidal, Inner harbour-central
83 SI22 264.86 253.70 11.16 6.42 40.03 6.23 0.51 2,633.76 5.11 -0.59 0.91 Subtidal, Inner harbour-central
84 SI23 56.89 52.34 4.55 3.63 7.95 2.19 0.63 652.24 4.36 0.17 1.01 Subtidal, Inner harbour-central
85 SI24 59.28 54.79 4.49 3.99 8.64 2.17 0.66 463.90 4.25 0.20 1.13 Subtidal, Inner harbour-central
86 SI25 85.93 81.07 4.86 4.17 14.61 3.50 0.63 45.34 3.43 -0.39 0.86 Subtidal, West Arm
87 SI26 72.65 69.46 3.19 5.68 19.87 3.50 0.60 92.46 5.40 -0.26 1.02 Subtidal, West Arm
88 SI27 53.88 51.50 2.38 5.73 19.56 3.41 0.59 175.43 4.37 -0.14 2.04 Subtidal, West Arm
89 SI28 90.02 84.70 5.32 4.30 14.18 3.30 0.62 45.40 3.02 -0.52 0.92 Subtidal, West Arm
Skewness Kurtosis Sample type, Area
(ppm)
[La/Gd]N [La/Yb]N [Gd/Yb]N Eu/Eu* SortingNo. Sample
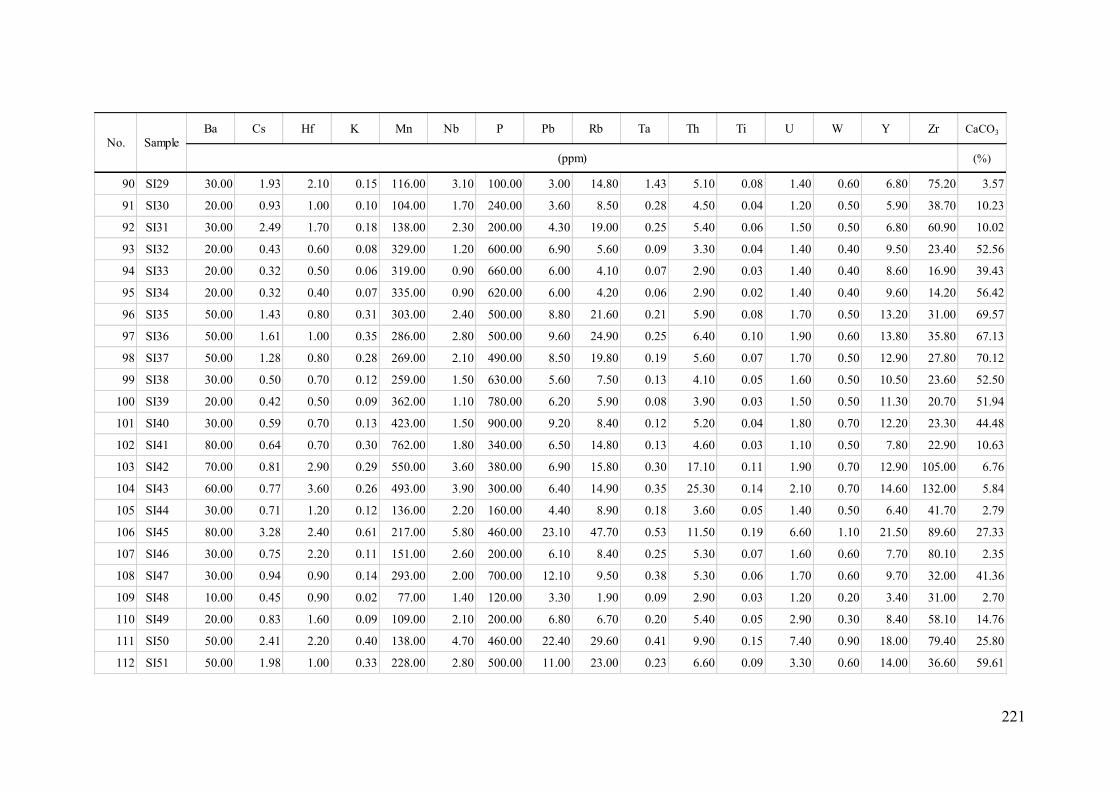
221
Ba Cs Hf K Mn Nb P Pb Rb Ta Th Ti U W Y Zr CaCO3
(%)
90 SI29 30.00 1.93 2.10 0.15 116.00 3.10 100.00 3.00 14.80 1.43 5.10 0.08 1.40 0.60 6.80 75.20 3.57
91 SI30 20.00 0.93 1.00 0.10 104.00 1.70 240.00 3.60 8.50 0.28 4.50 0.04 1.20 0.50 5.90 38.70 10.23
92 SI31 30.00 2.49 1.70 0.18 138.00 2.30 200.00 4.30 19.00 0.25 5.40 0.06 1.50 0.50 6.80 60.90 10.02
93 SI32 20.00 0.43 0.60 0.08 329.00 1.20 600.00 6.90 5.60 0.09 3.30 0.04 1.40 0.40 9.50 23.40 52.56
94 SI33 20.00 0.32 0.50 0.06 319.00 0.90 660.00 6.00 4.10 0.07 2.90 0.03 1.40 0.40 8.60 16.90 39.43
95 SI34 20.00 0.32 0.40 0.07 335.00 0.90 620.00 6.00 4.20 0.06 2.90 0.02 1.40 0.40 9.60 14.20 56.42
96 SI35 50.00 1.43 0.80 0.31 303.00 2.40 500.00 8.80 21.60 0.21 5.90 0.08 1.70 0.50 13.20 31.00 69.57
97 SI36 50.00 1.61 1.00 0.35 286.00 2.80 500.00 9.60 24.90 0.25 6.40 0.10 1.90 0.60 13.80 35.80 67.13
98 SI37 50.00 1.28 0.80 0.28 269.00 2.10 490.00 8.50 19.80 0.19 5.60 0.07 1.70 0.50 12.90 27.80 70.12
99 SI38 30.00 0.50 0.70 0.12 259.00 1.50 630.00 5.60 7.50 0.13 4.10 0.05 1.60 0.50 10.50 23.60 52.50
100 SI39 20.00 0.42 0.50 0.09 362.00 1.10 780.00 6.20 5.90 0.08 3.90 0.03 1.50 0.50 11.30 20.70 51.94
101 SI40 30.00 0.59 0.70 0.13 423.00 1.50 900.00 9.20 8.40 0.12 5.20 0.04 1.80 0.70 12.20 23.30 44.48
102 SI41 80.00 0.64 0.70 0.30 762.00 1.80 340.00 6.50 14.80 0.13 4.60 0.03 1.10 0.50 7.80 22.90 10.63
103 SI42 70.00 0.81 2.90 0.29 550.00 3.60 380.00 6.90 15.80 0.30 17.10 0.11 1.90 0.70 12.90 105.00 6.76
104 SI43 60.00 0.77 3.60 0.26 493.00 3.90 300.00 6.40 14.90 0.35 25.30 0.14 2.10 0.70 14.60 132.00 5.84
105 SI44 30.00 0.71 1.20 0.12 136.00 2.20 160.00 4.40 8.90 0.18 3.60 0.05 1.40 0.50 6.40 41.70 2.79
106 SI45 80.00 3.28 2.40 0.61 217.00 5.80 460.00 23.10 47.70 0.53 11.50 0.19 6.60 1.10 21.50 89.60 27.33
107 SI46 30.00 0.75 2.20 0.11 151.00 2.60 200.00 6.10 8.40 0.25 5.30 0.07 1.60 0.60 7.70 80.10 2.35
108 SI47 30.00 0.94 0.90 0.14 293.00 2.00 700.00 12.10 9.50 0.38 5.30 0.06 1.70 0.60 9.70 32.00 41.36
109 SI48 10.00 0.45 0.90 0.02 77.00 1.40 120.00 3.30 1.90 0.09 2.90 0.03 1.20 0.20 3.40 31.00 2.70
110 SI49 20.00 0.83 1.60 0.09 109.00 2.10 200.00 6.80 6.70 0.20 5.40 0.05 2.90 0.30 8.40 58.10 14.76
111 SI50 50.00 2.41 2.20 0.40 138.00 4.70 460.00 22.40 29.60 0.41 9.90 0.15 7.40 0.90 18.00 79.40 25.80
112 SI51 50.00 1.98 1.00 0.33 228.00 2.80 500.00 11.00 23.00 0.23 6.60 0.09 3.30 0.60 14.00 36.60 59.61
No. Sample
(ppm)
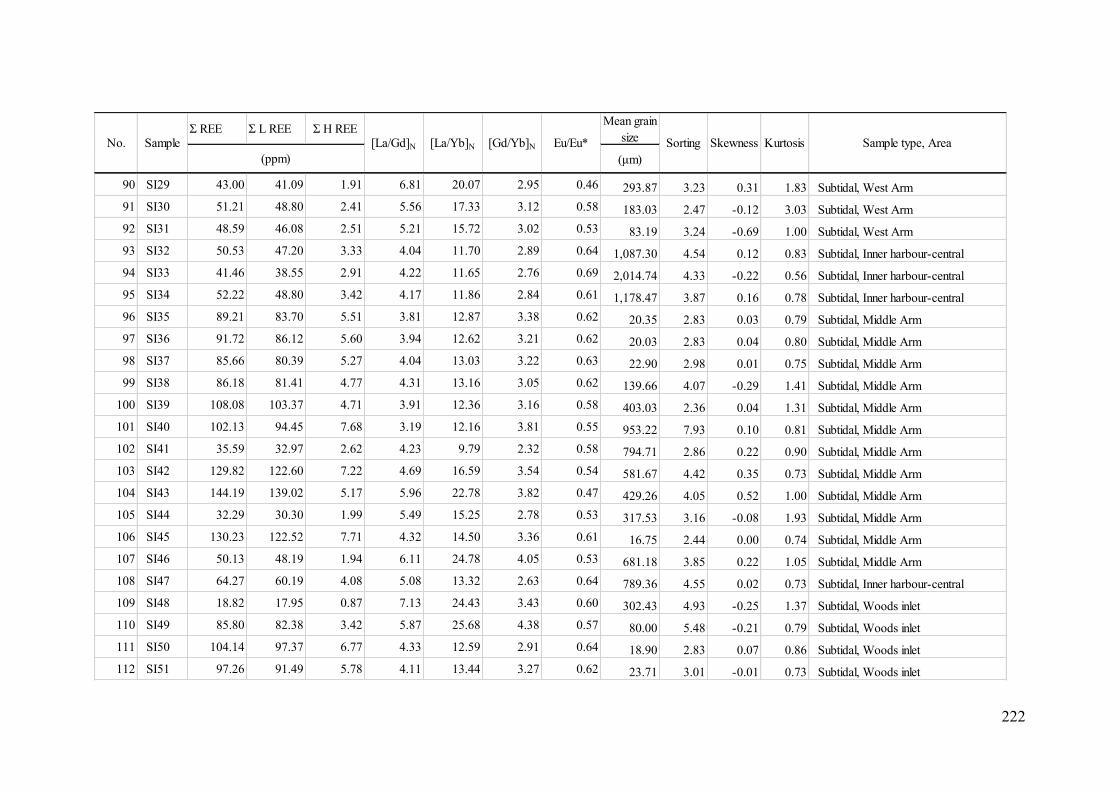
222
Σ REE Σ L REE Σ H REEMean grain
size
(μm)
90 SI29 43.00 41.09 1.91 6.81 20.07 2.95 0.46 293.87 3.23 0.31 1.83 Subtidal, West Arm
91 SI30 51.21 48.80 2.41 5.56 17.33 3.12 0.58 183.03 2.47 -0.12 3.03 Subtidal, West Arm
92 SI31 48.59 46.08 2.51 5.21 15.72 3.02 0.53 83.19 3.24 -0.69 1.00 Subtidal, West Arm
93 SI32 50.53 47.20 3.33 4.04 11.70 2.89 0.64 1,087.30 4.54 0.12 0.83 Subtidal, Inner harbour-central
94 SI33 41.46 38.55 2.91 4.22 11.65 2.76 0.69 2,014.74 4.33 -0.22 0.56 Subtidal, Inner harbour-central
95 SI34 52.22 48.80 3.42 4.17 11.86 2.84 0.61 1,178.47 3.87 0.16 0.78 Subtidal, Inner harbour-central
96 SI35 89.21 83.70 5.51 3.81 12.87 3.38 0.62 20.35 2.83 0.03 0.79 Subtidal, Middle Arm
97 SI36 91.72 86.12 5.60 3.94 12.62 3.21 0.62 20.03 2.83 0.04 0.80 Subtidal, Middle Arm
98 SI37 85.66 80.39 5.27 4.04 13.03 3.22 0.63 22.90 2.98 0.01 0.75 Subtidal, Middle Arm
99 SI38 86.18 81.41 4.77 4.31 13.16 3.05 0.62 139.66 4.07 -0.29 1.41 Subtidal, Middle Arm
100 SI39 108.08 103.37 4.71 3.91 12.36 3.16 0.58 403.03 2.36 0.04 1.31 Subtidal, Middle Arm
101 SI40 102.13 94.45 7.68 3.19 12.16 3.81 0.55 953.22 7.93 0.10 0.81 Subtidal, Middle Arm
102 SI41 35.59 32.97 2.62 4.23 9.79 2.32 0.58 794.71 2.86 0.22 0.90 Subtidal, Middle Arm
103 SI42 129.82 122.60 7.22 4.69 16.59 3.54 0.54 581.67 4.42 0.35 0.73 Subtidal, Middle Arm
104 SI43 144.19 139.02 5.17 5.96 22.78 3.82 0.47 429.26 4.05 0.52 1.00 Subtidal, Middle Arm
105 SI44 32.29 30.30 1.99 5.49 15.25 2.78 0.53 317.53 3.16 -0.08 1.93 Subtidal, Middle Arm
106 SI45 130.23 122.52 7.71 4.32 14.50 3.36 0.61 16.75 2.44 0.00 0.74 Subtidal, Middle Arm
107 SI46 50.13 48.19 1.94 6.11 24.78 4.05 0.53 681.18 3.85 0.22 1.05 Subtidal, Middle Arm
108 SI47 64.27 60.19 4.08 5.08 13.32 2.63 0.64 789.36 4.55 0.02 0.73 Subtidal, Inner harbour-central
109 SI48 18.82 17.95 0.87 7.13 24.43 3.43 0.60 302.43 4.93 -0.25 1.37 Subtidal, Woods inlet
110 SI49 85.80 82.38 3.42 5.87 25.68 4.38 0.57 80.00 5.48 -0.21 0.79 Subtidal, Woods inlet
111 SI50 104.14 97.37 6.77 4.33 12.59 2.91 0.64 18.90 2.83 0.07 0.86 Subtidal, Woods inlet
112 SI51 97.26 91.49 5.78 4.11 13.44 3.27 0.62 23.71 3.01 -0.01 0.73 Subtidal, Woods inlet
Kurtosis Sample type, Area
(ppm)
[La/Yb]N [Gd/Yb]N Eu/Eu* Sorting SkewnessNo. Sample [La/Gd]N
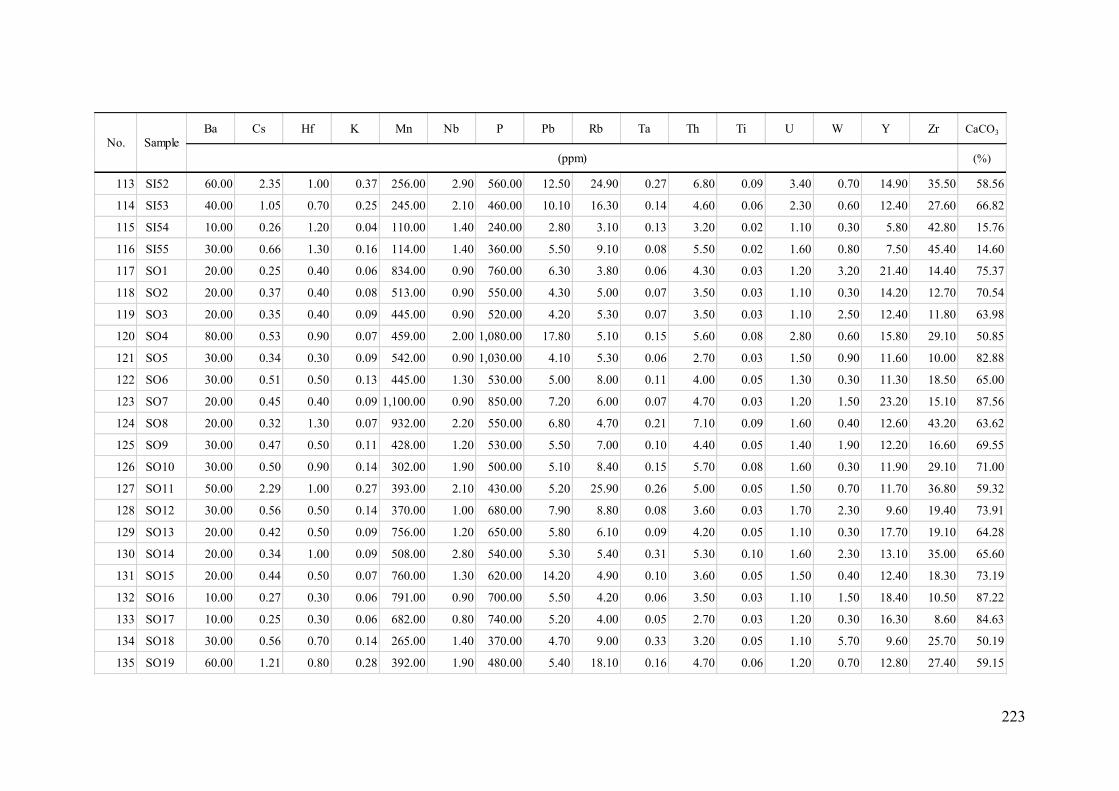
223
Ba Cs Hf K Mn Nb P Pb Rb Ta Th Ti U W Y Zr CaCO3
(%)
113 SI52 60.00 2.35 1.00 0.37 256.00 2.90 560.00 12.50 24.90 0.27 6.80 0.09 3.40 0.70 14.90 35.50 58.56
114 SI53 40.00 1.05 0.70 0.25 245.00 2.10 460.00 10.10 16.30 0.14 4.60 0.06 2.30 0.60 12.40 27.60 66.82
115 SI54 10.00 0.26 1.20 0.04 110.00 1.40 240.00 2.80 3.10 0.13 3.20 0.02 1.10 0.30 5.80 42.80 15.76
116 SI55 30.00 0.66 1.30 0.16 114.00 1.40 360.00 5.50 9.10 0.08 5.50 0.02 1.60 0.80 7.50 45.40 14.60
117 SO1 20.00 0.25 0.40 0.06 834.00 0.90 760.00 6.30 3.80 0.06 4.30 0.03 1.20 3.20 21.40 14.40 75.37
118 SO2 20.00 0.37 0.40 0.08 513.00 0.90 550.00 4.30 5.00 0.07 3.50 0.03 1.10 0.30 14.20 12.70 70.54
119 SO3 20.00 0.35 0.40 0.09 445.00 0.90 520.00 4.20 5.30 0.07 3.50 0.03 1.10 2.50 12.40 11.80 63.98
120 SO4 80.00 0.53 0.90 0.07 459.00 2.00 1,080.00 17.80 5.10 0.15 5.60 0.08 2.80 0.60 15.80 29.10 50.85
121 SO5 30.00 0.34 0.30 0.09 542.00 0.90 1,030.00 4.10 5.30 0.06 2.70 0.03 1.50 0.90 11.60 10.00 82.88
122 SO6 30.00 0.51 0.50 0.13 445.00 1.30 530.00 5.00 8.00 0.11 4.00 0.05 1.30 0.30 11.30 18.50 65.00
123 SO7 20.00 0.45 0.40 0.09 1,100.00 0.90 850.00 7.20 6.00 0.07 4.70 0.03 1.20 1.50 23.20 15.10 87.56
124 SO8 20.00 0.32 1.30 0.07 932.00 2.20 550.00 6.80 4.70 0.21 7.10 0.09 1.60 0.40 12.60 43.20 63.62
125 SO9 30.00 0.47 0.50 0.11 428.00 1.20 530.00 5.50 7.00 0.10 4.40 0.05 1.40 1.90 12.20 16.60 69.55
126 SO10 30.00 0.50 0.90 0.14 302.00 1.90 500.00 5.10 8.40 0.15 5.70 0.08 1.60 0.30 11.90 29.10 71.00
127 SO11 50.00 2.29 1.00 0.27 393.00 2.10 430.00 5.20 25.90 0.26 5.00 0.05 1.50 0.70 11.70 36.80 59.32
128 SO12 30.00 0.56 0.50 0.14 370.00 1.00 680.00 7.90 8.80 0.08 3.60 0.03 1.70 2.30 9.60 19.40 73.91
129 SO13 20.00 0.42 0.50 0.09 756.00 1.20 650.00 5.80 6.10 0.09 4.20 0.05 1.10 0.30 17.70 19.10 64.28
130 SO14 20.00 0.34 1.00 0.09 508.00 2.80 540.00 5.30 5.40 0.31 5.30 0.10 1.60 2.30 13.10 35.00 65.60
131 SO15 20.00 0.44 0.50 0.07 760.00 1.30 620.00 14.20 4.90 0.10 3.60 0.05 1.50 0.40 12.40 18.30 73.19
132 SO16 10.00 0.27 0.30 0.06 791.00 0.90 700.00 5.50 4.20 0.06 3.50 0.03 1.10 1.50 18.40 10.50 87.22
133 SO17 10.00 0.25 0.30 0.06 682.00 0.80 740.00 5.20 4.00 0.05 2.70 0.03 1.20 0.30 16.30 8.60 84.63
134 SO18 30.00 0.56 0.70 0.14 265.00 1.40 370.00 4.70 9.00 0.33 3.20 0.05 1.10 5.70 9.60 25.70 50.19
135 SO19 60.00 1.21 0.80 0.28 392.00 1.90 480.00 5.40 18.10 0.16 4.70 0.06 1.20 0.70 12.80 27.40 59.15
No. Sample
(ppm)
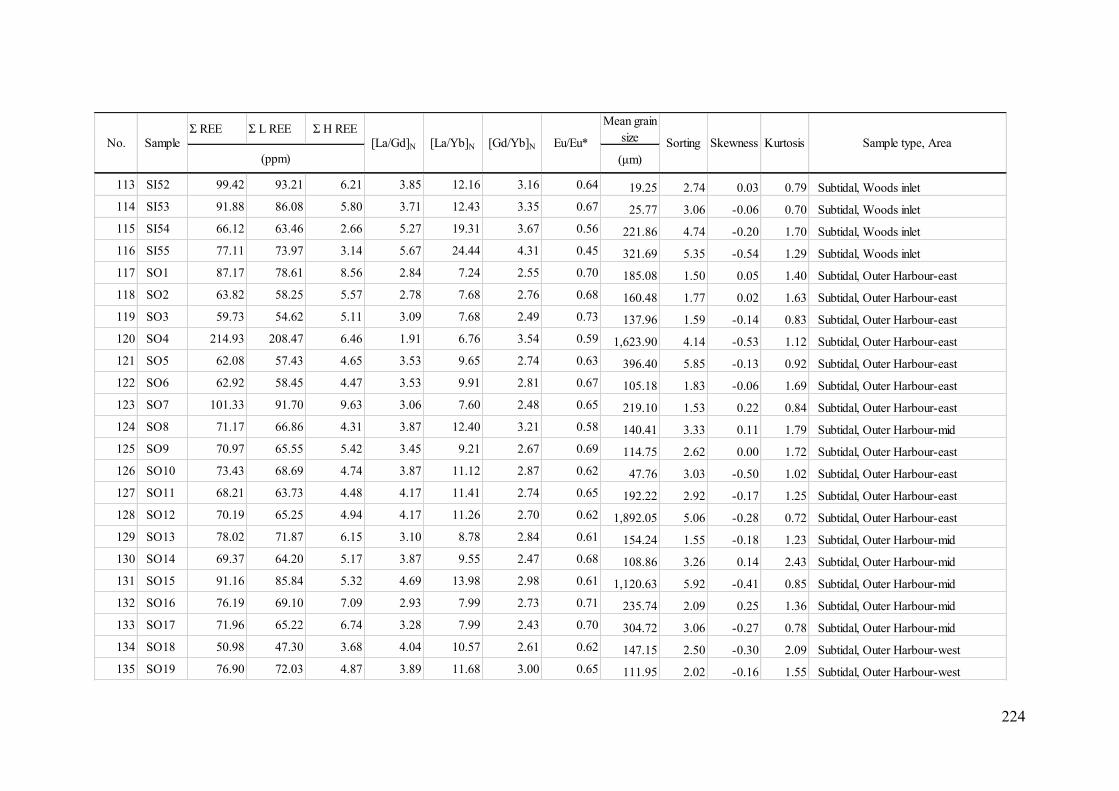
224
Σ REE Σ L REE Σ H REEMean grain
size
(μm)
113 SI52 99.42 93.21 6.21 3.85 12.16 3.16 0.64 19.25 2.74 0.03 0.79 Subtidal, Woods inlet
114 SI53 91.88 86.08 5.80 3.71 12.43 3.35 0.67 25.77 3.06 -0.06 0.70 Subtidal, Woods inlet
115 SI54 66.12 63.46 2.66 5.27 19.31 3.67 0.56 221.86 4.74 -0.20 1.70 Subtidal, Woods inlet
116 SI55 77.11 73.97 3.14 5.67 24.44 4.31 0.45 321.69 5.35 -0.54 1.29 Subtidal, Woods inlet
117 SO1 87.17 78.61 8.56 2.84 7.24 2.55 0.70 185.08 1.50 0.05 1.40 Subtidal, Outer Harbour-east
118 SO2 63.82 58.25 5.57 2.78 7.68 2.76 0.68 160.48 1.77 0.02 1.63 Subtidal, Outer Harbour-east
119 SO3 59.73 54.62 5.11 3.09 7.68 2.49 0.73 137.96 1.59 -0.14 0.83 Subtidal, Outer Harbour-east
120 SO4 214.93 208.47 6.46 1.91 6.76 3.54 0.59 1,623.90 4.14 -0.53 1.12 Subtidal, Outer Harbour-east
121 SO5 62.08 57.43 4.65 3.53 9.65 2.74 0.63 396.40 5.85 -0.13 0.92 Subtidal, Outer Harbour-east
122 SO6 62.92 58.45 4.47 3.53 9.91 2.81 0.67 105.18 1.83 -0.06 1.69 Subtidal, Outer Harbour-east
123 SO7 101.33 91.70 9.63 3.06 7.60 2.48 0.65 219.10 1.53 0.22 0.84 Subtidal, Outer Harbour-east
124 SO8 71.17 66.86 4.31 3.87 12.40 3.21 0.58 140.41 3.33 0.11 1.79 Subtidal, Outer Harbour-mid
125 SO9 70.97 65.55 5.42 3.45 9.21 2.67 0.69 114.75 2.62 0.00 1.72 Subtidal, Outer Harbour-east
126 SO10 73.43 68.69 4.74 3.87 11.12 2.87 0.62 47.76 3.03 -0.50 1.02 Subtidal, Outer Harbour-east
127 SO11 68.21 63.73 4.48 4.17 11.41 2.74 0.65 192.22 2.92 -0.17 1.25 Subtidal, Outer Harbour-east
128 SO12 70.19 65.25 4.94 4.17 11.26 2.70 0.62 1,892.05 5.06 -0.28 0.72 Subtidal, Outer Harbour-east
129 SO13 78.02 71.87 6.15 3.10 8.78 2.84 0.61 154.24 1.55 -0.18 1.23 Subtidal, Outer Harbour-mid
130 SO14 69.37 64.20 5.17 3.87 9.55 2.47 0.68 108.86 3.26 0.14 2.43 Subtidal, Outer Harbour-mid
131 SO15 91.16 85.84 5.32 4.69 13.98 2.98 0.61 1,120.63 5.92 -0.41 0.85 Subtidal, Outer Harbour-mid
132 SO16 76.19 69.10 7.09 2.93 7.99 2.73 0.71 235.74 2.09 0.25 1.36 Subtidal, Outer Harbour-mid
133 SO17 71.96 65.22 6.74 3.28 7.99 2.43 0.70 304.72 3.06 -0.27 0.78 Subtidal, Outer Harbour-mid
134 SO18 50.98 47.30 3.68 4.04 10.57 2.61 0.62 147.15 2.50 -0.30 2.09 Subtidal, Outer Harbour-west
135 SO19 76.90 72.03 4.87 3.89 11.68 3.00 0.65 111.95 2.02 -0.16 1.55 Subtidal, Outer Harbour-west
(ppm)
No. Sample [La/Gd]N [La/Yb]N [Gd/Yb]N Eu/Eu* Sorting Skewness Kurtosis Sample type, Area
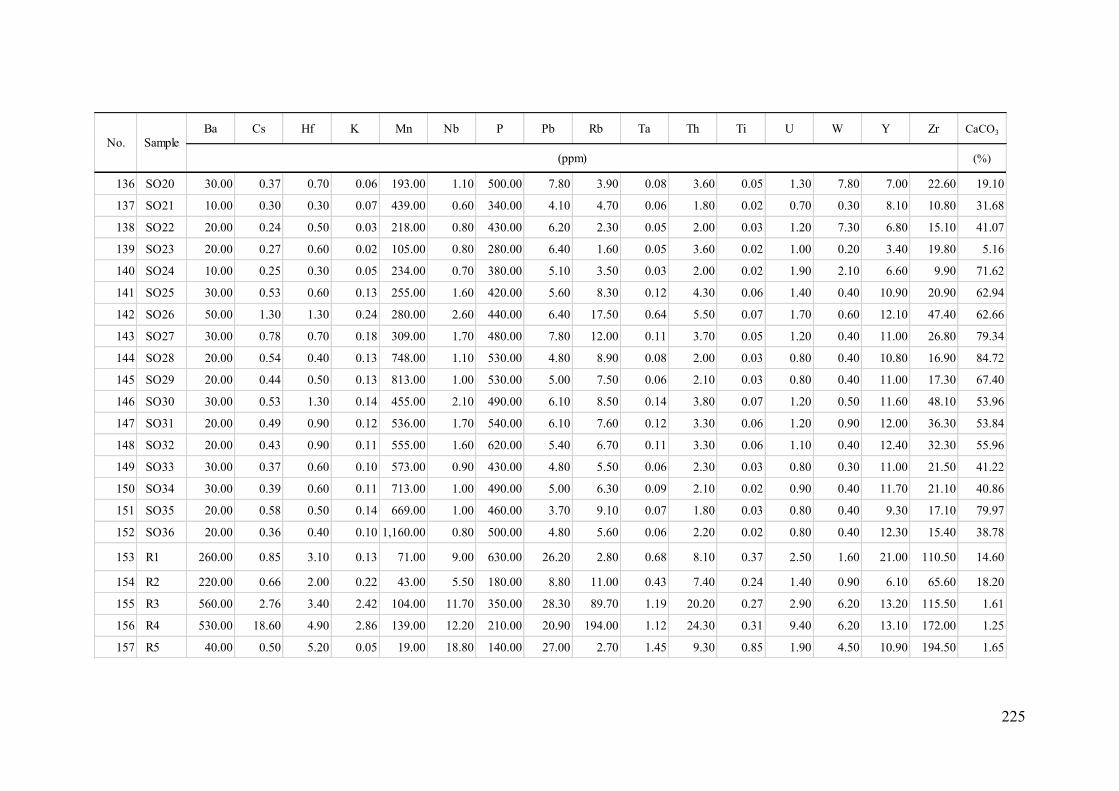
225
Ba Cs Hf K Mn Nb P Pb Rb Ta Th Ti U W Y Zr CaCO3
(%)
136 SO20 30.00 0.37 0.70 0.06 193.00 1.10 500.00 7.80 3.90 0.08 3.60 0.05 1.30 7.80 7.00 22.60 19.10
137 SO21 10.00 0.30 0.30 0.07 439.00 0.60 340.00 4.10 4.70 0.06 1.80 0.02 0.70 0.30 8.10 10.80 31.68
138 SO22 20.00 0.24 0.50 0.03 218.00 0.80 430.00 6.20 2.30 0.05 2.00 0.03 1.20 7.30 6.80 15.10 41.07
139 SO23 20.00 0.27 0.60 0.02 105.00 0.80 280.00 6.40 1.60 0.05 3.60 0.02 1.00 0.20 3.40 19.80 5.16
140 SO24 10.00 0.25 0.30 0.05 234.00 0.70 380.00 5.10 3.50 0.03 2.00 0.02 1.90 2.10 6.60 9.90 71.62
141 SO25 30.00 0.53 0.60 0.13 255.00 1.60 420.00 5.60 8.30 0.12 4.30 0.06 1.40 0.40 10.90 20.90 62.94
142 SO26 50.00 1.30 1.30 0.24 280.00 2.60 440.00 6.40 17.50 0.64 5.50 0.07 1.70 0.60 12.10 47.40 62.66
143 SO27 30.00 0.78 0.70 0.18 309.00 1.70 480.00 7.80 12.00 0.11 3.70 0.05 1.20 0.40 11.00 26.80 79.34
144 SO28 20.00 0.54 0.40 0.13 748.00 1.10 530.00 4.80 8.90 0.08 2.00 0.03 0.80 0.40 10.80 16.90 84.72
145 SO29 20.00 0.44 0.50 0.13 813.00 1.00 530.00 5.00 7.50 0.06 2.10 0.03 0.80 0.40 11.00 17.30 67.40
146 SO30 30.00 0.53 1.30 0.14 455.00 2.10 490.00 6.10 8.50 0.14 3.80 0.07 1.20 0.50 11.60 48.10 53.96
147 SO31 20.00 0.49 0.90 0.12 536.00 1.70 540.00 6.10 7.60 0.12 3.30 0.06 1.20 0.90 12.00 36.30 53.84
148 SO32 20.00 0.43 0.90 0.11 555.00 1.60 620.00 5.40 6.70 0.11 3.30 0.06 1.10 0.40 12.40 32.30 55.96
149 SO33 30.00 0.37 0.60 0.10 573.00 0.90 430.00 4.80 5.50 0.06 2.30 0.03 0.80 0.30 11.00 21.50 41.22
150 SO34 30.00 0.39 0.60 0.11 713.00 1.00 490.00 5.00 6.30 0.09 2.10 0.02 0.90 0.40 11.70 21.10 40.86
151 SO35 20.00 0.58 0.50 0.14 669.00 1.00 460.00 3.70 9.10 0.07 1.80 0.03 0.80 0.40 9.30 17.10 79.97
152 SO36 20.00 0.36 0.40 0.10 1,160.00 0.80 500.00 4.80 5.60 0.06 2.20 0.02 0.80 0.40 12.30 15.40 38.78
153 R1 260.00 0.85 3.10 0.13 71.00 9.00 630.00 26.20 2.80 0.68 8.10 0.37 2.50 1.60 21.00 110.50 14.60
154 R2 220.00 0.66 2.00 0.22 43.00 5.50 180.00 8.80 11.00 0.43 7.40 0.24 1.40 0.90 6.10 65.60 18.20
155 R3 560.00 2.76 3.40 2.42 104.00 11.70 350.00 28.30 89.70 1.19 20.20 0.27 2.90 6.20 13.20 115.50 1.61
156 R4 530.00 18.60 4.90 2.86 139.00 12.20 210.00 20.90 194.00 1.12 24.30 0.31 9.40 6.20 13.10 172.00 1.25
157 R5 40.00 0.50 5.20 0.05 19.00 18.80 140.00 27.00 2.70 1.45 9.30 0.85 1.90 4.50 10.90 194.50 1.65
No. Sample
(ppm)
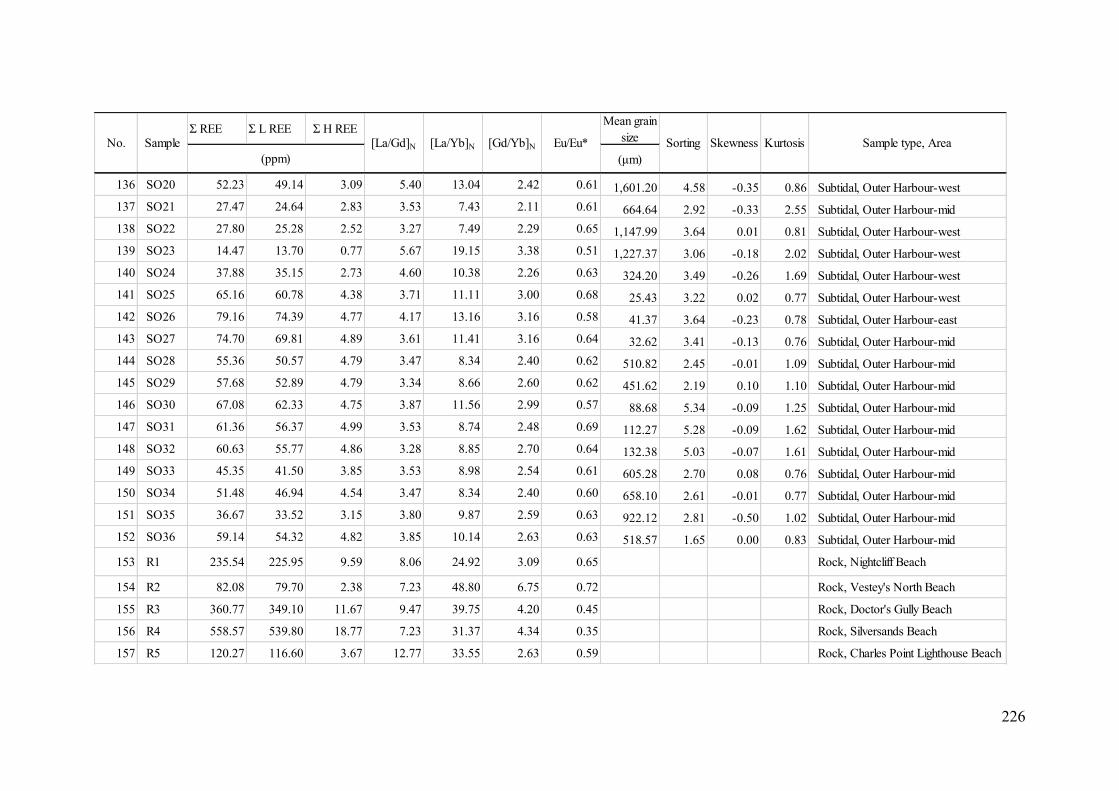
226
Σ REE Σ L REE Σ H REEMean grain
size
(μm)
136 SO20 52.23 49.14 3.09 5.40 13.04 2.42 0.61 1,601.20 4.58 -0.35 0.86 Subtidal, Outer Harbour-west
137 SO21 27.47 24.64 2.83 3.53 7.43 2.11 0.61 664.64 2.92 -0.33 2.55 Subtidal, Outer Harbour-mid
138 SO22 27.80 25.28 2.52 3.27 7.49 2.29 0.65 1,147.99 3.64 0.01 0.81 Subtidal, Outer Harbour-west
139 SO23 14.47 13.70 0.77 5.67 19.15 3.38 0.51 1,227.37 3.06 -0.18 2.02 Subtidal, Outer Harbour-west
140 SO24 37.88 35.15 2.73 4.60 10.38 2.26 0.63 324.20 3.49 -0.26 1.69 Subtidal, Outer Harbour-west
141 SO25 65.16 60.78 4.38 3.71 11.11 3.00 0.68 25.43 3.22 0.02 0.77 Subtidal, Outer Harbour-west
142 SO26 79.16 74.39 4.77 4.17 13.16 3.16 0.58 41.37 3.64 -0.23 0.78 Subtidal, Outer Harbour-east
143 SO27 74.70 69.81 4.89 3.61 11.41 3.16 0.64 32.62 3.41 -0.13 0.76 Subtidal, Outer Harbour-mid
144 SO28 55.36 50.57 4.79 3.47 8.34 2.40 0.62 510.82 2.45 -0.01 1.09 Subtidal, Outer Harbour-mid
145 SO29 57.68 52.89 4.79 3.34 8.66 2.60 0.62 451.62 2.19 0.10 1.10 Subtidal, Outer Harbour-mid
146 SO30 67.08 62.33 4.75 3.87 11.56 2.99 0.57 88.68 5.34 -0.09 1.25 Subtidal, Outer Harbour-mid
147 SO31 61.36 56.37 4.99 3.53 8.74 2.48 0.69 112.27 5.28 -0.09 1.62 Subtidal, Outer Harbour-mid
148 SO32 60.63 55.77 4.86 3.28 8.85 2.70 0.64 132.38 5.03 -0.07 1.61 Subtidal, Outer Harbour-mid
149 SO33 45.35 41.50 3.85 3.53 8.98 2.54 0.61 605.28 2.70 0.08 0.76 Subtidal, Outer Harbour-mid
150 SO34 51.48 46.94 4.54 3.47 8.34 2.40 0.60 658.10 2.61 -0.01 0.77 Subtidal, Outer Harbour-mid
151 SO35 36.67 33.52 3.15 3.80 9.87 2.59 0.63 922.12 2.81 -0.50 1.02 Subtidal, Outer Harbour-mid
152 SO36 59.14 54.32 4.82 3.85 10.14 2.63 0.63 518.57 1.65 0.00 0.83 Subtidal, Outer Harbour-mid
153 R1 235.54 225.95 9.59 8.06 24.92 3.09 0.65 Rock, Nightcliff Beach
154 R2 82.08 79.70 2.38 7.23 48.80 6.75 0.72 Rock, Vestey's North Beach
155 R3 360.77 349.10 11.67 9.47 39.75 4.20 0.45 Rock, Doctor's Gully Beach
156 R4 558.57 539.80 18.77 7.23 31.37 4.34 0.35 Rock, Silversands Beach
157 R5 120.27 116.60 3.67 12.77 33.55 2.63 0.59 Rock, Charles Point Lighthouse Beach
Skewness Kurtosis Sample type, Area
(ppm)
[La/Gd]N [La/Yb]N [Gd/Yb]N Eu/Eu* SortingNo. Sample
Related Documents