IN THE NAME OF ALLAH THE MOST BENEFICENT AND MERCIFUL

Welcome message from author
This document is posted to help you gain knowledge. Please leave a comment to let me know what you think about it! Share it to your friends and learn new things together.
Transcript

IN THE NAME OF ALLAH THE MOST BENEFICENT AND MERCIFUL
ii
Pre and postharvest management to improve yield and quality of
strawberry (Fragaria × ananassa) cv. ‘Chandler’
By
SANA SHAHZAD
M.Sc. (Hons.) Horticulture
2007-ag-2502
A thesis submitted in the fulfillment of the
requirements for the degree of
DOCTOR OF PHILOSOPHY
IN
HORTICULTURE
INSTITUTE OF HORTICULTURAL SCIENCES
FACULTY OF AGRICULTURE
UNIVESITY OF AGRICULTURE,
FAISALABAD-PAKISTAN
2019
iii
iv
v
vi
DEDICATION
This Humble Effort is Dedicated to
My Beloved Parents
And
My Respected Supervisor

vii
ACKNOWLEDGEMENT Allah never spoils any effort. Every piece of work is rewarded according to the
nature of devotion in it. I am, though, never be feeling myself able to offer my thanks
to Almighty ALLAH, the propitious, the sole creator of the universe, the source of all
knowledge and wisdom. Trembling lips and wet eyes praise for Holy Prophet
Muhammad (P.B.U.H), who is a torch of guidance and knowledge for humanity
forever, for his sacredness, due to whom I have been able to achieve this milestone of
my academic career. I wish to record my sincerest appreciations to my Supervisor
Prof. Dr. Saeed Ahmad, Institute of Horticultural Sciences, University of
Agriculture, Faisalabad, for her valuable comments and guidance.
I feel highly privileged to take this opportunity to express my heartiest
gratitude and deep sense of indebt to my worthy supervisory committee, Dr. Raheel
Anwar Assistant Professor and Prof. Dr. Rashid Ahmed, Dept. of Agronomy, for
their incentive teaching and valuable suggestions. I offer my gratitude especially to
my Grandfather Mian Abdul Khaliq, my Father Shahzad Khaliq, my Mother Azra
Begum, my Brother Zunair Shahzad and my Sister Sundas Shahzad, whose prayers
and inspirations are the torch to my destination and my honorable Uncle, Kashif
Hussain and my Aunties Shazia Kashif, Nazia Tariq who inspired me to higher
ideas of life and whose hands always rise in prayer of my success.
I would like to record my sincerest thanks to all my seniors, university friends
and colleagues Dr. Waqar Shafqat, Dr. Mehwish Liaquat, Dr. Kanval Shaukat,
Samra Asghar, Furkhanda Kalsoom, Aliya Hanif and special thanks to Mr. Shakeel
(Lab. Assistant) and Mr. Farhan (J.L.A) from pomology Lab. for their generous help,
cooperation and Memorial Company. Whatever I am today, could never have been
without the efforts, prayers, good wishes and sympathetic attitude of my very kind
and loving parents and family members.
Sana Shahzad
viii
ix
2.13 Pre harvest problems of strawberry 12
2.14 Pre harvest management practices to improve yield and quality 12
2.14.1 Effect of mulching material 12
2.14.2 Effect of plant spacing 12
2.14.3 Protected cultivation 12
2.14.4
Effectiveness of calcium chloride (CaCl2) for improving
growth, yield and qualitative characteristics of other
strawberry cultivars
13
2.14.5
Effectiveness of zinc sulfate (ZnSO4) for improving growth,
yield and qualitative characteristics of other strawberry
cultivars
14
2.14.6
Effectiveness of salicylic acid (SA) for improving growth,
yield and qualitative characteristics of other strawberry
cultivars
15
2.14.7
Effectiveness of gibberellic acid (GA3) for improving growth,
yield and qualitative characteristics of other strawberry
cultivars
16
2.15 Postharvest problems of strawberry 17
2.16 Effect of storage application of calcium chloride (CaCl2) on
quality and shelf life of fruits 17
2.17 Effect of storage application of salicylic acid (SA) on quality
and shelf life of fruits 18
Chapter 3 Materials and Methods 20
3.1 Experimental site detail 20
3.1.1 Site selection 20
3.1.2 Soil preparation 20
3.1.3 Preparation of beds 20
3.1.4 Selection of runner plants 20
3.1.5 Planting of runners 20
3.1.6 Foliar application 21
3.1.7 Plant protection with polythene tunnel 21
x
3.2 Study 1 (Salts) 21
3.2.1
Experiment No. 1: Foliar application of calcium chloride
(CaCl2) to improve the vegetative growth, yield and quality of
strawberry cv. „Chandler‟.
21
3.2.2
Experiment No. 2: Foliar application of zinc sulfate (ZnSO4)
to improve the vegetative growth, yield and quality of
strawberry cv. „Chandler‟.
22
3.3 Study 2 (Growth regulators) 22
3.3.1
Experiment No. 1: Foliar application of salicylic acid (SA) to
improve the vegetative growth, yield and quality of strawberry
cv. „Chandler‟.
22
3.3.2
Experiment No. 2: Foliar application of gibberellic acid (GA3)
to improve the vegetative growth, yield and quality of
Strawberry cv. „Chandler‟.
23
3.4 Study 3 (Confirmatory trial) 24
3.4.1
Comparison of calcium chloride (CaCl2), zinc sulfate (ZnSO4),
salicylic acid (SA) and gibberellic acid (GA3) to improve the
vegetative growth, yield and quality of strawberry cv.
„Chandler‟.
24
3.5 Parameters 24
3.5.1 Vegetative parameters 24
3.5.1.1 Number of leaves (plant-1
) 24
3.5.1.2 Leaf area (cm2) 25
3.5.1.3 Flower anthesis (days after foliar application) 25
3.5.1.4 Number of crowns (plant-1
) 25
3.5.1.5 Number of runners (plant-1
) 25
3.5.2 Yield parameters 25
3.5.2.1 Marketable (g plant
-1) 25
3.5.2.2 Unmarketable (g plant
-1) 25
3.5.2.3 Small size (g plant
-1) 26
xi
3.5.3 Fruit quality parameters 26
3.5.3.1 Firmness (kg. cm-2
) 26
3.5.3.2 TSS (ºBrix) 26
3.5.3.3 Titratable acidity (%) 26
3.5.3.4 TSS: TA ratio 26
3.5.3.5 Vitamin C (mg 100 g-1
) 26
3.5.3.6 Total phenolic contents (TPC) and total antioxidants (TA) 27
3.5.3.7 Total phenolic contents (mg GAE 100 g-1
) 27
3.5.3.8 Total antioxidants (% DPPH) 27
3.5.4 Activities of antioxidant enzymes (CAT, SOD and POD)
determination 27
3.5.4.1 Catalase (U mg−1
protein) 28
3.5.4.2 Peroxidase (U mg−1
protein) 28
3.5.4.3 Superoxide dismutase (U mg−1
protein) 28
3.5.5 Survival (%) 28
3.6 Study 4 (Postharvest) 29
3.6.1
Postharvest application of calcium chloride (CaCl2) and
salicylic acid (SA) maintain the quality and improve storage
life of strawberry cv. „Chandler‟.
29
3.6.1 Fruit weight loss (%) 30
3.6.2 Fungal decay (%) 30
3.7 Statistical analysis 30
3.8 Six months internship program at University of Florida, USA. 30
Chapter 4 Results and Discussion 32
4.1 Study- 1 (Salts) 32
4.1.1
Experiment No. 1: Foliar application of calcium chloride
(CaCl2) to improve the vegetative growth, yield and quality
of strawberry cv. ‘Chandler’.
32
4.1.1.1 Vegetative parameters 32
xii
4.1.1.1.1 Number of leaves (plant-1
) 32
4.1.1.1.2 Leaf area (cm2) 32
4.1.1.1.3 Flower anthesis (days after foliar application) 33
4.1.1.1.4 Number of crowns (plant-1
) 33
4.1.1.1.5 Number of runners (plant-1
) 33
4.1.1.2 Yield parameters 34
4.1.1.2.1 Marketable (g plant
-1) 34
4.1.1.2.2 Unmarketable (g plant
-1) 34
4.1.1.2.3 Small size (g plant
-1) 35
4.1.1.3 Fruit quality parameters 35
4.1.1.3.1 Firmness (kg. cm-2
) 35
4.1.1.3.2 TSS (ºBrix) 36
4.1.1.3.3 Titratable acidity (%) 36
4.1.1.3.4 TSS: TA ratio 36
4.1.1.3.5 Vitamin C (mg 100 g-1
) 36
4.1.1.3.6 Total phenolic contents (mg GAE 100 g-1
) 37
4.1.1.3.7 Total antioxidants (% DPPH) 37
4.1.1.4 Activities of anti-oxidative enzymes 41
4.1.1.4.1 Catalase (U mg−1
protein) 41
4.1.1.4.2 Superoxide dismutase (U mg−1
protein) 41
4.1.1.4.3 Peroxidase (U mg−1
protein) 42
4.1.1.5 Survival (%) 42
4.1.1 Discussion 44
4.1.1 Conclusion 47
4.1.2
Experiment No. 2: Foliar application of zinc sulfate
(ZnSO4) to improve the vegetative growth, yield and
quality of strawberry cv. ‘Chandler’.
48
4.1.2.1 Vegetative parameters 48
4.1.2.1.1 Number of leaves (plant-1
) 48
4.1.2.1.2 Leaf area (cm2) 48
xiii
4.1.2.1.3 Flower anthesis (days after foliar application) 49
4.1.2.1.4 Number of crowns (plant-1
) 49
4.1.2.1.5 Number of runners (plant-1
) 49
4.1.2.2 Yield parameters 50
4.1.2.2.1 Marketable (g plant
-1) 50
4.1.2.2.2 Unmarketable (g plant
-1) 50
4.1.2.2.3 Small size (g plant
-1) 51
4.1.2.3 Fruit quality Parameters 52
4.1.2.3.1 Firmness (kg. cm-2
) 52
4.1.2.3.2 TSS (ºBrix) 52
4.1.2.3.3 Titratable acidity (%) 52
4.1.2.3.4 TSS: TA ratio 52
4.1.2.3.5 Vitamin C (mg 100 g-1
) 53
4.1.2.3.6 Total phenolic contents (GAE mg 100 g-1
) 53
4.1.2.3.7 Total antioxidants (% DPPH) 53
4.1.2.4 Activities of anti-oxidative enzymes 57
4.1.2.4.1 Catalase (U mg−1
protein) 57
4.1.2.4.2 Superoxide dismutase (U mg−1
protein) 57
4.1.2.4.3 Peroxidase (U mg−1
protein) 58
4.1.2.5 Survival (%) 58
4.1.2 Discussion 60
4.1.2 Conclusion 63
4.2 Study-2 64
4.2.1
Experiment No. 1: Foliar application of salicylic acid (SA)
to improve the vegetative growth, yield and quality of
strawberry cv. ‘Chandler’.
64
4.2.1.1 Vegetative parameters 64
4.2.1.1.1 Number of leaves (plant-1
) 64
4.2.1.1.2 Leaf area (cm2) 64
4.2.1.1.3 Flower anthesis (days after foliar application) 65
xiv
4.2.1.1.4 Number of crowns (plant-1
) 65
4.2.1.1.5 Number of runners (plant-1
) 65
4.2.1.2 Yield parameters 66
4.2.1.2.1 Marketable (g plant
-1) 66
4.2.1.2.2 Unmarketable (g plant
-1) 66
4.2.1.2.3 Small size (g plant
-1) 67
4.2.1.3 Fruit quality parameters 67
4.2.1.3.1 Firmness (kg. cm-2
) 67
4.2.1.3.2 TSS (ºBrix) 68
4.2.1.3.3 Titratable acidity (%) 68
4.2.1.3.4 TSS: TA ratio 68
4.2.1.3.5 Vitamin C (mg 100 g-1
) 68
4.2.1.3.6 Total phenolic contents (GAE mg 100 g-1
) 69
4.2.1.3.7 Total antioxidants (% DPPH) 69
4.2.1.4 Activities of anti-oxidative enzymes 73
4.2.1.4.1 Catalase (U mg−1
protein) 73
4.2.1.4.2 Superoxide dismutase (U mg−1
protein) 73
4.2.1.4.3 Peroxidase (U mg−1
protein) 74
4.2.1.5 Survival (%) 74
4.2.1 Discussion 76
4.2.1 Conclusion 79
4.2.2
Experiment No. 2: Foliar application of gibberellic acid
(GA3) to improve the vegetative growth, yield and quality
of strawberry cv. ‘Chandler’
80
4.2.2.1 Vegetative parameters 80
4.2.2.1.1 Number of leaves (plant-1
) 80
4.2.2.1.2 Leaf area (cm2) 80
4.2.2.1.3 Flower anthesis (days after foliar application) 81
4.2.2.1.4 Number of crowns (plant-1
) 81
4.2.2.1.5 Number of runners (plant-1
) 81
xv
4.2.2.2 Yield parameters 82
4.2.2.2.1 Marketable (g plant
-1) 82
4.2.2.2.2 Unmarketable (g plant
-1) 82
4.2.2.2.3 Small size (g plant
-1) 83
4.2.2.3 Fruit quality Parameters 83
4.2.2.3.1 Firmness (kg. cm-2
) 83
4.2.2.3.2 TSS (ºBrix) 84
4.2.2.3.3 Titratable acidity (%) 84
4.2.2.3.4 TSS: TA ratio 84
4.2.2.3.5 Vitamin C (mg 100 g-1
) 85
4.2.2.3.6 Total phenolic contents (mg GAE 100 g-1
) 85
4.2.2.3.7 Total antioxidants (% DPPH) 85
4.2.2.4 Activities of anti-oxidative enzymes 89
4.2.2.4.1 Catalase (U mg−1
protein) 89
4.2.2.4.2 Superoxide dismutase (U mg−1
protein) 89
4.2.2.4.3 Peroxidase (U mg−1
protein) 90
4.2.2.5 Survival (%) 90
4.2.2 Discussion 92
4.2.2 Conclusion 95
4.3 Study-3 (Confirmatory Trial) 96
4.3
Comparison of calcium chloride (CaCl2), zinc sulfate
(ZnSO4), salicylic acid (SA) and gibberellic acid (GA3) to
improve the vegetative growth, yield and quality of
strawberry cv. ‘Chandler’
96
4.3.1 Vegetative parameters 96
4.3.1.1 Number of leaves (plant-1
) 96
4.3.1.2 Leaf area (cm2) 96
4.3.1.3 Flower anthesis (days after foliar application) 97
4.3.1.4 Number of crowns (plant-1
) 97
4.3.1.5 Number of runners (plant-1
) 97
xvi
4.3.2 Yield parameters 98
4.3.2.1 Marketable (g plant
-1) 98
4.3.2.2 Unmarketable (g plant
-1) 98
4.3.2.3 Small size (g plant
-1) 99
4.3.3 Fruit quality parameters 100
4.3.3.1 Firmness (kg. cm-2
) 100
4.3.3.2 TSS (ºBrix) 100
4.3.3.3 Titratable acidity (%) 100
4.3.3.4 TSS: TA ratio 100
4.3.3.5 Vitamin C (mg 100 g-1
) 101
4.3.3.6 Total phenolic contents (GAE mg 100 g-1
) 101
4.3.3.7 Total antioxidants (% DPPH) 101
4.3.4 Activities of anti-oxidative enzymes 105
4.3.4.1 Catalase (U mg−1
protein) 105
4.3.4.2 Superoxide dismutase (U mg−1
protein) 105
4.3.4.3 Peroxidase (U mg−1
protein) 106
4.3.5 Survival (%) 106
4.3 Discussion 108
4.3 Conclusions 110
4.4 Study-4 (Postharvest study) 111
4.4
Postharvest application of calcium chloride (CaCl2) and
salicylic acid (SA) maintain the quality and improve
storage life of strawberry cv. ‘Chandler’
111
4.4.1 Physical Parameters 111
4.4.1.1 Fruit weight loss (%) 111
4.4.1.2 Fungal decay (%) 112
4.4.1.3 Firmness (kg. cm-2
) 112
4.4.2 Fruit quality parameters 116
4.4.2.1 TSS (ºBrix) 116
4.4.2.2 Titratable acidity (%) 116
xvii
4.4.2.3 TSS: TA ratio 116
4.4.2.4 Vitamin C (mg 100 g-1
) 119
4.4.2.5 Total phenolic contents (GAE mg 100 g-1
) 119
4.4.2.6 Total antioxidants (% DPPH) 120
4.4.3 Activities of anti-oxidative enzymes 123
4.4.3.1 Catalase (U mg−1
protein) 123
4.4.3.2 Superoxide dismutase (U mg−1
protein) 124
4.4.3.3 Peroxidase (U mg−1
protein) 124
4.4 Discussion 128
4.4 Conclusion 132
Chapter-5 Summary 133
5.2 Future Recommendations 136
5.3 Recommendation for farmer 136
5.4 Study- 5 137
5.4.1 Six months internship (International Research Support
Initiative Program) at University of Florida, USA supported by
Higher Education Commission Islamabad Pakistan.
137
5.4.2 Introduction about GCREC 137
5.4.3 Strawberry production in Florida 137
5.4.4 FSHS Proceeding paper presented in (131st annual meeting of
Florida State Horticultural Society)
138
5.4.4 Optimization of Early-season Nitrogen Fertilization Program
for New Strawberry Cultivar „Florida Beauty‟
138
Literature Cited 146
xviii
LIST OF FIGURES
Figure
No. Description
Page
No.
2.1 Vegetative description of strawberry plant
6
2.2 World strawberry production in 2014 (FAO, 2014) 10
2.3 Increasing area of strawberry production from 2010-15 (GOP, 2015)
11
2.4 Increasing production of strawberry from 2010-15 (GOP, 2015)
11
4.1.1.1
Effect of foliar application of CaCl2 on firmness (kg. cm2) of strawberry
fruit. Vertical bars represent ± S.E of means.
38
4.1.1.2
Effect of foliar application of CaCl2 on TSS (ºBrix) of strawberry fruit.
Vertical bars represent ± S.E of means.
38
4.1.1.3
Effect of foliar application of CaCl2 on titratable acidity (%) of strawberry
fruit. Vertical bars represent ± S.E of means.
39
4.1.1.4 Effect of foliar application of CaCl2 on TSS: TA ratio of strawberry fruit.
Vertical bars represent ± S.E of means. 39
4.1.1.5 Effect of foliar application of CaCl2 on vitamin C (mg 100 g
-1) contents of
strawberry fruit. Vertical bars represent ± S.E of means. 40
4.1.1.6 Effect of foliar application of CaCl2 on total phenolic contents (mg GAE 100
g-1
) of strawberry fruit. Vertical bars represent ± S.E of means. 40
4.1.1.7 Effect of foliar application of CaCl2 on total antioxidants (% DPPH) of
strawberry fruit. Vertical bars represent ± S.E of means. 41
4.1.1.8
Effect of foliar application of CaCl2 on survival (%) of strawberry plants.
Vertical bars represent ± S.E of means.
43
4.1.2.1
Effect of foliar application of ZnSO4 on firmness (kg. cm2) of strawberry
fruit.
54
4.1.2.2
Effect of foliar application of ZnSO4 on TSS (ºBrix) of strawberry fruit.
54
xix
4.1.2.3 Effect of foliar application of ZnSO4 on titratable acidity (%) of strawberry
fruit. 55
4.1.2.4
Effect of foliar application of ZnSO4 on TSS: TA ratio of strawberry fruit.
55
4.1.2.5 Effect of foliar application of ZnSO4 on vitamin C (mg 100 g
-1) contents of
strawberry fruit. 56
4.1.2.6
Effect of foliar application of ZnSO4 on total phenolic contents (mg GAE
100 g-1
) of strawberry fruit.
56
4.1.2.7 Effect of foliar application of ZnSO4 on total antioxidants (% DPPH) of
strawberry fruit. 57
4.1.2.8
Effect of foliar application of ZnSO4 on survival (%) of strawberry fruit.
59
4.2.1.1
Effect of foliar application of SA on firmness (kg. cm-2
) of strawberry fruit.
70
4.2.1.2
Effect of foliar application of SA on TSS (ºBrix) of strawberry fruit.
70
4.2.1.3
Effect of foliar application of SA on titratable acidity (%) of strawberry fruit.
71
4.2.1.4
Effect of foliar application of SA on TSS: TA ratio of strawberry fruit.
71
4.2.1.5
Effect of foliar application of SA on vitamin C (mg 100 g-1
) contents of
strawberry fruit.
72
4.2.1.6 Effect of foliar application of SA on total phenolic contents (mg GAE 100
g-1
) of strawberry fruit. 72
4.2.1.7 Effect of foliar application of SA on total antioxidants (% DPPH) of
strawberry fruit. 73
4.2.1.8 Effect of foliar application of SA on survival (%) of strawberry plants.
75
xx
4.2.2.1
Effect of foliar application of GA3 on firmness (kg. cm-2
) of strawberry fruit.
86
4.2.2.2
Effect of foliar application of GA3 on TSS (ºBrix) contents of strawberry
fruit.
86
4.2.2.3
Effect of foliar application of GA3 on titratable acidity (%) of strawberry
fruit.
87
4.2.2.4 Effect of foliar application of GA3 on TSS: TA ratio of strawberry fruit.
87
4.2.2.5
Effect of foliar application of GA3 on vitamin C (mg 100 g-1
) contents of
strawberry fruit.
88
4.2.2.6 Effect of foliar application of GA3 on total phenolic contents (mg GAE 100
g-1
) of strawberry fruit. 88
4.2.2.7 Effect of foliar application of GA3 on total antioxidants (% DPPH) of
strawberry fruit. 89
4.2.2.8
Effect of foliar application of GA3 on survival (%) of strawberry plants.
91
4.3.1 Effect of foliar application of salts and growth regulators on on firmness (kg.
cm-2
) of strawberry fruit. 102
4.3.2
Effect of foliar application of salts and growth regulators on TSS (ºBrix) of
strawberry fruit.
102
4.3.3 Effect of foliar application of salts and growth regulators on titratable acidity
(%) of strawberry fruit. 103
4.3.4
Effect of foliar application of salts and growth regulators on TSS: TA ratio of
strawberry fruit.
103
4.3.5 Effect of foliar application of salts and growth regulators on vitamin C (mg
100 g-1
) contents of strawberry fruit. 104
4.3.6 Effect of foliar application of salts and growth regulators on total phenolic
contents (GAE mg 100 g-1
) of strawberry fruit. 104
xxi
4.3.7
Effect of foliar application of salts and growth regulators on total
antioxidants (% DPPH) of strawberry fruit.
105
4.3.8
Effect of foliar application of salts and growth regulators on survival (%) of
strawberry plants.
107
4.4.1 Effects of CaCl2 and SA different treatments on physical parameters of
strawberry during cold storage 113
4.4.2 Effects of CaCl2 and SA different treatments on TSS, Titratable acidity and
TSS: TA ratio of strawberry during cold storage 117
4.4.3 Effects of CaCl2 and SA different treatments on vitamin C, TPC and TA
activities of strawberry during cold storage 121
4.4.4 Effects of CaCl2 and SA different treatments on enzymatic activities of
strawberry during cold storage 125
xxii
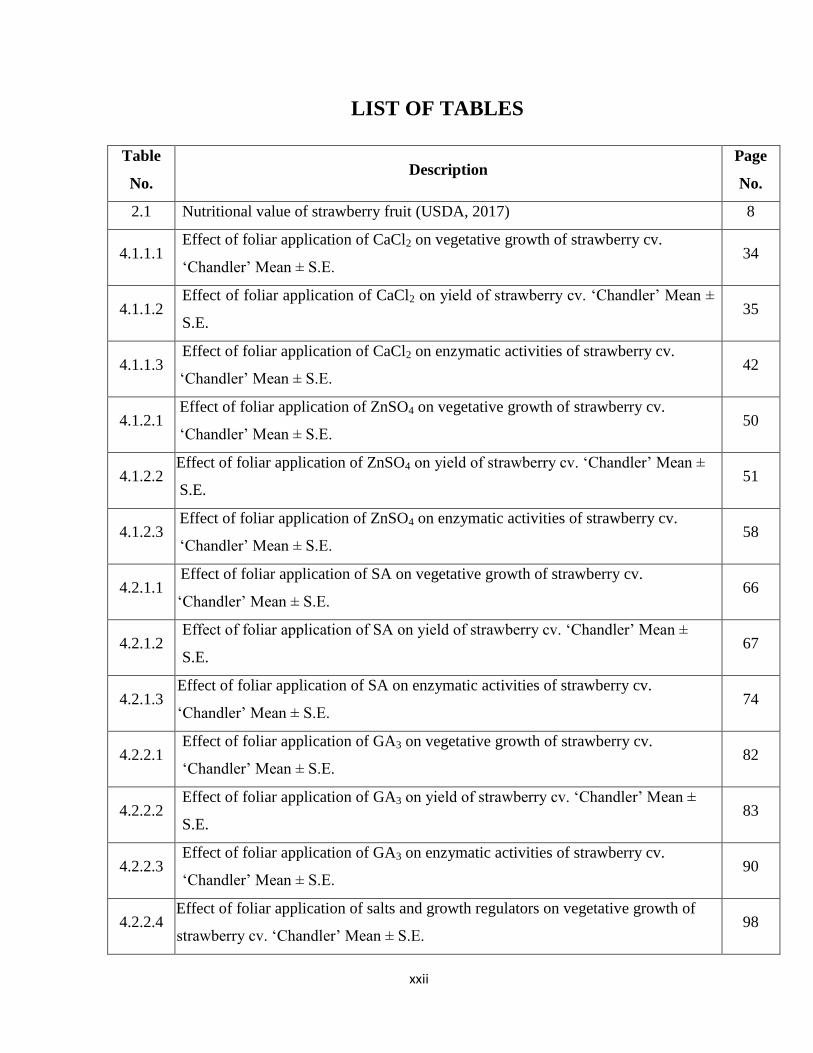
LIST OF TABLES
Table
No. Description
Page
No.
2.1 Nutritional value of strawberry fruit (USDA, 2017) 8
4.1.1.1 Effect of foliar application of CaCl2 on vegetative growth of strawberry cv.
„Chandler‟ Mean ± S.E. 34
4.1.1.2 Effect of foliar application of CaCl2 on yield of strawberry cv. „Chandler‟ Mean ±
S.E. 35
4.1.1.3 Effect of foliar application of CaCl2 on enzymatic activities of strawberry cv.
„Chandler‟ Mean ± S.E. 42
4.1.2.1 Effect of foliar application of ZnSO4 on vegetative growth of strawberry cv.
„Chandler‟ Mean ± S.E. 50
4.1.2.2 Effect of foliar application of ZnSO4 on yield of strawberry cv. „Chandler‟ Mean ±
S.E. 51
4.1.2.3 Effect of foliar application of ZnSO4 on enzymatic activities of strawberry cv.
„Chandler‟ Mean ± S.E. 58
4.2.1.1 Effect of foliar application of SA on vegetative growth of strawberry cv.
„Chandler‟ Mean ± S.E. 66
4.2.1.2 Effect of foliar application of SA on yield of strawberry cv. „Chandler‟ Mean ±
S.E. 67
4.2.1.3 Effect of foliar application of SA on enzymatic activities of strawberry cv.
„Chandler‟ Mean ± S.E. 74
4.2.2.1 Effect of foliar application of GA3 on vegetative growth of strawberry cv.
„Chandler‟ Mean ± S.E. 82
4.2.2.2 Effect of foliar application of GA3 on yield of strawberry cv. „Chandler‟ Mean ±
S.E. 83
4.2.2.3 Effect of foliar application of GA3 on enzymatic activities of strawberry cv.
„Chandler‟ Mean ± S.E. 90
4.2.2.4 Effect of foliar application of salts and growth regulators on vegetative growth of
strawberry cv. „Chandler‟ Mean ± S.E. 98
xxiii
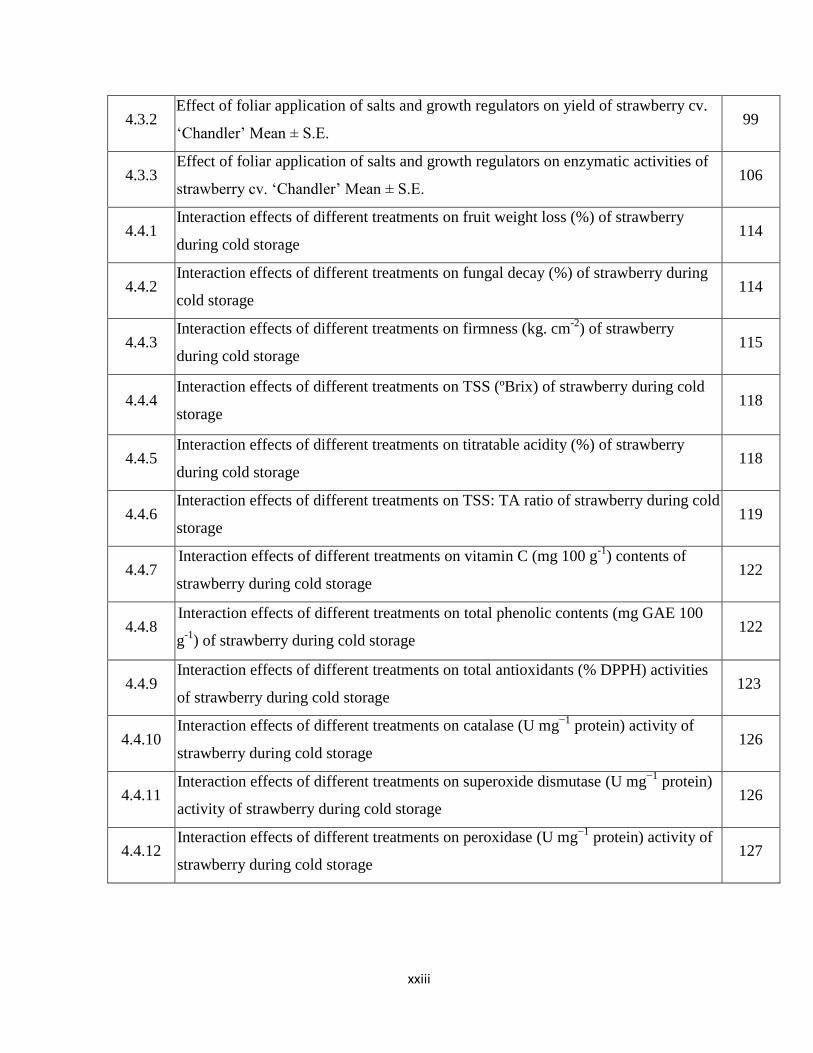
4.3.2 Effect of foliar application of salts and growth regulators on yield of strawberry cv.
„Chandler‟ Mean ± S.E. 99
4.3.3 Effect of foliar application of salts and growth regulators on enzymatic activities of
strawberry cv. „Chandler‟ Mean ± S.E. 106
4.4.1 Interaction effects of different treatments on fruit weight loss (%) of strawberry
during cold storage 114
4.4.2 Interaction effects of different treatments on fungal decay (%) of strawberry during
cold storage 114
4.4.3 Interaction effects of different treatments on firmness (kg. cm
-2) of strawberry
during cold storage 115
4.4.4 Interaction effects of different treatments on TSS (ºBrix) of strawberry during cold
storage 118
4.4.5 Interaction effects of different treatments on titratable acidity (%) of strawberry
during cold storage 118
4.4.6 Interaction effects of different treatments on TSS: TA ratio of strawberry during cold
storage 119
4.4.7 Interaction effects of different treatments on vitamin C (mg 100 g
-1) contents of
strawberry during cold storage 122
4.4.8 Interaction effects of different treatments on total phenolic contents (mg GAE 100
g-1
) of strawberry during cold storage 122
4.4.9 Interaction effects of different treatments on total antioxidants (% DPPH) activities
of strawberry during cold storage 123
4.4.10 Interaction effects of different treatments on catalase (U mg
−1 protein) activity of
strawberry during cold storage 126
4.4.11 Interaction effects of different treatments on superoxide dismutase (U mg
−1 protein)
activity of strawberry during cold storage 126
4.4.12 Interaction effects of different treatments on peroxidase (U mg
−1 protein) activity of
strawberry during cold storage 127
xxiv
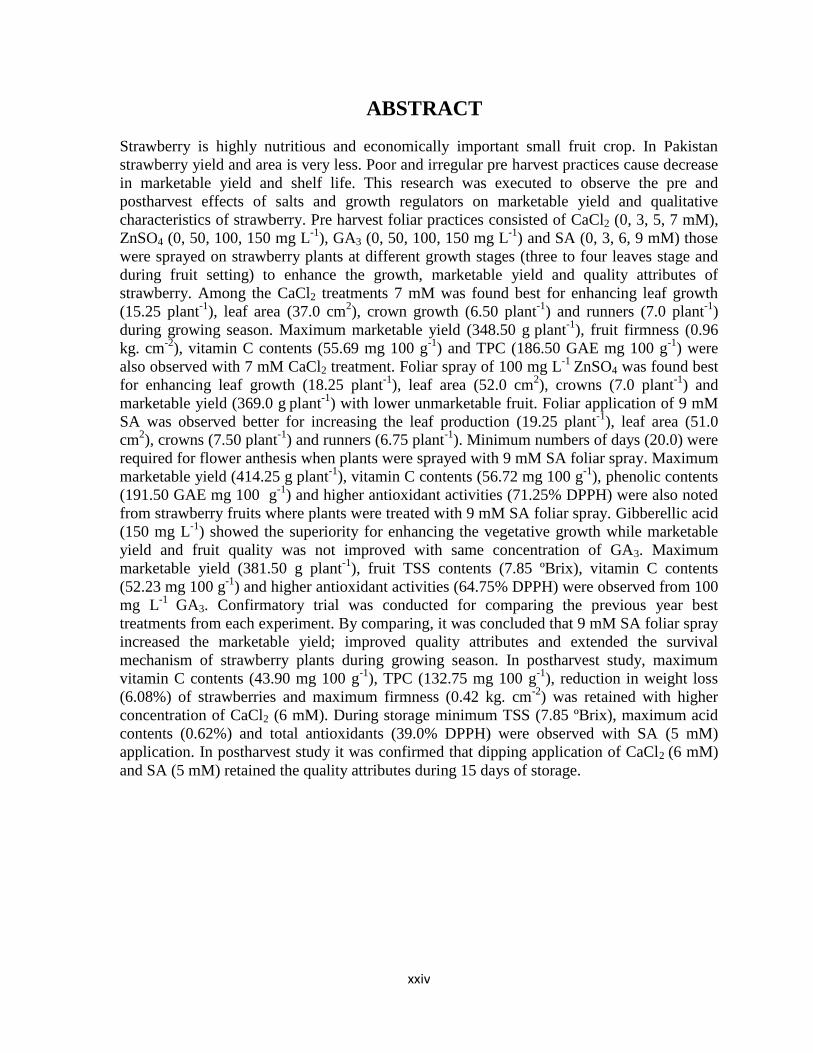
ABSTRACT
Strawberry is highly nutritious and economically important small fruit crop. In Pakistan
strawberry yield and area is very less. Poor and irregular pre harvest practices cause decrease
in marketable yield and shelf life. This research was executed to observe the pre and
postharvest effects of salts and growth regulators on marketable yield and qualitative
characteristics of strawberry. Pre harvest foliar practices consisted of CaCl2 (0, 3, 5, 7 mM),
ZnSO4 (0, 50, 100, 150 mg L-1
), GA3 (0, 50, 100, 150 mg L-1
) and SA (0, 3, 6, 9 mM) those
were sprayed on strawberry plants at different growth stages (three to four leaves stage and
during fruit setting) to enhance the growth, marketable yield and quality attributes of
strawberry. Among the CaCl2 treatments 7 mM was found best for enhancing leaf growth
(15.25 plant-1
), leaf area (37.0 cm2), crown growth (6.50 plant
-1) and runners (7.0 plant
-1)
during growing season. Maximum marketable yield (348.50 g plant
-1), fruit firmness (0.96
kg. cm-2
), vitamin C contents (55.69 mg 100 g-1
) and TPC (186.50 GAE mg 100 g-1
) were
also observed with 7 mM CaCl2 treatment. Foliar spray of 100 mg L-1
ZnSO4 was found best
for enhancing leaf growth (18.25 plant-1
), leaf area (52.0 cm2), crowns (7.0 plant
-1) and
marketable yield (369.0 g plant
-1) with lower unmarketable fruit. Foliar application of 9 mM
SA was observed better for increasing the leaf production (19.25 plant-1
), leaf area (51.0
cm2), crowns (7.50 plant
-1) and runners (6.75 plant
-1). Minimum numbers of days (20.0) were
required for flower anthesis when plants were sprayed with 9 mM SA foliar spray. Maximum
marketable yield (414.25 g plant-1
), vitamin C contents (56.72 mg 100 g-1
), phenolic contents
(191.50 GAE mg 100 g-1
) and higher antioxidant activities (71.25% DPPH) were also noted
from strawberry fruits where plants were treated with 9 mM SA foliar spray. Gibberellic acid
(150 mg L-1
) showed the superiority for enhancing the vegetative growth while marketable
yield and fruit quality was not improved with same concentration of GA3. Maximum
marketable yield (381.50 g plant-1
), fruit TSS contents (7.85 ºBrix), vitamin C contents
(52.23 mg 100 g-1
) and higher antioxidant activities (64.75% DPPH) were observed from 100
mg L-1
GA3. Confirmatory trial was conducted for comparing the previous year best
treatments from each experiment. By comparing, it was concluded that 9 mM SA foliar spray
increased the marketable yield; improved quality attributes and extended the survival
mechanism of strawberry plants during growing season. In postharvest study, maximum
vitamin C contents (43.90 mg 100 g-1
), TPC (132.75 mg 100 g-1
), reduction in weight loss
(6.08%) of strawberries and maximum firmness (0.42 kg. cm-2
) was retained with higher
concentration of CaCl2 (6 mM). During storage minimum TSS (7.85 ºBrix), maximum acid
contents (0.62%) and total antioxidants (39.0% DPPH) were observed with SA (5 mM)
application. In postharvest study it was confirmed that dipping application of CaCl2 (6 mM)
and SA (5 mM) retained the quality attributes during 15 days of storage.
1
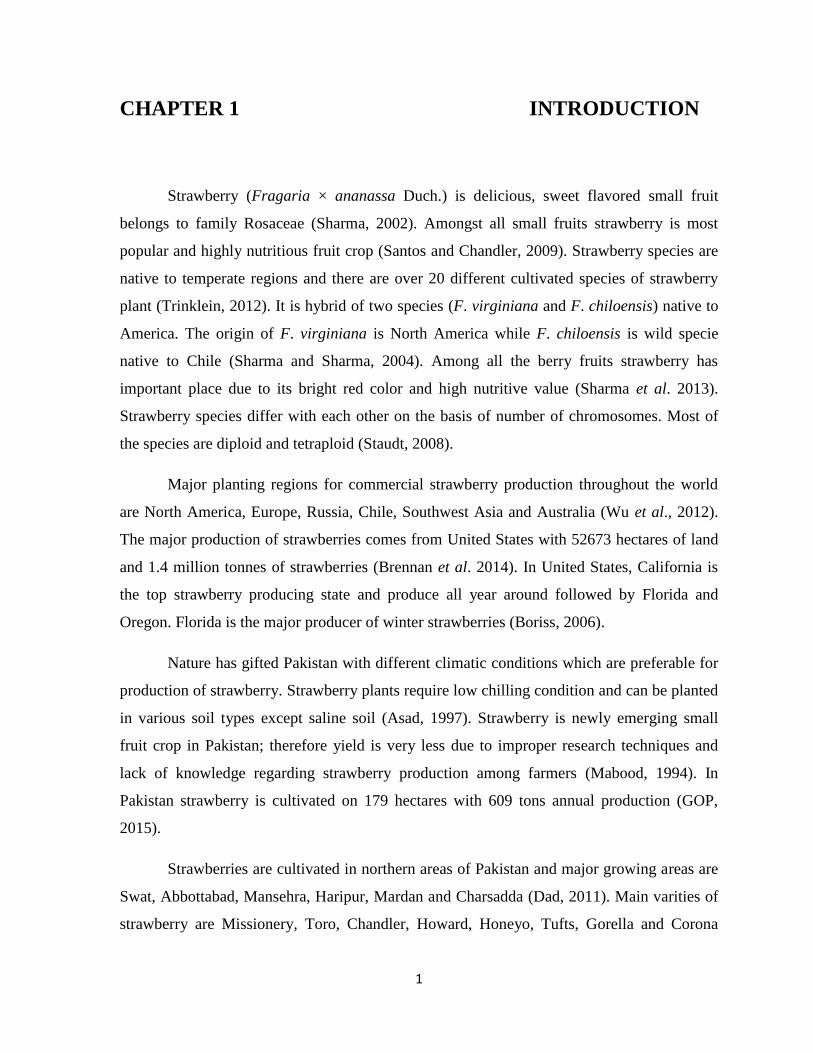
CHAPTER 1 INTRODUCTION
Strawberry (Fragaria × ananassa Duch.) is delicious, sweet flavored small fruit
belongs to family Rosaceae (Sharma, 2002). Amongst all small fruits strawberry is most
popular and highly nutritious fruit crop (Santos and Chandler, 2009). Strawberry species are
native to temperate regions and there are over 20 different cultivated species of strawberry
plant (Trinklein, 2012). It is hybrid of two species (F. virginiana and F. chiloensis) native to
America. The origin of F. virginiana is North America while F. chiloensis is wild specie
native to Chile (Sharma and Sharma, 2004). Among all the berry fruits strawberry has
important place due to its bright red color and high nutritive value (Sharma et al. 2013).
Strawberry species differ with each other on the basis of number of chromosomes. Most of
the species are diploid and tetraploid (Staudt, 2008).
Major planting regions for commercial strawberry production throughout the world
are North America, Europe, Russia, Chile, Southwest Asia and Australia (Wu et al., 2012).
The major production of strawberries comes from United States with 52673 hectares of land
and 1.4 million tonnes of strawberries (Brennan et al. 2014). In United States, California is
the top strawberry producing state and produce all year around followed by Florida and
Oregon. Florida is the major producer of winter strawberries (Boriss, 2006).
Nature has gifted Pakistan with different climatic conditions which are preferable for
production of strawberry. Strawberry plants require low chilling condition and can be planted
in various soil types except saline soil (Asad, 1997). Strawberry is newly emerging small
fruit crop in Pakistan; therefore yield is very less due to improper research techniques and
lack of knowledge regarding strawberry production among farmers (Mabood, 1994). In
Pakistan strawberry is cultivated on 179 hectares with 609 tons annual production (GOP,
2015).
Strawberries are cultivated in northern areas of Pakistan and major growing areas are
Swat, Abbottabad, Mansehra, Haripur, Mardan and Charsadda (Dad, 2011). Main varities of
strawberry are Missionery, Toro, Chandler, Howard, Honeyo, Tufts, Gorella and Corona
2
(Murtaza, 2014). In Pakistan, strawberry yield is limited and fruit is consumed as fresh and in
processed form (Mabood, 1994; Murtaza, 2014).
Strawberries are delicious, low calorie fruits having anthocyanins and phenolics
(Adda Bjarnadottir, 2012). Strawberries lower the level of cholesterol, blood pressure, reduce
inflammation and decrease oxidative stress. Important characteristic of strawberry fruit
include aroma, taste and flavor (Giampieri et al., 2012). Ripe strawberries contain 10% total
soluble solids contents and 90% water. Strawberry fruit is extremely abundant source of
ascorbic acid (59 mg/100g), dietary fiber and fructose that helps in controlling blood sugar
levels in the body by slowing down the process of digestion. These nutritive values have
great potential in controlling cardiovascular diseases and cancer related health problems
(Basu et al., 2010; Seeram, 2008). Strawberries are rich source of anthocyanin contents and
anti-carcinogenic materials such as ellagic acid (Da-Silva et al., 2007).
Strawberry plant has low chilling requirement and can be cultivated successfully in
tropical and sub-tropical areas. Maturity period of strawberry is very short and ranges
between 30-40 days (Amin, 1996). Rapid top-growth of strawberry (crowns, leaves, runners
and daughter plants) can occur within 2-3 months, which depends on nutrients, light,
temperature, salinity and water conditions (Li et al. 2010).
Strawberry has fast growth habit which demands macro and micro nutrients
synchronized with growth stages of the crop (Medeiros et al., 2015). Both, macro and micro
nutrients play major role in strawberry growth and development (Haifa, 2014).
Micronutrients increase the hormonal activity and uptake efficiency of macronutrients by
acting as catalyst (Phillips, 2004).
Foliar application enhances plant growth and nutrient concentration in certain above
ground plant organisms (Swietlik and Faust, 1984). Foliar application of micronutrients is a
supplemental application method to supply nutrients during critical growth stages when
plants cannot uptake adequate nutrients from soil due to complex soil chemistry, leaching of
nutrients, low soil temperature, immobile nutrients and low water availability which
solubilize the nutrients (Growing Produce, 2018). In general, through foliar spray essential
3
nutrients enter through the stomata of leaves more rapidly as compared to soil application
(Alshaal and Ramady, 2017).
Foliar application of salts and growth regulators enhance the canopy growth (plant
spreading, crowns, runners and leaf area), also improve the nutritional value of fruit and yield
(Qureshi et al., 2013). Plants obtain calcium from soil solution through root system via
xylem. Deficiency of calcium in root system disturbs the normal life cycle of plants and
causes malformation (White, 2000). The cationic form of Ca improves the inflexibility of
plant cells and promote the cell expansion process (Bakshi et al., 2013). Zinc plays important
role in normal plant metabolism and increase the activity of enzyme called tryptophan which
improve the level of Indole acetic acid (IAA) hormone in plant which further enhance the
growth (Nasiri et al., 2010). In sweet cherry zinc (Zn) plays major role in pollination, fruit
setting and increases total yield (Motesharezade et al., 2001).
Foliar application of growth regulators promote the natural plant hormones which
regulate the process of plant growth. Gibberellic acid (GA3) promotes the canopy growth
including leaf growth, leaf area and also initiates flowering (Sharma and Singh, 2009). Fruit
set percentage increases with application of GA3 but sometimes higher concentration
decrease the total marketable yield of strawberry (Paroussi et al., 2002). In plant defense
mechanism salicylic acid induces the resistance against pathogens (Metwally et al., 2013).
When a pathogen attacks on plant surface, SA induces systemic acquired resistance (SAR) in
undamaged plant cells by activating natural defense mechanism of plant (Tsuda et al., 2008).
Foliar treatment of SA enhances the endogenous level of SA; due to that pathogenesis related
genes activated where pathogen attack and create resistance against pathogen (Van Loon et
al., 2006). As general, foliar applied SA significantly increases the overall vegetative growth
including shoot length, leaf area and canopy growth (Khodary, 2004).
4
The nature of strawberry fruit is non-climacteric due to that it has short shelf life and
major storage issues are rapid metabolic activity, sensitive to fungal decay and grey mold
disease (Hernandez-Munoz et al., 2006). Quality of strawberry fruit deteriorates rapidly due
to water loss, bruising, mechanical damage and soft texture (Khreba et al., 2014). Treatment
of calcium chloride (CaCl2) delays the senescence process and act as physical barrier for the
reduction of water from fruit (Pila et al., 2010). Calcium chloride slows down the metabolic
process of kiwi fruit and decreased the TSS contents by delaying ethylene cycle (Fisk et al.,
2008). During storage CaCl2 maintained firmness, TSS contents of peaches and decreased the
sugar accumulation (Prussia et al., 2005). Dipping treatment of SA reduced the fruit
softening, ripening process, senescence, inhibits the rapid ethylene activity and also reduced
fungal problem of fruit (Zhang et al., 2010). Treatment of SA reduced the fungal problem
and enhanced the antioxidant activity of peaches (Khademi and Ershadi, 2013).
In literature, very little information available but not complete answers regarding the
efficiency of salts and growth regulators for increasing the marketable yield, improving fruit
quality and especially relating to antioxidants and enzymatic activities of strawberry. Pre and
postharvest application of fungicides is largely used practice in Pakistan which causes the
health issues but not focus on non-chemical techniques which reduce the health issues in
humans. By keeping in view previous studies, the present study was executed to pursue the
following goals:
To evaluate the role of foliar applied salts and growth regulators on vegetative
growth, marketable yield and quality attributes of strawberry.
Optimization of best concentrations of salts and growth regulators which enhance the
marketable yield and also improve the quality of strawberry.
Enhancement in storage life of strawberries and to retain quality by using CaCl2 and
SA.
5
CHAPTER 2 REVIEW OF LITERATURE
2.1 Specie introduction
Strawberry Fragaria × ananassa is hybrid specie belongs to family Rosaceae and
genus Fragaria, cultivated worldwide (Manganaris et al., 2014). The symbol „×‟ showed that
it is hybrid of two species Fragaria virginiana and Fragaria chiloensis and these species are
native to America (Hummer and Hancock, 2009). Historical references showed that
strawberry was mentioned as old as 234 BCE when a roman senator became popular due to
medicinal importance of strawberries. Presently cultivated Fragaria × ananassa introduced
by Duchesne in 1766 and called as „pineapple strawberry‟. The reason was its aroma
resembles with pineapple. It is popular specie for commercial strawberry cultivation
(Hummer and Hancock, 2009).
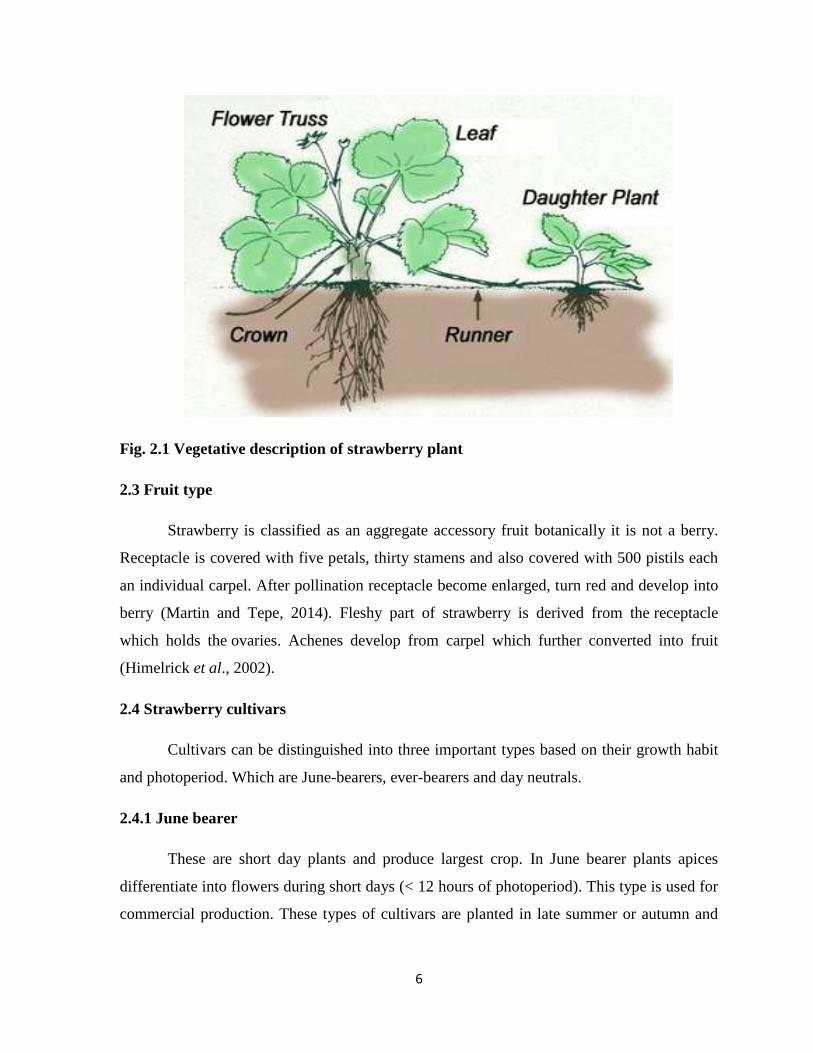
2.2 Vegetative structure of strawberry plant
Strawberry plant comprises of five important parts including trifoliate leaves, crowns,
roots, runners and new plants which called as daughter plants (Plants, 2010). Crown is major
part of plant which is short and thick stem that gives rise to roots and flowering truss of plant.
Four crowns per plant potentially improved the growth and play important role in strawberry
yield (Handley, 2003). Strawberry leaves are trifoliate and contain three leaflets which
arranged as spiral fashion and capture light for the process of photosynthesis and play major
role for the development of plant canopy and yield (Poling, 2012). Strawberry has
adventitious root system and roots grow positively geotropic (Neri and Savini, 2004).
Flowering inflorescence occurs at growing tip of crown. Strawberry flower has five sepals
that cover the flower at bud stage. The receptacle is cone shaped and has large number of
pistils that develops into fruit during maturity. Stamens and pistils are respective male and
female parts of strawberry flower (Poling, 2012). For commercial strawberry production
runner plants are used for best production (Andriolo et al., 2014). During summer runner
growth is stimulated due to warm temperature and majority of runners develops from mother
plant (Handley, 2003). Runner plants grow during summer and stored at 0ºC until planting
and used as bare root transplants. Plug transplants are also used for strawberry propagation
(Hochmuth et al., 2006).
6
Fig. 2.1 Vegetative description of strawberry plant
2.3 Fruit type
Strawberry is classified as an aggregate accessory fruit botanically it is not a berry.
Receptacle is covered with five petals, thirty stamens and also covered with 500 pistils each
an individual carpel. After pollination receptacle become enlarged, turn red and develop into
berry (Martin and Tepe, 2014). Fleshy part of strawberry is derived from the receptacle
which holds the ovaries. Achenes develop from carpel which further converted into fruit
(Himelrick et al., 2002).
2.4 Strawberry cultivars
Cultivars can be distinguished into three important types based on their growth habit
and photoperiod. Which are June-bearers, ever-bearers and day neutrals.
2.4.1 June bearer
These are short day plants and produce largest crop. In June bearer plants apices
differentiate into flowers during short days (< 12 hours of photoperiod). This type is used for
commercial production. These types of cultivars are planted in late summer or autumn and
7
harvested from spring to autumn. Examples are cavendish, chandler, darselect, earliglow
elsanta and jewel (Hancock 1999; Haifa, 2014).
2.4.2 Ever bearer
These types of cultivars produce all year around, first harvest in spring and another in
the late summer or fall. In ever bearer plants apices differentiate into flowers during long
days (12 hours of photoperiod). Most common examples are Ogallala and Ozark Beauty
(Haifa, 2014).
2.4.3 Day neutral
Flowering occurs in day neutral strawberry plants regardless of photoperiod, three
months after planting. Flower buds initiate during the entire growth season. Maximum
production achieve from day neutral plants during the first year of plantation. Flowering
occurs in these plants whenever the temperature is 2°C to 29°C. Examples are
seascape, tribute, and tristar. Both produce good quality fruits (Sharma and Sharma, 2004;
Haifa, 2014).
2.5 Chandler strawberry
Chandler (Fragaria × ananassa) was released in 1983 from California (Sharma and
Sharma, 2004). The fruit is of good quality with bright colour, flavor, texture and quite
resistant to physical damage from rain. Chandler is June bearer short day variety. Full sun is
beneficial for Chandler strawberry just like all other strawberries. However, Chandler
strawberry is susceptible to root rot. In well-drained soil it can be planted properly. The
preferred soil pH for chandler is 6-7 and sufficient amount of water is needed in the absence
of rainfall (Strawberry, 2018).
2.5.1 Important aspects of chandler strawberry
Good for commercial purpose
Good for growing in subtropical
Good for larger production
Higher yield of strawberries
Excellent Flavor and color
8
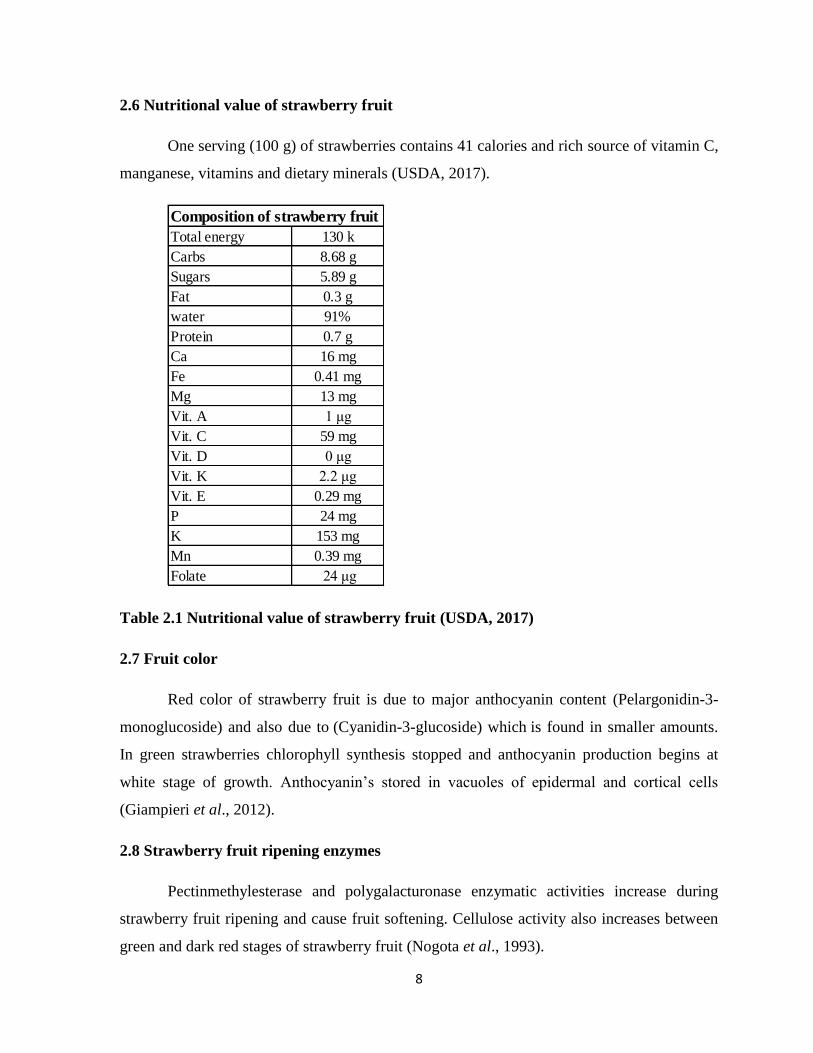
2.6 Nutritional value of strawberry fruit
One serving (100 g) of strawberries contains 41 calories and rich source of vitamin C,
manganese, vitamins and dietary minerals (USDA, 2017).
Table 2.1 Nutritional value of strawberry fruit (USDA, 2017)
2.7 Fruit color
Red color of strawberry fruit is due to major anthocyanin content (Pelargonidin-3-
monoglucoside) and also due to (Cyanidin-3-glucoside) which is found in smaller amounts.
In green strawberries chlorophyll synthesis stopped and anthocyanin production begins at
white stage of growth. Anthocyanin‟s stored in vacuoles of epidermal and cortical cells
(Giampieri et al., 2012).
2.8 Strawberry fruit ripening enzymes
Pectinmethylesterase and polygalacturonase enzymatic activities increase during
strawberry fruit ripening and cause fruit softening. Cellulose activity also increases between
green and dark red stages of strawberry fruit (Nogota et al., 1993).
Composition of strawberry fruit
Total energy 130 k
Carbs 8.68 g
Sugars 5.89 g
Fat 0.3 g
water 91%
Protein 0.7 g
Ca 16 mg
Fe 0.41 mg
Mg 13 mg
Vit. A 1 μg
Vit. C 59 mg
Vit. D 0 μg
Vit. K 2.2 μg
Vit. E 0.29 mg
P 24 mg
K 153 mg
Mn 0.39 mg
Folate 24 μg
9
2.9 Changes in activities of antioxidant enzymes during strawberry fruit ripening
Reactive oxygen species (ROS) produce during biochemical changes in strawberry
fruit such as O2-, H2O2, and OH
- which cause oxidative stress (Jimenez et al. 2003). These
(ROS) species cause early fruit ripening and leading towards senescence process. The
response of various activities of antioxidant enzymes (POD, CAT and SOD) appear during
different growth stages. Reactive oxygen species produce due to decline in these activities
(Anand et al., 2009). Maximum catalase activity found during strawberry fruit ripening. It
increases in white and red color fruit. Superoxide dismutase activity increase during
maturation stages up to highest level in white fruits. Peroxidase activity increase in white
color fruits and rapidly decrease in red color strawberry fruits (Lopez et al., 2010).
2.10 Phenolic contents of strawberry fruit
Strawberry fruit contain important polyphenols including chlorogenic acid and D-
catechin also called as tannins. Total soluble phenols decrease during ripening up to 0.5-0.6%
in green strawberries and 0.2-0.3% in red berries. Peroxidase and polyphenol oxidase
activities also decrease about 80% during fruit ripening stage (Spayd and Morris, 1981).
2.11 World strawberry production
For strawberry production United States accounted as major producer all over the
world. Major strawberry producing state in United States is California with 90% production,
followed by Florida with 10% of strawberry production (Brennan et al., 2014; Boriss, 2006).
US produce 1.4 billion kg of strawberries in which 1.2 billion kg comes from California (Wu
et al. 2012). Major importer of US strawberries is Canada which received 118 million kg of
strawberries (ERS, 2013). Mexico, Spain, Egypt, Poland and Turkey are other world leading
strawberry producers (Wu et al. 2012).
10
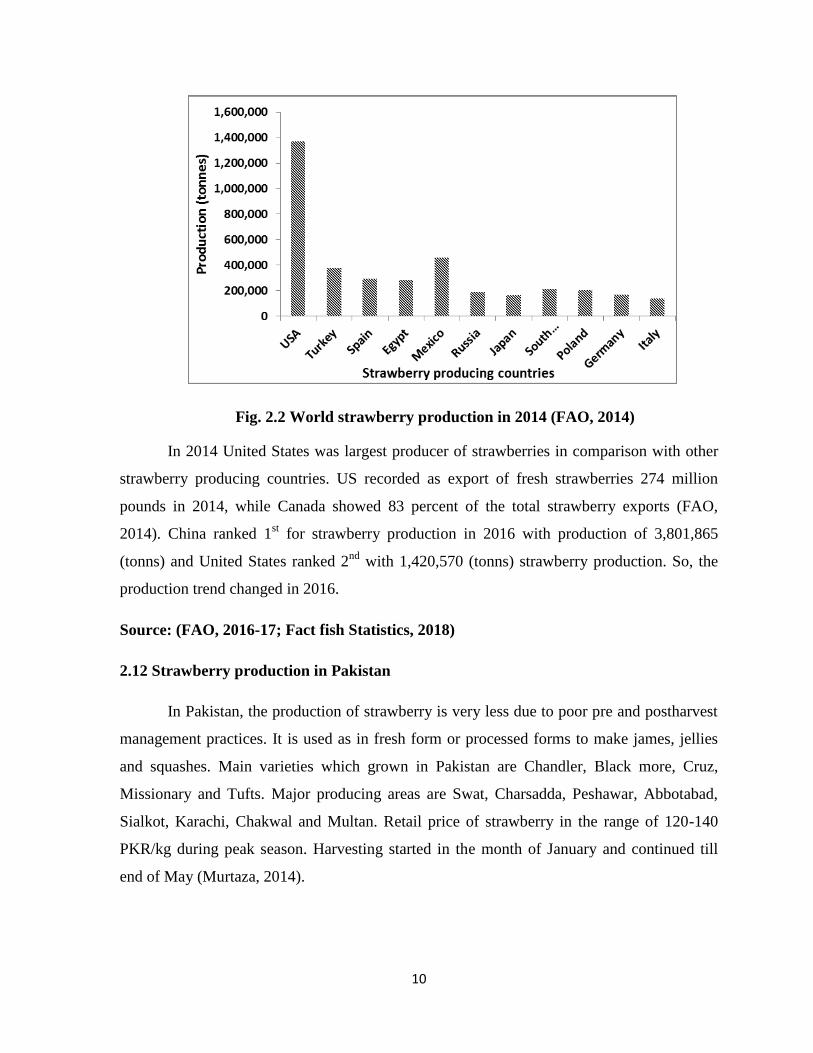
Fig. 2.2 World strawberry production in 2014 (FAO, 2014)
In 2014 United States was largest producer of strawberries in comparison with other
strawberry producing countries. US recorded as export of fresh strawberries 274 million
pounds in 2014, while Canada showed 83 percent of the total strawberry exports (FAO,
2014). China ranked 1st for strawberry production in 2016 with production of 3,801,865
(tonns) and United States ranked 2nd
with 1,420,570 (tonns) strawberry production. So, the
production trend changed in 2016.
Source: (FAO, 2016-17; Fact fish Statistics, 2018)
2.12 Strawberry production in Pakistan
In Pakistan, the production of strawberry is very less due to poor pre and postharvest
management practices. It is used as in fresh form or processed forms to make james, jellies
and squashes. Main varieties which grown in Pakistan are Chandler, Black more, Cruz,
Missionary and Tufts. Major producing areas are Swat, Charsadda, Peshawar, Abbotabad,
Sialkot, Karachi, Chakwal and Multan. Retail price of strawberry in the range of 120-140
PKR/kg during peak season. Harvesting started in the month of January and continued till
end of May (Murtaza, 2014).
11
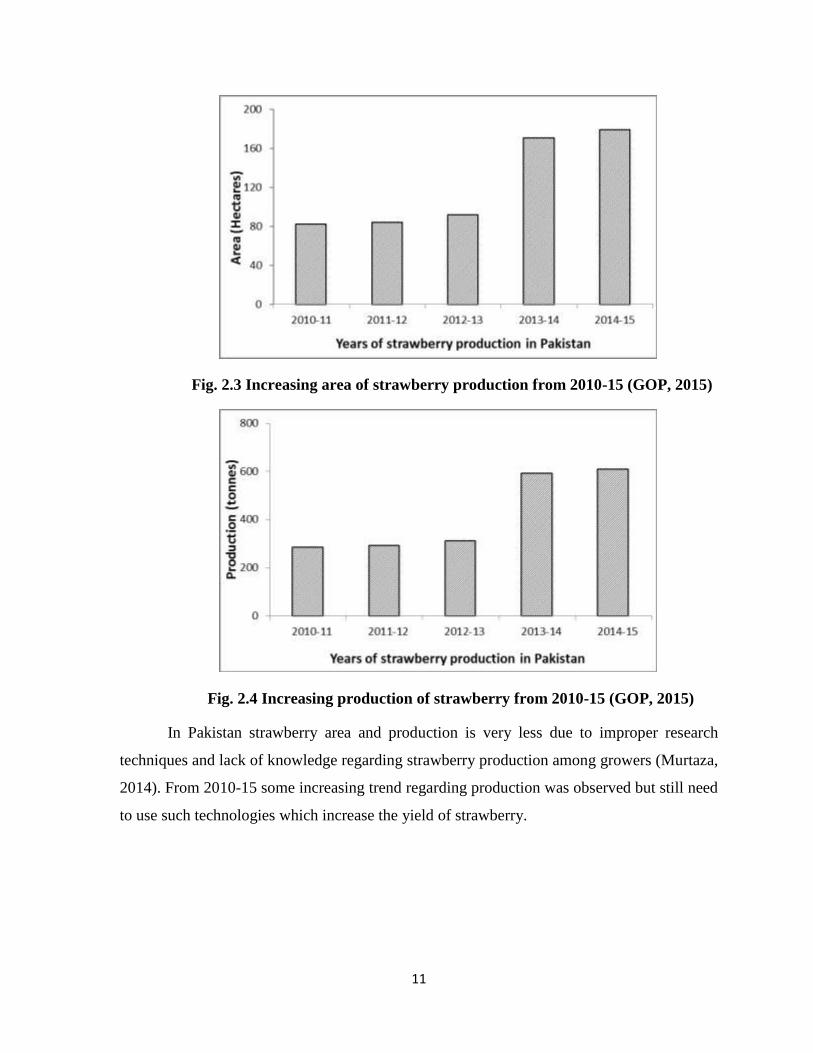
Fig. 2.3 Increasing area of strawberry production from 2010-15 (GOP, 2015)
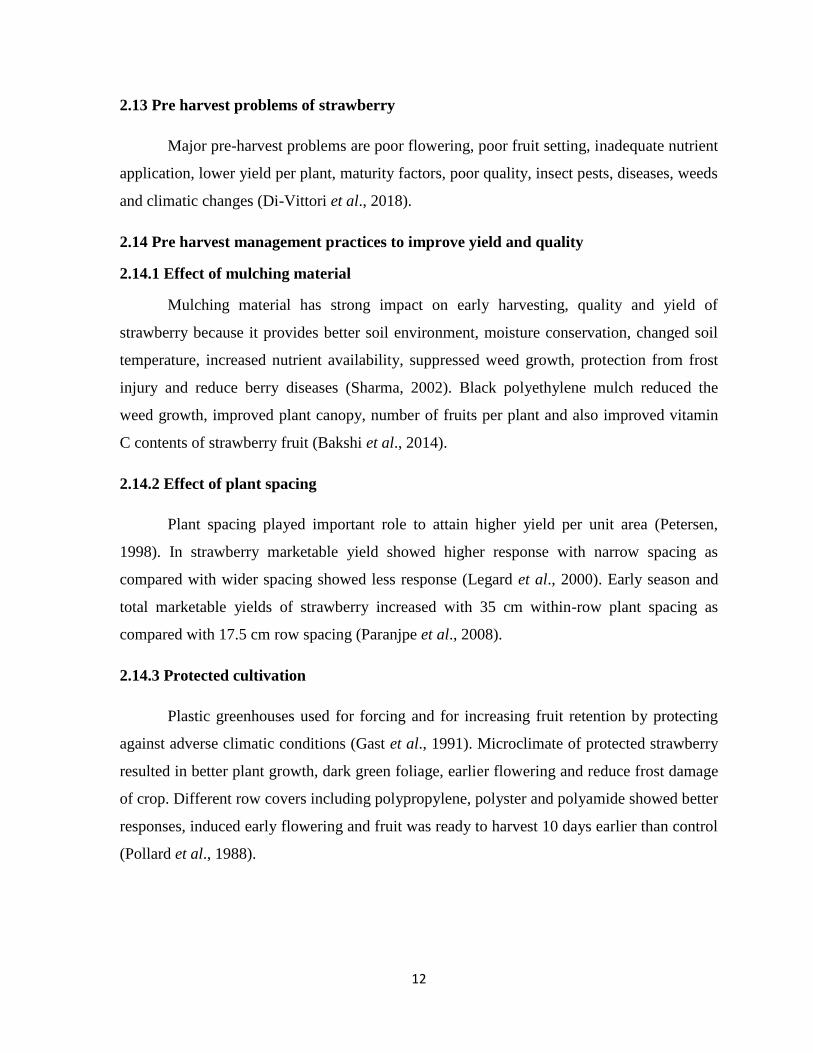
Fig. 2.4 Increasing production of strawberry from 2010-15 (GOP, 2015)
In Pakistan strawberry area and production is very less due to improper research
techniques and lack of knowledge regarding strawberry production among growers (Murtaza,
2014). From 2010-15 some increasing trend regarding production was observed but still need
to use such technologies which increase the yield of strawberry.
12
2.13 Pre harvest problems of strawberry
Major pre-harvest problems are poor flowering, poor fruit setting, inadequate nutrient
application, lower yield per plant, maturity factors, poor quality, insect pests, diseases, weeds
and climatic changes (Di-Vittori et al., 2018).
2.14 Pre harvest management practices to improve yield and quality
2.14.1 Effect of mulching material
Mulching material has strong impact on early harvesting, quality and yield of
strawberry because it provides better soil environment, moisture conservation, changed soil
temperature, increased nutrient availability, suppressed weed growth, protection from frost
injury and reduce berry diseases (Sharma, 2002). Black polyethylene mulch reduced the
weed growth, improved plant canopy, number of fruits per plant and also improved vitamin
C contents of strawberry fruit (Bakshi et al., 2014).
2.14.2 Effect of plant spacing
Plant spacing played important role to attain higher yield per unit area (Petersen,
1998). In strawberry marketable yield showed higher response with narrow spacing as
compared with wider spacing showed less response (Legard et al., 2000). Early season and
total marketable yields of strawberry increased with 35 cm within-row plant spacing as
compared with 17.5 cm row spacing (Paranjpe et al., 2008).
2.14.3 Protected cultivation
Plastic greenhouses used for forcing and for increasing fruit retention by protecting
against adverse climatic conditions (Gast et al., 1991). Microclimate of protected strawberry
resulted in better plant growth, dark green foliage, earlier flowering and reduce frost damage
of crop. Different row covers including polypropylene, polyster and polyamide showed better
responses, induced early flowering and fruit was ready to harvest 10 days earlier than control
(Pollard et al., 1988).
13
2.14.4 Effectiveness of calcium chloride (CaCl2) for improving growth, yield and
qualitative characteristics of other strawberry cultivars
Calcium is important plant nutrient related to fruit quality and firmness. It involved in
improving firmness because it is major component of pectin which improved the inflexibility
of plant cells (Sams, 1999; Maas, 1998). Foliar nutrition of calcium considered as cultural
practice for improving fruit calcium contents and it also reduced grey mould disease
(Bramlage et al., 1985; Elad and Volpin, 1993). Foliar applied CaCl2 at rate of 20 kg per ha
before harvest delayed tissue softening, fruit ripening process and reduced grey mould (B.
cinerea) disease in strawberries (Cheour et al., 1990).
Kazemi (2013a) evaluated the effectiveness of foliar spray of calcium chloride (2.5
and 5 mM) and salicylic acid (0.25, 0.5 and 0.75 mM) on strawberry yield and quality.
Results revealed that SA and CaCl2 either combined or separate foliar spray enhanced the
runner growth (6.12), leaf area (31.12 cm2), rooting density and flower production. Fruit
quality and yield was also improved by combine application of CaCl2 and SA.
Bakshi et al. (2013) examined the effects of foliar applied CaCl2 (0.2, 0.4 and 0.6 %)
and ZnSO4 (0.2, 0.4 and 0.6 %) on strawberry cultivar chandler. Leaf growth (19.6), leaf area
(64.7 cm2), flowering density (27.6) and marketable fruits per plant (21.0) increased with
CaCl2 and micronutrients foliar application. Fruit (size, length and diameter), TSS (8.34 ºB)
and ascorbic acid (62.88 mg/100g) contents of strawberry increased with increasing
concentration of calcium and other micro nutrients.
Kazemi (2014a) evaluated the effects of foliar applied CaCl2 on strawberry cultivar
„Pajaro‟. Calcium enhanced the weight of primary fruit but reduced the length of flowering
period. Calcium spray increased the TSS contents (9.8 ºB), ascorbic acid contents (65.7
mg/100g) and lower acidity than control. For the betterment of fruit quality Ca acted as
secondary messenger and played significant role in inflexibility of cell wall functions by
delaying the process of fruit softening and senescence activity (Sams, 1999). Foliar
application of calcium containing products improved the firmness of kiwifruit cultivar
„Tsechelidis‟ as compared with control treatment. Higher ascorbic acid contents and total
14
antioxidant activities were recorded and leaves Ca concentration was also increased with
foliar application (Koutinas et al., 2010).
2.14.5 Effectiveness of zinc sulfate (ZnSO4) for improving growth, yield and qualitative
characteristics of other strawberry cultivars
Zinc is major component of several enzymes, proteins and important metal element
for normal metabolic process of plants. It increased the activity of enzyme called tryptophan
which, further enhanced the production of growth hormone (IAA) and acted as growth
promoter (Nasiri et al., 2010). Zinc is major trace element for plant growth which is involved
in enzymatic reactions and regulate protein and carbohydrate metabolism (Lolaei et al.,
2012). Through foliar application nutrients absorbes very quickly and transported to different
plant parts to perform different functions and helpful for the correction of nutrient
deficiencies. Zinc played significant role for enhancing the quality attributes of fruits and
reduced the different physiological disorders in fruit trees (Meena et al., 2014).
Abdollahi et al. (2010) conducted experiment on „Selva‟ strawberry by using PBZ
and H3BO3 different concentrations along with ZnSO4 (0, 100, 200 mg L-1
) to maximize the
canopy growth, yield and quality attributes. Hydroponic system was used for the growth of
runners in green house. Results revealed that reduction in vegetative growth was observed
with PP333 while zinc application showed positive effects regarding fruit quality. Yield was
also increased with foliar spray of ZnSO4. Number of leaves (16.2) increased with zinc
application but fresh shoot/root ratio decreased.
Kazemi (2015) studied the effects of foliar applied CaCl2 with two levels (5 and 10
mM) and ZnSO4 also with three levels (50, 100, 150 mg L-1
) on canopy growth, yield and
qualitative properties of strawberry cultivar „Pajaro‟. Zinc sulfate @ 150 mg L-1
and CaCl2 @
10 mM increased the runner growth (5.1), leaf area (46.3 cm2), size of fruits, total soluble
solids (9.95 °B), acid contents and vitamin C contents (67.41 mg/100 g) of strawberry. High
dose of zinc and calcium maximize the yield and nutritional value.
Lolaei et al. (2012) observed the effects of ZnSO4 (0, 50, 100, 150 mg L-1
) on
vegetative parameters, yield and some quality attributes of strawberry cultivar „Camarosa‟. It
was reported that ZnSO4 @ 150 mg L-1
increased the TSS contents (8.31 ºB) but leaf area
15
(42.20 cm2) maximized with 100 mg L
-1 of ZnSO4. High dose of ZnSO4 @ 150 mg L
-1
showed the positive effects regarding fruit set (%), yield and flowering density. Strawberry
yield and quality increased with higher application of ZnSO4.
2.14.6 Effectiveness of salicylic acid (SA) for improving growth, yield and qualitative
characteristics of other strawberry cultivars
Salicylic acid found in plants as important phenolic compound which acted as
signaling molecule against oxidative stresses and provide tolerance. It performed various
functions including plant growth, ion uptake and transport, reduce transpiration rate and leaf
abscission (Ashraf et al., 2010). Foliar applied SA increased the endogenous level of SA and
also activated the pathogenesis related genes at the site of pathogen attack by creating
pathogenic resistance in plants (Van Loon et al., 2006).
Kazemi (2013a) noticed the effects of foliar spray of SA with three doses (0.25, 0.5
and 0.75 mM) and calcium chloride (CaCl2) with two doses (2.5 and 5 mM) on canopy
growth and yield components of strawberry plants. Foliar applied SA (0.25 mM) and CaCl2
(2.5 mM) alone or combined application improved the vegetative and reproductive growth.
Maximum no. of runners (5.98), leaf area (28 cm2), flower production and fruit weight
enhanced with combine spray of SA and CaCl2.
Combined (salt and growth regulator) foliar spray improved the yield and qualitative
characteristics of strawberry. It is because of SA induced the resistance in plants against
abiotic stresses and CaCl2 acted as a messenger for these environmental stimuli that activated
defense mechanism (Qureshi et al., 2013).
Lolaei et al. (2012) examined pre and postharvest effects of SA on strawberry cultivar
„Camarosa‟ by using 4 different levels of SA (0, 3, 5 and 7 mM) on 60 plants. Results
revealed that SA @ 7 mM delayed the ripening of strawberry fruit and showed higher
titratable acidity TA (0.95%) and vitamin C contents (75 mg/100 g) as compared with
control. Fruit ripening decreased due to slow down of metabolic activities and carbohydrate
depletion rate by increasing SA concentration.
16
It is also reported that 5-sulfosalicylic acid at (2.5 mM) increased the quality
attributes including TPC, flavonoids, TSS, TA and vitamin C contents of strawberry due to
delay in senescence activity (Kazemi, 2013b).
2.14.7 Effectiveness of gibberellic acid (GA3) for improving growth, yield and
qualitative characteristics of other strawberry cultivars
External application of PGR on plants acted as growth promoter and played important
role in development and regulation of different processes. Gibberellins are known to promote
stem growth by increasing the cell division and enlargement (Canli and Orhan, 2009).
Gibberellic acid (GA3) is natural plant hormone which promoted the growth and encouraged
the desirable effects including plant height and flower production (Srivastava and Srivastava,
2007). Fruit production and growth increased in clementine oranges by application of GA3
(Van Rensburg et al., 1996). Gibberellic acid showed the significant responses in many
horticultural crops to improve the flowering and fruit setting (Taylor and Knight, 1986).
Jamal Uddin et al. (2012) stated that foliar treatment of 75 ppm of GA3 enhanced the
canopy growth and marketable yield of strawberry because it increased the hormonal activity
due to that rapid cell division and elongation process in different parts of plants. It also
enhanced the sweetness of strawberries.
In literature it is reported that foliar treatment of 100 mg L-1
of GA3 maximize the
runners (6.8) and leaf area (33.5 cm2) of strawberry cultivar „Camarosa‟ because it acted as
bio regulator and greatly influenced on growth and development. Strawberry TSS contents
not affected by GA3 concentration and titratable acidity decreased (Kazemi, 2014b).
Asadi et al. (2013) examined the effects of GA3 doses (0, 25 and 50 mg L-1
) on
strawberry cultivar „Gaviota‟. Runner growth (4.5) increased with GA3 (50 mg L-1
)
application although no. of leaves and crown growth was not affected by same GA3
concentration.
Growth regulators enhanced the flowering, fruit production, while they have no
significant impact on other biochemical attributes including fruit pH, TA and TSS contents.
17
They enhanced the total anthocyanin concentration and total phenolic contents of
strawberries (Roussos et al., 2009).
2.15 Postharvest problems of strawberry
Strawberries are extremely perishable crop and require careful handling and
appropriate management practices for increasing the shelf life. These required rapid removal
of field heat to retained fruit quality (Picha, 2006). Low temperature during storage (0 to 4ºC)
play important role for retaining its quality. Improper harvesting stage, high temperature,
short shelf life, fungal decay, weight loss, loss of brightness and color darkening are major
postharvest problems of strawberry (Khreba et al., 2014).
2.16 Effect of storage application of calcium chloride (CaCl2) on quality and shelf life of
fruits
Postharvest application of calcium means applying calcium directly on fruit surface,
which is best method for increasing internal calcium content of fruit. Different methods used
including dipping, vacuum infiltration or pressure infiltration which increased the fruit
calcium content and firmness in storage (Conway et al., 1994). Calcium played significant
role for retaining fruit quality and firmness. It involved in maintaining fruit firmness because
major component of pectin which improved the inflexibility of cells, membrane rigidity and
maintained cell structure (Sams, 1999; Maas, 1998). During storage Ca reduced the growth
of pathogens, conidia germination by disturbing the process of germ tube elongation and also
acted as barrier for nutrients availability to pathogens on the fruit surface (Moline, 1994).
Lysiak et al. (2008) evaluated shelf life of peaches by dipping in 2% CaCl2 solution
for 30 minutes and then kept at 4°C for next 2 weeks in boxes, in which some boxes were
uncovered or covered with polyethylene. Calcium chloride application proved better for
maintaining firmness, soluble solids contents and reduced the weight loss of peaches as
compared with untreated fruits.
Pre storage application of CaCl2 (1, 1.5, and 2.0%) showed positive responses against
anthracnose disease of papaya. Six pre harvest sprays were applied on papaya to observe the
effects of CaCl2 on internal calcium content of fruit, spore germination, mycelial growth,
disease incidence and shelf life. Internal Ca content of papaya fruit improved with 2.0%
18
spray of calcium, anthracnose disease was reduced and shelf life was extended up to 5 weeks
(Madani et al., 2014).
Dipping treatment of CaCl2 3% delay the softening of kiwi fruit and slow down the
process of degradation of ascorbic acid contents by retarding disintegration of cell walls and
reduced the enzymatic activity of L ascorbic acid (Franco et al., 2008).
Bagheri et al. (2015) evaluated storage life and quality of persimmon fruit kept at 0°C
for next 4 months dipped in solutions containing (0.5, 1, and 2%) CaCl2. Fruit weight loss
and chilling injury was decreased with CaCl2 treatments compared with control. Total
phenolic contents were increased with 2% CaCl2 treatment. Lower antioxidant activity was
recorded in untreated fruits as compared with CaCl2 treated fruits. Maximum catalase activity
was noted in 2% CaCl2 treated fruits. Tissue browning occurred in control treatment due to
increased CAT activity.
2.17 Effect of storage application of salicylic acid (SA) on quality and shelf life of fruits
Storage applied SA provides resistance against oxidative stresses (Asghari and
Aghdam, 2010). Salicylic acid has capability for delaying ripening process, maintaining
nutritional value and reducing storage diseases of fruits (Zhang et al., 2010). Fruit softening
occurred due to rapid metabolic activity of polygalactosidases and pectin methylesterases
which are cell wall degrading enzymes. Salicylic acid delayed the cell wall enzymatic
activity by decreasing metabolic process (Srivastava and Dwivedi, 2000).
Salari et al. (2013) studied postharvest effects of SA (1, 2, 3 and 4 mM) on 3
strawberry cultivars (Paros, Camarosa and Selva) kept at 3°C for 12 days. Results showed
that the response of 4 mM SA was highest for retaining vitamin C contents (86.48 mg/100 g).
Highest rotten fruit (%) was noted in untreated fruits as compared with SA treated.
Strawberry cultivar „Paros‟ showed highest contents of vitamin C and TSS: TA ratio with 2
mM SA. Interaction between cultivar and SA treatments was not significant.
19
Salicylic acid is important phenylpropanoid compound which enhanced the fruit
resistance against pathogens and other stress causing factors. It activated ascorbate
peroxidase activity due to that activity total antioxidants increased which prevent destruction
of ascorbic acid contents during storage (Stolfa et al., 2014).
Postharvest treatment of SA is beneficial to inhibit tissue softening by delaying
hydrolases activities which retained cell membrane consistency. Dipping of tomatoes in SA
before storage at low temperature induced heat shock proteins (HSPs) biosynthesis which
create resistance against low temperature (Baninaiem et al., 2016).
Khademi and Ershadi (2013) studied the effects of SA on peach shelf life. According
to their results 2 mM SA was more effective for maintaining firmness, TPC and TA activity
of fruits as compared with 4 mM SA because higher concentration damaged the fruits and
not found best for retaining fruit quality.
20
CHAPTER 3 MATERIALS AND METHODS
3.1 Experimental site detail
3.1.1 Site Selection
Field experiments were conducted at Ayub Agricultural Research Institute (AARI),
Jhang Road Faisalabad Pakistan in the Fruit Research area during November, 2015 to April,
2016 and confirmatory trial was conducted from November, 2016 to April, 2017. This site
was selected because it was fully equipped with good characteristics of soil, water and
drainage system and availability of labors.
3.1.2 Soil preparation
Two plots with same size for field experiments were selected for runner
transplantation. Soil was prepared in the month of September by adding FYM 120-150 kg
and DAP 2.5-3 kg for each plot which length was 66 feet and width was 20 feet. Silt was
mixed in soil for soil fertility, better root penetration and crown development. Soil was
prepared one month before runner transplantation.
3.1.3 Preparation of beds
Raised beds were prepared after one month of soil preparation and their width was
1.5 feet. Black polyethylene sheet as mulching material was used to cover the beds and for
controlling weeds. Holes were made in sheet for runner transplantation and plant to plant
distance was 9-10 inches. Runners were transplanted in double rows with 20 plants on each
bed.
3.1.4 Selection of runner plants
Healthy and disease free bare root transplants of strawberry cv. „Chandler‟ were
collected from Agricultural Research Institute North Mingora, Swat, Khyber Pakhtoonkhwa.
3.1.5 Planting of runners
Initially treat the runner roots with Topsin-M @ 2g/L fungicide to reduce the problem
of anthracnose and other soil-borne diseases before planting. Strawberry has shallow root
21
system so; runners were planted 2-3 inches deep to avoid crown damage. At the start, surface
irrigation was done weekly and then according to crop requirement.
3.1.6 Foliar application
Foliar application of salts and growth regulators were applied after 2 weeks of runner
transplantation when old leaves were dried and new sprouting was occur. When plants were
at 3-4 leaves stage 1st foliar application was applied and 2
nd application was done at fruit
setting stage.
3.1.7 Plant protection with polythene tunnel
From mid-December till end of January polythene tunnel was used for protecting
against frost damage, for better plant growth and fresh green foliage.
3.2 Study 1 (Salts)
3.2.1 Experiment No. 1:
Foliar application of calcium chloride (CaCl2) to improve the vegetative growth, yield
and quality of Strawberry cv. ‘Chandler’
Different doses of calcium chloride were applied on plants to optimize the best dose
which improve the vegetative growth, yield and quality of fruit. Following concentrations
were applied.
Treatments:
T1 = Control
T2 = 3 mM CaCl2
T3 = 5 mM CaCl2
T4 = 7 mM CaCl2
This experiment was consisted of 4 treatments with 4 replications. There were 40
plants in each treatment and each replication was consisted of 10 plants. Total 160 plants
used for this experiment. Calcium chloride easily dissolved in water and recommended
concentration was mixed separately in one liter of water for 10 plants. For foliar spray 100
22
ml water was used for single strawberry plant for better absorption and penetration. For foliar
application Tween-20 (0.01%) was added as wetting agent. Foliar application was applied
during morning time (6-7 am) with handheld sprinkler in a very gentle way. Vegetative, yield
and quality parameters were measured during whole growing season. At the end of
strawberry season plants survival (%) was also recorded.
3.2.2 Experiment No. 2:
Foliar application of zinc sulfate (ZnSO4) to improve the vegetative growth, yield and
quality of Strawberry cv. ‘Chandler’
Treatments:
T1 = Control
T2 = 50 mg L-1
ZnSO4
T3 = 100 mg L-1
ZnSO4
T4= 150 mg L-1
ZnSO4
Same materials and methods were followed as previous described. Vegetative, yield
and fruit quality parameters were also recorded in this experiment.
3.3 Study 2 (Growth regulators)
3.3.1 Experiment No. 1:
Foliar application of salicylic acid (SA) to improve the vegetative growth, yield and
quality of Strawberry cv. ‘Chandler’
Treatments:
T1 = Control
T2 = 3 mM SA
T3 = 6 mM SA
T4 = 9 mM SA
23
This experiment was performed to check the effects of different concentrations of SA
on vegetative, yield and fruit quality parameters of strawberry. Each treatment was consisted
of 4 replications and in each replication there were 10 plants. Total 160 plants used for this
experiment. Salicylic acid not easily dissolved in water so firstly recommended concentration
was dissolved in 10 ml ethanol and then further dissolved in one liter of water for 10 plants.
For foliar spray 100 ml water was used for single strawberry plant for better absorption and
penetration. For foliar application Tween-20 (0.01%) was also added as wetting agent. Foliar
application was applied during morning time (6-7 am) with handheld sprinkler in a very
gentle way. Vegetative, yield, fruit quality parameters and survival (%) was recorded.
3.3.2 Experiment No. 2:
Foliar application of gibberellic acid (GA3) to improve the vegetative growth, yield and
quality of Strawberry cv. ‘Chandler’
Treatments:
T1 = Control
T2 = 50 mg L-1
GA3
T3 = 100 mg L-1
GA3
T4 = 150 mg L-1
GA3
Gibberellic acid also not dissolved easily in water so, recommended concentration
was mixed in 10 ml ethanol and then further added in the water to make 1 liter solution for 1
experimental unit (10 plants). All vegetative, yield and quality relating parameters were also
measured.
24
3.4 Study 3 (Confirmatory trial)
3.4.1 Comparison of calcium chloride (CaCl2), zinc sulfate (ZnSO4), salicylic acid (SA)
and gibberellic acid (GA3) to improve the vegetative growth, yield and quality of
strawberry cv. ‘Chandler’
Treatments:
T1 = Control
T2 = 7 mM CaCl2
T3 = 100 mg L-1
ZnSO4
T4 = 9 mM SA
T5 = 100 mg L-1
GA3
In this trial previous year best treatments from each experiment were compared with
each other to find out the best treatment which increased the vegetative growth, marketable
yield and also improve the quality of strawberries. Same method of foliar spray was followed
as in previous experiments. Each treatment was consisted of 4 replications and in each
replication there were 10 plants. Total 200 plants used for this experiment. All vegetative,
yield and quality relating parameters were measured as described in previous experiments.
3.5 Parameters
3.5.1 Vegetative parameters
3.5.1.1 Number of leaves (plant-1
)
Leaf growth was observed during and after end of strawberry season. Three healthy
plants from each replication were pull out from beds and then each plant was cut into two
halves in such way that trifoliate leaves with petioles separated and below portion (crown)
separated. After cutting of each plant numbers of leaves were counted.
25
3.5.1.2 Leaf area (cm2)
Healthy, disease free and large size leaves were collected from each replication. It
was calculated with leaf area meter (LI-COR, 3100C).
3.5.1.3 Flower anthesis (days after foliar application)
Runners were transplanted during 2, November 2015 and after 2 weeks when new
sprouting was occurred then foliar application was applied. Numbers of days required for 1st
flower anthesis (opening) were counted after foliar application.
3.5.1.4 Number of crowns (plant-1
)
Same plants which were used for numbers of leaves their below portion (crown)
separated and then numbers of crowns per plant were counted.
3.5.1.5 Number of runners (plant-1
)
Total numbers of runners per plant were estimated during whole strawberry season.
Runner growth was discouraged during whole season for better plant growth.
3.5.2 Yield parameters
Strawberry harvesting was started during end of January and continued till mid-April.
Yield was accounted as marketable, unmarketable and small size.
3.5.2.1 Marketable (g plant
-1)
Strawberries which were 75-80% fully mature, bright red color, larger size and
disease free counted as marketable yield during whole season.
3.5.2.2 Unmarketable (g plant
-1)
Strawberries which were affected due to Grey mould disease (Botrytis cinerea),
Anthracnose fungal disease (Colletotrichum), Powdery mildew (Podosphaera aphanis),
Thrips attack, Phyllody (abnormal development of floral parts into leafy structures caused by
phytoplasma or virus infections) and due to environmental factors (chilling injury and frost
injury) counted as unmarketable yield during season.
26
3.5.2.3 Small size (g plant
-1)
Strawberries which were (< 10 g) and bullet shaped counted as small size yield during
whole season.
3.5.3 Fruit quality Parameters
3.5.3.1 Firmness (kg. cm-2
)
Fruit firmness was observed with digital penetrometer (Humboldt H-1240D) by using
3mm diameter probe which measure the penetration force.
3.5.3.2 TSS (ºBrix)
Total soluble solids measured with digital TSS/Acid meter (Atago, Japan). TSS was
measured by adding one drop of fruit extract on scanner of the meter and it showed values.
3.5.3.3 Titratable acidity (%)
Acidity was measured with digital TSS/Acid meter (Atago, Japan) by diluting 1 ml
fruit extract in 50 ml distilled water after dilution put one drop on the scanner which shows
the acidity values.
3.5.3.4 TSS: TA ratio
When both TSS and acidity values were expressed on the meter then it shows TSS:
TA ratio by dividing the value of TSS with the value of the TA.
3.5.3.5 Vitamin C (mg 100 g-1
)
For the measurement of vitamin C contents in strawberry extract, first of all
strawberry extract was filtered then (10 ml) aliquot was taken in 100 ml flask by making
volume up to mark with the addition of (0.4%) oxalic acid. For titration purpose 5 ml aliquot
was titrated with (2, 6-dichlorophenol indophenol) when pink color appeared it was
indication of end point. Calculations were done with the procedure mentioned by Ruck
(1969).
27
3.5.3.6 Total phenolic contents (TPC) and Total antioxidants (TA)
For the estimation of TPC and TA in strawberry extract supernatant was prepared.
Enzymatic activities rapidly changed due to fluctuation in temperature, so for estimation
purpose liquid nitrogen was used immediately and samples stored at (-80°C). For
homogenization purpose mortar and pestle was used. Strawberry extract (1 ml), methanol,
acetone and HCl were taken in ratio of (10: 8: 2) then homogenization was done by adding
(200 mg) sand. After it prepared sample was taken in 2 eppendorf tubes and vortexed for
only 2 minutes. The process of centrifugation was done and supernatant was added in new
eppendorf tubes for TPC and TA analysis.
3.5.3.7 Total phenolic contents (mg GAE 100 g-1
)
For the determination of TPC of strawberry extract FC method was used. It is called
as Folin–Ciocalteu method. Extracted sample (100 μL) and FC reagent (200 μL) was taken in
centrifuge tube and vortexed only for one minute. After it sodium carbonate (800 μL) was
added in it and it was vortexed again only for one minute. Incubation was done for 2 hours at
ambient temperature and then read the absorbance at 765 nm against the Gallic acid (R2 =
0.7884) standard curve. Calculations were performed according to procedure detailed by
Ainsworth and Gillespie (2007).
3.5.3.8 Total antioxidants (% DPPH)
For TA determinations take supernatant (50 μL) and methanolic solution 0.004 % (5
ml) in test tube. Samples were tested with the interval of 30 minutes. Changes in absorbance
were measured at 517 nm. Calculations were done by using method detailed by Brand-
William et al., 1995.
3.5.4 Antioxidant enzymatic activities (CAT, SOD and POD) determination
For antioxidant enzymatic activities potassium phosphate buffer (2 ml) and
strawberry extract (1 ml) were homogenized. After it centrifugation was done and
supernatant collected for further estimation of enzymatic activities.
28
3.5.4.1 Catalase (U mg−1
protein)
For this activity hydrogen peroxide was used to initiate the reaction mixture.
Enzymatic extract (100 μL) was mixed in H2O2 (100 μL) and then activity was observed 240
nm. Calculations were performed by adopting procedure described by (Liu et al., 2009;
Jimenez et al., 2003).
3.5.4.2 Peroxidase (U mg−1
protein)
For POD activity reaction mixture was prepared by using potassium phosphate buffer
(0.1 M), hydrogen peroxide (20 mM) and guaiacol (20 mM) with different ratios (8: 1: 1).
Enzymatic extract (100 μL) was also added in reaction mixture (100 μL) and then absorbance
was noted at 470 nm. Calculations were performed by using procedure detailed by Liu et al.,
2009.
3.5.4.3 Superoxide dismutase (U mg−1
protein)
For estimation of this activity nitro blue tetrazolium was used for 50% inhibition of
photochemical reduction. Reaction was initiated by adding phosphate buffer (600 μL),
methionine (300 μL), riboflavin (150 μL), distilled water (1000 μL) and enzyme extract (100
μL). Illumination of this mixture was done with fluorescent lamp. The range of absorbance
was 560 nm. Calculations were performed by using protocol detailed by (Stanger and
Popovic, 2009; Jimenez et al., 2003).
3.5.5 Survival (%)
Number of diseased, damaged and dead plants was removed from field during entire
season. At the end of season remaining plants were counted for plants survival percentage.
Survival % = Number of disease, damage and dead plants x 100
Total number of plants
29
3.6 Study 4 (Postharvest)
3.6.1 Postharvest application of calcium chloride (CaCl2) and salicylic acid (SA)
maintain the quality and improve storage life of Strawberry cv. ‘Chandler’.
Treatments:
T1 = Control
T2 = 2 mM CaCl2
T3 = 4 mM CaCl2
T4 = 6 mM CaCl2
T5 = 3 mM SA
T6 = 5 mM SA
T7 = 7 mM SA
For postharvest experiment best quality strawberries were collected from strawberry
farm (Sharaqpur Sharif Lahore, Pakistan). Same size and same stage of mature fruits were
harvested. After harvesting strawberries were pre cooled at 0°C to remove field heat. Each
treatment (240 strawberries) was consisted of 4 replications and in each replication there
were 60 strawberries. For this experiment 1680 marketable strawberries were used. Calcium
chloride easily dissolved in water while salicylic acid firstly dissolves in 10 ml ethanol and
then added in water to make 2 L solution for each replication. Strawberries were in dipped in
different concentration of solutions for 10 minutes. After dipping strawberries were dried at
room condition and then packed in plastic punnets and stored at 4°C, 80-85% RH. Quality
analysis was performed during 0, 3, 6, 9, 12 and 15 days of interval. Fruit physical
parameters including fruit weight loss (%) and fungal decay (%) were also recorded only for
postharvest experiment.
30
3.6.1 Fruit weight loss (%)
For weight loss estimation from each replication separate strawberries were packed in
plastic punnets and weighed. Weight was balanced in each packing for the observation of
weight loss in different intervals.
Weight loss (%) = Fresh weight of strawberries - Final weight of strawberries × 100
Fresh weight of strawberries
3.6.2 Fungal decay (%)
Decay (%) was recorded during 3, 6, 9, 12 and 15 days of storage interval by using
following formula.
Fungal decay (%) = Number of diseased and decayed strawberries in each treatment × 100
Total number of strawberries per treatment
3.7 Statistical Analysis
The data regarding field experiments and postharvest study was statistically analyzed
by using MINITAB®18.0 and SPSS 21 Software (Steel et al., 1997).
3.8 Study 5
Six months internship program at University of Florida, GCREC, USA.
FSHS proceeding paper presented in (131st annual meeting of Florida State Horticultural
Society).
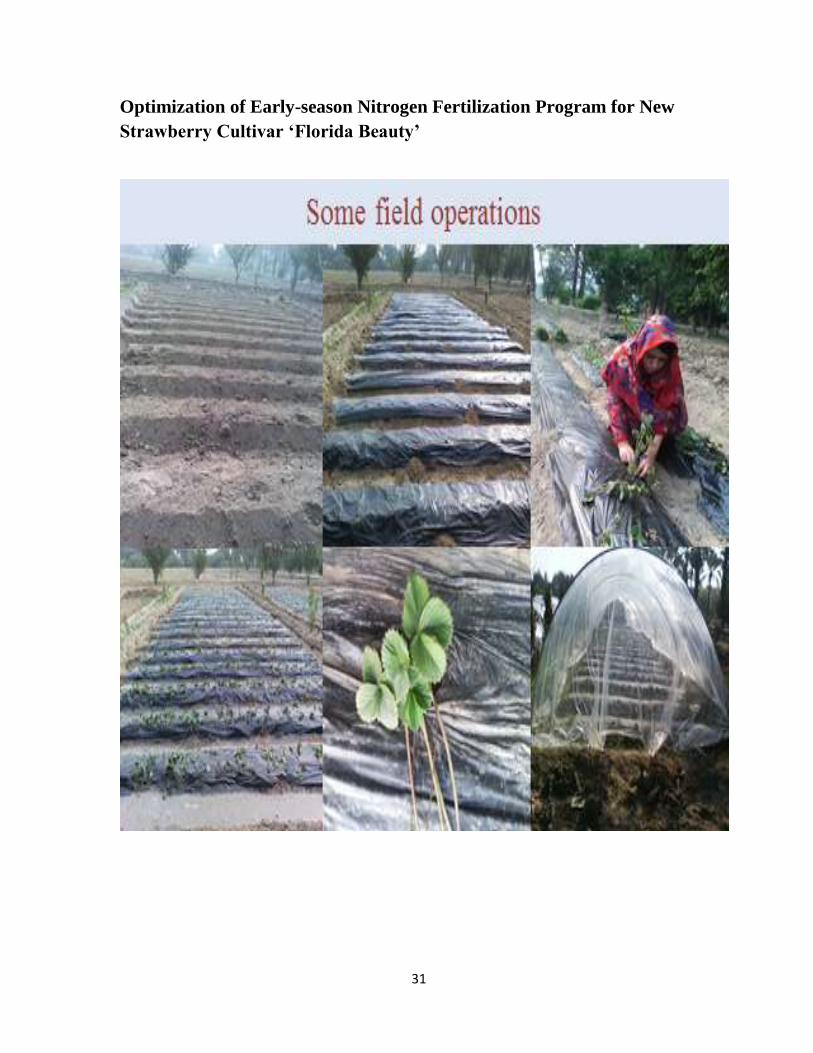
31
Optimization of Early-season Nitrogen Fertilization Program for New
Strawberry Cultivar ‘Florida Beauty’
32
CHAPTER 4 RESULTS AND DISCUSSION
4.1 Study- 1 (Salts)
4.1.1 Experiment No. 1:
Foliar application of calcium chloride (CaCl2) to improve the vegetative
growth, yield and quality of strawberry cv. ‘Chandler’
In this experiment foliar spray of CaCl2 was applied after 2nd
week of runner
transplantation when old leaves were dried and new sprouting occurred. When strawberry
plants were at 3-4 leaves stage 1st foliar application was applied and 2
nd was applied after
fruit setting. Treated strawberry plants were compared with control plants. Plants canopy
growth; yield and quality were observed during growing season. Complete methods are
mentioned in previous chapter.
4.1.1 Results
4.1.1.1 Vegetative parameters (Table 4.1.1.1)
4.1.1.1.1 Number of leaves (plant-1
)
Statistical results regarding strawberry leaves treated with foliar spray of CaCl2
showed significant (p < 0.05) increased results. Maximum leaves (15.25 plant-1
) were
observed in strawberry plants those were sprayed with 7 mM CaCl2 followed by the plants
sprayed with 5 mM and 3 mM where numbers of leaves were 13.50 and 12.0 plant-1
,
respectively. While less leaves (8.0 plant-1
) were in control plants. Calcium chloride
treatments were highly responsive for increasing the number of leaves during season as
compared with control plants.
4.1.1.1.2 Leaf area (cm2)
Statistical analysis regarding strawberry leaf area showed significant increased
results. Leaf area was increased with foliar application of CaCl2. Increasing trend in leaf area
(37.0 cm2) was found in plants sprayed with higher concentration of CaCl2 (7 mM) followed
by the plants sprayed with 5 mM and 3 mM which showed leaf area values 31.50 and 28.0
cm2, respectively. Strawberry plants which were sprayed with lower concentration of CaCl2
33
(3 mM) and control plants these treatments were statistically similar. Leaf area (27.50 cm2)
was minimum in control plants. It was observed that the treatment of CaCl2 is effective to
increase the leaf area when sprayed during growth stages.
4.1.1.1.3 Flower anthesis (days after foliar application)
Statistical analysis regarding flower anthesis showed non-significant results. First
foliar application was applied when strawberry plants were at 3-4 leaves stage. Numbers of
days required for flower anthesis for each treatment were recorded after 1st foliar application.
Statistically there was no difference among different CaCl2 treatment means and control
treatment. Numbers of days required for flower anthesis were almost similar in all
treatments.
4.1.1.1.4 Number of crowns (plant-1
)
Statistical results regarding crown growth of strawberry plants affected by foliar
application of CaCl2 showed significant increased results. Crown growth was noted at the
end of strawberry season and maximum number of crowns (6.50 plant-1
) was noted in 7 mM
CaCl2 treatment followed by plants sprayed with 5 mM which showed number of crowns
(4.50 plant-1
). Strawberry plants sprayed with 3 mM CaCl2 and control plants where numbers
of crowns were 3.25 and 2.50 plant-1
, respectively. Numbers of crowns were increased in the
strawberry plants due to foliar application of CaCl2 which was observed at the end of
strawberry season.
4.1.1.1.5 Number of runners (plant-1
)
Increasing trend was noted in runner production during season. Maximum runners
(7.0 plant-1
) were found in strawberry plants those were sprayed with 7 mM CaCl2 followed
by the plants sprayed with 5 mM and 3 mM where numbers of runners were 4.75 and 3.75
plant-1
, respectively. At the end of strawberry season minimum runners (2.50 plant-1
) were
found with control plants. It was noted from results that CaCl2 spray was more responsive for
increasing runner growth.
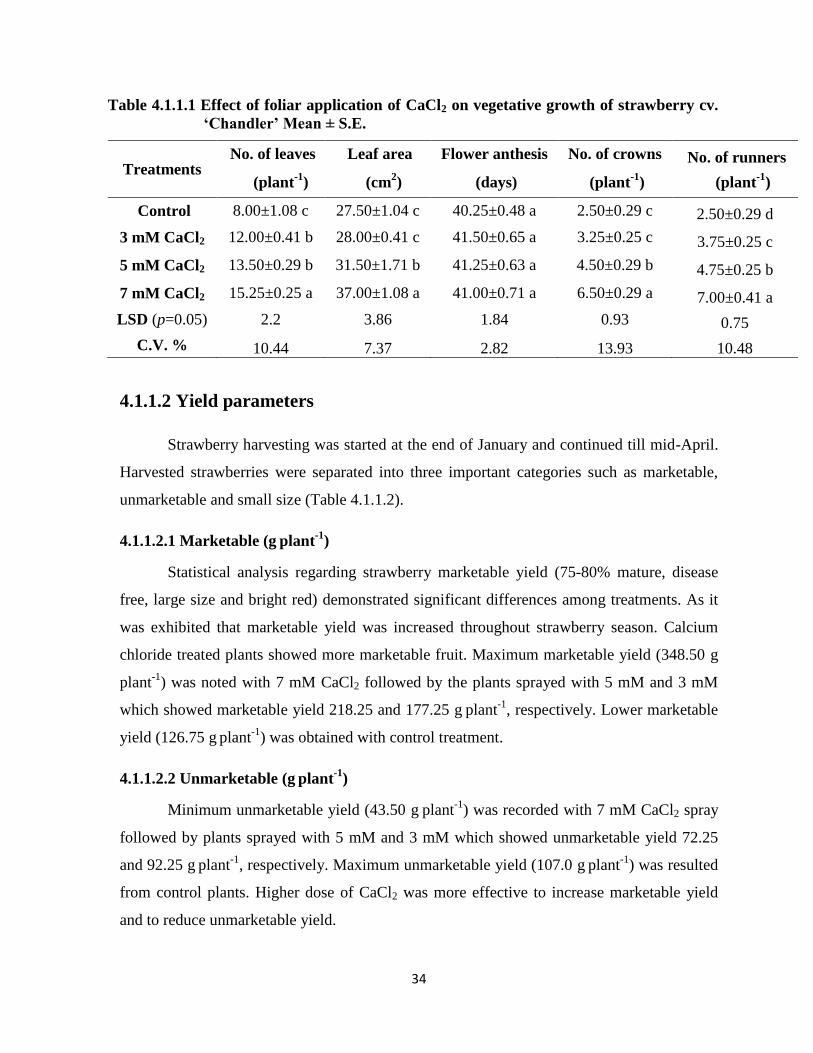
34
Table 4.1.1.1 Effect of foliar application of CaCl2 on vegetative growth of strawberry cv.
‘Chandler’ Mean ± S.E.
Treatments No. of leaves Leaf area Flower anthesis No. of crowns No. of runners
(plant-1
) (cm2) (days) (plant
-1) (plant
-1)
Control 8.00±1.08 c 27.50±1.04 c 40.25±0.48 a 2.50±0.29 c 2.50±0.29 d
3 mM CaCl2 12.00±0.41 b 28.00±0.41 c 41.50±0.65 a 3.25±0.25 c 3.75±0.25 c
5 mM CaCl2 13.50±0.29 b 31.50±1.71 b 41.25±0.63 a 4.50±0.29 b 4.75±0.25 b
7 mM CaCl2 15.25±0.25 a 37.00±1.08 a 41.00±0.71 a 6.50±0.29 a 7.00±0.41 a
LSD (p=0.05) 2.2 3.86 1.84 0.93 0.75
C.V. % 10.44 7.37 2.82 13.93 10.48
4.1.1.2 Yield parameters
Strawberry harvesting was started at the end of January and continued till mid-April.
Harvested strawberries were separated into three important categories such as marketable,
unmarketable and small size (Table 4.1.1.2).
4.1.1.2.1 Marketable (g plant
-1)
Statistical analysis regarding strawberry marketable yield (75-80% mature, disease
free, large size and bright red) demonstrated significant differences among treatments. As it
was exhibited that marketable yield was increased throughout strawberry season. Calcium
chloride treated plants showed more marketable fruit. Maximum marketable yield (348.50 g
plant-1
) was noted with 7 mM CaCl2 followed by the plants sprayed with 5 mM and 3 mM
which showed marketable yield 218.25 and 177.25 g plant
-1, respectively. Lower marketable
yield (126.75 g plant
-1) was obtained with control treatment.
4.1.1.2.2 Unmarketable (g plant
-1)
Minimum unmarketable yield (43.50 g plant
-1) was recorded with 7 mM CaCl2 spray
followed by plants sprayed with 5 mM and 3 mM which showed unmarketable yield 72.25
and 92.25 g plant
-1, respectively. Maximum unmarketable yield (107.0 g
plant
-1) was resulted
from control plants. Higher dose of CaCl2 was more effective to increase marketable yield
and to reduce unmarketable yield.
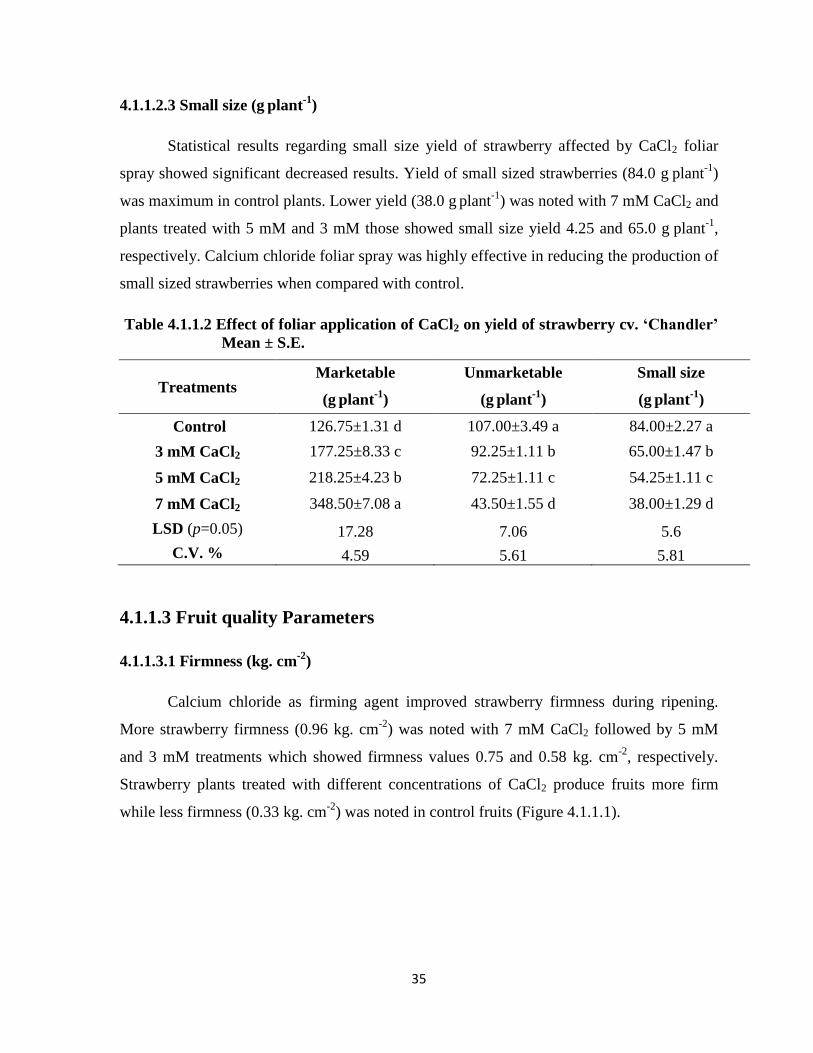
35
4.1.1.2.3 Small size (g plant
-1)
Statistical results regarding small size yield of strawberry affected by CaCl2 foliar
spray showed significant decreased results. Yield of small sized strawberries (84.0 g plant
-1)
was maximum in control plants. Lower yield (38.0 g plant
-1) was noted with 7 mM CaCl2 and
plants treated with 5 mM and 3 mM those showed small size yield 4.25 and 65.0 g plant
-1,
respectively. Calcium chloride foliar spray was highly effective in reducing the production of
small sized strawberries when compared with control.
Table 4.1.1.2 Effect of foliar application of CaCl2 on yield of strawberry cv. ‘Chandler’
Mean ± S.E.
Treatments Marketable Unmarketable Small size
(g plant
-1) (g
plant
-1) (g
plant
-1)
Control 126.75±1.31 d 107.00±3.49 a 84.00±2.27 a
3 mM CaCl2 177.25±8.33 c 92.25±1.11 b 65.00±1.47 b
5 mM CaCl2 218.25±4.23 b 72.25±1.11 c 54.25±1.11 c
7 mM CaCl2 348.50±7.08 a 43.50±1.55 d 38.00±1.29 d
LSD (p=0.05) 17.28 7.06 5.6
C.V. % 4.59 5.61 5.81
4.1.1.3 Fruit quality Parameters
4.1.1.3.1 Firmness (kg. cm-2
)
Calcium chloride as firming agent improved strawberry firmness during ripening.
More strawberry firmness (0.96 kg. cm-2
) was noted with 7 mM CaCl2 followed by 5 mM
and 3 mM treatments which showed firmness values 0.75 and 0.58 kg. cm-2
, respectively.
Strawberry plants treated with different concentrations of CaCl2 produce fruits more firm
while less firmness (0.33 kg. cm-2
) was noted in control fruits (Figure 4.1.1.1).
36
4.1.1.3.2 TSS (ºBrix)
The statistically analyzed data exhibited significant differences among different
calcium chloride treatments regarding strawberry TSS values. Total soluble solids increased
with different concentrations of CaCl2. Maximum amount of TSS (8.03 ºBrix) were noted in
strawberries sprayed with 5 mM CaCl2 followed by 7 mM (6.90 ºBrix) and 3 mM (6.28
ºBrix), respectively while minimum TSS values (5.70 ºBrix) were observed in control
treatment. Our results suggested that medium dose of CaCl2 showed its superiority for
increasing strawberry TSS contents (Figure 4.1.1.2).
4.1.1.3.3 Titratable acidity (%)
Recorded results were non-significant regarding foliar spray of CaCl2 on acid
contents of strawberry fruit. Numerically acid contents were more in control treatment as
compared to CaCl2 treatments. Over all, no difference was noted between different means of
treatments (Figure 4.1.1.3).
4.1.1.3.4 TSS: TA ratio
Statistical data regarding strawberry fruit TSS: TA ratio affected by foliar application
of CaCl2 showed increasing trend. Maximum TSS: TA ratio (7.63) was noted with 5 mM
CaCl2 followed by the plants treated with 7 mM (5.55) and 3 mM (5.14), respectively. TSS:
TA ratio is an important fruit quality parameter which expresses fruit ripening stage.
Minimum ratio was exhibited in control (4.48) treatment. Foliar spray of CaCl2 was more
responsive for increasing TSS: TA ratio in strawberry fruits (Figure 4.1.1.4).
4.1.1.3.5 Vitamin C (mg 100 g-1
)
Maximum vitamin C contents (55.69 mg 100 g-1
) were noted in strawberry fruits
sprayed with 7 mM CaCl2 followed by the plants treated with 5 mM (46.85 mg 100 g-1
) and 3
mM (41.17 mg 100 g-1
), respectively while lower vitamin C contents (35.55 mg 100 g-1
) were
found in control fruits. Calcium chloride as foliar spray played significant role for increasing
the vitamin C contents of strawberry fruits during season (Figure 4.1.1.5).
37
4.1.1.3.6 Total phenolic contents (mg GAE 100 g-1
)
Strawberry plants treated with CaCl2 7 mM, 5 mM and 3 mM produced the
strawberries with total phenolic contents of 186.50, 160.50 and 151.50 mg GAE 100 g-1
,
respectively and significant differences were exhibited. Lower phenolic contents were
observed in control (132.75 mg GAE 100 g-1
) fruits as compared to other treatments. It can
be concluded that CaCl2 spray was effective to produce strawberries with maximum total
phenolic contents (Figure 4.1.1.6).
4.1.1.3.7 Total antioxidants (% DPPH)
Higher antioxidant activities (65.50% DPPH) were noted in strawberry fruits where
plants were treated with 5 mM CaCl2 followed by 7 mM (55.50 % DPPH) and 3 mM (49.25
% DPPH), respectively. The response of medium concentration of CaCl2 (5 mM) was highly
effective for increasing antioxidant activities in strawberry fruits while minimum activities
were observed in control (41.50% DPPH) treatment (Figure 4.1.1.7).
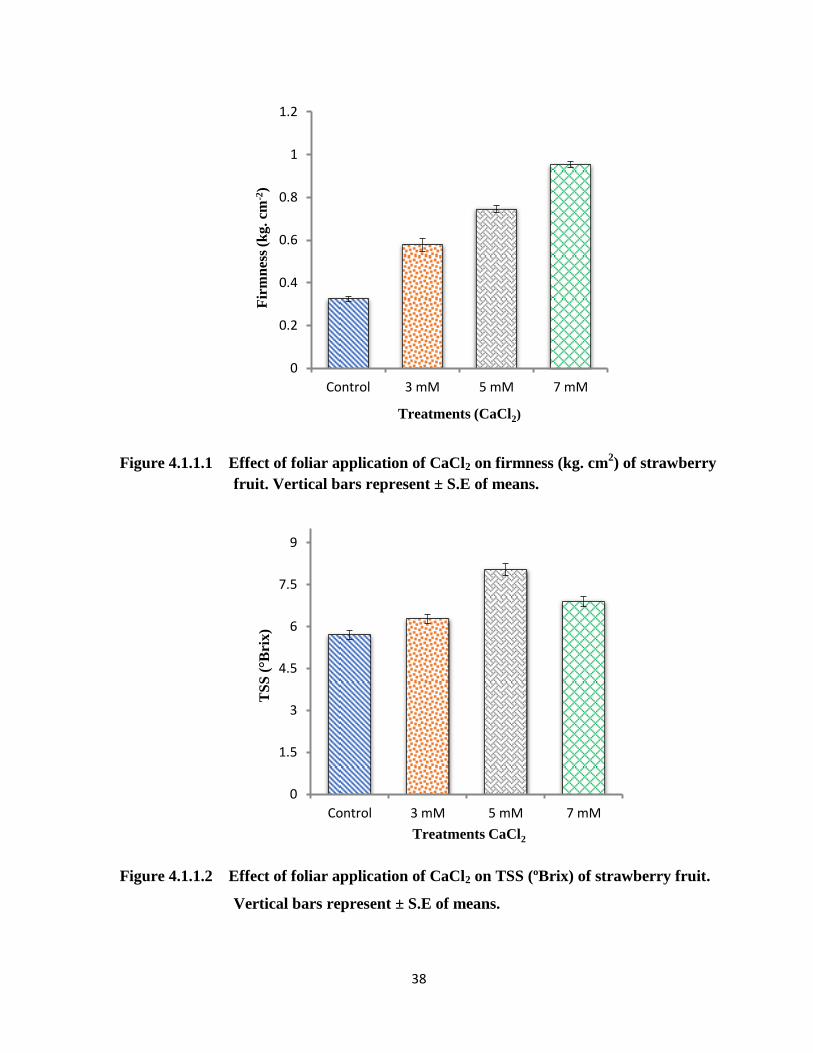
38
Figure 4.1.1.1 Effect of foliar application of CaCl2 on firmness (kg. cm2) of strawberry
fruit. Vertical bars represent ± S.E of means.
Figure 4.1.1.2 Effect of foliar application of CaCl2 on TSS (ºBrix) of strawberry fruit.
Vertical bars represent ± S.E of means.
0
0.2
0.4
0.6
0.8
1
1.2
Control 3 mM 5 mM 7 mM
Fir
mn
ess
(kg
. cm
-2)
Treatments (CaCl2)
0
1.5
3
4.5
6
7.5
9
Control 3 mM 5 mM 7 mM
TS
S (
°Bri
x)
Treatments CaCl2
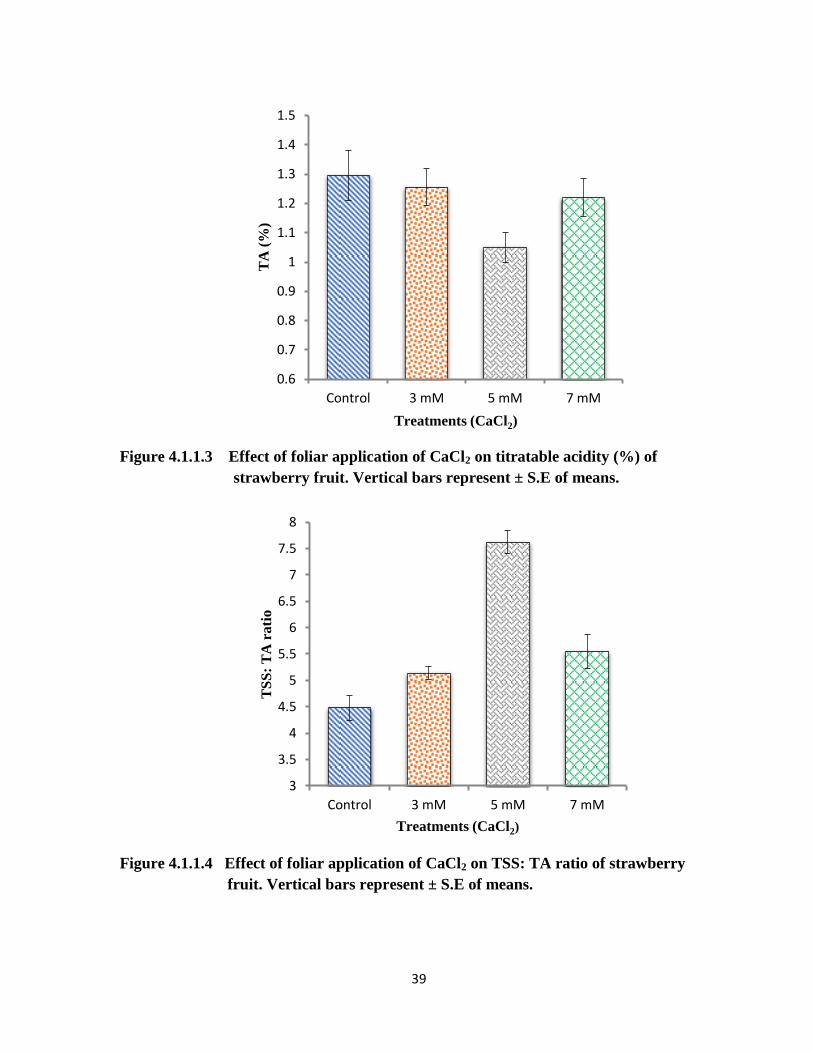
39
Figure 4.1.1.3 Effect of foliar application of CaCl2 on titratable acidity (%) of
strawberry fruit. Vertical bars represent ± S.E of means.
Figure 4.1.1.4 Effect of foliar application of CaCl2 on TSS: TA ratio of strawberry
fruit. Vertical bars represent ± S.E of means.
0.6
0.7
0.8
0.9
1
1.1
1.2
1.3
1.4
1.5
Control 3 mM 5 mM 7 mM
TA
(%
)
Treatments (CaCl2)
3
3.5
4
4.5
5
5.5
6
6.5
7
7.5
8
Control 3 mM 5 mM 7 mM
TS
S:
TA
rati
o
Treatments (CaCl2)
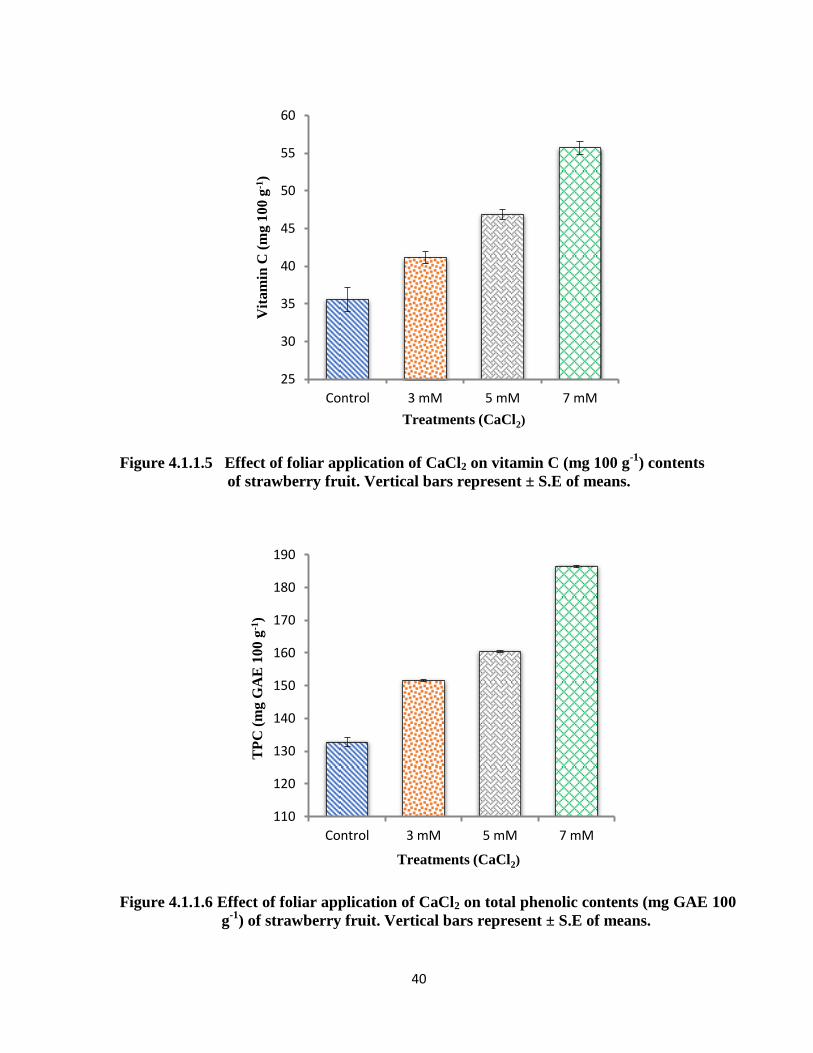
40
Figure 4.1.1.5 Effect of foliar application of CaCl2 on vitamin C (mg 100 g-1
) contents
of strawberry fruit. Vertical bars represent ± S.E of means.
Figure 4.1.1.6 Effect of foliar application of CaCl2 on total phenolic contents (mg GAE 100
g-1
) of strawberry fruit. Vertical bars represent ± S.E of means.
25
30
35
40
45
50
55
60
Control 3 mM 5 mM 7 mM
Vit
am
in C
(m
g 1
00
g-1
)
Treatments (CaCl2)
110
120
130
140
150
160
170
180
190
Control 3 mM 5 mM 7 mM
TP
C (
mg G
AE
100 g
-1)
Treatments (CaCl2)
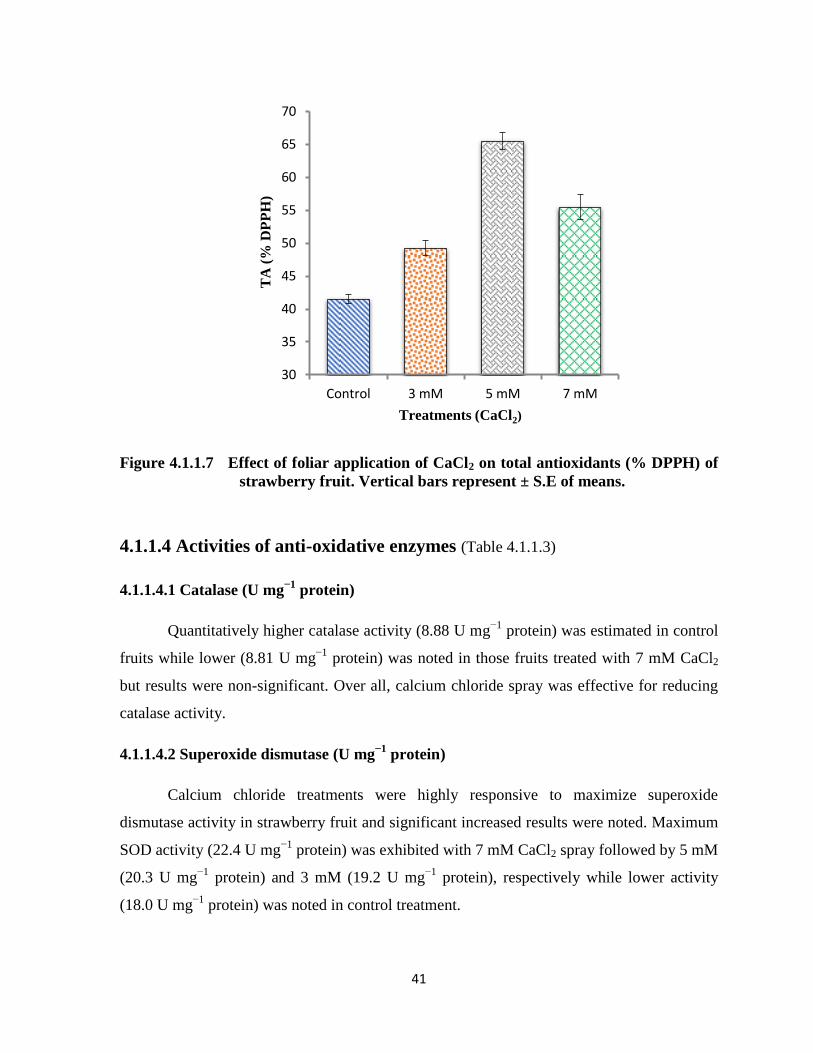
41
Figure 4.1.1.7 Effect of foliar application of CaCl2 on total antioxidants (% DPPH) of
strawberry fruit. Vertical bars represent ± S.E of means.
4.1.1.4 Activities of anti-oxidative enzymes (Table 4.1.1.3)
4.1.1.4.1 Catalase (U mg−1
protein)
Quantitatively higher catalase activity (8.88 U mg−1
protein) was estimated in control
fruits while lower (8.81 U mg−1
protein) was noted in those fruits treated with 7 mM CaCl2
but results were non-significant. Over all, calcium chloride spray was effective for reducing
catalase activity.
4.1.1.4.2 Superoxide dismutase (U mg−1
protein)
Calcium chloride treatments were highly responsive to maximize superoxide
dismutase activity in strawberry fruit and significant increased results were noted. Maximum
SOD activity (22.4 U mg−1
protein) was exhibited with 7 mM CaCl2 spray followed by 5 mM
(20.3 U mg−1
protein) and 3 mM (19.2 U mg−1
protein), respectively while lower activity
(18.0 U mg−1
protein) was noted in control treatment.
30
35
40
45
50
55
60
65
70
Control 3 mM 5 mM 7 mM
TA
(%
DP
PH
)
Treatments (CaCl2)
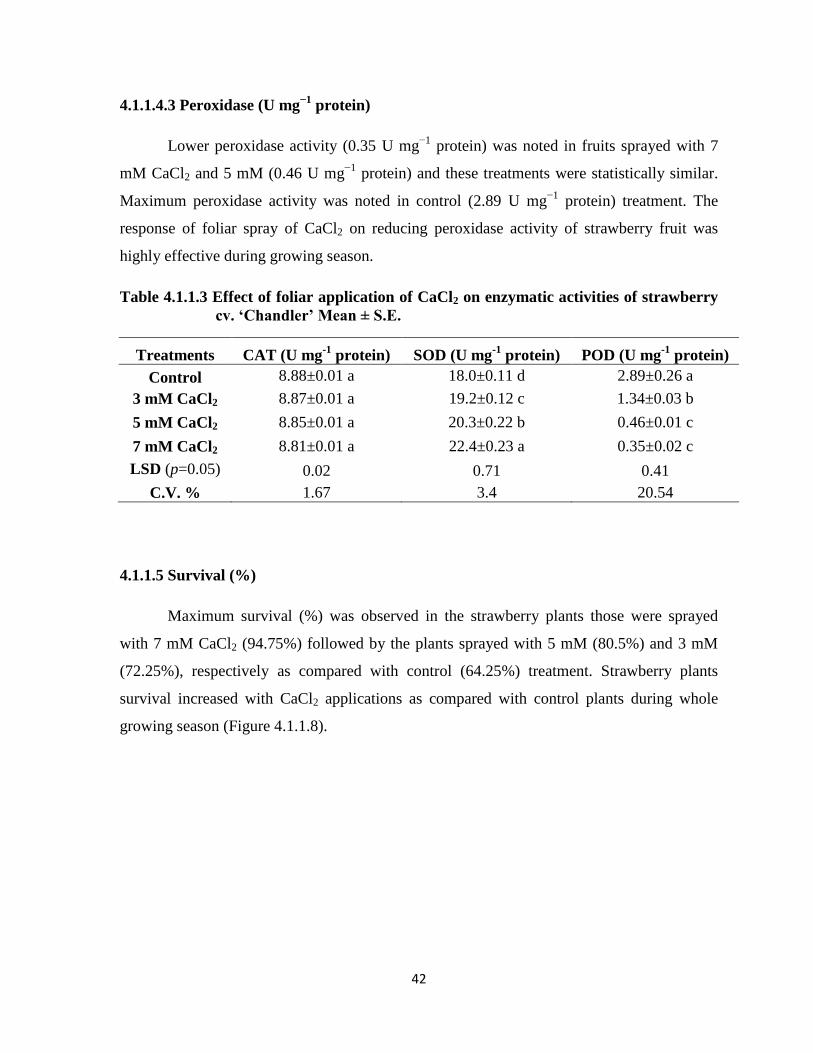
42
4.1.1.4.3 Peroxidase (U mg−1
protein)
Lower peroxidase activity (0.35 U mg−1
protein) was noted in fruits sprayed with 7
mM CaCl2 and 5 mM (0.46 U mg−1
protein) and these treatments were statistically similar.
Maximum peroxidase activity was noted in control (2.89 U mg−1
protein) treatment. The
response of foliar spray of CaCl2 on reducing peroxidase activity of strawberry fruit was
highly effective during growing season.
Table 4.1.1.3 Effect of foliar application of CaCl2 on enzymatic activities of strawberry
cv. ‘Chandler’ Mean ± S.E.
Treatments CAT (U mg-1
protein) SOD (U mg-1
protein) POD (U mg-1
protein)
Control 8.88±0.01 a 18.0±0.11 d 2.89±0.26 a
3 mM CaCl2 8.87±0.01 a 19.2±0.12 c 1.34±0.03 b
5 mM CaCl2 8.85±0.01 a 20.3±0.22 b 0.46±0.01 c
7 mM CaCl2 8.81±0.01 a 22.4±0.23 a 0.35±0.02 c
LSD (p=0.05) 0.02 0.71 0.41
C.V. % 1.67 3.4 20.54
4.1.1.5 Survival (%)
Maximum survival (%) was observed in the strawberry plants those were sprayed
with 7 mM CaCl2 (94.75%) followed by the plants sprayed with 5 mM (80.5%) and 3 mM
(72.25%), respectively as compared with control (64.25%) treatment. Strawberry plants
survival increased with CaCl2 applications as compared with control plants during whole
growing season (Figure 4.1.1.8).
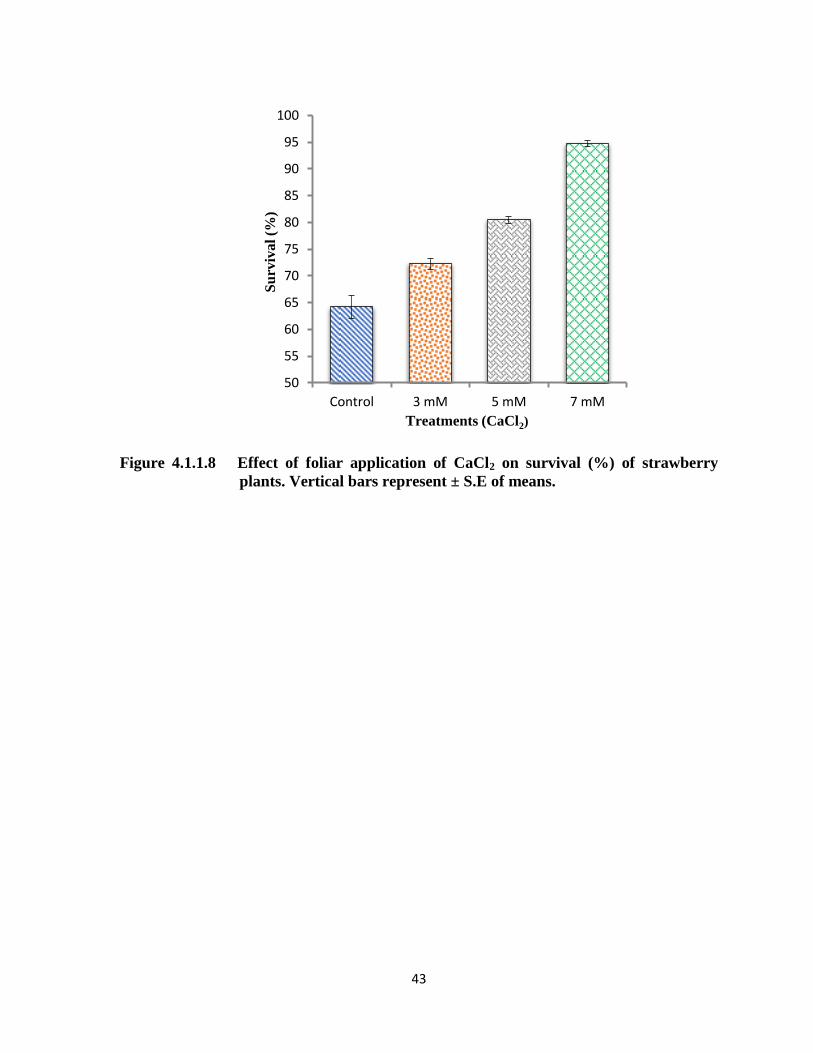
43
Figure 4.1.1.8 Effect of foliar application of CaCl2 on survival (%) of strawberry
plants. Vertical bars represent ± S.E of means.
50
55
60
65
70
75
80
85
90
95
100
Control 3 mM 5 mM 7 mM
Su
rviv
al
(%)
Treatments (CaCl2)
44
4.1.1 Discussion
Strawberry has fast growing habit which needs sufficient amount of nutrients
throughout growing season (Medeiros et al., 2015). For successful strawberry production
micronutrients play major role especially calcium which is classified as secondary nutrient
for strawberry plant requirement and structural part of cell walls and promote rapid plant
growth (Haifa, 2014). Micronutrients increased the hormonal activity and nutrient uptake
efficiency by acting as catalyst (Phillips, 2004). Foliar application of Ca promoted plant
growth and nutrient levels in certain above ground plant organism (Swietlik and Faust,
1984). Foliar application of micronutrients is a supplemental application method to supply
nutrients during critical growth stages when plants cannot uptake adequate nutrients from soil
due to complex soil chemistry, leaching of nutrients, low soil temperature, immobile
nutrients and low water availability which solubilize nutrients and reduce their efficiency
(Growing Produce, 2018). In general, through foliar application plants uptake essential
nutrients by penetrate in the cuticle or enter through the stomata of leaves more rapidly as
compared to soil application (Alshaal and Ramady, 2017).
In current study, different concentrations of calcium chloride were applied through
foliar application. Vegetative growth of strawberry plants was significantly increased with
calcium chloride applications as compared with control plants. Maximum leaves growth
(15.25 plant-1
), leaf area (37.0 cm2), crowns (6.50 plant
-1) and runners (7.0 plant
-1) were
increased with highest concentration of CaCl2 (7 mM) as compared with other treatments.
Calcium as important secondary nutrient for strawberry plant growth enhanced the vegetative
growth because it improve the inflexibility of plasma membrane of plant cells, most
prominent in the apoplast, the cell wall space where it plays major role for cross-link within
pectin polysaccharide matrix and contribute their stability (Haifa, 2014). The quantity of
calcium which plants uptake through soil solution, most of it translocated to the leaves but
very little amount goes to the fruit (Kadir, 2004). Therefore, for better plant growth plants
need regular supply of calcium for vigorous canopy development (Del-Amor and Marcelis,
2003). Our findings regarding foliar spray of calcium chloride enhanced vegetative growth of
strawberry similar with previous findings in which they observed that foliar spray of calcium
chloride (0.6%) enhanced the leaf growth, leaf area and improved canopy of strawberry plant
45
(Bakshi et al., 2013). Our results exhibited that strawberry flowering was not affected by
CaCl2 application and these results were similar with previous findings where foliar applied
0.3% CaCl2 not increased the cluster of flowers in tomato crop (Rab and Haq., 2012).
During whole growing season marketable yield (348.50 g plant-1
) showed increasing
trend and fruit setting was increased with 7 mM CaCl2 as compared with other treatments.
Maximum unmarketable strawberries (107.0 g plant-1
) were resulted from control plants. Our
results proved that CaCl2 treatments reduced unmarketable strawberries and increased the
marketable yield. Maximum small sized strawberries (84 g plant-1
) were noticed in control
treatment while 7 mM CaCl2 treatment was highly effective for reducing small sized
strawberries during season. The mechanism through which external application of CaCl2
improved growth and marketable yield of strawberries, it is because of calcium on plant
surface create electrochemical potential gradient which favors inward movement of calcium.
Calcium sequestered into vacuole through transport across the tonoplast, binds to calcium
binding proteins (calmodulin) and also with intracellular organelles such as mitochondria,
nucleus, endoplasmic reticulum and chloroplast. After binding, it is transmitted to receptor
proteins that elicit proper responses to the stimulus (Taiz and Zeiger, 2006). Our results
showed that marketable yield increased with foliar spray of CaCl2 similar with some previous
findings where foliar application of 10 mM CaCl2 improved the yield and qualitative
characteristics of strawberry cultivar „Pajaro‟ (Kazemi, 2015). The beneficial aspect of CaCl2
for increasing fruit setting and yield was due to maximum capability of photosynthesis and
CaCl2 increased the process of hormone metabolism due to that process auxin synthesis
increase in strawberry plants which is essential for yield and growth.
Maximum strawberry firmness (0.96 kg. cm-2
) was achieved with 7 mM CaCl2 foliar
spray as compared with control (0.33 kg. cm-2
) treatment. Firmness quality increased with
foliar spray of CaCl2 because calcium spray increased the level of pectin in fruit cells due to
that cell wall rigidity increased and fruits nature was more firm (Sams, 1999; Maas, 1998).
Maximum total soluble solids were found in those strawberries which were treated with
CaCl2 (5 mM) as compared with other treatments. It is because of carbohydrates and starch
converted into sugars during ripening stages of strawberry. Statistically acid contents were
found non-significant during season but maximum were noted with control treatment it is
46
because of less production of TSS contents. Maximum TSS: Acid ratio (7.63) was noted with
5 mM CaCl2 treatment. TSS: Acid was major indication of strawberry ripening and maturity.
Vitamin C known as ascorbic acid acted as an antioxidant which increased the
nutritional value of fruit (Rapisarda et al., 2008). Higher amount of vitamin C (55.69 mg 100
g-1
) was observed with 7 mM CaCl2 as compared with other treatments. Vitamin C increased
with CaCl2 application because calcium spray enhanced the activity of several catalytic
enzymes which played major role in biosynthesis of vitamin C contents (Kadir, 2014). Over
all, fruit quality was increased because calcium spray played major role in plant cell wall
integrity and improved the nutritional status of fruits. Calcium deficiency in fruits showed
less resistance against pathogens and increased the chances of disease occurrence in plants,
so calcium spray suggested as for disease management (Naradisorn, 2013). Kazemi (2014)
also observed similar findings regarding foliar application of CaCl2 10 mM enhanced the
quality of strawberry. In literature it was proved that foliar spray of calcium chloride 0.6%
increased the TSS contents (8.31 ºBrix), ascorbic acid contents (60.88 mg/100g) of
strawberry and lower acidity than control (Bakshi et al., 2013). In previous findings it was
confirmed that foliar application of calcium containing products improved firmness of
kiwifruit cultivar „Tsechelidis‟ compared with control (Koutinas et al., 2010).
In current study, it was evaluated that application of CaCl2 significantly increased
phenolic compounds and antioxidants in strawberry. Maximum phenolic contents
(186.50 mg GAE 100 g-1
) were found with 7 mM CaCl2 as compared with other treatments.
Higher antioxidants (65.50 % DPPH) increased with 5 mM CaCl2 because sometimes higher
doses were less effective to increase all quality attributes due to climatic, soil and varietal
response. External application of calcium activated environmental and developmental
responses against severe conditions (high light intensity, long day length, high temperature,
extreme drought, osmotic stress and attack of pathogens) in plant cell membranes and
enhanced calcium concentration which increased the level of antioxidants and phenolic
compounds in plants (Taiz and Zeiger, 2006).
Our results showed that enzymatic activities were also influenced with CaCl2
treatments. Catalase activity was found maximum in all the treatments and no difference was
observed. Superoxide dismutase activity was noted maximum with CaCl2 treatments.
Peroxidase activity was maximum in control plants and significantly lowered with CaCl2
47
spray because at very higher rate it cause off flavor. In literature it was observed that reactive
oxygen species (ROS) produced during biochemical changes in strawberry such as the
superoxide radical and it cause oxidative damage (Jimenez et al. 2003). These (ROS) species
caused early fruit ripening and leading towards senescence. Enzymatic activities including
POD and SOD produce during different growth stages and increased the defense responses.
Reactive oxygen species produce due to decline in these enzymatic activities (Anand et al.,
2009). According to our results it was clear that maximum survival (94.75%) achieved with 7
mM CaCl2 treated strawberry plants as compared to control (64.25%) plants. Previous studies
showed that calcium signaling played critical role in plant resistance to diseases; create
defense mechanism against insects and acclimatization against non-biological stresses (Sun
et al., 2009). As second messenger calcium played important role in signal transduction
pathways particularly ABA signal transduction process. When calcium encountered with
abiotic stresses (cold and drought) it rapidly accumulated ABA and increased calcium ions
concentration in plant cell. So, in that way enzymatic activities increased which enhanced the
survival mechanism (Sun et al., 2009). During whole season CaCl2 treated strawberry plants
showed better response as compared with untreated plants.
4.1.1 Conclusion
Calcium as secondary messenger play important role for strawberry plant growth and
development. In current study 7 mM CaCl2 treatment was proved best for improving the
vegetative growth, marketable yield and survival mechanism of strawberry plants during
growing season. Fruit quality was also improved with 7 mM CaCl2 foliar spray while TSS
contents, TSS: Acid ratio and total antioxidants were observed maximum with medium dose
of CaCl2 (5 mM) as compared with higher and lower doses because sometime higher doses
not increase the all quality attributes.
48
4.1.2 Experiment No. 2:
Foliar application of zinc sulfate (ZnSO4) to improve the vegetative growth,
yield and quality of strawberry cv. ‘Chandler’
In this experiment ZnSO4 was applied as foliar spray during growth stages. Treated
plants were compared with control plants. Canopy growth, yield and quality were observed
during growing season. Complete methods are mentioned in previous chapter.
4.1.2 Results
4.1.2.1 Vegetative parameters (Table 4.1.2.1)
4.1.2.1.1 Number of leaves (plant-1
)
Statistical analysis regarding strawberry leaves affected by foliar spray of ZnSO4
showed significant (p < 0.05) differences among different treatments means. Maximum
leaves (18.25 plant-1
) were observed with 100 mg L-1
ZnSO4 followed by other treatments
including 150 and 50 mg L-1
ZnSO4 which showed numbers of leaves (13.50 and 10.75
plant-1
), respectively. Minimum (8.25 plant-1
) leaves were observed in control plants.
Numbers of leaves increased with ZnSO4 foliar spray when compared with control plants.
4.1.2.1.2 Leaf area (cm2)
Leaf area was increased with foliar spray of ZnSO4. Maximum leaf area (52.0 cm2)
was noted with 100 mg L-1
ZnSO4 spray followed by other treatment 150 mg L-1
ZnSO4
which showed leaf area (42.75 cm2). Plants those were sprayed with ZnSO4 (50 mg L
-1) and
control plants these treatments were statistically same. Leaf area did not increase in control
plants. It was exhibited from results that foliar application of 100 mg L-1
ZnSO4 was more
efficient for maximizing the leaf area as compared to other treatments.
49
4.1.2.1.3 Flower anthesis (days after foliar application)
Minimum numbers of days (27.50) were required to open 1st flower when sprayed
with 150 mg L-1
ZnSO4 followed by other treatments 100 mg L-1
(33.75) and 50 mg L-1
(39.75), respectively. Maximum numbers of days (43.75) to open 1st flower were observed in
control treatment. It was noted that higher concentration of ZnSO4 initiate early flowering.
4.1.2.1.4 Number of crowns (plant-1
)
Maximum crowns (7.0 plant-1
) were observed in those strawberry plants sprayed with
100 mg L-1
ZnSO4 followed by 150 and 50 mg L-1
ZnSO4 where numbers of crowns were
4.50 and 3.50 plant-1
, respectively. Higher dose of ZnSO4 was not effective for increasing the
number of crowns when compared with 100 mg L-1
ZnSO4. Minimum numbers of crowns
(2.50 plant-1
) were noted in control treatment. It was noted that treatment of ZnSO4 (100 mg
L-1
) was more responsive to increase the crown growth.
4.1.2.1.5 Number of runners (plant-1
)
Statistical analysis regarding runner growth of strawberry plants affected by foliar
spray of ZnSO4 showed non-significant (p > 0.05) results. Runner growth was not increased
with foliar spray of ZnSO4 and no significant difference was noted among treatments.
Statistically all treatment means were same and similar numbers of runners per plant were
observed.
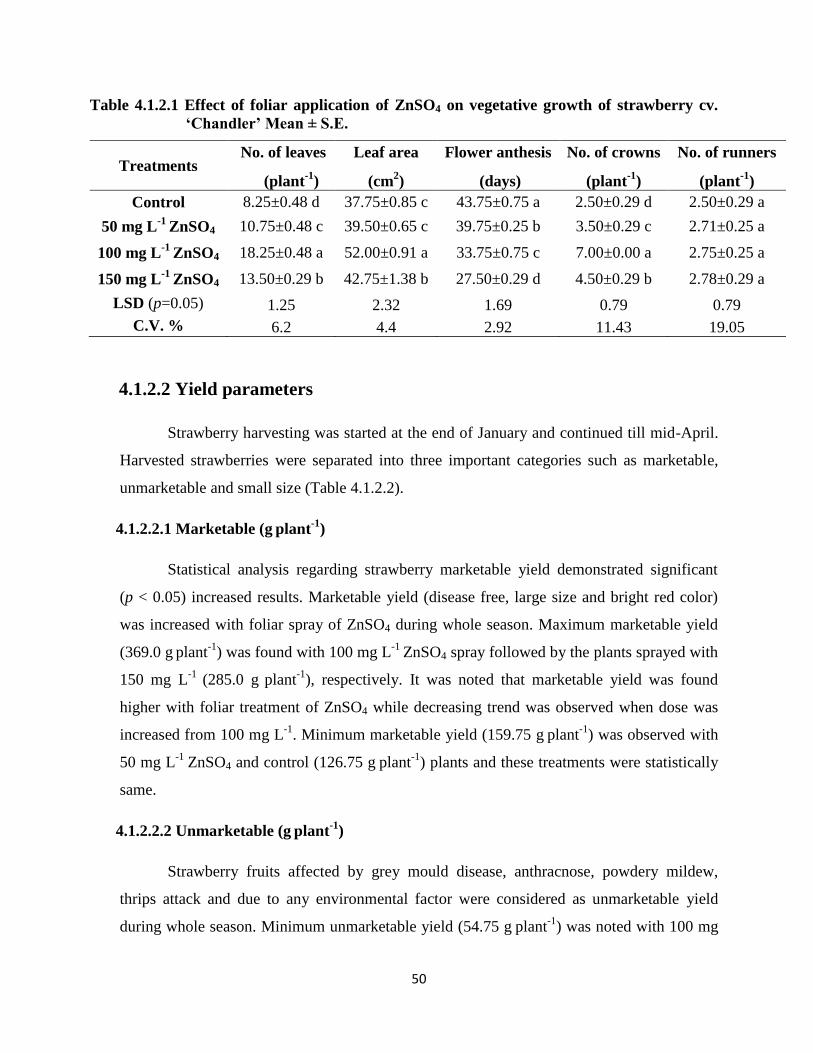
50
Table 4.1.2.1 Effect of foliar application of ZnSO4 on vegetative growth of strawberry cv.
‘Chandler’ Mean ± S.E.
Treatments No. of leaves Leaf area Flower anthesis No. of crowns No. of runners
(plant-1
) (cm2) (days) (plant
-1) (plant
-1)
Control 8.25±0.48 d 37.75±0.85 c 43.75±0.75 a 2.50±0.29 d 2.50±0.29 a
50 mg L-1
ZnSO4 10.75±0.48 c 39.50±0.65 c 39.75±0.25 b 3.50±0.29 c 2.71±0.25 a
100 mg L-1
ZnSO4 18.25±0.48 a 52.00±0.91 a 33.75±0.75 c 7.00±0.00 a 2.75±0.25 a
150 mg L-1
ZnSO4 13.50±0.29 b 42.75±1.38 b 27.50±0.29 d 4.50±0.29 b 2.78±0.29 a
LSD (p=0.05) 1.25 2.32 1.69 0.79 0.79
C.V. % 6.2 4.4 2.92 11.43 19.05
4.1.2.2 Yield parameters
Strawberry harvesting was started at the end of January and continued till mid-April.
Harvested strawberries were separated into three important categories such as marketable,
unmarketable and small size (Table 4.1.2.2).
4.1.2.2.1 Marketable (g plant
-1)
Statistical analysis regarding strawberry marketable yield demonstrated significant
(p < 0.05) increased results. Marketable yield (disease free, large size and bright red color)
was increased with foliar spray of ZnSO4 during whole season. Maximum marketable yield
(369.0 g plant
-1) was found with 100 mg L
-1 ZnSO4 spray followed by the plants sprayed with
150 mg L-1
(285.0 g plant
-1), respectively. It was noted that marketable yield was found
higher with foliar treatment of ZnSO4 while decreasing trend was observed when dose was
increased from 100 mg L-1
. Minimum marketable yield (159.75 g plant
-1) was observed with
50 mg L-1
ZnSO4 and control (126.75 g plant
-1) plants and these treatments were statistically
same.
4.1.2.2.2 Unmarketable (g plant
-1)
Strawberry fruits affected by grey mould disease, anthracnose, powdery mildew,
thrips attack and due to any environmental factor were considered as unmarketable yield
during whole season. Minimum unmarketable yield (54.75 g plant
-1) was noted with 100 mg
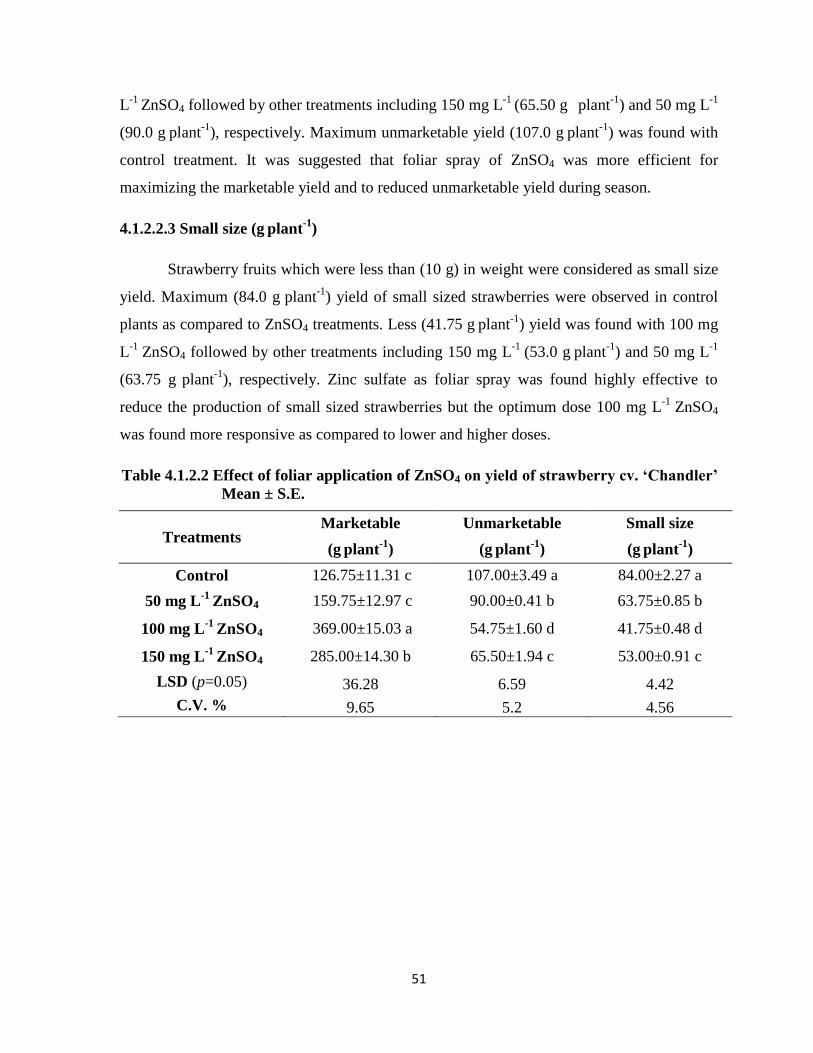
51
L-1
ZnSO4 followed by other treatments including 150 mg L-1
(65.50 g plant
-1) and 50 mg L
-1
(90.0 g plant
-1), respectively. Maximum unmarketable yield (107.0 g
plant
-1) was found with
control treatment. It was suggested that foliar spray of ZnSO4 was more efficient for
maximizing the marketable yield and to reduced unmarketable yield during season.
4.1.2.2.3 Small size (g plant
-1)
Strawberry fruits which were less than (10 g) in weight were considered as small size
yield. Maximum (84.0 g plant
-1) yield of small sized strawberries were observed in control
plants as compared to ZnSO4 treatments. Less (41.75 g plant
-1) yield was found with 100 mg
L-1
ZnSO4 followed by other treatments including 150 mg L-1
(53.0 g plant
-1) and 50 mg L
-1
(63.75 g plant
-1), respectively. Zinc sulfate as foliar spray was found highly effective to
reduce the production of small sized strawberries but the optimum dose 100 mg L-1
ZnSO4
was found more responsive as compared to lower and higher doses.
Table 4.1.2.2 Effect of foliar application of ZnSO4 on yield of strawberry cv. ‘Chandler’
Mean ± S.E.
Treatments Marketable Unmarketable Small size
(g plant
-1) (g
plant
-1) (g
plant
-1)
Control 126.75±11.31 c 107.00±3.49 a 84.00±2.27 a
50 mg L-1
ZnSO4 159.75±12.97 c 90.00±0.41 b 63.75±0.85 b
100 mg L-1
ZnSO4 369.00±15.03 a 54.75±1.60 d 41.75±0.48 d
150 mg L-1
ZnSO4 285.00±14.30 b 65.50±1.94 c 53.00±0.91 c
LSD (p=0.05) 36.28 6.59 4.42
C.V. % 9.65 5.2 4.56
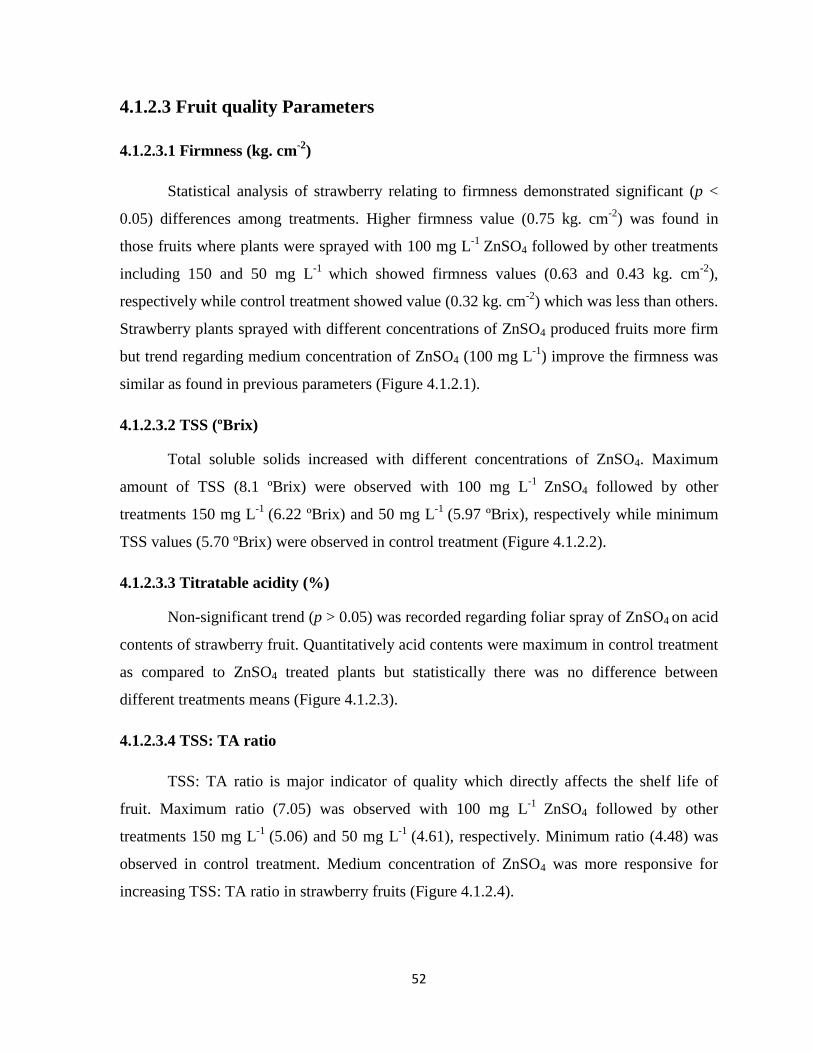
52
4.1.2.3 Fruit quality Parameters
4.1.2.3.1 Firmness (kg. cm-2
)
Statistical analysis of strawberry relating to firmness demonstrated significant (p <
0.05) differences among treatments. Higher firmness value (0.75 kg. cm-2
) was found in
those fruits where plants were sprayed with 100 mg L-1
ZnSO4 followed by other treatments
including 150 and 50 mg L-1
which showed firmness values (0.63 and 0.43 kg. cm-2
),
respectively while control treatment showed value (0.32 kg. cm-2
) which was less than others.
Strawberry plants sprayed with different concentrations of ZnSO4 produced fruits more firm
but trend regarding medium concentration of ZnSO4 (100 mg L-1
) improve the firmness was
similar as found in previous parameters (Figure 4.1.2.1).
4.1.2.3.2 TSS (ºBrix)
Total soluble solids increased with different concentrations of ZnSO4. Maximum
amount of TSS (8.1 ºBrix) were observed with 100 mg L-1
ZnSO4 followed by other
treatments 150 mg L-1
(6.22 ºBrix) and 50 mg L-1
(5.97 ºBrix), respectively while minimum
TSS values (5.70 ºBrix) were observed in control treatment (Figure 4.1.2.2).
4.1.2.3.3 Titratable acidity (%)
Non-significant trend (p > 0.05) was recorded regarding foliar spray of ZnSO4 on acid
contents of strawberry fruit. Quantitatively acid contents were maximum in control treatment
as compared to ZnSO4 treated plants but statistically there was no difference between
different treatments means (Figure 4.1.2.3).
4.1.2.3.4 TSS: TA ratio
TSS: TA ratio is major indicator of quality which directly affects the shelf life of
fruit. Maximum ratio (7.05) was observed with 100 mg L-1
ZnSO4 followed by other
treatments 150 mg L-1
(5.06) and 50 mg L-1
(4.61), respectively. Minimum ratio (4.48) was
observed in control treatment. Medium concentration of ZnSO4 was more responsive for
increasing TSS: TA ratio in strawberry fruits (Figure 4.1.2.4).
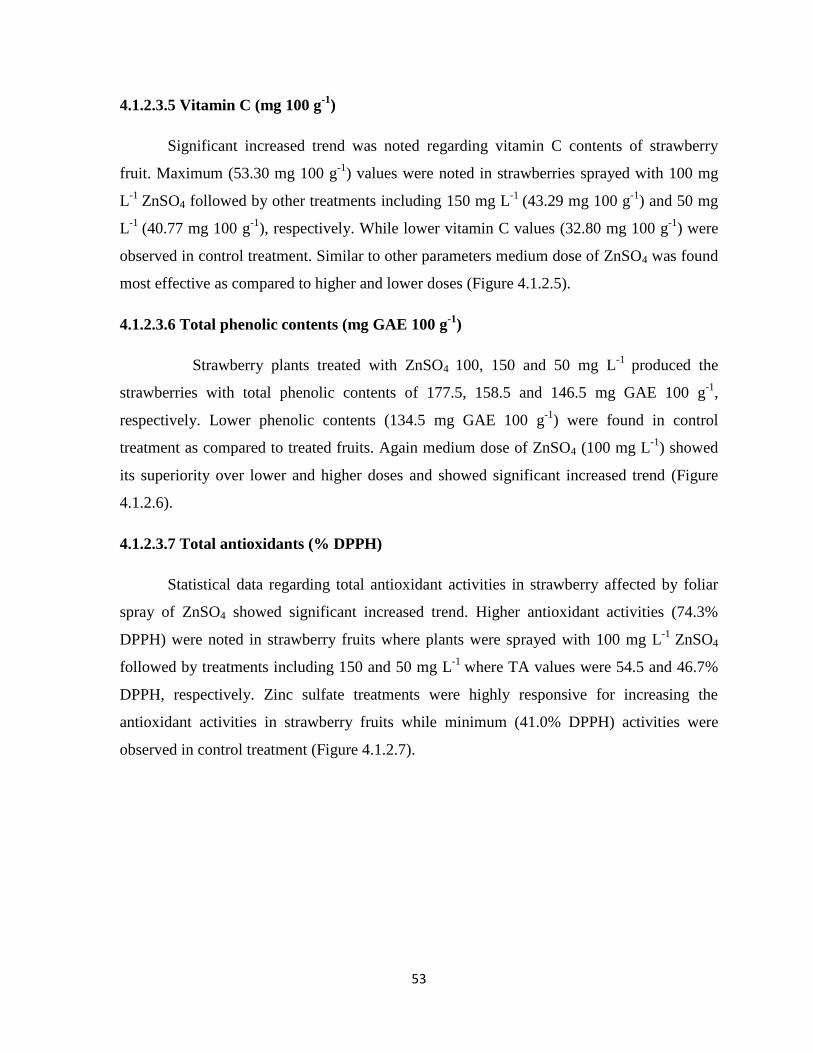
53
4.1.2.3.5 Vitamin C (mg 100 g-1
)
Significant increased trend was noted regarding vitamin C contents of strawberry
fruit. Maximum (53.30 mg 100 g-1
) values were noted in strawberries sprayed with 100 mg
L-1
ZnSO4 followed by other treatments including 150 mg L-1
(43.29 mg 100 g-1
) and 50 mg
L-1
(40.77 mg 100 g-1
), respectively. While lower vitamin C values (32.80 mg 100 g-1
) were
observed in control treatment. Similar to other parameters medium dose of ZnSO4 was found
most effective as compared to higher and lower doses (Figure 4.1.2.5).
4.1.2.3.6 Total phenolic contents (mg GAE 100 g-1
)
Strawberry plants treated with ZnSO4 100, 150 and 50 mg L-1
produced the
strawberries with total phenolic contents of 177.5, 158.5 and 146.5 mg GAE 100 g-1
,
respectively. Lower phenolic contents (134.5 mg GAE 100 g-1
) were found in control
treatment as compared to treated fruits. Again medium dose of ZnSO4 (100 mg L-1
) showed
its superiority over lower and higher doses and showed significant increased trend (Figure
4.1.2.6).
4.1.2.3.7 Total antioxidants (% DPPH)
Statistical data regarding total antioxidant activities in strawberry affected by foliar
spray of ZnSO4 showed significant increased trend. Higher antioxidant activities (74.3%
DPPH) were noted in strawberry fruits where plants were sprayed with 100 mg L-1
ZnSO4
followed by treatments including 150 and 50 mg L-1
where TA values were 54.5 and 46.7%
DPPH, respectively. Zinc sulfate treatments were highly responsive for increasing the
antioxidant activities in strawberry fruits while minimum (41.0% DPPH) activities were
observed in control treatment (Figure 4.1.2.7).
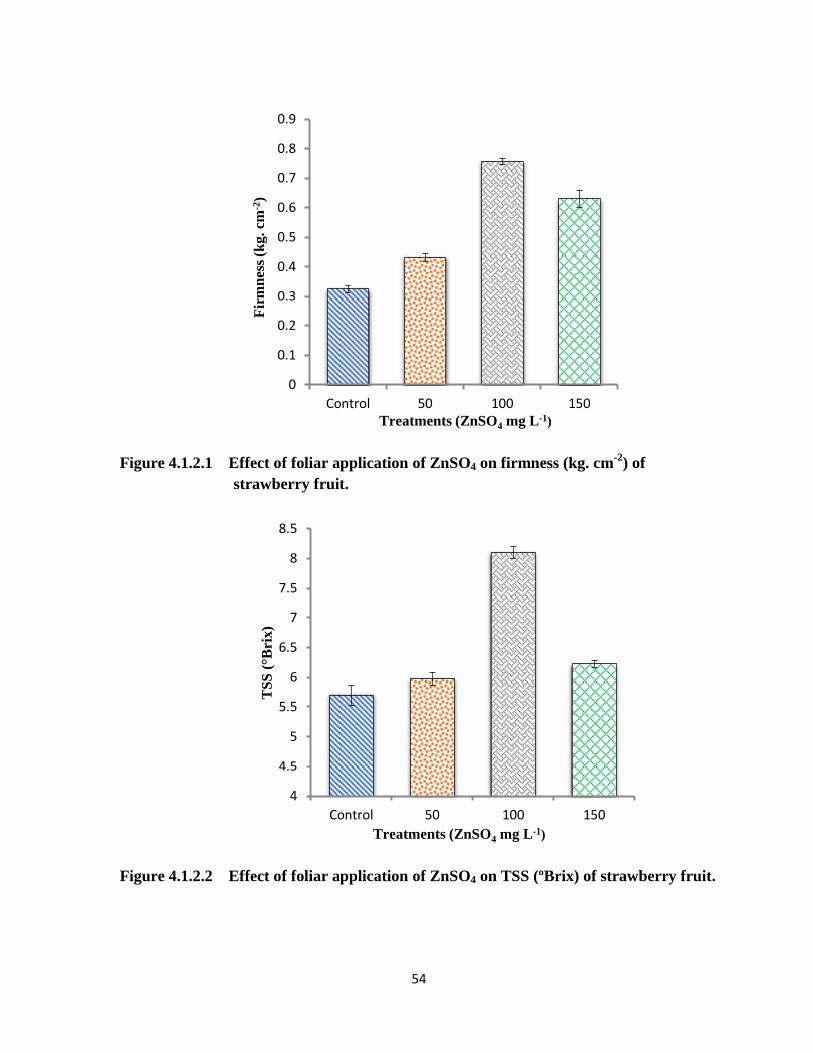
54
Figure 4.1.2.1 Effect of foliar application of ZnSO4 on firmness (kg. cm-2
) of
strawberry fruit.
Figure 4.1.2.2 Effect of foliar application of ZnSO4 on TSS (ºBrix) of strawberry fruit.
0
0.1
0.2
0.3
0.4
0.5
0.6
0.7
0.8
0.9
Control 50 100 150
Fir
mn
ess
(kg
. cm
-2)
Treatments (ZnSO4 mg L-1)
4
4.5
5
5.5
6
6.5
7
7.5
8
8.5
Control 50 100 150
TS
S (
°Bri
x)
Treatments (ZnSO4 mg L-1)
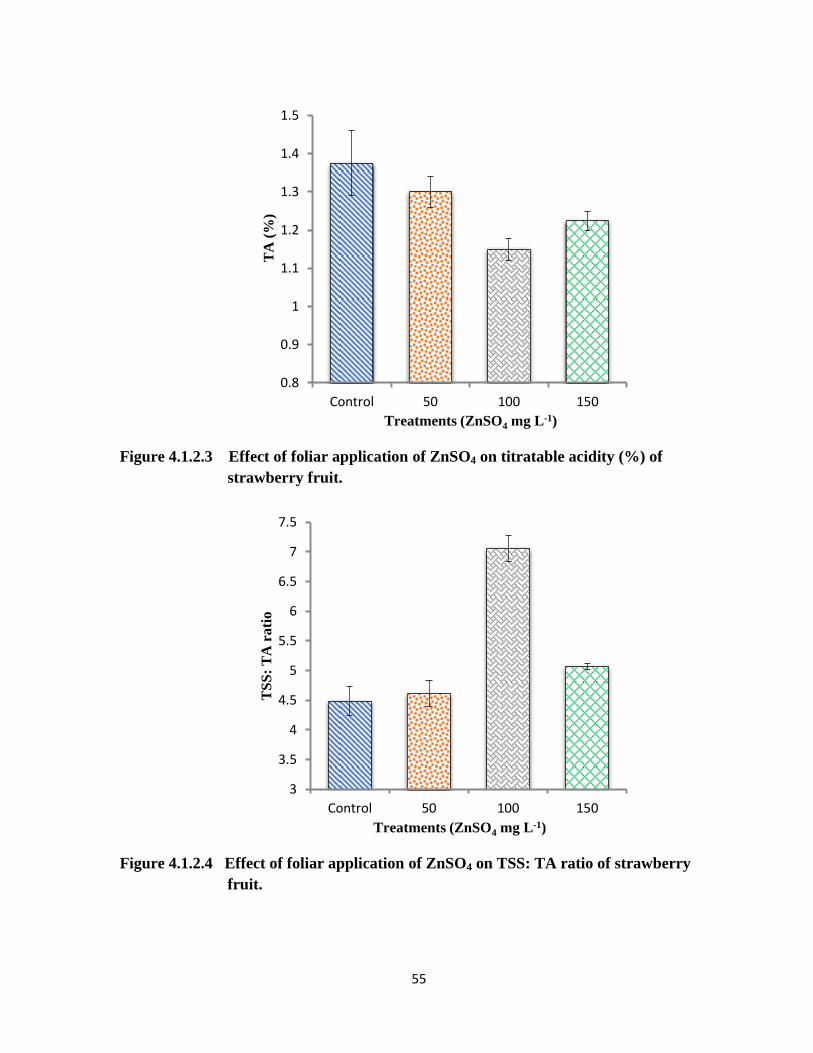
55
Figure 4.1.2.3 Effect of foliar application of ZnSO4 on titratable acidity (%) of
strawberry fruit.
Figure 4.1.2.4 Effect of foliar application of ZnSO4 on TSS: TA ratio of strawberry
fruit.
0.8
0.9
1
1.1
1.2
1.3
1.4
1.5
Control 50 100 150
TA
(%
)
Treatments (ZnSO4 mg L-1)
3
3.5
4
4.5
5
5.5
6
6.5
7
7.5
Control 50 100 150
TS
S:
TA
rati
o
Treatments (ZnSO4 mg L-1)
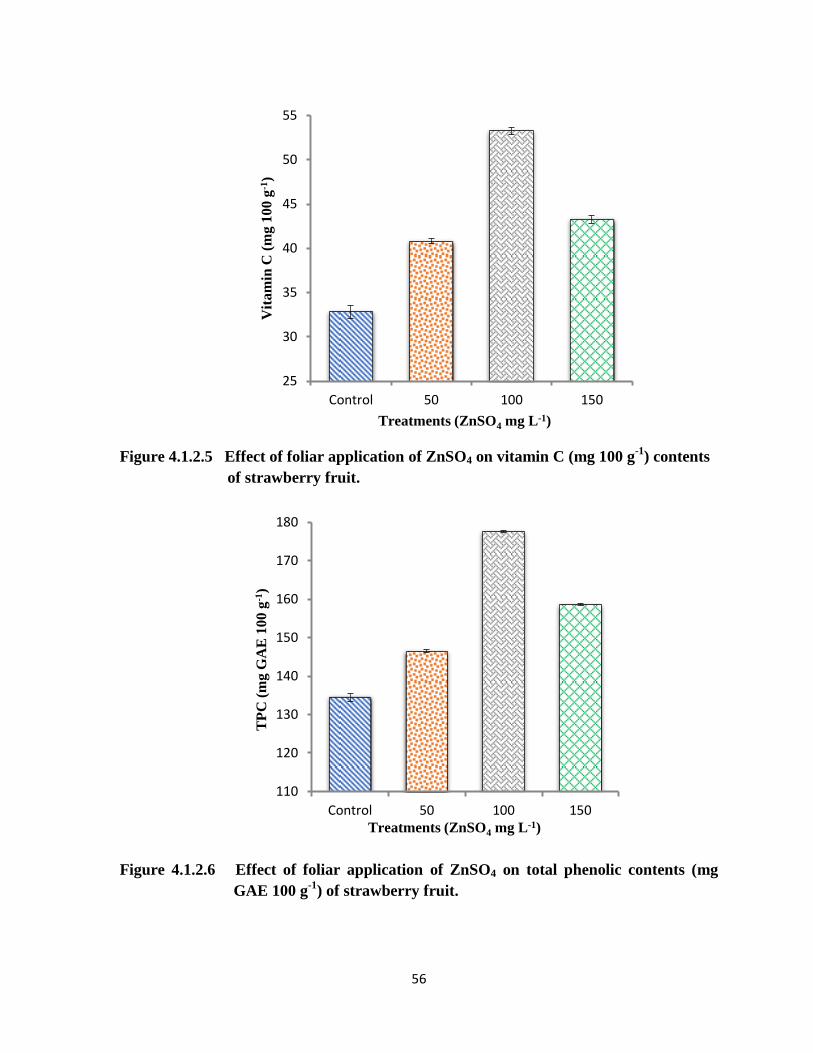
56
Figure 4.1.2.5 Effect of foliar application of ZnSO4 on vitamin C (mg 100 g-1
) contents
of strawberry fruit.
Figure 4.1.2.6 Effect of foliar application of ZnSO4 on total phenolic contents (mg
GAE 100 g-1
) of strawberry fruit.
25
30
35
40
45
50
55
Control 50 100 150
Vit
am
in C
(m
g 1
00
g-1
)
Treatments (ZnSO4 mg L-1)
110
120
130
140
150
160
170
180
Control 50 100 150
TP
C (
mg G
AE
100 g
-1)
Treatments (ZnSO4 mg L-1)
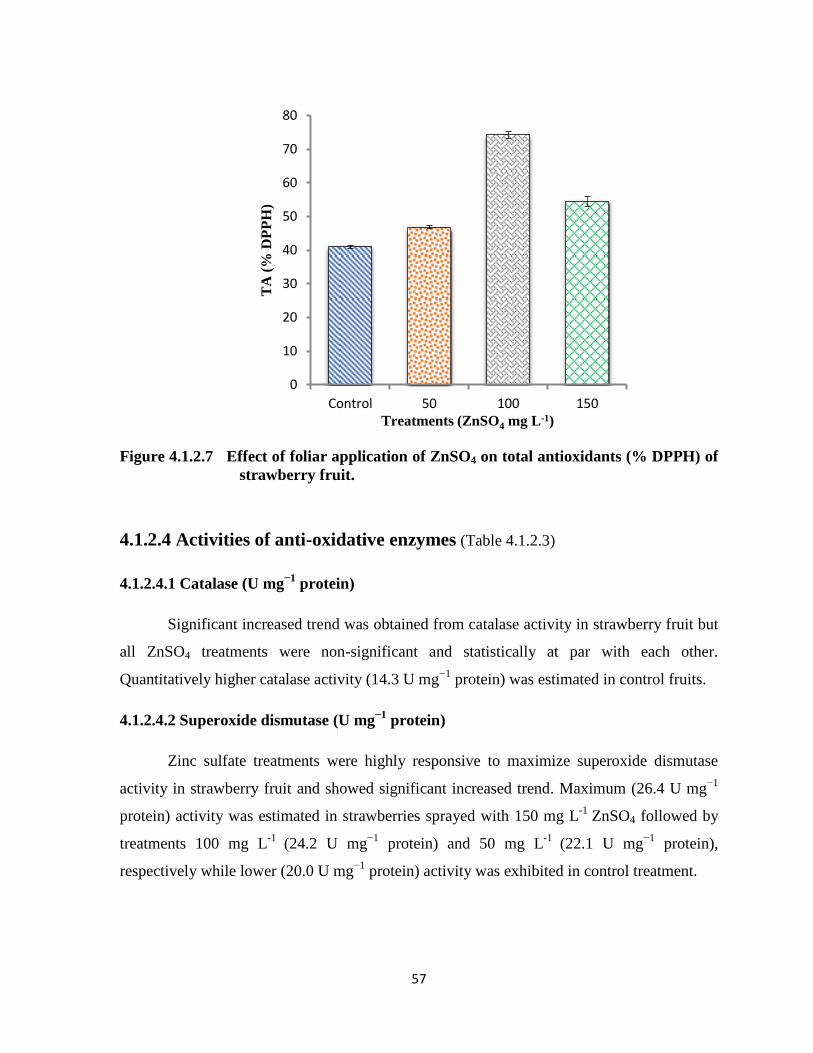
57
Figure 4.1.2.7 Effect of foliar application of ZnSO4 on total antioxidants (% DPPH) of
strawberry fruit.
4.1.2.4 Activities of anti-oxidative enzymes (Table 4.1.2.3)
4.1.2.4.1 Catalase (U mg−1
protein)
Significant increased trend was obtained from catalase activity in strawberry fruit but
all ZnSO4 treatments were non-significant and statistically at par with each other.
Quantitatively higher catalase activity (14.3 U mg−1
protein) was estimated in control fruits.
4.1.2.4.2 Superoxide dismutase (U mg−1
protein)
Zinc sulfate treatments were highly responsive to maximize superoxide dismutase
activity in strawberry fruit and showed significant increased trend. Maximum (26.4 U mg−1
protein) activity was estimated in strawberries sprayed with 150 mg L-1
ZnSO4 followed by
treatments 100 mg L-1
(24.2 U mg−1
protein) and 50 mg L-1
(22.1 U mg−1
protein),
respectively while lower (20.0 U mg−1
protein) activity was exhibited in control treatment.
0
10
20
30
40
50
60
70
80
Control 50 100 150
TA
(%
DP
PH
)
Treatments (ZnSO4 mg L-1)
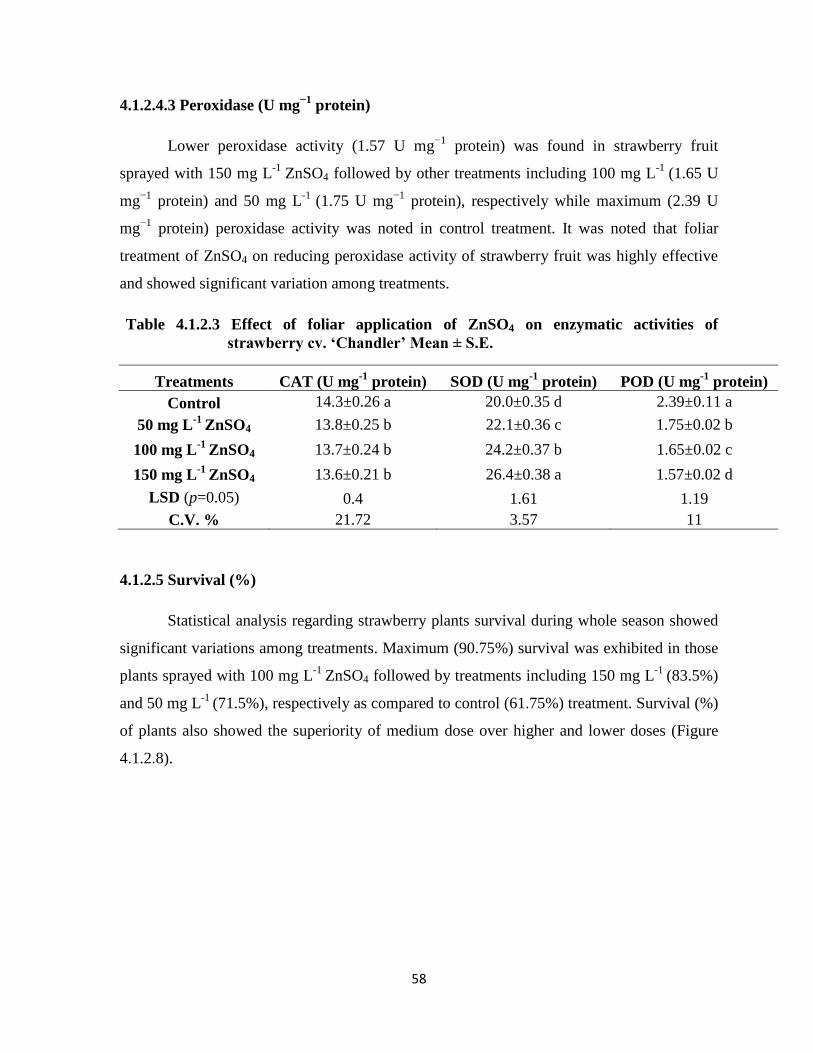
58
4.1.2.4.3 Peroxidase (U mg−1
protein)
Lower peroxidase activity (1.57 U mg−1
protein) was found in strawberry fruit
sprayed with 150 mg L-1
ZnSO4 followed by other treatments including 100 mg L-1
(1.65 U
mg−1
protein) and 50 mg L-1
(1.75 U mg−1
protein), respectively while maximum (2.39 U
mg−1
protein) peroxidase activity was noted in control treatment. It was noted that foliar
treatment of ZnSO4 on reducing peroxidase activity of strawberry fruit was highly effective
and showed significant variation among treatments.
Table 4.1.2.3 Effect of foliar application of ZnSO4 on enzymatic activities of
strawberry cv. ‘Chandler’ Mean ± S.E.
Treatments CAT (U mg-1
protein) SOD (U mg-1
protein) POD (U mg-1
protein)
Control 14.3±0.26 a 20.0±0.35 d 2.39±0.11 a
50 mg L-1
ZnSO4 13.8±0.25 b 22.1±0.36 c 1.75±0.02 b
100 mg L-1
ZnSO4 13.7±0.24 b 24.2±0.37 b 1.65±0.02 c
150 mg L-1
ZnSO4 13.6±0.21 b 26.4±0.38 a 1.57±0.02 d
LSD (p=0.05) 0.4 1.61 1.19
C.V. % 21.72 3.57 11
4.1.2.5 Survival (%)
Statistical analysis regarding strawberry plants survival during whole season showed
significant variations among treatments. Maximum (90.75%) survival was exhibited in those
plants sprayed with 100 mg L-1
ZnSO4 followed by treatments including 150 mg L-1
(83.5%)
and 50 mg L-1
(71.5%), respectively as compared to control (61.75%) treatment. Survival (%)
of plants also showed the superiority of medium dose over higher and lower doses (Figure
4.1.2.8).
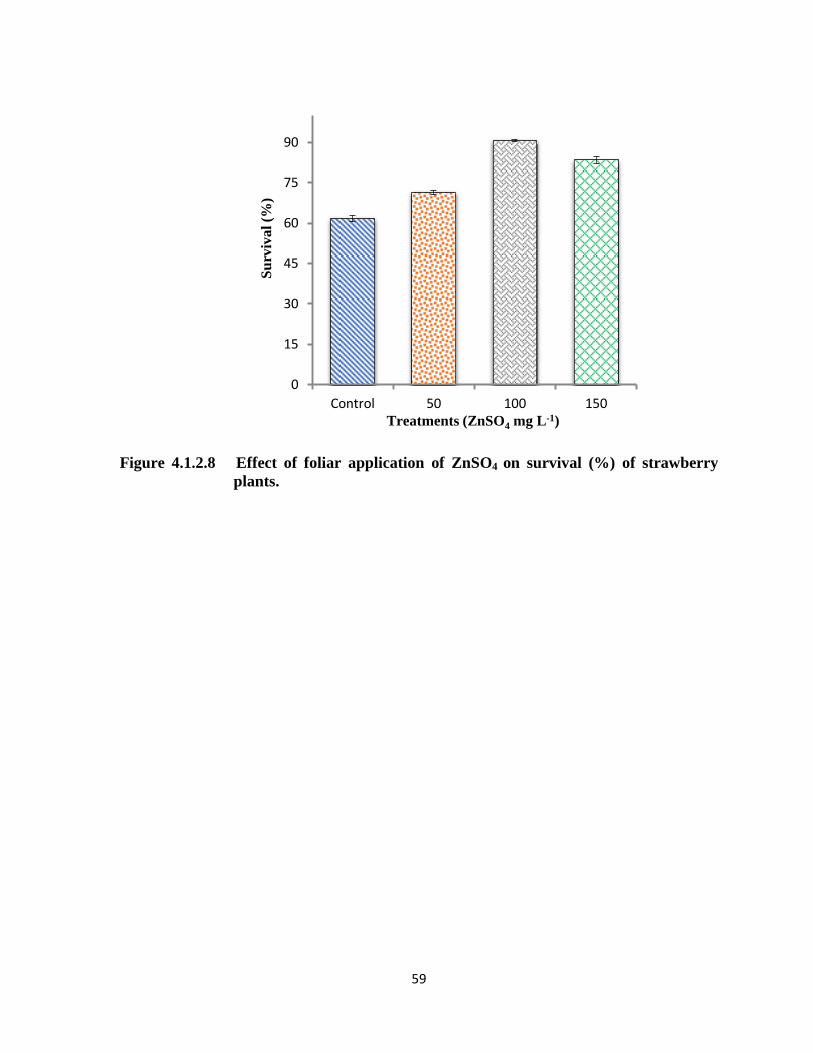
59
Figure 4.1.2.8 Effect of foliar application of ZnSO4 on survival (%) of strawberry
plants.
0
15
30
45
60
75
90
Control 50 100 150
Su
rviv
al
(%)
Treatments (ZnSO4 mg L-1)
60
4.1.2 Discussion
Foliar application of micro nutrients at proper and regular intervals plays major role
in increasing fruit set and productivity of strawberry plants (Abdollahi et al., 2010b). Zinc is
metal compound associated with many enzymes and proteins which played functional role
for improving normal plant growth and developmental processes (Nasiri et al., 2010).
Through foliar spray nutrients absorbed very quickly and perform different functions and
also helpful for correction of nutrient deficiencies to restore disrupted supply of
micronutrients (Alshaal and Ramady, 2017). Zinc played important role for reducing
different physiological disorders in fruit trees (Meena et al., 2014).
In current study, vegetative growth was enhanced with foliar spray of zinc sulfate.
Maximum leaves (18.25 plant-1
) and leaf area (52.0 cm2) were noted with 100 mg L
-1 ZnSO4.
Flower anthesis was also affected with higher concentration of ZnSO4. Maximum number of
crowns (7.0 plant-1
) was also noticed with 100 mg L-1
ZnSO4. In current study vegetative
parameters were found improving and flowering initiation was earlier in ZnSO4 sprayed
plants compared to control plants. This trend showed the superiority over control plants. It is
because of when ZnSO4 applied as foliar spray, it quickly penetrates into plant through
cuticle and epidermal walls (Meena et al., 2014). It is also reported that adsorption occurs on
the surface of plasmalemma, which is layer of protection. Nutrients enter through
plasmalemma into the cytoplasm and acted as growth promoter (Swietlik and Faust., 1984).
Zinc is necessary for increasing the level of tryptophan enzyme which further increased the
level of indole acetic acid hormone in plants and acted as growth promoter (Nasiri et al.,
2010). Therefore, maximum leaf growth, leaf area and flower initiation was earlier in treated
plants. It is proved that ZnSO4 improved the vegetative parameters but for this purpose the
optimum dose of ZnSO4 (100 mg L-1
) is important. Lower doses did not show maximum
influence but when these increased above optimum level again started to lose its influence
and parameters showed declining trend. In some previous studies it was estimated that foliar
spray of ZnSO4 maximized the growth of strawberry cultivar „Camarosa‟. Leaf area and
number of flowers increased with 100 mg L-1
ZnSO4 (Lolaei et al., 2012). In literature it was
recorded that foliar application of ZnSO4 showed positive effects regarding vegetative growth
of strawberry cultivar „Selva‟. Number of leaves and runner growth increased with zinc
61
application but fresh shoot/root ratio decreased (Abdollahi et al., 2010a). These results
confirm our findings that ZnSO4 improved the vegetative growth of strawberry during
season.
During season maximum marketable yield (369 g plant-1
) increased with foliar spray
of 100 mg L-1
ZnSO4. Minimum marketable yield was found in control plants. The response
of ZnSO4 for increasing marketable yield was highly effective throughout season but at very
higher and lower concentrations response was less effective than 100 mg L-1
ZnSO4.
Unmarketable yield was maximum in control plants as compared to treated plants. Minimum
small size strawberries (41.75 g plant-1
) were observed with 100 mg L-1
ZnSO4 as compared
to other treatments while maximum small sized strawberries (84 g plant-1
) were noted in
control plants. Marketable yield maximized due to foliar spray of ZnSO4, it is because of zinc
activated plant enzymes which played functional role in carbohydrate metabolism, synthesis
of protein structures and regulation process of auxin hormone (Abdollahi et al., 2010b). Zinc
is essential for rigidity of plant cellular membranes which protect the internal orientation of
macromolecules and increased the process of ion transport system in plant. Through foliar
spray zinc interacted with plant cell membrane phospholipids and sulphydryl groups which
played important role in maintenance of cellular structure (Hafeez et al., 2013). Kazemi
(2015) also indicated that ZnSO4 increased the yield of strawberry and also improved the
physical appearance of fruits. In Previous studies best results were obtained with higher dose
of ZnSO4. According to our findings the best results were obtained with medium dose of
ZnSO4 it could be due to climatic, soil and varietal response but the mechanism to improve
the yield and quality was confirmed.
Maximum amount of TSS (8.1 ºBrix) was found with 100 mg L-1
ZnSO4.
Quantitatively acidity was found maximum in control treatment as compared with ZnSO4
treatments but statistically no difference between different treatments means. But increasing
trend regarding TSS in treated plants confirmed the findings of Abedy (2001) who reported
that zinc has functional role in increasing photosynthetic activity and related enzymes,
convert starch into sugar which resulted in increasing sugar and decreasing acidity.
Maximum TSS: Acid ratio was also observed with 100 mg L-1
ZnSO4 as compared with other
treatments. Various researches have examined changes in enzymes during fruit development
62
under field conditions. Sucrose a major carbohydrate in many plants played important role in
metabolic process. During ripening enzymes including sucrose synthase and sucrose
invertase catalyze the conversion of sucrose to fructose and glucose in different fruits
(Archbold and Nosarszewski, 2004; Koch, 2004). As general foliar application of zinc
increased the reducing sugar concentration; it could be due to increasing sorbitol
dehydrogenase activity, sucrose synthase and acid invertase activity at the early fruit stage
(Zhang et al., 2014). So, foliar applied Zn increased the activity of carbohydrate metabolism
due to that TSS and sugar contents increased. In present study, maximum vitamin C contents
(53.30 mg 100 g-1
) were observed with 100 mg L-1
ZnSO4 as compared with other treatments,
it is because of foliar spray of zinc reduced the degradation process of vitamin C contents.
Abdollahi et al. (2010a) also noted strong relation between vitamin C and ZnSO4 foliar
application. Previous findings confirm our results that ZnSO4 enhanced the vitamin C
contents.
Our results showed that maximum TPC (177.5 mg GAE 100 g-1
) and TA activities
(74.3 % DPPH) were observed in those strawberry fruits where plants sprayed with 100 mg
L-1
ZnSO4. Foliar applied zinc increase the phenylalanine ammonia lyase activity, due to that
enzymatic activity TPC and TA activities become increase in fruits (Roussos and Tassis,
2011). Our results suggested that higher catalase and peroxidase activities were noted in
control treatment as compared with ZnSO4 treatments. Higher catalase activity leading
towards senescence activity and higher peroxidase activity caused off flavor. High value of
SOD activity was noted in strawberry fruits where plants were sprayed with 150 mg L-1
ZnSO4 while less activity was observed in control treatment. In some previous studies it was
exhibited that reactive oxygen species (ROS) produced during biochemical changes in
strawberry such as hydrogen peroxide and hydroxyl radical which cause oxidative damage
(Jimenez et al. 2003). These (ROS) species caused early fruit ripening and led to senescence.
Activities of various antioxidant enzymes produced during different growth stages of
strawberry fruit and increase the defense response against these ROS species (Anand et al.,
2009). Zinc played major role in defense mechanism of plant by increasing the regulation
process of those genes which required for creating resistance against environmental stresses
in plants (Marschner, 1995; Cakmak, 2000). During whole strawberry season maximum
survival (%) was found with 100 mg L-1
ZnSO4. In control treatment some deficiency
63
symptoms were observed during growth stages including chlorotic leaves and stunted
growth. In literature, it was noted that due to zinc deficiency stunted growth, smaller and
thinner internodes were observed in field grown tomatoes (Passam et al., 2007). Low level of
zinc in soil due to complex soil structure and competition with other micronutrients
(Srivastava and Singh, 2003). Soil applied Zn showed less efficiency for increasing plant
growth due to roots cannot uptake maximum nutrients and other major reasons including low
Zn mobility in soil and immobile in the phloem (Swietlik, 2002). From results, it was
observed that foliar application showed better and rapid response thus, foliar spray of Zn is
needed to overcome the Zn deficiency, to improve plant growth, yield and qualitative
characteristics of strawberry fruit.
4.1.2 Conclusion
Zinc is a component of many enzymes improves vegetative growth of strawberry
plants during season. Medium dose of ZnSO4 (100 mg L-1
) was found best for enhancing the
vegetative growth during whole growing season but flower initiation was earlier with higher
dose of ZnSO4 (150 mg L-1
). Maximum marketable yield (369 g plant-1
) and fruit quality was
improved with 100 mg L-1
ZnSO4. However, higher dose of ZnSO4 (150 mg L-1
) was found
better for increasing the activities of antioxidant enzymes in strawberry fruit during growth
stages. Sometimes, higher concentration of ZnSO4 did not show better response due to metal
toxicity.
64
4.2 Study-2
4.2.1 Experiment No. 1:
Foliar application of salicylic acid (SA) to improve the vegetative growth,
yield and quality of strawberry cv. ‘Chandler’.
In this experiment salicylic acid (SA) as foliar spray was applied after 2nd
week of
runner transplantation when old leaves were dried and new sprouting occurred. When
strawberry plants were at 3-4 leaves stage 1st foliar application was applied and 2
nd was
applied at fruit setting stage. Treated strawberry plants were compared with control plants.
Canopy growth, yield and fruit quality was observed during growing season.
4.2.1 Results
4.2.1.1 Vegetative parameters (Table 4.2.1.1)
4.2.1.1.1 Number of leaves (plant-1
)
Maximum leaves (19.25 plant-1
) were observed in strawberry plants those sprayed
with 9 mM SA followed by treatments including 6 mM and 3 mM where numbers of leaves
were 12.75 and 9.75 plant-1
, respectively. While less leaves (6.25 plant-1
) were observed in
control plants. Salicylic acid treatments were highly responsive for increasing the number of
leaves during whole growing season as compared with control plants.
4.2.1.1.2 Leaf area (cm2)
Statistical analysis regarding strawberry leaf area affected by foliar spray of SA
showed significant increased results. Higher value of leaf area (51.0 cm2) was observed in
plants sprayed with higher dose of SA (9 mM) followed by the plants sprayed with 6 mM
and 3 mM which showed leaf area values 43.75 and 30.75 cm2, respectively and these two
treatments were statistically same. Minimum value regarding leaf area (27.0 cm2) was
exhibited from control treatment. It was suggested that SA treatments showed their
superiority for enhancing leaf area of strawberry plants when sprayed during growth stages.
65
4.2.1.1.3 Flower anthesis (days after foliar application)
Minimum numbers of days (20.0) were required for flower initiation when strawberry
plants were sprayed with 9 mM SA followed by the plants sprayed with 6 mM (25.50) and 3
mM (24.0), respectively and these two treatments were statistically same. Maximum numbers
of days (41.75) for flower anthesis were required in control plants. It was exhibited that
effect of foliar application of SA to produce early flowering was more significant.
4.2.1.1.4 Number of crowns (plant-1
)
Statistical results regarding crown growth of strawberry plants affected by foliar
application of SA showed significant increased trend. Crown growth was noted at the end of
strawberry season and maximum numbers of crowns (7.50 plant-1
) were noted in strawberry
plants those were sprayed with 9 mM SA followed by treatments including 6 mM and 3 mM
which showed numbers of crowns 5.50 and 4.25 plant-1
, respectively while less number of
crowns (2.75 plant-1
) was observed in the control plants. It was concluded that numbers of
crowns increased in the strawberry plants due to foliar spray of SA as compared to control
treatment.
4.2.1.1.5 Number of runners (plant-1
)
Maximum runners (6.75 plant-1
) were found in strawberry plants those were sprayed
with 9 mM SA followed by plants sprayed with 6 mM and 3 mM where numbers of runners
were 4.50 and 3.25 plant-1
, respectively. During strawberry season minimum numbers of
runners (2.0 plant-1
) were estimated in control plants. It was exhibited that spray of SA for
increasing the runner growth was highly significant during growing season.
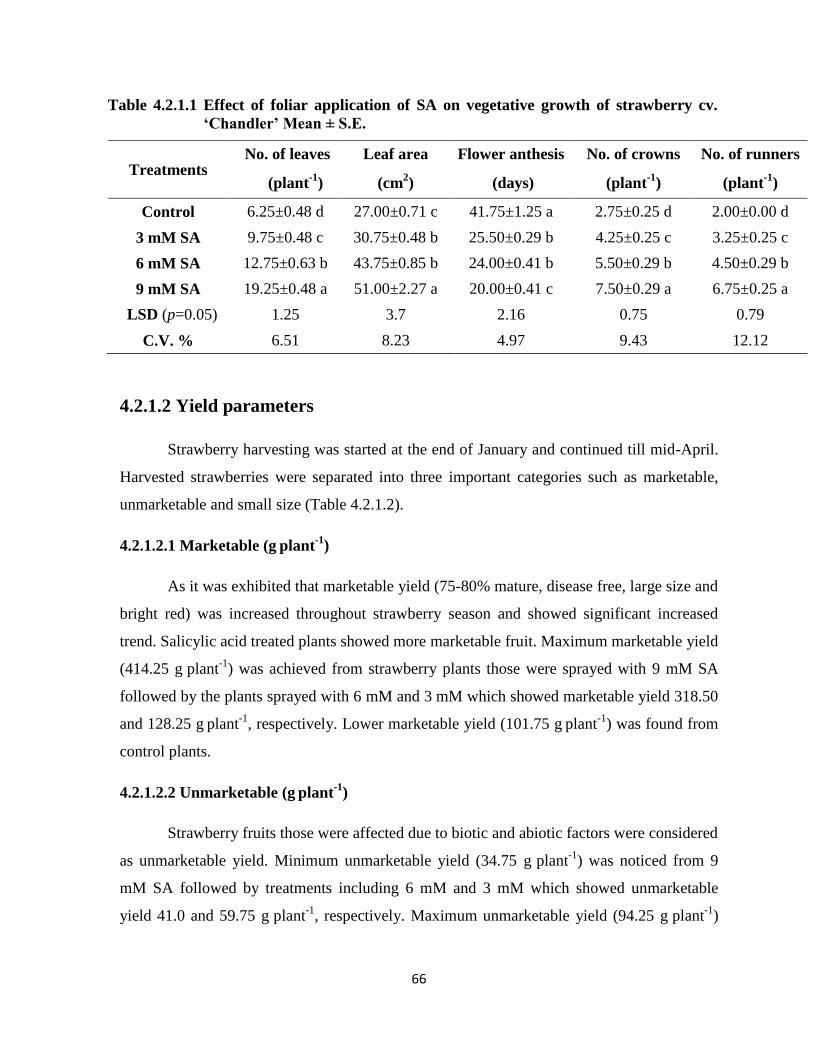
66
Table 4.2.1.1 Effect of foliar application of SA on vegetative growth of strawberry cv.
‘Chandler’ Mean ± S.E.
Treatments No. of leaves Leaf area Flower anthesis No. of crowns No. of runners
(plant-1
) (cm2) (days) (plant
-1) (plant
-1)
Control 6.25±0.48 d 27.00±0.71 c 41.75±1.25 a 2.75±0.25 d 2.00±0.00 d
3 mM SA 9.75±0.48 c 30.75±0.48 b 25.50±0.29 b 4.25±0.25 c 3.25±0.25 c
6 mM SA 12.75±0.63 b 43.75±0.85 b 24.00±0.41 b 5.50±0.29 b 4.50±0.29 b
9 mM SA 19.25±0.48 a 51.00±2.27 a 20.00±0.41 c 7.50±0.29 a 6.75±0.25 a
LSD (p=0.05) 1.25 3.7 2.16 0.75 0.79
C.V. % 6.51 8.23 4.97 9.43 12.12
4.2.1.2 Yield parameters
Strawberry harvesting was started at the end of January and continued till mid-April.
Harvested strawberries were separated into three important categories such as marketable,
unmarketable and small size (Table 4.2.1.2).
4.2.1.2.1 Marketable (g plant
-1)
As it was exhibited that marketable yield (75-80% mature, disease free, large size and
bright red) was increased throughout strawberry season and showed significant increased
trend. Salicylic acid treated plants showed more marketable fruit. Maximum marketable yield
(414.25 g plant
-1) was achieved from strawberry plants those were sprayed with 9 mM SA
followed by the plants sprayed with 6 mM and 3 mM which showed marketable yield 318.50
and 128.25 g plant
-1, respectively. Lower marketable yield (101.75 g
plant
-1) was found from
control plants.
4.2.1.2.2 Unmarketable (g plant
-1)
Strawberry fruits those were affected due to biotic and abiotic factors were considered
as unmarketable yield. Minimum unmarketable yield (34.75 g plant
-1) was noticed from 9
mM SA followed by treatments including 6 mM and 3 mM which showed unmarketable
yield 41.0 and 59.75 g plant
-1, respectively. Maximum unmarketable yield (94.25 g
plant
-1)
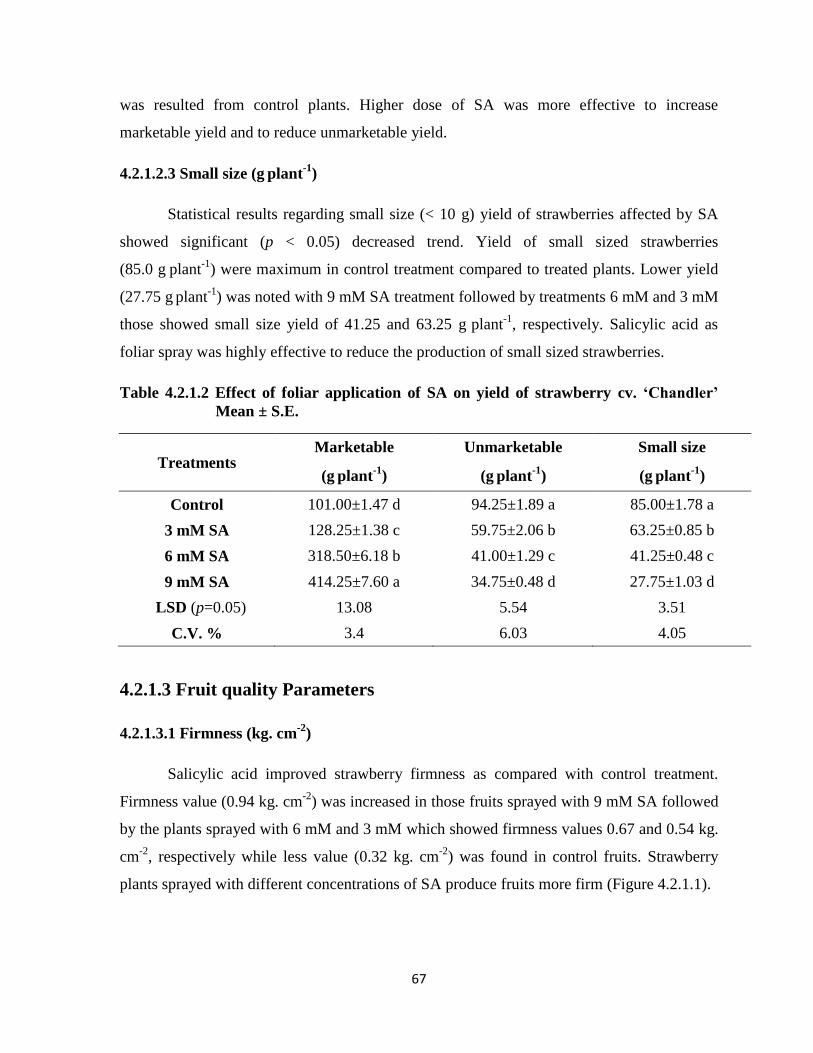
67
was resulted from control plants. Higher dose of SA was more effective to increase
marketable yield and to reduce unmarketable yield.
4.2.1.2.3 Small size (g plant
-1)
Statistical results regarding small size (< 10 g) yield of strawberries affected by SA
showed significant (p < 0.05) decreased trend. Yield of small sized strawberries
(85.0 g plant
-1) were maximum in control treatment compared to treated plants. Lower yield
(27.75 g plant
-1) was noted with 9 mM SA treatment followed by treatments 6 mM and 3 mM
those showed small size yield of 41.25 and 63.25 g plant
-1, respectively. Salicylic acid as
foliar spray was highly effective to reduce the production of small sized strawberries.
Table 4.2.1.2 Effect of foliar application of SA on yield of strawberry cv. ‘Chandler’
Mean ± S.E.
Treatments Marketable Unmarketable Small size
(g plant
-1) (g
plant
-1) (g
plant
-1)
Control 101.00±1.47 d 94.25±1.89 a 85.00±1.78 a
3 mM SA 128.25±1.38 c 59.75±2.06 b 63.25±0.85 b
6 mM SA 318.50±6.18 b 41.00±1.29 c 41.25±0.48 c
9 mM SA 414.25±7.60 a 34.75±0.48 d 27.75±1.03 d
LSD (p=0.05) 13.08 5.54 3.51
C.V. % 3.4 6.03 4.05
4.2.1.3 Fruit quality Parameters
4.2.1.3.1 Firmness (kg. cm-2
)
Salicylic acid improved strawberry firmness as compared with control treatment.
Firmness value (0.94 kg. cm-2
) was increased in those fruits sprayed with 9 mM SA followed
by the plants sprayed with 6 mM and 3 mM which showed firmness values 0.67 and 0.54 kg.
cm-2
, respectively while less value (0.32 kg. cm-2
) was found in control fruits. Strawberry
plants sprayed with different concentrations of SA produce fruits more firm (Figure 4.2.1.1).
68
4.2.1.3.2 TSS (ºBrix)
Total soluble solids increased in strawberries (8.47 ºBrix) sprayed with 6 mM SA
followed by 9 mM (7.77 ºBrix) and 3 mM (7.0 ºBrix), respectively while minimum TSS
values (6.3 ºBrix) were observed in control treatment. It was concluded that medium
concentration of SA 6 mM was found best for increasing the TSS in strawberry fruits (Figure
4.2.1.2).
4.2.1.3.3 Titratable acidity (%)
Statistical results were non-significant. Quantitatively acid contents were more in
control treatment as compared to SA treatments but statistically no difference was noted
between treatments means (Figure 4.2.1.3).
4.2.1.3.4 TSS: TA ratio
Statistical data regarding strawberry fruit TSS: TA ratio affected by foliar spray of
SA showed significant increased results. Maximum TSS: TA ratio (11.76) was noted in
strawberries where plants sprayed with 6 mM SA followed by the treatments 9 mM (10.87)
and 3 mM (9.84), respectively. TSS: TA ratio is an important fruit quality parameter which
indicates fruit ripening stage. Minimum ratio was found in control (8.9) treatment. Medium
concentration of SA was found better for increasing TSS: TA ratio in strawberry fruits
(Figure 4.2.1.4).
4.2.1.3.5 Vitamin C (mg 100 g-1
)
Maximum value (56.72 mg 100 g-1
) was found in strawberry fruits sprayed with 9
mM SA followed by treatments 6 mM (48.76 mg 100 g-1
) and 3 mM (41.20 mg 100 g-1
),
respectively while lower vitamin C contents (36.86 mg 100 g-1
) were observed in control
treatment. Our results suggested that foliar spray of SA on strawberry plants was highly
significant for increasing the vitamin C contents of strawberry fruits during growing season
(Figure 4.2.1.5).
69
4.2.1.3.6 Total phenolic contents (mg GAE 100 g-1
)
Plants treated with SA 9 mM, 6 mM and 3 mM produced the strawberries with
total phenolic contents of 191.50, 169.50 and 152.50 mg GAE 100 g-1
, respectively while
lower phenolic contents were observed in control (148.5 mg GAE 100 g-1
) fruits. Higher dose
of SA was best for increasing the total phenolic contents of strawberry. It can be concluded
that SA 9 mM foliar spray was found best to increase the total phenolic contents in
strawberry fruit as compared with other treatments (Figure 4.2.1.6).
4.2.1.3.7 Total antioxidants (% DPPH)
Higher antioxidant activities (71.25% DPPH) were noted in strawberry fruits where
plants were sprayed with 9 mM SA followed by treatments 6 mM (55.75% DPPH) and 3 mM
(47.5% DPPH), respectively and also showed significant increased trend. Salicylic acid
treatments were highly responsive for increasing the antioxidant activities in strawberry fruits
during growing season while minimum activities were observed in control (40.75% DPPH)
treatment (Figure 4.2.1.7).
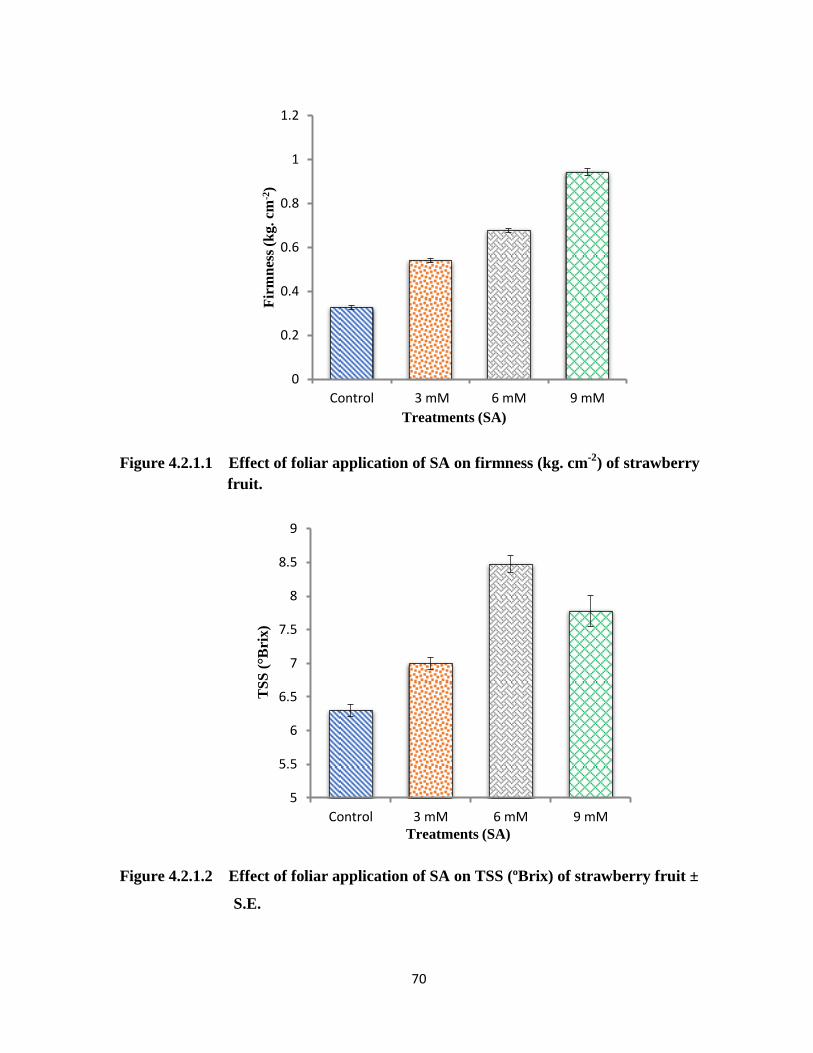
70
Figure 4.2.1.1 Effect of foliar application of SA on firmness (kg. cm-2
) of strawberry
fruit.
Figure 4.2.1.2 Effect of foliar application of SA on TSS (ºBrix) of strawberry fruit ±
S.E.
0
0.2
0.4
0.6
0.8
1
1.2
Control 3 mM 6 mM 9 mM
Fir
mn
ess
(kg
. cm
-2)
Treatments (SA)
5
5.5
6
6.5
7
7.5
8
8.5
9
Control 3 mM 6 mM 9 mM
TS
S (
°Bri
x)
Treatments (SA)
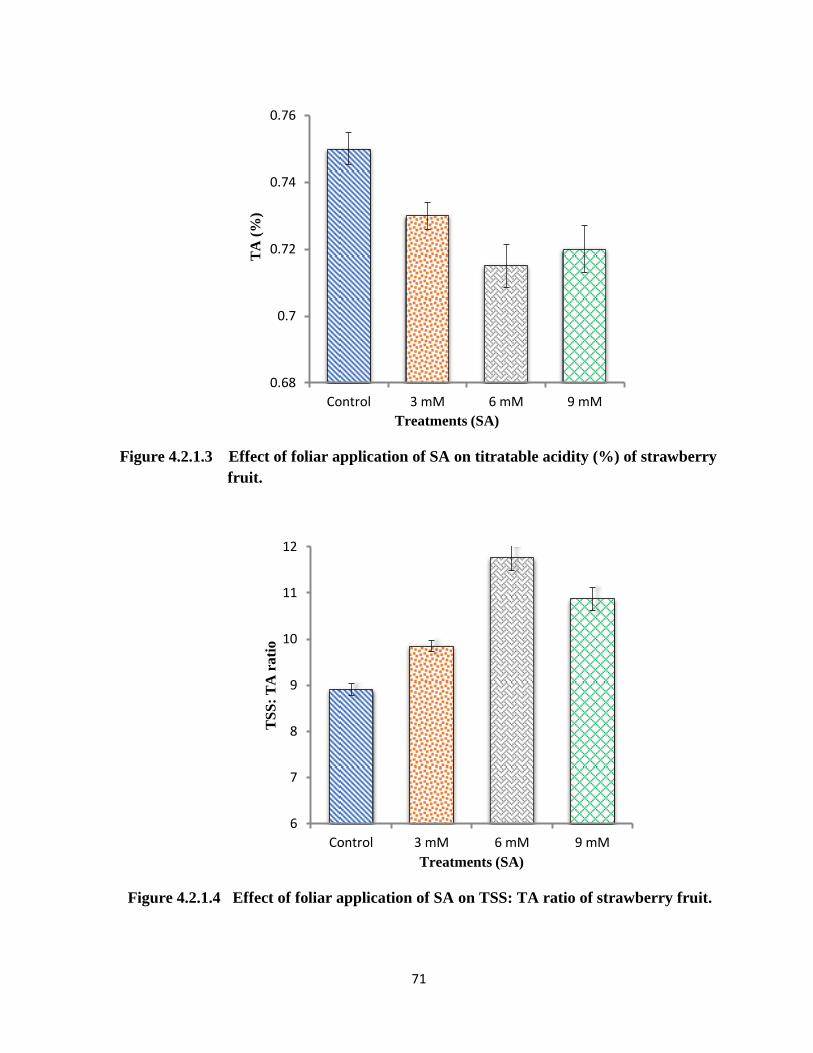
71
Figure 4.2.1.3 Effect of foliar application of SA on titratable acidity (%) of strawberry
fruit.
Figure 4.2.1.4 Effect of foliar application of SA on TSS: TA ratio of strawberry fruit.
0.68
0.7
0.72
0.74
0.76
Control 3 mM 6 mM 9 mM
TA
(%
)
Treatments (SA)
6
7
8
9
10
11
12
Control 3 mM 6 mM 9 mM
TS
S:
TA
ra
tio
Treatments (SA)
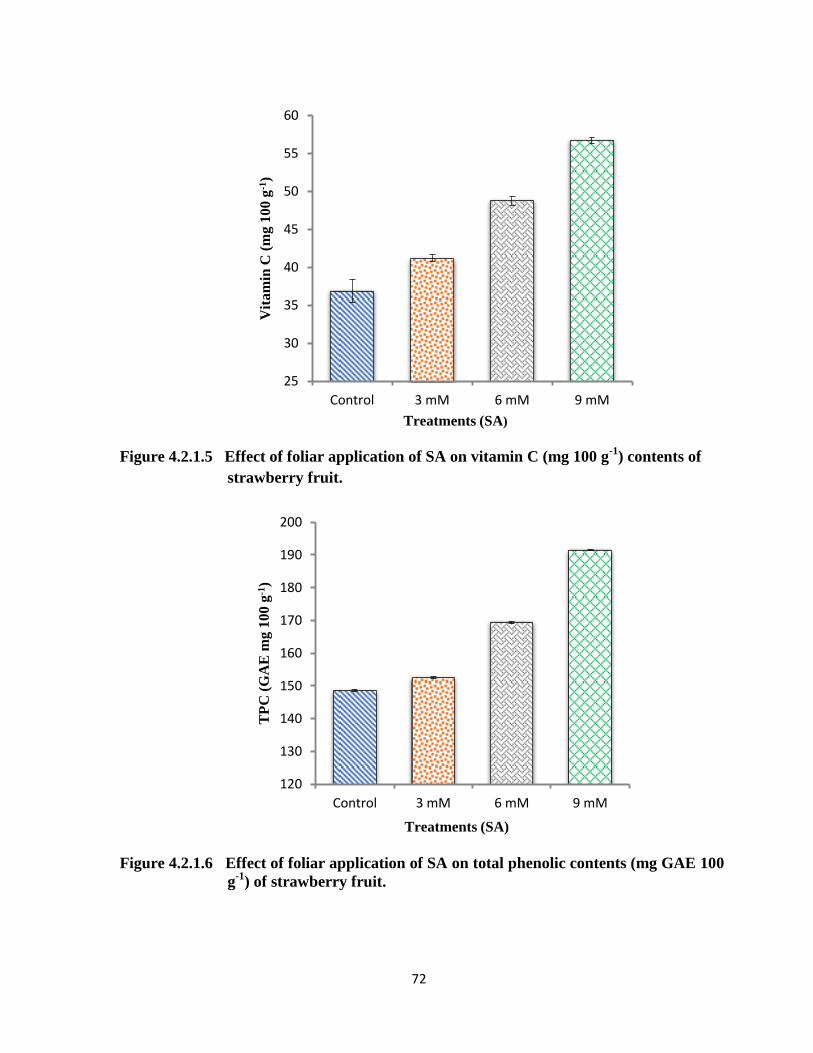
72
Figure 4.2.1.5 Effect of foliar application of SA on vitamin C (mg 100 g-1
) contents of
strawberry fruit.
Figure 4.2.1.6 Effect of foliar application of SA on total phenolic contents (mg GAE 100
g-1
) of strawberry fruit.
25
30
35
40
45
50
55
60
Control 3 mM 6 mM 9 mM
Vit
am
in C
(m
g 1
00
g-1
)
Treatments (SA)
120
130
140
150
160
170
180
190
200
Control 3 mM 6 mM 9 mM
TP
C (
GA
E m
g 1
00 g
-1)
Treatments (SA)
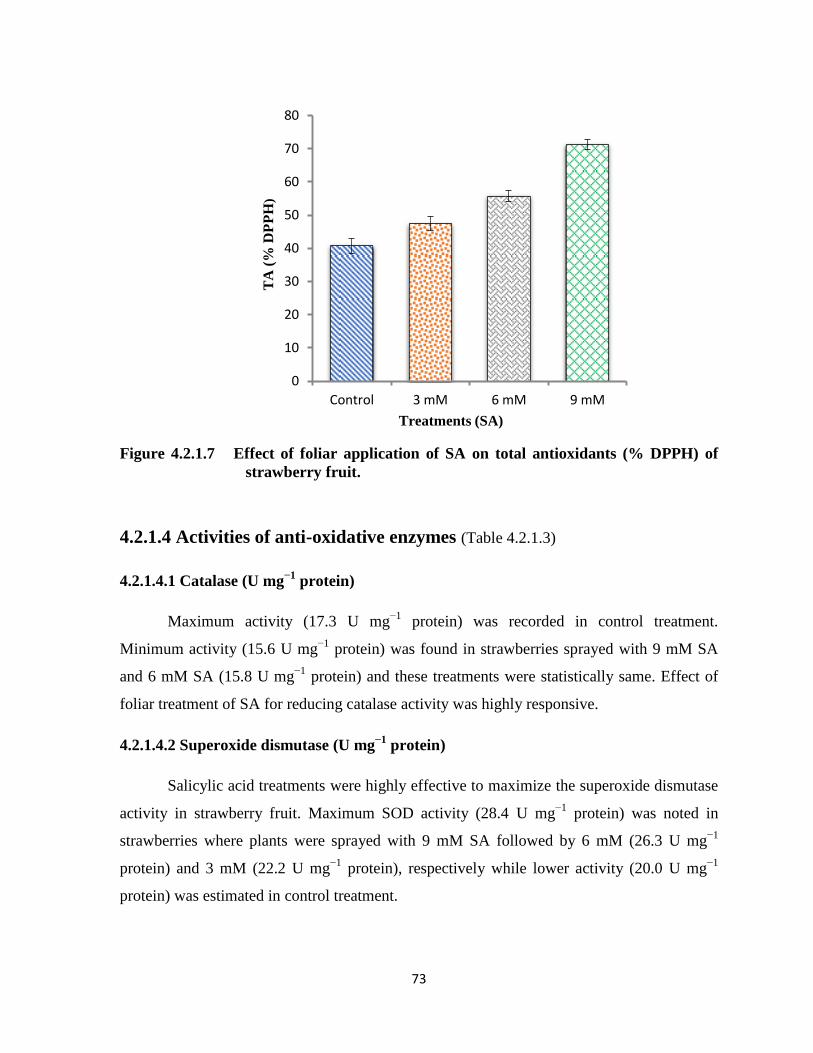
73
Figure 4.2.1.7 Effect of foliar application of SA on total antioxidants (% DPPH) of
strawberry fruit.
4.2.1.4 Activities of anti-oxidative enzymes (Table 4.2.1.3)
4.2.1.4.1 Catalase (U mg−1
protein)
Maximum activity (17.3 U mg−1
protein) was recorded in control treatment.
Minimum activity (15.6 U mg−1
protein) was found in strawberries sprayed with 9 mM SA
and 6 mM SA (15.8 U mg−1
protein) and these treatments were statistically same. Effect of
foliar treatment of SA for reducing catalase activity was highly responsive.
4.2.1.4.2 Superoxide dismutase (U mg−1
protein)
Salicylic acid treatments were highly effective to maximize the superoxide dismutase
activity in strawberry fruit. Maximum SOD activity (28.4 U mg−1
protein) was noted in
strawberries where plants were sprayed with 9 mM SA followed by 6 mM (26.3 U mg−1
protein) and 3 mM (22.2 U mg−1
protein), respectively while lower activity (20.0 U mg−1
protein) was estimated in control treatment.
0
10
20
30
40
50
60
70
80
Control 3 mM 6 mM 9 mM
TA
(%
DP
PH
)
Treatments (SA)
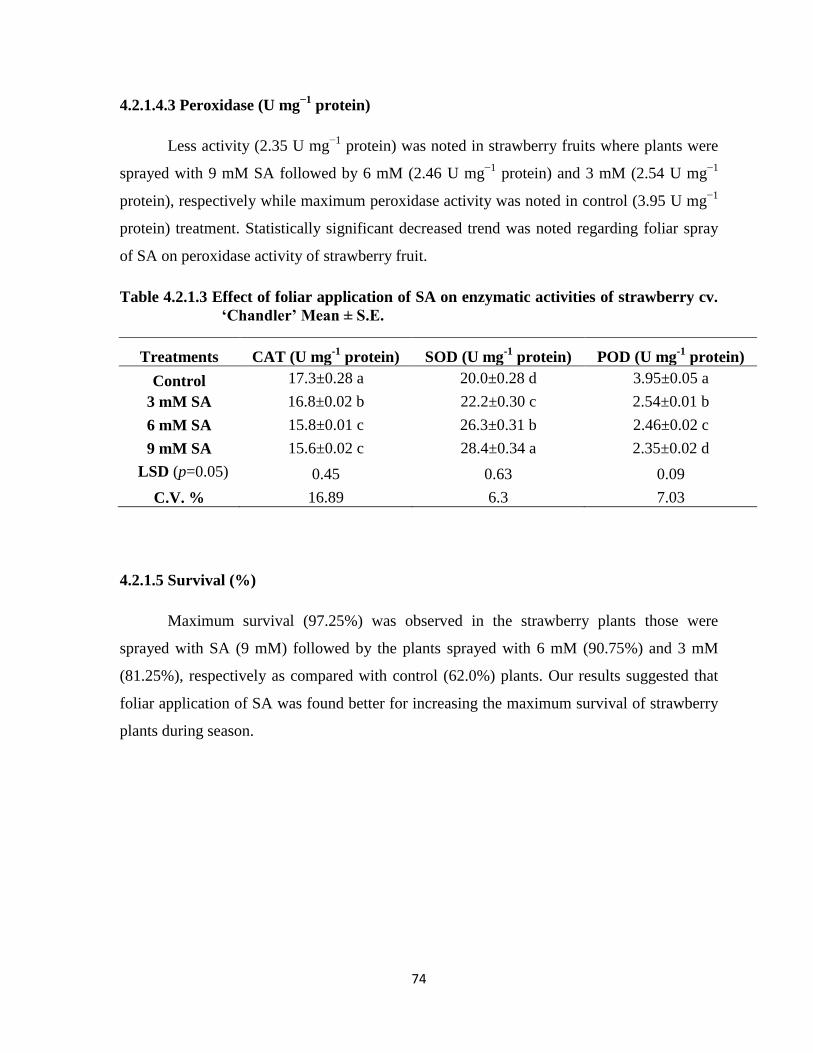
74
4.2.1.4.3 Peroxidase (U mg−1
protein)
Less activity (2.35 U mg−1
protein) was noted in strawberry fruits where plants were
sprayed with 9 mM SA followed by 6 mM (2.46 U mg−1
protein) and 3 mM (2.54 U mg−1
protein), respectively while maximum peroxidase activity was noted in control (3.95 U mg−1
protein) treatment. Statistically significant decreased trend was noted regarding foliar spray
of SA on peroxidase activity of strawberry fruit.
Table 4.2.1.3 Effect of foliar application of SA on enzymatic activities of strawberry cv.
‘Chandler’ Mean ± S.E.
Treatments CAT (U mg-1
protein) SOD (U mg-1
protein) POD (U mg-1
protein)
Control 17.3±0.28 a 20.0±0.28 d 3.95±0.05 a
3 mM SA 16.8±0.02 b 22.2±0.30 c 2.54±0.01 b
6 mM SA 15.8±0.01 c 26.3±0.31 b 2.46±0.02 c
9 mM SA 15.6±0.02 c 28.4±0.34 a 2.35±0.02 d
LSD (p=0.05) 0.45 0.63 0.09
C.V. % 16.89 6.3 7.03
4.2.1.5 Survival (%)
Maximum survival (97.25%) was observed in the strawberry plants those were
sprayed with SA (9 mM) followed by the plants sprayed with 6 mM (90.75%) and 3 mM
(81.25%), respectively as compared with control (62.0%) plants. Our results suggested that
foliar application of SA was found better for increasing the maximum survival of strawberry
plants during season.
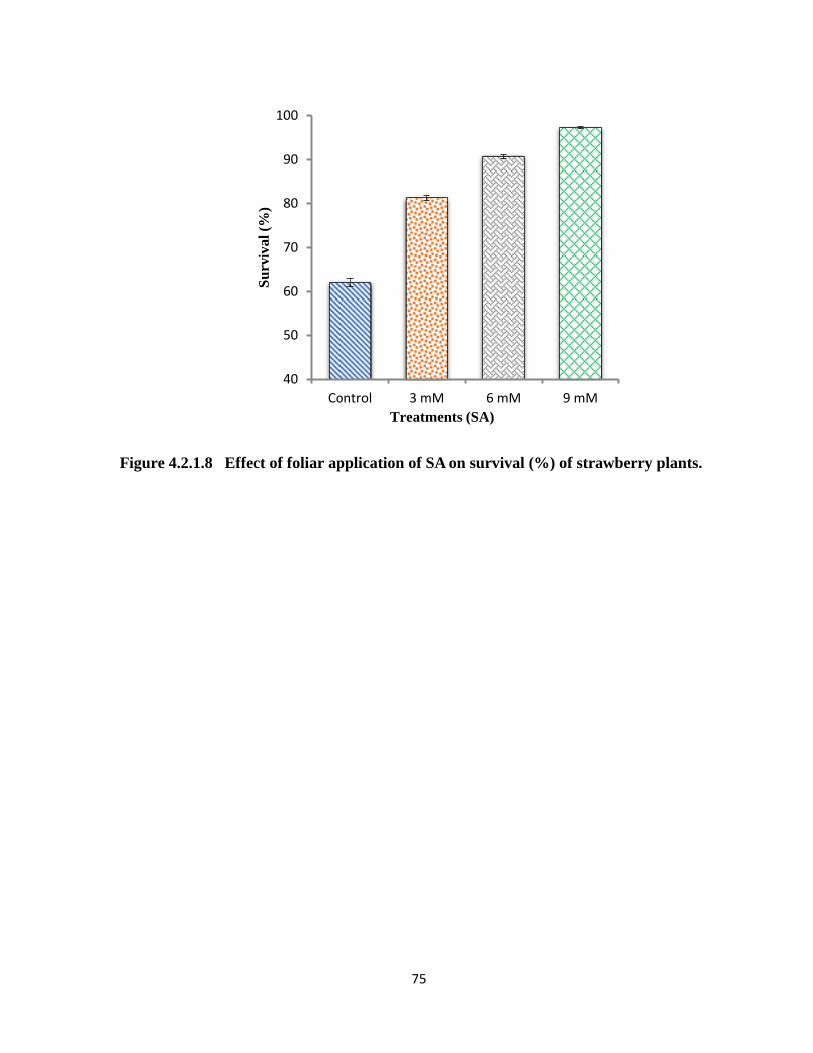
75
Figure 4.2.1.8 Effect of foliar application of SA on survival (%) of strawberry plants.
40
50
60
70
80
90
100
Control 3 mM 6 mM 9 mM
Su
rviv
al
(%)
Treatments (SA)
76
4.2.1 Discussion
Salicylic acid naturally occurs in plant body during developmental stages and acted as
signaling molecule and provides the resistance against oxidative damage. It performs various
functions including plant growth, ion uptake and transport, reduced transpiration rate and leaf
abscission (Ashraf et al., 2010). Foliar applied SA increased the endogenous level of SA
which activated pathogenesis related genes at the site of pathogen attack by creating
pathogenic resistance in different plants (Van Loon et al., 2006).
In current study plant growth was increased with SA spray. Salicylic acid spray of 9
mM was highly effective for increasing the vegetative growth. Maximum leaves growth
(19.25 plant-1
) and leaf area (51 cm2) was noted with higher dose of SA 9 mM. In some
previous studies it was proved that foliar spray of SA improved the growth and productivity
of strawberry plants. In this regard, Metwally et al. (2013) found that foliar treatment of SA
(1.0 and 2.0 mM) with different number of applications (once, twice and thrice) enhanced the
vegetative growth of strawberry cv. Sweet Charlie. Positive effect of SA for improving the
vegetative growth could be due to it increased the endogenous level of phytohormones
specially the growth promoters including auxins, gibberellins and cytokinins which played
important role for the enhancement of vegetative growth (Mady, 2014). Our findings
regarding flower anthesis showed that minimum number of days (20) were required for
flower anthesis when strawberry plants were sprayed with 9 mM SA as compared with
others. Our results regarding flower anthesis affected by foliar application of SA similar with
previous findings, who stated that SA acted as chelating agent and initiate the early flowering
(Oata, 1975; Pieterse and Muller, 1977). Our results suggest that crown and runner growth of
strawberry plants was also increased with SA. Higher amount of crowns (7.50 plant-1
) and
runners (6.75 plant-1
) increased with 9 mM SA foliar application. Overall, higher
concentration of SA 9 mM was found better for increasing the vegetative growth during
growing season. Our results regarding foliar application of SA enhanced vegetative growth
are in aid with previous studies where foliar applied SA 5.0 mM had positive and significant
effects on the vegetative parameters of strawberry cv. „Festival‟ (Youssef et al., 2017). It is
because of SA regulates the internal mechanism of plant such as plant growth, nutrient
uptake and transport system, plant water relations, membrane permeability, stomatal
77
conductance, photosynthesis and specially enhanced hormonal metabolism which promoted
cell division and enlargement (Hayat et al., 2010). So, due to increasing internal metabolic
process of plant canopy growth was increased.
Maximum marketable yield (414.25 g plant-1
) was exhibited from strawberry plants
which were sprayed with 9 mM SA. These results similar with previous study where foliar
spray of 5 mM SA improved the marketable yield of strawberry cv. „Festival‟ as compared to
water sprayed plants (Youssef et al., 2017). In some other studies it was also noted that foliar
treatment of SA at highest concentration resulted in higher early and total marketable yield of
strawberry. Maximum yield could be due to increase in vegetative growth which induced
more flowers and hence more fruits (Metwally et al., 2013; Kalaki et al., 2014). Our results
suggest that unmarketable yield (34.75 g plant-1
) was reduced with higher application of SA
as compared with other treatments. It might be due to SA activated defense mechanism of
plants against pathogen attack by creating systemic acquired resistance in whole plant body
for further spreading of disease (Tsuda et al., 2008). Small size yield was maximum (85.0 g
plant-1
) in control plants as compared to SA treated plants which effectively reduced the
small size yield during season.
Fruit firmness was improved in those strawberry fruits where plants were treated with
9 mM SA. Foliar application of SA produced more firm fruits as compared to control plants
which produced less firm fruits. It is because of during ripening, fruit softening occurs which
increased the cell wall degradation process by increasing enzymatic activity of
polygalactosidases and pectin methylesterases which leading towards senescence process
(Srivastava and Dwivedi, 2000). In current study, foliar applied 9 mM SA was found better
for improving the strawberry firmness. Our findings are in accordance with previous results
where SA decreased the metabolic activity of cell degrading enzymes and retained the
firmness of banana fruit (Srivastava and Dwivedi, 2000). In present study maximum total
soluble solids (8.47 °Brix) were increased with 6 mM SA as compared with higher or lower
concentrations of SA; it is because of higher concentration may have increased enzymatic
activity due to which some quality attributes showed declining trend. Increment in TSS
contents could be due to addition of sucrose in fruit during ripening process which increased
the activity of sucrose phosphate synthase and due to that enzymatic activity TSS contents
78
increased during ripening (Asghari and Aghdam, 2010). Salicylic acid acted as ethylene
inhibitor and reduces the maximum increment in activity of sucrose phosphate synthase
during ripening of banana and delayed the senescence process (Srivastava and Dwivedi,
2000; Hubbard et al., 1991; Asghari and Aghdam, 2010). Higher TSS: TA ratio (11.76) was
estimated with 6 mM SA while less ratio was found in control. TSS: TA ratio was maximum
in SA treated strawberries could be due to maximum TSS contents and lower acid contents
while in control fruits the ratio was minimum because of more acid and less TSS contents.
Maximum vitamin C contents were observed with higher application of SA 9 mM as
compared with other treatments. Salicylic acid application reduced the degradation of
vitamin C contents of strawberry fruit during ripening by delaying the senescence process
and improved fruit quality (Lolaei et al., 2012).
According to our results maximum TPC (191.50 mg GAE 100 g-1
) and TA activities
(71.25% DPPH) were noted in those strawberry fruits where plants sprayed with 9 mM SA.
Phenolic contents have capability for scavenging reactive oxygen species. It is because of
their contribution to qualitative characteristics of fruits, such as improving fruit color, texture
and reduction in bitterness (Hassanpour et al., 2011). Previous literature showed that SA
acted as potential molecule for activating the organic componds (phenylpropanoid-flavonoid)
synthesis in cherry fruit and enhanced the total phenolic contents (Dokhanieh et al., 2013).
Previous studies exhibited that when cherry fruit was treated with 1 mM SA total antioxidant
activities were found maximum (Hassanpour et al., 2011; Dokhanieh et al., 2013). Our
results demonstrated that enzymatic activities were highly influenced with foliar spray of SA.
Maximum catalase activity was estimated in control while minimum activity was found with
SA (9 mM). Superoxide dismutase activity was found higher with SA 9 mM as compared
with others. Maximum peroxidase activity was estimated in control fruits while SA
treatments were highly effective for reducing peroxidase activity in strawberry fruits during
growing season. In some previous findings it was proved that ROS produce during ripening
stages in the strawberry fruit such as superoxide radical which cause oxidative stress
(Jimenez et al. 2003). Enzymatic activities (CAT, POD and SOD) produce during different
growth stages and increase the defense responses (Anand et al., 2009). Due to decline in
enzymatic activities ROS produce during ripening. Numerous researchers have exhibited that
SA have inhibitory effects for reducing ROS species by enhancing the antioxidant power in
79
plants (Knorzer et al., 1999; Imran et al., 2007). Foliar treatment of SA at non-toxic level
increased the activities of those genes which have capability for producing proteins such as
chitinase which enhanced the defense mechanism of plants (Meena et al., 2001; Hussain et
al., 2015). Our results concluded that foliar treatment of 9 mM SA was highly effective for
increasing the maximum survival (97.25%) of strawberry plants during whole growing
season as compared to control plants.
4.2.1 Conclusion
Salicylic acid as signaling molecule enhanced the vegetative growth of strawberry
plants during whole growing season. Overall, it was suggested that foliar spray of 9 mM SA
was effective strategy for increasing the canopy growth, marketable yield, quality and
survival mechanism of strawberry plants during season.
80
4.2.2 Experiment No. 2:
Foliar application of gibberellic acid (GA3) to improve the vegetative
growth, yield and quality of strawberry cv. ‘Chandler’.
In this experiment foliar spray of GA3 with different concentrations was applied after
2nd
week of runner transplantation when old leaves were dried and new sprouting was
occurred. First foliar spray was applied at 3-4 leaves stage and 2nd
was applied at fruit setting
stage. Following parameters were measured:
4.2.2 Results
4.2.2.1 Vegetative parameters (Table 4.2.2.1)
4.2.2.1.1 Number of leaves (plant-1
)
Maximum leaves (23.50 plant-1
) were noted in strawberry plants which were sprayed
with 150 mg L-1
GA3 followed by other treatments including 100 and 50 mg L-1
GA3 which
showed numbers of leaves 20.50 and 11.50 plant-1
, respectively. Less leaves (7.0 plant-1
)
were noted in control plants. According to results 150 mg L-1
GA3 showed the superiority for
increasing the number of leaves during season.
4.2.2.1.2 Leaf area (cm2)
Increasing trend in leaf area was observed with foliar spray of GA3. Higher value of
leaf area (65.75 cm2) was observed in plants those were treated with 150 mg L
-1 GA3
followed by treatments including 100 and 50 mg L
-1 GA3 which showed leaf area values 58.0
and 21.75 cm2, respectively. Leaf area was less in control treatment. It was exhibited from
results that foliar spray of 150 mg L-1
GA3 was highly significant for maximizing the leaf
area.
81
4.2.2.1.3 Flower anthesis (days after foliar application)
Minimum numbers of days (20.50) were required to open 1st flower when strawberry
plants were sprayed with 150 mg L-1
GA3 followed by the plants sprayed with 100 mg L-1
(23.25) and 50 mg L-1
(27.0), respectively. Maximum numbers of days (41.75) to open
flowers were observed in control plants. It was concluded that GA3 reduced the number of
days to initiate the flowers but 150 mg L-1
GA3 was highly responsive to initiate the flowers
earlier.
4.2.2.1.4 Number of crowns (plant-1
)
Maximum crowns (8.0 plant-1
) were noted in strawberry plants those were sprayed
with 150 mg L-1
GA3 followed by treatments including 100 and 50 mg L-1
GA3 where the
numbers of crowns were 6.75 and 4.0 plant-1
, respectively. Higher dose of GA3 was found
more effective for increasing the number of crowns as compared with other treatments.
Minimum crowns (2.75 plant-1
) were noted in control plants. It was clear from results that
foliar spray of GA3 increased the crown growth during season.
4.2.2.1.5 Number of runners (plant-1
)
Maximum runners (11.0 plant-1
) were found in plants those were treated with 150 mg
L-1
GA3 followed by treatments including 100 and 50 mg L-1
GA3 where the numbers of
runners were 8.50 and 3.75 plant-1
, respectively. During strawberry season minimum
numbers of runners (2.25 plant-1
) were noted in control plants. It was clear that higher dose of
GA3 played significant role for increasing the number of runners per plant.
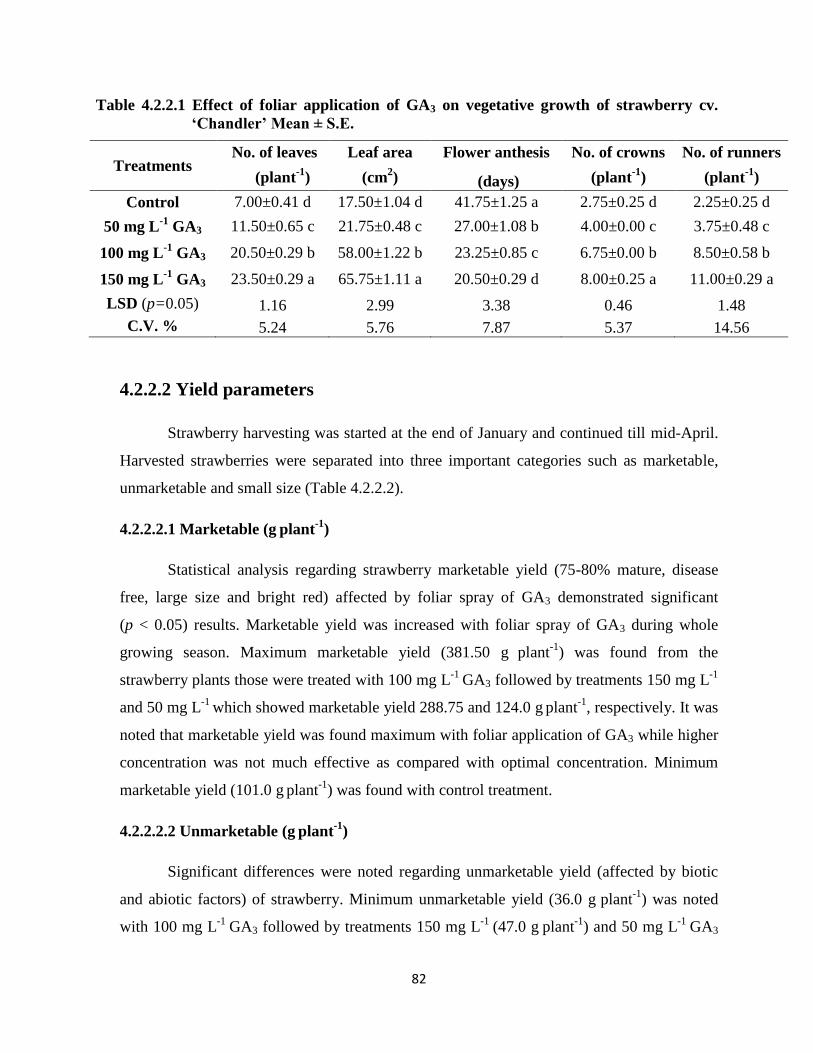
82
Table 4.2.2.1 Effect of foliar application of GA3 on vegetative growth of strawberry cv.
‘Chandler’ Mean ± S.E.
Treatments No. of leaves Leaf area Flower anthesis No. of crowns No. of runners
(plant-1
) (cm2) (days) (plant
-1) (plant
-1)
Control 7.00±0.41 d 17.50±1.04 d 41.75±1.25 a 2.75±0.25 d 2.25±0.25 d
50 mg L-1
GA3 11.50±0.65 c 21.75±0.48 c 27.00±1.08 b 4.00±0.00 c 3.75±0.48 c
100 mg L-1
GA3 20.50±0.29 b 58.00±1.22 b 23.25±0.85 c 6.75±0.00 b 8.50±0.58 b
150 mg L-1
GA3 23.50±0.29 a 65.75±1.11 a 20.50±0.29 d 8.00±0.25 a 11.00±0.29 a
LSD (p=0.05) 1.16 2.99 3.38 0.46 1.48
C.V. % 5.24 5.76 7.87 5.37 14.56
4.2.2.2 Yield parameters
Strawberry harvesting was started at the end of January and continued till mid-April.
Harvested strawberries were separated into three important categories such as marketable,
unmarketable and small size (Table 4.2.2.2).
4.2.2.2.1 Marketable (g plant
-1)
Statistical analysis regarding strawberry marketable yield (75-80% mature, disease
free, large size and bright red) affected by foliar spray of GA3 demonstrated significant
(p < 0.05) results. Marketable yield was increased with foliar spray of GA3 during whole
growing season. Maximum marketable yield (381.50 g
plant-1
) was found from the
strawberry plants those were treated with 100 mg L-1
GA3 followed by treatments 150 mg L-1
and 50 mg L-1
which showed marketable yield 288.75 and 124.0 g plant
-1, respectively. It was
noted that marketable yield was found maximum with foliar application of GA3 while higher
concentration was not much effective as compared with optimal concentration. Minimum
marketable yield (101.0 g plant
-1) was found with control treatment.
4.2.2.2.2 Unmarketable (g plant
-1)
Significant differences were noted regarding unmarketable yield (affected by biotic
and abiotic factors) of strawberry. Minimum unmarketable yield (36.0 g plant
-1) was noted
with 100 mg L-1
GA3 followed by treatments 150 mg L-1
(47.0 g plant
-1) and 50 mg L
-1 GA3
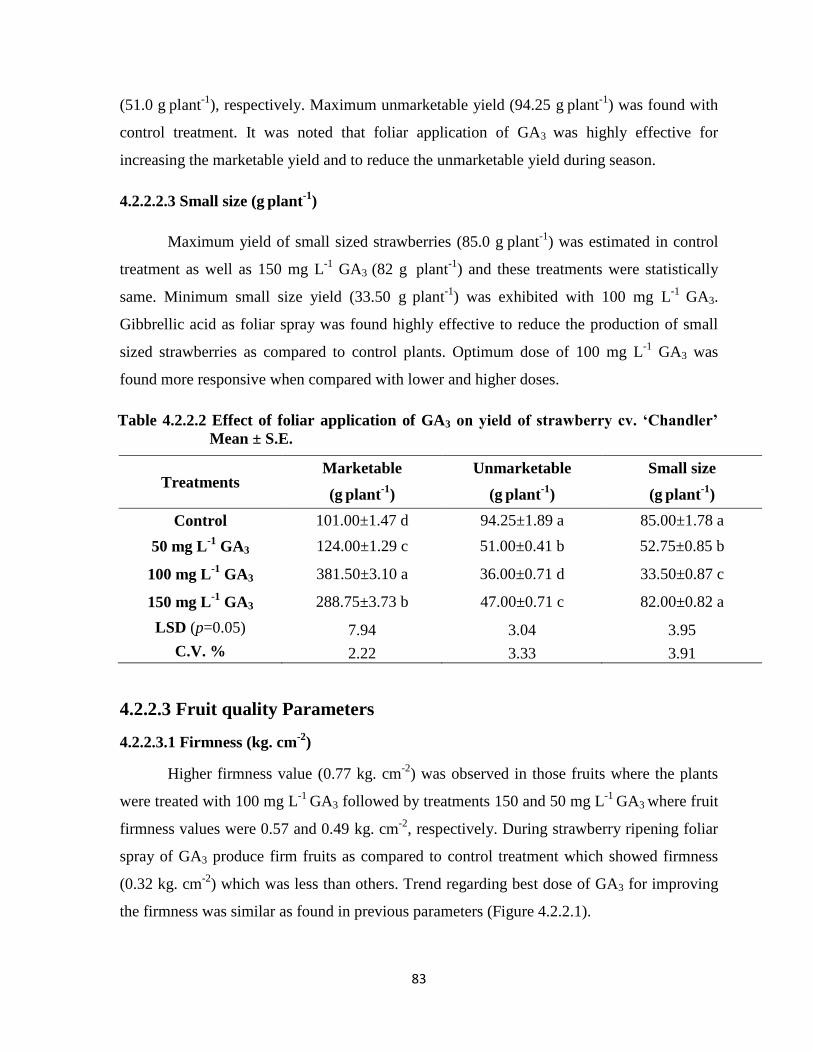
83
(51.0 g plant
-1), respectively. Maximum unmarketable yield (94.25 g
plant
-1) was found with
control treatment. It was noted that foliar application of GA3 was highly effective for
increasing the marketable yield and to reduce the unmarketable yield during season.
4.2.2.2.3 Small size (g plant
-1)
Maximum yield of small sized strawberries (85.0 g plant
-1) was estimated in control
treatment as well as 150 mg L-1
GA3 (82 g
plant
-1) and these treatments were statistically
same. Minimum small size yield (33.50 g plant
-1) was exhibited with 100 mg L
-1 GA3.
Gibbrellic acid as foliar spray was found highly effective to reduce the production of small
sized strawberries as compared to control plants. Optimum dose of 100 mg L-1
GA3 was
found more responsive when compared with lower and higher doses.
Table 4.2.2.2 Effect of foliar application of GA3 on yield of strawberry cv. ‘Chandler’
Mean ± S.E.
Treatments Marketable Unmarketable Small size
(g plant
-1) (g
plant
-1) (g
plant
-1)
Control 101.00±1.47 d 94.25±1.89 a 85.00±1.78 a
50 mg L-1
GA3 124.00±1.29 c 51.00±0.41 b 52.75±0.85 b
100 mg L-1
GA3 381.50±3.10 a 36.00±0.71 d 33.50±0.87 c
150 mg L-1
GA3 288.75±3.73 b 47.00±0.71 c 82.00±0.82 a
LSD (p=0.05) 7.94 3.04 3.95
C.V. % 2.22 3.33 3.91
4.2.2.3 Fruit quality Parameters
4.2.2.3.1 Firmness (kg. cm-2
)
Higher firmness value (0.77 kg. cm-2
) was observed in those fruits where the plants
were treated with 100 mg L-1
GA3 followed by treatments 150 and 50 mg L-1
GA3 where fruit
firmness values were 0.57 and 0.49 kg. cm-2
, respectively. During strawberry ripening foliar
spray of GA3 produce firm fruits as compared to control treatment which showed firmness
(0.32 kg. cm-2
) which was less than others. Trend regarding best dose of GA3 for improving
the firmness was similar as found in previous parameters (Figure 4.2.2.1).
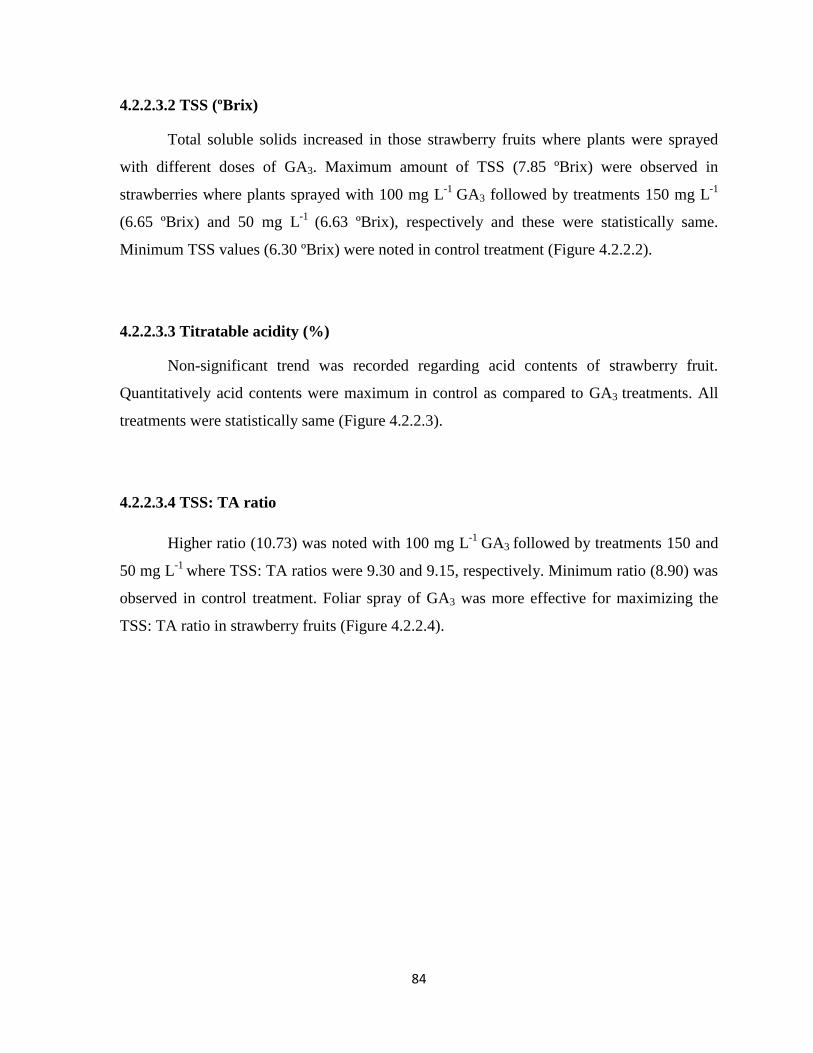
84
4.2.2.3.2 TSS (ºBrix)
Total soluble solids increased in those strawberry fruits where plants were sprayed
with different doses of GA3. Maximum amount of TSS (7.85 ºBrix) were observed in
strawberries where plants sprayed with 100 mg L-1
GA3 followed by treatments 150 mg L-1
(6.65 ºBrix) and 50 mg L-1
(6.63 ºBrix), respectively and these were statistically same.
Minimum TSS values (6.30 ºBrix) were noted in control treatment (Figure 4.2.2.2).
4.2.2.3.3 Titratable acidity (%)
Non-significant trend was recorded regarding acid contents of strawberry fruit.
Quantitatively acid contents were maximum in control as compared to GA3 treatments. All
treatments were statistically same (Figure 4.2.2.3).
4.2.2.3.4 TSS: TA ratio
Higher ratio (10.73) was noted with 100 mg L-1
GA3 followed by treatments 150 and
50 mg L-1
where TSS: TA ratios were 9.30 and 9.15, respectively. Minimum ratio (8.90) was
observed in control treatment. Foliar spray of GA3 was more effective for maximizing the
TSS: TA ratio in strawberry fruits (Figure 4.2.2.4).
85
4.2.2.3.5 Vitamin C (mg 100 g-1
)
Maximum (52.23 mg 100 g-1
) contents were observed in strawberry fruits sprayed
with 100 mg L-1
GA3 followed by treatments 150 mg L-1
(46.44 mg 100 g-1
) and 50 mg L-1
(39.80 mg 100 g-1
), respectively. While minimum (36.86 mg 100 g-1
) contents were observed
in control treatment. Results showed that medium dose of GA3 showed its superiority over
lower and higher doses for increasing the vitamin C contents of strawberry (Figure 4.2.2.5).
4.2.2.3.6 Total phenolic contents (mg GAE 100 g-1
)
Strawberry plants treated with GA3 100, 150 and 50 mg L-1
produced the strawberries
with total phenolic contents of 181.50, 164.50 and 141.50 mg GAE 100 g-1
, respectively.
Lower contents (138.50 mg GAE 100 g-1
) were observed in control treatment as compared to
other treated fruits. Again medium dose of GA3 (100 mg L-1
) showed its superiority over
lower and higher doses (Figure 4.2.2.6).
4.2.2.3.7 Total antioxidants (% DPPH)
Higher antioxidant activities (64.75% DPPH) were found in strawberry fruits where
plants were sprayed with 100 mg L-1
GA3 followed by other treatments 150 mg L-1
(47.50%
DPPH) and 50 mg L-1
(44.75% DPPH), respectively. Gibberellic acid treatments were highly
effective for increasing the antioxidant activities in strawberry fruits while minimum
activities were observed in control (35.75% DPPH) treatment (Figure 4.2.2.7).
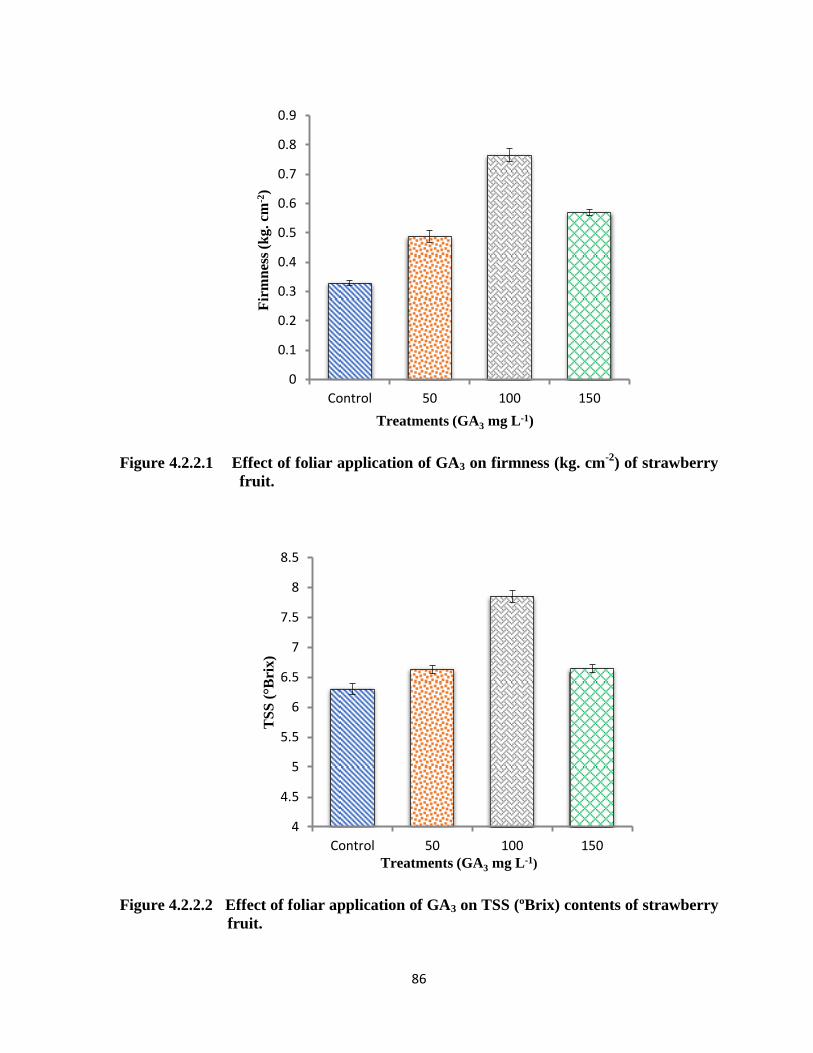
86
Figure 4.2.2.1 Effect of foliar application of GA3 on firmness (kg. cm-2
) of strawberry
fruit.
Figure 4.2.2.2 Effect of foliar application of GA3 on TSS (ºBrix) contents of strawberry
fruit.
0
0.1
0.2
0.3
0.4
0.5
0.6
0.7
0.8
0.9
Control 50 100 150
Fir
mn
ess
(kg
. cm
-2)
Treatments (GA3 mg L-1)
4
4.5
5
5.5
6
6.5
7
7.5
8
8.5
Control 50 100 150
TS
S (
°Bri
x)
Treatments (GA3 mg L-1)
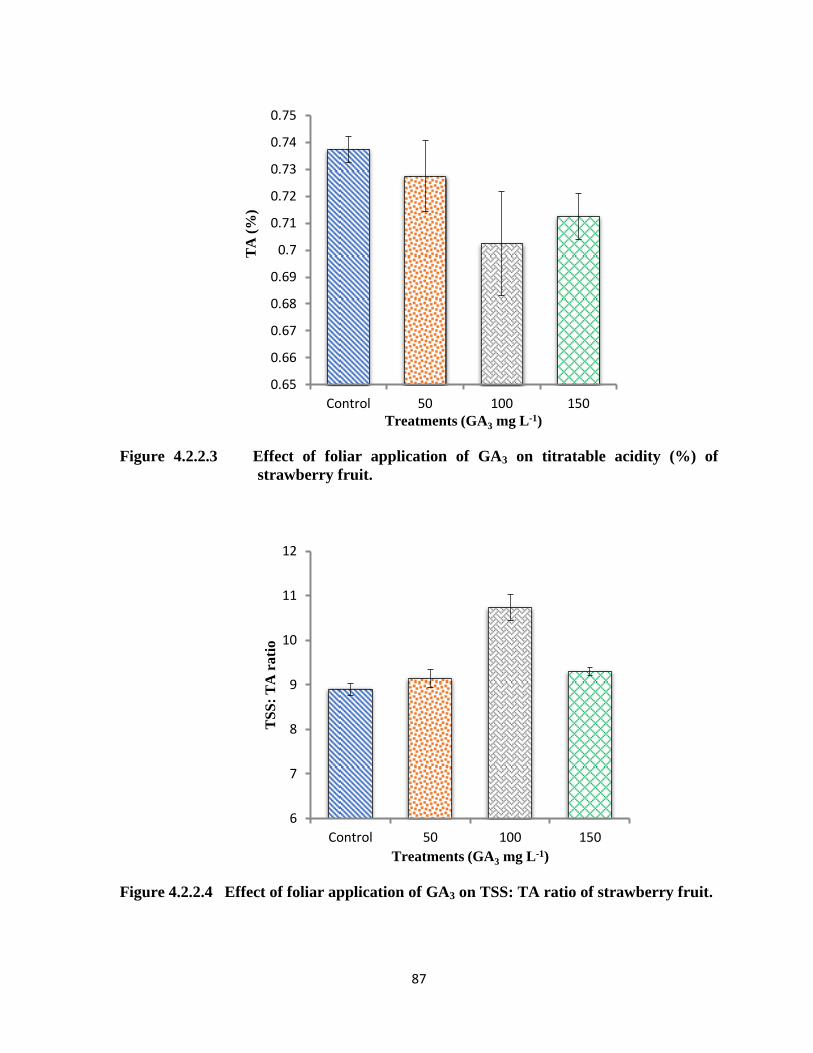
87
Figure 4.2.2.3 Effect of foliar application of GA3 on titratable acidity (%) of
strawberry fruit.
Figure 4.2.2.4 Effect of foliar application of GA3 on TSS: TA ratio of strawberry fruit.
0.65
0.66
0.67
0.68
0.69
0.7
0.71
0.72
0.73
0.74
0.75
Control 50 100 150
TA
(%
)
Treatments (GA3 mg L-1)
6
7
8
9
10
11
12
Control 50 100 150
TS
S:
TA
rati
o
Treatments (GA3 mg L-1)
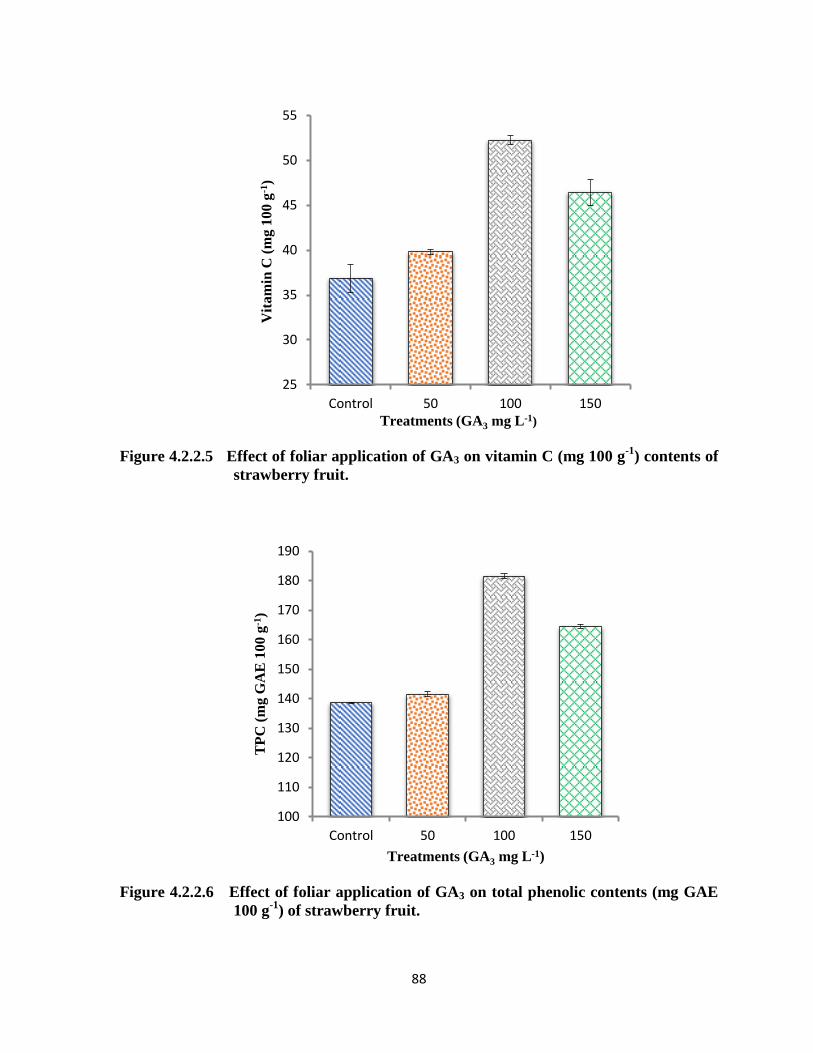
88
Figure 4.2.2.5 Effect of foliar application of GA3 on vitamin C (mg 100 g-1
) contents of
strawberry fruit.
Figure 4.2.2.6 Effect of foliar application of GA3 on total phenolic contents (mg GAE
100 g-1
) of strawberry fruit.
25
30
35
40
45
50
55
Control 50 100 150
Vit
am
in C
(m
g 1
00
g-1
)
Treatments (GA3 mg L-1)
100
110
120
130
140
150
160
170
180
190
Control 50 100 150
TP
C (
mg G
AE
100 g
-1)
Treatments (GA3 mg L-1)
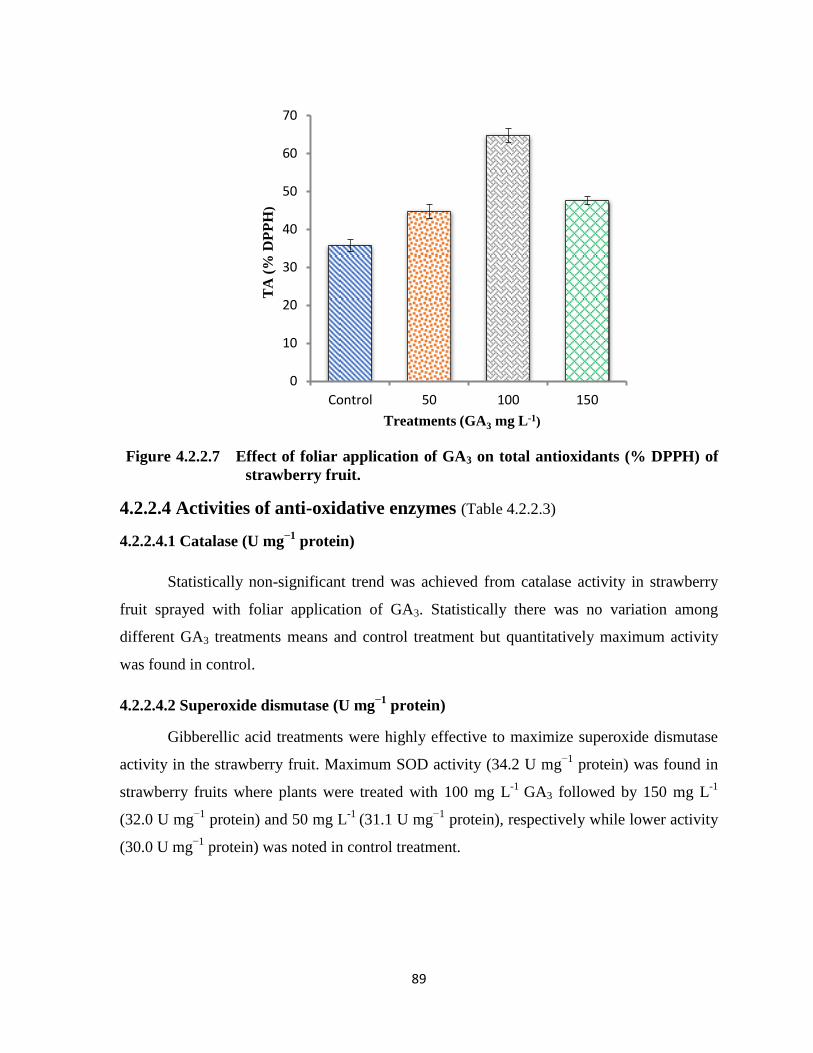
89
Figure 4.2.2.7 Effect of foliar application of GA3 on total antioxidants (% DPPH) of
strawberry fruit.
4.2.2.4 Activities of anti-oxidative enzymes (Table 4.2.2.3)
4.2.2.4.1 Catalase (U mg−1
protein)
Statistically non-significant trend was achieved from catalase activity in strawberry
fruit sprayed with foliar application of GA3. Statistically there was no variation among
different GA3 treatments means and control treatment but quantitatively maximum activity
was found in control.
4.2.2.4.2 Superoxide dismutase (U mg−1
protein)
Gibberellic acid treatments were highly effective to maximize superoxide dismutase
activity in the strawberry fruit. Maximum SOD activity (34.2 U mg−1
protein) was found in
strawberry fruits where plants were treated with 100 mg L-1
GA3 followed by 150 mg L-1
(32.0 U mg−1
protein) and 50 mg L-1
(31.1 U mg−1
protein), respectively while lower activity
(30.0 U mg−1
protein) was noted in control treatment.
0
10
20
30
40
50
60
70
Control 50 100 150
TA
(%
DP
PH
)
Treatments (GA3 mg L-1)
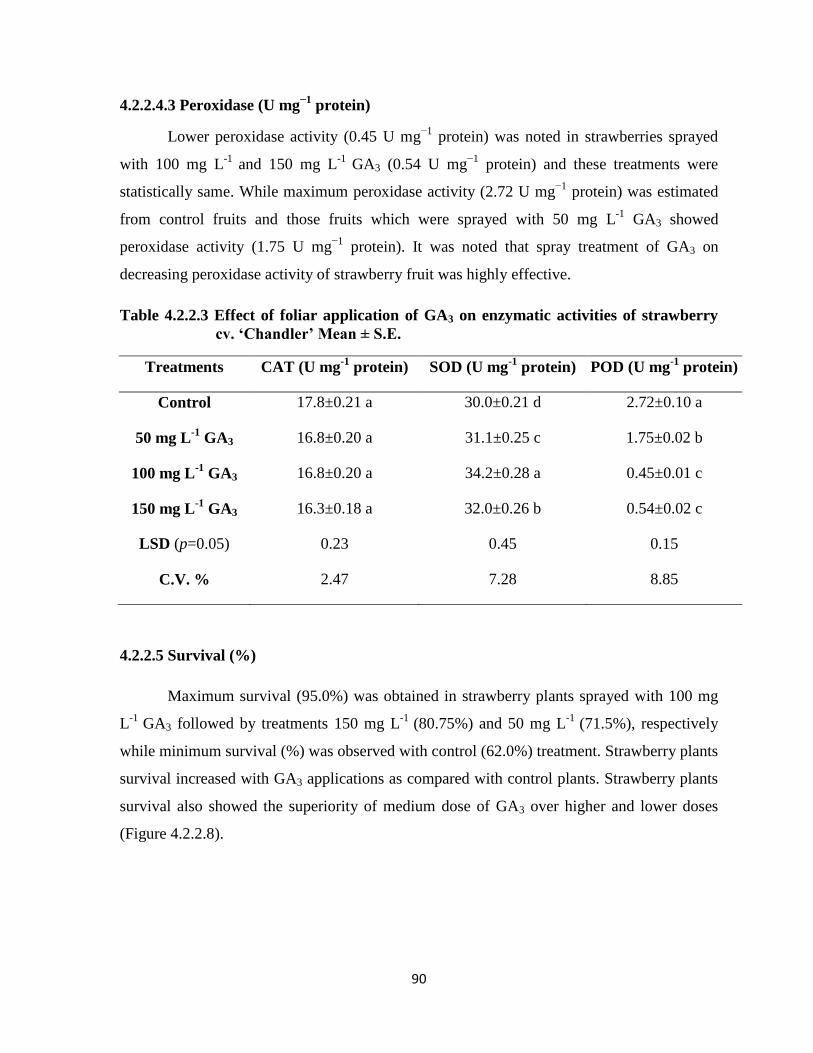
90
4.2.2.4.3 Peroxidase (U mg−1
protein)
Lower peroxidase activity (0.45 U mg−1
protein) was noted in strawberries sprayed
with 100 mg L-1
and 150 mg L-1
GA3 (0.54 U mg−1
protein) and these treatments were
statistically same. While maximum peroxidase activity (2.72 U mg−1
protein) was estimated
from control fruits and those fruits which were sprayed with 50 mg L-1
GA3 showed
peroxidase activity (1.75 U mg−1
protein). It was noted that spray treatment of GA3 on
decreasing peroxidase activity of strawberry fruit was highly effective.
Table 4.2.2.3 Effect of foliar application of GA3 on enzymatic activities of strawberry
cv. ‘Chandler’ Mean ± S.E.
Treatments CAT (U mg-1
protein) SOD (U mg-1
protein) POD (U mg-1
protein)
Control 17.8±0.21 a 30.0±0.21 d 2.72±0.10 a
50 mg L-1
GA3 16.8±0.20 a 31.1±0.25 c 1.75±0.02 b
100 mg L-1
GA3 16.8±0.20 a 34.2±0.28 a 0.45±0.01 c
150 mg L-1
GA3 16.3±0.18 a 32.0±0.26 b 0.54±0.02 c
LSD (p=0.05) 0.23 0.45 0.15
C.V. % 2.47 7.28 8.85
4.2.2.5 Survival (%)
Maximum survival (95.0%) was obtained in strawberry plants sprayed with 100 mg
L-1
GA3 followed by treatments 150 mg L-1
(80.75%) and 50 mg L-1
(71.5%), respectively
while minimum survival (%) was observed with control (62.0%) treatment. Strawberry plants
survival increased with GA3 applications as compared with control plants. Strawberry plants
survival also showed the superiority of medium dose of GA3 over higher and lower doses
(Figure 4.2.2.8).
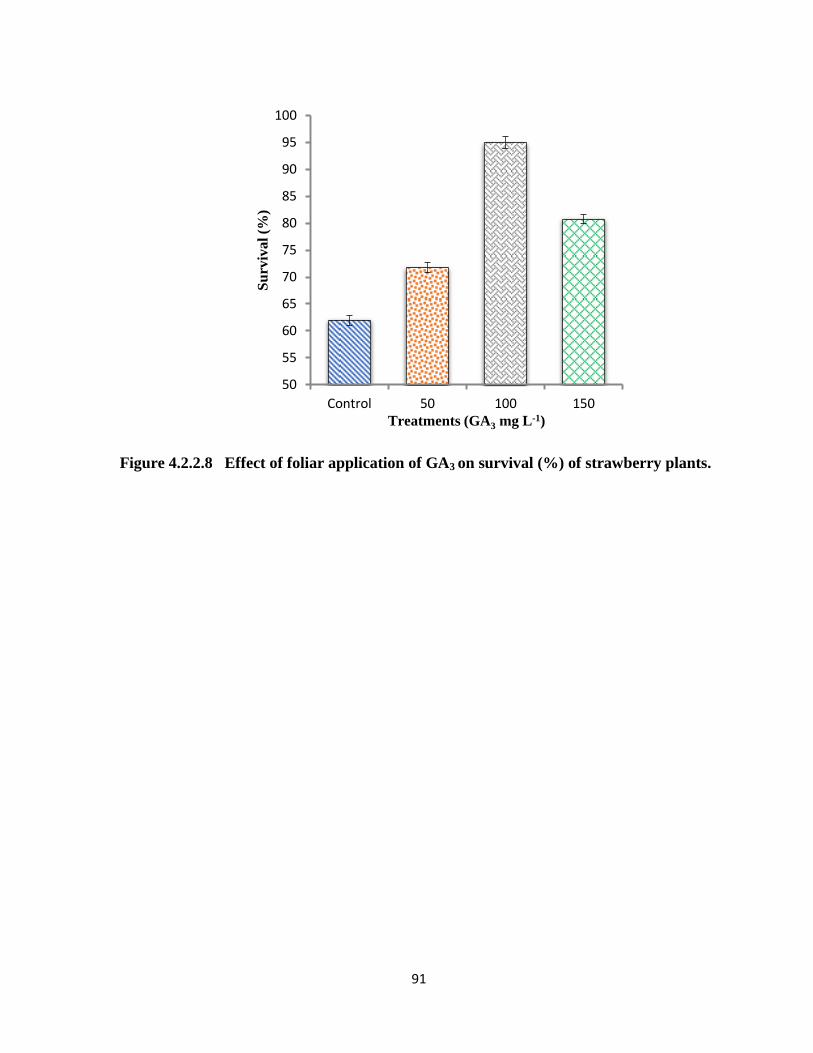
91
Figure 4.2.2.8 Effect of foliar application of GA3 on survival (%) of strawberry plants.
50
55
60
65
70
75
80
85
90
95
100
Control 50 100 150
Su
rviv
al
(%)
Treatments (GA3 mg L-1)
92
4.2.2 Discussion
Foliar spray of growth regulators enhance the fruit production and improve the
qualitative characteristics of fruits. They have potential for increasing the flowering density
and fruit setting percentage (Dutta and Banik, 2007). Gibberellic acid a type of
phytohormone belongs to family tetracyclic diterpenoids acids it plays prominent role in
biological functions of plant growth including leaf expansion, flower development, runner
production, cell division and elongation in different plants (Saddon and Al-Zubaidy, 2017).
In strawberry, gibberellic acid induced early flowering, early fruit development, increased
number of flowering truss per crown. It also increased the number of runners in all
strawberry varieties during long days (Sharma and Sing, 2009).
In current study different concentrations of GA3 were foliar applied on strawberry
plants. Vegetative growth significantly increased in all GA3 treatments but maximum leaves
(23.50 plant-1
) and leaf area (65.75 cm2) was noted with 150 mg L
-1 GA3. It could be due to
GA3 which promotes rapid cell division process in strawberry plants (Turner, 1963). The
response of GA3 for initiation of early flowering was highly significant. Minimum numbers
of days (20.25) were required for flower anthesis when plants sprayed with 150 mg L-1
GA3.
Our results regarding GA3 effects on flower anthesis were similar with previous findings who
reported that GA3 reduced the days of flower emergence, accelerated the level of internal
growth hormones due to that it enhanced the flower buds in strawberry cultivar „Seascape‟ in
all growing conditions (Paroussi et al., 2002). In current results increasing trend was
estimated regarding vegetative growth and maximum crowns (8.0 plant-1
) and runners (11.0
plant-1
) were observed with 150 mg L-1
GA3. Our findings are in accordance with previous
results where foliar applied GA3 increased the number of runners and crown growth in
strawberry cultivar „Gaviota‟ (Asadi et al., 2013). The mechanism through which GA3
increased the vegetative growth it involved rapid increase in mitosis in the region of
meristem after foliar spray of GA3 which increased the cell division activity and also
stimulated the cell elongation in plant (Taiz and Zeiger, 2002b). Gibberellic acid stimulated
growth due to increased activity of enzyme (xyloglucan endotransglycosylase) which
involved in cell wall extension. When GA3 is applied on plant surface it regulates the activity
93
of XET during growth and development (Taiz and Zeiger, 2002b). Overall, the vegetative
growth increased with higher dose of GA3 (150 mg L-1
) as compared with other treatments.
According to present findings it was shown that marketable yield significantly
increased in all GA3 treatments throughout strawberry season. Maximum marketable yield
(381.50 g plant-1
) was obtained with 100 mg L-1
GA3 as compared to other treatments.
Unmarketable yield was lowered in all GA3 treatments. These findings are supported by the
results of Jamal Uddin et al. (2012) who stated that 75 ppm of GA3 enhanced the fruit
production but also improved the weight of strawberries. Our results suggested that
maximum yield of small sized strawberries (85.0 g plant-1
) was estimated in control as well
as 150 mg L-1
GA3 (82 g plant-1
) while minimum small size yield (33.50 g plant-1
) was noted
with 100 mg L-1
GA3. It was observed from results that the response of higher and lower
concentrations of GA3 was less effective to reduce small size yield during season. Our
findings are in agreement with previous results where higher dose of 200 mg L-1
GA3 reduced
the marketable yield of strawberry and increased the production of maximum aborted
flowers, small size and malformed fruits (Paroussi et al., 2002). It is also stated that optimum
concentration of GA3 produced the normal fruit of tomato but as its concentration increased,
it resulted in production of smaller fruits per plant (Gelmesa et al., 2013).
Gibberellic acid treatments were highly effective for improving the quality of
strawberry. Higher firmness values were achieved in those strawberry fruits treated with 100
mg L-1
GA3. Firmness is important quality parameter because firmer fruits are considered
less sensitive to mechanical injury so its shelf life will be more as compared to softer fruits
(Taylor and Knight, 1986). Gibberellic acid application regulates the activities of cell wall
hydraulic enzymes so due to that fruit firmness increased. In literature similar findings were
observed when foliar application of 100 ppm GA3 was applied on two plum cultivars
„Obilnaja‟ and „Black Star‟ which showed higher flesh firmness as compared to control fruits
(Harman and Sen, 2016). According to our results maximum TSS values were observed in
fruits which were sprayed with 100 mg L-1
GA3. Total soluble solids increased in all GA3
treatments; it could be due to rapidly change of organic acid contents into sugars during fruit
ripening. Our results regarding increasing trend in TSS contents were similar with the
previous results of Rajput and Singh (1977) who reported that the increment in TSS could be
94
due to production of maximum auxin hormone in plants during development process which
further increased the level of secondary metabolites in plants and their rapid translocation
from different parts of plants to the fruits. Thus, those plants which treated with growth
regulators have potential for producing secondary metabolites which further increased the
TSS contents in fruits. In present study non-significant trend was recorded regarding acid
contents of strawberry fruit. In previous study similar results were found when foliar spray of
GA3 (25-75 ppm) was applied on guava fruit which showed decrease in acid contents, it was
because of GA3 foliar treatment caused the early fruit ripening due to that fruit respiration
process increased and acid contents rapidly converted into sugars (Singh et al., 2017). TSS:
Acid ratio is an important quality parameter of strawberry fruit which determined the
ripening stage and shelf life. This parameter is also beneficial for the growers that they can
get good quality fruit. Maximum ratio was noted with 100 mg L-1
GA3 as compared with
other treatments.
Higher vitamin C contents shows higher nutritive value of strawberry fruits.
Maximum vitamin C contents (52.23 mg 100 g-1
) were noted with 100 mg L-1
of GA3. Higher
and lower application of GA3 was less effective for increasing the vitamin C contents during
season. Our results confirmed the previous findings where foliar treatment of GA3 (10, 20
and 30 ppm) improved the vitamin C contents of mandarin. It could be due to GA3 increased
the activity of L-ascorbic acid while in control fruits decrease in vitamin C could be due to
loss of this activity where it converted into 2-3-dioxy-L-gluconic acid (Rokaya et al., 2016).
From results it was clear that TPC and TA were increased with foliar treatment of GA3
during season. Maximum TPC (181.50 mg GAE 100 g-1
) and TA (64.75% DPPH) were
estimated with 100 mg L-1
GA3 treatment. It was noted that higher and lower doses were less
effective for increasing the TPC and TA during season. Similar results were also observed
from previous studies where foliar application of 100 ppm of GA3 on two plum cultivars
„Obilnaja‟ and „Black Star‟ increased TPC contents and TA activities. It is because of GA3
promoted biosynthesis of secondary metabolites in the fruit with higher antioxidant activity
(Harman and Sen, 2016). According to our results higher catalase and peroxidase enzymatic
activities were observed in control fruits while GA3 treatments were highly effective in
reducing these activities during season. Minimum superoxide dismutase activity was noted
with control while those fruits sprayed with 100 mg L-1
GA3 showed increment in superoxide
95
dismutase activity. In literature it was exhibited that maximum catalase activity found during
strawberry fruit ripening. It increased in white and red color fruit but higher activity of
catalase led to senescence (Jimenez et al. 2003). Superoxide dismutase activity increased
during maturation stages up to highest levels in white fruits. Decreased during turning stage
and increased during ripening stage of strawberry. Peroxidase activity increased in white
color fruits and decreased in red color strawberry fruits but during ripening higher peroxidase
activity caused off flavor of strawberry (Lopez et al., 2010). Not enough evidences are
available in the literature regarding the effects of GA3 on enzymatic activities of fruits but
GA3 has important role in biosynthesis of secondary metabolites which regulate the
enzymatic activities in the fruit. In present study maximum survival (95%) was observed
with medium dose of GA3 100 mg L-1
it might be due to climatic, soil and varietal response.
4.2.2 Conclusion
Gibberellic acid as growth promoter played important role in increasing the
vegetative growth throughout strawberry season. Higher dose of GA3 (150 mg L-1
) expressed
the superiority for enhancing the vegetative growth while marketable yield and fruit quality
was not improved with this concentration. Higher dose of GA3 caused maximum increase in
cell division activity due to that vegetative growth increased and most of the plant
photosynthetic products used for increasing leaves, crowns and runner growth and less
available for producing good quality fruit. So, present study proved that medium dose of GA3
(100 mg L-1
) increased the marketable yield and also improved the quality of strawberry.
96
4.3 Study-3
(Confirmatory Trial)
4.3 Comparison of calcium chloride (CaCl2), zinc sulfate (ZnSO4), salicylic
acid (SA) and gibberellic acid (GA3) to improve the vegetative growth,
yield and quality of strawberry cv. ‘Chandler’
In this study previous year optimized treatments from each experiment were compared
with each other to find out the best treatment which increase the canopy growth, marketable
yield and also improve the quality of strawberries. Same method of foliar spray was followed
as in previous experiments. Following parameters were measured:
4.3.1 Vegetative parameters (Table 4.3.1)
4.3.1.1 Number of leaves (plant-1
)
Number of leaves (21.25 plant-1
) increased with 100 mg L-1
GA3 followed by
treatments including 9 mM SA, 7 mM CaCl2 and 100 mg L-1
ZnSO4 which showed numbers
of leaves 18.25, 16.50 and 15.50 plant-1
, respectively. Strawberry plants those were sprayed
with salts CaCl2 and ZnSO4; their results were statistically same. Minimum leaves (10.50
plant-1
) were observed in control plants. It was concluded that numbers of leaves increased
with foliar spray of GA3 as compared to other treatments.
4.3.1.2 Leaf area (cm2)
Leaf area was increased with foliar application of salts and growth regulators.
Maximum leaf area (61.75 cm2) was increased with 100 mg L
-1 GA3 followed by treatments
including 9 mM SA, 7 mM CaCl2 and 100 mg L-1
ZnSO4 which showed leaf area values
49.25, 46.25 and 42.50 cm2, respectively. According to results SA and CaCl2 treatments were
statistically same. Leaf area was not increased in control plants. It was noted from results that
foliar spray of GA3 was more effective for increasing the leaf area as compared to other foliar
treatments.
97
4.3.1.3 Flower anthesis (days after foliar application)
Minimum number of days (15.50) was required for flower anthesis when strawberry
plants were treated with 100 mg L-1
GA3 followed by 9 mM SA (17.75) and these treatments
were statistically same. Strawberry plants sprayed with salts including 100 mg L-1
ZnSO4 and
7 mM CaCl2 also showed minimum numbers of days 30.50 and 35.0, respectively. Maximum
days (47.50) for flower anthesis were observed with control plants. It was concluded from
results that foliar spray of salts and growth regulators is highly effective strategy to initiate
early flowering and reduced the maximum number of days to open flowers.
4.3.1.4 Number of crowns (plant-1
)
Maximum crowns (8.0 plant-1
) were observed with 100 mg L-1
GA3 followed by
treatments including 9 mM SA, 7 mM CaCl2 and 100 mg L-1
ZnSO4 where numbers of
crowns were 6.50, 6.25 and 6.0 plant-1
, respectively. The response of different foliar sprays
of salts and growth regulators was highly effective for increasing the crown growth while
minimum crowns (3.0 plant-1
) were observed in control plants.
4.3.1.5 Number of runners (plant-1
)
Maximum runners (11.0 plant-1
) were observed with 100 mg L-1
GA3 followed by
treatments including 9 mM SA (5.50 plant-1
), 7 mM CaCl2 (5.0 plant-1
) and 100 mg L-1
ZnSO4 (4.50 plant-1
), respectively. During whole strawberry season minimum runners (2.75
plant-1
) were observed in control plants. It was noted that numbers of runners were
significantly increased with different foliar applications as compared with control plants.
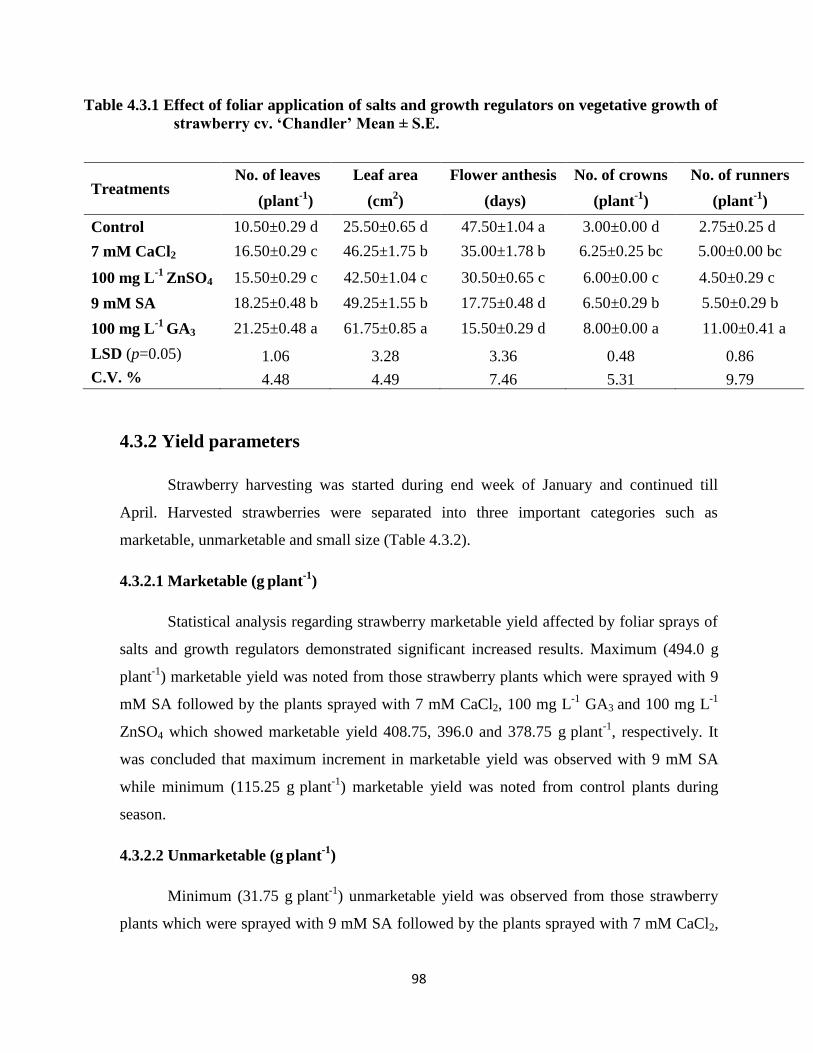
98
Table 4.3.1 Effect of foliar application of salts and growth regulators on vegetative growth of
strawberry cv. ‘Chandler’ Mean ± S.E.
Treatments
No. of leaves Leaf area Flower anthesis No. of crowns No. of runners
(plant-1
) (cm2) (days) (plant
-1) (plant
-1)
Control 10.50±0.29 d 25.50±0.65 d 47.50±1.04 a 3.00±0.00 d 2.75±0.25 d
7 mM CaCl2 16.50±0.29 c 46.25±1.75 b 35.00±1.78 b 6.25±0.25 bc 5.00±0.00 bc
100 mg L-1
ZnSO4 15.50±0.29 c 42.50±1.04 c 30.50±0.65 c 6.00±0.00 c 4.50±0.29 c
9 mM SA 18.25±0.48 b 49.25±1.55 b 17.75±0.48 d 6.50±0.29 b 5.50±0.29 b
100 mg L-1
GA3 21.25±0.48 a 61.75±0.85 a 15.50±0.29 d 8.00±0.00 a 11.00±0.41 a
LSD (p=0.05) 1.06 3.28 3.36 0.48 0.86
C.V. % 4.48 4.49 7.46 5.31 9.79
4.3.2 Yield parameters
Strawberry harvesting was started during end week of January and continued till
April. Harvested strawberries were separated into three important categories such as
marketable, unmarketable and small size (Table 4.3.2).
4.3.2.1 Marketable (g plant
-1)
Statistical analysis regarding strawberry marketable yield affected by foliar sprays of
salts and growth regulators demonstrated significant increased results. Maximum (494.0 g
plant-1
) marketable yield was noted from those strawberry plants which were sprayed with 9
mM SA followed by the plants sprayed with 7 mM CaCl2, 100 mg L-1
GA3 and 100 mg L-1
ZnSO4 which showed marketable yield 408.75, 396.0 and 378.75 g plant
-1, respectively. It
was concluded that maximum increment in marketable yield was observed with 9 mM SA
while minimum (115.25 g plant
-1) marketable yield was noted from control plants during
season.
4.3.2.2 Unmarketable (g plant
-1)
Minimum (31.75 g plant
-1) unmarketable yield was observed from those strawberry
plants which were sprayed with 9 mM SA followed by the plants sprayed with 7 mM CaCl2,
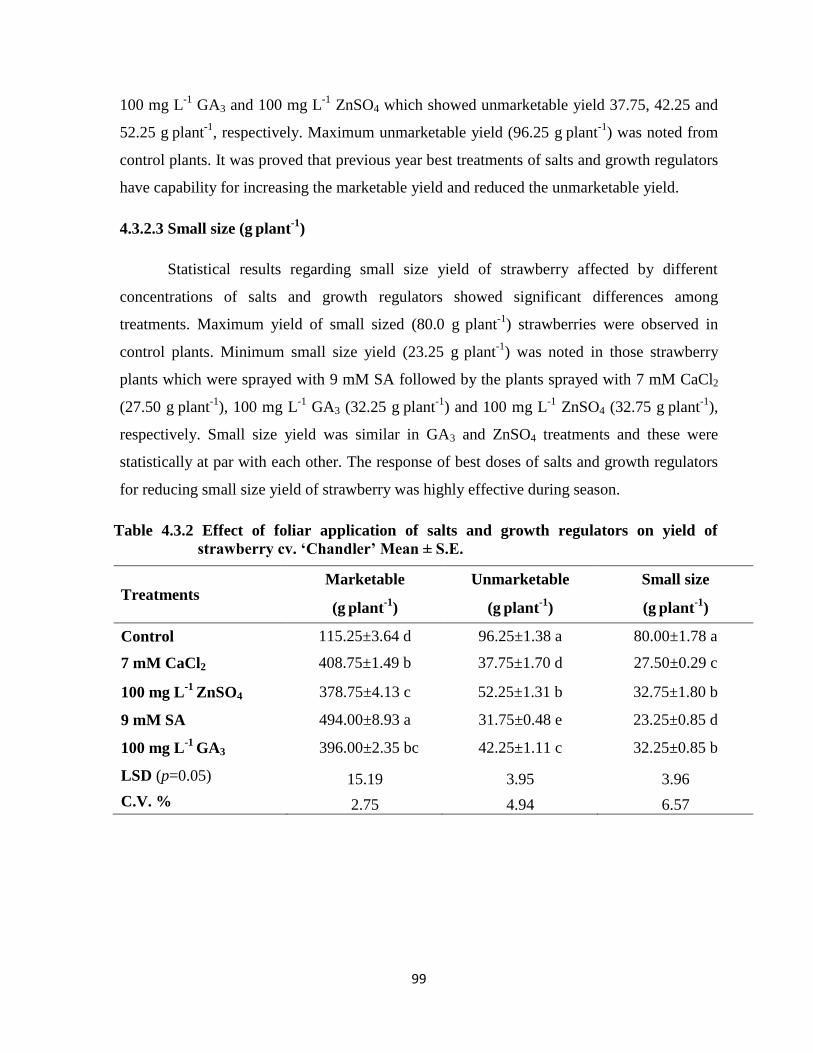
99
100 mg L-1
GA3 and 100 mg L-1
ZnSO4 which showed unmarketable yield 37.75, 42.25 and
52.25 g plant
-1, respectively. Maximum unmarketable yield (96.25 g
plant
-1) was noted from
control plants. It was proved that previous year best treatments of salts and growth regulators
have capability for increasing the marketable yield and reduced the unmarketable yield.
4.3.2.3 Small size (g plant
-1)
Statistical results regarding small size yield of strawberry affected by different
concentrations of salts and growth regulators showed significant differences among
treatments. Maximum yield of small sized (80.0 g plant
-1) strawberries were observed in
control plants. Minimum small size yield (23.25 g plant
-1) was noted in those strawberry
plants which were sprayed with 9 mM SA followed by the plants sprayed with 7 mM CaCl2
(27.50 g plant
-1), 100 mg L
-1 GA3 (32.25 g
plant
-1) and 100 mg L
-1 ZnSO4 (32.75 g
plant
-1),
respectively. Small size yield was similar in GA3 and ZnSO4 treatments and these were
statistically at par with each other. The response of best doses of salts and growth regulators
for reducing small size yield of strawberry was highly effective during season.
Table 4.3.2 Effect of foliar application of salts and growth regulators on yield of
strawberry cv. ‘Chandler’ Mean ± S.E.
Treatments Marketable Unmarketable Small size
(g plant
-1) (g
plant
-1) (g
plant
-1)
Control 115.25±3.64 d 96.25±1.38 a 80.00±1.78 a
7 mM CaCl2 408.75±1.49 b 37.75±1.70 d 27.50±0.29 c
100 mg L-1
ZnSO4 378.75±4.13 c 52.25±1.31 b 32.75±1.80 b
9 mM SA 494.00±8.93 a 31.75±0.48 e 23.25±0.85 d
100 mg L-1
GA3 396.00±2.35 bc 42.25±1.11 c 32.25±0.85 b
LSD (p=0.05) 15.19 3.95 3.96
C.V. % 2.75 4.94 6.57
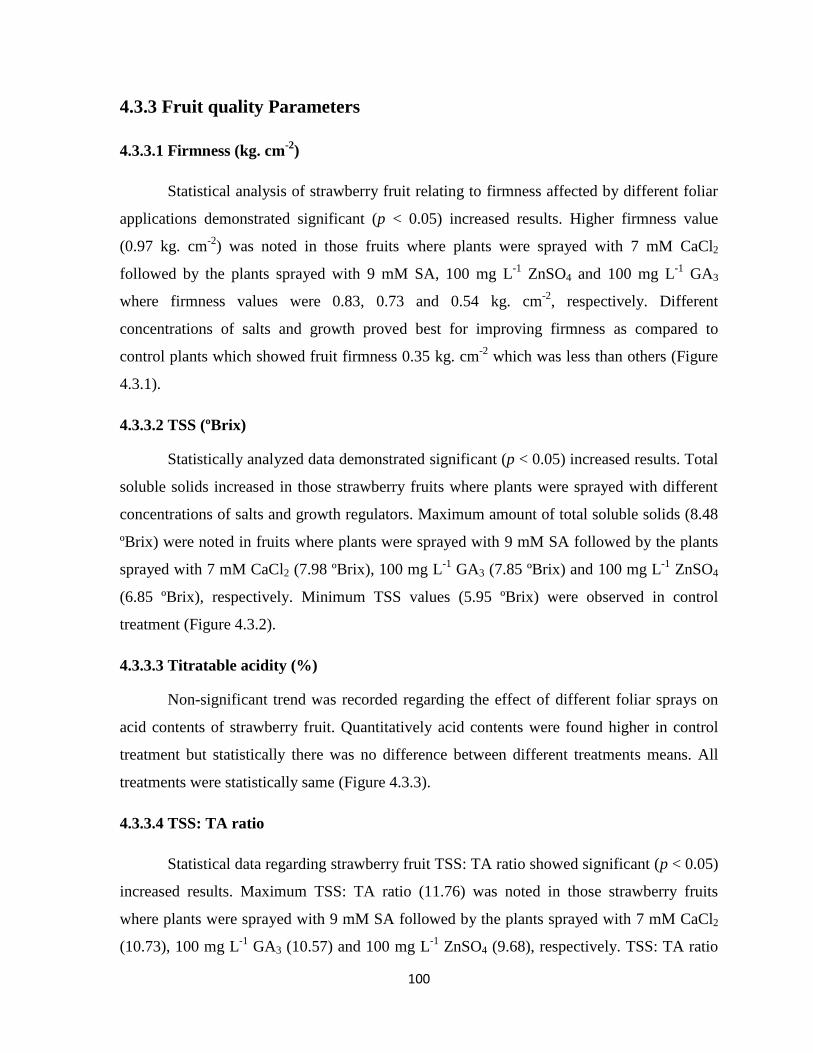
100
4.3.3 Fruit quality Parameters
4.3.3.1 Firmness (kg. cm-2
)
Statistical analysis of strawberry fruit relating to firmness affected by different foliar
applications demonstrated significant (p < 0.05) increased results. Higher firmness value
(0.97 kg. cm-2
) was noted in those fruits where plants were sprayed with 7 mM CaCl2
followed by the plants sprayed with 9 mM SA, 100 mg L-1
ZnSO4 and 100 mg L-1
GA3
where firmness values were 0.83, 0.73 and 0.54 kg. cm-2
, respectively. Different
concentrations of salts and growth proved best for improving firmness as compared to
control plants which showed fruit firmness 0.35 kg. cm-2
which was less than others (Figure
4.3.1).
4.3.3.2 TSS (ºBrix)
Statistically analyzed data demonstrated significant (p < 0.05) increased results. Total
soluble solids increased in those strawberry fruits where plants were sprayed with different
concentrations of salts and growth regulators. Maximum amount of total soluble solids (8.48
ºBrix) were noted in fruits where plants were sprayed with 9 mM SA followed by the plants
sprayed with 7 mM CaCl2 (7.98 ºBrix), 100 mg L-1
GA3 (7.85 ºBrix) and 100 mg L-1
ZnSO4
(6.85 ºBrix), respectively. Minimum TSS values (5.95 ºBrix) were observed in control
treatment (Figure 4.3.2).
4.3.3.3 Titratable acidity (%)
Non-significant trend was recorded regarding the effect of different foliar sprays on
acid contents of strawberry fruit. Quantitatively acid contents were found higher in control
treatment but statistically there was no difference between different treatments means. All
treatments were statistically same (Figure 4.3.3).
4.3.3.4 TSS: TA ratio
Statistical data regarding strawberry fruit TSS: TA ratio showed significant (p < 0.05)
increased results. Maximum TSS: TA ratio (11.76) was noted in those strawberry fruits
where plants were sprayed with 9 mM SA followed by the plants sprayed with 7 mM CaCl2
(10.73), 100 mg L-1
GA3 (10.57) and 100 mg L-1
ZnSO4 (9.68), respectively. TSS: TA ratio
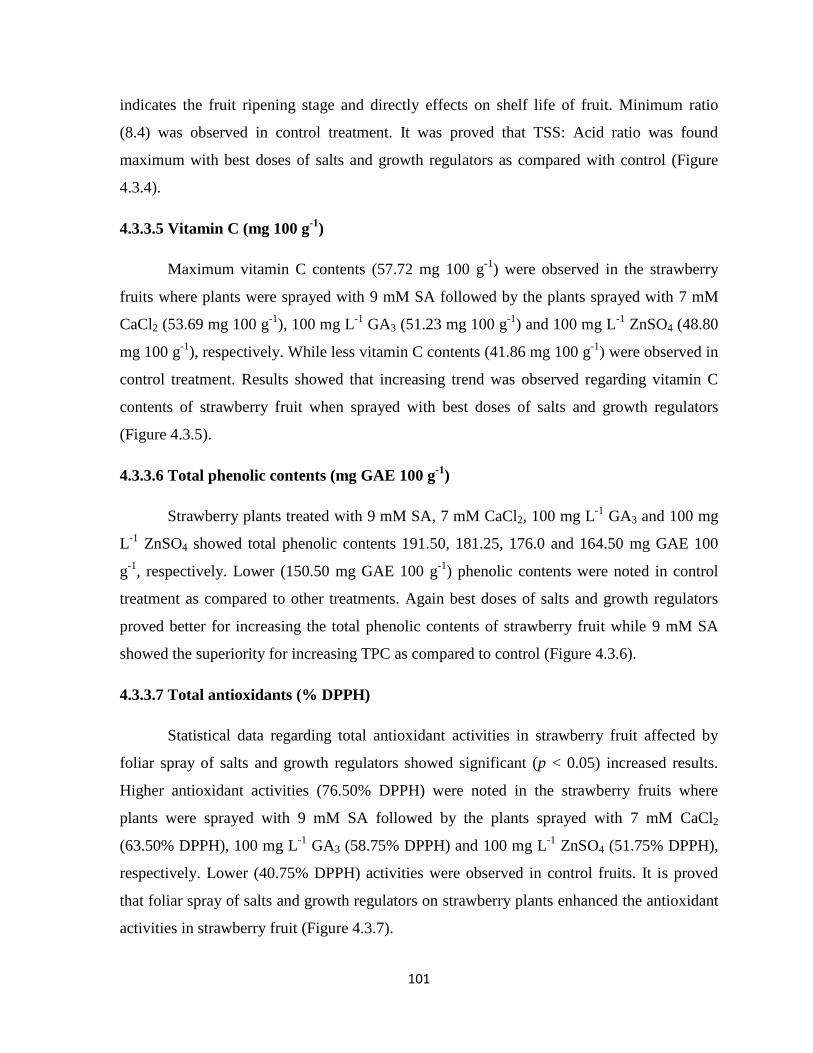
101
indicates the fruit ripening stage and directly effects on shelf life of fruit. Minimum ratio
(8.4) was observed in control treatment. It was proved that TSS: Acid ratio was found
maximum with best doses of salts and growth regulators as compared with control (Figure
4.3.4).
4.3.3.5 Vitamin C (mg 100 g-1
)
Maximum vitamin C contents (57.72 mg 100 g-1
) were observed in the strawberry
fruits where plants were sprayed with 9 mM SA followed by the plants sprayed with 7 mM
CaCl2 (53.69 mg 100 g-1
), 100 mg L-1
GA3 (51.23 mg 100 g-1
) and 100 mg L-1
ZnSO4 (48.80
mg 100 g-1
), respectively. While less vitamin C contents (41.86 mg 100 g-1
) were observed in
control treatment. Results showed that increasing trend was observed regarding vitamin C
contents of strawberry fruit when sprayed with best doses of salts and growth regulators
(Figure 4.3.5).
4.3.3.6 Total phenolic contents (mg GAE 100 g-1
)
Strawberry plants treated with 9 mM SA, 7 mM CaCl2, 100 mg L-1
GA3 and 100 mg
L-1
ZnSO4 showed total phenolic contents 191.50, 181.25, 176.0 and 164.50 mg GAE 100
g-1
, respectively. Lower (150.50 mg GAE 100 g-1
) phenolic contents were noted in control
treatment as compared to other treatments. Again best doses of salts and growth regulators
proved better for increasing the total phenolic contents of strawberry fruit while 9 mM SA
showed the superiority for increasing TPC as compared to control (Figure 4.3.6).
4.3.3.7 Total antioxidants (% DPPH)
Statistical data regarding total antioxidant activities in strawberry fruit affected by
foliar spray of salts and growth regulators showed significant (p < 0.05) increased results.
Higher antioxidant activities (76.50% DPPH) were noted in the strawberry fruits where
plants were sprayed with 9 mM SA followed by the plants sprayed with 7 mM CaCl2
(63.50% DPPH), 100 mg L-1
GA3 (58.75% DPPH) and 100 mg L-1
ZnSO4 (51.75% DPPH),
respectively. Lower (40.75% DPPH) activities were observed in control fruits. It is proved
that foliar spray of salts and growth regulators on strawberry plants enhanced the antioxidant
activities in strawberry fruit (Figure 4.3.7).
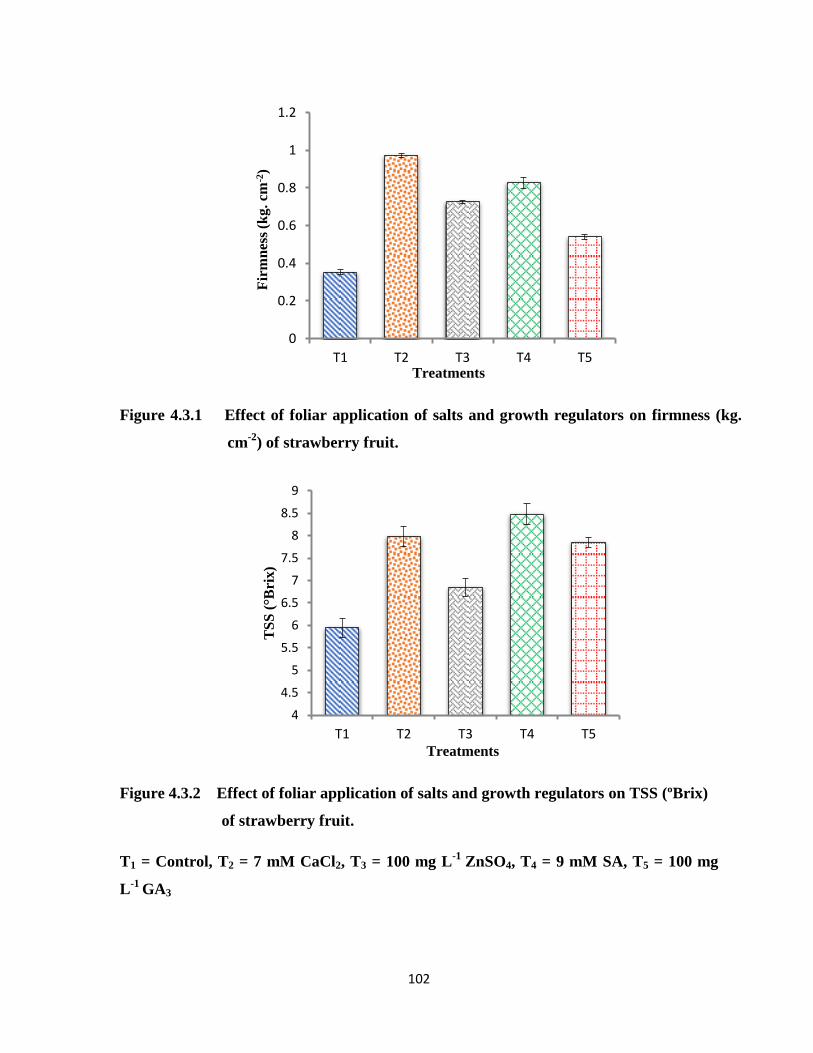
102
Figure 4.3.1 Effect of foliar application of salts and growth regulators on firmness (kg.
cm-2
) of strawberry fruit.
Figure 4.3.2 Effect of foliar application of salts and growth regulators on TSS (ºBrix)
of strawberry fruit.
T1 = Control, T2 = 7 mM CaCl2, T3 = 100 mg L-1
ZnSO4, T4 = 9 mM SA, T5 = 100 mg
L-1
GA3
0
0.2
0.4
0.6
0.8
1
1.2
T1 T2 T3 T4 T5
Fir
mn
ess
(kg
. cm
-2)
Treatments
4
4.5
5
5.5
6
6.5
7
7.5
8
8.5
9
T1 T2 T3 T4 T5
TS
S (
°Bri
x)
Treatments
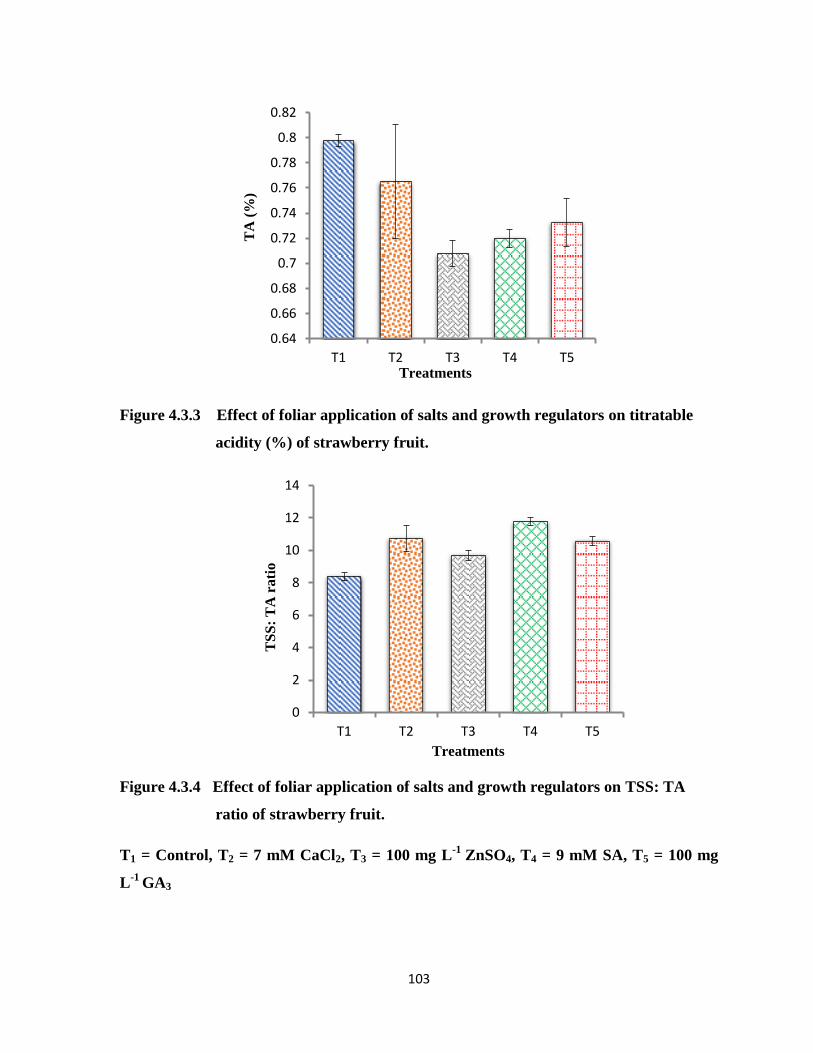
103
Figure 4.3.3 Effect of foliar application of salts and growth regulators on titratable
acidity (%) of strawberry fruit.
Figure 4.3.4 Effect of foliar application of salts and growth regulators on TSS: TA
ratio of strawberry fruit.
T1 = Control, T2 = 7 mM CaCl2, T3 = 100 mg L-1
ZnSO4, T4 = 9 mM SA, T5 = 100 mg
L-1
GA3
0.64
0.66
0.68
0.7
0.72
0.74
0.76
0.78
0.8
0.82
T1 T2 T3 T4 T5
TA
(%
)
Treatments
0
2
4
6
8
10
12
14
T1 T2 T3 T4 T5
TS
S:
TA
rati
o
Treatments
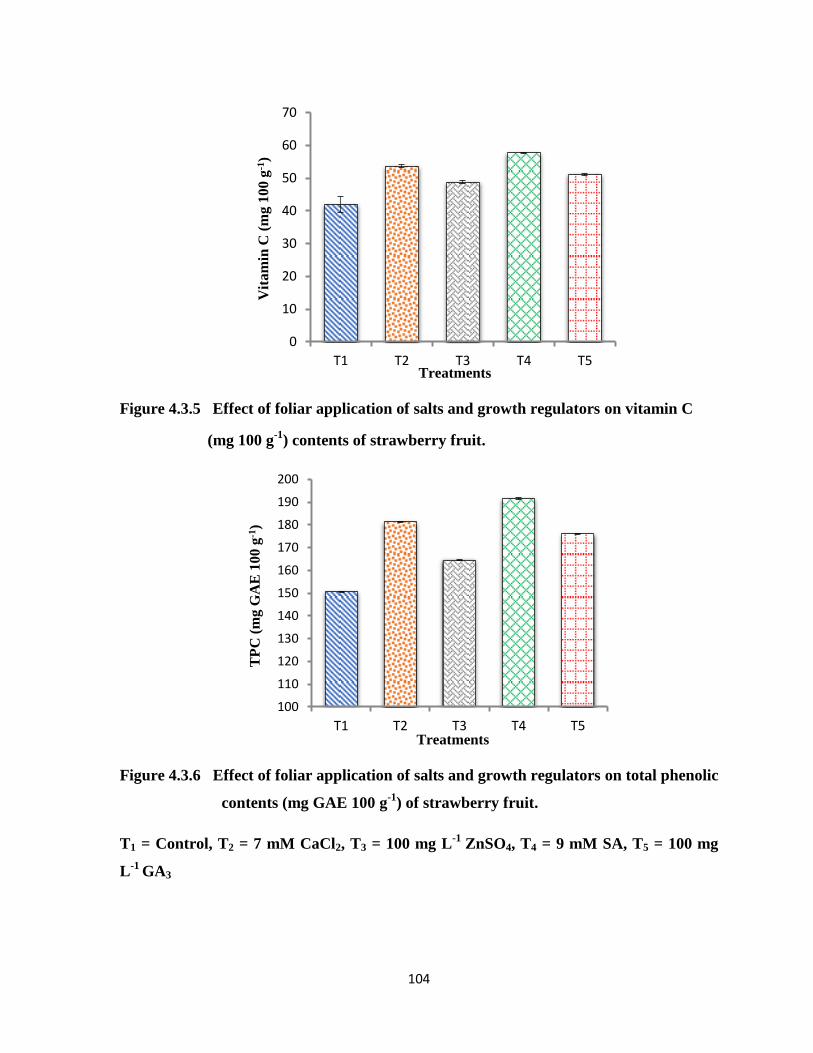
104
Figure 4.3.5 Effect of foliar application of salts and growth regulators on vitamin C
(mg 100 g-1
) contents of strawberry fruit.
Figure 4.3.6 Effect of foliar application of salts and growth regulators on total phenolic
contents (mg GAE 100 g-1
) of strawberry fruit.
T1 = Control, T2 = 7 mM CaCl2, T3 = 100 mg L-1
ZnSO4, T4 = 9 mM SA, T5 = 100 mg
L-1
GA3
0
10
20
30
40
50
60
70
T1 T2 T3 T4 T5
Vit
am
in C
(m
g 1
00 g
-1)
Treatments
100
110
120
130
140
150
160
170
180
190
200
T1 T2 T3 T4 T5
TP
C (
mg
GA
E 1
00 g
-1)
Treatments
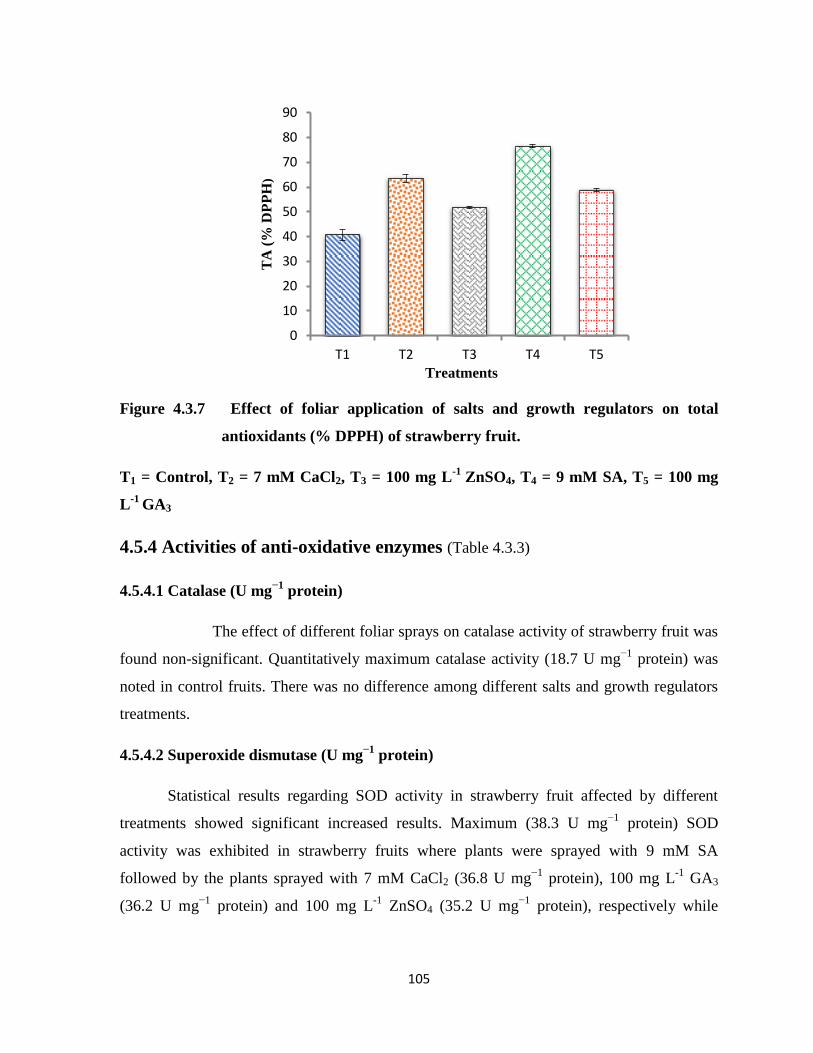
105
Figure 4.3.7 Effect of foliar application of salts and growth regulators on total
antioxidants (% DPPH) of strawberry fruit.
T1 = Control, T2 = 7 mM CaCl2, T3 = 100 mg L-1
ZnSO4, T4 = 9 mM SA, T5 = 100 mg
L-1
GA3
4.5.4 Activities of anti-oxidative enzymes (Table 4.3.3)
4.5.4.1 Catalase (U mg−1
protein)
The effect of different foliar sprays on catalase activity of strawberry fruit was
found non-significant. Quantitatively maximum catalase activity (18.7 U mg−1
protein) was
noted in control fruits. There was no difference among different salts and growth regulators
treatments.
4.5.4.2 Superoxide dismutase (U mg−1
protein)
Statistical results regarding SOD activity in strawberry fruit affected by different
treatments showed significant increased results. Maximum (38.3 U mg−1
protein) SOD
activity was exhibited in strawberry fruits where plants were sprayed with 9 mM SA
followed by the plants sprayed with 7 mM CaCl2 (36.8 U mg−1
protein), 100 mg L-1
GA3
(36.2 U mg−1
protein) and 100 mg L-1
ZnSO4 (35.2 U mg−1
protein), respectively while
0
10
20
30
40
50
60
70
80
90
T1 T2 T3 T4 T5
TA
(%
DP
PH
)
Treatments
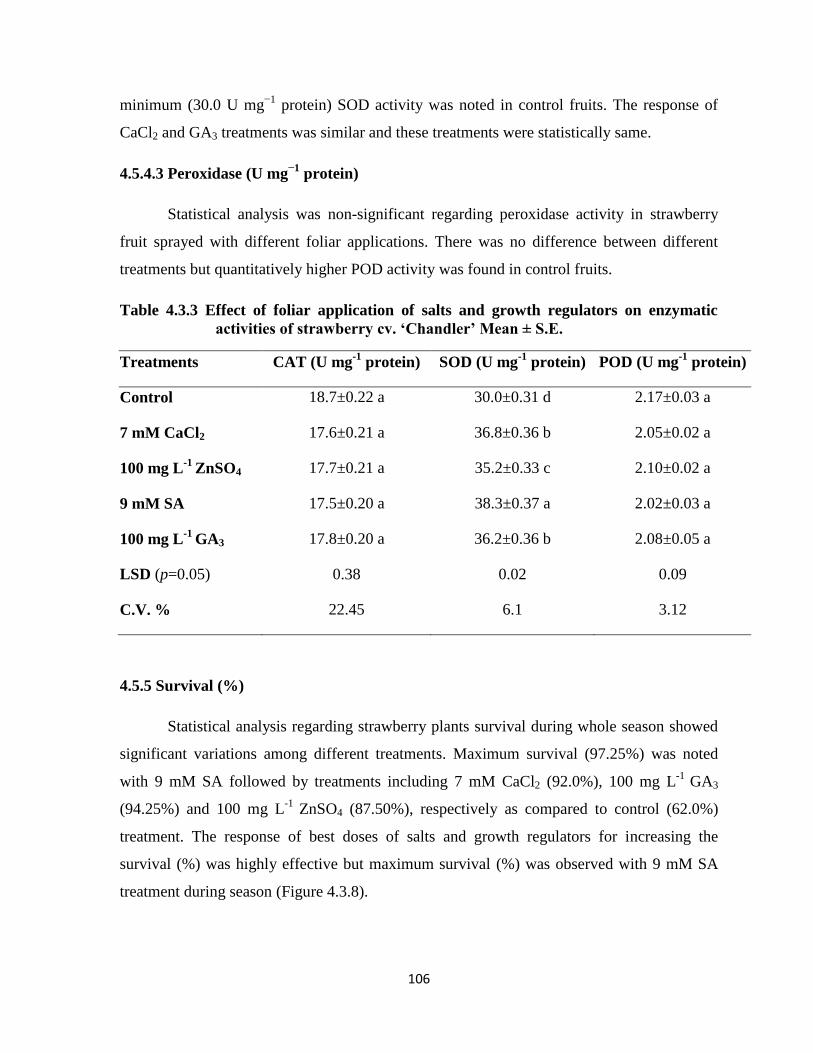
106
minimum (30.0 U mg−1
protein) SOD activity was noted in control fruits. The response of
CaCl2 and GA3 treatments was similar and these treatments were statistically same.
4.5.4.3 Peroxidase (U mg−1
protein)
Statistical analysis was non-significant regarding peroxidase activity in strawberry
fruit sprayed with different foliar applications. There was no difference between different
treatments but quantitatively higher POD activity was found in control fruits.
Table 4.3.3 Effect of foliar application of salts and growth regulators on enzymatic
activities of strawberry cv. ‘Chandler’ Mean ± S.E.
Treatments CAT (U mg-1
protein) SOD (U mg-1
protein) POD (U mg-1
protein)
Control 18.7±0.22 a 30.0±0.31 d 2.17±0.03 a
7 mM CaCl2 17.6±0.21 a 36.8±0.36 b 2.05±0.02 a
100 mg L-1
ZnSO4 17.7±0.21 a 35.2±0.33 c 2.10±0.02 a
9 mM SA 17.5±0.20 a 38.3±0.37 a 2.02±0.03 a
100 mg L-1
GA3 17.8±0.20 a 36.2±0.36 b 2.08±0.05 a
LSD (p=0.05) 0.38 0.02 0.09
C.V. % 22.45 6.1 3.12
4.5.5 Survival (%)
Statistical analysis regarding strawberry plants survival during whole season showed
significant variations among different treatments. Maximum survival (97.25%) was noted
with 9 mM SA followed by treatments including 7 mM CaCl2 (92.0%), 100 mg L-1
GA3
(94.25%) and 100 mg L-1
ZnSO4 (87.50%), respectively as compared to control (62.0%)
treatment. The response of best doses of salts and growth regulators for increasing the
survival (%) was highly effective but maximum survival (%) was observed with 9 mM SA
treatment during season (Figure 4.3.8).
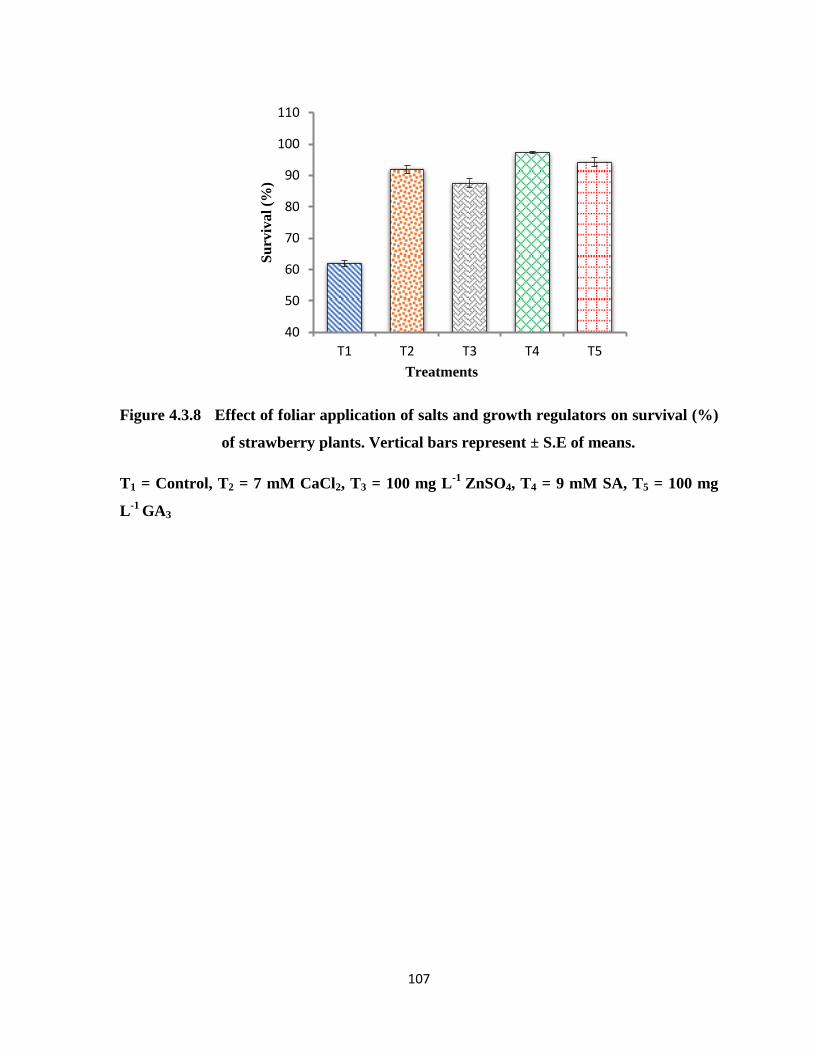
107
Figure 4.3.8 Effect of foliar application of salts and growth regulators on survival (%)
of strawberry plants. Vertical bars represent ± S.E of means.
T1 = Control, T2 = 7 mM CaCl2, T3 = 100 mg L-1
ZnSO4, T4 = 9 mM SA, T5 = 100 mg
L-1
GA3
40
50
60
70
80
90
100
110
T1 T2 T3 T4 T5
Su
rviv
al
(%)
Treatments
108
4.3 Discussion
Foliar application of salts and growth regulators play important role for increasing the
vegetative growth (canopy spreading, crowns, runner growth and leaf area), maximize the
nutritional value and yield of strawberry (Qureshi et al., 2013).
In current study previous year best treatments including 7 mM CaCl2, 100 mg L-1
ZnSO4, 9 mM SA and 100 mg L-1
GA3 from each experiment along with control were
compared each other to check their effects on vegetative, yield and quality parameters of
strawberry. Increasing trend was observed regarding vegetative growth affected by different
salts and growth regulators. Maximum leaves (21.25 plant-1
) and leaf area (61.75 cm2) was
exhibited with 100 mg L-1
GA3 as compared to other treatments. Leaf growth was increased
because GA3 promoted rapid cell division process and also increased cell elongation activity
in strawberry plants (Turner, 1963). Flower initiation was earlier in all treatments except
control plants and minimum numbers of days (15.50) were required when plants were
sprayed with 100 mg L-1
GA3. Maximum number of crowns (8.0 plant-1
) and runners (11.0
plant-1
) were observed in those strawberry plants sprayed with 100 mg L-1
GA3. Overall
vegetative growth was significantly increased with all foliar sprays but GA3 (100 mg L-1
)
showed the superiority for increasing the vegetative growth as compared to other treatments.
Our results proved that previous year best treatments of salts and growth regulators
significantly increased the marketable yield when again compared during next year.
Maximum (494.0 g plant-1
) marketable yield was noted with 9 mM SA foliar spray as
compared to other treatments. Unmarketable yield was minimum in all foliar applied
treatments as compared to control. Maximum (80.0 g plant-1
) small size yield was noted with
control plants as compared to treated plants during growing season. Salicylic acid improved
yield, it is because of SA acted as potential molecule for activating the defense mechanism of
plant against any pathogen attack by creating systemic acquired resistance in whole plant
body for further spreading of disease (Tsuda et al., 2008). Our results concluded that
strawberry fruits were more firm where plants were sprayed with different concentrations of
salts and growth regulators. Maximum firmness value (0.97 kg. cm-2
) was observed in those
strawberry fruits where plants were sprayed with 7 mM CaCl2 as compared to other
treatments. Calcium chloride improved firmness it could be due to calcium is major
109
component of pectin which improved the inflexibility of fruit cell wall and membrane
rigidity (Sams, 1999; Maas, 1998).
In current study strawberry quality attributes were improved with 9 mM SA as
compared to other treatments. Maximum TSS (8.48 ºBrix) contents were observed with 9
mM SA. Increasing trend relating to TSS contents was observed in all fruits where
strawberry plants were sprayed with different concentrations of salts and growth regulators.
Acid contents were found non-significant while TSS: Acid ratio was maximum with 9 mM
SA as compared to other treatments. Increment in TSS contents could be due to accumulation
of sucrose in fruit during development process which increased the activity of sucrose
phosphate synthase due to that activity acid contents decreased and TSS increased
(Srivastava and Dwivedi, 2000; Hubbard et al., 1991).
Higher vitamin C contents increased the fruit nutritional value and maximum (57.72
mg 100 g-1
) vitamin C contents were observed with 9 mM SA as compared to other
treatments. It could be due to salicylic acid application reduced degradation of vitamin C
contents of strawberry fruit during ripening by delaying the senescence process and improved
fruit quality (Lolaei et al., 2012). Maximum TPC (191.50 mg GAE 100 g-1
) and TA (76.50%
DPPH) activities were observed from those fruits where strawberry plants were sprayed with
9 mM SA. Other treatments including 7 mM CaCl2, 100 mg L-1
ZnSO4 and 100 mg L-1
GA3
also showed increasing trend regarding TPC and TA activities. Our results regarding TPC
and TA activities increased due to foliar spray of salts and growth regulators similar with
previous findings who reported that SA increased the organic compounds (phenylpropanoid–
flavonoid) synthesis in cornelian cherry fruit and stimulate the accumulation of phenolic
contents and maximum antioxidant activities (Dokhanieh et al., 2013). Enzymatic activities
were also influenced with different foliar applications. Maximum catalase activity was
exhibited in control fruits while minimum activities were observed in those fruits where
strawberry plants were sprayed with different foliar applications. Superoxide dismutase
activity was lowered in control fruits while foliar treatments increased the SOD activity in
strawberry fruit. Peroxidase activity was found lower in those fruits treated with different
foliar sprays while maximum was noticed in control plants. Overall, the effect of different
foliar sprays was highly effective for maintaining the balance between enzymatic activities
110
during growth stages. Activities of different antioxidant enzymes (CAT, POD and SOD)
produced during different growth stages and increased the defense response against ROS
species (Anand et al., 2009). Maximum survival (97.25%) was observed with 9 mM SA as
compared to control (62.0%) plants. In current study the response of previous year best doses
of salts and growth regulators for increasing the survival (%) was highly significant.
4.3 Conclusions
Vegetative growth was increased with different foliar sprays as compared to control
plants. Our results confirmed that maximum leaves, leaf area, crowns and runner
growth was observed with 100 mg L-1
GA3. It was proved that gibberellic acid
response was highly significant for increasing the vegetative growth as compared to
other treatments during whole growing season.
Marketable yield was significantly increased with 9 mM SA foliar spray as compared
to other treatments.
Maximum strawberry firmness was improved with 7 mM CaCl2 foliar spray as
compared to other treatments. Fruit quality was improved with different foliar sprays
but maximum response was observed with 9 mM SA foliar spray.
Overall, it was proved that from all foliar applied treatments 9 mM SA was found
best for increasing the marketable yield, for improving the maximum quality
attributes and extending the survival mechanism of strawberry plants during growing
season.
111
4.4 Study-4
(Postharvest study)
Postharvest application of calcium chloride (CaCl2) and salicylic acid (SA)
maintain the quality and improve storage life of strawberry cv. ‘Chandler’
This experiment was executed to check the effectiveness of CaCl2 and SA for
increasing the shelf life of strawberries. Marketable strawberries were dipped in different
concentrations of CaCl2 and SA solutions for 10 minutes to observe their effects on shelf life
and quality. After dipping strawberries were dried at room temperature then packed in plastic
punnets and stored at 4°C with 80-85% RH. All fruit quality parameters were analyzed
during 0, 3, 6, 9, 12 and 15 days of interval.
4.4.1 Physical Parameters
4.4.1.1 Fruit weight loss (%)
Weight loss (15.08%) was found maximum in control treatment after 15 days while
minimum weight loss (6.08%) was noticed in strawberries treated with 6 mM CaCl2 followed
by other treatments 5 mM SA (6.13%), 4 mM CaCl2 (6.89%), 7 mM SA (7.44%), 2 mM
CaCl2 (7.92%) and 3 mM SA (7.95%), respectively (Table 4.4.1). The response of lower and
medium concentrations of CaCl2 and SA was observed similar after 15 days and these were
statistically same. Results clearly indicated that control treatment showed rapid decline in
weight loss while minor changes were noted in treated fruits. According to results rapid
increment in weight loss was noticed in control treatment but CaCl2 and SA different
concentrations acted as barrier for reducing weight loss. Quantitatively 6 mM CaCl2 showed
the superiority over other treatments for reducing weight loss of strawberries (Figure 4.4.1).
112
4.4.1.2 Fungal decay (%)
Strawberries which were affected due to grey mold or anthracnose fungal disease
were recorded on daily basis (Table 4.4.2). In control treatment decay problem was started
after 6 days while in treated fruits decay problem was minimum during entire storage. Fungal
decay (56.80%) was found maximum in control treatment after 15 days while those fruits
treated with 5 mM SA showed minimum decay (3.50%) followed by other treatments 4 mM
CaCl2 (5.50%), 7 mM SA (6.50%), 6 mM CaCl2 (7.50%), 3 mM SA (8.50%) and 2 mM
CaCl2 (10.50%), respectively. Different concentrations of CaCl2 and SA were performed
effectively to reduce the decay incidence. The response of medium dose of SA (5 mM) for
reducing decay incidence was maximum as compared with other treatments (Figure 4.4.1).
4.4.1.3 Firmness (kg. cm-2
)
Strawberry firmness was decreased during storage but fruits treated with different
doses of CaCl2 and SA maintained fruit firmness during entire storage. After 15 days of
storage maximum strawberry firmness (0.42 kg. cm-2
) was achieved with 6 mM CaCl2
followed by treatments 5 mM SA (0.39 kg. cm-2
), 4 mM CaCl2 (0.37 kg. cm-2
), 7 mM SA
(0.36 kg. cm-2
), 2 mM CaCl2 (0.34 kg. cm-2
) and 3 mM SA (0.32 kg. cm-2
), respectively
(Table 4.4.3). The response of control treatment and lower doses of CaCl2 and SA was non-
significant after 15 days. Interaction effects revealed that maximum decreasing trend in
firmness was observed in all treated fruits after 12 days while in control treatment it was
noted after 6 days. Overall results regarding strawberry firmness suggested that higher dose
of CaCl2 (6 mM) was more effective for maintaining strawberry firmness during storage
(Figure 4.4.1).
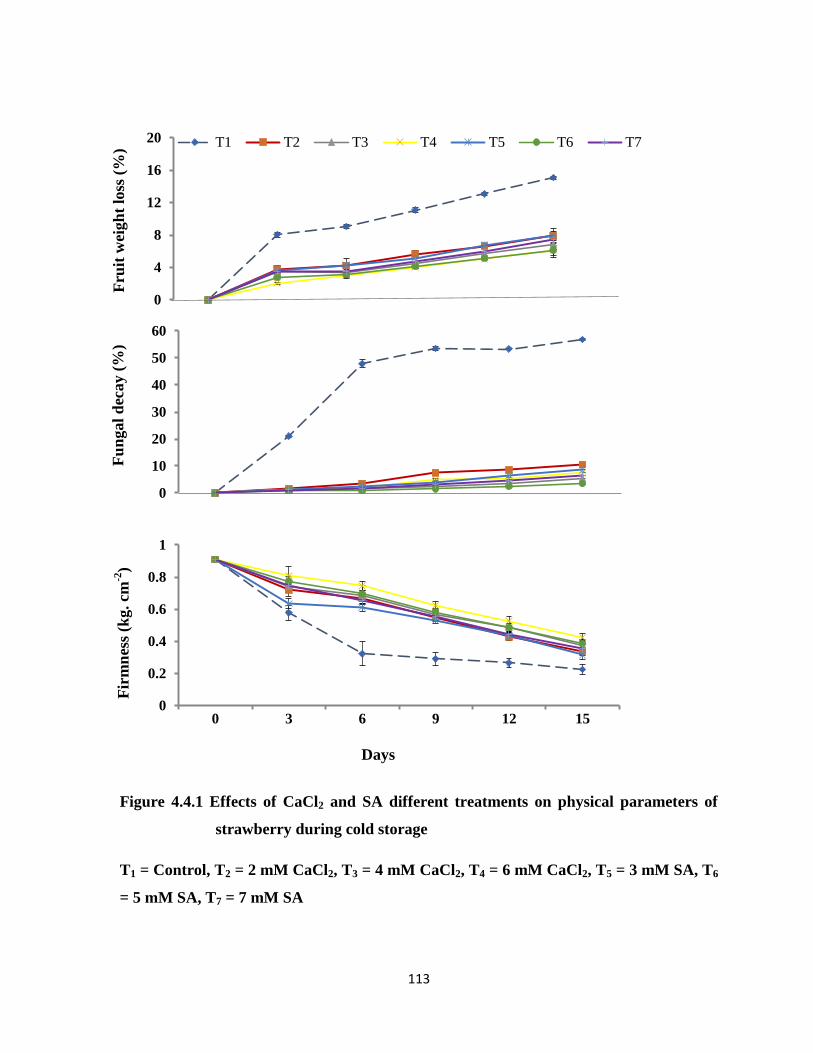
113
Figure 4.4.1 Effects of CaCl2 and SA different treatments on physical parameters of
strawberry during cold storage
T1 = Control, T2 = 2 mM CaCl2, T3 = 4 mM CaCl2, T4 = 6 mM CaCl2, T5 = 3 mM SA, T6
= 5 mM SA, T7 = 7 mM SA
0
4
8
12
16
20 T1 T2 T3 T4 T5 T6 T7
0
10
20
30
40
50
60
0
0.2
0.4
0.6
0.8
1
0 3 6 9 12 15
Days
Fru
it w
eigh
t lo
ss (
%)
F
un
gal
dec
ay (
%)
F
irm
nes
s (k
g. cm
-2)
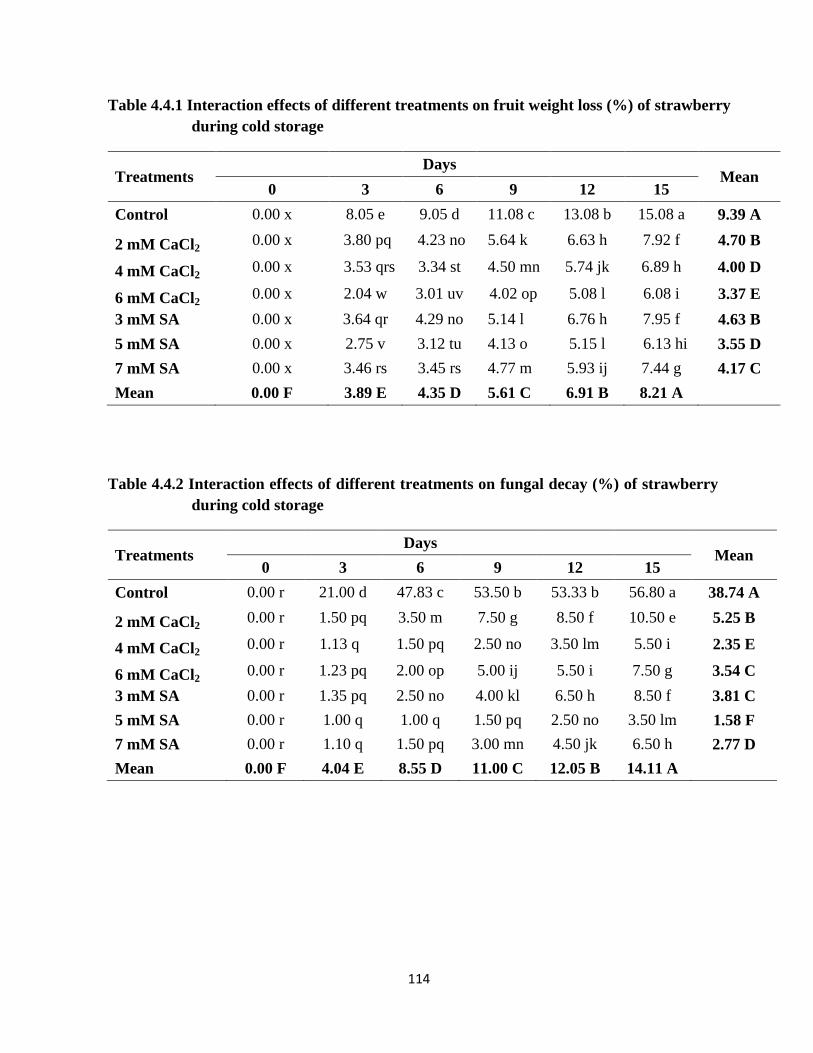
114
Table 4.4.1 Interaction effects of different treatments on fruit weight loss (%) of strawberry
during cold storage
Treatments Days
Mean 0 3 6 9 12 15
Control 0.00 x 8.05 e 9.05 d 11.08 c 13.08 b 15.08 a 9.39 A
2 mM CaCl2 0.00 x 3.80 pq 4.23 no 5.64 k 6.63 h 7.92 f 4.70 B
4 mM CaCl2 0.00 x 3.53 qrs 3.34 st 4.50 mn 5.74 jk 6.89 h 4.00 D
6 mM CaCl2 0.00 x 2.04 w 3.01 uv 4.02 op 5.08 l 6.08 i 3.37 E
3 mM SA 0.00 x 3.64 qr 4.29 no 5.14 l 6.76 h 7.95 f 4.63 B
5 mM SA 0.00 x 2.75 v 3.12 tu 4.13 o 5.15 l 6.13 hi 3.55 D
7 mM SA 0.00 x 3.46 rs 3.45 rs 4.77 m 5.93 ij 7.44 g 4.17 C
Mean 0.00 F 3.89 E 4.35 D 5.61 C 6.91 B 8.21 A
Table 4.4.2 Interaction effects of different treatments on fungal decay (%) of strawberry
during cold storage
Treatments Days
Mean 0 3 6 9 12 15
Control 0.00 r 21.00 d 47.83 c 53.50 b 53.33 b 56.80 a 38.74 A
2 mM CaCl2 0.00 r 1.50 pq 3.50 m 7.50 g 8.50 f 10.50 e 5.25 B
4 mM CaCl2 0.00 r 1.13 q 1.50 pq 2.50 no 3.50 lm 5.50 i 2.35 E
6 mM CaCl2 0.00 r 1.23 pq 2.00 op 5.00 ij 5.50 i 7.50 g 3.54 C
3 mM SA 0.00 r 1.35 pq 2.50 no 4.00 kl 6.50 h 8.50 f 3.81 C
5 mM SA 0.00 r 1.00 q 1.00 q 1.50 pq 2.50 no 3.50 lm 1.58 F
7 mM SA 0.00 r 1.10 q 1.50 pq 3.00 mn 4.50 jk 6.50 h 2.77 D
Mean 0.00 F 4.04 E 8.55 D 11.00 C 12.05 B 14.11 A
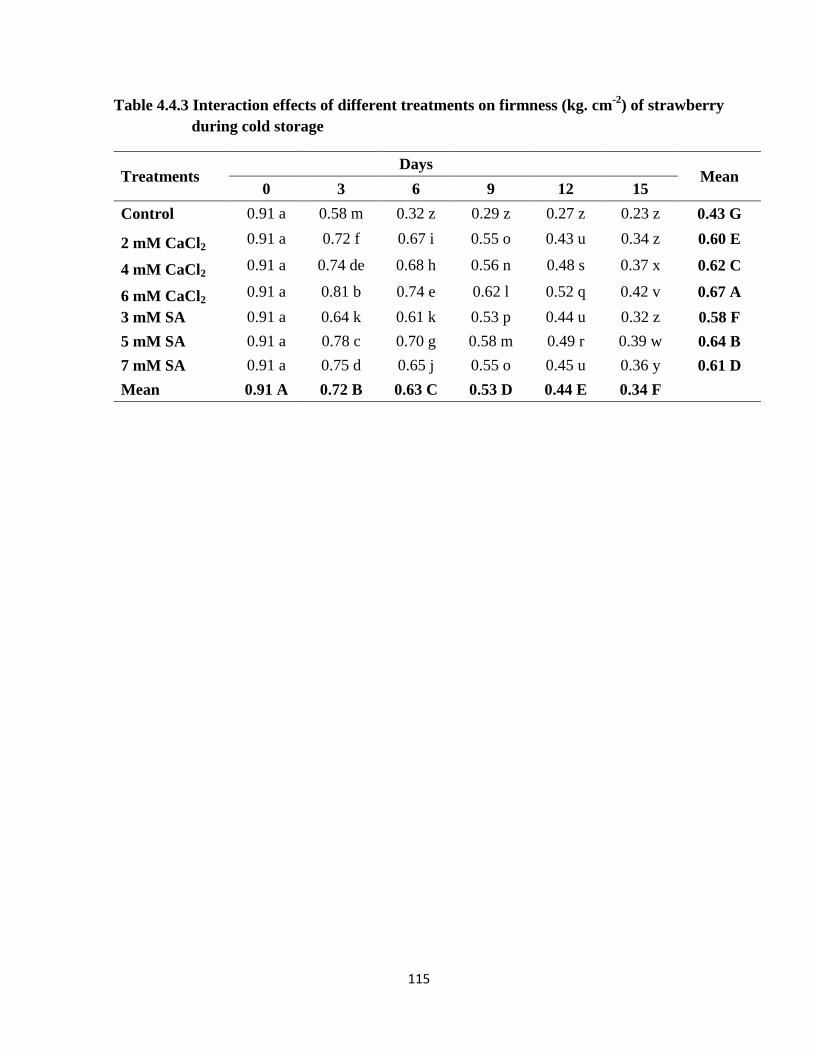
115
Table 4.4.3 Interaction effects of different treatments on firmness (kg. cm-2
) of strawberry
during cold storage
Treatments Days
Mean 0 3 6 9 12 15
Control 0.91 a 0.58 m 0.32 z 0.29 z 0.27 z 0.23 z 0.43 G
2 mM CaCl2 0.91 a 0.72 f 0.67 i 0.55 o 0.43 u 0.34 z 0.60 E
4 mM CaCl2 0.91 a 0.74 de 0.68 h 0.56 n 0.48 s 0.37 x 0.62 C
6 mM CaCl2 0.91 a 0.81 b 0.74 e 0.62 l 0.52 q 0.42 v 0.67 A
3 mM SA 0.91 a 0.64 k 0.61 k 0.53 p 0.44 u 0.32 z 0.58 F
5 mM SA 0.91 a 0.78 c 0.70 g 0.58 m 0.49 r 0.39 w 0.64 B
7 mM SA 0.91 a 0.75 d 0.65 j 0.55 o 0.45 u 0.36 y 0.61 D
Mean 0.91 A 0.72 B 0.63 C 0.53 D 0.44 E 0.34 F
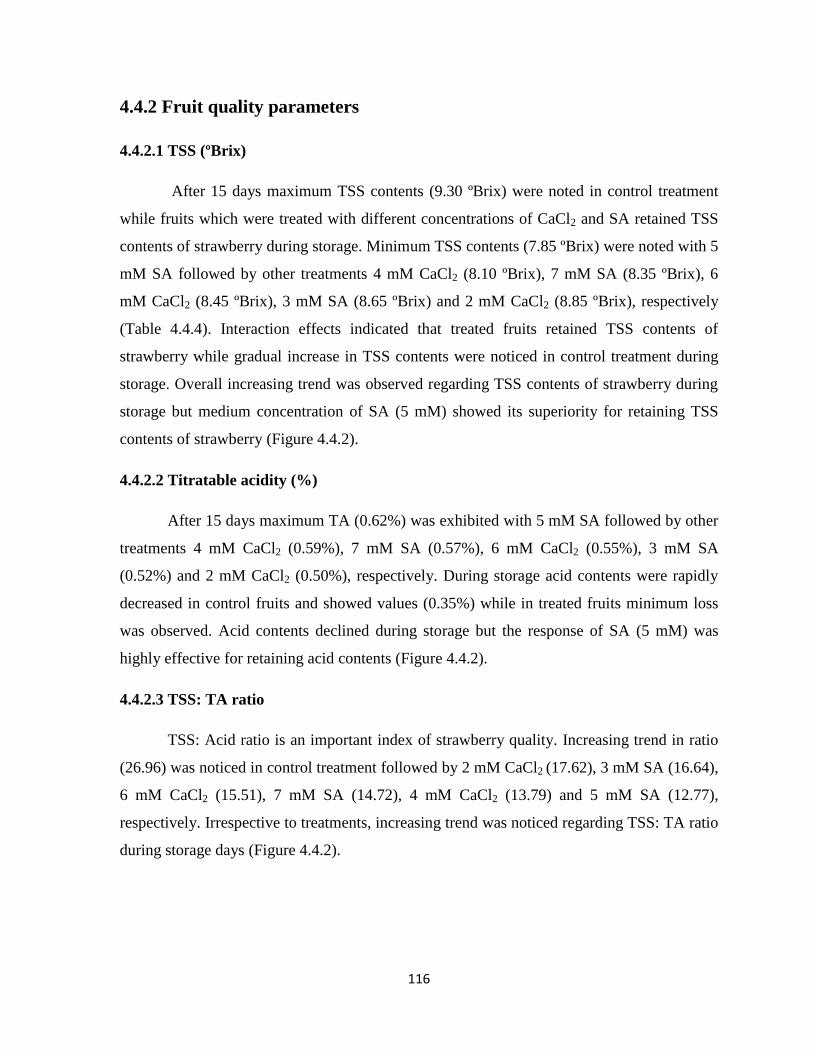
116
4.4.2 Fruit quality parameters
4.4.2.1 TSS (ºBrix)
After 15 days maximum TSS contents (9.30 ºBrix) were noted in control treatment
while fruits which were treated with different concentrations of CaCl2 and SA retained TSS
contents of strawberry during storage. Minimum TSS contents (7.85 ºBrix) were noted with 5
mM SA followed by other treatments 4 mM CaCl2 (8.10 ºBrix), 7 mM SA (8.35 ºBrix), 6
mM CaCl2 (8.45 ºBrix), 3 mM SA (8.65 ºBrix) and 2 mM CaCl2 (8.85 ºBrix), respectively
(Table 4.4.4). Interaction effects indicated that treated fruits retained TSS contents of
strawberry while gradual increase in TSS contents were noticed in control treatment during
storage. Overall increasing trend was observed regarding TSS contents of strawberry during
storage but medium concentration of SA (5 mM) showed its superiority for retaining TSS
contents of strawberry (Figure 4.4.2).
4.4.2.2 Titratable acidity (%)
After 15 days maximum TA (0.62%) was exhibited with 5 mM SA followed by other
treatments 4 mM CaCl2 (0.59%), 7 mM SA (0.57%), 6 mM CaCl2 (0.55%), 3 mM SA
(0.52%) and 2 mM CaCl2 (0.50%), respectively. During storage acid contents were rapidly
decreased in control fruits and showed values (0.35%) while in treated fruits minimum loss
was observed. Acid contents declined during storage but the response of SA (5 mM) was
highly effective for retaining acid contents (Figure 4.4.2).
4.4.2.3 TSS: TA ratio
TSS: Acid ratio is an important index of strawberry quality. Increasing trend in ratio
(26.96) was noticed in control treatment followed by 2 mM CaCl2 (17.62), 3 mM SA (16.64),
6 mM CaCl2 (15.51), 7 mM SA (14.72), 4 mM CaCl2 (13.79) and 5 mM SA (12.77),
respectively. Irrespective to treatments, increasing trend was noticed regarding TSS: TA ratio
during storage days (Figure 4.4.2).
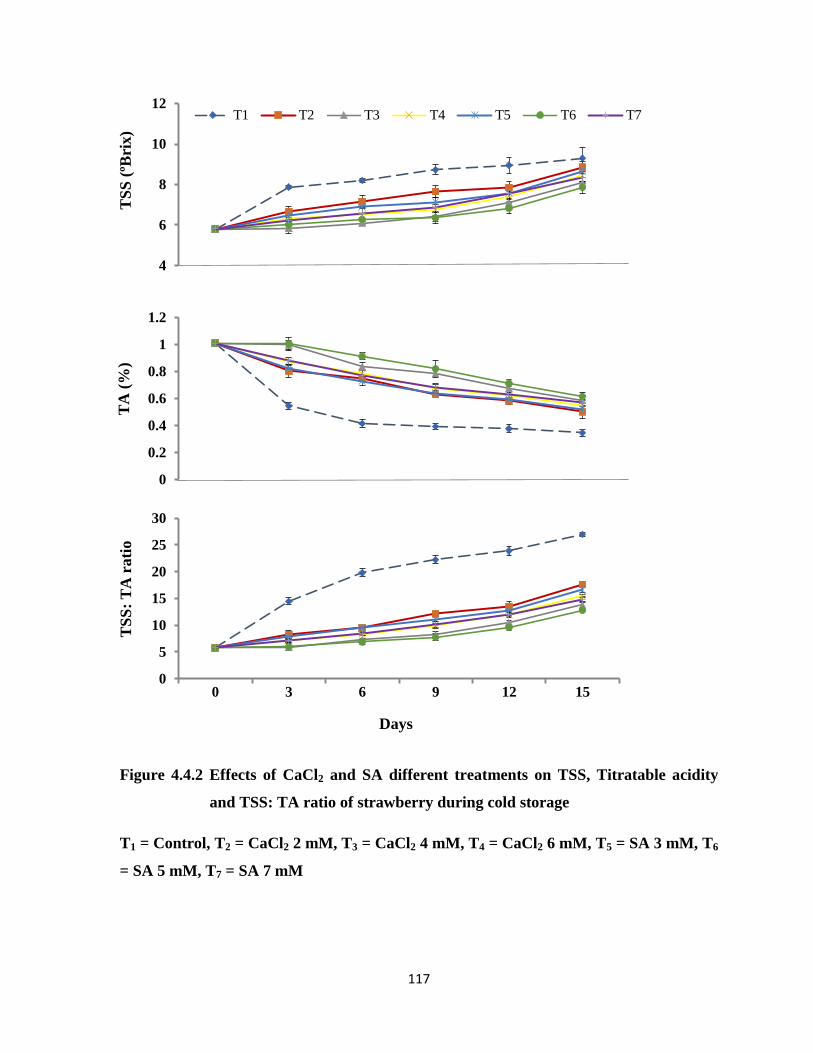
117
Figure 4.4.2 Effects of CaCl2 and SA different treatments on TSS, Titratable acidity
and TSS: TA ratio of strawberry during cold storage
T1 = Control, T2 = CaCl2 2 mM, T3 = CaCl2 4 mM, T4 = CaCl2 6 mM, T5 = SA 3 mM, T6
= SA 5 mM, T7 = SA 7 mM
4
6
8
10
12T1 T2 T3 T4 T5 T6 T7
0
0.2
0.4
0.6
0.8
1
1.2
0
5
10
15
20
25
30
0 3 6 9 12 15
Days
TS
S (
ºBri
x)
T
A (
%)
TS
S:
TA
rati
o
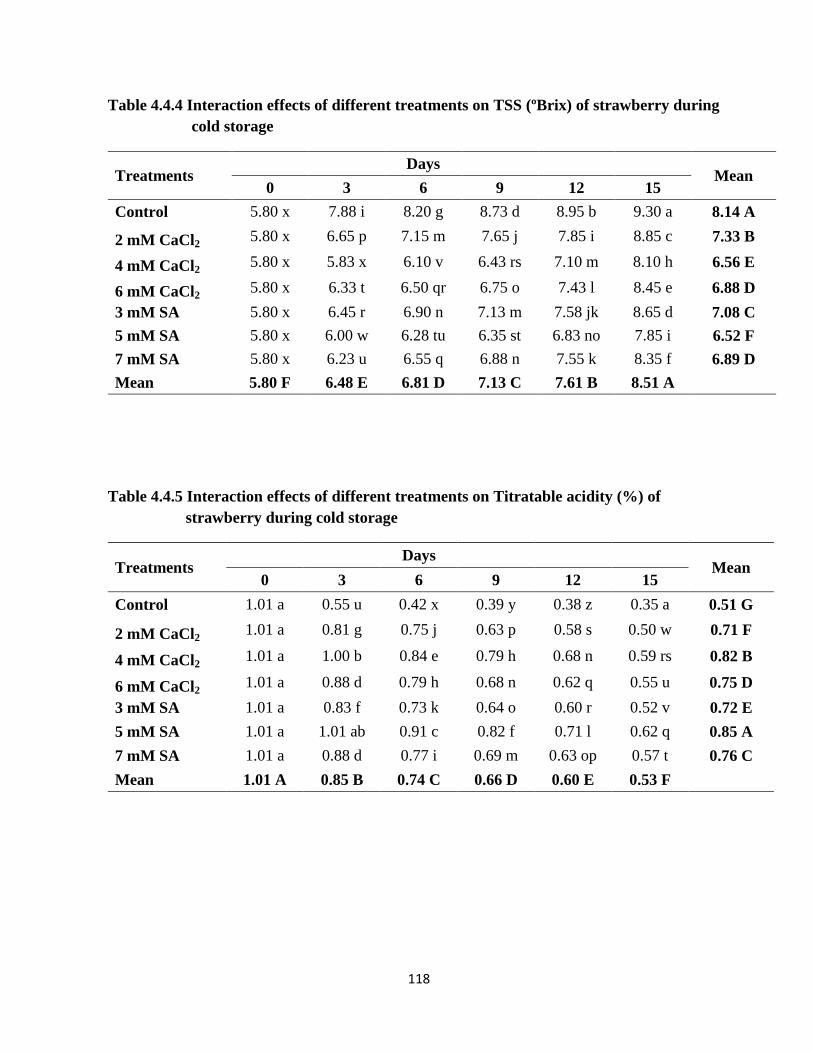
118
Table 4.4.4 Interaction effects of different treatments on TSS (ºBrix) of strawberry during
cold storage
Treatments Days
Mean 0 3 6 9 12 15
Control 5.80 x 7.88 i 8.20 g 8.73 d 8.95 b 9.30 a 8.14 A
2 mM CaCl2 5.80 x 6.65 p 7.15 m 7.65 j 7.85 i 8.85 c 7.33 B
4 mM CaCl2 5.80 x 5.83 x 6.10 v 6.43 rs 7.10 m 8.10 h 6.56 E
6 mM CaCl2 5.80 x 6.33 t 6.50 qr 6.75 o 7.43 l 8.45 e 6.88 D
3 mM SA 5.80 x 6.45 r 6.90 n 7.13 m 7.58 jk 8.65 d 7.08 C
5 mM SA 5.80 x 6.00 w 6.28 tu 6.35 st 6.83 no 7.85 i 6.52 F
7 mM SA 5.80 x 6.23 u 6.55 q 6.88 n 7.55 k 8.35 f 6.89 D
Mean 5.80 F 6.48 E 6.81 D 7.13 C 7.61 B 8.51 A
Table 4.4.5 Interaction effects of different treatments on Titratable acidity (%) of
strawberry during cold storage
Treatments
Days
Mean 0 3 6 9 12 15
Control 1.01 a 0.55 u 0.42 x 0.39 y 0.38 z 0.35 a 0.51 G
2 mM CaCl2 1.01 a 0.81 g 0.75 j 0.63 p 0.58 s 0.50 w 0.71 F
4 mM CaCl2 1.01 a 1.00 b 0.84 e 0.79 h 0.68 n 0.59 rs 0.82 B
6 mM CaCl2 1.01 a 0.88 d 0.79 h 0.68 n 0.62 q 0.55 u 0.75 D
3 mM SA 1.01 a 0.83 f 0.73 k 0.64 o 0.60 r 0.52 v 0.72 E
5 mM SA 1.01 a 1.01 ab 0.91 c 0.82 f 0.71 l 0.62 q 0.85 A
7 mM SA 1.01 a 0.88 d 0.77 i 0.69 m 0.63 op 0.57 t 0.76 C
Mean 1.01 A 0.85 B 0.74 C 0.66 D 0.60 E 0.53 F
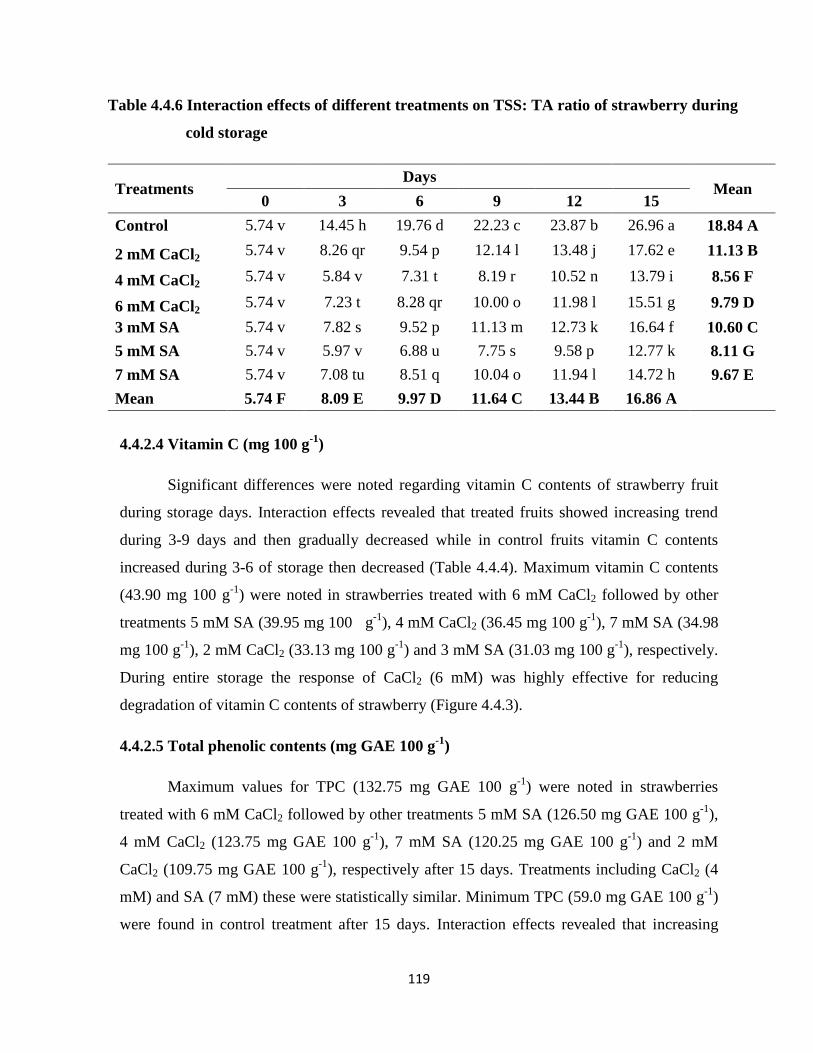
119
Table 4.4.6 Interaction effects of different treatments on TSS: TA ratio of strawberry during
cold storage
Treatments Days
Mean 0 3 6 9 12 15
Control 5.74 v 14.45 h 19.76 d 22.23 c 23.87 b 26.96 a 18.84 A
2 mM CaCl2 5.74 v 8.26 qr 9.54 p 12.14 l 13.48 j 17.62 e 11.13 B
4 mM CaCl2 5.74 v 5.84 v 7.31 t 8.19 r 10.52 n 13.79 i 8.56 F
6 mM CaCl2 5.74 v 7.23 t 8.28 qr 10.00 o 11.98 l 15.51 g 9.79 D
3 mM SA 5.74 v 7.82 s 9.52 p 11.13 m 12.73 k 16.64 f 10.60 C
5 mM SA 5.74 v 5.97 v 6.88 u 7.75 s 9.58 p 12.77 k 8.11 G
7 mM SA 5.74 v 7.08 tu 8.51 q 10.04 o 11.94 l 14.72 h 9.67 E
Mean 5.74 F 8.09 E 9.97 D 11.64 C 13.44 B 16.86 A
4.4.2.4 Vitamin C (mg 100 g-1
)
Significant differences were noted regarding vitamin C contents of strawberry fruit
during storage days. Interaction effects revealed that treated fruits showed increasing trend
during 3-9 days and then gradually decreased while in control fruits vitamin C contents
increased during 3-6 of storage then decreased (Table 4.4.4). Maximum vitamin C contents
(43.90 mg 100 g-1
) were noted in strawberries treated with 6 mM CaCl2 followed by other
treatments 5 mM SA (39.95 mg 100 g-1
), 4 mM CaCl2 (36.45 mg 100 g-1
), 7 mM SA (34.98
mg 100 g-1
), 2 mM CaCl2 (33.13 mg 100 g-1
) and 3 mM SA (31.03 mg 100 g-1
), respectively.
During entire storage the response of CaCl2 (6 mM) was highly effective for reducing
degradation of vitamin C contents of strawberry (Figure 4.4.3).
4.4.2.5 Total phenolic contents (mg GAE 100 g-1
)
Maximum values for TPC (132.75 mg GAE 100 g-1
) were noted in strawberries
treated with 6 mM CaCl2 followed by other treatments 5 mM SA (126.50 mg GAE 100 g-1
),
4 mM CaCl2 (123.75 mg GAE 100 g-1
), 7 mM SA (120.25 mg GAE 100 g-1
) and 2 mM
CaCl2 (109.75 mg GAE 100 g-1
), respectively after 15 days. Treatments including CaCl2 (4
mM) and SA (7 mM) these were statistically similar. Minimum TPC (59.0 mg GAE 100 g-1
)
were found in control treatment after 15 days. Interaction effects revealed that increasing
120
trend was observed in treated fruits regarding TPC during 3-9 days while in control fruits it
was noticed during 3-6 days then gradually decreased (Table 4.4.8). From results it was
observed that CaCl2 (6 mM) was highly effective for retaining maximum TPC during storage
(Figure 4.4.3).
4.4.2.6 Total antioxidants (% DPPH)
After 15 days maximum antioxidant activities (39.0% DPPH) were noted in
strawberries treated with 5 mM SA followed by other treatments 7 mM SA (36.50% DPPH),
4 mM CaCl2 (35.50% DPPH), 6 mM CaCl2 (33.25% DPPH), 3 mM SA (32.50% DPPH) and
2 mM CaCl2 (31.25% DPPH), respectively. The response of control treatment and lower
doses of SA and CaCl2 was similar after 15 days and these treatments were statistically same.
Interaction effects revealed that antioxidant activity of all treated strawberry fruits increased
during 3-9 days and then gradually decreased while in control fruits increasing trend was
observed during 3-6 days then decreased (Table 4.4.9). Minimum antioxidant activities
(28.75% DPPH) were noticed in control treatment during entire storage and after 15 days.
Medium dose of SA (5 mM) retained more antioxidant activities as compared with other
treatments (Figure 4.4.3).
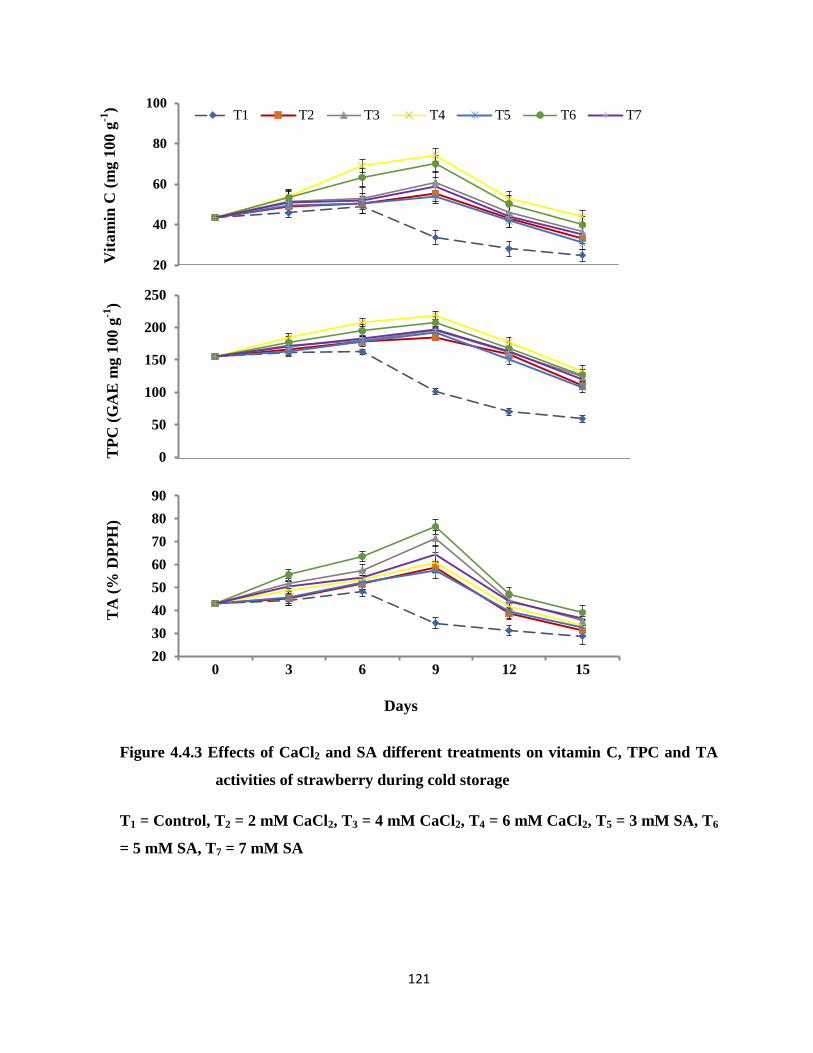
121
Figure 4.4.3 Effects of CaCl2 and SA different treatments on vitamin C, TPC and TA
activities of strawberry during cold storage
T1 = Control, T2 = 2 mM CaCl2, T3 = 4 mM CaCl2, T4 = 6 mM CaCl2, T5 = 3 mM SA, T6
= 5 mM SA, T7 = 7 mM SA
20
40
60
80
100T1 T2 T3 T4 T5 T6 T7
0
50
100
150
200
250
20
30
40
50
60
70
80
90
0 3 6 9 12 15
Days
Vit
am
in C
(m
g 1
00 g
-1)
T
PC
(G
AE
mg 1
00 g
-1)
T
A (
% D
PP
H)
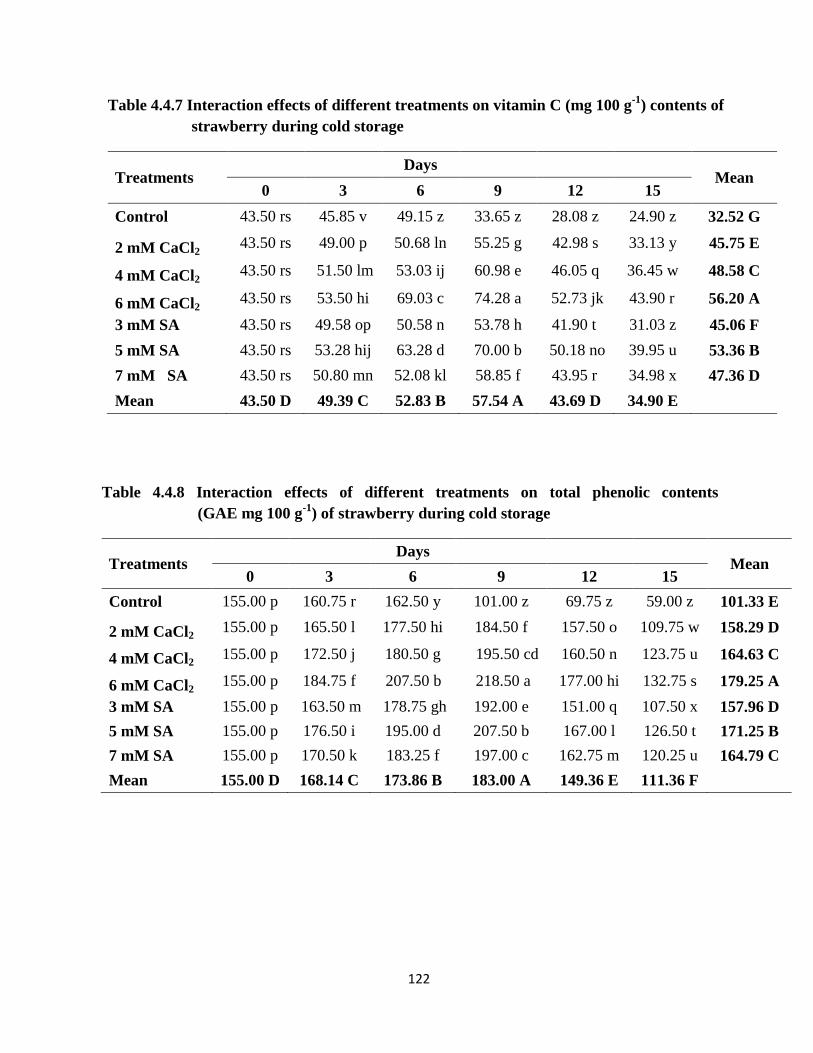
122
Table 4.4.7 Interaction effects of different treatments on vitamin C (mg 100 g-1
) contents of
strawberry during cold storage
Treatments Days
Mean 0 3 6 9 12 15
Control 43.50 rs 45.85 v 49.15 z 33.65 z 28.08 z 24.90 z 32.52 G
2 mM CaCl2 43.50 rs 49.00 p 50.68 ln 55.25 g 42.98 s 33.13 y 45.75 E
4 mM CaCl2 43.50 rs 51.50 lm 53.03 ij 60.98 e 46.05 q 36.45 w 48.58 C
6 mM CaCl2 43.50 rs 53.50 hi 69.03 c 74.28 a 52.73 jk 43.90 r 56.20 A
3 mM SA 43.50 rs 49.58 op 50.58 n 53.78 h 41.90 t 31.03 z 45.06 F
5 mM SA 43.50 rs 53.28 hij 63.28 d 70.00 b 50.18 no 39.95 u 53.36 B
7 mM SA 43.50 rs 50.80 mn 52.08 kl 58.85 f 43.95 r 34.98 x 47.36 D
Mean 43.50 D 49.39 C 52.83 B 57.54 A 43.69 D 34.90 E
Table 4.4.8 Interaction effects of different treatments on total phenolic contents
(GAE mg 100 g-1
) of strawberry during cold storage
Treatments
Days
Mean 0 3 6 9 12 15
Control 155.00 p 160.75 r 162.50 y 101.00 z 69.75 z 59.00 z 101.33 E
2 mM CaCl2 155.00 p 165.50 l 177.50 hi 184.50 f 157.50 o 109.75 w 158.29 D
4 mM CaCl2 155.00 p 172.50 j 180.50 g 195.50 cd 160.50 n 123.75 u 164.63 C
6 mM CaCl2 155.00 p 184.75 f 207.50 b 218.50 a 177.00 hi 132.75 s 179.25 A
3 mM SA 155.00 p 163.50 m 178.75 gh 192.00 e 151.00 q 107.50 x 157.96 D
5 mM SA 155.00 p 176.50 i 195.00 d 207.50 b 167.00 l 126.50 t 171.25 B
7 mM SA 155.00 p 170.50 k 183.25 f 197.00 c 162.75 m 120.25 u 164.79 C
Mean 155.00 D 168.14 C 173.86 B 183.00 A 149.36 E 111.36 F
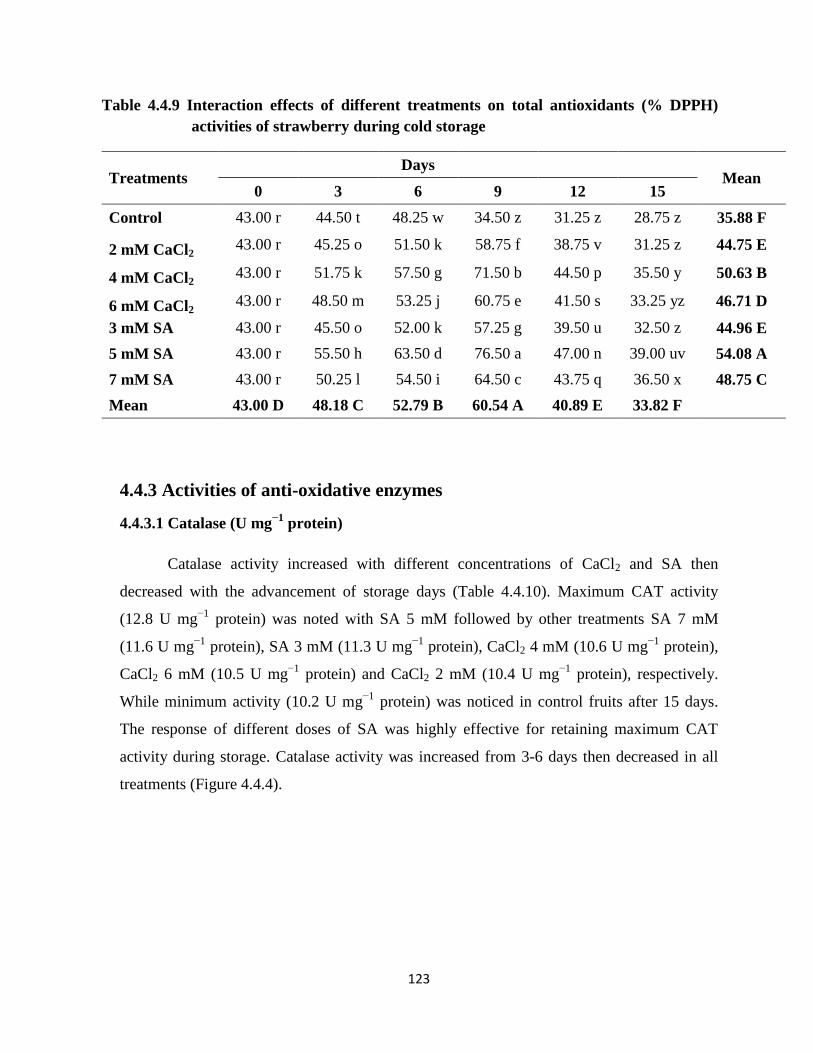
123
Table 4.4.9 Interaction effects of different treatments on total antioxidants (% DPPH)
activities of strawberry during cold storage
Treatments
Days
Mean 0 3 6 9 12 15
Control 43.00 r 44.50 t 48.25 w 34.50 z 31.25 z 28.75 z 35.88 F
2 mM CaCl2 43.00 r 45.25 o 51.50 k 58.75 f 38.75 v 31.25 z 44.75 E
4 mM CaCl2 43.00 r 51.75 k 57.50 g 71.50 b 44.50 p 35.50 y 50.63 B
6 mM CaCl2 43.00 r 48.50 m 53.25 j 60.75 e 41.50 s 33.25 yz 46.71 D
3 mM SA 43.00 r 45.50 o 52.00 k 57.25 g 39.50 u 32.50 z 44.96 E
5 mM SA 43.00 r 55.50 h 63.50 d 76.50 a 47.00 n 39.00 uv 54.08 A
7 mM SA 43.00 r 50.25 l 54.50 i 64.50 c 43.75 q 36.50 x 48.75 C
Mean 43.00 D 48.18 C 52.79 B 60.54 A 40.89 E 33.82 F
4.4.3 Activities of anti-oxidative enzymes
4.4.3.1 Catalase (U mg−1
protein)
Catalase activity increased with different concentrations of CaCl2 and SA then
decreased with the advancement of storage days (Table 4.4.10). Maximum CAT activity
(12.8 U mg−1
protein) was noted with SA 5 mM followed by other treatments SA 7 mM
(11.6 U mg−1
protein), SA 3 mM (11.3 U mg−1
protein), CaCl2 4 mM (10.6 U mg−1
protein),
CaCl2 6 mM (10.5 U mg−1
protein) and CaCl2 2 mM (10.4 U mg−1
protein), respectively.
While minimum activity (10.2 U mg−1
protein) was noticed in control fruits after 15 days.
The response of different doses of SA was highly effective for retaining maximum CAT
activity during storage. Catalase activity was increased from 3-6 days then decreased in all
treatments (Figure 4.4.4).
124
4.4.3.2 Superoxide dismutase (U mg−1
protein)
Strawberry fruits treated with 5 mM SA exhibited maximum SOD activity (24.3 U
mg−1
protein) followed by treatments 7 mM SA (23.2 U mg−1
protein), 4 mM CaCl2 (21.3 U
mg−1
protein), 6 mM CaCl2 (19.2 U mg−1
protein), 3 mM SA (18.2 U mg−1
protein) and 2
mM CaCl2 (17.2 U mg−1
protein), respectively after 15 days (Table 4.4.11). Maximum
decline in SOD activity was noted in control treatment during entire storage. Increasing trend
regarding SOD activity was observed from 3-6 days of storage then decreased. From results
it was concluded that SA (5 mM) dipping application showed the superiority over all
treatments for retaining maximum SOD activity (Figure 4.4.4).
4.4.3.3 Peroxidase (U mg−1
protein)
Maximum POD activity (0.39 U mg−1
protein) was exhibited with 5 mM SA after 15
days followed by other treatments 4 mM CaCl2 (0.35 U mg−1
protein), 7 mM SA (0.29 U
mg−1
protein), 6 mM CaCl2 (0.28 U mg−1
protein), 3 mM SA (0.26 U mg−1
protein) and 2
mM CaCl2 (0.26 U mg−1
protein), respectively (Table 4.4.12). Fruits treated with lower doses
of SA (3 mM) and CaCl2 (2 mM) were statistically same. Peroxidase activity was increased
in treated fruits during 3-6 days while in control fruits increasing trend was observed from 0-
3 days. Different doses of CaCl2 and SA retained POD activity during storage while in
control fruits minimum activity (0.15 U mg−1
protein) was observed after 15 days. From
results it was observed that medium concentration of SA (5 mM) retained maximum POD
activity in strawberry fruits during 15 days of storage (Figure 4.4.4).
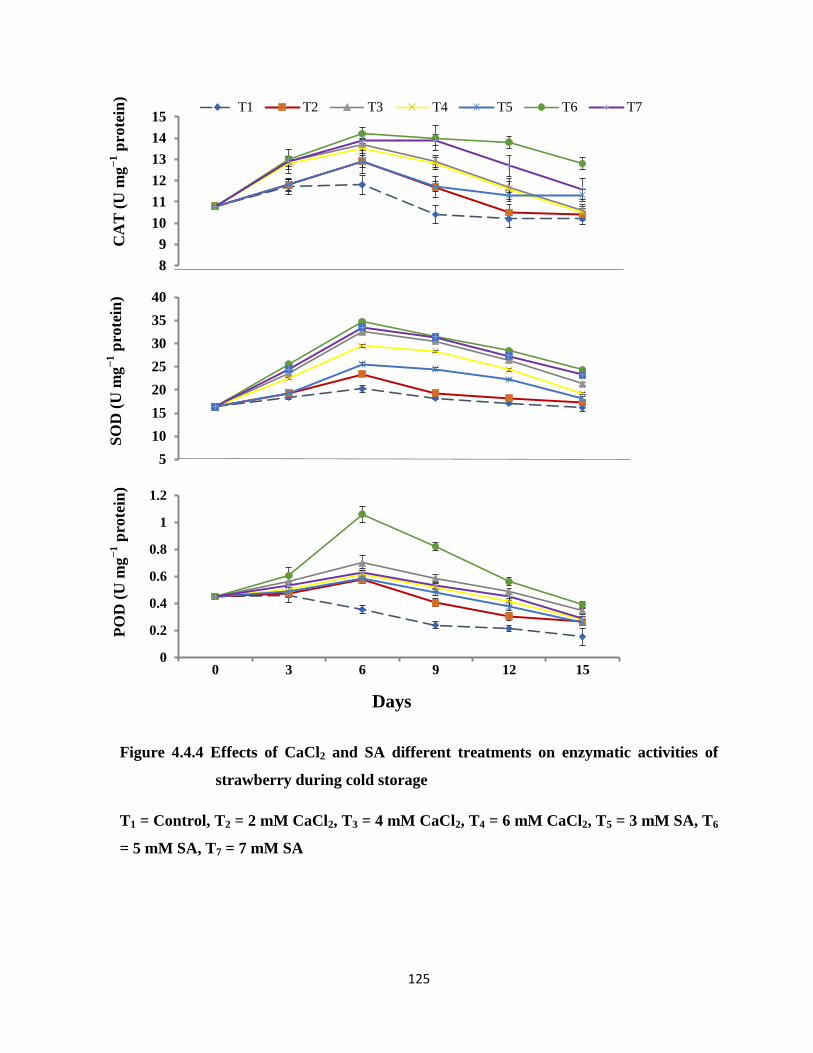
125
Figure 4.4.4 Effects of CaCl2 and SA different treatments on enzymatic activities of
strawberry during cold storage
T1 = Control, T2 = 2 mM CaCl2, T3 = 4 mM CaCl2, T4 = 6 mM CaCl2, T5 = 3 mM SA, T6
= 5 mM SA, T7 = 7 mM SA
8
9
10
11
12
13
14
15T1 T2 T3 T4 T5 T6 T7
5
10
15
20
25
30
35
40
0
0.2
0.4
0.6
0.8
1
1.2
0 3 6 9 12 15
C
AT
(U
mg
−1 p
rote
in)
S
OD
(U
mg
−1 p
rote
in)
P
OD
(U
mg
−1 p
rote
in)
Days
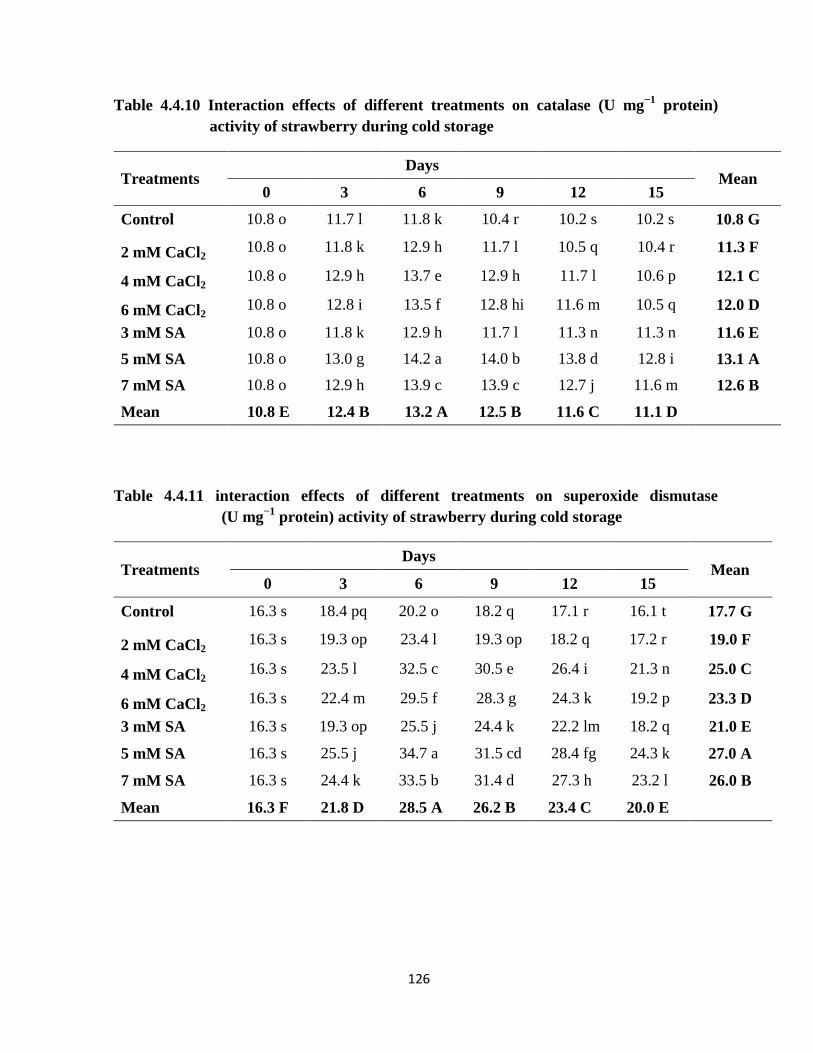
126
Table 4.4.10 Interaction effects of different treatments on catalase (U mg−1
protein)
activity of strawberry during cold storage
Treatments
Days
Mean 0 3 6 9 12 15
Control 10.8 o 11.7 l 11.8 k 10.4 r 10.2 s 10.2 s 10.8 G
2 mM CaCl2 10.8 o 11.8 k 12.9 h 11.7 l 10.5 q 10.4 r 11.3 F
4 mM CaCl2 10.8 o 12.9 h 13.7 e 12.9 h 11.7 l 10.6 p 12.1 C
6 mM CaCl2 10.8 o 12.8 i 13.5 f 12.8 hi 11.6 m 10.5 q 12.0 D
3 mM SA 10.8 o 11.8 k 12.9 h 11.7 l 11.3 n 11.3 n 11.6 E
5 mM SA 10.8 o 13.0 g 14.2 a 14.0 b 13.8 d 12.8 i 13.1 A
7 mM SA 10.8 o 12.9 h 13.9 c 13.9 c 12.7 j 11.6 m 12.6 B
Mean 10.8 E 12.4 B 13.2 A 12.5 B 11.6 C 11.1 D
Table 4.4.11 interaction effects of different treatments on superoxide dismutase
(U mg−1
protein) activity of strawberry during cold storage
Treatments
Days
Mean 0 3 6 9 12 15
Control 16.3 s 18.4 pq 20.2 o 18.2 q 17.1 r 16.1 t 17.7 G
2 mM CaCl2 16.3 s 19.3 op 23.4 l 19.3 op 18.2 q 17.2 r 19.0 F
4 mM CaCl2 16.3 s 23.5 l 32.5 c 30.5 e 26.4 i 21.3 n 25.0 C
6 mM CaCl2 16.3 s 22.4 m 29.5 f 28.3 g 24.3 k 19.2 p 23.3 D
3 mM SA 16.3 s 19.3 op 25.5 j 24.4 k 22.2 lm 18.2 q 21.0 E
5 mM SA 16.3 s 25.5 j 34.7 a 31.5 cd 28.4 fg 24.3 k 27.0 A
7 mM SA 16.3 s 24.4 k 33.5 b 31.4 d 27.3 h 23.2 l 26.0 B
Mean 16.3 F 21.8 D 28.5 A 26.2 B 23.4 C 20.0 E
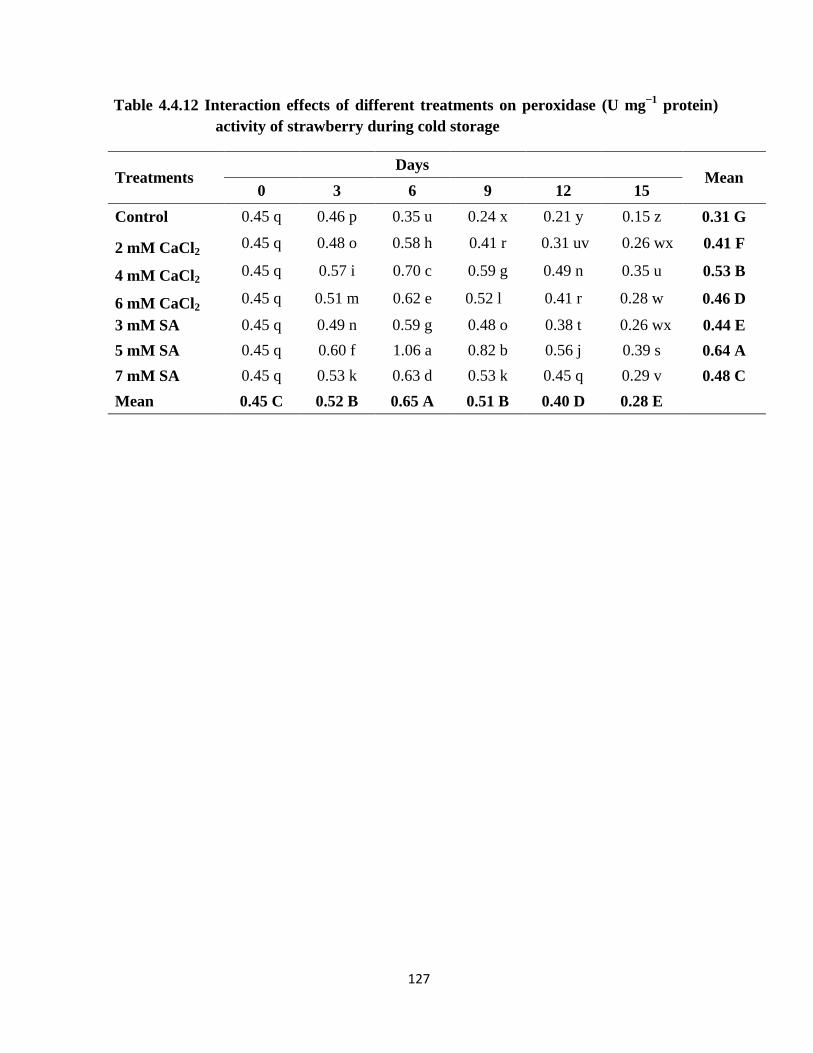
127
Table 4.4.12 Interaction effects of different treatments on peroxidase (U mg−1
protein)
activity of strawberry during cold storage
Treatments Days
Mean 0 3 6 9 12 15
Control 0.45 q 0.46 p 0.35 u 0.24 x 0.21 y 0.15 z 0.31 G
2 mM CaCl2 0.45 q 0.48 o 0.58 h 0.41 r 0.31 uv 0.26 wx 0.41 F
4 mM CaCl2 0.45 q 0.57 i 0.70 c 0.59 g 0.49 n 0.35 u 0.53 B
6 mM CaCl2 0.45 q 0.51 m 0.62 e 0.52 l 0.41 r 0.28 w 0.46 D
3 mM SA 0.45 q 0.49 n 0.59 g 0.48 o 0.38 t 0.26 wx 0.44 E
5 mM SA 0.45 q 0.60 f 1.06 a 0.82 b 0.56 j 0.39 s 0.64 A
7 mM SA 0.45 q 0.53 k 0.63 d 0.53 k 0.45 q 0.29 v 0.48 C
Mean 0.45 C 0.52 B 0.65 A 0.51 B 0.40 D 0.28 E
128
4.4 Discussion
Strawberry is very sensitive fruit crop which requires careful handling and
appropriate management practices to retain fruit quality after harvest. Strawberry fruits
require rapid removal of field heat to extend its shelf life. Low storage temperature (0 to 4ºC)
plays important role for retaining its quality. Short shelf life, fungal decay, weight loss, loss
of brightness and color darkening are major postharvest problems of strawberries (Picha,
2006). Postharvest application of calcium means applying calcium directly on the fruit
surface, which is best method for retaining fruit quality. Calcium applied directly on fruit
surface by dipping method which improves the calcium content in fruit cell wall and due to
which firmness was maintained during storage (Conway et al., 1994). Storage application of
SA also delayed fruit softening, fruit ripening and senescence process due to inhibition of
ethylene process and also beneficial for reduction of fungal decay of strawberries (Zhang et
al., 2010).
In Present study increasing trend in fruit weight loss was noted during storage.
Increment in weight loss (15.08%) was found in control treatment after 15 days while
minimum (6.08%) was noticed with CaCl2 (6 mM) followed by other treated fruits. It could
be due to higher metabolic activity of fruit which occurred due to depletion of moisture from
surface of fruit because of higher transpiration process which still continued during whole
storage (Boynton et al., 2005). According to our results control treatment exhibited rapid
increment in weight loss during entire storage while minor changes in weight loss were noted
from all treated fruits. Our results regarding weight loss (%) of strawberry are also in aid
with Pila et al. (2010) who stated that CaCl2 on fruit surface acted as physical barrier reduced
the rapid metabolic activity due to its anti-senescent properties, so water loss from fruit
surface reduced and shelf life of tomato increased during storage. Bagheri et al. (2014) also
evaluated shelf life and quality of persimmon fruit dipped in different concentrations of
CaCl2 and stored at 0°C for 4 months. Fruit weight loss decreased with CaCl2 treatments
(0.5, 1, and 2%) as compared with control.
Although, strawberry decay is still serious problem which is caused by fungal
pathogens. During last storage interval, control fruits showed maximum decay (56.80%)
problem while minimum decay (3.50%) was estimated with 5 mM SA. Therefore, it was
129
noted from results that different concentrations of CaCl2 and SA effectively minimized the
decay incidence during entire storage. Salicylic acid reduced decay incidence during storage
because it increased the activity of proteins (chitinase and β-1, 3-glucanase) which played
significant role in enhancing defense mechanism in fruits against oxidative damage caused
by ROS species (Meena et al., 2001; Hussain et al., 2015). Our findings regarding SA
minimized decay during storage similar with Baninaiem et al. (2016) who exhibited that
different concentrations of SA (1, 2 and 4 mM) reduced the decay incidence of tomato fruit
when stored at 10°C for 40 days.
Strawberry firmness is a major fruit quality index during storage which was positively
affected by different concentrations of CaCl2 and SA as compared to control treatment.
Strawberry firmness was decreased during storage but treated fruits maintained fruit firmness
during entire storage. After 15 days of storage maximum strawberry firmness (0.67 kg. cm-2
)
was achieved with CaCl2 (6 mM) as compared to other treatments. Firmness decreased
during storage due to higher metabolic activity of strawberries after harvest which caused
more water loss from fruit surface and cells lose their rigidity (Maas, 1998). Our results
regarding firmness suggested that higher dose of CaCl2 (6 mM) was more effective for
maintaining strawberry firmness during storage. It is because of dipping application of
calcium improves the fruit cell wall pectin due to that membrane rigidity and cell structure
maintained during storage (Sams, 1999; Maas, 1998). In some previous studies it was shown
that dipping treatment of CaCl2 2% solution maintained firmness of peaches when stored at
4°C for 2 weeks (Lysiak et al., 2008). In some other studies it was also observed that salt
solution of CaCl2 3% maintained the firmness of nectarines during storage (Manganaris et
al., 2005).
Different doses of CaCl2 and SA effectively maintained the TSS contents of
strawberry during storage. Increment in TSS contents during storage due to higher respiration
process of fruit which converted starch contents into sugars (Avina et al., 2014). During last
storage interval maximum TSS contents were recorded in control fruits while minimum were
observed with SA (5 mM). Our results match with previous findings who stated that SA
application leads to reduction in invertase enzymatic activity and reduced maximum
increment in TSS contents of banana fruit during storage (Srivastava and Dwivedi, 2000).
130
Reduction in acid contents was observed during storage because of acids rapidly converted
into sugars but the response of SA (5 mM) was highly effective for retaining strawberry acid
contents as compared to other treatments. Our findings regarding acid contents of strawberry
similar with previous findings who reported that titratable acidity was more in SA treated
tomatoes as compared to control (Baninaiem et al., 2016). The level of TSS: TA ratio was
found higher among all treatments during storage period however; this increment was more
in control treatment because of maximum reduction in acidity and rapidly increasing TSS
and sugar contents.
According to our findings vitamin C contents reduced during storage. Degradation
process of vitamin C contents during storage due to fluctuation in temperature and higher
metabolic activity of fruit (Silva et al., 2013). Low temperature during storage cause
oxidation of vitamin C contents of fruit (Rapisarda et al., 2008). Maximum vitamin C (43.90
mg 100 g-1
) contents were noted in fruits treated with CaCl2 (6 mM) as compared to other
treatments after 15 days of storage. The reason of decreasing vitamin C during storage due to
reduction in ascorbate peroxidase enzymatic activity but CaCl2 application enhanced the
activity of several catalytic enzymes which played major role in biosynthesis of vitamin C
contents (Kadir, 2014). Our results are also in accordance with Akhtar et al. (2010) who
observed the effects of CaCl2 on storage behavior of loquat cultivar „Surkh‟ which were
dipped in calcium solutions for 2 minutes and then stored at 4°C for 10 weeks. Minimum loss
was observed regarding vitamin C contents when treated with CaCl2 (1% and 2%).
Our results investigated that maximum TPC (132.75 mg GAE 100 g-1
) were noted in
strawberry fruits treated with CaCl2 (6 mM) after 15 days of storage. Phenolic contents
maximize during storage due to low temperature while decrease in TPC due to higher
metabolic activity of fruit (Silva et al., 2013). Our results similar with previous findings
where shelf life and quality of persimmon fruit increased with different concentrations of
CaCl2 (0.5, 1 and 2%) at 0°C for 4 months. Total phenolic contents increased with 2% CaCl2
treatment. Phenolic contents have maximum antioxidant activity against oxidative stress
caused by scavenging free radicals. Phenolic contents reduced with increment in storage days
due to higher enzymatic activity and oxidation process (Bagheri et al., 2014).
131
Antioxidants (enzymatic and non-enzymatic) plays major role in decreasing oxidative
stress in fruits caused by ROS species and also helpful for reducing chronic diseases in
humans (Yamaguchi et al., 1998). Oxidative damage in fruits recovered with antioxidants
like total phenolic contents, flavonoids, anthocyanin‟s and ascorbic acid contents (Kinsella et
al., 1993). Maximum antioxidant activity (39.0% DPPH) was noted with SA (5 mM)
followed by other treated fruits while minimum antioxidant activities (28.75% DPPH) were
noticed in control treatment after 15 days. These results match with previous studies where
SA (1 mM) enhanced the antioxidant capacity of cornelian cherry fruit during storage
(Dokhanieh et al., 2013). Increasing concentration of SA enhanced antioxidant activity in
peach fruit (Tareen et al., 2012).
Antioxidant enzymatic activities (CAT, SOD and POD) play important role in
scavenging ROS species in different parts of cell in response to different stress conditions.
Due to ROS species homeostasis of the cell is disrupted. During stress condition enzymatic
activities which protect the cell structure by scavenging ROS species (Racchi, 2013). In
present study antioxidant enzymatic activities were noticed higher with SA (5 mM) while,
lower trend was noticed in control fruits after 15 days. Enzymatic activities activated the
defense mechanism of plant against biotic and abiotic stresses. Superoxide dismutase is
ubiquitous defensive enzyme which has ability to protect the plant cell from damage during
stress conditions. Catalase and peroxidase enzymatic activities are also responsible for
scavenging ROS species which damage the cells under stress conditions (Racchi, 2013;
Hertwig et al., 1992). However, decreasing trend regarding enzymatic activities due to
interaction with low temperature and higher metabolic activities of strawberries.
132
4.4 Conclusion
Maximum vitamin C contents, TPC, reduction in weight loss and strawberry firmness
was retained with higher concentration of CaCl2 (6 mM). Maximum retention of TSS, acid
contents, total antioxidants and enzymatic activities (CAT, SOD and POD) were found
maximum with SA (5 mM). Overall results showed that CaCl2 (6 mM) and SA (5 mM)
showed the superiority for retaining maximum quality attributes during 15 days of storage as
compared with other treatments.
133
Chapter-5
5.1 SUMMARY
Strawberry (Fragaria × ananassa Duch.) is delicious and sweet flavored small fruit
crop. Strawberry is newly introduced small fruit crop in Pakistan; therefore yield is very less
compared to major producers. Major pre-harvest problems are poor flowering, poor fruit
setting, inadequate nutrient application, lower yield per plant, maturity factors, poor quality,
insect pests, diseases, weeds and climatic changes. Strawberry is very sensitive fruit crop and
storage losses may reach up to 25-40%. Improper harvesting stage, high temperature, short
shelf life, fungal decay, weight loss, loss of brightness and color darkening are major
postharvest problems of strawberry. By knowing pre and postharvest problems and current
situation of strawberry production in Pakistan, present study was planned to explore such pre
and postharvest management practices which increase the marketable yield and improve
quality of strawberries.
Foliar application of CaCl2 in different concentrations was applied at 3-4 leaves stage
and then after fruit setting. In this study 7 mM CaCl2 was found best for increasing the
vegetative growth and survival mechanism during entire strawberry season. Marketable yield
(418.50 g plant
-1) increased with foliar application of 7 mM CaCl2. Unmarketable and small
sized yield was found maximum in control treatment. Fruit quality parameters including
vitamin C (55.69 mg 100 g-1
) and TPC (186.50 mg GAE 100 g-1
) also improved with 7 mM
CaCl2 except TSS contents (8.03 ºBrix) and TSS: Acid ratio (7.63) were found maximum
with 5 mM CaCl2 as compared to higher and lower doses because sometimes higher doses
increased the maximum activity of fruit ripening enzymes due to that some quality attributes
showed declining trend.
In second experiment 100 mg L-1
ZnSO4 was found best for enhancing the vegetative
growth during whole growing season but flower initiation was earlier with higher
concentration of ZnSO4 (150 mg L-1
). Maximum marketable yield (369.0 g plant
-1) and fruit
quality attributes including firmness (0.75 kg. cm-2
), TSS (8.1 ºBrix), vitamin C (53.30 mg
100 g-1
) and TPC (177.5 mg GAE 100 g-1
) were observed maximum with medium dose of
ZnSO4 100 mg L-1
as compared with higher and lower concentrations. However, antioxidant
134
enzymes (CAT, SOD and POD) were observed maximum with 150 mg L-1
ZnSO4. Higher
and lower doses of ZnSO4 were less effective for improving the quality attributes of
strawberry.
In third experiment SA was applied as foliar spray. Maximum marketable yield
(414.25 g plant-1
) was observed from strawberry plants treated with 9 mM SA as compared to
other treatments. Higher application of 9 mM SA was found better for reducing unmarketable
and small size yield. Strawberry quality attributes including firmness (0.94 kg. cm-2
), vitamin
C contents (56.72 mg 100 g-1
) and TPC (191.50 mg GAE 100 g-1
) were also improved with
higher concentration of 9 mM SA but TSS (8.47 ºBrix) and TSS: Acid ratio (11.76) was
increased with medium concentration of 6 mM SA. Overall, it was found that foliar spray of
9 mM SA was highly effective to increase the vegetative growth, marketable yield, quality
attributes and survival mechanism of strawberry plants during season.
In fourth experiment different concentrations of GA3 were applied on growth stages.
Higher dose of 150 mg L-1
GA3 showed the superiority over other doses to enhance the
vegetative growth. While maximum marketable yield and fruit quality was not improved
with higher concentration of 150 mg L-1
GA3. It is because of higher concentration of GA3
caused the maximum increase in cell division activity due to that more utilization of
photosynthetic products in vegetative growth. It might be possible that due to fewer products
fruit quality could not improve. So, this study proved that 100 mg L-1
GA3 increased the
marketable yield (381.50 g plant-1
), improved the TSS (7.85 ºBrix), vitamin C (52.23 mg 100
g-1
) and TPC (181.50 mg 100 g-1
) of strawberry.
Confirmatory trial was performed during next year to compare previous year best
treatments from each experiment and to find out the best treatment. In this experiment 100
mg L-1
GA3 was confirmed for increasing the vegetative growth as compared to other
treatments during whole growing season. Increasing trend was observed regarding
marketable yield (494.0 g plant-1
) with 9 mM SA foliar spray as compared to other
treatments. Unmarketable yield and small size yield was also minimum in treated plants.
Maximum strawberry firmness (0.97 kg. cm-2
) was improved with 7 mM CaCl2 foliar spray
while other quality attributes including TSS (8.48 ºBrix), TSS: TA ratio (11.76), vitamin C
(57.72 mg 100 g-1
), TPC (191.50 mg GAE 100 g-1
) and TA (76.50% DPPH) were improved
135
with 9 mM SA foliar spray. In this study, it can be concluded that 9 mM SA was best for
increasing the marketable yield, for improving the quality attributes and for extending the
survival mechanism of strawberry plants during whole growing season.
Postharvest study was executed to check the effectiveness of CaCl2 and SA different
doses on shelf life and quality attributes of strawberry during 15 days of storage. Maximum
vitamin C contents (43.90 mg 100 g-1
), TPC (132.75 mg GAE 100 g-1
), reduction in weight
loss (6.08%) of strawberries and firmness (0.42 kg. cm-2
) was retained with higher
concentration of CaCl2 (6 mM) dipping application. Higher concentration sometimes less
effective because during storage thick coating on fruit surface reduced gaseous exchange
between external and internal environment of fruit. Minimum TSS (7.85 ºBrix), maximum
retaining of acid contents (0.62%), total antioxidants (39.0% DPPH) and enzymatic activities
were observed with SA (5 mM) as compared with other treatments. In postharvest study it
was confirmed that dipping application of CaCl2 (6 mM) and SA (5 mM) showed the
superiority for retaining maximum quality attributes during 15 days of storage.
136
5.2 Future Recommendations
More work is needed on other strawberry cultivars such as Douglas, Toro,
Pocahontas, Honeyo and Tufts by using salts and growth regulators to increase the
marketable yield and to improve quality attributes.
Strawberry is extremely sensitive crop. So, more work on pre harvest practices such
as time of planting runners, planting density, proper mulching to reduce weeds,
protection from frost through tunnel and proper and timely nutrient application is
needed.
Drip irrigation system with fertilizer application (fertigation) is necessary to improve
the better plant growth and yield because strawberry has small root system. Due to
complex soil chemistry and leaching of nutrients strawberry plants cannot receive
proper nutrients.
Molecular level work is needed to identify those genes which develop resistance in
plants against frost damage and adverse climatic conditions.
From postharvest perspective proper packing material, temperature management and
use of other newly emerging salts and growth regulators need to be explored to
reduce decay incidence and to increase the shelf life of strawberries.
5.3 Recommendation for farmer
Strawberry is highly economic short duration (6 months) crop. By applying proper pre
harvest practices farmer can earn more.
Optimized concentrations of salts (7 mM CaCl2 and 100 mg L-1
ZnSO4) and growth
regulators (9 mM SA and 100 mg L-1
GA3) increase the vegetative growth,
marketable yield and improve the qualitative characteristics of strawberry fruit.
Postharvest dipping application of CaCl2 (6 mM) and SA (5 mM) increase the shelf
life and retain maximum quality attributes of strawberries during 15 days of cold
storage at 4°C.
137
5.4 Study- 5
5.4.1 Six months internship (International Research Support Initiative
Program) at University of Florida, USA supported by Higher
Education commission Islamabad Pakistan.
5.4.2 Introduction about GCREC
Gulf Coast Research and Education Center established in 1925 located in Balm/Wimauma
Florida, United States. In past it was only research laboratory where main focus on to
identify the cause and to develop protection measures for the control of fungi that was
causing major losses in tomato crop. Now days the center is known worldwide for the high
quality research and also for facilitating growers and the industry. Major areas of research are
vegetable, floral, strawberry production and breeding. For high quality strawberry production
different management practices are used which including planting density, different N rates,
mulch color, planting date and plant growth regulators.
5.4.3 Strawberry production in Florida
Major production of strawberries comes from United States with 24,000 hectares of land and
1.4 billion kilograms of strawberries (Brennan et al. 2014). In United States, California and
Florida are two major states for largest strawberry production. California produces all year
around but has major strawberry production during summer season and decreases in winter.
Florida is largest producer of winter strawberries and produce fresh strawberries from
November until late March but from the last few years there is competition between Florida
and Mexico for early production of winter strawberries. Mexico has same production pattern
as Florida and produce all year around but in small volumes. Florida growers want to
produce at the end of November and early December to get higher prices because early
season fruit receives maximum prices (Boriss, 2006).
138
5.4.4 FSHS Proceeding paper presented in (131st annual meeting of Florida
State Horticultural Society)
Optimization of Early-season Nitrogen Fertilization Program for New
Strawberry Cultivar ‘Florida Beauty’
Sana Shahzad1, Tia Silvasy
2 and Shinsuke Agehara
2
1
University of Agriculture, Faisalabad, Pakistan
2Gulf Coast Research and Education Center, University of Florida IFAS, Wimauma, FL 33598
Corresponding author: [email protected]
Additional index words. Fragaria × ananassa Duch., fruit earliness
Abstract
Strawberry (Fragaria × ananassa Duch.) growers in Florida generally apply 168–224 kg of
nitrogen (N) per hectare during the growing season, starting with 1.96–2.24 kg/ha/d during
establishment (e.g. 3 weeks) followed by lower rates at 0.56–1.12 kg/ha/d. The initial high-
dose fertilization is beneficial for improving the establishment of strawberry transplants, but
this practice must be tailored for each cultivar based on its growth characteristics and nutrient
requirements. Major aim of this study was to observe the optimal early-season fertilization
program for „Florida Beauty‟ which is a newly developed early-yielding cultivar. Treatments
were different durations of the high N fertilization at 2.24 kg/ha/d during establishment: 0, 3,
6, and 9 weeks. After these treatment durations, all treatments were subjected to the lower
rate at 1.12 kg/ha/d, providing 149 to 243 kg of N in the entire growing season. Transplants
were planted in the field on Sep. 28, 2017 and harvests were performed 30 times between
Nov. 2, 2017 and Feb. 26, 2018. Extending the high N fertilization duration from 0 to 9
weeks accelerated initial canopy development and increased leaf area by 30% during season.
It also increased the early yield (Nov.–Jan.) by 33% and the total season yield by 28%, while
reducing thrip damage fruit by up to 53% in the entire season. These results suggest that
initial high N fertilization (2.24 kg/ha/d) can be extended slightly longer for „Florida Beauty‟
than for other major cultivars in Florida. Delayed establishment of an ideal canopy size can
result in yield reductions and increased insect damage.
139
Introduction
„Florida Beauty‟ is a newly developed strawberry cultivar which released from University of
Florida in 2017 and originated from a cross between Queensland Australia selection and
„Florida Radiance‟. This cultivar has compact plant growth habit, bright color, low chilling
requirement and excellent fruit quality. The combination of these characteristics makes this
cultivar adaptable to early planting in Florida from 20 Sept. to 1st Oct. (Whitaker et al.,
2017).
Nitrogen is essential component of chlorophyll and plays major role for enhancing vegetative
growth of strawberry plants because chlorophylls allow plants to capture light energy from
the sun and produce carbohydrate molecules in the photosynthesis process. Nitrogen is major
part of plant proteins and also play important role for synthesis of genetic material (DNA and
RNA) (El-Sawy et al., 2012). In strawberry, N is one of the most abundant mineral nutrients,
with the optimal leaf N concentration ranging from 3% to 4% (Hochmuth et al., 1996).
Optimum N fertilization in strawberry produces maximum yield and improves quality. It has
been observed that maximum strawberry yields can be achieved by regular supply of N
irrespective of the N source (Hochmuth and Hanlon, 1999; Simmone et al., 2001). Nitrogen
deficiency caused reductions in total dry biomass and relative growth rate of plant mainly
through decreases in leaf area ratio and plant N contents (Deng and Woodward, 1998).
Increasing N fertilization increases the leaf N contents and promotes the development of
healthy and greener leaves (Albregts and Howard, 1982). Excessive N fertilization can
promote canopy growth (plant spread, leaf number and leaf area) and early marketable yield
but decrease flower production and total marketable yield during season (El-Sawy et al.,
2012).
Current N fertilization practices for increasing strawberry production in Florida are based on
previous studies which included different N sources, fertilizer placement methods, pre-plant
fertilization, and different N fertilization rates (Hochmuth and Hanlon, 1999; Albregts and
Howard, 1982; Agehara et al., 2017). In general, Florida strawberry growers apply 168–224
kg of nitrogen per hectare during the growing season, which starting from 1.96–2.24 kg/ha/d
during establishment (e.g. 3 weeks) followed by lower rates at 0.56–1.12 kg/ha/d (Sangha
and Agehara, 2016). The initial high-dose fertilization is beneficial for improving the
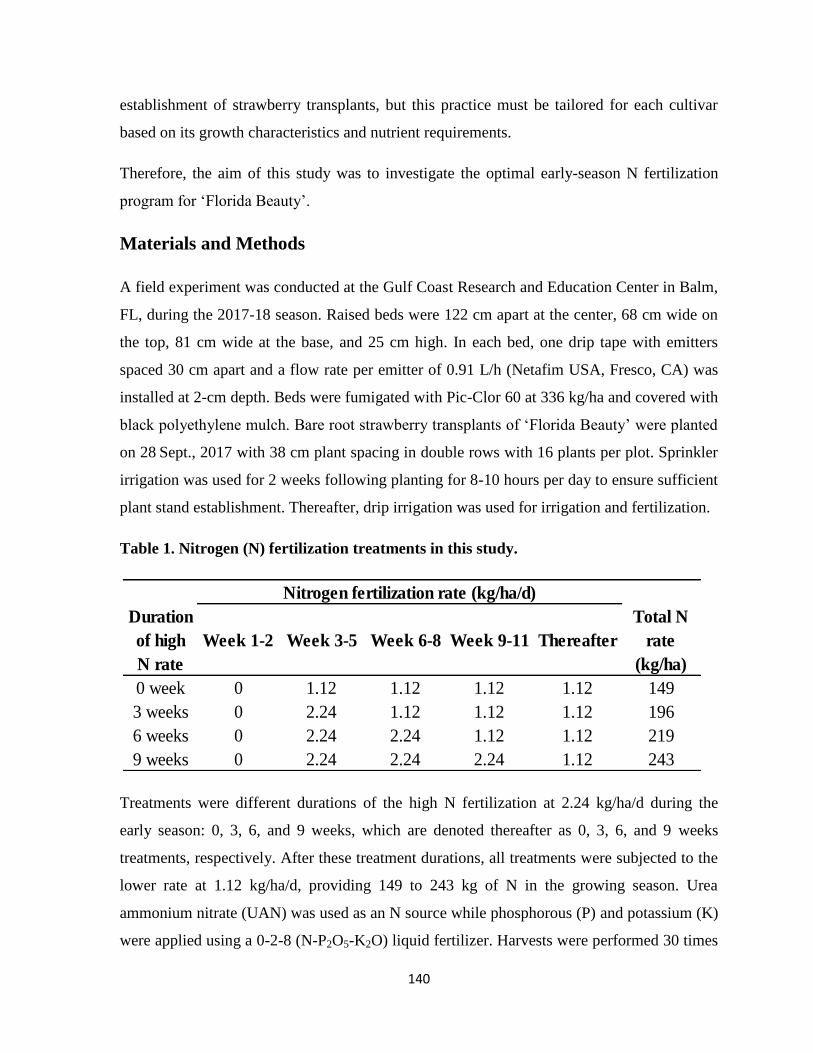
140
establishment of strawberry transplants, but this practice must be tailored for each cultivar
based on its growth characteristics and nutrient requirements.
Therefore, the aim of this study was to investigate the optimal early-season N fertilization
program for „Florida Beauty‟.
Materials and Methods
A field experiment was conducted at the Gulf Coast Research and Education Center in Balm,
FL, during the 2017-18 season. Raised beds were 122 cm apart at the center, 68 cm wide on
the top, 81 cm wide at the base, and 25 cm high. In each bed, one drip tape with emitters
spaced 30 cm apart and a flow rate per emitter of 0.91 L/h (Netafim USA, Fresco, CA) was
installed at 2-cm depth. Beds were fumigated with Pic-Clor 60 at 336 kg/ha and covered with
black polyethylene mulch. Bare root strawberry transplants of „Florida Beauty‟ were planted
on 28 Sept., 2017 with 38 cm plant spacing in double rows with 16 plants per plot. Sprinkler
irrigation was used for 2 weeks following planting for 8-10 hours per day to ensure sufficient
plant stand establishment. Thereafter, drip irrigation was used for irrigation and fertilization.
Table 1. Nitrogen (N) fertilization treatments in this study.
Treatments were different durations of the high N fertilization at 2.24 kg/ha/d during the
early season: 0, 3, 6, and 9 weeks, which are denoted thereafter as 0, 3, 6, and 9 weeks
treatments, respectively. After these treatment durations, all treatments were subjected to the
lower rate at 1.12 kg/ha/d, providing 149 to 243 kg of N in the growing season. Urea
ammonium nitrate (UAN) was used as an N source while phosphorous (P) and potassium (K)
were applied using a 0-2-8 (N-P2O5-K2O) liquid fertilizer. Harvests were performed 30 times
Duration Total N
of high Week 1-2 Week 3-5 Week 6-8 Week 9-11 Thereafter rate
N rate (kg/ha)
0 week 0 1.12 1.12 1.12 1.12 149
3 weeks 0 2.24 1.12 1.12 1.12 196
6 weeks 0 2.24 2.24 1.12 1.12 219
9 weeks 0 2.24 2.24 2.24 1.12 243
Nitrogen fertilization rate (kg/ha/d)
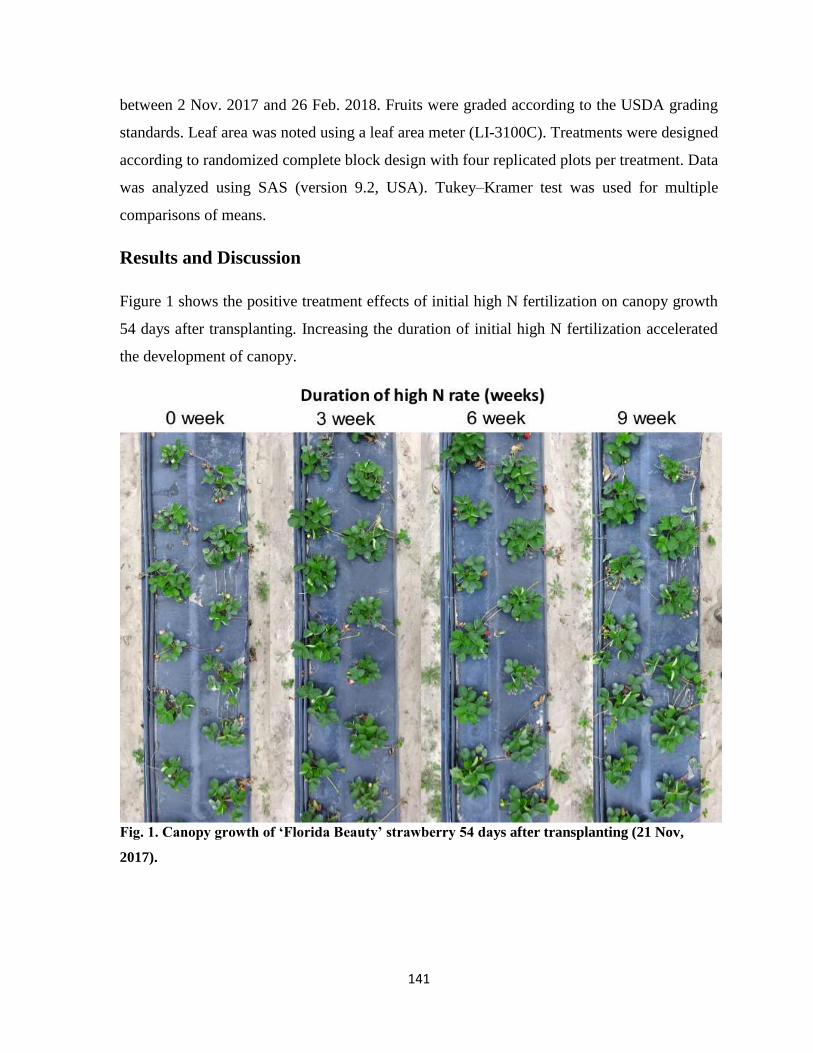
141
between 2 Nov. 2017 and 26 Feb. 2018. Fruits were graded according to the USDA grading
standards. Leaf area was noted using a leaf area meter (LI-3100C). Treatments were designed
according to randomized complete block design with four replicated plots per treatment. Data
was analyzed using SAS (version 9.2, USA). Tukey–Kramer test was used for multiple
comparisons of means.
Results and Discussion
Figure 1 shows the positive treatment effects of initial high N fertilization on canopy growth
54 days after transplanting. Increasing the duration of initial high N fertilization accelerated
the development of canopy.
Fig. 1. Canopy growth of ‘Florida Beauty’ strawberry 54 days after transplanting (21 Nov,
2017).
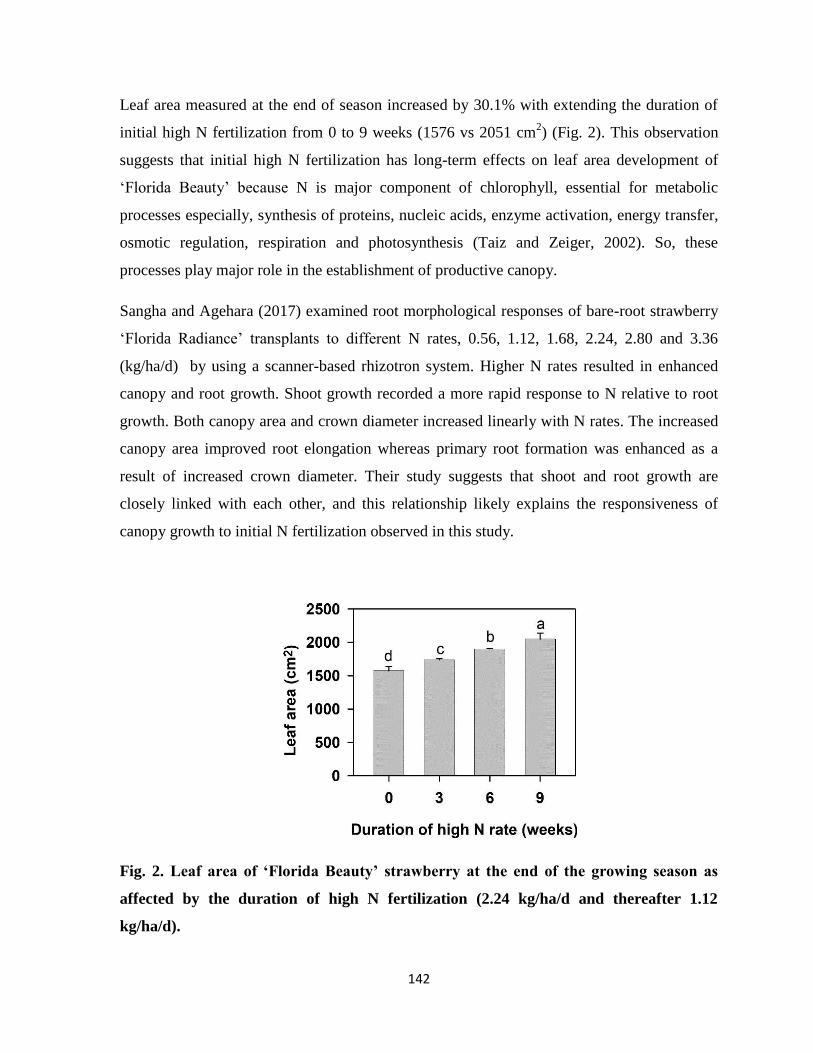
142
Leaf area measured at the end of season increased by 30.1% with extending the duration of
initial high N fertilization from 0 to 9 weeks (1576 vs 2051 cm2) (Fig. 2). This observation
suggests that initial high N fertilization has long-term effects on leaf area development of
„Florida Beauty‟ because N is major component of chlorophyll, essential for metabolic
processes especially, synthesis of proteins, nucleic acids, enzyme activation, energy transfer,
osmotic regulation, respiration and photosynthesis (Taiz and Zeiger, 2002). So, these
processes play major role in the establishment of productive canopy.
Sangha and Agehara (2017) examined root morphological responses of bare-root strawberry
„Florida Radiance‟ transplants to different N rates, 0.56, 1.12, 1.68, 2.24, 2.80 and 3.36
(kg/ha/d) by using a scanner-based rhizotron system. Higher N rates resulted in enhanced
canopy and root growth. Shoot growth recorded a more rapid response to N relative to root
growth. Both canopy area and crown diameter increased linearly with N rates. The increased
canopy area improved root elongation whereas primary root formation was enhanced as a
result of increased crown diameter. Their study suggests that shoot and root growth are
closely linked with each other, and this relationship likely explains the responsiveness of
canopy growth to initial N fertilization observed in this study.
Fig. 2. Leaf area of ‘Florida Beauty’ strawberry at the end of the growing season as
affected by the duration of high N fertilization (2.24 kg/ha/d and thereafter 1.12
kg/ha/d).
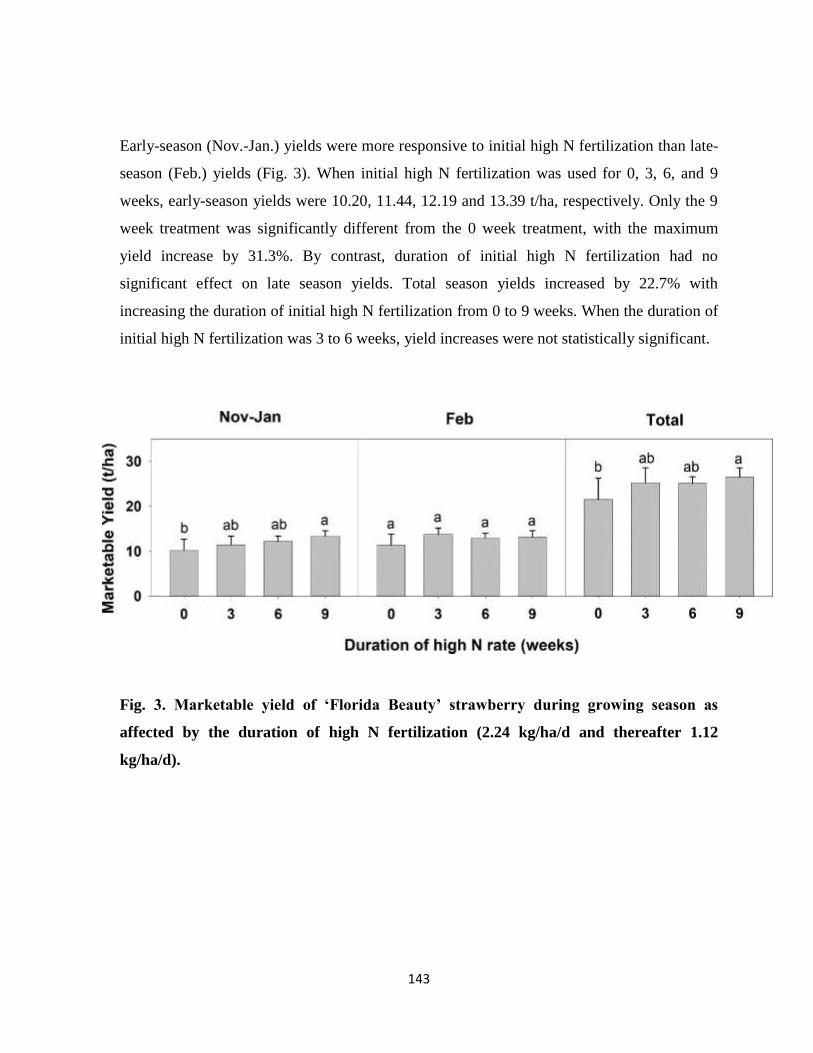
143
Early-season (Nov.-Jan.) yields were more responsive to initial high N fertilization than late-
season (Feb.) yields (Fig. 3). When initial high N fertilization was used for 0, 3, 6, and 9
weeks, early-season yields were 10.20, 11.44, 12.19 and 13.39 t/ha, respectively. Only the 9
week treatment was significantly different from the 0 week treatment, with the maximum
yield increase by 31.3%. By contrast, duration of initial high N fertilization had no
significant effect on late season yields. Total season yields increased by 22.7% with
increasing the duration of initial high N fertilization from 0 to 9 weeks. When the duration of
initial high N fertilization was 3 to 6 weeks, yield increases were not statistically significant.
Fig. 3. Marketable yield of ‘Florida Beauty’ strawberry during growing season as
affected by the duration of high N fertilization (2.24 kg/ha/d and thereafter 1.12
kg/ha/d).
144
Sangha and Agehara (2016) evaluated different N fertilization rates during the early season
using two strawberry cultivars, „Florida Radiance‟ and „Florida127‟. Their treatments were
five N rates during the early season (22 Oct.-14 Dec.), 0.22, 0.67, 1.12, 1.56 and 2.0 N
kg/ha/d, all of which were followed by 1.12 kg/ha/d during the rest of the season. „Florida
Radiance‟ showed continuous increases in total marketable yields by up to 57% (13.6 vs 21.3
t/ha) with increasing the early season N rate from 0.22 to 2.0 kg/ha/d. By contrast,
„Florida127‟ increased total marketable yields by up to 53% (12.1 vs 18.5 t/ha) with
increasing N rate from 0.22 to 1.12 kg/ha/d but no yield differences with further increases in
N rate. Therefore, their results suggest that „Florida Radiance‟ is more responsive to higher N
rates than „Florida127‟ during early season, similar to our findings initial high N fertilization
increased total marketable yield of „Florida Beauty‟. Similarity between „Florida Radiance‟
and „Florida Beauty‟ was the high yield response to N fertilization during establishment.
Major Florida strawberry cultivars, such as „Florida Radiance‟ and „FL 05-107‟, require a
medium level of fertilization to produce excellent fruit yields, which is generally up to 3
weeks of initial high N fertilization with the total N of 168 to 196 kg/ha (Whitaker et al.,
2008; Whitaker et al., 2012). By contrast, „Florida127‟ responds more strongly to N
application in terms of vegetative growth and requires lower N fertilization rates for fruit
production (Whitaker et al., 2014). Our study demonstrated that fruits yields of „Florida
Beauty‟ can be maximized using 9 weeks of initial high N fertilization with the total season
rate of 243 kg/ha, suggesting that this cultivar is highly responsive of N fertilization. This
cultivar generally has greater fruit loads than other cultivars in early- to mid-season
especially when planted early (e.g. 20 Sep. to 10 Oct.), possibly requiring higher N rates to
maintain plant health and productivity.
Our results suggest that high N fertilization is beneficial for more efficient N uptake during
establishment which results in improved fruit earliness and yields. Initial high N fertilization
for „Florida Beauty‟ can be extended up to 9 weeks to maximize fruit yields, thereby
requiring relatively large amounts of N for establishment compared to other major Florida
cultivars.
145
Conclusions
„Florida Beauty‟ is characterized by its compact plant habit, which is highly responsive to N
fertilization during establishment. We recommend using high N fertilization at 2.24 kg/ha/d
for 9 weeks during establishment, which is slightly longer compared to the recommendation
for other cultivars (Whitaker et al., 2008; Whitaker et al., 2012). Negative impact of
excessive N fertilization appears to be minimal for this cultivar. Delayed establishment of an
ideal canopy size can result in yield reductions especially during the early season.
146
LITERATURE CITED
Abdollahi, M., S. Eshghi and E. Tafazoli. 2010a. Interaction of paclobutrazol, boron and zinc
on vegetative growth, yield and fruit quality of strawberry (Fragaria ×ananassa
Duch. cv. Selva). J. Biol. Environ. Sci. 4(11):67-75.
Abdollahi, M., S. Eshghi, E. Tafazzoli and N. Moosavi. 2010b. Effects of paclobutrazol,
boric acid and zinc sulfate on vegetative and reproductive growth of strawberry cv.
Selva. J. Agr. Sci. Tech. 14:357-363.
Abedy, A. 2001. Effects of zinc sulfate and citric acid spray on fruit characteristics of tomato
cultivar 'Urbana'. MSc. Thesis, Shiraz University. pp. 10-15.
Adda-Bjarnadottir, M. 2012. Strawberries. Nutrition Facts and Health Benefits. pp.101.
https://authoritynutrition.com/foods/strawberries/
Agehara, S., B.M. Santos and A.J. Whidden. 2017. Nitrogen Fertilization of Strawberry
Cultivars: Is Preplant Starter Fertilizer Needed? Univ. Fla. Ext. Serv. HS1116.
Ainsworth, E.A. and K.M. Gillespie. 2007. Estimation of total phenolic contents and other
oxidation substances in plant tissue using Folin-Ciocalteu reagent. Nature Protocols.
2: 875-877.
Akhtar, A., N.A. Abbasi and A. Hussain. 2010. Effect of calcium chloride treatments on
quality characteristics of loquat fruit during storage. Pak. J. Bot. 42:181-188.
Albregts, E. and C. Howard. 1982. Effect of fertilizer rate on number of malformed
strawberry fruit. Proc. Fla. State Hort. Soc. 95:323-324.
Alshaal, T. and H.R. El-Ramady. 2017. Foliar application: from plant nutrition to
Biofortification. Env. Biodiv. Soil Security. 1:71-83.
Amin, M. 1996. Progress and prospects of strawberry production in NWFP. Annual Report,
Agricultural Research Station (North) Mingora, Swat. 212:4-7.
Anand, T., R. Ghaskaran, T. Raguchander, R. Samiyappan, V. Prakasan and C.
Gopalakrishnan. 2009. Defence responses of chilli fruits to Colletotrichum capsici
and Alternaria alternata. Biol. Plant. 53:553-559.
Andriolo, J.L., D.I. Janisch, M.D. Picio, O.J. Schmitt and M.A. Lerner. 2014. Nitrogen
accumulation and monitoring by strawberry stock plants for runner tips production.
Hort. bras. 32:273-279.
147
Archbold, D.D. and M. Nosarszewski. 2004. Patterns of sorbitol metabolism and availability
during apple fruit set. HortScience. 39:887.
Asad, A. 1997. Strawberry production and marketing potentials. Advisory leaflet of MFVDP,
30:1-2.
Asadi, Z., M. Jafarpour, A.R. Golparvar and A. Mohammadkhani. 2013. Effect of GA
application on fruit yield, flowering and vegetative characteristics on early yield of
strawberry cv. Gaviota. Intl. J. Agri. Crop Sci. 5(15):1716.
Asghari, M. and M.S. Aghdam. 2010. Impact of salicylic acid on post-harvest physiology of
horticultural crops. Trend Food Sci. Technol. 21:502-509.
Ashraf, M., N.A. Akram, R.N. Arteca and M.R. Foolad. 2010. The physiological,
biochemical and molecular roles of brassinosteroids and salicylic acid in plant
processes and salt tolerance. Crit. Rev. Plant Sci. 29(3):162-190.
Avina, J.E.D., J.A. Rodriguez, M.A. Ochoa, O.T. Ortiz, G.I. Olivas, J.F.A. Zavala, A.
Gustavo and G. Aguilar. 2014. Effect of edible coatings on bioactive compounds and
antioxidant capacity of tomatoes at different maturity stages. J. Food. Sci. Technol.
51:2706-2712.
Bagheri, M., M.E. Ashari and A. Ershadi. 2015. Effect of postharvest calcium chloride
treatment on the storage life and quality of persimmon fruits (Diospyros kaki Thunb.)
cv.„Karaj‟. Int. J. Hortic. Sci. Technol. 2(1):15-26.
Bakshi, P., A. Jasrotia, V.K. Wali, A. Sharma and M. Bakshi. 2013. Influence of pre-harvest
application of calcium and micro-nutrients on growth, yield, quality and shelf-life of
strawberry cv. Chandler. Indian. J. Agr. Sci. 83(8):831-835.
Bakshi, P., D.J. Bhat, V.K. Wali, A. Sharma and M. Iqbal. 2014. Growth, yield and quality of
strawberry (Fragaria xananassa Duch.) cv. Chandler as influenced by various
mulching materials. Afr. J. Agric. Res. 9(7):701-706.
Baninaiem, E., A.M. Mirzaaliandastjerdi, S. Rastegar and K. Abbaszade. 2016. Effect of pre-
and postharvest salicylic acid treatment on quality characteristics of tomato during
cold storage. Adv. Hortic. Sci. 30(3):183-192.
Basu, A., M. Rhone and T.J. Lyons. 2010. Berries: emerging impact on cardiovascular
health. Nutrition reviews. 68:168-177.
148
Boriss, H. 2006. Commodity Profile: Strawberries.
http://aic.ucdavis.edu/profiles/Strawberries.pdf. Accessed 18 Aug. 2018.
Boynton, B.B., B.A. Welt, C.A. Sims, J.K. Brecht, M.O. Balaban and M.A. Marshall. 2005.
Effect of low dose electron beam irradiation on respiration, microbiology, color and
texture of fresh cut Cantaloupe. Hort. Technol. 15:802-807.
Bramlage, W.G., M. Drake and S.A. Weis. 1985. Comparisons of calcium chloride, calcium
phosphate and a calcium chelate as foliar sprays for 'McIntosh' apple trees. J. Am.
Soc. Hortic. Sci. 110:786-789.
Brand-Williams, W., M.E. Cuvelier and C. Berset. 1995. Use of free radical method to
evaluate antioxidant activity. Lebensm Wiss Technol. 28:25-30.
Brennan, R.M., P.D.S. Caligari, J.R. Clark, P.B. de Oliveira, C.E. Finn, J.F. Hancock and D.
Simpson. 2014. Berry crops. In Horticulture: Plants for People and Places. Springer,
Dordrecht. 1:301-325.
Cakmak, I. 2000. Possible roles of zinc in protecting plant cells from damage by reactive
oxygen species. The New Phytologist. 146(2):185-205.
Canli, F.A. and H. Orhan. 2009. Effects of preharvest gibberellic acid applications on fruit
quality of „0900 Ziraat‟ sweet cherry. HortTechnology. 19(1):127-129.
Cheour, F., C. Willemot, J. Arul, Y. Desjardin, J. Makhlouf, P.M. Charest and A. Gosselin.
1990. Foliar application of calcium chloride delays postharvest ripening of
strawberry. J. Am. Soc. Hortic. Sci. 115:789-792.
Conway, W.S., C.E. Sams and A. Kelman. 1994. Enhancing the natural resistance of plant
tissues to postharvest disease through calcium applications. HortScience. 29:751-754.
Dad, A. 2011. Strawberry cultivation in Charsadda-Pakistan. Hafat Roza veterinary stresses
in plants. J. Plant Nut. Soil Sci. 168:521-530.
Da-Silva, F.L., M.T. Escribano-Bailón, J.J.P. Alonso, J.C. Rivas-Gonzalo and C. Santos-
Buelga. 2007. Anthocyanin pigments in strawberry. LWT-Food Sci. Technol. 40:374-
382.
Del-Amor, F.K. and L.F.M. Marcelis. 2003. Regulation of nutrient uptake, water uptake and
growth under calcium starvation and recovery. J. Hort. Sci. Biotechnol. 78:343-349.
Deng, X. and F.I. Woodward. 1998. The growth and yield responses of Fragaria ananassa to
elevated CO2 and N Supply. Ann. Bot. 81:67-71.
149
Di-Vittori, L., L. Mazzoni, M. Battino and B. Mezzetti. 2018. Pre-harvest factors influencing
the quality of berries. Sci. Hortic. 233:310-322.
Dokhanieh, A.Y., M.S. Aghdam, J.R. Fard and H. Hassanpour. 2013. Postharvest salicylic
acid treatment enhances antioxidant potential of cornelian cherry fruit. Sci. Hortic.
154:31-36.
Dutta, P. and A.K. Banik. 2007. Effect of foliar feeding of nutrients and plant growth
regulators on physicochemical quality of Sardar guava grown in West Bengal. Acta
Hort. 335:407-11.
Economic Research Service, 2013. U.S. strawberry industry. Economics, Statistics and
Market Information System Publication, United States Department of Agriculture,
Ithaca, NY.
Elad, Y. and H. Volpin. 1993. Reduced development of grey mould (Botrytis cinerea) in
bean and tomato plants by calcium nutrition. J. Phytopathol. 139:146-156.
El-Sawy, S.M., S.R. Salman, E.M.A. El-Moniem, M.S. Omiama and A.F. Abou-Hadid.
2012. Influence of some fertilizer treatments on productivity and fruit quality of
strawberries. J. Appl. Sci. Res. 8(1):483.
FAO. 2014. Food and Agriculture Organization of United Nations, Statistics Division.
Database. http://faostat.fao.org/site/339/default. aspx. Accessed 10 Nov. 2015.
FAO. 2016-17. Food and Agriculture Organization of United Nations, Statistics Division.
Database. http://faostat.fao.org/site/339/default. aspx. Accessed 10 Aug. 2017.
Fact fish. 2011-18. Strawberries, production quantity (tons) - for all countries.
http://www.factfish.com/statistic/strawberries%2C%20production%20quantity
Accessed 10 Sep. 2018.
Fisk, C.L., A.M. Silver, B.C. Strik and Y. Zhao. 2008. Postharvest quality of hardy Kiwifruit
(Actinidia arguta Ananasnaya) associated with packaging and storage conditions.
Postharvest Biol. Technol. 47:338-345.
Franco, J., D. Antunes, F. Melo, R. Guilherme, N. Neves, F. Curado and S. Rodrigues. 2008.
The Influence of pre and post-harvest calcium applications on storage capability and
quality of „Hayward‟ Kiwifruit. Algarve, Portugal. 43:512-516.
GOP. 2014-15. Government of Pakistan ministry of national food security and research
Islamabad. Fruits, vegetables and condiments statistics of Pakistan. pp:1-2.
150
Gast, K.L. and J.E. Pollard. 1991. Rowcovers and mulch alter seasonal strawberry carbon
metabolism. HortScience. 26(4):421-421.
Gelmesa, D., B. Abebie and L. Desalegn. 2013. Effects of Gibberellic acid and 2,4-
dichlorophenoxy acetic acid spray on vegetative growth, fruit anatomy and seed
setting of tomato (Lycopersicon esculentum Mill.). J. Sci. Technol. Arts Res. 2(3):25-
34.
Giampieri, F., S. Tulipani, J.M. Alvarez-Suarez, J.L. Quiles, B. Mezzetti and M. Battino.
2012. The strawberry: composition, nutritional quality, and impact on human health.
Nutrition. 28:9-19.
Growing Produce. 2018. Why foliar feeding? https:/ /www. growingproduce. com/
sponsor/yara/why-foliar-feeding/
Hafeez, B., Y.M. Khanif and M. Saleem. 2013. Role of zinc in plant nutrition a
review. Amer. J. Exp. Agric. 3(2):374.
Haifa, 2014. Strawberry crop guide: mineral nutrition of strawberries. http://www.haifa-
group.com/knowledge_center/crop_guides/strawberry/mineral_nutrition_of_strawber
ries/
Hancock, J.F. 1999. Strawberries. CABI Publishing, New York.
Handley, D.T. 2003. The Strawberry Plant: What You Should Know.
http://www.newenglandvfc.org/2003_conference/proceedings_03/strawberry2/strawb
erry_plant_what_you_should_know.pdf
Harman, Y. and F. Sen. 2016. The effect of different concentrations of pre-harvest gibberellic
acid on the quality and durability of „Obilnaja‟and „Black Star‟plum varieties. J. Food
Sci. Technol. 36(2):362-368.
Hassanpour, H., Y. Hamidoghli, J. Hajilo and M. Adlipour. 2011. Antioxidant capacity and
phytochemical properties of cornelian cherry (Cornus mas L.) genotypes in Iran. Sci.
Hortic. 129:459-463.
Hayat, S., S.A. Hasan, Q. Hayat, M. Irfan and A. Ahmad. 2010. Effect of salicylic acid on
net photosynthetic rate, chlorophyll fluorescence, and antioxidant enzymes in Vigna
radiata plants exposed to temperature and salinity stresses. Plant Stress. 4:62-71.
151
Hernandez-Munoz, H., E. Almenar, M.J. Ocio and R. Gavara. 2006. Effect of calcium dips
and chitosan coatings on postharvest life of strawberries (Fragaria xananassa).
Postharvest Biol. Technol. 39:247-253.
Hertwig, B., P. Streb and J. Feierabend. 1992. Light dependence of catalase synthesis and
degradation in leaves and influence of interfering stress conditions. Plant Physiol.
100:1547-1553.
Himelrick, D., A. Powell and W.A. Dozier. 2002. Commercial production strawberry.
Alabama Cooperative Extension System, ANR-0633. Alabama and Auburn
Universities, Auburn, AL.
Hochmuth, G., D. Cantliffe, C. Chandler, C. Stanley, E. Bish, E. Waldo, D. Legard and J.
Duval. 2006. Containerized strawberry transplants reduce establishment-period water
use and enhance early growth and flowering compared with bare-root plants.
HortTechnology. 16:46-54.
Hochmuth, G.J. and E. Hanlon. 1999. A summary of N and K research with strawberry in
Florida. Univ. Fla. Ext. Serv., SL 344.
Hochmuth, G.J., E.E. Albregts, C.C. Chandler, J. Cornell and J. Harrison. 1996. Nitrogen
fertigation requirements of drip-irrigated strawberries. J. Amer. Soc. Hort. Sci.
121:660-665.
Hubbard, N.L., D.M. Pharr and S.C. Huber. 1991. Sucrose phosphate synthase and other
sucrose metabolizing enzymes in fruit of various species. Physiol. Plant. 82:191-196.
Hummer, K.E. and J. Hancock. 2009. Strawberry genomics: botanical history, cultivation,
traditional breeding, and new technologies. Genetics and genomics of Rosaceae.
Springer:413-435.
Hussain, M., M.I. Hamid and M.U. Ghazanfar. 2015. Salicylic acid induced resistance in
fruits to combat against postharvest pathogens: a review. Arch. Phytopathology Plant.
Protect. 48(1):34-42.
Imran, H., Z. Yuxing, D.U. Guoqiang, W. Guoying and Z. Jianghong. 2007. Effect of
salicylic acid (SA) on delaying fruit senescence of Huang Kum pear. Front. Agric.
China. 1(4):456-459.
152
Jamal, A.F.M., M.J. Hossan, M.S. Islam, M.K. Ahsan and H. Mehraj. 2012. Strawberry
growth and yield responses to gibberellic acid concentrations. J. Expt. Biosci. 3:51-
56.
Jimenez, A., F. Romojaro, J.M. Gomez, M.R. Llanos and F. Sevilla. 2003. Antioxidant
systems and their relationship with the response of pepper fruits to storage at 20ºC. J.
Agr. Food Chem. 51:6293-6299.
Kadir, S.A. 2004. Fruit quality at harvest of „Jonathan‟ apple treated with foliar applied
calcium chloride. J. Plant. Nut. 27:1991-2006.
Kalaki, G.S., V. Abdosi, M.M.A. Boojar. 2014. Change in chlorophylls composition and
some morphological attributes of strawberry (Fragaria × ananassa Duch cv.
Camarosa) in response to salicylic acid spray. Int. J. Biosci. 5(12):204-2011.
Kazemi, M. 2013a. Foliar application of salicylic acid and calcium on yield, yield component
and chemical properties of strawberry. Bull. Env. Pharmacol. Life Sci. 2(11):19-23.
Kazemi, M. 2013b. Influence of foliar application of 5-sulfosalicylic acid, malic acid,
putrescine and potassium nitrate on vegetative growth and reproductive
characteristics of strawberry cv.„Selva‟. J. Biol. Environ. Sci. 7(20):93-101.
Kazemi, M. 2014a. Influence of foliar application of iron, calcium and zinc sulfate on
vegetative growth and reproductive characteristics of strawberry cv.„Pajaro‟. Trakia J.
Sci. 1:21-26.
Kazemi, M. 2014b. Pre-harvest foliar application of paclobutrazol, boric acid and gibberellic
acid influences vegetative growth, reproductive characteristics and quality of
strawberry (Fragaria× ananassa Duch. cv. Camarosa). Bull. Env. Pharmacol. Life
Sci. 3(4):183-187.
Kazemi, M. 2015. Effect of Iron (Fe-EDDHA), Calcium Chloride and Zinc Sulphate on
Vegetative Growth, Yield and Fruit Quality of Strawberry (Fragaria ×Ananassa
Duch. cv. Pajaro) Jordan J. Agr. Sci. 173(3643):1-8.
Khademi, Z. and A. Ershadi. 2013. Postharvest application of salicylic acid improves
storability of Peach (Prunus persica cv. Elberta) fruits. Int. J. Agri. Crop Sci. 5:651-
655.
Khodary, S.E.A. 2004. Effect of salicylic acid on the growth, photosynthesis and
carbohydrate metabolism in salt stressed maize plants. Int. J. Agric. Biol. 6:5-8.
153
Khreba, A.H., A.H. Hassan, M.S. Emam and S.A. Atala. 2014. Effect of Some Pre and
Postharvest Treatments on Quality and Storability of Strawberry Fruits. J. Amer. Sci.
11:10.
Kinsella, J.E., E. Frankel, B. German, J. Kanner. 1993. Possible mechanism for the protective
role of antioxidants in wine and plants foods. Food Technol. 47:85–89.
Knorzer, O.C., B. Lederer, J. Durner and P. Boger. 1999. Antioxidative defense activation in
soybean cells. Physiol. Plant. 107:294-302.
Koch, K. 2004. Sucrose metabolism: Regulatory mechanisms and pivotal roles in sugar
sensing and plant development. Curr. Opin. Plant Biol. 7:235-246.
Koutinas, N., T. Sotiropoulos, A. Petridis, D. Almaliotis, E. Deligeorgis, I. Therios and N.
Voulgarakis. 2010. Effects of preharvest calcium foliar sprays on several fruit quality
attributes and nutritional status of the kiwifruit cultivar „Tsechelidis‟. HortScience.
45(6):984-987.
Legard, D.E., C.L. Xiao, J.C. Mertely and C.K. Chandler. 2000. Effects of plant spacing and
cultivar on incidence of botrytis fruit rot in annual strawberry. University of Florida,
Gulf Coast Research and Education Center, Lewis Gallagher Road, Dover. 84(5):531-
538.
Li, H., R. Huang, T. Li and K. Hu. 2010. Ability of nitrogen and phosphorus assimilation of
seven strawberry cultivars in a northern Atlantic coastal soil. In World Congress of
Soil Science, Soil Solutions for a Changing World (Vol. 19).
Liu, D., J. Zou, Q. Meng, J. Zou and W. Jiang. 2009. Uptake and accumulation and oxidative
stress in garlic (Allium sativum L.) under lead phytotoxicity. Ecotoxicol. 18:134-143.
Lolaei, A., B. Kaviani, M.A. Rezaei, M.K. Raad and R. Mohammadipour. 2012. Effect of
pre-and postharvest treatment of salicylic acid on ripening of fruit and overall quality
of strawberry (Fragaria ananasa Duch cv. Camarosa) fruit. Ann. Biol. Res.
3(10):4680-4684.
Lolaei, A., M.A. Rezaei, M. Khorrami and B. Kaviani. 2012. Effect of paclobutrazol and
sulfate zinc on vegetative growth, yield and fruit quality of strawberry (Fragaria
×ananassa Duch. cv. Camarosa). Ann. Biol. Res. 3(10):4657-4662.
Lopez, A.P., M.T.N. Gochicoa and A.R. Franco. 2010. Activities of antioxidant enzymes
during strawberry fruit development and ripening. Biol. Plantarum. 54(2):349-352.
154
Lysiak, G., W.J. Florkowski and S.E. Prussia. 2008. Postharvest calcium chloride application
and moisture barrier influence on peach fruit quality. HortTechnology. 18(1):100-
105.
Maas, J.L. 1998. Compendium of strawberry diseases. St. Paul, Minnesota, USA, APS Press.
Mabood, M. 1994. The future prospects of strawberry production in Pakistan. Advisory
leaflet. 17:51-52.
Madani, B., M.T.M. Mohamed, A.R. Biggs, J. Kadir, Y. Awang, A. Tayebimeigooni and
T.R. Shojaei. 2014. Effect of pre-harvest calcium chloride applications on fruit
calcium level and post-harvest anthracnose disease of papaya. Crop Protection. 55:55-
60.
Mady, M.A. 2014. Inducing cold tolerability in squash (Cucurbita pepo L.) plant by using
salicylic acid and chelated calcium application. Int. J. Agric. Sci. Res. 4:9-24.
Manganaris, G.A., M. Vasilakakis, G. Diamantidis and I. Mignani. 2005. Effect of
postharvest calcium treatments on the physicochemical properties of cell wall pectin
in nectarine fruit during ripening after harvest or cold storage. J. Hort. Sci.
Biotechnol. 80:611-617.
Manganaris, G.A., V. Goulas, A.R. Vicente and L.A. Terry. 2014. Berry antioxidants: small
fruits providing large benefits. J. Sci. Food Agric. 94(5):825-33.
Marschner, H. 1995. Mineral nutrition of higher plants. 2nd
edn. Academic Press: London.
Martin, E. and E. Tepe. 2014. Cold climate strawberry farming. Department of Horticultural
Science e-book, University of Minnesota, St. Paul, MN. pp. 22-23.
Medeiros, R.F., W.E. Pereira, R.D.M. Rodrigues, R.D. Nascimento, J.F. Suassuna and T.A.
Dantas. 2015. Growth and yield of strawberry plants fertilized with nitrogen and
phosphorus. Rev. Bras. Eng. Agr. Amb. 19:865-870.
Meena, B., T. Marimuthu, R. Velazhahan. 2001. Salicylic acid induces systemic resistance in
groundnut against late leaf spot caused by Cercosporidium personatum. J. Mycol.
Plant Pathol. 31:139–145.
Meena, D., R. Tiwari and O.P. Singh. 2014. Effect of nutrient spray on growth, fruit yield
and quality of aonla. Ann. plant soil res. 16(3):242-245.
155
Metwally, A.A., S.M. Youssef, S.M. El-Miniawy and M.E. Ragab. 2013. Effect of foliar
spraying of salicylic acid on growth, yield and quality of cold stored strawberry
plants. J. Biol. Chem. Environ. Sci. 8:1-17.
Moline, H.E. 1994. Preharvest management for postharvest biological control. Biological
Control of Postharvest Diseases-Theory and Practice. CL Wilson and ME
Wisniewski, eds. CRC Press, Boca Raton, Florida, the United States of America. 57-
62.
Motesharezade, B., M.J. Malakuty and B. Nakhoda. 2001. Effects of N, Zn and B sprays on
photochemical efficiency of sweet cherry. Hort. Newsletter. 12:106-111.
Murtaza, A. 2014. Strawberry a delicious fruit. FoodJournal. PK. 25-27.
www.foodjournal.pk/2014/July-September-2014/PDF.../Anjuman-Strawberry.pdf
Naradisorn, M. 2013. Effect of calcium nutrition on fruit quality and post-harvest diseases.
Int. J. Sci. Innovations and Discoverie. 3(1):8-13.
Nasiri, Y., S. Zehtab-Salmasi, S. Nasrullahzadeh, N. Najafi and K. Ghassemi- Golezani.
2010. Effects of foliar application of micronutrients (Fe and Zn) on flower yield and
essential oil of chamomile (Matricaria chamomilla L.). J. Med Plant. Res. 4:1733-
1737.
Neri, D. and G. Savini. 2004. Root growth and structure in strawberry as affected by organic
residues. Acta Hortic. 708:39-44.
Nogata, Y., H. Ohta and A.G.J. Voragen. 1993. Polygalacturonase in strawberry
fruit. Phytochemistry. 34(3):617-620.
Oata, Y. 1975. Short day flowering of Lemna gibba G3 induced by salicylic acid. Plant Cell
Physiol. 16:1131-1135.
Paranjpe, A.V., D.J. Cantliffe, P.J. Stoffella, E.M. Lamb and C.A. Powell. 2008. Relationship
of plant density to fruit yield of 'Sweet Charlie' strawberry grown in a Pine Bark
soilless medium in a high-roof passively ventilated greenhouse. Sci. Hort.
115(2):117-123.
Paroussi, G., D.G. Voyiatzis, E. Paroussis and P.D. Drogoudi. 2002. Growth, flowering and
yield responses to GA3 of strawberry grown under different environmental
conditions. Sci. Hort. 96(4):103-113.
156
Passam, C.H., C. Ioannis, J. Karapanos, J. Penelope and D. Savvas. 2007. A review of recent
research on tomato nutrition, breeding and post-harvest technology with reference to
fruit quality. Eur. J. Plant Sci. Biotecnol. 1(1):1-21.
Petersen, V.O. 1998. Influence of raised beds, plant density, and fertigation on yield and
quality of strawberry (Fragaria ×ananassa Duch.). Europ. J. Hort. Sci. 63(1):19-22.
Phillips, M. 2004. Economic benefit from using micronutrients for the farmer and the
fertilizer producer. IFA. International Symposium on Micronutrients. New Delhi,
India.
Picha, D. 2006. Post-Harvest Care of Strawberries in Moldova. Agribusiness Development
Project Citizens Network for Foreign Affairs.
Pieterse, A.H. and L.J. Muller. 1977. Induction of flowering in Lemna gibba G3 under short
day conditions. Plant Cell Physiol. 18:45-53.
Pila, N., N.B. Gol and T.V.R. Rao. 2010. Effect of postharvest treatments on
physicochemical characteristics and shelf life of tomato (Lycopersicon esculentum
Mill.) fruits during Storage. Amr. J. Agric. Environ. Sci. 9:470-479.
Plants, S. 2010. Strawberry Plant. http://strawberryplants.org/2010/05/strawberry-plant/
Poling, E.B. 2012. Strawberry plant structure and growth habit. New York State Berry
Growers Association, Berry EXPO.
Pollard, J.E., K.L.B. Gast and C.M. Cundari. 1988. Overwinter row covers increase yield and
earliness in strawberry. In International Strawberry Symposium. 265:229-234.
Prussia, S.E., D. Aggarwal, G.P. Lysiak and W.J. Florkowski. 2005. Postharvest calcium
chloride dips for increasing peach firmness. Acta Hort. 682: 1551-1557.
Qureshi, K.M., S. Chughtai, U.S. Qureshi and N.A. Abbasi. 2013. Impact of exogenous
application of salt and growth regulators on growth and yield of strawberry. Pak. J.
Bot. 45(4):1179-1185.
Rab, A. and I.U. Haq. 2012. Foliar application of calcium chloride and borax influences plant
growth, yield, and quality of tomato (Lycopersicon esculentum Mill.) fruit. Turk. J.
Agric. For. 36(6):695-701.
Racchi, M. 2013. Antioxidant defenses in plants with attention to Prunus and Citrus
spp. Antioxidants. 2:340-369.
157
Rajput, C.B.S. and S.N. Singh. 1977. Effect of certain plant growth substances in guava.
Haryana J. Hort. Sci. 6:117-9.
Rapisarda, P., B. Marisol, P. Pannuzo and N. Timpanaro. 2008. Effect of cold storage on
vitamin C, phenolics and antioxidant activity of five orange genotype (Citrus sinensis
L. osbeck). Postharvest Biol. Technol. 49:346-354.
Rokaya, P.R., D.R. Baral, D.M. Gautam, A.K. Shrestha and K.P. Paudyal. 2016. Effect of
pre-harvest application of gibberellic acid on fruit quality and shelf life of mandarin
(Citrus reticulata Blanco). Amer. J. Plant Sci. 7(07):1033-1039.
Roussos, P.A. and A. Tassis. 2011. Effects of girdling, nitrogen, zinc and auxin foliar spray
applications on mandarin fruit „Nova‟ quality characteristics. Emir. J. Food Agric.
431-439.
Roussos, P.A., N. Denaxa and T. Damvakaris. 2009. Strawberry fruit quality attributes after
application of plant growth stimulating compounds. Sci. Hort. 119(2):138-146.
Ruck, J.A. 1969. Chemical methods for analysis of fruits and vegetables. Summerland,
Res. Stat. Dept. Agri. Can. pp. 27-30.
Saddon, N. and N.A. Al-Zubaidy. 2017. Effect of gibberellic acid on growth, yield and
chemical composition of corn (Zea mays L.) a review. J. Purity, Utility Reaction and
Environ. 6(3):14-29.
Salari, N., A. Bahraminejad, G. Afsharmanesh and G. Khajehpour. 2013. Effect of salicylic
acid on post-harvest quantitative and qualitative traits of strawberry cultivars. Adv.
Environ. Biol. 94-100.
Sams, C.E. 1999. Preharvest factors affecting postharvest texture. Postharvest Biol. Technol.
15:249-254.
Sangha, B. and S. Agehara. 2016. Optimization of Growth-Stage specific Nitrogen
fertilization improves strawberry growth and yield. Proc. Fla. State Hort. Soc.
129:137-139.
Sangha, B. and S. Agehara. 2017. Using a scanner-based rhizotron system to characterize
root morphological responses of bare-root strawberry transplants to nitrogen
fertilization rates. Proc. Fla. State Hort. Soc. 130:129-132.
Santos, B.M. and C.K. Chandler. 2009. Influence of nitrogen fertilization rates on the
performance of strawberry cultivars. Int. J. Fruit Sci. 9:126-135.
158
Seeram, N.P. 2008. Berry fruits for cancer prevention: current status and future prospects. J.
Agr. Food Chem. 56:630-635.
Sharma, N.C., S.D. Sharma and R.S. Spehia. 2013. Effect of plastic mulch colour on growth,
fruiting and fruit quality of Strawberry under polyhouse cultivation. Int. J.
Bioresource Stress Manage. 4(2):314-315.
Sharma, R.R. 2002. Growing Strawberries. International Book Distributing Co., Lucknow,
India. pp. 1-99.
Sharma, R.R. and R. Singh. 2009. Gibberellic acid influences the production of malformed
and button berries and fruit yield and quality in strawberry (Fragaria Ananassa
Dutch). Sci. Hortic. 119:430-433.
Sharma, R.R. and V.P. Sharma. 2004. The Strawberry. ICAR, New Delhi, India.
Silva, J.M., L.C.S.A. Correia, N.P. Moura, P.L. Salgado, M.I.S. Maciel and H.P. Villar.
2013. Sensorial analysis of strawberry submitted to the technology of ionizing
radiation. Acta. Hort. 842:863-866.
Simonne, E.H., J.R. Duval and E. Golden. 2001. Interactions between nitrogen rates and
cultivar on the yield of strawberry. Proc. Fla. State Hort. Soc. 114:315-317.
Singh, K., M. Sharma and S.K. Singh. 2017. Effect of plant growth regulators on fruit yield
and quality of guava (Psidium guajava) cv. Allahabad Safeda. J. Pure Appl.
Microbio. 11(2):1149-1155.
Smolen, S. 2012. Foliar Nutrition: Current State of Knowledge and Opportunities. In: A. K.
Srivastava (Ed.), Advances in Citrus Nutrition, Springer Science + Business Media,
pp. 41-58.
Spayd, S.E. and J.R. Morris. 1981. Physical and chemical characteristics of puree from once
over harvested strawberries. J. Am. Soc. Hortic. Sci. 106:105-109.
Srivastava, A.K. and S. Singh. 2003. Soil-plant nutrient limits in relation to optimum fruit
yield. Plant Sci. 170:86-92.
Srivastava, M.K. and U.N. Dwivedi. 2000. Delayed ripening of banana fruit by salicylic acid.
Plant Sci. 158:87-96.
Srivastava, N.K. and A.K. Srivastava. 2007. Influence of gibberellic acid on 14
CO2
metabolism, growth, and production of alkaloids in Catharanthus roseus.
Photosynthetica. 45:156-60.
159
Stagner, D. and B.M. Popovic. 2009. Comparative study of antioxidant capacity in organs of
different Allium species. Cent. Eur. J. Biol. 4:224-228.
Staudt, G. 2008. Strawberry biogeography, genetics and systematics. In VI International
Strawberry Symposium 842:71-84.
Steel, R.G.D., J.H. Torrie and D.A. Dickey. 1997. Principles and Procedures of Statistics: A
Biometrical Approach. 3rd
ed. McGraw Hill Book Co. Inc., New York, USA.
Stolfa, I., S. Maric. A. Stanisavljevic, R. Vukovic and M. Varga. 2014. The impact of
environmentally friendly postharvest treatments on the antioxidant activity of
strawberry fruits during storage. Poljoprivreda. 20(2):23-28.
Strawberry, M. 2018. Chandler Strawberry Plants. https://strawberryplants.org/chandler-
strawberry-plants/
Sun, F., X. Xia and W. Yin. 2009. The mutual regulations between ABA and calcium signal
transduction pathways under abiotia stress. Genomics and Applied Biology.
28(2):391-397.
Swietlik, D. 2002. Zinc nutrition of fruit trees by foliar sprays. Acta Hort. 93(594):123-129.
https://doi.org/10.17660/ActaHortic.2002.594.11.
Swietlik, D. and M. Faust. 1984. Foliar nutrition of fruit crops. Hortic. Rev. 6:287-355.
Taiz, L. and E. Zeiger. 2002a. Plant Physiology, 3rd
ed. Sinauer Associates Inc. Sunderland,
MA, USA, pp. 68–69.
Taiz, L. and E. Zeiger. 2002b. Plant Physiology, 3rd
ed. Sinauer Associates Inc. Sunderland,
MA, USA, pp. 477-478.
Taiz, L. and E. Zeiger. 2006. Plant Physiology, 4th
ed. Sinauer Associates Inc. Sunderland,
MA, USA, pp. 207-208.
Tareen, M.J., N.A. Abbasi and I.A. Hafiz. 2012. Postharvest application of salicylic acid
enhanced antioxidant enzyme activity and maintained quality of peach cv.
“Flordaking” fruit during storage. Sci. Hortic. 142:221-228.
Taylor, D.R. and J.N. Knight. 1986. Russeting and cracking of apple fruit and their control
with plant growth regulators. Acta. Hort. 11:819-820.
Trinklein, D. 2012. Strawberry: A Brief History. https:// ipm. missouri.
edu/meg/2012/5/Strawberry-A-Brief-History/
160
Tsuda, K., M. Sato, J. Glazebrook, J.D. Cohen and F. Katagiri. 2008. Interply between
MAMP triggered and SA-mediated defense responses. Plant J. 53:763-775.
Turner, J.N. 1963. Application of gibberellic acid to strawberry plants at different stages of
development. Nature. 197:95-96.
Uddin, A. J., M.J. Hossan, M.S. Islam, M.K. Ahsan and H. Mehraj. 2012. Strawberry growth
and yield responses to gibberellic acid concentrations. J. Expt. Biosci. 3:51-56.
USDA, 2017. USDA Food Composition Databases. https://ndb.nal.usda.gov/ndb/search
Van Loon, L.C., M. Rep and C.M.J. Pieterse. 2006. Significance of inducible defense-related
proteins in infected plants. Annu. Rev. Phytopathol. 44:135-162.
Van Rensburg, P., P. Shung-Shi, A.F. García-Luis Fornés and J.L. Guardiola. 1996.
Improving cropvalue in Fino Clementine mandarin with plant growth regulators.
Proc. Int. Soc. Citricult. 2:970-974.
Whitaker, V.M., C.K. Chandler and N.A. Peres. 2014. Sensation™ „Florida127‟strawberry.
Univ. Fla. Ext. Serv. HS1256.
Whitaker, V.M., C.K. Chandler, B.M. Santos and N.A. Peres. 2008. „Florida Radiance‟
Strawberry. Univ. Fla. Ext. Serv. HS1151.
Whitaker, V.M., C.K. Chandler, B.M. Santos and N.A. Peres. 2012. Winterstar™ („FL 05-
107‟) Strawberry. Univ. Fla. Ext. Serv. HS1198.
Whitaker, V.M., N.A. Peres and S. Agehara. 2017. „Florida Beauty‟ Strawberry. Univ. Fla.
Ext. Serv. HS1307.
White, P.J. 2000. Calcium channels in higher plants. Biochimica et Biophysica Acta.
1465:171-189.
Wu, F., Z. Guan and A. Whidden. 2012. Strawberry industry overview and outlook. Food
and Resource Economics Department Publication, University of Florida Institute of
Food and Agricultural Sciences, Gainesville, FL.
Yamaguchi, T., H. Takamura, T. Matoba, J. Terao. 1998. HPLC method for evaluation of the
free radical-scavenging activity of foods by using 1,1-diphenyl2-picrylhydrazyl.
Biosci. Biotechnol. Biochem. 62:1201–1204.
161
Youssef, S.M.S., A. El-Azm, N.A. Ibrahim, A. Elhady and S.A. Elhameid. 2017. Frequent
foliar sprayings of salicylic acid with elevated concentrations enhance growth, yield
and fruit quality of strawberry (Fragaria x ananassa Duch. cv. Festival)
Plants. Egypt. J. Hortic. 44(1):61-74.
Zhang, H., L. Ma, S. Jiang, H. Lin, X. Zhang, L. Ge and Z. Xu. 2010. Enhancement of
biocontrol efficacy of Rhodotorula glutinis by salicylic acid against gray mold
spoilage of strawberries. Int. J. Food Microbiol. 141:122-125.
Zhang, Y., C. Fu, Y. Yan, X. Fan, Y.A. Wang and M. Li. 2014. Foliar application of sugar
alcohol zinc increases sugar content in apple fruit and promotes activity of metabolic
enzymes. Hort Science. 49(8):1067-1070.
Related Documents