San Lorenzo River Watershed Siltation TMDL September 20, 2002 ATTACHMENT B San Lorenzo River Total Maximum Daily Load For Sediment (Including: Carbonera Creek, Lompico Creek, and Shingle Mill Creek) State of California Central Coast Regional Water Quality Control Board 09/20/02 Staff Contact : Mark Angelo 81 Higuera St. San Luis Obispo, CA 93401 (805) 542-4771 [email protected]

Welcome message from author
This document is posted to help you gain knowledge. Please leave a comment to let me know what you think about it! Share it to your friends and learn new things together.
Transcript

San Lorenzo River Watershed Siltation TMDL September 20, 2002 ATTACHMENT B
San Lorenzo River Total Maximum Daily Load
For Sediment
(Including: Carbonera Creek, Lompico Creek, and Shingle Mill Creek)
State of California Central Coast Regional Water Quality Control Board
09/20/02
Staff Contact: Mark Angelo 81 Higuera St. San Luis Obispo, CA 93401 (805) 542-4771 [email protected]

San Lorenzo River Watershed Siltation TMDL September 20, 2002 ATTACHMENT B
San Lorenzo River Sediment Total Maximum Daily Load
TABLE OF CONTENTS
1 BACKGROUND ................................................................................................................ 1-1
2 PROBLEM STATEMENT ............................................................................................... 2-1 2.1 BENEFICIAL USES ......................................................................................................... 2-1 2.2 IMPACTS TO BENEFICIAL USES...................................................................................... 2-2
2.2.1 Fisheries (COLD, MIGR, SPWN, RARE) ............................................................ 2-2 2.2.2 Municipal Water Supply (MUN).......................................................................... 2-4
2.3 CONCLUSIONS............................................................................................................... 2-5
3 NUMERIC TARGETS...................................................................................................... 3-0 3.1 GENERAL DISCUSSION OF NUMERIC TARGETS.............................................................. 3-0 3.2 DESCRIPTION OF NUMERIC TARGETS ............................................................................ 3-0
4 SOURCE ANALYSIS........................................................................................................ 4-1 4.1 METHODOLOGY ............................................................................................................ 4-1 4.2 ANALYSIS ..................................................................................................................... 4-4
4.2.1 Two Estimates of Sediment Yield Evaluated........................................................ 4-4 4.2.2 Difference in Results Explained........................................................................... 4-5
4.3 TOTAL SEDIMENT LOAD AND YIELD ESTIMATES .......................................................... 4-6
5 LINKAGE ANALYSIS ..................................................................................................... 5-1
6 TOTAL MAXIMUM DAILY LOADS AND LOAD ALLOCATIONS ....................... 6-1 6.1 TOTAL MAXIMUM DAILY LOADS.................................................................................. 6-1 6.2 ALLOCATIONS TO EROSION SOURCE CATEGORIES ........................................................ 6-4 6.3 PERCENT CONTROLLABLE LOAD .................................................................................. 6-7
7 MARGIN OF SAFETY ..................................................................................................... 7-1
8 IMPLEMENTATION PLAN ........................................................................................... 8-1 8.1 INTRODUCTION ............................................................................................................. 8-1
8.1.1 Watershed-Wide Implementation......................................................................... 8-1 8.2 PROPOSED IMPLEMENTATION ACTIONS ........................................................................ 8-2
8.2.1 Roads (Upland and Streamside) .......................................................................... 8-6 8.2.2 Developed Parcels (THP Land and Other Urban and Rural Land).................... 8-7 8.2.3 Mass Wasting ....................................................................................................... 8-7 8.2.4 Streambanks......................................................................................................... 8-8 8.2.5 All Roads and Developed and Developing Parcels ............................................. 8-8
8.3 EXISTING IMPLEMENTATION ACTIONS.......................................................................... 8-9 8.3.1 On-going Activities Expected to Reduce Sediment Loads ................................. 8-10

San Lorenzo River Watershed Siltation TMDL September 20, 2002 ATTACHMENT B
8.3.2 Planning and Administrative Activities ............................................................. 8-10 8.3.2.1 County of Santa Cruz..................................................................................... 8-10 8.3.2.2 The City of Santa Cruz .................................................................................. 8-11 8.3.2.3 The City of Scotts Valley............................................................................... 8-11 8.3.2.4 Cooperative Planning Activities for Salmonid Recovery.............................. 8-11
8.4 REGULATORY MECHANISM BY WHICH TMDL IMPLEMENTATION IS ASSURED........... 8-14 8.4.1 Regional Board Authority to Require Implementation ...................................... 8-14 8.4.2 Three-Tier Framework for Nonpoint Source Pollution Control........................ 8-14 8.4.3 Regulatory Controls to Reduce Sedimentation.................................................. 8-15
8.4.3.1 National Pollutant Discharge Elimination System Permits ........................... 8-15 8.4.3.2 Other Agency’s Regulatory Activities........................................................... 8-16
8.5 SCHEDULE OF COMPLIANCE........................................................................................ 8-19 8.6 DEMONSTRATING COMPLIANCE.................................................................................. 8-22
8.6.1 Measures of Success .......................................................................................... 8-22 8.6.2 Failure Scenarios............................................................................................... 8-23 8.6.3 Compliance Assurance and Enforcement .......................................................... 8-23
8.7 COST OF IMPLEMENTATION......................................................................................... 8-24 8.7.1 Introduction........................................................................................................ 8-24 8.7.2 Cost of Trackable Implementation Actions........................................................ 8-25 8.7.3 Cost of Erosion Control Management practices ............................................... 8-26
8.7.3.1 Cost Basis for Management practices............................................................ 8-27 8.7.3.2 Cost of Road Management practices ............................................................. 8-30 8.7.3.3 Cost of Management Practices on Developed Parcel Erosion Controls ........ 8-31 8.7.3.4 Cost of Management Practices for Streambank Erosion Control .................. 8-32
8.7.4 Cost of Monitoring............................................................................................. 8-32 8.7.5 Total Estimate of Costs ...................................................................................... 8-33
9 MONITORING PLAN ...................................................................................................... 9-1 9.1 REGIONAL BOARD MONITORING REQUIREMENTS FOR TMDL...................................... 9-1
9.1.1 Numeric Target Monitoring at Compliance Points ............................................. 9-1 9.1.2 Regional Board Monitoring Implementation Actions.......................................... 9-2
9.2 OTHER ELEMENTS OF COMPREHENSIVE MONITORING PLAN ........................................ 9-3 9.2.1 County of Santa Cruz Streambed and Habitat Monitoring ................................. 9-3 9.2.2 Project Effectiveness Monitoring......................................................................... 9-5 9.2.3 Turbidity............................................................................................................... 9-5
9.3 DATA MANAGEMENT AND QUALITY ASSURANCE ........................................................ 9-5
APPENDIX A: WATERSHED CHARACTERIZATION........................................................ 1 GEOLOGY (FROM HECHT, 1998, PGS. 8-9) ................................................................................... 1 SOILS (FROM JAGGER, 1993, PG. 3-5 AND HECHT, 1998, PGS. 9-10) ........................................... 2 FAULTS AND SEISMIC ACTIVITY (FROM HECHT, 1998, PGS. 10-11)............................................. 3 MAJOR WILDFIRES AND STORMS (FROM HECHT, 1998, PG. 11)................................................... 4 WATER RESOURCES (FROM SWRCB, 1982, PGS. 13).................................................................. 4 LAND USE (FROM SWRCB, 1982, PGS 14-15)............................................................................. 5
APPENDIX B: BACKGROUND DATA FOR SOURCE ANALYSIS.................................... 6 SEDIMENT SOURCE CATEGORIES AND SEDIMENT PRODUCTION CALCULATION METHODOLOGY. 8

San Lorenzo River Watershed Siltation TMDL September 20, 2002 ATTACHMENT B
SYNTHETIC SUSPENDED SEDIMENT YIELD (ADAPTED FROM SH&G, 2001, APP. B).................. 21
APPENDIX C: PRIMARY REFERENCES ............................................................................ 23
APPENDIX D: SECONDARY REFERENCES ...................................................................... 25
APPENDIX E: COLOR FIGURES ......................................................................................... 27
APPENDIX F: EXCERPTS FROM FOREST PRACTICES ACT...................................... 44
APPENDIX G: COUNTY EROSION CONTROL RECOMMENDATIONS ..................... 47

San Lorenzo River Watershed Siltation TMDL September 20, 2002 ATTACHMENT B
List of Figures
Figure 1 San Lorenzo River Watershed.....................................................................................................1-3 Figure 2 Construction Activities in San Lorenzo River Watershed...........................................................1-4 Figure 3 Listed Waterbodies ....................................................................................................................... 27 Figure 4 San Lorenzo River Subwatersheds ............................................................................................... 28 Figure 5 Municipal Water Supplies ............................................................................................................ 29 Figure 6 Monitoring Sites ........................................................................................................................... 30 Figure 7 San Lorenzo River Watershed Geology ....................................................................................... 31 Figure 8 San Lorenzo River Watershed - Average Precipitation................................................................ 32 Figure 9 Sediment Yield (tons/yr) by Subwatershed .................................................................................. 33 Figure 10 THP Upland Roads Estimated Sediment Yield .......................................................................... 34 Figure 11 THP Streamside Roads on Steep Slopes Estimated Sediment Yield.......................................... 35 Figure 12 Roads by Subwatershed.............................................................................................................. 36 Figure 13 Public/Private Upland Roads Estimated Sediment Yield ........................................................... 37 Figure 14 Public/Private Streamside Roads on Steep Slopes ..................................................................... 38 Figure 15 Timber Harvesting Plan Lands Estimated Sediment Yield ........................................................ 39 Figure 16 Other Urban/Rural Lands Estimated Sediment Yield ................................................................ 40 Figure 17 Landslides................................................................................................................................... 41 Figure 18 Mass Wasting Estimated Sediment Yield................................................................................... 42 Figure 19 Stream Channel/Bank Estimated Sediment Yield ...................................................................... 43

San Lorenzo River Watershed Siltation TMDL September 20, 2002 ATTACHMENT B
List of Tables
Table 2-1 Designated Beneficial Uses for Listed Waterbodies within the San Lorenzo Watershed.........2-2 Table 3-1 Numeric Targets ........................................................................................................................3-0 Table 4-1 Descriptions of Sources of Erosion (SH&G, 2001, Table 4.1)..................................................4-3 Table 4-2 Sediment Source Estimates (SH&G, 2001, adapted from Table 4.4)........................................4-4 Table 4-3 Suspended Sediment Yields at Big Trees (USGS Data)............................................................4-5 Table 4-4 Estimated Sediment Load and Yield by Subwatershed and Source Category...........................4-7 Table 6-1 Existing Loads and Total Maximum Daily Loads for Sediment ...............................................6-1 Table 6-2 Measured Values for Streambed Sediment Parameters (See SH&G Study, Table 5.2) ............6-3 Table 6-3 Linkage of Instream Conditions to Sediment Reductions for SLR Watershed .........................6-4 Table 6-4 Linkage of Instream Conditions to Sediment Reductions for Lompico Creek..........................6-4 Table 6-5 Load Allocations by Source Category.......................................................................................6-5 Table 6-6 Calculating Load Allocations (tons/year) - Shingle Mill Creek ................................................6-6 Table 6-7 Listed Waterbody Total Maximum Daily Loads and Attainable Loads....................................6-7 Table 8-1 Trackable Implementation Actions to Address Sources of Erosion and Sedimentation ...........8-4 Table 8-2 Available Strategies and Measures to Reduce Erosion and Chronic Sediment for Sites Situated
in Inner Gorge and Hillslope Settings (SH&G, 2001, Table 6.3) ......................................................8-8 Table 8-3 Non-Regulatory Regional Board Activities Affecting Sedimentation in San Lorenzo River
Watershed ........................................................................................................................................8-12 Table 8-4 Implementation Compliance Schedule ....................................................................................8-20 Table 8-5 Annualized Costs for Trackable Implementation Actions.......................................................8-26 Table 8-6 Estimated BMP Implementation Costs....................................................................................8-27 Table 8-7 Hypothetical Cost Schedule for BMP Implementation ...........................................................8-27 Table 8-8 Cost Basis for Calculating Cost of BMP Implementation.......................................................8-28 Table 8-9 Allocation of Strategies for Road Improvement Used in Cost Estimate .................................8-30 Table 8-10 Median Cost per mile of Road Improvements.......................................................................8-30 Table 8-11 Cost Estimate of Road Improvements by Strategy................................................................8-31 Table 8-12 Cost of Developed Parcel Erosion Controls ..........................................................................8-31 Table 8-13 Cost of Streambank Erosion Control....................................................................................8-32 Table 8-14 Estimate of Annualized Cost to CCRWQCB for Monitoring TMDL Implementation.........8-33 Table 9-1 TMDL Indicator Monitoring .....................................................................................................9-2 Table 9-2 Santa Cruz County Monitoring Plan. (Source: Swanson Hydrology & Geomorphology, p. 52,
Table 5.2: Geomorphic and Sediment Conditions Monitoring Plan).................................................9-4 Table 1: Sediment Source Estimates (SH&G, 2001, adapted from Table 4.4)............................................. 7 Table 0-1 THP Road and Trails Length per Acre ......................................................................................... 9 Table 0-2 Timber Harvesting Plan Upland Roads Sediment Yield ............................................................ 10 Table 0-3 THP Streamside on Steep Slopes Road Sediment Yield ............................................................ 11 Table 0-4 Public/Private Upland Roads Sediment Yield............................................................................ 13 Table 0-5 Public/Private Streamside roads on steep slopes Sediment Yield .............................................. 14 Table 0-6 Active and Recent THPs Sediment Yield................................................................................... 16 Table 0-7 Other Urban and Rural Lands Sediment Yield........................................................................... 17 Table 0-8 Mass Wasting Weighting Factors............................................................................................... 18 Table 0-9 Mass Wasting Sediment Yield ................................................................................................... 19 Table 0-10 Channel/Bank Erosion Sediment Yield .................................................................................... 21

San Lorenzo River Watershed Siltation TMDL September 20, 2002 ATTACHMENT B
Background Page 1-1
1 Background The San Lorenzo River Estuary and the San Lorenzo River have been listed for non-attainment of established water quality standards pertaining to sediment under Section 303(d) of the Clean Water Act. Three creeks within the San Lorenzo River Watershed have also been listed. These are Shingle Mill Creek, Lompico Creek and Carbonera Creek. Section 303(d) requires the State to establish the Total Maximum Daily Load (TMDL) for sediment at a level necessary to achieve/attain the water quality standard for sediment. Seasonal variations and a margin of safety that takes into account any lack of knowledge concerning the relationship between effluent limitations and water quality must be incorporated into the TMDL. The following watershed characterization is from a State Water Resources Control Board draft staff report (SWRCB, 1982, pgs. 12-13): “The San Lorenzo River drains an area of 138 square miles in northern Santa Cruz County. The river flows southward to empty into Monterey Bay at the City of Santa Cruz (Figure 1). Much of the watershed is rugged and forested as is typical of the Coast Range south of San Francisco. “Elevations range from sea level to above 3,000 feet within the San Lorenzo River Watershed. The river drops from an elevation 2,900 feet to sea level in 22 miles, dropping the first 2,000 feet in only 3 miles. Most of the tributaries enter the river from the east where the drainage area is underlain with sedimentary rocks. Major tributaries from the east include Branciforte, Carbonera, Zayante, Newell and Bear Creeks. Boulder and Fall Creeks are the two major streams that drain the western portion of the watershed that is underlain by granitic rock. “The climate of the watershed is affected by its proximity to the Pacific Ocean. Winters are cool and wet with an average annual rainfall of about 47 inches, ranging from about 30 inches in the City of Santa Cruz to 60 inches at the community of Boulder Creek. Summers are warm and dry although cooled at times by morning fog at the lower elevations. Eighty-two percent of the rainfall occurs in the period December through April. “Highway 17 from Santa Cruz to San Jose follows the western border of the watershed. Highway 9 from Santa Cruz to Santa Clara generally follows the San Lorenzo River northward. Communities important to the watershed include Scotts Valley, Felton and Boulder Creek. “Human use of the watershed followed a pattern similar to other areas of the Coast Range within 100 miles of San Francisco Bay. In the early 1800’s, the coastal grasslands supported cattle that were a source of hides and tallow. During the 1860 to 1900 period, logging was a major activity. In 1864, 28 sawmills were operating in the Big Basin- San Lorenzo Valley (SCCPD, 1979, secondary reference). Although redwood and fir were the principal species sought as lumber, many areas were clear-cut so that other species of trees were cut and later burned in the

San Lorenzo River Watershed Siltation TMDL September 20, 2002 ATTACHMENT B
Background Page 1-2
process. “Although some forest and brush areas were converted to agricultural land in the late 1800’s and early 1900’s, agriculture has not remained an important use in the watershed. Limestone supported an important industry for a time and there were a number of sand and gravel quarries. “In the mid-1800’s, the beach at Santa Cruz and the redwood forests became an important attraction for people from the San Francisco Bay area. Many second-home developments began in the period between 1900 and 1925. This use increased and many of the small communities were well established prior to 1940. In the 1950's the San Lorenzo River was considered a "well-developed resort and recreational area (Smith, 1958, secondary reference).” Much of the watershed, though, consisted of summer homes. In 1960, the vacancy rate for the watershed was 56 percent, while the population at the time was 10,946 (Ricker, 1976, secondary reference). In the 1960’s many of the summer homes were converted to year- round residences. A number of major subdivisions were authorized and many residences were built for year-round occupancy. By 1976, many summer homes were converted to permanent residences, and the vacancy rate decreased to 21 percent, while the population rose to 30,538 (Ricker, 1976, secondary reference). Between 1960 and 1976, the number of housing units in the watershed increased from 8,982 to 14,131, a 57.3 percent increase (SCCPD, 1979, secondary reference). Most of the new development during this period was along the flat valley bottom along the streams and it was estimated that 14 percent of the homes in the watershed were within 100 feet of the San Lorenzo River or one of its tributaries (SCCPD, 1979, secondary reference).” The following is from a Central Coast Regional Board Report (Jagger, 1993, pp.12-13): “Coats (1982, secondary reference) asserted that land-use activities, including road and homesite construction, significantly increased the sediment yields in Zayante Creek and San Lorenzo River. Observations of Zayante and Lockhart Creeks by Coats (1982, secondary reference) showed that although the head and middle waters of these creeks had the same steep slopes and bedrock composition, the sediment yield was higher in the mid-basin regions, possibly because "land use has been more intense in mid-basin areas (Coats, 1982, secondary reference). Estimates on the extent of induced erosion ranged from two to four times the amount of natural erosion (SCCPD, 1979, secondary reference). The same source noted that 90 percent of landslides observed in the winter of 1978 were triggered by human disturbances. SWRCB (1982, secondary reference) stated that over 25 percent of the induced sedimentation of the San Lorenzo River was attributed to recent construction, with another 35 percent of the sedimentation blamed on erosion from unimproved paved roads. Coats (1982, secondary reference) stated that 80 percent of the induced erosion was from road construction. The County Resources Inventory Map (SCS, 1990, secondary reference) stated that impairment of Bean, Bear, Boulder, Kings, Lompico, Newell, and Zayante Creeks resulted directly from construction or development.”

San Lorenzo River Watershed Siltation TMDL September 20, 2002 ATTACHMENT B
Background Page 1-3
Figure 1 San Lorenzo River Watershed
N
Bear Cre
ek
Zaya
nte
Cree
k
Newe
ll C
reek
Lom
pico
C
reek
San Lorenzo R
ive r
Boulder Creek
Bean
Cre ek
Car
bone
ra C
reek
Bran
ci for
te C
reek
Boulder Creek
Felton
Santa Cruz
Loch Lomond Reservoir
Shingl e Mi ll C
r.
Monterey BayLos Angeles
San Francisco
Santa Cruz#
San Lorenzo RiverWatershed
0 1 2 3 4 5 Miles

San Lorenzo River Watershed Siltation TMDL September 20, 2002 ATTACHMENT B
Background Page 1-4
Construction activity is not as prevalent today, in 2001, as it was in the 1970’s and 1980’s. County data indicates that construction activity, measured in dwelling units constructed, peaked in the watershed in the 1970’s and 1980’s and has since decreased (Figure 2). Therefore, construction has not been identified as a separate sediment source category. It is included in the Other Urban and Rural Lands sediment source category. Current construction trends are towards single home development on large parcels. The access roads associated with this type of development are proving to be problematic and are addressed within the appropriate Roads Sediment Category.
02,0004,0006,0008,000
10,00012,00014,00016,00018,000
1840
s18
60s
1880
s19
00s
1920
s19
40s
1960
s19
80s
Uni
ts
by Decade
Cumulative
Figure 2 Construction Activities in San Lorenzo River Watershed The dominant cause of disturbance remains the extensive road network (Hecht, 1998, pp. 37-38). Unpaved and poorly maintained roads that are used for year-round access continue to be the most persistent sources of bed sedimentation. Increasing use and disturbance of the roadway surfaces as well as inadequate roadway drainage appear to be the primary immediate sources. Numerous small-scale failures of cut and fill slopes and culvert blowouts also introduce much debris along roads. Sidecasting of storm debris during road maintenance contributes to stream sedimentation. Road drainage practices accelerate flow to and within headwater creeks induce considerable road-related erosion downstream from the right-of-way. The connection between road construction/maintenance and culvert blowouts and eroding banks downstream is often not perceived or appreciated. Improved maintenance of existing roads is likely to prove one of the most effective means of reducing sedimentation and persistent turbidity in the San Lorenzo River Watershed. In this context, roads include those maintained by the County, State, road associations, and private owners (including those used for timber harvest and fire control).

San Lorenzo River Watershed Siltation TMDL September 20, 2002 ATTACHMENT B
Problem Statement – Page 2-1
2 Problem Statement The waterbodies that have been listed for sediment in the San Lorenzo River Watershed are: the Main Stem of the San Lorenzo River, Carbonera Creek, Lompico Creek, and Shingle Mill Creek (see Figure 3). The specific water quality objectives that apply wholly, or in part, to sediment are contained within the Central Coast Region’s Water Quality Control Plan (Basin Plan) (Central Coast Regional Water Quality Control Board, 1994, p. III-3) and are listed below: Settleable solids: Waters shall not contain settleable material in concentrations that result in
deposition of material that causes nuisance or adversely affects beneficial uses. Sediment: The suspended sediment load and suspended sediment discharge rate of surface waters
shall not be altered in such a manner as to cause nuisance or adversely affect beneficial uses.
Turbidity: Waters shall be free of changes in turbidity that cause nuisance or adversely affect
beneficial uses. Increase in turbidity attributable to controllable water quality factors shall not exceed the following limits: 1. Where natural turbidity is between 0 and 50 Jackson Turbidity Units (JTU), increases shall not exceed 20 percent. 2. Where natural turbidity is between 50 and 100 JTU, increases shall not exceed 10 JTU. 3. Where natural turbidity is greater than 100 JTU, increases shall not exceed 10 percent. Allowable zones of dilution within which higher concentrations will be tolerated will be defined for each discharge in discharge permits.
2.1 Beneficial Uses Designated beneficial uses for the San Lorenzo Watershed are listed in Table 2-1. Those beneficial uses that may be impacted by excessive sediment and/or turbidity include: 1. Cold Fresh Water Habitat (COLD) - Uses of water that support cold water ecosystems
including, but not limited to, preservation or enhancement of aquatic habitats, vegetation, fish or wildlife, including invertebrates.
2. Migration of Aquatic Organisms (MIGR) - Uses of water that support habitats necessary for
migration or other temporary activities by aquatic organisms, such as anadromous fish.

San Lorenzo River Watershed Siltation TMDL September 20, 2002 ATTACHMENT B
Problem Statement – Page 2-2
3. Spawning, Reproduction, and/or Early Development (SPWN) - Uses of water that support
high quality aquatic habitats suitable for reproduction and early development of fish. 4. Rare, Threatened, or Endangered Species (RARE) - Uses of water that support habitats
necessary, at least in part, for the survival and successful maintenance of plant or animal species established under state or federal law as rare, threatened, or endangered.
5. Municipal and Domestic Supply (MUN) - Uses of water for community, military, or individual water supply systems including, but not limited to, drinking water supply. According to State Board Resolution No. 88-63, "Sources of Drinking Water Policy" all surface waters are considered suitable, or potentially suitable, for municipal or domestic water supply except where: a. TDS exceeds 3000 mg/l (5000 uS/cm electrical conductivity); b. Contamination exists, that cannot reasonably be treated for domestic use; c. The source is not sufficient to supply an average sustained yield of 200 gallons per day; d. The water is in collection or treatment systems of municipal or industrial wastewaters,
process waters, mining wastewaters, or storm water runoff; and e. The water is in systems for conveying or holding agricultural drainage waters.
Table 2-1 Designated Beneficial Uses for Listed Waterbodies within the San Lorenzo Watershed
Waterbody Names
MUN
AGR
IND
GWR
REC1
REC2
WILD
COLD
MIGR
SPWN
BIOL
RARE
EST
FRESH
COMM
SHELL
San Lorenzo River
X
X
X
X
X
X
X
X
X
X
X
X
X
X
Carbonera Creek
X
X
X
X
X
X
X
X
X
X
X
Lompico Creek
X
X
X
X
X
X
X
X
X
X
Shingle Mill Creek
X
X
X
X
X
X
X
X
X
2.2 Impacts to Beneficial Uses
2.2.1 Fisheries (COLD, MIGR, SPWN, RARE) Anadromous fisheries are impacted by sediment within the San Lorenzo River Watershed. The San Lorenzo River and its three listed waterbodies, Carbonera Creek, Lompico Creek and Shingle Mill Creek have been identified as impaired by sediment due to impacts to beneficial uses associated with anadromous fisheries. Dramatic decreases in Coho salmon (from 5,000 in 1960 to <100 in 1980) and steelhead (from 20,000 in 1964 to 750 in 1980) populations within the San Lorenzo River and its tributaries have been attributed to the loss of suitable habitat for spawning, rearing and oversummering due to excessive sedimentation from the extensive road system, urban and suburban development and natural and man-induced landslides within the watershed. Current populations of steelhead remain at early 1980 levels, while no Coho salmon were found during 1994-1997 monitoring efforts (Alley, 1998, pp. 10-11). Decreases in fish populations have often been attributed to the loss of stream habitat resulting from excessive sedimentation (SCCPD, 1979, p. 71). “The San Lorenzo River once held the distinction

San Lorenzo River Watershed Siltation TMDL September 20, 2002 ATTACHMENT B
Problem Statement – Page 2-3
of having the largest steelhead fishery south of San Francisco (SCCPD, 1979, secondary reference). The Department of Public Health (1950-1951, secondary reference) said ‘The San Lorenzo River System is vitally important to the fisheries of the State of California,’ with 100 miles of streams supporting fishery habitats. However, the watershed has experienced severe drops in both silver (Coho) salmon and steelhead trout counts. In 1964, the number of steelhead in the San Lorenzo River was estimated at 20,000 (SCCPD, 1979, secondary reference). In 1980, that figure dropped to 750 (SWRCB, 1982, secondary reference). The salmon counts are equally discouraging. In 1960, the total salmon run was 5,000, but dropped to less than 100 by 1980 (SWRCB, 1982, secondary reference). Local groups have been stocking the river since the 1950's with 10,000 to 50,000 juvenile steelhead and silver salmon. Silver salmon stocking was discontinued in 1983 (U.S. Army Corps of Engineers, 1989, secondary reference)” (Jagger, 1993, pg 1-2). On August 18, 1997, the National Marine Fisheries Service published a final rule listing the Central California Coast and South/Central California Coast steelhead Evolutionary Significant Units (ESUs) as threatened species under the Endangered Species Act. Numeric targets have been selected that are protective of steelhead and Coho salmon habitat that are critical for spawning, rearing and overwintering. “In 1962, Hee described all of the tributaries in the watershed as having either rocky or gravelly bottoms, which are ideal for the spawning of steelhead and salmon, with only the San Lorenzo River itself having sandy conditions (Hee, 1962, secondary reference). Sedimentation has destroyed more than 50 percent of ideal streambed habitat for steelhead and salmon in the years up to 1979 (SCCPD, 1979, secondary reference)” (Jagger, 1993, p. 14). “The severe drop in fish counts indicates that the habitat in the San Lorenzo Watershed is no longer compatible with the needs of the native fish species. While other factors may also contribute to the drop in steelhead trout and silver salmon, several sources have discovered a direct correlation between siltation and survival rates of steelhead and Coho salmon fry (Shapovalov and Taft, 1954, secondary reference; SCCPD, 1979, secondary reference). Hee (1962, secondary reference) and the Santa Cruz County Planning Department (1979, secondary reference) have produced adequate descriptions of the watershed over the last thirty years to verify the fact that siltation is occurring” (Jagger, 1993, p. 16). Sedimentation problems have been associated with increased human activities in the watershed. “Prior to 1968, available literature refers to the pristine quality of the river and its attractiveness to tourists. Since 1968, various reports have documented the general decline in the quality of the water within the San Lorenzo River and a concurrent decline in salmon and steelhead populations. Early studies indicate that the amount of sedimentation was a concern only in terms of quarry sluicing (Smith, 1958, secondary reference), and the turbidity of the water was measured only as it related to sewage outfall (Hee, 1962, secondary reference). Smith (1958, secondary reference) reported that sufficient scouring of streams in the watershed occurred during winter storms to offset the inflow of sediment from storm runoff. Leonard (1968, secondary reference) was the first to document a concern for the increased erosion caused by man's activities in the watershed. Sediment deposition has caused an increase in the amount of silt-covered bottom in the San Lorenzo River from 8 percent in 1966 to 65 percent in 1972 (SCCPD, 1979 analysis of Department of Fish and Game data, secondary reference). SCCPD (1979, secondary reference)

San Lorenzo River Watershed Siltation TMDL September 20, 2002 ATTACHMENT B
Problem Statement – Page 2-4
analysis of USGS and county data revealed that, compared to expected natural rates, watershed streams have had very high rates of sediment transport. A 1990 study found that most tributaries of the watershed have been impacted by sediment from either development or unknown sources (SCS, 1990, secondary reference)“ (Jagger, 1993, p. 10). The most recent study concerning sediment conditions in the San Lorenzo River was completed in July 1998 in support of the update of the 1979 San Lorenzo River Watershed Plan. The study findings are summarized below (Hecht, 1998, p. 2): “Stream conditions have not substantially improved since the 1979 Watershed Plan, despite the original plan’s generally well-founded recommendations. The strongest comparative data are available for the Zayante and Bean Creek subwatersheds. In this portion of the watershed, the bed material is now composed of slightly finer bed material, with fewer clean spawning gravels or cobbles and boulders for summer rearing of young fish. The mineralogic composition of the bed sediment indicates that proportionately less bed sediment is originating from the upper portions of these watersheds, and more form the lower sandy portions. The upper areas are more typical of most areas of the watershed; this pattern suggests that existing measures may be helping slightly or at least inhibiting further sedimentation, although this should be regarded as an inference rather than a finding due to complicating factors. The lower portions of the two watersheds include large areas of urbanizing and eroding sandy soils, pointing to the need to address the unique challenges posed by these soils.”
2.2.2 Municipal Water Supply (MUN) The municipal water supply of the San Lorenzo Valley is dependent on the water quality of the San Lorenzo River and has been adversely affected by sediment. County residents rely on either the surface or ground waters of the San Lorenzo Watershed for their water needs. There are numerous surface water diversions within the San Lorenzo River Watershed that are used as municipal water supply. Please refer to Figure 5, in Appendix E: Color Figures, for a map display of the Municipal Water Supplies within the watershed. During high flows, surface water diversions for municipal water supplies within the San Lorenzo River and its tributaries have experienced periods where they must be shut down due to excessive turbidity and sedimentation that overwhelm the filtering capacity of the intake facilities. This causes suppliers to rely on other sources at a time when available surface water is at its greatest quantity. Currently, the impacts to municipal water supply are not clearly defined in terms of frequency and duration. There are no comprehensive records relating water supply operations to turbidity levels in the river and its tributaries. City of Santa Cruz personnel indicate that there may be a sliding scale on when intakes have to be closed and can be opened depending on river and meteorological conditions. For example, if turbidity is at 10 NTUs and there is a threat of rain the City may decide to shut down the intake in anticipation of increasing turbidity in the river if it does rain. If a storm has passed, the City may elect to open the intake when turbidity is at 25 NTUs in anticipation of decreasing turbidity as flow decreases after the storm.

San Lorenzo River Watershed Siltation TMDL September 20, 2002 ATTACHMENT B
Problem Statement – Page 2-5
There is an impression that turbidity impacts are getting “worse”. A complete review of the City’s operations log for the water intake may shed some light on the trends in turbidity levels and how they affect the City’s operations. Other issues that may affect the operations of the water supply system for the City is an aging plant with increasing demands for water and stiffer requirements for turbidity on the delivery side of the system. The stiffer turbidity requirements on the delivery side are associated with pathogens and disinfection requirements for drinking water. Also, turbidity is not strictly a sediment problem, especially in a watershed that has logging activities in it. Organic matter may be a significant component in turbidity levels. The implementation of the recommendations of this TMDL for sediment reduction will also improve turbidity, in the long run. There are no quick fixes and it is felt that decreases in sediment delivery to streams will occur over many years, so operational considerations will have to assume that turbidity will not be improved in the short-term. It is recommended that turbidity be monitored and its sources be identified as part of the Implementation and Monitoring Plan. As the issue comes into focus, numeric targets and allocations will be put in place, if warranted.
2.3 Conclusions The San Lorenzo River and its tributaries, Carbonera Creek, Lompico Creek and Shingle Mill Creek exceed narrative water quality objectives for settleable materials because beneficial uses associated with anadromous fisheries have been adversely impacted by sediment. The main impacts from sediment are to anadromous fish habitat: spawning gravels, pools and riffles. Fine sediments in spawning gravels can affect the survival of eggs by limiting flow through the gravels, thereby reducing oxygen supply to the eggs and interfering with the removal of metabolic wastes. Fine sediment in spawning gravels can also affect survival of fry by inhibiting their emergence from the redd. Pools that are used for oversummering habitat may become filled with fine sediment, reducing their volume, which in turn affects their overall usefulness. Riffles act as a source of food for fish by providing habitat for benthic invertebrates (water insects that live on the river/stream bottom) on which the fish feed. Sediment can reduce or eliminate habitat for benthic invertebrates by partially or completely covering riffles. Turbidity has been identified as a potential problem within the watershed. Specifically, municipal water supplies have had to temporarily close certain intakes due to periodic high turbidities. Most of the information surrounding the turbidity problems is anecdotal, with little specific data to establish the extent and magnitude of the impacts. Although it is recognized that turbidity does have an impact on the operation of some municipal water supplies, it is unclear what the operational parameters are that cause the closure of the intakes and the source of the turbidity has not been established. The City of Santa Cruz Water Department will install a turbidimeter at the Tait Street intake in order to better define the turbidity problem. Turbidity monitoring throughout the watershed will be part of the implementation and monitoring phase of the TMDL in order to better define the impacts as well as the sources of the turbidity.

San Lorenzo River Watershed Siltation TMDL September 20, 2002 ATTACHMENT B
Numeric Targets – Page 3-0
3 Numeric Targets
3.1 General Discussion of Numeric Targets Choosing appropriate numeric targets for sediment and relating these targets to sediment yield is difficult. The following discussion is taken from the “Protocol for Developing Sediment TMDLs” (USEPA, 1999, p. 4-3). “The watershed processes that cause adverse sediment impacts are rarely simple. These processes often vary substantially over time and space, affect designated uses in more than one way (e.g., fish spawning and rearing life stages), and are frequently difficult to relate to specific sediment sources. It is often appropriate to view sediment TMDLs as an iterative approach in which assessment tools, planning decisions, and sediment management actions are each evaluated over time to ensure that they are reasonably accurate and successful in addressing sediment concerns (emphasis added). “ In light of the foregoing discussion, these numeric targets will be further evaluated through Implementation and Monitoring and be revised as necessary. Other parameters (e.g. temperature, canopy cover) will also be monitored in order to gain a better understanding of factors affecting the instream habitat. These other parameters may be used as targets in the future targets if it is determined that they are relevant measures of water quality improvement as it relates to sediment.
3.2 Description of Numeric Targets Representative stream reaches that will be used as points of attainment have been selected as part of the monitoring strategy see Monitoring Plan, (Appendix E, Figure 6). Numeric Target monitoring will be performed triennially during low flow conditions (after spring rains have ceased and prior to the start of fall/winter rains). The following parameters will be monitored within each reach, as appropriate.
Table 3-1 Numeric Targets Parameter Numeric Target
Percent fine fines < 0.85 mm in spawning gravels
< 21% by wet volume using a McNeil Sampler
Percent coarse fines < 6 mm in spawning gravels < 30% by wet volume using a McNeil Sampler Residual Pool Volume (V*) < 0.21 (mean) and < 0.45 (max) Median particle size diameter (D50) from riffle crest surfaces
≥37 mm (minimum for a reach) ≥ 69 mm (mean for a reach)
The basis for these parameters and their associated numeric targets to provide adequate protection to the impacted beneficial uses is described below.

San Lorenzo River Watershed Siltation TMDL September 20, 2002 ATTACHMENT B
Numeric Targets – Page 3-1
1. Percent Fine Fines in Spawning Gravels Parameter: Percent fines < 0.85 mm in spawning gravels Numeric Target: < 21% by wet volume using McNeil Sampler. This value is derived from published, peer-reviewed literature (Kondolf, 2000) since no data currently exists for this parameter within the San Lorenzo River Watershed. Regional Board Staff determined this to be a legitimate numeric target for spawning areas in San Lorenzo River Watershed, since the impact to developing steelhead and salmon there should be similar to those in geographic locations where most studies have been undertaken. The value of 21 percent was derived using research values for the base percentage of fines (14 percent) and multiplying it by a factor (1/0.67) to account for fine sediment removal that occurs when the redd (nesting gravels) is constructed. The value of 14 percent was used in the Garcia River Sediment TMDL (USEPA, 1998, p. 16) and is also referenced by Kondolf (2000, p. 271). Kondolf suggests that survival rates would be around 50 percent where fines less than approximately 1 mm make up 14 percent of the total redd gravel. Redds with at least 50 percent emergence success would probably be considered as productive by most biologists (Ibid.)
The factor used to account for the fines removal during redd construction was taken from Kondolf (2000, p. 268). It was derived using linear regression for data collected from eleven sites. Kondolf found that there was a linear relationship between the percent < 1 mm in the undisturbed gravel, and the percent < 1 mm (represented by “y”) in the redd gravel. The following equation represents this relationship:
Equation 1: y = 0.67 x Where: X = percent < 1 mm in the undisturbed gravel Y = percent < 1 mm in the redd gravel
In order to go from a desired gravel condition to an initial gravel condition Equation 1 must be rearranged to:
Equation 2: x = y/0.67
The Numeric Target in potential spawning gravels then, is:
21%=14/0.67 Discussion: “Once the eggs are laid and fertilized, the spawners cover the redds with material from upstream, including clean gravels and cobbles. The interstitial spaces between the particles allow for water to flow into the interior cavity where dissolved oxygen, needed by the growing embryos, is replenished. Similarly, the interstitial spaces allow water to flow out of the interior cavity carrying away metabolic wastes. However, fine particles either delivered to the stream or mobilized by storm flow can intrude into those interstitial spaces, blocking the flow of oxygen into the redd and the metabolic

San Lorenzo River Watershed Siltation TMDL September 20, 2002 ATTACHMENT B
Numeric Targets – Page 3-2
wastes out of it. The reduced permeability into and out of the redd results in a reduction in the rate of embryo survival. ”Research on this subject has concluded that as the percentage of fines increases as a proportion of the total bulk core sample, the survival to emergence (i.e., out of the gravel) decreases. Fines that impact embryo development are generally defined as particles that pass through a 0.85 mm sieve“ (Garcia River Sediment TMDL, USEPA, 1998, p. 16). Monitoring of fine sediment for compliance with this target will be conducted using a McNeil bulk sampler applied directly to potential spawning substrates. The Monitoring Plan identifies sampling protocols. This numeric target will be evaluated as part of the TMDL Monitoring Plan to ensure the target’s applicability to the San Lorenzo River Watershed and to verify that the targets show attainment of the TMDL. If, after three years of monitoring, median particle size diameter (D50) values are found to be correlated (≥ r2 = 0.70) with percent fines in bedload as collected in a McNeil bulk sampler, percent fines will be measured on a less frequent basis.
2. Percent of Coarse Fines in Spawning Gravels
Parameter: Percent fines < 6 mm in spawning gravels Numeric Target: < 30% by wet volume using a McNeil Sampler Values characterizing the effect of coarser fine sediment on emergence appear in the literature and staff relied upon these to establish this numeric target. Values associated with 50% emergence average about 30% for sediment finer than both 3.35 mm and 6.35 mm (Kondolf, 2000, p. 271). Staff considers 30% to be a legitimate numeric target for the San Lorenzo River Watershed, since the impact to developing steelhead and Coho salmon from fines there should be similar to those for geographic locations where most studies have been undertaken. The grain size of 6 mm was chosen because it falls between the values cited by Kondolf (3.35 mm and 6.35 mm) associated with the value of 30% used as the numeric target. No factor accounting for removal of coarser fines by fish during redd construction was applied to this value, as was done for the percent fines less than 0.85 mm, because the data are more variable, than similar data for fines less than 0.85 mm. Discussion: Sedimentation has been identified as one of the principal factors in determining the survival rate from deposition to hatching of eggs and the survival rate from hatching to emergence from the gravel (Shapovalov and Tact, 1954, p. 155). The coarser fines, > 0.85 mm and < 6.5 mm, can impede emergence of fry from the redd thereby reducing survival rates for fry.
“Steelhead and salmon require spawning sites with gravels (from ¼ in. to 3-1/2 in. diameter) having a minimum of fine material (sand and silt) mixed with them and with good flows of clean waters moving over and through them. Increases in fine materials from sedimentation, or cementing of the gravels with fine materials, restrict water and

San Lorenzo River Watershed Siltation TMDL September 20, 2002 ATTACHMENT B
Numeric Targets – Page 3-3
oxygen flow through the redd (nest) to the fertilized eggs. These restrictions reduce hatching success. In many local streams, steelhead appear to successfully utilize substrates for spawning with high percentages of coarse sand which probably reduce hatching success… “Unless hatching success has been severely reduced, however, survival of eggs and larvae is usually sufficient to saturate the limited available rearing habitat in most small coastal streams,” (Alley, 1998, p. 14). Monitoring of fine sediment for compliance with this target will be conducted using a McNeil bulk sampler directly applied to potential spawning substrates. The Monitoring Plan identifies sampling protocols. This numeric target will be evaluated as part of the TMDL Monitoring Plan to ensure the target’s applicability to the San Lorenzo River Watershed and to verify that the targets show attainment of the TMDL. If after three years of monitoring, median particle size diameter (D50) values are found to be correlated (≥ r2=0.70) with percent fines in bedload as collected in a McNeil bulk sampler, percent fines will be measured on a less frequent basis.
3. Residual Pool Volume
Parameter: Residual Pool Volume (V*) Numeric Target: < 0.21 (mean) and < 0.45 (max) Since no data related to V* has been developed for the San Lorenzo River Watershed or any comparable watersheds in the region this value is taken from the Garcia River Sediment TMDL. The numeric target will be modified, if necessary, as V* data for the San Lorenzo River Watershed becomes available. Discussion: V* gives a direct measurement of the impact of sediment on pool volume. It is the ratio of the amount of pool volume filled in with fine, mobile sediment, and the total scour pool volume (Lisle, 1993). Overwintering habitat requirements include “deeper pools, undercut banks, side channels, and especially large, unembedded rocks provide shelter for fish against the high flows of winter. In some years, such as 1982, extreme floods may make overwintering habitat the critical factor in steelhead production. In most years, however, if the pools have sufficient larger boulders or undercut banks to provide summer rearing habitat for yearling steelhead, then these elements are sufficient to protect them against winter flows. “Pool habitat is the primary habitat for steelhead in summer in the San Lorenzo River, especially in San Lorenzo tributaries and the upper San Lorenzo River above the Boulder Creek confluence. The deeper it is the move value it has. The densities of yearling steelhead are usually regulated by water depth and the amount of escape cover that exists during low-flow periods of the year (July-October). In most small coastal streams, availability of this ‘maintenance habitat’ provided by depth and cover appears to determine the number of smolts produced by the smaller streams” (Alley, 1998, p. 15, 16).

San Lorenzo River Watershed Siltation TMDL September 20, 2002 ATTACHMENT B
Numeric Targets – Page 3-4
4. Median Particle Size
Parameter: Median particle size diameter (D50) in spawning gravels Numeric Target: > 37 mm (minimum for a reach); > 69 mm (mean for a reach); with an approximately normal distribution of grain size. Discussion (adapted from Redwood Creek Sediment TMDL (USEPA, 1998): The D50 is the median value of the size distribution in a sample of surface pebble counts. It is a measure of the central tendency of the whole sample, and thus is one of several indicators of how "fine" or "coarse" the sample is overall. As discussed in the discussion for the percent fines targets, both amount and size of fine and coarse sediments can impact salmonid lifestages. The D50 indicator is selected for the San Lorenzo River and its tributaries because it is easy to calculate based on results from pebble counts. In a study that evaluated the relationship between hillslope disturbance and various instream indicators, Knopp (1993) found that clear trend of decreasing particle sizes in the riffles was evident with increasing hillslope disturbance. Moreover, Knopp found that a statistically significant difference in average and minimum D50 values when comparing reaches in undisturbed and less disturbed watersheds with reaches in moderately and highly disturbed watersheds. Therefore, the D50 levels identified in undisturbed and less disturbed locations are good candidates for numeric targets for the San Lorenzo River and its tributaries. Knopp also found that the moderately disturbed reaches were not statistically different from the highly disturbed reaches. This indicates that D50 results may take upwards of 40 years before mitigation of current disturbance is positively reflected. The recommended numeric targets may require revision as more data is gathered within the watershed. By setting two numbers in the Redwood Creek Sediment TMDL, USEPA recognizes that there may be annual variability in this target. These values are based on Knopp’s findings (1993) concerning D50 levels in north coast watersheds that were relatively undisturbed. Because Knopp found the D50 to be a discriminating indicator (that is, an indicator capable of distinguishing between watersheds which were more or less disturbed as a result of prior management), the indicator and associated target levels identified in Knopp’s study are appropriate.

San Lorenzo River Watershed Siltation TMDL September 20, 2002 ATTACHMENT B
Source Analysis – Page 4-1
4 Source Analysis
4.1 Methodology
Source analysis for the listed waterbodies (except the San Lorenzo River Estuary) is based on the work performed by Swanson Hydrology and Geomorphology (SH&G, 2001) under contract to the Santa Cruz County Environmental Health Department. The SH&G study focused on three subwatersheds within the San Lorenzo River Watershed: Newell Creek, Zayante Creek and Bean Creek. One of the five listed waterbodies, Lompico Creek, is a subwatershed of Zayante Creek and therefore was part of the SH&G study. The other four listed waterbodies (San Lorenzo River, Shingle Mill Creek, Carbonera Creek and the San Lorenzo River Estuary) were not part of the study. However, information from the other subwatersheds was applied to the listed waters. This source analysis relies on sediment source categories, erosion rates and delivery ratios as developed in the SH&G study. Refer to Appendix B: Background Data for Source Analysis for a more detailed explanation of the sources. Refer to Appendix E: Color Figures for maps associated with the Source Analysis. The sediment source category “Streamside Roads on Steep Slopes” corresponds generally to the “Inner Gorge Roads” category in the Zayante Area Sediment Source Study (SH&G, 2001). This change was made to avoid confusion between the California Department of Mines and Geology (DMG) definition of “inner gorge” and the “inner gorge” roads category. The DMG definition of “inner gorge” is as follows: An inner gorge is a geomorphic feature formed by coalescing scars originating from landsliding and erosional processes caused by active stream erosion. The feature is identified as that area of stream bank situated immediately adjacent to the stream channel, having a side slope of generally over 65 percent, and being situated below the first break in slope above the stream channel. The streamside roads on steep slopes category includes roads within 200 ft of a stream course and on slopes > 15%. The sediment source category for “Upland Roads” corresponds generally to the “Hillslope Roads” category in the Zayante Area Sediment Source Study (SH&G, 2001). Existing sediment loads for the listed waterbodies were calculated as follows (See Appendix B: Background Data for Source Analysis for a more a detailed explanation of how the data were developed): 1. Sediment source categories were defined (See Table 4-1). These categories are
representative of the sediment sources found within the subject watersheds.
2. The sediment source categories were assigned erosion rates and delivery ratios that were used to calculate sedimentation rates used in the source analysis (see Table 4-2). The erosion rate is the estimated erosion production for a particular sediment source category. It is expressed either in tons/sq mi/yr for area features, or tons/mi/yr for linear features. The delivery ratio is the percentage of the erosion rate for a particular category that reaches a waterbody. Sediment yield for a sediment source category is the erosion rate multiplied by the delivery ratio multiplied by the area or linear measure for that sediment source category.

San Lorenzo River Watershed Siltation TMDL September 20, 2002 ATTACHMENT B
Source Analysis – Page 4-2
3. The watershed was divided into subwatersheds that were used to accumulate sediment
yields. The base subwatersheds that were defined for this TMDL were from the Calwater 2.2 GIS dataset (Figure 4). They are at the Planning Watershed Level, which is the smallest watershed level within the Calwater dataset. Calwater 2.2 is the third version of the California Watershed Map that is a set of standardized watershed boundaries. The dataset has been reviewed by an Interagency California Watershed Mapping Committee, which includes federal and state agencies. The watershed boundaries are nested in a hierarchical structure. At the highest level there are Hydrologic Regions (1st level), then Hydrologic Units, Hydrologic Areas, Hydrologic Sub-Areas, Super Planning Watersheds and Planning Watersheds (6th level). The Planning Watersheds do not coincide exactly with the San Lorenzo River Watershed or the listed waterbody subwatersheds, so the Planning Watersheds were modified to include subwatersheds for listed waterbodies and to limit the watershed to those lands that drain into the San Lorenzo River. The names of three subwatersheds have been changed from the name assigned in Calwater. This was done to conform to local naming conventions. The original names of the three subwatersheds and their new names are as follows: Original Calwater Name New Name Castlerock Falls Upper San Lorenzo River San Lorenzo River Middle San Lorenzo River Love Creek Ben Lomond The use of multiple subwatersheds allowed for a finer look at sediment sources and will facilitate implementation planning by highlighting differences in the spatial distribution of the various sediment sources.
4. Geographic Information System (GIS) coverages were used to sum area and linear measures by sediment source category for the subwatershed. These values were multiplied by the associated sedimentation rate and summed to calculate the existing sediment yield for the listed waterbody (see Table 4-4 Estimated Sediment Load and Yield by Subwatershed and Source Category).
5. Results of this analysis were validated with the results of the synthetic average sediment yield developed in the SH&G report. Refer to the Analysis section below.

San Lorenzo River Watershed Siltation TMDL September 20, 2002 ATTACHMENT B
Source Analysis – Page 4-3
Table 4-1 Descriptions of Sources of Erosion (SH&G, 2001, Table 4.1) Sediment Source
Category Source Extent Erosion Description/Types/Sources
Timber Harvest Plan (THP) Roads (streamside on steep slopes)
THP Roads (Upland)
Includes road cuts, shoulders, surfaces, and ditches on permanent and seasonal roads and skid trails
Predominately surface erosion from road related activities including erosion from drainage modifications caused by roads. This category is considered to be 100% human caused. This category was further divided into streamside on steep slopes (roads within 200 ft of a waterway) and upland roads because of differences in delivery ratios.
Public and Private Roads (streamside on steep slopes)
Public and Private Roads (Upland)
Includes road cuts, shoulders, surfaces, and ditches on paved and dirt roads
Predominately surface erosion from road related activities including erosion from drainage modifications caused by roads. This category is assumed to be 100% human caused. This category was further divided into streamside on steep slopes (roads within 200 ft of a waterway and on slopes less than 15%) and upland roads because of differences in delivery ratios.
Active and Recent THP Parcels
Includes forested lands with Timber Harvest Plans generated since 1987
Includes all surface erosion including sheet erosion, rills, and gullies. This category has both a human and natural component.
Other Urban and Rural Lands
Includes all forested and unforested lands outside of recent Timber Harvest Plan plots
Includes surface erosion from sheet erosion, rills, and gullies as well as mass wasting (i.e. – landslides, debris flows). The mass wasting component was pulled out of the final numbers and put into a separate mass wasting category. This category has both a human and natural component.
Mass Wasting
Includes all lands within the study area
Erosion from landslides and debris flows are included in this category along with road and disturbance related mass wasting. This category has both a human and natural component though the available data is insufficient to determine their proportions.
Channel/Bank Erosion
Includes all stream corridors within the study area
Includes main channel, banks, and floodplain areas of the stream. Does not include landslide toes and erosion from culvert outfalls. This category is predominately natural though rates can be accelerated from human activities
Discussion of development of the erosion rates, delivery ratios and sedimentation rates is located in Appendix B: Background Data for Source Analysis. Table 1 in Appendix B has the same information as Table 4-2 and also includes footnotes providing detail on how delivery ratios were developed.

San Lorenzo River Watershed Siltation TMDL September 20, 2002 ATTACHMENT B
Source Analysis – Page 4-4
Table 4-2 Sediment Source Estimates (SH&G, 2001, adapted from Table 4.4)
Sediment Source Category Erosion Rate Delivery Ratio Sedimentation Rate
THP Roads (streamside on steep slopes) 413 tons/mi/yr 1.00 413 tons/mi/yr
THP Roads (upland) 413 tons/mi/yr 0.42 173 tons/mi/yr
Public and Private Roads (streamside on steep slopes)
120 tons/mi/yr 1.00 120 tons/mi/yr
Public and Private Roads (upland- <=15% slope w/in 200 ft. of stream, >15% slope outside 200 ft. of stream)
120 tons/mi/yr 0.42 50 tons/mi/yr
Public and Private Roads (upland- <=15% slope outside 200 ft. of stream)
120 tons/mi/yr 0.10 12 tons/mi/yr
Active and Recent THP Parcels 206 tons/mi2/yr 0.42 87 tons/mi2/yr
Other Urban and Rural Lands 1310 tons/mi2/yr 0.42 550 tons/mi2/yr
Mass Wasting 3570 tons/mi/yr 0.42 1500 tons/mi/yr
Channel/Bank Erosion – Alluvium and Santa Margarita Sandstone Geologic Units
400 tons/mi/yr 1.00 400 tons/mi/yr
Channel/Bank Erosion – Other Geologic Units
200 tons/mi/yr 1.00 200 tons/mi/yr
4.2 Analysis
4.2.1 Two Estimates of Sediment Yield Evaluated Staff used the more conservative of two estimates of sediment yield. A “synthetic suspended sediment yield,” and a “simplified model” were used to develop the two estimates. The adjusted yield of 2,550 tons/sq mi/yr, generated by the synthetic suspended sediment yield method, provides a better basis from which to calculate required load reductions than the simplified model, since it is based on a longer period of record. However, staff relied on the simplified model because it was constructed in such a manner that yields by individual erosion categories could be derived, and load allocations determined accordingly. The simplified model generated an estimate yield of 3,056 tons/sq mi/yr and was based on calculated delivery ratios developed by SH&G from one year of data from the Soquel Creek Watershed—a watershed adjacent and to the south east of the San Lorenzo River Watershed. Staff considers the instream measurements used to develop the synthetic suspended sediment yield are actually more representative of actual conditions within the watershed than the simplified model used to develop the estimated sediment yields for this TMDL. The synthetic suspended sediment yield is based on ten years of actual suspended sediment data for the San Lorenzo River that was correlated to flow and then extrapolated over 60 years of flow data. The ten years of suspended sediment data were collected between 1973-1982, a period of increasing residential/commercial development, with a concomitant increase in sediment production and delivery, within the watershed (Table 4-3). This period also included years of extremely low rainfall and years of extremely high rainfall. The extreme variability of the sediment yield from year-to-year

San Lorenzo River Watershed Siltation TMDL September 20, 2002 ATTACHMENT B
Source Analysis – Page 4-5
is apparent in these data. In the course of ten years, sediment yield varied from 5-tons/sq mi/year during the drought in the mid-1970’s, to 14,458-tons/sq mi/yr during an El Niño year in 1982. Additionally, 20% of the total sediment yield for the decade moved in one day in 1982.
Table 4-3 Suspended Sediment Yields at Big Trees (USGS Data)
Water Year
Sediment Yield (tons/sq
mi/yr)
Sediment Yield
(tons/yr)
Maximum Daily
Sediment Yield
(tons/sq mi/day)
Maximum Daily Sediment
Yield (tons/day)
Maximum Daily Yield as
Percent of Yearly Yield
1973 4,134 438,211 1,179 125,000 28.5% 1974 881 93,350 144 15,300 16.4% 1975 606 64,195 158 16,800 26.2% 1976 5 532 1 148 27.8% 1977 5 564 1 84 14.9% 1978 3,166 335,582 845 89,600 26.7% 1979 272 28,877 125 13,200 45.7% 1980 3,988 422,781 1,113 118,000 27.9% 1981 194 20,549 112 11,900 57.9% 1982 14,458 1,532,515 5,745 609,00 39.7%
4.2.2 Difference in Results Explained The difference between estimated sediment yields from the simplified model and the synthetic suspended sediment model, may be explained by a number of factors. The uncertainty in the simplified model yields for individual source categories is rather large. Most of the yields that were developed came from limited data sets, thereby increasing the uncertainty of the data. Also, the estimated sediment yields were developed for an area of the watershed that is considered more erodible than the rest of the watershed due to a preponderance of Santa Margarita Sandstone. Applying these same estimates over the whole of the watershed would result in overestimation of sediment yield. Lastly, the simplified model yields are summed at the subwatershed level for which areas range from 0.7 sq mi to 16.2 sq mi. The sediment data used in the synthetic model are from the Big Trees station; a watershed of 106 sq mi. Sediment yield per sq mi varies inversely with watershed area. That is, as watershed area increases, sediment yield per sq mi decreases. There are two main reasons for this: 1) as watershed size increases, storm events become more variable over the watershed producing sediment at different rates depending on storm intensity, thereby smoothing the effects of localized intense rainfall events; and 2) sediment is moved through a small system more efficiently than a large system, therefore a higher percentage of the sediment that reaches a stream network in a small watershed will exit that watershed in a given year relative to a larger watershed. This is due, in part, to the fact that the larger the watershed, the lower the overall gradient of the streams in the watershed, which in turn causes more sediment to be stored within the large watershed relative to a small watershed.

San Lorenzo River Watershed Siltation TMDL September 20, 2002 ATTACHMENT B
Source Analysis – Page 4-6
This effect can be seen from the synthetic suspended sediment load produced for the Zayante Creek Station as part of the SH&G study. The Zayante Creek station is located on a tributary to the mainstem, upstream of the Big Trees station. SH&G estimated a synthetic suspended sediment load for Zayante Creek (11.1 sq mi) at 4,900 tons/sq mi/yr over its period of record (1958-1992). This is more than twice the synthetic suspended sediment yield developed for the Big Trees station (2,320 tons/sq mi/yr) with its 106-sq mi watershed. In order to compare the simplified model sediment yield to the synthetic suspended sediment yield, the synthetic sediment yield must be increased to account for bedload. The synthetic suspended sediment yield was increased by 10%, which is the upper end of the range of bedload values discussed above. The adjusted synthetic suspended sediment yield is calculated as follows: Adjusted synthetic sediment yield = 2,320 tons/sq mi/yr x 1.10 = 2,550 tons/sq mi/yr. The average sediment yield of 3,056-tons/sq mi/yr derived in the source analysis is within 20% of the synthetic average sediment yield of 2,550 tons/sq mi/yr.
4.3 Total Sediment Load and Yield Estimates Table 4-4 Estimated Sediment Load and Yield by Subwatershed and Source Category represents the culmination of the Source Analysis. It summarizes all of the calculations that were performed as part of the source analysis, which are described in detail in Appendix B: Background Data for Source Analysis. On a watershed-wide level approximately 29% of the sediment yield is associated with THP roads and Public/Private roads. This is significant because all of the erosion associated with roads is considered to be wholly induced by humans, therefore it offers a good opportunity for sediment reduction. Mass wasting is the dominant source of sediment within the basin, accounting for 41% of the sediment delivered to streams. Other Urban and Rural lands and Channel/Bank Erosion each contribute approximately 15% of the sediment load and 14% of the load, respectively. Sediment from THP lands is a small portion of the overall sediment load, less than 1%. The upper subwatersheds of Upper San Lorenzo River, Kings Creek, Boulder Creek, and Bear Creek along with Zayante Creek represent the majority of sediment yield associated with Timber Harvesting Plans and Mass Wasting. Kings Creek subwatershed represents the maximum value of sediment yield associated with THPs while Upper San Lorenzo River Subwatershed produces the most sediment associated with Mass Wasting. Mass Wasting is also significant in the Bean Creek and Branciforte Creek subwatersheds. Sediment yields associated with Public/Private roads and Other Urban and Rural Lands are more evenly distributed throughout the entire watershed with the maximum amount for both sources located in the San Lorenzo River subwatershed. Channel/Bank erosion is also distributed somewhat evenly throughout the watershed, with the maximum value associated within the San Lorenzo River

San Lorenzo River Watershed Siltation TMDL September 20, 2002 ATTACHMENT B
Source Analysis – Page 4-7
subwatershed. Zayante Creek subwatershed has the maximum total sediment yield with a value of 54,836 tons/yr, which represents 13.1% of the total sediment yield for the entire watershed. Newell Creek subwatershed contributes a disproportionately small amount of sediment relative to its size. This is because of the sediment trapping efficiency of Loch Lomond Reservoir. As part of the development of the estimated sediment yields, only 10% of the sediment produced above Loch Lomond Reservoir was included in the totals shown in Table 4-4. This represents a 90% trapping efficiency for the Reservoir.

San Lorenzo River Watershed Siltation TMDL September 20, 2002 ATTACHMENT B
Source Analysis – Page 4-8
Table 4-4 Estimated Sediment Load and Yield by Subwatershed and Source Category
SubWS ID Subwatershed Area
(sq mi)
Upland THP
Roads (tons/yr)
Streamside on steep
slopes THP Roads
(tons/yr)
Upland Public/Private
Roads (tons/yr)
Streamside on steep slopes
Public/Private Roads
(tons/yr)
THP Lands
(tons/yr)
Other Urban and Rural
Lands (tons/yr)
Mass Wasting(tons/yr)
Stream Channel/
Bank Erosion (tons/yr)
Total Sediment
Yield (tons/yr)
% of Total
Sediment Yield
(tons/sq mi/yr)
304.12010 Upper San Lorenzo River 11.53 5,915 2,683 2,260 951 134 5,491 32,085 4,712 54,231 12.93% 4,703
304.12011 Kings Creek 12.13 10,677 4,842 1,921 1,317 319 4,648 17,419 5,172 46,315 11.04% 3,818304.12020 Boulder Creek 11.47 7,708 3,496 2,003 1,176 232 4,839 10,580 5,312 35,346 8.43% 3,082304.12021 Ben Lomond 10.32 4,143 1,879 3,147 1,509 106 5,005 23,499 4,964 44,252 10.55% 4,288
304.12022 Middle San Lorenzo River 15.87 2,284 1,036 3,291 1,294 71 8,284 12,215 8,190 36,665 8.74% 2,310
304.12023 Shingle Mill Creek 0.71 0 0 275 150 0 391 0 358 1,174 0.28% 1,654
304.12030 Bear Creek 16.23 9,230 4,186 2,566 1,638 246 7,368 12,975 6,422 44,631 10.64% 2,750304.12031 Newell Creek 9.72 1,539 698 590 79 49 1,018 1,503 935 6,411 1.53% 660304.12040 Zayante Creek 14.02 6,924 3,140 3,376 1,432 207 6,393 28,110 5,254 54,836 13.08% 3,911304.12041 Bean Creek 10.41 1,753 795 2,804 1,499 49 5,416 13,937 6,134 32,387 7.72% 3,111304.12042 Lompico Creek 2.77 883 401 896 582 23 1,378 7,156 1,236 12,555 2.99% 4,532
304.12050 Carbonera Creek 7.08 878 398 2,583 295 33 3,687 4,464 3,728 16,066 3.83% 2,269
304.12051 Branciforte Creek 9.95 1,676 760 2,051 1,744 39 5,223 10,688 5,088 27,269 6.50% 2,741
304.12052 Pasatiempo Creek 0.8 0 0 348 0 0 442 87 0 877 0.21% 1,096
304.12053 Santa Cruz 4.23 0 0 1302.4 54 0 2,327 31 2,638 6,352 1.51% 1,502Total Sediment Load for
San Lorenzo River(tons/yr) 137.23 53,610 24,314 29,415 13,720 1,508 61,910 174,749 60,143 419,369 100.00% 3,056 % of Total 12.78% 5.80% 7.01% 3.27% 0.36% 14.76% 41.67% 14.34% 100.00%
Sed. Yield (tons/sq mi/yr) 391 177 214 100 11 451 1,273 438 3,056 Note: Waterbodies listed for sediment impairment on the 1998 303(d) List are shown in bold.

San Lorenzo River Watershed Siltation TMDL September 20, 2002 ATTACHMENT B
TMDL and Allocations – Page 5-1
5 Linkage Analysis This linkage analysis examines the relationship between sediment loadings and numeric targets identified in the previous section. The linkages addressed are identified in the chart below. Improved linkage may be realized through evaluation of monitoring data collected to measure progress toward each target.
This TARGET is LINKED to the LOADING to: Residual Pool Volume
Median Gravel DiameterPercent Fine fines
Percent Coarse fines
San Lorenzo River, Shingle Mill
Creek, Carbonera Creek and Lompico Creek
Staff assumes that changes in the target parameters are related to changes in sediment load, but that these linkages are generally indirect and highly variable. However, over the long term, reductions in sediment inputs to the stream system are expected to result in reduction in sediment distributions in the channel and improvements in the numeric target parameters. Improved linkage may be realized through evaluation of monitoring data collected to measure progress toward each target. Knopp’s (1983) study of northern California coastal streams demonstrated that sediment generated from upslope disturbance had a measurable effect on the structure of the aquatic environment (p.40). He identified a statistical link between watershed disturbance and several in-stream sediment indicators, including residual pool volume (V*) and median gravel diameter (D50). This linkage is the basis for selecting the four stream substrate targets. Calculating the actual loading that would produce the desired substrate conditions as expressed in the targets, would require data that are not currently available. These data would include accurate background sediment loads and baseline conditions of each parameter associated with those loads. In the absence of these data, Regional Board staff relied on available data for embeddedness and percent of sediment particles less than 4mm to establish a load (see Section 6 Total Maximum Daily Loads and Load Allocations).

San Lorenzo River Watershed Siltation TMDL September 20, 2002 ATTACHMENT B
TMDL and Allocations – Page 6-1
6 Total Maximum Daily Loads and Load Allocations
6.1 Total Maximum Daily Loads The TMDL for San Lorenzo River Watershed listed waterbodies was established as a 27 percent reduction from current loads for the San Lorenzo River, Carbonera, and Shingle Mill Creeks, and a 24 percent reduction for Lompico Creek (Table 6-1). Table 6-1 Existing Loads and Total Maximum Daily Loads for Sediment
Existing conditions of measured instream parameters were related to desired conditions in order to calculate the percent reduction in sediment loads. Staff assumed a one-to-one correspondence between sediment source reductions needed and reductions in stream sediment levels as measured by these indicators. Although the actual relationship between sediment delivery and instream conditions influenced by sediment dynamics is poorly understood, this one-to-one correspondence is considered a reasonable and conservative approximation. This basic approach can be seen in the Protocol for Developing Sediment TMDLs (USEPA, 1999, p. 6-3). In the protocol it gives the following simple relationship for linking existing conditions to sediment loadings:
existing instream condition ~ existing sediment loadings desired instream condition target sediment loadings
1 Expressed here as an annual load (tons/year).
Existing Sediment Load
(tons/yr) Sediment Source
Category San Lorenzo River Lompico Creek Carbonera Creek Shingle Mill Creek
Upland THP Roads 53,610 883 878 0Streamside THP Roads on steep slopes 24,314 401 398 0Upland Public/Private Roads 29,415 896 2,583 275Streamside Public/Private Roads on steep slopes 13,720 582 295 150THP Land 1,508 23 33 0Other Urban and Rural Land 61,910 1,378 3,687 391Mass Wasting 174,749 7,156 4,464 0Channel/Bank Erosion 60,143 1,236 3,728 358
Total 419,369 12,555 16,066 1,174
TMDL1= (1.00 – % Reduction *Existing Load)
TOTAL MAXIMUM DAILY LOADS
(1.00-.027)*419,369= 306,139
(1.00-.024)*12,555= 9,542
(1.00-.027)*16,066 = 11,728
(1.00-.027)*1,174= 857

San Lorenzo River Watershed Siltation TMDL September 20, 2002 ATTACHMENT B
TMDL and Allocations – Page 6-2
From this relationship, the target sediment loadings as a percentage of existing sediment loadings can be developed as follows:
target sediment loadings = (existing instream condition - desired instream condition) existing instream condition This is the equation used in Table 6-3 and Table 6-4. Regional Board staff choose embeddedness of particles 16 mm and greater (0.63 in.) and percent sediment less than 4 mm as the parameters upon which to base calculations of percent reduction in loading. These parameters were used because monitoring data were available in the SH&G Study (2001, p. 44). Cobbles and boulders larger than approximately 6 inches (150 mm) in diameter provide good, heterogeneous habitat for aquatic insects in riffles and runs if they are embedded less than 25 percent. Cobbles and boulders larger than 9 inches (225 mm) in diameter provide potential fish cover if embedded less than 25 percent (Alley, 1998). For rearing habitat, young-of-the-year steelhead and salmon appear to be regulated by available insect food, although cover (hiding areas, provided by undercut banks, large rocks which are not buried or “embedded” in finer substrate, surface turbulence etc.) and pool and riffle depth are also important, especially for larger fish. The abundance of food (aquatic and terrestrial insects that fall into the stream) and fast-water feeding positions for capture of the drifting insects in “growth habitat” determines the size of these smolts. Increased embeddedness and loss of pool depth due to increased sedimentation from fines negatively affect survival success for different life stages of steelhead and salmon. Regional Board staff selected a desired condition of 20 % for percent sediment less than 4 mm. This differs from the recommended desired condition of 30% in the Zayante Area Sediment Source Study (SH&G, 2001, pg. 44). Staff selected the lower 20 % value for the desired condition: • to add a measure of conservatism to the linkage analysis, • to account for differences in pebble count results versus bulk sampling results, and • to acknowledge that local conditions for percent sediment less than 4 mm in the late 1970’s
and 1980 were generally less than or equal to 12% (SH&G, 2001, pg. 47-Table 5.3). SH&G selected the value of 30% based on impacts to spawning success and primary benthic invertebrate production (SH&G, 2001, pg. 44). Spawning success depends on percent fines within the spawning gravel matrix, but the SH&G measurements were of surface pebbles, not the entire matrix. Kondolf (2000, pg. 267) indicates that the surface layer of gravel is typically coarser than the underlying, subsurface layers. Sampling the gravel surface layer can give a good indication of the framework size of the gravel matrix, but subsurface sampling is required to assess the entire grain size distribution of the gravel matrix. There is no known relationship between the gravel surface grain size distribution and the gravel matrix grain size distribution, so a definitive reduction factor for the matrix versus the surface grain sizes cannot be assigned. Staff reviewed conditions prevailing in the late 1970’s and 1980 to provide a physical basis for reducing the desired condition value to a more conservative value.

San Lorenzo River Watershed Siltation TMDL September 20, 2002 ATTACHMENT B
TMDL and Allocations – Page 6-3
Measured values from this time period range from 0% to 38% with most values less than or equal to 12%. Staff selected a value of 20% for the desired condition in recognition of the prevailing conditions 20 years ago, while recognizing that the sample size is small and may not be representative of conditions within the watershed as a whole. Table 6-2 lists the current conditions within the SH&G study area. It can be seen that values for percent sediment less than 4 mm vary from a high of 55% downstream of the Mt. Hermon slide on Bean Creek to a low of 1% downstream from Loch Lomond Reservoir on Newell Creek. Values for embeddedness range from 60% downstream of the Mt. Hermon slide on Bean Creek and 22% downstream on of Loch Lomond Reservoir on Newell Creek. Since the SH&G Study measured embeddedness for particles as small as 16 mm (0.63 in.), the embeddedness values from the SH&G monitoring, depicted in Table 6-2, are considered to be high relative to values that would be measured if embeddedness of particles 100mm (4 in.) and greater were monitored. Table 6-2 Measured Values for Streambed Sediment Parameters (See SH&G Study, Table 5.2)
SH&G Site ID
Date of Sample Location of Site <4 mm Embeddedness
B-1 6/5/99 Bean Creek below Lockhart Gulch 42% 52% B-2 7/30/99 Bean Creek at 1956 DWR site 23% 50% B-3 7/10/99 Bean Creek downstream of Mt. Hermon slide 55% 60% B-4 7/24/99 Bean Creek upstream of Mt. Hermon slide 15% 49% L-1 9/18/99 Love Creek below slide 12% 44% N-1 6/19/99 Newell Creek at Steel bridge 1% 23% N-2 6/19/99 Newell Creek above Glen Arbor Bridge 4% 22% Z-1 10/21/99 Woodwardia, Zayante Creek 38% 54% Z-2 5/22/99 Woodwardia, Zayante Creek 34% 47% Z-3 6/12/99 Mountain Charlie Gulch 38% 24% Z-4 6/22/99 Zayante Creek above Mtn Charlie Gulch 11% 39% Z-5 6/19/99 Zayante Creek store 27% 42% Z-6 6/26/99 Zayante Creek at Graham Hill Road 16% 46% Z-7 6/12/99 Zayante Creek scour logs 28% 25% Z-8 11/14/99 Lompico Creek 6% 48%
Average 23% 42% Table 6-3 displays the current condition, the desired condition and the percent reduction in sediment yield required to attain numeric targets for all of the monitoring sites used in the SH&G study. These values are used to estimate required reductions in sediment delivery for all of the listed waterbodies except Lompico Creek, which will meet required reductions developed from data associated with the monitoring site located on Lompico Creek as displayed in Table 6-4. Using the monitoring data developed for the SH&G study a sediment reduction of 27% is required to meet numeric targets for the San Lorenzo River as shown in Table 6-3. This value is also used as the required value for Carbonera Creek and Shingle Mill Creek since no data is available for these watersheds at this time.

San Lorenzo River Watershed Siltation TMDL September 20, 2002 ATTACHMENT B
TMDL and Allocations – Page 6-4
Table 6-3 Linkage of Instream Conditions to Sediment Reductions for SLR Watershed
Instream Indicator
Existing Conditions A
Desired Condition B
% Reduction in Sediment Yield Needed to Attain Numeric Target 100*(A-B)/A
<4 mm 23% 20% 13.0% Embeddedness 42% 25% 40.5% Average Reduction Required (13.0% + 40.5%)/2 = 27%
Using the monitoring data developed for the SH&G study a sediment reduction of 24% is required to meet numeric targets for Lompico Creek as shown in Table 6-4.
Table 6-4 Linkage of Instream Conditions to Sediment Reductions for Lompico Creek Instream Indicator
Existing Conditions A
Desired Condition B
% Reduction in Sediment Yield Needed to Attain Numeric Target 100*(A-B)/A
<4 mm 6% 20% 0% Embeddedness 48% 25% 47.9% Average Reduction Required (0% + 47.9%)/2 = 24%
6.2 Allocations to Erosion Source Categories This TMDL establishes load allocations for the sediment source categories identified in the Source Analysis (Table 6-5). The allocations are based on the known effectiveness of Management Practices and other strategies for reducing sediment loads. The effectiveness is expressed as the “percent controllable load,” and is discussed in detail in the following section. The allocation is the difference between the existing load and the controllable load, with minor corrections applied.

San Lorenzo River Watershed Siltation TMDL September 20, 2002 ATTACHMENT B
TMDL and Allocations – Page 6-5
Table 6-5 Load Allocations by Source Category
Sediment Source Category Allocations (tons/year)
Shingle Mill Creek Carbonera Creek Lompico Creek San Lorenzo River
Upland THP Roads 0 420 362 25,215
Streamside THP Roads on Steep Slopes 0 182 164 10,949
Upland Public/Private Roads 146 1,233 367 13,835
Streamside Public/Private Roads on Steep Slopes 77 135 239 6,178
THP Land 0 23 16 1,057
Other Urban and Rural Land 310 2,622 965 43,368
Mass Wasting 0 4,082 6,440 157,388 Channel/Bank Erosion 324 3,030 989 48,149
Total Allocation = TMDL 857 11,728 9,542 306,139 The following steps yield the load allocation:
1. calculate the existing total load for a source category (see Source Analysis and Table 6-1), 2. assign a percent controllable load value for each source category (estimates of controllable
loads were made by SH&G; they considered technical and logistical issues including: geologic stability, access to lands, costs, and potential hydrologic impacts (SH&G, 2001 p.41)),
3. calculate the controllable load by multiplying the percent controllable value by the total load,
4. calculate the “attainable load” by subtracting controllable load from existing total load, 5. where a waterbody’s total attainable load is less than the TMDL, allocate the difference to
each source category based on that category’s percent of the total attainable load, 6. where total attainable loads are greater than the TMDL, raise the percent controllable value
above that assigned by SH&G and reapply to total load to achieve the necessary reduction.

San Lorenzo River Watershed Siltation TMDL September 20, 2002 ATTACHMENT B
TMDL and Allocations – Page 6-6
An example best illustrates how load allocations were calculated. In Table 6-6 we see: 1. Shingle Mill Creek existing load equals 1,174 tons/year, 2 and 3. Controllable loads (column C) are calculated based on percent controllable load values, 4. Attainable load is existing load minus controllable load, (column D), 5. Total attainable load is 100 ton/yr (= 857-757) less than the TMDL. So the 100-tons/year
difference is reallocated on a percentage basis to calculate Load Allocation. (i.e. Other Urban and Rural Land has attainable load of 274 tons/yr, which is 274/757=36% of total attainable load. Therefore, 36% of the 100-ton/yr difference goes to this source category for the final load allocation.)
Table 6-6 Calculating Load Allocations (tons/year) - Shingle Mill Creek
Sediment Source Existing Load
A
Percent Controllable
B
Controllable Load
C=A*B
Attainable Load
D=A-C
Load Allocation
Upland THP Roads 0 53% 0 0 0 Streamside THP Roads on steep slopes 0 55% 0 0 0 Upland Public/Private Roads 275 53% 146 129 146 Streamside Public/Private Roads on steep slopes 150 55% 83 68 77 THP Land 0 30% 0 0 0 Other Urban and Rural Land 391 30% 117 274 310 Mass Wasting 0 10% 0 0 0 Channel/Bank Erosion 358 20% 72 286 324
Total 1,174 417 757 TMDL = 857 In the above example of Shingle Mill Creek, the total attainable load was less than the TMDL. However, for the San Lorenzo River, the percent controllable loads identified in the SH&G study were not adequate to achieve the TMDL. Therefore, staff raised percent controllable loads from 50% (the SH&G value) to 53% for upland roads, and from 50% to 55% for streamside roads on steep slopes over the entire watershed. Similarly, in Lompico Creek, the percent controllable loads were not adequate to meet the creek’s calculated TMDL. This required an increase in percentage reductions from 50% to 59% for all road related sediment in order to meet its calculated TMDL. Staff chose to increase the percent controllable loads from roads because roads represent the single largest contributor of sediment to the streams in the San Lorenzo River Watershed and because all sediment production associated with roads is human induced. Furthermore, staff expects that greater reductions can be achieved through more aggressive implementation of Management Practices on roads. This is because the 50% value from SH&G was based on conditions in the highly erosive Santa Margarita sandstone, whereas less erosive substrates predominate throughout the Lompico Creek subwatershed and other tributaries to the San Lorenzo River. In less erosive substrates staff assumes erosion can be controlled to a greater extent than in more erosive substrates. Table 6-7 is a summary of the estimated existing load, Total Maximum Daily Load, and attainable load for each listed waterbody. This table illustrates that BMP implementation is expected to reduce loads to the TMDL.

San Lorenzo River Watershed Siltation TMDL September 20, 2002 ATTACHMENT B
TMDL and Allocations – Page 6-7
Table 6-7 Listed Waterbody Total Maximum Daily Loads and Attainable Loads
Waterbody
Existing Load (tons/yr)
Total Maximum Daily Load
(tons/yr)
Attainable Load
(tons/yr) San Lorenzo River 419,369 306,139 305,918 Lompico Creek 12,555 9,542 9,542 Carbonera Creek 16,066 11,728 11,543 Shingle Mill Creek 1,174 857 757
6.3 Percent Controllable Load Large reductions of erosion associated with roads can be realized through the use of standard Best Management Practices (BMPs). Treatment of cut and fill slopes and road surfaces can achieve reductions that range from 32-47% for cut slopes, 50-99% for fill slopes, and 70-99% for road surfaces. It has been demonstrated that up to 80% of Total Suspended Solids can be removed from run-off from new development (USEPA, 1993, p. 4-12), which is a land-use included in the “Other Urban and Rural Land.” This is for storms less than or equal to the 2-year/24-hour storm. Chronic fine sediment from mass wasting can be controlled by the installation of drainage systems that reduce surface erosion. Channel and streambank erosion can be controlled by bank stabilization, healthy riparian corridor vegetation that can be facilitated by establishing reasonable stream setbacks and through the use of riparian buffer easements. Further discussion of available sediment reduction measures can be found in the SH&G Report (2001, p. 55) and in the EPA’s “Guidance Specifying Management Measures for sources of Nonpoint Pollution in Coastal Waters” (USEPA, 1993). Percent controllable loads for each sediment source category were developed as part of the SH&G study (2001, p. 39 Table 4-4). These reductions were reviewed and accepted by a San Lorenzo River Technical Advisory Committee, consisting of representatives of interested groups within the San Lorenzo Watershed. The discussion of the proposed reductions below is from the SH&G report (Ibid., pp. 41-42): Upland THP Roads and Skid Trails (50%): Reduction of sediment loads from THP roads and skid trails on hillslopes will largely depend upon cooperation with landowners, monitoring and maintenance of roads beyond the period required by CDF and additional expenditure. Sediment load reductions from existing roads could be tied to future timber harvest proposals (See THP recommendations). For these reasons, it was assumed that only a 50 percent reduction could be achieved. Streamside THP roads and Skid Trails on steep slopes (50%): Streamside THP roads and skid trails on steep slopes trails typically occur within a geologically unstable area, reducing the potential effectiveness of treatments. For this reason in addition to the reasons cited above for Upland THP roads and skid trails, only a 50 percent reduction is assumed.

San Lorenzo River Watershed Siltation TMDL September 20, 2002 ATTACHMENT B
TMDL and Allocations – Page 6-8
Upland Public and Private Roads (50%): Hillslope erosion control will largely depend upon the cooperation of multiple landowners for private roads and Santa Cruz County for public roads. This will be especially important to create systematically continuous drainage systems. Treatment of hillslope drainage should result in a beneficial reduction in mass wasting and concentration of flow in the steep streamside slopes. Although geologically more stable than steep streamside slopes, landownership is predominately private. For these reasons, a 50 percent reduction in supplies was assumed. Public and Private Streamside Roads on Steep Slopes (50%): Streamside roads on steep slopes are largely publicly owned and assumed accessible. Private streamside roads on steep slopes may have limited accessibility depending upon landowner cooperation. Treatment success may be difficult due to unstable geologic setting and steep terrain. For these reasons, the controllable load has been set to 50 percent. Active and Recent THP parcels (30%): Similar to THP roads and skid trails, cooperation with landowners will be the key to treatment and sediment reduction. Incentives to treat past harvest plots may only arise with future timber harvests on the same or nearby parcels. THP parcels in recent years have occurred in steeper terrain and some parcels are within steep streamside slopes. For these reasons, it is assumed that sediment loads can only be reduced by 30 percent. Other Urban and Rural Lands (30%): Other urban and rural lands are a mix of public and private ownerships, thus limiting factors are funding resources and landowner (private or agency) cooperation. For these reasons a 30 percent reduction has been assumed. Mass Wasting (Natural and Human Caused) 10%: Mass wasting in this sediment load allocation is the episodic and non-point source component. The “human caused” component results from excessive grading and/or poor drainage conditions on roads and development on hillslopes and in the steep streamside slopes. Direct treatment of landslides is usually difficult and expensive and in many cases requires access to private lands. However, proper treatment of surface drainage and erosion problems within the categories listed above should help reduce human caused mass wasting. The 10% reduction is assumed to be an ancillary benefit to treatment of surface erosion problems. Channel/Bank Erosion (20%): Treatment of channel erosion problems is difficult due to lack of construction access and geologic instability. Bank erosion problems are often expensive to treat and are usually not undertaken unless valuable property or structures are at risk. In addition, installation of bank control structures may cause more bank erosion thereby undoing benefits. For these reasons, sediment reduction at channel erosion sites is assumed to be 20 percent.”

San Lorenzo River Watershed Siltation TMDL September 20, 2002 ATTACHMENT B
Margin of Safety – Page 7-1
7 Margin of Safety Two instream indicators, % embedded in fines, and % fine sediment < 4 mm, are used to determine the amount of sediment load reduction required to attain the narrative water quality objective for settleable material. These were selected because they were the most reliable quantitative data available that describe instream conditions associated with sediment deposition that affect salmonid fisheries. The desired value for percent embeddedness was set at 25% based on Alley (1999, p.47). Alley indicates that “cobbles and boulders larger than approximately 150 mm (6 inches) provide good, heterogeneous habitat for aquatic insects in riffles and runs if embedded less than 25%.” Percent embeddedness was measured by visual inspection as part of the pebble count procedure that was used during the collection of data to support the Zayante Area Sediment Source Study. Embeddedness was recorded for particles greater than or equal to 16 mm (~5/8in). There is a large disparity between the particle size used to measure embeddedness in the field and the critical particle size recommended by Alley. It is substantially harder to embed a 6-in cobble in fines than it is to embed a 5/8-in piece of gravel. Therefore, percent embeddedness measured in the field represents a significantly higher number than if embeddedness were only measured for particles with a diameter of 6-in and greater. Staff feels that this disparity in particle size represents an implicit margin-of-safety. The Zayante Area Study (SH&G, 2001, p. 45) makes the same case. The desired value for percent fine sediment < 4 mm was set at 30% in the Zayante Area Study (SH&G, 2001. p. 44). This value is selected because it has been shown that salmonid survival in, and emergence from, the redd is affected by the amount of fines within the gravel matrix. The value of 30% is for subsurface bulk samples and not surface pebble count samples. Staff selected a lower value of 20% for two reasons. Staff added an implicit margin-of-safety by reducing this value from 30% to 20%. Also, Kondolf (2001, p. 267) indicates that surface values for percent fine sediment are typically lower than what would be measured in a subsurface bulk sample. Although there is no quantitative relationship between the surface and subsurface value, staff feels that a reduction is required in order to account for this difference.

San Lorenzo River Watershed Siltation TMDL September 20, 2002 ATTACHMENT B
Implementation Plan – Page 8-1
8 Implementation Plan
8.1 Introduction The overall intent of this Implementation Plan is to reduce sediment loading into the San Lorenzo River and its tributaries. The Implementation Plan describes existing regulatory controls and cites relevant sections of the California Water Code (CWC) establishing the Regional Board’s authority to enforce the provisions set forth in the Implementation Plan. The Plan describes the Three-Tier Framework for nonpoint source (NPS) pollution control that will be used in determining when and what type of enforcement actions the Regional Board would use should such actions become necessary. The Plan identifies the specific actions that are expected to bring about the reductions in sedimentation specified in the TMDL. The Plan also sharpens existing regulatory controls where sediment is concerned, builds on ongoing efforts of both the Regional Board and other Implementing Parties and stakeholders, and proposes new actions by these parties. The reader can go directly to Table 8-2 in the section entitled Implementation Actions to learn which of these actions are to be tracked by the Regional Board in its effort to ensure compliance with the TMDL. Section 13242 of the CWC requires that a plan of implementation be incorporated into the Basin Plan when the Regional Board adopts water quality objectives or TMDLs. The implementation plan must include: 1) a description of the nature of the actions necessary to achieve the water quality objectives, including recommendations for appropriate action by any entity, public or private; 2) a time schedule for the actions to be taken; and 3) a description of the monitoring and surveillance to be undertaken to determine compliance with the objectives. This implementation plan identifies available means for complying with the TMDL; evaluates the economic impacts of implementation of the TMDL; and identifies potential sources of funding for implementation actions identified herein. Because of the sizable contribution of nonpoint sources to the sediment load of the San Lorenzo River, this Plan will emphasize implementation of the Three-Tier Framework for NPS pollution control (CWC §13369), and incorporate concepts set forth in the NPS Program Plan. The Plan also provides for implementation of regulatory controls on point sources, including storm water. The Basin Plan amendment process has been certified by the Secretary for Resources as “functionally equivalent to,” and therefore exempt from, the California Environmental Quality Act (CEQA) requirement for preparation of an environmental impact report or negative declaration and initial study (CCR Title 14, §15251(g)). However, a CEQA-required Environmental Checklist must be completed and is included in the Basin Plan Amendment package that will be considered for adoption by the Regional Board.
8.1.1 Watershed-Wide Implementation The listing of the main stem and three tributaries to the San Lorenzo River prompted a watershed-scale analysis of sedimentation in this TMDL. Similarly, the Implementation Plan

San Lorenzo River Watershed Siltation TMDL September 20, 2002 ATTACHMENT B
Implementation Plan – Page 8-2
includes a broad selection of actions, which are to be implemented throughout the entire watershed. As the receiving water of all its tributaries, conditions in the San Lorenzo River are a reflection of conditions in all tributaries, not just the three listed tributaries, Shingle Mill Creek, Carbonera Creek, and Lompico Creek. Thus, load reductions are necessary in all major tributaries and from all sources. Compliance with this amendment will be determined by monitoring representative locations in certain tributaries and by tracking all implementation actions taken.
8.2 Proposed Implementation Actions The Central Coast Regional Water Quality Control Board (Regional Board) will implement the TMDL in coordination with the San Lorenzo River Technical Advisory Committee, chaired by the County of Santa Cruz Water Resources Program Environmental Health Services Department. The Technical Advisory Committee is a consortium of stakeholders, including representatives from water agencies, federal, state, County and city agencies, the County Resource Conservation District, private landowners, and the environmental community. The Committee’s role in implementation of this TMDL will be to provide a forum in which to periodically examine the effectiveness of sediment reduction activities, and to support the Regional Board’s tracking of these activities. This Implementation Plan emphasizes reduction of chronic fine sediments generated from road networks and parcels by means of both general and specific implementation actions to be undertaken by Implementing Parties, Responsible Dischargers, and stakeholders throughout the watershed. Several of these actions are identified as “Trackable Implementation Actions” (Table 8-1). Table 8-1 groups the proposed implementation actions by sediment source categories to demonstrate that each category is addressed by specific actions. Some of the initial implementation actions include further assessments necessary to locate and prioritize specific projects that would result in the greatest reductions in sediment from chronic sources. Implementation actions also include developing strategies to treat known point sources such as the Bean Creek Road slides. Thus, before implementation of some of the on-the-ground projects begins, considerable work needs to be done. Other implementation actions would result from sharpening the language and introducing greater specificity to existing regulatory control measures used by the Regional Board. For example, the County’s forthcoming Storm Water Management Plan, required by Phase II Storm Water NPDES permit rules, will require implementation of control measures throughout the San Lorenzo River Watershed, e.g. site inspection and enforcement of erosion control measures. Similarly, the cities and County will consider the need to revise ordinances to increase their effectiveness in preventing erosion and sedimentation. Development and implementation of a variety of management practices for road maintenance and erosion control can move forward immediately. The County of Santa Cruz Draft San Lorenzo Watershed Management Plan describes recommendations for control of erosion and

San Lorenzo River Watershed Siltation TMDL September 20, 2002 ATTACHMENT B
Implementation Plan – Page 8-3
sedimentation (Appendix G). Several of the County’s recommendations are related or identical to Trackable Implementation Actions (Table 8-1). Swanson Hydrology & Geomorphology outlined available strategies and measures to reduce erosion and chronic sediment in their report on Bean and Zayante Creeks (2001) (Table 8-2). Implementing Parties including public agencies and private parties, would be expected to select from these, or comparable measures, in developing specific strategies for on-the-ground treatments. In the following discussion of specific Trackable Implementation Actions, letters in parentheses correspond to those actions identified in (Table 8-1).

San Lorenzo River Watershed Siltation TMDL September 20, 2002 ATTACHMENT B
Implementation Plan – Page 8-4
Table 8-1 Trackable Implementation Actions to Address Sources of Erosion and Sedimentation Source Category Implementation Action Implementing Party
A Increase presence at Pre-Harvest Inspections to 100% of Class I and Class II watercourses.
RWQCB
B Perform Post-Harvest Inspections 3 to 5 years after harvest on THPs with Class I and Class II watercourse crossings.
RWQCB
C Convene a Working Group of federal, state, and local agencies, and timberland owners and foresters to develop specific timber harvesting management practices for the San Lorenzo River Watershed.
NMFS, CDF, County Planning, RWQCB, Timber Land Owners
D Enforce erosion control ordinance following 3-year THP maintenance period. County Planning
E Develop strategy for more effective enforcement of County code violations pertaining to erosion control and sedimentation prevention throughout the San Lorenzo Watershed.
County Planning
Roads: Upland and Streamside THP
F RWQCB will review evidence of Timber Harvest Plan Best Management Practices developed pursuant to Section 916.9 of 2001 Forest Practices Act during Pre-Harvest and Post-Harvest Inspections (see excerpts of Interim Forest Practice Rules in Appendix F).
CDF, THP Submitter, RWQCB
E G Create public road database to inventory and prioritize problems for correction. County Public Works, Caltrans, Cities
H Develop a Public Road Maintenance Best Management Practices (BMP) Program. County Public Works and Planning
I Improve public road spoils management and disposal: develop spoils disposal site(s) in or near the San Lorenzo Watershed.
County Public Works and Caltrans
J Assess State Park roads and trails for erosion into San Lorenzo River and tributaries. Develop a program for funding and addressing any identified problems.
State Parks
Roads:
Upland and Streamside Public/Private
K Develop and implement private road improvement program. RCD-lead, NRCS, County, RWQCB,
CDFG, landowners Developed Parcels:
THP Lands A-F
E L Evaluate need to revise erosion control provisions in County Grading Regulations
and Erosion Control Ordinance to better protect sandy-soil areas. County Planning
M Evaluate need to revise erosion control provisions in City of Scotts Valley Grading Regulations and Erosion Control Ordinance to better protect sandy-soil areas.
City of Scotts Valley
N Evaluate need to revise erosion control provisions in City of Santa Cruz Grading Regulations and Erosion Control Ordinance to better protect sandy-soil areas.
City of Santa Cruz
O Promote improved livestock management practices to reduce discharge of sediment. RCD, Santa Cruz Horsemen, County Planning, County Environmental Health Services, Livestock Owners
Developed Parcels:
Other Urban and Rural Land
P Implement education programs and modify policies and procedures to improve riparian corridor protection, maintain channel integrity, implement alternatives to hard bank protection, and retain woody material.
County Planning, DFG, Cities

San Lorenzo River Watershed Siltation TMDL September 20, 2002 ATTACHMENT B
Implementation Plan – Page 8-5
Source Category Implementation Action Implementing Party Q Develop strategy to reduce erosion from point sources, including Mount Hermon
slide, Bean Creek Road slides, McEnery Road, Skypark, Rancho Rio and Monte Fiore.
County, City of Scotts Valley
Mass Wasting
R Develop strategy to address accelerating the mitigation of quarry impacts at Hanson Aggregates site.
County Planning, California Division of Mines and Geology
Streambanks A-H, J-N, P
Source Category Implementation Action Responsible Dischargers
All Roads, Developed, and Developing Parcels
S Develop and implement Storm Water Management Plans (SWMPs) and Storm Water Pollution Prevention Plans (SWPPPs) consistent with NPDES Phase II Storm Water regulations.
County Planning and Public Works, City of Santa Cruz, City of Scotts Valley, construction site operators and owners.
T Identify the San Lorenzo River Watershed as a priority for site inspection and enforcement of control measures in SWMPs and SWPPPs. Establish mechanism by which operators and owners of one-acre and greater construction projects are notified of the requirement to prepare SWPPPs.
County Planning and Public Works, City of Santa Cruz, City of Scotts Valley, construction site operators and owners.
U Consider incorporation of sediment control programs/projects into SWMPs. County Planning and Public Works, City of Santa Cruz, City of Scotts Valley, construction site operators and owners.

San Lorenzo River Watershed Siltation TMDL September 20, 2002 ATTACHMENT B
Implementation Plan – Page 8-6
8.2.1 Roads (Upland and Streamside) For timber harvest plans, the Regional Board will increase staff presence at Pre-Harvest Inspections to 100 percent where Class I and Class II watercourses are affected by road crossings, or by significant harvest operations (A). The Regional Board will also maintain the option to perform post-harvest inspections three to five years after harvest on these same watercourses (B). Regional Board staff will coordinate post-harvest inspections with the County’s enforcement of the erosion control ordinance following the 3-year THP maintenance period (D). The County Planning Department will also develop a strategy for more effective enforcement of County code violations pertaining to erosion control, which would improve enforcement on Timber Harvest Plans as well as other lands throughout the watershed (E). The County of Santa Cruz Planning Department will convene a Working Group involving representatives of the Regional Board, the National Marine Fisheries Service, the California Department of Fish and Game, and the Department of Forestry and Fire Protection, and Santa Cruz-based timberland owners and foresters (C). The Working Group will convene to develop specific timber harvesting management practices that will ensure compliance with the Sediment TMDL for the San Lorenzo River. Appendix F includes excerpts from the Interim Forest Practice Rules for Protection and Restoration in Watersheds with Threatened or Impaired Values (§916.9 of 2001 Forest Practice Rules). The excerpted portions are those that are directly applicable to controlling erosion and sedimentation through Timber Harvesting Best Management Practices (BMPs) for THPs in the San Lorenzo River Watershed. Regional Board staff have interpreted the language in the 2001 Forest Practice Rules such that the requirements apply to any planning watershed in which timber operations could contribute pollutants or stressors limiting water quality in a listed water body; these planning watersheds are the subwatersheds identified in this TMDL (Figure 2). The Regional Board may review evidence of implementation of BMPs during Pre-Harvest Inspections and in subsequent post-harvest inspections (F). Should the Board of Forestry at some future date adopt final rules that are more restrictive than those identified in the Interim Rules, or should the Working Group (above) identify specific measures that are more restrictive, the more restrictive practices would replace those identified in the Interim Rules excerpted in Appendix F. The County Department of Public Works, Caltrans, and the cities of Santa Cruz and Scott’s Valley will create a public road database to identify and prioritize maintenance and improvement projects (G). The entities will complete road assessments on inner gorge roads and in sandy-soils areas first, then complete the rest of the Watershed, concentrating in areas of high erosion hazard. Continuing with implementation of recommendations from the County Public Works’ Erosion Control Manual, the County Department of Public Works will develop a Road Maintenance Best Management Practices (BMP) Program to improve maintenance (H). The Department will continue training of maintenance crews, and develop regular training for staff. Working with Caltrans, the Department will improve public road spoils management and disposal by

San Lorenzo River Watershed Siltation TMDL September 20, 2002 ATTACHMENT B
Implementation Plan – Page 8-7
identifying a spoils disposal site(s) in or near the San Lorenzo Watershed (I). California State Parks will assess roads and trails for erosion into the San Lorenzo River and its tributaries (J). The agency will also develop a program for funding and addressing any identified problems. The Santa Cruz Resource Conservation District will establish a private road improvement program (K). The program will implement cost effective private road demonstration projects utilizing BMPs; develop long-term maintenance agreements that may establish a formal County Service Area or other formal contractual agreement; and develop a monitoring plan to assess project effectiveness in improving water quality.
8.2.2 Developed Parcels (THP Land and Other Urban and Rural Land) In addition to certain of the Trackable Implementation Actions identified to address the Roads source category (including A-F, S), several actions for developed parcels are identified inTable 8-1. First, the County and the Cities will evaluate the need to revise the erosion control and grading ordinances to include more specific regulations and guidelines for sandy-soils areas. These revisions will benefit other sandy-soil areas throughout the County, including portions of Bonny Doon, Soquel watershed, and Aptos/La Selva Beach/Corralitos areas (L, M, N). Also, the County Resource Conservation District, the Santa Cruz Horsemen, County Planning, and County Environmental Health Services will promote improved livestock management practices to reduce discharge of sediment (O). Livestock operators will participate through implementing improved practices. Additionally, the County Planning Department, the Department of Fish and Game, and the Cities of Scotts Valley and Santa Cruz will take the lead in implementing education programs and will modify policies and procedures to improve riparian corridor protection, maintain channel integrity, implement alternatives to hard bank protection, and retain woody material (P). As part of this effort, the County will revise the Santa Cruz County Stream Care Guide.
8.2.3 Mass Wasting Mass wasting sources of sediment require site-by-site assessments to develop an appropriate strategy for stabilization. The County and the City of Scotts Valley will develop a strategy to reduce erosion from point sources, including the Mount Hermon slide, the Bean Creek Road slides, and slides on McEnery Road, Skypark, Rancho Rio and Monte Fiore (Q). County Planning and the California Division of Mines and Geology will develop a strategy to address accelerating the mitigation of quarry impacts at Hanson Aggregates site (R).

San Lorenzo River Watershed Siltation TMDL September 20, 2002 ATTACHMENT B
Implementation Plan – Page 8-8
Table 8-2 Available Strategies and Measures to Reduce Erosion and Chronic Sediment for Sites Situated in Inner Gorge and Hillslope Settings (SH&G, 2001, Table 6.3)
TREATMENT STRATEGY TREATMENT MEASURE Roads
Drainage Control Disperse/Slow Grass-lined Swales Runoff Infiltration Trenches Rolling Dips + Water Bars Outslope roads Pave roads with compacted gravel/decomposed Granite Control Place flow in culverts Concentrated Extend culvert outlets and fit with energy dissipaters Runoff Use curbs to direct runoff on paved roads
Soil Stabilization Pave road surfaces with asphalt Pave roads with compacted gravel/decomposed Granite Rock line open drainage ditches Install retaining/slough walls to stabilize
road cuts and trap sediments Stabilize roadcuts and sidecast with vegetation Sediment Retention Install staged catch basins Install vegetated filter strips
Sediment/Erosion Control
Install organic debris filters Install sediment retention basins
Developed Parcels
Drainage Control
Control runoff from impervious surfaces
Install roof gutter and downspout systems and control discharge in pipe
Install pipe extensions and energy dissipaters to safe outlet Disperse runoff Direct runoff to infiltration trenches Direct runoff into grass lined swales and/or open flat vegetated areas
Soil Stabilization Mulch and plant vegetation on exposed soils Sediment/Erosion Control Install retaining structures to support fill slopes Install retaining / slough walls on cut slopes Sediment Retention Install vegetated filter strips in drainage paths and/or in flow
dispersion areas Install catch basins at inlets or culvert discharge points, control
outflow by dispersion and/or energy dissipation.
8.2.4 Streambanks Streambank erosion will be addressed by several of the actions identified here, including Implementation Actions A-H, J-N, and P.
8.2.5 All Roads and Developed and Developing Parcels Storm water discharge from Municipal Separate Storm Sewer Systems (MS4s) and construction activities require a permit. The County of Santa Cruz, City of Scotts Valley and the City of Santa Cruz are MS4s and must develop a Storm Water Management Plan (SWMP) to control storm water discharges impacting water quality. These responsible dischargers must file a Notice of Intent (NOI) for coverage under a General NPDES permit by March 2003. Similarly, owners and operators of construction sites will be required to submit NOIs to be covered by a general storm water permit for construction. After March 2003, owners and operators must develop and implement Storm Water Pollution Prevention Plans (SWPPP) for each site to control storm water

San Lorenzo River Watershed Siltation TMDL September 20, 2002 ATTACHMENT B
Implementation Plan – Page 8-9
discharges, the intent of which will be to eliminate sediment transport to streams. This TMDL’s Implementation Plan identifies the MS4 entities and the owners and operators of construction sites (one-acre and greater) as Responsible Dischargers. This means they are subject to regulatory requirements pursuant to the NPDES permits for storm water, and are no longer Implementing Parties pursuing self-determined (Tier 1) or regulatory-based (Tier 2) sediment control measures (See Section 8.4 Regulatory Mechanism by which TMDL Implementation is Assured). The County’s SWMP will result in sediment reduction activities because the regulations require MS4s to:
• Have an ordinance or other regulatory mechanism requiring the implementation of proper erosion and sediment controls, and controls for other wastes, on applicable construction sites;
• Have procedures for site inspection and enforcement of control measures; • Have sanctions to ensure compliance (established in the ordinance or other regulatory
mechanism); • Establish procedures for the receipt and consideration of information submitted by the
public; and • Determine the appropriate best management practices.
The Implementation Plan includes an Action (‘S’ in Table 8-1) requiring the County, the Cities of Scott Valley and Santa Cruz, as well as construction site owners and operators to develop and implement SWMPs and SWPPPs consistent with NPDES Phase II Storm Water regulations. This is simply a restatement of what is already required of them under these regulations. The SWMP (anticipated to be prepared jointly by the County and the Cities) is further required to identify the San Lorenzo Watershed as a priority for site inspection and enforcement of control measures (T). This will require the entities to establish a mechanism by which operators and owners of one-acre and greater construction projects are notified of the requirement to prepare SWPPPs. Additionally, during development of current and future updates of the SWMP, the agencies are required to consider incorporation of sediment control programs and projects into the SWMP (U).
8.3 Existing Implementation Actions This Implementation Plan relies on continued implementation of on-going efforts augmented by proposed implementation actions. On-going efforts of state and local entities as well as non-governmental stakeholder organizations are addressing all sources of sediment through a broad array of approaches, encompassing planning, and on-the-ground erosion control projects. Enforcement of local ordinances and the regulatory basis of many of these actions were discussed in the previous Section 8.2.3. The proposed implementation actions include a range of specific to general actions to be conducted by Implementing Parties, which either compliment or augment on-going efforts.

San Lorenzo River Watershed Siltation TMDL September 20, 2002 ATTACHMENT B
Implementation Plan – Page 8-10
8.3.1 On-going Activities Expected to Reduce Sediment Loads In 1995, the County of Santa Cruz Department of Environmental Health began working on the update of the San Lorenzo Watershed Plan. A draft of that document provides an excellent summary of on-going activities to reduce sediment loads in the Watershed. The following contains much of that summary. Upon its completion, the final version of the San Lorenzo River Watershed Plan will contain a more complete assessment of on-going activities.
8.3.2 Planning and Administrative Activities
8.3.2.1 County of Santa Cruz
8.3.2.1.1 Department of Environmental Health and Planning Department In the recent years, the County has increased focus and staffing for watershed management and erosion control efforts. In 1999, a Water Resources Section of the Planning Department was created that included a new Resource Planner position, with a primary responsibility to advocate and coordinate erosion control efforts within the County. In addition, new Resource Planners work in Environmental Health and Public Works. Erosion control and resource protection are integrated into the County’s overall development review process, increasing the consistency and effectiveness of implementation of county planning standards. The Environmental Planning Section addresses erosion control on several important levels:
• Streambank stabilization project applicants must include a hydrologist’s evaluation that the project will not induce off-site bank erosion.
• Environmental Planning coordinates with Public Works to improve erosion control for subdivision grading projects.
• Winter grading approvals have been consolidated into a computer database to facilitate tracking of projects.
• Environmental Planning staff also implement retention/detention requirements for groundwater recharge zones in sandy-soil areas.
8.3.2.1.2 Department of Public Works Santa Cruz County maintains 601 miles of road, only one mile of which is unsurfaced. It is one of the responsibilities of County Department of Public Works to maintain this road system. Maintenance practices employed by the Department include:
• A policy against side-casting material over the edge of the road; • End-hauling slide material to local stockpile sites, and reducing the time that material is
stockpiled at road turnouts. • Bidding for erosion control as a separate item in road contracts, which encourages
contractors to accommodate the cost of time and materials for erosion control. • Communication with Environmental Planning prior to the winter season to insure
installation of erosion control measures. Public Works has received two grants from the California Department of Fish and Game SB271 grant program. One will fund a partial roads assessment for the San Lorenzo watershed to document culverts and identify areas of high erosion potential. The other grant will fund training

San Lorenzo River Watershed Siltation TMDL September 20, 2002 ATTACHMENT B
Implementation Plan – Page 8-11
for about half of the maintenance crews in erosion control and the creation of an erosion control manual for Public Works. Through the Department’s partnership with the Santa Cruz County RCD on these and other projects, a public outreach and education component to the work is under development, thereby expanding the effectiveness of the Department’s erosion control work.
8.3.2.2 The City of Santa Cruz In the past few years, the City of Santa Cruz has become more active in watershed issues and is currently involved in several planning processes that relate to erosion and sediment control. The City of Santa Cruz also owns properties associated with Loch Lomond (Newell Creek) and Zayante Creek. The City of Santa Cruz created a new position for watershed issues that has coordinated with the County on erosion control enforcement.
8.3.2.3 The City of Scotts Valley The City of Scotts Valley revised their grading ordinance in 1997. The revised grading ordinance limits cuts to 40 feet, with extra review required for cuts over 20 feet. Development is prohibited on slopes greater than 40 percent. The City also began to review grading as an integral component of development proposals, instead of reviewing grading once approval had been granted. The City began to more vigorously enforce the erosion control components of the grading ordinance, including the requirement for erosion control plans, winter inspections to insure compliance, and the ability to address urgent erosion control problems and charge the developer for the cost. In cooperation with police, the City can receive calls about erosion control problems 24 hours a day.
8.3.2.4 Cooperative Planning Activities for Salmonid Recovery The TMDL and this Implementation Plan focus on one factor critical to the survival of salmonids—sediment. The ultimate success of these fish however will depend on several factors, including: adequate flows, temperature, woody debris, and nutrients. Two significant implementation efforts, which seek to integrate these factors into a more comprehensive management strategy for salmonids in the Watershed, include the Salmonid Enhancement Strategy, and the California Department of Fish and Game Steelhead Recovery Plans.
8.3.2.4.1 Salmonid Enhancement Strategy Funded by the California State Coastal Conservancy, and developed by the County of Santa Cruz, this project will yield an overall strategy to protect and enhance the steelhead population and restore a viable Coho salmon population to the San Lorenzo River. Short and medium term implementation projects will be prioritized. Strategies will be directed at improving and restoring spawning migration access and spawning and rearing habitat quality for the full spectrum of streamflow conditions and future water demand. Management strategies affecting various life stages of these salmonid species will involve management of winter and summer streamflows, retention of woody debris, modifying migration barriers, reducing erosion and sedimentation, improving overall aquatic habitat quality and restoring continuous riparian canopies and corridors.
8.3.2.4.2 The California Department of Fish and Game Steelhead Recovery Plans

San Lorenzo River Watershed Siltation TMDL September 20, 2002 ATTACHMENT B
Implementation Plan – Page 8-12
The California Department of Fish and Game will prepare Steelhead Recovery Plans for each watershed that will identify actions that should be undertaken to secure the viability of the San Lorenzo River steelhead population. Since sedimentation is a known limiting factor, both federal and state agencies will be involved with erosion control efforts in the San Lorenzo Watershed. Sediment has been identified as a limiting factor in the Draft Strategic Plan for Restoration of the Endangered Coho Salmon South of San Francisco Bay (CDFG, 1998).
8.3.2.4.3 Current and Projected Non-Regulatory Regional Board Activities In addition to the regulatory pollution control measures described above (WDRs, NPDES, etc.) numerous non-regulatory activities to reduce erosion and sedimentation are planned or currently underway in the watershed (Table 8-3). These efforts will assist in implementation of the TMDL. Table 8-3 Non-Regulatory Regional Board Activities Affecting Sedimentation in San Lorenzo River Watershed On-going Priority Activities Manage Clean Water Act, Section 319(h) grant projects and
promote development of new contracts: Current grant: Kings Creek (Araki Gulch) Sediment Control Project to stabilize soils on a slide using semi-temporary biotechnical measures, to allow reestablishment of trees and other native vegetation. (Term of grant: 4/01-8/04).
Encourage voluntary implementation of BMPs to reduce siltation: attend Blue Circle meetings, interagency meetings, visit landowners, give presentations at workshops, review and comment on San Lorenzo Watershed Management Plan.
Targeted Projects for Potential Funding from NPS Implementation Protection and restoration of riparian areas/steelhead habitat.
Implementation of short course for road design and installation.
Targeted Projects for Potential Funding from State Revolving Fund Storm water Abatement.
Erosion Control. Address noncompliance with existing Phase I storm water
requirements.
8.3.2.4.4 Erosion Control Projects Diverse agencies have implemented erosion control projects in the watershed. The Natural Resources Conservation Service, through their Watershed Emergency Program, sponsored bank stabilization efforts at Felton Covered Bridge, Glen Arbor and Spring Street. The State Department of Parks and Recreation stabilized an eroding streambank that threatened a group of old-growth redwood trees in Henry Cowell State Park. Since 2000, Caltrans has repaired three large landslides along Highway 9: south of Felton, at Glen Arbor Road, and north of Boulder Creek. In 2000, the Natural Resources Employment Program (NREP) installed biotechnical slide stabilization measures on Araki Road. NREP has secured funding through the State Water Resources Control Board to continue this work. The San Lorenzo Valley Water District repaired a large gully on Box Gulch, in the Zayante watershed. The County Planning Department has overseen the implementation of several erosion control projects in the San Lorenzo Watershed, including: a sediment basin and slough walls in the

San Lorenzo River Watershed Siltation TMDL September 20, 2002 ATTACHMENT B
Implementation Plan – Page 8-13
Rancho Rio development, a sediment basin on Mill Creek, and improvements to Love Creek Road (1981), the Bean Creek Road Slide (1980s), and King’s Creek Road (1999). The Santa Cruz County Resource Conservation District has recently implemented a number of erosion control projects in San Lorenzo Valley. Three projects were installed recently (2000) as part of a Clean Water Act Section 319 (h) grant. One project assisted a private landowner with a bank stabilization project including retention of a large log on Bean Creek. Another project involves improving drainage and reducing erosion from a site along Bean Creek Road. The last project involved drainage and paving a small private road to reduce erosion. The RCD partnered with the County Department of Public Works on the Bean Creek Road project, effectively expanding the reach of the Department’s erosion control work through public outreach and education. In the lower two miles of the San Lorenzo River, the Army Corps of Engineers and the City of Santa Cruz are raising the levees through downtown Santa Cruz to provide better flood protection. At the same time, the City of Santa Cruz is examining opportunities to enhance steelhead habitat in the lower mainstem and estuary, and has undertaken a two-year estuary monitoring effort with funding from the State Water Resources Control Board to better characterize conditions there.
8.3.2.4.5 Outreach, Education, and Technical Assistance There are ongoing efforts for erosion and sedimentation education and outreach in the San Lorenzo Watershed. Overall, there is consensus that the public is better informed about erosion and sedimentation issues than in 1979. However, while public awareness has increased, a constant influx of new residents and growing watershed population will keep public education and outreach a challenge. Outreach and education efforts include the San Lorenzo Watershed Caretakers, a Coordinated Resource Management and Planning (CRMP) group supported by the Santa Cruz County Resource Conservation District (RCD) that has been active since 1995. As part of their recent 319(h) grant, the Santa Cruz County RCD sponsored a number of outreach efforts, including newsletters, tours and rural roads maintenance workshops. The County has implemented numerous public outreach and educational programs over the past twenty-two years. A Rural Road Maintenance Workbook was developed by the Planning Department in the early 1980’s and was distributed for many years. In 1986, the County distributed a StreamCare Guide to all stream-side residents that included information on impacts of sedimentation and techniques for bank stabilization. Brochures on the Erosion Control and related ordinances have been updated. County staff present information at a Soil Conservation Class taught each year at Cabrillo College. The City of Santa Cruz, through its watershed specialist, has been active in the last year with informal outreach to erosion control violators in the watershed. The 1979 Watershed plan envisioned greater technical assistance for erosion control efforts than is currently available. Staffing and organizational changes have limited technical assistance provided by the Natural Resources Conservation Service. Local specialists in erosion control

San Lorenzo River Watershed Siltation TMDL September 20, 2002 ATTACHMENT B
Implementation Plan – Page 8-14
and road construction are few, costly, and not readily available. However, technical assistance has increased in the past few years. Watershed planning efforts and the listing of steelhead will help provide more technical assistance over the next several years. While more technical assistance may be available to agencies and organizations, it may not be widely available to individual landowners.
8.4 Regulatory Mechanism by which TMDL Implementation is Assured
8.4.1 Regional Board Authority to Require Implementation The Porter-Cologne Water Quality Control Act establishes the responsibilities and authorities of the Regional Water Quality Control Board, including authority and responsibility for regional water quality control and planning. The Regional Board establishes water quality objectives by amending its Water Quality Control Plan for the Central Coast Region (Basin Plan). To prevent water quality problems, the Regional Board enforces waste discharge restrictions. The waste discharge restrictions can be implemented through waste discharge prohibitions, Water Quality Certification (Clean Water Act §401), National Pollutant Discharge Elimination System (NPDES) permits, waste discharge requirements (WDRs), enforcement actions, and/or Best Management Practices (Basin Plan, p. IV-3.) The Basin plan specifies pollution controls from point sources by implementing a variety of full regulatory programs, including the NPDES Program, and the issuance of Waste Discharge Requirements. In the case of nonpoint sources, the Regional Board relies on the implementation of NPS controls, including Management Measures and associated Management Practices within the Three-Tier Framework for NPS pollution control (CWC §13369), and on the application of a wide range of State programs and enforcement authorities.
8.4.2 Three-Tier Framework for Nonpoint Source Pollution Control The three-tier framework uses three different options of enforceable policies and mechanisms under the California Water Code to ensure implementation of the “Plan for California’s Nonpoint Source Pollution Control Program,” (NPS Program Plan). The options, or tiers, are presented in order of increasing stringency: Tier 1: Self-Determined Implementation of Management Practices Tier 2: Regulatory-Based Encouragement of Management Practices Tier 3: Effluent Limitations and Enforcement. Through the Three-Tier Framework, the Regional Board acknowledges that many NPS problems are best addressed through the self-determined cooperation of stakeholders in improving their management practices (Tier 1). However, persistent NPS water quality problems not effectively resolved through self-determined action will be addressed through applicable regulatory programs and authorities (Tier 2 and Tier 3). Sequential movement through the tiers is not required of the Regional Board. Depending on the severity of the NPS problem, the Regional Board may move directly to the enforcement actions specified in Tier 3. Also, the Regional Board can choose to implement a combination of water quality control mechanisms from each of the Tiers as well as additional remedies (e.g., enforcement orders) as provided under the CWC.
San Lorenzo River Watershed Siltation TMDL September 20, 2002 ATTACHMENT B
Implementation Plan – Page 8-15
The listing of the San Lorenzo River, Lompico Creek, Shingle Mill Creek, and Carbonera Creek as impaired by sediment, is based on evidence of persistent nonpoint source water quality problems that are not responding to self-determined actions in the watershed. This Implementation Plan represents a programmatic response to these problems and will exercise all options available under the Three-Tier Framework.
8.4.3 Regulatory Controls to Reduce Sedimentation Described below are existing regulatory pollution control measures used by the Regional Board that potentially affect sediment discharge in the San Lorenzo River Watershed. The manner in which these measures will be used to achieve the reductions in sediment loading is described in sections that follow.
8.4.3.1 National Pollutant Discharge Elimination System Permits With the exception of several storm water permitted facilities, there is currently only one point source discharger of sediment covered under National Pollutant Discharge Elimination System (NPDES) permits in the San Lorenzo River Watershed. The permit for this facility, the RMC Lonestar Olympia Sand Plant, includes effluent requirements for turbidity.
8.4.3.1.1 Storm Water Permits Municipal Permits Phase II of the NPDES program expands Phase I by requiring additional operators of Municipal Separate Storm Sewer Systems in urbanized areas, to implement programs and practices to control polluted storm water runoff. General NPDES permits will cover these actions. General Permit requirements include the submission of a Notice of Intent to comply with the permit and the submittal of Storm Water Management Plans. A Storm Water General Municipal Permit is scheduled for Regional Board adoption December 8, 2002. Under the General Municipal Permit, the County of Santa Cruz, and the cities of Santa Cruz and Scotts Valley will be required to develop and submit Storm Water Management Plans to the Regional Board by March 10, 2003. Upon submittal of the Storm Water Management Plan to the Regional Board, the entities will be covered under the General Permit. The City of Santa Cruz has begun implementing a storm water pollution prevention program with the assistance of the State Coastal Commission and the Monterey Bay National Marine Sanctuary Water Quality Protection Program. The Program has developed an Urban Runoff Management Plan for areas draining into the Sanctuary. The Cities, the County and other jurisdictions will eventually implement this Plan. The City of Santa Cruz has established a storm water utility charge to finance flood control and urban runoff management (County of Santa Cruz Environmental Health Services and Planning Department, 2001, p. 33).

San Lorenzo River Watershed Siltation TMDL September 20, 2002 ATTACHMENT B
Implementation Plan – Page 8-16
Construction Permits The Phase I NPDES Storm Water Program currently requires operators of construction activities that disturb five or more acres to obtain a NPDES Construction Storm Water Permit. The Regional Board issues these permits in Santa Cruz County. The Phase II Final Rule regulates discharges from smaller construction sites disturbing equal to or greater than one acre and less than five acres. Polluted storm water runoff from construction sites often flows to storm sewers and is ultimately discharged into the San Lorenzo River and its tributaries. Newell Creek, Carbonera Creek, Bean Creek, Zayante Creek, and Limestone Brook receive storm water flows directly from facilities permitted by the Regional Board under General Industrial and Construction Storm Water Permits. Of the pollutants commonly discharged from construction sites sediment is usually the main pollutant of concern. A Storm Water General Construction Permit covering all small construction sites in communities of the Central Coast Region is scheduled for State Board adoption by December 8, 2002. Site owners/operators will be required to submit a Notice of Intent to be covered by this permit. They will also be required to submit a Storm Water Pollution Prevention Plan (SWPPP). The SWPPP must include a site description and measures and controls to prevent or minimize pollutants in storm water discharges.
8.4.3.2 Other Agency’s Regulatory Activities In addition to the Regional Board’s role in regulating the protection of water quality, the California Department of Fish and Game (CDFG) and the County of Santa Cruz have enforcement authority for issues related to erosion, sedimentation and water quality in the San Lorenzo Watershed. While the City of Santa Cruz has no direct authority, they have a strong interest in facilitating enforcement due to the potential for erosion to affect their water supplies. The following description of other agency’s regulatory activities is taken from the County’s Draft San Lorenzo River Watershed Plan Update.
8.4.3.2.1 The County of Santa Cruz The most significant erosion control efforts by the County of Santa Cruz have been the development and implementation of ordinances that reduce erosion through development: the Erosion Control Ordinance, the Grading Ordinance, the Geological Hazards Ordinance and the Riparian Corridor Protection Ordinance. These ordinances work in concert to minimize both short-term and long-term site disturbance by development (County of Santa Cruz Environmental Health Services and Planning Department, 2001, p. 53). The Departments of Public Works, Environmental Planning, and Code Compliance have different responsibilities to enforce the Erosion Control Ordinance. Environmental Planning staff is responsible for enforcing erosion control measures for grading and other development permits. Public Works is responsible for enforcing erosion control measures on subdivisions. The ordinance limits the period of legal earthwork to the dry season, generally April 15 through October 15. General water quality protection is also effected through implementation of the riparian corridor protection ordinances, which requires setback of land disturbing activities from creeks in the County and both cities.

San Lorenzo River Watershed Siltation TMDL September 20, 2002 ATTACHMENT B
Implementation Plan – Page 8-17
However, these policies are subject to variances, particularly on properties where there already exists disturbance of the riparian corridor (Ibid., p. 36). County code compliance responds initially to complaints for violations of the Erosion Control Ordinance. Enforcement has evolved substantially in the past twenty-two years. Following passage of the erosion control ordinance in 1978, enforcement was performed informally under the Watershed Section. Then, enforcement of the environmental ordinances evolved from a part-time position to a full-time position within Environmental Planning. In 1995, environmental code compliance was consolidated with code compliance for building and zoning regulations. This consolidation has several positive benefits. Erosion enforcement is now more standardized, especially for tracking cases, and has benefited from the code compliance senior staff and management attention. Code enforcement staff has received some training in erosion control issues. One staff person is responsible for the San Lorenzo Watershed and is located at the Felton office. Code compliance has also received also increased attention and support from County Counsel and the District Attorney’s office. Currently, code compliance is better positioned to abate erosion problems with the recent creation of an Environmental Mitigation Fund and hiring of two contractors who will correct erosion control violations when property owners fail to achieve compliance and the cost will be billed to the owner. Despite these improvements, other agency staff and the public perceive that County code enforcement for erosion control could be improved. Low staffing, long response times and the perceived low priority for erosion control violations are the primary criticisms. However, erosion control violations, especially larger ones, can be difficult and expensive to resolve. In recent years, staff turnover and an existing code compliance backlog may have delayed timely enforcement and perhaps have increased the proportion of minor grading activities conducted outside of existing regulations. Erosion control enforcement could be improved with regular training, especially for new staff, better communication between environmental planning and code compliance staff, and regular evaluations to track effectiveness and make improvements. Recently, the City of Santa Cruz Watershed Specialist has begun coordination with the County on enforcement issues, and tries to resolve small violations through outreach to private property owners. County of Santa Cruz Public Works has made strides in maintenance and project practices to reduce erosion, since 1979 when the County’s first Watershed Management Plan was adopted. These improvements include, a policy against side-casting material over the edge of the road; end-hauling slide material to local stockpile sites, and reducing the time that material is stockpiled at road turnouts. With California Department of Fish and Game funding, Public Works has funded a partial roads assessment of the watershed to document culverts and identify areas of high erosion potential. These funds also supported training for maintenance crews in erosion control and the creation of an erosion control manual for Public Works (Ibid., p. 55).

San Lorenzo River Watershed Siltation TMDL September 20, 2002 ATTACHMENT B
Implementation Plan – Page 8-18
8.4.3.2.2 The California Department of Fish and Game The California Department of Fish and Game enforces erosion control standards through:
1. Issuance of Streambed Alteration Agreement Permit (SSA permit) for work in the bed or bank of streams,
2. Taking enforcement action against work done in streams without an SSA permits, 3. Participation in reviews of timber harvest plans; and 4. Taking enforcement action against the discharge of materials deleterious to fish life,
including sediment discharge. In the past, the California Department of Fish and Game (CDFG) issued streambed alteration agreements on a local, less formal basis. Due to a lawsuit, the California Department of Fish and Game is now required to comply with CEQA for all projects under their jurisdiction. CEQA review results in a more careful project review, more coordination with County review, a more lengthy review time, and potentially better original projects with adequate mitigation.
8.4.3.2.3 The California Department of Forestry and Fire Protection 8.4.3.2.3.1 Forest Practice Rules Timber harvest activities on private and public land in California are presently governed by Timber Harvest Rules that were initiated by the Z'berg-Nejedly Forest Practice Act of 1973. The California Department of Forestry (CDF) administers the rules for timber harvest plan permits. Pursuant to a Management Agency Agreement between CDF and the Regional Board, the Regional Board reviews and comments on Timber Harvest Plans (THPs), at times conditioning their approval on specific mitigations to protect water quality. Requirements for THPs have steadily increased and include that erosion control and stream protection measures be developed, documented, reviewed and carried out. Since 1973, many additions and modifications have been added to the rules governing timber harvest. However, the findings of a 1999 Scientific Review Panel (SRP) report found that the Forest Practice Rules (FPR) did not protect endangered salmonid habitat. SRP recommendations have been applied by the State Board of Forestry as an interim measure prior to development of site-specific watershed plans that will eventually guide timber harvest. Interim Rules of the FPR also address threatened or impaired values and state, in addition to all other district Forest Practice Rules, requirements to “comply with the terms of a Total Maximum Daily Load (TMDL) that has been adopted to address factors that may be affected by timber operations if a TMDL has been adopted, or not result in any measurable sediment load increase to a watercourse system or lake” (Section 916.9, 936.9, 956.). Under current conditions in the San Lorenzo River Watershed, management attention to timber harvest roads generally exceeds the attention given to some privately held roads for the two-year period required under the FPR. In some cases, drainage and erosion control improvements on private roads that access THP lands are made possible through harvest activities. However, the fact remains that timber harvest does open up new roads and skid trails, or reactivates older roads and trails that were constructed prior to current standards. Timber roads are often used for residential purposes even though they do not have to meet the standards required for residential roads under County policies and ordinances. After the harvest period, trespass or residential use can induce erosion from timber roads.

San Lorenzo River Watershed Siltation TMDL September 20, 2002 ATTACHMENT B
Implementation Plan – Page 8-19
8.5 Schedule of Compliance Estimates of controllable load were based on application of typical Management Practices appropriate for local conditions (see Chapter 6, Allocations). For each source category, Regional Board staff anticipate reductions would result from an aggressive approach to project implementation. The timeline for implementation will be 25 years. Within this period staff expects that Trackable Implementation Actions and the specific projects they drive, will result in substantial instream habitat improvements. At the same time, staff recognizes that within this 25-year period, extreme storms and episodic sediment loading will occur (SH&G, 2001, p. 43). Because sediment loads are not to be directly measured over this 25-year period, the schedule of implementation for this TMDL tracks the completion of implementation milestones, and lays out a sequence of reviews and evaluations that form the basis of an adaptive management strategy (Table 8-4). This schedule includes an initial period to finalize the comprehensive monitoring plan.

San Lorenzo River Watershed Siltation TMDL September 20, 2002 ATTACHMENT B
Implementation Plan – Page 8-20
Table 8-4 Implementation Compliance Schedule
At End of Implementation
Year:
IMPLEMENTATION MILESTONE MONITORING ACTIVITY
LOAD ALLOCATION2
(tons/yr) San Lorenzo River
Mainstem and Tributaries San Lorenzo River
Mainstem and Tributaries 1 Regional Board (RB) staff and San Lorenzo River Technical Advisory Committee (SLR TAC)
meet to: a) review progress on implementation actions; b) adopt Comprehensive Monitoring Program; and c) establish time schedules for Implementation Actions and plan for Tier 2 and 3 options. RB, County, and City of Santa Cruz and City of Scotts Valley staff meet to review inclusion of Implementation Actions S, T, and U, in Storm water Management Plan.
Refine sampling strategy for comprehensive monitoring plan; Turbidity by water agencies.
2 RB staff and SLR TAC meet to review progress on implementation actions and monitoring. Full suite of Numeric Target Parameters at compliance points; Turbidity by water agencies.
3 Implementing Parties report progress of actions. RB staff and SLR TAC meet to review progress on implementation actions and monitoring; RB staff consider modifications to Trackable Implementation Actions; RB requests implementation tracking report from Implementing Parties if not provided;
Turbidity by water agencies.
4 RB staff and SLR TAC meet to review progress on implementation actions; Turbidity by water agencies. 5 RB staff and SLR TAC meet to review progress on implementation actions; Full suite of Numeric Target
Parameters at compliance points; Turbidity by water agencies.
6 Implementing Parties report progress of actions. RB staff and SLR TAC meet to review progress on implementation actions and monitoring; RB staff consider modifications to Trackable Implementation Actions; RB requests implementation tracking report from Implementing Parties if not provided;
Turbidity by water agencies.
7 RB staff and SLR TAC meet to review progress on implementation actions; Turbidity by water agencies. 8 RB staff and SLR TAC meet to review progress on implementation actions; Full suite of Numeric Target
Parameters at compliance points; Turbidity by water agencies.
9 Implementing Parties report progress of actions. RB staff and SLR TAC meet to review progress on implementation actions and monitoring; RB staff consider modifications to Trackable Implementation Actions; RB requests implementation tracking report from Implementing Parties if not provided;
Turbidity by water agencies.
10 RB staff and SLR TAC meet to review progress on implementation actions; Turbidity by water agencies.
419,369
2 Direct measurement of sediment loading is not proposed for this TMDL. Parameters characterizing the effect of loading are to be measured instead, and are identified as Numeric
Targets. This 25-year schedule for achieving the TMDL acknowledges that implementation actions taken in the near term are expected to take years to produce a response as measured through Numeric Target monitoring.

San Lorenzo River Watershed Siltation TMDL September 20, 2002 ATTACHMENT B
Implementation Plan – Page 8-21
At End of Implementation
Year:
IMPLEMENTATION MILESTONE MONITORING ACTIVITY
LOAD ALLOCATION2
(tons/yr) 11 RB staff and SLR TAC meet to review progress on implementation actions;
RB staff calculate 10-year rolling average of streambed sediment data and turbidity; Full suite of Numeric Target Parameters at compliance points; Turbidity by water agencies.
12 Implementing Parties report progress of actions. RB staff and SLR TAC meet to review progress on implementation actions and monitoring; RB staff consider modifications to Trackable Implementation Actions; RB requests implementation tracking report from Implementing Parties if not provided; RB staff calculate 10-year rolling average of streambed sediment data and turbidity;
Turbidity by water agencies.
13 RB staff and SLR TAC meet to review progress on implementation actions; RB staff calculate 10-year rolling average of streambed sediment data and turbidity;
Turbidity by water agencies.
14 RB staff and SLR TAC meet to review progress on implementation actions; RB staff calculate 10-year rolling average of streambed sediment data and turbidity;
Full suite of Numeric Target Parameters at compliance points; Turbidity by water agencies.
15 Implementing Parties report progress of actions. RB staff and SLR TAC meet to review progress on implementation actions and monitoring; RB staff consider modifications to Trackable Implementation Actions; RB requests implementation tracking report from Implementing Parties if not provided; RB staff calculate 10-year rolling average of streambed sediment data and turbidity;
Turbidity by water agencies.
16-24 Repeat as above with 1- and 3-year milestones
25 Numeric Targets Achieved; Load reduction Achieved
306,139

San Lorenzo River Watershed Siltation TMDL September 20, 2002 ATTACHMENT B
Implementation Plan – Page 8-22
8.6 Demonstrating Compliance
8.6.1 Measures of Success The primary measure of success for implementation of this TMDL is attainment of the numeric targets (which represent or indicate the load allocations). However, recognizing the variability inherent in the factors affecting sediment loads within the San Lorenzo River Watershed, staff will consider other measures of success in evaluating implementation of the TMDL, including attainment of Trackable Implementation Actions. Because it will be several years before we are able to evaluate the effectiveness of implementation using water quality indicators, in the initial phase of implementation we will focus on demonstrating compliance by tracking the completion of actions described in this Implementation Plan. Thus compliance is achieved initially by demonstrating through reporting requirements that implementation measures have been undertaken, and subsequently by showing that numeric targets are achieved through monitoring. A complete description of compliance monitoring is presented in the next section, Monitoring Plan. Regional Board staff and the San Lorenzo River Technical Advisory Committee will meet on an on-going basis at least annually to discuss progress in implementation. In assessing the status of compliance, Regional Board staff will consider the degree to which the Implementing Party has implemented, or is implementing, sediment control measures. Through scheduled reporting, every three years, Implementing Parties will provide the necessary information upon which staff will make the determination of compliance. Every three years, staff will consider possible changes to the actions, reporting requirements and monitoring. Modifications may include selection of additional management practices, or substitution of Management practices identified in this TMDL as Trackable Implementation Actions (Table 8-1). The parameters associated with numeric targets (e.g., residual pool volume, fine sediment percentages, etc.) are relatively insensitive to probable annual variations in the effects of sediment loading. Ideally, parameters would directly account for spatial and temporal variations in precipitation, runoff, and discharge, enabling analysts to distinguish changes in loading and its effects from land use practices, from changes attributable to differences in runoff intensity. Such indicators were not identified for this TMDL, therefore the numeric targets are expressed as ten-year rolling averages. Additional data, including effectiveness monitoring data developed by the County and other Implementing Parties will be collected in parallel with numeric targets data to better inform TMDL compliance evaluations and propose course corrections as necessary. This approach allows proceeding with BMP installation while additional monitoring data are collected to either strengthen the existing analysis or to provide a basis for reviewing and revising the TMDL. This “adaptive management” approach enables stakeholders to move forward with resource protection based on reasonably rigorous planning and assessment.

San Lorenzo River Watershed Siltation TMDL September 20, 2002 ATTACHMENT B
Implementation Plan – Page 8-23
8.6.2 Failure Scenarios There are two “failure scenarios” in which implementation of the TMDL would be considered unsuccessful, and Regional Board action would be required. The first of these would be failing to achieve the numeric targets and corresponding load reductions while at the same time completing Trackable Implementation Actions. Regional Board staff recognizes this outcome is a distinct possibility, based on past occurrences of uncontrollable natural disturbances, such as major floods, catastrophic wildland fires, and earthquakes. Under this failure scenario, the Regional Board’s action would be to re-evaluate the numeric targets and implementation actions and to adjust them as necessary. Staff will consider information provided by Implementing Parties at three-year intervals, including effectiveness monitoring data and percent project completion. This scenario would not prompt enforcement action by the Regional Board and would be consistent with Tier 1, self-determined implementation of management practices. The second failure scenario involves failure to meet numeric targets coupled with failure to achieve Trackable Implementation Actions. Should the Implementing Parties fail to implement or achieve Trackable Implementation Actions, the Regional Board shall consider more stringent regulatory mechanisms, consistent with the Three-Tier Framework for NPS Control (See Compliance and Enforcement below). If necessary, the Regional Board will identify individual responsible dischargers of sediment through investigation and reporting pursuant to section 13267 of the California Water Code. Additionally, the Regional Board will consider inclusion of appropriate trackable implementation actions as requirements in Storm Water or other Permits.
8.6.3 Compliance Assurance and Enforcement As provided in the State Board’s Water Quality Enforcement Policy, prompt, consistent, predictable, and fair enforcement are necessary to deter and correct violations of water quality standards, violations of the California Water Code, and to ensure that Implementing Parties carry out their responsibilities for meeting the TMDL allocations. This and progressive enforcement are particularly necessary to adequately deal with those Implementing Parties who fail to implement self-determined (Tier 1) or regulatory-encouraged (Tier 2) sediment control measures. Thus, Tier 3 of the State’s NPS Framework for pollution prevention, relies on existing enforcement authority and mechanisms (effluent limitations and required actions), and is invoked when Tiers One or Two have failed to address a NPS pollution problem. Among the enforcement actions available to the Regional Board are both informal and formal actions. An enforcement action is any action taken to address an incidence of actual or threatened noncompliance with existing regulations or provisions designed to protect water quality. To this end, the Regional Board may use, as the circumstances of the case may warrant, any combination of the following:
• Implementation and enforcement of Section 13267 of the California Water Code to ensure that all responsible parties submit, in a prompt and complete manner, documentation of effort to install Management Practices, monitoring data or other technical information requested.
• Consideration of adoption of waste discharge requirements, pursuant to Section 13263 of the California Water Code, as appropriate (i.e., for any responsible party who fails to implement voluntary or regulatory-encouraged sediment controls).

San Lorenzo River Watershed Siltation TMDL September 20, 2002 ATTACHMENT B
Implementation Plan – Page 8-24
• Consideration of adoption of an enforcement order pursuant to Section 13304 of the California Water Code against any responsible party who violates Regional Board waste discharge requirements and/or fails to implement voluntary or regulatory-encouraged sediment control measures to prevent and mitigate sediment pollution or threatened pollution of surface waters.
• Consideration of adoption of enforcement orders pursuant to Section 13301 of the California Water Code against those who violate Regional Board waste discharge requirements and/or prohibitions.
• Consideration of Administrative Civil Liability Complaints, as provided for by the California Water Code, against any responsible party who fails to comply with Regional Board orders, prohibitions, and requests.
• Consideration of adoption of referrals of recalcitrant violators of Regional Board orders and prohibitions to the District Attorney or Attorney General for criminal or civil prosecution, respectively.
If the Regional Board were to find that significant discharges or threatened discharges of sediment occur despite the implementation of Trackable Implementation Actions, it would consider the need to revise the actions and would consider the issuance of a Cleanup and Abatement Order (CAO), WDR, or Basin Plan Waste Discharge Prohibition to address the discharge. The Regional Board would not, in this case, impose administrative civil liabilities for violations of the existing waste discharge prohibitions. However if CAOs, WDRs, or prohibitions are established and discharges or threats continue to occur, Regional Board may take enforcement for failure to comply.
8.7 Cost of Implementation Porter-Cologne requires that the Regional Board take “economic considerations”, into account when requiring pollution control requirements (Public Resources Code, Section 21159 (a)(3)(c)). The Regional Board must analyze what methods are available to achieve compliance and the costs of those methods. Costs incurred by the Regional Board for implementation and monitoring have been estimated for informational purposes; however, these estimates are not required for the “economic consideration.”
8.7.1 Introduction Regional Board staff identified a variety of costs associated with implementation of this TMDL. These fall into three broad categories: 1) Trackable Implementation Actions (e.g., revising erosion control ordinance, conducting assessment of road erosion problems); 2) Management practices for permanent to semi-permanent features (e.g., sediment basins) and for routine activities (e.g., road spoils removal) and operation and maintenance of semi-permanent Management practices; and 3) TMDL Monitoring. Several watershed management efforts are funded by a variety of sources. The following list derived from the Draft San Lorenzo River Watershed Management Plan Update (County of Santa Cruz, 2001, pp. 69, 70), identifies sources and funding strategies that are expected to support TMDL implementation:

San Lorenzo River Watershed Siltation TMDL September 20, 2002 ATTACHMENT B
Implementation Plan – Page 8-25
• Private expenditures • Permit fees • Fees for service • Cost-sharing • Grants • State and federal funding • Local general funds • Special districts • Redevelopment agency • Water bills • Pooled resources among agencies • Shift of existing funding
8.7.2 Cost of Trackable Implementation Actions Anticipating the costs of Trackable Implementation Actions with any accuracy is challenging for several reasons. Many of the actions, such as review and revision of policies and ordinances by a governmental agency, could incur no significant costs beyond the program budgets of those agencies. However, other actions, like an assessment of roads to identify restoration needs, do carry discrete costs. Cost estimates are further complicated by the fact that some implementation actions are necessitated by other regulatory requirements (e.g., Phase II Storm water) or are actions anticipated regardless of TMDL adoption. Therefore assigning all of these costs to TMDL implementation would be inaccurate. For example, Phase II Storm water program implementation costs could run as high as $51,000 for a community with a population of 65,000, based on preliminary estimates developed by Regional Board Staff. These programs would include many components that address sediment management in the watershed, such as: public education, a storm water ordinance, and good housekeeping (erosion control, vegetation, storm drain maintenance, and agency staff training for municipal facilities). The City of Watsonville’s (population 38,000) Basic Urban Runoff Program costs were $33,750 and the program will likely result in substantial reductions in sediment loading in storm water flows. Table 8-5 identifies the estimated cost of completing Trackable Implementation Actions. Excluded from this estimate are any costs associated with actual BMP installation (addressed below), as well as costs associated with actions to which stakeholders are committed irrespective of TMDL adoption (e.g. requirements pursuant to NPDES stormwater regulations). Costs to agencies for staff augmentation necessary to provide additional enforcement and outreach activities are included, however no charges are included for these agencies’ planning activities or for policy review and revision, as these are activities consistent with existing agency responsibilities.

San Lorenzo River Watershed Siltation TMDL September 20, 2002 ATTACHMENT B
Implementation Plan – Page 8-26
Table 8-5 Annualized Costs for Trackable Implementation Actions Implementation Action 1 Person Year (PY) = $100,000 Implementing Party
Increase presence at Pre-Harvest Inspections to 100% of Class I and Class II watercourses.
0.05 PY $5,000 RWQCB
Perform Post-Harvest Inspections 3 to 5 years after harvest on THPs with Class I and Class II watercourses crossings.
0.05 PY $5,000 RWQCB
Enforce erosion control ordinance following 3-year THP maintenance period.
0.05 PY $5,000 County Planning
Timber Harvest Plan Best Management Practices 0.1 PY $10,000 CDF
Develop strategy for more effective enforcement of County code violations pertaining to erosion control and sedimentation prevention throughout the San Lorenzo Watershed.
0.05 PY/agency $15,000 County Planning and Public Works, City of Santa Cruz, City of Scotts Valley
Develop private road improvement program. 1 PY for RCD, plus pilot project costs
$200,000 RCD-lead, NRCS, County, RWQCB, CDFG.
Implement education programs and modify policies and procedures to improve riparian corridor protection, maintain channel integrity, implement alternatives to hard bank protection, and retain woody material.
0.1 PY 0.1 PY
$25,000 $25,000
County Planning City of Santa Cruz Water Department
Evaluate need to revise erosion control provisions in Cities of Santa Cruz, Scotts Valley and County’s Grading Regulations and Erosion Control Ordinances to better protect sandy-soil areas.
0.75 PY $75,000 Cities of Santa Cruz, Scotts Valley and County Planning
Promote improved livestock management practices to reduce discharge of sediment.
1.0 PY $100,000 County Planning
TOTAL $465,000
8.7.3 Cost of Erosion Control Management practices While there is a range of discrete costs associated with on-the-ground BMP implementation, several factors influence the accuracy of the estimate of total costs presented here (Table 8-6). The most significant factor is the uncertainty surrounding the number of miles of road, acres of developed upland parcels, or mass wasting areas to be treated. Additional assessment is required to identify where, when, and to what degree these areas would be best addressed with the techniques of erosion control. Because of this uncertainty, Regional Board staff used miles and acreages aggregated for the entire watershed, rather than breaking the estimate out by subwatershed for the estimate presented here. An estimate of cost to conduct assessments is included in the cost estimate for road improvements, and is also factored in to the cost for stream bank protection projects.

San Lorenzo River Watershed Siltation TMDL September 20, 2002 ATTACHMENT B
Implementation Plan – Page 8-27
Table 8-6 Estimated BMP Implementation Costs ROADS
THP Upland
THP Streamside
Public/Private Upland
Public/Private Streamside
Retention Basins3
$3,064,463 $522,724 $1,606,752 $959,810 $1,361,421 $7,515,170 DEVELOPED PARCELS
THP Area (acres) Other Urban and
Rural Area All Mass Wasting $612,160 $3,023,104 $1,354,240 $4,989,504
STREAMBANKS Other Geology Stream Miles
(1project/ 5 miles)
Alluvium Stream Miles
(1 project/3 miles)
Santa Margarita Sandstone Stream Miles
(1 project/mile) $2,358,200 $478,833 $538,000 $3,375,033
TOTAL ROAD COSTS $15,879,707 Total BMP costs for erosion control on roads, developed parcels, and streambanks are estimated to be approximately $16 million (Table 8-6). The following sections discuss how these estimates were developed. The schedule of these costs is not known, since the schedule of actions remains uncertain. Labor, materials, and land values all have bearing on the final cost of implementation, and are all subject to market conditions throughout the period of implementation. However, assuming a 25-year period of implementation, Regional Board staff estimated a cost of approximately $4.8 million for the first five years, and approximately $1.4 million for the first year alone (Table 8-7). Annual maintenance costs as a percentage of construction costs are in addition to these installation costs, and were assumed to be 20 percent (USEPA, 1993, Table 4-16, pp. 4-75-80). Table 8-7 Hypothetical Cost Schedule for BMP Implementation
Costs distributed over 25-years Year 1-5 Year 6-10 Year 11-15 Year 16-20 Year 21-25 Years 1-25
$4,763,912 $3,969,927 $3,175,941 $2,381,956 $1,587,971 $15,879,707 Year 1-5 Costs distributed over first five years
Year 1 Year 2 Year 3 Year 4 Year 5 Years 1-5 $1,429,174 $1,190,978 $ 952,782 $714,587 $476,391 $4,763,912
O&M $285,835
8.7.3.1 Cost Basis for Management practices The cost basis for the estimates presented here was derived from a variety of sources identified in Table 8-8. Regional Board staff used local and recent examples where possible and provided a range of costs to demonstrate how costs could vary. Staff calculated the median cost within this range where appropriate and then applied it to the appropriate unit of measure, e.g., acres to be treated, at predetermined ratios based on several assumptions as described below.
3 Assumes retention basin capacity equivalent to five percent of total drainage area.

San Lorenzo River Watershed Siltation TMDL September 20, 2002 ATTACHMENT B
Implementation Plan – Page 8-28
Table 8-8 Cost Basis for Calculating Cost of BMP Implementation PRICE RANGE TREATMENT
STRATEGY TREATMENT MEASURE TECHNIQUE
$/mile $/unit SOURCE
ROADS
Roads Assessment
360 RWR, 1998, p. 55.
Grass-lined Swales Permanent seeding 2,500/ac 7,000/ac SCC, 2001, p. 55 Infiltration Trenches
Ripping, slash scattering, and waterbar installation
812 USEPA, 1993, p. 3-57. Rolling Dips + Water Bars
$20/dip; $12.50/bar (USEPA, 1993, p. 3-85) Outslope roads Blading, shaping, outsloping, improving
drainage 17,276 6,000 54,297
RWR, 1998, p. 55.
Disperse/Slow Runoff
Pave roads with compacted gravel/decomposed Granite.
Place flow in culverts. Excavate crossings, log string bridges, remove road bench where failing, replace culvert, install ditch-relief culverts, reconstruct headwall, remove road bench where failing
8,892 55,446 60,377
RWR, 1998, p. 55.
Extend culvert outlets and fit with energy dissipaters.
Control Concentrated Runoff
Use curbs to direct runoff on paved roads. Pave road surfaces with asphalt. Pave roads with compacted gravel/decomposed Granite.
Crushed rock to 5cm and large stone to 20cm depth.
3,218/mi 14,481/mi USEPA, 1993, p. 3-46.
Rock line open drainage ditches. Install retaining/slough walls to stabilize road cuts and trap sediments.
Stabilize roadcuts and sidecast with vegetation.
Grass, hydroseed with mulch 321/mi 1,228/mi4 USEPA, 1993, pp. 3-46, 3-56.
Permanent seeding 2,500/ac 7,000/ac SCC, 2001, p. 55.
Soil Stabilization
Erosion Control Blankets 3,000/ac 7,000/ac SCC, 2001, p. 72. Install staged catch basins. Install vegetated filter strips. 4,500/ac 48,000/ac USEPA, 1993, p. 4-80.
Sediment Retention
Install organic debris filters.
4 Savings of $497/km in construction and annual maintenance (USEPA, 1993, p. 3-56).

San Lorenzo River Watershed Siltation TMDL September 20, 2002 ATTACHMENT B
Implementation Plan – Page 8-29
PRICE RANGE TREATMENT STRATEGY
TREATMENT MEASURE TECHNIQUE $/mile $/unit
SOURCE
Install sediment retention basins. $1,000/drainage acre for <50K cu. ft. capacity; $550/drainage acre for >50K cu. ft. capacity.
USEPA, 1993, p. 4-78.
DEVELOPED PARCELS
Install roof gutter and downspout systems and control discharge in pipe.
Control runoff from impervious surfaces
Install pipe extensions and energy dissipaters to safe outlet.
Direct runoff to infiltration trenches. Disperse runoff Direct runoff into grass lined swales and/or open flat vegetated areas.
Mulch and plant vegetation on exposed soils. 800/ac 1,500/ac SCC, 2001, p. 68. Install retaining structures to support fill slopes.
Soil Stabilization
Install retaining / slough walls on cut slopes. Install vegetated filter strips in drainage paths and/or in flow dispersion areas.
4,500/ac 48,000/ac USEPA, 1993, p. 4-80. Sediment Retention
Install catch basins at inlets or culvert discharge points, control outflow by dispersion and/or energy dissipation.
700/ac 900/ac USEPA, 1993, p. 4-78
USEPA, 1993. Guidance Specifying Management Measures for Sources of Nonpoint Pollution in Coastal Waters. 840-B-92-002, January. RWR, 1998: Roques Wildland Resources, 1998. A Report on the Economics of Forest Restoration in the Sierra Nevada (Unpublished Review Draft). August. SCC, 2001: Santa Cruz County, 2001. Draft Santa Cruz County Manual of Erosion Control Standards. Prepared by Salix Applied Earthcare, Redding, CA.

San Lorenzo River Watershed Siltation TMDL September 20, 2002 ATTACHMENT B
Implementation Plan – Page 8-30
8.7.3.2 Cost of Road Management practices The strategies available to address chronic erosion from roads were allocated to the road types quantified in the TMDL roads analysis (Table 8-9). Staff assumed that half of all THP roads would be treated, while public and private roads would be treated at lesser intensities of ten percent and 30 percent for upland and streamside roads, respectively. This distinction was made based on the observation that public and private roads are predominately located in the flatter, urbanized portions of Santa Cruz and would thus require less treatment than roads in the upper watershed. Median costs were assigned to the four broad categories of strategies available, and a fifth category was identified, Roads Assessment, to incorporate the cost of this essential first step in conducting road improvements (Table 8-10). Table 8-9 Allocation of Strategies for Road Improvement Used in Cost Estimate
Disperse/Slow
Runoff
Control Concentrated
Runoff Soil
StabilizationSediment Retention
Miles of Road Total
Miles of Road
Treated THP Roads
Upland 40% 25% 30% 5% 100% 336 50% 168 Streamside 60% 20% 15% 5% 100% 64 50% 32
Public/Private Roads Upland 30% 35% 30% 5% 100% 693 10% 69
Streamside 40% 40% 15% 5% 100% 122 30% 37 Table 8-10 Median Cost per mile of Road Improvements
Roads Assessment Disperse/slow
Runoff
Control Concentrated
Runoff Soil
Stabilization Sediment Retention
Range Median Range Median Range Median Range Median $360 $ 812 $6,000 $ 8,892 $55,446 $ 322 $2,223 $ 4,500 $26,250
$ 6,000 $55,446 $ 1,228 $48,000 $17,276 $60,377 $ 3,218 $54,297 $14,481
Regional Board staff calculated a cost of approximately $7.5 million to install Management practices for road improvements on 306 miles of roads throughout the San Lorenzo Watershed (Table 8-11). Staff further assumed an aggregated cost for annual maintenance as a percentage of construction costs to be 20% (USEPA, 1993, Table 4-16, pp. 4-75-80). The schedule for implementation would be expected to occur over a period of years and would be driven in part by the response of the watershed to Management practices and other implementation actions as they are taken. Considerable uncertainty regarding the schedule and the very necessity of certain implementation actions results from the lag in response time within the watershed. The monitoring plan, which tracks water quality outcomes on a ten-year rolling average, will also include effectiveness monitoring for specific Management Practices, which will inform the selection of when and where to implement Management Practices. However, significant implementation needs to occur initially, before evidence of effectiveness has been established.

San Lorenzo River Watershed Siltation TMDL September 20, 2002 ATTACHMENT B
Implementation Plan – Page 8-31
Table 8-11 Cost Estimate of Road Improvements by Strategy
Disperse/Slow Runoff
Control Concentrated
Runoff Soil StabilizationSediment Retention TOTALS
Miles Treated Cost
Miles Treated Cost
Miles Treated Cost
Miles Treated Cost Cost
Miles Treated
8.7.3.2.1.1 THP Roads Upland 67 $403,200 42 $2,328,732 50 $144,094 8 $220,500 $3,064,463 168
Streamside 19 $115,200 6 $354,854 5 $13,723 2 $42,000 $522,724 32 8.7.3.2.1.2 Public/Private Roads
Upland 21 $124,740 24 $1,344,843 21 $59,439 3 $90,956 $1,606,752 69 Streamside 15 $87,840 15 $811,729 5 $12,203 2 $48,038 $959,810 37
Sediment basins for 5% of drainage areaa $1,361,421 $730,980 $4,840,159 $181,116 $1,762,915 $7,515,170 306
aAssumes average cost of $775/drainage acre.
8.7.3.3 Cost of Management Practices on Developed Parcel Erosion Controls Erosion controls on lands throughout the watershed would cost an estimated $5 million to address (Table 8-12). Regional Board staff assumed five percent of THP areas, two percent of other lands, and one percent of mass wasting areas would be treated. These figures reflect both the expected need and the relative feasibility of achieving erosion control objectives in these areas. Mass wasting areas are notoriously challenging to stabilize when they are underlain by geological conditions like those of the Santa Cruz Mountains. For this reason staff assumed only one acre in one hundred warrants treatment in the San Lorenzo River Watershed. The expense of the treatments available to address the breadth of erosion control problems in developed areas ranges widely. Staff made assumptions of per acre costs of $1,000, $2,000, and $10,000 to address the three broad categories of land types of THP, urban and rural, and mass wasting, respectively (Table 8-12). Table 8-12 Cost of Developed Parcel Erosion Controls
Total Acres Total Treatment Acres Costs
THP Areas
Other Urban and
Rural Areas
All Mass Wasting Areas
THP Areas5%
Other Urban and Rural
Areas 2%
Mass Wasting Areas
1% THP Areas ($1,000/ac)
Other Urban and Rural
($2,000/ac)
Mass Wasting
($10,000/ac)
12,243 75,578 13,542 612 1,512 135 $612,210 $3,023,144 $1,354,340
TOTAL $4,989,694

San Lorenzo River Watershed Siltation TMDL September 20, 2002 ATTACHMENT B
Implementation Plan – Page 8-32
8.7.3.4 Cost of Management Practices for Streambank Erosion Control Bank erosion is difficult and expensive to prevent in the Santa Cruz Mountains. Hardening the banks with structures such as rip rap, gabions and walls often result in more erosion downstream where flow energy is deflected to unprotected banks (SH&G, 2001, pp. 60, 61). However, projects that incorporate the analysis of reach hydraulics and geomorphic stability, and limit the use of hard structures, are feasible and have been completed within the watershed. The median cost of five such projects considered in this analysis is $50,000 (Steve Weisman, personal communication, 2002). Regional Board staff applied this median cost to stream miles traversing the three geologic terrains found in the Santa Cruz Mountains (Table 8-13). Staff assumed the frequency of projects (number of projects per mile of stream) would be greatest on streams within the highly erosive Santa Margarita Sandstone. Staff estimated a total cost of approximately $3.4 million to implement erosion control projects on streambanks along the major tributaries (corresponding to planning watersheds) in the watershed. Table 8-13 Cost of Streambank Erosion Control
Santa Margarita Sandstone
Stream Miles
Alluvium Stream Miles
Other Geology Stream Miles Total
Santa Margarita Sandstone Streams
(1 project/mi.) Alluvium Streams(1 project/3 mi.)
Other Geology Streams
(1project/ 5 mi.) TOTAL 11 29 236 275 $538,000 $478,833 $2,358,200 $3,375,033
8.7.4 Cost of Monitoring Initially, the cost to conduct monitoring numeric targets explicitly required by this TMDL, will be incurred by the Regional Board (Table 8-14). Other monitoring activities conducted by the County of Santa Cruz, water agencies, and parties responsible for erosion control project implementation are not included in this cost estimate, since they are anticipated irrespective of TMDL adoption. Responsibility for monitoring will be reevaluated during triennial review of implementation and progress.

San Lorenzo River Watershed Siltation TMDL September 20, 2002 ATTACHMENT B
Implementation Plan – Page 8-33
Table 8-14 Estimate of Annualized Cost to CCRWQCB for Monitoring TMDL Implementation Monitoring Program Activity Person
Years Costs Watershed Characterization
Continue watershed characterization monitoring 0.08 PY $8,000
Data Management Create Monitoring Program database and make monitoring data accessible through CCAMP web site 0.01 PY $1,000
Collaborate and Coordinate with Other Monitoring Efforts
Coordinate nonpoint source-related and TMDL monitoring with Monitoring Program
0.02 PY $2,000 Finalize monitoring quality assurance guidance which
includes recommended sampling, analytic protocols, and methods 0.02 PY $2,000
Compile data available from other monitoring programs for inclusion in the Monitoring Program database 0.01 PY $1,000
Aid local agencies and volunteer monitoring and watchdog organizations disseminate data through websites 0.01 PY $1,000
Conduct detailed data analysis and write technical reports, summarizing monitoring data for use in TMDL compliance 0.06 PY $6,000
TOTAL 0.21 PY $21,000
8.7.5 Total Estimate of Costs Adding the three cost categories of Trackable Implementation Actions, Management Practices, and TMDL monitoring, the total cost for TMDL implementation is expected to be over $16 million.
Trackable Implementation Actions: $465,000Management Practices: $15,879,707TMDL Monitoring: $21,000
TOTAL $16,405,707

San Lorenzo River Watershed Siltation TMDL September 20, 2002 ATTACHMENT B
Monitoring Plan – Page 9-1
9 MONITORING PLAN The monitoring plan for this TMDL is designed to serve three purposes: 1) to determine whether numeric targets are met, 2) to track the completion of implementation actions required to achieve load reductions, 3) to expand the information base upon which future actions will be based. The plan combines water quality data collection with implementation action tracking. As explained above, because of the relative insensitivity of the four indicators to natural variation, the initial phase of monitoring will emphasize tracking the completion of actions described in the Implementation Plan. However, within the first year of implementation, Regional Board staff and other stakeholders will make further refinements to a Comprehensive Monitoring Program for water quality parameters. The Regional Board will coordinate with other entities undertaking monitoring of sediment and habitat-related parameters through participation in the San Lorenzo River Technical Advisory Committee (TAC). The TAC is a County-led effort comprised of representatives of local and state government and watershed stakeholders such as the San Lorenzo Valley Water District and the Santa Cruz County Resource Conservation District. The outgrowth of this coordination will be a Comprehensive Monitoring Program that includes compliance monitoring (for numeric targets) and monitoring of other habitat conditions. The TAC will annually review data from the Comprehensive Monitoring Program. Data reviewed by the TAC will come from several efforts described more completely below, including: the County of Santa Cruz monitoring plan to evaluate the effectiveness of erosion control efforts, and to better characterize the physical factors that influence local sedimentation and salmonid habitat quality; the City of Santa Cruz Water Department and the San Lorenzo Valley Water District turbidity trend monitoring plan. The annual review will provide a basis to evaluate the effectiveness of existing implementation efforts and make recommendations for additional measures as necessary. Every third year, Regional Board staff will review the results of numeric target monitoring in the context of these other monitoring efforts, and in conjunction with results from tracking the implementation actions. From these data, staff will make determinations of compliance as discussed in the Implementation Plan and consider changes to monitoring.
9.1 Regional Board Monitoring Requirements for TMDL The Comprehensive Monitoring Plan will compliment, but not replace, the Regional Board’s monitoring requirements for this TMDL. Those requirements include triennial compliance point monitoring of the numeric target parameters, and tracking of implementation actions.
9.1.1 Numeric Target Monitoring at Compliance Points Initially, indicator monitoring will be performed by the Regional Board, or its designee, on all listed waterbodies and at the mouths of tributaries into the mainstream. County and Regional Board staff have identified stream reaches as points of attainment (Figure 6 in Appendix E). Monitoring will be performed during low flow conditions (after spring rains have ceased and

San Lorenzo River Watershed Siltation TMDL September 20, 2002 ATTACHMENT B
Monitoring Plan – Page 9-2
prior to the start of fall/winter rains). Table 9-1 describes the monitoring strategy for the full suite of compliance indicators. Table 9-1 TMDL Indicator Monitoring
Numeric Target
Frequency Compliance Point
Protocol Implementing Party
Percent fine fines < 0.85 mm in potential spawning gravels.
< 21% by wet volume using a McNeil (bulk) sample.
Triennually during low-flow period or, less frequent basis after 3 years if D50 correlated with % fines.
See Figure 6. In spawning gravels.
CCRWQCB, 2002
Regional Board
Percent coarse fines < 6 mm in potential spawning gravels.
< 30% by wet volume using a McNeil (bulk) sample.
Triennially during low-flow period or, less frequent basis after 3 years if D50 correlated with % fines.
See Figure 6. In spawning gravels
CCRWQCB, 2002)
Regional Board
Residual Pool Volume (V*). < 0.21 (mean) and < 0.45 (max).
Triennially during low-flow period.
See Figure 6. In qualifying pools5
CCRWQCB, 2002
Regional Board
Median particle size diameter (D50) from riffle crest surfaces.
≥ 37 mm (minimum for a reach) ≥ 69 mm (mean for a reach)
Triennially during low-flow period.
See Figure 6. In spawning gravels
CCRWQCB, 2002
Regional Board
9.1.2 Regional Board Monitoring Implementation Actions Implementation monitoring ensures that identified management actions are undertaken. Implementation monitoring is often cited as the most cost-effective of the monitoring types because it provides information on whether implementation actions are being undertaken as intended. Reporting to the Regional Board at three-year intervals by Implementing Parties, and site inspections by Regional Board staff, are the primary means by which implementation actions are tracked. In evaluating implementation actions, the Regional Board will take into consideration the level of effort made by the Implementing Party, the portion of the action completed, and the extent to which the action has achieved the desired outcomes.
5 Defined in Sediment Assessment Protocols (CCWRQCB, 2002).

San Lorenzo River Watershed Siltation TMDL September 20, 2002 ATTACHMENT B
Monitoring Plan – Page 9-3
9.2 Other Elements of Comprehensive Monitoring Plan
9.2.1 County of Santa Cruz Streambed and Habitat Monitoring The County of Santa Cruz will establish a bed sedimentation monitoring program at intervals of one to five years to evaluate whether erosion control efforts are resulting in improved stream habitat conditions. Additionally, they will monitor stream geomorphology, bank erosion, and streamflow in San Lorenzo mainstream and tributaries to gain a greater understanding of the physical factors that influence local sedimentation and salmonid habitat quality (Table 9-2). Regional Board staff will assist in finding funding sources for implementation and work with a liaison, such as the RCD, to work directly on landowners’ properties. The Implementing Party will generate information as part of each project indicating an estimate of sediment reduction from implementation.

San Lorenzo River Watershed Siltation TMDL September 20, 2002 ATTACHMENT B
Monitoring Plan – Page 9-4
Table 9-2 Santa Cruz County Monitoring Plan. (Source: Swanson Hydrology & Geomorphology, p. 52, Table 5.2: Geomorphic and Sediment Conditions Monitoring Plan) Monitoring Parameter
Description Numeric Target
Frequency of Measurement
Protocol
Discrete Measurements Pool Embeddedness
Pool Embeddedness relates to available escape cover for juveniles under cobbles and boulders (> 100 mm in diameter). Highly embedded pools support less escape cover due to siltation of interstices. This variable is an estimate averaged over the entire pool.
< 25 percent based on ocular estimate
Biannually during low-flow periods. This variable should be estimated at the same locations where V* is measured as a complement to data collected from other methods.
Flosi et. al. (1998)
Reach-scale Measurements Bankfull width and depth
Defined as the flow at which the water begins to access the floodplain. Bankfull is hypothesized to occur during the 1.5 – 2.33 year flood. Often indicated by a break in slope from a streambank to a floodplain depositional surface.
N/A. Should be compared to reference reaches or historic conditions to determine impacts or improvements
An initial survey should be conducted on the reach of interest defining these variables. Surveys should be repeated every 5 years.
Rosgen (1994), Flosi et. al. (1998)
Channel Entrenchment
The ratio between the bankfull width and the width at 2 times the bankfull depth. Is an indicator of the confinement of the channel and the width of the floodplain surface. Some channels can become unnaturally entrenched causing excessive bank erosion and reduced sediment deposition on floodplain surfaces.
N/A. Should be compared to reference reaches or historic conditions to determine impacts or improvements
An initial survey should be conducted on the reach of interest defining these variables. Surveys should be repeated every 5 years.
Rosgen (1994), Flosi et. al. (1998)
Rosgen Channel Type
Rosgen channel type is based on a combination of gradient, dominant substrate, bankfull width to depth ratio, and channel entrenchment. The Rosgen classification is the most common system used on streams.
N/A. Should be compared to reference reaches or historic conditions to determine impacts or improvements.
An initial survey should be conducted on the reach of interest defining these variables. Surveys should be repeated every 5 years.
Rosgen (1994), Flosi et. al. (1998)
Linear distance of eroded banks
Measured distance of actively eroding bank length. Height and assumed cause should also be noted for each discrete bank failure.
N/A. Improvements could be measured through time. Problematic areas could be targeted for restoration.
An initial survey should be conducted on the reach of interest defining these variables. Surveys should be repeated every 5 years.
Rosgen (1994), Flosi et. al. (1998)
Linear distance of modified banks
Measured distance of modified bank length. Type of modification should be noted.
N/A. Improvements could be measured through time. Problematic areas could be targeted for restoration.
An initial survey should be conducted on the reach of interest defining these variables. Surveys should be repeated every 5 years.
Rosgen (1994), Flosi et. al. (1998)
In-channel large woody debris density
Large woody debris (>1 ft diameter, > 6 ft in length) provides important sediment storage and habitat generating elements. Woody debris should be counted within the active channel (bankfull to bankfull) and not include recruitment.
Should be measured every 3-5 years or in the summer following a large flow event. Woody debris surveys could be combined with habitat or bank surveys.
Flosi et. al. (1998)

San Lorenzo River Watershed Siltation TMDL September 20, 2002 ATTACHMENT B
Monitoring Plan – Page 9-5
9.2.2 Project Effectiveness Monitoring Effectiveness monitoring is used to assess whether specific erosion control projects or Management Practices have had the desired effect. The County will work with project proponents to monitor specific projects to determine their immediate and medium term on-site effects. All federal and state funding for watershed improvement projects, including 319(h), Proposition 13, and State Resolving Fund projects, now require that effectiveness monitoring be carried out by the project proponent. Similar requirements are attached to Department of Fish and Game grant programs. Characteristics of effectiveness monitoring plans include:
• Quantifiable approach. Results must be discernible over time so that they can be compared to previous or reference conditions.
• Appropriate in scale and application, and relevant to designated or existing uses and the TMDL numeric target indicators.
• Adequately precise, reproducible by independent investigators, and consistent with scientific understanding of the problems and solutions.
• Able to distinguish among many different factors/sources (e.g., roads, mass wasting). • Understandable to the public and supported by stakeholders. • Feasible and cost-effective. • Anticipatory of potential future conditions and climatic influences. • Minimally disruptive to the beneficial uses during data collection (e.g., avoids disturbing
spawning redds.)
9.2.3 Turbidity The City of Santa Cruz will conduct turbidity trend monitoring to determine if, and to what degree, turbidity impairs the beneficial use of municipal water supply in their operation of water treatment facilities. The City of Santa Cruz operates a continuous reading turbidimeter located at the coast pump station, just above where Highway 1 crosses the River. The turbidimeter is connected to the City’s SCADA system and the City can collect history on it. The City will replumb the sample lines so that only river water is sampled. The City will determine if the range setting of 0-1000 NTU is appropriate to characterize ambient turbidity in the San Lorenzo River. The San Lorenzo Valley Water District will deploy a turbidity monitoring device to produce data comparable to those collected by the City. Together these systems will produce data to characterize the turbidity regime of the San Lorenzo River.
9.3 Data Management and Quality Assurance The Regional Board anticipates several agencies’ involvement in monitoring conditions in the San Lorenzo River Watershed. These agencies would include Santa Cruz County Environmental Health, the City of Santa Cruz, and the San Lorenzo Valley Water District. This approach will require development of a data management plan. Regional Board staff and the other contributors to the monitoring programs will provide data in a format compatible with the Central Coast Ambient Monitoring Program (CCAMP). CCAMP includes data from projects within the Regional Board's jurisdiction (northern Ventura to southern San Mateo counties). The

San Lorenzo River Watershed Siltation TMDL September 20, 2002 ATTACHMENT B
Monitoring Plan – Page 9-6
availability of this data provides opportunities for valuable data comparisons between the San Lorenzo River Watershed and other similar areas. This database and selected analytic tools will be available on the Internet as well as linked to the RWQCB website.

San Lorenzo River Watershed Siltation TMDL September 20, 2002 ATTACHMENT B
Appendix A – Watershed Characterization – Page 1
Appendix A: Watershed Characterization
Geology (from Hecht, 1998, pgs. 8-9) Several prior reports have recognized three separate terrains within the San Lorenzo Valley (see Figure 7), each with its own characteristic hydrologic conditions. The distinctions are often made on the basis of the underlying geology, which strongly affects not only erodibility, but also persistence of flows into the dry season or drought years, the nature of low-flow aquatic habitat, and water quality. • North of the Zayante fault, interbedded sandstones, shales, and mudstone predominate, with
steeply inclined and folded strata. Complex mosaics of soils and vegetation have developed on these geologic structures, resulting in diverse and widespread sediment sources. Slopes tend to be steep, prone to moderate to severe erosion. Principal watersheds are the upper San Lorenzo River (above Boulder Creek), Kings, Two Bar, and Bear Creeks, plus the northern portions of the Boulder Creek and Zayante Creek basins. The Butano fault once brought hard sandstones upward, resulting in a very steep slope rising from the River and Bear Creek abruptly toward the Summit ridge; this zone between the Butano fault and the Summit is now a belt of often –serious sediment sources, as roads and clearings are cut through this oversteepened slope. Dry-season flows are generally lowest in this geologic terrain, with streams often drying to isolated pools during mid-summer; hence, sedimentation (which fills pools) is especially harmful to aquatic habitat, recreation, and water quality.
• South of the Zayante fault, and west of the Ben Lomond fault, the uplifted eastern side of Ben Lomond Mountain forms the southwestern edge of the San Lorenzo watershed. Crystalline bedrock types – principally granitics, schists, and marble (or ‘limestone’ as it is locally known) – have developed residual soils which support steep small forested watersheds with low to moderate background erosion rates. Streams clear up quickly after storms. The lower portions of these watersheds have developed in downslope-dipping sandstones and mudstones, locally prone to landsliding, especially where disturbed. Principal watersheds are Fall, Alba, Clear and Sweetwater Creeks, Malosky, Peavine and Jamison Creeks, and the southern portion of the Boulder Creek Basin. Summer flows are generally sufficient to support perennial stream threads and diverse aquatic habitat. The lower reaches of streams emanating from the eastern slope of Ben Lomond Mountain are used by steelhead and once supported coho, with the middle and upper reaches being too steep for access by anadromous fish.
• The third terrain is found south of the Zayante fault, and east of the Ben Lomond fault and the San Lorenzo River. It includes the Love Creek, Quail Hollow, Graham Hill Road, Mount Hermon and Scotts Valley areas, as well as most of the Bean and Branciforte Creek basins, and the southern portions of the Zayante and Newell Creek watersheds. Here, sandstones and shales form erodible soils which tend to be either very sandy or clay rich. Much of the area was once vegetated with unusual associations of trees and shrubs that exploited niches made available by these atypical soils. By far the largest continuous units of sandy soils are found in this area, and these tend to be sandier than other sandstone-derived soils elsewhere in the watershed. Erosion

San Lorenzo River Watershed Siltation TMDL September 20, 2002 ATTACHMENT B
Appendix A – Watershed Characterization – Page 2
rates are often high to extreme in this terrain, especially where sandy soils occur in headwater areas or near channels. The sandy soils, which were capable of absorbing nearly all rainfall under natural conditions, now form steep-walled gullies and gulches where runoff from paved or covered surfaces is concentrated. Residential, commercial, and industrial uses (including quarries) are among the densest in the San Lorenzo watershed. Roads and homes are probably the predominant sources of sediment, although much of the sediment they ‘generate’ is off-site – from incision of gullies and from bank erosion along gulches and creeks. In places, landslides impinge upon the channels, feeding a seemingly endless supply of sandy material directly into channels. Eroded sediment entering local streams commonly contains much (or mostly) medium and coarse sands, which fills pools and mantles riffles with soft, habitat-impairing sandy beds. The Santa Margarita and Lompico aquifers are recharged through the sandy soils; erosion-inducing runoff represents recharge being lost from these important water-bearing units. The two aquifers not only sustain summer flows in the San Lorenzo River and lower Zayante Creek, but also provide the municipal and industrial water supply for much of the watershed’s population. The quality of water in these aquifers is also maintained by high rates of recharge, and to the extent that land-use change results in increased runoff (and less low-salinity, low-nitrate recharge), water quality is also diminished.
In each of the three segments of the valley, sources and processes of erosion differ somewhat. Challenges posed in restoring fish habitats also differ somewhat amongst the three geologic terrains. Nonetheless, important similarities also cut across these geologic boundaries. Each segment contains areas of sandy soils. Each includes dispersed areas of unstable slopes, and significant areas of sediment sources along the road network. And, in each area, pools which once provided crucial oversummering habitat for anadromous steelhead and coho salmon are chronically filled with sand and fine gravels.
Soils (from Jagger, 1993, pg. 3-5 and Hecht, 1998, pgs. 9-10) Soils of the San Lorenzo watershed are diverse, reflecting the complex bedrock geology of mudstone/shales and sandstones, and fractured granitic rocks, schists, metamorphosed limestones. Soils vary, sometimes markedly, form location to location, depending on the underlying parent materials, and other factors such as climate, aspect, vegetation cover, and local relief (Lindsey and Butler, 1968, secondary reference). Soils of mixed parent material and texture have developed on the alluvial and terrace deposits along nearly all of the major streams and on the colluvial and slope deposits of varying age and slope that fill many of the swales and hollows near the headwaters. Ricker (1979, secondary reference) designated the soils to the west of the Ben Lomond Fault as being slightly erodible, whereas the soils to the north of the Zayante Fault were considered to be highly erodible. Soils to the south of the Zayante Fault and to the east of the Ben Lomond Fault were designated as moderately to highly erodible. A study of sediment yields from Zayante Creek and the lower San Lorenzo River revealed that the largest contributors to sedimentation were the soils derived from the Vaqueros and Butano Sandstones (Coats, 1982, secondary reference), which are prevalent in the north (Brabb, 1970, as referenced by Aston, 1979, secondary reference). The next largest contributors to sedimentation were the Lompico and Santa Margarita Sandstones and the Lambert and Monterey Shales (Coats, 1982, secondary reference), which are common in the

San Lorenzo River Watershed Siltation TMDL September 20, 2002 ATTACHMENT B
Appendix A – Watershed Characterization – Page 3
east (Brabb, 1970, as referenced by Aston, 1979, secondary reference). A recent County Resources Inventory Map (SCS, 1990, secondary reference) indicated that Bean, Bear, Lompico, and Zayante Creeks, all located to the east of the San Lorenzo River have been impaired by natural sedimentation. However, Logan, Kings, and Two Bar Creeks on the east side, and Marshall, Alba, Jamison, Hare, Bull, and Shingle Mill Creeks, on the west side of the San Lorenzo River, also have had impairment from sedimentation from either known or unknown sources. In the most general terms, it can be stated that soils underlain by permeable sandstones, as well as igneous and metamorphic rocks, are classified as deep and well drained to excessively well drained. These sandy and sandy loam soils are dispersed throughout the San Lorenzo Valley, most notable in areas underlain by the Santa Margarita formation. Soils formed from mudstones and shales tend also to be deep, yet somewhat less well drained. Overall depth is often limited by steep slopes and the gradual loss of topsoil to erosional forces. In alluvial areas of San Lorenzo, soils are also considered to be deep and well drained, although soil depth may be locally limited by clay-rich subsoils. Soils formed from the Santa Margarita and (locally) several other sandstone formations, and decomposed granite are also sandy, deep to very deep, excessively well drained, and extremely erodible. These “Zayante” or “Arnold”-type soils are among the sandiest in the State, and have a number of unique properties in addition to erodibility – such as very high infiltration rates, favorable attributes for aquifer recharge, and (often) limited ground cover. Focused efforts to limit mechanical disturbance of sandy soils, combined with added efforts and appropriate erosion control strategies, are necessary to reduce excessive sedimentation from these highly erodible areas, as well as to maintain recharge and quality of ground water. In terms of rapid soil loss through landsliding, AMBAG (1978, secondary reference) and SCCPD (1979, secondary reference) indicated that the areas in the extreme north and extreme east of the watershed have the steep slopes and unstable rock types that are susceptible to landsliding. Data from the Santa Cruz Planning Office by Cooper, Clark and Associates (1974, secondary reference), using aerial maps from 1963, 1968, and 1970, showed that in terms of spatial frequency, both sides of the watershed have had equal landsliding activity. An investigation of slope failures in the Felton Quadrangle after the heavy 1982-1983 winter storms showed slope failures on both sides of the river. This investigation also suggested, however, that slope failures occurred most frequently in highly developed areas or along channels of water (Foxx, 1984, secondary reference). Bedrock failures are not as common as soil failures, according to Coats (1982, secondary reference) and Foxx (1984, secondary reference). When bedrock failures did occur, the Santa Margarita Sandstone seemed most vulnerable, due to its unconsolidated, permeable, and mostly uncemented nature. Coats' (1982, secondary reference) study suggested that bedrock failures were most common in Santa Margarita Sandstone, but asserted that 23 percent of bedrock failures occurred in other types of bedrock, the most notable being Vaqueros Sandstone.
Faults and Seismic Activity (from Hecht, 1998, pgs. 10-11) Faulting and seismicity pose a potential geologic hazard and contribute to overall sediment loading

San Lorenzo River Watershed Siltation TMDL September 20, 2002 ATTACHMENT B
Appendix A – Watershed Characterization – Page 4
in the Santa Cruz Mountains. The San Andreas Fault parallels the northern boundary of the watershed approximately two miles to the north. Numerous faults cross the San Lorenzo Valley, the most notable faults include the Zayante fault, which runs primarily east-west and crosses Loch Lomond; the Ben Lomond fault which runs up the San Lorenzo River to the Boulder Creek area; and the Butano fault, which crosses the northern, highest portions of the San Lorenzo watershed. Santa Cruz County experiences varying levels of seismic activity on a regular basis. The most significant event in recent memory was the 1989 Loma Prieta earthquake, which measured 7.1 on the Richter scale. Widespread damage to structures, roadways, and utilities occurred in the San Lorenzo Valley. Landslides, debris flows, and the reconstruction of residences and infrastructure contributed to both habitat impairing bed sedimentation and persistent turbidity in area streams and surface waters. Sedimentation following future earthquakes should be anticipated:
• Directly from landslides and downslope movements associated with the earthquake or the first rains following the event;
• Indirectly, from reconstruction activities; and
• With delay, from accelerated erosion during heavy storms several years following the event. Santa Cruz County and other agencies seeking disaster-relief funding or assistance may wish to explicitly include measures to manage sedimentation in streams as part of their emergency-response program. These may include (among others) (a) end hauling debris removed from roads and driveways, (b) providing for appropriate erosion-control measures for the “quick and dirty” repairs which follow disasters, (c) preparing field sheets explaining the need and means for these measures directed at out-of-County contractors, or relief workers, and (d) funding for these efforts. Roughly the same sediment sources and control measures might also apply to other episodic events, such as large wildfires or floods.
Major Wildfires and Storms (from Hecht, 1998, pg. 11) Major wildfires and storms are important aspects of bed sedimentation, erosion and aquatic habitat management throughout the Coast Ranges (Jones and others, 1972; Knott, secondary reference, 1978, secondary reference). The San Lorenzo watershed contains substantial areas of fire-adapted vegetation, reported to burn at historical intervals of typically 40 to 80 years (Thomas, 1961, secondary reference; Langenheim and others, 1983, secondary reference).
Water Resources (from SWRCB, 1982, pgs. 13) Local precipitation is the only source of water in the San Lorenzo River Watershed. Average precipitation for the San Lorenzo River Watershed is shown in Figure 8. Precipitation is almost entirely rainfall, which has a direct influence on the amount of annual runoff and the seasonal variation of that runoff. This relationship results in a highly variable amount of annual runoff in the San Lorenzo River. The mean runoff of the river at the USGS

San Lorenzo River Watershed Siltation TMDL September 20, 2002 ATTACHMENT B
Appendix A – Watershed Characterization – Page 5
gaging station at Big Trees is nearly 100,000 acre-feet per year (AFA). One year in ten, the runoff is predicted to drop lower than 21,000 AFA and be higher than 200,000 AFA (Ricker, 1979, secondary reference). During the drought years of 1976-77 water year, the annual runoff dropped to 9,750 acre-feet (AF). Most of the precipitation occurs during the November through April period while most of the runoff occurs from December through May. This one-month delay in runoff is due to delayed passage of water through soil and groundwater storage. However, the availability of water in the tributary basins is not uniform because of differences in the underlying geology. The northern half of the watershed is underlain by older, consolidated sedimentary rocks, which store little water (SCCPD, 1979, secondary reference). Runoff rates are high and summer flows are generally low for the streams that drain this area, including the upper San Lorenzo River, Upper Boulder Creek and Upper Bean Creek. Although this area includes about 50% of the watershed, it provides only about 10% of the flow during dry years. The southwestern sixth of the watershed is underlain by the granitic rock of Ben Lomond Mountain. This area stores relatively large amounts of water which is slowly released to feed springs and streams that maintain the high base flows of Lower Boulder Creek, Clear Creek, Fall Creek, Shingle Mill Creek and Gold Gulch. During dry periods, this area contributes almost 40% of the total base flow of the San Lorenzo River. The northern half of the watershed is underlain by consolidated sedimentary rocks that store little water. Runoff rates are high, and summer flows are generally very low for streams that drain this area: upper San Lorenzo River, upper Boulder Creek, and Upper Bean Creek. Although this overall area comprises 50 percent of the Watershed, during dry years it only contributes about 10 percent of the River flow (SCCPD, 1979, secondary reference).
Land Use (from SWRCB, 1982, pgs 14-15) Land uses in the San Lorenzo River Watershed include: • Urban Areas consisting of housing, commercial, and industrial uses. • Suburban low density development. • Timberland Preserves • Agricultural Land Use, Primarily orchards. • Quarries and gravel extraction plants. • State Park Land. • Roads. • Waterways and water storage. Land use activities that have most disturbed the watershed are suburban development and road building. Much of the prime lowland in the San Lorenzo Watershed has been heavily developed. This has pushed development into areas of steep slope, unstable bedrock, and erodible soils (Ricker, 1979, secondary reference).

San Lorenzo River Watershed Siltation TMDL September 20, 2002 ATTACHMENT B
Appendix B – Background Data for Source Analysis – Page 6
Appendix B: Background Data for Source Analysis The source analysis utilizes two distinct datasets: sediment source category data and sediment production data. The sediment source category dataset was derived from Geographic Information System (GIS) data layers that represent the various sediment source categories defined in the source analysis associated with the listed waterbodies' subwatersheds. Most of the GIS data layers were obtained from the Santa Cruz County's excellent Environmental Management Information System (SCC EMIS). The sediment production dataset was developed from three sources: original field data on roads and certain landslides collected as part of the work performed by Swanson Hydrology and Geology (SH&G, 2001); field data collected by fisheries biologist Don Alley for stream bank erosion as referenced in the SH&G report; and by extrapolation of field data and sediment production estimates produced for the California Department of Forestry and Fire Prevention's (CDF) "Watershed Assessment for the East Branch of Soquel Creek (Cafferata, 1993). Erosion rates, delivery ratios and sedimentation rates are shown in Table 1. Associated footnotes describe the development of the table. The following summary of the methodology used for quantifying hillslope erosion and sedimentation is taken from the CDF report for the East Branch of Soquel Creek (Cafferata, 1993, pg. 28). Quantitative estimates of erosion risk and erosion volumes associated with past and anticipated activities (i.e., timber harvesting and road building) were made based on the results of the Critical Sites Erosions Study (CSES). A selected number of random sample locations were utilized on existing, planned and abandoned roads, as well as on past harvest areas. Data was input into equations to estimate the risk of generating critical erosion sites (i.e., large erosion events producing more than 100 yds3/ac). On-site measurements were made to estimate other sources of erosion not addressed by the CSES. Estimates were then made of the amount of sediment that could result from the estimated erosion. Finally, the significance of the estimated sedimentation was studied by comparing it with estimates of sediment yield for Soquel Creek, based on data from the San Lorenzo River, a similar, neighboring basin. The methodology utilized for the hillslope erosion and sedimentation analysis was designed by Rice and has been used in several parts of the state.

San Lorenzo River Watershed Siltation TMDL September 20, 2002 ATTACHMENT B
Appendix B – Background Data for Source Analysis – Page 7
Table 1: Sediment Source Estimates (SH&G, 2001, adapted from Table 4.4)
Sediment Source Category Erosion Rate Delivery Ratio Sedimentation Rate
THP Roads (streamside roads on steep slopes)a
413 tons/mi/yr 1.00 413 tons/mi/yr
THP Roads (upland)b 413 tons/mi/yr 0.42 173 tons/mi/yr
Streamside Public and Private Roads on Steep Slopesc
120 tons/mi/yr 1.00 120 tons/mi/yr
Public and Private Roads (upland)d 120 tons/mi/yr 0.42 50 tons/mi/yr
Active and Recent THP Parcelse 206 tons/mi2/yr 0.42 87 tons/mi2/yr
Other Urban and Rural Landsf 1310 tons/mi2/yr 0.42 550 tons/mi2/yr
Mass Wastingg 3570 tons/mi/yr 0.42 1500 tons/mi/yr
Channel/Bank Erosion – Alluvium and Santa Margarita Sandstone Geologic Unitsh
400 tons/mi/yr 1.00 400 tons/mi/yr
Channel/Bank Erosion – Other Geologic Unitsi
200 tons/mi/yr 1.00 200 tons/mi/yr
Footnotes for Table 1 (from SH&G, 2001, pg. 36): a) Streamside THP Roads on Steep Slopes - Rate based on Cafferata (1993) estimates from the East Branch of Soquel Creek for Forestry Roads Currently in Use. The rate, in yd 3 /ac was converted to tons/yr assuming a soil bulk density of 85 lbs/ft 3 .The delivery efficiency to stream channels was assumed to be 100% since the estimate is for streamside roads on steep slopes. b) THP Roads (upland) - Rate based on Cafferata (1993) estimates from the East Branch of Soquel Creek for Forestry Roads Currently in Use. The rate, in yd 3 /ac was converted to tons/yr assuming a soil bulk density of 85 lbs/ft 3 .The delivery efficiency to stream channels was assumed to be 42% based on an average rate determined from the Soquel Demonstration Forest. c) Streamside Public/Private Roads on Steep Slopes - The Soquel Demonstration Forest Study (Cafferata, 1993) reported an erosion rate from Non-Forestry Roads as 46.8 yd3/mi. Since the density and location of road in the Zayante Study Area does not resemble public and private road densities in the Demonstration Forest, field data collected by SH&G was used. SH&G collected information from representative road cuts throughout the Zayante Study Area and applied a USDA-NRCS erosion yield methodology. The result was an erosion rate of approximately 40 tons/mi/yr from road cuts. To account for erosion from inside ditches, road shoulders and the road surface, this value was tripled. A sediment delivery efficiency of 100% was used for streamside roads on steep slopes. d). Public/Private Roads (upland) - The Soquel Demonstration Forest Study (Cafferata, 1993) reported an erosion rate from Non-Forestry Roads as 46.8 yd3/mi. Since the density and location of road in the Zayante Study Area does not resemble public and private road densities in the Demonstration Forest, field data collected by SH&G was used. SH&G collected information from representative road cuts throughout the Zayante Study Area and applied a USDA-NRCS erosion yield methodology. The result was an erosion rate of approximately 40 tons/mi/yr from road cuts. To account for erosion from inside ditches, road shoulders and the road surface, this value was tripled. A sediment delivery efficiency of 42% was used for Upland roads. e) Active and Recent THP Parcels - Rate based on Cafferata (1993) estimates from the East Branch of Soquel Creek for Harvest Areas of the Last 20 Years. The rate, in yd 3 /ac was converted to tons/yr assuming a soil bulk density of 85 lbs/cu ft . The delivery efficiency to stream channels was assumed to be 42% based on an average rate determined from the Soquel Demonstration Forest f) Other Urban and Rural Lands - The Soquel Demonstration Forest Study (Cafferata, 1993) reported a background erosion rate of 5.8 yd 3 /ac/yr that was derived from previous studies of sedimentation in Loch Lomond. The Brown (1973) report on average sedimentation rates measured in Loch Lomond Reservoir reported rates of 1100 tons/mi 2 /yr. Given the available information we were unable to back calculate and obtain equivalent values. Instead, the

San Lorenzo River Watershed Siltation TMDL September 20, 2002 ATTACHMENT B
Appendix B – Background Data for Source Analysis – Page 8
Brown value was used along with a delivery efficiency of 42%. This rate included sediment from surface erosion and mass wasting. Mass wasting was removed from this category and placed in its own category. Fifty percent of the original rate was transferred to mass wasting. g) Mass Wasting - Sediment Yield from Mass Wasting was estimated by taking 50% of the value from Other Urban and Rural Lands and adding estimated erosion rates from known active landslides in the project area. An additional amount was also added to account for unknown mass wasting sources. This category also accounts for mass wasting from timberlands and roads that were not accounted for in other Sediment Source Categories. h) Channel/Bank Erosion (Alluvium and Santa Margarita Sandstone Geologic Units - Sediment Yield from Channel/Bank Erosion is assumed to come from two sources, bank erosion (assumed to be 60% of the process) and channel downcutting (assumed to be 40% of the process). Bank erosion was estimated based on field surveys conducted by Don Alley. The total cut area for the survey was calculated and multiplied by an assumed retreat rate of 0.5 feet per year. The volume was then divided by the total stream mileage surveyed to produce a sediment yield per mile of stream. Since no data are available for rates of channel downcutting in the Santa Cruz Mountains, channel downcutting was assumed to amount to 40% of the Channel/Bank Erosion sediment yield. The combined value of bank erosion and Channel/Bank downcutting was converted to tons/sq mi /yr by multiplying by the stream mileage in the studied watershed. Soil bulk density was assumed to be 100-lbs/cu ft. i) Channel/Bank Erosion (Other Geologic Units) – This is 50% of the value used for Channel/Bank Erosion (Alluvium and Santa Margarita Sandstone Geologic Units). Alluvium and Santa Margarita Sandstone are highly erodible relative to the other geologic units represented in the San Lorenzo River Watershed, so this value was reduced by 50% in order to give a more realistic accounting of Channel/Bank Erosion throughout the watershed.
The data development methodology for estimating sediment production for this TMDL is discussed below. The numbers shown for Newell Creek in this section are different than those shown in the final table in the Source Analysis Section. Sediment yield numbers were reduced in the final table because Loch Lomond Reservoir traps a significant amount of the sediment that enters it (>90%). A ratio of the land area above the reservoir to the total land area of the Newell Creek subwatershed * 0.10 was used to reduce the estimated sediment yield from the portion of Newell Creek that enters into Loch Lomond Reservoir.
Sediment Source Categories and Sediment Production Calculation Methodology The land uses identified as sediment source categories were outlined in the Source Analysis Section and are discussed below. 1. Timber Harvesting Plan (THP) Roads (streamside on steep slopes and upland)
THP seasonal and temporary roads and skid trails were identified as a distinct sediment source category for the purposes of this TMDL. They are treated equally for calculating sediment production and therefore will be collectively referred to as THP Roads. THP roads were split into two categories, streamside roads on steep slopes and upland roads. It was felt that the streamside roads on steep slopes have a higher sediment delivery ratio (100%) to the streams versus the sediment delivery ratio for the upland roads (42%). Streamside roads on steep slopes are those roads that fall within a 200 foot buffer of the SCC EMIS streams layer. Upland roads are those that fall outside the 200 foot buffer. Delivery ratios represent the percentage of eroded materials that actually reach the streams.

San Lorenzo River Watershed Siltation TMDL September 20, 2002 ATTACHMENT B
Appendix B – Background Data for Source Analysis – Page 9
The basic calculation for estimating sediment delivery to the streams for roads is: Sediment Load (tons/yr) = length of road (mi) * erosion rate per length of road (tons/mi/yr) * delivery ratio (%) Sediment loads were calculated on a subwatershed basis (see Figure 10 and Figure 11). Road lengths within each subwatershed were calculated by taking an average road length/THP acre and multiplying it by the THP acreage within a subwatershed (see Section 3. Active and Recent THP Lands, below for a discussion on THP Acreages). The average values for THP roads per logged acreage were calculated based on a review of 100 THPs from the San Lorenzo River Watershed. The review was conducted in order to establish an average value for the length of seasonal and temporary roads and skid trails per acre associated with the THPs. Lengths of roads and skid trails were measured from maps provided as part of the THP submittal. The maps varied greatly in quality and level of detail, therefore, only 73 THPs of the 100 reviewed were used to establish an average length of road and trails for each acre logged. As shown in the table below, it was found there was a distinct break in the average road and trail length per acre between THPs below 150 acres and THPs greater than or equal to 150 acres. The value used to calculate THP road and trail lengths was increased by 10% in order to account for the low quality of, and lack of detail on, some of the maps.
Table 0-1 THP Road and Trails Length per Acre Logged Acreage
Average Length of Roads & Skid Trails (feet/acre)
Average Length of Roads & Skid Trails + 10% MOS (feet/acre)
<150 186 204 >=150 111 122
THP and roads were not digitized for the areas outside the SH&G study area because it was felt that the quality of the maps in the THP submittals was not good enough to justify the amount of effort required to input this data The ratio of streamside on steep slopes to upland THP roads (Streamside on Steep Slopes - 16%, Upland - 84%) was derived using the SH&G digitized data for the Zayante Area Sediment Study. This ratio was applied consistently across each subwatershed to estimate the total length of streamside on steep slopes and upland THP roads within each subwatershed. The erosion rate per mile of road is assumed to be 413 tons/mi/yr as used in the SH&G (2001) study. This value was originally used by Cafferata (1993). The delivery ratio for upland roads is 42% as used in the SH&G (2001) study. This value is based on the average efficiency from all erosion sources as presented in Cafferata (1993).

San Lorenzo River Watershed Siltation TMDL September 20, 2002 ATTACHMENT B
Appendix B – Background Data for Source Analysis – Page 10
The delivery ratio for streamside roads on steep slopes is100% as used in the SH&G (2001) study. This value is used due to the adjacency of the source to stream corridors. Using the above values the sediment load equations for upland and streamside roads on steep slopes are shown below: Upland: Sed. Load = 0.84 * road length (mi) * 413 tons/mi/yr * 0.42 Streamside on Steep Slopes: Sed. Load = 0.16 * road length (mi) * 413 tons/mi/yr * 1.0 THP upland roads sediment yields are shown in Table 0-2 and Figure 10. THP streamside roads on steep slopes sediment yields are shown in Table 0-3 and Figure 11.
Table 0-2 Timber Harvesting Plan Upland Roads Sediment Yield
Subwatershed ID
Subwatershed Name
All THP Roads (mi)
A
Upland THP Roads (mi) B = 0.84 * A
Upland THP Roads Sediment Yield (tons/year)
C = B * 413 * 0.42
304.12010 Upper San Lorenzo River 40.59 34.10 5,915
304.12011 Kings Creek 73.27 61.55 10,677 304.12020 Boulder Creek 52.90 44.44 7,708 304.12021 Ben Lomond 28.43 23.88 4,143
304.12022 Middle San Lorenzo River 15.68 13.17 2,284
304.12023 Shingle Mill Creek 0.00 0 304.12030 Bear Creek 63.34 53.21 9,230 304.12031 Newell Creek 42.40 35.62 6,179 304.12040 Zayante Creek 47.52 39.92 6,924 304.12041 Bean Creek 12.03 10.10 1,753 304.12042 Lompico Creek 6.06 5.09 883 304.12050 Carbonera Creek 6.03 5.06 878 304.12051 Branciforte Creek 11.50 9.66 1,676 304.12052 Pasatiempo Creek 0.00 0 304.12053 Santa Cruz 0.00 0
Totals 400 336 58,342
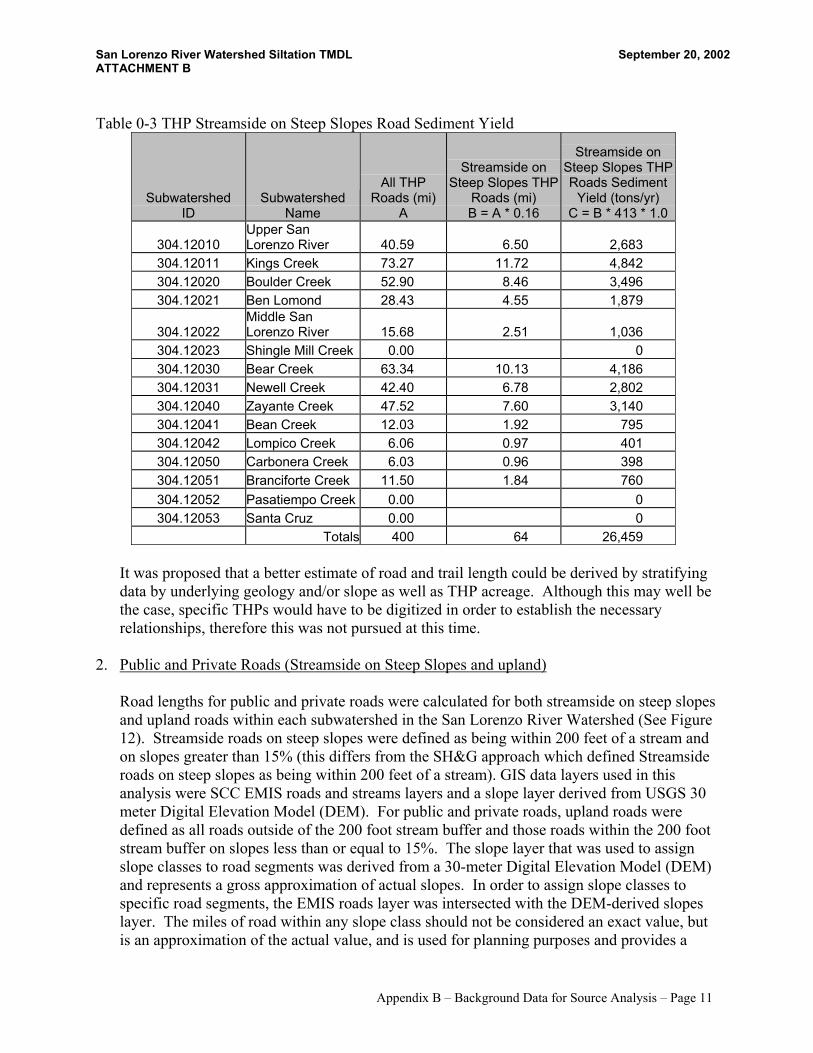
San Lorenzo River Watershed Siltation TMDL September 20, 2002 ATTACHMENT B
Appendix B – Background Data for Source Analysis – Page 11
Table 0-3 THP Streamside on Steep Slopes Road Sediment Yield
Subwatershed ID
Subwatershed Name
All THP Roads (mi)
A
Streamside on Steep Slopes THP
Roads (mi) B = A * 0.16
Streamside on Steep Slopes THP Roads Sediment
Yield (tons/yr) C = B * 413 * 1.0
304.12010 Upper San Lorenzo River 40.59 6.50 2,683
304.12011 Kings Creek 73.27 11.72 4,842 304.12020 Boulder Creek 52.90 8.46 3,496 304.12021 Ben Lomond 28.43 4.55 1,879
304.12022 Middle San Lorenzo River 15.68 2.51 1,036
304.12023 Shingle Mill Creek 0.00 0 304.12030 Bear Creek 63.34 10.13 4,186 304.12031 Newell Creek 42.40 6.78 2,802 304.12040 Zayante Creek 47.52 7.60 3,140 304.12041 Bean Creek 12.03 1.92 795 304.12042 Lompico Creek 6.06 0.97 401 304.12050 Carbonera Creek 6.03 0.96 398 304.12051 Branciforte Creek 11.50 1.84 760 304.12052 Pasatiempo Creek 0.00 0 304.12053 Santa Cruz 0.00 0
Totals 400 64 26,459 It was proposed that a better estimate of road and trail length could be derived by stratifying data by underlying geology and/or slope as well as THP acreage. Although this may well be the case, specific THPs would have to be digitized in order to establish the necessary relationships, therefore this was not pursued at this time.
2. Public and Private Roads (Streamside on Steep Slopes and upland) Road lengths for public and private roads were calculated for both streamside on steep slopes and upland roads within each subwatershed in the San Lorenzo River Watershed (See Figure 12). Streamside roads on steep slopes were defined as being within 200 feet of a stream and on slopes greater than 15% (this differs from the SH&G approach which defined Streamside roads on steep slopes as being within 200 feet of a stream). GIS data layers used in this analysis were SCC EMIS roads and streams layers and a slope layer derived from USGS 30 meter Digital Elevation Model (DEM). For public and private roads, upland roads were defined as all roads outside of the 200 foot stream buffer and those roads within the 200 foot stream buffer on slopes less than or equal to 15%. The slope layer that was used to assign slope classes to road segments was derived from a 30-meter Digital Elevation Model (DEM) and represents a gross approximation of actual slopes. In order to assign slope classes to specific road segments, the EMIS roads layer was intersected with the DEM-derived slopes layer. The miles of road within any slope class should not be considered an exact value, but is an approximation of the actual value, and is used for planning purposes and provides a

San Lorenzo River Watershed Siltation TMDL September 20, 2002 ATTACHMENT B
Appendix B – Background Data for Source Analysis – Page 12
basis for comparing subwatersheds. The lengths derived from the GIS are used in the analysis to estimate sediment loads associated with public and private roads. The delivery ratios for the different road categories are the same as for the THP roads with one exception: upland – 42% and streamside on steep slopes – 100%. The exception is for slopes <=15% that are more than 200 ft. from a watercourse. The delivery ratio for these roads was set at 10%. The erosion rate per mile of road is assumed to be 120 tons/mi/yr as used in the SH&G (2001) study. This value was derived from the data developed from the SH&G road survey and values used by Cafferata (1993). The equations for estimating sediment load from public and private roads are essentially the same as those used for THP roads with the exception that the lengths for upland and streamside roads on steep slopes are derived directly from the GIS data for public and private roads. Using the above values the sediment load equations for upland and streamside roads on steep slopes are shown below: Upland (slope > 15% and outside buffer or slope <= 15% and inside buffer:
Sed. Load = road length * 120 tons/mi/yr * 0.42
Upland (slope <= 15% and outside buffer):
Sed. Load = road length * 120 tons/mi/yr * 0.42
Streamside on Steep Slopes: Sed. Load = road length (mi) * 120 tons/mi/yr * 1.0 Public/Private Upland Roads Sediment Yield is shown in Table 0-4 and Figure 13. Public/Private Streamside roads on steep slopes Sediment Yield is shown in Table 0-5 and Figure 14.

San Lorenzo River Watershed Siltation TMDL September 20, 2002 ATTACHMENT B
Appendix B – Background Data for Source Analysis – Page 13
Table 0-4 Public/Private Upland Roads Sediment Yield
Subwatershed ID Subwatershed
SubWatershed Area (sq mi)
A
Total Mileage Public/Private
Roads (mi)B
Upland Roads <=15%
Inside Buffer>15%
Outside Buffer (mi) C
Upland Roads <=15% Outside Buffer (mi) D
Upland Roads
Sediment Yield
(tons/yr) G =
C*120*0.42 +
D*120*0.10
304.12010 Upper San Lorenzo River 11.53 53.87 44.48 1.47
2,260
304.12011 Kings Creek 12.13 50.48 37.69 1.81 1,921 304.12020 Boulder Creek 11.47 53.04 38.66 4.59 2,003 304.12021 Ben Lomond 10.32 82.58 60.08 9.93 3,147
304.12022 Middle San Lorenzo River 15.87 92.02 60.32 20.92 3,291
304.12023 Shingle Mill Creek 0.71 7.82 5.12 1.44
275
304.12030 Bear Creek 16.23 65.91 50.50 1.75 2,566 304.12031 Newell Creek 9.72 15.08 11.48 0.97 590 304.12040 Zayante Creek 14.02 81.55 66.16 3.45 3,376 304.12041 Bean Creek 10.41 75.87 53.23 10.14 2,804 304.12042 Lompico Creek 2.77 22.85 17.70 0.30 896
304.12050 Carbonera Creek 7.08 72.46 45.38 24.61 2,583
304.12051 Branciforte Creek 9.95 58.17 39.78 3.86 2,051
304.12052 Pasatiempo Creek 0.80 9.11 6.21 2.90 348
304.12053 Santa Cruz 4.23 74.60 10.75 63.41 1,302

San Lorenzo River Watershed Siltation TMDL September 20, 2002 ATTACHMENT B
Appendix B – Background Data for Source Analysis – Page 14
Table 0-5 Public/Private Streamside roads on steep slopes Sediment Yield
Subwatershed ID Subwatershed
SubWatershed Area (sq mi)
A
Total Mileage Public/Private
Roads (mi) B
Streamside Roads on Steep Slopes
(mi) C
Streamside roads on steep slopes Sediment Yield
(tons/yr) D = C*120*1.0
304.12010 Upper San Lorenzo River 11.53 54.26 7.92 951
304.12011 Kings Creek 12.13 50.47 10.98 1,317 304.12020 Boulder Creek 11.47 53.19 9.80 1,176 304.12021 Ben Lomond 10.32 82.57 12.57 1,509
304.12022 Middle San Lorenzo River 15.87 92.15 10.78 1,294
304.12023 Shingle Mill Creek 0.71 7.81 1.25 150
304.12030 Bear Creek 16.23 66.39 13.65 1,638 304.12031 Newell Creek 9.72 15.09 2.64 316 304.12040 Zayante Creek 14.02 81.92 11.93 1,432 304.12041 Bean Creek 10.41 75.99 12.50 1,499 304.12042 Lompico Creek 2.77 22.81 4.85 582
304.12050 Carbonera Creek 7.08 72.41 2.46 295
304.12051 Branciforte Creek 9.95 58.35 14.53 1,744
304.12052 Pasatiempo Creek 0.80 9.10
304.12053 Santa Cruz 4.23 74.61 0.45 54 The public and private roads data was obtained from the SCC EMIS. While an excellent data source, there are some slight limitations that required remedying before this data layer could be used in the analysis. Some roads that appear on this layer are "paper roads", roads that are typically part of a subdivision that has never been built but are included on county documents such as assessor parcel maps. Using digital orthophoto quarter quads (DOQQ) images and parcel data from the SCC EMIS, roads that appeared to be paper roads were identified as such in the roads data table. This was done identifying undeveloped parcels and overlaying the roads layer and the parcel layer on the DOQQ images. Wherever it appeared that roads led to only undeveloped parcels and there were no readily identifiable roads on the DOQQs, the roads were assumed to be paper roads. This turned out to be a very small percentage of the roads within the watershed. They are not included in the analysis.
3. Active and Recent THP Lands
THP land acreage was used to develop sediment source loads attributed to harvested lands within the subject subwatersheds. THP acreages were used in conjunction with erosion rate

San Lorenzo River Watershed Siltation TMDL September 20, 2002 ATTACHMENT B
Appendix B – Background Data for Source Analysis – Page 15
estimates and delivery ratios to calculate estimated sediment loads for this sediment source category. These values were also used to develop sediment source loads for THP roads and trails, as discussed above. Sediment delivery to streams for active and recent THPs was calculated using the following equation: Sediment load (tons/year) = THP acreage * erosion rate (tons/ac/yr) * delivery ratio THP submittals were used to develop land acreages for active and recent THPs for THPs submitted within the time period of 1988 to mid-year 2000. Only plans that had been “Accepted” were included in the acreage totals. As part of a THP, the plan must include harvest acres and sections (from the Public Land Survey System (PLSS)) included in the plan area. THP files were reviewed for the Central Coast Regional Water Quality Control Board's region, including the San Lorenzo River Watershed. THP number, section(s), and harvest acres for each THP were entered into a database. When THPs were located on multiple sections, some THPs did not specify how much acreage of the total THP acreage occurred on each section. When this occurred, the acreage was divided up evenly between each section. This data was joined to the Public Land Survey System (section level) GIS layer. Values for total harvest acres per section could then be located geographically within the subwatersheds. Since section boundaries do not conform to watershed boundaries, harvest acres were apportioned to each subwatershed by using a ratio of the area of the section that was located within each subwatershed to the total acreage of the section. As part of the THP, parcel level information may be provided on an optional basis. For THPs that provided parcel data, a process similar to the one described for sections was performed. Parcel level data is preferred to section level data because it typically provides a better estimate of the geographic location of the THP than the section level data provides. In cases where the parcel is larger than an individual section, section level data may be more accurate. A parcel GIS layer was acquired from the SCC EMIS for use in locating THPs geographically. Where available, parcel level data was used in lieu of section data. There were problems with using parcel data. For some THPs, not all of the parcels identified in a THP could be associated with a parcel in the GIS layer. When this was the case, the section level data was used. Also, when section level data is apportioned at finer and finer resolution (e.g. the subwatershed level), the ability to correctly locate the THP acreage geographically becomes less precise. Acreages were converted to square miles using a conversion factor of 640 acres/mi2. An erosion rate of 206 tons/mi2/yr was used in this TMDL. This is the rate used in the SH&G study which is based on Cafferata (1993).

San Lorenzo River Watershed Siltation TMDL September 20, 2002 ATTACHMENT B
Appendix B – Background Data for Source Analysis – Page 16
A delivery ratio of 42% was used in this TMDL. This is the ratio used in the SH&G (2001) study which is based on Cafferata (1993). The equation for estimating sediment loads from active and recent THPs is: Sediment Load (tons/year) = THP area (mi2) * 206 tons/mi2/yr * 0.42
THP Lands Sediment Yield is shown in Table 0-6 and Figure 15.
Table 0-6 Active and Recent THPs Sediment Yield
Subwatershed ID Subwatershed
Subwatershed (sq mi)
A
THP Area (sq mi)
B
% Area in THP (%)
C = B/A * 100
THP Sediment Yield (tons/yr)
D = B * 206 * 0.42
304.12010 Upper San Lorenzo River 11.53 1.54 13.40% 134
304.12011 Kings Creek 12.13 3.68 30.37% 319 304.12020 Boulder Creek 11.47 2.68 23.36% 232 304.12021 Ben Lomond 10.32 1.22 11.83% 106
304.12022 Middle San Lorenzo River 15.87 0.82 5.14% 71
304.12023 Shingle Mill Creek 0.71 0
304.12030 Bear Creek 16.23 2.84 17.48% 246 304.12031 Newell Creek 9.72 2.29 23.58% 198 304.12040 Zayante Creek 14.02 2.40 17.10% 207 304.12041 Bean Creek 10.41 0.57 5.43% 49 304.12042 Lompico Creek 2.77 0.26 9.54% 23 304.12050 Carbonera Creek 7.08 0.38 5.32% 33
304.12051 Branciforte Creek 9.95 0.45 4.56% 39
304.12052 Pasatiempo Creek 0.80 0
304.12053 Santa Cruz 4.23 0
4. Other Urban and Rural Lands
Other Urban and Rural lands were assumed to be all lands within a subject watershed that were not part of the recent and active THP lands. The acreage for these lands was calculated simply by subtracting the estimated THP lands within the subject watershed from the total acreage for the watershed. Sediment delivery to streams for active and recent THPs was calculated using the following equation: Sediment load (tons/year) = Other Urban and Rural Lands acreage * erosion rate (tons/ac/yr) * delivery ratio

San Lorenzo River Watershed Siltation TMDL September 20, 2002 ATTACHMENT B
Appendix B – Background Data for Source Analysis – Page 17
The equation for estimating sediment loads from Other Urban and Rural Lands is: Sediment Load (tons/year) = Other Urban and Rural lands area (mi2) * 1310 tons/mi2/yr * 0.42 Other Urban and Rural Lands Sediment Yield are shown in Table 0-7 and Figure 16.
Table 0-7 Other Urban and Rural Lands Sediment Yield
Subwatershed ID Subwatershed
Subwatershed (sq mi)
A
THP Area (sq mi)
B
Other Urban and Rural
Area (sq mi)C = A - B
% Area in Other Urban
and Rural D = C/A * 100
Other Urban and Rural
Sediment Yield (tons/yr)
E = C * 1310 * 0.42
304.12010 Upper San Lorenzo River 11.53 1.54 9.98 86.60% 5,491
304.12011 Kings Creek 12.13 3.68 8.45 69.63% 4,648 304.12020 Boulder Creek 11.47 2.68 8.79 76.64% 4,839 304.12021 Ben Lomond 10.32 1.22 9.10 88.17% 5,005
304.12022 Middle San Lorenzo River 15.87 0.82 15.06 94.86% 8,284
304.12023 Shingle Mill Creek 0.71 0.71 100.00% 391
304.12030 Bear Creek 16.23 2.84 13.39 82.52% 7,368 304.12031 Newell Creek 9.72 2.29 7.43 76.42% 4,087 304.12040 Zayante Creek 14.02 2.40 11.62 82.90% 6,393 304.12041 Bean Creek 10.41 0.57 9.84 94.57% 5,416 304.12042 Lompico Creek 2.77 0.26 2.50 90.46% 1,378 304.12050 Carbonera Creek 7.08 0.38 6.70 94.68% 3,687
304.12051 Branciforte Creek 9.95 0.45 9.49 95.44% 5,223
304.12052 Pasatiempo Creek 0.80 0.80 100.00% 442
304.12053 Santa Cruz 4.23 4.23 100.00% 2,327
An erosion rate of 1310 tons/mi2/yr was used to estimate sediment loads. This was the value used in the SH&G study and was derived from sedimentation rates in Loch Lomond Reservoir. Since the rate developed from the Loch Lomond Reservoir data included mass wasting, 50% the erosion rate is assigned to the mass wasting category and 50% is assigned to the Other Urban and Rural lands. Therefore, the value of 1310 tons/mi2/yr represents 50% of the estimated sediment rate derived from the Loch Lomond Reservoir data. The Other Urban and Rural lands were lumped together into one category because the original document (Cafferata, 1993) from which the erosion rates and delivery ratios were obtained lumped these lands into one category.

San Lorenzo River Watershed Siltation TMDL September 20, 2002 ATTACHMENT B
Appendix B – Background Data for Source Analysis – Page 18
5. Mass Wasting
In the SH&G study mass wasting was broken out of the THP lands and Other Urban and Rural lands by taking half of the sediment load calculated from Loch Lomond Reservoir data (as discussed above) and adding in estimated erosion rates from known active landslides in the Zayante Study area. An additional amount was also added to account for unknown mass wasting sources. The value for sediment yield from mass wasting that was used in the SH&G study is 3570 tons/mi2/yr. This value was applied evenly over the Zayante Study area. In order to extrapolate this value to the rest of the San Lorenzo River Watershed, landslide data from the USGS (1998) was used to develop a weighting factor based on the percentage of each subwatershed exhibiting any form of landslide as documented in the USGS data (see Figure 17). The percentage of the SH&G study area classified as landslide is 17.7% (4448 acres landslide/25,155 acres total area). This number was used to normalize the landslide percentages within all of the subwatersheds in the San Lorenzo River Watershed. Subwatershed percentages were divided by 17.7% to create a weighting factor for applying the erosion rate associated with mass wasting from the SH&G study.
Table 0-8 Mass Wasting Weighting Factors
Subwatershed ID Subwatershed Name
Subwatershed Area (sq mi)
(A)
All Mass Wasting (sq
mi) (B)
Percent Subwatershed as Landslide
(C)=B/A Weighting Factor
(D) = C/17.7%
304.12010 Upper San Lorenzo River 11.53 3.79 32.86% 1.86
304.12011 Kings Creek 12.13 2.06 16.95% 0.96
304.12020 Boulder Creek 11.47 1.25 10.88% 0.61
304.12021 Ben Lomond 10.32 2.77 26.88% 1.52
304.12022 Middle San Lorenzo River 15.87 1.44 9.09% 0.51
304.12023 Shingle Mill Creek 0.71
304.12030 Bear Creek 16.23 1.53 9.44% 0.53
304.12031 Newell Creek 9.72 0.71 7.33% 0.41 304.12040 Zayante Creek 14.02 3.32 23.67% 1.34
304.12041 Bean Creek 10.41 1.65 15.81% 0.89
304.12042 Lompico Creek 2.77 0.84 30.50% 1.72
304.12050 Carbonera Creek 7.08 0.53 7.44% 0.42
304.12051 Branciforte Creek 9.95 1.26 12.69% 0.72
304.12052 Pasatiempo Creek 0.80 0.01 1.28% 0.07
304.12053 Santa Cruz 4.23 0.00 0.09% 0.00

San Lorenzo River Watershed Siltation TMDL September 20, 2002 ATTACHMENT B
Appendix B – Background Data for Source Analysis – Page 19
The equation for calculating the mass wasting sediment load is as follows: Sediment Loads (tons/yr) = Erosion rate (3570 tons/mi2/yr) * Subwatershed area * weighting factor Mass Wasting Sediment Yield is shown in Table 0-9 and Figure 18.
Table 0-9 Mass Wasting Sediment Yield
Subwatershed ID
Subwatershed Name
Subwatershed Area (sq mi)
A
Erosion Rate
(tons/sq mi/yr)
B
Weighting Factor
C
Delivery Ratio
D
Sediment Load (tons/yr)E = A*B*C*D
304.12010 Upper San Lorenzo River 11.53
3,570 1.86 0.42 32,085
304.12011 Kings Creek 12.13
3,570 0.96 0.42 17,419
304.12020 Boulder Creek 11.47
3,570 0.61 0.42 10,580
304.12021 Ben Lomond 10.32
3,570 1.52 0.42 23,499
304.12022 Middle San Lorenzo River 15.87
3,570 0.51 0.42 12,215
304.12023 Shingle Mill Creek 0.71
3,570 0.00 0
304.12030 Bear Creek 16.23
3,570 0.53 0.42 12,975 304.12031 Newell Creek 9.72 3,570 0.41 0.42 6,031 304.12040 Zayante Creek 14.02 3,570 1.34 0.42 28,110
304.12041 Bean Creek 10.41
3,570 0.89 0.42 13,937
304.12042 Lompico Creek 2.77
3,570 1.72 0.42 7,156
304.12050 Carbonera Creek 7.08
3,570 0.42 0.42 4,464
304.12051 Branciforte Creek 9.95
3,570 0.72 0.42 10,688
304.12052 Pasatiempo Creek 0.80
3,570 0.07 0.42 87
304.12053 Santa Cruz 4.23
3,570 0.00 0.42 31

San Lorenzo River Watershed Siltation TMDL September 20, 2002 ATTACHMENT B
Appendix B – Background Data for Source Analysis – Page 20
6. Channel/Bank Erosion Channel/Bank erosion was estimated by multiplying stream lengths in miles within the subwatersheds by an estimate of sediment production per mile. The erosion rate value used in the SH&G report is 400 tons/mi/yr. This value was developed from studies performed in the Santa Margarita Sandstone, a highly erodible sandstone found predominantly within the lower subwatersheds on the east side of the San Lorenzo River. It was felt that applying this value across the entire watershed was not appropriate since it was developed in one of the most highly erodible geologic units in the watershed. Therefore, it was decided to apply the sediment yield of 400 tons/yr to streams that transit the Santa Margarita Sandstone and Alluvial Deposits, Unconsolidated and a sediment yield of 200 tons/yr to streams that transit all other geologic units. The delivery ratio for all streams is 100%. Stream lengths were obtained by intersecting the stream layer with the geology layer and the subwatershed layer in the GIS. Stream lengths were aggregated by subwatershed and appropriate geologic unit. The stream lengths derived by this method were used in the equations below. The equation used for calculating the sediment load from stream banks is: Sediment Load (tons/year) = stream length (mi) * 400 tons/mi/yr * 1.00 (for Santa Margarita Sandstone and Alluvial Deposits, Unconsolidated Units) Sediment Load (tons/year) = stream length (mi) * 200 tons/mi/yr * 1.00 (for Other Geologic Units) Channel/Bank Erosion Sediment Rates are shown in Table 0-10 and Figure 19.

San Lorenzo River Watershed Siltation TMDL September 20, 2002 ATTACHMENT B
Appendix B – Background Data for Source Analysis – Page 21
Table 0-10 Channel/Bank Erosion Sediment Yield
SubWS ID Subwatershed
Total Stream Miles
A
Total Sediment
Yield (tons/yr)
B
Other Geology StreamMiles
C
Other Sediment
Yield (tons/yr)
D = C * 200
Alluvium StreamMiles
E
Alluvium Sediment
Yield (tons/yr)
F = E * 400
Santa Margarita Sandstone
Stream Miles
G
Santa Margarita
SandstoneSediment
Yield (tons/yr)
H = G * 400
304.12010 Upper San Lorenzo River 23.56 4,712 23.56 4,712
304.12011 Kings Creek 25.86 5,172 25.86 5,172 304.12020 Boulder Creek 26.46 5,312 26.36 5,272 0.1 40 304.12021 Ben Lomond 22.18 4,964 19.54 3,908 2.59 1,036 0.05 20
304.12022 Middle San Lorenzo River 33.35 8,190 25.75 5,150 7.29 2,916 0.31 124
304.12023 Shingle Mill Creek 1.54 358 1.29 258 0.25 100
304.12030 Bear Creek 32.11 6,422 32.11 6,422 304.12031 Newell Creek 17.89 3,752 17.02 3,404 0.14 56 0.73 292304.12040 Zayante Creek 24.94 5,254 23.61 4,722 1.33 532304.12041 Bean Creek 20.63 6,134 10.59 2,118 5.62 2,248 4.42 1,768304.12042 Lompico Creek 6.18 1,236 6.18 1,236
304.12050 Carbonera Creek 13.47 3,728 8.3 1,660 4.29 1,716 0.88 352
304.12051 Branciforte Creek 19.27 5,088 13.1 2,620 3.99 1,596 2.18 872
304.12052 Pasatiempo Creek
304.12053 Santa Cruz 7.87 2,638 2.55 510 4.46 1,784 0.86 344 Total 275.31 62,960 235.82 47,164 28.73 11,492 10.76 4,304
Synthetic Suspended Sediment Yield (adapted from SH&G, 2001, App. B) The longest record of sediment discharge and stream flow in the San Lorenzo River Watershed was measured by the U.S. Geological Survey at Big Trees gauging station at Henry Cowell State Park in Felton (Drainage Area = 106 square miles). To extend the sediment yield record beyond the limited years measured, an annual sediment yield rating curve was generated by plotting measured annual suspended sediment yield against annual stream flow volume. This rating curve was then used to extrapolate sediment yields over the longer stream flow record (1939-1998) yielding an average rate of 2,320-tons/sq mi/yr. The long-term average sediment yield for the Big Trees gage using the synthetic record is 2,320-tons/sq mi/yr with a range between 16,400-tons/sq mi/yr and 40-tons/sq mi/yr.

San Lorenzo River Watershed Siltation TMDL September 20, 2002 ATTACHMENT B
Appendix B – Background Data for Source Analysis – Page 22
Bedload was measured at Big Trees gage at various times, however the flow was relatively low when measurements were taken. In general, bedload at the stream gage location probably results in total sediment yields 4-10 percent higher than the suspended loads. In the upper watershed, bedload transport rates would be expected to be higher. The average sediment yield for both the San Lorenzo River at Big Trees provides essential information for this study. Sediment yield data for individual years describes the variability in erosion rates from year to year and reflects the climatic variability typical of streams in Mediterranean climates. Conversely, a long-term sediment yield estimate ignores year-to-year variability and provides a context for determining average erosion conditions in the watershed. In terms of constructing a sediment budget, the long-term sediment yield estimate from gauged locations in the watershed provides a back check to determine if all sediment sources in the watershed are being considered along with the appropriate magnitudes. This study uses the synthetic suspended sediment yield estimates to compare with independent sediment yield estimates derived from the application of erosion rates, delivery ratios and source category area and linear measurements derived from the GIS database. In other words, the sediment yields measured at stream gages should approximate sediment inflow from natural and accelerated erosion sources as defined by the sediment source categories

San Lorenzo River Watershed Siltation TMDL September 20, 2002 ATTACHMENT B
Appendix C: Primary References – Page 23
Appendix C: Primary References Alley, D.W & Associates (1998), Comparison of Juvenile Steelhead Densities in 1981 and 1994-97 in the San Lorenzo River and Tributaries, Santa Cruz County, California; With an Estimate of Juvenile Population Size in the Mainstream River and Expected Adult Returns, for the City of Santa Cruz Water Department and San Lorenzo Valley Water District, January, 1998. Anderson, Patricia and Jennifer Nelson (Department of Fish and Game, 1996), contained in Streams south of San Francisco Bay Coho Salmon Reference Materials for Registered Foresters, Volume 1 Cafferata, Peter H. and Poole, Chris, Watershed Assessment for the East Branch of Soquel Creek. California Department of Forestry and Fire Protection, Sacramento, California December 1993. Central Coast Regional Water Quality Control Board (1994), Water Quality Control Plan for the Central Coastal Basin (Basin Plan), September, 1994. County of Santa Cruz Environmental Health Services and Planning Department. 2001, Draft San Lorenzo River Watershed Management Plan Update. December. Hecht, Barry, Kittleson, Gary (1998), An Assessment of Streambed Conditions and Erosion Control Efforts in the San Lorenzo River Watershed, Santa Cruz County, California, Balance Hydraulics: July 1998. Jagger, Paul et al. (1993), Final Report: Literature Review of Non-Point Source Impacts in the San Lorenzo River Watershed, California Regional Water Quality Control Board – Central Coast Region, November, 1993. Kondolf, G. Mathias, 2000, “Assessing Salmonid Spawning Gravel Quality”, Transactions of the American Fisheries Society, 129:pgs. 262-281, 2000. Lisle, T.E., 1993 The fraction of pool volume filled with fine sediment in northern California: relation to basin geology and sediment yield. Fianl Report to the California Department of Forestry and Fire Protection. Nelson, Jennifer, (2001), Personal Communication concerning San Lorenzo River Lagoon. Philip Williams & Associates, et al (1989), San Lorenzo River Enhancement Plan: A Plan for Biological Enhancement on the Lower San Lorenzo River, City of Santa Cruz, 1989. Phillips, Robert W., Lantz, R.L., Claire, E.W., and Moring, J.R. (1975), “Some Effects of Gravel Mixtures on Emergence of Coho Salmon and Steelhead Trout Fry”, Transactions of the American Fisheries Society, No. 3, 1975 Santa Cruz County Planning Department, State of California Resources Agency (SCCPD, 1979), The San Lorenzo River Watershed Management Plan. December, 1979.

San Lorenzo River Watershed Siltation TMDL September 20, 2002 ATTACHMENT B
Appendix C: Primary References – Page 24
SH&G (Swanson Hydrology & Geomorphology) (2001), Zayante Area Sediment Source Study, Swanson Hydrology and Geomorphology, January, 2001. Shapovalov, L. and A.C. Taft (1954), The Life Histories of the Steelhead Rainbow Trout and Silver Salmon. California Department of Fish and Game, Fish Bulletin 98. State of California Department of Fish and Game (DFG, 1996), Steelhead Restoration and Management Plan for California, February, 1996. State of California Water Resources Control Board (SWRCB, 1982), Draft Staff Report for Fact-Finding Hearing for Zayante Creek/Lower San Lorenzo River and the Upper San Lorenzo River Instream Beneficial Use Program. September 28, 1982. USEPA, 1993, Guidance Specifying Management Measures for Sources of Nonpoint Pollution in Coastal Waters, 840-B-92-002, January 1993. USEPA, 1998, Garcia River Sediment Total Maximum Daily Load USEPA-2, 1998, Redwood Creek Sediment Total Maximum Daily Load USEPA, 1999, Protocol for Developing Sediment TMDLs, First Edition. Environmental Protection Agency document number 841-B-99-004; Office of Water, Washington, DC, October 1999. US Geological Survey, 1998, Roberts, Sebastian and Andrew D. Barron, Digital Compilation of “Preliminary Map of Landslide Deposits in Santa Cruz County, California, by Cooper-Clark and Associates, 1975”: A Digital Map Database; Open-File Report 98-792, U.S. Geological Survey, Menlo Park, CA 1998

San Lorenzo River Watershed Siltation TMDL September 20, 2002 ATTACHMENT B
Appendix D: Secondary Referances– Page 25
Appendix D: Secondary References AMBAG (1978), Water Quality Management Plan for the Monterey Region. Aston, Robert (1979), Water Quality Technical Section, San Lorenzo River Watershed Management Plan. County of Santa Cruz Community Resources Agency, October 1979. Coats, Robert et al. (1982), Landsliding, Channel Change, and Sedimentation Transport in Zayante Creek and the Lower San Lorenzo River, 1982 Water Year and Implications for Management of the Stream Resource. The Center for Natural Resource Studies, 1982. Copeland, Robert R. (1986), San Lorenzo River Sedimentation Study, Numerical Model Investigation, Final Report. U.S. Army Corps of Engineers, Technical Report HL 86-10, December, 1986. Foxx, Mark (1984), Slope Failure in the Felton Quadrangle, 1981-83. Thesis, University of Santa Cruz, June, 1984. Hee, Richard J. (1962), Report on Survey of the San Lorenzo River, Santa Cruz County. State of California Department of Public Health, Bureau of Sanitary Engineering, July, 1962. Jones, B.L., Hawley, N.L., and Crippen, J.R., 1972, Sediment transport in the western tributaries of the Sacramento River, California: U.S. Geological Survey Water-Supply Paper 1798-J, 27 p. Knott, J.M., Pederson, G.L. and Middlebury, R.F., 1978, Interim report on streamflow, sediment discharge, and water quality in the Calabazas Creek Basin, Santa Clara County, California: U.S. Geological Survey Water Resources Investigation 78-2. Langenheim, J.L., Greenlee, J., Benson, A., and Ritter, P., 1983, Vegetation, fire history, and fire potential of Big Basin Redwoods State Park, California; Final report to the California Department of Parks and Recreation, Contract 60-20-019. 108 p. Leonard, William R. (1972), Water Quality Conditions of the San Lorenzo River. California Regional Water Quality Control Board, Central Coast Region, June 1972. Lindsey, W.C., and Butler, C.S., 1968, Report and General Soil Map, Santa Cruz County: USDA Soil Conservation Service, 43 p.+ maps and appendices. Ricker, John (1976), Preliminary Report on the San Lorenzo River Watershed Planning Process, Santa Cruz County Office of Watershed Management. August, 1976. Ricker, J. and T. Butler (1979), Fishery Habitat and the Aquatic Ecosystem, Technical Section. San Lorenzo River Water Management Plan, County of Santa Cruz Community Resources Agency

San Lorenzo River Watershed Siltation TMDL September 20, 2002 ATTACHMENT B
Appendix D: Secondary Referances– Page 26
Watershed Management Section and California Department of Fish and Game Protected Waterways Program. November, 1979. Smith, Darrell J. (1958), Sedimentation Studies--Zayante and Bean Creeks, Tributaries of the San Lorenzo River, Santa Cruz County, Project Number 58-3-4. State of California Department of Water Resources, September, 1958. Soil Conservation Service (1990), County Resources Inventory, Water Bodies Impaired by Non-point Sources. State of California Department of Public Health, Bureau of Sanitary Engineering (Department of Public Health, 1950-1951), A Report on Present and Proposed Waste Discharges in the San Lorenzo Valley and Their Effect upon Beneficial Uses of the San Lorenzo River. Thomas, J.H., 1961, Flora of the Santa Cruz Mountains of California, Stanford University Press, 434p. U.S. Army Corps of Engineers (1989), San Lorenzo River Investigation

San Lorenzo River Watershed Siltation TMDL September 20, 2002 ATTACHMENT B
Appendix E: Color Figures– Page 27
Appendix E: Color Figures
Figure 3 Listed Waterbodies

San Lorenzo River Watershed Siltation TMDL September 20, 2002 ATTACHMENT B
Appendix E: Color Figures– Page 28
Figure 4 San Lorenzo River Subwatersheds

San Lorenzo River Watershed Siltation TMDL September 20, 2002 ATTACHMENT B
Appendix E: Color Figures– Page 29
Figure 5 Municipal Water Supplies

San Lorenzo River Watershed Siltation TMDL September 20, 2002 ATTACHMENT B
Appendix E: Color Figures– Page 30
Figure 6 Monitoring Sites

San Lorenzo River Watershed Siltation TMDL September 20, 2002 ATTACHMENT B
Appendix E: Color Figures– Page 31
Figure 7 San Lorenzo River Watershed Geology

San Lorenzo River Watershed Siltation TMDL September 20, 2002 ATTACHMENT B
Appendix E: Color Figures– Page 32
Figure 8 San Lorenzo River Watershed - Average Precipitation

San Lorenzo River Watershed Siltation TMDL September 20, 2002 ATTACHMENT B
Appendix E: Color Figures– Page 33
Figure 9 Sediment Yield (tons/yr) by Subwatershed

San Lorenzo River Watershed Siltation TMDL September 20, 2002 ATTACHMENT B
Appendix E: Color Figures– Page 34
Figure 10 THP Upland Roads Estimated Sediment Yield

San Lorenzo River Watershed Siltation TMDL September 20, 2002 ATTACHMENT B
Appendix E: Color Figures– Page 35
Figure 11 THP Streamside Roads on Steep Slopes Estimated Sediment Yield

San Lorenzo River Watershed Siltation TMDL September 20, 2002 ATTACHMENT B
Appendix E: Color Figures– Page 36
Figure 12 Roads by Subwatershed

San Lorenzo River Watershed Siltation TMDL September 20, 2002 ATTACHMENT B
Appendix E: Color Figures– Page 37
Figure 13 Public/Private Upland Roads Estimated Sediment Yield

San Lorenzo River Watershed Siltation TMDL September 20, 2002 ATTACHMENT B
Appendix E: Color Figures– Page 38
Figure 14 Public/Private Streamside Roads on Steep Slopes

San Lorenzo River Watershed Siltation TMDL September 20, 2002 ATTACHMENT B
Appendix E: Color Figures– Page 39
Figure 15 Timber Harvesting Plan Lands Estimated Sediment Yield

San Lorenzo River Watershed Siltation TMDL September 20, 2002 ATTACHMENT B
Appendix E: Color Figures– Page 40
Figure 16 Other Urban/Rural Lands Estimated Sediment Yield

San Lorenzo River Watershed Siltation TMDL September 20, 2002 ATTACHMENT B
Appendix E: Color Figures– Page 41
Figure 17 Landslides

San Lorenzo River Watershed Siltation TMDL September 20, 2002 ATTACHMENT B
Appendix E: Color Figures– Page 42
Figure 18 Mass Wasting Estimated Sediment Yield

San Lorenzo River Watershed Siltation TMDL September 20, 2002 ATTACHMENT B
Appendix E: Color Figures– Page 43
Figure 19 Stream Channel/Bank Estimated Sediment Yield

San Lorenzo River Watershed Siltation TMDL September 20, 2002 ATTACHMENT B
Appendix F: Excerpts from Forest Practices Act– Page 44
Appendix F: Excerpts from Forest Practices Act
Interim Forest Practice Rules for Protection and Restoration in Watersheds with Threatened or Impaired Values (§916.9 of 2001 Forest Practice Rules) In addition to all other district Forest Practice Rules, the following requirements shall apply in any planning watershed6with threatened or impaired values: (a) GOAL - Every timber operation shall be planned and conducted to prevent deleterious interference with the watershed conditions that primarily limit the values set forth in 14 CCR 916.2 [936.2, 956.2](a) (e.g., sediment load increase where sediment is a primary limiting factor; thermal load increase where water temperature is a primary limiting factor; loss of instream large woody debris or recruitment potential where lack of this value is a primary limiting factor; substantial increase in peak flows or large flood frequency where peak flows or large flood frequency are primary limiting factors). To achieve this goal, every timber operation shall be planned and conducted to meet the following objectives where they affect a primary limiting factor:
(1) Comply with the terms of a Total Maximum Daily Load (TMDL) that has been adopted to address factors that may be affected by timber operations if a TMDL has been adopted, or not result in any measurable sediment load increase to a watercourse system or lake…
. ...(h) For Class I waters, any plan involving timber operations within the WLPZ shall contain the
following information:… ….(2) A description of all existing permanent crossings of Class I waters by logging roads and
clear specification regarding how these crossings are to be modified, used, and treated to minimize risks, giving special attention to allowing fish to pass both upstream and downstream during all life stages. (3) Clear and enforceable specifications for construction and operation of any new crossing of Class I waters to prevent direct harm, habitat degradation, water velocity increase, hindrance of fish passage, or other potential impairment of beneficial uses of water...
...(j) Where an inner gorge extends beyond a Class I WLPZ and slopes are greater than 55%, a
special management zone shall be established where the use of evenaged regeneration methods is prohibited. This zone shall extend upslope to the first major break-in-slope to less than 55% for a distance of 100 feet or more, or 300 feet as measured from the watercourse or lake transition line, which ever is less. All operations on slopes exceeding 65% within an inner gorge shall be reviewed by a Certified Engineering Geologist prior to plan approval, regardless of whether they are proposed within a WLPZ or outside of a WLPZ…
6 Planning Watershed means the contiguous land base and associated watershed system that forms a fourth order or other watershed typically 10,000 acres or less in size. Planning watersheds are used in planning forest management and assessing impacts. The Director has prepared and distributed maps identifying planning watersheds plan submitters must use. Where a watershed exceeds 10,000 acres, the Director may approve subdividing it. Plan submitters may propose and use different planning watersheds, with the Director’s approval. Examples include but are not limited to the following: when 10,000 acres or less is not a logical planning unit, such as on the Eastside Sierra Pine type, as long as the size in excess of 10,000 acres is the smallest that is practical. Third order basins flowing directly into the ocean shall also be considered an appropriate planning watershed.

San Lorenzo River Watershed Siltation TMDL September 20, 2002 ATTACHMENT B
Appendix F: Excerpts from Forest Practices Act – Page 45
…(l) Construction or reconstruction of logging roads, tractor roads, or landings shall not take place during the winter period unless the approved plan incorporates a complete winter period operating plan pursuant to 14 CCR 914.7(a) [934.7(a), 954.7(a)] that specifically addresses such road construction. Use of logging roads, tractor roads, or landings shall not take place at any location where saturated soil conditions exist, where a stable logging road or landing operating surface does not exist, or when visibly turbid water from the road, landing, or skid trail surface or inside ditch may reach a watercourse or lake. Grading to obtain a drier running surface more than one time before reincorporation of any resulting berms back into the road surface is prohibited. (m) All tractor roads shall have drainage and/or drainage collection and storage facilities installed as soon as practical following yarding and prior to either (1) the start of any rain which causes overland flow across or along the disturbed surface within a WLPZ or within any ELZ or EEZ designated for watercourse or lake protection, or (2) any day with a National Weather Service forecast of a chance of rain of 30 percent or more, a flash flood warning, or a flash flood watch. (n) Within the WLPZ, and within any ELZ or EEZ designated for watercourse or lake protection, treatments to stabilize soils, minimize soil erosion, and prevent the discharge of sediment into waters in amounts deleterious to aquatic species or the quality and beneficial uses of water, or that threaten to violate applicable water quality requirements, shall be applied in accordance with the following standards:
(1) The following requirements shall apply to all such treatments. (A) They shall be described in the plan. (B) For areas disturbed from May 1 through October 15, treatment shall be completed
prior to the start of any rain that causes overland flow across or along the disturbed surface.
(C) For areas disturbed from October 16 through April 30, treatment shall be completed prior to any day for which a chance of rain of 30 percent or greater is forecast by the National Weather Service or within 10 days, whichever is earlier.
(2) The traveled surface of logging roads shall be treated to prevent waterborne transport of sediment and concentration of runoff that results from timber operations.
(3) The treatment for other disturbed areas, including: (A) areas exceeding 100 contiguous square feet where timber operations have exposed bare soil, (B) approaches to tractor road watercourse crossings between the drainage facilities closest to the crossing, (C) road cut banks and fills, and (D) any other area of disturbed soil that threatens to discharge sediment into waters in amounts deleterious to the quality and beneficial uses of water, may include, but need not be limited to, mulching, rip-rapping, grass seeding, or chemical soil stabilizers. Where straw, mulch, or slash is used, the minimum coverage shall be 90%, and any treated area that has been subject to reuse or has less than 90% surface cover shall be treated again prior to the end of timber operations. The RPF may propose alternative treatments that will achieve the same level of erosion control and sediment discharge prevention.
(4) Where the undisturbed natural ground cover cannot effectively protect beneficial uses of water from timber operations, the ground shall be treated by measures including, but not limited to, seeding, mulching, or replanting, in order to retain and improve its natural ability to filter sediment, minimize soil erosion, and stabilize banks of watercourses and lakes.
(o) As part of the plan, the RPF shall identify active erosion sites in the logging area, assess them to determine which sites pose significant risks to the beneficial uses of water, assess them to

San Lorenzo River Watershed Siltation TMDL September 20, 2002 ATTACHMENT B
Appendix F: Excerpts from Forest Practices Act – Page 46
determine whether feasible remedies exist, and address in the plan feasible remediation for all sites that pose significant risk to the beneficial uses of water. (p) The erosion control maintenance period on permanent and seasonal roads and associated landings that are not abandoned in accordance with 14 CCR 923.8 shall be three years…
…(s) No timber operations are allowed in a WLPZ, or within any ELZ or EEZ designated for watercourse or lake protection, under emergency notices or exemption notices except for hauling on existing roads, road maintenance, and operations conducted for public safety….

San Lorenzo River Watershed Siltation TMDL September 20, 2002 ATTACHMENT B
Appendix G: County Erosion Control– Page 47
Appendix G: County Erosion Control Recommendations The County of Santa Cruz recommendations presented below appear in the 2001 Draft Watershed Management Plan (pp.60-61) and integrate recommendations from: 1) An Assessment of Streambed Conditions and Erosion Control Efforts in the San Lorenzo River Watershed, Santa Cruz County, California (Balance Hydrologics, 1998), 2) Zayante Area Sediment Source Study (Swanson Hydrology and Geomorphology, 2001), and 3) Planning, Public Works and Environmental Health staff comments. For a more detailed description of the recommendations, see the referenced technical studies. Trackable Implementation Actions adopted from the County recommendations are described in the TMDL under Proposed Implementation Actions. Table 1 includes information on timing and funding for implementing these recommendations. 1. Develop Comprehensive Erosion Control Program (County of Santa Cruz – lead, City of Scotts Valley, City of Santa Cruz, State Parks, Resource Conservation District (RCD), Natural Resources Conservation Service(NRCS), Regional Water Quality Control Board (RWQCB), Caltrans, California Department of Fish and Game (CDFG)) a. Complete efforts to establish an ongoing program within the County government to inventory problems, coordinate implementation with other agencies and track effectiveness of erosion control efforts. (County, ongoing) b. Coordinate erosion control efforts among agencies, including County of Santa Cruz, City of Santa Cruz, City of Scotts Valley, State Parks, Caltrans, San Lorenzo Valley Water District, and Resource Conservation District. (Coordination has begun through preparation of this Watershed Plan update). c. Develop a program for permit coordination among agencies to facilitate permitting for erosion control and habitat restoration projects. (RCD, SCCPD, CDFG, NMFS). 2. Reduce Erosion from Public Roads (County of Santa Cruz, California Dept of Transportation, State Parks, City of Scotts Valley, Department of Fish and Game) a. Create county road database to identify culverts, and to prioritize maintenance and improvement projects. Complete road assessments on inner gorge roads and in sandy soils areas first, then complete rest of rest of watershed, especially areas of high erosion hazard. (County of Santa Cruz, Summer 2001, CDFG grant) b. Develop a Road Maintenance Best Management Practices (BMP) Program 1) Develop BMP manual (County of Santa Cruz Public Works, ongoing, CDFG grant) 2) Train County of Santa Cruz Public Works staff in erosion control practices (County of Santa Cruz Public Works, ongoing, CDFG grants) 3) Develop regular training for staff (County of Santa Cruz Public Works) c. Improve maintenance and preventative actions to reduce erosion 1) Increase staffing during storms to address culvert maintenance and drainage problems before damage occurs (County of Santa Cruz Public Works, no funding for staff increase)

San Lorenzo River Watershed Siltation TMDL September 20, 2002 ATTACHMENT B
Appendix G: County Erosion Control – Page 48
2) Evaluate policy regarding placement of driveways and associated drainage fees. Consider increase in drainage fees to mitigate impacts of new private driveways on public roads. (County of Santa Cruz Planning and Public Works) 3) Develop a policy to remove leaning trees near roads to reduce slipouts and road repairs. (County of Santa Cruz Planning and Public Works). 4) Continue practice of no side-casting and berm construction along County roads. (County of Santa Cruz Public Works) 5) Improve road drainage to minimize landslides (County of Santa Cruz Public Works) 6) Plan for major erosional events, such as fires, major storms, and landslides. (County of Santa Cruz Planning and Public Works) d. Improve spoils management and disposal 1) Develop spoils disposal site(s) in or near the San Lorenzo Watershed. (County of Santa Cruz Public Works – lead, Caltrans). This site should be open to the public for a fee. Site could be purchased property or contracts to dispose of spoils on private property. 2) Continue improvements in handling winter slide material, including identification of winter stockpiling sites, and end-hauling. Develop erosion control practice BMPs for stockpiling sites. (County of Santa Cruz Public Works – lead; Caltrans) 3) Eliminate illegal dumping of slide material from private property at road pull-outs. (County of Santa Cruz Public Works; Caltrans) e. Assess State Park roads and trails for erosion into streams and rivers. Develop a program for funding and addressing any identified problems f. Assess and address erosion at prior repair sites. g. Augment emergency road repair funds to install betterments during damage repairs in order to prevent future failure and sediment production. Work to modify FEMA policy regarding betterments and/or ensure local funding for adequate improvements. (County, NMFS, Legislators, FEMA, OES) 3. Develop and Implement a Private Roads Sediment Reduction Program (Resource Conservation District-lead, Natural Resources Conservation Service, County, Regional Water Quality Control Board, California Department of Fish and Game. Grant submitted by RCD in 2001 for Prop 13 funding). a. Develop and implement private road education program 1) Revise and distribute Booklet, Maintaining Your Private Road (RCD) 2) Continue/support Rural Roads workshops, sponsored by RCD b. Develop private road database, treatment priorities and strategies c. Provide cost-sharing for private road improvement, including emergency repairs (County, RCD, funding agencies) d. Increase enforcement of erosion control regulations for private roads where property owners do not address problems under the programs listed above (County, RWQCB, CDFG) e. Encourage formation of road associations or county service areas to fund upgrades and effective maintenance. (County, RCD) 4. Improve Timber Harvest and Appurtenant Roads (California Department of Forestry and Fire Protection-lead, Resource Conservation District (through private roads program), County of Santa Cruz, California Department of Fish and

San Lorenzo River Watershed Siltation TMDL September 20, 2002 ATTACHMENT B
Appendix G: County Erosion Control – Page 49
Game, Regional Water Quality Control Board, National Marine Fisheries Service. No current funding. Timber Harvest Rules may be modified due to listing of Steelhead and Coho salmon.). a. Document and improve THP access roads b. Upgrade timber roads with special attention to drainage and potential for mass wasting c. Surface year-round access roads and maintain unsurfaced roads and skid trails d. Increase road abandonment (fills, culverts and stream crossings pulled) between harvests e. Upgrade stream crossings to reduce failures and provide for fish passage (CDFFP, NMFS) f. Identify and address problems associated with legacy (pre-1970) roads, including relocation and closure. g. Require review by an Engineering Geologist for grading on inner gorge slopes. h. Require mitigation for timber roads along stream corridors; limit new roads and trails in stream corridors. i. Create more stringent guidelines for “existing roads” for post-harvest development. (County of Santa Cruz) j. Provide for ongoing maintenance and/or enforce county erosion control ordinance following the current 3-year THP maintenance period. (CDFFP, County of Santa Cruz) 5. Reduce erosion from private and public lands a. Reduce erosion from point sources, including Mount Hermon slide, Bean Creek Road slides, McEnery Road, Skypark, Rancho Rio and Monte Fiore. (County of Santa Cruz, City of Scotts Valley, and other agencies) b. Promote retrofits for retention and detention to reduce excessive drainage and mass wasting. c. Improve technical support and community education provided by federal, state and local agencies. (Natural Resources Conservation Service, Resource Conservation District, California Dept of Fish and Game, County of Santa Cruz, City of Scotts Valley). d. Develop awards program to showcase successful efforts in minimizing erosion and bed sedimentation. (County of Santa Cruz and City of Scotts Valley). e. Provide additional field staff to strengthen programs to identify and promote correction of erosion problems through assessment, education, outreach, and incentives. (SCCRCD, SCCPD, Water Agencies). e. Continue to provide training to code compliance staff on erosion control issues and increase staffing level. (County of Santa Cruz Planning Dept.). 6. Implement programs to address erosion problems unique to sandy soils. (County of Santa Cruz-lead City of Scotts Valley, Resource Conservation District, Natural Resources Conservation Service.) a. Seek funding for a 3-year program to develop, demonstrate, and disseminate information about sandy-soil erosion control to permitting staff and the public. b. Revise the County’s Erosion Control Ordinance to include more specific regulations and guidelines for sandy-soils areas. These revisions will benefit other sandy-soil areas throughout the County, including portions of Bonny Doon, Soquel watershed, and Aptos/La Selva Beach/Corralitos areas. c. Evaluate need to revise erosion control provisions in City of Scotts Valley Grading Regulations to better protect sandy-soil areas.

San Lorenzo River Watershed Siltation TMDL September 20, 2002 ATTACHMENT B
Appendix G: County Erosion Control – Page 50
7. Protect and Improve Stream Channel Function Implement education programs and modify policies and procedures to improve riparian corridor protection, maintain channel integrity, implement alternatives to hard bank protection, and retain large woody material in streams. Encourage natural recruitment and retention of large woody material that supports pool development and sediment transport. (County of Santa Cruz – lead, California Dept of Fish and Game, Resource Conservation District, Natural Resources Conservation Service. CDFG has funded SB271 grant to County of Santa Cruz to sponsor workshop for public and private engineers for Fall 2001). 8. Evaluate Erosion Control Efforts Monitor bed sedimentation, channel conditions, and stream geomorphology every 1-3 years to evaluate if erosion control efforts are resulting in improved stream habitat conditions. (County of Santa Cruz, baseline monitoring will be completed in 2001).
Table 1. Sediment Reduction Recommendations Contained in the San Lorenzo River Watershed Management Plan (County of Santa Cruz Environmental Health Services and Planning Department, 2001, p. 72)
Related Documents