San Diego County Community Profiles Behavioral Health Profile by Region and Subregional Area (SRA) REGIONS: Central East North Central North Coastal North Inland South Published August 2013 County of San Diego, Health & Human Services Agency, Public Health Services, Community Health Statisitcs Unit Page 1

Welcome message from author
This document is posted to help you gain knowledge. Please leave a comment to let me know what you think about it! Share it to your friends and learn new things together.
Transcript

San Diego County
Community Profiles
Behavioral Health Profile by Region and Subregional Area (SRA)
REGIONS: Central East
North Central North Coastal North Inland
South
Published August 2013
County of San Diego, Health & Human Services Agency, Public Health Services, Community Health Statisitcs Unit Page 1

This page is intentionally left blank.
County of San Diego, Health & Human Services Agency, Public Health Services, Community Health Statisitcs Unit Page 2

Acknowledgements
We acknowledge the contributions of the following individuals for their work in the preparation of this document:
Sanaa Abedin, MPH, Epidemiology & Immunization Services Branch Brit Colanter, MPH, Epidemiology & Immunization Services Branch Isabel Corcos, PhD, MPH, Emergency Medical Services Branch Kim De Vera, Community Health Statistics Lorri Freitas, MPH, Epidemiology & Immunization Services Branch Lacey Hicks, MPH, Epidemiology & Immunization Services Branch Sutida (Nid) Jariangprasert, MPH, Maternal, Child and Family Health Services Jeff Johnson, MPH, Epidemiology & Immunization Services Branch Marjorie Lee, MPH, Sexually Transmitted Diseases and Hepatitis Prevention Program Marisa Moore, MD, MPH, Tuberculosis Control Jennifer Nelson, MPH, Epidemiology & Immunization Services Branch Tyler Packett, Emergency Medical Services Leslie Ray, MPH, MPPA, MA, Community Health Statistics, Emergency Medical Services Alicia Sampson, MPH, CPH, Community Health Statistics Joshua Smith, PhD, MPH, Emergency Medical Services Ryan Smith, MPH(c), Community Health Statistics Barbara Stepanski, MPH, Emergency Medical Services Samantha Tweeten, PhD, MPH, Epidemiology & Immunization Services Branch Jessica Yen, MPH, Epidemiology & Immunization Services Branch
Thank you to the following individuals for their leadership and support in making this project possible: Nick Macchione, MS, MPH, FACHE, Director, Health and Human Services Agency Wilma J. Wooten, MD, MPH, Public Health Officer Eric McDonald, MD, MPH, Deputy Public Health Officer Marcy Metz, RN, CEN, Chief of Emergency Medical Services
County of San Diego, Health & Human Services Agency, Public Health Services, Community Health Statisitcs Unit Page 3

Table of Contents
Table of Contents – San Diego County Behavioral Health Profile
Click on a topic to jump to that section in the Profile Introduction ....................................................................................... p 5 San Diego County Behavioral Health Profile ........................................ p 8 Geographic Maps
Geographic Boundary Map Hospital Resource Map
Behavioral Health Data Alcohol‐related Disorders Acute Alcohol‐related Disorder Chronic Alcohol‐related Disorder Alzheimer’s Disease Anxiety Disorder
Attention‐Deficit, Conduct and Disruptive Behavior‐related Dementia Developmental Disorder
Disorders Usually Diagnosed in Childhood Impulse Control Disorder
Mood Disorders Overdose/Poisoning Personality Disorder
Schizophrenia and Other Psychotic Disorders Self‐Inflicted Injury Substance‐related Disorders Acute Substance‐related Disorder Chronic Substance‐related Disorder Suicide
Data Guide ......................................................................................... p 138 Important Information for Data Users – including explanation of Regional Boundaries
Data Sources Glossary of Health Terms

INTRODUCTION
County of San Diego, Health & Human Services Agency, Public Health Services, Community Health Statisitcs Unit Page 5
Introduction
Introduction
Community Health Statistics The Community Health Statistics unit was created to provide a means of sharing information about the health behaviors, diseases, injuries, and demographic characteristics of specific populations in San Diego County. This unit aims to supply health professionals with community level data describing the health trends and needs of the residents of our County. Community Health Statistics also provides or refers persons to available local, state, and national statistics.
Purpose This profile is a compilation of information made available to the public health community and public policy‐makers to better understand and manage the health and well‐being of the residents of our County. The purpose of this profile is to provide detailed information about the health and characteristics of the people living in San Diego County. It is designed to help the Health and Human Services Agency staff in each of the Health and Human Services Regions (Regions) identify problems and priority needs within their communities.
Regional Data Please see Important Information in the data guide section for explanation of geographic boundaries as well as information on methods used here, age adjusted rates, and notes on comparing data.
Navigating the Document This PDF document is intended for electronic viewing, online or downloaded to your computer; this allows full navigation ability to jump through the document. This document is updated periodically throughout the year. Using the online version will preserve the links and full navigation ability as well as ensure the most recent version of the document is being used. Use links to jump to a section or page from a list
The Table of Contents (page 4) has many links to quickly jump to the specific section of interest. Within the document, some title pages have lists that are linked to quickly jump to a topic within a section. These links are not underlined, but can be identified when the hand icon ( ) turns into a pointing hand ( ) when hovering over an item.
County of San Diego, Health & Human Services Agency, Public Health Services, Community Health Statisitcs Unit Page 6

Introduction
There are also links outside the document for more information on a subject. These are underlined and require internet access. They may be identified by the pointing hand with a “w” for web access. Use the navigation bar at the bottom of the window to move through a document:
A‐ go to 1st page B‐ go back one page C‐ enter a page number to go to D‐ go forward one page E‐ go to last page
Use bookmarks to jump to a section This is a built‐in table of contents that is viewed to the side of the document and can be left open while viewing the document. To access this, click on the bookmarks tab on the left side of window. Use the (+) or (‐) symbols to expand or collapse the list. Click on a bookmark to jump to that page.
For more information, contact: Alicia Sampson, Epidemiologist
Leslie Upledger Ray, Senior Epidemiologist County of San Diego, Community Health Statistics at Emergency Medical Services
6255 Mission Gorge Road, San Diego, CA 92120 (619) 285‐6429 (office)
[email protected] [email protected]
County of San Diego, Health & Human Services Agency, Public Health Services, Community Health Statisitcs Unit Page 7

SAN DIEGO COUNTY BEHAVIORAL HEALTH
PROFILE
County of San Diego, Health & Human Services Agency, Public Health Services, Community Health Statisitcs Unit Page 8

RIVERSIDEORANGE
IMPERIAL
BAJACALIFORNIA
CentralSan Diego
Peninsula
CoronadoNational
City
SoutheasternSan Diego
Mid-City
KearnyMesa
CoastalUniversity
DelMar-Mira
Mesa
NorthSan Diego Poway
Miramar
Elliott-Navajo
SweetwaterChulaVista
SouthBay
Jamul
SpringValleyLemon
Grove
La MesaEl Cajon
Santee
Lakeside
HarbisonCrest Alpine
RamonaSanDieguito
Carlsbad
Oceanside
Pendleton
Escondido
SanMarcos
Vista
ValleyCenter
PaumaFallbrook
Palomar-Julian
Laguna-PineValley
MountainEmpire
Anza-BorregoSprings
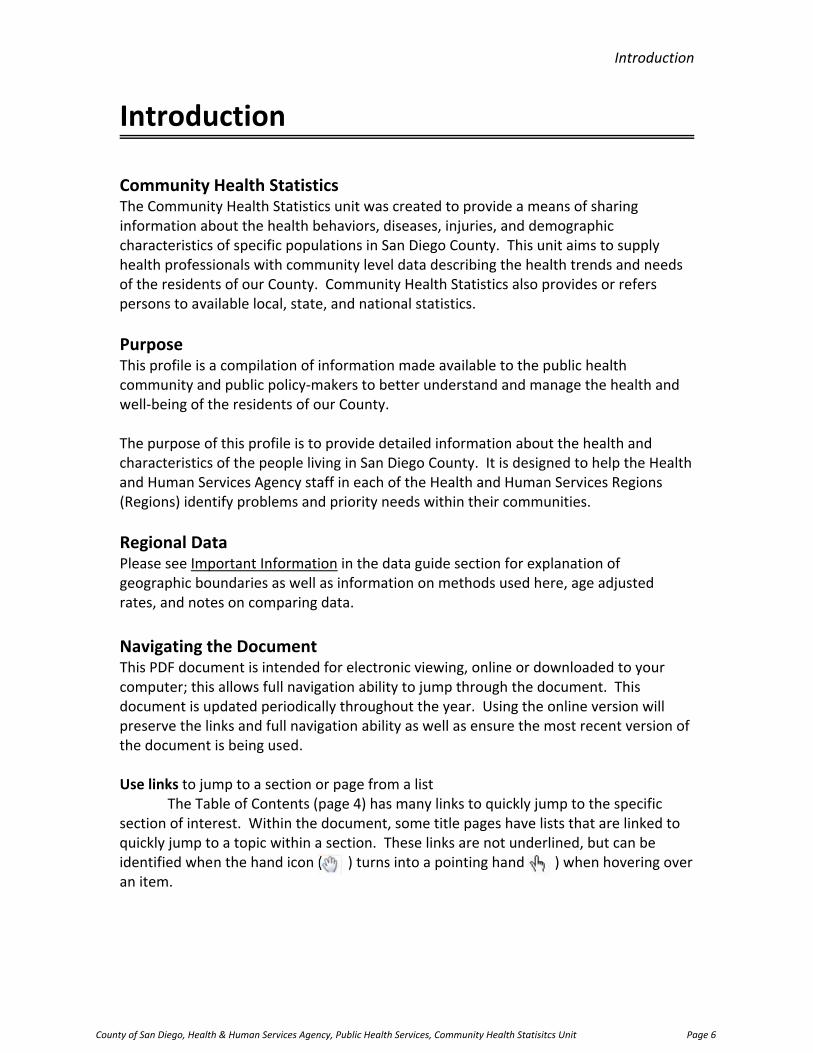
SRA BoundaryRegion
CentralEastNorth CentralNorth CoastalNorth InlandSouth
± 0 10 205Miles
Map Date: 2013Maps/Analysis by County of San Diego, EMSContact Isabel Corcos, Leslie Ray 619.285.6429
Regional and Subregional (SRA)Boundaries in San Diego County
County of San Diego, Health & Human Services Agency, Public Health Services, Community Health Statisitcs Unit Page 9

®v
®v
®v®v
®v
®v
®v
®v ®v
®v®v
®v
®v
®v
®v
®v
®v®v
®v
®v
Palomar MedicalTrauma Catchment
Sharp MemorialTrauma Catchment
Scripps Memorial La JollaTrauma Catchment
Scripps-MercyTrauma CatchmentUCSD Medical Center
Trauma Catchment
RIVERSIDE
BAJA CALIFORNIA
IMPER
IAL
ORANGETrauma Catchment Area
Ambulance Service Area
BARONA RESERVATION
BORREGO SPRINGS FPD
CARLSBAD
CHULA VISTA
CORONADO
CSA 17 SAN DIEGUITO
CSA 69 HEARTLAND PARAMEDICS
DESERT REGION
EL CAJON
ESCONDIDO
FEDERAL
GROSSMONT
IMPERIAL BEACH
JULIAN-CUYAMACA FPD
MUTUAL AID
NATIONAL CITY
NORTH 5 SERVICE
NORTH COUNTY FPD
OCEANSIDE
POWAY
RAMONA
SAN DIEGO
SAN MARCOS
SOUTH 5 SERVICE
SYCUAN RESERVATION
VALLEY CENTER SERVICE
VISTA
Map Date: 2012Contact: Isabel Corcos or Leslie Ray,County of San Diego Emergency Medical Services619.285.6429
NAD_1983_StatePlane_California_VI_FIPS_0406_Feet,D_North_American_1983, Foot_US
Ü 0 9 184.5Miles
Hospital Facilities
ED
®v Alvarado
®v Camp Pendleton
®v Fallbrook
®v Kaiser
®v Navy Balboa
®v Paradise Valley
®v Pomerado
®v Scripps Chula Vista
®v Scripps Encinitas
®v Sharp Chula Vista
®v Sharp Coronado
®v UCSD Thornton
Base/ED
®v Grossmont
®v Tri-City
Trauma/Base/ED
®v UCSD Medical
®v Sharp Memorial
®v Scripps Mercy
®v Scripps La Jolla
®v Palomar West
Trauma/ED
®v Children's
County of San Diego Emergency Medical ResourcesHospitals, Trauma Catchment Areas, and Ambulance Service Areas
County of San Diego, Health & Human Services Agency, Public Health Services, Community Health Statisitcs Unit Page 10

Alcohol‐related Disorders
County of San Diego, Health & Human Services Agency, Public Health Services, Community Health Statisitcs Unit Page 11

Acute Alcohol‐Related Disorders
County of San Diego, Health & Human Services Agency, Public Health Services, Community Health Statisitcs Unit Page 12

No. Rate* No. Rate* No. Rate* No. Rate* No. Rate* No. Rate* No. Rate* No. Rate* No. Rate* No. Rate* No. Rate*
San Diego County (Actual Rate) 1,481 47.8 1,701 54.6
San Diego County (Age‐Adjusted Rate) 1,481 47.4 1,701 54.0
Central Region 306 63.2 324 66.7
Central San Diego 164 99.1 171 103.0
Mid‐City 95 58.3 103 63.1
Southeast San Diego 47 30.2 50 32.0
East Region 335 72.3 371 79.5
Alpine 26 172.9 15 99.0
El Cajon 66 53.0 68 54.3
Harbison Crest/El Cajon** 116 83.4 129 92.1
Jamul 8 42.2 9 51.2
La Mesa 51 86.3 75 125.0
Laguna‐Pine Valley <5 § <5 §
Lakeside 40 71.4 27 47.9
Lemon Grove 21 70.4 19 63.4
Mountain Empire <5 § <5 §
Santee 36 70.4 50 96.7
Spring Valley 34 42.0 44 53.8
North Central Region 309 51.2 378 62.0
Coastal 48 63.7 63 83.4
Del Mar‐Mira Mesa 51 32.4 52 32.8
Elliott‐Navajo 44 49.4 66 73.8
Kearny Mesa 104 68.8 124 81.7
Miramar <5 § <5 §
Peninsula 39 62.0 52 82.5
University 23 36.7 21 31.6
North Coastal Region 204 40.3 194 38.1
Carlsbad 59 51.4 56 48.3
Oceanside 69 43.2 62 38.7
Pendleton <5 § <5 §
San Dieguito 35 37.4 29 30.6
Vista 40 39.8 46 45.4
North Inland Region 181 31.8 271 47.2
Anza‐Borrego Springs 16 360.4 6 128.6
Escondido 53 32.5 100 60.9
Fallbrook 13 27.5 12 25.1
North San Diego 35 32.9 45 41.8
Palomar‐Julian <5 § <5 §
Pauma <5 § <5 §
Poway 26 30.1 30 34.5
Ramona 9 25.8 26 73.4
San Marcos 23 25.6 42 46.6
Valley Center <5 § 6 25.6
South Region 146 31.2 163 34.7
Chula Vista 73 63.3 69 59.5
Coronado 8 32.4 14 60.0
National City 13 22.3 14 23.9
South Bay 26 19.3 40 29.6
Sweetwater 26 19.2 26 19.0Unknown <5 ‐‐‐ <5 ‐‐‐*Rates per 100,000 population. County age‐adjusted rates per 100,000 2000 US standard population.**Harbison Crest/El Cajon is an aggregation of the Harbison Crest and El Cajon SRAs. Due to geographic limitations, the Harbison Crest SRA is not shown alone. See the Data Guide for more information.†Acute alcohol‐related disorder hospitaliza on refers to (principal diagnosis) ICD‐9 codes 291, 305.0, 980.0.§Rates not calculated for fewer than 5 events. Rates not calculated in cases where zip code is unknown.Source: Patient Discharge Database (CA OSHPD), County of San Diego, Health & Human Services Agency, Public Health Services, Epidemiology & Immunization Services Branch; SANDAG, Current Population Estimates, 10/2012.Prepared by: County of San Diego, Health & Human Services Agency, Public Health Services, Community Health Statistics Unit, 2013.
Acute Alcohol‐related Disorder† Hospitaliza ons Among San Diego County Residents by Location of Residence
Geography2010 Total 2011 Total 2012 Total 2013 Total 2014 Total 2015 Total 2016 Total 2017 Total 2018 Total 2019 Total 2020 Total
County of San Diego, Health & Human Services Agency, Public Health Services, Community Health Statisitcs Unit Page 13

No. Rate* No. Rate* No. Rate* No. Rate* No. Rate* No. Rate* No. Rate* No. Rate* No. Rate* No. Rate* No. Rate* No. Rate* No. Rate*
San Diego County (Actual Rate) 1,481 47.8 954 61.4 527 34.2 1,113 74.2 74 50.5 213 21.5 13 3.8 20 17.3 6 1.0 69 13.9 489 54.9 795 104.6 122 34.7
San Diego County (Age‐Adjusted Rate) 1,481 47.4
Central Region 306 63.2 199 80.3 107 45.2 204 142.0 32 56.5 56 27.4 <5 § 5 31.5 <5 § 13 15.6 110 68.1 158 148.1 25 57.8
Central San Diego 164 99.1 112 123.7 52 69.3 128 155.5 10 87.1 20 34.7 <5 § <5 § <5 § <5 § 65 93.2 84 221.4 11 70.8
Mid‐City 95 58.3 54 66.5 41 50.1 63 135.6 <5 § 22 32.1 <5 § <5 § <5 § 6 18.0 34 67.5 46 140.4 9 70.4
Southeast San Diego 47 30.2 33 43.4 14 17.5 13 87.3 18 69.6 14 17.9 <5 § <5 § <5 § <5 § 11 26.6 28 77.8 5 33.4
East Region 335 72.3 227 99.5 108 45.9 272 97.4 19 71.5 36 31.1 <5 § <5 § <5 § 16 23.3 113 93.2 180 141.2 25 44.7
Alpine 26 172.9 16 214.5 10 132.0 25 211.7 <5 § <5 § <5 § <5 § <5 § <5 § 10 305.5 14 287.5 <5 §
El Cajon 66 53.0 51 83.7 15 23.6 53 72.0 7 100.0 5 15.1 <5 § <5 § <5 § 5 25.4 18 54.5 35 110.4 8 54.5
Harbison Crest/El Cajon** 116 83.4 84 123.1 32 45.1 95 111.4 7 98.3 13 36.9 <5 § <5 § <5 § 7 32.5 33 92.1 65 176.0 11 64.3
Jamul 8 42.2 <5 § <5 § 6 57.2 <5 § <5 § <5 § <5 § <5 § <5 § <5 § <5 § <5 §
La Mesa 51 86.3 32 113.5 19 61.5 45 121.5 <5 § 5 42.2 <5 § <5 § <5 § <5 § 15 87.8 29 188.8 5 58.2
Laguna‐Pine Valley <5 § <5 § <5 § <5 § <5 § <5 § <5 § <5 § <5 § <5 § <5 § <5 § <5 §
Lakeside 40 71.4 24 86.6 16 56.5 38 93.0 <5 § <5 § <5 § <5 § <5 § <5 § 17 117.4 19 118.6 <5 §
Lemon Grove 21 70.4 17 117.2 <5 § 12 126.8 <5 § 7 56.0 <5 § <5 § <5 § <5 § 11 137.1 7 91.6 <5 §
Mountain Empire <5 § <5 § <5 § <5 § <5 § <5 § <5 § <5 § <5 § <5 § <5 § <5 § <5 §
Santee 36 70.4 23 92.9 13 49.3 28 73.7 <5 § <5 § <5 § <5 § <5 § <5 § 14 100.9 21 142.4 <5 §
Spring Valley 34 42.0 25 63.4 9 21.6 22 57.5 5 § <5 § <5 § <5 § <5 § <5 § 10 47.5 19 88.1 <5 §
North Central Region 309 51.2 193 63.2 116 38.9 247 67.7 <5 § 36 42.0 <5 § 7 26.8 <5 § 16 15.6 104 54.2 169 118.2 19 26.4
Coastal 48 63.7 26 66.9 22 60.2 39 64.1 <5 § 5 62.1 <5 § <5 § <5 § <5 § 16 57.8 26 158.1 5 40.3
Del Mar‐Mira Mesa 51 32.4 28 35.4 23 29.3 40 52.7 <5 § 5 31.6 <5 § <5 § <5 § 5 25.9 19 40.0 24 53.6 <5 §
Elliott‐Navajo 44 49.4 25 57.8 19 41.4 35 58.2 <5 § 6 46.2 <5 § <5 § <5 § <5 § 14 55.6 25 111.2 <5 §
Kearny Mesa 104 68.8 69 91.6 35 46.1 79 93.7 <5 § 16 47.8 <5 § <5 § <5 § 8 34.0 32 64.4 58 162.8 6 31.5
Miramar <5 § <5 § <5 § <5 § <5 § <5 § <5 § <5 § <5 § <5 § <5 § <5 § <5 §
Peninsula 39 62.0 33 96.5 6 20.9 35 73.0 <5 § <5 § <5 § <5 § <5 § <5 § 13 61.8 23 160.7 <5 §
University 23 36.7 12 38.6 11 34.7 19 57.7 <5 § <5 § <5 § <5 § <5 § <5 § 10 50.6 13 141.5 <5 §
North Coastal Region 204 40.3 130 50.4 74 29.8 155 51.8 11 75.7 22 15.3 <5 § <5 § <5 § 7 8.4 69 50.5 107 85.6 20 33.6
Carlsbad 59 51.4 36 64.5 23 39.0 45 53.3 <5 § <5 § <5 § <5 § <5 § <5 § 19 63.1 30 92.0 8 44.9
Oceanside 69 43.2 44 55.5 25 31.1 54 72.7 <5 § 11 18.4 <5 § <5 § <5 § <5 § 22 49.3 41 104.8 <5 §
Pendleton <5 § <5 § <5 § <5 § <5 § <5 § <5 § <5 § <5 § <5 § <5 § <5 § <5 §
San Dieguito 35 37.4 27 58.7 8 16.8 30 40.9 <5 § <5 § <5 § <5 § <5 § <5 § 17 68.9 14 47.7 <5 §
Vista 40 39.8 22 43.4 18 36.2 26 59.3 5 184.7 6 12.9 <5 § <5 § <5 § <5 § 11 38.3 22 93.4 5 49.5
North Inland Region 181 31.8 117 41.7 64 22.1 139 44.2 <5 § 24 14.6 <5 § <5 § <5 § 10 13.0 46 31.0 98 64.3 25 34.6
Anza‐Borrego Springs 16 360.4 13 578.8 <5 § 13 463.8 <5 § <5 § <5 § <5 § <5 § <5 § <5 § 8 551.7 <5 §
Escondido 53 32.5 38 47.0 15 18.3 39 54.9 <5 § 11 14.8 <5 § <5 § <5 § <5 § 17 37.6 29 75.5 5 28.5
Fallbrook 13 27.5 8 34.0 5 21.0 12 43.9 <5 § <5 § <5 § <5 § <5 § <5 § <5 § 7 53.1 <5 §
North San Diego 35 32.9 17 33.0 18 32.7 30 47.9 <5 § <5 § <5 § <5 § <5 § <5 § 5 16.2 23 79.5 5 38.8
Palomar‐Julian <5 § <5 § <5 § <5 § <5 § <5 § <5 § <5 § <5 § <5 § <5 § <5 § <5 §
Pauma <5 § <5 § <5 § <5 § <5 § <5 § <5 § <5 § <5 § <5 § <5 § <5 § <5 §
Poway 26 30.1 15 35.6 11 24.9 19 32.8 <5 § <5 § <5 § <5 § <5 § <5 § 8 38.5 14 52.1 <5 §
Ramona 9 25.8 6 34.2 <5 § 8 32.2 <5 § <5 § <5 § <5 § <5 § <5 § <5 § 7 63.5 <5 §
San Marcos 23 25.6 16 36.4 7 15.2 14 30.8 <5 § 6 18.4 <5 § <5 § <5 § <5 § 8 31.7 6 29.4 <5 §
Valley Center <5 § <5 § <5 § <5 § <5 § <5 § <5 § <5 § <5 § <5 § <5 § <5 § <5 §
South Region 146 31.2 88 37.6 58 24.7 96 97.8 6 30.5 39 14.0 <5 § <5 § <5 § 7 8.7 47 35.6 83 78.3 8 16.5
Chula Vista 73 63.3 44 79.2 29 48.6 53 248.1 <5 § 17 20.9 <5 § <5 § <5 § <5 § 28 90.4 40 151.2 <5 §
Coronado 8 32.4 <5 § 6 59.1 7 39.1 <5 § <5 § <5 § <5 § <5 § <5 § <5 § 5 99.6 <5 §
National City 13 22.3 8 26.7 5 17.7 9 132.5 <5 § <5 § <5 § <5 § <5 § <5 § <5 § 8 66.7 <5 §
South Bay 26 19.3 19 27.9 7 10.5 12 58.5 <5 § 11 11.9 <5 § <5 § <5 § <5 § 5 13.2 18 58.8 <5 §
Sweetwater 26 19.2 15 22.8 11 15.9 15 47.6 <5 § 7 11.0 <5 § <5 § <5 § <5 § 9 22.1 12 37.6 <5 §Unknown <5 ‐‐‐ <5 ‐‐‐ <5 ‐‐‐ <5 ‐‐‐ <5 ‐‐‐ <5 ‐‐‐ <5 ‐‐‐ <5 ‐‐‐ <5 ‐‐‐ <5 ‐‐‐ <5 ‐‐‐ <5 ‐‐‐ <5 ‐‐‐*Rates per 100,000 population. County age‐adjusted rates per 100,000 2000 US standard population.**Harbison Crest/El Cajon is an aggregation of the Harbison Crest and El Cajon SRAs. Due to geographic limitations, the Harbison Crest SRA is not shown alone. See the Data Guide for more information.
***Numbers may not add up to totals due to unknown or missing details.
†Acute alcohol‐related disorder hospitaliza on refers to (principal diagnosis) ICD‐9 codes 291, 305.0, 980.0.
‡API includes Asian, Pacific Islander, Na ve Hawaiian. Other includes 2 or more races, Na ve American/Alaska Na ve, American Indian, or other.
§Rates not calculated for fewer than 5 events. Rates not calculated in cases where zip code is unknown.
Source: Patient Discharge Database (CA OSHPD), County of San Diego, Health & Human Services Agency, Public Health Services, Epidemiology & Immunization Services Branch; SANDAG, Current Population Estimates, 10/2012.
Prepared by: County of San Diego, Health & Human Services Agency, Public Health Services, Community Health Statistics Unit, 2013.
Ages 0‐14 Ages 15‐24 Ages 25‐44 Ages 45‐64 Ages 65+
Acute Alcohol‐related Disorder† Hospitaliza ons Among San Diego County Residents by Loca on of Residence, 2010 Detail
Geography2010 Total
Gender Race/Ethnicity Age Group
Male Female White Black Hispanic API‡ Other‡
County of San Diego, Health & Human Services Agency, Public Health Services, Community Health Statisitcs Unit Page 14

No. Rate* No. Rate* No. Rate* No. Rate* No. Rate* No. Rate* No. Rate* No. Rate* No. Rate* No. Rate* No. Rate* No. Rate* No. Rate*
San Diego County (Actual Rate) 1,701 54.6 1,078 69.0 623 40.1 1,292 86.4 41 28.7 271 26.8 13 3.7 42 35.6 <5 § 92 18.5 602 67.6 851 110.4 153 42.3
San Diego County (Age‐Adjusted Rate) 1,701 54.0
Central Region 324 66.7 209 84.2 115 48.4 218 153.2 19 34.6 64 30.8 5 7.7 12 74.9 <5 § 11 13.7 109 67.0 167 153.9 36 81.7
Central San Diego 171 103.0 107 118.1 64 84.9 121 147.8 7 63.0 33 56.3 <5 § 6 104.6 <5 § <5 § 62 88.0 87 225.0 18 112.2
Mid‐City 103 63.1 62 76.3 41 50.0 75 163.9 6 31.9 13 18.7 5 21.0 <5 § <5 § <5 § 32 63.2 52 155.3 15 116.2
Southeast San Diego 50 32.0 40 52.5 10 12.5 22 149.5 6 24.1 18 22.6 <5 § <5 § <5 § <5 § 15 36.1 28 77.0 <5 §
East Region 371 79.5 235 102.3 136 57.4 285 102.1 10 38.4 57 47.9 <5 § 11 51.3 <5 § 18 25.9 138 114.1 187 145.3 28 47.9
Alpine 15 99.0 13 172.6 <5 § 14 119.0 <5 § <5 § <5 § <5 § <5 § <5 § <5 § 7 142.5 <5 §
El Cajon 68 54.3 46 75.0 22 34.4 48 65.3 <5 § 13 38.3 <5 § <5 § <5 § <5 § 24 72.5 38 118.6 <5 §
Harbison Crest/El Cajon** 129 92.1 89 129.5 40 56.1 97 113.9 6 85.9 20 55.3 <5 § 5 72.5 <5 § <5 § 42 117.0 75 201.3 8 45.2
Jamul 9 51.2 6 59.4 <5 § 5 52.3 <5 § <5 § <5 § <5 § <5 § <5 § <5 § <5 § <5 §
La Mesa 75 125.0 41 143.2 34 108.4 62 166.3 <5 § 9 73.0 <5 § <5 § <5 § <5 § 27 154.6 40 255.0 5 56.5
Laguna‐Pine Valley <5 § <5 § <5 § <5 § <5 § <5 § <5 § <5 § <5 § <5 § <5 § <5 § <5 §
Lakeside 27 47.9 16 57.4 11 38.6 24 58.7 <5 § <5 § <5 § <5 § <5 § <5 § 9 62.5 12 74.0 <5 §
Lemon Grove 19 63.4 12 82.4 7 45.5 13 139.0 <5 § 6 46.8 <5 § <5 § <5 § <5 § 6 75.2 10 129.8 <5 §
Mountain Empire <5 § <5 § <5 § <5 § <5 § <5 § <5 § <5 § <5 § <5 § <5 § <5 § <5 §
Santee 50 96.7 28 111.9 22 82.5 44 115.3 <5 § 6 71.5 <5 § <5 § <5 § <5 § 27 197.0 20 133.3 <5 §
Spring Valley 44 53.8 28 70.4 16 38.1 25 65.3 <5 § 10 37.4 <5 § <5 § <5 § <5 § 20 95.2 18 82.7 5 50.8
North Central Region 378 62.0 236 76.5 142 47.1 327 89.5 5 26.7 24 27.4 <5 § 7 26.3 <5 § 15 14.5 121 62.5 203 140.5 39 52.9
Coastal 63 83.4 42 107.9 21 57.4 60 99.0 <5 § <5 § <5 § <5 § <5 § <5 § 16 57.4 38 231.6 6 47.6
Del Mar‐Mira Mesa 52 32.8 29 36.5 23 29.1 43 56.7 <5 § <5 § <5 § <5 § <5 § <5 § 23 49.3 19 41.6 8 55.6
Elliott‐Navajo 66 73.8 41 94.5 25 54.3 55 91.8 <5 § 5 37.9 <5 § <5 § <5 § <5 § 28 110.3 32 141.6 <5 §
Kearny Mesa 124 81.7 75 99.3 49 64.4 105 125.1 <5 § 14 41.1 <5 § <5 § <5 § 7 31.8 30 59.2 75 207.5 12 61.9
Miramar <5 § <5 § <5 § <5 § <5 § <5 § <5 § <5 § <5 § <5 § <5 § <5 § <5 §
Peninsula 52 82.5 37 107.6 15 52.3 46 96.4 <5 § <5 § <5 § <5 § <5 § <5 § 20 93.8 26 182.6 5 69.1
University 21 31.6 12 36.5 9 26.8 18 52.6 <5 § <5 § <5 § <5 § <5 § <5 § <5 § 13 139.8 <5 §
North Coastal Region 194 38.1 121 46.6 73 29.2 151 50.5 <5 § 31 21.1 <5 § <5 § <5 § 23 27.3 56 41.0 101 79.7 14 22.7
Carlsbad 56 48.3 35 62.1 21 35.3 42 49.6 <5 § 10 58.2 <5 § <5 § <5 § 5 39.0 17 57.4 27 81.5 7 37.9
Oceanside 62 38.7 39 49.1 23 28.5 54 73.3 <5 § 6 9.9 <5 § <5 § <5 § <5 § 20 44.8 34 86.5 5 26.7
Pendleton <5 § <5 § <5 § <5 § <5 § <5 § <5 § <5 § <5 § <5 § <5 § <5 § <5 §
San Dieguito 29 30.6 17 36.4 12 24.9 23 31.1 <5 § <5 § <5 § <5 § <5 § 8 79.8 5 20.4 14 47.1 <5 §
Vista 46 45.4 29 56.7 17 33.9 31 71.1 <5 § 13 27.2 <5 § <5 § <5 § 6 36.4 14 48.4 26 107.9 <5 §
North Inland Region 271 47.2 177 62.5 94 32.2 218 69.5 <5 § 38 22.6 <5 § 7 32.5 <5 § 16 20.1 97 66.0 131 84.8 26 34.8
Anza‐Borrego Springs 6 128.6 6 255.3 <5 § 5 177.2 <5 § <5 § <5 § <5 § <5 § <5 § <5 § <5 § <5 §
Escondido 100 60.9 70 85.9 30 36.3 75 106.3 <5 § 22 29.1 <5 § <5 § <5 § <5 § 38 84.0 49 125.2 10 56.1
Fallbrook 12 25.1 10 41.9 <5 § 6 22.0 <5 § <5 § <5 § <5 § <5 § <5 § <5 § 6 45.7 <5 §
North San Diego 45 41.8 27 51.9 18 32.4 39 62.1 <5 § <5 § <5 § <5 § <5 § 5 41.7 14 46.0 20 67.8 6 45.1
Palomar‐Julian <5 § <5 § <5 § <5 § <5 § <5 § <5 § <5 § <5 § <5 § <5 § <5 § <5 §
Pauma <5 § <5 § <5 § <5 § <5 § <5 § <5 § <5 § <5 § <5 § <5 § <5 § <5 §
Poway 30 34.5 21 49.5 9 20.2 28 48.3 <5 § <5 § <5 § <5 § <5 § <5 § 9 44.7 13 47.6 <5 §
Ramona 26 73.4 13 73.0 13 73.7 25 99.9 <5 § <5 § <5 § <5 § <5 § <5 § 9 113.9 16 142.9 <5 §
San Marcos 42 46.6 29 65.7 13 28.2 34 75.7 <5 § <5 § <5 § <5 § <5 § <5 § 16 64.2 20 96.6 <5 §
Valley Center 6 25.6 <5 § 5 42.8 5 33.7 <5 § <5 § <5 § <5 § <5 § <5 § <5 § <5 § <5 §
South Region 163 34.7 100 42.8 63 26.7 93 96.7 <5 § 57 20.3 <5 § <5 § <5 § 9 11.1 81 62.2 62 57.4 10 20.2
Chula Vista 69 59.5 40 71.6 29 48.3 40 191.1 <5 § 27 32.7 <5 § <5 § <5 § <5 § 35 113.3 30 111.4 <5 §
Coronado 14 60.0 7 52.4 7 70.3 12 70.3 <5 § <5 § <5 § <5 § <5 § <5 § 7 116.5 <5 § <5 §
National City 14 23.9 12 40.0 <5 § 6 91.0 <5 § 7 18.6 <5 § <5 § <5 § <5 § <5 § 6 49.2 <5 §
South Bay 40 29.6 24 35.3 16 23.9 18 89.5 <5 § 16 17.2 <5 § <5 § <5 § <5 § 22 58.5 13 42.1 <5 §
Sweetwater 26 19.0 17 25.6 9 12.8 17 54.1 <5 § 7 10.8 <5 § <5 § <5 § <5 § 13 32.6 9 27.4 <5 §Unknown <5 ‐‐‐ <5 ‐‐‐ <5 ‐‐‐ <5 ‐‐‐ <5 ‐‐‐ <5 ‐‐‐ <5 ‐‐‐ <5 ‐‐‐ <5 ‐‐‐ <5 ‐‐‐ <5 ‐‐‐ <5 ‐‐‐ <5 ‐‐‐* Rates per 100,000 population. County age‐adjusted rates per 100,000 2000 US standard population.**Harbison Crest/El Cajon is an aggregation of the Harbison Crest and El Cajon SRAs. Due to geographic limitations, the Harbison Crest SRA is not shown alone. See the Data Guide for more information.
***Numbers may not add up to totals due to unknown or missing details.
†Acute alcohol‐related disorder hospitaliza on refers to (principal diagnosis) ICD‐9 codes 291, 305.0, 980.0.
‡API includes Asian, Pacific Islander, Na ve Hawaiian. Other includes 2 or more races, Na ve American/Alaska Na ve, American Indian, or other.
§Rates not calculated for fewer than 5 events. Rates not calculated in cases where zip code is unknown.
Source: Patient Discharge Database (CA OSHPD), County of San Diego, Health & Human Services Agency, Public Health Services, Epidemiology & Immunization Services Branch; SANDAG, Current Population Estimates, 10/2012.
Prepared by: County of San Diego, Health & Human Services Agency, Public Health Services, Community Health Statistics Unit, 2013.
Gender Race/Ethnicity Age Group
Male Female White Black Hispanic Ages 65+API‡ Other‡ Ages 0‐14 Ages 15‐24 Ages 25‐44 Ages 45‐64Geography2011 Total
Acute Alcohol‐related Disorder† Hospitaliza ons Among San Diego County Residents by Loca on of Residence, 2011 Detail
County of San Diego, Health & Human Services Agency, Public Health Services, Community Health Statisitcs Unit Page 15

No. Rate* No. Rate* No. Rate* No. Rate* No. Rate* No. Rate* No. Rate* No. Rate* No. Rate* No. Rate* No. Rate*
San Diego County (Actual Rate) 6,757 218.3 7,404 237.6
San Diego County (Age‐Adjusted Rate) 6,757 211.5 7,404 230.3
Central Region 1,909 394.1 1,829 376.7
Central San Diego 1,141 689.1 1,111 669.4
Mid‐City 405 248.4 363 222.4
Southeast San Diego 363 233.0 355 227.0
East Region 846 182.7 984 210.9
Alpine 30 199.5 39 257.3
El Cajon 144 115.6 172 137.3
Harbison Crest/El Cajon** 270 194.0 337 240.7
Jamul 28 147.7 32 182.0
La Mesa 160 270.8 200 333.4
Laguna‐Pine Valley <5 § <5 §
Lakeside 98 174.9 70 124.2
Lemon Grove 59 197.9 73 243.7
Mountain Empire 17 224.0 9 105.8
Santee 76 148.6 97 187.6
Spring Valley 105 129.6 123 150.5
North Central Region 1,006 166.6 1,116 183.0
Coastal 207 274.6 243 321.6
Del Mar‐Mira Mesa 104 66.0 124 78.2
Elliott‐Navajo 160 179.6 170 190.1
Kearny Mesa 333 220.2 361 238.0
Miramar <5 § <5 §
Peninsula 116 184.3 139 220.4
University 85 135.5 76 114.3
North Coastal Region 750 148.3 933 183.0
Carlsbad 118 102.9 114 98.4
Oceanside 330 206.6 396 247.4
Pendleton 7 18.7 <5 §
San Dieguito 124 132.6 163 171.8
Vista 171 170.3 257 253.6
North Inland Region 920 161.5 1,098 191.1
Anza‐Borrego Springs 12 270.3 6 128.6
Escondido 392 240.5 480 292.3
Fallbrook 64 135.3 78 162.9
North San Diego 146 137.0 167 155.2
Palomar‐Julian 7 111.7 6 93.3
Pauma 9 120.7 14 180.1
Poway 105 121.7 104 119.7
Ramona 58 166.3 65 183.4
San Marcos 102 113.4 154 170.8
Valley Center 25 107.2 24 102.3
South Region 755 161.2 810 172.5
Chula Vista 345 299.4 321 276.9
Coronado 61 247.0 45 192.9
National City 136 233.2 145 247.9
South Bay 153 113.4 220 162.8
Sweetwater 60 44.3 79 57.8Unknown 571 ‐‐‐ 634 ‐‐‐*Rates per 100,000 population. County age‐adjusted rates per 100,000 2000 US standard population.**Harbison Crest/El Cajon is an aggregation of the Harbison Crest and El Cajon SRAs. Due to geographic limitations, the Harbison Crest SRA is not shown alone. See the Data Guide for more information.†Acute alcohol‐related disorder Emergency Department Discharge refers to (principal diagnosis) ICD‐9 codes 291, 305.0, 980.0.§Rates not calculated for fewer than 5 events. Rates not calculated in cases where zip code is unknown.Source: Emergency Department Discharge Database (CA OSHPD), County of San Diego, Health & Human Services Agency, Public Health Services, Emergency Medical Services; SANDAG, Current Population Estimates, 10/2012.Prepared by: County of San Diego, Health & Human Services Agency, Public Health Services, Community Health Statistics Unit, 2013.
Acute Alcohol‐related Disorder† Emergency Department Discharges Among San Diego County Residents by Loca on of Residence
Geography2010 Total 2011 Total 2012 Total 2013 Total 2014 Total 2015 Total 2016 Total 2017 Total 2018 Total 2019 Total 2020 Total
County of San Diego, Health & Human Services Agency, Public Health Services, Community Health Statisitcs Unit Page 16

No. Rate* No. Rate* No. Rate* No. Rate* No. Rate* No. Rate* No. Rate* No. Rate* No. Rate* No. Rate* No. Rate* No. Rate* No. Rate*
San Diego County (Actual Rate) 6,757 218.3 4,385 282.2 2,372 153.9 4,511 300.7 463 315.8 1,435 144.8 120 35.1 132 114.0 137 23.0 1,401 282.5 2,313 259.5 2,652 348.8 254 72.3
San Diego County (Age‐Adjusted Rate) 6,757 211.5
Central Region 1,909 394.1 1,399 564.8 510 215.4 1,165 811.1 261 460.5 407 199.2 30 47.0 29 182.9 38 42.3 284 341.6 647 400.7 866 811.5 74 171.0
Central San Diego 1,141 689.1 895 988.7 246 327.8 858 1042.6 115 1001.6 133 230.8 11 129.4 14 246.6 18 93.0 84 365.4 364 522.0 629 1657.5 46 296.0
Mid‐City 405 248.4 244 300.5 161 196.7 210 452.1 50 258.8 115 168.0 14 59.4 12 228.4 12 35.5 111 333.5 137 271.8 132 402.8 13 101.7
Southeast San Diego 363 233.0 260 342.2 103 129.0 97 651.1 96 371.0 159 203.1 5 15.7 <5 § 8 21.8 89 331.2 146 353.3 105 291.7 15 100.3
East Region 846 182.7 522 228.9 324 137.8 621 222.4 56 210.7 135 116.8 8 38.7 14 66.7 18 20.0 180 262.7 303 250.0 302 237.0 43 76.9
Alpine 30 199.5 10 134.1 20 264.0 26 220.1 <5 § <5 § <5 § <5 § <5 § 7 354.8 14 427.7 9 184.8 <5 §
El Cajon 144 115.6 92 151.0 52 81.8 103 139.8 13 185.8 24 72.4 <5 § <5 § <5 § 36 183.1 51 154.5 43 135.7 12 81.8
Harbison Crest/El Cajon** 270 194.0 172 252.1 98 138.2 196 229.8 20 280.8 44 124.8 <5 § <5 § 8 28.8 61 283.4 99 276.2 85 230.1 17 99.4
Jamul 28 147.7 15 137.6 13 161.3 18 171.7 <5 § 7 121.0 <5 § <5 § <5 § 9 283.6 6 125.1 12 200.4 <5 §
La Mesa 160 270.8 91 322.9 69 223.2 125 337.4 9 217.3 20 168.7 <5 § <5 § <5 § 24 284.6 51 298.6 79 514.3 6 69.8
Laguna‐Pine Valley <5 § <5 § <5 § <5 § <5 § <5 § <5 § <5 § <5 § <5 § <5 § <5 § <5 §
Lakeside 98 174.9 65 234.6 33 116.5 78 191.0 <5 § 11 106.1 <5 § <5 § <5 § 29 362.5 30 207.1 30 187.2 7 116.0
Lemon Grove 59 197.9 40 275.9 19 124.1 40 422.5 7 159.2 11 88.0 <5 § <5 § <5 § 8 175.3 25 311.6 22 287.9 <5 §
Mountain Empire 17 224.0 6 146.9 11 313.8 14 338.2 <5 § <5 § <5 § <5 § <5 § <5 § 10 562.4 <5 § <5 §
Santee 76 148.6 47 189.8 29 109.9 64 168.5 <5 § 8 98.4 <5 § <5 § <5 § 22 314.4 28 201.9 22 149.1 <5 §
Spring Valley 105 129.6 75 190.3 30 72.1 57 149.0 13 167.8 31 119.0 <5 § <5 § <5 § 17 140.7 39 185.2 37 171.6 10 106.2
North Central Region 1,006 166.6 593 194.1 413 138.4 776 212.6 33 175.8 115 134.2 41 37.9 26 99.6 17 18.0 265 258.3 356 185.5 333 233.0 35 48.7
Coastal 207 274.6 112 288.3 95 260.0 169 277.8 <5 § 13 161.6 10 303.2 8 323.6 <5 § 70 628.2 65 234.7 64 389.1 <5 §
Del Mar‐Mira Mesa 104 66.0 49 62.0 55 70.1 79 104.0 6 162.1 8 50.6 7 12.7 <5 § <5 § 38 196.9 35 73.6 25 55.8 6 44.1
Elliott‐Navajo 160 179.6 99 229.0 61 133.0 128 213.0 <5 § 22 169.6 5 65.0 <5 § 5 29.3 31 279.5 54 214.5 66 293.5 <5 §
Kearny Mesa 333 220.2 203 269.4 130 171.4 239 283.4 18 268.0 52 155.3 9 45.4 9 131.6 7 30.1 72 305.6 113 227.3 127 356.5 14 73.4
Miramar <5 § <5 § <5 § <5 § <5 § <5 § <5 § <5 § <5 § <5 § <5 § <5 § <5 §
Peninsula 116 184.3 84 245.7 32 111.3 107 223.1 <5 § 5 61.0 <5 § <5 § <5 § 18 144.0 56 266.1 39 272.4 <5 §
University 85 135.5 45 144.8 40 126.4 54 164.0 <5 § 14 228.3 9 44.7 <5 § <5 § 35 159.5 33 167.1 12 130.6 <5 §
North Coastal Region 750 148.3 444 172.2 306 123.4 556 185.9 26 179.0 134 93.1 7 23.3 17 93.5 14 13.9 175 209.0 281 205.8 241 192.9 39 65.4
Carlsbad 118 102.9 56 100.4 62 105.2 102 120.9 <5 § 11 66.0 <5 § <5 § <5 § 35 286.4 34 113.0 37 113.4 10 56.1
Oceanside 330 206.6 200 252.3 130 161.6 240 323.3 18 259.5 55 91.8 <5 § 8 125.2 6 18.7 50 197.2 143 320.2 115 293.9 16 86.8
Pendleton 7 18.7 6 23.0 <5 § 6 25.7 <5 § <5 § <5 § <5 § <5 § 7 35.0 <5 § <5 § <5 §
San Dieguito 124 132.6 76 165.2 48 101.0 104 141.8 <5 § 18 143.5 <5 § <5 § <5 § 42 447.8 35 141.9 38 129.5 6 45.4
Vista 171 170.3 106 209.1 65 130.7 104 237.1 5 184.7 50 107.1 <5 § 7 229.1 <5 § 41 244.7 69 240.4 51 216.4 7 69.3
North Inland Region 920 161.5 542 193.2 378 130.8 630 200.1 12 115.9 223 136.0 12 20.3 32 151.0 25 20.9 232 301.0 301 202.8 334 219.3 28 38.8
Anza‐Borrego Springs 12 270.3 7 311.7 5 227.9 8 285.4 <5 § <5 § <5 § <5 § <5 § <5 § <5 § 6 413.8 <5 §
Escondido 392 240.5 252 311.6 140 170.4 249 350.2 5 148.6 128 172.7 <5 § 6 141.7 12 33.2 76 296.4 132 291.6 158 411.5 14 79.9
Fallbrook 64 135.3 39 165.6 25 105.2 39 142.8 <5 § 24 139.3 <5 § <5 § <5 § 15 210.6 27 270.4 18 136.6 <5 §
North San Diego 146 137.0 71 137.9 75 136.3 111 177.2 5 196.3 14 131.4 6 23.4 8 159.0 <5 § 50 436.9 30 97.3 57 196.9 5 38.8
Palomar‐Julian 7 111.7 <5 § <5 § 5 108.2 <5 § <5 § <5 § <5 § <5 § <5 § <5 § <5 § <5 §
Pauma 9 120.7 <5 § 5 138.4 <5 § <5 § <5 § <5 § <5 § <5 § <5 § <5 § <5 § <5 §
Poway 105 121.7 45 106.7 60 135.9 81 139.7 <5 § 9 87.2 <5 § 10 296.3 <5 § 40 395.7 41 197.1 20 74.4 <5 §
Ramona 58 166.3 32 182.5 26 150.0 54 217.4 <5 § <5 § <5 § <5 § <5 § 13 251.6 20 251.9 23 208.7 <5 §
San Marcos 102 113.4 71 161.4 31 67.4 62 136.5 <5 § 33 101.2 <5 § <5 § <5 § 21 167.4 32 126.7 43 211.0 <5 §
Valley Center 25 107.2 17 145.2 8 68.8 18 120.3 <5 § <5 § <5 § <5 § <5 § 7 226.5 10 215.4 6 78.0 <5 §
South Region 755 161.2 447 191.0 308 131.4 340 346.5 41 208.1 339 122.1 17 28.6 9 67.1 22 21.7 211 261.2 232 175.9 263 248.1 27 55.6
Chula Vista 345 299.4 207 372.7 138 231.2 167 781.8 21 531.5 143 175.8 <5 § 5 195.2 10 40.8 82 436.3 123 397.1 113 427.0 17 117.1
Coronado 61 247.0 18 123.8 43 423.4 52 290.2 <5 § 5 149.1 <5 § <5 § <5 § 13 200.8 11 166.9 34 677.2 <5 §
National City 136 233.2 99 330.0 37 130.7 38 559.4 11 429.9 81 218.1 5 47.4 <5 § <5 § 32 261.2 40 254.4 57 475.4 <5 §
South Bay 153 113.4 90 132.2 63 94.2 56 272.8 7 129.1 83 89.8 <5 § <5 § <5 § 57 238.5 44 116.0 42 137.3 6 46.5
Sweetwater 60 44.3 33 50.1 27 38.9 27 85.6 <5 § 27 42.5 <5 § <5 § <5 § 27 139.4 14 34.4 17 53.2 <5 §Unknown 571 ‐‐‐ 438 ‐‐‐ 133 ‐‐‐ 423 ‐‐‐ 34 ‐‐‐ 82 ‐‐‐ 5 ‐‐‐ 5 ‐‐‐ <5 ‐‐‐ 54 ‐‐‐ 193 ‐‐‐ 321 ‐‐‐ 8 ‐‐‐*Rates per 100,000 population. County age‐adjusted rates per 100,000 2000 US standard population.**Harbison Crest/El Cajon is an aggregation of the Harbison Crest and El Cajon SRAs. Due to geographic limitations, the Harbison Crest SRA is not shown alone. See the Data Guide for more information.
***Numbers may not add up to totals due to unknown or missing details.
†Acute alcohol‐related disorder Emergency Department Discharge refers to (principal diagnosis) ICD‐9 codes 291, 305.0, 980.0.
‡API includes Asian, Pacific Islander, Na ve Hawaiian. Other includes 2 or more races, Na ve American/Alaska Na ve, American Indian, or other.
§Rates not calculated for fewer than 5 events. Rates not calculated in cases where zip code is unknown.
Source: Emergency Department Discharge Database (CA OSHPD), County of San Diego, Health & Human Services Agency, Public Health Services, Emergency Medical Services; SANDAG, Current Population Estimates, 10/2012.
Prepared by: County of San Diego, Health & Human Services Agency, Public Health Services, Community Health Statistics Unit, 2013.
Ages 0‐14 Ages 15‐24 Ages 25‐44 Ages 45‐64 Ages 65+
Acute Alcohol‐related Disorder† Emergency Department Discharges Among San Diego County Residents by Loca on of Residence, 2010 Detail
Geography2010 Total
Gender Race/Ethnicity Age Group
Male Female White Black Hispanic API‡ Other‡
County of San Diego, Health & Human Services Agency, Public Health Services, Community Health Statisitcs Unit Page 17

No. Rate* No. Rate* No. Rate* No. Rate* No. Rate* No. Rate* No. Rate* No. Rate* No. Rate* No. Rate* No. Rate* No. Rate* No. Rate*
San Diego County (Actual Rate) 7,404 237.6 4,785 306.2 2,619 168.6 4,793 320.5 459 321.2 1,597 158.0 178 51.0 247 209.7 137 23.1 1,578 316.5 2,416 271.2 2,993 388.2 280 77.4
San Diego County (Age‐Adjusted Rate) 7,404 230.3
Central Region 1,829 376.7 1,286 518.3 543 228.7 1,135 797.5 215 391.9 380 182.9 37 57.3 41 255.8 33 36.6 301 374.8 571 351.2 857 789.6 67 152.1
Central San Diego 1,111 669.4 830 916.3 281 372.8 839 1025.0 88 791.8 139 237.0 9 104.4 24 418.6 12 59.7 93 448.5 351 498.5 612 1582.7 43 267.9
Mid‐City 363 222.4 219 269.5 144 175.8 184 402.2 45 239.4 94 135.1 18 75.7 15 282.9 13 38.5 100 309.2 118 232.9 121 361.4 11 85.2
Southeast San Diego 355 227.0 237 310.9 118 147.2 112 761.0 82 328.7 147 184.7 10 31.1 <5 § 8 22.1 108 396.8 102 245.8 124 340.8 13 86.1
East Region 984 210.9 592 257.6 392 165.5 612 219.3 73 280.3 181 152.2 14 66.0 61 284.6 12 13.5 232 334.4 358 296.1 343 266.5 39 66.7
Alpine 39 257.3 25 331.8 14 183.6 26 221.0 <5 § 6 256.2 <5 § 5 954.2 <5 § 11 518.9 12 377.7 14 285.0 <5 §
El Cajon 172 137.3 112 182.6 60 93.9 93 126.5 17 248.1 37 108.9 <5 § 12 188.4 <5 § 41 208.2 76 229.5 49 152.9 <5 §
Harbison Crest/El Cajon** 337 240.7 201 292.5 136 190.7 197 231.4 28 400.9 60 165.8 6 124.5 32 463.8 5 18.2 76 351.2 143 398.5 98 263.0 15 84.7
Jamul 32 182.0 17 168.3 15 200.7 17 177.9 5 601.0 6 109.3 <5 § <5 § <5 § 16 530.3 6 138.5 10 179.3 <5 §
La Mesa 200 333.4 132 461.1 68 216.8 136 364.7 10 243.4 29 235.2 <5 § 7 262.3 <5 § 32 391.7 70 400.8 88 560.9 10 112.9
Laguna‐Pine Valley <5 § <5 § <5 § <5 § <5 § <5 § <5 § <5 § <5 § <5 § <5 § <5 § <5 §
Lakeside 70 124.2 35 125.6 35 122.9 51 124.8 <5 § 7 65.9 <5 § 7 262.9 <5 § 12 148.8 25 173.7 29 178.9 <5 §
Lemon Grove 73 243.7 54 370.8 19 123.5 42 449.1 9 210.6 21 163.9 <5 § <5 § <5 § 16 342.6 25 313.4 29 376.4 <5 §
Mountain Empire 9 105.8 <5 § 5 127.2 5 110.8 <5 § <5 § <5 § <5 § <5 § <5 § <5 § <5 § <5 §
Santee 97 187.6 51 203.8 46 172.5 74 193.8 <5 § 13 154.9 <5 § <5 § <5 § 29 400.3 32 233.5 33 220.0 <5 §
Spring Valley 123 150.5 71 178.5 52 123.9 60 156.8 15 198.0 37 138.2 <5 § <5 § <5 § 37 298.8 40 190.3 37 170.0 7 71.1
North Central Region 1,116 183.0 697 226.0 419 139.1 864 236.6 33 176.5 103 117.4 64 57.4 35 131.5 20 21.2 294 283.9 354 182.8 391 270.6 57 77.4
Coastal 243 321.6 139 357.0 104 284.0 193 318.3 <5 § 11 133.4 18 528.5 13 516.1 <5 § 76 688.5 77 276.2 79 481.4 7 55.5
Del Mar‐Mira Mesa 124 78.2 74 93.2 50 63.2 83 109.5 11 305.9 9 55.9 15 26.9 <5 § <5 § 46 230.1 38 81.5 29 63.4 9 62.6
Elliott‐Navajo 170 190.1 114 262.7 56 121.6 141 235.4 8 201.1 11 83.4 <5 § <5 § <5 § 31 286.2 50 197.0 81 358.5 6 43.9
Kearny Mesa 361 238.0 240 317.6 121 158.9 273 325.2 9 136.5 51 149.7 11 54.6 10 144.5 6 25.5 81 368.4 103 203.2 153 423.3 18 92.9
Miramar <5 § <5 § <5 § <5 § <5 § <5 § <5 § <5 § <5 § <5 § <5 § <5 § <5 §
Peninsula 139 220.4 <5 § 41 142.9 127 266.2 <5 § 6 71.5 <5 § <5 § <5 § 21 170.4 62 290.7 39 274.0 15 207.2
University 76 114.3 29 88.1 47 140.0 44 128.6 <5 § 15 223.7 14 64.6 <5 § <5 § 37 152.5 23 111.2 10 107.6 <5 §
North Coastal Region 933 183.0 543 209.1 390 155.9 661 221.1 25 174.6 195 132.8 15 48.5 30 160.0 19 18.9 228 270.2 311 227.8 352 277.6 23 37.3
Carlsbad 114 98.4 49 87.0 65 109.2 91 107.5 <5 § 13 75.7 <5 § 5 122.9 <5 § 27 210.4 42 141.9 35 105.6 7 37.9
Oceanside 396 247.4 245 308.3 151 187.3 286 388.1 9 134.7 71 116.8 10 80.6 16 245.1 <5 § 85 343.4 144 322.3 157 399.3 7 37.4
Pendleton <5 § <5 § <5 § <5 § <5 § <5 § <5 § <5 § <5 § <5 § <5 § <5 § <5 §
San Dieguito 163 171.8 85 182.2 78 161.7 132 178.3 <5 § 27 207.9 <5 § <5 § <5 § 55 548.8 47 192.2 54 181.5 <5 §
Vista 257 253.6 162 316.9 95 189.2 151 346.1 13 494.3 82 171.7 <5 § 7 226.9 10 46.7 58 351.7 78 269.6 106 440.1 5 48.0
North Inland Region 1,098 191.1 661 233.5 437 149.9 739 235.4 26 255.3 265 157.4 22 36.3 34 157.7 32 27.0 259 324.8 345 234.7 412 266.6 50 67.0
Anza‐Borrego Springs 6 128.6 <5 § <5 § 6 212.6 <5 § <5 § <5 § <5 § <5 § <5 § <5 § <5 § <5 §
Escondido 480 292.3 313 384.1 167 201.8 297 421.1 16 485.9 154 203.4 <5 § 7 162.6 13 36.0 78 301.2 167 369.0 210 536.7 12 67.3
Fallbrook 78 162.9 38 159.3 40 166.5 43 157.9 <5 § 31 174.1 <5 § <5 § <5 § 23 317.4 28 276.8 23 175.0 <5 23.5
North San Diego 167 155.2 79 151.8 88 158.3 120 191.1 7 280.8 17 155.4 13 49.5 5 97.9 6 26.8 58 483.3 39 128.1 52 176.2 12 90.2
Palomar‐Julian 6 93.3 <5 § 6 184.1 6 129.6 <5 § <5 § <5 § <5 § <5 § <5 § <5 § 5 212.9 <5 §
Pauma 14 180.1 <5 § 10 265.3 7 224.1 <5 § <5 § <5 § <5 § <5 § <5 § 6 296.2 5 244.3 <5 §
Poway 104 119.7 63 148.4 41 92.2 88 151.9 <5 § 10 94.1 <5 § <5 § <5 § 40 365.2 27 134.2 25 91.5 8 71.0
Ramona 65 183.4 39 219.1 26 147.4 52 207.8 <5 § 6 70.4 <5 § 5 492.6 <5 § 13 237.0 20 253.0 22 196.5 7 174.4
San Marcos 154 170.8 109 247.1 45 97.7 105 233.7 <5 § 37 111.3 <5 § 8 277.6 <5 § 36 281.5 47 188.7 59 285.0 9 75.6
Valley Center 24 102.3 13 110.5 11 94.1 15 101.1 <5 § 8 133.4 <5 § <5 § <5 § 7 214.9 9 199.6 7 91.4 <5 §
South Region 810 172.5 526 225.0 284 120.5 344 357.8 48 255.3 365 129.8 19 31.7 23 171.2 20 19.9 222 273.4 281 215.8 261 241.8 26 52.6
Chula Vista 321 276.9 215 385.1 106 176.4 148 707.1 15 391.7 142 172.1 <5 § 10 390.0 <5 § 89 468.2 126 407.8 97 360.1 6 40.9
Coronado 45 192.9 26 194.5 19 190.8 33 193.3 <5 § 5 155.6 <5 § <5 § <5 § 14 246.2 11 183.1 15 299.3 <5 §
National City 145 247.9 102 339.9 43 151.0 45 682.7 9 363.3 85 226.3 <5 § <5 § <5 § 28 228.8 37 234.2 71 582.3 5 82.3
South Bay 220 162.8 136 199.9 84 125.2 86 427.5 23 443.1 99 106.1 <5 § <5 § 7 23.6 66 277.7 78 207.4 61 197.3 8 60.6
Sweetwater 79 57.8 47 70.7 32 45.6 32 101.8 <5 § 34 52.7 7 23.8 5 95.6 5 15.9 25 122.0 29 72.6 17 51.7 <5 §Unknown 634 ‐‐‐ 480 ‐‐‐ 154 ‐‐‐ 438 ‐‐‐ 39 ‐‐‐ 108 ‐‐‐ 7 ‐‐‐ 23 ‐‐‐ <5 ‐‐‐ 42 ‐‐‐ 196 ‐‐‐ 377 ‐‐‐ 18 ‐‐‐*Rates per 100,000 population. County age‐adjusted rates per 100,000 2000 US standard population.**Harbison Crest/El Cajon is an aggregation of the Harbison Crest and El Cajon SRAs. Due to geographic limitations, the Harbison Crest SRA is not shown alone. See the Data Guide for more information.
***Numbers may not add up to totals due to unknown or missing details.
†Acute alcohol‐related disorder Emergency Department Discharge refers to (principal diagnosis) ICD‐9 codes 291, 305.0, 980.0.
‡API includes Asian, Pacific Islander, Na ve Hawaiian. Other includes 2 or more races, Na ve American/Alaska Na ve, American Indian, or other.
§Rates not calculated for fewer than 5 events. Rates not calculated in cases where zip code is unknown.
Source: Emergency Department Discharge Database (CA OSHPD), County of San Diego, Health & Human Services Agency, Public Health Services, Emergency Medical Services; SANDAG, Current Population Estimates, 10/2012.
Prepared by: County of San Diego, Health & Human Services Agency, Public Health Services, Community Health Statistics Unit, 2013.
Gender Race/Ethnicity Age Group
Male Female White Black Hispanic Ages 65+API‡ Other‡ Ages 0‐14 Ages 15‐24 Ages 25‐44 Ages 45‐64Geography2011 Total
Acute Alcohol‐related Disorder† Emergency Department Discharges Among San Diego County Residents by Loca on of Residence, 2011 Detail
County of San Diego, Health & Human Services Agency, Public Health Services, Community Health Statisitcs Unit Page 18

Chronic Alcohol‐Related Disorders
County of San Diego, Health & Human Services Agency, Public Health Services, Community Health Statisitcs Unit Page 19

No. Rate* No. Rate* No. Rate* No. Rate* No. Rate* No. Rate* No. Rate* No. Rate* No. Rate* No. Rate* No. Rate*
San Diego County (Actual Rate) 1,086 35.1 982 31.5
San Diego County (Age‐Adjusted Rate) 1,086 34.6 982 31.3
Central Region 146 30.1 139 28.6
Central San Diego 87 52.5 78 47.0
Mid‐City 37 22.7 40 24.5
Southeast San Diego 22 14.1 21 13.4
East Region 184 39.7 173 37.1
Alpine 8 53.2 5 33.0
El Cajon 38 30.5 26 20.8
Harbison Crest/El Cajon** 63 45.3 52 37.1
Jamul 11 58.0 <5 §
La Mesa 32 54.2 48 80.0
Laguna‐Pine Valley <5 § <5 §
Lakeside 18 32.1 17 30.2
Lemon Grove 14 47.0 8 26.7
Mountain Empire <5 § <5 §
Santee 20 39.1 19 36.8
Spring Valley 13 16.0 16 19.6
North Central Region 213 35.3 199 32.6
Coastal 41 54.4 42 55.6
Del Mar‐Mira Mesa 30 19.0 38 24.0
Elliott‐Navajo 38 42.6 30 33.5
Kearny Mesa 65 43.0 61 40.2
Miramar <5 § <5 §
Peninsula 21 33.4 19 30.1
University 18 28.7 9 13.5
North Coastal Region 227 44.9 159 31.2
Carlsbad 66 57.5 54 46.6
Oceanside 72 45.1 51 31.9
Pendleton <5 § <5 §
San Dieguito 45 48.1 25 26.3
Vista 43 42.8 28 27.6
North Inland Region 232 40.7 223 38.8
Anza‐Borrego Springs 6 135.1 <5 §
Escondido 50 30.7 48 29.2
Fallbrook 20 42.3 17 35.5
North San Diego 36 33.8 58 53.9
Palomar‐Julian <5 § <5 §
Pauma <5 § <5 §
Poway 43 49.8 34 39.1
Ramona 26 74.6 22 62.1
San Marcos 34 37.8 26 28.8
Valley Center 10 42.9 12 51.2
South Region 84 17.9 89 19.0
Chula Vista 29 25.2 36 31.1
Coronado 5 20.2 6 25.7
National City 5 8.6 5 8.5
South Bay 29 21.5 33 24.4
Sweetwater 16 11.8 9 6.6Unknown <5 ‐‐‐ <5 ‐‐‐*Rates per 100,000 population. County age‐adjusted rates per 100,000 2000 US standard population.**Harbison Crest/El Cajon is an aggregation of the Harbison Crest and El Cajon SRAs. Due to geographic limitations, the Harbison Crest SRA is not shown alone. See the Data Guide for more information.†Chronic alcohol‐related disorder hospitaliza on refers to (principal diagnosis) ICD‐9 code 303.§Rates not calculated for fewer than 5 events. Rates not calculated in cases where zip code is unknown.Source: Patient Discharge Database (CA OSHPD), County of San Diego, Health & Human Services Agency, Public Health Services, Epidemiology & Immunization Services Branch; SANDAG, Current Population Estimates, 10/2012.Prepared by: County of San Diego, Health & Human Services Agency, Public Health Services, Community Health Statistics Unit, 2013.
Chronic Alcohol‐related Disorder† Hospitaliza ons Among San Diego County Residents by Loca on of Residence
Geography2010 Total 2011 Total 2012 Total 2013 Total 2014 Total 2015 Total 2016 Total 2017 Total 2018 Total 2019 Total 2020 Total
County of San Diego, Health & Human Services Agency, Public Health Services, Community Health Statisitcs Unit Page 20

No. Rate* No. Rate* No. Rate* No. Rate* No. Rate* No. Rate* No. Rate* No. Rate* No. Rate* No. Rate* No. Rate* No. Rate* No. Rate*
San Diego County (Actual Rate) 1,086 35.1 654 42.1 432 28.0 842 56.1 37 25.2 118 11.9 <5 § 15 13.0 <5 § 85 17.1 390 43.7 530 69.7 79 22.5
San Diego County (Age‐Adjusted Rate) 1,086 34.6
Central Region 146 30.1 97 39.2 49 20.7 104 72.4 11 19.4 21 10.3 <5 § <5 § <5 § 12 14.4 57 35.3 68 63.7 9 20.8
Central San Diego 87 52.5 55 60.8 32 42.6 66 80.2 <5 § 11 19.1 <5 § <5 § <5 § <5 § 33 47.3 43 113.3 7 45.0
Mid‐City 37 22.7 23 28.3 14 17.1 27 58.1 <5 § 7 10.2 <5 § <5 § <5 § 7 21.0 16 31.7 13 39.7 <5 §
Southeast San Diego 22 14.1 19 25.0 <5 § 11 73.8 8 30.9 <5 § <5 § <5 § <5 § <5 § 8 19.4 12 33.3 <5 §
East Region 184 39.7 103 45.2 81 34.5 142 50.8 9 33.9 20 17.3 <5 § <5 § <5 § 10 14.6 77 63.5 89 69.8 8 14.3
Alpine 8 53.2 <5 § <5 § 7 59.3 <5 § <5 § <5 § <5 § <5 § <5 § <5 § <5 § <5 §
El Cajon 38 30.5 22 36.1 16 25.2 31 42.1 <5 § <5 § <5 § <5 § <5 § <5 § 10 30.3 23 72.6 <5 §
Harbison Crest/El Cajon** 63 45.3 38 55.7 25 35.2 53 62.1 <5 § <5 § <5 § <5 § <5 § <5 § 21 58.6 36 97.5 <5 §
Jamul 11 58.0 9 82.6 <5 § 8 76.3 <5 § <5 § <5 § <5 § <5 § <5 § 8 166.8 <5 § <5 §
La Mesa 32 54.2 16 56.8 16 51.8 25 67.5 <5 § 5 42.2 <5 § <5 § <5 § <5 § 14 82.0 17 110.7 <5 §
Laguna‐Pine Valley <5 § <5 § <5 § <5 § <5 § <5 § <5 § <5 § <5 § <5 § <5 § <5 § <5 §
Lakeside 18 32.1 7 25.3 11 38.8 14 34.3 <5 § <5 § <5 § <5 § <5 § <5 § 8 55.2 9 56.2 <5 §
Lemon Grove 14 47.0 6 41.4 8 52.2 5 52.8 <5 § 6 48.0 <5 § <5 § <5 § <5 § 9 112.2 5 65.4 <5 §
Mountain Empire <5 § <5 § <5 § <5 § <5 § <5 § <5 § <5 § <5 § <5 § <5 § <5 § <5 §
Santee 20 39.1 14 56.5 6 22.7 17 44.8 <5 § <5 § <5 § <5 § <5 § <5 § 8 57.7 8 54.2 <5 §
Spring Valley 13 16.0 5 12.7 8 19.2 9 23.5 <5 § <5 § <5 § <5 § <5 § <5 § <5 § 5 23.2 <5 §
North Central Region 213 35.3 141 46.1 72 24.1 169 46.3 <5 § 16 18.7 <5 § <5 § <5 § 22 21.4 84 43.8 92 64.4 14 19.5
Coastal 41 54.4 26 66.9 15 41.1 31 51.0 <5 § <5 § <5 § <5 § <5 § 5 44.9 19 68.6 15 91.2 <5 §
Del Mar‐Mira Mesa 30 19.0 19 24.0 11 14.0 26 34.2 <5 § <5 § <5 § <5 § <5 § 5 25.9 10 21.0 15 33.5 <5 §
Elliott‐Navajo 38 42.6 24 55.5 14 30.5 32 53.3 <5 § <5 § <5 § <5 § <5 § <5 § 17 67.5 15 66.7 <5 §
Kearny Mesa 65 43.0 42 55.7 23 30.3 50 59.3 <5 § 5 14.9 <5 § <5 § <5 § 7 29.7 24 48.3 28 78.6 6 31.5
Miramar <5 § <5 § <5 § <5 § <5 § <5 § <5 § <5 § <5 § <5 § <5 § <5 § <5 §
Peninsula 21 33.4 17 49.7 <5 § 15 31.3 <5 § <5 § <5 § <5 § <5 § <5 § 8 38.0 10 69.9 <5 §
University 18 28.7 13 41.8 5 15.8 15 45.6 <5 § <5 § <5 § <5 § <5 § <5 § 6 30.4 9 97.9 <5 §
North Coastal Region 227 44.9 129 50.0 98 39.5 189 63.2 12 82.6 13 9.0 <5 § <5 § <5 § 17 20.3 71 52.0 112 89.6 27 45.3
Carlsbad 66 57.5 39 69.9 27 45.8 53 62.8 <5 § <5 § <5 § <5 § <5 § 5 40.9 19 63.1 35 107.3 7 39.3
Oceanside 72 45.1 45 56.8 27 33.6 54 72.7 7 100.9 8 13.4 <5 § <5 § <5 § 5 19.7 27 60.4 36 92.0 <5 §
Pendleton <5 § <5 § <5 § <5 § <5 § <5 § <5 § <5 § <5 § <5 § <5 § <5 § <5 §
San Dieguito 45 48.1 21 45.6 24 50.5 41 55.9 <5 § <5 § <5 § <5 § <5 § 5 53.3 11 44.6 16 54.5 13 98.3
Vista 43 42.8 24 47.3 19 38.2 40 91.2 <5 § <5 § <5 § <5 § <5 § <5 § 13 45.3 25 106.1 <5 §
North Inland Region 232 40.7 131 46.7 101 34.9 188 59.7 <5 § 19 11.6 <5 § <5 § <5 § 20 25.9 74 49.9 119 78.1 18 24.9
Anza‐Borrego Springs 6 135.1 <5 § <5 § 5 178.4 <5 § <5 § <5 § <5 § <5 § <5 § <5 § <5 § <5 §
Escondido 50 30.7 31 38.3 19 23.1 39 54.9 <5 § 5 6.7 <5 § <5 § <5 § <5 § 17 37.6 27 70.3 <5 §
Fallbrook 20 42.3 11 46.7 9 37.9 13 47.6 <5 § <5 § <5 § <5 § <5 § <5 § 10 100.1 9 68.3 <5 §
North San Diego 36 33.8 17 33.0 19 34.5 32 51.1 <5 § <5 § <5 § <5 § <5 § 10 87.4 7 22.7 17 58.7 <5 §
Palomar‐Julian <5 § <5 § <5 § <5 § <5 § <5 § <5 § <5 § <5 § <5 § <5 § <5 § <5 §
Pauma <5 § <5 § <5 § <5 § <5 § <5 § <5 § <5 § <5 § <5 § <5 § <5 § <5 §
Poway 43 49.8 31 73.5 12 27.2 36 62.1 <5 § <5 § <5 § <5 § <5 § <5 § 11 52.9 19 70.7 9 83.2
Ramona 26 74.6 9 51.3 17 98.1 26 104.7 <5 § <5 § <5 § <5 § <5 § <5 § <5 § 22 199.7 <5 §
San Marcos 34 37.8 16 36.4 18 39.2 28 61.6 <5 § <5 § <5 § <5 § <5 § <5 § 16 63.4 17 83.4 <5 §
Valley Center 10 42.9 7 59.8 <5 § <5 § <5 § <5 § <5 § <5 § <5 § <5 § 6 129.2 <5 § <5 §
South Region 84 17.9 53 22.6 31 13.2 50 51.0 <5 § 29 10.4 <5 § <5 § <5 § <5 § 27 20.5 50 47.2 <5 §
Chula Vista 29 25.2 16 28.8 13 21.8 16 74.9 <5 § 12 14.8 <5 § <5 § <5 § <5 § 10 32.3 16 60.5 <5 §
Coronado 5 20.2 <5 § <5 § <5 § <5 § <5 § <5 § <5 § <5 § <5 § <5 § <5 § <5 §
National City 5 8.6 5 16.7 <5 § <5 § <5 § <5 § <5 § <5 § <5 § <5 § <5 § <5 § <5 §
South Bay 29 21.5 22 32.3 7 10.5 16 78.0 <5 § 11 11.9 <5 § <5 § <5 § <5 § 10 26.4 17 55.6 <5 §
Sweetwater 16 11.8 9 13.7 7 10.1 11 34.9 <5 § <5 § <5 § <5 § <5 § <5 § 5 12.3 10 31.3 <5 §Unknown <5 ‐‐‐ <5 ‐‐‐ <5 ‐‐‐ <5 ‐‐‐ <5 ‐‐‐ <5 ‐‐‐ <5 ‐‐‐ <5 ‐‐‐ <5 ‐‐‐ <5 ‐‐‐ <5 ‐‐‐ <5 ‐‐‐ <5 ‐‐‐*Rates per 100,000 population. County age‐adjusted rates per 100,000 2000 US standard population.**Harbison Crest/El Cajon is an aggregation of the Harbison Crest and El Cajon SRAs. Due to geographic limitations, the Harbison Crest SRA is not shown alone. See the Data Guide for more information.
***Numbers may not add up to totals due to unknown or missing details.
†Chronic alcohol‐related disorder hospitaliza on refers to (principal diagnosis) ICD‐9 code 303.
‡API includes Asian, Pacific Islander, Na ve Hawaiian. Other includes 2 or more races, Na ve American/Alaska Na ve, American Indian, or other.
§Rates not calculated for fewer than 5 events. Rates not calculated in cases where zip code is unknown.
Source: Patient Discharge Database (CA OSHPD), County of San Diego, Health & Human Services Agency, Public Health Services, Epidemiology & Immunization Services Branch; SANDAG, Current Population Estimates, 10/2012.
Prepared by: County of San Diego, Health & Human Services Agency, Public Health Services, Community Health Statistics Unit, 2013.
Ages 0‐14 Ages 15‐24 Ages 25‐44 Ages 45‐64 Ages 65+
Chronic Alcohol‐related Disorder† Hospitaliza ons Among San Diego County Residents by Loca on of Residence, 2010 Detail
Geography2010 Total
Gender Race/Ethnicity Age Group
Male Female White Black Hispanic API‡ Other‡
County of San Diego, Health & Human Services Agency, Public Health Services, Community Health Statisitcs Unit Page 21

No. Rate* No. Rate* No. Rate* No. Rate* No. Rate* No. Rate* No. Rate* No. Rate* No. Rate* No. Rate* No. Rate* No. Rate* No. Rate*
San Diego County (Actual Rate) 982 31.5 554 35.4 428 27.6 724 48.4 32 22.4 128 12.7 8 2.3 36 30.6 <5 § 63 12.6 393 44.1 458 59.4 68 18.8
San Diego County (Age‐Adjusted Rate) 982 31.3
Central Region 139 28.6 100 40.3 39 16.4 88 61.8 13 23.7 26 12.5 <5 § 5 31.2 <5 § 7 8.7 69 42.4 52 47.9 11 25.0
Central San Diego 78 47.0 55 60.7 23 30.5 46 56.2 6 54.0 17 29.0 <5 § <5 § <5 § <5 § 47 66.7 26 67.2 <5 §
Mid‐City 40 24.5 31 38.1 9 11.0 32 69.9 <5 § <5 § <5 § <5 § <5 § <5 § 15 29.6 12 35.8 9 69.7
Southeast San Diego 21 13.4 14 18.4 7 8.7 10 67.9 <5 § 6 7.5 <5 § <5 § <5 § <5 § 7 16.9 14 38.5 <5 §
East Region 173 37.1 95 41.3 78 32.9 123 44.1 8 30.7 25 21.0 <5 § 12 56.0 <5 § 9 13.0 66 54.6 83 64.5 15 25.6
Alpine 5 33.0 <5 § <5 § 5 42.5 <5 § <5 § <5 § <5 § <5 § <5 § <5 § <5 § <5 §
El Cajon 26 20.8 17 27.7 9 14.1 16 21.8 <5 § 7 20.6 <5 § <5 § <5 § <5 § 11 33.2 12 37.5 <5 §
Harbison Crest/El Cajon** 52 37.1 32 46.6 20 28.0 38 44.6 <5 § 8 22.1 <5 § <5 § <5 § <5 § 20 55.7 24 64.4 5 28.2
Jamul <5 § <5 § <5 § <5 § <5 § <5 § <5 § <5 § <5 § <5 § <5 § <5 § <5 §
La Mesa 48 80.0 24 83.8 24 76.5 35 93.9 <5 § 7 56.8 <5 § <5 § <5 § 5 61.2 18 103.1 21 133.9 <5 §
Laguna‐Pine Valley <5 § <5 § <5 § <5 § <5 § <5 § <5 § <5 § <5 § <5 § <5 § <5 § <5 §
Lakeside 17 30.2 8 28.7 9 31.6 12 29.4 <5 § <5 § <5 § <5 § <5 § <5 § <5 § 12 74.0 <5 §
Lemon Grove 8 26.7 6 41.2 <5 § <5 § <5 § <5 § <5 § <5 § <5 § <5 § <5 § 7 90.9 <5 §
Mountain Empire <5 § <5 § <5 § <5 § <5 § <5 § <5 § <5 § <5 § <5 § <5 § <5 § <5 §
Santee 19 36.8 10 40.0 9 33.7 15 39.3 <5 § <5 § <5 § <5 § <5 § <5 § 12 87.6 6 40.0 <5 §
Spring Valley 16 19.6 8 20.1 8 19.1 10 26.1 <5 § <5 § <5 § <5 § <5 § <5 § 6 28.5 8 36.8 <5 §
North Central Region 199 32.6 103 33.4 96 31.9 155 42.4 <5 § 14 16.0 <5 § 11 41.3 <5 § 13 12.6 81 41.8 92 63.7 13 17.6
Coastal 42 55.6 19 48.8 23 62.8 36 59.4 <5 § <5 § <5 § <5 § <5 § <5 § 19 68.2 18 109.7 <5 §
Del Mar‐Mira Mesa 38 24.0 20 25.2 18 22.8 27 35.6 <5 § <5 § <5 § 5 69.3 <5 § <5 § 22 47.2 13 28.4 <5 §
Elliott‐Navajo 30 33.5 16 36.9 14 30.4 20 33.4 <5 § <5 § <5 § <5 § <5 § <5 § 7 27.6 17 75.2 <5 §
Kearny Mesa 61 40.2 35 46.3 26 34.2 48 57.2 <5 § 5 14.7 <5 § <5 § <5 § <5 § 22 43.4 32 88.5 5 25.8
Miramar <5 § <5 § <5 § <5 § <5 § <5 § <5 § <5 § <5 § <5 § <5 § <5 § <5 §
Peninsula 19 30.1 7 20.4 12 41.8 16 33.5 <5 § <5 § <5 § <5 § <5 § <5 § 8 37.5 9 63.2 <5 §
University 9 13.5 6 18.2 <5 8.9 8 23.4 <5 § <5 § <5 § <5 § <5 § <5 § <5 § <5 § <5 §
North Coastal Region 159 31.2 89 34.3 70 28.0 126 42.1 <5 § 15 10.2 <5 § <5 § <5 § 11 13.0 67 49.1 71 56.0 10 16.2
Carlsbad 54 46.6 24 42.6 30 50.4 35 41.3 <5 § 8 46.6 <5 § <5 § <5 § <5 § 18 60.8 29 87.5 5 27.1
Oceanside 51 31.9 36 45.3 15 18.6 48 65.1 <5 § <5 § <5 § <5 § <5 § <5 § 29 64.9 16 40.7 <5 §
Pendleton <5 § <5 § <5 § <5 § <5 § <5 § <5 § <5 § <5 § <5 § <5 § <5 § <5 §
San Dieguito 25 26.3 13 27.9 12 24.9 20 27.0 <5 § <5 § <5 § <5 § <5 § <5 § 10 40.9 12 40.3 <5 §
Vista 28 27.6 15 29.3 13 25.9 22 50.4 <5 § 5 10.5 <5 § <5 § <5 § <5 § 9 31.1 14 58.1 <5 §
North Inland Region 223 38.8 117 41.3 106 36.4 185 58.9 <5 § 14 8.3 <5 § 8 37.1 <5 § 18 22.6 68 46.3 121 78.3 16 21.4
Anza‐Borrego Springs <5 § <5 § <5 § <5 § <5 § <5 § <5 § <5 § <5 § <5 § <5 § <5 § <5 §
Escondido 48 29.2 26 31.9 22 26.6 38 53.9 <5 § 7 9.2 <5 § <5 § <5 § <5 § 17 37.6 21 53.7 6 33.7
Fallbrook 17 35.5 5 21.0 12 50.0 15 55.1 <5 § <5 § <5 § <5 § <5 § <5 § <5 § 11 83.7 <5 §
North San Diego 58 53.9 32 61.5 26 46.8 53 84.4 <5 § <5 § <5 § <5 § <5 § <5 § 18 59.1 33 111.8 <5 §
Palomar‐Julian <5 § <5 § <5 § <5 § <5 § <5 § <5 § <5 § <5 § <5 § <5 § <5 § <5 §
Pauma <5 § <5 § <5 § <5 § <5 § <5 § <5 § <5 § <5 § <5 § <5 § <5 § <5 §
Poway 34 39.1 19 44.8 15 33.7 27 46.6 <5 § <5 § <5 § <5 § <5 § 5 45.6 9 44.7 19 69.5 <5 §
Ramona 22 62.1 11 61.8 11 62.4 20 79.9 <5 § <5 § <5 § <5 § <5 § <5 § 6 75.9 13 116.1 <5 §
San Marcos 26 28.8 14 31.7 12 26.0 20 44.5 <5 § <5 § <5 § <5 § <5 § <5 § 8 32.1 15 72.5 <5 §
Valley Center 12 51.2 6 51.0 6 51.3 9 60.7 <5 § <5 § <5 § <5 § <5 § <5 § 5 110.9 6 78.4 <5 §
South Region 89 19.0 50 21.4 39 16.5 47 48.9 <5 § 34 12.1 <5 § <5 § <5 § 5 6.2 42 32.2 39 36.1 <5 §
Chula Vista 36 31.1 21 37.6 15 25.0 23 109.9 <5 § 12 14.5 <5 § <5 § <5 § <5 § 18 58.3 15 55.7 <5 §
Coronado 6 25.7 <5 § <5 § <5 § <5 § <5 § <5 § <5 § <5 § <5 § <5 § <5 § <5 §
National City 5 8.5 5 16.7 <5 § <5 § <5 § <5 § <5 § <5 § <5 § <5 § <5 § <5 § <5 §
South Bay 33 24.4 19 27.9 14 20.9 12 59.7 <5 § 16 17.2 <5 § <5 § <5 § <5 § 20 53.2 12 38.8 <5 §
Sweetwater 9 6.6 <5 § 6 8.6 6 19.1 <5 § <5 § <5 § <5 § <5 § <5 § <5 § 6 18.2 <5 §Unknown <5 ‐‐‐ <5 ‐‐‐ <5 ‐‐‐ <5 ‐‐‐ <5 ‐‐‐ <5 ‐‐‐ <5 ‐‐‐ <5 ‐‐‐ <5 ‐‐‐ <5 ‐‐‐ <5 ‐‐‐ <5 ‐‐‐ <5 ‐‐‐*Rates per 100,000 population. County age‐adjusted rates per 100,000 2000 US standard population.**Harbison Crest/El Cajon is an aggregation of the Harbison Crest and El Cajon SRAs. Due to geographic limitations, the Harbison Crest SRA is not shown alone. See the Data Guide for more information.
***Numbers may not add up to totals due to unknown or missing details.
†Chronic alcohol‐related disorder hospitaliza on refers to (principal diagnosis) ICD‐9 code 303.
‡API includes Asian, Pacific Islander, Na ve Hawaiian. Other includes 2 or more races, Na ve American/Alaska Na ve, American Indian, or other.
§Rates not calculated for fewer than 5 events. Rates not calculated in cases where zip code is unknown.
Source: Patient Discharge Database (CA OSHPD), County of San Diego, Health & Human Services Agency, Public Health Services, Epidemiology & Immunization Services Branch; SANDAG, Current Population Estimates, 10/2012.
Prepared by: County of San Diego, Health & Human Services Agency, Public Health Services, Community Health Statistics Unit, 2013.
Gender Race/Ethnicity Age Group
Male Female White Black Hispanic Ages 65+API‡ Other‡ Ages 0‐14 Ages 15‐24 Ages 25‐44 Ages 45‐64Geography2011 Total
Chronic Alcohol‐related Disorder† Hospitaliza ons Among San Diego County Residents by Loca on of Residence, 2011 Detail
County of San Diego, Health & Human Services Agency, Public Health Services, Community Health Statisitcs Unit Page 22

No. Rate* No. Rate* No. Rate* No. Rate* No. Rate* No. Rate* No. Rate* No. Rate* No. Rate* No. Rate* No. Rate*
San Diego County (Actual Rate) 1,778 57.4 1,918 61.6
San Diego County (Age‐Adjusted Rate) 1,778 56.6 1,918 61.2
Central Region 538 111.1 516 106.3
Central San Diego 412 248.8 403 242.8
Mid‐City 64 39.3 61 37.4
Southeast San Diego 62 39.8 52 33.2
East Region 234 50.5 254 54.4
Alpine 8 53.2 <5 §
El Cajon 38 30.5 49 39.1
Harbison Crest/El Cajon** 71 51.0 80 57.1
Jamul 9 47.5 6 34.1
La Mesa 44 74.5 74 123.4
Laguna‐Pine Valley <5 § <5 §
Lakeside 24 42.8 36 63.9
Lemon Grove 27 90.6 14 46.7
Mountain Empire <5 § <5 §
Santee 28 54.7 17 32.9
Spring Valley 21 25.9 21 25.7
North Central Region 252 41.7 319 52.3
Coastal 66 87.6 80 105.9
Del Mar‐Mira Mesa 21 13.3 25 15.8
Elliott‐Navajo 50 56.1 30 33.5
Kearny Mesa 82 54.2 114 75.2
Miramar <5 § <5 §
Peninsula 25 39.7 58 92.0
University 8 12.8 12 18.0
North Coastal Region 222 43.9 244 47.9
Carlsbad 50 43.6 29 25.0
Oceanside 78 48.8 105 65.6
Pendleton <5 § <5 §
San Dieguito 52 55.6 53 55.9
Vista 42 41.8 57 56.3
North Inland Region 123 21.6 129 22.5
Anza‐Borrego Springs <5 § <5 §
Escondido 45 27.6 57 34.7
Fallbrook 14 29.6 7 14.6
North San Diego 15 14.1 20 18.6
Palomar‐Julian <5 § <5 §
Pauma <5 § <5 §
Poway 11 12.7 8 9.2
Ramona 12 34.4 5 14.1
San Marcos 21 23.3 29 32.2
Valley Center <5 § <5 §
South Region 174 37.1 169 36.0
Chula Vista 99 85.9 95 82.0
Coronado 11 44.5 10 42.9
National City 18 30.9 17 29.1
South Bay 38 28.2 39 28.9
Sweetwater 8 5.9 8 5.9Unknown 235 ‐‐‐ 287 ‐‐‐*Rates per 100,000 population. County age‐adjusted rates per 100,000 2000 US standard population.**Harbison Crest/El Cajon is an aggregation of the Harbison Crest and El Cajon SRAs. Due to geographic limitations, the Harbison Crest SRA is not shown alone. See the Data Guide for more information.†Chronic alcohol‐related disorder Emergency Department Discharge refers to (principal diagnosis) ICD‐9 code 303.§Rates not calculated for fewer than 5 events. Rates not calculated in cases where zip code is unknown.Source: Emergency Department Discharge Database (CA OSHPD), County of San Diego, Health & Human Services Agency, Public Health Services, Emergency Medical Services; SANDAG, Current Population Estimates, 10/2012.Prepared by: County of San Diego, Health & Human Services Agency, Public Health Services, Community Health Statistics Unit, 2013.
Chronic Alcohol‐related Disorder† Emergency Department Discharges Among San Diego County Residents by Loca on of Residence
Geography2010 Total 2011 Total 2012 Total 2013 Total 2014 Total 2015 Total 2016 Total 2017 Total 2018 Total 2019 Total 2020 Total
County of San Diego, Health & Human Services Agency, Public Health Services, Community Health Statisitcs Unit Page 23

No. Rate* No. Rate* No. Rate* No. Rate* No. Rate* No. Rate* No. Rate* No. Rate* No. Rate* No. Rate* No. Rate* No. Rate* No. Rate*
San Diego County (Actual Rate) 1,778 57.4 1,278 82.3 500 32.4 1,398 93.2 92 62.8 233 23.5 9 2.6 30 25.9 <5 § 57 11.5 559 62.7 1,087 143.0 71 20.2
San Diego County (Age‐Adjusted Rate) 1,778 56.6
Central Region 538 111.1 417 168.4 121 51.1 418 291.0 51 90.0 49 24.0 <5 § 11 69.4 <5 § 9 10.8 153 94.8 343 321.4 32 73.9
Central San Diego 412 248.8 328 362.4 84 111.9 350 425.3 28 243.9 22 38.2 <5 § 6 105.7 <5 § 6 26.1 107 153.4 276 727.3 22 141.6
Mid‐City 64 39.3 41 50.5 23 28.1 48 103.3 <5 § 8 11.7 <5 § 5 95.2 <5 § <5 § 21 41.7 36 109.9 7 54.8
Southeast San Diego 62 39.8 48 63.2 14 17.5 20 134.2 22 85.0 19 24.3 <5 § <5 § <5 § <5 § 25 60.5 31 86.1 <5 §
East Region 234 50.5 153 67.1 81 34.5 186 66.6 12 45.2 27 23.4 <5 § 6 28.6 <5 § 10 14.6 80 66.0 140 109.9 <5 §
Alpine 8 53.2 <5 § 6 79.2 8 67.7 <5 § <5 § <5 § <5 § <5 § <5 § <5 § 5 102.7 <5 §
El Cajon 38 30.5 24 39.4 14 22.0 32 43.4 <5 § <5 § <5 § <5 § <5 § <5 § 12 36.4 22 69.4 <5 §
Harbison Crest/El Cajon** 71 51.0 46 67.4 25 35.2 55 64.5 5 70.2 8 22.7 <5 § <5 § <5 § <5 § 23 64.2 43 116.4 <5 §
Jamul 9 47.5 5 45.9 <5 § 7 66.8 <5 § <5 § <5 § <5 § <5 § <5 § 5 104.3 <5 § <5 §
La Mesa 44 74.5 34 120.6 10 32.4 38 102.6 <5 § <5 § <5 § <5 § <5 § <5 § 13 76.1 31 201.8 <5 §
Laguna‐Pine Valley <5 § <5 § <5 § <5 § <5 § <5 § <5 § <5 § <5 § <5 § <5 § <5 § <5 §
Lakeside 24 42.8 14 50.5 10 35.3 19 46.5 <5 § <5 § <5 § <5 § <5 § <5 § 9 62.1 14 87.4 <5 §
Lemon Grove 27 90.6 22 151.7 5 32.7 21 221.8 <5 § <5 § <5 § <5 § <5 § <5 § 11 137.1 14 183.2 <5 §
Mountain Empire <5 § <5 § <5 § <5 § <5 § <5 § <5 § <5 § <5 § <5 § <5 § <5 § <5 §
Santee 28 54.7 13 52.5 15 56.9 22 57.9 <5 § <5 § <5 § <5 § <5 § <5 § 9 64.9 16 108.5 <5 §
Spring Valley 21 25.9 15 38.1 6 14.4 14 36.6 <5 § <5 § <5 § <5 § <5 § <5 § 7 33.2 12 55.6 <5 §
North Central Region 252 41.7 162 53.0 90 30.2 221 60.5 5 26.6 21 24.5 <5 § <5 § <5 § 10 9.7 87 45.3 143 100.0 10 13.9
Coastal 66 87.6 42 108.1 24 65.7 59 97.0 <5 § 5 62.1 <5 § <5 § <5 § <5 § 20 72.2 43 261.4 <5 §
Del Mar‐Mira Mesa 21 13.3 15 19.0 6 7.6 16 21.1 <5 § <5 § <5 § <5 § <5 § <5 § <5 § 12 26.8 <5 §
Elliott‐Navajo 50 56.1 33 76.3 17 37.1 49 81.5 <5 § <5 § <5 § <5 § <5 § <5 § 21 83.4 27 120.1 <5 §
Kearny Mesa 82 54.2 47 62.4 35 46.1 68 80.6 <5 § 11 32.8 <5 § <5 § <5 § <5 § 29 58.3 46 129.1 <5 §
Miramar <5 § <5 § <5 § <5 § <5 § <5 § <5 § <5 § <5 § <5 § <5 § <5 § <5 §
Peninsula 25 39.7 21 61.4 <5 § 23 48.0 <5 § <5 § <5 § <5 § <5 § <5 § 11 52.3 10 69.9 <5 §
University 8 12.8 <5 § <5 § 6 18.2 <5 § <5 § <5 § <5 § <5 § <5 § <5 § 5 54.4 <5 §
North Coastal Region 222 43.9 124 48.1 98 39.5 175 58.5 6 41.3 38 26.4 <5 § <5 § <5 § 10 11.9 90 65.9 115 92.0 7 11.7
Carlsbad 50 43.6 22 39.4 28 47.5 46 54.5 <5 § <5 § <5 § <5 § <5 § <5 § 22 73.1 24 73.6 <5 §
Oceanside 78 48.8 49 61.8 29 36.0 57 76.8 <5 § 17 28.4 <5 § <5 § <5 § <5 § 28 62.7 46 117.6 <5 §
Pendleton <5 § <5 § <5 § <5 § <5 § <5 § <5 § <5 § <5 § <5 § <5 § <5 § <5 §
San Dieguito 52 55.6 31 67.4 21 44.2 45 61.4 <5 § 7 55.8 <5 § <5 § <5 § <5 § 21 85.1 24 81.8 <5 §
Vista 42 41.8 22 43.4 20 40.2 27 61.6 <5 § 13 27.9 <5 § <5 § <5 § <5 § 19 66.2 21 89.1 <5 §
North Inland Region 123 21.6 74 26.4 49 17.0 98 31.1 <5 § 20 12.2 <5 § <5 § <5 § 10 13.0 33 22.2 76 49.9 <5 §
Anza‐Borrego Springs <5 § <5 § <5 § <5 § <5 § <5 § <5 § <5 § <5 § <5 § <5 § <5 § <5 §
Escondido 45 27.6 27 33.4 18 21.9 35 49.2 <5 § 7 9.4 <5 § <5 § <5 § <5 § 15 33.1 26 67.7 <5 §
Fallbrook 14 29.6 8 34.0 6 25.3 11 40.3 <5 § <5 § <5 § <5 § <5 § <5 § <5 § 8 60.7 <5 §
North San Diego 15 14.1 11 21.4 <5 § 13 20.7 <5 § <5 § <5 § <5 § <5 § <5 § <5 § 11 38.0 <5 §
Palomar‐Julian <5 § <5 § <5 § <5 § <5 § <5 § <5 § <5 § <5 § <5 § <5 § <5 § <5 §
Pauma <5 § <5 § <5 § <5 § <5 § <5 § <5 § <5 § <5 § <5 § <5 § <5 § <5 §
Poway 11 12.7 <5 § 7 15.9 10 17.3 <5 § <5 § <5 § <5 § <5 § <5 § <5 § <5 § <5 §
Ramona 12 34.4 <5 § 8 46.1 12 48.3 <5 § <5 § <5 § <5 § <5 § <5 § <5 § 8 72.6 <5 §
San Marcos 21 23.3 16 36.4 5 10.9 14 30.8 <5 § 7 21.5 <5 § <5 § <5 § <5 § <5 § 17 83.4 <5 §
Valley Center <5 § <5 § <5 § <5 § <5 § <5 § <5 § <5 § <5 § <5 § <5 § <5 § <5 §
South Region 174 37.1 137 58.5 37 15.8 107 109.0 6 30.5 56 20.2 <5 § <5 § <5 § <5 § 46 34.9 115 108.5 9 18.5
Chula Vista 99 85.9 76 136.8 23 38.5 67 313.6 <5 § 26 32.0 <5 § <5 § <5 § <5 § 28 90.4 67 253.2 <5 §
Coronado 11 44.5 5 34.4 6 59.1 9 50.2 <5 § <5 § <5 § <5 § <5 § <5 § <5 § 7 139.4 <5 §
National City 18 30.9 16 53.3 <5 § 6 88.3 <5 § 11 29.6 <5 § <5 § <5 § <5 § <5 § 12 100.1 <5 §
South Bay 38 28.2 34 50.0 <5 § 19 92.6 <5 § 16 17.3 <5 § <5 § <5 § <5 § 8 21.1 23 75.2 5 38.7
Sweetwater 8 5.9 6 9.1 <5 § 6 19.0 <5 § <5 § <5 § <5 § <5 § <5 § <5 § 6 18.8 <5 §Unknown 235 ‐‐‐ 211 ‐‐‐ 24 ‐‐‐ 193 ‐‐‐ 12 ‐‐‐ 22 ‐‐‐ <5 ‐‐‐ <5 ‐‐‐ <5 ‐‐‐ <5 ‐‐‐ 70 ‐‐‐ 155 ‐‐‐ 6 ‐‐‐*Rates per 100,000 population. County age‐adjusted rates per 100,000 2000 US standard population.**Harbison Crest/El Cajon is an aggregation of the Harbison Crest and El Cajon SRAs. Due to geographic limitations, the Harbison Crest SRA is not shown alone. See the Data Guide for more information.
***Numbers may not add up to totals due to unknown or missing details.
†Chronic alcohol‐related disorder Emergency Department Discharge refers to (principal diagnosis) ICD‐9 code 303.
‡API includes Asian, Pacific Islander, Na ve Hawaiian. Other includes 2 or more races, Na ve American/Alaska Na ve, American Indian, or other.
§Rates not calculated for fewer than 5 events. Rates not calculated in cases where zip code is unknown.
Source: Emergency Department Discharge Database (CA OSHPD), County of San Diego, Health & Human Services Agency, Public Health Services, Emergency Medical Services; SANDAG, Current Population Estimates, 10/2012.
Prepared by: County of San Diego, Health & Human Services Agency, Public Health Services, Community Health Statistics Unit, 2013.
Ages 0‐14 Ages 15‐24 Ages 25‐44 Ages 45‐64 Ages 65+
Chronic Alcohol‐related Disorder† Emergency Department Discharges Among San Diego County Residents by Loca on of Residence, 2010 Detail
Geography2010 Total
Gender Race/Ethnicity Age Group
Male Female White Black Hispanic API‡ Other‡
County of San Diego, Health & Human Services Agency, Public Health Services, Community Health Statisitcs Unit Page 24

No. Rate* No. Rate* No. Rate* No. Rate* No. Rate* No. Rate* No. Rate* No. Rate* No. Rate* No. Rate* No. Rate* No. Rate* No. Rate*
San Diego County (Actual Rate) 1,918 61.6 1,363 87.2 555 35.7 1,488 99.5 78 54.6 267 26.4 7 2.0 52 44.1 <5 § 43 8.6 611 68.6 1,156 149.9 106 29.3
San Diego County (Age‐Adjusted Rate) 1,918 61.2
Central Region 516 106.3 378 152.4 138 58.1 405 284.6 45 82.0 49 23.6 <5 § 11 68.6 <5 § 6 7.5 122 75.0 357 328.9 29 65.8
Central San Diego 403 242.8 301 332.3 102 135.3 342 417.8 24 215.9 26 44.3 <5 § 8 139.5 <5 § <5 § 93 132.1 283 731.9 22 137.1
Mid‐City 61 37.4 40 49.2 21 25.6 39 85.2 10 53.2 7 10.1 <5 § <5 § <5 § <5 § 17 33.5 39 116.5 <5 §
Southeast San Diego 52 33.2 37 48.5 15 18.7 24 163.1 11 44.1 16 20.1 <5 § <5 § <5 § <5 § 12 28.9 35 96.2 <5 §
East Region 254 54.4 169 73.5 85 35.9 192 68.8 <5 § 32 26.9 <5 § 19 88.7 <5 § 6 8.6 106 87.7 128 99.5 14 23.9
Alpine <5 § <5 § <5 § <5 § <5 § <5 § <5 § <5 § <5 § <5 § <5 § <5 § <5 §
El Cajon 49 39.1 34 55.4 15 23.5 30 40.8 <5 § 12 35.3 <5 § 6 94.2 <5 § <5 § 29 87.6 18 56.2 <5 §
Harbison Crest/El Cajon** 80 57.1 55 80.0 25 35.1 51 59.9 <5 § 17 47.0 <5 § 10 144.9 <5 § <5 § 39 108.7 37 99.3 <5 §
Jamul 6 34.1 <5 § <5 § 6 62.8 <5 § <5 § <5 § <5 § <5 § <5 § <5 § <5 § <5 §
La Mesa 74 123.4 49 171.2 25 79.7 60 160.9 <5 § <5 § <5 § <5 § <5 § <5 § 33 188.9 35 223.1 6 67.8
Laguna‐Pine Valley <5 § <5 § <5 § <5 § <5 § <5 § <5 § <5 § <5 § <5 § <5 § <5 § <5 §
Lakeside 36 63.9 25 89.7 11 38.6 28 68.5 <5 § <5 § <5 § 5 187.8 <5 § <5 § 10 69.5 23 141.9 <5 §
Lemon Grove 14 46.7 13 89.3 <5 § 10 106.9 <5 § <5 § <5 § <5 § <5 § <5 § <5 § 11 142.8 <5 §
Mountain Empire <5 § <5 § <5 § <5 § <5 § <5 § <5 § <5 § <5 § <5 § <5 § <5 § <5 §
Santee 17 32.9 10 40.0 7 26.2 16 41.9 <5 § <5 § <5 § <5 § <5 § <5 § 11 80.3 6 40.0 <5 §
Spring Valley 21 25.7 10 25.1 11 26.2 15 39.2 <5 § <5 § <5 § <5 § <5 § <5 § 7 33.3 11 50.5 <5 §
North Central Region 319 52.3 231 74.9 88 29.2 286 78.3 6 32.1 19 21.7 <5 § 5 18.8 <5 § 11 10.6 97 50.1 183 126.7 28 38.0
Coastal 80 105.9 51 131.0 29 79.2 73 120.4 <5 § <5 § <5 § <5 § <5 § 5 45.3 19 68.2 51 310.8 5 39.6
Del Mar‐Mira Mesa 25 15.8 21 26.4 <5 § 20 26.4 <5 § <5 § <5 § <5 § <5 § <5 § 11 23.6 12 26.2 <5 §
Elliott‐Navajo 30 33.5 20 46.1 10 21.7 26 43.4 <5 § <5 § <5 § <5 § <5 § <5 § 10 39.4 20 88.5 <5 §
Kearny Mesa 114 75.2 81 107.2 33 43.3 101 120.3 <5 § 9 26.4 <5 § <5 § <5 § 5 22.7 28 55.2 68 188.1 13 67.1
Miramar <5 § <5 § <5 § <5 § <5 § <5 § <5 § <5 § <5 § <5 § <5 § <5 § <5 §
Peninsula 58 92.0 <5 § 6 20.9 54 113.2 <5 § <5 § <5 § <5 § <5 § <5 § 25 117.2 25 175.6 7 96.7
University 12 18.0 6 18.2 6 17.9 12 35.1 <5 § <5 § <5 § <5 § <5 § <5 § <5 § 7 75.3 <5 §
North Coastal Region 244 47.9 152 58.5 92 36.8 192 64.2 <5 § 40 27.3 <5 § 6 32.0 <5 § 9 10.7 101 74.0 125 98.6 9 14.6
Carlsbad 29 25.0 11 19.5 18 30.2 25 29.5 <5 § <5 § <5 § <5 § <5 § <5 § 13 43.9 14 42.2 <5 §
Oceanside 105 65.6 63 79.3 42 52.1 78 105.8 <5 § 22 36.2 <5 § <5 § <5 § <5 § 46 103.0 54 137.4 <5 §
Pendleton <5 § <5 § <5 § <5 § <5 § <5 § <5 § <5 § <5 § <5 § <5 § <5 § <5 §
San Dieguito 53 55.9 33 70.7 20 41.5 46 62.2 <5 § 6 46.2 <5 § <5 § <5 § 6 59.9 22 90.0 22 73.9 <5 §
Vista 57 56.3 45 88.0 12 23.9 43 98.6 <5 § 10 20.9 <5 § <5 § <5 § <5 § 20 69.1 35 145.3 <5 §
North Inland Region 129 22.5 84 29.7 45 15.4 102 32.5 <5 § 20 11.9 <5 § <5 § <5 § 6 7.5 30 20.4 86 55.7 7 9.4
Anza‐Borrego Springs <5 § <5 § <5 § <5 § <5 § <5 § <5 § <5 § <5 § <5 § <5 § <5 § <5 §
Escondido 57 34.7 34 41.7 23 27.8 47 66.6 <5 § 6 7.9 <5 § <5 § <5 § <5 § 15 33.1 40 102.2 <5 §
Fallbrook 7 14.6 <5 § <5 § 6 22.0 <5 § <5 § <5 § <5 § <5 § <5 § <5 § 6 45.7 <5 §
North San Diego 20 18.6 15 28.8 5 9.0 16 25.5 <5 § <5 § <5 § <5 § <5 § <5 § 6 19.7 12 40.7 <5 §
Palomar‐Julian <5 § <5 § <5 § <5 § <5 § <5 § <5 § <5 § <5 § <5 § <5 § <5 § <5 §
Pauma <5 § <5 § <5 § <5 § <5 § <5 § <5 § <5 § <5 § <5 § <5 § <5 § <5 §
Poway 8 9.2 5 11.8 <5 § 8 13.8 <5 § <5 § <5 § <5 § <5 § <5 § <5 § <5 § <5 §
Ramona 5 14.1 <5 § <5 § <5 § <5 § <5 § <5 § <5 § <5 § <5 § <5 § <5 § <5 §
San Marcos 29 32.2 26 58.9 <5 § 18 40.1 <5 § 11 33.1 <5 § <5 § <5 § <5 § 5 20.1 20 96.6 <5 §
Valley Center <5 § <5 § <5 § <5 § <5 § <5 § <5 § <5 § <5 § <5 § <5 § <5 § <5 §
South Region 169 36.0 117 50.1 52 22.1 98 101.9 6 31.9 61 21.7 <5 § <5 § <5 § <5 § 84 64.5 71 65.8 10 20.2
Chula Vista 95 82.0 69 123.6 26 43.3 53 253.2 <5 § 39 47.3 <5 § <5 § <5 § <5 § 57 184.5 33 122.5 <5 §
Coronado 10 42.9 7 52.4 <5 § 8 46.9 <5 § <5 § <5 § <5 § <5 § <5 § 7 116.5 <5 § <5 §
National City 17 29.1 14 46.7 <5 § 7 106.2 <5 § 7 18.6 <5 § <5 § <5 § <5 § <5 § 10 82.0 <5 §
South Bay 39 28.9 20 29.4 19 28.3 24 119.3 <5 § 13 13.9 <5 § <5 § <5 § <5 § 14 37.2 22 71.2 <5 §
Sweetwater 8 5.9 7 10.5 <5 § 6 19.1 <5 § <5 § <5 § <5 § <5 § <5 § <5 § <5 § <5 §Unknown 287 ‐‐‐ 232 ‐‐‐ 55 ‐‐‐ 213 ‐‐‐ 14 ‐‐‐ 46 ‐‐‐ <5 ‐‐‐ 7 ‐‐‐ <5 ‐‐‐ <5 ‐‐‐ 71 ‐‐‐ 206 ‐‐‐ 9 ‐‐‐* Rates per 100,000 population. County age‐adjusted rates per 100,000 2000 US standard population.
**Numbers may not add up to totals due to unknown or missing details.
† Chronic alcohol‐related disorder Emergency Department Discharge refers to (principal diagnosis) ICD‐9 code 303.
‡API includes Asian, Pacific Islander, Na ve Hawaiian. Other includes 2 or more races, Na ve American/Alaska Na ve, American Indian, or other.
§ Rates not calculated for fewer than 5 events. Rates not calculated in cases where zip code is unknown.
Source: Emergency Department Discharge Database (CA OSHPD), County of San Diego, Health & Human Services Agency, Public Health Services, Emergency Medical Services; SANDAG, Current Population Estimates, 10/2012.
Prepared by: County of San Diego, Health & Human Services Agency, Public Health Services, Community Health Statistics Unit, 2013.
Gender Race/Ethnicity Age Group
Male Female White Black Hispanic Ages 65+API‡ Other‡ Ages 0‐14 Ages 15‐24 Ages 25‐44 Ages 45‐64Geography2011 Total
Chronic Alcohol‐related Disorder† Emergency Department Discharges Among San Diego County Residents by Loca on of Residence, 2011 Detail
County of San Diego, Health & Human Services Agency, Public Health Services, Community Health Statisitcs Unit Page 25

Alzheimer’s Disease
County of San Diego, Health & Human Services Agency, Public Health Services, Community Health Statisitcs Unit Page 26

No. Rate* No. Rate* No. Rate* No. Rate* No. Rate* No. Rate* No. Rate* No. Rate* No. Rate* No. Rate* No. Rate*
San Diego County (Actual Rate) 1,195 38.6 1,221 39.2
San Diego County (Age‐Adjusted Rate) 1,195 37.2 1,221 36.5
Central Region 97 20.0 113 23.3
Central San Diego 35 21.1 36 21.7
Mid‐City 40 24.5 38 23.3
Southeast San Diego 22 14.1 39 24.9
East Region 185 39.9 186 39.9
Alpine 10 66.5 <5 §
El Cajon 57 45.8 45 35.9
Harbison Crest/El Cajon** 74 53.2 69 49.3
Jamul 8 42.2 7 39.8
La Mesa 41 69.4 45 75.0
Laguna‐Pine Valley <5 § <5 §
Lakeside 15 26.8 13 23.1
Lemon Grove 9 30.2 13 43.4
Mountain Empire <5 § <5 §
Santee 12 23.5 13 25.1
Spring Valley 15 18.5 21 25.7
North Central Region 223 36.9 220 36.1
Coastal 42 55.7 30 39.7
Del Mar‐Mira Mesa 32 20.3 28 17.7
Elliott‐Navajo 48 53.9 44 49.2
Kearny Mesa 63 41.7 76 50.1
Miramar <5 § <5 §
Peninsula 21 33.4 27 42.8
University 17 27.1 15 22.6
North Coastal Region 256 50.6 250 49.0
Carlsbad 49 42.7 58 50.1
Oceanside 82 51.3 74 46.2
Pendleton <5 § <5 §
San Dieguito 54 57.7 45 47.4
Vista 71 70.7 73 72.0
North Inland Region 305 53.6 300 52.2
Anza‐Borrego Springs <5 § 5 107.1
Escondido 127 77.9 112 68.2
Fallbrook 16 33.8 25 52.2
North San Diego 66 61.9 62 57.6
Palomar‐Julian <5 § <5 §
Pauma <5 § <5 §
Poway 47 54.5 35 40.3
Ramona 7 20.1 8 22.6
San Marcos 30 33.3 38 42.1
Valley Center 8 34.3 10 42.6
South Region 124 26.5 148 31.5
Chula Vista 66 57.3 65 56.1
Coronado 9 36.4 10 42.9
National City 18 30.9 21 35.9
South Bay 18 13.3 27 20.0
Sweetwater 13 9.6 25 18.3Unknown 5 ‐‐‐ <5 ‐‐‐*Rates per 100,000 population. County age‐adjusted rates per 100,000 2000 US standard population.**Harbison Crest/El Cajon is an aggregation of the Harbison Crest and El Cajon SRAs. Due to geographic limitations, the Harbison Crest SRA is not shown alone. See the Data Guide for more information.†Alzheimer's death refers to (underlying cause of death) ICD‐10 code G40.§Rates not calculated for fewer than 5 events. Rates not calculated in cases where zip code is unknown.Source: Death Statistical Master Files (CDPH), County of San Diego, Health & Human Services Agency, Public Health Services, Epidemiology & Immunization Services Branch; SANDAG, Current Population Estimates, 10/2012.Prepared by: County of San Diego, Health & Human Services Agency, Public Health Services, Community Health Statistics Unit, 2013.
Alzheimer's† Deaths Among San Diego County Residents by Location of Residence
Geography2010 Total 2011 Total 2012 Total 2013 Total 2014 Total 2015 Total 2016 Total 2017 Total 2018 Total 2019 Total 2020 Total
County of San Diego, Health & Human Services Agency, Public Health Services, Community Health Statisitcs Unit Page 27

No. Rate* No. Rate* No. Rate* No. Rate* No. Rate* No. Rate* No. Rate* No. Rate* No. Rate* No. Rate* No. Rate* No. Rate* No. Rate*
San Diego County (Actual Rate) 1,195 38.6 382 24.6 813 52.7 992 66.1 26 17.7 120 12.1 45 13.2 9 7.8 <5 § <5 § <5 § 12 1.6 1,183 336.6
San Diego County (Age‐Adjusted Rate) 1,195 37.2
Central Region 97 20.0 36 14.5 61 25.8 58 40.4 14 24.7 16 7.8 8 12.5 <5 § <5 § <5 § <5 § <5 § 95 219.5
Central San Diego 35 21.1 14 15.5 21 28.0 24 29.2 <5 § 6 10.4 <5 § <5 § <5 § <5 § <5 § <5 § 34 218.8
Mid‐City 40 24.5 16 19.7 24 29.3 27 58.1 <5 § 5 7.3 <5 § <5 § <5 § <5 § <5 § <5 § 40 312.9
Southeast San Diego 22 14.1 6 7.9 16 20.0 7 47.0 6 23.2 5 6.4 <5 § <5 § <5 § <5 § <5 § <5 § 21 140.4
East Region 185 39.9 52 22.8 133 56.6 163 58.4 <5 § 15 13.0 <5 § <5 § <5 § <5 § <5 § <5 § 184 328.9
Alpine 10 66.5 <5 § 7 92.4 10 84.7 <5 § <5 § <5 § <5 § <5 § <5 § <5 § <5 § 10 477.3
El Cajon 57 45.8 13 21.3 44 69.2 50 67.9 <5 § <5 § <5 § <5 § <5 § <5 § <5 § <5 § 56 381.8
Harbison Crest/El Cajon** 74 53.2 20 29.3 54 76.1 66 77.4 <5 § <5 § <5 § <5 § <5 § <5 § <5 § <5 § 73 426.7
Jamul 8 42.2 <5 § 7 86.9 6 57.2 <5 § <5 § <5 § <5 § <5 § <5 § <5 § <5 § 8 403.0
La Mesa 41 69.4 14 49.7 27 87.3 38 102.6 <5 § <5 § <5 § <5 § <5 § <5 § <5 § <5 § 41 477.0
Laguna‐Pine Valley <5 § <5 § <5 § <5 § <5 § <5 § <5 § <5 § <5 § <5 § <5 § <5 § <5 §
Lakeside 15 26.8 6 21.7 9 31.8 14 34.3 <5 § <5 § <5 § <5 § <5 § <5 § <5 § <5 § 15 248.7
Lemon Grove 9 30.2 <5 § 9 58.8 6 63.4 <5 § <5 § <5 § <5 § <5 § <5 § <5 § <5 § 9 271.7
Mountain Empire <5 § <5 § <5 § <5 § <5 § <5 § <5 § <5 § <5 § <5 § <5 § <5 § <5 §
Santee 12 23.5 <5 § 9 34.1 10 26.3 <5 § <5 § <5 § <5 § <5 § <5 § <5 § <5 § 12 209.9
Spring Valley 15 18.5 5 12.7 10 24.0 12 31.4 <5 § <5 § <5 § <5 § <5 § <5 § <5 § <5 § 15 159.4
North Central Region 223 36.9 64 20.9 159 53.3 200 54.8 5 26.6 7 8.2 9 8.3 <5 § <5 § <5 § <5 § <5 § 222 308.9
Coastal 42 55.7 9 23.2 33 90.3 39 64.1 <5 § <5 § <5 § <5 § <5 § <5 § <5 § <5 § 42 338.8
Del Mar‐Mira Mesa 32 20.3 12 15.2 20 25.5 25 32.9 <5 § <5 § 6 10.9 <5 § <5 § <5 § <5 § <5 § 32 235.1
Elliott‐Navajo 48 53.9 10 23.1 38 82.8 44 73.2 <5 § <5 § <5 § <5 § <5 § <5 § <5 § <5 § 47 353.8
Kearny Mesa 63 41.7 20 26.5 43 56.7 54 64.0 <5 § 5 14.9 <5 § <5 § <5 § <5 § <5 § <5 § 63 330.4
Miramar <5 § <5 § <5 § <5 § <5 § <5 § <5 § <5 § <5 § <5 § <5 § <5 § <5 §
Peninsula 21 33.4 <5 § 17 59.1 21 43.8 <5 § <5 § <5 § <5 § <5 § <5 § <5 § <5 § 21 290.5
University 17 27.1 9 29.0 8 25.3 17 51.6 <5 § <5 § <5 § <5 § <5 § <5 § <5 § <5 § 17 270.5
North Coastal Region 256 50.6 81 31.4 175 70.6 230 76.9 <5 § 16 11.1 6 20.0 <5 § <5 § <5 § <5 § 5 4.0 251 421.1
Carlsbad 49 42.7 13 23.3 36 61.1 42 49.8 <5 § <5 § <5 § <5 § <5 § <5 § <5 § <5 § 48 269.5
Oceanside 82 51.3 29 36.6 53 65.9 72 97.0 <5 § 5 8.3 <5 § <5 § <5 § <5 § <5 § <5 § 80 433.9
Pendleton <5 § <5 § <5 § <5 § <5 § <5 § <5 § <5 § <5 § <5 § <5 § <5 § <5 §
San Dieguito 54 57.7 16 34.8 38 80.0 51 69.5 <5 § <5 § <5 § <5 § <5 § <5 § <5 § <5 § 54 408.2
Vista 71 70.7 23 45.4 48 96.5 65 148.2 <5 § 5 10.7 <5 § <5 § <5 § <5 § <5 § <5 § 69 683.6
North Inland Region 305 53.6 109 38.9 196 67.8 267 84.8 <5 § 23 14.0 12 20.3 <5 § <5 § <5 § <5 § <5 § 304 421.3
Anza‐Borrego Springs <5 § <5 § <5 § <5 § <5 § <5 § <5 § <5 § <5 § <5 § <5 § <5 § <5 §
Escondido 127 77.9 44 54.4 83 101.0 109 153.3 <5 § 15 20.2 <5 § <5 § <5 § <5 § <5 § <5 § 127 724.6
Fallbrook 16 33.8 6 25.5 10 42.1 15 54.9 <5 § <5 § <5 § <5 § <5 § <5 § <5 § <5 § 16 195.5
North San Diego 66 61.9 22 42.7 44 79.9 60 95.8 <5 § <5 § <5 § <5 § <5 § <5 § <5 § <5 § 65 504.7
Palomar‐Julian <5 § <5 § <5 § <5 § <5 § <5 § <5 § <5 § <5 § <5 § <5 § <5 § <5 §
Pauma <5 § <5 § <5 § <5 § <5 § <5 § <5 § <5 § <5 § <5 § <5 § <5 § <5 §
Poway 47 54.5 16 37.9 31 70.2 40 69.0 <5 § <5 § <5 § <5 § <5 § <5 § <5 § <5 § 47 434.4
Ramona 7 20.1 <5 § <5 § 6 24.2 <5 § <5 § <5 § <5 § <5 § <5 § <5 § <5 § 7 187.3
San Marcos 30 33.3 14 31.8 16 34.8 28 61.6 <5 § <5 § <5 § <5 § <5 § <5 § <5 § <5 § 30 255.1
Valley Center 8 34.3 <5 § 6 51.6 5 33.4 <5 § <5 § <5 § <5 § <5 § <5 § <5 § <5 § 8 211.6
South Region 124 26.5 37 15.8 87 37.1 69 70.3 <5 § 43 15.5 6 10.1 <5 § <5 § <5 § <5 § <5 § 122 251.2
Chula Vista 66 57.3 19 34.2 47 78.7 36 168.5 <5 § 22 27.0 <5 § <5 § <5 § <5 § <5 § <5 § 65 447.8
Coronado 9 36.4 <5 § 8 78.8 8 44.7 <5 § <5 § <5 § <5 § <5 § <5 § <5 § <5 § 9 258.5
National City 18 30.9 6 20.0 12 42.4 9 132.5 <5 § 8 21.5 <5 § <5 § <5 § <5 § <5 § <5 § 18 292.0
South Bay 18 13.3 8 11.8 10 15.0 8 39.0 <5 § 7 7.6 <5 § <5 § <5 § <5 § <5 § <5 § 17 131.7
Sweetwater 13 9.6 <5 § 10 14.4 8 25.4 <5 § 5 7.9 <5 § <5 § <5 § <5 § <5 § <5 § 13 113.1Unknown 5 ‐‐‐ <5 ‐‐‐ <5 ‐‐‐ 5 ‐‐‐ <5 ‐‐‐ <5 ‐‐‐ <5 ‐‐‐ <5 ‐‐‐ <5 ‐‐‐ <5 ‐‐‐ <5 ‐‐‐ <5 ‐‐‐ 5 ‐‐‐*Rates per 100,000 population. County age‐adjusted rates per 100,000 2000 US standard population.**Harbison Crest/El Cajon is an aggregation of the Harbison Crest and El Cajon SRAs. Due to geographic limitations, the Harbison Crest SRA is not shown alone. See the Data Guide for more information.
***Numbers may not add up to totals due to unknown or missing details.
†Alzheimer's death refers to (underlying cause of death) ICD‐10 code G40. ‐‐‐‡API includes Asian, Pacific Islander, Na ve Hawaiian. Other includes 2 or more races, Na ve American/Alaska Na ve, American Indian, or other.
§Rates not calculated for fewer than 5 events. Rates not calculated in cases where zip code is unknown.
Source: Death Statistical Master Files (CDPH), County of San Diego, Health & Human Services Agency, Public Health Services, Epidemiology & Immunization Services Branch; SANDAG, Current Population Estimates, 10/2012.
Prepared by: County of San Diego, Health & Human Services Agency, Public Health Services, Community Health Statistics Unit, 2013.
Geography2010 Total
Gender Race/Ethnicity Age Group
Male Ages 65+Female White Other‡ Ages 0‐14 Ages 15‐24 Ages 25‐44API‡
Alzheimer's† Deaths Among San Diego County Residents by Loca on of Residence, 2010 Detail
Ages 45‐64HispanicBlack
County of San Diego, Health & Human Services Agency, Public Health Services, Community Health Statisitcs Unit Page 28

No. Rate* No. Rate* No. Rate* No. Rate* No. Rate* No. Rate* No. Rate* No. Rate* No. Rate* No. Rate* No. Rate* No. Rate* No. Rate*
San Diego County (Actual Rate) 1,221 39.2 403 25.8 818 52.7 1,003 67.1 45 31.5 116 11.5 45 12.9 11 9.3 <5 § <5 § <5 § 12 1.6 1,208 333.8
San Diego County (Age‐Adjusted Rate) 1,221 36.5
Central Region 113 23.3 35 14.1 78 32.8 57 40.1 23 41.9 24 11.5 8 12.4 <5 § <5 § <5 § <5 § <5 § 110 249.6
Central San Diego 36 21.7 11 12.1 25 33.2 28 34.2 <5 § 7 11.9 <5 § <5 § <5 § <5 § <5 § <5 § 36 224.3
Mid‐City 38 23.3 12 14.8 26 31.7 21 45.9 5 26.6 9 12.9 <5 § <5 § <5 § <5 § <5 § <5 § 36 278.9
Southeast San Diego 39 24.9 12 15.7 27 33.7 8 54.4 17 68.1 8 10.0 6 18.7 <5 § <5 § <5 § <5 § <5 § 38 251.6
East Region 186 39.9 44 19.1 142 60.0 164 58.8 6 23.0 12 10.1 <5 § <5 § <5 § <5 § <5 § <5 § 184 314.6
Alpine <5 § <5 § <5 § <5 § <5 § <5 § <5 § <5 § <5 § <5 § <5 § <5 § <5 §
El Cajon 45 35.9 12 19.6 33 51.6 39 53.0 <5 § <5 § <5 § <5 § <5 § <5 § <5 § <5 § 45 297.5
Harbison Crest/El Cajon** 69 49.3 14 20.4 55 77.1 63 74.0 <5 § <5 § <5 § <5 § <5 § <5 § <5 § <5 § 68 383.9
Jamul 7 39.8 <5 § <5 § 6 62.8 <5 § <5 § <5 § <5 § <5 § <5 § <5 § <5 § 7 357.3
La Mesa 45 75.0 12 41.9 33 105.2 41 109.9 <5 § <5 § <5 § <5 § <5 § <5 § <5 § <5 § 45 508.2
Laguna‐Pine Valley <5 § <5 § <5 § <5 § <5 § <5 § <5 § <5 § <5 § <5 § <5 § <5 § <5 120.5
Lakeside 13 23.1 <5 § 11 38.6 12 29.4 <5 § <5 § <5 § <5 § <5 § <5 § <5 § <5 § 13 204.2
Lemon Grove 13 43.4 <5 § 11 71.5 9 96.2 <5 § <5 § <5 § <5 § <5 § <5 § <5 § <5 § 12 351.1
Mountain Empire <5 § <5 § <5 § <5 § <5 § <5 § <5 § <5 § <5 § <5 § <5 § <5 § <5 §
Santee 13 25.1 <5 § 10 37.5 13 34.1 <5 § <5 § <5 § <5 § <5 § <5 § <5 § <5 § 13 214.9
Spring Valley 21 25.7 <5 § 17 40.5 15 39.2 <5 § <5 § <5 § <5 § <5 § <5 § <5 § <5 § 21 213.2
North Central Region 220 36.1 83 26.9 137 45.5 197 53.9 <5 § 9 10.3 7 6.3 5 18.8 <5 § <5 § <5 § <5 § 220 298.6
Coastal 30 39.7 10 25.7 20 54.6 30 49.5 <5 § <5 § <5 § <5 § <5 § <5 § <5 § <5 § 30 237.8
Del Mar‐Mira Mesa 28 17.7 13 16.4 15 19.0 20 26.4 <5 § <5 § 7 12.5 <5 § <5 § <5 § <5 § <5 § 28 194.8
Elliott‐Navajo 44 49.2 13 30.0 31 67.3 42 70.1 <5 § <5 § <5 § <5 § <5 § <5 § <5 § <5 § 44 322.0
Kearny Mesa 76 50.1 29 38.4 47 61.7 64 76.2 <5 § 8 23.5 <5 § <5 § <5 § <5 § <5 § <5 § 76 392.1
Miramar <5 § <5 § <5 § <5 § <5 § <5 § <5 § <5 § <5 § <5 § <5 § <5 § <5 §
Peninsula 27 42.8 10 29.1 17 59.3 26 54.5 <5 § <5 § <5 § <5 § <5 § <5 § <5 § <5 § 27 372.9
University 15 22.6 8 24.3 7 20.9 15 43.9 <5 § <5 § <5 § <5 § <5 § <5 § <5 § <5 § 15 234.7
North Coastal Region 250 49.0 76 29.3 174 69.6 221 73.9 <5 § 16 10.9 7 22.6 <5 § <5 § <5 § <5 § <5 § 248 402.4
Carlsbad 58 50.1 22 39.1 36 60.5 56 66.1 <5 § <5 § <5 § <5 § <5 § <5 § <5 § <5 § 57 308.5
Oceanside 74 46.2 15 18.9 59 73.2 61 82.8 <5 § 6 9.9 <5 § <5 § <5 § <5 § <5 § <5 § 73 389.8
Pendleton <5 § <5 § <5 § <5 § <5 § <5 § <5 § <5 § <5 § <5 § <5 § <5 § <5 §
San Dieguito 45 47.4 13 27.9 32 66.3 42 56.7 <5 § <5 § <5 § <5 § <5 § <5 § <5 § <5 § 45 322.3
Vista 73 72.0 26 50.9 47 93.6 62 142.1 <5 § 8 16.8 <5 § <5 § <5 § <5 § <5 § <5 § 73 701.4
North Inland Region 300 52.2 112 39.6 188 64.5 275 87.6 <5 § 12 7.1 9 14.9 <5 § <5 § <5 § <5 § <5 § 297 397.9
Anza‐Borrego Springs 5 107.1 <5 § <5 § <5 § <5 § <5 § <5 § <5 § <5 § <5 § <5 § <5 § 5 338.3
Escondido 112 68.2 47 57.7 65 78.6 109 154.5 <5 § <5 § <5 § <5 § <5 § <5 § <5 § <5 § 109 611.4
Fallbrook 25 52.2 8 33.5 17 70.8 24 88.1 <5 § <5 § <5 § <5 § <5 § <5 § <5 § <5 § 25 293.4
North San Diego 62 57.6 26 50.0 36 64.8 52 82.8 <5 § <5 § 5 19.0 <5 § <5 § <5 § <5 § <5 § 62 465.9
Palomar‐Julian <5 § <5 § <5 § <5 § <5 § <5 § <5 § <5 § <5 § <5 § <5 § <5 § <5 §
Pauma <5 § <5 § <5 § <5 § <5 § <5 § <5 § <5 § <5 § <5 § <5 § <5 § <5 §
Poway 35 40.3 12 28.3 23 51.7 31 53.5 <5 § <5 § <5 § <5 § <5 § <5 § <5 § <5 § 35 310.8
Ramona 8 22.6 <5 § 6 34.0 7 28.0 <5 § <5 § <5 § <5 § <5 § <5 § <5 § <5 § 8 199.4
San Marcos 38 42.1 7 15.9 31 67.3 34 75.7 <5 § <5 § <5 § <5 § <5 § <5 § <5 § <5 § 38 319.2
Valley Center 10 42.6 <5 § 6 51.3 9 60.7 <5 § <5 § <5 § <5 § <5 § <5 § <5 § <5 § 10 249.9
South Region 148 31.5 52 22.2 96 40.7 85 88.4 8 42.6 43 15.3 12 20.0 <5 § <5 § <5 § <5 § <5 § 145 293.5
Chula Vista 65 56.1 20 35.8 45 74.9 41 195.9 <5 § 18 21.8 <5 § <5 § <5 § <5 § <5 § <5 § 64 436.3
Coronado 10 42.9 <5 § 7 70.3 10 58.6 <5 § <5 § <5 § <5 § <5 § <5 § <5 § <5 § 10 282.4
National City 21 35.9 9 30.0 12 42.1 7 106.2 <5 § 8 21.3 <5 § <5 § <5 § <5 § <5 § <5 § 20 329.1
South Bay 27 20.0 13 19.1 14 20.9 11 54.7 <5 § 12 12.9 <5 § <5 § <5 § <5 § <5 § <5 § 26 197.0
Sweetwater 25 18.3 7 10.5 18 25.7 16 50.9 <5 § 5 7.7 <5 § <5 § <5 § <5 § <5 § <5 § 25 209.8
Unknown <5 ‐‐‐ <5 ‐‐‐ <5 ‐‐‐ <5 ‐‐‐ <5 ‐‐‐ <5 ‐‐‐ <5 ‐‐‐ <5 ‐‐‐ <5 ‐‐‐ <5 ‐‐‐ <5 ‐‐‐ <5 ‐‐‐ <5 ‐‐‐*Rates per 100,000 population. County age‐adjusted rates per 100,000 2000 US standard population.
**Harbison Crest/El Cajon is an aggregation of the Harbison Crest and El Cajon SRAs. Due to geographic limitations, the Harbison Crest SRA is not shown alone. See the Data Guide for more information.
***Numbers may not add up to totals due to unknown or missing details.
†Alzheimer's death refers to (underlying cause of death) ICD‐10 code G40. ‐‐‐‡API includes Asian, Pacific Islander, Na ve Hawaiian. Other includes 2 or more races, Na ve American/Alaska Na ve, American Indian, or other.
§Rates not calculated for fewer than 5 events. Rates not calculated in cases where zip code is unknown.
Source: Death Statistical Master Files (CDPH), County of San Diego, Health & Human Services Agency, Public Health Services, Epidemiology & Immunization Services Branch; SANDAG, Current Population Estimates, 10/2012.
Prepared by: County of San Diego, Health & Human Services Agency, Public Health Services, Community Health Statistics Unit, 2013.
Ages 65+API‡ Other‡ Ages 0‐14Geography2011 Total
Alzheimer's† Deaths Among San Diego County Residents by Loca on of Residence, 2011 Detail
Ages 15‐24 Ages 25‐44 Ages 45‐64Male Female White Black Hispanic
Gender Race/Ethnicity Age Group
County of San Diego, Health & Human Services Agency, Public Health Services, Community Health Statisitcs Unit Page 29

No. Rate* No. Rate* No. Rate* No. Rate* No. Rate* No. Rate* No. Rate* No. Rate* No. Rate* No. Rate* No. Rate*
San Diego County (Actual Rate) 540 17.4 567 18.2
San Diego County (Age‐Adjusted Rate) 540 18.2 567 19.0
Central Region 69 14.2 50 10.3
Central San Diego 25 15.1 20 12.1
Mid‐City 23 14.1 18 11.0
Southeast San Diego 21 13.5 12 7.7
East Region 126 27.2 113 24.2
Alpine <5 § <5 §
El Cajon 23 18.5 29 23.2
Harbison Crest/El Cajon** 48 34.5 43 30.7
Jamul <5 § 8 45.5
La Mesa 26 44.0 21 35.0
Laguna‐Pine Valley <5 § <5 §
Lakeside 12 21.4 10 17.7
Lemon Grove 10 33.5 7 23.4
Mountain Empire <5 § <5 §
Santee 12 23.5 12 23.2
Spring Valley 10 12.3 10 12.2
North Central Region 100 16.6 121 19.8
Coastal 12 15.9 21 27.8
Del Mar‐Mira Mesa 17 10.8 16 10.1
Elliott‐Navajo 18 20.2 15 16.8
Kearny Mesa 33 21.8 54 35.6
Miramar <5 § <5 §
Peninsula <5 § 10 15.9
University 16 25.5 5 7.5
North Coastal Region 70 13.8 80 15.7
Carlsbad 21 18.3 19 16.4
Oceanside 23 14.4 21 13.1
Pendleton <5 § <5 §
San Dieguito 18 19.2 19 20.0
Vista 8 8.0 21 20.7
North Inland Region 108 19.0 122 21.2
Anza‐Borrego Springs <5 § <5 §
Escondido 37 22.7 33 20.1
Fallbrook 8 16.9 14 29.2
North San Diego 28 26.3 27 25.1
Palomar‐Julian <5 § <5 §
Pauma <5 § <5 §
Poway 7 8.1 11 12.7
Ramona 9 25.8 9 25.4
San Marcos 13 14.5 22 24.4
Valley Center 5 21.4 <5 §
South Region 67 14.3 81 17.3
Chula Vista 20 17.4 29 25.0
Coronado 6 24.3 <5 §
National City 10 17.1 16 27.4
South Bay 18 13.3 15 11.1
Sweetwater 13 9.6 17 12.4Unknown <5 ‐‐‐ <5 ‐‐‐*Rates per 100,000 population. County age‐adjusted rates per 100,000 2000 US standard population.**Harbison Crest/El Cajon is an aggregation of the Harbison Crest and El Cajon SRAs. Due to geographic limitations, the Harbison Crest SRA is not shown alone. See the Data Guide for more information.†Alzheimer's disease hospitaliza on refers to (principal diagnosis) ICD‐9 code 331.§Rates not calculated for fewer than 5 events. Rates not calculated in cases where zip code is unknown.Source: Patient Discharge Database (CA OSHPD), County of San Diego, Health & Human Services Agency, Public Health Services, Epidemiology & Immunization Services Branch; SANDAG, Current Population Estimates, 10/2012.Prepared by: County of San Diego, Health & Human Services Agency, Public Health Services, Community Health Statistics Unit, 2013.
Alzheimer's Disease† Hospitaliza ons Among San Diego County Residents by Location of Residence
Geography2010 Total 2011 Total 2012 Total 2013 Total 2014 Total 2015 Total 2016 Total 2017 Total 2018 Total 2019 Total 2020 Total
County of San Diego, Health & Human Services Agency, Public Health Services, Community Health Statisitcs Unit Page 30
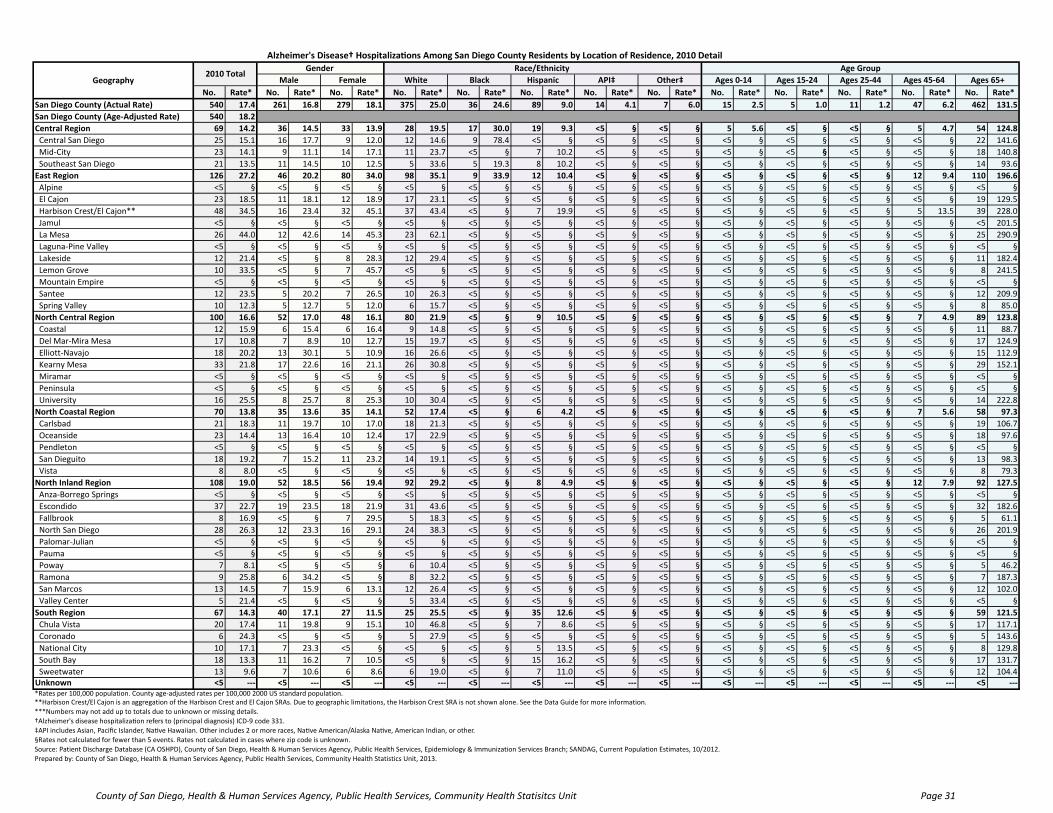
No. Rate* No. Rate* No. Rate* No. Rate* No. Rate* No. Rate* No. Rate* No. Rate* No. Rate* No. Rate* No. Rate* No. Rate* No. Rate*
San Diego County (Actual Rate) 540 17.4 261 16.8 279 18.1 375 25.0 36 24.6 89 9.0 14 4.1 7 6.0 15 2.5 5 1.0 11 1.2 47 6.2 462 131.5
San Diego County (Age‐Adjusted Rate) 540 18.2
Central Region 69 14.2 36 14.5 33 13.9 28 19.5 17 30.0 19 9.3 <5 § <5 § 5 5.6 <5 § <5 § 5 4.7 54 124.8
Central San Diego 25 15.1 16 17.7 9 12.0 12 14.6 9 78.4 <5 § <5 § <5 § <5 § <5 § <5 § <5 § 22 141.6
Mid‐City 23 14.1 9 11.1 14 17.1 11 23.7 <5 § 7 10.2 <5 § <5 § <5 § <5 § <5 § <5 § 18 140.8
Southeast San Diego 21 13.5 11 14.5 10 12.5 5 33.6 5 19.3 8 10.2 <5 § <5 § <5 § <5 § <5 § <5 § 14 93.6
East Region 126 27.2 46 20.2 80 34.0 98 35.1 9 33.9 12 10.4 <5 § <5 § <5 § <5 § <5 § 12 9.4 110 196.6
Alpine <5 § <5 § <5 § <5 § <5 § <5 § <5 § <5 § <5 § <5 § <5 § <5 § <5 §
El Cajon 23 18.5 11 18.1 12 18.9 17 23.1 <5 § <5 § <5 § <5 § <5 § <5 § <5 § <5 § 19 129.5
Harbison Crest/El Cajon** 48 34.5 16 23.4 32 45.1 37 43.4 <5 § 7 19.9 <5 § <5 § <5 § <5 § <5 § 5 13.5 39 228.0
Jamul <5 § <5 § <5 § <5 § <5 § <5 § <5 § <5 § <5 § <5 § <5 § <5 § <5 201.5
La Mesa 26 44.0 12 42.6 14 45.3 23 62.1 <5 § <5 § <5 § <5 § <5 § <5 § <5 § <5 § 25 290.9
Laguna‐Pine Valley <5 § <5 § <5 § <5 § <5 § <5 § <5 § <5 § <5 § <5 § <5 § <5 § <5 §
Lakeside 12 21.4 <5 § 8 28.3 12 29.4 <5 § <5 § <5 § <5 § <5 § <5 § <5 § <5 § 11 182.4
Lemon Grove 10 33.5 <5 § 7 45.7 <5 § <5 § <5 § <5 § <5 § <5 § <5 § <5 § <5 § 8 241.5
Mountain Empire <5 § <5 § <5 § <5 § <5 § <5 § <5 § <5 § <5 § <5 § <5 § <5 § <5 §
Santee 12 23.5 5 20.2 7 26.5 10 26.3 <5 § <5 § <5 § <5 § <5 § <5 § <5 § <5 § 12 209.9
Spring Valley 10 12.3 5 12.7 5 12.0 6 15.7 <5 § <5 § <5 § <5 § <5 § <5 § <5 § <5 § 8 85.0
North Central Region 100 16.6 52 17.0 48 16.1 80 21.9 <5 § 9 10.5 <5 § <5 § <5 § <5 § <5 § 7 4.9 89 123.8
Coastal 12 15.9 6 15.4 6 16.4 9 14.8 <5 § <5 § <5 § <5 § <5 § <5 § <5 § <5 § 11 88.7
Del Mar‐Mira Mesa 17 10.8 7 8.9 10 12.7 15 19.7 <5 § <5 § <5 § <5 § <5 § <5 § <5 § <5 § 17 124.9
Elliott‐Navajo 18 20.2 13 30.1 5 10.9 16 26.6 <5 § <5 § <5 § <5 § <5 § <5 § <5 § <5 § 15 112.9
Kearny Mesa 33 21.8 17 22.6 16 21.1 26 30.8 <5 § <5 § <5 § <5 § <5 § <5 § <5 § <5 § 29 152.1
Miramar <5 § <5 § <5 § <5 § <5 § <5 § <5 § <5 § <5 § <5 § <5 § <5 § <5 §
Peninsula <5 § <5 § <5 § <5 § <5 § <5 § <5 § <5 § <5 § <5 § <5 § <5 § <5 §
University 16 25.5 8 25.7 8 25.3 10 30.4 <5 § <5 § <5 § <5 § <5 § <5 § <5 § <5 § 14 222.8
North Coastal Region 70 13.8 35 13.6 35 14.1 52 17.4 <5 § 6 4.2 <5 § <5 § <5 § <5 § <5 § 7 5.6 58 97.3
Carlsbad 21 18.3 11 19.7 10 17.0 18 21.3 <5 § <5 § <5 § <5 § <5 § <5 § <5 § <5 § 19 106.7
Oceanside 23 14.4 13 16.4 10 12.4 17 22.9 <5 § <5 § <5 § <5 § <5 § <5 § <5 § <5 § 18 97.6
Pendleton <5 § <5 § <5 § <5 § <5 § <5 § <5 § <5 § <5 § <5 § <5 § <5 § <5 §
San Dieguito 18 19.2 7 15.2 11 23.2 14 19.1 <5 § <5 § <5 § <5 § <5 § <5 § <5 § <5 § 13 98.3
Vista 8 8.0 <5 § <5 § <5 § <5 § <5 § <5 § <5 § <5 § <5 § <5 § <5 § 8 79.3
North Inland Region 108 19.0 52 18.5 56 19.4 92 29.2 <5 § 8 4.9 <5 § <5 § <5 § <5 § <5 § 12 7.9 92 127.5
Anza‐Borrego Springs <5 § <5 § <5 § <5 § <5 § <5 § <5 § <5 § <5 § <5 § <5 § <5 § <5 §
Escondido 37 22.7 19 23.5 18 21.9 31 43.6 <5 § <5 § <5 § <5 § <5 § <5 § <5 § <5 § 32 182.6
Fallbrook 8 16.9 <5 § 7 29.5 5 18.3 <5 § <5 § <5 § <5 § <5 § <5 § <5 § <5 § 5 61.1
North San Diego 28 26.3 12 23.3 16 29.1 24 38.3 <5 § <5 § <5 § <5 § <5 § <5 § <5 § <5 § 26 201.9
Palomar‐Julian <5 § <5 § <5 § <5 § <5 § <5 § <5 § <5 § <5 § <5 § <5 § <5 § <5 §
Pauma <5 § <5 § <5 § <5 § <5 § <5 § <5 § <5 § <5 § <5 § <5 § <5 § <5 §
Poway 7 8.1 <5 § <5 § 6 10.4 <5 § <5 § <5 § <5 § <5 § <5 § <5 § <5 § 5 46.2
Ramona 9 25.8 6 34.2 <5 § 8 32.2 <5 § <5 § <5 § <5 § <5 § <5 § <5 § <5 § 7 187.3
San Marcos 13 14.5 7 15.9 6 13.1 12 26.4 <5 § <5 § <5 § <5 § <5 § <5 § <5 § <5 § 12 102.0
Valley Center 5 21.4 <5 § <5 § 5 33.4 <5 § <5 § <5 § <5 § <5 § <5 § <5 § <5 § <5 §
South Region 67 14.3 40 17.1 27 11.5 25 25.5 <5 § 35 12.6 <5 § <5 § <5 § <5 § <5 § <5 § 59 121.5
Chula Vista 20 17.4 11 19.8 9 15.1 10 46.8 <5 § 7 8.6 <5 § <5 § <5 § <5 § <5 § <5 § 17 117.1
Coronado 6 24.3 <5 § <5 § 5 27.9 <5 § <5 § <5 § <5 § <5 § <5 § <5 § <5 § 5 143.6
National City 10 17.1 7 23.3 <5 § <5 § <5 § 5 13.5 <5 § <5 § <5 § <5 § <5 § <5 § 8 129.8
South Bay 18 13.3 11 16.2 7 10.5 <5 § <5 § 15 16.2 <5 § <5 § <5 § <5 § <5 § <5 § 17 131.7
Sweetwater 13 9.6 7 10.6 6 8.6 6 19.0 <5 § 7 11.0 <5 § <5 § <5 § <5 § <5 § <5 § 12 104.4Unknown <5 ‐‐‐ <5 ‐‐‐ <5 ‐‐‐ <5 ‐‐‐ <5 ‐‐‐ <5 ‐‐‐ <5 ‐‐‐ <5 ‐‐‐ <5 ‐‐‐ <5 ‐‐‐ <5 ‐‐‐ <5 ‐‐‐ <5 ‐‐‐*Rates per 100,000 population. County age‐adjusted rates per 100,000 2000 US standard population.**Harbison Crest/El Cajon is an aggregation of the Harbison Crest and El Cajon SRAs. Due to geographic limitations, the Harbison Crest SRA is not shown alone. See the Data Guide for more information.
***Numbers may not add up to totals due to unknown or missing details.
†Alzheimer's disease hospitaliza on refers to (principal diagnosis) ICD‐9 code 331.
‡API includes Asian, Pacific Islander, Na ve Hawaiian. Other includes 2 or more races, Na ve American/Alaska Na ve, American Indian, or other.
§Rates not calculated for fewer than 5 events. Rates not calculated in cases where zip code is unknown.
Source: Patient Discharge Database (CA OSHPD), County of San Diego, Health & Human Services Agency, Public Health Services, Epidemiology & Immunization Services Branch; SANDAG, Current Population Estimates, 10/2012.
Prepared by: County of San Diego, Health & Human Services Agency, Public Health Services, Community Health Statistics Unit, 2013.
Ages 45‐64Hispanic
Alzheimer's Disease† Hospitaliza ons Among San Diego County Residents by Loca on of Residence, 2010 Detail
Geography2010 Total
Gender Race/Ethnicity Age Group
Male Ages 65+Female White Black Other‡ Ages 0‐14 Ages 15‐24 Ages 25‐44API‡
County of San Diego, Health & Human Services Agency, Public Health Services, Community Health Statisitcs Unit Page 31

No. Rate* No. Rate* No. Rate* No. Rate* No. Rate* No. Rate* No. Rate* No. Rate* No. Rate* No. Rate* No. Rate* No. Rate* No. Rate*
San Diego County (Actual Rate) 567 18.2 295 18.9 272 17.5 417 27.9 19 13.3 76 7.5 14 4.0 22 18.7 31 5.2 6 1.2 11 1.2 52 6.7 467 129.0
San Diego County (Age‐Adjusted Rate) 567 19.0
Central Region 50 10.3 21 8.5 29 12.2 32 22.5 6 10.9 7 3.4 <5 § <5 § <5 § <5 § <5 § <5 § 43 97.6
Central San Diego 20 12.1 7 7.7 13 17.2 14 17.1 <5 § <5 § <5 § <5 § <5 § <5 § <5 § <5 § 16 99.7
Mid‐City 18 11.0 8 9.8 10 12.2 15 32.8 <5 § <5 § <5 § <5 § <5 § <5 § <5 § <5 § 17 131.7
Southeast San Diego 12 7.7 6 7.9 6 7.5 <5 § <5 § <5 § <5 § <5 § <5 § <5 § <5 § <5 § 10 66.2
East Region 113 24.2 57 24.8 56 23.6 80 28.7 8 30.7 15 12.6 <5 § 7 32.7 11 12.3 <5 § <5 § 6 4.7 90 153.9
Alpine <5 § <5 § <5 § <5 § <5 § <5 § <5 § <5 § <5 § <5 § <5 § <5 § <5 §
El Cajon 29 23.2 15 24.5 14 21.9 23 31.3 <5 § <5 § <5 § <5 § <5 § <5 § <5 § <5 § 25 165.3
Harbison Crest/El Cajon** 43 30.7 24 34.9 19 26.6 29 34.1 <5 § 6 16.6 <5 § <5 § <5 § <5 § <5 § <5 § 33 186.3
Jamul 8 45.5 5 49.5 <5 § 6 62.8 <5 § <5 § <5 § <5 § <5 § <5 § <5 § <5 § 6 306.3
La Mesa 21 35.0 8 27.9 13 41.5 15 40.2 <5 § <5 § <5 § <5 § <5 § <5 § <5 § <5 § 19 214.6
Laguna‐Pine Valley <5 § <5 § <5 § <5 § <5 § <5 § <5 § <5 § <5 § <5 § <5 § <5 § <5 §
Lakeside 10 17.7 7 25.1 <5 § 8 19.6 <5 § <5 § <5 § <5 § 6 52.9 <5 § <5 § <5 § <5 §
Lemon Grove 7 23.4 5 34.3 <5 § 7 74.8 <5 § <5 § <5 § <5 § <5 § <5 § <5 § <5 § 7 204.8
Mountain Empire <5 § <5 § <5 § <5 § <5 § <5 § <5 § <5 § <5 § <5 § <5 § <5 § <5 §
Santee 12 23.2 <5 § 8 30.0 9 23.6 <5 § <5 § <5 § <5 § <5 § <5 § <5 § <5 § 11 181.9
Spring Valley 10 12.2 <5 § 6 14.3 5 13.1 <5 § <5 § <5 § <5 § <5 § <5 § <5 § <5 § 9 91.4
North Central Region 121 19.8 59 19.1 62 20.6 97 26.6 <5 § 8 9.1 <5 § <5 § 7 7.4 <5 § <5 § 10 6.9 102 138.4
Coastal 21 27.8 7 18.0 14 38.2 21 34.6 <5 § <5 § <5 § <5 § <5 § <5 § <5 § <5 § 20 158.6
Del Mar‐Mira Mesa 16 10.1 10 12.6 6 7.6 12 15.8 <5 § <5 § <5 § <5 § 5 15.7 <5 § <5 § <5 § 8 55.6
Elliott‐Navajo 15 16.8 7 16.1 8 17.4 12 20.0 <5 § <5 § <5 § <5 § <5 § <5 § <5 § <5 § 12 87.8
Kearny Mesa 54 35.6 27 35.7 27 35.5 42 50.0 <5 § 5 14.7 <5 § <5 § <5 § <5 § <5 § <5 § 50 257.9
Miramar <5 § <5 § <5 § <5 § <5 § <5 § <5 § <5 § <5 § <5 § <5 § <5 § <5 §
Peninsula 10 15.9 7 20.4 <5 § 6 12.6 <5 § <5 § <5 § <5 § <5 § <5 § <5 § <5 § 8 110.5
University 5 7.5 <5 § <5 § <5 § <5 § <5 § <5 § <5 § <5 § <5 § <5 § <5 § <5 §
North Coastal Region 80 15.7 50 19.3 30 12.0 67 22.4 <5 § 7 4.8 <5 § <5 § <5 § <5 § <5 § 5 3.9 69 111.9
Carlsbad 19 16.4 13 23.1 6 10.1 15 17.7 <5 § <5 § <5 § <5 § <5 § <5 § <5 § <5 § 14 75.8
Oceanside 21 13.1 13 16.4 8 9.9 17 23.1 <5 § <5 § <5 § <5 § <5 § <5 § <5 § <5 § 18 96.1
Pendleton <5 § <5 § <5 § <5 § <5 § <5 § <5 § <5 § <5 § <5 § <5 § <5 § <5 §
San Dieguito 19 20.0 10 21.4 9 18.7 19 25.7 <5 § <5 § <5 § <5 § <5 § <5 § <5 § <5 § 18 128.9
Vista 21 20.7 14 27.4 7 13.9 16 36.7 <5 § 5 10.5 <5 § <5 § <5 § <5 § <5 § <5 § 19 182.6
North Inland Region 122 21.2 64 22.6 58 19.9 105 33.5 <5 § 8 4.8 <5 § <5 § <5 § <5 § <5 § 13 8.4 102 136.7
Anza‐Borrego Springs <5 § <5 § <5 § <5 § <5 § <5 § <5 § <5 § <5 § <5 § <5 § <5 § <5 §
Escondido 33 20.1 22 27.0 11 13.3 26 36.9 <5 § <5 § <5 § <5 § <5 § <5 § <5 § <5 § 28 157.1
Fallbrook 14 29.2 7 29.3 7 29.1 14 51.4 <5 § <5 § <5 § <5 § <5 § <5 § <5 § <5 § 13 152.5
North San Diego 27 25.1 14 26.9 13 23.4 22 35.0 <5 § <5 § <5 § <5 § <5 § <5 § <5 § <5 § 24 180.3
Palomar‐Julian <5 § <5 § <5 § <5 § <5 § <5 § <5 § <5 § <5 § <5 § <5 § <5 § <5 §
Pauma <5 § <5 § <5 § <5 § <5 § <5 § <5 § <5 § <5 § <5 § <5 § <5 § <5 §
Poway 11 12.7 <5 § 7 15.7 9 15.5 <5 § <5 § <5 § <5 § <5 § <5 § <5 § <5 § 9 79.9
Ramona 9 25.4 <5 § 6 34.0 9 36.0 <5 § <5 § <5 § <5 § <5 § <5 § <5 § <5 § 7 174.4
San Marcos 22 24.4 10 22.7 12 26.0 20 44.5 <5 § <5 § <5 § <5 § <5 § <5 § <5 § <5 § 20 168.0
Valley Center <5 § <5 § <5 § <5 § <5 § <5 § <5 § <5 § <5 § <5 § <5 § <5 § <5 §
South Region 81 17.3 44 18.8 37 15.7 36 37.4 <5 § 31 11.0 <5 § 5 37.2 <5 § <5 § <5 § 14 13.0 61 123.5
Chula Vista 29 25.0 17 30.5 12 20.0 15 71.7 <5 § 12 14.5 <5 § <5 § <5 § <5 § <5 § 5 18.6 23 156.8
Coronado <5 § <5 § <5 § <5 § <5 § <5 § <5 § <5 § <5 § <5 § <5 § <5 § <5 §
National City 16 27.4 8 26.7 8 28.1 6 91.0 <5 § 7 18.6 <5 § <5 § <5 § <5 § <5 § <5 § 10 164.5
South Bay 15 11.1 8 11.8 7 10.4 6 29.8 <5 § 7 7.5 <5 § <5 § <5 § <5 § <5 § <5 § 11 83.3
Sweetwater 17 12.4 10 15.0 7 10.0 7 22.3 <5 § <5 § <5 § <5 § <5 § <5 § <5 § <5 § 14 117.5Unknown <5 ‐‐‐ <5 ‐‐‐ <5 ‐‐‐ <5 ‐‐‐ <5 ‐‐‐ <5 ‐‐‐ <5 ‐‐‐ <5 ‐‐‐ <5 ‐‐‐ <5 ‐‐‐ <5 ‐‐‐ <5 ‐‐‐ <5 ‐‐‐*Rates per 100,000 population. County age‐adjusted rates per 100,000 2000 US standard population.**Harbison Crest/El Cajon is an aggregation of the Harbison Crest and El Cajon SRAs. Due to geographic limitations, the Harbison Crest SRA is not shown alone. See the Data Guide for more information.
**Numbers may not add up to totals due to unknown or missing details.
†Alzheimer's disease hospitaliza on refers to (principal diagnosis) ICD‐9 code 331.
‡API includes Asian, Pacific Islander, Na ve Hawaiian. Other includes 2 or more races, Na ve American/Alaska Na ve, American Indian, or other.
§Rates not calculated for fewer than 5 events. Rates not calculated in cases where zip code is unknown.
Source: Patient Discharge Database (CA OSHPD), County of San Diego, Health & Human Services Agency, Public Health Services, Epidemiology & Immunization Services Branch; SANDAG, Current Population Estimates, 10/2012.
Prepared by: County of San Diego, Health & Human Services Agency, Public Health Services, Community Health Statistics Unit, 2013.
Ages 15‐24 Ages 25‐44 Ages 45‐64Male Female White Black Hispanic
Gender
Alzheimer's Disease† Hospitaliza ons Among San Diego County Residents by Loca on of Residence, 2011 Detail
Race/Ethnicity Age Group
Ages 65+API‡ Other‡ Ages 0‐14Geography2011 Total
County of San Diego, Health & Human Services Agency, Public Health Services, Community Health Statisitcs Unit Page 32

No. Rate* No. Rate* No. Rate* No. Rate* No. Rate* No. Rate* No. Rate* No. Rate* No. Rate* No. Rate* No. Rate*
San Diego County (Actual Rate) 158 5.1 180 5.8
San Diego County (Age‐Adjusted Rate) 158 5.4 180 5.9
Central Region 26 5.4 17 3.5
Central San Diego 6 3.6 5 3.0
Mid‐City 13 8.0 6 3.7
Southeast San Diego 7 4.5 6 3.8
East Region 30 6.5 28 6.0
Alpine <5 § <5 §
El Cajon <5 § 7 5.6
Harbison Crest/El Cajon** 5 34.1 13 9.3
Jamul <5 § <5 §
La Mesa 12 20.3 5 8.3
Laguna‐Pine Valley <5 § <5 §
Lakeside <5 § <5 §
Lemon Grove <5 § <5 §
Mountain Empire <5 § <5 §
Santee <5 § <5 §
Spring Valley <5 § <5 §
North Central Region 25 4.1 32 5.2
Coastal <5 § <5 §
Del Mar‐Mira Mesa <5 § 5 3.2
Elliott‐Navajo 8 9.0 8 8.9
Kearny Mesa 6 4.0 11 7.3
Miramar <5 § <5 §
Peninsula 5 7.9 <5 §
University <5 § <5 §
North Coastal Region 30 5.9 47 9.2
Carlsbad 6 5.2 7 6.0
Oceanside 7 4.4 16 10.0
Pendleton <5 § <5 §
San Dieguito 9 9.6 13 13.7
Vista 8 8.0 11 10.9
North Inland Region 29 5.1 38 6.6
Anza‐Borrego Springs <5 § <5 §
Escondido 12 7.4 13 7.9
Fallbrook 7 14.8 5 10.4
North San Diego <5 § 8 7.4
Palomar‐Julian <5 § <5 §
Pauma <5 § <5 §
Poway <5 § <5 §
Ramona <5 § <5 §
San Marcos <5 § 9 10.0
Valley Center <5 § <5 §
South Region 17 3.6 18 3.8
Chula Vista 9 7.8 7 6.0
Coronado <5 § <5 §
National City <5 § <5 §
South Bay <5 § 6 4.4
Sweetwater <5 § <5 §Unknown <5 ‐‐‐ <5 ‐‐‐*Rates per 100,000 population. County age‐adjusted rates per 100,000 2000 US standard population.**Harbison Crest/El Cajon is an aggregation of the Harbison Crest and El Cajon SRAs. Due to geographic limitations, the Harbison Crest SRA is not shown alone. See the Data Guide for more information.†Alzheimer's disease Emergency Department Discharge refers to (principal diagnosis) ICD‐9 code 331.§Rates not calculated for fewer than 5 events. Rates not calculated in cases where zip code is unknown.Source: Emergency Department Discharge Database (CA OSHPD), County of San Diego, Health & Human Services Agency, Public Health Services, Emergency Medical Services; SANDAG, Current Population Estimates, 10/2012.Prepared by: County of San Diego, Health & Human Services Agency, Public Health Services, Community Health Statistics Unit, 2013.
Alzheimer's Disease† Emergency Department Discharges Among San Diego County Residents by Loca on of Residence
Geography2010 Total 2011 Total 2012 Total 2013 Total 2014 Total 2015 Total 2016 Total 2017 Total 2018 Total 2019 Total 2020 Total
County of San Diego, Health & Human Services Agency, Public Health Services, Community Health Statisitcs Unit Page 33

No. Rate* No. Rate* No. Rate* No. Rate* No. Rate* No. Rate* No. Rate* No. Rate* No. Rate* No. Rate* No. Rate* No. Rate* No. Rate*
San Diego County (Actual Rate) 158 5.1 72 4.6 86 5.6 115 7.7 10 6.8 19 1.9 9 2.6 5 4.3 <5 § <5 § <5 § 11 1.4 141 40.1
San Diego County (Age‐Adjusted Rate) 158 5.4
Central Region 26 5.4 11 4.4 15 6.3 8 5.6 7 12.4 6 2.9 <5 § <5 § <5 § <5 § <5 § <5 § 25 57.8
Central San Diego 6 3.6 <5 § <5 § <5 § <5 § <5 § <5 § <5 § <5 § <5 § <5 § <5 § 6 38.6
Mid‐City 13 8.0 8 9.9 5 6.1 <5 § <5 § <5 § <5 § <5 § <5 § <5 § <5 § <5 § 12 93.9
Southeast San Diego 7 4.5 <5 § 6 7.5 <5 § <5 § <5 § <5 § <5 § <5 § <5 § <5 § <5 § 7 46.8
East Region 30 6.5 13 5.7 17 7.2 26 9.3 <5 § <5 § <5 § <5 § <5 § <5 § <5 § <5 § 25 44.7
Alpine <5 § <5 § <5 § <5 § <5 § <5 § <5 § <5 § <5 § <5 § <5 § <5 § <5 §
El Cajon <5 § <5 § <5 § <5 § <5 § <5 § <5 § <5 § <5 § <5 § <5 § <5 § <5 §
Harbison Crest/El Cajon** 5 34.1 <5 § <5 § <5 § <5 § <5 § <5 § <5 § <5 § <5 § <5 § <5 § <5 §
Jamul <5 § <5 § <5 § <5 § <5 § <5 § <5 § <5 § <5 § <5 § <5 § <5 § <5 §
La Mesa 12 20.3 <5 § 9 29.1 11 29.7 <5 § <5 § <5 § <5 § <5 § <5 § <5 § <5 § 11 128.0
Laguna‐Pine Valley <5 § <5 § <5 § <5 § <5 § <5 § <5 § <5 § <5 § <5 § <5 § <5 § <5 §
Lakeside <5 § <5 § <5 § <5 § <5 § <5 § <5 § <5 § <5 § <5 § <5 § <5 § <5 §
Lemon Grove <5 § <5 § <5 § <5 § <5 § <5 § <5 § <5 § <5 § <5 § <5 § <5 § <5 §
Mountain Empire <5 § <5 § <5 § <5 § <5 § <5 § <5 § <5 § <5 § <5 § <5 § <5 § <5 §
Santee <5 § <5 § <5 § <5 § <5 § <5 § <5 § <5 § <5 § <5 § <5 § <5 § <5 §
Spring Valley <5 § <5 § <5 § <5 § <5 § <5 § <5 § <5 § <5 § <5 § <5 § <5 § <5 §
North Central Region 25 4.1 13 4.3 12 4.0 21 5.8 <5 § <5 § <5 § <5 § <5 § <5 § <5 § <5 § 23 32.0
Coastal <5 § <5 § <5 § <5 § <5 § <5 § <5 § <5 § <5 § <5 § <5 § <5 § <5 §
Del Mar‐Mira Mesa <5 § <5 § <5 § <5 § <5 § <5 § <5 § <5 § <5 § <5 § <5 § <5 § <5 §
Elliott‐Navajo 8 9.0 5 11.6 <5 § 7 11.6 <5 § <5 § <5 § <5 § <5 § <5 § <5 § <5 § 7 52.7
Kearny Mesa 6 4.0 <5 § <5 § 5 5.9 <5 § <5 § <5 § <5 § <5 § <5 § <5 § <5 § 6 31.5
Miramar <5 § <5 § <5 § <5 § <5 § <5 § <5 § <5 § <5 § <5 § <5 § <5 § <5 §
Peninsula 5 7.9 <5 § <5 § <5 § <5 § <5 § <5 § <5 § <5 § <5 § <5 § <5 § 5 69.2
University <5 § <5 § <5 § <5 § <5 § <5 § <5 § <5 § <5 § <5 § <5 § <5 § <5 §
North Coastal Region 30 5.9 9 3.5 21 8.5 25 8.4 <5 § <5 § <5 § <5 § <5 § <5 § <5 § <5 § 27 45.3
Carlsbad 6 5.2 <5 § 6 10.2 <5 § <5 § <5 § <5 § <5 § <5 § <5 § <5 § <5 § 6 33.7
Oceanside 7 4.4 <5 § 5 6.2 5 6.7 <5 § <5 § <5 § <5 § <5 § <5 § <5 § <5 § 6 32.5
Pendleton <5 § <5 § <5 § <5 § <5 § <5 § <5 § <5 § <5 § <5 § <5 § <5 § <5 §
San Dieguito 9 9.6 <5 § 7 14.7 8 10.9 <5 § <5 § <5 § <5 § <5 § <5 § <5 § <5 § 7 52.9
Vista 8 8.0 5 9.9 <5 § 8 18.2 <5 § <5 § <5 § <5 § <5 § <5 § <5 § <5 § 8 79.3
North Inland Region 29 5.1 15 5.3 14 4.8 26 8.3 <5 § <5 § <5 § <5 § <5 § <5 § <5 § <5 § 27 37.4
Anza‐Borrego Springs <5 § <5 § <5 § <5 § <5 § <5 § <5 § <5 § <5 § <5 § <5 § <5 § <5 §
Escondido 12 7.4 6 7.4 6 7.3 10 14.1 <5 § <5 § <5 § <5 § <5 § <5 § <5 § <5 § 11 62.8
Fallbrook 7 14.8 <5 § <5 § 7 25.6 <5 § <5 § <5 § <5 § <5 § <5 § <5 § <5 § 6 73.3
North San Diego <5 § <5 § <5 § <5 § <5 § <5 § <5 § <5 § <5 § <5 § <5 § <5 § <5 §
Palomar‐Julian <5 § <5 § <5 § <5 § <5 § <5 § <5 § <5 § <5 § <5 § <5 § <5 § <5 §
Pauma <5 § <5 § <5 § <5 § <5 § <5 § <5 § <5 § <5 § <5 § <5 § <5 § <5 §
Poway <5 § <5 § <5 § <5 § <5 § <5 § <5 § <5 § <5 § <5 § <5 § <5 § <5 §
Ramona <5 § <5 § <5 § <5 § <5 § <5 § <5 § <5 § <5 § <5 § <5 § <5 § <5 §
San Marcos <5 § <5 § <5 § <5 § <5 § <5 § <5 § <5 § <5 § <5 § <5 § <5 § <5 §
Valley Center <5 § <5 § <5 § <5 § <5 § <5 § <5 § <5 § <5 § <5 § <5 § <5 § <5 §
South Region 17 3.6 11 4.7 6 2.6 9 9.2 <5 § 5 1.8 <5 § <5 § <5 § <5 § <5 § <5 § 14 28.8
Chula Vista 9 7.8 5 9.0 <5 § 5 23.4 <5 § <5 § <5 § <5 § <5 § <5 § <5 § <5 § 6 41.3
Coronado <5 § <5 § <5 § <5 § <5 § <5 § <5 § <5 § <5 § <5 § <5 § <5 § <5 §
National City <5 § <5 § <5 § <5 § <5 § <5 § <5 § <5 § <5 § <5 § <5 § <5 § <5 §
South Bay <5 § <5 § <5 § <5 § <5 § <5 § <5 § <5 § <5 § <5 § <5 § <5 § <5 §
Sweetwater <5 § <5 § <5 § <5 § <5 § <5 § <5 § <5 § <5 § <5 § <5 § <5 § <5 §Unknown <5 ‐‐ <5 ‐‐ <5 ‐‐ <5 ‐‐ <5 ‐‐ <5 ‐‐ <5 ‐‐ <5 ‐‐ <5 ‐‐ <5 ‐‐ <5 ‐‐ <5 ‐‐ <5 ‐‐*Rates per 100,000 population. County age‐adjusted rates per 100,000 2000 US standard population.**Harbison Crest/El Cajon is an aggregation of the Harbison Crest and El Cajon SRAs. Due to geographic limitations, the Harbison Crest SRA is not shown alone. See the Data Guide for more information.
***Numbers may not add up to totals due to unknown or missing details.
†Alzheimer's disease Emergency Department Discharge refers to (principal diagnosis) ICD‐9 code 331.
‡API includes Asian, Pacific Islander, Na ve Hawaiian. Other includes 2 or more races, Na ve American/Alaska Na ve, American Indian, or other.
§Rates not calculated for fewer than 5 events. Rates not calculated in cases where zip code is unknown.
Source: Emergency Department Discharge Database (CA OSHPD), County of San Diego, Health & Human Services Agency, Public Health Services, Emergency Medical Services; SANDAG, Current Population Estimates, 10/2012.
Prepared by: County of San Diego, Health & Human Services Agency, Public Health Services, Community Health Statistics Unit, 2013.
Black Other‡ Ages 0‐14 Ages 15‐24 Ages 25‐44API‡
Alzheimer's Disease† Emergency Department Discharges Among San Diego County Residents by Loca on of Residence, 2010 Detail
Geography2010 Total
Gender Race/Ethnicity Age Group
Male Ages 65+Female White Ages 45‐64Hispanic
County of San Diego, Health & Human Services Agency, Public Health Services, Community Health Statisitcs Unit Page 34

No. Rate* No. Rate* No. Rate* No. Rate* No. Rate* No. Rate* No. Rate* No. Rate* No. Rate* No. Rate* No. Rate* No. Rate* No. Rate*
San Diego County (Actual Rate) 180 5.8 87 5.6 93 6.0 128 8.6 9 6.3 28 2.8 9 2.6 6 5.1 5 0.8 <5 § <5 § 11 1.4 160 44.2
San Diego County (Age‐Adjusted Rate) 180 5.9
Central Region 17 3.5 9 3.6 8 3.4 7 4.9 5 9.1 <5 § <5 § <5 § <5 § <5 § <5 § <5 § 17 38.6
Central San Diego 5 3.0 <5 § <5 § <5 § <5 § <5 § <5 § <5 § <5 § <5 § <5 § <5 § 5 31.2
Mid‐City 6 3.7 5 6.2 <5 § 5 10.9 <5 § <5 § <5 § <5 § <5 § <5 § <5 § <5 § 6 46.5
Southeast San Diego 6 3.8 <5 § <5 § <5 § <5 § <5 § <5 § <5 § <5 § <5 § <5 § <5 § 6 39.7
East Region 28 6.0 10 4.4 18 7.6 15 5.4 <5 § 7 5.9 <5 § <5 § <5 § <5 § <5 § <5 § 26 44.5
Alpine <5 § <5 § <5 § <5 § <5 § <5 § <5 § <5 § <5 § <5 § <5 § <5 § <5 §
El Cajon 7 5.6 <5 § 5 7.8 <5 § <5 § <5 § <5 § <5 § <5 § <5 § <5 § <5 § 6 39.7
Harbison Crest/El Cajon** 13 9.3 <5 § 9 12.6 6 7.0 <5 § 5 13.8 <5 § <5 § <5 § <5 § <5 § <5 § 11 62.1
Jamul <5 § <5 § <5 § <5 § <5 § <5 § <5 § <5 § <5 § <5 § <5 § <5 § <5 §
La Mesa 5 8.3 <5 § <5 § <5 § <5 § <5 § <5 § <5 § <5 § <5 § <5 § <5 § 5 56.5
Laguna‐Pine Valley <5 § <5 § <5 § <5 § <5 § <5 § <5 § <5 § <5 § <5 § <5 § <5 § <5 §
Lakeside <5 § <5 § <5 § <5 § <5 § <5 § <5 § <5 § <5 § <5 § <5 § <5 § <5 §
Lemon Grove <5 § <5 § <5 § <5 § <5 § <5 § <5 § <5 § <5 § <5 § <5 § <5 § <5 §
Mountain Empire <5 § <5 § <5 § <5 § <5 § <5 § <5 § <5 § <5 § <5 § <5 § <5 § <5 §
Santee <5 § <5 § <5 § <5 § <5 § <5 § <5 § <5 § <5 § <5 § <5 § <5 § <5 §
Spring Valley <5 § <5 § <5 § <5 § <5 § <5 § <5 § <5 § <5 § <5 § <5 § <5 § <5 §
North Central Region 32 5.2 13 4.2 19 6.3 28 7.7 <5 § <5 § <5 § <5 § <5 § <5 § <5 § <5 § 29 39.4
Coastal <5 § <5 § <5 § <5 § <5 § <5 § <5 § <5 § <5 § <5 § <5 § <5 § <5 §
Del Mar‐Mira Mesa 5 3.2 <5 § <5 § <5 § <5 § <5 § <5 § <5 § <5 § <5 § <5 § <5 § <5 §
Elliott‐Navajo 8 8.9 5 11.5 <5 § 7 11.7 <5 § <5 § <5 § <5 § <5 § <5 § <5 § <5 § 8 58.5
Kearny Mesa 11 7.3 5 6.6 6 7.9 10 11.9 <5 § <5 § <5 § <5 § <5 § <5 § <5 § <5 § 11 56.7
Miramar <5 § <5 § <5 § <5 § <5 § <5 § <5 § <5 § <5 § <5 § <5 § <5 § <5 §
Peninsula <5 § <5 § <5 § <5 § <5 § <5 § <5 § <5 § <5 § <5 § <5 § <5 § <5 §
University <5 § <5 § <5 § <5 § <5 § <5 § <5 § <5 § <5 § <5 § <5 § <5 § <5 §
North Coastal Region 47 9.2 29 11.2 18 7.2 38 12.7 <5 § 5 3.4 <5 § <5 § 5 5.0 <5 § <5 § <5 § 40 64.9
Carlsbad 7 6.0 <5 § <5 § 7 8.3 <5 § <5 § <5 § <5 § <5 § <5 § <5 § <5 § 7 37.9
Oceanside 16 10.0 9 11.3 7 8.7 13 17.6 <5 § <5 § <5 § <5 § <5 § <5 § <5 § <5 § 12 64.1
Pendleton <5 § <5 § <5 § <5 § <5 § <5 § <5 § <5 § <5 § <5 § <5 § <5 § <5 §
San Dieguito 13 13.7 8 17.1 5 10.4 13 17.6 <5 § <5 § <5 § <5 § <5 § <5 § <5 § <5 § 11 78.8
Vista 11 10.9 8 15.7 <5 § 5 11.5 <5 § <5 § <5 § <5 § <5 § <5 § <5 § <5 § 10 96.1
North Inland Region 38 6.6 16 5.7 22 7.5 30 9.6 <5 § 6 3.6 <5 § <5 § <5 § <5 § <5 § <5 § 32 42.9
Anza‐Borrego Springs <5 § <5 § <5 § <5 § <5 § <5 § <5 § <5 § <5 § <5 § <5 § <5 § <5 §
Escondido 13 7.9 5 6.1 8 9.7 10 14.2 <5 § <5 § <5 § <5 § <5 § <5 § <5 § <5 § 10 56.1
Fallbrook 5 10.4 <5 § <5 § <5 § <5 § <5 § <5 § <5 § <5 § <5 § <5 § <5 § <5 §
North San Diego 8 7.4 <5 § 6 10.8 6 9.6 <5 § <5 § <5 § <5 § <5 § <5 § <5 § <5 § 8 60.1
Palomar‐Julian <5 § <5 § <5 § <5 § <5 § <5 § <5 § <5 § <5 § <5 § <5 § <5 § <5 §
Pauma <5 § <5 § <5 § <5 § <5 § <5 § <5 § <5 § <5 § <5 § <5 § <5 § <5 §
Poway <5 § <5 § <5 § <5 § <5 § <5 § <5 § <5 § <5 § <5 § <5 § <5 § <5 §
Ramona <5 § <5 § <5 § <5 § <5 § <5 § <5 § <5 § <5 § <5 § <5 § <5 § <5 §
San Marcos 9 10.0 5 11.3 <5 § 7 15.6 <5 § <5 § <5 § <5 § <5 § <5 § <5 § <5 § 8 67.2
Valley Center <5 § <5 § <5 § <5 § <5 § <5 § <5 § <5 § <5 § <5 § <5 § <5 § <5 §
South Region 18 3.8 10 4.3 8 3.4 10 10.4 <5 § 6 2.1 <5 § <5 § <5 § <5 § <5 § <5 § 16 32.4
Chula Vista 7 6.0 5 9.0 <5 § <5 § <5 § <5 § <5 § <5 § <5 § <5 § <5 § <5 § 6 40.9
Coronado <5 § <5 § <5 § <5 § <5 § <5 § <5 § <5 § <5 § <5 § <5 § <5 § <5 §
National City <5 § <5 § <5 § <5 § <5 § <5 § <5 § <5 § <5 § <5 § <5 § <5 § <5 §
South Bay 6 4.4 <5 § <5 § <5 § <5 § <5 § <5 § <5 § <5 § <5 § <5 § <5 § 5 37.9
Sweetwater <5 § <5 § <5 § <5 § <5 § <5 § <5 § <5 § <5 § <5 § <5 § <5 § <5 §Unknown <5 ‐‐ <5 ‐‐ <5 ‐‐ <5 ‐‐ <5 ‐‐ <5 ‐‐ <5 ‐‐ <5 ‐‐ <5 ‐‐ <5 ‐‐ <5 ‐‐ <5 ‐‐ <5 ‐‐*Rates per 100,000 population. County age‐adjusted rates per 100,000 2000 US standard population.**Harbison Crest/El Cajon is an aggregation of the Harbison Crest and El Cajon SRAs. Due to geographic limitations, the Harbison Crest SRA is not shown alone. See the Data Guide for more information.
***Numbers may not add up to totals due to unknown or missing details.
†Alzheimer's disease Emergency Department Discharge refers to (principal diagnosis) ICD‐9 code 331.
‡API includes Asian, Pacific Islander, Na ve Hawaiian. Other includes 2 or more races, Na ve American/Alaska Na ve, American Indian, or other.
§Rates not calculated for fewer than 5 events. Rates not calculated in cases where zip code is unknown.
Source: Emergency Department Discharge Database (CA OSHPD), County of San Diego, Health & Human Services Agency, Public Health Services, Emergency Medical Services; SANDAG, Current Population Estimates, 10/2012.
Prepared by: County of San Diego, Health & Human Services Agency, Public Health Services, Community Health Statistics Unit, 2013.
Ages 65+API‡ Other‡ Ages 0‐14Geography2011 Total
Gender
Alzheimer's Disease† Emergency Department Discharges Among San Diego County Residents by Loca on of Residence, 2011 Detail
Race/Ethnicity Age Group
Male Female White Black Hispanic Ages 15‐24 Ages 25‐44 Ages 45‐64
County of San Diego, Health & Human Services Agency, Public Health Services, Community Health Statisitcs Unit Page 35

Anxiety Disorders
County of San Diego, Health & Human Services Agency, Public Health Services, Community Health Statisitcs Unit Page 36

No. Rate* No. Rate* No. Rate* No. Rate* No. Rate* No. Rate* No. Rate* No. Rate* No. Rate* No. Rate* No. Rate*
San Diego County (Actual Rate) 483 15.6 578 18.6
San Diego County (Age‐Adjusted Rate) 483 15.3 578 18.0
Central Region 72 14.9 105 21.6
Central San Diego 35 21.1 43 25.9
Mid‐City 23 14.1 32 19.6
Southeast San Diego 14 9.0 30 19.2
East Region 104 22.5 127 27.2
Alpine <5 § <5 §
El Cajon 22 17.7 28 22.4
Harbison Crest/El Cajon** 43 30.9 49 35.0
Jamul <5 § <5 §
La Mesa 17 28.8 20 33.3
Laguna‐Pine Valley <5 § <5 §
Lakeside 7 12.5 15 26.6
Lemon Grove 8 26.8 11 36.7
Mountain Empire <5 § <5 §
Santee 11 21.5 7 13.5
Spring Valley 11 13.6 14 17.1
North Central Region 93 15.4 111 18.2
Coastal 14 18.6 16 21.2
Del Mar‐Mira Mesa 13 8.3 12 7.6
Elliott‐Navajo 17 19.1 31 34.7
Kearny Mesa 32 21.2 41 27.0
Miramar <5 § <5 §
Peninsula 14 22.2 <5 §
University <5 § 7 10.5
North Coastal Region 63 12.5 84 16.5
Carlsbad 10 8.7 14 12.1
Oceanside 27 16.9 29 18.1
Pendleton <5 § <5 §
San Dieguito 14 15.0 17 17.9
Vista 9 9.0 21 20.7
North Inland Region 87 15.3 71 12.4
Anza‐Borrego Springs <5 § <5 §
Escondido 29 17.8 15 9.1
Fallbrook 12 25.4 7 14.6
North San Diego 17 16.0 11 10.2
Palomar‐Julian <5 § <5 §
Pauma <5 § <5 §
Poway 12 13.9 14 16.1
Ramona 5 14.3 6 16.9
San Marcos 9 10.0 14 15.5
Valley Center <5 § <5 §
South Region 64 13.7 80 17.0
Chula Vista 28 24.3 40 34.5
Coronado <5 § <5 §
National City 6 10.3 9 15.4
South Bay 18 13.3 18 13.3
Sweetwater 9 6.7 10 7.3Unknown <5 ‐‐‐ <5 ‐‐‐*Rates per 100,000 population. County age‐adjusted rates per 100,000 2000 US standard population.**Harbison Crest/El Cajon is an aggregation of the Harbison Crest and El Cajon SRAs. Due to geographic limitations, the Harbison Crest SRA is not shown alone. See the Data Guide for more information.†Anxiety disorder‐related hospitaliza on refers to (principal diagnosis) ICD‐9 codes 293.84, 300, 308, 309.81, 313.00‐313.22, 313.3, 313.83‐313.84.§Rates not calculated for fewer than 5 events. Rates not calculated in cases where zip code is unknown.Source: Patient Discharge Database (CA OSHPD), County of San Diego, Health & Human Services Agency, Public Health Services, Epidemiology & Immunization Services Branch; SANDAG, Current Population Estimates, 10/2012.Prepared by: County of San Diego, Health & Human Services Agency, Public Health Services, Community Health Statistics Unit, 2013.
Anxiety Disorder‐related† Hospitaliza ons Among San Diego County Residents by Location of Residence
Geography2010 Total 2011 Total 2012 Total 2013 Total 2014 Total 2015 Total 2016 Total 2017 Total 2018 Total 2019 Total 2020 Total
County of San Diego, Health & Human Services Agency, Public Health Services, Community Health Statisitcs Unit Page 37
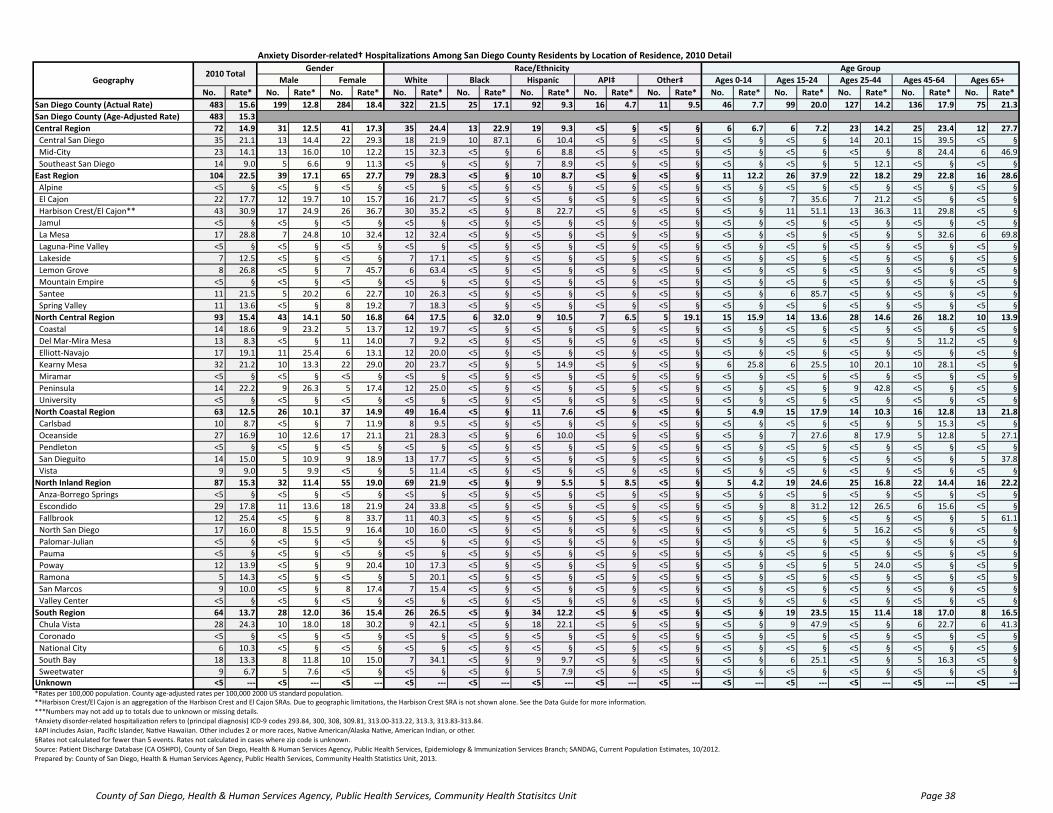
No. Rate* No. Rate* No. Rate* No. Rate* No. Rate* No. Rate* No. Rate* No. Rate* No. Rate* No. Rate* No. Rate* No. Rate* No. Rate*
San Diego County (Actual Rate) 483 15.6 199 12.8 284 18.4 322 21.5 25 17.1 92 9.3 16 4.7 11 9.5 46 7.7 99 20.0 127 14.2 136 17.9 75 21.3
San Diego County (Age‐Adjusted Rate) 483 15.3
Central Region 72 14.9 31 12.5 41 17.3 35 24.4 13 22.9 19 9.3 <5 § <5 § 6 6.7 6 7.2 23 14.2 25 23.4 12 27.7
Central San Diego 35 21.1 13 14.4 22 29.3 18 21.9 10 87.1 6 10.4 <5 § <5 § <5 § <5 § 14 20.1 15 39.5 <5 §
Mid‐City 23 14.1 13 16.0 10 12.2 15 32.3 <5 § 6 8.8 <5 § <5 § <5 § <5 § <5 § 8 24.4 6 46.9
Southeast San Diego 14 9.0 5 6.6 9 11.3 <5 § <5 § 7 8.9 <5 § <5 § <5 § <5 § 5 12.1 <5 § <5 §
East Region 104 22.5 39 17.1 65 27.7 79 28.3 <5 § 10 8.7 <5 § <5 § 11 12.2 26 37.9 22 18.2 29 22.8 16 28.6
Alpine <5 § <5 § <5 § <5 § <5 § <5 § <5 § <5 § <5 § <5 § <5 § <5 § <5 §
El Cajon 22 17.7 12 19.7 10 15.7 16 21.7 <5 § <5 § <5 § <5 § <5 § 7 35.6 7 21.2 <5 § <5 §
Harbison Crest/El Cajon** 43 30.9 17 24.9 26 36.7 30 35.2 <5 § 8 22.7 <5 § <5 § <5 § 11 51.1 13 36.3 11 29.8 <5 §
Jamul <5 § <5 § <5 § <5 § <5 § <5 § <5 § <5 § <5 § <5 § <5 § <5 § <5 §
La Mesa 17 28.8 7 24.8 10 32.4 12 32.4 <5 § <5 § <5 § <5 § <5 § <5 § <5 § 5 32.6 6 69.8
Laguna‐Pine Valley <5 § <5 § <5 § <5 § <5 § <5 § <5 § <5 § <5 § <5 § <5 § <5 § <5 §
Lakeside 7 12.5 <5 § <5 § 7 17.1 <5 § <5 § <5 § <5 § <5 § <5 § <5 § <5 § <5 §
Lemon Grove 8 26.8 <5 § 7 45.7 6 63.4 <5 § <5 § <5 § <5 § <5 § <5 § <5 § <5 § <5 §
Mountain Empire <5 § <5 § <5 § <5 § <5 § <5 § <5 § <5 § <5 § <5 § <5 § <5 § <5 §
Santee 11 21.5 5 20.2 6 22.7 10 26.3 <5 § <5 § <5 § <5 § <5 § 6 85.7 <5 § <5 § <5 §
Spring Valley 11 13.6 <5 § 8 19.2 7 18.3 <5 § <5 § <5 § <5 § <5 § <5 § <5 § <5 § <5 §
North Central Region 93 15.4 43 14.1 50 16.8 64 17.5 6 32.0 9 10.5 7 6.5 5 19.1 15 15.9 14 13.6 28 14.6 26 18.2 10 13.9
Coastal 14 18.6 9 23.2 5 13.7 12 19.7 <5 § <5 § <5 § <5 § <5 § <5 § <5 § <5 § <5 §
Del Mar‐Mira Mesa 13 8.3 <5 § 11 14.0 7 9.2 <5 § <5 § <5 § <5 § <5 § <5 § <5 § 5 11.2 <5 §
Elliott‐Navajo 17 19.1 11 25.4 6 13.1 12 20.0 <5 § <5 § <5 § <5 § <5 § <5 § <5 § <5 § <5 §
Kearny Mesa 32 21.2 10 13.3 22 29.0 20 23.7 <5 § 5 14.9 <5 § <5 § 6 25.8 6 25.5 10 20.1 10 28.1 <5 §
Miramar <5 § <5 § <5 § <5 § <5 § <5 § <5 § <5 § <5 § <5 § <5 § <5 § <5 §
Peninsula 14 22.2 9 26.3 5 17.4 12 25.0 <5 § <5 § <5 § <5 § <5 § <5 § 9 42.8 <5 § <5 §
University <5 § <5 § <5 § <5 § <5 § <5 § <5 § <5 § <5 § <5 § <5 § <5 § <5 §
North Coastal Region 63 12.5 26 10.1 37 14.9 49 16.4 <5 § 11 7.6 <5 § <5 § 5 4.9 15 17.9 14 10.3 16 12.8 13 21.8
Carlsbad 10 8.7 <5 § 7 11.9 8 9.5 <5 § <5 § <5 § <5 § <5 § <5 § <5 § 5 15.3 <5 §
Oceanside 27 16.9 10 12.6 17 21.1 21 28.3 <5 § 6 10.0 <5 § <5 § <5 § 7 27.6 8 17.9 5 12.8 5 27.1
Pendleton <5 § <5 § <5 § <5 § <5 § <5 § <5 § <5 § <5 § <5 § <5 § <5 § <5 §
San Dieguito 14 15.0 5 10.9 9 18.9 13 17.7 <5 § <5 § <5 § <5 § <5 § <5 § <5 § <5 § 5 37.8
Vista 9 9.0 5 9.9 <5 § 5 11.4 <5 § <5 § <5 § <5 § <5 § <5 § <5 § <5 § <5 §
North Inland Region 87 15.3 32 11.4 55 19.0 69 21.9 <5 § 9 5.5 5 8.5 <5 § 5 4.2 19 24.6 25 16.8 22 14.4 16 22.2
Anza‐Borrego Springs <5 § <5 § <5 § <5 § <5 § <5 § <5 § <5 § <5 § <5 § <5 § <5 § <5 §
Escondido 29 17.8 11 13.6 18 21.9 24 33.8 <5 § <5 § <5 § <5 § <5 § 8 31.2 12 26.5 6 15.6 <5 §
Fallbrook 12 25.4 <5 § 8 33.7 11 40.3 <5 § <5 § <5 § <5 § <5 § <5 § <5 § <5 § 5 61.1
North San Diego 17 16.0 8 15.5 9 16.4 10 16.0 <5 § <5 § <5 § <5 § <5 § <5 § 5 16.2 <5 § <5 §
Palomar‐Julian <5 § <5 § <5 § <5 § <5 § <5 § <5 § <5 § <5 § <5 § <5 § <5 § <5 §
Pauma <5 § <5 § <5 § <5 § <5 § <5 § <5 § <5 § <5 § <5 § <5 § <5 § <5 §
Poway 12 13.9 <5 § 9 20.4 10 17.3 <5 § <5 § <5 § <5 § <5 § <5 § 5 24.0 <5 § <5 §
Ramona 5 14.3 <5 § <5 § 5 20.1 <5 § <5 § <5 § <5 § <5 § <5 § <5 § <5 § <5 §
San Marcos 9 10.0 <5 § 8 17.4 7 15.4 <5 § <5 § <5 § <5 § <5 § <5 § <5 § <5 § <5 §
Valley Center <5 § <5 § <5 § <5 § <5 § <5 § <5 § <5 § <5 § <5 § <5 § <5 § <5 §
South Region 64 13.7 28 12.0 36 15.4 26 26.5 <5 § 34 12.2 <5 § <5 § <5 § 19 23.5 15 11.4 18 17.0 8 16.5
Chula Vista 28 24.3 10 18.0 18 30.2 9 42.1 <5 § 18 22.1 <5 § <5 § <5 § 9 47.9 <5 § 6 22.7 6 41.3
Coronado <5 § <5 § <5 § <5 § <5 § <5 § <5 § <5 § <5 § <5 § <5 § <5 § <5 §
National City 6 10.3 <5 § <5 § <5 § <5 § <5 § <5 § <5 § <5 § <5 § <5 § <5 § <5 §
South Bay 18 13.3 8 11.8 10 15.0 7 34.1 <5 § 9 9.7 <5 § <5 § <5 § 6 25.1 <5 § 5 16.3 <5 §
Sweetwater 9 6.7 5 7.6 <5 § <5 § <5 § 5 7.9 <5 § <5 § <5 § <5 § <5 § <5 § <5 §Unknown <5 ‐‐‐ <5 ‐‐‐ <5 ‐‐‐ <5 ‐‐‐ <5 ‐‐‐ <5 ‐‐‐ <5 ‐‐‐ <5 ‐‐‐ <5 ‐‐‐ <5 ‐‐‐ <5 ‐‐‐ <5 ‐‐‐ <5 ‐‐‐*Rates per 100,000 population. County age‐adjusted rates per 100,000 2000 US standard population.**Harbison Crest/El Cajon is an aggregation of the Harbison Crest and El Cajon SRAs. Due to geographic limitations, the Harbison Crest SRA is not shown alone. See the Data Guide for more information.
***Numbers may not add up to totals due to unknown or missing details.
†Anxiety disorder‐related hospitaliza on refers to (principal diagnosis) ICD‐9 codes 293.84, 300, 308, 309.81, 313.00‐313.22, 313.3, 313.83‐313.84.
‡API includes Asian, Pacific Islander, Na ve Hawaiian. Other includes 2 or more races, Na ve American/Alaska Na ve, American Indian, or other.
§Rates not calculated for fewer than 5 events. Rates not calculated in cases where zip code is unknown.
Source: Patient Discharge Database (CA OSHPD), County of San Diego, Health & Human Services Agency, Public Health Services, Epidemiology & Immunization Services Branch; SANDAG, Current Population Estimates, 10/2012.
Prepared by: County of San Diego, Health & Human Services Agency, Public Health Services, Community Health Statistics Unit, 2013.
Ages 45‐64Hispanic
Anxiety Disorder‐related† Hospitaliza ons Among San Diego County Residents by Loca on of Residence, 2010 Detail
Geography2010 Total
Gender Race/Ethnicity Age Group
Male Ages 65+Female White Black Other‡ Ages 0‐14 Ages 15‐24 Ages 25‐44API‡
County of San Diego, Health & Human Services Agency, Public Health Services, Community Health Statisitcs Unit Page 38

No. Rate* No. Rate* No. Rate* No. Rate* No. Rate* No. Rate* No. Rate* No. Rate* No. Rate* No. Rate* No. Rate* No. Rate* No. Rate*
San Diego County (Actual Rate) 578 18.6 233 14.9 345 22.2 346 23.1 36 25.2 141 13.9 20 5.7 19 16.1 42 7.1 143 28.7 153 17.2 151 19.6 89 24.6
San Diego County (Age‐Adjusted Rate) 578 18.0
Central Region 105 21.6 50 20.2 55 23.2 48 33.7 13 23.7 37 17.8 5 7.7 <5 § 10 11.1 27 33.6 31 19.1 26 24.0 11 25.0
Central San Diego 43 25.9 19 21.0 24 31.8 22 26.9 8 72.0 12 20.5 <5 § <5 § <5 § 12 57.9 13 18.5 12 31.0 <5 §
Mid‐City 32 19.6 18 22.1 14 17.1 19 41.5 <5 § 10 14.4 <5 § <5 § <5 § 5 15.5 12 23.7 8 23.9 6 46.5
Southeast San Diego 30 19.2 13 17.1 17 21.2 7 47.6 <5 § 15 18.8 <5 § <5 § 6 16.6 10 36.7 6 14.5 6 16.5 <5 §
East Region 127 27.2 49 21.3 78 32.9 78 28.0 7 26.9 23 19.3 <5 § 9 42.0 9 10.1 24 34.6 26 21.5 46 35.7 22 37.6
Alpine <5 § <5 § <5 § <5 § <5 § <5 § <5 § <5 § <5 § <5 § <5 § <5 § <5 §
El Cajon 28 22.4 10 16.3 18 28.2 19 25.8 <5 § <5 § <5 § <5 § <5 § 8 40.6 5 15.1 12 37.5 <5 §
Harbison Crest/El Cajon** 49 35.0 20 29.1 29 40.7 30 35.2 <5 § 7 19.3 <5 § 6 87.0 <5 § 11 50.8 8 22.3 20 53.7 7 39.5
Jamul <5 § <5 § <5 § <5 § <5 § <5 § <5 § <5 § <5 § <5 § <5 § <5 § <5 §
La Mesa 20 33.3 8 27.9 12 38.3 13 34.9 <5 § <5 § <5 § <5 § <5 § <5 § 6 34.4 9 57.4 <5 §
Laguna‐Pine Valley <5 § <5 § <5 § <5 § <5 § <5 § <5 § <5 § <5 § <5 § <5 § <5 § <5 §
Lakeside 15 26.6 10 35.9 5 17.6 11 26.9 <5 § <5 § <5 § <5 § <5 § <5 § 5 34.7 <5 § <5 §
Lemon Grove 11 36.7 <5 § 8 52.0 <5 § <5 § <5 § <5 § <5 § <5 § <5 § <5 § <5 § <5 §
Mountain Empire <5 § <5 § <5 § <5 § <5 § <5 § <5 § <5 § <5 § <5 § <5 § <5 § <5 §
Santee 7 13.5 <5 § <5 § 7 18.3 <5 § <5 § <5 § <5 § <5 § <5 § <5 § <5 § <5 §
Spring Valley 14 17.1 <5 § 10 23.8 8 20.9 <5 § <5 § <5 § <5 § <5 § <5 § <5 § 5 23.0 5 50.8
North Central Region 111 18.2 43 13.9 68 22.6 80 21.9 5 26.7 15 17.1 7 6.3 <5 § 13 13.8 32 30.9 34 17.6 18 12.5 14 19.0
Coastal 16 21.2 7 18.0 9 24.6 14 23.1 <5 § <5 § <5 § <5 § <5 § 5 45.3 6 21.5 <5 § <5 §
Del Mar‐Mira Mesa 12 7.6 7 8.8 5 6.3 11 14.5 <5 § <5 § <5 § <5 § <5 § <5 § <5 § <5 § <5 §
Elliott‐Navajo 31 34.7 8 18.4 23 50.0 16 26.7 <5 § 7 53.1 <5 § <5 § 7 41.3 9 83.1 10 39.4 <5 § <5 §
Kearny Mesa 41 27.0 15 19.9 26 34.2 30 35.7 <5 § 6 17.6 <5 § <5 § 5 21.3 12 54.6 12 23.7 9 24.9 <5 §
Miramar <5 § <5 § <5 § <5 § <5 § <5 § <5 § <5 § <5 § <5 § <5 § <5 § <5 §
Peninsula <5 § <5 § <5 § <5 § <5 § <5 § <5 § <5 § <5 § <5 § <5 § <5 § <5 §
University 7 10.5 <5 § <5 § 6 17.5 <5 § <5 § <5 § <5 § <5 § <5 § <5 § <5 § <5 §
North Coastal Region 84 16.5 32 12.3 52 20.8 63 21.1 5 34.9 11 7.5 <5 § <5 § <5 § 22 26.1 22 16.1 23 18.1 15 24.3
Carlsbad 14 12.1 <5 § 10 16.8 13 15.4 <5 § <5 § <5 § <5 § <5 § <5 § <5 § 7 21.1 <5 §
Oceanside 29 18.1 13 16.4 16 19.8 19 25.8 <5 § <5 § <5 § <5 § <5 § 11 44.4 11 24.6 5 12.7 <5 §
Pendleton <5 § <5 § <5 § <5 § <5 § <5 § <5 § <5 § <5 § <5 § <5 § <5 § <5 §
San Dieguito 17 17.9 <5 § 14 29.0 16 21.6 <5 § <5 § <5 § <5 § <5 § <5 § <5 § 5 16.8 7 50.1
Vista 21 20.7 9 17.6 12 23.9 13 29.8 <5 § 5 10.5 <5 § <5 § <5 § <5 § 7 24.2 6 24.9 <5 §
North Inland Region 71 12.4 34 12.0 37 12.7 50 15.9 <5 § 12 7.1 <5 § <5 § <5 § 17 21.3 21 14.3 16 10.4 13 17.4
Anza‐Borrego Springs <5 § <5 § <5 § <5 § <5 § <5 § <5 § <5 § <5 § <5 § <5 § <5 § <5 §
Escondido 15 9.1 8 9.8 7 8.5 6 8.5 <5 § 6 7.9 <5 § <5 § <5 § <5 § 6 13.3 5 12.8 <5 §
Fallbrook 7 14.6 <5 § 5 20.8 6 22.0 <5 § <5 § <5 § <5 § <5 § <5 § <5 § <5 § <5 §
North San Diego 11 10.2 5 9.6 6 10.8 8 12.7 <5 § <5 § <5 § <5 § <5 § <5 § <5 § <5 § <5 §
Palomar‐Julian <5 § <5 § <5 § <5 § <5 § <5 § <5 § <5 § <5 § <5 § <5 § <5 § <5 §
Pauma <5 § <5 § <5 § <5 § <5 § <5 § <5 § <5 § <5 § <5 § <5 § <5 § <5 §
Poway 14 16.1 11 25.9 <5 § 9 15.5 <5 § <5 § <5 § <5 § <5 § 5 45.6 <5 § 5 18.3 <5 §
Ramona 6 16.9 <5 § <5 § 6 24.0 <5 § <5 § <5 § <5 § <5 § <5 § <5 § <5 § <5 §
San Marcos 14 15.5 5 11.3 9 19.5 12 26.7 <5 § <5 § <5 § <5 § <5 § <5 § 5 20.1 <5 § <5 §
Valley Center <5 § <5 § <5 § <5 § <5 § <5 § <5 § <5 § <5 § <5 § <5 § <5 § <5 §
South Region 80 17.0 25 10.7 55 23.3 27 28.1 <5 § 43 15.3 <5 § <5 § <5 § 21 25.9 19 14.6 22 20.4 14 28.3
Chula Vista 40 34.5 9 16.1 31 51.6 12 57.3 <5 § 23 27.9 <5 § <5 § <5 § 13 68.4 9 29.1 10 37.1 8 54.5
Coronado <5 § <5 § <5 § <5 § <5 § <5 § <5 § <5 § <5 § <5 § <5 § <5 § <5 §
National City 9 15.4 5 16.7 <5 § <5 § <5 § 6 16.0 <5 § <5 § <5 § <5 § <5 § <5 § <5 §
South Bay 18 13.3 7 10.3 11 16.4 6 29.8 <5 § 10 10.7 <5 § <5 § <5 § <5 § 5 13.3 5 16.2 <5 §
Sweetwater 10 7.3 <5 § 6 8.6 <5 § <5 § <5 § <5 § <5 § <5 § <5 § <5 § 5 15.2 <5 §Unknown <5 ‐‐‐ <5 ‐‐‐ <5 ‐‐‐ <5 ‐‐‐ <5 ‐‐‐ <5 ‐‐‐ <5 ‐‐‐ <5 ‐‐‐ <5 ‐‐‐ <5 ‐‐‐ <5 ‐‐‐ <5 ‐‐‐ <5 ‐‐‐* Rates per 100,000 population. County age‐adjusted rates per 100,000 2000 US standard population.**Harbison Crest/El Cajon is an aggregation of the Harbison Crest and El Cajon SRAs. Due to geographic limitations, the Harbison Crest SRA is not shown alone. See the Data Guide for more information.
***Numbers may not add up to totals due to unknown or missing details.
†Anxiety disorder‐related hospitaliza on refers to (principal diagnosis) ICD‐9 codes 293.84, 300, 308, 309.81, 313.00‐313.22, 313.3, 313.83‐313.84.
‡API includes Asian, Pacific Islander, Na ve Hawaiian. Other includes 2 or more races, Na ve American/Alaska Na ve, American Indian, or other.
§Rates not calculated for fewer than 5 events. Rates not calculated in cases where zip code is unknown.
Source: Patient Discharge Database (CA OSHPD), County of San Diego, Health & Human Services Agency, Public Health Services, Epidemiology & Immunization Services Branch; SANDAG, Current Population Estimates, 10/2012.
Prepared by: County of San Diego, Health & Human Services Agency, Public Health Services, Community Health Statistics Unit, 2013.
Ages 15‐24 Ages 25‐44 Ages 45‐64Male Female White Black Hispanic
Gender
Anxiety Disorder‐related† Hospitaliza ons Among San Diego County Residents by Loca on of Residence, 2011 Detail
Race/Ethnicity Age Group
Ages 65+API‡ Other‡ Ages 0‐14Geography2011 Total
County of San Diego, Health & Human Services Agency, Public Health Services, Community Health Statisitcs Unit Page 39

No. Rate* No. Rate* No. Rate* No. Rate* No. Rate* No. Rate* No. Rate* No. Rate* No. Rate* No. Rate* No. Rate*
San Diego County (Actual Rate) 7,346 237.3 7,719 247.7
San Diego County (Age‐Adjusted Rate) 7,346 230.7 7,719 241.0
Central Region 1,552 320.4 1,605 330.5
Central San Diego 624 376.9 585 352.5
Mid‐City 453 277.8 432 264.7
Southeast San Diego 475 304.9 588 375.9
East Region 1,256 271.2 1,280 274.3
Alpine 23 153.0 30 197.9
El Cajon 262 210.4 274 218.7
Harbison Crest/El Cajon** 474 340.6 478 341.3
Jamul 62 327.0 50 284.4
La Mesa 194 328.3 196 326.7
Laguna‐Pine Valley <5 § <5 §
Lakeside 99 176.7 99 175.6
Lemon Grove 72 241.5 90 300.5
Mountain Empire 10 131.8 13 152.8
Santee 105 205.3 126 243.7
Spring Valley 213 263.0 194 237.3
North Central Region 896 148.4 994 163.0
Coastal 118 156.6 143 189.3
Del Mar‐Mira Mesa 120 76.2 143 90.2
Elliott‐Navajo 161 180.7 149 166.6
Kearny Mesa 348 230.1 387 255.1
Miramar <5 § <5 §
Peninsula 72 114.4 83 131.6
University 76 121.2 88 132.4
North Coastal Region 906 179.1 957 187.7
Carlsbad 114 99.4 116 100.1
Oceanside 401 251.1 420 262.3
Pendleton <5 § 11 29.2
San Dieguito 107 114.4 127 133.8
Vista 280 278.8 283 279.3
North Inland Region 1,175 206.3 1,308 227.7
Anza‐Borrego Springs 9 202.7 17 364.3
Escondido 462 283.4 558 339.8
Fallbrook 126 266.4 140 292.4
North San Diego 199 186.8 194 180.3
Palomar‐Julian 7 111.7 9 140.0
Pauma 10 134.1 10 128.7
Poway 122 141.3 137 157.7
Ramona 58 166.3 58 163.7
San Marcos 152 169.0 148 164.1
Valley Center 30 128.6 37 157.7
South Region 1,432 305.7 1,460 311.0
Chula Vista 639 554.5 617 532.3
Coronado 29 117.4 45 192.9
National City 231 396.1 240 410.3
South Bay 392 290.6 418 309.3
Sweetwater 141 104.2 140 102.5Unknown 129 ‐‐‐ 115 ‐‐‐*Rates per 100,000 population. County age‐adjusted rates per 100,000 2000 US standard population.**Harbison Crest/El Cajon is an aggregation of the Harbison Crest and El Cajon SRAs. Due to geographic limitations, the Harbison Crest SRA is not shown alone. See the Data Guide for more information.†Anxiety disorder‐related Emergency Department Discharge refers to (principal diagnosis) ICD‐9 codes 293.84, 300, 308, 309.81, 313.00‐313.22, 313.3, 313.83‐313.84.§Rates not calculated for fewer than 5 events. Rates not calculated in cases where zip code is unknown.Source: Emergency Department Discharge Database (CA OSHPD), County of San Diego, Health & Human Services Agency, Public Health Services, Emergency Medical Services; SANDAG, Current Population Estimates, 10/2012.Prepared by: County of San Diego, Health & Human Services Agency, Public Health Services, Community Health Statistics Unit, 2013.
Anxiety Disorder‐related† Emergency Department Discharges Among San Diego County Residents by Loca on of Residence
Geography2010 Total 2011 Total 2012 Total 2013 Total 2014 Total 2015 Total 2016 Total 2017 Total 2018 Total 2019 Total 2020 Total
County of San Diego, Health & Human Services Agency, Public Health Services, Community Health Statisitcs Unit Page 40

No. Rate* No. Rate* No. Rate* No. Rate* No. Rate* No. Rate* No. Rate* No. Rate* No. Rate* No. Rate* No. Rate* No. Rate* No. Rate*
San Diego County (Actual Rate) 7,346 237.3 2,920 187.9 4,426 287.1 3,759 250.6 586 399.7 2,385 240.6 302 88.4 222 191.8 149 25.0 1,539 310.4 3,037 340.7 1,994 262.2 627 178.4
San Diego County (Age‐Adjusted Rate) 7,346 230.7
Central Region 1,552 320.4 613 247.5 939 396.7 607 422.6 278 490.5 563 275.5 60 93.9 27 170.3 25 27.8 341 410.2 665 411.9 449 420.7 72 166.4
Central San Diego 624 376.9 280 309.3 344 458.4 324 393.7 89 775.1 186 322.8 <5 § 12 211.4 6 31.0 105 456.7 281 403.0 200 527.0 32 205.9
Mid‐City 453 277.8 166 204.4 287 350.7 175 376.7 75 388.2 166 242.5 24 101.9 11 209.4 6 17.7 110 330.5 201 398.8 110 335.7 26 203.4
Southeast San Diego 475 304.9 167 219.8 308 385.8 108 724.9 114 440.5 211 269.6 32 100.5 <5 § 13 35.5 126 469.0 183 442.9 139 386.1 14 93.6
East Region 1,256 271.2 458 200.8 798 339.5 798 285.8 118 444.0 272 235.3 27 130.6 29 138.1 26 28.9 260 379.4 514 424.1 365 286.4 91 162.6
Alpine 23 153.0 12 160.9 11 145.2 18 152.4 <5 § <5 § <5 § <5 § <5 § 6 304.1 11 336.1 5 102.7 <5 §
El Cajon 262 210.4 92 151.0 170 267.3 181 245.7 14 200.1 54 162.9 5 112.5 8 127.4 <5 § 48 244.2 107 324.1 89 280.8 15 102.3
Harbison Crest/El Cajon** 474 340.6 174 255.0 300 422.9 321 376.3 38 533.5 92 261.0 9 191.4 13 191.0 11 39.6 75 348.4 207 577.5 154 416.9 27 157.8
Jamul 62 327.0 24 220.2 38 471.5 32 305.2 <5 § 20 345.7 <5 § <5 § <5 § 12 378.1 29 604.7 14 233.8 6 302.3
La Mesa 194 328.3 66 234.2 128 414.1 126 340.1 22 531.1 38 320.6 <5 § <5 § <5 § 56 664.0 62 363.1 58 377.6 16 186.2
Laguna‐Pine Valley <5 § <5 § <5 § <5 § <5 § <5 § <5 § <5 § <5 § <5 § <5 § <5 § <5 §
Lakeside 99 176.7 31 111.9 68 240.1 81 198.3 6 607.3 7 67.5 <5 § <5 § <5 § 12 150.0 46 317.6 26 162.2 12 198.9
Lemon Grove 72 241.5 25 172.4 47 306.9 26 274.6 16 363.8 28 223.9 <5 § <5 § <5 § 17 372.5 29 361.4 20 261.7 <5 §
Mountain Empire 10 131.8 <5 § 8 228.2 7 169.1 <5 § <5 § <5 § <5 § <5 § <5 § <5 § 5 219.8 <5 §
Santee 105 205.3 44 177.7 61 231.2 84 221.2 <5 § 15 184.4 <5 § <5 § <5 § 35 500.1 41 295.6 19 128.8 8 139.9
Spring Valley 213 263.0 79 200.4 134 322.3 100 261.4 28 361.4 67 257.2 11 208.1 6 164.1 <5 § 45 372.4 85 403.6 64 296.7 16 170.0
North Central Region 896 148.4 348 113.9 548 183.6 613 167.9 41 218.5 130 151.8 55 50.8 47 180.0 19 20.1 167 162.8 373 194.3 246 172.1 91 126.6
Coastal 118 156.6 43 110.7 75 205.3 99 162.7 <5 § 9 111.9 <5 § 6 242.7 <5 § 22 197.4 53 191.4 27 164.1 13 104.9
Del Mar‐Mira Mesa 120 76.2 44 55.6 76 96.8 62 81.6 9 243.1 20 126.6 20 36.4 9 125.3 5 15.5 21 108.8 52 109.4 30 67.0 12 88.1
Elliott‐Navajo 161 180.7 67 155.0 94 204.9 111 184.7 9 223.8 23 177.3 5 65.0 10 230.8 <5 § 21 189.3 70 278.1 49 217.9 17 128.0
Kearny Mesa 348 230.1 138 183.2 210 276.8 224 265.6 21 312.7 62 185.2 22 111.0 13 190.1 5 21.5 73 309.9 131 263.5 105 294.7 34 178.3
Miramar <5 § <5 § <5 § <5 § <5 § <5 § <5 § <5 § <5 § <5 § <5 § <5 § <5 §
Peninsula 72 114.4 26 76.1 46 160.0 61 127.2 <5 § 8 97.6 <5 § <5 § <5 § 9 72.0 43 204.3 12 83.8 7 96.8
University 76 121.2 30 96.6 46 145.3 55 167.0 <5 § 8 130.4 5 24.9 8 316.5 <5 § 20 91.2 24 121.5 23 250.3 8 127.3
North Coastal Region 906 179.1 364 141.2 542 218.5 595 198.9 37 254.8 213 147.9 23 76.6 34 187.0 24 23.8 195 232.9 371 271.8 225 180.1 91 152.7
Carlsbad 114 99.4 44 78.9 70 118.8 101 119.7 <5 § 9 54.0 <5 § <5 75.5 <5 § 24 196.4 47 156.2 29 88.9 12 67.4
Oceanside 401 251.1 152 191.8 249 309.5 239 321.9 24 346.0 109 182.0 13 106.1 15 234.8 12 37.3 92 362.8 175 391.8 96 245.4 26 141.0
Pendleton <5 § <5 § <5 § <5 § <5 § <5 § <5 § <5 § <5 § <5 § <5 § <5 § <5 §
San Dieguito 107 114.4 39 84.8 68 143.1 82 111.8 <5 § 20 159.5 <5 § <5 § <5 § 20 213.2 36 146.0 29 98.8 19 143.6
Vista 280 278.8 125 246.5 155 311.7 170 387.6 13 480.2 74 158.6 6 144.7 15 491.0 7 32.8 56 334.2 112 390.1 71 301.3 34 336.8
North Inland Region 1,175 206.3 495 176.5 680 235.3 705 224.0 44 425.1 325 198.1 35 59.2 58 273.7 23 19.2 280 363.2 446 300.5 319 209.4 107 148.3
Anza‐Borrego Springs 9 202.7 6 267.1 <5 § 7 249.7 <5 § <5 § <5 § <5 § <5 § <5 § <5 § <5 § <5 §
Escondido 462 283.4 188 232.5 274 333.5 234 329.1 24 713.2 183 246.9 8 78.3 11 259.8 7 19.3 108 421.3 172 379.9 140 364.6 35 199.7
Fallbrook 126 266.4 47 199.6 79 332.5 70 256.4 <5 § 48 278.5 <5 § <5 § <5 § 34 477.3 44 440.6 32 242.9 12 146.6
North San Diego 199 186.8 92 178.7 107 194.4 135 215.5 11 431.9 7 65.7 14 54.6 30 596.1 <5 § 50 436.9 82 265.9 39 134.7 24 186.3
Palomar‐Julian 7 111.7 <5 § <5 § <5 § <5 § <5 § <5 § <5 § <5 § <5 § <5 § <5 § <5 §
Pauma 10 134.1 <5 § 6 166.1 5 161.2 <5 § 5 185.4 <5 § <5 § <5 § <5 § <5 § <5 § <5 §
Poway 122 141.3 52 123.3 70 158.6 97 167.3 <5 § 13 125.9 6 45.7 <5 § <5 § 31 306.7 44 211.5 34 126.5 12 110.9
Ramona 58 166.3 31 176.8 27 155.7 44 177.2 <5 § 13 158.3 <5 § <5 § <5 § 12 232.2 23 289.6 18 163.4 <5 §
San Marcos 152 169.0 61 138.6 91 198.0 95 209.1 5 283.8 44 134.9 <5 § <5 § <5 § 33 263.1 61 241.5 39 191.4 16 136.0
Valley Center 30 128.6 11 94.0 19 163.5 15 100.2 <5 § 7 120.7 <5 § <5 § <5 § 6 194.1 12 258.5 9 117.0 <5 §
South Region 1,432 305.7 560 239.2 872 372.0 368 375.0 58 294.4 851 306.4 99 166.4 23 171.4 31 30.6 271 335.4 602 456.4 357 336.8 171 352.1
Chula Vista 639 554.5 255 459.1 384 643.3 181 847.3 32 809.9 375 461.1 28 464.8 13 507.4 19 77.6 122 649.2 258 832.9 142 536.6 98 675.2
Coronado 29 117.4 9 61.9 20 196.9 23 128.4 <5 § 5 149.1 <5 § <5 § <5 § <5 § 15 227.5 6 119.5 5 143.6
National City 231 396.1 91 303.3 140 494.4 40 588.8 9 351.7 151 406.6 31 294.1 <5 § <5 § 53 432.7 92 585.1 59 492.0 25 405.6
South Bay 392 290.6 154 226.3 238 356.0 88 428.7 12 221.2 256 277.0 20 153.1 <5 § 5 16.9 66 276.2 174 458.7 112 366.0 35 271.2
Sweetwater 141 104.2 51 77.4 90 129.7 36 114.2 5 80.1 64 100.8 20 69.2 7 135.4 5 15.7 27 139.4 63 154.9 38 119.0 8 69.6Unknown 129 ‐‐‐ 82 ‐‐‐ 47 ‐‐‐ 73 ‐‐‐ 10 ‐‐‐ 31 ‐‐‐ <5 ‐‐‐ <5 ‐‐‐ <5 ‐‐‐ 25 ‐‐‐ 66 ‐‐‐ 33 ‐‐‐ <5 ‐‐‐*Rates per 100,000 population. County age‐adjusted rates per 100,000 2000 US standard population.**Harbison Crest/El Cajon is an aggregation of the Harbison Crest and El Cajon SRAs. Due to geographic limitations, the Harbison Crest SRA is not shown alone. See the Data Guide for more information.
***Numbers may not add up to totals due to unknown or missing details.
† Anxiety disorder‐related Emergency Department Discharge refers to (principal diagnosis) ICD‐9 codes 293.84, 300, 308, 309.81, 313.00‐313.22, 313.3, 313.83‐313.84.
‡API includes Asian, Pacific Islander, Na ve Hawaiian. Other includes 2 or more races, Na ve American/Alaska Na ve, American Indian, or other.
§ Rates not calculated for fewer than 5 events. Rates not calculated in cases where zip code is unknown.
Source: Emergency Department Discharge Database (CA OSHPD), County of San Diego, Health & Human Services Agency, Public Health Services, Emergency Medical Services; SANDAG, Current Population Estimates, 10/2012.
Prepared by: County of San Diego, Health & Human Services Agency, Public Health Services, Community Health Statistics Unit, 2013.
Black Other‡ Ages 0‐14 Ages 15‐24 Ages 25‐44API‡
Anxiety Disorder‐related† Emergency Department Discharges Among San Diego County Residents by Loca on of Residence, 2010 Detail
Geography2010 Total
Gender Race/Ethnicity Age Group
Male Ages 65+Female White Ages 45‐64Hispanic
County of San Diego, Health & Human Services Agency, Public Health Services, Community Health Statisitcs Unit Page 41

No. Rate* No. Rate* No. Rate* No. Rate* No. Rate* No. Rate* No. Rate* No. Rate* No. Rate* No. Rate* No. Rate* No. Rate* No. Rate*
San Diego County (Actual Rate) 7,719 247.7 3,189 204.1 4,530 291.7 3,881 259.5 564 394.7 2,487 246.0 322 92.3 337 286.0 160 27.0 1,584 317.7 3,210 360.3 2,105 273.0 660 182.4
San Diego County (Age‐Adjusted Rate) 7,719 241.0
Central Region 1,605 330.5 674 271.7 931 392.0 629 442.0 251 457.5 601 289.2 67 103.8 41 255.8 24 26.6 327 407.2 711 437.3 457 421.1 86 195.2
Central San Diego 585 352.5 284 313.5 301 399.3 327 399.5 63 566.9 151 257.5 21 243.6 18 313.9 10 49.8 88 424.4 265 376.3 179 462.9 43 267.9
Mid‐City 432 264.7 167 205.5 265 323.5 173 378.2 86 457.5 140 201.3 11 46.2 16 301.7 <5 § 94 290.6 208 410.5 111 331.5 15 116.2
Southeast San Diego 588 375.9 223 292.5 365 455.3 129 876.5 102 408.9 310 389.4 35 108.9 7 140.2 10 27.6 145 532.7 238 573.5 167 459.0 28 185.4
East Region 1,280 274.3 537 233.7 743 313.7 741 265.6 113 433.8 258 216.9 34 160.3 83 387.3 34 38.1 240 345.9 563 465.7 347 269.6 96 164.1
Alpine 30 197.9 8 106.2 22 288.5 22 187.0 <5 § <5 § <5 § <5 § <5 § <5 § 13 409.2 10 203.5 <5 §
El Cajon 274 218.7 120 195.6 154 240.9 167 227.1 29 423.2 32 94.2 10 220.0 29 455.4 6 23.7 45 228.5 121 365.4 84 262.2 18 119.0
Harbison Crest/El Cajon** 478 341.3 204 296.9 274 384.2 291 341.8 46 658.6 76 210.0 12 249.1 40 579.7 12 43.6 82 378.9 214 596.3 127 340.8 43 242.8
Jamul 50 284.4 19 188.0 31 414.8 21 219.7 <5 § 17 309.8 <5 § <5 § <5 § 10 331.5 17 392.5 18 322.7 5 255.2
La Mesa 196 326.7 83 289.9 113 360.3 110 295.0 18 438.1 35 283.9 <5 § 12 449.6 8 81.6 32 391.7 96 549.6 45 286.8 15 169.4
Laguna‐Pine Valley <5 § <5 § <5 § <5 § <5 § <5 § <5 § <5 § <5 § <5 § <5 § <5 § <5 §
Lakeside 99 175.6 41 147.1 58 203.6 71 173.7 <5 § 15 141.2 <5 § 5 187.8 <5 § 24 297.7 46 319.6 21 129.5 7 109.9
Lemon Grove 90 300.5 33 226.6 57 370.5 41 438.4 22 514.9 24 187.4 <5 § <5 § <5 § 21 449.7 32 401.2 31 402.3 5 146.3
Mountain Empire 13 152.8 5 109.3 8 203.6 6 133.0 <5 § 5 161.8 <5 § <5 § <5 § <5 § 5 260.7 <5 § <5 §
Santee 126 243.7 68 271.7 58 217.5 92 241.0 <5 § 18 214.5 <5 § 9 422.3 7 72.2 23 317.5 53 386.8 36 240.0 7 115.7
Spring Valley 194 237.3 76 191.1 118 281.1 85 222.2 20 264.1 62 231.6 13 240.7 11 294.1 <5 § 38 306.9 87 414.0 57 261.9 11 111.7
North Central Region 994 163.0 408 132.3 586 194.5 656 179.6 46 246.0 137 156.1 63 56.5 72 270.6 21 22.2 187 180.6 416 214.8 280 193.8 90 122.2
Coastal 143 189.3 71 182.3 72 196.6 117 193.0 <5 § 11 133.4 <5 § 10 397.0 <5 § 31 280.8 65 233.2 29 176.7 14 111.0
Del Mar‐Mira Mesa 143 90.2 51 64.2 92 116.3 89 117.4 7 194.7 13 80.7 24 43.0 10 138.6 <5 § 20 100.0 56 120.1 53 115.9 10 69.6
Elliott‐Navajo 149 166.6 53 122.2 96 208.5 110 183.7 7 175.9 19 144.0 5 63.0 6 135.6 <5 § 16 147.7 66 260.1 49 216.9 16 117.1
Kearny Mesa 387 255.1 164 217.0 223 292.9 227 270.4 28 424.7 70 205.4 18 89.3 32 462.4 9 38.3 80 363.8 166 327.5 99 273.9 33 170.2
Miramar <5 § <5 § <5 § <5 § <5 § <5 § <5 § <5 § <5 § <5 § <5 § <5 § <5 §
Peninsula 83 131.6 <5 § 53 184.8 62 130.0 <5 § 14 166.9 <5 § <5 § <5 § 18 146.0 35 164.1 28 196.7 <5 §
University 88 132.4 38 115.4 50 149.0 51 149.1 <5 § 9 134.2 12 55.4 11 401.6 <5 § 22 90.6 28 135.4 22 236.6 15 234.7
North Coastal Region 957 187.7 382 147.1 575 229.9 579 193.6 42 293.3 267 181.9 22 71.1 44 234.7 21 20.9 223 264.3 361 264.4 271 213.7 81 131.4
Carlsbad 116 100.1 39 69.3 77 129.3 90 106.3 <5 § 14 81.5 <5 § 6 147.5 <5 § 32 249.4 36 121.6 33 99.6 12 65.0
Oceanside 420 262.3 170 214.0 250 310.0 241 327.0 23 344.2 124 204.0 11 88.7 21 321.7 10 30.7 89 359.5 169 378.3 115 292.5 37 197.6
Pendleton 11 29.2 11 42.1 <5 § 9 39.1 <5 § <5 § <5 § <5 § <5 § 9 44.4 <5 § <5 § <5 §
San Dieguito 127 133.8 55 117.9 72 149.3 97 131.1 <5 § 25 192.5 <5 § <5 § 6 35.9 32 319.3 34 139.0 41 137.8 14 100.3
Vista 283 279.3 107 209.3 176 350.5 142 325.5 16 608.4 104 217.8 6 141.9 14 453.8 <5 § 61 369.9 120 414.8 82 340.4 18 172.9
North Inland Region 1,308 227.7 525 185.5 783 268.6 796 253.6 47 461.5 343 203.7 56 92.5 56 259.8 32 27.0 281 352.4 502 341.5 348 225.2 145 194.3
Anza‐Borrego Springs 17 364.3 6 255.3 11 474.8 12 425.2 <5 § <5 § <5 § <5 § <5 § <5 § 9 1419.6 <5 § <5 §
Escondido 558 339.8 229 281.0 329 397.6 306 433.8 27 819.9 198 261.5 18 173.4 7 162.6 14 38.8 129 498.1 202 446.3 156 398.7 57 319.7
Fallbrook 140 292.4 43 180.3 97 403.8 85 312.1 <5 § 49 275.2 <5 § 5 440.1 <5 § 32 441.6 48 474.6 41 312.0 16 187.7
North San Diego 194 180.3 81 155.7 113 203.3 130 207.0 7 280.8 13 118.9 25 95.2 15 293.8 <5 § 36 300.0 79 259.6 45 152.5 31 232.9
Palomar‐Julian 9 140.0 <5 § 7 214.8 <5 § <5 § <5 § <5 § <5 § <5 § <5 § <5 § 6 255.4 <5 §
Pauma 10 128.7 <5 § 6 159.2 5 160.1 <5 § <5 § <5 § <5 § <5 § 6 552.5 <5 § <5 § <5 §
Poway 137 157.7 58 136.6 79 177.7 99 170.8 5 337.8 12 113.0 10 74.4 9 263.9 <5 § 30 273.9 51 253.4 38 139.1 16 142.1
Ramona 58 163.7 26 146.1 32 181.5 46 183.8 <5 § 7 82.1 <5 § <5 § <5 § 14 255.2 23 291.0 12 107.2 7 174.4
San Marcos 148 164.1 61 138.3 87 188.8 82 182.5 5 292.4 50 150.3 <5 § 8 277.6 8 40.2 21 164.2 71 285.1 35 169.1 13 109.2
Valley Center 37 157.7 15 127.5 22 188.2 27 182.1 <5 § 7 116.7 <5 § <5 § <5 § 9 276.3 13 288.4 13 169.8 <5 §
South Region 1,460 311.0 593 253.7 867 367.8 420 436.9 46 244.7 860 305.9 80 133.4 33 245.6 28 27.8 301 370.7 598 459.1 375 347.4 158 319.8
Chula Vista 617 532.3 267 478.3 350 582.5 204 974.6 23 600.7 345 418.1 26 428.8 12 468.0 11 45.1 115 605.0 234 757.3 181 671.9 76 518.1
Coronado 45 192.9 14 104.7 31 311.3 38 222.5 <5 § 7 217.8 <5 § <5 § <5 § 5 87.9 27 449.5 6 119.7 7 197.7
National City 240 410.3 93 309.9 147 516.1 55 834.5 5 201.9 151 402.0 24 227.0 5 387.0 <5 § 44 359.5 110 696.2 60 492.1 22 362.0
South Bay 418 309.3 159 233.7 259 386.1 77 382.8 9 173.4 299 320.5 17 130.1 <5 § 8 27.0 101 425.0 176 468.0 91 294.4 42 318.2
Sweetwater 140 102.5 60 90.2 80 114.1 46 146.4 9 148.9 58 89.9 13 44.3 12 229.4 5 15.9 36 175.7 51 127.7 37 112.5 11 92.3Unknown 115 ‐‐‐ 70 ‐‐‐ 45 ‐‐‐ 60 ‐‐‐ 19 ‐‐‐ 21 ‐‐‐ <5 ‐‐‐ 8 ‐‐‐ <5 ‐‐‐ 25 ‐‐‐ 59 ‐‐‐ 27 ‐‐‐ <5 ‐‐‐*Rates per 100,000 population. County age‐adjusted rates per 100,000 2000 US standard population.**Harbison Crest/El Cajon is an aggregation of the Harbison Crest and El Cajon SRAs. Due to geographic limitations, the Harbison Crest SRA is not shown alone. See the Data Guide for more information.
***Numbers may not add up to totals due to unknown or missing details.
†Anxiety disorder‐related Emergency Department Discharge refers to (principal diagnosis) ICD‐9 codes 293.84, 300, 308, 309.81, 313.00‐313.22, 313.3, 313.83‐313.84.
‡API includes Asian, Pacific Islander, Na ve Hawaiian. Other includes 2 or more races, Na ve American/Alaska Na ve, American Indian, or other.
§Rates not calculated for fewer than 5 events. Rates not calculated in cases where zip code is unknown.
Source: Emergency Department Discharge Database (CA OSHPD), County of San Diego, Health & Human Services Agency, Public Health Services, Emergency Medical Services; SANDAG, Current Population Estimates, 10/2012.
Prepared by: County of San Diego, Health & Human Services Agency, Public Health Services, Community Health Statistics Unit, 2013.
Ages 65+API‡ Other‡ Ages 0‐14Geography2011 Total
Gender
Anxiety Disorder‐related† Emergency Department Discharges Among San Diego County Residents by Loca on of Residence, 2011 Detail
Race/Ethnicity Age Group
Male Female White Black Hispanic Ages 15‐24 Ages 25‐44 Ages 45‐64
County of San Diego, Health & Human Services Agency, Public Health Services, Community Health Statisitcs Unit Page 42

Attention Deficit, Conduct, and Disruptive Behavior
County of San Diego, Health & Human Services Agency, Public Health Services, Community Health Statisitcs Unit Page 43

No. Rate* No. Rate* No. Rate* No. Rate* No. Rate* No. Rate* No. Rate* No. Rate* No. Rate* No. Rate* No. Rate*
San Diego County (Actual Rate) 115 3.7 152 4.9
San Diego County (Age‐Adjusted Rate) 115 4.0 152 5.1
Central Region 16 3.3 25 5.1
Central San Diego 5 3.0 12 7.2
Mid‐City 6 3.7 9 5.5
Southeast San Diego 5 3.2 <5 §
East Region 26 5.6 33 7.1
Alpine <5 § <5 §
El Cajon 6 4.8 <5 §
Harbison Crest/El Cajon** 8 5.7 14 10.0
Jamul <5 § <5 §
La Mesa 8 13.5 <5 §
Laguna‐Pine Valley <5 § <5 §
Lakeside <5 § <5 §
Lemon Grove <5 § <5 §
Mountain Empire <5 § <5 §
Santee <5 § 6 11.6
Spring Valley <5 § <5 §
North Central Region 36 6.0 28 4.6
Coastal <5 § <5 §
Del Mar‐Mira Mesa 6 3.8 5 3.2
Elliott‐Navajo 6 6.7 8 8.9
Kearny Mesa 12 7.9 10 6.6
Miramar <5 § <5 §
Peninsula <5 § <5 §
University <5 § <5 §
North Coastal Region 6 1.2 15 2.9
Carlsbad <5 § 6 5.2
Oceanside <5 § 5 3.1
Pendleton <5 § <5 §
San Dieguito <5 § <5 §
Vista <5 § <5 §
North Inland Region 11 1.9 25 4.4
Anza‐Borrego Springs <5 § <5 §
Escondido <5 § <5 §
Fallbrook <5 § <5 §
North San Diego <5 § 7 6.5
Palomar‐Julian <5 § <5 §
Pauma <5 § <5 §
Poway <5 § <5 §
Ramona <5 § <5 §
San Marcos <5 § <5 §
Valley Center <5 § <5 §
South Region 20 4.3 26 5.5
Chula Vista 11 9.5 13 11.2
Coronado <5 § <5 §
National City <5 § <5 §
South Bay 5 3.7 6 4.4
Sweetwater <5 § 7 5.1Unknown <5 ‐‐‐ <5 ‐‐‐*Rates per 100,000 population. County age‐adjusted rates per 100,000 2000 US standard population.**Harbison Crest/El Cajon is an aggregation of the Harbison Crest and El Cajon SRAs. Due to geographic limitations, the Harbison Crest SRA is not shown alone. See the Data Guide for more information.†A en on‐Deficit, Conduct, and Disrup ve Behavior‐related hospitaliza on refers to (principal diagnosis) ICD‐9 codes 312.00‐312.23, 312.4, 312.8,312.9, 313.81, 314.§Rates not calculated for fewer than 5 events. Rates not calculated in cases where zip code is unknown.Source: Patient Discharge Database (CA OSHPD), County of San Diego, Health & Human Services Agency, Public Health Services, Epidemiology & Immunization Services Branch; SANDAG, Current Population Estimates, 10/2012.Prepared by: County of San Diego, Health & Human Services Agency, Public Health Services, Community Health Statistics Unit, 2013.
Attention‐Deficit, Conduct, and Disruptive Behavior‐related† Hospitaliza ons Among San Diego County Residents by Location of Residence
Geography2010 Total 2011 Total 2012 Total 2013 Total 2014 Total 2015 Total 2016 Total 2017 Total 2018 Total 2019 Total 2020 Total
County of San Diego, Health & Human Services Agency, Public Health Services, Community Health Statisitcs Unit Page 44

No. Rate* No. Rate* No. Rate* No. Rate* No. Rate* No. Rate* No. Rate* No. Rate* No. Rate* No. Rate* No. Rate* No. Rate* No. Rate*
San Diego County (Actual Rate) 115 3.7 83 5.3 32 2.1 59 3.9 20 13.6 26 2.6 <5 § 5 4.3 82 13.8 24 4.8 <5 § <5 § 6 1.7
San Diego County (Age‐Adjusted Rate) 115 4.0
Central Region 16 3.3 12 4.8 <5 § 5 3.5 6 10.6 <5 § <5 § <5 § 13 14.5 <5 § <5 § <5 § <5 §
Central San Diego 5 3.0 <5 § <5 § <5 § <5 § <5 § <5 § <5 § <5 § <5 § <5 § <5 § <5 §
Mid‐City 6 3.7 5 6.2 <5 § <5 § <5 § <5 § <5 § <5 § <5 § <5 § <5 § <5 § <5 §
Southeast San Diego 5 3.2 <5 § <5 § <5 § <5 § <5 § <5 § <5 § 5 13.6 <5 § <5 § <5 § <5 §
East Region 26 5.6 18 7.9 8 3.4 18 6.4 <5 § <5 § <5 § <5 § 17 18.9 5 7.3 <5 § <5 § <5 §
Alpine <5 § <5 § <5 § <5 § <5 § <5 § <5 § <5 § <5 § <5 § <5 § <5 § <5 §
El Cajon 6 4.8 6 9.8 <5 § <5 § <5 § <5 § <5 § <5 § 6 23.5 <5 § <5 § <5 § <5 §
Harbison Crest/El Cajon** 8 5.7 8 11.7 <5 § 6 7.0 <5 § <5 § <5 § <5 § 8 28.8 <5 § <5 § <5 § <5 §
Jamul <5 § <5 § <5 § <5 § <5 § <5 § <5 § <5 § <5 § <5 § <5 § <5 § <5 §
La Mesa 8 13.5 <5 § <5 § 5 13.5 <5 § <5 § <5 § <5 § <5 § <5 § <5 § <5 § <5 §
Laguna‐Pine Valley <5 § <5 § <5 § <5 § <5 § <5 § <5 § <5 § <5 § <5 § <5 § <5 § <5 §
Lakeside <5 § <5 § <5 § <5 § <5 § <5 § <5 § <5 § <5 § <5 § <5 § <5 § <5 §
Lemon Grove <5 § <5 § <5 § <5 § <5 § <5 § <5 § <5 § <5 § <5 § <5 § <5 § <5 §
Mountain Empire <5 § <5 § <5 § <5 § <5 § <5 § <5 § <5 § <5 § <5 § <5 § <5 § <5 §
Santee <5 § <5 § <5 § <5 § <5 § <5 § <5 § <5 § <5 § <5 § <5 § <5 § <5 §
Spring Valley <5 § <5 § <5 § <5 § <5 § <5 § <5 § <5 § <5 § <5 § <5 § <5 § <5 §
North Central Region 36 6.0 24 7.9 12 4.0 17 4.7 7 37.3 9 10.5 <5 § <5 § 26 27.5 8 7.8 <5 § <5 § <5 §
Coastal <5 § <5 § <5 § <5 § <5 § <5 § <5 § <5 § <5 § <5 § <5 § <5 § <5 §
Del Mar‐Mira Mesa 6 3.8 5 6.3 <5 § <5 § <5 § <5 § <5 § <5 § <5 § <5 § <5 § <5 § <5 §
Elliott‐Navajo 6 6.7 <5 § <5 § <5 § <5 § <5 § <5 § <5 § 5 29.3 <5 § <5 § <5 § <5 §
Kearny Mesa 12 7.9 7 9.3 5 6.6 7 8.3 <5 § <5 § <5 § <5 § 9 38.7 <5 § <5 § <5 § <5 §
Miramar <5 § <5 § <5 § <5 § <5 § <5 § <5 § <5 § <5 § <5 § <5 § <5 § <5 §
Peninsula <5 § <5 § <5 § <5 § <5 § <5 § <5 § <5 § <5 § <5 § <5 § <5 § <5 §
University <5 § <5 § <5 § <5 § <5 § <5 § <5 § <5 § <5 § <5 § <5 § <5 § <5 §
North Coastal Region 6 1.2 <5 § <5 § 5 1.7 <5 § <5 § <5 § <5 § <5 § <5 § <5 § <5 § <5 §
Carlsbad <5 § <5 § <5 § <5 § <5 § <5 § <5 § <5 § <5 § <5 § <5 § <5 § <5 §
Oceanside <5 § <5 § <5 § <5 § <5 § <5 § <5 § <5 § <5 § <5 § <5 § <5 § <5 §
Pendleton <5 § <5 § <5 § <5 § <5 § <5 § <5 § <5 § <5 § <5 § <5 § <5 § <5 §
San Dieguito <5 § <5 § <5 § <5 § <5 § <5 § <5 § <5 § <5 § <5 § <5 § <5 § <5 §
Vista <5 § <5 § <5 § <5 § <5 § <5 § <5 § <5 § <5 § <5 § <5 § <5 § <5 §
North Inland Region 11 1.9 9 3.2 <5 § 7 2.2 <5 § <5 § <5 § <5 § 8 6.7 <5 § <5 § <5 § <5 §
Anza‐Borrego Springs <5 § <5 § <5 § <5 § <5 § <5 § <5 § <5 § <5 § <5 § <5 § <5 § <5 §
Escondido <5 § <5 § <5 § <5 § <5 § <5 § <5 § <5 § <5 § <5 § <5 § <5 § <5 §
Fallbrook <5 § <5 § <5 § <5 § <5 § <5 § <5 § <5 § <5 § <5 § <5 § <5 § <5 §
North San Diego <5 § <5 § <5 § <5 § <5 § <5 § <5 § <5 § <5 § <5 § <5 § <5 § <5 §
Palomar‐Julian <5 § <5 § <5 § <5 § <5 § <5 § <5 § <5 § <5 § <5 § <5 § <5 § <5 §
Pauma <5 § <5 § <5 § <5 § <5 § <5 § <5 § <5 § <5 § <5 § <5 § <5 § <5 §
Poway <5 § <5 § <5 § <5 § <5 § <5 § <5 § <5 § <5 § <5 § <5 § <5 § <5 §
Ramona <5 § <5 § <5 § <5 § <5 § <5 § <5 § <5 § <5 § <5 § <5 § <5 § <5 §
San Marcos <5 § <5 § <5 § <5 § <5 § <5 § <5 § <5 § <5 § <5 § <5 § <5 § <5 §
Valley Center <5 § <5 § <5 § <5 § <5 § <5 § <5 § <5 § <5 § <5 § <5 § <5 § <5 §
South Region 20 4.3 17 7.3 <5 § 7 7.1 <5 § 10 3.6 <5 § <5 § 14 13.8 6 7.4 <5 § <5 § <5 §
Chula Vista 11 9.5 8 14.4 <5 § <5 § <5 § 6 7.4 <5 § <5 § 8 32.7 <5 § <5 § <5 § <5 §
Coronado <5 § <5 § <5 § <5 § <5 § <5 § <5 § <5 § <5 § <5 § <5 § <5 § <5 §
National City <5 § <5 § <5 § <5 § <5 § <5 § <5 § <5 § <5 § <5 § <5 § <5 § <5 §
South Bay 5 3.7 5 7.3 <5 § <5 § <5 § <5 § <5 § <5 § <5 § <5 § <5 § <5 § <5 §
Sweetwater <5 § <5 § <5 § <5 § <5 § <5 § <5 § <5 § <5 § <5 § <5 § <5 § <5 §Unknown <5 ‐‐‐ <5 ‐‐‐ <5 ‐‐‐ <5 ‐‐‐ <5 ‐‐‐ <5 ‐‐‐ <5 ‐‐‐ <5 ‐‐‐ <5 ‐‐‐ <5 ‐‐‐ <5 ‐‐‐ <5 ‐‐‐ <5 ‐‐‐*Rates per 100,000 population. County age‐adjusted rates per 100,000 2000 US standard population.**Harbison Crest/El Cajon is an aggregation of the Harbison Crest and El Cajon SRAs. Due to geographic limitations, the Harbison Crest SRA is not shown alone. See the Data Guide for more information.
***Numbers may not add up to totals due to unknown or missing details.
†A en on‐Deficit, Conduct, and Disrup ve Behavior‐related hospitaliza on refers to (principal diagnosis) ICD‐9 codes 312.00‐312.23, 312.4, 312.8,312.9, 313.81, 314.
‡API includes Asian, Pacific Islander, Na ve Hawaiian. Other includes 2 or more races, Na ve American/Alaska Na ve, American Indian, or other.
§Rates not calculated for fewer than 5 events. Rates not calculated in cases where zip code is unknown.
Source: Patient Discharge Database (CA OSHPD), County of San Diego, Health & Human Services Agency, Public Health Services, Epidemiology & Immunization Services Branch; SANDAG, Current Population Estimates, 10/2012.
Prepared by: County of San Diego, Health & Human Services Agency, Public Health Services, Community Health Statistics Unit, 2013.
A en on‐Deficit, Conduct, and Disrup ve Behavior‐related† Hospitaliza ons Among San Diego County Residents by Loca on of Residence, 2010 Detail
Geography2010 Total
Gender Race/Ethnicity Age Group
Male Ages 65+Female White Ages 45‐64HispanicBlack Other‡ Ages 0‐14 Ages 15‐24 Ages 25‐44API‡
County of San Diego, Health & Human Services Agency, Public Health Services, Community Health Statisitcs Unit Page 45

No. Rate* No. Rate* No. Rate* No. Rate* No. Rate* No. Rate* No. Rate* No. Rate* No. Rate* No. Rate* No. Rate* No. Rate* No. Rate*
San Diego County (Actual Rate) 152 4.9 100 6.4 52 3.3 82 5.5 13 9.1 41 4.1 <5 § 5 4.2 98 16.5 48 9.6 <5 § <5 § <5 §
San Diego County (Age‐Adjusted Rate) 152 5.1
Central Region 25 5.1 15 6.0 10 4.2 11 7.7 <5 § 9 4.3 <5 § <5 § 18 20.0 5 6.2 <5 § <5 § <5 §
Central San Diego 12 7.2 5 5.5 7 9.3 6 7.3 <5 § 5 8.5 <5 § <5 § 9 44.8 <5 § <5 § <5 § <5 §
Mid‐City 9 5.5 8 9.8 <5 § <5 § <5 § <5 § <5 § <5 § 6 17.8 <5 § <5 § <5 § <5 §
Southeast San Diego <5 § <5 § <5 § <5 § <5 § <5 § <5 § <5 § <5 § <5 § <5 § <5 § <5 §
East Region 33 7.1 25 10.9 8 3.4 19 6.8 <5 § 8 6.7 <5 § <5 § 21 23.6 11 15.9 <5 § <5 § <5 §
Alpine <5 § <5 § <5 § <5 § <5 § <5 § <5 § <5 § <5 § <5 § <5 § <5 § <5 §
El Cajon <5 § <5 § <5 § <5 § <5 § <5 § <5 § <5 § <5 § <5 § <5 § <5 § <5 §
Harbison Crest/El Cajon** 14 10.0 9 13.1 5 7.0 9 10.6 <5 § <5 § <5 § <5 § 9 32.7 <5 § <5 § <5 § <5 §
Jamul <5 § <5 § <5 § <5 § <5 § <5 § <5 § <5 § <5 § <5 § <5 § <5 § <5 §
La Mesa <5 § <5 § <5 § <5 § <5 § <5 § <5 § <5 § <5 § <5 § <5 § <5 § <5 §
Laguna‐Pine Valley <5 § <5 § <5 § <5 § <5 § <5 § <5 § <5 § <5 § <5 § <5 § <5 § <5 §
Lakeside <5 § <5 § <5 § <5 § <5 § <5 § <5 § <5 § <5 § <5 § <5 § <5 § <5 §
Lemon Grove <5 § <5 § <5 § <5 § <5 § <5 § <5 § <5 § <5 § <5 § <5 § <5 § <5 §
Mountain Empire <5 § <5 § <5 § <5 § <5 § <5 § <5 § <5 § <5 § <5 § <5 § <5 § <5 §
Santee 6 11.6 5 20.0 <5 § <5 § <5 § <5 § <5 § <5 § <5 § <5 § <5 § <5 § <5 §
Spring Valley <5 § <5 § <5 § <5 § <5 § <5 § <5 § <5 § <5 § <5 § <5 § <5 § <5 §
North Central Region 28 4.6 19 6.2 9 3.0 16 4.4 <5 § 6 6.8 <5 § <5 § 20 21.2 6 5.8 <5 § <5 § <5 §
Coastal <5 § <5 § <5 § <5 § <5 § <5 § <5 § <5 § <5 § <5 § <5 § <5 § <5 §
Del Mar‐Mira Mesa 5 3.2 <5 § <5 § <5 § <5 § <5 § <5 § <5 § <5 § <5 § <5 § <5 § <5 §
Elliott‐Navajo 8 8.9 6 13.8 <5 § 6 10.0 <5 § <5 § <5 § <5 § 6 35.4 <5 § <5 § <5 § <5 §
Kearny Mesa 10 6.6 8 10.6 <5 § 5 6.0 <5 § <5 § <5 § <5 § 7 29.8 <5 § <5 § <5 § <5 §
Miramar <5 § <5 § <5 § <5 § <5 § <5 § <5 § <5 § <5 § <5 § <5 § <5 § <5 §
Peninsula <5 § <5 § <5 § <5 § <5 § <5 § <5 § <5 § <5 § <5 § <5 § <5 § <5 §
University <5 § <5 § <5 § <5 § <5 § <5 § <5 § <5 § <5 § <5 § <5 § <5 § <5 §
North Coastal Region 15 2.9 8 3.1 7 2.8 11 3.7 <5 § <5 § <5 § <5 § 8 8.0 6 7.1 <5 § <5 § <5 §
Carlsbad 6 5.2 <5 § <5 § 5 5.9 <5 § <5 § <5 § <5 § <5 § <5 § <5 § <5 § <5 §
Oceanside 5 3.1 <5 § <5 § <5 § <5 § <5 § <5 § <5 § 5 15.3 <5 § <5 § <5 § <5 §
Pendleton <5 § <5 § <5 § <5 § <5 § <5 § <5 § <5 § <5 § <5 § <5 § <5 § <5 §
San Dieguito <5 § <5 § <5 § <5 § <5 § <5 § <5 § <5 § <5 § <5 § <5 § <5 § <5 §
Vista <5 § <5 § <5 § <5 § <5 § <5 § <5 § <5 § <5 § <5 § <5 § <5 § <5 §
North Inland Region 25 4.4 16 5.7 9 3.1 18 5.7 <5 § <5 § <5 § <5 § 13 11.0 12 15.0 <5 § <5 § <5 §
Anza‐Borrego Springs <5 § <5 § <5 § <5 § <5 § <5 § <5 § <5 § <5 § <5 § <5 § <5 § <5 §
Escondido <5 § <5 § <5 § <5 § <5 § <5 § <5 § <5 § <5 § <5 § <5 § <5 § <5 §
Fallbrook <5 § <5 § <5 § <5 § <5 § <5 § <5 § <5 § <5 § <5 § <5 § <5 § <5 §
North San Diego 7 6.5 6 11.5 <5 § 5 8.0 <5 § <5 § <5 § <5 § <5 § <5 § <5 § <5 § <5 §
Palomar‐Julian <5 § <5 § <5 § <5 § <5 § <5 § <5 § <5 § <5 § <5 § <5 § <5 § <5 §
Pauma <5 § <5 § <5 § <5 § <5 § <5 § <5 § <5 § <5 § <5 § <5 § <5 § <5 §
Poway <5 § <5 § <5 § <5 § <5 § <5 § <5 § <5 § <5 § <5 § <5 § <5 § <5 §
Ramona <5 § <5 § <5 § <5 § <5 § <5 § <5 § <5 § <5 § <5 § <5 § <5 § <5 §
San Marcos <5 § <5 § <5 § <5 § <5 § <5 § <5 § <5 § <5 § <5 § <5 § <5 § <5 §
Valley Center <5 § <5 § <5 § <5 § <5 § <5 § <5 § <5 § <5 § <5 § <5 § <5 § <5 §
South Region 26 5.5 17 7.3 9 3.8 7 7.3 <5 § 11 3.9 <5 § <5 § 18 17.9 8 9.9 <5 § <5 § <5 §
Chula Vista 13 11.2 9 16.1 <5 § <5 § <5 § 7 8.5 <5 § <5 § 6 24.6 7 36.8 <5 § <5 § <5 §
Coronado <5 § <5 § <5 § <5 § <5 § <5 § <5 § <5 § <5 § <5 § <5 § <5 § <5 §
National City <5 § <5 § <5 § <5 § <5 § <5 § <5 § <5 § <5 § <5 § <5 § <5 § <5 §
South Bay 6 4.4 <5 § <5 § <5 § <5 § <5 § <5 § <5 § 6 20.2 <5 § <5 § <5 § <5 §
Sweetwater 7 5.1 5 7.5 <5 § <5 § <5 § <5 § <5 § <5 § 6 19.1 <5 § <5 § <5 § <5 §Unknown <5 ‐‐‐ <5 ‐‐‐ <5 ‐‐‐ <5 ‐‐‐ <5 ‐‐‐ <5 ‐‐‐ <5 ‐‐‐ <5 ‐‐‐ <5 ‐‐‐ <5 ‐‐‐ <5 ‐‐‐ <5 ‐‐‐ <5 ‐‐‐*Rates per 100,000 population. County age‐adjusted rates per 100,000 2000 US standard population.**Harbison Crest/El Cajon is an aggregation of the Harbison Crest and El Cajon SRAs. Due to geographic limitations, the Harbison Crest SRA is not shown alone. See the Data Guide for more information.
***Numbers may not add up to totals due to unknown or missing details.
†A en on‐Deficit, Conduct, and Disrup ve Behavior‐related hospitaliza on refers to (principal diagnosis) ICD‐9 codes 312.00‐312.23, 312.4, 312.8,312.9, 313.81, 314.
‡API includes Asian, Pacific Islander, Na ve Hawaiian. Other includes 2 or more races, Na ve American/Alaska Na ve, American Indian, or other.
§Rates not calculated for fewer than 5 events. Rates not calculated in cases where zip code is unknown.
Source: Patient Discharge Database (CA OSHPD), County of San Diego, Health & Human Services Agency, Public Health Services, Epidemiology & Immunization Services Branch; SANDAG, Current Population Estimates, 10/2012.
Prepared by: County of San Diego, Health & Human Services Agency, Public Health Services, Community Health Statistics Unit, 2013.
Ages 65+API‡ Other‡ Ages 0‐14Geography2011 Total
Gender
A en on‐Deficit, Conduct, and Disrup ve Behavior‐related† Hospitaliza ons Among San Diego County Residents by Loca on of Residence, 2011 Detail
Race/Ethnicity Age Group
Ages 15‐24 Ages 25‐44 Ages 45‐64Male Female White Black Hispanic
County of San Diego, Health & Human Services Agency, Public Health Services, Community Health Statisitcs Unit Page 46

No. Rate* No. Rate* No. Rate* No. Rate* No. Rate* No. Rate* No. Rate* No. Rate* No. Rate* No. Rate* No. Rate*
San Diego County (Actual Rate) 279 9.0 274 8.8
San Diego County (Age‐Adjusted Rate) 279 9.1 274 8.8
Central Region 31 6.4 31 6.4
Central San Diego 14 8.5 7 4.2
Mid‐City 5 3.1 17 10.4
Southeast San Diego 12 7.7 7 4.5
East Region 83 17.9 58 12.4
Alpine <5 § <5 §
El Cajon 17 13.7 14 11.2
Harbison Crest/El Cajon** 32 23.0 26 18.6
Jamul <5 § <5 §
La Mesa 10 16.9 8 13.3
Laguna‐Pine Valley <5 § <5 §
Lakeside 8 14.3 6 10.6
Lemon Grove 8 26.8 5 16.7
Mountain Empire <5 § <5 §
Santee 6 11.7 <5 §
Spring Valley 15 18.5 7 8.6
North Central Region 31 5.1 30 4.9
Coastal <5 § <5 §
Del Mar‐Mira Mesa 7 4.4 7 4.4
Elliott‐Navajo 7 7.9 6 6.7
Kearny Mesa 8 5.3 13 8.6
Miramar <5 § <5 §
Peninsula <5 § <5 §
University <5 § <5 §
North Coastal Region 51 10.1 58 11.4
Carlsbad 7 6.1 14 12.1
Oceanside 25 15.7 19 11.9
Pendleton <5 § <5 §
San Dieguito 9 9.6 11 11.6
Vista 10 10.0 13 12.8
North Inland Region 45 7.9 63 11.0
Anza‐Borrego Springs <5 § <5 §
Escondido 21 12.9 29 17.7
Fallbrook <5 § 8 16.7
North San Diego 6 5.6 10 9.3
Palomar‐Julian <5 § <5 §
Pauma <5 § <5 §
Poway 6 7.0 5 5.8
Ramona <5 § <5 §
San Marcos <5 3.3 8 8.9
Valley Center <5 § <5 §
South Region 30 6.4 32 6.8
Chula Vista 14 12.1 19 16.4
Coronado <5 § <5 §
National City <5 § <5 §
South Bay 10 7.4 9 6.7
Sweetwater <5 § <5 §Unknown 8 ‐‐‐ <5 ‐‐‐*Rates per 100,000 population. County age‐adjusted rates per 100,000 2000 US standard population.**Harbison Crest/El Cajon is an aggregation of the Harbison Crest and El Cajon SRAs. Due to geographic limitations, the Harbison Crest SRA is not shown alone. See the Data Guide for more information.†A en on‐Deficit, Conduct, and Disrup ve Behavior‐related Emergency Department Discharge refers to (principal diagnosis) ICD‐9 codes 312.00‐312.23, 312.4, 312.8,312.9, 313.81, 314.§Rates not calculated for fewer than 5 events. Rates not calculated in cases where zip code is unknown.Source: Emergency Department Discharge Database (CA OSHPD), County of San Diego, Health & Human Services Agency, Public Health Services, Emergency Medical Services; SANDAG, Current Population Estimates, 10/2012.Prepared by: County of San Diego, Health & Human Services Agency, Public Health Services, Community Health Statistics Unit, 2013.
A en on‐Deficit, Conduct, and Disrup ve Behavior‐related† Emergency Department Discharges Among San Diego County Residents by Loca on of Residence
Geography2010 Total 2011 Total 2012 Total 2013 Total 2014 Total 2015 Total 2016 Total 2017 Total 2018 Total 2019 Total 2020 Total
County of San Diego, Health & Human Services Agency, Public Health Services, Community Health Statisitcs Unit Page 47

No. Rate* No. Rate* No. Rate* No. Rate* No. Rate* No. Rate* No. Rate* No. Rate* No. Rate* No. Rate* No. Rate* No. Rate* No. Rate*
San Diego County (Actual Rate) 279 9.0 169 10.9 110 7.1 168 11.2 25 17.1 61 6.2 8 2.3 11 9.5 95 15.9 67 13.5 43 4.8 43 5.7 31 8.8
San Diego County (Age‐Adjusted Rate) 279 9.1
Central Region 31 6.4 20 8.1 11 4.6 10 7.0 6 10.6 13 6.4 <5 § <5 § 12 13.4 9 10.8 5 3.1 <5 § <5 §
Central San Diego 14 8.5 10 11.0 <5 § 7 8.5 <5 § <5 § <5 § <5 § <5 § 5 21.7 <5 § <5 § <5 §
Mid‐City 5 3.1 <5 § <5 § <5 § <5 § <5 § <5 § <5 § <5 § <5 § <5 § <5 § <5 §
Southeast San Diego 12 7.7 6 7.9 6 7.5 <5 § <5 § 6 7.7 <5 § <5 § 6 16.4 <5 § <5 § <5 § <5 §
East Region 83 17.9 55 24.1 28 11.9 57 20.4 7 26.3 9 7.8 <5 § <5 § 23 25.6 17 24.8 13 10.7 21 16.5 9 16.1
Alpine <5 § <5 § <5 § <5 § <5 § <5 § <5 § <5 § <5 § <5 § <5 § <5 § <5 §
El Cajon 17 13.7 15 24.6 <5 § 14 19.0 <5 § <5 § <5 § <5 § <5 § <5 § <5 § 6 18.9 <5 §
Harbison Crest/El Cajon** 32 23.0 24 35.2 8 11.3 26 30.5 <5 § <5 § <5 § <5 § 9 32.4 <5 § 5 13.9 10 27.1 <5 §
Jamul <5 § <5 § <5 § <5 § <5 § <5 § <5 § <5 § <5 § <5 § <5 § <5 § <5 §
La Mesa 10 16.9 7 24.8 <5 § 6 16.2 <5 § <5 § <5 § <5 § <5 § <5 § <5 § <5 § <5 §
Laguna‐Pine Valley <5 § <5 § <5 § <5 § <5 § <5 § <5 § <5 § <5 § <5 § <5 § <5 § <5 §
Lakeside 8 14.3 5 18.0 <5 § 7 17.1 <5 § <5 § <5 § <5 § <5 § <5 § <5 § <5 § <5 §
Lemon Grove 8 26.8 <5 § <5 § <5 § <5 § <5 § <5 § <5 § <5 § <5 § <5 § <5 § <5 §
Mountain Empire <5 § <5 § <5 § <5 § <5 § <5 § <5 § <5 § <5 § <5 § <5 § <5 § <5 §
Santee 6 11.7 <5 § <5 § <5 § <5 § <5 § <5 § <5 § <5 § <5 § <5 § <5 § <5 §
Spring Valley 15 18.5 10 25.4 5 12.0 7 18.3 <5 § <5 § <5 § <5 § <5 § 5 41.4 <5 § <5 § <5 §
North Central Region 31 5.1 18 5.9 13 4.4 20 5.5 <5 § 6 7.0 <5 § <5 § 18 19.0 8 7.8 <5 § <5 § <5 §
Coastal <5 § <5 § <5 § <5 § <5 § <5 § <5 § <5 § <5 § <5 § <5 § <5 § <5 §
Del Mar‐Mira Mesa 7 4.4 <5 § <5 § <5 § <5 § <5 § <5 § <5 § <5 § <5 § <5 § <5 § <5 §
Elliott‐Navajo 7 7.9 5 11.6 <5 § 6 10.0 <5 § <5 § <5 § <5 § <5 § <5 § <5 § <5 § <5 §
Kearny Mesa 8 5.3 <5 § 5 6.6 <5 § <5 § <5 § <5 § <5 § <5 § <5 § <5 § <5 § <5 §
Miramar <5 § <5 § <5 § <5 § <5 § <5 § <5 § <5 § <5 § <5 § <5 § <5 § <5 §
Peninsula <5 § <5 § <5 § <5 § <5 § <5 § <5 § <5 § <5 § <5 § <5 § <5 § <5 §
University <5 § <5 § <5 § <5 § <5 § <5 § <5 § <5 § <5 § <5 § <5 § <5 § <5 §
North Coastal Region 51 10.1 29 11.2 22 8.9 34 11.4 <5 § 9 6.3 <5 § <5 § 10 9.9 20 23.9 10 7.3 <5 § 7 11.7
Carlsbad 7 6.1 <5 § <5 § 6 7.1 <5 § <5 § <5 § <5 § <5 § <5 § <5 § <5 § <5 §
Oceanside 25 15.7 15 18.9 10 12.4 15 20.2 <5 § 5 8.3 <5 § <5 § 7 21.8 9 35.5 7 15.7 <5 § <5 §
Pendleton <5 § <5 § <5 § <5 § <5 § <5 § <5 § <5 § <5 § <5 § <5 § <5 § <5 §
San Dieguito 9 9.6 5 10.9 <5 § 8 10.9 <5 § <5 § <5 § <5 § <5 § <5 § <5 § <5 § <5 §
Vista 10 10.0 6 11.8 <5 § 5 11.4 <5 § <5 § <5 § <5 § <5 § <5 § <5 § <5 § <5 §
North Inland Region 45 7.9 22 7.8 23 8.0 35 11.1 <5 § 7 4.3 <5 § <5 § 18 15.1 5 6.5 5 3.4 6 3.9 11 15.2
Anza‐Borrego Springs <5 § <5 § <5 § <5 § <5 § <5 § <5 § <5 § <5 § <5 § <5 § <5 § <5 §
Escondido 21 12.9 9 11.1 12 14.6 14 19.7 <5 § 6 8.1 <5 § <5 § 7 19.3 <5 § <5 § <5 § 5 28.5
Fallbrook <5 § <5 § <5 § <5 § <5 § <5 § <5 § <5 § <5 § <5 § <5 § <5 § <5 §
North San Diego 6 5.6 <5 § <5 § 5 8.0 <5 § <5 § <5 § <5 § <5 § <5 § <5 § <5 § <5 §
Palomar‐Julian <5 § <5 § <5 § <5 § <5 § <5 § <5 § <5 § <5 § <5 § <5 § <5 § <5 §
Pauma <5 § <5 § <5 § <5 § <5 § <5 § <5 § <5 § <5 § <5 § <5 § <5 § <5 §
Poway 6 7.0 <5 § <5 § 5 8.6 <5 § <5 § <5 § <5 § <5 § <5 § <5 § <5 § <5 §
Ramona <5 § <5 § <5 § <5 § <5 § <5 § <5 § <5 § <5 § <5 § <5 § <5 § <5 §
San Marcos <5 3.3 <5 § <5 § <5 § <5 § <5 § <5 § <5 § <5 § <5 § <5 § <5 § <5 §
Valley Center <5 § <5 § <5 § <5 § <5 § <5 § <5 § <5 § <5 § <5 § <5 § <5 § <5 §
South Region 30 6.4 20 8.5 10 4.3 8 8.2 <5 § 16 5.8 <5 § <5 § 14 13.8 7 8.7 6 4.5 <5 § <5 §
Chula Vista 14 12.1 8 14.4 6 10.1 <5 § <5 § 8 9.8 <5 § <5 § 7 28.6 <5 § <5 § <5 § <5 §
Coronado <5 § <5 § <5 § <5 § <5 § <5 § <5 § <5 § <5 § <5 § <5 § <5 § <5 §
National City <5 § <5 § <5 § <5 § <5 § <5 § <5 § <5 § <5 § <5 § <5 § <5 § <5 §
South Bay 10 7.4 6 8.8 <5 § <5 § <5 § 5 § <5 § <5 § <5 § <5 § <5 § <5 § <5 §
Sweetwater <5 § <5 § <5 § <5 § <5 § <5 § <5 § <5 § <5 § <5 § <5 § <5 § <5 §Unknown 8 ‐‐‐ 5 ‐‐‐ <5 ‐‐‐ <5 ‐‐‐ <5 ‐‐‐ <5 ‐‐‐ <5 ‐‐‐ <5 ‐‐‐ <5 ‐‐‐ <5 ‐‐‐ <5 ‐‐‐ 6 ‐‐‐ <5 ‐‐‐*Rates per 100,000 population. County age‐adjusted rates per 100,000 2000 US standard population.**Harbison Crest/El Cajon is an aggregation of the Harbison Crest and El Cajon SRAs. Due to geographic limitations, the Harbison Crest SRA is not shown alone. See the Data Guide for more information.
***Numbers may not add up to totals due to unknown or missing details.
†A en on‐Deficit, Conduct, and Disrup ve Behavior‐related Emergency Department Discharge refers to (principal diagnosis) ICD‐9 codes 312.00‐312.23, 312.4, 312.8,312.9, 313.81, 314.
‡API includes Asian, Pacific Islander, Na ve Hawaiian. Other includes 2 or more races, Na ve American/Alaska Na ve, American Indian, or other.
§Rates not calculated for fewer than 5 events. Rates not calculated in cases where zip code is unknown.
Source: Emergency Department Discharge Database (CA OSHPD), County of San Diego, Health & Human Services Agency, Public Health Services, Emergency Medical Services; SANDAG, Current Population Estimates, 10/2012.
Prepared by: County of San Diego, Health & Human Services Agency, Public Health Services, Community Health Statistics Unit, 2013.
Ages 45‐64Hispanic
A en on‐Deficit, Conduct, and Disrup ve Behavior‐related† Emergency Department Discharges Among San Diego County Residents by Loca on of Residence, 2010 Detail
Geography2010 Total
Gender Race/Ethnicity Age Group
Male Ages 65+Female White Black Other‡ Ages 0‐14 Ages 15‐24 Ages 25‐44API‡
County of San Diego, Health & Human Services Agency, Public Health Services, Community Health Statisitcs Unit Page 48

No. Rate* No. Rate* No. Rate* No. Rate* No. Rate* No. Rate* No. Rate* No. Rate* No. Rate* No. Rate* No. Rate* No. Rate* No. Rate*
San Diego County (Actual Rate) 274 8.8 167 10.7 107 6.9 165 11.0 19 13.3 63 6.2 8 2.3 12 10.2 89 15.0 71 14.2 40 4.5 46 6.0 28 7.7
San Diego County (Age‐Adjusted Rate) 274 8.8
Central Region 31 6.4 16 6.4 15 6.3 12 8.4 6 10.9 12 5.8 <5 § <5 § 8 8.9 8 10.0 5 3.1 8 7.4 <5 §
Central San Diego 7 4.2 <5 § <5 § <5 § <5 § <5 § <5 § <5 § <5 § <5 § <5 § <5 § <5 §
Mid‐City 17 10.4 10 12.3 7 8.5 6 13.1 <5 § 8 11.5 <5 § <5 § 5 14.8 5 15.5 <5 § <5 § <5 §
Southeast San Diego 7 4.5 <5 § <5 § <5 § <5 § <5 § <5 § <5 § <5 § <5 § <5 § <5 § <5 §
East Region 58 12.4 37 16.1 21 8.9 33 11.8 5 19.2 12 10.1 <5 § <5 § 18 20.2 15 21.6 10 8.3 12 9.3 <5 §
Alpine <5 § <5 § <5 § <5 § <5 § <5 § <5 § <5 § <5 § <5 § <5 § <5 § <5 §
El Cajon 14 11.2 8 13.0 6 9.4 9 12.2 <5 § <5 § <5 § <5 § <5 § <5 § <5 § 6 18.7 <5 §
Harbison Crest/El Cajon** 26 18.6 15 21.8 11 15.4 17 20.0 <5 § <5 § <5 § <5 § 5 18.2 5 23.1 5 13.9 9 24.2 <5 §
Jamul <5 § <5 § <5 § <5 § <5 § <5 § <5 § <5 § <5 § <5 § <5 § <5 § <5 §
La Mesa 8 13.3 8 27.9 <5 § <5 § <5 § <5 § <5 § <5 § <5 § <5 § <5 § <5 § <5 §
Laguna‐Pine Valley <5 § <5 § <5 § <5 § <5 § <5 § <5 § <5 § <5 § <5 § <5 § <5 § <5 §
Lakeside 6 10.6 <5 § <5 § <5 § <5 § <5 § <5 § <5 § <5 § <5 § <5 § <5 § <5 §
Lemon Grove 5 16.7 <5 § <5 § <5 § <5 § <5 § <5 § <5 § <5 § <5 § <5 § <5 § <5 §
Mountain Empire <5 § <5 § <5 § <5 § <5 § <5 § <5 § <5 § <5 § <5 § <5 § <5 § <5 §
Santee <5 § <5 § <5 § <5 § <5 § <5 § <5 § <5 § <5 § <5 § <5 § <5 § <5 §
Spring Valley 7 8.6 <5 § <5 § <5 § <5 § <5 § <5 § <5 § <5 § <5 § <5 § <5 § <5 §
North Central Region 30 4.9 25 8.1 5 1.7 21 5.8 <5 § <5 § <5 § <5 § 14 14.8 9 8.7 <5 § <5 § <5 §
Coastal <5 § <5 § <5 § <5 § <5 § <5 § <5 § <5 § <5 § <5 § <5 § <5 § <5 §
Del Mar‐Mira Mesa 7 4.4 5 6.3 <5 § 5 6.6 <5 § <5 § <5 § <5 § 5 15.7 <5 § <5 § <5 § <5 §
Elliott‐Navajo 6 6.7 5 11.5 <5 § 5 8.3 <5 § <5 § <5 § <5 § <5 § <5 § <5 § <5 § <5 §
Kearny Mesa 13 8.6 12 15.9 <5 § 8 9.5 <5 § <5 § <5 § <5 § 6 25.5 <5 § <5 § <5 § <5 §
Miramar <5 § <5 § <5 § <5 § <5 § <5 § <5 § <5 § <5 § <5 § <5 § <5 § <5 §
Peninsula <5 § <5 § <5 § <5 § <5 § <5 § <5 § <5 § <5 § <5 § <5 § <5 § <5 §
University <5 § <5 § <5 § <5 § <5 § <5 § <5 § <5 § <5 § <5 § <5 § <5 § <5 §
North Coastal Region 58 11.4 33 12.7 25 10.0 39 13.0 <5 § 12 8.2 <5 § <5 § 16 15.9 18 21.3 6 4.4 13 10.3 5 8.1
Carlsbad 14 12.1 <5 § 11 18.5 11 13.0 <5 § <5 § <5 § <5 § <5 § 7 54.6 <5 § <5 § <5 §
Oceanside 19 11.9 12 15.1 7 8.7 13 17.6 <5 § <5 § <5 § <5 § <5 § <5 § 5 11.2 5 12.7 <5 §
Pendleton <5 § <5 § <5 § <5 § <5 § <5 § <5 § <5 § <5 § <5 § <5 § <5 § <5 §
San Dieguito 11 11.6 8 17.1 <5 § 8 10.8 <5 § <5 § <5 § <5 § 5 29.9 <5 § <5 § <5 § <5 §
Vista 13 12.8 9 17.6 <5 § 6 13.8 <5 § 5 10.5 <5 § <5 § <5 § <5 § <5 § 6 24.9 <5 §
North Inland Region 63 11.0 38 13.4 25 8.6 42 13.4 <5 § 12 7.1 <5 § <5 § 19 16.0 15 18.8 8 5.4 8 5.2 13 17.4
Anza‐Borrego Springs <5 § <5 § <5 § <5 § <5 § <5 § <5 § <5 § <5 § <5 § <5 § <5 § <5 §
Escondido 29 17.7 16 19.6 13 15.7 20 28.4 <5 § 7 9.2 <5 § <5 § 7 19.4 7 27.0 <5 § 5 12.8 6 33.7
Fallbrook 8 16.7 7 29.3 <5 § 5 18.4 <5 § <5 § <5 § <5 § 5 56.5 <5 § <5 § <5 § <5 §
North San Diego 10 9.3 5 9.6 5 9.0 8 12.7 <5 § <5 § <5 § <5 § <5 § <5 § <5 § <5 § 5 37.6
Palomar‐Julian <5 § <5 § <5 § <5 § <5 § <5 § <5 § <5 § <5 § <5 § <5 § <5 § <5 §
Pauma <5 § <5 § <5 § <5 § <5 § <5 § <5 § <5 § <5 § <5 § <5 § <5 § <5 §
Poway 5 5.8 <5 § <5 § <5 § <5 § <5 § <5 § <5 § <5 § <5 § <5 § <5 § <5 §
Ramona <5 § <5 § <5 § <5 § <5 § <5 § <5 § <5 § <5 § <5 § <5 § <5 § <5 §
San Marcos 8 8.9 <5 § <5 § <5 § <5 § <5 § <5 § <5 § <5 § <5 § <5 § <5 § <5 §
Valley Center <5 § <5 § <5 § <5 § <5 § <5 § <5 § <5 § <5 § <5 § <5 § <5 § <5 §
South Region 32 6.8 17 7.3 15 6.4 17 17.7 <5 § 11 3.9 <5 § <5 § 13 12.9 6 7.4 8 6.1 <5 § <5 §
Chula Vista 19 16.4 10 17.9 9 15.0 12 57.3 <5 § 6 7.3 <5 § <5 § 7 28.7 <5 § <5 § <5 § <5 §
Coronado <5 § <5 § <5 § <5 § <5 § <5 § <5 § <5 § <5 § <5 § <5 § <5 § <5 §
National City <5 § <5 § <5 § <5 § <5 § <5 § <5 § <5 § <5 § <5 § <5 § <5 § <5 §
South Bay 9 6.7 <5 § 5 7.5 <5 § <5 § <5 § <5 § <5 § 5 16.9 <5 § <5 § <5 § <5 §
Sweetwater <5 § <5 § <5 § <5 § <5 § <5 § <5 § <5 § <5 § <5 § <5 § <5 § <5 §Unknown <5 § <5 § <5 § <5 § <5 § <5 § <5 § <5 § <5 § <5 § <5 § <5 § <5 §*Rates per 100,000 population. County age‐adjusted rates per 100,000 2000 US standard population.**Harbison Crest/El Cajon is an aggregation of the Harbison Crest and El Cajon SRAs. Due to geographic limitations, the Harbison Crest SRA is not shown alone. See the Data Guide for more information.
***Numbers may not add up to totals due to unknown or missing details.
†A en on‐Deficit, Conduct, and Disrup ve Behavior‐related Emergency Department Discharge refers to (principal diagnosis) ICD‐9 codes 312.00‐312.23, 312.4, 312.8,312.9, 313.81, 314.
‡API includes Asian, Pacific Islander, Na ve Hawaiian. Other includes 2 or more races, Na ve American/Alaska Na ve, American Indian, or other.
§Rates not calculated for fewer than 5 events. Rates not calculated in cases where zip code is unknown.
Source: Emergency Department Discharge Database (CA OSHPD), County of San Diego, Health & Human Services Agency, Public Health Services, Emergency Medical Services; SANDAG, Current Population Estimates, 10/2012.
Prepared by: County of San Diego, Health & Human Services Agency, Public Health Services, Community Health Statistics Unit, 2013.
Ages 15‐24 Ages 25‐44 Ages 45‐64Male Female White Black Hispanic
Gender
A en on‐Deficit, Conduct, and Disrup ve Behavior‐related† Emergency Department Discharges Among San Diego County Residents by Loca on of Residence, 2011 Detail
Race/Ethnicity Age Group
Ages 65+API‡ Other‡ Ages 0‐14Geography2011 Total
County of San Diego, Health & Human Services Agency, Public Health Services, Community Health Statisitcs Unit Page 49

Dementia
County of San Diego, Health & Human Services Agency, Public Health Services, Community Health Statisitcs Unit Page 50

No. Rate* No. Rate* No. Rate* No. Rate* No. Rate* No. Rate* No. Rate* No. Rate* No. Rate* No. Rate* No. Rate*
San Diego County (Actual Rate) 605 19.5 693 22.2
San Diego County (Age‐Adjusted Rate) 605 18.9 693 20.6
Central Region 84 17.3 87 17.9
Central San Diego 27 16.3 24 14.5
Mid‐City 36 22.1 35 21.4
Southeast San Diego 21 13.5 28 17.9
East Region 131 28.3 153 32.8
Alpine 10 66.5 5 33.0
El Cajon 28 22.5 45 35.9
Harbison Crest/El Cajon** 54 38.8 63 45.0
Jamul 6 31.6 5 28.4
La Mesa 26 44.0 27 45.0
Laguna‐Pine Valley <5 § <5 §
Lakeside 7 12.5 12 21.3
Lemon Grove 8 26.8 11 36.7
Mountain Empire <5 § <5 §
Santee 12 23.5 14 27.1
Spring Valley 6 7.4 13 15.9
North Central Region 114 18.9 141 23.1
Coastal 23 30.5 30 39.7
Del Mar‐Mira Mesa 18 11.4 21 13.3
Elliott‐Navajo 24 26.9 27 30.2
Kearny Mesa 36 23.8 48 31.6
Miramar <5 § <5 §
Peninsula 5 7.9 6 9.5
University 8 12.8 9 13.5
North Coastal Region 89 17.6 107 21.0
Carlsbad 19 16.6 32 27.6
Oceanside 24 15.0 23 14.4
Pendleton <5 § <5 §
San Dieguito 29 31.0 36 37.9
Vista 17 16.9 16 15.8
North Inland Region 127 22.3 139 24.2
Anza‐Borrego Springs <5 § <5 §
Escondido 38 23.3 37 22.5
Fallbrook 8 16.9 10 20.9
North San Diego 41 38.5 41 38.1
Palomar‐Julian <5 § <5 §
Pauma <5 § <5 §
Poway 11 12.7 19 21.9
Ramona 6 17.2 10 28.2
San Marcos 20 22.2 19 21.1
Valley Center <5 § <5 §
South Region 59 12.6 66 14.1
Chula Vista 22 19.1 29 25.0
Coronado <5 § 5 21.4
National City 9 15.4 9 15.4
South Bay 16 11.9 16 11.8
Sweetwater 8 5.9 7 5.1Unknown <5 ‐‐‐ <5 ‐‐‐*Rates per 100,000 population. County age‐adjusted rates per 100,000 2000 US standard population.**Harbison Crest/El Cajon is an aggregation of the Harbison Crest and El Cajon SRAs. Due to geographic limitations, the Harbison Crest SRA is not shown alone. See the Data Guide for more information.†Demen a death refers to (underlying cause of death) ICD‐10 codes F01, F03.§Rates not calculated for fewer than 5 events. Rates not calculated in cases where zip code is unknown.Source: Death Statistical Master Files (CDPH), County of San Diego, Health & Human Services Agency, Public Health Services, Epidemiology & Immunization Services Branch; SANDAG, Current Population Estimates, 10/2012.Prepared by: County of San Diego, Health & Human Services Agency, Public Health Services, Community Health Statistics Unit, 2013.
Dementia† Deaths Among San Diego County Residents by Location of Residence
Geography2010 Total 2011 Total 2012 Total 2013 Total 2014 Total 2015 Total 2016 Total 2017 Total 2018 Total 2019 Total 2020 Total
County of San Diego, Health & Human Services Agency, Public Health Services, Community Health Statisitcs Unit Page 51

No. Rate* No. Rate* No. Rate* No. Rate* No. Rate* No. Rate* No. Rate* No. Rate* No. Rate* No. Rate* No. Rate* No. Rate* No. Rate*
San Diego County (Actual Rate) 605 19.5 207 13.3 398 25.8 486 32.4 22 15.0 58 5.9 33 9.7 5 4.3 <5 § <5 § <5 § 7 0.9 598 170.2
San Diego County (Age‐Adjusted Rate) 605 18.9
Central Region 84 17.3 31 12.5 53 22.4 48 33.4 12 21.2 18 8.8 5 7.8 <5 § <5 § <5 § <5 § <5 § 83 191.8
Central San Diego 27 16.3 11 12.2 16 21.3 16 19.4 <5 § 7 12.1 <5 § <5 § <5 § <5 § <5 § <5 § 27 173.7
Mid‐City 36 22.1 13 16.0 23 28.1 26 56.0 <5 § 5 7.3 <5 § <5 § <5 § <5 § <5 § <5 § 35 273.8
Southeast San Diego 21 13.5 7 9.2 14 17.5 6 40.3 7 27.1 6 7.7 <5 § <5 § <5 § <5 § <5 § <5 § 21 140.4
East Region 131 28.3 44 19.3 87 37.0 111 39.7 <5 11.3 11 9.5 <5 § <5 § <5 § <5 § <5 § <5 § 129 230.6
Alpine 10 66.5 <5 § 7 92.4 10 84.7 <5 § <5 § <5 § <5 § <5 § <5 § <5 § <5 § 10 477.3
El Cajon 28 22.5 11 18.1 17 26.7 26 35.3 <5 § <5 § <5 § <5 § <5 § <5 § <5 § <5 § 28 190.9
Harbison Crest/El Cajon** 54 38.8 19 27.8 35 49.3 45 52.8 <5 § <5 § <5 § <5 § <5 § <5 § <5 § <5 § 53 309.8
Jamul 6 31.6 <5 § <5 § 5 47.7 <5 § <5 § <5 § <5 § <5 § <5 § <5 § <5 § 6 302.3
La Mesa 26 44.0 8 28.4 18 58.2 22 59.4 <5 § <5 § <5 § <5 § <5 § <5 § <5 § <5 § 26 302.5
Laguna‐Pine Valley <5 § <5 § <5 § <5 § <5 § <5 § <5 § <5 § <5 § <5 § <5 § <5 § <5 §
Lakeside 7 12.5 <5 § <5 § 7 17.1 <5 § <5 § <5 § <5 § <5 § <5 § <5 § <5 § 7 116.0
Lemon Grove 8 26.8 <5 § 6 39.2 6 63.4 <5 § <5 § <5 § <5 § <5 § <5 § <5 § <5 § 8 241.5
Mountain Empire <5 § <5 § <5 § <5 § <5 § <5 § <5 § <5 § <5 § <5 § <5 § <5 § <5 §
Santee 12 23.5 <5 § 8 30.3 10 26.3 <5 § <5 § <5 § <5 § <5 § <5 § <5 § <5 § 11 192.4
Spring Valley 6 7.4 <5 § 5 12.0 <5 § <5 § <5 § <5 § <5 § <5 § <5 § <5 § <5 § 6 63.7
North Central Region 114 18.9 40 13.1 74 24.8 95 26.0 <5 § 8 9.3 8 7.4 <5 § <5 § <5 § <5 § <5 § 112 155.8
Coastal 23 30.5 8 20.6 15 41.1 21 34.5 <5 § <5 § <5 § <5 § <5 § <5 § <5 § <5 § 23 185.5
Del Mar‐Mira Mesa 18 11.4 8 10.1 10 12.7 11 14.5 <5 § <5 § 6 10.9 <5 § <5 § <5 § <5 § <5 § 18 132.2
Elliott‐Navajo 24 26.9 10 23.1 14 30.5 22 36.6 <5 § <5 § <5 § <5 § <5 § <5 § <5 § <5 § 23 173.1
Kearny Mesa 36 23.8 12 15.9 24 31.6 29 34.4 <5 § 6 § <5 § <5 § <5 § <5 § <5 § <5 § 35 183.6
Miramar <5 § <5 § <5 § <5 § <5 § <5 § <5 § <5 § <5 § <5 § <5 § <5 § <5 §
Peninsula 5 7.9 <5 § 5 17.4 5 10.4 <5 § <5 § <5 § <5 § <5 § <5 § <5 § <5 § 5 69.2
University 8 12.8 <5 § 6 19.0 7 21.3 <5 § <5 § <5 § <5 § <5 § <5 § <5 § <5 § 8 127.3
North Coastal Region 89 17.6 26 10.1 63 25.4 83 27.7 <5 § <5 § <5 § <5 § <5 § <5 § <5 § <5 § 89 149.3
Carlsbad 19 16.6 8 14.3 11 18.7 18 21.3 <5 § <5 § <5 § <5 § <5 § <5 § <5 § <5 § 19 106.7
Oceanside 24 15.0 6 7.6 18 22.4 22 29.6 <5 § <5 § <5 § <5 § <5 § <5 § <5 § <5 § 24 130.2
Pendleton <5 § <5 § <5 § <5 § <5 § <5 § <5 § <5 § <5 § <5 § <5 § <5 § <5 §
San Dieguito 29 31.0 7 15.2 22 46.3 29 39.5 <5 § <5 § <5 § <5 § <5 § <5 § <5 § <5 § 29 219.2
Vista 17 16.9 5 9.9 12 24.1 14 31.9 <5 § <5 § <5 § <5 § <5 § <5 § <5 § <5 § 17 168.4
North Inland Region 127 22.3 46 16.4 81 28.0 109 34.6 <5 § 9 5.5 6 10.1 <5 § <5 § <5 § <5 § <5 § 125 173.2
Anza‐Borrego Springs <5 § <5 § <5 § <5 § <5 § <5 § <5 § <5 § <5 § <5 § <5 § <5 § <5 §
Escondido 38 23.3 16 19.8 22 26.8 33 46.4 <5 § <5 § <5 § <5 § <5 § <5 § <5 § <5 § 38 216.8
Fallbrook 8 16.9 <5 § 6 25.3 7 25.6 <5 § <5 § <5 § <5 § <5 § <5 § <5 § <5 § 8 97.8
North San Diego 41 38.5 16 31.1 25 45.4 35 55.9 <5 § <5 § <5 § <5 § <5 § <5 § <5 § <5 § 41 318.3
Palomar‐Julian <5 § <5 § <5 § <5 § <5 § <5 § <5 § <5 § <5 § <5 § <5 § <5 § <5 §
Pauma <5 § <5 § <5 § <5 § <5 § <5 § <5 § <5 § <5 § <5 § <5 § <5 § <5 §
Poway 11 12.7 <5 § 10 22.7 8 13.8 <5 § <5 § <5 § <5 § <5 § <5 § <5 § <5 § 10 92.4
Ramona 6 17.2 <5 § <5 § 5 20.1 <5 § <5 § <5 § <5 § <5 § <5 § <5 § <5 § 5 133.8
San Marcos 20 22.2 7 15.9 13 28.3 18 39.6 <5 § <5 § <5 § <5 § <5 § <5 § <5 § <5 § 20 170.0
Valley Center <5 § <5 § <5 § <5 § <5 § <5 § <5 § <5 § <5 § <5 § <5 § <5 § <5 §
South Region 59 12.6 19 8.1 40 17.1 39 39.7 <5 § 9 3.2 8 13.4 <5 § <5 § <5 § <5 § <5 § 59 121.5
Chula Vista 22 19.1 8 14.4 14 23.5 17 79.6 <5 § <5 § <5 § <5 § <5 § <5 § <5 § <5 § 22 151.6
Coronado <5 § <5 § <5 § <5 § <5 § <5 § <5 § <5 § <5 § <5 § <5 § <5 § <5 §
National City 9 15.4 <5 § 6 21.2 <5 § <5 § <5 § <5 § <5 § <5 § <5 § <5 § <5 § 9 146.0
South Bay 16 11.9 <5 § 12 17.9 8 39.0 <5 § <5 § 5 38.3 <5 § <5 § <5 § <5 § <5 § 16 124.0
Sweetwater 8 5.9 <5 § 5 7.2 8 25.4 <5 § <5 § <5 § <5 § <5 § <5 § <5 § <5 § 8 69.6Unknown <5 ‐‐‐ <5 ‐‐‐ <5 ‐‐‐ <5 ‐‐‐ <5 ‐‐‐ <5 ‐‐‐ <5 ‐‐‐ <5 ‐‐‐ <5 ‐‐‐ <5 ‐‐‐ <5 ‐‐‐ <5 ‐‐‐ <5 ‐‐‐*Rates per 100,000 population. County age‐adjusted rates per 100,000 2000 US standard population.**Harbison Crest/El Cajon is an aggregation of the Harbison Crest and El Cajon SRAs. Due to geographic limitations, the Harbison Crest SRA is not shown alone. See the Data Guide for more information.
***Numbers may not add up to totals due to unknown or missing details.
†Demen a death refers to (underlying cause of death) ICD‐10 codes F01, F03.
‡API includes Asian, Pacific Islander, Na ve Hawaiian. Other includes 2 or more races, Na ve American/Alaska Na ve, American Indian, or other.
§Rates not calculated for fewer than 5 events. Rates not calculated in cases where zip code is unknown.
Source: Death Statistical Master Files (CDPH), County of San Diego, Health & Human Services Agency, Public Health Services, Epidemiology & Immunization Services Branch; SANDAG, Current Population Estimates, 10/2012.
Prepared by: County of San Diego, Health & Human Services Agency, Public Health Services, Community Health Statistics Unit, 2013.
Geography2010 Total
Gender Race/Ethnicity Age Group
Male Ages 65+Female White Other‡ Ages 0‐14 Ages 15‐24 Ages 25‐44API‡
Demen a† Deaths Among San Diego County Residents by Loca on of Residence, 2010 Detail
Ages 45‐64HispanicBlack
County of San Diego, Health & Human Services Agency, Public Health Services, Community Health Statisitcs Unit Page 52

No. Rate* No. Rate* No. Rate* No. Rate* No. Rate* No. Rate* No. Rate* No. Rate* No. Rate* No. Rate* No. Rate* No. Rate* No. Rate*
San Diego County (Actual Rate) 693 22.2 253 16.2 440 28.3 551 36.8 19 13.3 84 8.3 34 9.7 5 4.2 <5 § <5 § <5 § 6 0.8 687 189.8
San Diego County (Age‐Adjusted Rate) 693 20.6
Central Region 87 17.9 32 12.9 55 23.2 50 35.1 11 20.1 21 10.1 5 7.7 <5 § <5 § <5 § <5 § <5 § 85 192.9
Central San Diego 24 14.5 12 13.2 12 15.9 21 25.7 <5 § <5 § <5 § <5 § <5 § <5 § <5 § <5 § 23 143.3
Mid‐City 35 21.4 10 12.3 25 30.5 22 48.1 <5 § 8 11.5 <5 § <5 § <5 § <5 § <5 § <5 § 35 271.2
Southeast San Diego 28 17.9 10 13.1 18 22.5 7 47.6 5 20.0 13 16.3 <5 § <5 § <5 § <5 § <5 § <5 § 27 178.7
East Region 153 32.8 56 24.4 97 41.0 128 45.9 <5 § 17 14.3 <5 § <5 § <5 § <5 § <5 § <5 § 152 259.9
Alpine 5 33.0 <5 § <5 § 5 42.5 <5 § <5 § <5 § <5 § <5 § <5 § <5 § <5 § 5 224.6
El Cajon 45 35.9 16 26.1 29 45.4 38 51.7 <5 § 6 17.7 <5 § <5 § <5 § <5 § <5 § <5 § 45 297.5
Harbison Crest/El Cajon** 63 45.0 24 34.9 39 54.7 53 62.3 <5 § 8 22.1 <5 § <5 § <5 § <5 § <5 § <5 § 63 355.7
Jamul 5 28.4 <5 § <5 § <5 31.4 <5 § <5 § <5 § <5 § <5 § <5 § <5 § <5 § 5 255.2
La Mesa 27 45.0 9 31.4 18 57.4 24 64.4 <5 § <5 § <5 § <5 § <5 § <5 § <5 § <5 § 27 304.9
Laguna‐Pine Valley <5 § <5 § <5 § <5 § <5 § <5 § <5 § <5 § <5 § <5 § <5 § <5 § <5 §
Lakeside 12 21.3 7 25.1 5 17.6 11 26.9 <5 § <5 § <5 § <5 § <5 § <5 § <5 § <5 § 12 188.5
Lemon Grove 11 36.7 <5 § 8 52.0 8 85.5 <5 § <5 § <5 § <5 § <5 § <5 § <5 § <5 § 11 321.8
Mountain Empire <5 § <5 § <5 § <5 § <5 § <5 § <5 § <5 § <5 § <5 § <5 § <5 § <5 §
Santee 14 27.1 <5 § 10 37.5 14 36.7 <5 § <5 § <5 § <5 § <5 § <5 § <5 § <5 § 13 214.9
Spring Valley 13 15.9 <5 § 10 23.8 8 20.9 <5 § <5 § <5 § <5 § <5 § <5 § <5 § <5 § 13 132.0
North Central Region 141 23.1 61 19.8 80 26.6 121 33.1 <5 § 7 8.0 11 9.9 <5 § <5 § <5 § <5 § <5 § 140 190.0
Coastal 30 39.7 14 36.0 16 43.7 28 46.2 <5 § <5 § <5 § <5 § <5 § <5 § <5 § <5 § 30 237.8
Del Mar‐Mira Mesa 21 13.3 11 13.9 10 12.6 13 17.2 <5 § <5 § 6 10.8 <5 § <5 § <5 § <5 § <5 § 21 146.1
Elliott‐Navajo 27 30.2 14 32.3 13 28.2 25 41.7 <5 § <5 § <5 § <5 § <5 § <5 § <5 § <5 § 26 190.3
Kearny Mesa 48 31.6 16 21.2 32 42.0 40 47.7 <5 § <5 § <5 § <5 § <5 § <5 § <5 § <5 § 48 247.6
Miramar <5 § <5 § <5 § <5 § <5 § <5 § <5 § <5 § <5 § <5 § <5 § <5 § <5 §
Peninsula 6 9.5 <5 § <5 § 6 12.6 <5 § <5 § <5 § <5 § <5 § <5 § <5 § <5 § 6 82.9
University 9 13.5 <5 § 6 17.9 9 26.3 <5 § <5 § <5 § <5 § <5 § <5 § <5 § <5 § 9 140.8
North Coastal Region 107 21.0 30 11.6 77 30.8 94 31.4 <5 § 7 4.8 <5 § <5 § <5 § <5 § <5 § <5 § 106 172.0
Carlsbad 32 27.6 12 21.3 20 33.6 30 35.4 <5 § <5 § <5 § <5 § <5 § <5 § <5 § <5 § 32 173.2
Oceanside 23 14.4 5 6.3 18 22.3 16 21.7 <5 § 5 8.2 <5 § <5 § <5 § <5 § <5 § <5 § 22 117.5
Pendleton <5 § <5 § <5 § <5 § <5 § <5 § <5 § <5 § <5 § <5 § <5 § <5 § <5 §
San Dieguito 36 37.9 8 17.1 28 58.1 32 43.2 <5 § <5 § <5 § <5 § <5 § <5 § <5 § <5 § 36 257.9
Vista 16 15.8 5 9.8 11 21.9 16 36.7 <5 § <5 § <5 § <5 § <5 § <5 § <5 § <5 § 16 153.7
North Inland Region 139 24.2 48 17.0 91 31.2 123 39.2 <5 § 8 4.8 5 8.3 <5 § <5 § <5 § <5 § <5 § 138 184.9
Anza‐Borrego Springs <5 § <5 § <5 § <5 § <5 § <5 § <5 § <5 § <5 § <5 § <5 § <5 § <5 §
Escondido 37 22.5 9 11.0 28 33.8 35 49.6 <5 § <5 § <5 § <5 § <5 § <5 § <5 § <5 § 37 207.6
Fallbrook 10 20.9 <5 § 7 29.1 10 36.7 <5 § <5 § <5 § <5 § <5 § <5 § <5 § <5 § 10 117.3
North San Diego 41 38.1 11 21.1 30 54.0 32 51.0 <5 § 5 45.7 <5 § <5 § <5 § <5 § <5 § <5 § 41 308.1
Palomar‐Julian <5 § <5 § <5 § <5 § <5 § <5 § <5 § <5 § <5 § <5 § <5 § <5 § <5 §
Pauma <5 § <5 § <5 § <5 § <5 § <5 § <5 § <5 § <5 § <5 § <5 § <5 § <5 §
Poway 19 21.9 8 18.8 11 24.7 15 25.9 <5 § <5 § <5 § <5 § <5 § <5 § <5 § <5 § 19 168.7
Ramona 10 28.2 5 28.1 5 28.4 10 40.0 <5 § <5 § <5 § <5 § <5 § <5 § <5 § <5 § 9 224.3
San Marcos 19 21.1 11 24.9 8 17.4 18 40.1 <5 § <5 § <5 § <5 § <5 § <5 § <5 § <5 § 19 159.6
Valley Center <5 § <5 § <5 § <5 § <5 § <5 § <5 § <5 § <5 § <5 § <5 § <5 § <5 §
South Region 66 14.1 26 11.1 40 17.0 35 36.4 <5 § 24 8.5 7 11.7 <5 § <5 § <5 § <5 § <5 § 66 133.6
Chula Vista 29 25.0 13 23.3 16 26.6 18 86.0 <5 § 8 9.7 <5 § <5 § <5 § <5 § <5 § <5 § 29 197.7
Coronado 5 21.4 <5 § <5 § 5 29.3 <5 § <5 § <5 § <5 § <5 § <5 § <5 § <5 § 5 141.2
National City 9 15.4 <5 § 7 24.6 <5 § <5 § 5 13.3 <5 § <5 § <5 § <5 § <5 § <5 § 9 148.1
South Bay 16 11.8 5 7.3 11 16.4 <5 § <5 § 10 10.7 <5 § <5 § <5 § <5 § <5 § <5 § 16 121.2
Sweetwater 7 5.1 <5 § <5 § 5 15.9 <5 § <5 § <5 § <5 § <5 § <5 § <5 § <5 § 7 58.8
Unknown <5 ‐‐‐ <5 ‐‐‐ <5 ‐‐‐ <5 ‐‐‐ <5 ‐‐‐ <5 ‐‐‐ <5 ‐‐‐ <5 ‐‐‐ <5 ‐‐‐ <5 ‐‐‐ <5 ‐‐‐ <5 ‐‐‐ <5 ‐‐‐*Rates per 100,000 population. County age‐adjusted rates per 100,000 2000 US standard population.
**Harbison Crest/El Cajon is an aggregation of the Harbison Crest and El Cajon SRAs. Due to geographic limitations, the Harbison Crest SRA is not shown alone. See the Data Guide for more information.
***Numbers may not add up to totals due to unknown or missing details.
†Demen a death refers to (underlying cause of death) ICD‐10 codes F01, F03.
‡API includes Asian, Pacific Islander, Na ve Hawaiian. Other includes 2 or more races, Na ve American/Alaska Na ve, American Indian, or other.
§Rates not calculated for fewer than 5 events. Rates not calculated in cases where zip code is unknown.
Source: Death Statistical Master Files (CDPH), County of San Diego, Health & Human Services Agency, Public Health Services, Epidemiology & Immunization Services Branch; SANDAG, Current Population Estimates, 10/2012.
Prepared by: County of San Diego, Health & Human Services Agency, Public Health Services, Community Health Statistics Unit, 2013.
Ages 65+API‡ Other‡ Ages 0‐14Geography2011 Total
Demen a† Deaths Among San Diego County Residents by Loca on of Residence, 2011 Detail
Ages 15‐24 Ages 25‐44 Ages 45‐64Male Female White Black Hispanic
Gender Race/Ethnicity Age Group
County of San Diego, Health & Human Services Agency, Public Health Services, Community Health Statisitcs Unit Page 53

No. Rate* No. Rate* No. Rate* No. Rate* No. Rate* No. Rate* No. Rate* No. Rate* No. Rate* No. Rate* No. Rate*
San Diego County (Actual Rate) 123 4.0 107 3.4
San Diego County (Age‐Adjusted Rate) 123 4.1 107 3.5
Central Region 11 2.3 16 3.3
Central San Diego 5 3.0 5 3.0
Mid‐City <5 § 7 4.3
Southeast San Diego <5 § <5 §
East Region 17 3.7 12 2.6
Alpine <5 § <5 §
El Cajon <5 § <5 §
Harbison Crest/El Cajon** 6 4.3 6 4.3
Jamul <5 § <5 §
La Mesa <5 § <5 §
Laguna‐Pine Valley <5 § <5 §
Lakeside <5 § <5 §
Lemon Grove <5 § <5 §
Mountain Empire <5 § <5 §
Santee <5 § <5 §
Spring Valley <5 § <5 §
North Central Region 20 3.3 20 3.3
Coastal <5 § <5 §
Del Mar‐Mira Mesa 5 3.2 <5 §
Elliott‐Navajo <5 § 9 10.1
Kearny Mesa 7 4.6 7 4.6
Miramar <5 § <5 §
Peninsula <5 § <5 §
University <5 § <5 §
North Coastal Region 18 3.6 17 3.3
Carlsbad <5 § 5 4.3
Oceanside 7 4.4 <5 §
Pendleton <5 § <5 §
San Dieguito 5 5.3 <5 §
Vista <5 § 6 5.9
North Inland Region 48 8.4 31 5.4
Anza‐Borrego Springs <5 § <5 §
Escondido 19 11.7 12 7.3
Fallbrook 9 19.0 <5 §
North San Diego 5 4.7 7 6.5
Palomar‐Julian <5 § <5 §
Pauma <5 § <5 §
Poway 6 7.0 <5 §
Ramona <5 § <5 §
San Marcos 5 5.6 <5 §
Valley Center <5 § <5 §
South Region 9 1.9 11 2.3
Chula Vista <5 § 7 6.0
Coronado <5 § <5 §
National City <5 § <5 §
South Bay <5 § <5 §
Sweetwater <5 § <5 §Unknown <5 ‐‐‐ <5 ‐‐‐*Rates per 100,000 population. County age‐adjusted rates per 100,000 2000 US standard population.**Harbison Crest/El Cajon is an aggregation of the Harbison Crest and El Cajon SRAs. Due to geographic limitations, the Harbison Crest SRA is not shown alone. See the Data Guide for more information.†Demen a‐related hospitaliza on refers to (principal diagnosis) ICD‐9 code 290.§Rates not calculated for fewer than 5 events. Rates not calculated in cases where zip code is unknown.Source: Patient Discharge Database (CA OSHPD), County of San Diego, Health & Human Services Agency, Public Health Services, Epidemiology & Immunization Services Branch; SANDAG, Current Population Estimates, 10/2012.Prepared by: County of San Diego, Health & Human Services Agency, Public Health Services, Community Health Statistics Unit, 2013.
Dementia‐related† Hospitaliza ons Among San Diego County Residents by Location of Residence
Geography2010 Total 2011 Total 2012 Total 2013 Total 2014 Total 2015 Total 2016 Total 2017 Total 2018 Total 2019 Total 2020 Total
County of San Diego, Health & Human Services Agency, Public Health Services, Community Health Statisitcs Unit Page 54

No. Rate* No. Rate* No. Rate* No. Rate* No. Rate* No. Rate* No. Rate* No. Rate* No. Rate* No. Rate* No. Rate* No. Rate* No. Rate*
San Diego County (Actual Rate) 123 4.0 51 3.3 72 4.7 85 5.7 7 4.8 19 1.9 7 2.0 <5 2.6 <5 § <5 § <5 § 5 0.7 117 33.3
San Diego County (Age‐Adjusted Rate) 123 4.1
Central Region 11 2.3 6 2.4 5 2.1 6 4.2 <5 § <5 § <5 § <5 § <5 § <5 § <5 § <5 § 10 23.1
Central San Diego 5 3.0 <5 § <5 § 5 6.1 <5 § <5 § <5 § <5 § <5 § <5 § <5 § <5 § 5 32.2
Mid‐City <5 § <5 § <5 § <5 § <5 § <5 § <5 § <5 § <5 § <5 § <5 § <5 § <5 §
Southeast San Diego <5 § <5 § <5 § <5 § <5 § <5 § <5 § <5 § <5 § <5 § <5 § <5 § <5 §
East Region 17 3.7 6 2.6 11 4.7 12 4.3 <5 § <5 § <5 § <5 § <5 § <5 § <5 § <5 § 16 28.6
Alpine <5 § <5 § <5 § <5 § <5 § <5 § <5 § <5 § <5 § <5 § <5 § <5 § <5 §
El Cajon <5 § <5 § <5 § <5 § <5 § <5 § <5 § <5 § <5 § <5 § <5 § <5 § <5 §
Harbison Crest/El Cajon** 6 4.3 <5 § 5 7.0 5 5.9 <5 § <5 § <5 § <5 § <5 § <5 § <5 § <5 § 6 35.1
Jamul <5 § <5 § <5 § <5 § <5 § <5 § <5 § <5 § <5 § <5 § <5 § <5 § <5 §
La Mesa <5 § <5 § <5 § <5 § <5 § <5 § <5 § <5 § <5 § <5 § <5 § <5 § <5 §
Laguna‐Pine Valley <5 § <5 § <5 § <5 § <5 § <5 § <5 § <5 § <5 § <5 § <5 § <5 § <5 §
Lakeside <5 § <5 § <5 § <5 § <5 § <5 § <5 § <5 § <5 § <5 § <5 § <5 § <5 §
Lemon Grove <5 § <5 § <5 § <5 § <5 § <5 § <5 § <5 § <5 § <5 § <5 § <5 § <5 §
Mountain Empire <5 § <5 § <5 § <5 § <5 § <5 § <5 § <5 § <5 § <5 § <5 § <5 § <5 §
Santee <5 § <5 § <5 § <5 § <5 § <5 § <5 § <5 § <5 § <5 § <5 § <5 § <5 §
Spring Valley <5 § <5 § <5 § <5 § <5 § <5 § <5 § <5 § <5 § <5 § <5 § <5 § <5 §
North Central Region 20 3.3 <5 § 17 5.7 17 4.7 <5 § <5 § <5 § <5 § <5 § <5 § <5 § <5 § 19 26.4
Coastal <5 § <5 § <5 § <5 § <5 § <5 § <5 § <5 § <5 § <5 § <5 § <5 § <5 §
Del Mar‐Mira Mesa 5 3.2 <5 § 5 6.4 <5 § <5 § <5 § <5 § <5 § <5 § <5 § <5 § <5 § 5 36.7
Elliott‐Navajo <5 § <5 § <5 § <5 § <5 § <5 § <5 § <5 § <5 § <5 § <5 § <5 § <5 §
Kearny Mesa 7 4.6 <5 § 5 6.6 7 8.3 <5 § <5 § <5 § <5 § <5 § <5 § <5 § <5 § 6 31.5
Miramar <5 § <5 § <5 § <5 § <5 § <5 § <5 § <5 § <5 § <5 § <5 § <5 § <5 §
Peninsula <5 § <5 § <5 § <5 § <5 § <5 § <5 § <5 § <5 § <5 § <5 § <5 § <5 §
University <5 § <5 § <5 § <5 § <5 § <5 § <5 § <5 § <5 § <5 § <5 § <5 § <5 §
North Coastal Region 18 3.6 6 2.3 12 4.8 11 3.7 <5 § <5 § <5 § <5 § <5 § <5 § <5 § <5 § 17 28.5
Carlsbad <5 § <5 § <5 § <5 § <5 § <5 § <5 § <5 § <5 § <5 § <5 § <5 § <5 §
Oceanside 7 4.4 <5 § <5 § <5 § <5 § <5 § <5 § <5 § <5 § <5 § <5 § <5 § 6 32.5
Pendleton <5 § <5 § <5 § <5 § <5 § <5 § <5 § <5 § <5 § <5 § <5 § <5 § <5 §
San Dieguito 5 5.3 <5 § <5 § <5 § <5 § <5 § <5 § <5 § <5 § <5 § <5 § <5 § 5 37.8
Vista <5 § <5 § <5 § <5 § <5 § <5 § <5 § <5 § <5 § <5 § <5 § <5 § <5 §
North Inland Region 48 8.4 25 8.9 23 8.0 37 11.8 <5 § 7 4.3 <5 § <5 § <5 § <5 § <5 § <5 § 46 63.8
Anza‐Borrego Springs <5 § <5 § <5 § <5 § <5 § <5 § <5 § <5 § <5 § <5 § <5 § <5 § <5 §
Escondido 19 11.7 10 12.4 9 11.0 14 19.7 <5 § <5 § <5 § <5 § <5 § <5 § <5 § <5 § 17 97.0
Fallbrook 9 19.0 <5 § 6 25.3 8 29.3 <5 § <5 § <5 § <5 § <5 § <5 § <5 § <5 § 9 110.0
North San Diego 5 4.7 <5 § <5 § <5 § <5 § <5 § <5 § <5 § <5 § <5 § <5 § <5 § 5 38.8
Palomar‐Julian <5 § <5 § <5 § <5 § <5 § <5 § <5 § <5 § <5 § <5 § <5 § <5 § <5 §
Pauma <5 § <5 § <5 § <5 § <5 § <5 § <5 § <5 § <5 § <5 § <5 § <5 § <5 §
Poway 6 7.0 5 11.9 <5 § <5 § <5 § <5 § <5 § <5 § <5 § <5 § <5 § <5 § 6 55.5
Ramona <5 § <5 § <5 § <5 § <5 § <5 § <5 § <5 § <5 § <5 § <5 § <5 § <5 §
San Marcos 5 5.6 <5 § <5 § <5 § <5 § <5 § <5 § <5 § <5 § <5 § <5 § <5 § 5 42.5
Valley Center <5 § <5 § <5 § <5 § <5 § <5 § <5 § <5 § <5 § <5 § <5 § <5 § <5 §
South Region 9 1.9 5 2.1 <5 § <5 § <5 § <5 § <5 § <5 § <5 § <5 § <5 § <5 § 9 18.5
Chula Vista <5 § <5 § <5 § <5 § <5 § <5 § <5 § <5 § <5 § <5 § <5 § <5 § <5 §
Coronado <5 § <5 § <5 § <5 § <5 § <5 § <5 § <5 § <5 § <5 § <5 § <5 § <5 §
National City <5 § <5 § <5 § <5 § <5 § <5 § <5 § <5 § <5 § <5 § <5 § <5 § <5 §
South Bay <5 § <5 § <5 § <5 § <5 § <5 § <5 § <5 § <5 § <5 § <5 § <5 § <5 §
Sweetwater <5 § <5 § <5 § <5 § <5 § <5 § <5 § <5 § <5 § <5 § <5 § <5 § <5 §Unknown <5 ‐‐‐ <5 ‐‐‐ <5 ‐‐‐ <5 ‐‐‐ <5 ‐‐‐ <5 ‐‐‐ <5 ‐‐‐ <5 ‐‐‐ <5 ‐‐‐ <5 ‐‐‐ <5 ‐‐‐ <5 ‐‐‐ <5 ‐‐‐*Rates per 100,000 population. County age‐adjusted rates per 100,000 2000 US standard population.**Harbison Crest/El Cajon is an aggregation of the Harbison Crest and El Cajon SRAs. Due to geographic limitations, the Harbison Crest SRA is not shown alone. See the Data Guide for more information.
***Numbers may not add up to totals due to unknown or missing details.
†Demen a‐related hospitaliza on refers to (principal diagnosis) ICD‐9 code 290.
‡API includes Asian, Pacific Islander, Na ve Hawaiian. Other includes 2 or more races, Na ve American/Alaska Na ve, American Indian, or other.
§Rates not calculated for fewer than 5 events. Rates not calculated in cases where zip code is unknown.
Source: Patient Discharge Database (CA OSHPD), County of San Diego, Health & Human Services Agency, Public Health Services, Epidemiology & Immunization Services Branch; SANDAG, Current Population Estimates, 10/2012.
Prepared by: County of San Diego, Health & Human Services Agency, Public Health Services, Community Health Statistics Unit, 2013.
Ages 45‐64Hispanic
Demen a‐related† Hospitaliza ons Among San Diego County Residents by Loca on of Residence, 2010 Detail
Geography2010 Total
Gender Race/Ethnicity Age Group
Male Ages 65+Female White Black Other‡ Ages 0‐14 Ages 15‐24 Ages 25‐44API‡
County of San Diego, Health & Human Services Agency, Public Health Services, Community Health Statisitcs Unit Page 55

No. Rate* No. Rate* No. Rate* No. Rate* No. Rate* No. Rate* No. Rate* No. Rate* No. Rate* No. Rate* No. Rate* No. Rate* No. Rate*
San Diego County (Actual Rate) 107 3.4 55 3.5 52 3.3 79 5.3 10 7.0 10 1.0 5 1.4 <5 § <5 § <5 § <5 § 6 0.8 101 27.9
San Diego County (Age‐Adjusted Rate) 107 3.5
Central Region 16 3.3 8 3.2 8 3.4 6 4.2 <5 § <5 § <5 § <5 § <5 § <5 § <5 § <5 § 14 31.8
Central San Diego 5 3.0 <5 § <5 § <5 § <5 § <5 § <5 § <5 § <5 § <5 § <5 § <5 § 5 31.2
Mid‐City 7 4.3 <5 § <5 § <5 § <5 § <5 § <5 § <5 § <5 § <5 § <5 § <5 § 6 46.5
Southeast San Diego <5 § <5 § <5 § <5 § <5 § <5 § <5 § <5 § <5 § <5 § <5 § <5 § <5 §
East Region 12 2.6 7 3.0 5 2.1 8 2.9 <5 § <5 § <5 § <5 § <5 § <5 § <5 § <5 § 11 18.8
Alpine <5 § <5 § <5 § <5 § <5 § <5 § <5 § <5 § <5 § <5 § <5 § <5 § <5 §
El Cajon <5 § <5 § <5 § <5 § <5 § <5 § <5 § <5 § <5 § <5 § <5 § <5 § <5 §
Harbison Crest/El Cajon** 6 4.3 <5 § <5 § <5 § <5 § <5 § <5 § <5 § <5 § <5 § <5 § <5 § 6 33.9
Jamul <5 § <5 § <5 § <5 § <5 § <5 § <5 § <5 § <5 § <5 § <5 § <5 § <5 §
La Mesa <5 § <5 § <5 § <5 § <5 § <5 § <5 § <5 § <5 § <5 § <5 § <5 § <5 §
Laguna‐Pine Valley <5 § <5 § <5 § <5 § <5 § <5 § <5 § <5 § <5 § <5 § <5 § <5 § <5 §
Lakeside <5 § <5 § <5 § <5 § <5 § <5 § <5 § <5 § <5 § <5 § <5 § <5 § <5 §
Lemon Grove <5 § <5 § <5 § <5 § <5 § <5 § <5 § <5 § <5 § <5 § <5 § <5 § <5 §
Mountain Empire <5 § <5 § <5 § <5 § <5 § <5 § <5 § <5 § <5 § <5 § <5 § <5 § <5 §
Santee <5 § <5 § <5 § <5 § <5 § <5 § <5 § <5 § <5 § <5 § <5 § <5 § <5 §
Spring Valley <5 § <5 § <5 § <5 § <5 § <5 § <5 § <5 § <5 § <5 § <5 § <5 § <5 §
North Central Region 20 3.3 8 2.6 12 4.0 16 4.4 <5 § <5 § <5 § <5 § <5 § <5 § <5 § <5 § 19 25.8
Coastal <5 § <5 § <5 § <5 § <5 § <5 § <5 § <5 § <5 § <5 § <5 § <5 § <5 §
Del Mar‐Mira Mesa <5 § <5 § <5 § <5 § <5 § <5 § <5 § <5 § <5 § <5 § <5 § <5 § <5 §
Elliott‐Navajo 9 10.1 <5 § 5 10.9 8 13.4 <5 § <5 § <5 § <5 § <5 § <5 § <5 § <5 § 8 58.5
Kearny Mesa 7 4.6 <5 § 5 6.6 <5 § <5 § <5 § <5 § <5 § <5 § <5 § <5 § <5 § 7 36.1
Miramar <5 § <5 § <5 § <5 § <5 § <5 § <5 § <5 § <5 § <5 § <5 § <5 § <5 §
Peninsula <5 § <5 § <5 § <5 § <5 § <5 § <5 § <5 § <5 § <5 § <5 § <5 § <5 §
University <5 § <5 § <5 § <5 § <5 § <5 § <5 § <5 § <5 § <5 § <5 § <5 § <5 §
North Coastal Region 17 3.3 6 2.3 11 4.4 17 5.7 <5 § <5 § <5 § <5 § <5 § <5 § <5 § <5 § 16 26.0
Carlsbad 5 4.3 <5 § <5 § 5 5.9 <5 § <5 § <5 § <5 § <5 § <5 § <5 § <5 § 5 27.1
Oceanside <5 § <5 § <5 § <5 § <5 § <5 § <5 § <5 § <5 § <5 § <5 § <5 § <5 §
Pendleton <5 § <5 § <5 § <5 § <5 § <5 § <5 § <5 § <5 § <5 § <5 § <5 § <5 §
San Dieguito <5 § <5 § <5 § <5 § <5 § <5 § <5 § <5 § <5 § <5 § <5 § <5 § <5 §
Vista 6 5.9 <5 § <5 § 6 13.8 <5 § <5 § <5 § <5 § <5 § <5 § <5 § <5 § 5 48.0
North Inland Region 31 5.4 19 6.7 12 4.1 26 8.3 <5 § <5 § <5 § <5 § <5 § <5 § <5 § <5 § 31 41.5
Anza‐Borrego Springs <5 § <5 § <5 § <5 § <5 § <5 § <5 § <5 § <5 § <5 § <5 § <5 § <5 §
Escondido 12 7.3 8 9.8 <5 § 10 14.2 <5 § <5 § <5 § <5 § <5 § <5 § <5 § <5 § 12 67.3
Fallbrook <5 § <5 § <5 § <5 § <5 § <5 § <5 § <5 § <5 § <5 § <5 § <5 § <5 §
North San Diego 7 6.5 <5 § <5 § <5 § <5 § <5 § <5 § <5 § <5 § <5 § <5 § <5 § 7 52.6
Palomar‐Julian <5 § <5 § <5 § <5 § <5 § <5 § <5 § <5 § <5 § <5 § <5 § <5 § <5 §
Pauma <5 § <5 § <5 § <5 § <5 § <5 § <5 § <5 § <5 § <5 § <5 § <5 § <5 §
Poway <5 § <5 § <5 § <5 § <5 § <5 § <5 § <5 § <5 § <5 § <5 § <5 § <5 §
Ramona <5 § <5 § <5 § <5 § <5 § <5 § <5 § <5 § <5 § <5 § <5 § <5 § <5 §
San Marcos <5 § <5 § <5 § <5 § <5 § <5 § <5 § <5 § <5 § <5 § <5 § <5 § <5 §
Valley Center <5 § <5 § <5 § <5 § <5 § <5 § <5 § <5 § <5 § <5 § <5 § <5 § <5 §
South Region 11 2.3 7 3.0 <5 § 6 6.2 <5 § <5 § <5 § <5 § <5 § <5 § <5 § <5 § 10 20.2
Chula Vista 7 6.0 <5 § <5 § <5 § <5 § <5 § <5 § <5 § <5 § <5 § <5 § <5 § 6 40.9
Coronado <5 § <5 § <5 § <5 § <5 § <5 § <5 § <5 § <5 § <5 § <5 § <5 § <5 §
National City <5 § <5 § <5 § <5 § <5 § <5 § <5 § <5 § <5 § <5 § <5 § <5 § <5 §
South Bay <5 § <5 § <5 § <5 § <5 § <5 § <5 § <5 § <5 § <5 § <5 § <5 § <5 §
Sweetwater <5 § <5 § <5 § <5 § <5 § <5 § <5 § <5 § <5 § <5 § <5 § <5 § <5 §Unknown <5 ‐‐‐ <5 ‐‐‐ <5 ‐‐‐ <5 ‐‐‐ <5 ‐‐‐ <5 ‐‐‐ <5 ‐‐‐ <5 ‐‐‐ <5 ‐‐‐ <5 ‐‐‐ <5 ‐‐‐ <5 ‐‐‐ <5 ‐‐‐*Rates per 100,000 population. County age‐adjusted rates per 100,000 2000 US standard population.**Harbison Crest/El Cajon is an aggregation of the Harbison Crest and El Cajon SRAs. Due to geographic limitations, the Harbison Crest SRA is not shown alone. See the Data Guide for more information.
***Numbers may not add up to totals due to unknown or missing details.
† Demen a‐related hospitaliza on refers to (principal diagnosis) ICD‐9 code 290.
‡API includes Asian, Pacific Islander, Na ve Hawaiian. Other includes 2 or more races, Na ve American/Alaska Na ve, American Indian, or other.
§Rates not calculated for fewer than 5 events. Rates not calculated in cases where zip code is unknown.
Source: Patient Discharge Database (CA OSHPD), County of San Diego, Health & Human Services Agency, Public Health Services, Epidemiology & Immunization Services Branch; SANDAG, Current Population Estimates, 10/2012.
Prepared by: County of San Diego, Health & Human Services Agency, Public Health Services, Community Health Statistics Unit, 2013.
Ages 15‐24 Ages 25‐44 Ages 45‐64Male Female White Black Hispanic
Gender
Demen a‐related† Hospitaliza ons Among San Diego County Residents by Loca on of Residence, 2011 Detail
Race/Ethnicity Age Group
Ages 65+API‡ Other‡ Ages 0‐14Geography2011 Total
County of San Diego, Health & Human Services Agency, Public Health Services, Community Health Statisitcs Unit Page 56

No. Rate* No. Rate* No. Rate* No. Rate* No. Rate* No. Rate* No. Rate* No. Rate* No. Rate* No. Rate* No. Rate*
San Diego County (Actual Rate) 35 1.1 32 1.0
San Diego County (Age‐Adjusted Rate) 35 1.1 32 0.9
Central Region <5 § <5 §
Central San Diego <5 § <5 §
Mid‐City <5 § <5 §
Southeast San Diego <5 § <5 §
East Region <5 § <5 §
Alpine <5 § <5 §
El Cajon <5 § <5 §
Harbison Crest/El Cajon** <5 § <5 §
Jamul <5 § <5 §
La Mesa <5 § <5 §
Laguna‐Pine Valley <5 § <5 §
Lakeside <5 § <5 §
Lemon Grove <5 § <5 §
Mountain Empire <5 § <5 §
Santee <5 § <5 §
Spring Valley <5 § <5 §
North Central Region <5 § <5 §
Coastal <5 § <5 §
Del Mar‐Mira Mesa <5 § <5 §
Elliott‐Navajo <5 § <5 §
Kearny Mesa <5 § <5 §
Miramar <5 § <5 §
Peninsula <5 § <5 §
University <5 § <5 §
North Coastal Region 17 3.4 22 4.3
Carlsbad <5 § 6 5.2
Oceanside 6 3.8 11 6.9
Pendleton <5 § <5 §
San Dieguito <5 § <5 §
Vista 5 5.0 <5 §
North Inland Region 5 0.9 <5 §
Anza‐Borrego Springs <5 § <5 §
Escondido <5 § <5 §
Fallbrook <5 § <5 §
North San Diego <5 § <5 §
Palomar‐Julian <5 § <5 §
Pauma <5 § <5 §
Poway <5 § <5 §
Ramona <5 § <5 §
San Marcos <5 § <5 §
Valley Center <5 § <5 §
South Region 6 1.3 <5 §
Chula Vista <5 § <5 §
Coronado <5 § <5 §
National City <5 § <5 §
South Bay <5 § <5 §
Sweetwater <5 § <5 §Unknown <5 ‐‐‐ <5 ‐‐‐*Rates per 100,000 population. County age‐adjusted rates per 100,000 2000 US standard population.**Harbison Crest/El Cajon is an aggregation of the Harbison Crest and El Cajon SRAs. Due to geographic limitations, the Harbison Crest SRA is not shown alone. See the Data Guide for more information.†Demen a‐related Emergency Department Discharge refers to (principal diagnosis) ICD‐9 code 290.§Rates not calculated for fewer than 5 events. Rates not calculated in cases where zip code is unknown.Source: Emergency Department Discharge Database (CA OSHPD), County of San Diego, Health & Human Services Agency, Public Health Services, Emergency Medical Services; SANDAG, Current Population Estimates, 10/2012.Prepared by: County of San Diego, Health & Human Services Agency, Public Health Services, Community Health Statistics Unit, 2013.
Demen a‐related† Emergency Department Discharges Among San Diego County Residents by Loca on of Residence
Geography2010 Total 2011 Total 2012 Total 2013 Total 2014 Total 2015 Total 2016 Total 2017 Total 2018 Total 2019 Total 2020 Total
County of San Diego, Health & Human Services Agency, Public Health Services, Community Health Statisitcs Unit Page 57

No. Rate* No. Rate* No. Rate* No. Rate* No. Rate* No. Rate* No. Rate* No. Rate* No. Rate* No. Rate* No. Rate* No. Rate* No. Rate*
San Diego County (Actual Rate) 35 1.1 13 0.8 22 1.4 30 2.0 <5 § <5 § <5 § <5 § <5 § <5 § <5 § <5 § 35 10.0
San Diego County (Age‐Adjusted Rate) 35 1.1
Central Region <5 § <5 § <5 § <5 § <5 § <5 § <5 § <5 § <5 § <5 § <5 § <5 § <5 §
Central San Diego <5 § <5 § <5 § <5 § <5 § <5 § <5 § <5 § <5 § <5 § <5 § <5 § <5 §
Mid‐City <5 § <5 § <5 § <5 § <5 § <5 § <5 § <5 § <5 § <5 § <5 § <5 § <5 §
Southeast San Diego <5 § <5 § <5 § <5 § <5 § <5 § <5 § <5 § <5 § <5 § <5 § <5 § <5 §
East Region <5 § <5 § <5 § <5 § <5 § <5 § <5 § <5 § <5 § <5 § <5 § <5 § <5 §
Alpine <5 § <5 § <5 § <5 § <5 § <5 § <5 § <5 § <5 § <5 § <5 § <5 § <5 §
El Cajon <5 § <5 § <5 § <5 § <5 § <5 § <5 § <5 § <5 § <5 § <5 § <5 § <5 §
Harbison Crest/El Cajon** <5 § <5 § <5 § <5 § <5 § <5 § <5 § <5 § <5 § <5 § <5 § <5 § <5 §
Jamul <5 § <5 § <5 § <5 § <5 § <5 § <5 § <5 § <5 § <5 § <5 § <5 § <5 §
La Mesa <5 § <5 § <5 § <5 § <5 § <5 § <5 § <5 § <5 § <5 § <5 § <5 § <5 §
Laguna‐Pine Valley <5 § <5 § <5 § <5 § <5 § <5 § <5 § <5 § <5 § <5 § <5 § <5 § <5 §
Lakeside <5 § <5 § <5 § <5 § <5 § <5 § <5 § <5 § <5 § <5 § <5 § <5 § <5 §
Lemon Grove <5 § <5 § <5 § <5 § <5 § <5 § <5 § <5 § <5 § <5 § <5 § <5 § <5 §
Mountain Empire <5 § <5 § <5 § <5 § <5 § <5 § <5 § <5 § <5 § <5 § <5 § <5 § <5 §
Santee <5 § <5 § <5 § <5 § <5 § <5 § <5 § <5 § <5 § <5 § <5 § <5 § <5 §
Spring Valley <5 § <5 § <5 § <5 § <5 § <5 § <5 § <5 § <5 § <5 § <5 § <5 § <5 §
North Central Region <5 § <5 § <5 § <5 § <5 § <5 § <5 § <5 § <5 § <5 § <5 § <5 § <5 §
Coastal <5 § <5 § <5 § <5 § <5 § <5 § <5 § <5 § <5 § <5 § <5 § <5 § <5 §
Del Mar‐Mira Mesa <5 § <5 § <5 § <5 § <5 § <5 § <5 § <5 § <5 § <5 § <5 § <5 § <5 §
Elliott‐Navajo <5 § <5 § <5 § <5 § <5 § <5 § <5 § <5 § <5 § <5 § <5 § <5 § <5 §
Kearny Mesa <5 § <5 § <5 § <5 § <5 § <5 § <5 § <5 § <5 § <5 § <5 § <5 § <5 §
Miramar <5 § <5 § <5 § <5 § <5 § <5 § <5 § <5 § <5 § <5 § <5 § <5 § <5 §
Peninsula <5 § <5 § <5 § <5 § <5 § <5 § <5 § <5 § <5 § <5 § <5 § <5 § <5 §
University <5 § <5 § <5 § <5 § <5 § <5 § <5 § <5 § <5 § <5 § <5 § <5 § <5 §
North Coastal Region 17 3.4 6 2.3 11 4.4 16 5.3 <5 § <5 § <5 § <5 § <5 § <5 § <5 § <5 § 17 28.5
Carlsbad <5 § <5 § <5 § <5 § <5 § <5 § <5 § <5 § <5 § <5 § <5 § <5 § <5 §
Oceanside 6 3.8 <5 § 5 6.2 5 6.7 <5 § <5 § <5 § <5 § <5 § <5 § <5 § <5 § 6 32.5
Pendleton <5 § <5 § <5 § <5 § <5 § <5 § <5 § <5 § <5 § <5 § <5 § <5 § <5 §
San Dieguito <5 § <5 § <5 § <5 § <5 § <5 § <5 § <5 § <5 § <5 § <5 § <5 § <5 §
Vista 5 5.0 <5 § <5 § 5 11.4 <5 § <5 § <5 § <5 § <5 § <5 § <5 § <5 § 5 49.5
North Inland Region 5 0.9 <5 § <5 § <5 § <5 § <5 § <5 § <5 § <5 § <5 § <5 § <5 § 5 6.9
Anza‐Borrego Springs <5 § <5 § <5 § <5 § <5 § <5 § <5 § <5 § <5 § <5 § <5 § <5 § <5 §
Escondido <5 § <5 § <5 § <5 § <5 § <5 § <5 § <5 § <5 § <5 § <5 § <5 § <5 §
Fallbrook <5 § <5 § <5 § <5 § <5 § <5 § <5 § <5 § <5 § <5 § <5 § <5 § <5 §
North San Diego <5 § <5 § <5 § <5 § <5 § <5 § <5 § <5 § <5 § <5 § <5 § <5 § <5 §
Palomar‐Julian <5 § <5 § <5 § <5 § <5 § <5 § <5 § <5 § <5 § <5 § <5 § <5 § <5 §
Pauma <5 § <5 § <5 § <5 § <5 § <5 § <5 § <5 § <5 § <5 § <5 § <5 § <5 §
Poway <5 § <5 § <5 § <5 § <5 § <5 § <5 § <5 § <5 § <5 § <5 § <5 § <5 §
Ramona <5 § <5 § <5 § <5 § <5 § <5 § <5 § <5 § <5 § <5 § <5 § <5 § <5 §
San Marcos <5 § <5 § <5 § <5 § <5 § <5 § <5 § <5 § <5 § <5 § <5 § <5 § <5 §
Valley Center <5 § <5 § <5 § <5 § <5 § <5 § <5 § <5 § <5 § <5 § <5 § <5 § <5 §
South Region 6 1.3 <5 § <5 § 5 5.1 <5 § <5 § <5 § <5 § <5 § <5 § <5 § <5 § 6 12.4
Chula Vista <5 § <5 § <5 § <5 § <5 § <5 § <5 § <5 § <5 § <5 § <5 § <5 § <5 §
Coronado <5 § <5 § <5 § <5 § <5 § <5 § <5 § <5 § <5 § <5 § <5 § <5 § <5 §
National City <5 § <5 § <5 § <5 § <5 § <5 § <5 § <5 § <5 § <5 § <5 § <5 § <5 §
South Bay <5 § <5 § <5 § <5 § <5 § <5 § <5 § <5 § <5 § <5 § <5 § <5 § <5 §
Sweetwater <5 § <5 § <5 § <5 § <5 § <5 § <5 § <5 § <5 § <5 § <5 § <5 § <5 §Unknown <5 ‐‐‐ <5 ‐‐‐ <5 ‐‐‐ <5 ‐‐‐ <5 ‐‐‐ <5 ‐‐‐ <5 ‐‐‐ <5 ‐‐‐ <5 ‐‐‐ <5 ‐‐‐ <5 ‐‐‐ <5 ‐‐‐ <5 ‐‐‐*Rates per 100,000 population. County age‐adjusted rates per 100,000 2000 US standard population.**Harbison Crest/El Cajon is an aggregation of the Harbison Crest and El Cajon SRAs. Due to geographic limitations, the Harbison Crest SRA is not shown alone. See the Data Guide for more information.
***Numbers may not add up to totals due to unknown or missing details.
†Demen a‐related Emergency Department Discharge refers to (principal diagnosis) ICD‐9 code 290.
‡API includes Asian, Pacific Islander, Na ve Hawaiian. Other includes 2 or more races, Na ve American/Alaska Na ve, American Indian, or other.
§Rates not calculated for fewer than 5 events. Rates not calculated in cases where zip code is unknown.
Source: Emergency Department Discharge Database (CA OSHPD), County of San Diego, Health & Human Services Agency, Public Health Services, Emergency Medical Services; SANDAG, Current Population Estimates, 10/2012.
Prepared by: County of San Diego, Health & Human Services Agency, Public Health Services, Community Health Statistics Unit, 2013.
Black Other‡ Ages 0‐14 Ages 15‐24 Ages 25‐44API‡
Demen a‐related† Emergency Department Discharges Among San Diego County Residents by Loca on of Residence, 2010 Detail
Geography2010 Total
Gender Race/Ethnicity Age Group
Male Ages 65+Female White Ages 45‐64Hispanic
County of San Diego, Health & Human Services Agency, Public Health Services, Community Health Statisitcs Unit Page 58

No. Rate* No. Rate* No. Rate* No. Rate* No. Rate* No. Rate* No. Rate* No. Rate* No. Rate* No. Rate* No. Rate* No. Rate* No. Rate*
San Diego County (Actual Rate) 32 1.0 14 0.9 18 1.2 29 1.9 <5 § <5 § <5 § <5 § <5 § <5 § <5 § <5 § 31 8.6
San Diego County (Age‐Adjusted Rate) 32 0.9
Central Region <5 § <5 § <5 § <5 § <5 § <5 § <5 § <5 § <5 § <5 § <5 § <5 § <5 §
Central San Diego <5 § <5 § <5 § <5 § <5 § <5 § <5 § <5 § <5 § <5 § <5 § <5 § <5 §
Mid‐City <5 § <5 § <5 § <5 § <5 § <5 § <5 § <5 § <5 § <5 § <5 § <5 § <5 §
Southeast San Diego <5 § <5 § <5 § <5 § <5 § <5 § <5 § <5 § <5 § <5 § <5 § <5 § <5 §
East Region <5 § <5 § <5 § <5 § <5 § <5 § <5 § <5 § <5 § <5 § <5 § <5 § <5 §
Alpine <5 § <5 § <5 § <5 § <5 § <5 § <5 § <5 § <5 § <5 § <5 § <5 § <5 §
El Cajon <5 § <5 § <5 § <5 § <5 § <5 § <5 § <5 § <5 § <5 § <5 § <5 § <5 §
Harbison Crest/El Cajon** <5 § <5 § <5 § <5 § <5 § <5 § <5 § <5 § <5 § <5 § <5 § <5 § <5 §
Jamul <5 § <5 § <5 § <5 § <5 § <5 § <5 § <5 § <5 § <5 § <5 § <5 § <5 §
La Mesa <5 § <5 § <5 § <5 § <5 § <5 § <5 § <5 § <5 § <5 § <5 § <5 § <5 §
Laguna‐Pine Valley <5 § <5 § <5 § <5 § <5 § <5 § <5 § <5 § <5 § <5 § <5 § <5 § <5 §
Lakeside <5 § <5 § <5 § <5 § <5 § <5 § <5 § <5 § <5 § <5 § <5 § <5 § <5 §
Lemon Grove <5 § <5 § <5 § <5 § <5 § <5 § <5 § <5 § <5 § <5 § <5 § <5 § <5 §
Mountain Empire <5 § <5 § <5 § <5 § <5 § <5 § <5 § <5 § <5 § <5 § <5 § <5 § <5 §
Santee <5 § <5 § <5 § <5 § <5 § <5 § <5 § <5 § <5 § <5 § <5 § <5 § <5 §
Spring Valley <5 § <5 § <5 § <5 § <5 § <5 § <5 § <5 § <5 § <5 § <5 § <5 § <5 §
North Central Region <5 § <5 § <5 § <5 § <5 § <5 § <5 § <5 § <5 § <5 § <5 § <5 § <5 §
Coastal <5 § <5 § <5 § <5 § <5 § <5 § <5 § <5 § <5 § <5 § <5 § <5 § <5 §
Del Mar‐Mira Mesa <5 § <5 § <5 § <5 § <5 § <5 § <5 § <5 § <5 § <5 § <5 § <5 § <5 §
Elliott‐Navajo <5 § <5 § <5 § <5 § <5 § <5 § <5 § <5 § <5 § <5 § <5 § <5 § <5 §
Kearny Mesa <5 § <5 § <5 § <5 § <5 § <5 § <5 § <5 § <5 § <5 § <5 § <5 § <5 §
Miramar <5 § <5 § <5 § <5 § <5 § <5 § <5 § <5 § <5 § <5 § <5 § <5 § <5 §
Peninsula <5 § <5 § <5 § <5 § <5 § <5 § <5 § <5 § <5 § <5 § <5 § <5 § <5 §
University <5 § <5 § <5 § <5 § <5 § <5 § <5 § <5 § <5 § <5 § <5 § <5 § <5 §
North Coastal Region 22 4.3 10 3.9 12 4.8 20 6.7 <5 § <5 § <5 § <5 § <5 § <5 § <5 § <5 § 21 34.1
Carlsbad 6 5.2 <5 § <5 § 6 7.1 <5 § <5 § <5 § <5 § <5 § <5 § <5 § <5 § 5 27.1
Oceanside 11 6.9 <5 § 7 8.7 10 13.6 <5 § <5 § <5 § <5 § <5 § <5 § <5 § <5 § 11 58.7
Pendleton <5 § <5 § <5 § <5 § <5 § <5 § <5 § <5 § <5 § <5 § <5 § <5 § <5 §
San Dieguito <5 § <5 § <5 § <5 § <5 § <5 § <5 § <5 § <5 § <5 § <5 § <5 § <5 §
Vista <5 § <5 § <5 § <5 § <5 § <5 § <5 § <5 § <5 § <5 § <5 § <5 § <5 §
North Inland Region <5 § <5 § <5 § <5 § <5 § <5 § <5 § <5 § <5 § <5 § <5 § <5 § <5 §
Anza‐Borrego Springs <5 § <5 § <5 § <5 § <5 § <5 § <5 § <5 § <5 § <5 § <5 § <5 § <5 §
Escondido <5 § <5 § <5 § <5 § <5 § <5 § <5 § <5 § <5 § <5 § <5 § <5 § <5 §
Fallbrook <5 § <5 § <5 § <5 § <5 § <5 § <5 § <5 § <5 § <5 § <5 § <5 § <5 §
North San Diego <5 § <5 § <5 § <5 § <5 § <5 § <5 § <5 § <5 § <5 § <5 § <5 § <5 §
Palomar‐Julian <5 § <5 § <5 § <5 § <5 § <5 § <5 § <5 § <5 § <5 § <5 § <5 § <5 §
Pauma <5 § <5 § <5 § <5 § <5 § <5 § <5 § <5 § <5 § <5 § <5 § <5 § <5 §
Poway <5 § <5 § <5 § <5 § <5 § <5 § <5 § <5 § <5 § <5 § <5 § <5 § <5 §
Ramona <5 § <5 § <5 § <5 § <5 § <5 § <5 § <5 § <5 § <5 § <5 § <5 § <5 §
San Marcos <5 § <5 § <5 § <5 § <5 § <5 § <5 § <5 § <5 § <5 § <5 § <5 § <5 §
Valley Center <5 § <5 § <5 § <5 § <5 § <5 § <5 § <5 § <5 § <5 § <5 § <5 § <5 §
South Region <5 § <5 § <5 § <5 § <5 § <5 § <5 § <5 § <5 § <5 § <5 § <5 § <5 §
Chula Vista <5 § <5 § <5 § <5 § <5 § <5 § <5 § <5 § <5 § <5 § <5 § <5 § <5 §
Coronado <5 § <5 § <5 § <5 § <5 § <5 § <5 § <5 § <5 § <5 § <5 § <5 § <5 §
National City <5 § <5 § <5 § <5 § <5 § <5 § <5 § <5 § <5 § <5 § <5 § <5 § <5 §
South Bay <5 § <5 § <5 § <5 § <5 § <5 § <5 § <5 § <5 § <5 § <5 § <5 § <5 §
Sweetwater <5 § <5 § <5 § <5 § <5 § <5 § <5 § <5 § <5 § <5 § <5 § <5 § <5 §Unknown <5 ‐‐‐ <5 ‐‐‐ <5 ‐‐‐ <5 ‐‐‐ <5 ‐‐‐ <5 ‐‐‐ <5 ‐‐‐ <5 ‐‐‐ <5 ‐‐‐ <5 ‐‐‐ <5 ‐‐‐ <5 ‐‐‐ <5 ‐‐‐*Rates per 100,000 population. County age‐adjusted rates per 100,000 2000 US standard population.**Harbison Crest/El Cajon is an aggregation of the Harbison Crest and El Cajon SRAs. Due to geographic limitations, the Harbison Crest SRA is not shown alone. See the Data Guide for more information.
***Numbers may not add up to totals due to unknown or missing details.
†Demen a‐related Emergency Department Discharge refers to (principal diagnosis) ICD‐9 code 290.
‡API includes Asian, Pacific Islander, Na ve Hawaiian. Other includes 2 or more races, Na ve American/Alaska Na ve, American Indian, or other.
§Rates not calculated for fewer than 5 events. Rates not calculated in cases where zip code is unknown.
Source: Emergency Department Discharge Database (CA OSHPD), County of San Diego, Health & Human Services Agency, Public Health Services, Emergency Medical Services; SANDAG, Current Population Estimates, 10/2012.
Prepared by: County of San Diego, Health & Human Services Agency, Public Health Services, Community Health Statistics Unit, 2013.
Ages 65+API‡ Other‡ Ages 0‐14Geography2011 Total
Gender
Demen a‐related† Emergency Department Discharges Among San Diego County Residents by Loca on of Residence, 2011 Detail
Race/Ethnicity Age Group
Male Female White Black Hispanic Ages 15‐24 Ages 25‐44 Ages 45‐64
County of San Diego, Health & Human Services Agency, Public Health Services, Community Health Statisitcs Unit Page 59

Developmental Disorders
County of San Diego, Health & Human Services Agency, Public Health Services, Community Health Statisitcs Unit Page 60

No. Rate* No. Rate* No. Rate* No. Rate* No. Rate* No. Rate* No. Rate* No. Rate* No. Rate* No. Rate* No. Rate*
San Diego County (Actual Rate) 35 1.1 33 1.1
San Diego County (Age‐Adjusted Rate) 35 1.2 33 1.1
Central Region 6 1.2 <5 §
Central San Diego <5 § <5 §
Mid‐City <5 § <5 §
Southeast San Diego <5 § <5 §
East Region 12 2.6 10 2.1
Alpine <5 § <5 §
El Cajon <5 § <5 §
Harbison Crest/El Cajon** 5 3.6 <5 §
Jamul <5 § <5 §
La Mesa <5 § <5 §
Laguna‐Pine Valley <5 § <5 §
Lakeside <5 § <5 §
Lemon Grove <5 § <5 §
Mountain Empire <5 § <5 §
Santee <5 § <5 §
Spring Valley <5 § <5 §
North Central Region <5 § <5 §
Coastal <5 § <5 §
Del Mar‐Mira Mesa <5 § <5 §
Elliott‐Navajo <5 § <5 §
Kearny Mesa <5 § <5 §
Miramar <5 § <5 §
Peninsula <5 § <5 §
University <5 § <5 §
North Coastal Region <5 § <5 §
Carlsbad <5 § <5 §
Oceanside <5 § <5 §
Pendleton <5 § <5 §
San Dieguito <5 § <5 §
Vista <5 § <5 §
North Inland Region 7 1.2 9 1.6
Anza‐Borrego Springs <5 § <5 §
Escondido <5 § <5 §
Fallbrook <5 § <5 §
North San Diego <5 § <5 §
Palomar‐Julian <5 § <5 §
Pauma <5 § <5 §
Poway <5 § <5 §
Ramona <5 § <5 §
San Marcos <5 § <5 §
Valley Center <5 § <5 §
South Region <5 § 5 1.1
Chula Vista <5 § <5 §
Coronado <5 § <5 §
National City <5 § <5 §
South Bay <5 § <5 §
Sweetwater <5 § <5 §Unknown <5 ‐‐‐ <5 ‐‐‐*Rates per 100,000 population. County age‐adjusted rates per 100,000 2000 US standard population.**Harbison Crest/El Cajon is an aggregation of the Harbison Crest and El Cajon SRAs. Due to geographic limitations, the Harbison Crest SRA is not shown alone. See the Data Guide for more information.†Developmental disorder‐related hospitaliza on refers to (principal diagnosis) ICD‐9 codes 307.0, 307.9, 315, 317‐319, V40.0‐V41.0.§Rates not calculated for fewer than 5 events. Rates not calculated in cases where zip code is unknown.Source: Patient Discharge Database (CA OSHPD), County of San Diego, Health & Human Services Agency, Public Health Services, Epidemiology & Immunization Services Branch; SANDAG, Current Population Estimates, 10/2012.Prepared by: County of San Diego, Health & Human Services Agency, Public Health Services, Community Health Statistics Unit, 2013.
Developmental Disorder‐related† Hospitaliza ons Among San Diego County Residents by Location of Residence
Geography2010 Total 2011 Total 2012 Total 2013 Total 2014 Total 2015 Total 2016 Total 2017 Total 2018 Total 2019 Total 2020 Total
County of San Diego, Health & Human Services Agency, Public Health Services, Community Health Statisitcs Unit Page 61

No. Rate* No. Rate* No. Rate* No. Rate* No. Rate* No. Rate* No. Rate* No. Rate* No. Rate* No. Rate* No. Rate* No. Rate* No. Rate*
San Diego County (Actual Rate) 35 1.1 13 0.8 22 1.4 27 1.8 <5 § <5 § <5 § <5 § <5 § <5 § <5 § <5 § 29 8.3
San Diego County (Age‐Adjusted Rate) 35 1.2
Central Region 6 1.2 <5 § <5 § <5 § <5 § <5 § <5 § <5 § <5 § <5 § <5 § <5 § <5 §
Central San Diego <5 § <5 § <5 § <5 § <5 § <5 § <5 § <5 § <5 § <5 § <5 § <5 § <5 §
Mid‐City <5 § <5 § <5 § <5 § <5 § <5 § <5 § <5 § <5 § <5 § <5 § <5 § <5 §
Southeast San Diego <5 § <5 § <5 § <5 § <5 § <5 § <5 § <5 § <5 § <5 § <5 § <5 § <5 §
East Region 12 2.6 <5 § 8 3.4 11 3.9 <5 § <5 § <5 § <5 § <5 § <5 § <5 § <5 § 11 19.7
Alpine <5 § <5 § <5 § <5 § <5 § <5 § <5 § <5 § <5 § <5 § <5 § <5 § <5 §
El Cajon <5 § <5 § <5 § <5 § <5 § <5 § <5 § <5 § <5 § <5 § <5 § <5 § <5 §
Harbison Crest/El Cajon** 5 3.6 <5 § <5 § <5 § <5 § <5 § <5 § <5 § <5 § <5 § <5 § <5 § <5 §
Jamul <5 § <5 § <5 § <5 § <5 § <5 § <5 § <5 § <5 § <5 § <5 § <5 § <5 §
La Mesa <5 § <5 § <5 § <5 § <5 § <5 § <5 § <5 § <5 § <5 § <5 § <5 § <5 §
Laguna‐Pine Valley <5 § <5 § <5 § <5 § <5 § <5 § <5 § <5 § <5 § <5 § <5 § <5 § <5 §
Lakeside <5 § <5 § <5 § <5 § <5 § <5 § <5 § <5 § <5 § <5 § <5 § <5 § <5 §
Lemon Grove <5 § <5 § <5 § <5 § <5 § <5 § <5 § <5 § <5 § <5 § <5 § <5 § <5 §
Mountain Empire <5 § <5 § <5 § <5 § <5 § <5 § <5 § <5 § <5 § <5 § <5 § <5 § <5 §
Santee <5 § <5 § <5 § <5 § <5 § <5 § <5 § <5 § <5 § <5 § <5 § <5 § <5 §
Spring Valley <5 § <5 § <5 § <5 § <5 § <5 § <5 § <5 § <5 § <5 § <5 § <5 § <5 §
North Central Region <5 § <5 § <5 § <5 § <5 § <5 § <5 § <5 § <5 § <5 § <5 § <5 § <5 §
Coastal <5 § <5 § <5 § <5 § <5 § <5 § <5 § <5 § <5 § <5 § <5 § <5 § <5 §
Del Mar‐Mira Mesa <5 § <5 § <5 § <5 § <5 § <5 § <5 § <5 § <5 § <5 § <5 § <5 § <5 §
Elliott‐Navajo <5 § <5 § <5 § <5 § <5 § <5 § <5 § <5 § <5 § <5 § <5 § <5 § <5 §
Kearny Mesa <5 § <5 § <5 § <5 § <5 § <5 § <5 § <5 § <5 § <5 § <5 § <5 § <5 §
Miramar <5 § <5 § <5 § <5 § <5 § <5 § <5 § <5 § <5 § <5 § <5 § <5 § <5 §
Peninsula <5 § <5 § <5 § <5 § <5 § <5 § <5 § <5 § <5 § <5 § <5 § <5 § <5 §
University <5 § <5 § <5 § <5 § <5 § <5 § <5 § <5 § <5 § <5 § <5 § <5 § <5 §
North Coastal Region <5 § <5 § <5 § <5 § <5 § <5 § <5 § <5 § <5 § <5 § <5 § <5 § <5 §
Carlsbad <5 § <5 § <5 § <5 § <5 § <5 § <5 § <5 § <5 § <5 § <5 § <5 § <5 §
Oceanside <5 § <5 § <5 § <5 § <5 § <5 § <5 § <5 § <5 § <5 § <5 § <5 § <5 §
Pendleton <5 § <5 § <5 § <5 § <5 § <5 § <5 § <5 § <5 § <5 § <5 § <5 § <5 §
San Dieguito <5 § <5 § <5 § <5 § <5 § <5 § <5 § <5 § <5 § <5 § <5 § <5 § <5 §
Vista <5 § <5 § <5 § <5 § <5 § <5 § <5 § <5 § <5 § <5 § <5 § <5 § <5 §
North Inland Region 7 1.2 <5 § <5 § 6 1.9 <5 § <5 § <5 § <5 § <5 § <5 § <5 § <5 § 5 6.9
Anza‐Borrego Springs <5 § <5 § <5 § <5 § <5 § <5 § <5 § <5 § <5 § <5 § <5 § <5 § <5 §
Escondido <5 § <5 § <5 § <5 § <5 § <5 § <5 § <5 § <5 § <5 § <5 § <5 § <5 §
Fallbrook <5 § <5 § <5 § <5 § <5 § <5 § <5 § <5 § <5 § <5 § <5 § <5 § <5 §
North San Diego <5 § <5 § <5 § <5 § <5 § <5 § <5 § <5 § <5 § <5 § <5 § <5 § <5 §
Palomar‐Julian <5 § <5 § <5 § <5 § <5 § <5 § <5 § <5 § <5 § <5 § <5 § <5 § <5 §
Pauma <5 § <5 § <5 § <5 § <5 § <5 § <5 § <5 § <5 § <5 § <5 § <5 § <5 §
Poway <5 § <5 § <5 § <5 § <5 § <5 § <5 § <5 § <5 § <5 § <5 § <5 § <5 §
Ramona <5 § <5 § <5 § <5 § <5 § <5 § <5 § <5 § <5 § <5 § <5 § <5 § <5 §
San Marcos <5 § <5 § <5 § <5 § <5 § <5 § <5 § <5 § <5 § <5 § <5 § <5 § <5 §
Valley Center <5 § <5 § <5 § <5 § <5 § <5 § <5 § <5 § <5 § <5 § <5 § <5 § <5 §
South Region <5 § <5 § <5 § <5 § <5 § <5 § <5 § <5 § <5 § <5 § <5 § <5 § <5 §
Chula Vista <5 § <5 § <5 § <5 § <5 § <5 § <5 § <5 § <5 § <5 § <5 § <5 § <5 §
Coronado <5 § <5 § <5 § <5 § <5 § <5 § <5 § <5 § <5 § <5 § <5 § <5 § <5 §
National City <5 § <5 § <5 § <5 § <5 § <5 § <5 § <5 § <5 § <5 § <5 § <5 § <5 §
South Bay <5 § <5 § <5 § <5 § <5 § <5 § <5 § <5 § <5 § <5 § <5 § <5 § <5 §
Sweetwater <5 § <5 § <5 § <5 § <5 § <5 § <5 § <5 § <5 § <5 § <5 § <5 § <5 §Unknown <5 ‐‐‐ <5 ‐‐‐ <5 ‐‐‐ <5 ‐‐‐ <5 ‐‐‐ <5 ‐‐‐ <5 ‐‐‐ <5 ‐‐‐ <5 ‐‐‐ <5 ‐‐‐ <5 ‐‐‐ <5 ‐‐‐ <5 ‐‐‐*Rates per 100,000 population. County age‐adjusted rates per 100,000 2000 US standard population.**Harbison Crest/El Cajon is an aggregation of the Harbison Crest and El Cajon SRAs. Due to geographic limitations, the Harbison Crest SRA is not shown alone. See the Data Guide for more information.
***Numbers may not add up to totals due to unknown or missing details.
†Developmental disorder‐related hospitaliza on refers to (principal diagnosis) ICD‐9 codes 307.0, 307.9, 315, 317‐319, V40.0‐V41.0.
‡API includes Asian, Pacific Islander, Na ve Hawaiian. Other includes 2 or more races, Na ve American/Alaska Na ve, American Indian, or other.
§Rates not calculated for fewer than 5 events. Rates not calculated in cases where zip code is unknown.
Source: Patient Discharge Database (CA OSHPD), County of San Diego, Health & Human Services Agency, Public Health Services, Epidemiology & Immunization Services Branch; SANDAG, Current Population Estimates, 10/2012.
Prepared by: County of San Diego, Health & Human Services Agency, Public Health Services, Community Health Statistics Unit, 2013.
Developmental Disorder‐related† Hospitaliza ons Among San Diego County Residents by Loca on of Residence, 2010 Detail
Geography2010 Total
Gender Race/Ethnicity Age Group
Male Ages 65+Female White Ages 45‐64HispanicBlack Other‡ Ages 0‐14 Ages 15‐24 Ages 25‐44API‡
County of San Diego, Health & Human Services Agency, Public Health Services, Community Health Statisitcs Unit Page 62

No. Rate* No. Rate* No. Rate* No. Rate* No. Rate* No. Rate* No. Rate* No. Rate* No. Rate* No. Rate* No. Rate* No. Rate* No. Rate*
San Diego County (Actual Rate) 33 1.1 20 1.3 13 0.8 22 1.5 <5 § 8 0.8 <5 § <5 § <5 § <5 § <5 § <5 § 22 6.1
San Diego County (Age‐Adjusted Rate) 33 1.1
Central Region <5 § <5 § <5 § <5 § <5 § <5 § <5 § <5 § <5 § <5 § <5 § <5 § <5 §
Central San Diego <5 § <5 § <5 § <5 § <5 § <5 § <5 § <5 § <5 § <5 § <5 § <5 § <5 §
Mid‐City <5 § <5 § <5 § <5 § <5 § <5 § <5 § <5 § <5 § <5 § <5 § <5 § <5 §
Southeast San Diego <5 § <5 § <5 § <5 § <5 § <5 § <5 § <5 § <5 § <5 § <5 § <5 § <5 §
East Region 10 2.1 5 2.2 5 2.1 8 2.9 <5 § <5 § <5 § <5 § <5 § <5 § <5 § <5 § 7 12.0
Alpine <5 § <5 § <5 § <5 § <5 § <5 § <5 § <5 § <5 § <5 § <5 § <5 § <5 §
El Cajon <5 § <5 § <5 § <5 § <5 § <5 § <5 § <5 § <5 § <5 § <5 § <5 § <5 §
Harbison Crest/El Cajon** <5 § <5 § <5 § <5 § <5 § <5 § <5 § <5 § <5 § <5 § <5 § <5 § <5 §
Jamul <5 § <5 § <5 § <5 § <5 § <5 § <5 § <5 § <5 § <5 § <5 § <5 § <5 §
La Mesa <5 § <5 § <5 § <5 § <5 § <5 § <5 § <5 § <5 § <5 § <5 § <5 § <5 §
Laguna‐Pine Valley <5 § <5 § <5 § <5 § <5 § <5 § <5 § <5 § <5 § <5 § <5 § <5 § <5 §
Lakeside <5 § <5 § <5 § <5 § <5 § <5 § <5 § <5 § <5 § <5 § <5 § <5 § <5 §
Lemon Grove <5 § <5 § <5 § <5 § <5 § <5 § <5 § <5 § <5 § <5 § <5 § <5 § <5 §
Mountain Empire <5 § <5 § <5 § <5 § <5 § <5 § <5 § <5 § <5 § <5 § <5 § <5 § <5 §
Santee <5 § <5 § <5 § <5 § <5 § <5 § <5 § <5 § <5 § <5 § <5 § <5 § <5 §
Spring Valley <5 § <5 § <5 § <5 § <5 § <5 § <5 § <5 § <5 § <5 § <5 § <5 § <5 §
North Central Region <5 § <5 § <5 § <5 § <5 § <5 § <5 § <5 § <5 § <5 § <5 § <5 § <5 §
Coastal <5 § <5 § <5 § <5 § <5 § <5 § <5 § <5 § <5 § <5 § <5 § <5 § <5 §
Del Mar‐Mira Mesa <5 § <5 § <5 § <5 § <5 § <5 § <5 § <5 § <5 § <5 § <5 § <5 § <5 §
Elliott‐Navajo <5 § <5 § <5 § <5 § <5 § <5 § <5 § <5 § <5 § <5 § <5 § <5 § <5 §
Kearny Mesa <5 § <5 § <5 § <5 § <5 § <5 § <5 § <5 § <5 § <5 § <5 § <5 § <5 §
Miramar <5 § <5 § <5 § <5 § <5 § <5 § <5 § <5 § <5 § <5 § <5 § <5 § <5 §
Peninsula <5 § <5 § <5 § <5 § <5 § <5 § <5 § <5 § <5 § <5 § <5 § <5 § <5 §
University <5 § <5 § <5 § <5 § <5 § <5 § <5 § <5 § <5 § <5 § <5 § <5 § <5 §
North Coastal Region <5 § <5 § <5 § <5 § <5 § <5 § <5 § <5 § <5 § <5 § <5 § <5 § <5 §
Carlsbad <5 § <5 § <5 § <5 § <5 § <5 § <5 § <5 § <5 § <5 § <5 § <5 § <5 §
Oceanside <5 § <5 § <5 § <5 § <5 § <5 § <5 § <5 § <5 § <5 § <5 § <5 § <5 §
Pendleton <5 § <5 § <5 § <5 § <5 § <5 § <5 § <5 § <5 § <5 § <5 § <5 § <5 §
San Dieguito <5 § <5 § <5 § <5 § <5 § <5 § <5 § <5 § <5 § <5 § <5 § <5 § <5 §
Vista <5 § <5 § <5 § <5 § <5 § <5 § <5 § <5 § <5 § <5 § <5 § <5 § <5 §
North Inland Region 9 1.6 6 2.1 <5 § 7 2.2 <5 § <5 § <5 § <5 § <5 § <5 § <5 § <5 § <5 §
Anza‐Borrego Springs <5 § <5 § <5 § <5 § <5 § <5 § <5 § <5 § <5 § <5 § <5 § <5 § <5 §
Escondido <5 § <5 § <5 § <5 § <5 § <5 § <5 § <5 § <5 § <5 § <5 § <5 § <5 §
Fallbrook <5 § <5 § <5 § <5 § <5 § <5 § <5 § <5 § <5 § <5 § <5 § <5 § <5 §
North San Diego <5 § <5 § <5 § <5 § <5 § <5 § <5 § <5 § <5 § <5 § <5 § <5 § <5 §
Palomar‐Julian <5 § <5 § <5 § <5 § <5 § <5 § <5 § <5 § <5 § <5 § <5 § <5 § <5 §
Pauma <5 § <5 § <5 § <5 § <5 § <5 § <5 § <5 § <5 § <5 § <5 § <5 § <5 §
Poway <5 § <5 § <5 § <5 § <5 § <5 § <5 § <5 § <5 § <5 § <5 § <5 § <5 §
Ramona <5 § <5 § <5 § <5 § <5 § <5 § <5 § <5 § <5 § <5 § <5 § <5 § <5 §
San Marcos <5 § <5 § <5 § <5 § <5 § <5 § <5 § <5 § <5 § <5 § <5 § <5 § <5 §
Valley Center <5 § <5 § <5 § <5 § <5 § <5 § <5 § <5 § <5 § <5 § <5 § <5 § <5 §
South Region 5 1.1 <5 § <5 § <5 § <5 § <5 § <5 § <5 § <5 § <5 § <5 § <5 § <5 §
Chula Vista <5 § <5 § <5 § <5 § <5 § <5 § <5 § <5 § <5 § <5 § <5 § <5 § <5 §
Coronado <5 § <5 § <5 § <5 § <5 § <5 § <5 § <5 § <5 § <5 § <5 § <5 § <5 §
National City <5 § <5 § <5 § <5 § <5 § <5 § <5 § <5 § <5 § <5 § <5 § <5 § <5 §
South Bay <5 § <5 § <5 § <5 § <5 § <5 § <5 § <5 § <5 § <5 § <5 § <5 § <5 §
Sweetwater <5 § <5 § <5 § <5 § <5 § <5 § <5 § <5 § <5 § <5 § <5 § <5 § <5 §Unknown <5 ‐‐‐ <5 ‐‐‐ <5 ‐‐‐ <5 ‐‐‐ <5 ‐‐‐ <5 ‐‐‐ <5 ‐‐‐ <5 ‐‐‐ <5 ‐‐‐ <5 ‐‐‐ <5 ‐‐‐ <5 ‐‐‐ <5 ‐‐‐*Rates per 100,000 population. County age‐adjusted rates per 100,000 2000 US standard population.**Harbison Crest/El Cajon is an aggregation of the Harbison Crest and El Cajon SRAs. Due to geographic limitations, the Harbison Crest SRA is not shown alone. See the Data Guide for more information.
***Numbers may not add up to totals due to unknown or missing details.
†Developmental disorder‐related hospitaliza on refers to (principal diagnosis) ICD‐9 codes 307.0, 307.9, 315, 317‐319, V40.0‐V41.0.
‡API includes Asian, Pacific Islander, Na ve Hawaiian. Other includes 2 or more races, Na ve American/Alaska Na ve, American Indian, or other.
§Rates not calculated for fewer than 5 events. Rates not calculated in cases where zip code is unknown.
Source: Patient Discharge Database (CA OSHPD), County of San Diego, Health & Human Services Agency, Public Health Services, Epidemiology & Immunization Services Branch; SANDAG, Current Population Estimates, 10/2012.
Prepared by: County of San Diego, Health & Human Services Agency, Public Health Services, Community Health Statistics Unit, 2013.
Ages 65+API‡ Other‡ Ages 0‐14Geography2011 Total
Gender
Developmental Disorder‐related† Hospitaliza ons Among San Diego County Residents by Loca on of Residence, 2011 Detail
Race/Ethnicity Age Group
Ages 15‐24 Ages 25‐44 Ages 45‐64Male Female White Black Hispanic
County of San Diego, Health & Human Services Agency, Public Health Services, Community Health Statisitcs Unit Page 63

No. Rate* No. Rate* No. Rate* No. Rate* No. Rate* No. Rate* No. Rate* No. Rate* No. Rate* No. Rate* No. Rate*
San Diego County (Actual Rate) 433 14.0 533 17.1
San Diego County (Age‐Adjusted Rate) 433 13.9 533 16.9
Central Region 64 13.2 94 19.4
Central San Diego 23 13.9 30 18.1
Mid‐City 27 16.6 46 28.2
Southeast San Diego 14 9.0 18 11.5
East Region 133 28.7 178 38.1
Alpine <5 § <5 §
El Cajon 41 32.9 46 36.7
Harbison Crest/El Cajon** 61 43.8 79 56.4
Jamul <5 § 6 34.1
La Mesa 18 30.5 30 50.0
Laguna‐Pine Valley <5 § <5 §
Lakeside 6 10.7 16 28.4
Lemon Grove 14 47.0 16 53.4
Mountain Empire <5 § 5 58.8
Santee 8 15.6 11 21.3
Spring Valley 19 23.5 14 17.1
North Central Region 46 7.6 54 8.9
Coastal 6 8.0 <5 §
Del Mar‐Mira Mesa 7 4.4 9 5.7
Elliott‐Navajo 9 10.1 12 13.4
Kearny Mesa 16 10.6 20 13.2
Miramar <5 § <5 §
Peninsula <5 § <5 §
University 6 9.6 7 10.5
North Coastal Region 39 7.7 49 9.6
Carlsbad <5 § 7 6.0
Oceanside 15 9.4 24 15.0
Pendleton <5 § <5 §
San Dieguito 10 10.7 7 7.4
Vista 11 11.0 11 10.9
North Inland Region 94 16.5 96 16.7
Anza‐Borrego Springs <5 § <5 §
Escondido 45 27.6 47 28.6
Fallbrook 5 10.6 5 10.4
North San Diego 15 14.1 16 14.9
Palomar‐Julian <5 § <5 §
Pauma <5 § <5 §
Poway 6 7.0 8 9.2
Ramona 6 17.2 <5 §
San Marcos 11 12.2 14 15.5
Valley Center <5 § <5 §
South Region 47 10.0 52 11.1
Chula Vista 20 17.4 28 24.2
Coronado <5 § <5 §
National City 13 22.3 <5 §
South Bay 6 4.4 12 8.9
Sweetwater 7 5.2 5 3.7Unknown 10 ‐‐‐ 10 ‐‐‐*Rates per 100,000 population. County age‐adjusted rates per 100,000 2000 US standard population.**Harbison Crest/El Cajon is an aggregation of the Harbison Crest and El Cajon SRAs. Due to geographic limitations, the Harbison Crest SRA is not shown alone. See the Data Guide for more information.†Developmental disorder‐related Emergency Department Discharge refers to (principal diagnosis) ICD‐9 codes 307.0, 307.9, 315, 317‐319, V40.0‐V41.0.§Rates not calculated for fewer than 5 events. Rates not calculated in cases where zip code is unknown.Source: Emergency Department Discharge Database (CA OSHPD), County of San Diego, Health & Human Services Agency, Public Health Services, Emergency Medical Services; SANDAG, Current Population Estimates, 10/2012.Prepared by: County of San Diego, Health & Human Services Agency, Public Health Services, Community Health Statistics Unit, 2013.
Developmental Disorder‐related† Emergency Department Discharges Among San Diego County Residents by Loca on of Residence
Geography2010 Total 2011 Total 2012 Total 2013 Total 2014 Total 2015 Total 2016 Total 2017 Total 2018 Total 2019 Total 2020 Total
County of San Diego, Health & Human Services Agency, Public Health Services, Community Health Statisitcs Unit Page 64
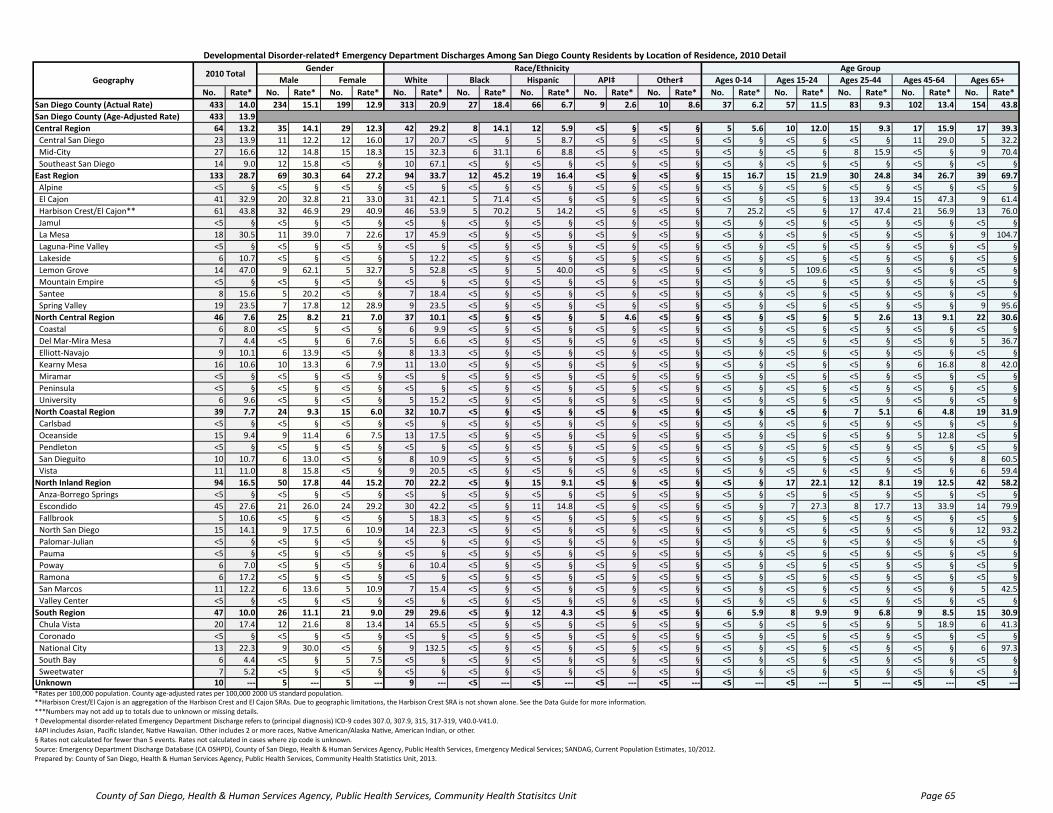
No. Rate* No. Rate* No. Rate* No. Rate* No. Rate* No. Rate* No. Rate* No. Rate* No. Rate* No. Rate* No. Rate* No. Rate* No. Rate*
San Diego County (Actual Rate) 433 14.0 234 15.1 199 12.9 313 20.9 27 18.4 66 6.7 9 2.6 10 8.6 37 6.2 57 11.5 83 9.3 102 13.4 154 43.8
San Diego County (Age‐Adjusted Rate) 433 13.9
Central Region 64 13.2 35 14.1 29 12.3 42 29.2 8 14.1 12 5.9 <5 § <5 § 5 5.6 10 12.0 15 9.3 17 15.9 17 39.3
Central San Diego 23 13.9 11 12.2 12 16.0 17 20.7 <5 § 5 8.7 <5 § <5 § <5 § <5 § <5 § 11 29.0 5 32.2
Mid‐City 27 16.6 12 14.8 15 18.3 15 32.3 6 31.1 6 8.8 <5 § <5 § <5 § <5 § 8 15.9 <5 § 9 70.4
Southeast San Diego 14 9.0 12 15.8 <5 § 10 67.1 <5 § <5 § <5 § <5 § <5 § <5 § <5 § <5 § <5 §
East Region 133 28.7 69 30.3 64 27.2 94 33.7 12 45.2 19 16.4 <5 § <5 § 15 16.7 15 21.9 30 24.8 34 26.7 39 69.7
Alpine <5 § <5 § <5 § <5 § <5 § <5 § <5 § <5 § <5 § <5 § <5 § <5 § <5 §
El Cajon 41 32.9 20 32.8 21 33.0 31 42.1 5 71.4 <5 § <5 § <5 § <5 § <5 § 13 39.4 15 47.3 9 61.4
Harbison Crest/El Cajon** 61 43.8 32 46.9 29 40.9 46 53.9 5 70.2 5 14.2 <5 § <5 § 7 25.2 <5 § 17 47.4 21 56.9 13 76.0
Jamul <5 § <5 § <5 § <5 § <5 § <5 § <5 § <5 § <5 § <5 § <5 § <5 § <5 §
La Mesa 18 30.5 11 39.0 7 22.6 17 45.9 <5 § <5 § <5 § <5 § <5 § <5 § <5 § <5 § 9 104.7
Laguna‐Pine Valley <5 § <5 § <5 § <5 § <5 § <5 § <5 § <5 § <5 § <5 § <5 § <5 § <5 §
Lakeside 6 10.7 <5 § <5 § 5 12.2 <5 § <5 § <5 § <5 § <5 § <5 § <5 § <5 § <5 §
Lemon Grove 14 47.0 9 62.1 5 32.7 5 52.8 <5 § 5 40.0 <5 § <5 § <5 § 5 109.6 <5 § <5 § <5 §
Mountain Empire <5 § <5 § <5 § <5 § <5 § <5 § <5 § <5 § <5 § <5 § <5 § <5 § <5 §
Santee 8 15.6 5 20.2 <5 § 7 18.4 <5 § <5 § <5 § <5 § <5 § <5 § <5 § <5 § <5 §
Spring Valley 19 23.5 7 17.8 12 28.9 9 23.5 <5 § <5 § <5 § <5 § <5 § <5 § <5 § <5 § 9 95.6
North Central Region 46 7.6 25 8.2 21 7.0 37 10.1 <5 § <5 § 5 4.6 <5 § <5 § <5 § 5 2.6 13 9.1 22 30.6
Coastal 6 8.0 <5 § <5 § 6 9.9 <5 § <5 § <5 § <5 § <5 § <5 § <5 § <5 § <5 §
Del Mar‐Mira Mesa 7 4.4 <5 § 6 7.6 5 6.6 <5 § <5 § <5 § <5 § <5 § <5 § <5 § <5 § 5 36.7
Elliott‐Navajo 9 10.1 6 13.9 <5 § 8 13.3 <5 § <5 § <5 § <5 § <5 § <5 § <5 § <5 § <5 §
Kearny Mesa 16 10.6 10 13.3 6 7.9 11 13.0 <5 § <5 § <5 § <5 § <5 § <5 § <5 § 6 16.8 8 42.0
Miramar <5 § <5 § <5 § <5 § <5 § <5 § <5 § <5 § <5 § <5 § <5 § <5 § <5 §
Peninsula <5 § <5 § <5 § <5 § <5 § <5 § <5 § <5 § <5 § <5 § <5 § <5 § <5 §
University 6 9.6 <5 § <5 § 5 15.2 <5 § <5 § <5 § <5 § <5 § <5 § <5 § <5 § <5 §
North Coastal Region 39 7.7 24 9.3 15 6.0 32 10.7 <5 § <5 § <5 § <5 § <5 § <5 § 7 5.1 6 4.8 19 31.9
Carlsbad <5 § <5 § <5 § <5 § <5 § <5 § <5 § <5 § <5 § <5 § <5 § <5 § <5 §
Oceanside 15 9.4 9 11.4 6 7.5 13 17.5 <5 § <5 § <5 § <5 § <5 § <5 § <5 § 5 12.8 <5 §
Pendleton <5 § <5 § <5 § <5 § <5 § <5 § <5 § <5 § <5 § <5 § <5 § <5 § <5 §
San Dieguito 10 10.7 6 13.0 <5 § 8 10.9 <5 § <5 § <5 § <5 § <5 § <5 § <5 § <5 § 8 60.5
Vista 11 11.0 8 15.8 <5 § 9 20.5 <5 § <5 § <5 § <5 § <5 § <5 § <5 § <5 § 6 59.4
North Inland Region 94 16.5 50 17.8 44 15.2 70 22.2 <5 § 15 9.1 <5 § <5 § <5 § 17 22.1 12 8.1 19 12.5 42 58.2
Anza‐Borrego Springs <5 § <5 § <5 § <5 § <5 § <5 § <5 § <5 § <5 § <5 § <5 § <5 § <5 §
Escondido 45 27.6 21 26.0 24 29.2 30 42.2 <5 § 11 14.8 <5 § <5 § <5 § 7 27.3 8 17.7 13 33.9 14 79.9
Fallbrook 5 10.6 <5 § <5 § 5 18.3 <5 § <5 § <5 § <5 § <5 § <5 § <5 § <5 § <5 §
North San Diego 15 14.1 9 17.5 6 10.9 14 22.3 <5 § <5 § <5 § <5 § <5 § <5 § <5 § <5 § 12 93.2
Palomar‐Julian <5 § <5 § <5 § <5 § <5 § <5 § <5 § <5 § <5 § <5 § <5 § <5 § <5 §
Pauma <5 § <5 § <5 § <5 § <5 § <5 § <5 § <5 § <5 § <5 § <5 § <5 § <5 §
Poway 6 7.0 <5 § <5 § 6 10.4 <5 § <5 § <5 § <5 § <5 § <5 § <5 § <5 § <5 §
Ramona 6 17.2 <5 § <5 § <5 § <5 § <5 § <5 § <5 § <5 § <5 § <5 § <5 § <5 §
San Marcos 11 12.2 6 13.6 5 10.9 7 15.4 <5 § <5 § <5 § <5 § <5 § <5 § <5 § <5 § 5 42.5
Valley Center <5 § <5 § <5 § <5 § <5 § <5 § <5 § <5 § <5 § <5 § <5 § <5 § <5 §
South Region 47 10.0 26 11.1 21 9.0 29 29.6 <5 § 12 4.3 <5 § <5 § 6 5.9 8 9.9 9 6.8 9 8.5 15 30.9
Chula Vista 20 17.4 12 21.6 8 13.4 14 65.5 <5 § <5 § <5 § <5 § <5 § <5 § <5 § 5 18.9 6 41.3
Coronado <5 § <5 § <5 § <5 § <5 § <5 § <5 § <5 § <5 § <5 § <5 § <5 § <5 §
National City 13 22.3 9 30.0 <5 § 9 132.5 <5 § <5 § <5 § <5 § <5 § <5 § <5 § <5 § 6 97.3
South Bay 6 4.4 <5 § 5 7.5 <5 § <5 § <5 § <5 § <5 § <5 § <5 § <5 § <5 § <5 §
Sweetwater 7 5.2 <5 § <5 § <5 § <5 § <5 § <5 § <5 § <5 § <5 § <5 § <5 § <5 §Unknown 10 ‐‐‐ 5 ‐‐‐ 5 ‐‐‐ 9 ‐‐‐ <5 ‐‐‐ <5 ‐‐‐ <5 ‐‐‐ <5 ‐‐‐ <5 ‐‐‐ <5 ‐‐‐ 5 ‐‐‐ <5 ‐‐‐ <5 ‐‐‐*Rates per 100,000 population. County age‐adjusted rates per 100,000 2000 US standard population.**Harbison Crest/El Cajon is an aggregation of the Harbison Crest and El Cajon SRAs. Due to geographic limitations, the Harbison Crest SRA is not shown alone. See the Data Guide for more information.
***Numbers may not add up to totals due to unknown or missing details.
† Developmental disorder‐related Emergency Department Discharge refers to (principal diagnosis) ICD‐9 codes 307.0, 307.9, 315, 317‐319, V40.0‐V41.0.
‡API includes Asian, Pacific Islander, Na ve Hawaiian. Other includes 2 or more races, Na ve American/Alaska Na ve, American Indian, or other.
§ Rates not calculated for fewer than 5 events. Rates not calculated in cases where zip code is unknown.
Source: Emergency Department Discharge Database (CA OSHPD), County of San Diego, Health & Human Services Agency, Public Health Services, Emergency Medical Services; SANDAG, Current Population Estimates, 10/2012.
Prepared by: County of San Diego, Health & Human Services Agency, Public Health Services, Community Health Statistics Unit, 2013.
Ages 45‐64Hispanic
Developmental Disorder‐related† Emergency Department Discharges Among San Diego County Residents by Loca on of Residence, 2010 Detail
Geography2010 Total
Gender Race/Ethnicity Age Group
Male Ages 65+Female White Black Other‡ Ages 0‐14 Ages 15‐24 Ages 25‐44API‡
County of San Diego, Health & Human Services Agency, Public Health Services, Community Health Statisitcs Unit Page 65
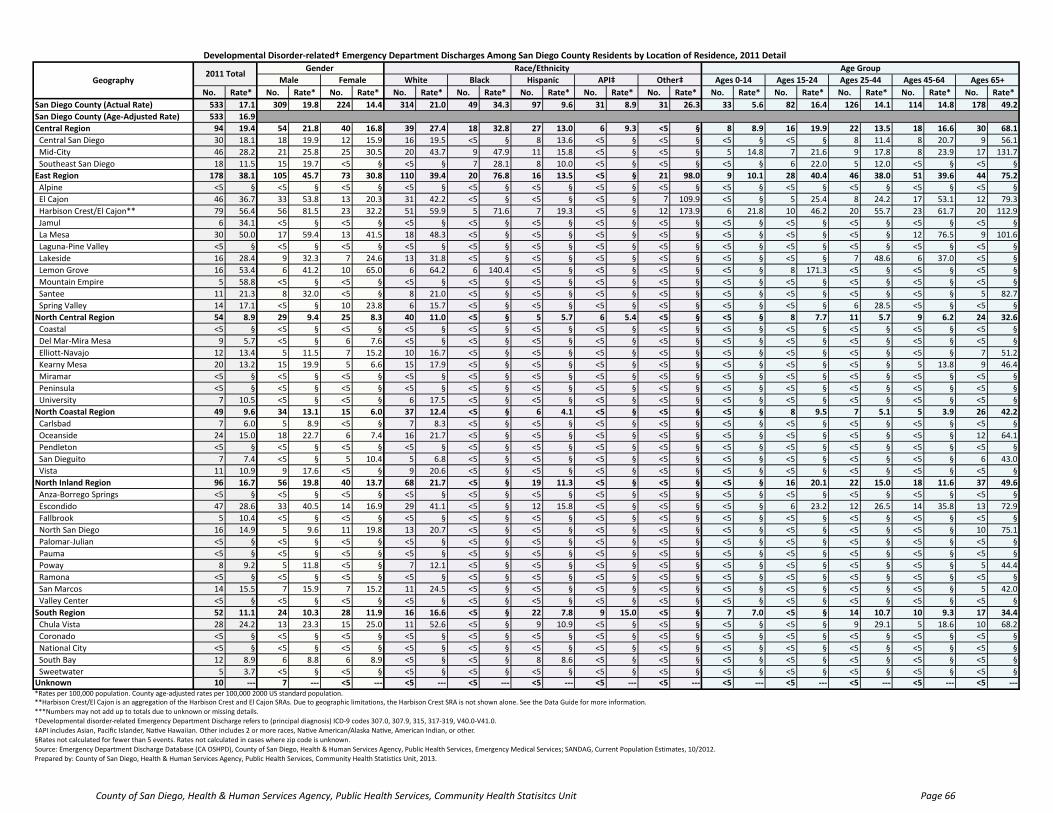
No. Rate* No. Rate* No. Rate* No. Rate* No. Rate* No. Rate* No. Rate* No. Rate* No. Rate* No. Rate* No. Rate* No. Rate* No. Rate*
San Diego County (Actual Rate) 533 17.1 309 19.8 224 14.4 314 21.0 49 34.3 97 9.6 31 8.9 31 26.3 33 5.6 82 16.4 126 14.1 114 14.8 178 49.2
San Diego County (Age‐Adjusted Rate) 533 16.9
Central Region 94 19.4 54 21.8 40 16.8 39 27.4 18 32.8 27 13.0 6 9.3 <5 § 8 8.9 16 19.9 22 13.5 18 16.6 30 68.1
Central San Diego 30 18.1 18 19.9 12 15.9 16 19.5 <5 § 8 13.6 <5 § <5 § <5 § <5 § 8 11.4 8 20.7 9 56.1
Mid‐City 46 28.2 21 25.8 25 30.5 20 43.7 9 47.9 11 15.8 <5 § <5 § 5 14.8 7 21.6 9 17.8 8 23.9 17 131.7
Southeast San Diego 18 11.5 15 19.7 <5 § <5 § 7 28.1 8 10.0 <5 § <5 § <5 § 6 22.0 5 12.0 <5 § <5 §
East Region 178 38.1 105 45.7 73 30.8 110 39.4 20 76.8 16 13.5 <5 § 21 98.0 9 10.1 28 40.4 46 38.0 51 39.6 44 75.2
Alpine <5 § <5 § <5 § <5 § <5 § <5 § <5 § <5 § <5 § <5 § <5 § <5 § <5 §
El Cajon 46 36.7 33 53.8 13 20.3 31 42.2 <5 § <5 § <5 § 7 109.9 <5 § 5 25.4 8 24.2 17 53.1 12 79.3
Harbison Crest/El Cajon** 79 56.4 56 81.5 23 32.2 51 59.9 5 71.6 7 19.3 <5 § 12 173.9 6 21.8 10 46.2 20 55.7 23 61.7 20 112.9
Jamul 6 34.1 <5 § <5 § <5 § <5 § <5 § <5 § <5 § <5 § <5 § <5 § <5 § <5 §
La Mesa 30 50.0 17 59.4 13 41.5 18 48.3 <5 § <5 § <5 § <5 § <5 § <5 § <5 § 12 76.5 9 101.6
Laguna‐Pine Valley <5 § <5 § <5 § <5 § <5 § <5 § <5 § <5 § <5 § <5 § <5 § <5 § <5 §
Lakeside 16 28.4 9 32.3 7 24.6 13 31.8 <5 § <5 § <5 § <5 § <5 § <5 § 7 48.6 6 37.0 <5 §
Lemon Grove 16 53.4 6 41.2 10 65.0 6 64.2 6 140.4 <5 § <5 § <5 § <5 § 8 171.3 <5 § <5 § <5 §
Mountain Empire 5 58.8 <5 § <5 § <5 § <5 § <5 § <5 § <5 § <5 § <5 § <5 § <5 § <5 §
Santee 11 21.3 8 32.0 <5 § 8 21.0 <5 § <5 § <5 § <5 § <5 § <5 § <5 § <5 § 5 82.7
Spring Valley 14 17.1 <5 § 10 23.8 6 15.7 <5 § <5 § <5 § <5 § <5 § <5 § 6 28.5 <5 § <5 §
North Central Region 54 8.9 29 9.4 25 8.3 40 11.0 <5 § 5 5.7 6 5.4 <5 § <5 § 8 7.7 11 5.7 9 6.2 24 32.6
Coastal <5 § <5 § <5 § <5 § <5 § <5 § <5 § <5 § <5 § <5 § <5 § <5 § <5 §
Del Mar‐Mira Mesa 9 5.7 <5 § 6 7.6 <5 § <5 § <5 § <5 § <5 § <5 § <5 § <5 § <5 § <5 §
Elliott‐Navajo 12 13.4 5 11.5 7 15.2 10 16.7 <5 § <5 § <5 § <5 § <5 § <5 § <5 § <5 § 7 51.2
Kearny Mesa 20 13.2 15 19.9 5 6.6 15 17.9 <5 § <5 § <5 § <5 § <5 § <5 § <5 § 5 13.8 9 46.4
Miramar <5 § <5 § <5 § <5 § <5 § <5 § <5 § <5 § <5 § <5 § <5 § <5 § <5 §
Peninsula <5 § <5 § <5 § <5 § <5 § <5 § <5 § <5 § <5 § <5 § <5 § <5 § <5 §
University 7 10.5 <5 § <5 § 6 17.5 <5 § <5 § <5 § <5 § <5 § <5 § <5 § <5 § <5 §
North Coastal Region 49 9.6 34 13.1 15 6.0 37 12.4 <5 § 6 4.1 <5 § <5 § <5 § 8 9.5 7 5.1 5 3.9 26 42.2
Carlsbad 7 6.0 5 8.9 <5 § 7 8.3 <5 § <5 § <5 § <5 § <5 § <5 § <5 § <5 § <5 §
Oceanside 24 15.0 18 22.7 6 7.4 16 21.7 <5 § <5 § <5 § <5 § <5 § <5 § <5 § <5 § 12 64.1
Pendleton <5 § <5 § <5 § <5 § <5 § <5 § <5 § <5 § <5 § <5 § <5 § <5 § <5 §
San Dieguito 7 7.4 <5 § 5 10.4 5 6.8 <5 § <5 § <5 § <5 § <5 § <5 § <5 § <5 § 6 43.0
Vista 11 10.9 9 17.6 <5 § 9 20.6 <5 § <5 § <5 § <5 § <5 § <5 § <5 § <5 § <5 §
North Inland Region 96 16.7 56 19.8 40 13.7 68 21.7 <5 § 19 11.3 <5 § <5 § <5 § 16 20.1 22 15.0 18 11.6 37 49.6
Anza‐Borrego Springs <5 § <5 § <5 § <5 § <5 § <5 § <5 § <5 § <5 § <5 § <5 § <5 § <5 §
Escondido 47 28.6 33 40.5 14 16.9 29 41.1 <5 § 12 15.8 <5 § <5 § <5 § 6 23.2 12 26.5 14 35.8 13 72.9
Fallbrook 5 10.4 <5 § <5 § <5 § <5 § <5 § <5 § <5 § <5 § <5 § <5 § <5 § <5 §
North San Diego 16 14.9 5 9.6 11 19.8 13 20.7 <5 § <5 § <5 § <5 § <5 § <5 § <5 § <5 § 10 75.1
Palomar‐Julian <5 § <5 § <5 § <5 § <5 § <5 § <5 § <5 § <5 § <5 § <5 § <5 § <5 §
Pauma <5 § <5 § <5 § <5 § <5 § <5 § <5 § <5 § <5 § <5 § <5 § <5 § <5 §
Poway 8 9.2 5 11.8 <5 § 7 12.1 <5 § <5 § <5 § <5 § <5 § <5 § <5 § <5 § 5 44.4
Ramona <5 § <5 § <5 § <5 § <5 § <5 § <5 § <5 § <5 § <5 § <5 § <5 § <5 §
San Marcos 14 15.5 7 15.9 7 15.2 11 24.5 <5 § <5 § <5 § <5 § <5 § <5 § <5 § <5 § 5 42.0
Valley Center <5 § <5 § <5 § <5 § <5 § <5 § <5 § <5 § <5 § <5 § <5 § <5 § <5 §
South Region 52 11.1 24 10.3 28 11.9 16 16.6 <5 § 22 7.8 9 15.0 <5 § 7 7.0 <5 § 14 10.7 10 9.3 17 34.4
Chula Vista 28 24.2 13 23.3 15 25.0 11 52.6 <5 § 9 10.9 <5 § <5 § <5 § <5 § 9 29.1 5 18.6 10 68.2
Coronado <5 § <5 § <5 § <5 § <5 § <5 § <5 § <5 § <5 § <5 § <5 § <5 § <5 §
National City <5 § <5 § <5 § <5 § <5 § <5 § <5 § <5 § <5 § <5 § <5 § <5 § <5 §
South Bay 12 8.9 6 8.8 6 8.9 <5 § <5 § 8 8.6 <5 § <5 § <5 § <5 § <5 § <5 § <5 §
Sweetwater 5 3.7 <5 § <5 § <5 § <5 § <5 § <5 § <5 § <5 § <5 § <5 § <5 § <5 §Unknown 10 ‐‐‐ 7 ‐‐‐ <5 ‐‐‐ <5 ‐‐‐ <5 ‐‐‐ <5 ‐‐‐ <5 ‐‐‐ <5 ‐‐‐ <5 ‐‐‐ <5 ‐‐‐ <5 ‐‐‐ <5 ‐‐‐ <5 ‐‐‐*Rates per 100,000 population. County age‐adjusted rates per 100,000 2000 US standard population.**Harbison Crest/El Cajon is an aggregation of the Harbison Crest and El Cajon SRAs. Due to geographic limitations, the Harbison Crest SRA is not shown alone. See the Data Guide for more information.
***Numbers may not add up to totals due to unknown or missing details.
†Developmental disorder‐related Emergency Department Discharge refers to (principal diagnosis) ICD‐9 codes 307.0, 307.9, 315, 317‐319, V40.0‐V41.0.
‡API includes Asian, Pacific Islander, Na ve Hawaiian. Other includes 2 or more races, Na ve American/Alaska Na ve, American Indian, or other.
§Rates not calculated for fewer than 5 events. Rates not calculated in cases where zip code is unknown.
Source: Emergency Department Discharge Database (CA OSHPD), County of San Diego, Health & Human Services Agency, Public Health Services, Emergency Medical Services; SANDAG, Current Population Estimates, 10/2012.
Prepared by: County of San Diego, Health & Human Services Agency, Public Health Services, Community Health Statistics Unit, 2013.
Ages 15‐24 Ages 25‐44 Ages 45‐64Male Female White Black Hispanic
Gender
Developmental Disorder‐related† Emergency Department Discharges Among San Diego County Residents by Loca on of Residence, 2011 Detail
Race/Ethnicity Age Group
Ages 65+API‡ Other‡ Ages 0‐14Geography2011 Total
County of San Diego, Health & Human Services Agency, Public Health Services, Community Health Statisitcs Unit Page 66

Disorders Usually Diagnosed in Infancy, Childhood, or Adolescence
County of San Diego, Health & Human Services Agency, Public Health Services, Community Health Statisitcs Unit Page 67
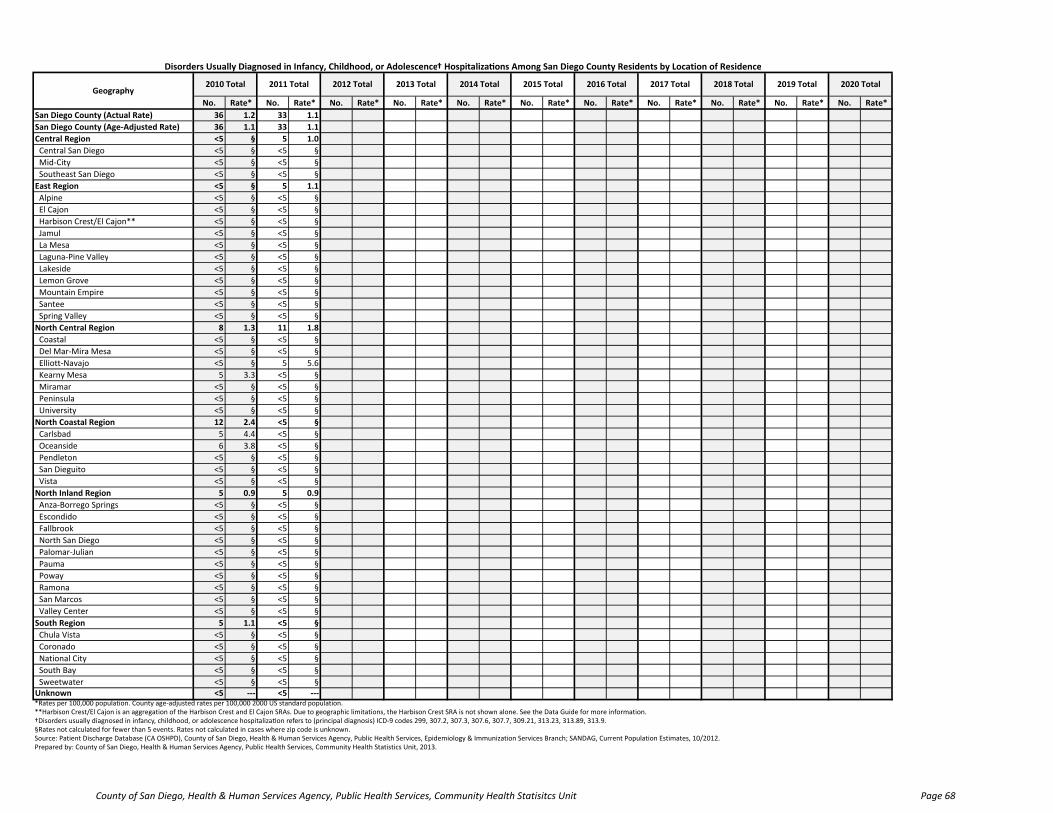
No. Rate* No. Rate* No. Rate* No. Rate* No. Rate* No. Rate* No. Rate* No. Rate* No. Rate* No. Rate* No. Rate*
San Diego County (Actual Rate) 36 1.2 33 1.1
San Diego County (Age‐Adjusted Rate) 36 1.1 33 1.1
Central Region <5 § 5 1.0
Central San Diego <5 § <5 §
Mid‐City <5 § <5 §
Southeast San Diego <5 § <5 §
East Region <5 § 5 1.1
Alpine <5 § <5 §
El Cajon <5 § <5 §
Harbison Crest/El Cajon** <5 § <5 §
Jamul <5 § <5 §
La Mesa <5 § <5 §
Laguna‐Pine Valley <5 § <5 §
Lakeside <5 § <5 §
Lemon Grove <5 § <5 §
Mountain Empire <5 § <5 §
Santee <5 § <5 §
Spring Valley <5 § <5 §
North Central Region 8 1.3 11 1.8
Coastal <5 § <5 §
Del Mar‐Mira Mesa <5 § <5 §
Elliott‐Navajo <5 § 5 5.6
Kearny Mesa 5 3.3 <5 §
Miramar <5 § <5 §
Peninsula <5 § <5 §
University <5 § <5 §
North Coastal Region 12 2.4 <5 §
Carlsbad 5 4.4 <5 §
Oceanside 6 3.8 <5 §
Pendleton <5 § <5 §
San Dieguito <5 § <5 §
Vista <5 § <5 §
North Inland Region 5 0.9 5 0.9
Anza‐Borrego Springs <5 § <5 §
Escondido <5 § <5 §
Fallbrook <5 § <5 §
North San Diego <5 § <5 §
Palomar‐Julian <5 § <5 §
Pauma <5 § <5 §
Poway <5 § <5 §
Ramona <5 § <5 §
San Marcos <5 § <5 §
Valley Center <5 § <5 §
South Region 5 1.1 <5 §
Chula Vista <5 § <5 §
Coronado <5 § <5 §
National City <5 § <5 §
South Bay <5 § <5 §
Sweetwater <5 § <5 §Unknown <5 ‐‐‐ <5 ‐‐‐*Rates per 100,000 population. County age‐adjusted rates per 100,000 2000 US standard population.**Harbison Crest/El Cajon is an aggregation of the Harbison Crest and El Cajon SRAs. Due to geographic limitations, the Harbison Crest SRA is not shown alone. See the Data Guide for more information.†Disorders usually diagnosed in infancy, childhood, or adolescence hospitaliza on refers to (principal diagnosis) ICD‐9 codes 299, 307.2, 307.3, 307.6, 307.7, 309.21, 313.23, 313.89, 313.9.§Rates not calculated for fewer than 5 events. Rates not calculated in cases where zip code is unknown.Source: Patient Discharge Database (CA OSHPD), County of San Diego, Health & Human Services Agency, Public Health Services, Epidemiology & Immunization Services Branch; SANDAG, Current Population Estimates, 10/2012.Prepared by: County of San Diego, Health & Human Services Agency, Public Health Services, Community Health Statistics Unit, 2013.
Disorders Usually Diagnosed in Infancy, Childhood, or Adolescence† Hospitaliza ons Among San Diego County Residents by Location of Residence
Geography2010 Total 2011 Total 2012 Total 2013 Total 2014 Total 2015 Total 2016 Total 2017 Total 2018 Total 2019 Total 2020 Total
County of San Diego, Health & Human Services Agency, Public Health Services, Community Health Statisitcs Unit Page 68

No. Rate* No. Rate* No. Rate* No. Rate* No. Rate* No. Rate* No. Rate* No. Rate* No. Rate* No. Rate* No. Rate* No. Rate* No. Rate*
San Diego County (Actual Rate) 36 1.2 30 1.9 6 0.4 26 1.7 <5 § 6 0.6 <5 § <5 § 15 2.5 19 3.8 <5 § <5 § <5 §
San Diego County (Age‐Adjusted Rate) 36 1.1
Central Region <5 § <5 § <5 § <5 § <5 § <5 § <5 § <5 § <5 § <5 § <5 § <5 § <5 §
Central San Diego <5 § <5 § <5 § <5 § <5 § <5 § <5 § <5 § <5 § <5 § <5 § <5 § <5 §
Mid‐City <5 § <5 § <5 § <5 § <5 § <5 § <5 § <5 § <5 § <5 § <5 § <5 § <5 §
Southeast San Diego <5 § <5 § <5 § <5 § <5 § <5 § <5 § <5 § <5 § <5 § <5 § <5 § <5 §
East Region <5 § <5 § <5 § <5 § <5 § <5 § <5 § <5 § <5 § <5 § <5 § <5 § <5 §
Alpine <5 § <5 § <5 § <5 § <5 § <5 § <5 § <5 § <5 § <5 § <5 § <5 § <5 §
El Cajon <5 § <5 § <5 § <5 § <5 § <5 § <5 § <5 § <5 § <5 § <5 § <5 § <5 §
Harbison Crest/El Cajon** <5 § <5 § <5 § <5 § <5 § <5 § <5 § <5 § <5 § <5 § <5 § <5 § <5 §
Jamul <5 § <5 § <5 § <5 § <5 § <5 § <5 § <5 § <5 § <5 § <5 § <5 § <5 §
La Mesa <5 § <5 § <5 § <5 § <5 § <5 § <5 § <5 § <5 § <5 § <5 § <5 § <5 §
Laguna‐Pine Valley <5 § <5 § <5 § <5 § <5 § <5 § <5 § <5 § <5 § <5 § <5 § <5 § <5 §
Lakeside <5 § <5 § <5 § <5 § <5 § <5 § <5 § <5 § <5 § <5 § <5 § <5 § <5 §
Lemon Grove <5 § <5 § <5 § <5 § <5 § <5 § <5 § <5 § <5 § <5 § <5 § <5 § <5 §
Mountain Empire <5 § <5 § <5 § <5 § <5 § <5 § <5 § <5 § <5 § <5 § <5 § <5 § <5 §
Santee <5 § <5 § <5 § <5 § <5 § <5 § <5 § <5 § <5 § <5 § <5 § <5 § <5 §
Spring Valley <5 § <5 § <5 § <5 § <5 § <5 § <5 § <5 § <5 § <5 § <5 § <5 § <5 §
North Central Region 8 1.3 7 2.3 <5 § <5 § <5 § <5 § <5 § <5 § 6 6.3 <5 § <5 § <5 § <5 §
Coastal <5 § <5 § <5 § <5 § <5 § <5 § <5 § <5 § <5 § <5 § <5 § <5 § <5 §
Del Mar‐Mira Mesa <5 § <5 § <5 § <5 § <5 § <5 § <5 § <5 § <5 § <5 § <5 § <5 § <5 §
Elliott‐Navajo <5 § <5 § <5 § <5 § <5 § <5 § <5 § <5 § <5 § <5 § <5 § <5 § <5 §
Kearny Mesa 5 3.3 5 6.6 <5 § <5 § <5 § <5 § <5 § <5 § <5 § <5 § <5 § <5 § <5 §
Miramar <5 § <5 § <5 § <5 § <5 § <5 § <5 § <5 § <5 § <5 § <5 § <5 § <5 §
Peninsula <5 § <5 § <5 § <5 § <5 § <5 § <5 § <5 § <5 § <5 § <5 § <5 § <5 §
University <5 § <5 § <5 § <5 § <5 § <5 § <5 § <5 § <5 § <5 § <5 § <5 § <5 §
North Coastal Region 12 2.4 12 4.7 <5 § 12 4.0 <5 § <5 § <5 § <5 § <5 § 10 11.9 <5 § <5 § <5 §
Carlsbad 5 4.4 5 9.0 <5 § 5 5.9 <5 § <5 § <5 § <5 § <5 § <5 § <5 § <5 § <5 §
Oceanside 6 3.8 6 7.6 <5 § 6 8.1 <5 § <5 § <5 § <5 § <5 § 6 23.7 <5 § <5 § <5 §
Pendleton <5 § <5 § <5 § <5 § <5 § <5 § <5 § <5 § <5 § <5 § <5 § <5 § <5 §
San Dieguito <5 § <5 § <5 § <5 § <5 § <5 § <5 § <5 § <5 § <5 § <5 § <5 § <5 §
Vista <5 § <5 § <5 § <5 § <5 § <5 § <5 § <5 § <5 § <5 § <5 § <5 § <5 §
North Inland Region 5 0.9 <5 § <5 § <5 § <5 § <5 § <5 § <5 § <5 § <5 § <5 § <5 § <5 §
Anza‐Borrego Springs <5 § <5 § <5 § <5 § <5 § <5 § <5 § <5 § <5 § <5 § <5 § <5 § <5 §
Escondido <5 § <5 § <5 § <5 § <5 § <5 § <5 § <5 § <5 § <5 § <5 § <5 § <5 §
Fallbrook <5 § <5 § <5 § <5 § <5 § <5 § <5 § <5 § <5 § <5 § <5 § <5 § <5 §
North San Diego <5 § <5 § <5 § <5 § <5 § <5 § <5 § <5 § <5 § <5 § <5 § <5 § <5 §
Palomar‐Julian <5 § <5 § <5 § <5 § <5 § <5 § <5 § <5 § <5 § <5 § <5 § <5 § <5 §
Pauma <5 § <5 § <5 § <5 § <5 § <5 § <5 § <5 § <5 § <5 § <5 § <5 § <5 §
Poway <5 § <5 § <5 § <5 § <5 § <5 § <5 § <5 § <5 § <5 § <5 § <5 § <5 §
Ramona <5 § <5 § <5 § <5 § <5 § <5 § <5 § <5 § <5 § <5 § <5 § <5 § <5 §
San Marcos <5 § <5 § <5 § <5 § <5 § <5 § <5 § <5 § <5 § <5 § <5 § <5 § <5 §
Valley Center <5 § <5 § <5 § <5 § <5 § <5 § <5 § <5 § <5 § <5 § <5 § <5 § <5 §
South Region 5 1.1 <5 § <5 § <5 § <5 § <5 § <5 § <5 § <5 § <5 § <5 § <5 § <5 §
Chula Vista <5 § <5 § <5 § <5 § <5 § <5 § <5 § <5 § <5 § <5 § <5 § <5 § <5 §
Coronado <5 § <5 § <5 § <5 § <5 § <5 § <5 § <5 § <5 § <5 § <5 § <5 § <5 §
National City <5 § <5 § <5 § <5 § <5 § <5 § <5 § <5 § <5 § <5 § <5 § <5 § <5 §
South Bay <5 § <5 § <5 § <5 § <5 § <5 § <5 § <5 § <5 § <5 § <5 § <5 § <5 §
Sweetwater <5 § <5 § <5 § <5 § <5 § <5 § <5 § <5 § <5 § <5 § <5 § <5 § <5 §Unknown <5 ‐‐‐ <5 ‐‐‐ <5 ‐‐‐ <5 ‐‐‐ <5 ‐‐‐ <5 ‐‐‐ <5 ‐‐‐ <5 ‐‐‐ <5 ‐‐‐ <5 ‐‐‐ <5 ‐‐‐ <5 ‐‐‐ <5 ‐‐‐*Rates per 100,000 population. County age‐adjusted rates per 100,000 2000 US standard population.**Harbison Crest/El Cajon is an aggregation of the Harbison Crest and El Cajon SRAs. Due to geographic limitations, the Harbison Crest SRA is not shown alone. See the Data Guide for more information.
***Numbers may not add up to totals due to unknown or missing details.
†Disorders usually diagnosed in infancy, childhood, or adolescence hospitaliza on refers to (principal diagnosis) ICD‐9 codes 299, 307.2, 307.3, 307.6, 307.7, 309.21, 313.23, 313.89, 313.9.
‡API includes Asian, Pacific Islander, Na ve Hawaiian. Other includes 2 or more races, Na ve American/Alaska Na ve, American Indian, or other.
§Rates not calculated for fewer than 5 events. Rates not calculated in cases where zip code is unknown.
Source: Patient Discharge Database (CA OSHPD), County of San Diego, Health & Human Services Agency, Public Health Services, Epidemiology & Immunization Services Branch; SANDAG, Current Population Estimates, 10/2012.
Prepared by: County of San Diego, Health & Human Services Agency, Public Health Services, Community Health Statistics Unit, 2013.
Disorders Usually Diagnosed in Infancy, Childhood, or Adolescence† Hospitaliza ons Among San Diego County Residents by Loca on of Residence, 2010 Detail
Geography2010 Total
Gender Race/Ethnicity Age Group
Male Ages 65+Female White Ages 45‐64HispanicBlack Other‡ Ages 0‐14 Ages 15‐24 Ages 25‐44API‡
County of San Diego, Health & Human Services Agency, Public Health Services, Community Health Statisitcs Unit Page 69

No. Rate* No. Rate* No. Rate* No. Rate* No. Rate* No. Rate* No. Rate* No. Rate* No. Rate* No. Rate* No. Rate* No. Rate* No. Rate*
San Diego County (Actual Rate) 33 1.1 21 1.3 12 0.8 18 1.2 5 3.5 6 0.6 <5 § <5 § 20 3.4 9 1.8 <5 § <5 § <5 §
San Diego County (Age‐Adjusted Rate) 33 1.1
Central Region 5 1.0 <5 § <5 § <5 § <5 § <5 § <5 § <5 § <5 § <5 § <5 § <5 § <5 §
Central San Diego <5 § <5 § <5 § <5 § <5 § <5 § <5 § <5 § <5 § <5 § <5 § <5 § <5 §
Mid‐City <5 § <5 § <5 § <5 § <5 § <5 § <5 § <5 § <5 § <5 § <5 § <5 § <5 §
Southeast San Diego <5 § <5 § <5 § <5 § <5 § <5 § <5 § <5 § <5 § <5 § <5 § <5 § <5 §
East Region 5 1.1 <5 § <5 § <5 § <5 § <5 § <5 § <5 § <5 § <5 § <5 § <5 § <5 §
Alpine <5 § <5 § <5 § <5 § <5 § <5 § <5 § <5 § <5 § <5 § <5 § <5 § <5 §
El Cajon <5 § <5 § <5 § <5 § <5 § <5 § <5 § <5 § <5 § <5 § <5 § <5 § <5 §
Harbison Crest/El Cajon** <5 § <5 § <5 § <5 § <5 § <5 § <5 § <5 § <5 § <5 § <5 § <5 § <5 §
Jamul <5 § <5 § <5 § <5 § <5 § <5 § <5 § <5 § <5 § <5 § <5 § <5 § <5 §
La Mesa <5 § <5 § <5 § <5 § <5 § <5 § <5 § <5 § <5 § <5 § <5 § <5 § <5 §
Laguna‐Pine Valley <5 § <5 § <5 § <5 § <5 § <5 § <5 § <5 § <5 § <5 § <5 § <5 § <5 §
Lakeside <5 § <5 § <5 § <5 § <5 § <5 § <5 § <5 § <5 § <5 § <5 § <5 § <5 §
Lemon Grove <5 § <5 § <5 § <5 § <5 § <5 § <5 § <5 § <5 § <5 § <5 § <5 § <5 §
Mountain Empire <5 § <5 § <5 § <5 § <5 § <5 § <5 § <5 § <5 § <5 § <5 § <5 § <5 §
Santee <5 § <5 § <5 § <5 § <5 § <5 § <5 § <5 § <5 § <5 § <5 § <5 § <5 §
Spring Valley <5 § <5 § <5 § <5 § <5 § <5 § <5 § <5 § <5 § <5 § <5 § <5 § <5 §
North Central Region 11 1.8 7 2.3 <5 § 7 1.9 <5 § <5 § <5 § <5 § 5 5.3 5 4.8 <5 § <5 § <5 §
Coastal <5 § <5 § <5 § <5 § <5 § <5 § <5 § <5 § <5 § <5 § <5 § <5 § <5 §
Del Mar‐Mira Mesa <5 § <5 § <5 § <5 § <5 § <5 § <5 § <5 § <5 § <5 § <5 § <5 § <5 §
Elliott‐Navajo 5 5.6 <5 § <5 § <5 § <5 § <5 § <5 § <5 § <5 § <5 § <5 § <5 § <5 §
Kearny Mesa <5 § <5 § <5 § <5 § <5 § <5 § <5 § <5 § <5 § <5 § <5 § <5 § <5 §
Miramar <5 § <5 § <5 § <5 § <5 § <5 § <5 § <5 § <5 § <5 § <5 § <5 § <5 §
Peninsula <5 § <5 § <5 § <5 § <5 § <5 § <5 § <5 § <5 § <5 § <5 § <5 § <5 §
University <5 § <5 § <5 § <5 § <5 § <5 § <5 § <5 § <5 § <5 § <5 § <5 § <5 §
North Coastal Region <5 § <5 § <5 § <5 § <5 § <5 § <5 § <5 § <5 § <5 § <5 § <5 § <5 §
Carlsbad <5 § <5 § <5 § <5 § <5 § <5 § <5 § <5 § <5 § <5 § <5 § <5 § <5 §
Oceanside <5 § <5 § <5 § <5 § <5 § <5 § <5 § <5 § <5 § <5 § <5 § <5 § <5 §
Pendleton <5 § <5 § <5 § <5 § <5 § <5 § <5 § <5 § <5 § <5 § <5 § <5 § <5 §
San Dieguito <5 § <5 § <5 § <5 § <5 § <5 § <5 § <5 § <5 § <5 § <5 § <5 § <5 §
Vista <5 § <5 § <5 § <5 § <5 § <5 § <5 § <5 § <5 § <5 § <5 § <5 § <5 §
North Inland Region 5 0.9 <5 § <5 § <5 § <5 § <5 § <5 § <5 § <5 § <5 § <5 § <5 § <5 §
Anza‐Borrego Springs <5 § <5 § <5 § <5 § <5 § <5 § <5 § <5 § <5 § <5 § <5 § <5 § <5 §
Escondido <5 § <5 § <5 § <5 § <5 § <5 § <5 § <5 § <5 § <5 § <5 § <5 § <5 §
Fallbrook <5 § <5 § <5 § <5 § <5 § <5 § <5 § <5 § <5 § <5 § <5 § <5 § <5 §
North San Diego <5 § <5 § <5 § <5 § <5 § <5 § <5 § <5 § <5 § <5 § <5 § <5 § <5 §
Palomar‐Julian <5 § <5 § <5 § <5 § <5 § <5 § <5 § <5 § <5 § <5 § <5 § <5 § <5 §
Pauma <5 § <5 § <5 § <5 § <5 § <5 § <5 § <5 § <5 § <5 § <5 § <5 § <5 §
Poway <5 § <5 § <5 § <5 § <5 § <5 § <5 § <5 § <5 § <5 § <5 § <5 § <5 §
Ramona <5 § <5 § <5 § <5 § <5 § <5 § <5 § <5 § <5 § <5 § <5 § <5 § <5 §
San Marcos <5 § <5 § <5 § <5 § <5 § <5 § <5 § <5 § <5 § <5 § <5 § <5 § <5 §
Valley Center <5 § <5 § <5 § <5 § <5 § <5 § <5 § <5 § <5 § <5 § <5 § <5 § <5 §
South Region <5 § <5 § <5 § <5 § <5 § <5 § <5 § <5 § <5 § <5 § <5 § <5 § <5 §
Chula Vista <5 § <5 § <5 § <5 § <5 § <5 § <5 § <5 § <5 § <5 § <5 § <5 § <5 §
Coronado <5 § <5 § <5 § <5 § <5 § <5 § <5 § <5 § <5 § <5 § <5 § <5 § <5 §
National City <5 § <5 § <5 § <5 § <5 § <5 § <5 § <5 § <5 § <5 § <5 § <5 § <5 §
South Bay <5 § <5 § <5 § <5 § <5 § <5 § <5 § <5 § <5 § <5 § <5 § <5 § <5 §
Sweetwater <5 § <5 § <5 § <5 § <5 § <5 § <5 § <5 § <5 § <5 § <5 § <5 § <5 §Unknown <5 ‐‐‐ <5 ‐‐‐ <5 ‐‐‐ <5 ‐‐‐ <5 ‐‐‐ <5 ‐‐‐ <5 ‐‐‐ <5 ‐‐‐ <5 ‐‐‐ <5 ‐‐‐ <5 ‐‐‐ <5 ‐‐‐ <5 ‐‐‐*Rates per 100,000 population. County age‐adjusted rates per 100,000 2000 US standard population.**Harbison Crest/El Cajon is an aggregation of the Harbison Crest and El Cajon SRAs. Due to geographic limitations, the Harbison Crest SRA is not shown alone. See the Data Guide for more information.
***Numbers may not add up to totals due to unknown or missing details.
†Disorders usually diagnosed in infancy, childhood, or adolescence hospitaliza on refers to (principal diagnosis) ICD‐9 codes 299, 307.2, 307.3, 307.6, 307.7, 309.21, 313.23, 313.89, 313.9.
‡API includes Asian, Pacific Islander, Na ve Hawaiian. Other includes 2 or more races, Na ve American/Alaska Na ve, American Indian, or other.
§Rates not calculated for fewer than 5 events. Rates not calculated in cases where zip code is unknown.
Source: Patient Discharge Database (CA OSHPD), County of San Diego, Health & Human Services Agency, Public Health Services, Epidemiology & Immunization Services Branch; SANDAG, Current Population Estimates, 10/2012.
Prepared by: County of San Diego, Health & Human Services Agency, Public Health Services, Community Health Statistics Unit, 2013.
Ages 65+API‡ Other‡ Ages 0‐14Geography2011 Total
Gender
Disorders Usually Diagnosed in Infancy, Childhood, or Adolescence† Hospitaliza ons Among San Diego County Residents by Loca on of Residence, 2011 Detail
Race/Ethnicity Age Group
Ages 15‐24 Ages 25‐44 Ages 45‐64Male Female White Black Hispanic
County of San Diego, Health & Human Services Agency, Public Health Services, Community Health Statisitcs Unit Page 70

No. Rate* No. Rate* No. Rate* No. Rate* No. Rate* No. Rate* No. Rate* No. Rate* No. Rate* No. Rate* No. Rate*
San Diego County (Actual Rate) 53 1.7 45 1.4
San Diego County (Age‐Adjusted Rate) 53 1.8 45 1.5
Central Region 9 1.9 9 1.9
Central San Diego <5 § <5 §
Mid‐City 5 3.1 <5 §
Southeast San Diego <5 § <5 §
East Region 13 2.8 7 1.5
Alpine <5 § <5 §
El Cajon <5 § <5 §
Harbison Crest/El Cajon** <5 § <5 §
Jamul <5 § <5 §
La Mesa <5 § <5 §
Laguna‐Pine Valley <5 § <5 §
Lakeside <5 § <5 §
Lemon Grove 5 16.8 <5 §
Mountain Empire <5 § <5 §
Santee <5 § <5 §
Spring Valley <5 § <5 §
North Central Region 8 1.3 8 1.3
Coastal <5 § <5 §
Del Mar‐Mira Mesa <5 § <5 §
Elliott‐Navajo <5 § <5 §
Kearny Mesa <5 § <5 §
Miramar <5 § <5 §
Peninsula <5 § <5 §
University <5 § <5 §
North Coastal Region 9 1.8 5 1.0
Carlsbad <5 § <5 §
Oceanside <5 § <5 §
Pendleton <5 § <5 §
San Dieguito <5 § <5 §
Vista <5 § <5 §
North Inland Region 5 0.9 10 1.7
Anza‐Borrego Springs <5 § <5 §
Escondido <5 § <5 §
Fallbrook <5 § <5 §
North San Diego <5 § <5 §
Palomar‐Julian <5 § <5 §
Pauma <5 § <5 §
Poway <5 § <5 §
Ramona <5 § <5 §
San Marcos <5 § <5 §
Valley Center <5 § <5 §
South Region 7 1.5 6 1.3
Chula Vista <5 § <5 §
Coronado <5 § <5 §
National City <5 § <5 §
South Bay <5 § <5 §
Sweetwater <5 § <5 §Unknown <5 ‐‐‐ <5 ‐‐‐*Rates per 100,000 population. County age‐adjusted rates per 100,000 2000 US standard population.**Harbison Crest/El Cajon is an aggregation of the Harbison Crest and El Cajon SRAs. Due to geographic limitations, the Harbison Crest SRA is not shown alone. See the Data Guide for more information.†Disorders usually diagnosed in infancy, childhood, or adolescence Emergency Department Discharge refers to (principal diagnosis) ICD‐9 codes 299, 307.2, 307.3, 307.6, 307.7, 309.21, 313.23, 313.89, 313.9.§Rates not calculated for fewer than 5 events. Rates not calculated in cases where zip code is unknown.Source: Emergency Department Discharge Database (CA OSHPD), County of San Diego, Health & Human Services Agency, Public Health Services, Emergency Medical Services; SANDAG, Current Population Estimates, 10/2012.Prepared by: County of San Diego, Health & Human Services Agency, Public Health Services, Community Health Statistics Unit, 2013.
Disorders Usually Diagnosed in Infancy, Childhood, or Adolescence† Emergency Department Discharges Among San Diego County Residents by Loca on of Residence
Geography2010 Total 2011 Total 2012 Total 2013 Total 2014 Total 2015 Total 2016 Total 2017 Total 2018 Total 2019 Total 2020 Total
County of San Diego, Health & Human Services Agency, Public Health Services, Community Health Statisitcs Unit Page 71

No. Rate* No. Rate* No. Rate* No. Rate* No. Rate* No. Rate* No. Rate* No. Rate* No. Rate* No. Rate* No. Rate* No. Rate* No. Rate*
San Diego County (Actual Rate) 53 1.7 39 2.5 14 0.9 29 1.9 6 4.1 11 1.1 <5 § <5 § 36 6.0 11 2.2 <5 § <5 § <5 §
San Diego County (Age‐Adjusted Rate) 53 1.8
Central Region 9 1.9 9 3.6 <5 § <5 § <5 § <5 § <5 § <5 § 7 7.8 <5 § <5 § <5 § <5 §
Central San Diego <5 § <5 § <5 § <5 § <5 § <5 § <5 § <5 § <5 § <5 § <5 § <5 § <5 §
Mid‐City 5 3.1 5 6.2 <5 § <5 § <5 § <5 § <5 § <5 § <5 § <5 § <5 § <5 § <5 §
Southeast San Diego <5 § <5 § <5 § <5 § <5 § <5 § <5 § <5 § <5 § <5 § <5 § <5 § <5 §
East Region 13 2.8 7 3.1 6 2.6 8 2.9 <5 § <5 § <5 § <5 § 9 10.0 <5 § <5 § <5 § <5 §
Alpine <5 § <5 § <5 § <5 § <5 § <5 § <5 § <5 § <5 § <5 § <5 § <5 § <5 §
El Cajon <5 § <5 § <5 § <5 § <5 § <5 § <5 § <5 § <5 § <5 § <5 § <5 § <5 §
Harbison Crest/El Cajon** <5 § <5 § <5 § <5 § <5 § <5 § <5 § <5 § <5 § <5 § <5 § <5 § <5 §
Jamul <5 § <5 § <5 § <5 § <5 § <5 § <5 § <5 § <5 § <5 § <5 § <5 § <5 §
La Mesa <5 § <5 § <5 § <5 § <5 § <5 § <5 § <5 § <5 § <5 § <5 § <5 § <5 §
Laguna‐Pine Valley <5 § <5 § <5 § <5 § <5 § <5 § <5 § <5 § <5 § <5 § <5 § <5 § <5 §
Lakeside <5 § <5 § <5 § <5 § <5 § <5 § <5 § <5 § <5 § <5 § <5 § <5 § <5 §
Lemon Grove 5 16.8 <5 § 5 32.7 <5 § <5 § <5 § <5 § <5 § <5 § <5 § <5 § <5 § <5 §
Mountain Empire <5 § <5 § <5 § <5 § <5 § <5 § <5 § <5 § <5 § <5 § <5 § <5 § <5 §
Santee <5 § <5 § <5 § <5 § <5 § <5 § <5 § <5 § <5 § <5 § <5 § <5 § <5 §
Spring Valley <5 § <5 § <5 § <5 § <5 § <5 § <5 § <5 § <5 § <5 § <5 § <5 § <5 §
North Central Region 8 1.3 <5 § <5 § 7 1.9 <5 § <5 § <5 § <5 § 6 6.3 <5 § <5 § <5 § <5 §
Coastal <5 § <5 § <5 § <5 § <5 § <5 § <5 § <5 § <5 § <5 § <5 § <5 § <5 §
Del Mar‐Mira Mesa <5 § <5 § <5 § <5 § <5 § <5 § <5 § <5 § <5 § <5 § <5 § <5 § <5 §
Elliott‐Navajo <5 § <5 § <5 § <5 § <5 § <5 § <5 § <5 § <5 § <5 § <5 § <5 § <5 §
Kearny Mesa <5 § <5 § <5 § <5 § <5 § <5 § <5 § <5 § <5 § <5 § <5 § <5 § <5 §
Miramar <5 § <5 § <5 § <5 § <5 § <5 § <5 § <5 § <5 § <5 § <5 § <5 § <5 §
Peninsula <5 § <5 § <5 § <5 § <5 § <5 § <5 § <5 § <5 § <5 § <5 § <5 § <5 §
University <5 § <5 § <5 § <5 § <5 § <5 § <5 § <5 § <5 § <5 § <5 § <5 § <5 §
North Coastal Region 9 1.8 6 2.3 <5 § 6 2.0 <5 § <5 § <5 § <5 § 6 5.9 <5 § <5 § <5 § <5 §
Carlsbad <5 § <5 § <5 § <5 § <5 § <5 § <5 § <5 § <5 § <5 § <5 § <5 § <5 §
Oceanside <5 § <5 § <5 § <5 § <5 § <5 § <5 § <5 § <5 § <5 § <5 § <5 § <5 §
Pendleton <5 § <5 § <5 § <5 § <5 § <5 § <5 § <5 § <5 § <5 § <5 § <5 § <5 §
San Dieguito <5 § <5 § <5 § <5 § <5 § <5 § <5 § <5 § <5 § <5 § <5 § <5 § <5 §
Vista <5 § <5 § <5 § <5 § <5 § <5 § <5 § <5 § <5 § <5 § <5 § <5 § <5 §
North Inland Region 5 0.9 <5 § <5 § <5 § <5 § <5 § <5 § <5 § <5 § <5 § <5 § <5 § <5 §
Anza‐Borrego Springs <5 § <5 § <5 § <5 § <5 § <5 § <5 § <5 § <5 § <5 § <5 § <5 § <5 §
Escondido <5 § <5 § <5 § <5 § <5 § <5 § <5 § <5 § <5 § <5 § <5 § <5 § <5 §
Fallbrook <5 § <5 § <5 § <5 § <5 § <5 § <5 § <5 § <5 § <5 § <5 § <5 § <5 §
North San Diego <5 § <5 § <5 § <5 § <5 § <5 § <5 § <5 § <5 § <5 § <5 § <5 § <5 §
Palomar‐Julian <5 § <5 § <5 § <5 § <5 § <5 § <5 § <5 § <5 § <5 § <5 § <5 § <5 §
Pauma <5 § <5 § <5 § <5 § <5 § <5 § <5 § <5 § <5 § <5 § <5 § <5 § <5 §
Poway <5 § <5 § <5 § <5 § <5 § <5 § <5 § <5 § <5 § <5 § <5 § <5 § <5 §
Ramona <5 § <5 § <5 § <5 § <5 § <5 § <5 § <5 § <5 § <5 § <5 § <5 § <5 §
San Marcos <5 § <5 § <5 § <5 § <5 § <5 § <5 § <5 § <5 § <5 § <5 § <5 § <5 §
Valley Center <5 § <5 § <5 § <5 § <5 § <5 § <5 § <5 § <5 § <5 § <5 § <5 § <5 §
South Region 7 1.5 7 3.0 <5 § <5 § <5 § <5 § <5 § <5 § 5 4.9 <5 § <5 § <5 § <5 §
Chula Vista <5 § <5 § <5 § <5 § <5 § <5 § <5 § <5 § <5 § <5 § <5 § <5 § <5 §
Coronado <5 § <5 § <5 § <5 § <5 § <5 § <5 § <5 § <5 § <5 § <5 § <5 § <5 §
National City <5 § <5 § <5 § <5 § <5 § <5 § <5 § <5 § <5 § <5 § <5 § <5 § <5 §
South Bay <5 § <5 § <5 § <5 § <5 § <5 § <5 § <5 § <5 § <5 § <5 § <5 § <5 §
Sweetwater <5 § <5 § <5 § <5 § <5 § <5 § <5 § <5 § <5 § <5 § <5 § <5 § <5 §Unknown <5 ‐‐‐ <5 ‐‐‐ <5 ‐‐‐ <5 ‐‐‐ <5 ‐‐‐ <5 ‐‐‐ <5 ‐‐‐ <5 ‐‐‐ <5 ‐‐‐ <5 ‐‐‐ <5 ‐‐‐ <5 ‐‐‐ <5 ‐‐‐*Rates per 100,000 population. County age‐adjusted rates per 100,000 2000 US standard population.**Harbison Crest/El Cajon is an aggregation of the Harbison Crest and El Cajon SRAs. Due to geographic limitations, the Harbison Crest SRA is not shown alone. See the Data Guide for more information.
***Numbers may not add up to totals due to unknown or missing details.
† Disorders usually diagnosed in infancy, childhood, or adolescence Emergency Department Discharge refers to (principal diagnosis) ICD‐9 codes 299, 307.2, 307.3, 307.6, 307.7, 309.21, 313.23, 313.89, 313.9.
‡API includes Asian, Pacific Islander, Na ve Hawaiian. Other includes 2 or more races, Na ve American/Alaska Na ve, American Indian, or other.
§ Rates not calculated for fewer than 5 events. Rates not calculated in cases where zip code is unknown.
Source: Emergency Department Discharge Database (CA OSHPD), County of San Diego, Health & Human Services Agency, Public Health Services, Emergency Medical Services; SANDAG, Current Population Estimates, 10/2012.
Prepared by: County of San Diego, Health & Human Services Agency, Public Health Services, Community Health Statistics Unit, 2013.
Ages 45‐64Hispanic
Disorders Usually Diagnosed in Infancy, Childhood, or Adolescence† Emergency Department Discharges Among San Diego County Residents by Loca on of Residence, 2010 Detail
Geography2010 Total
Gender Race/Ethnicity Age Group
Male Ages 65+Female White Black Other‡ Ages 0‐14 Ages 15‐24 Ages 25‐44API‡
County of San Diego, Health & Human Services Agency, Public Health Services, Community Health Statisitcs Unit Page 72

No. Rate* No. Rate* No. Rate* No. Rate* No. Rate* No. Rate* No. Rate* No. Rate* No. Rate* No. Rate* No. Rate* No. Rate* No. Rate*
San Diego County (Actual Rate) 45 1.4 29 1.9 16 1.0 20 1.3 8 5.6 12 1.2 <5 § <5 § 20 3.4 16 3.2 5 0.6 <5 § <5 §
San Diego County (Age‐Adjusted Rate) 45 1.5
Central Region 9 1.9 5 2.0 <5 § <5 § <5 § <5 § <5 § <5 § <5 § <5 § <5 § <5 § <5 §
Central San Diego <5 § <5 § <5 § <5 § <5 § <5 § <5 § <5 § <5 § <5 § <5 § <5 § <5 §
Mid‐City <5 § <5 § <5 § <5 § <5 § <5 § <5 § <5 § <5 § <5 § <5 § <5 § <5 §
Southeast San Diego <5 § <5 § <5 § <5 § <5 § <5 § <5 § <5 § <5 § <5 § <5 § <5 § <5 §
East Region 7 1.5 <5 § <5 § <5 § <5 § <5 § <5 § <5 § <5 § <5 § <5 § <5 § <5 §
Alpine <5 § <5 § <5 § <5 § <5 § <5 § <5 § <5 § <5 § <5 § <5 § <5 § <5 §
El Cajon <5 § <5 § <5 § <5 § <5 § <5 § <5 § <5 § <5 § <5 § <5 § <5 § <5 §
Harbison Crest/El Cajon** <5 § <5 § <5 § <5 § <5 § <5 § <5 § <5 § <5 § <5 § <5 § <5 § <5 §
Jamul <5 § <5 § <5 § <5 § <5 § <5 § <5 § <5 § <5 § <5 § <5 § <5 § <5 §
La Mesa <5 § <5 § <5 § <5 § <5 § <5 § <5 § <5 § <5 § <5 § <5 § <5 § <5 §
Laguna‐Pine Valley <5 § <5 § <5 § <5 § <5 § <5 § <5 § <5 § <5 § <5 § <5 § <5 § <5 §
Lakeside <5 § <5 § <5 § <5 § <5 § <5 § <5 § <5 § <5 § <5 § <5 § <5 § <5 §
Lemon Grove <5 § <5 § <5 § <5 § <5 § <5 § <5 § <5 § <5 § <5 § <5 § <5 § <5 §
Mountain Empire <5 § <5 § <5 § <5 § <5 § <5 § <5 § <5 § <5 § <5 § <5 § <5 § <5 §
Santee <5 § <5 § <5 § <5 § <5 § <5 § <5 § <5 § <5 § <5 § <5 § <5 § <5 §
Spring Valley <5 § <5 § <5 § <5 § <5 § <5 § <5 § <5 § <5 § <5 § <5 § <5 § <5 §
North Central Region 8 1.3 5 1.6 <5 § 5 1.4 <5 § <5 § <5 § <5 § <5 § <5 § <5 § <5 § <5 §
Coastal <5 § <5 § <5 § <5 § <5 § <5 § <5 § <5 § <5 § <5 § <5 § <5 § <5 §
Del Mar‐Mira Mesa <5 § <5 § <5 § <5 § <5 § <5 § <5 § <5 § <5 § <5 § <5 § <5 § <5 §
Elliott‐Navajo <5 § <5 § <5 § <5 § <5 § <5 § <5 § <5 § <5 § <5 § <5 § <5 § <5 §
Kearny Mesa <5 § <5 § <5 § <5 § <5 § <5 § <5 § <5 § <5 § <5 § <5 § <5 § <5 §
Miramar <5 § <5 § <5 § <5 § <5 § <5 § <5 § <5 § <5 § <5 § <5 § <5 § <5 §
Peninsula <5 § <5 § <5 § <5 § <5 § <5 § <5 § <5 § <5 § <5 § <5 § <5 § <5 §
University <5 § <5 § <5 § <5 § <5 § <5 § <5 § <5 § <5 § <5 § <5 § <5 § <5 §
North Coastal Region 5 1.0 <5 § <5 § <5 § <5 § <5 § <5 § <5 § <5 § <5 § <5 § <5 § <5 §
Carlsbad <5 § <5 § <5 § <5 § <5 § <5 § <5 § <5 § <5 § <5 § <5 § <5 § <5 §
Oceanside <5 § <5 § <5 § <5 § <5 § <5 § <5 § <5 § <5 § <5 § <5 § <5 § <5 §
Pendleton <5 § <5 § <5 § <5 § <5 § <5 § <5 § <5 § <5 § <5 § <5 § <5 § <5 §
San Dieguito <5 § <5 § <5 § <5 § <5 § <5 § <5 § <5 § <5 § <5 § <5 § <5 § <5 §
Vista <5 § <5 § <5 § <5 § <5 § <5 § <5 § <5 § <5 § <5 § <5 § <5 § <5 §
North Inland Region 10 1.7 6 2.1 <5 § 7 2.2 <5 § <5 § <5 § <5 § 5 4.2 5 6.3 <5 § <5 § <5 §
Anza‐Borrego Springs <5 § <5 § <5 § <5 § <5 § <5 § <5 § <5 § <5 § <5 § <5 § <5 § <5 §
Escondido <5 § <5 § <5 § <5 § <5 § <5 § <5 § <5 § <5 § <5 § <5 § <5 § <5 §
Fallbrook <5 § <5 § <5 § <5 § <5 § <5 § <5 § <5 § <5 § <5 § <5 § <5 § <5 §
North San Diego <5 § <5 § <5 § <5 § <5 § <5 § <5 § <5 § <5 § <5 § <5 § <5 § <5 §
Palomar‐Julian <5 § <5 § <5 § <5 § <5 § <5 § <5 § <5 § <5 § <5 § <5 § <5 § <5 §
Pauma <5 § <5 § <5 § <5 § <5 § <5 § <5 § <5 § <5 § <5 § <5 § <5 § <5 §
Poway <5 § <5 § <5 § <5 § <5 § <5 § <5 § <5 § <5 § <5 § <5 § <5 § <5 §
Ramona <5 § <5 § <5 § <5 § <5 § <5 § <5 § <5 § <5 § <5 § <5 § <5 § <5 §
San Marcos <5 § <5 § <5 § <5 § <5 § <5 § <5 § <5 § <5 § <5 § <5 § <5 § <5 §
Valley Center <5 § <5 § <5 § <5 § <5 § <5 § <5 § <5 § <5 § <5 § <5 § <5 § <5 §
South Region 6 1.3 5 2.1 <5 § <5 § <5 § 5 § <5 § <5 § <5 § <5 § <5 § <5 § <5 §
Chula Vista <5 § <5 § <5 § <5 § <5 § <5 § <5 § <5 § <5 § <5 § <5 § <5 § <5 §
Coronado <5 § <5 § <5 § <5 § <5 § <5 § <5 § <5 § <5 § <5 § <5 § <5 § <5 §
National City <5 § <5 § <5 § <5 § <5 § <5 § <5 § <5 § <5 § <5 § <5 § <5 § <5 §
South Bay <5 § <5 § <5 § <5 § <5 § <5 § <5 § <5 § <5 § <5 § <5 § <5 § <5 §
Sweetwater <5 § <5 § <5 § <5 § <5 § <5 § <5 § <5 § <5 § <5 § <5 § <5 § <5 §Unknown <5 ‐‐‐ <5 ‐‐‐ <5 ‐‐‐ <5 ‐‐‐ <5 ‐‐‐ <5 ‐‐‐ <5 ‐‐‐ <5 ‐‐‐ <5 ‐‐‐ <5 ‐‐‐ <5 ‐‐‐ <5 ‐‐‐ <5 ‐‐‐*Rates per 100,000 population. County age‐adjusted rates per 100,000 2000 US standard population.**Harbison Crest/El Cajon is an aggregation of the Harbison Crest and El Cajon SRAs. Due to geographic limitations, the Harbison Crest SRA is not shown alone. See the Data Guide for more information.
***Numbers may not add up to totals due to unknown or missing details.
†Disorders usually diagnosed in infancy, childhood, or adolescence Emergency Department Discharge refers to (principal diagnosis) ICD‐9 codes 299, 307.2, 307.3, 307.6, 307.7, 309.21, 313.23, 313.89, 313.9.
‡API includes Asian, Pacific Islander, Na ve Hawaiian. Other includes 2 or more races, Na ve American/Alaska Na ve, American Indian, or other.
§Rates not calculated for fewer than 5 events. Rates not calculated in cases where zip code is unknown.
Source: Emergency Department Discharge Database (CA OSHPD), County of San Diego, Health & Human Services Agency, Public Health Services, Emergency Medical Services; SANDAG, Current Population Estimates, 10/2012.
Prepared by: County of San Diego, Health & Human Services Agency, Public Health Services, Community Health Statistics Unit, 2013.
Ages 15‐24 Ages 25‐44 Ages 45‐64Male Female White Black Hispanic
Gender
Disorders Usually Diagnosed in Infancy, Childhood, or Adolescence† Emergency Department Discharges Among San Diego County Residents by Loca on of Residence, 2011 Detail
Race/Ethnicity Age Group
Ages 65+API‡ Other‡ Ages 0‐14Geography2011 Total
County of San Diego, Health & Human Services Agency, Public Health Services, Community Health Statisitcs Unit Page 73

Impulse Control Disorder
County of San Diego, Health & Human Services Agency, Public Health Services, Community Health Statisitcs Unit Page 74

No. Rate* No. Rate* No. Rate* No. Rate* No. Rate* No. Rate* No. Rate* No. Rate* No. Rate* No. Rate* No. Rate*
San Diego County (Actual Rate) 250 8.1 192 6.2
San Diego County (Age‐Adjusted Rate) 250 8.2 192 6.4
Central Region 37 7.6 32 6.6
Central San Diego 16 9.7 9 5.4
Mid‐City 15 9.2 11 6.7
Southeast San Diego 6 3.9 12 7.7
East Region 55 11.9 30 6.4
Alpine <5 § <5 §
El Cajon 17 13.7 5 4.0
Harbison Crest/El Cajon** 23 16.5 9 6.4
Jamul <5 § <5 §
La Mesa 5 8.5 <5 §
Laguna‐Pine Valley <5 § <5 §
Lakeside <5 § <5 §
Lemon Grove 5 16.8 <5 §
Mountain Empire <5 § <5 §
Santee 7 13.7 6 11.6
Spring Valley 8 9.9 <5 §
North Central Region 50 8.3 34 5.6
Coastal 6 8.0 7 9.3
Del Mar‐Mira Mesa 7 4.4 <5 §
Elliott‐Navajo 13 14.6 9 10.1
Kearny Mesa 16 10.6 11 7.3
Miramar <5 § <5 §
Peninsula <5 § <5 §
University 5 8.0 <5 §
North Coastal Region 43 8.5 31 6.1
Carlsbad <5 § 7 6.0
Oceanside 21 13.1 13 8.1
Pendleton <5 § <5 §
San Dieguito <5 § 6 6.3
Vista 16 15.9 5 4.9
North Inland Region 33 5.8 47 8.2
Anza‐Borrego Springs <5 § <5 §
Escondido 6 3.7 17 10.4
Fallbrook 6 12.7 6 12.5
North San Diego 11 10.3 5 4.6
Palomar‐Julian <5 § <5 §
Pauma <5 § <5 §
Poway <5 § 8 9.2
Ramona <5 § <5 §
San Marcos <5 § 8 8.9
Valley Center <5 § <5 §
South Region 32 6.8 18 3.8
Chula Vista 9 7.8 7 6.0
Coronado <5 § <5 §
National City 7 12.0 <5 §
South Bay 11 8.2 7 5.2
Sweetwater 5 3.7 <5 §Unknown <5 ‐‐‐ <5 ‐‐‐*Rates per 100,000 population. County age‐adjusted rates per 100,000 2000 US standard population.**Harbison Crest/El Cajon is an aggregation of the Harbison Crest and El Cajon SRAs. Due to geographic limitations, the Harbison Crest SRA is not shown alone. See the Data Guide for more information.†Impulse control disorder hospitaliza on refers to (principal diagnosis) ICD‐9 code 312.3.§Rates not calculated for fewer than 5 events. Rates not calculated in cases where zip code is unknown.Source: Patient Discharge Database (CA OSHPD), County of San Diego, Health & Human Services Agency, Public Health Services, Epidemiology & Immunization Services Branch; SANDAG, Current Population Estimates, 10/2012.Prepared by: County of San Diego, Health & Human Services Agency, Public Health Services, Community Health Statistics Unit, 2013.
Impulse Control Disorder† Hospitaliza ons Among San Diego County Residents by Location of Residence
Geography2010 Total 2011 Total 2012 Total 2013 Total 2014 Total 2015 Total 2016 Total 2017 Total 2018 Total 2019 Total 2020 Total
County of San Diego, Health & Human Services Agency, Public Health Services, Community Health Statisitcs Unit Page 75

No. Rate* No. Rate* No. Rate* No. Rate* No. Rate* No. Rate* No. Rate* No. Rate* No. Rate* No. Rate* No. Rate* No. Rate* No. Rate*
San Diego County (Actual Rate) 250 8.1 175 11.3 75 4.9 150 10.0 25 17.1 45 4.5 11 3.2 16 13.8 109 18.3 95 19.2 16 1.8 6 0.8 24 6.8
San Diego County (Age‐Adjusted Rate) 250 8.2
Central Region 37 7.6 18 7.3 19 8.0 11 7.7 10 17.6 8 3.9 <5 § 6 37.8 9 10.0 17 20.4 6 3.7 <5 § <5 §
Central San Diego 16 9.7 6 6.6 10 13.3 <5 § <5 § <5 § <5 § 6 105.7 <5 § 10 43.5 5 7.2 <5 § <5 §
Mid‐City 15 9.2 8 9.9 7 8.6 7 15.1 5 25.9 <5 § <5 § <5 § 6 17.7 <5 § <5 § <5 § <5 §
Southeast San Diego 6 3.9 <5 § <5 § <5 § <5 § <5 § <5 § <5 § <5 § <5 § <5 § <5 § <5 §
East Region 55 11.9 44 19.3 11 4.7 34 12.2 <5 § 9 7.8 <5 § 6 28.6 19 21.1 27 39.4 <5 § <5 § <5 §
Alpine <5 § <5 § <5 § <5 § <5 § <5 § <5 § <5 § <5 § <5 50.7 <5 § <5 § <5 §
El Cajon 17 13.7 16 26.3 <5 § 9 12.2 <5 § 5 15.1 <5 § <5 § 10 39.2 6 30.5 <5 § <5 § <5 §
Harbison Crest/El Cajon** 23 16.5 22 32.2 <5 § 11 12.9 <5 § 6 17.0 <5 § <5 § 12 43.2 9 41.8 <5 § <5 § <5 §
Jamul <5 § <5 § <5 § <5 § <5 § <5 § <5 § <5 § <5 § <5 § <5 § <5 § <5 §
La Mesa 5 8.5 <5 § <5 § <5 § <5 § <5 § <5 § <5 § <5 § <5 § <5 § <5 § <5 §
Laguna‐Pine Valley <5 § <5 § <5 § <5 § <5 § <5 § <5 § <5 § <5 § <5 § <5 § <5 § <5 §
Lakeside <5 § <5 § <5 § <5 § <5 § <5 § <5 § <5 § <5 § <5 § <5 § <5 § <5 §
Lemon Grove 5 16.8 5 34.5 <5 § <5 § <5 § <5 § <5 § <5 § <5 § <5 § <5 § <5 § <5 §
Mountain Empire <5 § <5 § <5 § <5 § <5 § <5 § <5 § <5 § <5 § <5 § <5 § <5 § <5 §
Santee 7 13.7 <5 § <5 § 6 15.8 <5 § <5 § <5 § <5 § <5 § <5 § <5 § <5 § <5 §
Spring Valley 8 9.9 7 17.8 <5 § 7 18.3 <5 § <5 § <5 § <5 § <5 § <5 § <5 § <5 § <5 §
North Central Region 50 8.3 41 13.4 9 3.0 35 9.6 6 32.0 8 9.3 <5 § <5 § 22 23.3 18 17.5 <5 § <5 § 7 9.7
Coastal 6 8.0 5 12.9 <5 § 5 8.2 <5 § <5 § <5 § <5 § <5 § <5 § <5 § <5 § <5 §
Del Mar‐Mira Mesa 7 4.4 5 6.3 <5 § 6 7.9 <5 § <5 § <5 § <5 § <5 § <5 § <5 § <5 § <5 §
Elliott‐Navajo 13 14.6 13 30.1 <5 § 7 11.6 <5 § 6 46.2 <5 § <5 § 6 35.2 7 63.1 <5 § <5 § <5 §
Kearny Mesa 16 10.6 11 14.6 5 6.6 11 13.0 5 74.4 <5 § <5 § <5 § 5 21.5 8 34.0 <5 § <5 § <5 §
Miramar <5 § <5 § <5 § <5 § <5 § <5 § <5 § <5 § <5 § <5 § <5 § <5 § <5 §
Peninsula <5 § <5 § <5 § <5 § <5 § <5 § <5 § <5 § <5 § <5 § <5 § <5 § <5 §
University 5 8.0 <5 § <5 § <5 § <5 § <5 § <5 § <5 § <5 § <5 § <5 § <5 § <5 §
North Coastal Region 43 8.5 28 10.9 15 6.0 31 10.4 <5 § <5 § <5 § <5 § 26 25.7 14 16.7 <5 § <5 § <5 §
Carlsbad <5 § <5 § <5 § <5 § <5 § <5 § <5 § <5 § <5 § <5 § <5 § <5 § <5 §
Oceanside 21 13.1 13 16.4 8 9.9 16 21.6 <5 § <5 § <5 § <5 § 16 49.8 <5 § <5 § <5 § <5 §
Pendleton <5 § <5 § <5 § <5 § <5 § <5 § <5 § <5 § <5 § <5 § <5 § <5 § <5 §
San Dieguito <5 § <5 § <5 § <5 § <5 § <5 § <5 § <5 § <5 § <5 § <5 § <5 § <5 §
Vista 16 15.9 10 19.7 6 12.1 11 25.1 <5 § <5 § <5 § <5 § 10 46.9 6 35.8 <5 § <5 § <5 §
North Inland Region 33 5.8 25 8.9 8 2.8 25 7.9 <5 § 6 3.7 <5 § <5 § 19 15.9 8 10.4 <5 § <5 § 5 6.9
Anza‐Borrego Springs <5 § <5 § <5 § <5 § <5 § <5 § <5 § <5 § <5 § <5 § <5 § <5 § <5 §
Escondido 6 3.7 <5 § <5 § <5 § <5 § <5 § <5 § <5 § <5 § <5 § <5 § <5 § <5 §
Fallbrook 6 12.7 <5 § <5 § <5 § <5 § <5 § <5 § <5 § 5 56.6 <5 § <5 § <5 § <5 §
North San Diego 11 10.3 10 19.4 <5 § 10 16.0 <5 § <5 § <5 § <5 § 6 26.7 <5 § <5 § <5 § <5 §
Palomar‐Julian <5 § <5 § <5 § <5 § <5 § <5 § <5 § <5 § <5 § <5 § <5 § <5 § <5 §
Pauma <5 § <5 § <5 § <5 § <5 § <5 § <5 § <5 § <5 § <5 § <5 § <5 § <5 §
Poway <5 § <5 § <5 § <5 § <5 § <5 § <5 § <5 § <5 § <5 § <5 § <5 § <5 §
Ramona <5 § <5 § <5 § <5 § <5 § <5 § <5 § <5 § <5 § <5 § <5 § <5 § <5 §
San Marcos <5 § <5 § <5 § <5 § <5 § <5 § <5 § <5 § <5 § <5 § <5 § <5 § <5 §
Valley Center <5 § <5 § <5 § <5 § <5 § <5 § <5 § <5 § <5 § <5 § <5 § <5 § <5 §
South Region 32 6.8 19 8.1 13 5.5 14 14.3 <5 § 11 4.0 <5 § <5 § 14 13.8 11 13.6 <5 § <5 § <5 §
Chula Vista 9 7.8 <5 § 5 8.4 <5 § <5 § <5 § <5 § <5 § <5 § 5 26.6 <5 § <5 § <5 §
Coronado <5 § <5 § <5 § <5 § <5 § <5 § <5 § <5 § <5 § <5 § <5 § <5 § <5 §
National City 7 12.0 6 20.0 <5 § <5 § <5 § <5 § <5 § <5 § <5 § <5 § <5 § <5 § <5 §
South Bay 11 8.2 7 10.3 <5 § <5 § <5 § <5 § <5 § <5 § 7 23.7 <5 § <5 § <5 § <5 §
Sweetwater 5 3.7 <5 § <5 § 5 15.9 <5 § <5 § <5 § <5 § <5 § <5 § <5 § <5 § <5 §Unknown <5 ‐‐‐ <5 ‐‐‐ <5 ‐‐‐ <5 ‐‐‐ <5 ‐‐‐ <5 ‐‐‐ <5 ‐‐‐ <5 ‐‐‐ <5 ‐‐‐ <5 ‐‐‐ <5 ‐‐‐ <5 ‐‐‐ <5 ‐‐‐*Rates per 100,000 population. County age‐adjusted rates per 100,000 2000 US standard population.**Harbison Crest/El Cajon is an aggregation of the Harbison Crest and El Cajon SRAs. Due to geographic limitations, the Harbison Crest SRA is not shown alone. See the Data Guide for more information.
***Numbers may not add up to totals due to unknown or missing details.
†Impulse control disorder hospitaliza on refers to (principal diagnosis) ICD‐9 code 312.3.
‡API includes Asian, Pacific Islander, Na ve Hawaiian. Other includes 2 or more races, Na ve American/Alaska Na ve, American Indian, or other.
§Rates not calculated for fewer than 5 events. Rates not calculated in cases where zip code is unknown.
Source: Patient Discharge Database (CA OSHPD), County of San Diego, Health & Human Services Agency, Public Health Services, Epidemiology & Immunization Services Branch; SANDAG, Current Population Estimates, 10/2012.
Prepared by: County of San Diego, Health & Human Services Agency, Public Health Services, Community Health Statistics Unit, 2013.
Ages 45‐64 Ages 65+Ages 15‐24 Ages 25‐44
Impulse Control Disorder† Hospitaliza ons Among San Diego County Residents by Loca on of Residence, 2010 Detail
Female White Black Hispanic API‡ Other‡Geography2010 Total
Gender Race/Ethnicity Age Group
Male Ages 0‐14
County of San Diego, Health & Human Services Agency, Public Health Services, Community Health Statisitcs Unit Page 76

No. Rate* No. Rate* No. Rate* No. Rate* No. Rate* No. Rate* No. Rate* No. Rate* No. Rate* No. Rate* No. Rate* No. Rate* No. Rate*
San Diego County (Actual Rate) 192 6.2 143 9.2 49 3.2 123 8.2 5 3.5 40 4.0 7 2.0 12 10.2 102 17.2 53 10.6 16 1.8 <5 § 18 5.0
San Diego County (Age‐Adjusted Rate) 192 6.4
Central Region 32 6.6 20 8.1 12 5.1 15 10.5 <5 § 10 4.8 <5 § <5 § 16 17.8 10 12.5 <5 § <5 § <5 §
Central San Diego 9 5.4 <5 § 6 8.0 5 6.1 <5 § <5 § <5 § <5 § <5 § 6 28.9 <5 § <5 § <5 §
Mid‐City 11 6.7 8 9.8 <5 § 5 10.9 <5 § 5 7.2 <5 § <5 § 9 26.6 <5 § <5 § <5 § <5 §
Southeast San Diego 12 7.7 9 11.8 <5 § 5 34.0 <5 § <5 § <5 § <5 § 6 16.6 <5 § <5 § <5 § <5 §
East Region 30 6.4 22 9.6 8 3.4 17 6.1 <5 § <5 § <5 § 5 23.3 14 15.7 6 8.6 6 5.0 <5 § <5 §
Alpine <5 § <5 § <5 § <5 § <5 § <5 § <5 § <5 § <5 § <5 § <5 § <5 § <5 §
El Cajon 5 4.0 <5 § <5 § <5 § <5 § <5 § <5 § <5 § <5 § <5 § <5 § <5 § <5 §
Harbison Crest/El Cajon** 9 6.4 6 8.7 <5 § <5 § <5 § <5 § <5 § <5 § <5 § <5 § <5 § <5 § <5 §
Jamul <5 § <5 § <5 § <5 § <5 § <5 § <5 § <5 § <5 § <5 § <5 § <5 § <5 §
La Mesa <5 § <5 § <5 § <5 § <5 § <5 § <5 § <5 § <5 § <5 § <5 § <5 § <5 §
Laguna‐Pine Valley <5 § <5 § <5 § <5 § <5 § <5 § <5 § <5 § <5 § <5 § <5 § <5 § <5 §
Lakeside <5 § <5 § <5 § <5 § <5 § <5 § <5 § <5 § <5 § <5 § <5 § <5 § <5 §
Lemon Grove <5 § <5 § <5 § <5 § <5 § <5 § <5 § <5 § <5 § <5 § <5 § <5 § <5 §
Mountain Empire <5 § <5 § <5 § <5 § <5 § <5 § <5 § <5 § <5 § <5 § <5 § <5 § <5 §
Santee 6 11.6 6 24.0 <5 § <5 § <5 § <5 § <5 § <5 § 6 61.9 <5 § <5 § <5 § <5 §
Spring Valley <5 § <5 § <5 § <5 § <5 § <5 § <5 § <5 § <5 § <5 § <5 § <5 § <5 §
North Central Region 34 5.6 21 6.8 13 4.3 27 7.4 <5 § 6 6.8 <5 § <5 § 12 12.7 11 10.6 7 3.6 <5 § <5 §
Coastal 7 9.3 <5 § <5 § 6 9.9 <5 § <5 § <5 § <5 § <5 § <5 § <5 § <5 § <5 §
Del Mar‐Mira Mesa <5 § <5 § <5 § <5 § <5 § <5 § <5 § <5 § <5 § <5 § <5 § <5 § <5 §
Elliott‐Navajo 9 10.1 6 13.8 <5 § 5 8.3 <5 § <5 § <5 § <5 § 5 29.5 <5 § <5 § <5 § <5 §
Kearny Mesa 11 7.3 6 7.9 5 6.6 9 10.7 <5 § <5 § <5 § <5 § <5 § <5 § 5 9.9 <5 § <5 §
Miramar <5 § <5 § <5 § <5 § <5 § <5 § <5 § <5 § <5 § <5 § <5 § <5 § <5 §
Peninsula <5 § <5 § <5 § <5 § <5 § <5 § <5 § <5 § <5 § <5 § <5 § <5 § <5 §
University <5 § <5 § <5 § <5 § <5 § <5 § <5 § <5 § <5 § <5 § <5 § <5 § <5 §
North Coastal Region 31 6.1 23 8.9 8 3.2 23 7.7 <5 § 7 4.8 <5 § <5 § 18 17.9 7 8.3 <5 § <5 § <5 §
Carlsbad 7 6.0 7 12.4 <5 § 6 7.1 <5 § <5 § <5 § <5 § <5 § <5 § <5 § <5 § <5 §
Oceanside 13 8.1 8 10.1 5 6.2 7 9.5 <5 § 5 8.2 <5 § <5 § 10 30.7 <5 § <5 § <5 § <5 §
Pendleton <5 § <5 § <5 § <5 § <5 § <5 § <5 § <5 § <5 § <5 § <5 § <5 § <5 §
San Dieguito 6 6.3 <5 § <5 § 6 8.1 <5 § <5 § <5 § <5 § <5 § <5 § <5 § <5 § <5 §
Vista 5 4.9 5 9.8 <5 § <5 § <5 § <5 § <5 § <5 § <5 § <5 § <5 § <5 § <5 §
North Inland Region 47 8.2 41 14.5 6 2.1 33 10.5 <5 § 6 3.6 <5 § <5 § 31 26.1 13 16.3 <5 § <5 § <5 §
Anza‐Borrego Springs <5 § <5 § <5 § <5 § <5 § <5 § <5 § <5 § <5 § <5 § <5 § <5 § <5 §
Escondido 17 10.4 13 16.0 <5 § 11 15.6 <5 § <5 § <5 § <5 § 10 27.7 6 23.2 <5 § <5 § <5 §
Fallbrook 6 12.5 6 25.2 <5 § <5 § <5 § <5 § <5 § <5 § 6 67.8 <5 § <5 § <5 § <5 §
North San Diego 5 4.6 5 9.6 <5 § 5 8.0 <5 § <5 § <5 § <5 § <5 § <5 § <5 § <5 § <5 §
Palomar‐Julian <5 § <5 § <5 § <5 § <5 § <5 § <5 § <5 § <5 § <5 § <5 § <5 § <5 §
Pauma <5 § <5 § <5 § <5 § <5 § <5 § <5 § <5 § <5 § <5 § <5 § <5 § <5 §
Poway 8 9.2 8 18.8 <5 § <5 § <5 § <5 § <5 § <5 § <5 § <5 § <5 § <5 § <5 §
Ramona <5 § <5 § <5 § <5 § <5 § <5 § <5 § <5 § <5 § <5 § <5 § <5 § <5 §
San Marcos 8 8.9 6 13.6 <5 § 6 13.4 <5 § <5 § <5 § <5 § 6 30.2 <5 § <5 § <5 § <5 §
Valley Center <5 § <5 § <5 § <5 § <5 § <5 § <5 § <5 § <5 § <5 § <5 § <5 § <5 §
South Region 18 3.8 16 6.8 <5 § 8 8.3 <5 § 8 2.8 <5 § <5 § 11 10.9 6 7.4 <5 § <5 § <5 §
Chula Vista 7 6.0 6 10.7 <5 § <5 § <5 § 5 6.1 <5 § <5 § 5 20.5 <5 § <5 § <5 § <5 §
Coronado <5 § <5 § <5 § <5 § <5 § <5 § <5 § <5 § <5 § <5 § <5 § <5 § <5 §
National City <5 § <5 § <5 § <5 § <5 § <5 § <5 § <5 § <5 § <5 § <5 § <5 § <5 §
South Bay 7 5.2 7 10.3 <5 § <5 § <5 § <5 § <5 § <5 § <5 § <5 § <5 § <5 § <5 §
Sweetwater <5 § <5 § <5 § <5 § <5 § <5 § <5 § <5 § <5 § <5 § <5 § <5 § <5 §Unknown <5 ‐‐‐ <5 ‐‐‐ <5 ‐‐‐ <5 ‐‐‐ <5 ‐‐‐ <5 ‐‐‐ <5 ‐‐‐ <5 ‐‐‐ <5 ‐‐‐ <5 ‐‐‐ <5 ‐‐‐ <5 ‐‐‐ <5 ‐‐‐*Rates per 100,000 population. County age‐adjusted rates per 100,000 2000 US standard population.**Harbison Crest/El Cajon is an aggregation of the Harbison Crest and El Cajon SRAs. Due to geographic limitations, the Harbison Crest SRA is not shown alone. See the Data Guide for more information.
***Numbers may not add up to totals due to unknown or missing details.
†Impulse control disorder hospitaliza on refers to (principal diagnosis) ICD‐9 code 312.3.
‡API includes Asian, Pacific Islander, Na ve Hawaiian. Other includes 2 or more races, Na ve American/Alaska Na ve, American Indian, or other.
§Rates not calculated for fewer than 5 events. Rates not calculated in cases where zip code is unknown.
Source: Patient Discharge Database (CA OSHPD), County of San Diego, Health & Human Services Agency, Public Health Services, Epidemiology & Immunization Services Branch; SANDAG, Current Population Estimates, 10/2012.
Prepared by: County of San Diego, Health & Human Services Agency, Public Health Services, Community Health Statistics Unit, 2013.
API‡ Ages 45‐64
Impulse Control Disorder† Hospitaliza ons Among San Diego County Residents by Loca on of Residence, 2011 Detail
Other‡ Ages 0‐14 Ages 15‐24 Ages 25‐44Geography2011 Total
Gender Race/Ethnicity Age Group
Male Female White Black Hispanic Ages 65+
County of San Diego, Health & Human Services Agency, Public Health Services, Community Health Statisitcs Unit Page 77

No. Rate* No. Rate* No. Rate* No. Rate* No. Rate* No. Rate* No. Rate* No. Rate* No. Rate* No. Rate* No. Rate*
San Diego County (Actual Rate) 19 0.6 18 0.6
San Diego County (Age‐Adjusted Rate) 19 0.6 18 0.6
Central Region <5 § <5 §
Central San Diego <5 § <5 §
Mid‐City <5 § <5 §
Southeast San Diego <5 § <5 §
East Region <5 § 5 1.1
Alpine <5 § <5 §
El Cajon <5 § <5 §
Harbison Crest/El Cajon** <5 § <5 §
Jamul <5 § <5 §
La Mesa <5 § <5 §
Laguna‐Pine Valley <5 § <5 §
Lakeside <5 § <5 §
Lemon Grove <5 § <5 §
Mountain Empire <5 § <5 §
Santee <5 § <5 §
Spring Valley <5 § <5 §
North Central Region <5 § <5 §
Coastal <5 § <5 §
Del Mar‐Mira Mesa <5 § <5 §
Elliott‐Navajo <5 § <5 §
Kearny Mesa <5 § <5 §
Miramar <5 § <5 §
Peninsula <5 § <5 §
University <5 § <5 §
North Coastal Region <5 § <5 §
Carlsbad <5 § <5 §
Oceanside <5 § <5 §
Pendleton <5 § <5 §
San Dieguito <5 § <5 §
Vista <5 § <5 §
North Inland Region <5 § <5 §
Anza‐Borrego Springs <5 § <5 §
Escondido <5 § <5 §
Fallbrook <5 § <5 §
North San Diego <5 § <5 §
Palomar‐Julian <5 § <5 §
Pauma <5 § <5 §
Poway <5 § <5 §
Ramona <5 § <5 §
San Marcos <5 § <5 §
Valley Center <5 § <5 §
South Region <5 § <5 §
Chula Vista <5 § <5 §
Coronado <5 § <5 §
National City <5 § <5 §
South Bay <5 § <5 §
Sweetwater <5 § <5 §Unknown <5 ‐‐‐ <5 ‐‐‐*Rates per 100,000 population. County age‐adjusted rates per 100,000 2000 US standard population.**Harbison Crest/El Cajon is an aggregation of the Harbison Crest and El Cajon SRAs. Due to geographic limitations, the Harbison Crest SRA is not shown alone. See the Data Guide for more information.†Impulse control disorder Emergency Department Discharge refers to (principal diagnosis) ICD‐9 code 312.3.§Rates not calculated for fewer than 5 events. Rates not calculated in cases where zip code is unknown.Source: Emergency Department Discharge Database (CA OSHPD), County of San Diego, Health & Human Services Agency, Public Health Services, Emergency Medical Services; SANDAG, Current Population Estimates, 10/2012.Prepared by: County of San Diego, Health & Human Services Agency, Public Health Services, Community Health Statistics Unit, 2013.
Impulse Control Disorder† Emergency Department Discharges Among San Diego County Residents by Loca on of Residence
Geography2010 Total 2011 Total 2012 Total 2013 Total 2014 Total 2015 Total 2016 Total 2017 Total 2018 Total 2019 Total 2020 Total
County of San Diego, Health & Human Services Agency, Public Health Services, Community Health Statisitcs Unit Page 78

No. Rate* No. Rate* No. Rate* No. Rate* No. Rate* No. Rate* No. Rate* No. Rate* No. Rate* No. Rate* No. Rate* No. Rate* No. Rate*
San Diego County (Actual Rate) 19 0.6 12 0.8 7 0.5 12 0.8 <5 § <5 § <5 § <5 § 6 1.0 9 1.8 <5 § <5 § <5 §
San Diego County (Age‐Adjusted Rate) 19 0.6
Central Region <5 § <5 § <5 § <5 § <5 § <5 § <5 § <5 § <5 § <5 § <5 § <5 § <5 §
Central San Diego <5 § <5 § <5 § <5 § <5 § <5 § <5 § <5 § <5 § <5 § <5 § <5 § <5 §
Mid‐City <5 § <5 § <5 § <5 § <5 § <5 § <5 § <5 § <5 § <5 § <5 § <5 § <5 §
Southeast San Diego <5 § <5 § <5 § <5 § <5 § <5 § <5 § <5 § <5 § <5 § <5 § <5 § <5 §
East Region <5 § <5 § <5 § <5 § <5 § <5 § <5 § <5 § <5 § <5 § <5 § <5 § <5 §
Alpine <5 § <5 § <5 § <5 § <5 § <5 § <5 § <5 § <5 § <5 § <5 § <5 § <5 §
El Cajon <5 § <5 § <5 § <5 § <5 § <5 § <5 § <5 § <5 § <5 § <5 § <5 § <5 §
Harbison Crest/El Cajon** <5 § <5 § <5 § <5 § <5 § <5 § <5 § <5 § <5 § <5 § <5 § <5 § <5 §
Jamul <5 § <5 § <5 § <5 § <5 § <5 § <5 § <5 § <5 § <5 § <5 § <5 § <5 §
La Mesa <5 § <5 § <5 § <5 § <5 § <5 § <5 § <5 § <5 § <5 § <5 § <5 § <5 §
Laguna‐Pine Valley <5 § <5 § <5 § <5 § <5 § <5 § <5 § <5 § <5 § <5 § <5 § <5 § <5 §
Lakeside <5 § <5 § <5 § <5 § <5 § <5 § <5 § <5 § <5 § <5 § <5 § <5 § <5 §
Lemon Grove <5 § <5 § <5 § <5 § <5 § <5 § <5 § <5 § <5 § <5 § <5 § <5 § <5 §
Mountain Empire <5 § <5 § <5 § <5 § <5 § <5 § <5 § <5 § <5 § <5 § <5 § <5 § <5 §
Santee <5 § <5 § <5 § <5 § <5 § <5 § <5 § <5 § <5 § <5 § <5 § <5 § <5 §
Spring Valley <5 § <5 § <5 § <5 § <5 § <5 § <5 § <5 § <5 § <5 § <5 § <5 § <5 §
North Central Region <5 § <5 § <5 § <5 § <5 § <5 § <5 § <5 § <5 § <5 § <5 § <5 § <5 §
Coastal <5 § <5 § <5 § <5 § <5 § <5 § <5 § <5 § <5 § <5 § <5 § <5 § <5 §
Del Mar‐Mira Mesa <5 § <5 § <5 § <5 § <5 § <5 § <5 § <5 § <5 § <5 § <5 § <5 § <5 §
Elliott‐Navajo <5 § <5 § <5 § <5 § <5 § <5 § <5 § <5 § <5 § <5 § <5 § <5 § <5 §
Kearny Mesa <5 § <5 § <5 § <5 § <5 § <5 § <5 § <5 § <5 § <5 § <5 § <5 § <5 §
Miramar <5 § <5 § <5 § <5 § <5 § <5 § <5 § <5 § <5 § <5 § <5 § <5 § <5 §
Peninsula <5 § <5 § <5 § <5 § <5 § <5 § <5 § <5 § <5 § <5 § <5 § <5 § <5 §
University <5 § <5 § <5 § <5 § <5 § <5 § <5 § <5 § <5 § <5 § <5 § <5 § <5 §
North Coastal Region <5 § <5 § <5 § <5 § <5 § <5 § <5 § <5 § <5 § <5 § <5 § <5 § <5 §
Carlsbad <5 § <5 § <5 § <5 § <5 § <5 § <5 § <5 § <5 § <5 § <5 § <5 § <5 §
Oceanside <5 § <5 § <5 § <5 § <5 § <5 § <5 § <5 § <5 § <5 § <5 § <5 § <5 §
Pendleton <5 § <5 § <5 § <5 § <5 § <5 § <5 § <5 § <5 § <5 § <5 § <5 § <5 §
San Dieguito <5 § <5 § <5 § <5 § <5 § <5 § <5 § <5 § <5 § <5 § <5 § <5 § <5 §
Vista <5 § <5 § <5 § <5 § <5 § <5 § <5 § <5 § <5 § <5 § <5 § <5 § <5 §
North Inland Region <5 § <5 § <5 § <5 § <5 § <5 § <5 § <5 § <5 § <5 § <5 § <5 § <5 §
Anza‐Borrego Springs <5 § <5 § <5 § <5 § <5 § <5 § <5 § <5 § <5 § <5 § <5 § <5 § <5 §
Escondido <5 § <5 § <5 § <5 § <5 § <5 § <5 § <5 § <5 § <5 § <5 § <5 § <5 §
Fallbrook <5 § <5 § <5 § <5 § <5 § <5 § <5 § <5 § <5 § <5 § <5 § <5 § <5 §
North San Diego <5 § <5 § <5 § <5 § <5 § <5 § <5 § <5 § <5 § <5 § <5 § <5 § <5 §
Palomar‐Julian <5 § <5 § <5 § <5 § <5 § <5 § <5 § <5 § <5 § <5 § <5 § <5 § <5 §
Pauma <5 § <5 § <5 § <5 § <5 § <5 § <5 § <5 § <5 § <5 § <5 § <5 § <5 §
Poway <5 § <5 § <5 § <5 § <5 § <5 § <5 § <5 § <5 § <5 § <5 § <5 § <5 §
Ramona <5 § <5 § <5 § <5 § <5 § <5 § <5 § <5 § <5 § <5 § <5 § <5 § <5 §
San Marcos <5 § <5 § <5 § <5 § <5 § <5 § <5 § <5 § <5 § <5 § <5 § <5 § <5 §
Valley Center <5 § <5 § <5 § <5 § <5 § <5 § <5 § <5 § <5 § <5 § <5 § <5 § <5 §
South Region <5 § <5 § <5 § <5 § <5 § <5 § <5 § <5 § <5 § <5 § <5 § <5 § <5 §
Chula Vista <5 § <5 § <5 § <5 § <5 § <5 § <5 § <5 § <5 § <5 § <5 § <5 § <5 §
Coronado <5 § <5 § <5 § <5 § <5 § <5 § <5 § <5 § <5 § <5 § <5 § <5 § <5 §
National City <5 § <5 § <5 § <5 § <5 § <5 § <5 § <5 § <5 § <5 § <5 § <5 § <5 §
South Bay <5 § <5 § <5 § <5 § <5 § <5 § <5 § <5 § <5 § <5 § <5 § <5 § <5 §
Sweetwater <5 § <5 § <5 § <5 § <5 § <5 § <5 § <5 § <5 § <5 § <5 § <5 § <5 §Unknown <5 ‐‐‐ <5 ‐‐‐ <5 ‐‐‐ <5 ‐‐‐ <5 ‐‐‐ <5 ‐‐‐ <5 ‐‐‐ <5 ‐‐‐ <5 ‐‐‐ <5 ‐‐‐ <5 ‐‐‐ <5 ‐‐‐ <5 ‐‐‐*Rates per 100,000 population. County age‐adjusted rates per 100,000 2000 US standard population.**Harbison Crest/El Cajon is an aggregation of the Harbison Crest and El Cajon SRAs. Due to geographic limitations, the Harbison Crest SRA is not shown alone. See the Data Guide for more information.
***Numbers may not add up to totals due to unknown or missing details.
† Impulse control disorder Emergency Department Discharge refers to (principal diagnosis) ICD‐9 code 312.3.
‡API includes Asian, Pacific Islander, Na ve Hawaiian. Other includes 2 or more races, Na ve American/Alaska Na ve, American Indian, or other.
§ Rates not calculated for fewer than 5 events. Rates not calculated in cases where zip code is unknown.
Source: Emergency Department Discharge Database (CA OSHPD), County of San Diego, Health & Human Services Agency, Public Health Services, Emergency Medical Services; SANDAG, Current Population Estimates, 10/2012.
Prepared by: County of San Diego, Health & Human Services Agency, Public Health Services, Community Health Statistics Unit, 2013.
Ages 0‐14 Ages 15‐24 Ages 25‐44 Ages 45‐64 Ages 65+
Impulse Control Disorder† Emergency Department Discharges Among San Diego County Residents by Loca on of Residence, 2010 Detail
Geography2010 Total
Gender Race/Ethnicity Age Group
Male Female White Black Hispanic API‡ Other‡
County of San Diego, Health & Human Services Agency, Public Health Services, Community Health Statisitcs Unit Page 79
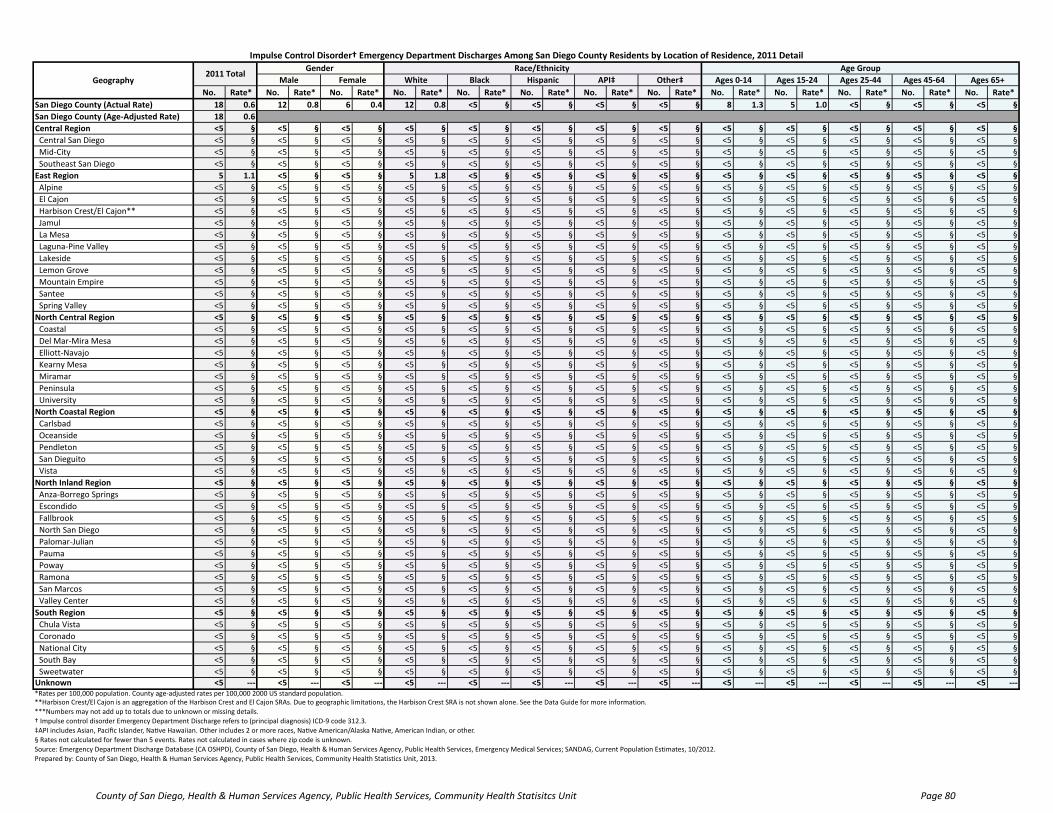
No. Rate* No. Rate* No. Rate* No. Rate* No. Rate* No. Rate* No. Rate* No. Rate* No. Rate* No. Rate* No. Rate* No. Rate* No. Rate*
San Diego County (Actual Rate) 18 0.6 12 0.8 6 0.4 12 0.8 <5 § <5 § <5 § <5 § 8 1.3 5 1.0 <5 § <5 § <5 §
San Diego County (Age‐Adjusted Rate) 18 0.6
Central Region <5 § <5 § <5 § <5 § <5 § <5 § <5 § <5 § <5 § <5 § <5 § <5 § <5 §
Central San Diego <5 § <5 § <5 § <5 § <5 § <5 § <5 § <5 § <5 § <5 § <5 § <5 § <5 §
Mid‐City <5 § <5 § <5 § <5 § <5 § <5 § <5 § <5 § <5 § <5 § <5 § <5 § <5 §
Southeast San Diego <5 § <5 § <5 § <5 § <5 § <5 § <5 § <5 § <5 § <5 § <5 § <5 § <5 §
East Region 5 1.1 <5 § <5 § 5 1.8 <5 § <5 § <5 § <5 § <5 § <5 § <5 § <5 § <5 §
Alpine <5 § <5 § <5 § <5 § <5 § <5 § <5 § <5 § <5 § <5 § <5 § <5 § <5 §
El Cajon <5 § <5 § <5 § <5 § <5 § <5 § <5 § <5 § <5 § <5 § <5 § <5 § <5 §
Harbison Crest/El Cajon** <5 § <5 § <5 § <5 § <5 § <5 § <5 § <5 § <5 § <5 § <5 § <5 § <5 §
Jamul <5 § <5 § <5 § <5 § <5 § <5 § <5 § <5 § <5 § <5 § <5 § <5 § <5 §
La Mesa <5 § <5 § <5 § <5 § <5 § <5 § <5 § <5 § <5 § <5 § <5 § <5 § <5 §
Laguna‐Pine Valley <5 § <5 § <5 § <5 § <5 § <5 § <5 § <5 § <5 § <5 § <5 § <5 § <5 §
Lakeside <5 § <5 § <5 § <5 § <5 § <5 § <5 § <5 § <5 § <5 § <5 § <5 § <5 §
Lemon Grove <5 § <5 § <5 § <5 § <5 § <5 § <5 § <5 § <5 § <5 § <5 § <5 § <5 §
Mountain Empire <5 § <5 § <5 § <5 § <5 § <5 § <5 § <5 § <5 § <5 § <5 § <5 § <5 §
Santee <5 § <5 § <5 § <5 § <5 § <5 § <5 § <5 § <5 § <5 § <5 § <5 § <5 §
Spring Valley <5 § <5 § <5 § <5 § <5 § <5 § <5 § <5 § <5 § <5 § <5 § <5 § <5 §
North Central Region <5 § <5 § <5 § <5 § <5 § <5 § <5 § <5 § <5 § <5 § <5 § <5 § <5 §
Coastal <5 § <5 § <5 § <5 § <5 § <5 § <5 § <5 § <5 § <5 § <5 § <5 § <5 §
Del Mar‐Mira Mesa <5 § <5 § <5 § <5 § <5 § <5 § <5 § <5 § <5 § <5 § <5 § <5 § <5 §
Elliott‐Navajo <5 § <5 § <5 § <5 § <5 § <5 § <5 § <5 § <5 § <5 § <5 § <5 § <5 §
Kearny Mesa <5 § <5 § <5 § <5 § <5 § <5 § <5 § <5 § <5 § <5 § <5 § <5 § <5 §
Miramar <5 § <5 § <5 § <5 § <5 § <5 § <5 § <5 § <5 § <5 § <5 § <5 § <5 §
Peninsula <5 § <5 § <5 § <5 § <5 § <5 § <5 § <5 § <5 § <5 § <5 § <5 § <5 §
University <5 § <5 § <5 § <5 § <5 § <5 § <5 § <5 § <5 § <5 § <5 § <5 § <5 §
North Coastal Region <5 § <5 § <5 § <5 § <5 § <5 § <5 § <5 § <5 § <5 § <5 § <5 § <5 §
Carlsbad <5 § <5 § <5 § <5 § <5 § <5 § <5 § <5 § <5 § <5 § <5 § <5 § <5 §
Oceanside <5 § <5 § <5 § <5 § <5 § <5 § <5 § <5 § <5 § <5 § <5 § <5 § <5 §
Pendleton <5 § <5 § <5 § <5 § <5 § <5 § <5 § <5 § <5 § <5 § <5 § <5 § <5 §
San Dieguito <5 § <5 § <5 § <5 § <5 § <5 § <5 § <5 § <5 § <5 § <5 § <5 § <5 §
Vista <5 § <5 § <5 § <5 § <5 § <5 § <5 § <5 § <5 § <5 § <5 § <5 § <5 §
North Inland Region <5 § <5 § <5 § <5 § <5 § <5 § <5 § <5 § <5 § <5 § <5 § <5 § <5 §
Anza‐Borrego Springs <5 § <5 § <5 § <5 § <5 § <5 § <5 § <5 § <5 § <5 § <5 § <5 § <5 §
Escondido <5 § <5 § <5 § <5 § <5 § <5 § <5 § <5 § <5 § <5 § <5 § <5 § <5 §
Fallbrook <5 § <5 § <5 § <5 § <5 § <5 § <5 § <5 § <5 § <5 § <5 § <5 § <5 §
North San Diego <5 § <5 § <5 § <5 § <5 § <5 § <5 § <5 § <5 § <5 § <5 § <5 § <5 §
Palomar‐Julian <5 § <5 § <5 § <5 § <5 § <5 § <5 § <5 § <5 § <5 § <5 § <5 § <5 §
Pauma <5 § <5 § <5 § <5 § <5 § <5 § <5 § <5 § <5 § <5 § <5 § <5 § <5 §
Poway <5 § <5 § <5 § <5 § <5 § <5 § <5 § <5 § <5 § <5 § <5 § <5 § <5 §
Ramona <5 § <5 § <5 § <5 § <5 § <5 § <5 § <5 § <5 § <5 § <5 § <5 § <5 §
San Marcos <5 § <5 § <5 § <5 § <5 § <5 § <5 § <5 § <5 § <5 § <5 § <5 § <5 §
Valley Center <5 § <5 § <5 § <5 § <5 § <5 § <5 § <5 § <5 § <5 § <5 § <5 § <5 §
South Region <5 § <5 § <5 § <5 § <5 § <5 § <5 § <5 § <5 § <5 § <5 § <5 § <5 §
Chula Vista <5 § <5 § <5 § <5 § <5 § <5 § <5 § <5 § <5 § <5 § <5 § <5 § <5 §
Coronado <5 § <5 § <5 § <5 § <5 § <5 § <5 § <5 § <5 § <5 § <5 § <5 § <5 §
National City <5 § <5 § <5 § <5 § <5 § <5 § <5 § <5 § <5 § <5 § <5 § <5 § <5 §
South Bay <5 § <5 § <5 § <5 § <5 § <5 § <5 § <5 § <5 § <5 § <5 § <5 § <5 §
Sweetwater <5 § <5 § <5 § <5 § <5 § <5 § <5 § <5 § <5 § <5 § <5 § <5 § <5 §Unknown <5 ‐‐‐ <5 ‐‐‐ <5 ‐‐‐ <5 ‐‐‐ <5 ‐‐‐ <5 ‐‐‐ <5 ‐‐‐ <5 ‐‐‐ <5 ‐‐‐ <5 ‐‐‐ <5 ‐‐‐ <5 ‐‐‐ <5 ‐‐‐*Rates per 100,000 population. County age‐adjusted rates per 100,000 2000 US standard population.**Harbison Crest/El Cajon is an aggregation of the Harbison Crest and El Cajon SRAs. Due to geographic limitations, the Harbison Crest SRA is not shown alone. See the Data Guide for more information.
***Numbers may not add up to totals due to unknown or missing details.
† Impulse control disorder Emergency Department Discharge refers to (principal diagnosis) ICD‐9 code 312.3.
‡API includes Asian, Pacific Islander, Na ve Hawaiian. Other includes 2 or more races, Na ve American/Alaska Na ve, American Indian, or other.
§ Rates not calculated for fewer than 5 events. Rates not calculated in cases where zip code is unknown.
Source: Emergency Department Discharge Database (CA OSHPD), County of San Diego, Health & Human Services Agency, Public Health Services, Emergency Medical Services; SANDAG, Current Population Estimates, 10/2012.
Prepared by: County of San Diego, Health & Human Services Agency, Public Health Services, Community Health Statistics Unit, 2013.
Gender Race/Ethnicity Age Group
Male Female White Black Hispanic Ages 65+API‡ Other‡ Ages 0‐14 Ages 15‐24 Ages 25‐44 Ages 45‐64Geography2011 Total
Impulse Control Disorder† Emergency Department Discharges Among San Diego County Residents by Loca on of Residence, 2011 Detail
County of San Diego, Health & Human Services Agency, Public Health Services, Community Health Statisitcs Unit Page 80

Mood Disorders
County of San Diego, Health & Human Services Agency, Public Health Services, Community Health Statisitcs Unit Page 81

No. Rate* No. Rate* No. Rate* No. Rate* No. Rate* No. Rate* No. Rate* No. Rate* No. Rate* No. Rate* No. Rate*
San Diego County (Actual Rate) 9,849 318.2 10,307 330.8
San Diego County (Age‐Adjusted Rate) 9,849 310.7 10,307 322.5
Central Region 2,157 445.3 2,190 451.0
Central San Diego 1,082 653.5 1,049 632.1
Mid‐City 610 374.1 671 411.2
Southeast San Diego 465 298.4 470 300.5
East Region 2,035 439.4 2,025 433.9
Alpine 64 425.7 52 343.0
El Cajon 438 351.7 433 345.7
Harbison Crest/El Cajon** 758 544.7 813 580.6
Jamul 48 253.2 43 244.6
La Mesa 340 575.4 339 565.1
Laguna‐Pine Valley 7 132.6 5 88.6
Lakeside 181 323.1 180 319.4
Lemon Grove 117 392.5 115 384.0
Mountain Empire 16 210.8 35 411.5
Santee 236 461.4 196 379.2
Spring Valley 268 330.9 247 302.2
North Central Region 1,586 262.6 1,735 284.5
Coastal 204 270.6 238 315.0
Del Mar‐Mira Mesa 286 181.5 328 207.0
Elliott‐Navajo 259 290.7 281 314.2
Kearny Mesa 573 378.9 608 400.8
Miramar <5 § <5 §
Peninsula 168 266.9 165 261.7
University 94 149.9 113 170.0
North Coastal Region 1,374 271.6 1,494 293.0
Carlsbad 257 224.0 322 277.9
Oceanside 556 348.1 594 371.0
Pendleton 6 16.0 6 15.9
San Dieguito 252 269.4 240 252.9
Vista 303 301.7 332 327.6
North Inland Region 1,534 269.4 1,627 283.2
Anza‐Borrego Springs 20 450.5 22 471.4
Escondido 484 296.9 546 332.5
Fallbrook 134 283.3 130 271.6
North San Diego 250 234.6 349 324.3
Palomar‐Julian 9 143.6 10 155.6
Pauma <5 § 15 193.0
Poway 221 256.1 217 249.7
Ramona 128 367.1 110 310.4
San Marcos 224 249.0 190 210.7
Valley Center 60 257.2 38 162.0
South Region 1,163 248.2 1,236 263.3
Chula Vista 482 418.3 475 409.8
Coronado 37 149.8 42 180.0
National City 152 260.6 188 321.4
South Bay 297 220.1 328 242.7
Sweetwater 195 144.1 203 148.6Unknown <5 ‐‐‐ <5 ‐‐‐*Rates per 100,000 population. County age‐adjusted rates per 100,000 2000 US standard population.**Harbison Crest/El Cajon is an aggregation of the Harbison Crest and El Cajon SRAs. Due to geographic limitations, the Harbison Crest SRA is not shown alone. See the Data Guide for more information.†Mood disorder hospitaliza on refers to (principal diagnosis) ICD‐9 codes 293.83, 296, 300.4, 311.§Rates not calculated for fewer than 5 events. Rates not calculated in cases where zip code is unknown.Source: Patient Discharge Database (CA OSHPD), County of San Diego, Health & Human Services Agency, Public Health Services, Epidemiology & Immunization Services Branch; SANDAG, Current Population Estimates, 10/2012.Prepared by: County of San Diego, Health & Human Services Agency, Public Health Services, Community Health Statistics Unit, 2013.
Mood Disorder† Hospitaliza ons Among San Diego County Residents by Location of Residence
Geography2010 Total 2011 Total 2012 Total 2013 Total 2014 Total 2015 Total 2016 Total 2017 Total 2018 Total 2019 Total 2020 Total
County of San Diego, Health & Human Services Agency, Public Health Services, Community Health Statisitcs Unit Page 82

No. Rate* No. Rate* No. Rate* No. Rate* No. Rate* No. Rate* No. Rate* No. Rate* No. Rate* No. Rate* No. Rate* No. Rate* No. Rate*
San Diego County (Actual Rate) 9,849 318.2 4,200 270.3 5,649 366.4 6,864 457.6 716 488.4 1,544 155.7 309 90.5 213 184.0 732 122.8 2,228 449.3 2,876 322.6 3,193 419.9 820 233.3
San Diego County (Age‐Adjusted Rate) 9,849 310.7
Central Region 2,157 445.3 1,069 431.6 1,088 459.6 1,266 881.4 329 580.5 419 205.0 65 101.8 49 309.0 102 113.6 324 389.7 759 470.1 833 780.6 139 321.2
Central San Diego 1,082 653.5 597 659.5 485 646.2 753 915.0 113 984.1 158 274.2 21 247.1 26 458.0 26 134.3 108 469.8 392 562.2 473 1,246.4 83 534.0
Mid‐City 610 374.1 264 325.1 346 422.8 353 760.0 92 476.2 127 185.5 20 84.9 12 228.4 42 124.2 103 309.5 212 420.6 216 659.2 37 289.4
Southeast San Diego 465 298.4 208 273.8 257 321.9 160 1,073.9 124 479.2 134 171.2 24 75.4 11 223.3 34 92.7 113 420.6 155 375.1 144 400.0 19 127.0
East Region 2,035 439.4 826 362.2 1,209 514.3 1,574 563.6 132 496.7 231 199.8 27 130.6 30 142.9 131 145.6 495 722.4 532 439.0 701 550.0 176 314.6
Alpine 64 425.7 24 321.8 40 528.0 54 457.2 <5 § 6 270.9 <5 § <5 § <5 § 23 1,165.7 14 427.7 22 451.7 <5 §
El Cajon 438 351.7 188 308.6 250 393.1 327 443.9 35 500.1 54 162.9 7 157.6 7 111.5 28 109.9 102 518.8 95 287.8 166 523.7 47 320.4
Harbison Crest/El Cajon** 758 544.7 302 442.6 456 642.8 579 678.8 45 631.8 95 269.5 11 233.9 11 161.6 50 180.1 168 780.5 170 474.3 284 768.9 86 502.7
Jamul 48 253.2 19 174.3 29 359.8 34 324.3 8 875.3 5 86.4 <5 § <5 § <5 § 18 567.1 8 166.8 15 250.5 <5 §
La Mesa 340 575.4 159 564.2 181 585.6 268 723.5 25 603.6 32 270.0 <5 § <5 § 19 197.3 73 865.5 106 620.7 115 748.7 27 314.1
Laguna‐Pine Valley 7 132.6 5 178.6 <5 § 5 126.9 <5 § <5 § <5 § <5 § <5 § <5 § <5 § <5 § <5 §
Lakeside 181 323.1 59 213.0 122 430.9 150 367.2 <5 § 18 173.7 <5 § 6 228.3 8 69.7 37 462.5 55 379.8 68 424.3 13 215.5
Lemon Grove 117 392.5 52 358.6 65 424.5 83 876.7 14 318.3 15 119.9 <5 § <5 § 8 127.6 36 788.8 21 261.7 39 510.3 13 392.5
Mountain Empire 16 210.8 <5 § 12 342.4 9 217.4 <5 § <5 § <5 § <5 § <5 § <5 § <5 § 9 395.6 <5 §
Santee 236 461.4 92 371.5 144 545.8 200 526.6 <5 § 20 245.9 6 288.2 <5 § 20 203.8 68 971.7 63 454.2 71 481.3 14 244.9
Spring Valley 268 330.9 110 279.1 158 380.0 192 501.9 30 387.2 36 138.2 <5 § <5 § 19 112.6 67 554.4 91 432.1 75 347.8 16 170.0
North Central Region 1,586 262.6 660 216.0 926 310.3 1,190 325.9 79 421.0 154 179.8 77 71.1 47 180.0 153 161.8 374 364.6 487 253.7 420 293.8 152 211.5
Coastal 204 270.6 80 206.0 124 339.4 161 264.7 5 686.8 15 186.4 8 242.6 9 364.1 14 182.0 34 305.1 76 274.4 54 328.3 26 209.7
Del Mar‐Mira Mesa 286 181.5 111 140.4 175 222.9 214 281.7 15 405.2 16 101.3 26 47.3 10 139.2 33 102.1 78 404.2 87 183.0 65 145.1 23 168.9
Elliott‐Navajo 259 290.7 129 298.4 130 283.4 199 331.2 11 273.6 37 285.2 <5 § 5 115.4 34 199.2 62 558.9 65 258.2 84 373.5 14 105.4
Kearny Mesa 573 378.9 211 280.0 362 477.2 400 474.3 40 595.6 69 206.1 29 146.3 16 234.0 57 245.3 142 602.8 165 331.9 145 407.0 64 335.7
Miramar <5 § <5 § <5 § <5 § <5 § <5 § <5 § <5 § <5 § <5 § <5 § <5 § <5 §
Peninsula 168 266.9 84 245.7 84 292.1 142 296.1 5 238.2 12 146.4 <5 § 5 202.5 12 152.9 37 296.0 69 327.9 37 258.5 13 179.9
University 94 149.9 45 144.8 49 154.8 72 218.7 <5 § 5 81.5 10 49.7 <5 § <5 § 20 91.2 24 121.5 35 380.9 12 190.9
North Coastal Region 1,374 271.6 560 217.2 814 328.2 1,068 357.0 49 337.4 161 111.8 27 89.9 26 143.0 104 102.9 355 424.0 370 271.0 411 328.9 134 224.8
Carlsbad 257 224.0 114 204.4 143 242.6 216 256.0 5 315.7 19 114.0 6 74.0 <5 § 20 91.1 58 474.6 71 235.9 80 245.3 28 157.2
Oceanside 556 348.1 221 278.8 335 416.3 410 552.2 30 432.5 71 118.5 11 89.8 18 281.8 52 161.8 137 540.3 156 349.3 168 429.4 43 233.2
Pendleton 6 16.0 <5 § <5 § <5 § <5 § <5 § <5 § <5 § <5 § 5 25.0 <5 § <5 § <5 §
San Dieguito 252 269.4 91 197.8 161 338.8 225 306.8 <5 § 11 87.7 5 118.4 <5 § 12 70.9 58 618.3 63 255.4 81 276.1 38 287.3
Vista 303 301.7 130 256.4 173 347.9 214 488.0 13 480.2 59 126.4 5 120.6 <5 § 20 93.9 97 578.8 79 275.2 82 348.0 25 247.7
North Inland Region 1,534 269.4 628 223.9 906 313.5 1,216 386.3 52 502.4 151 92.1 44 74.4 43 202.9 148 123.8 378 490.3 415 279.6 448 294.1 145 201.0
Anza‐Borrego Springs 20 450.5 11 489.8 9 410.2 16 570.8 <5 § <5 196.3 <5 § <5 § <5 § <5 § 5 817.0 9 620.7 <5 §
Escondido 484 296.9 190 234.9 294 357.9 370 520.4 23 683.5 69 93.1 8 78.3 7 165.3 40 110.5 102 397.9 144 318.1 152 395.9 46 262.5
Fallbrook 134 283.3 68 288.8 66 277.8 112 410.2 <5 § 14 81.2 <5 § <5 § 14 158.5 41 575.5 21 210.3 34 258.0 24 293.3
North San Diego 250 234.6 133 258.3 117 212.6 196 312.8 6 235.6 10 93.9 19 74.1 11 218.6 28 124.8 70 611.6 61 197.8 67 231.4 24 186.3
Palomar‐Julian 9 143.6 <5 § 5 157.0 8 173.2 <5 § <5 § <5 § <5 § <5 § <5 § <5 § <5 § <5 §
Pauma <5 § <5 § <5 § <5 § <5 § <5 § <5 § <5 § <5 § <5 § <5 § <5 § <5 §
Poway 221 256.1 80 189.7 141 319.4 179 308.8 7 463.3 20 193.7 5 38.1 6 177.8 20 112.9 69 682.6 48 230.7 60 223.3 24 221.8
Ramona 128 367.1 50 285.2 78 449.9 111 446.9 <5 § 7 85.3 <5 § <5 § 13 185.6 34 658.0 47 591.9 30 272.3 <5 §
San Marcos 224 249.0 69 156.8 155 337.2 171 376.3 12 681.0 24 73.6 5 68.6 8 278.7 23 114.8 48 382.6 57 225.7 78 382.8 18 153.0
Valley Center 60 257.2 20 170.8 40 344.2 49 327.5 <5 § <5 § <5 § 5 319.5 6 145.5 12 388.2 27 581.5 12 156.0 <5 §
South Region 1,163 248.2 457 195.2 706 301.2 550 560.5 75 380.6 428 154.1 69 116.0 18 134.1 94 92.9 302 373.8 313 237.3 380 358.4 74 152.4
Chula Vista 482 418.3 201 361.9 281 470.7 249 1165.6 19 480.9 184 226.2 16 265.6 8 312.3 44 179.7 126 670.5 108 348.7 166 627.3 38 261.8
Coronado 37 149.8 14 96.3 23 226.5 32 178.6 <5 § <5 § <5 § <5 § 5 159.7 6 92.7 14 212.4 11 219.1 <5 §
National City 152 260.6 66 220.0 86 303.7 69 1015.8 10 390.8 55 148.1 15 142.3 <5 § 8 65.6 32 261.2 31 197.1 68 567.1 13 210.9
South Bay 297 220.1 117 171.9 180 269.2 119 579.8 23 424.0 128 138.5 18 137.8 <5 § 20 67.6 64 267.8 107 282.1 91 297.4 15 116.2
Sweetwater 195 144.1 59 89.5 136 196.0 81 256.8 23 368.4 60 94.5 20 69.2 6 116.0 17 53.4 74 382.0 53 130.3 44 137.8 7 60.9Unknown <5 ‐‐‐ <5 ‐‐‐ <5 ‐‐‐ <5 ‐‐‐ <5 ‐‐‐ <5 ‐‐‐ <5 ‐‐‐ <5 ‐‐‐ <5 ‐‐‐ <5 ‐‐‐ <5 ‐‐‐ <5 ‐‐‐ <5 ‐‐‐* Rates per 100,000 population. County age‐adjusted rates per 100,000 2000 US standard population.**Harbison Crest/El Cajon is an aggregation of the Harbison Crest and El Cajon SRAs. Due to geographic limitations, the Harbison Crest SRA is not shown alone. See the Data Guide for more information.
***Numbers may not add up to totals due to unknown or missing details.
†Mood disorder hospitaliza on refers to (principal diagnosis) ICD‐9 codes 293.83, 296, 300.4, 311.
‡API includes Asian, Pacific Islander, Na ve Hawaiian. Other includes 2 or more races, Na ve American/Alaska Na ve, American Indian, or other.
§Rates not calculated for fewer than 5 events. Rates not calculated in cases where zip code is unknown.
Source: Patient Discharge Database (CA OSHPD), County of San Diego, Health & Human Services Agency, Public Health Services, Epidemiology & Immunization Services Branch; SANDAG, Current Population Estimates, 10/2012.
Prepared by: County of San Diego, Health & Human Services Agency, Public Health Services, Community Health Statistics Unit, 2013.
Ages 0‐14 Ages 15‐24 Ages 25‐44 Ages 45‐64 Ages 65+
Mood Disorder† Hospitaliza ons Among San Diego County Residents by Loca on of Residence, 2010 Detail
Geography2010 Total
Gender Race/Ethnicity Age Group
Male Female White Black Hispanic API‡ Other‡
County of San Diego, Health & Human Services Agency, Public Health Services, Community Health Statisitcs Unit Page 83

No. Rate* No. Rate* No. Rate* No. Rate* No. Rate* No. Rate* No. Rate* No. Rate* No. Rate* No. Rate* No. Rate* No. Rate* No. Rate*
San Diego County (Actual Rate) 10,307 330.8 4,361 279.1 5,946 382.9 6,964 465.6 702 491.2 1,657 163.9 339 97.2 370 314.1 802 135.1 2,457 492.8 3,086 346.4 3,141 407.4 821 226.9
San Diego County (Age‐Adjusted Rate) 10,307 322.5
Central Region 2,190 451.0 1,112 448.2 1,078 453.9 1,294 909.3 293 534.1 418 201.1 79 122.4 51 318.2 97 107.7 373 464.5 762 468.7 816 751.9 142 322.3
Central San Diego 1,049 632.1 610 673.4 439 582.4 729 890.7 106 953.8 133 226.8 25 290.0 26 453.4 16 79.6 135 651.0 391 555.3 437 1,130.1 70 436.2
Mid‐City 671 411.2 292 359.3 379 462.6 393 859.1 81 430.9 128 184.0 32 134.5 19 358.3 34 100.6 125 386.5 234 461.8 236 704.9 42 325.4
Southeast San Diego 470 300.5 210 275.4 260 324.3 172 1,168.7 106 424.9 157 197.2 22 68.5 6 120.2 47 129.8 113 415.2 137 330.1 143 393.1 30 198.6
East Region 2,025 433.9 787 342.5 1,238 522.7 1,458 522.5 134 514.5 255 214.4 20 94.3 94 438.6 117 131.2 454 654.3 635 525.2 632 491.0 187 319.7
Alpine 52 343.0 18 238.9 34 445.9 45 382.6 <5 § <5 § <5 § <5 § <5 § 19 896.2 13 409.2 12 244.2 5 224.6
El Cajon 433 345.7 195 317.9 238 372.4 302 410.8 37 539.9 49 144.2 <5 § 30 471.1 27 106.7 98 497.7 128 386.6 124 387.1 56 370.2
Harbison Crest/El Cajon** 813 580.6 323 470.1 490 687.0 584 686.0 60 859.0 91 251.4 6 124.5 45 652.2 42 152.6 183 845.7 255 710.6 235 630.6 98 553.3
Jamul 43 244.6 17 168.3 26 347.9 29 303.4 <5 § 9 164.0 <5 § <5 § <5 § 14 464.0 13 300.2 11 197.2 <5 §
La Mesa 339 565.1 132 461.1 207 660.1 244 654.3 20 486.7 41 332.5 <5 § 23 861.7 22 224.4 58 710.0 113 646.9 120 764.9 26 293.6
Laguna‐Pine Valley 5 88.6 <5 § 5 189.5 <5 § <5 § <5 § <5 § <5 § <5 § <5 § <5 § <5 § <5 §
Lakeside 180 319.4 64 229.6 116 407.2 143 349.9 <5 § 16 150.6 <5 § 7 262.9 15 132.4 32 396.9 53 368.3 72 444.1 8 125.6
Lemon Grove 115 384.0 46 315.8 69 448.5 66 705.7 13 304.2 26 203.0 <5 § <5 § 5 80.9 34 728.1 37 463.8 27 350.4 12 351.1
Mountain Empire 35 411.5 14 305.9 21 534.4 25 554.2 <5 § 5 161.8 <5 § <5 § 5 302.1 9 737.7 8 417.1 13 522.9 <5 §
Santee 196 379.2 88 351.7 108 405.0 162 424.4 <5 § 14 166.8 <5 § 9 422.3 8 82.5 57 786.7 59 430.6 59 393.3 13 214.9
Spring Valley 247 302.2 85 213.8 162 386.0 156 407.8 32 422.5 49 183.1 <5 § <5 § 13 77.7 47 379.6 84 399.7 79 363.0 24 243.7
North Central Region 1,735 284.5 678 219.8 1,057 350.8 1,291 353.5 80 427.9 156 177.8 96 86.1 65 244.3 182 192.8 396 382.4 545 281.4 441 305.2 171 232.1
Coastal 238 315.0 92 236.3 146 398.8 195 321.6 <5 § 13 157.7 13 381.7 7 277.9 7 91.9 48 434.9 78 279.8 58 353.4 47 372.6
Del Mar‐Mira Mesa 328 207.0 141 177.6 187 236.5 217 286.4 20 556.2 25 155.2 42 75.3 14 194.0 55 173.1 92 460.2 88 188.8 77 168.4 16 111.3
Elliott‐Navajo 281 314.2 116 267.3 165 358.4 211 352.3 17 427.2 35 265.3 <5 § 12 271.2 50 294.8 66 609.2 76 299.5 73 323.1 16 117.1
Kearny Mesa 608 400.8 214 283.2 394 517.5 439 523.0 34 515.7 67 196.6 25 124.0 22 317.9 58 246.8 127 577.6 186 367.0 179 495.3 58 299.2
Miramar <5 § <5 § <5 § <5 § <5 § <5 § <5 § <5 § <5 § <5 § <5 § <5 § <5 §
Peninsula 165 261.7 66 192.0 99 345.1 148 310.2 <5 § 11 131.1 <5 § <5 § 7 88.3 34 275.8 75 351.6 35 245.9 14 193.3
University 113 170.0 48 145.8 65 193.7 79 231.0 <5 § 5 74.6 13 60.0 7 255.6 5 85.7 28 115.4 42 203.0 18 193.6 20 312.9
North Coastal Region 1,494 293.0 628 241.8 866 346.2 1,151 384.9 58 405.0 169 115.1 30 96.9 60 320.0 139 138.3 417 494.2 387 283.5 447 352.5 104 168.7
Carlsbad 322 277.9 108 191.8 214 359.4 279 329.5 5 317.7 16 93.2 11 131.6 8 196.7 34 155.9 103 802.8 84 283.7 72 217.3 29 157.0
Oceanside 594 371.0 268 337.3 326 404.3 430 583.5 37 553.7 83 136.5 10 80.6 25 383.0 58 177.8 142 573.6 155 346.9 199 506.2 40 213.6
Pendleton 6 15.9 <5 § <5 § <5 § <5 § <5 § <5 § <5 § <5 § 6 29.6 <5 § <5 § <5 §
San Dieguito 240 252.9 110 235.7 130 269.5 210 283.7 <5 § 13 100.1 <5 § 6 204.3 21 125.7 77 768.3 63 257.6 60 201.7 19 136.1
Vista 332 327.6 138 270.0 194 386.3 228 522.6 14 532.3 57 119.4 8 189.3 20 648.3 26 121.4 89 539.7 85 293.8 116 481.6 16 153.7
North Inland Region 1,627 283.2 629 222.2 998 342.3 1,206 384.2 55 540.0 201 119.4 56 92.5 73 338.6 146 123.0 444 556.8 438 297.9 478 309.4 121 162.1
Anza‐Borrego Springs 22 471.4 14 595.7 8 345.3 20 708.7 <5 § <5 § <5 § <5 § <5 § <5 § 7 1104.1 7 480.1 <5 §
Escondido 546 332.5 214 262.6 332 401.3 368 521.7 31 941.4 107 141.3 10 96.4 21 487.9 43 119.1 127 490.4 158 349.1 187 477.9 31 173.9
Fallbrook 130 271.6 48 201.2 82 341.4 99 363.5 <5 § 20 112.3 <5 § <5 § 15 169.5 33 455.4 35 346.1 33 251.1 14 164.3
North San Diego 349 324.3 131 251.8 218 392.2 267 425.1 <5 § 27 246.8 23 87.5 18 352.6 43 192.3 124 1,033.3 85 279.3 68 230.4 29 217.9
Palomar‐Julian 10 155.6 6 189.3 <5 § 8 172.9 <5 § <5 § <5 § <5 § <5 § <5 § <5 § <5 § <5 §
Pauma 15 193.0 8 199.9 7 185.7 8 256.1 <5 § <5 § <5 § 5 372.6 <5 § 8 736.6 <5 § 6 293.1 <5 §
Poway 217 249.7 79 186.1 138 310.5 180 310.6 8 540.5 6 56.5 12 89.3 7 205.3 13 75.4 74 675.6 43 213.7 71 259.8 16 142.1
Ramona 110 310.4 40 224.7 70 396.9 86 343.7 <5 § 9 105.6 <5 § 6 591.1 6 87.8 29 528.7 39 493.4 33 294.8 <5 §
San Marcos 190 210.7 68 154.1 122 264.8 143 318.2 9 526.3 23 69.2 5 67.5 5 173.5 20 100.6 32 250.3 58 232.9 57 275.3 23 193.2
Valley Center 38 162.0 21 178.5 17 145.4 27 182.1 <5 § 6 100.1 <5 § 5 315.1 <5 § 12 368.4 11 244.0 12 156.8 <5 §
South Region 1,236 263.3 527 225.5 709 300.8 564 586.7 82 436.2 458 162.9 58 96.7 27 201.0 121 120.2 373 459.4 319 244.9 327 302.9 96 194.3
Chula Vista 475 409.8 214 383.3 261 434.4 218 1041.5 31 809.6 171 207.2 21 346.4 13 507.0 50 204.9 141 741.8 122 394.8 114 423.2 48 327.2
Coronado 42 180.0 15 112.2 27 271.1 32 187.4 <5 § <5 § <5 § <5 § <5 § 11 193.5 11 183.1 9 179.6 7 197.7
National City 188 321.4 69 229.9 119 417.8 79 1198.6 12 484.5 88 234.3 7 66.2 <5 § 17 139.6 45 367.7 45 284.8 65 533.1 16 263.2
South Bay 328 242.7 143 210.1 185 275.8 130 646.3 15 289.0 149 159.7 15 114.8 6 172.6 28 94.5 93 391.3 99 263.2 91 294.4 17 128.8
Sweetwater 203 148.6 86 129.4 117 166.9 105 334.1 22 363.9 49 75.9 13 44.3 6 114.7 22 70.1 83 405.0 42 105.2 48 145.9 8 67.1Unknown <5 ‐‐‐ <5 ‐‐‐ <5 ‐‐‐ <5 ‐‐‐ <5 ‐‐‐ <5 ‐‐‐ <5 ‐‐‐ <5 ‐‐‐ <5 ‐‐‐ <5 ‐‐‐ <5 ‐‐‐ <5 ‐‐‐ <5 ‐‐‐*Rates per 100,000 population. County age‐adjusted rates per 100,000 2000 US standard population.**Harbison Crest/El Cajon is an aggregation of the Harbison Crest and El Cajon SRAs. Due to geographic limitations, the Harbison Crest SRA is not shown alone. See the Data Guide for more information.
***Numbers may not add up to totals due to unknown or missing details.
†Mood disorder hospitaliza on refers to (principal diagnosis) ICD‐9 codes 293.83, 296, 300.4, 311.
‡API includes Asian, Pacific Islander, Na ve Hawaiian. Other includes 2 or more races, Na ve American/Alaska Na ve, American Indian, or other.
§Rates not calculated for fewer than 5 events. Rates not calculated in cases where zip code is unknown.
Source: Patient Discharge Database (CA OSHPD), County of San Diego, Health & Human Services Agency, Public Health Services, Epidemiology & Immunization Services Branch; SANDAG, Current Population Estimates, 10/2012.
Prepared by: County of San Diego, Health & Human Services Agency, Public Health Services, Community Health Statistics Unit, 2013.
Gender Race/Ethnicity Age Group
Male Female White Black Hispanic Ages 65+API‡ Other‡ Ages 0‐14 Ages 15‐24 Ages 25‐44 Ages 45‐64Geography2011 Total
Mood Disorder† Hospitaliza ons Among San Diego County Residents by Loca on of Residence, 2011 Detail
County of San Diego, Health & Human Services Agency, Public Health Services, Community Health Statisitcs Unit Page 84
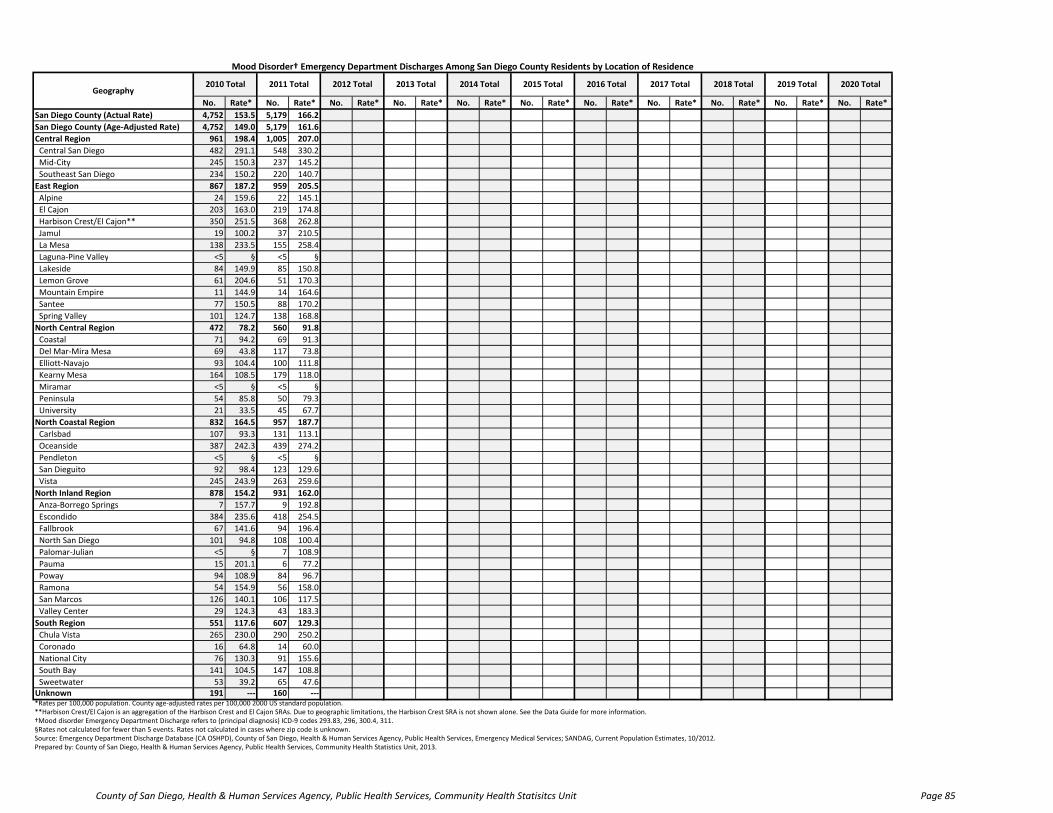
No. Rate* No. Rate* No. Rate* No. Rate* No. Rate* No. Rate* No. Rate* No. Rate* No. Rate* No. Rate* No. Rate*
San Diego County (Actual Rate) 4,752 153.5 5,179 166.2
San Diego County (Age‐Adjusted Rate) 4,752 149.0 5,179 161.6
Central Region 961 198.4 1,005 207.0
Central San Diego 482 291.1 548 330.2
Mid‐City 245 150.3 237 145.2
Southeast San Diego 234 150.2 220 140.7
East Region 867 187.2 959 205.5
Alpine 24 159.6 22 145.1
El Cajon 203 163.0 219 174.8
Harbison Crest/El Cajon** 350 251.5 368 262.8
Jamul 19 100.2 37 210.5
La Mesa 138 233.5 155 258.4
Laguna‐Pine Valley <5 § <5 §
Lakeside 84 149.9 85 150.8
Lemon Grove 61 204.6 51 170.3
Mountain Empire 11 144.9 14 164.6
Santee 77 150.5 88 170.2
Spring Valley 101 124.7 138 168.8
North Central Region 472 78.2 560 91.8
Coastal 71 94.2 69 91.3
Del Mar‐Mira Mesa 69 43.8 117 73.8
Elliott‐Navajo 93 104.4 100 111.8
Kearny Mesa 164 108.5 179 118.0
Miramar <5 § <5 §
Peninsula 54 85.8 50 79.3
University 21 33.5 45 67.7
North Coastal Region 832 164.5 957 187.7
Carlsbad 107 93.3 131 113.1
Oceanside 387 242.3 439 274.2
Pendleton <5 § <5 §
San Dieguito 92 98.4 123 129.6
Vista 245 243.9 263 259.6
North Inland Region 878 154.2 931 162.0
Anza‐Borrego Springs 7 157.7 9 192.8
Escondido 384 235.6 418 254.5
Fallbrook 67 141.6 94 196.4
North San Diego 101 94.8 108 100.4
Palomar‐Julian <5 § 7 108.9
Pauma 15 201.1 6 77.2
Poway 94 108.9 84 96.7
Ramona 54 154.9 56 158.0
San Marcos 126 140.1 106 117.5
Valley Center 29 124.3 43 183.3
South Region 551 117.6 607 129.3
Chula Vista 265 230.0 290 250.2
Coronado 16 64.8 14 60.0
National City 76 130.3 91 155.6
South Bay 141 104.5 147 108.8
Sweetwater 53 39.2 65 47.6Unknown 191 ‐‐‐ 160 ‐‐‐*Rates per 100,000 population. County age‐adjusted rates per 100,000 2000 US standard population.**Harbison Crest/El Cajon is an aggregation of the Harbison Crest and El Cajon SRAs. Due to geographic limitations, the Harbison Crest SRA is not shown alone. See the Data Guide for more information.†Mood disorder Emergency Department Discharge refers to (principal diagnosis) ICD‐9 codes 293.83, 296, 300.4, 311.§Rates not calculated for fewer than 5 events. Rates not calculated in cases where zip code is unknown.Source: Emergency Department Discharge Database (CA OSHPD), County of San Diego, Health & Human Services Agency, Public Health Services, Emergency Medical Services; SANDAG, Current Population Estimates, 10/2012.Prepared by: County of San Diego, Health & Human Services Agency, Public Health Services, Community Health Statistics Unit, 2013.
Mood Disorder† Emergency Department Discharges Among San Diego County Residents by Loca on of Residence
Geography2010 Total 2011 Total 2012 Total 2013 Total 2014 Total 2015 Total 2016 Total 2017 Total 2018 Total 2019 Total 2020 Total
County of San Diego, Health & Human Services Agency, Public Health Services, Community Health Statisitcs Unit Page 85
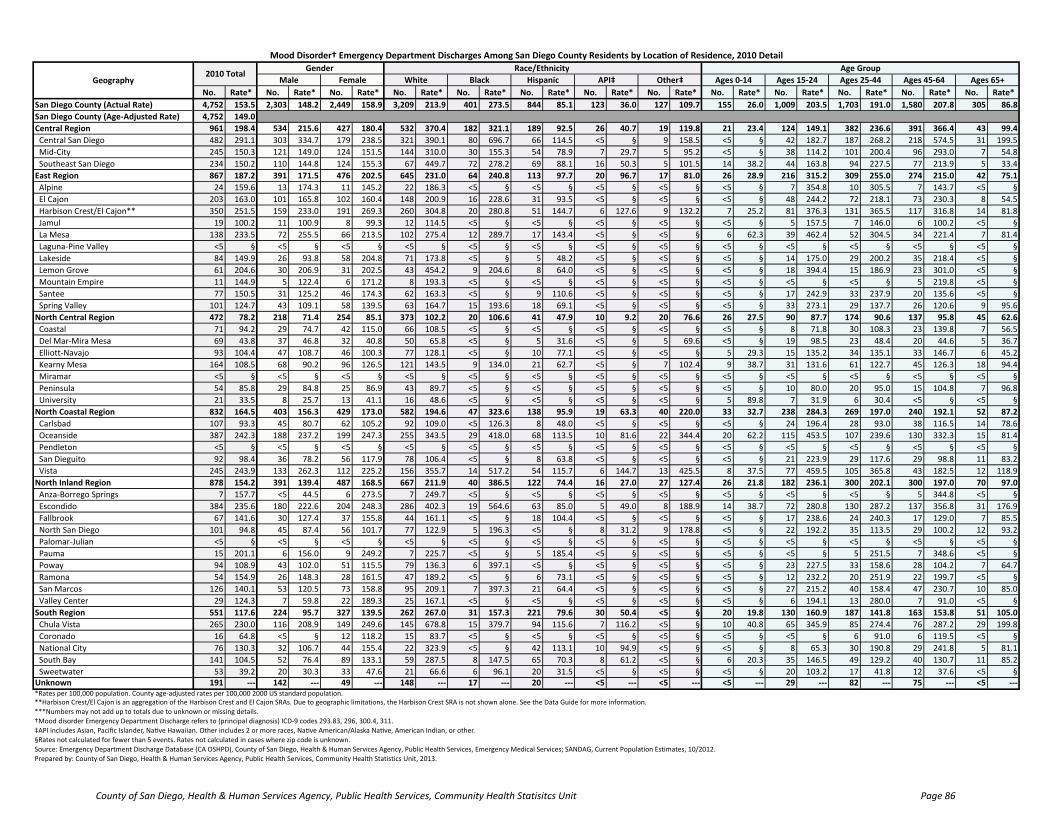
No. Rate* No. Rate* No. Rate* No. Rate* No. Rate* No. Rate* No. Rate* No. Rate* No. Rate* No. Rate* No. Rate* No. Rate* No. Rate*
San Diego County (Actual Rate) 4,752 153.5 2,303 148.2 2,449 158.9 3,209 213.9 401 273.5 844 85.1 123 36.0 127 109.7 155 26.0 1,009 203.5 1,703 191.0 1,580 207.8 305 86.8
San Diego County (Age‐Adjusted Rate) 4,752 149.0
Central Region 961 198.4 534 215.6 427 180.4 532 370.4 182 321.1 189 92.5 26 40.7 19 119.8 21 23.4 124 149.1 382 236.6 391 366.4 43 99.4
Central San Diego 482 291.1 303 334.7 179 238.5 321 390.1 80 696.7 66 114.5 <5 § 9 158.5 <5 § 42 182.7 187 268.2 218 574.5 31 199.5
Mid‐City 245 150.3 121 149.0 124 151.5 144 310.0 30 155.3 54 78.9 7 29.7 5 95.2 <5 § 38 114.2 101 200.4 96 293.0 7 54.8
Southeast San Diego 234 150.2 110 144.8 124 155.3 67 449.7 72 278.2 69 88.1 16 50.3 5 101.5 14 38.2 44 163.8 94 227.5 77 213.9 5 33.4
East Region 867 187.2 391 171.5 476 202.5 645 231.0 64 240.8 113 97.7 20 96.7 17 81.0 26 28.9 216 315.2 309 255.0 274 215.0 42 75.1
Alpine 24 159.6 13 174.3 11 145.2 22 186.3 <5 § <5 § <5 § <5 § <5 § 7 354.8 10 305.5 7 143.7 <5 §
El Cajon 203 163.0 101 165.8 102 160.4 148 200.9 16 228.6 31 93.5 <5 § <5 § <5 § 48 244.2 72 218.1 73 230.3 8 54.5
Harbison Crest/El Cajon** 350 251.5 159 233.0 191 269.3 260 304.8 20 280.8 51 144.7 6 127.6 9 132.2 7 25.2 81 376.3 131 365.5 117 316.8 14 81.8
Jamul 19 100.2 11 100.9 8 99.3 12 114.5 <5 § <5 § <5 § <5 § <5 § 5 157.5 7 146.0 6 100.2 <5 §
La Mesa 138 233.5 72 255.5 66 213.5 102 275.4 12 289.7 17 143.4 <5 § <5 § 6 62.3 39 462.4 52 304.5 34 221.4 7 81.4
Laguna‐Pine Valley <5 § <5 § <5 § <5 § <5 § <5 § <5 § <5 § <5 § <5 § <5 § <5 § <5 §
Lakeside 84 149.9 26 93.8 58 204.8 71 173.8 <5 § 5 48.2 <5 § <5 § <5 § 14 175.0 29 200.2 35 218.4 <5 §
Lemon Grove 61 204.6 30 206.9 31 202.5 43 454.2 9 204.6 8 64.0 <5 § <5 § <5 § 18 394.4 15 186.9 23 301.0 <5 §
Mountain Empire 11 144.9 5 122.4 6 171.2 8 193.3 <5 § <5 § <5 § <5 § <5 § <5 § <5 § 5 219.8 <5 §
Santee 77 150.5 31 125.2 46 174.3 62 163.3 <5 § 9 110.6 <5 § <5 § <5 § 17 242.9 33 237.9 20 135.6 <5 §
Spring Valley 101 124.7 43 109.1 58 139.5 63 164.7 15 193.6 18 69.1 <5 § <5 § <5 § 33 273.1 29 137.7 26 120.6 9 95.6
North Central Region 472 78.2 218 71.4 254 85.1 373 102.2 20 106.6 41 47.9 10 9.2 20 76.6 26 27.5 90 87.7 174 90.6 137 95.8 45 62.6
Coastal 71 94.2 29 74.7 42 115.0 66 108.5 <5 § <5 § <5 § <5 § <5 § 8 71.8 30 108.3 23 139.8 7 56.5
Del Mar‐Mira Mesa 69 43.8 37 46.8 32 40.8 50 65.8 <5 § 5 31.6 <5 § 5 69.6 <5 § 19 98.5 23 48.4 20 44.6 5 36.7
Elliott‐Navajo 93 104.4 47 108.7 46 100.3 77 128.1 <5 § 10 77.1 <5 § <5 § 5 29.3 15 135.2 34 135.1 33 146.7 6 45.2
Kearny Mesa 164 108.5 68 90.2 96 126.5 121 143.5 9 134.0 21 62.7 <5 § 7 102.4 9 38.7 31 131.6 61 122.7 45 126.3 18 94.4
Miramar <5 § <5 § <5 § <5 § <5 § <5 § <5 § <5 § <5 § <5 § <5 § <5 § <5 §
Peninsula 54 85.8 29 84.8 25 86.9 43 89.7 <5 § <5 § <5 § <5 § <5 § 10 80.0 20 95.0 15 104.8 7 96.8
University 21 33.5 8 25.7 13 41.1 16 48.6 <5 § <5 § <5 § <5 § 5 89.8 7 31.9 6 30.4 <5 § <5 §
North Coastal Region 832 164.5 403 156.3 429 173.0 582 194.6 47 323.6 138 95.9 19 63.3 40 220.0 33 32.7 238 284.3 269 197.0 240 192.1 52 87.2
Carlsbad 107 93.3 45 80.7 62 105.2 92 109.0 <5 126.3 8 48.0 <5 § <5 § <5 § 24 196.4 28 93.0 38 116.5 14 78.6
Oceanside 387 242.3 188 237.2 199 247.3 255 343.5 29 418.0 68 113.5 10 81.6 22 344.4 20 62.2 115 453.5 107 239.6 130 332.3 15 81.4
Pendleton <5 § <5 § <5 § <5 § <5 § <5 § <5 § <5 § <5 § <5 § <5 § <5 § <5 §
San Dieguito 92 98.4 36 78.2 56 117.9 78 106.4 <5 § 8 63.8 <5 § <5 § <5 § 21 223.9 29 117.6 29 98.8 11 83.2
Vista 245 243.9 133 262.3 112 225.2 156 355.7 14 517.2 54 115.7 6 144.7 13 425.5 8 37.5 77 459.5 105 365.8 43 182.5 12 118.9
North Inland Region 878 154.2 391 139.4 487 168.5 667 211.9 40 386.5 122 74.4 16 27.0 27 127.4 26 21.8 182 236.1 300 202.1 300 197.0 70 97.0
Anza‐Borrego Springs 7 157.7 <5 44.5 6 273.5 7 249.7 <5 § <5 § <5 § <5 § <5 § <5 § <5 § 5 344.8 <5 §
Escondido 384 235.6 180 222.6 204 248.3 286 402.3 19 564.6 63 85.0 5 49.0 8 188.9 14 38.7 72 280.8 130 287.2 137 356.8 31 176.9
Fallbrook 67 141.6 30 127.4 37 155.8 44 161.1 <5 § 18 104.4 <5 § <5 § <5 § 17 238.6 24 240.3 17 129.0 7 85.5
North San Diego 101 94.8 45 87.4 56 101.7 77 122.9 5 196.3 <5 § 8 31.2 9 178.8 <5 § 22 192.2 35 113.5 29 100.2 12 93.2
Palomar‐Julian <5 § <5 § <5 § <5 § <5 § <5 § <5 § <5 § <5 § <5 § <5 § <5 § <5 §
Pauma 15 201.1 6 156.0 9 249.2 7 225.7 <5 § 5 185.4 <5 § <5 § <5 § <5 § 5 251.5 7 348.6 <5 §
Poway 94 108.9 43 102.0 51 115.5 79 136.3 6 397.1 <5 § <5 § <5 § <5 § 23 227.5 33 158.6 28 104.2 7 64.7
Ramona 54 154.9 26 148.3 28 161.5 47 189.2 <5 § 6 73.1 <5 § <5 § <5 § 12 232.2 20 251.9 22 199.7 <5 §
San Marcos 126 140.1 53 120.5 73 158.8 95 209.1 7 397.3 21 64.4 <5 § <5 § <5 § 27 215.2 40 158.4 47 230.7 10 85.0
Valley Center 29 124.3 7 59.8 22 189.3 25 167.1 <5 § <5 § <5 § <5 § <5 § 6 194.1 13 280.0 7 91.0 <5 §
South Region 551 117.6 224 95.7 327 139.5 262 267.0 31 157.3 221 79.6 30 50.4 <5 § 20 19.8 130 160.9 187 141.8 163 153.8 51 105.0
Chula Vista 265 230.0 116 208.9 149 249.6 145 678.8 15 379.7 94 115.6 7 116.2 <5 § 10 40.8 65 345.9 85 274.4 76 287.2 29 199.8
Coronado 16 64.8 <5 § 12 118.2 15 83.7 <5 § <5 § <5 § <5 § <5 § <5 § 6 91.0 6 119.5 <5 §
National City 76 130.3 32 106.7 44 155.4 22 323.9 <5 § 42 113.1 10 94.9 <5 § <5 § 8 65.3 30 190.8 29 241.8 5 81.1
South Bay 141 104.5 52 76.4 89 133.1 59 287.5 8 147.5 65 70.3 8 61.2 <5 § 6 20.3 35 146.5 49 129.2 40 130.7 11 85.2
Sweetwater 53 39.2 20 30.3 33 47.6 21 66.6 6 96.1 20 31.5 <5 § <5 § <5 § 20 103.2 17 41.8 12 37.6 <5 §Unknown 191 ‐‐‐ 142 ‐‐‐ 49 ‐‐‐ 148 ‐‐‐ 17 ‐‐‐ 20 ‐‐‐ <5 ‐‐‐ <5 ‐‐‐ <5 ‐‐‐ 29 ‐‐‐ 82 ‐‐‐ 75 ‐‐‐ <5 ‐‐‐*Rates per 100,000 population. County age‐adjusted rates per 100,000 2000 US standard population.**Harbison Crest/El Cajon is an aggregation of the Harbison Crest and El Cajon SRAs. Due to geographic limitations, the Harbison Crest SRA is not shown alone. See the Data Guide for more information.
***Numbers may not add up to totals due to unknown or missing details.
†Mood disorder Emergency Department Discharge refers to (principal diagnosis) ICD‐9 codes 293.83, 296, 300.4, 311.
‡API includes Asian, Pacific Islander, Na ve Hawaiian. Other includes 2 or more races, Na ve American/Alaska Na ve, American Indian, or other.
§Rates not calculated for fewer than 5 events. Rates not calculated in cases where zip code is unknown.
Source: Emergency Department Discharge Database (CA OSHPD), County of San Diego, Health & Human Services Agency, Public Health Services, Emergency Medical Services; SANDAG, Current Population Estimates, 10/2012.
Prepared by: County of San Diego, Health & Human Services Agency, Public Health Services, Community Health Statistics Unit, 2013.
Ages 0‐14 Ages 15‐24 Ages 25‐44 Ages 45‐64 Ages 65+
Mood Disorder† Emergency Department Discharges Among San Diego County Residents by Loca on of Residence, 2010 Detail
Geography2010 Total
Gender Race/Ethnicity Age Group
Male Female White Black Hispanic API‡ Other‡
County of San Diego, Health & Human Services Agency, Public Health Services, Community Health Statisitcs Unit Page 86

No. Rate* No. Rate* No. Rate* No. Rate* No. Rate* No. Rate* No. Rate* No. Rate* No. Rate* No. Rate* No. Rate* No. Rate* No. Rate*
San Diego County (Actual Rate) 5,179 166.2 2,459 157.3 2,720 175.1 3,345 223.7 451 315.6 940 93.0 163 46.7 207 175.7 190 32.0 1,043 209.2 1,942 218.0 1,644 213.2 360 99.5
San Diego County (Age‐Adjusted Rate) 5,179 161.6
Central Region 1,005 207.0 562 226.5 443 186.5 566 397.7 199 362.8 177 85.2 30 46.5 22 137.3 22 24.4 123 153.2 418 257.1 386 355.7 56 127.1
Central San Diego 548 330.2 346 382.0 202 268.0 371 453.3 91 818.8 53 90.4 15 174.0 14 244.2 5 24.9 44 212.2 234 332.3 232 600.0 33 205.6
Mid‐City 237 145.2 121 148.9 116 141.6 120 262.3 50 266.0 53 76.2 6 25.2 6 113.1 5 14.8 38 117.5 103 203.3 76 227.0 15 116.2
Southeast San Diego 220 140.7 95 124.6 125 155.9 75 509.6 58 232.5 71 89.2 9 28.0 <5 § 12 33.1 41 150.6 81 195.2 78 214.4 8 53.0
East Region 959 205.5 426 185.4 533 225.0 664 238.0 77 295.6 107 90.0 10 47.1 66 308.0 29 32.5 190 273.8 389 321.7 282 219.1 69 118.0
Alpine 22 145.1 9 119.5 13 170.5 17 144.5 <5 § <5 § <5 § <5 § <5 § <5 § 9 283.3 7 142.5 <5 §
El Cajon 219 174.8 103 167.9 116 181.5 159 216.3 22 321.0 19 55.9 <5 § 14 219.8 6 23.7 40 203.1 90 271.8 66 206.0 17 112.4
Harbison Crest/El Cajon** 368 262.8 162 235.8 206 288.8 269 316.0 29 415.2 34 93.9 <5 § 24 347.8 9 32.7 67 309.6 149 415.2 115 308.6 28 158.1
Jamul 37 210.5 13 128.7 24 321.1 16 167.4 6 721.2 10 182.2 <5 § <5 § <5 § 12 397.7 12 277.1 7 125.5 <5 §
La Mesa 155 258.4 80 279.5 75 239.2 100 268.1 13 316.4 12 97.3 <5 § 13 487.1 <5 § 30 367.2 67 383.6 44 280.5 10 112.9
Laguna‐Pine Valley <5 § <5 § <5 § <5 § <5 § <5 § <5 § <5 § <5 § <5 § <5 § <5 § <5 §
Lakeside 85 150.8 27 96.9 58 203.6 74 181.0 <5 § <5 § <5 § 5 187.8 <5 § 12 148.8 40 278.0 24 148.0 7 109.9
Lemon Grove 51 170.3 19 130.4 32 208.0 26 278.0 12 280.8 8 62.5 <5 § <5 § <5 § 15 321.2 18 225.6 8 103.8 7 204.8
Mountain Empire 14 164.6 8 174.8 6 152.7 9 199.5 <5 § <5 § <5 § <5 § <5 § 8 655.7 <5 § <5 § <5 §
Santee 88 170.2 46 183.8 42 157.5 73 191.2 <5 § 7 83.4 <5 § <5 § <5 § 19 262.2 34 248.1 28 186.6 5 82.7
Spring Valley 138 168.8 62 155.9 76 181.1 80 209.1 14 184.8 27 100.9 <5 § 12 320.9 <5 § 23 185.8 58 276.0 46 211.4 7 71.1
North Central Region 560 91.8 255 82.7 305 101.2 404 110.6 33 176.5 53 60.4 34 30.5 25 93.9 19 20.1 112 108.2 194 100.2 171 118.4 64 86.9
Coastal 69 91.3 34 87.3 35 95.6 60 99.0 <5 § <5 § <5 § <5 § <5 § 10 90.6 22 78.9 18 109.7 15 118.9
Del Mar‐Mira Mesa 117 73.8 47 59.2 70 88.5 74 97.7 <5 § 9 55.9 23 41.2 6 83.1 <5 § 28 140.0 40 85.8 37 80.9 9 62.6
Elliott‐Navajo 100 111.8 53 122.2 47 102.1 73 121.9 9 226.2 10 75.8 <5 § 5 113.0 <5 § 21 193.9 38 149.8 34 150.5 <5 §
Kearny Mesa 179 118.0 79 104.5 100 131.3 121 144.1 12 182.0 29 85.1 <5 § 8 115.6 8 34.0 31 141.0 58 114.4 56 154.9 26 134.1
Miramar <5 § <5 § <5 § <5 § <5 § <5 § <5 § <5 § <5 § <5 § <5 § <5 § <5 §
Peninsula 50 79.3 <5 § 29 101.1 43 90.1 <5 § <5 § <5 § <5 § <5 § 13 105.5 18 84.4 14 98.3 <5 §
University 45 67.7 21 63.8 24 71.5 33 96.5 <5 § <5 § <5 § <5 § <5 § 9 37.1 18 87.0 12 129.1 6 93.9
North Coastal Region 957 187.7 455 175.2 502 200.7 683 228.4 52 363.1 161 109.7 22 71.1 33 176.0 49 48.8 247 292.7 327 239.5 282 222.4 52 84.4
Carlsbad 131 113.1 60 106.5 71 119.2 109 128.7 <5 § 11 64.1 <5 § <5 § <5 § 43 335.2 37 125.0 39 117.7 10 54.1
Oceanside 439 274.2 208 261.8 231 286.5 296 401.7 37 553.7 68 111.9 13 104.8 21 321.7 20 61.3 107 432.2 154 344.7 137 348.5 21 112.1
Pendleton <5 § <5 § <5 § <5 § <5 § <5 § <5 § <5 § <5 § <5 § <5 § <5 § <5 §
San Dieguito 123 129.6 60 128.6 63 130.6 109 147.3 <5 § 10 77.0 <5 § <5 § 11 65.8 36 359.2 35 143.1 33 110.9 8 57.3
Vista 263 259.6 126 246.5 137 272.8 168 385.0 11 418.3 72 150.8 <5 § 8 259.3 16 74.7 60 363.8 101 349.1 73 303.1 13 124.9
North Inland Region 931 162.0 397 140.3 534 183.2 631 201.0 48 471.3 183 108.7 32 52.8 34 157.7 38 32.0 217 272.1 337 229.2 280 181.2 59 79.0
Anza‐Borrego Springs 9 192.8 <5 § 6 259.0 7 248.1 <5 § <5 § <5 § <5 § <5 § <5 § <5 § <5 § <5 §
Escondido 418 254.5 184 225.8 234 282.8 268 380.0 33 1002.1 99 130.7 9 86.7 7 162.6 15 41.5 87 335.9 155 342.5 144 368.0 17 95.4
Fallbrook 94 196.4 39 163.5 55 229.0 63 231.3 <5 § 25 140.4 <5 § <5 § <5 § 19 262.2 41 405.4 23 175.0 7 82.1
North San Diego 108 100.4 47 90.3 61 109.7 83 132.2 <5 § 10 91.4 9 34.3 6 117.5 <5 § 33 275.0 29 95.3 31 105.0 11 82.7
Palomar‐Julian 7 108.9 <5 § 5 153.4 <5 § <5 § <5 § <5 § <5 § <5 § <5 § <5 § <5 § <5 §
Pauma 6 77.2 <5 § <5 § <5 § <5 § <5 § <5 § <5 § <5 § <5 § <5 § <5 § <5 §
Poway 84 96.7 29 68.3 55 123.7 57 98.4 <5 § 11 103.5 8 59.5 <5 § <5 § 22 200.8 22 109.3 25 91.5 11 97.7
Ramona 56 158.0 27 151.7 29 164.4 50 199.8 <5 § <5 § <5 § <5 § <5 § 16 291.7 24 303.6 11 98.3 <5 §
San Marcos 106 117.5 44 99.7 62 134.6 64 142.4 8 467.8 25 75.2 5 67.5 <5 § 8 40.2 24 187.7 43 172.7 24 115.9 7 58.8
Valley Center 43 183.3 20 170.0 23 196.7 33 222.5 <5 § 7 116.7 <5 § <5 § <5 § 11 337.7 18 399.3 12 156.8 <5 §
South Region 607 129.3 256 109.5 351 148.9 279 290.2 29 154.3 240 85.4 35 58.4 20 148.9 33 32.8 139 171.2 196 150.5 184 170.4 55 111.3
Chula Vista 290 250.2 125 223.9 165 274.6 145 692.7 15 391.7 110 133.3 10 164.9 8 312.0 19 77.9 65 342.0 96 310.7 80 297.0 30 204.5
Coronado 14 60.0 <5 § 12 120.5 12 70.3 <5 § <5 § <5 § <5 § <5 § <5 § <5 § <5 § <5 §
National City 91 155.6 42 140.0 49 172.0 35 531.0 <5 § 40 106.5 9 85.1 <5 § <5 § 13 106.2 27 170.9 39 319.9 8 131.6
South Bay 147 108.8 60 88.2 87 129.7 58 288.3 7 134.8 69 74.0 8 61.2 <5 § 7 23.6 37 155.7 50 132.9 44 142.3 9 68.2
Sweetwater 65 47.6 27 40.6 38 54.2 29 92.3 <5 § 19 29.4 8 27.2 5 95.6 <5 § 21 102.5 19 47.6 17 51.7 5 42.0Unknown 160 ‐‐‐ 108 ‐‐‐ 52 ‐‐‐ 118 ‐‐‐ 13 ‐‐‐ 19 ‐‐‐ <5 ‐‐‐ 7 ‐‐‐ <5 ‐‐‐ 15 ‐‐‐ 81 ‐‐‐ 59 ‐‐‐ 5 ‐‐‐*Rates per 100,000 population. County age‐adjusted rates per 100,000 2000 US standard population.**Harbison Crest/El Cajon is an aggregation of the Harbison Crest and El Cajon SRAs. Due to geographic limitations, the Harbison Crest SRA is not shown alone. See the Data Guide for more information.
***Numbers may not add up to totals due to unknown or missing details.
†Mood disorder Emergency Department Discharge refers to (principal diagnosis) ICD‐9 codes 293.83, 296, 300.4, 311.
‡API includes Asian, Pacific Islander, Na ve Hawaiian. Other includes 2 or more races, Na ve American/Alaska Na ve, American Indian, or other.
§Rates not calculated for fewer than 5 events. Rates not calculated in cases where zip code is unknown.
Source: Emergency Department Discharge Database (CA OSHPD), County of San Diego, Health & Human Services Agency, Public Health Services, Emergency Medical Services; SANDAG, Current Population Estimates, 10/2012.
Prepared by: County of San Diego, Health & Human Services Agency, Public Health Services, Community Health Statistics Unit, 2013.
Gender Race/Ethnicity Age Group
Male Female White Black Hispanic Ages 65+API‡ Other‡ Ages 0‐14 Ages 15‐24 Ages 25‐44 Ages 45‐64Geography2011 Total
Mood Disorder† Emergency Department Discharges Among San Diego County Residents by Loca on of Residence, 2011 Detail
County of San Diego, Health & Human Services Agency, Public Health Services, Community Health Statisitcs Unit Page 87

Overdose/Poisoning
County of San Diego, Health & Human Services Agency, Public Health Services, Community Health Statisitcs Unit Page 88

Healthy People 2020 Target: 13.1 deaths per 100,000 population, age‐adjusted*
USA: 13.9 deaths per 100,000 popula on, age‐adjusted (2010)* ‡
California: 12.2 deaths per 100,000 popula on, age‐adjusted (2010)* ‡
No. Rate* No. Rate* No. Rate* No. Rate* No. Rate* No. Rate* No. Rate* No. Rate* No. Rate* No. Rate* No. Rate*
San Diego County (Actual Rate) 412 13.3 448 14.4
San Diego County (Age‐Adjusted Rate) 412 12.8 448 13.8
Central Region 81 16.7 87 17.9
Central San Diego 42 25.4 42 25.3
Mid‐City 22 13.5 20 12.3
Southeast San Diego 17 10.9 25 16.0
East Region 72 15.5 95 20.4
Alpine <5 § <5 §
El Cajon 12 9.6 23 18.4
Harbison Crest/El Cajon** 32 23.0 36 25.7
Jamul <5 § <5 §
La Mesa 9 15.2 13 21.7
Laguna‐Pine Valley <5 § <5 0.0
Lakeside 11 19.6 14 24.8
Lemon Grove <5 § 5 16.7
Mountain Empire <5 § <5 §
Santee 6 11.7 6 11.6
Spring Valley 7 8.6 11 13.5
North Central Region 81 13.4 66 10.8
Coastal 7 9.3 14 18.5
Del Mar‐Mira Mesa 14 8.9 12 7.6
Elliott‐Navajo 12 13.5 10 11.2
Kearny Mesa 33 21.8 18 11.9
Miramar <5 § <5 §
Peninsula 12 19.1 8 12.7
University <5 § <5 §
North Coastal Region 70 13.8 82 16.1
Carlsbad 14 12.2 14 12.1
Oceanside 24 15.0 28 17.5
Pendleton <5 § <5 §
San Dieguito 12 12.8 11 11.6
Vista 17 16.9 26 25.7
North Inland Region 73 12.8 75 13.1
Anza‐Borrego Springs <5 § <5 §
Escondido 26 15.9 32 19.5
Fallbrook 5 10.6 10 20.9
North San Diego 11 10.3 7 6.5
Palomar‐Julian <5 § <5 §
Pauma <5 § <5 §
Poway 10 11.6 7 8.1
Ramona <5 § <5 §
San Marcos 14 15.6 10 11.1
Valley Center <5 § <5 §
South Region 30 6.4 41 8.7
Chula Vista 13 11.3 20 17.3
Coronado <5 § <5 §
National City <5 § 7 12.0
South Bay 9 6.7 9 6.7
Sweetwater <5 § <5 §Unknown 5 ‐‐‐ <5 ‐‐‐*Rates per 100,000 population. County age‐adjusted rates per 100,000 2000 US standard population.**Harbison Crest/El Cajon is an aggregation of the Harbison Crest and El Cajon SRAs. Due to geographic limitations, the Harbison Crest SRA is not shown alone. See the Data Guide for more information.†Overdose/Poisoning death refers to (underlying cause of death) ICD‐10 codes X40‐X49, X60‐X69, X85‐X90, Y10‐Y19, Y35.2,Y40‐59, Y60‐69, U01.6‐U01.7. This includes all intents.‡Source: Na onal Vital Sta s cs System, CDC, NCHS. Online database accessed 06/01/2013: h p://wonder.cdc.gov.§Rates not calculated for fewer than 5 events. Rates not calculated in cases where zip code is unknown.Source: Death Statistical Master Files (CDPH), County of San Diego, Health & Human Services Agency, Public Health Services, Epidemiology & Immunization Services Branch; SANDAG, Current Population Estimates, 10/2012.Prepared by: County of San Diego, Health & Human Services Agency, Public Health Services, Community Health Statistics Unit, 2013.
Overdose/Poisoning† Deaths Among San Diego County Residents by Location of Residence
Geography2010 Total 2011 Total 2012 Total 2013 Total 2014 Total 2015 Total 2016 Total 2017 Total 2018 Total 2019 Total 2020 Total
County of San Diego, Health & Human Services Agency, Public Health Services, Community Health Statisitcs Unit Page 89

No. Rate* No. Rate* No. Rate* No. Rate* No. Rate* No. Rate* No. Rate* No. Rate* No. Rate* No. Rate* No. Rate* No. Rate* No. Rate*
San Diego County (Actual Rate) 412 13.3 257 16.5 155 10.1 320 21.3 22 15.0 52 5.2 7 2.0 11 9.5 <5 § 35 7.1 121 13.6 220 28.9 35 10.0
San Diego County (Age‐Adjusted Rate) 412 12.8
Central Region 81 16.7 58 23.4 23 9.7 54 37.6 15 26.5 11 5.4 <5 § <5 § <5 § 6 7.2 24 14.9 46 43.1 5 11.6
Central San Diego 42 25.4 30 33.1 12 16.0 32 38.9 5 43.5 5 8.7 <5 § <5 § <5 § <5 § 14 20.1 21 55.3 <5 §
Mid‐City 22 13.5 16 19.7 6 7.3 16 34.4 <5 § <5 § <5 § <5 § <5 § <5 § 6 11.9 14 42.7 <5 §
Southeast San Diego 17 10.9 12 15.8 5 6.3 6 40.3 7 27.1 <5 § <5 § <5 § <5 § <5 § <5 § 11 30.6 <5 §
East Region 72 15.5 42 18.4 30 12.8 62 22.2 <5 § <5 § <5 § <5 § <5 § 7 10.2 21 17.3 41 32.2 <5 §
Alpine <5 § <5 26.8 <5 26.4 <5 § <5 § <5 § <5 § <5 § <5 § <5 § <5 § <5 § <5 §
El Cajon 12 9.6 9 14.8 <5 4.7 11 14.9 <5 § <5 § <5 § <5 § <5 § <5 § <5 § 8 25.2 <5 §
Harbison Crest/El Cajon** 32 23.0 23 33.7 9 12.7 29 34.0 <5 § <5 § <5 § <5 § <5 § <5 § 9 25.1 18 48.7 <5 §
Jamul <5 § <5 § <5 12.4 <5 § <5 § <5 § <5 § <5 § <5 § <5 § <5 § <5 § <5 §
La Mesa 9 15.2 <5 14.2 5 16.2 9 24.3 <5 § <5 § <5 § <5 § <5 § <5 § <5 § 6 39.1 <5 §
Laguna‐Pine Valley <5 § <5 § <5 § <5 § <5 § <5 § <5 § <5 § <5 § <5 § <5 § <5 § <5 §
Lakeside 11 19.6 6 21.7 5 17.7 9 22.0 <5 § <5 § <5 § <5 § <5 § <5 § 5 34.5 5 31.2 <5 §
Lemon Grove <5 § <5 6.9 <5 6.5 <5 § <5 § <5 § <5 § <5 § <5 § <5 § <5 § <5 § <5 §
Mountain Empire <5 § <5 § <5 § <5 § <5 § <5 § <5 § <5 § <5 § <5 § <5 § <5 § <5 §
Santee 6 11.7 <5 8.1 <5 15.2 6 15.8 <5 § <5 § <5 § <5 § <5 § <5 § <5 § <5 § <5 §
Spring Valley 7 8.6 <5 10.1 <5 7.2 <5 § <5 § <5 § <5 § <5 § <5 § <5 § <5 § 5 23.2 <5 §
North Central Region 81 13.4 45 14.7 36 12.1 70 19.2 <5 § 8 9.3 <5 § <5 § <5 § 7 6.8 20 10.4 43 30.1 11 15.3
Coastal 7 9.3 <5 7.7 <5 10.9 6 9.9 <5 § <5 § <5 § <5 § <5 § <5 § <5 § <5 § <5 §
Del Mar‐Mira Mesa 14 8.9 8 10.1 6 7.6 13 17.1 <5 § <5 § <5 § <5 § <5 § <5 § <5 § 7 15.6 <5 §
Elliott‐Navajo 12 13.5 7 16.2 5 10.9 10 16.6 <5 § <5 § <5 § <5 § <5 § <5 § <5 § 6 26.7 <5 §
Kearny Mesa 33 21.8 17 22.6 16 21.1 27 32.0 <5 § 5 14.9 <5 § <5 § <5 § <5 § 7 14.1 18 50.5 7 36.7
Miramar <5 § <5 § <5 § <5 § <5 § <5 § <5 § <5 § <5 § <5 § <5 § <5 § <5 §
Peninsula 12 19.1 8 23.4 <5 13.9 11 22.9 <5 § <5 § <5 § <5 § <5 § <5 § <5 § 7 48.9 <5 §
University <5 § <5 6.4 <5 3.2 <5 § <5 § <5 § <5 § <5 § <5 § <5 § <5 § <5 § <5 §
North Coastal Region 70 13.8 47 18.2 23 9.3 57 19.1 <5 § 8 5.6 <5 § <5 § <5 § 6 7.2 17 12.5 40 32.0 6 10.1
Carlsbad 14 12.2 12 21.5 <5 3.4 14 16.6 <5 § <5 § <5 § <5 § <5 § <5 § <5 § 8 24.5 <5 §
Oceanside 24 15.0 18 22.7 6 7.5 18 24.2 <5 § <5 § <5 § <5 § <5 § <5 § 6 13.4 16 40.9 <5 §
Pendleton <5 § <5 11.5 <5 § <5 § <5 § <5 § <5 § <5 § <5 § <5 § <5 § <5 § <5 §
San Dieguito 12 12.8 7 15.2 5 10.5 11 15.0 <5 § <5 § <5 § <5 § <5 § <5 § <5 § 6 20.4 <5 §
Vista 17 16.9 7 13.8 10 20.1 12 27.4 <5 § <5 § <5 § <5 § <5 § <5 § <5 § 10 42.4 <5 §
North Inland Region 73 12.8 42 15.0 31 10.7 63 20.0 <5 § 5 3.0 <5 § <5 § <5 § 7 9.1 26 17.5 31 20.4 9 12.5
Anza‐Borrego Springs <5 § <5 44.5 <5 45.6 <5 71.4 <5 § <5 § <5 § <5 § <5 § <5 § <5 § <5 § <5 §
Escondido 26 15.9 19 23.5 7 8.5 24 33.8 <5 § <5 § <5 § <5 § <5 § <5 § 11 24.3 9 23.4 <5 §
Fallbrook 5 10.6 <5 8.5 <5 12.6 <5 § <5 § <5 § <5 § <5 § <5 § <5 § <5 § <5 § <5 §
North San Diego 11 10.3 6 11.7 5 9.1 9 14.4 <5 § <5 § <5 § <5 § <5 § <5 § <5 § <5 § <5 §
Palomar‐Julian <5 § <5 § <5 § <5 § <5 § <5 § <5 § <5 § <5 § <5 § <5 § <5 § <5 §
Pauma <5 § <5 26.0 <5 § <5 § <5 § <5 § <5 § <5 § <5 § <5 § <5 § <5 § <5 §
Poway 10 11.6 <5 7.1 7 15.9 9 15.5 <5 § <5 § <5 § <5 § <5 § <5 § <5 § 5 18.6 <5 §
Ramona <5 § <5 5.7 <5 5.8 <5 § <5 § <5 § <5 § <5 § <5 § <5 § <5 § <5 § <5 §
San Marcos 14 15.6 7 15.9 7 15.2 11 24.2 <5 § <5 § <5 § <5 § <5 § <5 § 5 19.8 7 34.4 <5 §
Valley Center <5 § <5 17.1 <5 § <5 § <5 § <5 § <5 § <5 § <5 § <5 § <5 § <5 § <5 §
South Region 30 6.4 20 8.5 10 4.3 11 11.2 <5 § 14 5.0 <5 § <5 § <5 § <5 § 11 8.3 16 15.1 <5 §
Chula Vista 13 11.3 9 16.2 <5 6.7 <5 § <5 § 8 9.8 <5 § <5 § <5 § <5 § 5 16.1 7 26.5 <5 §
Coronado <5 § <5 13.8 <5 9.8 <5 § <5 § <5 § <5 § <5 § <5 § <5 § <5 § <5 § <5 §
National City <5 § <5 6.7 <5 7.1 <5 § <5 § <5 § <5 § <5 § <5 § <5 § <5 § <5 § <5 §
South Bay 9 6.7 6 8.8 <5 4.5 <5 § <5 § <5 § <5 § <5 § <5 § <5 § <5 § <5 § <5 §
Sweetwater <5 § <5 1.5 <5 § <5 § <5 § <5 § <5 § <5 § <5 § <5 § <5 § <5 § <5 §Unknown 5 ‐‐‐ <5 ‐‐‐ <5 ‐‐‐ <5 ‐‐‐ <5 ‐‐‐ <5 ‐‐‐ <5 ‐‐‐ <5 ‐‐‐ <5 ‐‐‐ <5 ‐‐‐ <5 ‐‐‐ <5 ‐‐‐ <5 ‐‐‐*Rates per 100,000 population. County age‐adjusted rates per 100,000 2000 US standard population.**Harbison Crest/El Cajon is an aggregation of the Harbison Crest and El Cajon SRAs. Due to geographic limitations, the Harbison Crest SRA is not shown alone. See the Data Guide for more information.
***Numbers may not add up to totals due to unknown or missing details.
†Overdose/Poisoning death refers to (underlying cause of death) ICD‐10 codes X40‐X49, X60‐X69, X85‐X90, Y10‐Y19, Y35.2,Y40‐59, Y60‐69, U01.6‐U01.7. This includes all intents.
‡API includes Asian, Pacific Islander, Na ve Hawaiian. Other includes 2 or more races, Na ve American/Alaska Na ve, American Indian, or other.
§Rates not calculated for fewer than 5 events. Rates not calculated in cases where zip code is unknown.
Source: Death Statistical Master Files (CDPH), County of San Diego, Health & Human Services Agency, Public Health Services, Epidemiology & Immunization Services Branch; SANDAG, Current Population Estimates, 10/2012.
Prepared by: County of San Diego, Health & Human Services Agency, Public Health Services, Community Health Statistics Unit, 2013.
HispanicBlack Other‡ Ages 0‐14 Ages 15‐24 Ages 25‐44API‡Geography2010 Total
Gender Race/Ethnicity Age Group
Male Ages 65+Female White
Overdose/Poisoning† Deaths Among San Diego County Residents by Loca on of Residence, 2010 Detail
Ages 45‐64
County of San Diego, Health & Human Services Agency, Public Health Services, Community Health Statisitcs Unit Page 90

No. Rate* No. Rate* No. Rate* No. Rate* No. Rate* No. Rate* No. Rate* No. Rate* No. Rate* No. Rate* No. Rate* No. Rate* No. Rate*
San Diego County (Actual Rate) 448 14.4 282 18.0 166 10.7 327 21.9 29 20.3 67 6.6 8 2.3 16 13.6 <5 § 34 6.8 141 15.8 252 32.7 20 5.5
San Diego County (Age‐Adjusted Rate) 448 13.8
Central Region 87 17.9 55 22.2 32 13.5 46 32.3 19 34.6 18 8.7 <5 § <5 § <5 § <5 § 25 15.4 57 52.5 <5 §
Central San Diego 42 25.3 30 33.1 12 15.9 26 31.8 9 81.0 6 10.2 <5 § <5 § <5 § <5 § 11 15.6 29 75.0 <5 §
Mid‐City 20 12.3 11 13.5 9 11.0 15 32.8 <5 § <5 § <5 § <5 § <5 § <5 § 6 11.8 13 38.8 <5 §
Southeast San Diego 25 16.0 14 18.4 11 13.7 5 34.0 9 36.1 9 11.3 <5 § <5 § <5 § <5 § 8 19.3 15 41.2 <5 §
East Region 95 20.4 53 23.1 42 17.7 76 27.2 <5 § 8 6.7 <5 § 6 28.0 <5 § 7 10.1 29 24.0 56 43.5 <5 §
Alpine <5 § <5 § <5 § <5 § <5 § <5 § <5 § <5 § <5 § <5 § <5 § <5 § <5 §
El Cajon 23 18.4 15 24.5 8 12.5 16 21.8 <5 § <5 § <5 § <5 § <5 § <5 § 8 24.2 13 40.6 <5 §
Harbison Crest/El Cajon** 36 25.7 24 34.9 12 16.8 28 32.9 <5 § <5 § <5 § <5 § <5 § <5 § 10 27.9 24 64.4 <5 §
Jamul <5 § <5 § <5 § <5 § <5 § <5 § <5 § <5 § <5 § <5 § <5 § <5 § <5 §
La Mesa 13 21.7 5 17.5 8 25.5 12 32.2 <5 § <5 § <5 § <5 § <5 § <5 § <5 § 7 44.6 <5 §
Laguna‐Pine Valley <5 § <5 § <5 § <5 § <5 § <5 § <5 § <5 § <5 § <5 § <5 § <5 § <5 §
Lakeside 14 24.8 7 25.1 7 24.6 13 31.8 <5 § <5 § <5 § <5 § <5 § <5 § 6 41.7 6 37.0 <5 §
Lemon Grove 5 16.7 <5 § <5 § 5 53.5 <5 § <5 § <5 § <5 § <5 § <5 § <5 § <5 § <5 §
Mountain Empire <5 § <5 § <5 § <5 § <5 § <5 § <5 § <5 § <5 § <5 § <5 § <5 § <5 §
Santee 6 11.6 <5 § <5 § 5 13.1 <5 § <5 § <5 § <5 § <5 § <5 § <5 § <5 § <5 §
Spring Valley 11 13.5 <5 § 7 16.7 9 23.5 <5 § <5 § <5 § <5 § <5 § <5 § <5 § 7 32.2 <5 §
North Central Region 66 10.8 44 14.3 22 7.3 57 15.6 <5 § <5 § <5 § <5 § <5 § <5 § 24 12.4 34 23.5 <5 §
Coastal 14 18.5 9 23.1 5 13.7 13 21.4 <5 § <5 § <5 § <5 § <5 § <5 § 5 17.9 7 42.7 <5 §
Del Mar‐Mira Mesa 12 7.6 7 8.8 5 6.3 9 11.9 <5 § <5 § <5 § <5 § <5 § <5 § 5 10.7 5 10.9 <5 §
Elliott‐Navajo 10 11.2 8 18.4 <5 § 9 15.0 <5 § <5 § <5 § <5 § <5 § <5 § <5 § 5 22.1 <5 §
Kearny Mesa 18 11.9 11 14.6 7 9.2 15 17.9 <5 § <5 § <5 § <5 § <5 § <5 § 5 9.9 11 30.4 <5 §
Miramar <5 § <5 § <5 § <5 § <5 § <5 § <5 § <5 § <5 § <5 § <5 § <5 § <5 §
Peninsula 8 12.7 6 17.5 <5 § 7 14.7 <5 § <5 § <5 § <5 § <5 § <5 § <5 § <5 § <5 §
University <5 § <5 § <5 § <5 § <5 § <5 § <5 § <5 § <5 § <5 § <5 § <5 § <5 §
North Coastal Region 82 16.1 55 21.2 27 10.8 65 21.7 <5 § 13 8.9 <5 § <5 § <5 § 6 7.1 29 21.2 42 33.1 5 8.1
Carlsbad 14 12.1 8 14.2 6 10.1 13 15.4 <5 § <5 § <5 § <5 § <5 § <5 § <5 § 10 30.2 <5 §
Oceanside 28 17.5 15 18.9 13 16.1 23 31.2 <5 § <5 § <5 § <5 § <5 § <5 § 10 22.4 14 35.6 <5 §
Pendleton <5 § <5 § <5 § <5 § <5 § <5 § <5 § <5 § <5 § <5 § <5 § <5 § <5 §
San Dieguito 11 11.6 8 17.1 <5 § 9 12.2 <5 § <5 § <5 § <5 § <5 § <5 § 7 28.6 <5 § <5 §
Vista 26 25.7 21 41.1 5 10.0 17 39.0 <5 § 9 18.8 <5 § <5 § <5 § <5 § 8 27.7 15 62.3 <5 §
North Inland Region 75 13.1 49 17.3 26 8.9 59 18.8 <5 § 9 5.3 <5 § <5 § <5 § 11 13.8 20 13.6 39 25.2 5 6.7
Anza‐Borrego Springs <5 § <5 § <5 § <5 § <5 § <5 § <5 § <5 § <5 § <5 § <5 § <5 § <5 §
Escondido 32 19.5 23 28.2 9 10.9 23 32.6 <5 § 6 7.9 <5 § <5 § <5 § 7 27.0 10 22.1 13 33.2 <5 §
Fallbrook 10 20.9 6 25.2 <5 § 9 33.0 <5 § <5 § <5 § <5 § <5 § <5 § <5 § 6 45.7 <5 §
North San Diego 7 6.5 <5 § <5 § 6 9.6 <5 § <5 § <5 § <5 § <5 § <5 § <5 § 6 20.3 <5 §
Palomar‐Julian <5 § <5 § <5 § <5 § <5 § <5 § <5 § <5 § <5 § <5 § <5 § <5 § <5 §
Pauma <5 § <5 § <5 § <5 § <5 § <5 § <5 § <5 § <5 § <5 § <5 § <5 § <5 §
Poway 7 8.1 <5 § <5 § 7 12.1 <5 § <5 § <5 § <5 § <5 § <5 § <5 § <5 § <5 §
Ramona <5 § <5 § <5 § <5 § <5 § <5 § <5 § <5 § <5 § <5 § <5 § <5 § <5 §
San Marcos 10 11.1 6 13.6 <5 § 8 17.8 <5 § <5 § <5 § <5 § <5 § <5 § <5 § 7 33.8 <5 §
Valley Center <5 § <5 § <5 § <5 § <5 § <5 § <5 § <5 § <5 § <5 § <5 § <5 § <5 §
South Region 41 8.7 24 10.3 17 7.2 23 23.9 <5 § 14 5.0 <5 § <5 § <5 § <5 § 14 10.7 22 20.4 <5 §
Chula Vista 20 17.3 11 19.7 9 15.0 11 52.6 <5 § 8 9.7 <5 § <5 § <5 § <5 § 8 25.9 10 37.1 <5 §
Coronado <5 § <5 § <5 § <5 § <5 § <5 § <5 § <5 § <5 § <5 § <5 § <5 § <5 §
National City 7 12.0 5 16.7 <5 § <5 § <5 § <5 § <5 § <5 § <5 § <5 § <5 § 5 41.0 <5 §
South Bay 9 6.7 6 8.8 <5 § 6 29.8 <5 § <5 § <5 § <5 § <5 § <5 § <5 § <5 § <5 §
Sweetwater <5 § <5 § <5 § <5 § <5 § <5 § <5 § <5 § <5 § <5 § <5 § <5 § <5 §
Unknown <5 ‐‐‐ <5 ‐‐‐ <5 ‐‐‐ <5 ‐‐‐ <5 ‐‐‐ <5 ‐‐‐ <5 ‐‐‐ <5 ‐‐‐ <5 ‐‐‐ <5 ‐‐‐ <5 ‐‐‐ <5 ‐‐‐ <5 ‐‐‐*Rates per 100,000 population. County age‐adjusted rates per 100,000 2000 US standard population.
**Harbison Crest/El Cajon is an aggregation of the Harbison Crest and El Cajon SRAs. Due to geographic limitations, the Harbison Crest SRA is not shown alone. See the Data Guide for more information.
***Numbers may not add up to totals due to unknown or missing details.
†Overdose/Poisoning death refers to (underlying cause of death) ICD‐10 codes X40‐X49, X60‐X69, X85‐X90, Y10‐Y19, Y35.2,Y40‐59, Y60‐69, U01.6‐U01.7. This includes all intents.
‡API includes Asian, Pacific Islander, Na ve Hawaiian. Other includes 2 or more races, Na ve American/Alaska Na ve, American Indian, or other.
§Rates not calculated for fewer than 5 events. Rates not calculated in cases where zip code is unknown.
Source: Death Statistical Master Files (CDPH), County of San Diego, Health & Human Services Agency, Public Health Services, Epidemiology & Immunization Services Branch; SANDAG, Current Population Estimates, 10/2012.
Prepared by: County of San Diego, Health & Human Services Agency, Public Health Services, Community Health Statistics Unit, 2013.
Ages 15‐24 Ages 25‐44 Ages 45‐64Male Female White Black Hispanic
Race/Ethnicity Age Group
Ages 65+API‡ Other‡ Ages 0‐14Geography2011 Total
Gender
Overdose/Poisoning† Deaths Among San Diego County Residents by Loca on of Residence, 2011 Detail
County of San Diego, Health & Human Services Agency, Public Health Services, Community Health Statisitcs Unit Page 91

No. Rate* No. Rate* No. Rate* No. Rate* No. Rate* No. Rate* No. Rate* No. Rate* No. Rate* No. Rate* No. Rate*
San Diego County (Actual Rate) 2,433 78.6 2,560 82.2
San Diego County (Age‐Adjusted Rate) 2,433 77.3 2,560 80.0
Central Region 478 98.7 574 118.2
Central San Diego 207 125.0 235 141.6
Mid‐City 157 96.3 179 109.7
Southeast San Diego 114 73.2 160 102.3
East Region 518 111.9 481 103.1
Alpine 21 139.7 9 59.4
El Cajon 129 103.6 112 89.4
Harbison Crest/El Cajon** 208 149.5 194 138.5
Jamul 11 58.0 13 74.0
La Mesa 78 132.0 70 116.7
Laguna‐Pine Valley <5 § <5 §
Lakeside 46 82.1 39 69.2
Lemon Grove 27 90.6 23 76.8
Mountain Empire 9 118.6 14 164.6
Santee 54 105.6 52 100.6
Spring Valley 61 75.3 67 82.0
North Central Region 342 56.6 387 63.5
Coastal 60 79.6 55 72.8
Del Mar‐Mira Mesa 55 34.9 56 35.3
Elliott‐Navajo 60 67.3 69 77.2
Kearny Mesa 114 75.4 142 93.6
Miramar <5 § <5 §
Peninsula 35 55.6 44 69.8
University 18 28.7 20 30.1
North Coastal Region 379 74.9 409 80.2
Carlsbad 68 59.3 97 83.7
Oceanside 155 97.0 147 91.8
Pendleton <5 § <5 §
San Dieguito 53 56.7 61 64.3
Vista 102 101.6 101 99.7
North Inland Region 353 62.0 349 60.7
Anza‐Borrego Springs <5 § <5 §
Escondido 111 68.1 109 66.4
Fallbrook 36 76.1 36 75.2
North San Diego 64 60.1 55 51.1
Palomar‐Julian <5 § <5 §
Pauma <5 § 6 77.2
Poway 48 55.6 37 42.6
Ramona 20 57.4 30 84.7
San Marcos 57 63.4 54 59.9
Valley Center 7 30.0 15 63.9
South Region 363 77.5 360 76.7
Chula Vista 140 121.5 138 119.1
Coronado 9 36.4 13 55.7
National City 48 82.3 49 83.8
South Bay 124 91.9 122 90.3
Sweetwater 42 31.0 38 27.8Unknown <5 ‐‐‐ <5 ‐‐‐*Rates per 100,000 population. County age‐adjusted rates per 100,000 2000 US standard population.**Harbison Crest/El Cajon is an aggregation of the Harbison Crest and El Cajon SRAs. Due to geographic limitations, the Harbison Crest SRA is not shown alone. See the Data Guide for more information.†Overdose/Poisoning‐related hospitaliza on refers to (principal diagnosis) ICD‐9 Ecodes E850‐E869, E950‐E952, E962, E972, E980‐E982. This includes all intents.§Rates not calculated for fewer than 5 events. Rates not calculated in cases where zip code is unknown.Source: Patient Discharge Database (CA OSHPD), County of San Diego, Health & Human Services Agency, Public Health Services, Epidemiology & Immunization Services Branch; SANDAG, Current Population Estimates, 10/2012.Prepared by: County of San Diego, Health & Human Services Agency, Public Health Services, Community Health Statistics Unit, 2013.
Overdose/Poisoning† Hospitaliza ons Among San Diego County Residents by Location of Residence
Geography2010 Total 2011 Total 2012 Total 2013 Total 2014 Total 2015 Total 2016 Total 2017 Total 2018 Total 2019 Total 2020 Total
County of San Diego, Health & Human Services Agency, Public Health Services, Community Health Statisitcs Unit Page 92

No. Rate* No. Rate* No. Rate* No. Rate* No. Rate* No. Rate* No. Rate* No. Rate* No. Rate* No. Rate* No. Rate* No. Rate* No. Rate*
San Diego County (Actual Rate) 2,433 78.6 1,088 70.0 1,345 87.2 1,620 108.0 189 128.9 425 42.9 100 29.3 67 57.9 65 10.9 326 65.7 664 74.5 910 119.7 468 133.2
San Diego County (Age‐Adjusted Rate) 2,433 77.3
Central Region 478 98.7 249 100.5 229 96.7 243 169.2 94 165.8 111 54.3 21 32.9 <5 § 16 17.8 49 58.9 150 92.9 206 193.0 57 131.7
Central San Diego 207 125.0 115 127.0 92 122.6 131 159.2 29 252.6 38 65.9 5 58.8 <5 § <5 § 17 73.9 65 93.2 95 250.3 28 180.2
Mid‐City 157 96.3 87 107.1 70 85.5 76 163.6 33 170.8 32 46.7 11 46.7 <5 § 9 26.6 15 45.1 51 101.2 61 186.2 21 164.3
Southeast San Diego 114 73.2 47 61.9 67 83.9 36 241.6 32 123.7 41 52.4 5 15.7 <5 § 5 13.6 17 63.3 34 82.3 50 138.9 8 53.5
East Region 518 111.9 225 98.7 293 124.6 390 139.7 38 143.0 66 57.1 7 33.9 13 61.9 16 17.8 66 96.3 122 100.7 223 175.0 91 162.6
Alpine 21 139.7 9 120.7 12 158.4 20 169.3 <5 § <5 § <5 § <5 § <5 § <5 § <5 § 11 225.9 <5 §
El Cajon 129 103.6 56 91.9 73 114.8 101 137.1 8 114.3 16 48.3 <5 § <5 § 6 23.5 12 61.0 31 93.9 60 189.3 20 136.4
Harbison Crest/El Cajon** 208 149.5 82 120.2 126 177.6 162 189.9 15 210.6 23 65.3 <5 § <5 § 7 25.2 25 116.1 57 159.0 88 238.3 31 181.2
Jamul 11 58.0 <5 § 9 111.7 8 76.3 <5 § <5 § <5 § <5 § <5 § <5 § <5 § <5 § 5 251.9
La Mesa 78 132.0 34 120.6 44 142.3 53 143.1 8 193.1 12 101.2 <5 § <5 § 6 62.3 8 94.9 13 76.1 34 221.4 17 197.8
Laguna‐Pine Valley <5 § <5 § <5 § <5 § <5 § <5 § <5 § <5 § <5 § <5 § <5 § <5 § <5 §
Lakeside 46 82.1 25 90.2 21 74.2 34 83.2 <5 § 11 106.1 <5 § <5 § <5 § <5 § 15 103.6 21 131.0 7 116.0
Lemon Grove 27 90.6 10 69.0 17 111.0 19 200.7 <5 § <5 § <5 § <5 § <5 § 7 153.4 <5 § 7 91.6 8 241.5
Mountain Empire 9 118.6 <5 § 6 171.2 5 120.8 <5 § <5 § <5 § <5 § <5 § <5 § <5 § 5 219.8 <5 §
Santee 54 105.6 27 109.0 27 102.3 43 113.2 <5 § 8 98.4 <5 § <5 § <5 § 11 157.2 11 79.3 25 169.5 7 122.4
Spring Valley 61 75.3 31 78.6 30 72.1 44 115.0 7 90.3 7 26.9 <5 § <5 § <5 § 8 66.2 12 57.0 31 143.7 9 95.6
North Central Region 342 56.6 145 47.5 197 66.0 262 71.8 10 53.3 29 33.9 18 16.6 14 53.6 5 5.3 49 47.8 107 55.7 103 72.1 78 108.5
Coastal 60 79.6 31 79.8 29 79.4 56 92.1 <5 § <5 § <5 § <5 § <5 § 5 44.9 15 54.2 15 91.2 24 193.6
Del Mar‐Mira Mesa 55 34.9 19 24.0 36 45.9 35 46.1 <5 § <5 § 8 14.6 5 69.6 <5 § 11 57.0 17 35.8 15 33.5 11 80.8
Elliott‐Navajo 60 67.3 28 64.8 32 69.8 43 71.6 5 124.3 8 61.7 <5 § <5 § <5 § 8 72.1 18 71.5 19 84.5 14 105.4
Kearny Mesa 114 75.4 43 57.1 71 93.6 82 97.2 <5 § 13 38.8 5 25.2 6 87.7 <5 § 19 80.7 42 84.5 32 89.8 19 99.7
Miramar <5 § <5 § <5 § <5 § <5 § <5 § <5 § <5 § <5 § <5 § <5 § <5 § <5 §
Peninsula 35 55.6 18 52.7 17 59.1 33 68.8 <5 § <5 § <5 § <5 § <5 § <5 § 12 57.0 13 90.8 7 96.8
University 18 28.7 6 19.3 12 37.9 13 39.5 <5 § <5 § <5 § <5 § <5 § <5 § <5 § 9 97.9 <5 §
North Coastal Region 379 74.9 159 61.7 220 88.7 291 97.3 15 103.3 40 27.8 12 40.0 16 88.0 7 6.9 58 69.3 100 73.2 122 97.6 92 154.4
Carlsbad 68 59.3 23 41.2 45 76.3 61 72.3 <5 § <5 § <5 § <5 § <5 § 8 65.5 19 63.1 24 73.6 15 84.2
Oceanside 155 97.0 72 90.8 83 103.2 110 148.2 10 144.2 15 25.0 7 57.1 11 172.2 <5 § 21 82.8 43 96.3 44 112.5 43 233.2
Pendleton <5 § <5 § <5 § <5 § <5 § <5 § <5 § <5 § <5 § <5 § <5 § <5 § <5 §
San Dieguito 53 56.7 20 43.5 33 69.5 50 68.2 <5 § <5 § <5 § <5 § <5 § 10 106.6 10 40.5 18 61.3 15 113.4
Vista 102 101.6 43 84.8 59 118.6 69 157.3 5 184.7 23 49.3 <5 § <5 § <5 § 18 107.4 28 97.5 36 152.8 19 188.2
North Inland Region 353 62.0 131 46.7 222 76.8 282 89.6 9 87.0 38 23.2 12 20.3 11 51.9 6 5.0 50 64.9 83 55.9 134 88.0 80 110.9
Anza‐Borrego Springs <5 § <5 § <5 § <5 § <5 § <5 § <5 § <5 § <5 § <5 § <5 § <5 § <5 §
Escondido 111 68.1 45 55.6 66 80.3 89 125.2 <5 § 19 25.6 <5 § <5 § <5 § 11 42.9 33 72.9 39 101.6 26 148.4
Fallbrook 36 76.1 12 51.0 24 101.0 27 98.9 <5 § 7 40.6 <5 § <5 § <5 § <5 § 7 70.1 17 129.0 8 97.8
North San Diego 64 60.1 21 40.8 43 78.1 51 81.4 <5 § <5 § 6 23.4 6 119.2 <5 § 6 52.4 20 64.9 22 76.0 16 124.2
Palomar‐Julian <5 § <5 § <5 § <5 § <5 § <5 § <5 § <5 § <5 § <5 § <5 § <5 § <5 §
Pauma <5 § <5 § <5 § <5 § <5 § <5 § <5 § <5 § <5 § <5 § <5 § <5 § <5 §
Poway 48 55.6 13 30.8 35 79.3 40 69.0 <5 § <5 § <5 § <5 § <5 § 9 89.0 8 38.5 19 70.7 9 83.2
Ramona 20 57.4 9 51.3 11 63.4 18 72.5 <5 § <5 § <5 § <5 § <5 § <5 § <5 § 9 81.7 5 133.8
San Marcos 57 63.4 25 56.8 32 69.6 43 94.6 5 283.8 6 18.4 <5 § <5 § <5 § 14 111.6 9 35.6 22 108.0 11 93.5
Valley Center 7 30.0 <5 § <5 § 5 33.4 <5 § <5 § <5 § <5 § <5 § <5 § <5 § <5 § <5 §
South Region 363 77.5 179 76.5 184 78.5 152 154.9 23 116.7 141 50.8 30 50.4 10 74.5 15 14.8 54 66.8 102 77.3 122 115.1 70 144.1
Chula Vista 140 121.5 67 120.6 73 122.3 60 280.9 8 202.5 54 66.4 11 182.6 <5 § 6 24.5 27 143.7 38 122.7 42 158.7 27 186.0
Coronado 9 36.4 5 34.4 <5 § 9 50.2 <5 § <5 § <5 § <5 § <5 § <5 § <5 § <5 § 5 143.6
National City 48 82.3 28 93.3 20 70.6 21 309.1 <5 § 17 45.8 5 47.4 <5 § <5 § <5 § 11 70.0 17 141.8 13 210.9
South Bay 124 91.9 63 92.6 61 91.2 45 219.2 10 184.4 57 61.7 7 53.6 <5 § 5 16.9 17 71.1 43 113.3 41 134.0 18 139.5
Sweetwater 42 31.0 16 24.3 26 37.5 17 53.9 <5 § 13 20.5 7 24.2 <5 § <5 § 7 36.1 10 24.6 18 56.4 7 60.9Unknown <5 ‐‐‐ <5 ‐‐‐ <5 ‐‐‐ <5 ‐‐‐ <5 ‐‐‐ <5 ‐‐‐ <5 ‐‐‐ <5 ‐‐‐ <5 ‐‐‐ <5 ‐‐‐ <5 ‐‐‐ <5 ‐‐‐ <5 ‐‐‐* Rates per 100,000 population. County age‐adjusted rates per 100,000 2000 US standard population.**Harbison Crest/El Cajon is an aggregation of the Harbison Crest and El Cajon SRAs. Due to geographic limitations, the Harbison Crest SRA is not shown alone. See the Data Guide for more information.
***Numbers may not add up to totals due to unknown or missing details.
† Overdose/Poisoning‐related hospitaliza on refers to (principal diagnosis) ICD‐9 Ecodes E850‐E869, E950‐E952, E962, E972, E980‐E982. This includes all intents.
‡API includes Asian, Pacific Islander, Na ve Hawaiian. Other includes 2 or more races, Na ve American/Alaska Na ve, American Indian, or other.
§ Rates not calculated for fewer than 5 events. Rates not calculated in cases where zip code is unknown.
Source: Patient Discharge Database (CA OSHPD), County of San Diego, Health & Human Services Agency, Public Health Services, Epidemiology & Immunization Services Branch; SANDAG, Current Population Estimates, 10/2012.
Prepared by: County of San Diego, Health & Human Services Agency, Public Health Services, Community Health Statistics Unit, 2013.
Black Other‡ Ages 0‐14 Ages 15‐24 Ages 25‐44API‡
Overdose/Poisoning† Hospitaliza ons Among San Diego County Residents by Loca on of Residence, 2010 Detail
Geography2010 Total
Gender Race/Ethnicity Age Group
Male Ages 65+Female White Ages 45‐64Hispanic
County of San Diego, Health & Human Services Agency, Public Health Services, Community Health Statisitcs Unit Page 93

No. Rate* No. Rate* No. Rate* No. Rate* No. Rate* No. Rate* No. Rate* No. Rate* No. Rate* No. Rate* No. Rate* No. Rate* No. Rate*
San Diego County (Actual Rate) 2,560 82.2 1,174 75.1 1,386 89.2 1,630 109.0 206 144.2 478 47.3 103 29.5 100 84.9 89 15.0 405 81.2 712 79.9 907 117.6 447 123.5
San Diego County (Age‐Adjusted Rate) 2,560 80.0
Central Region 574 118.2 296 119.3 278 117.1 277 194.6 116 211.5 130 62.6 27 41.8 15 93.6 22 24.4 92 114.6 166 102.1 218 200.9 76 172.5
Central San Diego 235 141.6 127 140.2 108 143.3 144 175.9 32 287.9 44 75.0 <5 § 6 104.6 <5 § 30 144.7 69 98.0 102 263.8 32 199.4
Mid‐City 179 109.7 75 92.3 104 126.9 96 209.8 29 154.3 38 54.6 6 25.2 6 113.1 7 20.7 28 86.6 49 96.7 69 206.1 26 201.4
Southeast San Diego 160 102.3 94 123.3 66 82.3 37 251.4 55 220.5 48 60.3 17 52.9 <5 § 13 35.9 34 124.9 48 115.7 47 129.2 18 119.2
East Region 481 103.1 225 97.9 256 108.1 340 121.9 33 126.7 55 46.2 11 51.9 30 140.0 10 11.2 54 77.8 127 105.0 208 161.6 82 140.2
Alpine 9 59.4 6 79.6 <5 § 8 68.0 <5 § <5 § <5 § <5 § <5 § <5 § <5 § <5 § <5 §
El Cajon 112 89.4 54 88.0 58 90.7 81 110.2 7 102.1 11 32.4 <5 § 6 94.2 <5 § 8 40.6 25 75.5 59 184.2 19 125.6
Harbison Crest/El Cajon** 194 138.5 92 133.9 102 143.0 139 163.3 11 157.5 23 63.5 5 103.8 11 159.4 <5 § 19 87.8 51 142.1 90 241.5 32 180.7
Jamul 13 74.0 <5 § 9 120.4 12 125.5 <5 § <5 § <5 § <5 § <5 § <5 § 5 115.4 5 89.6 <5 102.1
La Mesa 70 116.7 39 136.2 31 98.9 55 147.5 5 121.7 5 40.6 <5 § <5 § <5 § 6 73.4 17 97.3 31 197.6 12 135.5
Laguna‐Pine Valley <5 § <5 § <5 § <5 § <5 § <5 § <5 § <5 § <5 § <5 § <5 § <5 § <5 §
Lakeside 39 69.2 11 39.5 28 98.3 28 68.5 <5 § 6 56.5 <5 § <5 § <5 § <5 § 8 55.6 16 98.7 10 157.1
Lemon Grove 23 76.8 8 54.9 15 97.5 16 171.1 <5 § <5 § <5 § <5 § <5 § <5 § 6 75.2 10 129.8 <5 §
Mountain Empire 14 164.6 10 218.5 <5 § 10 221.7 <5 § <5 § <5 § <5 § <5 § 5 409.8 <5 § <5 § <5 §
Santee 52 100.6 24 95.9 28 105.0 39 102.2 <5 § <5 § <5 § <5 § <5 § 6 82.8 15 109.5 21 140.0 10 165.3
Spring Valley 67 82.0 31 78.0 36 85.8 33 86.3 14 184.8 12 44.8 <5 § 6 160.4 <5 § 8 64.6 20 95.2 27 124.1 11 111.7
North Central Region 387 63.5 172 55.8 215 71.4 281 76.9 20 107.0 46 52.4 18 16.1 13 48.9 15 15.9 79 76.3 104 53.7 109 75.4 80 108.6
Coastal 55 72.8 23 59.1 32 87.4 48 79.2 <5 § <5 § <5 § <5 § <5 § 7 63.4 16 57.4 14 85.3 18 142.7
Del Mar‐Mira Mesa 56 35.3 24 30.2 32 40.5 36 47.5 <5 § 5 31.0 8 14.3 <5 § 5 15.7 16 80.0 12 25.7 8 17.5 15 104.3
Elliott‐Navajo 69 77.2 34 78.4 35 76.0 44 73.5 8 201.1 12 90.9 <5 25.2 <5 § <5 § 14 129.2 20 78.8 19 84.1 13 95.1
Kearny Mesa 142 93.6 56 74.1 86 113.0 99 117.9 <5 § 22 64.6 7 34.7 6 86.7 <5 § 27 122.8 41 80.9 48 132.8 22 113.5
Miramar <5 § <5 § <5 § <5 § <5 § <5 § <5 § <5 § <5 § <5 § <5 § <5 § <5 §
Peninsula 44 69.8 23 66.9 21 73.2 39 81.8 <5 § <5 § <5 § <5 § <5 § 11 89.2 12 56.3 12 84.3 6 82.9
University 20 30.1 11 33.4 9 26.8 15 43.9 <5 § <5 § <5 § <5 § <5 § <5 § <5 § 8 86.0 6 93.9
North Coastal Region 409 80.2 150 57.8 259 103.5 322 107.7 8 55.9 51 34.7 11 35.5 13 69.3 8 8.0 81 96.0 120 87.9 116 91.5 84 136.3
Carlsbad 97 83.7 29 51.5 68 114.2 83 98.0 <5 § <5 § <5 § 5 122.9 <5 § 22 171.5 21 70.9 30 90.5 23 124.5
Oceanside 147 91.8 60 75.5 87 107.9 110 149.3 <5 § 27 44.4 <5 § <5 § 5 15.3 23 92.9 44 98.5 48 122.1 27 144.2
Pendleton <5 § <5 § <5 § <5 § <5 § <5 § <5 § <5 § <5 § <5 § <5 § <5 § <5 §
San Dieguito 61 64.3 23 49.3 38 78.8 57 77.0 <5 § <5 § <5 § <5 § <5 § 20 199.6 18 73.6 9 30.2 14 100.3
Vista 101 99.7 36 70.4 65 129.4 69 158.1 5 190.1 18 37.7 <5 § 6 194.5 <5 § 13 78.8 37 127.9 29 120.4 20 192.2
North Inland Region 349 60.7 163 57.6 186 63.8 262 83.5 6 58.9 49 29.1 14 23.1 16 74.2 17 14.3 50 62.7 85 57.8 129 83.5 68 91.1
Anza‐Borrego Springs <5 § <5 § <5 § <5 § <5 § <5 § <5 § <5 § <5 § <5 § <5 § <5 § <5 §
Escondido 109 66.4 46 56.4 63 76.1 76 107.7 <5 § 24 31.7 <5 § <5 § 7 19.4 13 50.2 34 75.1 36 92.0 19 106.6
Fallbrook 36 75.2 17 71.3 19 79.1 31 113.8 <5 § <5 § <5 § <5 § <5 § <5 § 8 79.1 16 121.8 7 82.1
North San Diego 55 51.1 28 53.8 27 48.6 43 68.5 <5 § <5 § <5 § <5 § <5 § 13 108.3 12 39.4 14 47.4 12 90.2
Palomar‐Julian <5 § <5 § <5 § <5 § <5 § <5 § <5 § <5 § <5 § <5 § <5 § <5 § <5 §
Pauma 6 77.2 <5 § 5 132.6 <5 § <5 § <5 § <5 § <5 § <5 § <5 § <5 § <5 § <5 §
Poway 37 42.6 19 44.8 18 40.5 26 44.9 <5 § <5 § 6 44.6 <5 § <5 § 5 45.6 8 39.8 14 51.2 7 62.2
Ramona 30 84.7 13 73.0 17 96.4 23 91.9 <5 § <5 § <5 § <5 § <5 § <5 § 7 88.6 13 116.1 5 124.6
San Marcos 54 59.9 26 58.9 28 60.8 41 91.2 <5 § 8 24.1 <5 § <5 § <5 § 6 46.9 9 36.1 23 111.1 16 134.4
Valley Center 15 63.9 8 68.0 7 59.9 12 80.9 <5 § <5 § <5 § <5 § <5 § <5 § 6 133.1 5 65.3 <5 §
South Region 360 76.7 168 71.9 192 81.5 148 153.9 23 122.3 147 52.3 22 36.7 13 96.8 17 16.9 49 60.4 110 84.5 127 117.6 57 115.4
Chula Vista 138 119.1 72 129.0 66 109.8 55 262.8 11 287.3 55 66.6 10 164.9 6 234.0 <5 § 20 105.2 39 126.2 55 204.2 20 136.4
Coronado 13 55.7 5 37.4 8 80.3 10 58.6 <5 § <5 § <5 § <5 § <5 § <5 § 7 116.5 <5 § <5 §
National City 49 83.8 15 50.0 34 119.4 21 318.6 <5 § 24 63.9 <5 § <5 § <5 § <5 § 14 88.6 18 147.6 9 148.1
South Bay 122 90.3 62 91.1 60 89.5 45 223.7 7 134.8 56 60.0 5 38.3 5 143.8 <5 § 15 63.1 34 90.4 45 145.6 24 181.8
Sweetwater 38 27.8 14 21.1 24 34.2 17 54.1 <5 § 10 15.5 <5 § <5 § 5 15.9 9 43.9 16 40.1 6 18.2 <5 §Unknown <5 ‐‐‐ <5 ‐‐‐ <5 ‐‐‐ <5 ‐‐‐ <5 ‐‐‐ <5 ‐‐‐ <5 ‐‐‐ <5 ‐‐‐ <5 ‐‐‐ <5 ‐‐‐ <5 ‐‐‐ <5 ‐‐‐ <5 ‐‐‐*Rates per 100,000 population. County age‐adjusted rates per 100,000 2000 US standard population.**Harbison Crest/El Cajon is an aggregation of the Harbison Crest and El Cajon SRAs. Due to geographic limitations, the Harbison Crest SRA is not shown alone. See the Data Guide for more information.
***Numbers may not add up to totals due to unknown or missing details.
†Overdose/Poisoning‐related hospitaliza on refers to (principal diagnosis) ICD‐9 Ecodes E850‐E869, E950‐E952, E962, E972, E980‐E982. This includes all intents.
‡API includes Asian, Pacific Islander, Na ve Hawaiian. Other includes 2 or more races, Na ve American/Alaska Na ve, American Indian, or other.
§Rates not calculated for fewer than 5 events. Rates not calculated in cases where zip code is unknown.
Source: Patient Discharge Database (CA OSHPD), County of San Diego, Health & Human Services Agency, Public Health Services, Epidemiology & Immunization Services Branch; SANDAG, Current Population Estimates, 10/2012.
Prepared by: County of San Diego, Health & Human Services Agency, Public Health Services, Community Health Statistics Unit, 2013.
Ages 65+API‡ Other‡ Ages 0‐14Geography2011 Total
Gender
Overdose/Poisoning† Hospitaliza ons Among San Diego County Residents by Loca on of Residence, 2011 Detail
Race/Ethnicity Age Group
Male Female White Black Hispanic Ages 15‐24 Ages 25‐44 Ages 45‐64
County of San Diego, Health & Human Services Agency, Public Health Services, Community Health Statisitcs Unit Page 94

No. Rate* No. Rate* No. Rate* No. Rate* No. Rate* No. Rate* No. Rate* No. Rate* No. Rate* No. Rate* No. Rate*
San Diego County (Actual Rate) 4,935 159.4 5,252 168.6
San Diego County (Age‐Adjusted Rate) 4,935 156.0 5,252 164.9
Central Region 874 180.4 930 191.5
Central San Diego 342 206.6 383 230.8
Mid‐City 248 152.1 278 170.3
Southeast San Diego 284 182.3 269 172.0
East Region 935 201.9 997 213.7
Alpine 36 239.4 26 171.5
El Cajon 198 159.0 199 158.9
Harbison Crest/El Cajon** 323 232.1 355 253.5
Jamul 47 247.9 55 312.9
La Mesa 128 216.6 172 286.7
Laguna‐Pine Valley 5 94.7 <5 §
Lakeside 103 183.9 108 191.6
Lemon Grove 38 127.5 46 153.6
Mountain Empire 25 329.4 23 270.4
Santee 101 197.5 108 208.9
Spring Valley 129 159.3 102 124.8
North Central Region 761 126.0 807 132.4
Coastal 94 124.7 151 199.9
Del Mar‐Mira Mesa 129 81.9 128 80.8
Elliott‐Navajo 128 143.6 126 140.9
Kearny Mesa 273 180.5 296 195.1
Miramar <5 § <5 §
Peninsula 77 122.3 54 85.6
University 58 92.5 51 76.7
North Coastal Region 753 148.9 809 158.7
Carlsbad 109 95.0 110 94.9
Oceanside 309 193.5 353 220.5
Pendleton 6 16.0 <5 §
San Dieguito 123 131.5 106 111.7
Vista 206 205.1 238 234.9
North Inland Region 814 142.9 881 153.3
Anza‐Borrego Springs <5 § 8 171.4
Escondido 280 171.8 263 160.1
Fallbrook 89 188.1 116 242.3
North San Diego 126 118.3 172 159.8
Palomar‐Julian <5 § 8 124.5
Pauma 15 201.1 13 167.2
Poway 81 93.8 101 116.2
Ramona 78 223.7 56 158.0
San Marcos 109 121.2 110 122.0
Valley Center 30 128.6 34 144.9
South Region 722 154.1 742 158.1
Chula Vista 313 271.6 294 253.6
Coronado 19 76.9 32 137.2
National City 107 183.5 85 145.3
South Bay 199 147.5 236 174.7
Sweetwater 84 62.1 95 69.5Unknown 76 ‐‐‐ 86 ‐‐‐*Rates per 100,000 population. County age‐adjusted rates per 100,000 2000 US standard population.**Harbison Crest/El Cajon is an aggregation of the Harbison Crest and El Cajon SRAs. Due to geographic limitations, the Harbison Crest SRA is not shown alone. See the Data Guide for more information.†Overdose/Poisoning‐related hospitaliza on refers to (principal diagnosis) ICD‐9 Ecodes E850‐E869, E950‐E952, E962, E972, E980‐E982. This includes all intents.§Rates not calculated for fewer than 5 events. Rates not calculated in cases where zip code is unknown.Source: Emergency Department Discharge Database (CA OSHPD), County of San Diego, Health & Human Services Agency, Public Health Services, Emergency Medical Services; SANDAG, Current Population Estimates, 10/2012.Prepared by: County of San Diego, Health & Human Services Agency, Public Health Services, Community Health Statistics Unit, 2013.
Overdose/Poisoning† Emergency Department Discharges Among San Diego County Residents by Location of Residence
Geography2010 Total 2011 Total 2012 Total 2013 Total 2014 Total 2015 Total 2016 Total 2017 Total 2018 Total 2019 Total 2020 Total
County of San Diego, Health & Human Services Agency, Public Health Services, Community Health Statisitcs Unit Page 95

No. Rate* No. Rate* No. Rate* No. Rate* No. Rate* No. Rate* No. Rate* No. Rate* No. Rate* No. Rate* No. Rate* No. Rate* No. Rate*
San Diego County (Actual Rate) 4,935 159.4 2,279 146.7 2,656 172.3 2,807 187.1 409 279.0 1,297 130.8 177 51.8 169 146.0 888 149.0 1,225 247.1 1,424 159.7 1,035 136.1 363 103.3
San Diego County (Age‐Adjusted Rate) 4,935 156.0
Central Region 874 180.4 422 170.4 452 190.9 352 245.1 176 310.5 281 137.5 37 57.9 20 126.1 150 167.0 184 221.3 291 180.2 203 190.2 46 106.3
Central San Diego 342 206.6 183 202.2 159 211.9 197 239.4 50 435.5 75 130.2 8 94.1 7 123.3 38 196.3 55 239.2 127 182.1 103 271.4 19 122.2
Mid‐City 248 152.1 121 149.0 127 155.2 100 215.3 48 248.5 81 118.3 11 46.7 7 133.2 44 130.1 55 165.3 91 180.5 42 128.2 16 125.2
Southeast San Diego 284 182.3 118 155.3 166 207.9 55 369.2 78 301.4 125 159.7 18 56.6 6 121.8 68 185.5 74 275.4 73 176.7 58 161.1 11 73.5
East Region 935 201.9 439 192.5 496 211.0 620 222.0 76 286.0 168 145.3 16 77.4 33 157.2 147 163.3 230 335.6 283 233.5 212 166.3 63 112.6
Alpine 36 239.4 18 241.3 18 237.6 30 254.0 <5 § <5 § <5 § <5 § <5 § 14 709.6 7 213.9 10 205.3 <5 §
El Cajon 198 159.0 95 155.9 103 161.9 127 172.4 21 300.1 36 108.6 <5 § 8 127.4 32 125.5 51 259.4 47 142.4 55 173.5 13 88.6
Harbison Crest/El Cajon** 323 232.1 150 219.8 173 243.9 213 249.7 38 533.5 50 141.9 5 106.3 11 161.6 49 176.5 85 394.9 90 251.1 78 211.2 21 122.7
Jamul 47 247.9 23 211.0 24 297.8 32 305.2 <5 § 7 121.0 <5 § <5 § 10 331.8 12 378.1 11 229.4 11 183.7 <5 §
La Mesa 128 216.6 70 248.4 58 187.6 82 221.4 8 193.1 30 253.1 <5 § <5 § 15 155.8 36 426.8 39 228.4 25 162.8 13 151.3
Laguna‐Pine Valley 5 94.7 <5 § <5 § 5 126.9 <5 § <5 § <5 § <5 § <5 § <5 § <5 § <5 § <5 §
Lakeside 103 183.9 55 198.5 48 169.5 82 200.7 <5 § 15 144.7 <5 § <5 § 18 156.8 21 262.5 35 241.7 25 156.0 <5 §
Lemon Grove 38 127.5 18 124.1 20 130.6 18 190.1 6 136.4 12 95.9 <5 § <5 § 10 159.5 9 197.2 13 162.0 <5 § <5 §
Mountain Empire 25 329.4 11 269.3 14 399.4 20 483.2 <5 § <5 § <5 § <5 § <5 § 9 901.8 <5 § 6 263.7 <5 §
Santee 101 197.5 40 161.5 61 231.2 70 184.3 <5 § 17 209.0 <5 § 9 429.8 16 163.0 16 228.6 38 274.0 21 142.4 10 174.9
Spring Valley 129 159.3 52 131.9 77 185.2 68 177.7 21 271.0 30 115.2 <5 § <5 § 22 130.4 25 206.9 47 223.2 31 143.7 <5 §
North Central Region 761 126.0 327 107.0 434 145.4 527 144.3 58 309.1 81 94.6 42 38.8 38 145.5 111 117.4 188 183.3 232 120.9 153 107.0 77 107.1
Coastal 94 124.7 40 103.0 54 147.8 80 131.5 <5 § <5 § <5 § <5 § 9 117.0 23 206.4 34 122.8 21 127.7 7 56.5
Del Mar‐Mira Mesa 129 81.9 57 72.1 72 91.7 80 105.3 6 162.1 9 57.0 18 32.8 13 181.0 26 80.4 31 160.6 35 73.6 26 58.0 11 80.8
Elliott‐Navajo 128 143.6 49 113.3 79 172.2 83 138.1 18 447.6 18 138.7 <5 § 5 115.4 20 117.2 31 279.5 31 123.1 33 146.7 13 97.9
Kearny Mesa 273 180.5 122 161.9 151 199.0 180 213.4 28 416.9 36 107.5 12 60.5 12 175.5 41 176.4 68 288.7 85 171.0 46 129.1 33 173.1
Miramar <5 § <5 § <5 § <5 § <5 § <5 § <5 § <5 § <5 § <5 § <5 § <5 § <5 §
Peninsula 77 122.3 35 102.4 42 146.1 65 135.5 <5 § 7 85.4 <5 § <5 § 8 101.9 17 136.0 28 133.1 14 97.8 10 138.4
University 58 92.5 23 74.0 35 110.6 38 115.4 <5 § 7 114.1 <5 § 5 197.8 7 125.7 17 77.5 18 91.2 13 141.5 <5 §
North Coastal Region 753 148.9 366 142.0 387 156.0 505 168.8 36 247.9 160 111.1 18 59.9 29 159.5 126 124.7 206 246.1 208 152.4 161 128.8 52 87.2
Carlsbad 109 95.0 54 96.8 55 93.3 90 106.7 <5 § 11 66.0 <5 § <5 § 25 113.8 26 212.7 25 83.1 30 92.0 <5 §
Oceanside 309 193.5 160 201.9 149 185.2 189 254.6 23 331.6 71 118.5 11 89.8 13 203.5 49 152.5 71 280.0 96 214.9 73 186.6 20 108.5
Pendleton 6 16.0 <5 § <5 § <5 § <5 § <5 § <5 § <5 § <5 § <5 § <5 § <5 § <5 §
San Dieguito 123 131.5 50 108.7 73 153.6 102 139.1 <5 § 13 103.7 <5 § 6 209.3 17 100.5 46 490.4 30 121.6 18 61.3 12 90.7
Vista 206 205.1 98 193.3 108 217.2 123 280.5 8 295.5 63 135.0 <5 § 5 163.7 35 164.2 59 352.1 55 191.6 40 169.8 17 168.4
North Inland Region 814 142.9 355 126.6 459 158.8 542 172.2 22 212.6 180 109.7 33 55.8 34 160.4 182 152.3 216 280.2 213 143.5 146 95.9 57 79.0
Anza‐Borrego Springs <5 § <5 § <5 § <5 § <5 § <5 § <5 § <5 § <5 § <5 § <5 § <5 § <5 §
Escondido 280 171.8 113 139.7 167 203.3 170 239.1 12 356.6 83 112.0 9 88.1 5 118.1 62 171.3 72 280.8 86 190.0 49 127.6 11 62.8
Fallbrook 89 188.1 44 186.9 45 189.4 55 201.4 <5 § 28 162.5 <5 § <5 § 30 339.6 11 154.4 19 190.3 19 144.2 10 122.2
North San Diego 126 118.3 46 89.3 80 145.3 91 145.2 <5 § 10 93.9 11 42.9 10 198.7 23 102.5 37 323.3 23 74.6 29 100.2 14 108.7
Palomar‐Julian <5 § <5 § <5 § <5 § <5 § <5 § <5 § <5 § <5 § <5 § <5 § <5 § <5 §
Pauma 15 201.1 8 208.0 7 193.8 8 258.0 <5 § <5 § <5 § 6 468.8 5 288.7 <5 § 5 251.5 <5 § <5 §
Poway 81 93.8 39 92.5 42 95.1 61 105.2 <5 § 11 106.5 6 45.7 <5 § 17 96.0 26 257.2 18 86.5 16 59.6 <5 §
Ramona 78 223.7 36 205.3 42 242.3 65 261.7 <5 § 12 146.2 <5 § <5 § 17 242.6 18 348.4 28 352.6 11 99.8 <5 §
San Marcos 109 121.2 51 115.9 58 126.2 70 154.1 5 283.8 25 76.7 6 82.4 <5 § 19 94.9 37 294.9 22 87.1 18 88.3 13 110.5
Valley Center 30 128.6 15 128.1 15 129.1 18 120.3 <5 § 8 137.9 <5 § <5 § 8 193.9 10 323.5 10 215.4 <5 § <5 §
South Region 722 154.1 323 138.0 399 170.2 217 221.1 34 172.6 411 148.0 30 50.4 13 96.9 169 167.0 179 221.6 169 128.1 139 131.1 66 135.9
Chula Vista 313 271.6 136 244.9 177 296.5 101 472.8 16 405.0 173 212.7 10 166.0 5 195.2 74 302.2 73 388.4 78 251.8 57 215.4 31 213.6
Coronado 19 76.9 8 55.0 11 108.3 14 78.1 <5 § 5 149.1 <5 § <5 § <5 § <5 § <5 § 6 119.5 6 172.4
National City 107 183.5 50 166.7 57 201.3 20 294.4 <5 § 79 212.7 <5 § <5 § 22 180.5 28 228.6 16 101.7 29 241.8 12 194.7
South Bay 199 147.5 98 144.0 101 151.1 53 258.2 12 221.2 118 127.7 7 53.6 <5 § 49 165.7 49 205.1 58 152.9 33 107.8 10 77.5
Sweetwater 84 62.1 31 47.0 53 76.4 29 92.0 <5 § 36 56.7 9 31.1 <5 § 21 66.0 28 144.5 14 34.4 14 43.8 7 60.9Unknown 76 ‐‐‐ 47 ‐‐‐ 29 ‐‐‐ 44 ‐‐‐ 7 ‐‐‐ 16 ‐‐‐ <5 ‐‐‐ <5 ‐‐‐ <5 ‐‐‐ 22 ‐‐‐ 28 ‐‐‐ 21 ‐‐‐ <5 ‐‐‐*Rates per 100,000 population. County age‐adjusted rates per 100,000 2000 US standard population.**Harbison Crest/El Cajon is an aggregation of the Harbison Crest and El Cajon SRAs. Due to geographic limitations, the Harbison Crest SRA is not shown alone. See the Data Guide for more information.
***Numbers may not add up to totals due to unknown or missing details.
†Overdose/Poisoning‐related hospitaliza on refers to (principal diagnosis) ICD‐9 Ecodes E850‐E869, E950‐E952, E962, E972, E980‐E982. This includes all intents.
‡API includes Asian, Pacific Islander, Na ve Hawaiian. Other includes 2 or more races, Na ve American/Alaska Na ve, American Indian, or other.
§Rates not calculated for fewer than 5 events. Rates not calculated in cases where zip code is unknown.
Source: Emergency Department Discharge Database (CA OSHPD), County of San Diego, Health & Human Services Agency, Public Health Services, Emergency Medical Services; SANDAG, Current Population Estimates, 10/2012.
Prepared by: County of San Diego, Health & Human Services Agency, Public Health Services, Community Health Statistics Unit, 2013.
Black Other‡ Ages 0‐14 Ages 15‐24 Ages 25‐44API‡
Overdose/Poisoning† Emergency Department Discharges Among San Diego County Residents by Loca on of Residence, 2010 Detail
Geography2010 Total
Gender Race/Ethnicity Age Group
Male Ages 65+Female White Ages 45‐64Hispanic
County of San Diego, Health & Human Services Agency, Public Health Services, Community Health Statisitcs Unit Page 96

No. Rate* No. Rate* No. Rate* No. Rate* No. Rate* No. Rate* No. Rate* No. Rate* No. Rate* No. Rate* No. Rate* No. Rate* No. Rate*
San Diego County (Actual Rate) 5,252 168.6 2,428 155.4 2,824 181.8 2,918 195.1 451 315.6 1,322 130.8 208 59.6 258 219.0 854 143.9 1,290 258.8 1,510 169.5 1,173 152.1 425 117.4
San Diego County (Age‐Adjusted Rate) 5,252 164.9
Central Region 930 191.5 458 184.6 472 198.8 370 260.0 180 328.1 291 140.0 45 69.7 32 199.6 162 179.8 183 227.9 286 175.9 234 215.6 65 147.5
Central San Diego 383 230.8 194 214.2 189 250.7 211 257.8 47 422.9 96 163.7 19 220.4 6 104.6 42 209.0 55 265.2 147 208.8 114 294.8 25 155.8
Mid‐City 278 170.3 144 177.2 134 163.6 104 227.3 47 250.0 97 139.4 12 50.4 15 282.9 60 177.6 63 194.8 73 144.1 66 197.1 16 124.0
Southeast San Diego 269 172.0 120 157.4 149 185.9 55 373.7 86 344.7 98 123.1 14 43.6 11 220.4 60 165.7 65 238.8 66 159.0 54 148.4 24 158.9
East Region 997 213.7 419 182.3 578 244.0 618 221.5 105 403.1 150 126.1 20 94.3 68 317.3 129 144.7 247 356.0 310 256.4 244 189.6 67 114.5
Alpine 26 171.5 12 159.3 14 183.6 20 170.0 <5 § <5 § <5 § <5 § <5 § 9 424.5 8 251.8 8 162.8 <5 §
El Cajon 199 158.9 99 161.4 100 156.5 132 179.5 25 364.8 20 58.9 <5 § 12 188.4 27 106.7 35 177.8 55 166.1 60 187.3 22 145.5
Harbison Crest/El Cajon** 355 253.5 165 240.1 190 266.4 223 261.9 37 529.7 47 129.8 8 166.0 26 376.8 43 156.2 86 397.4 91 253.6 109 292.5 26 146.8
Jamul 55 312.9 15 148.5 40 535.2 22 230.2 7 841.3 18 328.0 <5 § <5 § 15 557.0 18 596.6 13 300.2 6 107.6 <5 153.1
La Mesa 172 286.7 66 230.6 106 338.0 113 303.0 14 340.7 21 170.3 <5 § 14 524.5 16 163.2 35 428.4 60 343.5 48 305.9 13 146.8
Laguna‐Pine Valley <5 § <5 § <5 § <5 § <5 § <5 § <5 § <5 § <5 § <5 § <5 § <5 § <5 §
Lakeside 108 191.6 43 154.3 65 228.2 94 230.0 <5 § <5 § <5 § 5 187.8 14 123.5 24 297.7 39 271.0 22 135.7 9 141.4
Lemon Grove 46 153.6 20 137.3 26 169.0 16 171.1 8 187.2 16 124.9 <5 § <5 § <5 § 16 342.6 17 213.1 6 77.9 <5 §
Mountain Empire 23 270.4 16 349.7 7 178.1 14 310.4 <5 § 5 161.8 <5 § <5 § 5 302.1 <5 § 7 365.0 <5 § <5 §
Santee 108 208.9 45 179.8 63 236.2 81 212.2 6 704.2 5 59.6 <5 § 8 375.4 10 103.2 27 372.7 38 277.3 25 166.6 8 132.3
Spring Valley 102 124.8 35 88.0 67 159.6 33 86.3 28 369.7 31 115.8 <5 § 6 160.4 21 125.5 26 210.0 37 176.0 17 78.1 <5 §
North Central Region 807 132.4 391 126.8 416 138.1 537 147.0 41 219.3 108 123.1 53 47.5 49 184.1 110 116.5 192 185.4 261 134.8 158 109.4 86 116.7
Coastal 151 199.9 80 205.4 71 193.9 116 191.3 <5 § 13 157.7 9 264.2 6 238.2 11 144.4 47 425.8 50 179.4 34 207.2 9 71.3
Del Mar‐Mira Mesa 128 80.8 64 80.6 64 80.9 80 105.6 12 333.7 8 49.7 17 30.5 10 138.6 28 88.1 30 150.1 40 85.8 17 37.2 13 90.4
Elliott‐Navajo 126 140.9 63 145.2 63 136.8 85 141.9 8 201.1 22 166.7 <5 § <5 § 22 129.7 29 267.7 32 126.1 29 128.4 14 102.4
Kearny Mesa 296 195.1 138 182.6 158 207.5 179 213.2 18 273.0 56 164.3 16 79.3 18 260.1 40 170.2 61 277.4 100 197.3 63 174.3 32 165.1
Miramar <5 § <5 § <5 § <5 § <5 § <5 § <5 § <5 § <5 § <5 § <5 § <5 § <5 §
Peninsula 54 85.6 <5 § 35 122.0 44 92.2 <5 § <5 § <5 § 6 237.4 <5 § 9 73.0 25 117.2 8 56.2 10 138.1
University 51 76.7 26 79.0 25 74.5 32 93.6 <5 § 7 104.4 6 27.7 5 182.5 7 120.0 15 61.8 14 67.7 7 75.3 8 125.2
North Coastal Region 809 158.7 388 149.4 421 168.3 507 169.6 49 342.2 181 123.3 22 71.1 42 224.0 137 136.3 216 256.0 210 153.8 171 134.9 75 121.7
Carlsbad 110 94.9 48 85.2 62 104.1 84 99.2 5 317.7 13 75.7 <5 § <5 § 22 100.9 29 226.0 28 94.6 19 57.3 12 65.0
Oceanside 353 220.5 155 195.1 198 245.5 208 282.2 31 463.9 77 126.7 12 96.8 23 352.3 56 171.7 101 408.0 87 194.7 73 185.7 36 192.2
Pendleton <5 § <5 § <5 § <5 § <5 § <5 § <5 § <5 § <5 § <5 § <5 § <5 § <5 §
San Dieguito 106 111.7 59 126.4 47 97.4 90 121.6 <5 § 6 46.2 <5 § 5 170.2 16 95.8 38 379.2 26 106.3 16 53.8 10 71.6
Vista 238 234.9 124 242.6 114 227.0 124 284.2 12 456.3 84 175.9 <5 § 10 324.1 43 200.8 46 278.9 69 238.5 63 261.5 17 163.3
North Inland Region 881 153.3 387 136.7 494 169.4 593 188.9 33 324.0 192 114.0 27 44.6 32 148.4 136 114.6 248 311.0 200 136.0 219 141.7 78 104.5
Anza‐Borrego Springs 8 171.4 <5 § 7 302.1 6 212.6 <5 § <5 § <5 § <5 § <5 § <5 § <5 § <5 § <5 §
Escondido 263 160.1 112 137.4 151 182.5 169 239.6 8 242.9 79 104.3 5 48.2 <5 § 48 132.9 74 285.7 61 134.8 62 158.5 18 101.0
Fallbrook 116 242.3 51 213.8 65 270.6 65 238.7 10 1808.3 37 207.8 <5 § <5 § 19 214.7 40 552.0 25 247.2 23 175.0 9 105.6
North San Diego 172 159.8 70 134.5 102 183.5 121 192.7 7 280.8 14 128.0 12 45.7 16 313.4 23 102.9 46 383.3 35 115.0 44 149.1 24 180.3
Palomar‐Julian 8 124.5 <5 § 5 153.4 6 129.6 <5 § <5 § <5 § <5 § <5 § <5 § <5 § <5 § <5 §
Pauma 13 167.2 10 249.8 <5 79.6 7 224.1 <5 § <5 § <5 § <5 § <5 § 5 460.4 <5 § <5 § <5 §
Poway 101 116.2 41 96.6 60 135.0 81 139.8 <5 § 10 94.1 7 52.1 <5 § 17 98.6 26 237.4 21 104.4 32 117.1 5 44.4
Ramona 56 158.0 33 185.4 23 130.4 46 183.8 <5 § 7 82.1 <5 § <5 § 7 102.4 19 346.4 18 227.7 9 80.4 <5 §
San Marcos 110 122.0 50 113.3 60 130.2 67 149.1 5 292.4 32 96.2 <5 § <5 § 15 75.4 28 219.0 23 92.4 30 144.9 14 117.6
Valley Center 34 144.9 16 136.0 18 154.0 25 168.6 <5 § 7 116.7 <5 § <5 § <5 § 6 184.2 11 244.0 13 169.8 <5 §
South Region 742 158.1 321 137.3 421 178.6 233 242.4 38 202.1 384 136.6 41 68.4 33 245.6 178 176.8 193 237.7 194 149.0 125 115.8 52 105.3
Chula Vista 294 253.6 138 247.2 156 259.6 102 487.3 14 365.6 155 187.8 9 148.4 12 468.0 73 299.2 67 352.5 67 216.8 60 222.7 27 184.1
Coronado 32 137.2 7 52.4 25 251.1 21 123.0 <5 § <5 § <5 § <5 § <5 § 9 158.3 9 149.8 7 139.7 <5 §
National City 85 145.3 36 120.0 49 172.0 24 364.1 <5 § 47 125.1 8 75.7 <5 § 19 156.0 22 179.8 21 132.9 16 131.2 7 115.2
South Bay 236 174.7 102 149.9 134 199.8 60 298.3 11 211.9 142 152.2 7 53.6 10 287.7 54 182.2 71 298.7 70 186.1 32 103.5 9 68.2
Sweetwater 95 69.5 38 57.2 57 81.3 26 82.7 7 115.8 36 55.8 15 51.1 7 133.8 28 89.3 24 117.1 27 67.6 10 30.4 6 50.4Unknown 86 ‐‐‐ 64 ‐‐‐ 22 ‐‐‐ 60 ‐‐‐ 5 ‐‐‐ 16 ‐‐‐ <5 ‐‐‐ <5 ‐‐‐ <5 ‐‐‐ 11 ‐‐‐ 49 ‐‐‐ 22 ‐‐‐ <5 ‐‐‐*Rates per 100,000 population. County age‐adjusted rates per 100,000 2000 US standard population.**Harbison Crest/El Cajon is an aggregation of the Harbison Crest and El Cajon SRAs. Due to geographic limitations, the Harbison Crest SRA is not shown alone. See the Data Guide for more information.
***Numbers may not add up to totals due to unknown or missing details.
†Overdose/Poisoning‐related hospitaliza on refers to (principal diagnosis) ICD‐9 Ecodes E850‐E869, E950‐E952, E962, E972, E980‐E982. This includes all intents.
‡API includes Asian, Pacific Islander, Na ve Hawaiian. Other includes 2 or more races, Na ve American/Alaska Na ve, American Indian, or other.
§Rates not calculated for fewer than 5 events. Rates not calculated in cases where zip code is unknown.
Source: Emergency Department Discharge Database (CA OSHPD), County of San Diego, Health & Human Services Agency, Public Health Services, Emergency Medical Services; SANDAG, Current Population Estimates, 10/2012.
Prepared by: County of San Diego, Health & Human Services Agency, Public Health Services, Community Health Statistics Unit, 2013.
Ages 65+API‡ Other‡ Ages 0‐14Geography2011 Total
Gender
Overdose/Poisoning† Emergency Department Discharges Among San Diego County Residents by Loca on of Residence, 2011 Detail
Race/Ethnicity Age Group
Male Female White Black Hispanic Ages 15‐24 Ages 25‐44 Ages 45‐64
County of San Diego, Health & Human Services Agency, Public Health Services, Community Health Statisitcs Unit Page 97

Personality Disorders
County of San Diego, Health & Human Services Agency, Public Health Services, Community Health Statisitcs Unit Page 98

No. Rate* No. Rate* No. Rate* No. Rate* No. Rate* No. Rate* No. Rate* No. Rate* No. Rate* No. Rate* No. Rate*
San Diego County (Actual Rate) 48 1.6 34 1.1
San Diego County (Age‐Adjusted Rate) 48 1.5 34 1.1
Central Region 6 1.2 7 1.4
Central San Diego 5 3.0 <5 §
Mid‐City <5 § <5 §
Southeast San Diego <5 § <5 §
East Region 15 3.2 5 1.1
Alpine <5 § <5 §
El Cajon 7 5.6 <5 §
Harbison Crest/El Cajon** 7 5.0 <5 §
Jamul <5 § <5 §
La Mesa <5 § <5 §
Laguna‐Pine Valley <5 § <5 §
Lakeside <5 § <5 §
Lemon Grove <5 § <5 §
Mountain Empire <5 § <5 §
Santee <5 § <5 §
Spring Valley <5 § <5 §
North Central Region 7 1.2 8 1.3
Coastal <5 § <5 §
Del Mar‐Mira Mesa <5 § <5 §
Elliott‐Navajo <5 § <5 §
Kearny Mesa <5 § <5 §
Miramar <5 § <5 §
Peninsula <5 § <5 §
University <5 § <5 §
North Coastal Region <5 § <5 §
Carlsbad <5 § <5 §
Oceanside <5 § <5 §
Pendleton <5 § <5 §
San Dieguito <5 § <5 §
Vista <5 § <5 §
North Inland Region 9 1.6 <5 §
Anza‐Borrego Springs <5 § <5 §
Escondido 6 3.7 <5 §
Fallbrook <5 § <5 §
North San Diego <5 § <5 §
Palomar‐Julian <5 § <5 §
Pauma <5 § <5 §
Poway <5 § <5 §
Ramona <5 § <5 §
San Marcos <5 § <5 §
Valley Center <5 § <5 §
South Region 9 1.9 8 1.7
Chula Vista <5 § <5 §
Coronado <5 § <5 §
National City <5 § <5 §
South Bay 7 5.2 6 4.4
Sweetwater <5 § <5 §Unknown <5 ‐‐‐ <5 ‐‐‐*Rates per 100,000 population. County age‐adjusted rates per 100,000 2000 US standard population.**Harbison Crest/El Cajon is an aggregation of the Harbison Crest and El Cajon SRAs. Due to geographic limitations, the Harbison Crest SRA is not shown alone. See the Data Guide for more information.†Personality disorder hospitaliza on refers to (principal diagnosis) ICD‐9 code 301.§Rates not calculated for fewer than 5 events. Rates not calculated in cases where zip code is unknown.Source: Patient Discharge Database (CA OSHPD), County of San Diego, Health & Human Services Agency, Public Health Services, Epidemiology & Immunization Services Branch; SANDAG, Current Population Estimates, 10/2012.Prepared by: County of San Diego, Health & Human Services Agency, Public Health Services, Community Health Statistics Unit, 2013.
Personality Disorder† Hospitaliza ons Among San Diego County Residents by Location of Residence
Geography2010 Total 2011 Total 2012 Total 2013 Total 2014 Total 2015 Total 2016 Total 2017 Total 2018 Total 2019 Total 2020 Total
County of San Diego, Health & Human Services Agency, Public Health Services, Community Health Statisitcs Unit Page 99

No. Rate* No. Rate* No. Rate* No. Rate* No. Rate* No. Rate* No. Rate* No. Rate* No. Rate* No. Rate* No. Rate* No. Rate* No. Rate*
San Diego County (Actual Rate) 48 1.6 18 1.2 30 1.9 36 2.4 <5 § 7 0.7 <5 § <5 § <5 § 10 2.0 16 1.8 18 2.4 <5 §
San Diego County (Age‐Adjusted Rate) 48 1.5
Central Region 6 1.2 <5 § <5 § 6 4.2 <5 § <5 § <5 § <5 § <5 § <5 § <5 § <5 § <5 §
Central San Diego 5 3.0 <5 § <5 § 5 6.1 <5 § <5 § <5 § <5 § <5 § <5 § <5 § <5 § <5 §
Mid‐City <5 § <5 § <5 § <5 § <5 § <5 § <5 § <5 § <5 § <5 § <5 § <5 § <5 §
Southeast San Diego <5 § <5 § <5 § <5 § <5 § <5 § <5 § <5 § <5 § <5 § <5 § <5 § <5 §
East Region 15 3.2 7 3.1 8 3.4 10 3.6 <5 § <5 § <5 § <5 § <5 § <5 § <5 § 9 7.1 <5 §
Alpine <5 § <5 § <5 § <5 § <5 § <5 § <5 § <5 § <5 § <5 § <5 § <5 § <5 §
El Cajon 7 5.6 <5 § <5 § 6 8.1 <5 § <5 § <5 § <5 § <5 § <5 § <5 § <5 § <5 §
Harbison Crest/El Cajon** 7 5.0 <5 § <5 § 6 7.0 <5 § <5 § <5 § <5 § <5 § <5 § <5 § <5 § <5 §
Jamul <5 § <5 § <5 § <5 § <5 § <5 § <5 § <5 § <5 § <5 § <5 § <5 § <5 §
La Mesa <5 § <5 § <5 § <5 § <5 § <5 § <5 § <5 § <5 § <5 § <5 § <5 § <5 §
Laguna‐Pine Valley <5 § <5 § <5 § <5 § <5 § <5 § <5 § <5 § <5 § <5 § <5 § <5 § <5 §
Lakeside <5 § <5 § <5 § <5 § <5 § <5 § <5 § <5 § <5 § <5 § <5 § <5 § <5 §
Lemon Grove <5 § <5 § <5 § <5 § <5 § <5 § <5 § <5 § <5 § <5 § <5 § <5 § <5 §
Mountain Empire <5 § <5 § <5 § <5 § <5 § <5 § <5 § <5 § <5 § <5 § <5 § <5 § <5 §
Santee <5 § <5 § <5 § <5 § <5 § <5 § <5 § <5 § <5 § <5 § <5 § <5 § <5 §
Spring Valley <5 § <5 § <5 § <5 § <5 § <5 § <5 § <5 § <5 § <5 § <5 § <5 § <5 §
North Central Region 7 1.2 <5 § <5 § 6 1.6 <5 § <5 § <5 § <5 § <5 § <5 § 5 2.6 <5 § <5 §
Coastal <5 § <5 § <5 § <5 § <5 § <5 § <5 § <5 § <5 § <5 § <5 § <5 § <5 §
Del Mar‐Mira Mesa <5 § <5 § <5 § <5 § <5 § <5 § <5 § <5 § <5 § <5 § <5 § <5 § <5 §
Elliott‐Navajo <5 § <5 § <5 § <5 § <5 § <5 § <5 § <5 § <5 § <5 § <5 § <5 § <5 §
Kearny Mesa <5 § <5 § <5 § <5 § <5 § <5 § <5 § <5 § <5 § <5 § <5 § <5 § <5 §
Miramar <5 § <5 § <5 § <5 § <5 § <5 § <5 § <5 § <5 § <5 § <5 § <5 § <5 §
Peninsula <5 § <5 § <5 § <5 § <5 § <5 § <5 § <5 § <5 § <5 § <5 § <5 § <5 §
University <5 § <5 § <5 § <5 § <5 § <5 § <5 § <5 § <5 § <5 § <5 § <5 § <5 §
North Coastal Region <5 § <5 § <5 § <5 § <5 § <5 § <5 § <5 § <5 § <5 § <5 § <5 § <5 §
Carlsbad <5 § <5 § <5 § <5 § <5 § <5 § <5 § <5 § <5 § <5 § <5 § <5 § <5 §
Oceanside <5 § <5 § <5 § <5 § <5 § <5 § <5 § <5 § <5 § <5 § <5 § <5 § <5 §
Pendleton <5 § <5 § <5 § <5 § <5 § <5 § <5 § <5 § <5 § <5 § <5 § <5 § <5 §
San Dieguito <5 § <5 § <5 § <5 § <5 § <5 § <5 § <5 § <5 § <5 § <5 § <5 § <5 §
Vista <5 § <5 § <5 § <5 § <5 § <5 § <5 § <5 § <5 § <5 § <5 § <5 § <5 §
North Inland Region 9 1.6 <5 § 6 2.1 8 2.5 <5 § <5 § <5 § <5 § <5 § <5 § <5 § <5 § <5 §
Anza‐Borrego Springs <5 § <5 § <5 § <5 § <5 § <5 § <5 § <5 § <5 § <5 § <5 § <5 § <5 §
Escondido 6 3.7 <5 § <5 § 5 7.0 <5 § <5 § <5 § <5 § <5 § <5 § <5 § <5 § <5 §
Fallbrook <5 § <5 § <5 § <5 § <5 § <5 § <5 § <5 § <5 § <5 § <5 § <5 § <5 §
North San Diego <5 § <5 § <5 § <5 § <5 § <5 § <5 § <5 § <5 § <5 § <5 § <5 § <5 §
Palomar‐Julian <5 § <5 § <5 § <5 § <5 § <5 § <5 § <5 § <5 § <5 § <5 § <5 § <5 §
Pauma <5 § <5 § <5 § <5 § <5 § <5 § <5 § <5 § <5 § <5 § <5 § <5 § <5 §
Poway <5 § <5 § <5 § <5 § <5 § <5 § <5 § <5 § <5 § <5 § <5 § <5 § <5 §
Ramona <5 § <5 § <5 § <5 § <5 § <5 § <5 § <5 § <5 § <5 § <5 § <5 § <5 §
San Marcos <5 § <5 § <5 § <5 § <5 § <5 § <5 § <5 § <5 § <5 § <5 § <5 § <5 §
Valley Center <5 § <5 § <5 § <5 § <5 § <5 § <5 § <5 § <5 § <5 § <5 § <5 § <5 §
South Region 9 1.9 <5 § 7 3.0 6 6.1 <5 § <5 § <5 § <5 § <5 § <5 § 6 4.5 <5 § <5 §
Chula Vista <5 § <5 § <5 § <5 § <5 § <5 § <5 § <5 § <5 § <5 § <5 § <5 § <5 §
Coronado <5 § <5 § <5 § <5 § <5 § <5 § <5 § <5 § <5 § <5 § <5 § <5 § <5 §
National City <5 § <5 § <5 § <5 § <5 § <5 § <5 § <5 § <5 § <5 § <5 § <5 § <5 §
South Bay 7 5.2 <5 § 6 9.0 5 24.4 <5 § <5 § <5 § <5 § <5 § <5 § 6 15.8 <5 § <5 §
Sweetwater <5 § <5 § <5 § <5 § <5 § <5 § <5 § <5 § <5 § <5 § <5 § <5 § <5 §Unknown <5 ‐‐‐ <5 ‐‐‐ <5 ‐‐‐ <5 ‐‐‐ <5 ‐‐‐ <5 ‐‐‐ <5 ‐‐‐ <5 ‐‐‐ <5 ‐‐‐ <5 ‐‐‐ <5 ‐‐‐ <5 ‐‐‐ <5 ‐‐‐*Rates per 100,000 population. County age‐adjusted rates per 100,000 2000 US standard population.**Harbison Crest/El Cajon is an aggregation of the Harbison Crest and El Cajon SRAs. Due to geographic limitations, the Harbison Crest SRA is not shown alone. See the Data Guide for more information.
***Numbers may not add up to totals due to unknown or missing details.
†Personality disorder hospitaliza on refers to (principal diagnosis) ICD‐9 code 301.
‡API includes Asian, Pacific Islander, Na ve Hawaiian. Other includes 2 or more races, Na ve American/Alaska Na ve, American Indian, or other.
§Rates not calculated for fewer than 5 events. Rates not calculated in cases where zip code is unknown.
Source: Patient Discharge Database (CA OSHPD), County of San Diego, Health & Human Services Agency, Public Health Services, Epidemiology & Immunization Services Branch; SANDAG, Current Population Estimates, 10/2012.
Prepared by: County of San Diego, Health & Human Services Agency, Public Health Services, Community Health Statistics Unit, 2013.
Ages 0‐14 Ages 15‐24 Ages 25‐44 Ages 45‐64 Ages 65+
Personality Disorder† Hospitaliza ons Among San Diego County Residents by Loca on of Residence, 2010 Detail
Geography2010 Total
Gender Race/Ethnicity Age Group
Male Female White Black Hispanic API‡ Other‡
County of San Diego, Health & Human Services Agency, Public Health Services, Community Health Statisitcs Unit Page 100

No. Rate* No. Rate* No. Rate* No. Rate* No. Rate* No. Rate* No. Rate* No. Rate* No. Rate* No. Rate* No. Rate* No. Rate* No. Rate*
San Diego County (Actual Rate) 34 1.1 11 0.7 23 1.5 18 1.2 <5 § 11 1.1 <5 § <5 § <5 § 8 1.6 14 1.6 7 0.9 <5 §
San Diego County (Age‐Adjusted Rate) 34 1.1
Central Region 7 1.4 <5 § 5 2.1 <5 § <5 § <5 § <5 § <5 § <5 § <5 § <5 § <5 § <5 §
Central San Diego <5 § <5 § <5 § <5 § <5 § <5 § <5 § <5 § <5 § <5 § <5 § <5 § <5 §
Mid‐City <5 § <5 § <5 § <5 § <5 § <5 § <5 § <5 § <5 § <5 § <5 § <5 § <5 §
Southeast San Diego <5 § <5 § <5 § <5 § <5 § <5 § <5 § <5 § <5 § <5 § <5 § <5 § <5 §
East Region 5 1.1 <5 § <5 § <5 § <5 § <5 § <5 § <5 § <5 § <5 § <5 § <5 § <5 §
Alpine <5 § <5 § <5 § <5 § <5 § <5 § <5 § <5 § <5 § <5 § <5 § <5 § <5 §
El Cajon <5 § <5 § <5 § <5 § <5 § <5 § <5 § <5 § <5 § <5 § <5 § <5 § <5 §
Harbison Crest/El Cajon** <5 § <5 § <5 § <5 § <5 § <5 § <5 § <5 § <5 § <5 § <5 § <5 § <5 §
Jamul <5 § <5 § <5 § <5 § <5 § <5 § <5 § <5 § <5 § <5 § <5 § <5 § <5 §
La Mesa <5 § <5 § <5 § <5 § <5 § <5 § <5 § <5 § <5 § <5 § <5 § <5 § <5 §
Laguna‐Pine Valley <5 § <5 § <5 § <5 § <5 § <5 § <5 § <5 § <5 § <5 § <5 § <5 § <5 §
Lakeside <5 § <5 § <5 § <5 § <5 § <5 § <5 § <5 § <5 § <5 § <5 § <5 § <5 §
Lemon Grove <5 § <5 § <5 § <5 § <5 § <5 § <5 § <5 § <5 § <5 § <5 § <5 § <5 §
Mountain Empire <5 § <5 § <5 § <5 § <5 § <5 § <5 § <5 § <5 § <5 § <5 § <5 § <5 §
Santee <5 § <5 § <5 § <5 § <5 § <5 § <5 § <5 § <5 § <5 § <5 § <5 § <5 §
Spring Valley <5 § <5 § <5 § <5 § <5 § <5 § <5 § <5 § <5 § <5 § <5 § <5 § <5 §
North Central Region 8 1.3 <5 § 5 1.7 <5 § <5 § <5 § <5 § <5 § <5 § <5 § <5 § <5 § <5 §
Coastal <5 § <5 § <5 § <5 § <5 § <5 § <5 § <5 § <5 § <5 § <5 § <5 § <5 §
Del Mar‐Mira Mesa <5 § <5 § <5 § <5 § <5 § <5 § <5 § <5 § <5 § <5 § <5 § <5 § <5 §
Elliott‐Navajo <5 § <5 § <5 § <5 § <5 § <5 § <5 § <5 § <5 § <5 § <5 § <5 § <5 §
Kearny Mesa <5 § <5 § <5 § <5 § <5 § <5 § <5 § <5 § <5 § <5 § <5 § <5 § <5 §
Miramar <5 § <5 § <5 § <5 § <5 § <5 § <5 § <5 § <5 § <5 § <5 § <5 § <5 §
Peninsula <5 § <5 § <5 § <5 § <5 § <5 § <5 § <5 § <5 § <5 § <5 § <5 § <5 §
University <5 § <5 § <5 § <5 § <5 § <5 § <5 § <5 § <5 § <5 § <5 § <5 § <5 §
North Coastal Region <5 § <5 § <5 § <5 § <5 § <5 § <5 § <5 § <5 § <5 § <5 § <5 § <5 §
Carlsbad <5 § <5 § <5 § <5 § <5 § <5 § <5 § <5 § <5 § <5 § <5 § <5 § <5 §
Oceanside <5 § <5 § <5 § <5 § <5 § <5 § <5 § <5 § <5 § <5 § <5 § <5 § <5 §
Pendleton <5 § <5 § <5 § <5 § <5 § <5 § <5 § <5 § <5 § <5 § <5 § <5 § <5 §
San Dieguito <5 § <5 § <5 § <5 § <5 § <5 § <5 § <5 § <5 § <5 § <5 § <5 § <5 §
Vista <5 § <5 § <5 § <5 § <5 § <5 § <5 § <5 § <5 § <5 § <5 § <5 § <5 §
North Inland Region <5 § <5 § <5 § <5 § <5 § <5 § <5 § <5 § <5 § <5 § <5 § <5 § <5 §
Anza‐Borrego Springs <5 § <5 § <5 § <5 § <5 § <5 § <5 § <5 § <5 § <5 § <5 § <5 § <5 §
Escondido <5 § <5 § <5 § <5 § <5 § <5 § <5 § <5 § <5 § <5 § <5 § <5 § <5 §
Fallbrook <5 § <5 § <5 § <5 § <5 § <5 § <5 § <5 § <5 § <5 § <5 § <5 § <5 §
North San Diego <5 § <5 § <5 § <5 § <5 § <5 § <5 § <5 § <5 § <5 § <5 § <5 § <5 §
Palomar‐Julian <5 § <5 § <5 § <5 § <5 § <5 § <5 § <5 § <5 § <5 § <5 § <5 § <5 §
Pauma <5 § <5 § <5 § <5 § <5 § <5 § <5 § <5 § <5 § <5 § <5 § <5 § <5 §
Poway <5 § <5 § <5 § <5 § <5 § <5 § <5 § <5 § <5 § <5 § <5 § <5 § <5 §
Ramona <5 § <5 § <5 § <5 § <5 § <5 § <5 § <5 § <5 § <5 § <5 § <5 § <5 §
San Marcos <5 § <5 § <5 § <5 § <5 § <5 § <5 § <5 § <5 § <5 § <5 § <5 § <5 §
Valley Center <5 § <5 § <5 § <5 § <5 § <5 § <5 § <5 § <5 § <5 § <5 § <5 § <5 §
South Region 8 1.7 <5 § 7 3.0 <5 § <5 § <5 § <5 § <5 § <5 § <5 § <5 § <5 § <5 §
Chula Vista <5 § <5 § <5 § <5 § <5 § <5 § <5 § <5 § <5 § <5 § <5 § <5 § <5 §
Coronado <5 § <5 § <5 § <5 § <5 § <5 § <5 § <5 § <5 § <5 § <5 § <5 § <5 §
National City <5 § <5 § <5 § <5 § <5 § <5 § <5 § <5 § <5 § <5 § <5 § <5 § <5 §
South Bay 6 4.4 <5 § 6 8.9 <5 § <5 § <5 § <5 § <5 § <5 § <5 § <5 § <5 § <5 §
Sweetwater <5 § <5 § <5 § <5 § <5 § <5 § <5 § <5 § <5 § <5 § <5 § <5 § <5 §Unknown <5 ‐‐‐ <5 ‐‐‐ <5 ‐‐‐ <5 ‐‐‐ <5 ‐‐‐ <5 ‐‐‐ <5 ‐‐‐ <5 ‐‐‐ <5 ‐‐‐ <5 ‐‐‐ <5 ‐‐‐ <5 ‐‐‐ <5 ‐‐‐*Rates per 100,000 population. County age‐adjusted rates per 100,000 2000 US standard population.**Harbison Crest/El Cajon is an aggregation of the Harbison Crest and El Cajon SRAs. Due to geographic limitations, the Harbison Crest SRA is not shown alone. See the Data Guide for more information.
***Numbers may not add up to totals due to unknown or missing details.
†Personality disorder hospitaliza on refers to (principal diagnosis) ICD‐9 code 301.
‡API includes Asian, Pacific Islander, Na ve Hawaiian. Other includes 2 or more races, Na ve American/Alaska Na ve, American Indian, or other.
§Rates not calculated for fewer than 5 events. Rates not calculated in cases where zip code is unknown.
Source: Patient Discharge Database (CA OSHPD), County of San Diego, Health & Human Services Agency, Public Health Services, Epidemiology & Immunization Services Branch; SANDAG, Current Population Estimates, 10/2012.
Prepared by: County of San Diego, Health & Human Services Agency, Public Health Services, Community Health Statistics Unit, 2013.
Gender Race/Ethnicity Age Group
Male Female White Black Hispanic Ages 65+API‡ Other‡ Ages 0‐14 Ages 15‐24 Ages 25‐44 Ages 45‐64Geography2011 Total
Personality Disorder† Hospitaliza ons Among San Diego County Residents by Loca on of Residence, 2011 Detail
County of San Diego, Health & Human Services Agency, Public Health Services, Community Health Statisitcs Unit Page 101

No. Rate* No. Rate* No. Rate* No. Rate* No. Rate* No. Rate* No. Rate* No. Rate* No. Rate* No. Rate* No. Rate*
San Diego County (Actual Rate) 84 2.7 85 2.7
San Diego County (Age‐Adjusted Rate) 84 2.6 85 2.7
Central Region 17 3.5 14 2.9
Central San Diego 7 4.2 5 3.0
Mid‐City 6 3.7 <5 §
Southeast San Diego <5 § 6 3.8
East Region 24 5.2 27 5.8
Alpine <5 § <5 §
El Cajon 8 6.4 6 4.8
Harbison Crest/El Cajon** 11 7.9 14 10.0
Jamul <5 § <5 §
La Mesa <5 § <5 §
Laguna‐Pine Valley <5 § <5 §
Lakeside <5 § <5 §
Lemon Grove <5 § <5 §
Mountain Empire <5 § <5 §
Santee <5 § <5 §
Spring Valley <5 § <5 §
North Central Region 5 0.8 12 2.0
Coastal <5 § <5 §
Del Mar‐Mira Mesa <5 § <5 §
Elliott‐Navajo <5 § <5 §
Kearny Mesa <5 § <5 §
Miramar <5 § <5 §
Peninsula <5 § <5 §
University <5 § <5 §
North Coastal Region 11 2.2 13 2.5
Carlsbad <5 § <5 §
Oceanside 7 4.4 <5 §
Pendleton <5 § <5 §
San Dieguito <5 § <5 §
Vista <5 § 7 6.9
North Inland Region 7 1.2 12 2.1
Anza‐Borrego Springs <5 § <5 §
Escondido <5 § 7 4.3
Fallbrook <5 § <5 §
North San Diego <5 § <5 §
Palomar‐Julian <5 § <5 §
Pauma <5 § <5 §
Poway <5 § <5 §
Ramona <5 § <5 §
San Marcos <5 § <5 §
Valley Center <5 § <5 §
South Region 14 3.0 6 1.3
Chula Vista 10 8.7 <5 §
Coronado <5 § <5 §
National City <5 § <5 §
South Bay <5 § <5 §
Sweetwater <5 § <5 §Unknown 6 ‐‐‐ <5 ‐‐‐*Rates per 100,000 population. County age‐adjusted rates per 100,000 2000 US standard population.**Harbison Crest/El Cajon is an aggregation of the Harbison Crest and El Cajon SRAs. Due to geographic limitations, the Harbison Crest SRA is not shown alone. See the Data Guide for more information.†Personality disorder Emergency Department Discharge refers to (principal diagnosis) ICD‐9 code 301.§Rates not calculated for fewer than 5 events. Rates not calculated in cases where zip code is unknown.Source: Emergency Department Discharge Database (CA OSHPD), County of San Diego, Health & Human Services Agency, Public Health Services, Emergency Medical Services; SANDAG, Current Population Estimates, 10/2012.Prepared by: County of San Diego, Health & Human Services Agency, Public Health Services, Community Health Statistics Unit, 2013.
Personality Disorder† Emergency Department Discharges Among San Diego County Residents by Loca on of Residence
Geography2010 Total 2011 Total 2012 Total 2013 Total 2014 Total 2015 Total 2016 Total 2017 Total 2018 Total 2019 Total 2020 Total
County of San Diego, Health & Human Services Agency, Public Health Services, Community Health Statisitcs Unit Page 102

No. Rate* No. Rate* No. Rate* No. Rate* No. Rate* No. Rate* No. Rate* No. Rate* No. Rate* No. Rate* No. Rate* No. Rate* No. Rate*
San Diego County (Actual Rate) 84 2.7 50 3.2 34 2.2 48 3.2 10 6.8 20 2.0 <5 § <5 § 16 2.7 22 4.4 21 2.4 16 2.1 9 2.6
San Diego County (Age‐Adjusted Rate) 84 2.6
Central Region 17 3.5 10 4.0 7 3.0 10 7.0 <5 § <5 § <5 § <5 § <5 § <5 § 11 6.8 <5 § <5 §
Central San Diego 7 4.2 <5 § <5 § <5 § <5 § <5 § <5 § <5 § <5 § <5 § <5 § <5 § <5 §
Mid‐City 6 3.7 <5 § <5 § <5 § <5 § <5 § <5 § <5 § <5 § <5 § <5 § <5 § <5 §
Southeast San Diego <5 § <5 § <5 § <5 § <5 § <5 § <5 § <5 § <5 § <5 § <5 § <5 § <5 §
East Region 24 5.2 14 6.1 10 4.3 11 3.9 <5 § 6 5.2 <5 § <5 § 6 6.7 6 8.8 <5 § <5 § <5 §
Alpine <5 § <5 § <5 § <5 § <5 § <5 § <5 § <5 § <5 § <5 § <5 § <5 § <5 §
El Cajon 8 6.4 <5 § <5 § <5 § <5 § <5 § <5 § <5 § <5 § <5 § <5 § <5 § <5 §
Harbison Crest/El Cajon** 11 7.9 6 8.8 5 7.0 <5 § <5 § <5 § <5 § <5 § <5 § <5 § <5 § <5 § <5 §
Jamul <5 § <5 § <5 § <5 § <5 § <5 § <5 § <5 § <5 § <5 § <5 § <5 § <5 §
La Mesa <5 § <5 § <5 § <5 § <5 § <5 § <5 § <5 § <5 § <5 § <5 § <5 § <5 §
Laguna‐Pine Valley <5 § <5 § <5 § <5 § <5 § <5 § <5 § <5 § <5 § <5 § <5 § <5 § <5 §
Lakeside <5 § <5 § <5 § <5 § <5 § <5 § <5 § <5 § <5 § <5 § <5 § <5 § <5 §
Lemon Grove <5 § <5 § <5 § <5 § <5 § <5 § <5 § <5 § <5 § <5 § <5 § <5 § <5 §
Mountain Empire <5 § <5 § <5 § <5 § <5 § <5 § <5 § <5 § <5 § <5 § <5 § <5 § <5 §
Santee <5 § <5 § <5 § <5 § <5 § <5 § <5 § <5 § <5 § <5 § <5 § <5 § <5 §
Spring Valley <5 § <5 § <5 § <5 § <5 § <5 § <5 § <5 § <5 § <5 § <5 § <5 § <5 §
North Central Region 5 0.8 <5 § <5 § <5 § <5 § <5 § <5 § <5 § <5 § <5 § <5 § <5 § <5 §
Coastal <5 § <5 § <5 § <5 § <5 § <5 § <5 § <5 § <5 § <5 § <5 § <5 § <5 §
Del Mar‐Mira Mesa <5 § <5 § <5 § <5 § <5 § <5 § <5 § <5 § <5 § <5 § <5 § <5 § <5 §
Elliott‐Navajo <5 § <5 § <5 § <5 § <5 § <5 § <5 § <5 § <5 § <5 § <5 § <5 § <5 §
Kearny Mesa <5 § <5 § <5 § <5 § <5 § <5 § <5 § <5 § <5 § <5 § <5 § <5 § <5 §
Miramar <5 § <5 § <5 § <5 § <5 § <5 § <5 § <5 § <5 § <5 § <5 § <5 § <5 §
Peninsula <5 § <5 § <5 § <5 § <5 § <5 § <5 § <5 § <5 § <5 § <5 § <5 § <5 §
University <5 § <5 § <5 § <5 § <5 § <5 § <5 § <5 § <5 § <5 § <5 § <5 § <5 §
North Coastal Region 11 2.2 10 3.9 <5 § 8 2.7 <5 § <5 § <5 § <5 § <5 § 5 6.0 <5 § <5 § <5 §
Carlsbad <5 § <5 § <5 § <5 § <5 § <5 § <5 § <5 § <5 § <5 § <5 § <5 § <5 §
Oceanside 7 4.4 6 7.6 <5 § 5 6.7 <5 § <5 § <5 § <5 § <5 § <5 § <5 § <5 § <5 §
Pendleton <5 § <5 § <5 § <5 § <5 § <5 § <5 § <5 § <5 § <5 § <5 § <5 § <5 §
San Dieguito <5 § <5 § <5 § <5 § <5 § <5 § <5 § <5 § <5 § <5 § <5 § <5 § <5 §
Vista <5 § <5 § <5 § <5 § <5 § <5 § <5 § <5 § <5 § <5 § <5 § <5 § <5 §
North Inland Region 7 1.2 <5 § <5 § 5 1.6 <5 § <5 § <5 § <5 § <5 § <5 § <5 § <5 § <5 §
Anza‐Borrego Springs <5 § <5 § <5 § <5 § <5 § <5 § <5 § <5 § <5 § <5 § <5 § <5 § <5 §
Escondido <5 § <5 § <5 § <5 § <5 § <5 § <5 § <5 § <5 § <5 § <5 § <5 § <5 §
Fallbrook <5 § <5 § <5 § <5 § <5 § <5 § <5 § <5 § <5 § <5 § <5 § <5 § <5 §
North San Diego <5 § <5 § <5 § <5 § <5 § <5 § <5 § <5 § <5 § <5 § <5 § <5 § <5 §
Palomar‐Julian <5 § <5 § <5 § <5 § <5 § <5 § <5 § <5 § <5 § <5 § <5 § <5 § <5 §
Pauma <5 § <5 § <5 § <5 § <5 § <5 § <5 § <5 § <5 § <5 § <5 § <5 § <5 §
Poway <5 § <5 § <5 § <5 § <5 § <5 § <5 § <5 § <5 § <5 § <5 § <5 § <5 §
Ramona <5 § <5 § <5 § <5 § <5 § <5 § <5 § <5 § <5 § <5 § <5 § <5 § <5 §
San Marcos <5 § <5 § <5 § <5 § <5 § <5 § <5 § <5 § <5 § <5 § <5 § <5 § <5 §
Valley Center <5 § <5 § <5 § <5 § <5 § <5 § <5 § <5 § <5 § <5 § <5 § <5 § <5 §
South Region 14 3.0 8 3.4 6 2.6 6 6.1 <5 § 5 § <5 § <5 § <5 § 6 7.4 <5 § 5 4.7 <5 §
Chula Vista 10 8.7 5 9.0 5 8.4 <5 § <5 § 5 § <5 § <5 § <5 § <5 § <5 § <5 § <5 §
Coronado <5 § <5 § <5 § <5 § <5 § <5 § <5 § <5 § <5 § <5 § <5 § <5 § <5 §
National City <5 § <5 § <5 § <5 § <5 § <5 § <5 § <5 § <5 § <5 § <5 § <5 § <5 §
South Bay <5 § <5 § <5 § <5 § <5 § <5 § <5 § <5 § <5 § <5 § <5 § <5 § <5 §
Sweetwater <5 § <5 § <5 § <5 § <5 § <5 § <5 § <5 § <5 § <5 § <5 § <5 § <5 §Unknown 6 ‐‐‐ <5 ‐‐‐ <5 ‐‐‐ <5 ‐‐‐ <5 ‐‐‐ <5 ‐‐‐ <5 ‐‐‐ <5 ‐‐‐ <5 ‐‐‐ <5 ‐‐‐ <5 ‐‐‐ <5 ‐‐‐ <5 ‐‐‐*Rates per 100,000 population. County age‐adjusted rates per 100,000 2000 US standard population.**Harbison Crest/El Cajon is an aggregation of the Harbison Crest and El Cajon SRAs. Due to geographic limitations, the Harbison Crest SRA is not shown alone. See the Data Guide for more information.
***Numbers may not add up to totals due to unknown or missing details.
†Personality disorder Emergency Department Discharge refers to (principal diagnosis) ICD‐9 code 301.
‡API includes Asian, Pacific Islander, Na ve Hawaiian. Other includes 2 or more races, Na ve American/Alaska Na ve, American Indian, or other.
§Rates not calculated for fewer than 5 events. Rates not calculated in cases where zip code is unknown.
Source: Emergency Department Discharge Database (CA OSHPD), County of San Diego, Health & Human Services Agency, Public Health Services, Emergency Medical Services; SANDAG, Current Population Estimates, 10/2012.
Prepared by: County of San Diego, Health & Human Services Agency, Public Health Services, Community Health Statistics Unit, 2013.
Ages 0‐14 Ages 15‐24 Ages 25‐44 Ages 45‐64 Ages 65+
Personality Disorder† Emergency Department Discharges Among San Diego County Residents by Loca on of Residence, 2010 Detail
Geography2010 Total
Gender Race/Ethnicity Age Group
Male Female White Black Hispanic API‡ Other‡
County of San Diego, Health & Human Services Agency, Public Health Services, Community Health Statisitcs Unit Page 103

No. Rate* No. Rate* No. Rate* No. Rate* No. Rate* No. Rate* No. Rate* No. Rate* No. Rate* No. Rate* No. Rate* No. Rate* No. Rate*
San Diego County (Actual Rate) 85 2.7 50 3.2 35 2.3 47 3.1 12 8.4 15 1.5 <5 § 8 6.8 21 3.5 18 3.6 19 2.1 17 2.2 10 2.8
San Diego County (Age‐Adjusted Rate) 85 2.7
Central Region 14 2.9 8 3.2 6 2.5 5 3.5 <5 § <5 § <5 § <5 § 5 5.5 5 6.2 <5 § <5 § <5 §
Central San Diego 5 3.0 <5 § <5 § <5 § <5 § <5 § <5 § <5 § <5 § <5 § <5 § <5 § <5 §
Mid‐City <5 § <5 § <5 § <5 § <5 § <5 § <5 § <5 § <5 § <5 § <5 § <5 § <5 §
Southeast San Diego 6 3.8 <5 § <5 § <5 § <5 § <5 § <5 § <5 § <5 § <5 § <5 § <5 § <5 §
East Region 27 5.8 15 6.5 12 5.1 14 5.0 5 19.2 <5 § <5 § <5 § <5 § 5 7.2 11 9.1 7 5.4 <5 §
Alpine <5 § <5 § <5 § <5 § <5 § <5 § <5 § <5 § <5 § <5 § <5 § <5 § <5 §
El Cajon 6 4.8 <5 § <5 § <5 § <5 § <5 § <5 § <5 § <5 § <5 § <5 § <5 § <5 §
Harbison Crest/El Cajon** 14 10.0 8 11.6 6 8.4 8 9.4 <5 § <5 § <5 § <5 § <5 § <5 § 7 19.5 <5 § <5 §
Jamul <5 § <5 § <5 § <5 § <5 § <5 § <5 § <5 § <5 § <5 § <5 § <5 § <5 §
La Mesa <5 § <5 § <5 § <5 § <5 § <5 § <5 § <5 § <5 § <5 § <5 § <5 § <5 §
Laguna‐Pine Valley <5 § <5 § <5 § <5 § <5 § <5 § <5 § <5 § <5 § <5 § <5 § <5 § <5 §
Lakeside <5 § <5 § <5 § <5 § <5 § <5 § <5 § <5 § <5 § <5 § <5 § <5 § <5 §
Lemon Grove <5 § <5 § <5 § <5 § <5 § <5 § <5 § <5 § <5 § <5 § <5 § <5 § <5 §
Mountain Empire <5 § <5 § <5 § <5 § <5 § <5 § <5 § <5 § <5 § <5 § <5 § <5 § <5 §
Santee <5 § <5 § <5 § <5 § <5 § <5 § <5 § <5 § <5 § <5 § <5 § <5 § <5 §
Spring Valley <5 § <5 § <5 § <5 § <5 § <5 § <5 § <5 § <5 § <5 § <5 § <5 § <5 §
North Central Region 12 2.0 7 2.3 5 1.7 6 1.6 <5 § <5 § <5 § <5 § 5 5.3 5 4.8 <5 § <5 § <5 §
Coastal <5 § <5 § <5 § <5 § <5 § <5 § <5 § <5 § <5 § <5 § <5 § <5 § <5 §
Del Mar‐Mira Mesa <5 § <5 § <5 § <5 § <5 § <5 § <5 § <5 § <5 § <5 § <5 § <5 § <5 §
Elliott‐Navajo <5 § <5 § <5 § <5 § <5 § <5 § <5 § <5 § <5 § <5 § <5 § <5 § <5 §
Kearny Mesa <5 § <5 § <5 § <5 § <5 § <5 § <5 § <5 § <5 § <5 § <5 § <5 § <5 §
Miramar <5 § <5 § <5 § <5 § <5 § <5 § <5 § <5 § <5 § <5 § <5 § <5 § <5 §
Peninsula <5 § <5 § <5 § <5 § <5 § <5 § <5 § <5 § <5 § <5 § <5 § <5 § <5 §
University <5 § <5 § <5 § <5 § <5 § <5 § <5 § <5 § <5 § <5 § <5 § <5 § <5 §
North Coastal Region 13 2.5 10 3.9 <5 § 8 2.7 <5 § <5 § <5 § <5 § <5 § <5 § <5 § <5 § <5 §
Carlsbad <5 § <5 § <5 § <5 § <5 § <5 § <5 § <5 § <5 § <5 § <5 § <5 § <5 §
Oceanside <5 § <5 § <5 § <5 § <5 § <5 § <5 § <5 § <5 § <5 § <5 § <5 § <5 §
Pendleton <5 § <5 § <5 § <5 § <5 § <5 § <5 § <5 § <5 § <5 § <5 § <5 § <5 §
San Dieguito <5 § <5 § <5 § <5 § <5 § <5 § <5 § <5 § <5 § <5 § <5 § <5 § <5 §
Vista 7 6.9 5 9.8 <5 § <5 § <5 § <5 § <5 § <5 § <5 § <5 § <5 § <5 § <5 §
North Inland Region 12 2.1 8 2.8 <5 § 10 3.2 <5 § <5 § <5 § <5 § 5 4.2 <5 § <5 § <5 § <5 §
Anza‐Borrego Springs <5 § <5 § <5 § <5 § <5 § <5 § <5 § <5 § <5 § <5 § <5 § <5 § <5 §
Escondido 7 4.3 6 7.4 <5 § 6 8.5 <5 § <5 § <5 § <5 § <5 § <5 § <5 § <5 § <5 §
Fallbrook <5 § <5 § <5 § <5 § <5 § <5 § <5 § <5 § <5 § <5 § <5 § <5 § <5 §
North San Diego <5 § <5 § <5 § <5 § <5 § <5 § <5 § <5 § <5 § <5 § <5 § <5 § <5 §
Palomar‐Julian <5 § <5 § <5 § <5 § <5 § <5 § <5 § <5 § <5 § <5 § <5 § <5 § <5 §
Pauma <5 § <5 § <5 § <5 § <5 § <5 § <5 § <5 § <5 § <5 § <5 § <5 § <5 §
Poway <5 § <5 § <5 § <5 § <5 § <5 § <5 § <5 § <5 § <5 § <5 § <5 § <5 §
Ramona <5 § <5 § <5 § <5 § <5 § <5 § <5 § <5 § <5 § <5 § <5 § <5 § <5 §
San Marcos <5 § <5 § <5 § <5 § <5 § <5 § <5 § <5 § <5 § <5 § <5 § <5 § <5 §
Valley Center <5 § <5 § <5 § <5 § <5 § <5 § <5 § <5 § <5 § <5 § <5 § <5 § <5 §
South Region 6 1.3 <5 § <5 § <5 § <5 § <5 § <5 § <5 § <5 § <5 § <5 § <5 § <5 §
Chula Vista <5 § <5 § <5 § <5 § <5 § <5 § <5 § <5 § <5 § <5 § <5 § <5 § <5 §
Coronado <5 § <5 § <5 § <5 § <5 § <5 § <5 § <5 § <5 § <5 § <5 § <5 § <5 §
National City <5 § <5 § <5 § <5 § <5 § <5 § <5 § <5 § <5 § <5 § <5 § <5 § <5 §
South Bay <5 § <5 § <5 § <5 § <5 § <5 § <5 § <5 § <5 § <5 § <5 § <5 § <5 §
Sweetwater <5 § <5 § <5 § <5 § <5 § <5 § <5 § <5 § <5 § <5 § <5 § <5 § <5 §Unknown <5 ‐‐‐ <5 ‐‐‐ <5 ‐‐‐ <5 ‐‐‐ <5 ‐‐‐ <5 ‐‐‐ <5 ‐‐‐ <5 ‐‐‐ <5 ‐‐‐ <5 ‐‐‐ <5 ‐‐‐ <5 ‐‐‐ <5 ‐‐‐*Rates per 100,000 population. County age‐adjusted rates per 100,000 2000 US standard population.**Harbison Crest/El Cajon is an aggregation of the Harbison Crest and El Cajon SRAs. Due to geographic limitations, the Harbison Crest SRA is not shown alone. See the Data Guide for more information.
***Numbers may not add up to totals due to unknown or missing details.
†Personality disorder Emergency Department Discharge refers to (principal diagnosis) ICD‐9 code 301.
‡API includes Asian, Pacific Islander, Na ve Hawaiian. Other includes 2 or more races, Na ve American/Alaska Na ve, American Indian, or other.
§Rates not calculated for fewer than 5 events. Rates not calculated in cases where zip code is unknown.
Source: Emergency Department Discharge Database (CA OSHPD), County of San Diego, Health & Human Services Agency, Public Health Services, Emergency Medical Services; SANDAG, Current Population Estimates, 10/2012.
Prepared by: County of San Diego, Health & Human Services Agency, Public Health Services, Community Health Statistics Unit, 2013.
Gender Race/Ethnicity Age Group
Male Female White Black Hispanic Ages 65+API‡ Other‡ Ages 0‐14 Ages 15‐24 Ages 25‐44 Ages 45‐64Geography2011 Total
Personality Disorder† Emergency Department Discharges Among San Diego County Residents by Loca on of Residence, 2011 Detail
County of San Diego, Health & Human Services Agency, Public Health Services, Community Health Statisitcs Unit Page 104

Schizophrenia and Other Psychotic Disorders
County of San Diego, Health & Human Services Agency, Public Health Services, Community Health Statisitcs Unit Page 105

No. Rate* No. Rate* No. Rate* No. Rate* No. Rate* No. Rate* No. Rate* No. Rate* No. Rate* No. Rate* No. Rate*
San Diego County (Actual Rate) 7,713 249.2 8,082 259.4
San Diego County (Age‐Adjusted Rate) 7,713 244.9 8,082 253.1
Central Region 2,587 534.0 2,641 543.9
Central San Diego 1,124 678.9 1,148 691.7
Mid‐City 559 342.9 600 367.7
Southeast San Diego 904 580.2 893 570.9
East Region 1,817 392.3 2,052 439.7
Alpine 79 525.4 78 514.5
El Cajon 538 432.0 720 574.8
Harbison Crest/El Cajon** 854 613.6 1,039 742.0
Jamul 43 226.8 38 216.2
La Mesa 173 292.8 204 340.1
Laguna‐Pine Valley <5 § <5 §
Lakeside 96 171.4 115 204.0
Lemon Grove 110 369.0 102 340.6
Mountain Empire 8 105.4 13 152.8
Santee 71 138.8 76 147.0
Spring Valley 380 469.1 386 472.2
North Central Region 724 119.9 758 124.3
Coastal 104 138.0 120 158.8
Del Mar‐Mira Mesa 123 78.1 133 83.9
Elliott‐Navajo 76 85.3 74 82.8
Kearny Mesa 323 213.6 321 211.6
Miramar <5 § <5 §
Peninsula 49 77.9 56 88.8
University 48 76.5 53 79.7
North Coastal Region 581 114.9 658 129.1
Carlsbad 79 68.9 100 86.3
Oceanside 239 149.6 268 167.4
Pendleton <5 § <5 §
San Dieguito 73 78.1 76 80.1
Vista 190 189.2 213 210.2
North Inland Region 672 118.0 663 115.4
Anza‐Borrego Springs 5 112.6 5 107.1
Escondido 317 194.5 304 185.1
Fallbrook 61 129.0 58 121.2
North San Diego 95 89.2 72 66.9
Palomar‐Julian 6 95.7 7 108.9
Pauma 5 67.0 <5 §
Poway 57 66.0 69 79.4
Ramona 31 88.9 35 98.8
San Marcos 73 81.1 88 97.6
Valley Center 22 94.3 21 89.5
South Region 1,332 284.3 1,310 279.0
Chula Vista 527 457.3 475 409.8
Coronado 17 68.8 27 115.7
National City 285 488.7 303 518.0
South Bay 393 291.3 408 301.9
Sweetwater 110 81.3 97 71.0Unknown <5 ‐‐‐ <5 ‐‐‐*Rates per 100,000 population. County age‐adjusted rates per 100,000 2000 US standard population.**Harbison Crest/El Cajon is an aggregation of the Harbison Crest and El Cajon SRAs. Due to geographic limitations, the Harbison Crest SRA is not shown alone. See the Data Guide for more information.†Schizophrenia and other psycho c disorder hospitaliza on refers to (principal diagnosis) ICD‐9 codes 293.81, 293.82, 295, 297, 298.§Rates not calculated for fewer than 5 events. Rates not calculated in cases where zip code is unknown.Source: Patient Discharge Database (CA OSHPD), County of San Diego, Health & Human Services Agency, Public Health Services, Epidemiology & Immunization Services Branch; SANDAG, Current Population Estimates, 10/2012.Prepared by: County of San Diego, Health & Human Services Agency, Public Health Services, Community Health Statistics Unit, 2013.
Schizophrenia and Other Psychotic Disorder† Hospitaliza ons Among San Diego County Residents by Location of Residence
Geography2010 Total 2011 Total 2012 Total 2013 Total 2014 Total 2015 Total 2016 Total 2017 Total 2018 Total 2019 Total 2020 Total
County of San Diego, Health & Human Services Agency, Public Health Services, Community Health Statisitcs Unit Page 106

No. Rate* No. Rate* No. Rate* No. Rate* No. Rate* No. Rate* No. Rate* No. Rate* No. Rate* No. Rate* No. Rate* No. Rate* No. Rate*
San Diego County (Actual Rate) 7,713 249.2 4,672 300.7 3,041 197.3 4,546 303.1 1,048 714.9 1,475 148.8 369 108.0 170 146.9 32 5.4 995 200.7 3,133 351.4 3,011 396.0 542 154.2
San Diego County (Age‐Adjusted Rate) 7,713 244.9
Central Region 2,587 534.0 1,682 679.1 905 382.3 1,372 955.2 591 1042.7 451 220.7 115 180.0 38 239.6 5 5.6 230 276.6 1,135 703.0 1,101 1031.7 116 268.0
Central San Diego 1,124 678.9 737 814.2 387 515.6 673 817.8 229 1994.4 170 295.0 21 247.1 19 334.7 <5 § 63 274.0 507 727.1 496 1307.1 56 360.3
Mid‐City 559 342.9 330 406.4 229 279.8 280 602.8 120 621.2 95 138.8 53 225.0 8 152.3 <5 § 52 156.3 233 462.3 243 741.6 28 219.0
Southeast San Diego 904 580.2 615 809.6 289 362.0 419 2812.3 242 935.2 186 237.6 41 128.8 11 223.3 <5 § 115 428.0 395 955.9 362 1005.5 32 214.0
East Region 1,817 392.3 1,060 464.8 757 322.0 1,265 453.0 178 669.7 261 225.8 51 246.7 31 147.7 7 7.8 230 335.6 651 537.1 773 606.5 156 278.8
Alpine 79 525.4 37 496.0 42 554.4 46 389.5 6 3773.6 18 812.6 <5 § <5 § <5 § 17 861.6 46 1405.4 14 287.5 <5 §
El Cajon 538 432.0 353 579.4 185 290.9 408 553.9 43 614.5 68 205.1 8 180.1 6 95.6 <5 § 43 218.7 205 621.0 235 741.3 55 375.0
Harbison Crest/El Cajon** 854 613.6 521 763.5 333 469.4 629 737.5 77 1081.0 105 297.9 16 340.3 13 191.0 <5 § 66 306.6 313 873.3 390 1055.9 82 479.3
Jamul 43 226.8 14 128.5 29 359.8 24 228.9 9 984.7 7 121.0 <5 § <5 § <5 § 9 283.6 10 208.5 20 333.9 <5 §
La Mesa 173 292.8 89 315.8 84 271.7 127 342.8 17 410.4 20 168.7 <5 § <5 § <5 § 15 177.9 57 333.8 76 494.8 25 290.9
Laguna‐Pine Valley <5 § <5 § <5 § <5 § <5 § <5 § <5 § <5 § <5 § <5 § <5 § <5 § <5 §
Lakeside 96 171.4 57 205.7 39 137.7 70 171.4 6 607.3 12 115.8 <5 § <5 § <5 § 19 237.5 32 220.9 37 230.9 6 99.5
Lemon Grove 110 369.0 53 365.5 57 372.3 74 781.7 17 386.5 17 135.9 <5 § <5 § <5 § 23 503.9 28 349.0 52 680.5 6 181.2
Mountain Empire 8 105.4 <5 § <5 § 5 120.8 <5 § <5 § <5 § <5 § <5 § <5 § <5 § <5 § <5 §
Santee 71 138.8 47 189.8 24 91.0 56 147.5 <5 § 8 98.4 <5 § <5 § <5 § 11 157.2 19 137.0 28 189.8 12 209.9
Spring Valley 380 469.1 235 596.2 145 348.7 232 606.4 43 555.0 71 272.5 20 378.3 6 164.1 <5 § 67 554.4 142 674.2 153 709.4 18 191.2
North Central Region 724 119.9 412 134.8 312 104.5 469 128.5 60 319.7 87 101.6 65 60.0 26 99.6 5 5.3 113 110.2 300 156.3 244 170.7 62 86.3
Coastal 104 138.0 71 182.8 33 90.3 80 131.5 7 961.5 9 111.9 <5 § <5 § <5 § 22 197.4 35 126.4 33 200.6 14 112.9
Del Mar‐Mira Mesa 123 78.1 58 73.4 65 82.8 63 82.9 14 378.2 9 57.0 27 49.2 8 111.4 <5 § 12 62.2 68 143.1 33 73.7 9 66.1
Elliott‐Navajo 76 85.3 43 99.5 33 71.9 63 104.8 <5 § <5 § <5 § <5 § <5 § 13 117.2 27 107.2 24 106.7 11 82.8
Kearny Mesa 323 213.6 186 246.9 137 180.6 205 243.1 29 431.8 48 143.3 26 131.1 6 87.7 <5 § 51 216.5 128 257.4 129 362.1 13 68.2
Miramar <5 § <5 § <5 § <5 § <5 § <5 § <5 § <5 § <5 § <5 § <5 § <5 § <5 §
Peninsula 49 77.9 34 99.5 15 52.2 30 62.5 <5 § 12 146.4 <5 § <5 § <5 § 11 88.0 20 95.0 13 90.8 <5 §
University 48 76.5 19 61.2 29 91.6 28 85.0 5 486.4 5 81.5 5 24.9 5 197.8 <5 § <5 § 21 106.4 12 130.6 11 175.0
North Coastal Region 581 114.9 344 133.4 237 95.6 389 130.0 51 351.2 84 58.3 28 93.2 16 88.0 <5 § 99 118.3 246 180.2 188 150.4 47 78.9
Carlsbad 79 68.9 48 86.1 31 52.6 58 68.7 <5 § 10 60.0 <5 § 5 125.8 <5 § 11 90.0 33 109.6 23 70.5 12 67.4
Oceanside 239 149.6 153 193.0 86 106.9 133 179.1 43 619.9 39 65.1 12 97.9 6 93.9 <5 § 48 189.3 84 188.1 95 242.8 11 59.7
Pendleton <5 § <5 § <5 § <5 § <5 § <5 § <5 § <5 § <5 § <5 § <5 § <5 § <5 §
San Dieguito 73 78.1 36 78.2 37 77.9 61 83.2 <5 § <5 § <5 § <5 § <5 § 13 138.6 30 121.6 18 61.3 12 90.7
Vista 190 189.2 107 211.0 83 166.9 137 312.4 7 258.6 31 66.4 10 241.2 <5 § <5 § 27 161.1 99 344.9 52 220.7 12 118.9
North Inland Region 672 118.0 394 140.5 278 96.2 459 145.8 33 318.8 106 64.6 24 40.6 40 188.7 7 5.9 141 182.9 209 140.8 235 154.3 80 110.9
Anza‐Borrego Springs 5 112.6 <5 § <5 § 5 178.4 <5 § <5 § <5 § <5 § <5 § <5 § <5 § <5 § <5 §
Escondido 317 194.5 180 222.6 137 166.8 197 277.1 20 594.4 70 94.5 14 137.1 12 283.4 <5 § 58 226.2 106 234.1 124 323.0 29 165.5
Fallbrook 61 129.0 36 152.9 25 105.2 50 183.1 <5 § 6 34.8 <5 § <5 § <5 § 12 168.4 12 120.2 29 220.1 8 97.8
North San Diego 95 89.2 62 120.4 33 60.0 66 105.3 <5 § 5 46.9 8 31.2 13 258.3 <5 § 22 192.2 26 84.3 21 72.5 24 186.3
Palomar‐Julian 6 95.7 <5 § <5 § <5 § <5 § <5 § <5 § <5 § <5 § 6 1087.0 <5 § <5 § <5 §
Pauma 5 67.0 <5 § <5 § <5 § <5 § <5 § <5 § <5 § <5 § <5 § <5 § <5 § <5 §
Poway 57 66.0 23 54.5 34 77.0 42 72.5 7 463.3 <5 § <5 § <5 § <5 § 14 138.5 11 52.9 25 93.1 <5 §
Ramona 31 88.9 20 114.1 11 63.4 22 88.6 <5 § 8 97.4 <5 § <5 § <5 § 6 116.1 10 125.9 11 99.8 <5 §
San Marcos 73 81.1 47 106.8 26 56.6 54 118.8 <5 § 9 27.6 <5 § 5 § <5 § 13 103.6 33 130.7 17 83.4 10 85.0
Valley Center 22 94.3 16 136.7 6 51.6 17 113.6 <5 § <5 § <5 § <5 § <5 § 9 291.2 <5 § 7 91.0 <5 §
South Region 1,332 284.3 780 333.2 552 235.5 592 603.3 135 685.1 486 175.0 86 144.5 19 141.6 7 6.9 182 225.3 592 448.8 470 443.3 81 166.8
Chula Vista 527 457.3 312 561.7 215 360.2 250 1170.3 43 1088.3 197 242.2 28 464.8 <5 § 5 20.4 68 361.8 237 765.1 190 718.0 27 186.0
Coronado 17 68.8 11 75.6 6 59.1 15 83.7 <5 § <5 § <5 § <5 § <5 § <5 § 11 166.9 <5 § <5 §
National City 285 488.7 165 549.9 120 423.8 145 2134.6 26 1016.0 80 215.4 28 265.7 5 387.3 <5 § 17 138.8 119 756.8 128 1067.5 21 340.7
South Bay 393 291.3 240 352.6 153 228.9 130 633.4 55 1014.0 171 185.0 24 183.7 6 172.9 <5 § 74 309.7 174 458.7 124 405.2 20 155.0
Sweetwater 110 81.3 52 78.9 58 83.6 52 164.9 11 176.2 36 56.7 6 20.8 <5 § <5 § 23 118.7 51 125.4 24 75.1 11 95.7Unknown <5 ‐‐‐ <5 ‐‐‐ <5 ‐‐‐ <5 ‐‐‐ <5 ‐‐‐ <5 ‐‐‐ <5 ‐‐‐ <5 ‐‐‐ <5 ‐‐‐ <5 ‐‐‐ <5 ‐‐‐ <5 ‐‐‐ <5 ‐‐‐*Rates per 100,000 population. County age‐adjusted rates per 100,000 2000 US standard population.**Harbison Crest/El Cajon is an aggregation of the Harbison Crest and El Cajon SRAs. Due to geographic limitations, the Harbison Crest SRA is not shown alone. See the Data Guide for more information.
***Numbers may not add up to totals due to unknown or missing details.
†Schizophrenia and other psycho c disorder hospitaliza on refers to (principal diagnosis) ICD‐9 codes 293.81, 293.82, 295, 297, 298.
‡API includes Asian, Pacific Islander, Na ve Hawaiian. Other includes 2 or more races, Na ve American/Alaska Na ve, American Indian, or other.
§Rates not calculated for fewer than 5 events. Rates not calculated in cases where zip code is unknown.
Source: Patient Discharge Database (CA OSHPD), County of San Diego, Health & Human Services Agency, Public Health Services, Epidemiology & Immunization Services Branch; SANDAG, Current Population Estimates, 10/2012.
Prepared by: County of San Diego, Health & Human Services Agency, Public Health Services, Community Health Statistics Unit, 2013.
Ages 0‐14 Ages 15‐24 Ages 25‐44 Ages 45‐64 Ages 65+
Schizophrenia and Other Psycho c Disorder† Hospitaliza ons Among San Diego County Residents by Loca on of Residence, 2010 Detail
Geography2010 Total
Gender Race/Ethnicity Age Group
Male Female White Black Hispanic API‡ Other‡
County of San Diego, Health & Human Services Agency, Public Health Services, Community Health Statisitcs Unit Page 107

No. Rate* No. Rate* No. Rate* No. Rate* No. Rate* No. Rate* No. Rate* No. Rate* No. Rate* No. Rate* No. Rate* No. Rate* No. Rate*
San Diego County (Actual Rate) 8,082 259.4 4,757 304.4 3,325 214.1 4,511 301.6 1,197 837.6 1,600 158.3 406 116.4 205 174.0 34 5.7 1,079 216.4 3,360 377.1 3,059 396.8 550 152.0
San Diego County (Age‐Adjusted Rate) 8,082 253.1
Central Region 2,641 543.9 1,658 668.3 983 413.9 1,303 915.6 635 1157.5 497 239.1 138 213.8 35 218.4 5 5.5 292 363.6 1,151 707.9 1,077 992.4 116 263.3
Central San Diego 1,148 691.7 739 815.8 409 542.6 659 805.1 255 2294.4 155 264.3 45 522.0 15 261.6 <5 § 86 414.7 510 724.3 495 1280.1 56 348.9
Mid‐City 600 367.7 373 459.0 227 277.1 261 570.5 127 675.6 140 201.3 45 189.2 17 320.6 <5 § 87 269.0 243 479.5 245 731.7 23 178.2
Southeast San Diego 893 570.9 546 716.2 347 432.9 383 2602.4 253 1014.1 202 253.7 48 149.3 <5 § <5 § 119 437.2 398 959.1 337 926.3 37 244.9
East Region 2,052 439.7 1,169 508.7 883 372.8 1,322 473.8 236 906.1 313 263.2 47 221.6 84 391.9 6 6.7 212 305.5 801 662.5 842 654.2 191 326.5
Alpine 78 514.5 39 517.7 39 511.5 45 382.6 7 4191.6 9 384.3 <5 § 6 1145.0 <5 § 17 801.9 41 1290.5 18 366.4 <5 §
El Cajon 720 574.8 415 676.5 305 477.2 487 662.4 84 1225.7 93 273.7 16 352.0 27 424.0 <5 § 37 187.9 230 694.7 369 1151.8 83 548.8
Harbison Crest/El Cajon** 1,039 742.0 578 841.2 461 646.4 697 818.7 107 1531.9 148 408.9 22 456.6 44 637.7 <5 § 68 314.2 353 983.6 496 1330.9 121 683.2
Jamul 38 216.2 25 247.4 13 173.9 31 324.3 <5 § <5 § <5 § <5 § <5 § 7 232.0 17 392.5 9 161.3 5 255.2
La Mesa 204 340.1 117 408.7 87 277.4 127 340.5 34 827.5 24 194.6 <5 § 10 374.7 <5 § 32 391.7 79 452.3 71 452.5 21 237.2
Laguna‐Pine Valley <5 § <5 § <5 § <5 § <5 § <5 § <5 § <5 § <5 § <5 § <5 § <5 § <5 §
Lakeside 115 204.0 63 226.0 52 182.5 77 188.4 8 821.4 23 216.5 <5 § <5 § <5 § 7 86.8 57 396.1 41 252.9 6 94.2
Lemon Grove 102 340.6 51 350.2 51 331.5 60 641.5 14 327.6 21 163.9 <5 § <5 § <5 § 12 257.0 45 564.1 36 467.2 9 263.3
Mountain Empire 13 152.8 5 109.3 8 203.6 8 177.3 <5 § <5 § <5 § <5 § <5 § <5 245.9 7 365.0 <5 § <5 §
Santee 76 147.0 47 187.8 29 108.7 47 123.1 <5 § 16 190.7 <5 § 5 234.6 <5 § 24 331.3 22 160.5 21 140.0 9 148.8
Spring Valley 386 472.2 243 611.1 143 340.7 229 598.6 62 818.6 65 242.9 15 277.7 9 240.6 <5 § 41 331.2 180 856.4 147 675.5 18 182.7
North Central Region 758 124.3 424 137.5 334 110.9 441 120.8 84 449.3 92 104.9 88 78.9 21 78.9 6 6.4 134 129.4 316 163.2 224 155.0 78 105.9
Coastal 120 158.8 72 184.9 48 131.1 94 155.0 <5 § 11 133.4 7 205.5 <5 § <5 § 26 235.5 42 150.7 34 207.2 18 142.7
Del Mar‐Mira Mesa 133 83.9 53 66.7 80 101.2 57 75.2 7 194.7 13 80.7 51 91.4 <5 § <5 § 18 90.0 59 126.5 41 89.7 13 90.4
Elliott‐Navajo 74 82.8 39 89.9 35 76.0 49 81.8 7 175.9 7 53.1 <5 § <5 § <5 § 16 147.7 33 130.0 20 88.5 5 36.6
Kearny Mesa 321 211.6 195 258.1 126 165.5 177 210.9 52 788.7 53 155.5 22 109.1 9 130.0 <5 § 57 259.2 126 248.6 105 290.5 31 159.9
Miramar <5 § <5 § <5 § <5 § <5 § <5 § <5 § <5 § <5 § <5 § <5 § <5 § <5 §
Peninsula 56 88.8 42 122.2 14 48.8 32 67.1 7 327.3 <5 § <5 § <5 § <5 § 12 97.3 28 131.3 14 98.3 <5 27.6
University 53 79.7 23 69.9 30 89.4 31 90.6 9 771.2 <5 § 8 36.9 <5 § <5 § 5 20.6 28 135.4 9 96.8 9 140.8
North Coastal Region 658 129.1 365 140.6 293 117.1 432 144.5 54 377.1 103 70.2 33 106.6 25 133.3 8 8.0 127 150.5 290 212.4 190 149.8 43 69.8
Carlsbad 100 86.3 66 117.2 34 57.1 73 86.2 6 381.2 10 58.2 5 59.8 <5 § <5 § 28 218.2 37 125.0 22 66.4 13 70.4
Oceanside 268 167.4 147 185.0 121 150.1 160 217.1 33 493.9 48 79.0 17 137.1 7 107.2 6 18.4 44 177.7 119 266.4 87 221.3 12 64.1
Pendleton <5 § <5 § <5 § <5 § <5 § <5 § <5 § <5 § <5 § <5 § <5 § <5 § <5 §
San Dieguito 76 80.1 35 75.0 41 85.0 55 74.3 <5 § 9 69.3 <5 § 9 306.4 <5 § 11 109.8 37 151.3 21 70.6 7 50.1
Vista 213 210.2 116 226.9 97 193.2 143 327.7 15 570.3 36 75.4 11 260.2 6 194.5 <5 § 43 260.7 97 335.3 60 249.1 11 105.7
North Inland Region 663 115.4 397 140.3 266 91.2 459 146.2 39 382.9 89 52.9 34 56.2 27 125.2 <5 § 127 159.3 239 162.6 249 161.2 45 60.3
Anza‐Borrego Springs 5 107.1 <5 § <5 § 5 177.2 <5 § <5 § <5 § <5 § <5 § <5 § <5 § <5 § <5 §
Escondido 304 185.1 181 222.1 123 148.7 207 293.5 29 880.7 44 58.1 12 115.6 7 162.6 <5 § 43 166.0 97 214.3 152 388.5 12 67.3
Fallbrook 58 121.2 32 134.2 26 108.2 36 132.2 5 904.2 13 73.0 <5 § <5 § <5 § 11 151.8 26 257.1 14 106.5 5 58.7
North San Diego 72 66.9 42 80.7 30 54.0 43 68.5 <5 § 7 64.0 8 30.4 6 117.5 <5 § 19 158.3 27 88.7 17 57.6 8 60.1
Palomar‐Julian 7 108.9 <5 § <5 § 6 129.6 <5 § <5 § <5 § <5 § <5 § <5 § <5 § <5 § <5 §
Pauma <5 § <5 § <5 § <5 § <5 § <5 § <5 § <5 § <5 § <5 § <5 § <5 § <5 §
Poway 69 79.4 39 91.9 30 67.5 45 77.7 <5 § 9 84.7 8 59.5 <5 § <5 § 16 146.1 32 159.0 15 54.9 6 53.3
Ramona 35 98.8 21 118.0 14 79.4 33 131.9 <5 § <5 § <5 § <5 § <5 § 9 164.1 13 164.5 11 98.3 <5 §
San Marcos 88 97.6 54 122.4 34 73.8 66 146.9 <5 § 13 39.1 5 67.5 <5 § <5 § 17 132.9 33 132.5 26 125.6 12 100.8
Valley Center 21 89.5 16 136.0 5 42.8 17 114.6 <5 § <5 § <5 § <5 § <5 § 7 214.9 7 155.3 7 91.4 <5 §
South Region 1,310 279.0 744 318.3 566 240.1 554 576.2 149 792.6 506 180.0 66 110.0 13 96.8 6 6.0 187 230.3 563 432.3 477 441.9 77 155.9
Chula Vista 475 409.8 270 483.6 205 341.2 195 931.6 46 1201.4 199 241.1 24 395.8 5 195.0 <5 § 64 336.7 202 653.7 171 634.8 34 231.8
Coronado 27 115.7 9 67.3 18 180.8 21 123.0 <5 § <5 § <5 § <5 § <5 § 5 87.9 11 183.1 9 179.6 <5 §
National City 303 518.0 173 576.5 130 456.4 150 2275.8 38 1534.1 87 231.6 20 189.2 <5 § <5 § 29 237.0 123 778.4 131 1074.5 20 329.1
South Bay 408 301.9 240 352.7 168 250.5 151 750.7 48 924.7 183 196.2 13 99.5 <5 § <5 § 55 231.4 184 489.2 151 488.5 16 121.2
Sweetwater 97 71.0 52 78.2 45 64.2 37 117.7 15 248.1 35 54.2 9 30.7 <5 § <5 § 34 165.9 43 107.7 15 45.6 5 42.0Unknown <5 ‐‐‐ <5 ‐‐‐ <5 ‐‐‐ <5 ‐‐‐ <5 ‐‐‐ <5 ‐‐‐ <5 ‐‐‐ <5 ‐‐‐ <5 ‐‐‐ <5 ‐‐‐ <5 ‐‐‐ <5 ‐‐‐ <5 ‐‐‐*Rates per 100,000 population. County age‐adjusted rates per 100,000 2000 US standard population.**Harbison Crest/El Cajon is an aggregation of the Harbison Crest and El Cajon SRAs. Due to geographic limitations, the Harbison Crest SRA is not shown alone. See the Data Guide for more information.
***Numbers may not add up to totals due to unknown or missing details.
†Schizophrenia and other psycho c disorder hospitaliza on refers to (principal diagnosis) ICD‐9 codes 293.81, 293.82, 295, 297, 298.
‡API includes Asian, Pacific Islander, Na ve Hawaiian. Other includes 2 or more races, Na ve American/Alaska Na ve, American Indian, or other.
§Rates not calculated for fewer than 5 events. Rates not calculated in cases where zip code is unknown.
Source: Patient Discharge Database (CA OSHPD), County of San Diego, Health & Human Services Agency, Public Health Services, Epidemiology & Immunization Services Branch; SANDAG, Current Population Estimates, 10/2012.
Prepared by: County of San Diego, Health & Human Services Agency, Public Health Services, Community Health Statistics Unit, 2013.
Gender Race/Ethnicity Age Group
Male Female White Black Hispanic Ages 65+API‡ Other‡ Ages 0‐14 Ages 15‐24 Ages 25‐44 Ages 45‐64Geography2011 Total
Schizophrenia and Other Psycho c Disorder† Hospitaliza ons Among San Diego County Residents by Loca on of Residence, 2011 Detail
County of San Diego, Health & Human Services Agency, Public Health Services, Community Health Statisitcs Unit Page 108
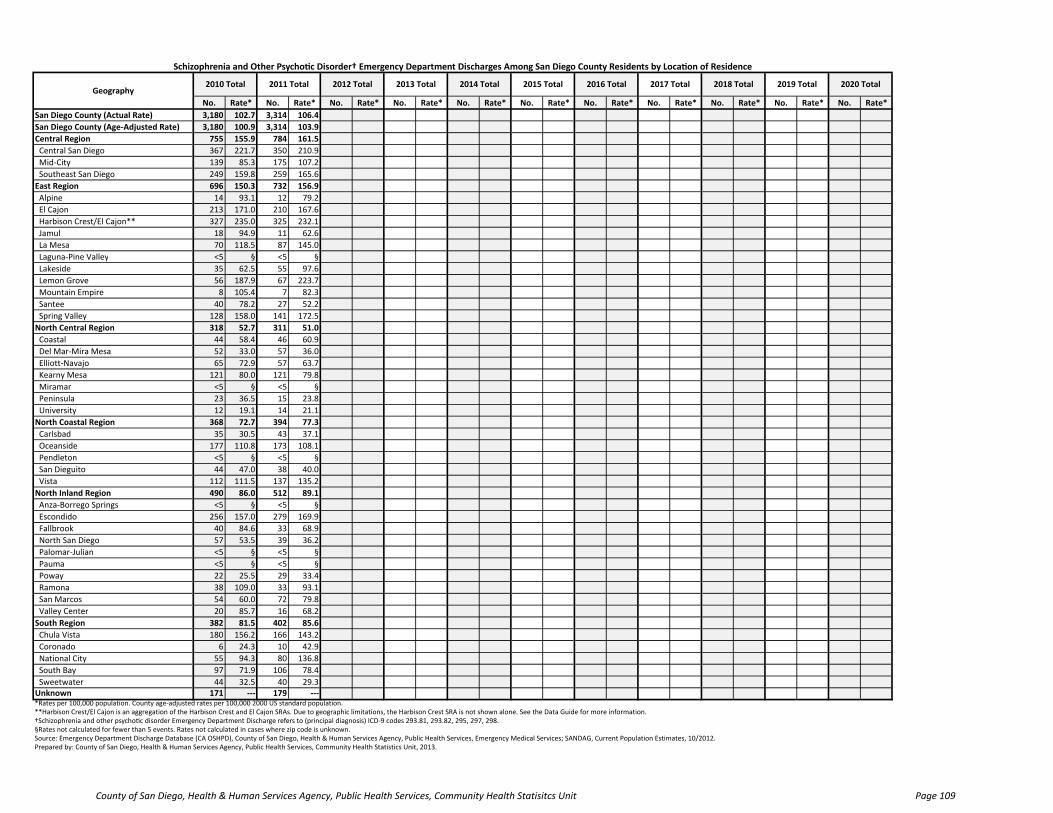
No. Rate* No. Rate* No. Rate* No. Rate* No. Rate* No. Rate* No. Rate* No. Rate* No. Rate* No. Rate* No. Rate*
San Diego County (Actual Rate) 3,180 102.7 3,314 106.4
San Diego County (Age‐Adjusted Rate) 3,180 100.9 3,314 103.9
Central Region 755 155.9 784 161.5
Central San Diego 367 221.7 350 210.9
Mid‐City 139 85.3 175 107.2
Southeast San Diego 249 159.8 259 165.6
East Region 696 150.3 732 156.9
Alpine 14 93.1 12 79.2
El Cajon 213 171.0 210 167.6
Harbison Crest/El Cajon** 327 235.0 325 232.1
Jamul 18 94.9 11 62.6
La Mesa 70 118.5 87 145.0
Laguna‐Pine Valley <5 § <5 §
Lakeside 35 62.5 55 97.6
Lemon Grove 56 187.9 67 223.7
Mountain Empire 8 105.4 7 82.3
Santee 40 78.2 27 52.2
Spring Valley 128 158.0 141 172.5
North Central Region 318 52.7 311 51.0
Coastal 44 58.4 46 60.9
Del Mar‐Mira Mesa 52 33.0 57 36.0
Elliott‐Navajo 65 72.9 57 63.7
Kearny Mesa 121 80.0 121 79.8
Miramar <5 § <5 §
Peninsula 23 36.5 15 23.8
University 12 19.1 14 21.1
North Coastal Region 368 72.7 394 77.3
Carlsbad 35 30.5 43 37.1
Oceanside 177 110.8 173 108.1
Pendleton <5 § <5 §
San Dieguito 44 47.0 38 40.0
Vista 112 111.5 137 135.2
North Inland Region 490 86.0 512 89.1
Anza‐Borrego Springs <5 § <5 §
Escondido 256 157.0 279 169.9
Fallbrook 40 84.6 33 68.9
North San Diego 57 53.5 39 36.2
Palomar‐Julian <5 § <5 §
Pauma <5 § <5 §
Poway 22 25.5 29 33.4
Ramona 38 109.0 33 93.1
San Marcos 54 60.0 72 79.8
Valley Center 20 85.7 16 68.2
South Region 382 81.5 402 85.6
Chula Vista 180 156.2 166 143.2
Coronado 6 24.3 10 42.9
National City 55 94.3 80 136.8
South Bay 97 71.9 106 78.4
Sweetwater 44 32.5 40 29.3Unknown 171 ‐‐‐ 179 ‐‐‐*Rates per 100,000 population. County age‐adjusted rates per 100,000 2000 US standard population.**Harbison Crest/El Cajon is an aggregation of the Harbison Crest and El Cajon SRAs. Due to geographic limitations, the Harbison Crest SRA is not shown alone. See the Data Guide for more information.†Schizophrenia and other psycho c disorder Emergency Department Discharge refers to (principal diagnosis) ICD‐9 codes 293.81, 293.82, 295, 297, 298.§Rates not calculated for fewer than 5 events. Rates not calculated in cases where zip code is unknown.Source: Emergency Department Discharge Database (CA OSHPD), County of San Diego, Health & Human Services Agency, Public Health Services, Emergency Medical Services; SANDAG, Current Population Estimates, 10/2012.Prepared by: County of San Diego, Health & Human Services Agency, Public Health Services, Community Health Statistics Unit, 2013.
Schizophrenia and Other Psycho c Disorder† Emergency Department Discharges Among San Diego County Residents by Loca on of Residence
Geography2010 Total 2011 Total 2012 Total 2013 Total 2014 Total 2015 Total 2016 Total 2017 Total 2018 Total 2019 Total 2020 Total
County of San Diego, Health & Human Services Agency, Public Health Services, Community Health Statisitcs Unit Page 109

No. Rate* No. Rate* No. Rate* No. Rate* No. Rate* No. Rate* No. Rate* No. Rate* No. Rate* No. Rate* No. Rate* No. Rate* No. Rate*
San Diego County (Actual Rate) 3,180 102.7 1,974 127.1 1,206 78.2 1,958 130.5 429 292.6 559 56.4 113 33.1 85 73.4 20 3.4 435 87.7 1,304 146.3 1,137 149.5 284 80.8
San Diego County (Age‐Adjusted Rate) 3,180 100.9
Central Region 755 155.9 532 214.8 223 94.2 409 284.7 189 333.5 114 55.8 24 37.6 15 94.6 <5 § 70 84.2 367 227.3 280 262.4 35 80.9
Central San Diego 367 221.7 265 292.8 102 135.9 207 251.5 88 766.4 53 92.0 7 82.4 9 158.5 <5 § 16 69.6 189 271.0 146 384.7 14 90.1
Mid‐City 139 85.3 87 107.1 52 63.5 69 148.5 34 176.0 23 33.6 10 42.5 <5 § <5 § 21 63.1 63 125.0 40 122.1 15 117.3
Southeast San Diego 249 159.8 180 236.9 69 86.4 133 892.7 67 258.9 38 48.5 7 22.0 <5 § <5 § 33 122.8 115 278.3 94 261.1 6 40.1
East Region 696 150.3 382 167.5 314 133.6 480 171.9 85 319.8 93 80.4 17 82.2 9 42.9 5 5.6 100 145.9 243 200.5 289 226.8 59 105.5
Alpine 14 93.1 6 80.4 8 105.6 9 76.2 <5 628.9 <5 § <5 § <5 § <5 § <5 § <5 § 6 123.2 <5 §
El Cajon 213 171.0 133 218.3 80 125.8 154 209.1 19 271.5 25 75.4 7 157.6 <5 § <5 § 16 81.4 83 251.4 102 321.8 11 75.0
Harbison Crest/El Cajon** 327 235.0 189 277.0 138 194.5 235 275.5 38 533.5 36 102.1 8 170.1 <5 § <5 § 30 139.4 127 354.3 147 398.0 21 122.7
Jamul 18 94.9 10 91.8 8 99.3 10 95.4 5 547.0 <5 § <5 § <5 § <5 § <5 § 5 104.3 8 133.6 <5 §
La Mesa 70 118.5 45 159.7 25 80.9 47 126.9 5 120.7 13 109.7 <5 § <5 § <5 § 10 118.6 26 152.3 21 136.7 13 151.3
Laguna‐Pine Valley <5 § <5 § <5 § <5 § <5 § <5 § <5 § <5 § <5 § <5 § <5 § <5 § <5 §
Lakeside 35 62.5 19 68.6 16 56.5 27 66.1 <5 § 5 48.2 <5 § <5 § <5 § 10 125.0 12 82.9 10 62.4 <5 §
Lemon Grove 56 187.9 26 179.3 30 195.9 34 359.1 12 272.9 8 64.0 <5 § <5 § <5 § 6 131.5 12 149.6 31 405.7 7 211.4
Mountain Empire 8 105.4 <5 § 6 171.2 5 120.8 <5 § <5 § <5 § <5 § <5 § <5 § <5 § <5 § <5 §
Santee 40 78.2 17 68.6 23 87.2 32 84.3 <5 § 6 73.8 <5 § <5 § <5 § 6 85.7 12 86.5 16 108.5 6 105.0
Spring Valley 128 158.0 68 172.5 60 144.3 81 211.7 23 296.9 20 76.8 <5 § <5 § <5 § 30 248.2 45 213.7 46 213.3 5 53.1
North Central Region 318 52.7 196 64.2 122 40.9 215 58.9 36 191.8 39 45.5 17 15.7 9 34.5 <5 § 45 43.9 109 56.8 109 76.3 52 72.3
Coastal 44 58.4 33 85.0 11 30.1 28 46.0 9 1236.3 <5 § <5 § <5 § <5 § <5 § 15 54.2 17 103.3 11 88.7
Del Mar‐Mira Mesa 52 33.0 23 29.1 29 36.9 35 46.1 <5 § <5 § 9 16.4 <5 § <5 § 5 25.9 17 35.8 18 40.2 11 80.8
Elliott‐Navajo 65 72.9 38 87.9 27 58.9 50 83.2 7 174.1 7 53.9 <5 § <5 § <5 § 20 180.3 12 47.7 23 102.3 10 75.3
Kearny Mesa 121 80.0 81 107.5 40 52.7 76 90.1 14 208.5 23 68.7 <5 § <5 § <5 § 15 63.7 49 98.6 40 112.3 15 78.7
Miramar <5 § <5 § <5 § <5 § <5 § <5 § <5 § <5 § <5 § <5 § <5 § <5 § <5 §
Peninsula 23 36.5 16 46.8 7 24.3 16 33.4 <5 § <5 § <5 § <5 § <5 § <5 § 8 38.0 9 62.9 <5 §
University 12 19.1 <5 § 8 25.3 10 30.4 <5 § <5 § <5 § <5 § <5 § <5 § 7 35.5 <5 § <5 §
North Coastal Region 368 72.7 242 93.9 126 50.8 240 80.2 24 165.3 61 42.4 15 49.9 24 132.0 <5 § 66 78.8 157 115.0 109 87.2 34 57.0
Carlsbad 35 30.5 20 35.9 15 25.4 29 34.4 <5 63.1 <5 § <5 § <5 § <5 § <5 § 17 56.5 9 27.6 6 33.7
Oceanside 177 110.8 115 145.1 62 77.1 102 137.4 16 230.6 33 55.1 8 65.3 15 234.8 <5 § 35 138.0 73 163.4 55 140.6 13 70.5
Pendleton <5 § <5 § <5 § <5 § <5 § <5 § <5 § <5 § <5 § <5 § <5 § <5 § <5 §
San Dieguito 44 47.0 25 54.3 19 40.0 36 49.1 <5 § <5 § <5 § <5 § <5 § 11 117.3 18 73.0 7 23.9 8 60.5
Vista 112 111.5 82 161.7 30 60.3 73 166.5 7 258.6 23 49.3 <5 § 5 163.7 <5 § 17 101.4 49 170.7 38 161.3 7 69.3
North Inland Region 490 86.0 280 99.8 210 72.7 324 102.9 23 222.2 97 59.1 20 33.8 23 108.5 5 4.2 83 107.7 174 117.2 161 105.7 67 92.9
Anza‐Borrego Springs <5 § <5 § <5 § <5 § <5 § <5 § <5 § <5 § <5 § <5 § <5 § <5 § <5 §
Escondido 256 157.0 152 188.0 104 126.6 161 226.4 15 445.8 58 78.3 14 137.1 7 165.3 <5 § 41 159.9 94 207.6 96 250.0 25 142.6
Fallbrook 40 84.6 21 89.2 19 80.0 23 84.2 <5 § 13 75.4 <5 § <5 § <5 § <5 § 17 170.2 13 98.7 6 73.3
North San Diego 57 53.5 27 52.4 30 54.5 38 60.6 <5 § <5 § <5 § 11 218.6 <5 § 7 61.2 15 48.6 14 48.4 18 139.8
Palomar‐Julian <5 § <5 § <5 § <5 § <5 § <5 § <5 § <5 § <5 § <5 § <5 § <5 § <5 §
Pauma <5 § <5 § <5 § <5 § <5 § <5 § <5 § <5 § <5 § <5 § <5 § <5 § <5 §
Poway 22 25.5 12 28.5 10 22.7 17 29.3 <5 § <5 § <5 § <5 § <5 § <5 § 7 33.6 8 29.8 5 46.2
Ramona 38 109.0 23 131.2 15 86.5 33 132.9 <5 § 5 60.9 <5 § <5 § <5 § 7 135.5 12 151.1 12 108.9 6 160.5
San Marcos 54 60.0 32 72.7 22 47.9 32 70.4 5 283.8 14 42.9 <5 § <5 § <5 § 14 111.6 22 87.1 11 54.0 7 59.5
Valley Center 20 85.7 11 94.0 9 77.4 18 120.3 <5 § <5 § <5 § <5 § <5 § 8 258.8 6 129.2 6 78.0 <5 §
South Region 382 81.5 224 95.7 158 67.4 173 176.3 39 197.9 141 50.8 19 31.9 <5 § <5 § 57 70.6 155 117.5 136 128.3 32 65.9
Chula Vista 180 156.2 106 190.9 74 124.0 98 458.8 18 455.6 51 62.7 6 99.6 <5 § <5 § 24 127.7 62 200.2 76 287.2 17 117.1
Coronado 6 24.3 <5 § <5 § <5 § <5 § <5 § <5 § <5 § <5 § <5 § <5 § <5 § <5 §
National City 55 94.3 35 116.7 20 70.6 25 368.0 6 234.5 18 48.5 6 56.9 <5 § <5 § 10 81.6 23 146.3 18 150.1 <5 §
South Bay 97 71.9 59 86.7 38 56.8 29 141.3 13 239.7 47 50.8 6 45.9 <5 § <5 § 18 75.3 47 123.9 26 85.0 6 46.5
Sweetwater 44 32.5 20 30.3 24 34.6 17 53.9 <5 § 23 36.2 <5 § <5 § <5 § 5 25.8 20 49.2 13 40.7 5 43.5Unknown 171 ‐‐‐ 118 ‐‐‐ 53 ‐‐‐ 117 ‐‐‐ 33 ‐‐‐ 14 ‐‐‐ <5 ‐‐‐ <5 ‐‐‐ <5 ‐‐‐ 14 ‐‐‐ 99 ‐‐‐ 53 ‐‐‐ 5 ‐‐‐*Rates per 100,000 population. County age‐adjusted rates per 100,000 2000 US standard population.**Harbison Crest/El Cajon is an aggregation of the Harbison Crest and El Cajon SRAs. Due to geographic limitations, the Harbison Crest SRA is not shown alone. See the Data Guide for more information.
***Numbers may not add up to totals due to unknown or missing details.
†Schizophrenia and other psycho c disorder Emergency Department Discharge refers to (principal diagnosis) ICD‐9 codes 293.81, 293.82, 295, 297, 298.
‡API includes Asian, Pacific Islander, Na ve Hawaiian. Other includes 2 or more races, Na ve American/Alaska Na ve, American Indian, or other.
§Rates not calculated for fewer than 5 events. Rates not calculated in cases where zip code is unknown.
Source: Emergency Department Discharge Database (CA OSHPD), County of San Diego, Health & Human Services Agency, Public Health Services, Emergency Medical Services; SANDAG, Current Population Estimates, 10/2012.
Prepared by: County of San Diego, Health & Human Services Agency, Public Health Services, Community Health Statistics Unit, 2013.
Ages 0‐14 Ages 15‐24 Ages 25‐44 Ages 45‐64 Ages 65+
Schizophrenia and Other Psycho c Disorder† Emergency Department Discharges Among San Diego County Residents by Loca on of Residence, 2010 Detail
Geography2010 Total
Gender Race/Ethnicity Age Group
Male Female White Black Hispanic API‡ Other‡
County of San Diego, Health & Human Services Agency, Public Health Services, Community Health Statisitcs Unit Page 110
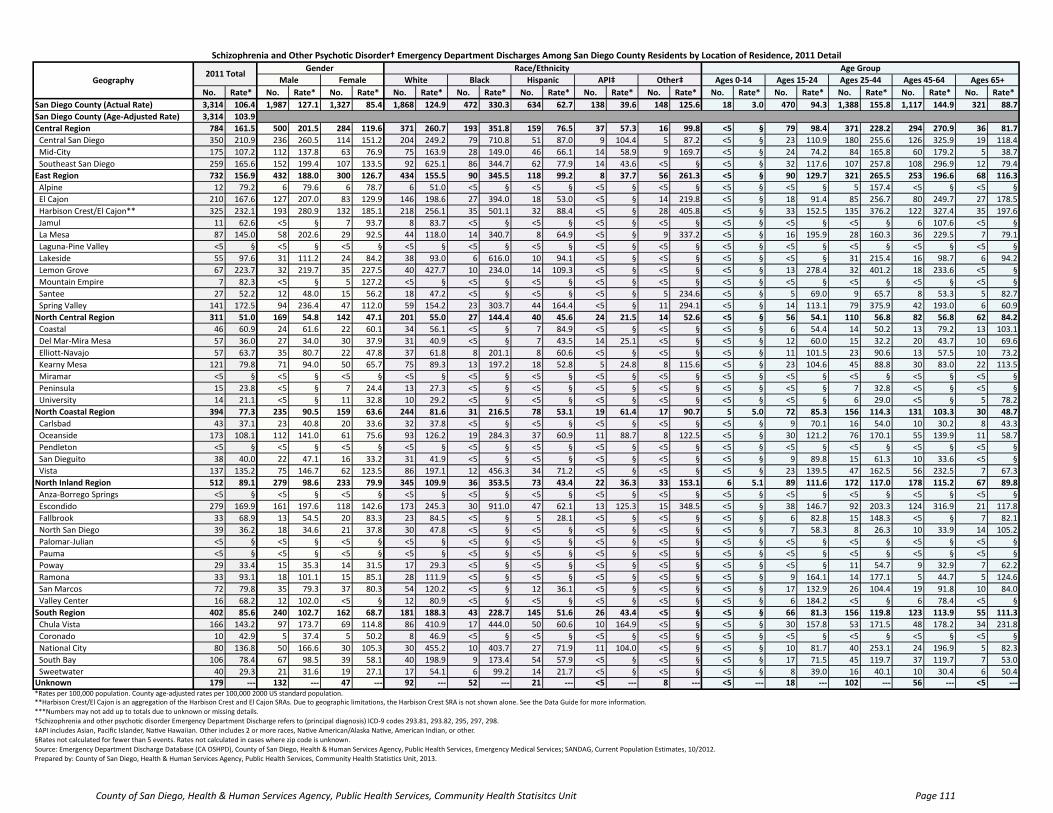
No. Rate* No. Rate* No. Rate* No. Rate* No. Rate* No. Rate* No. Rate* No. Rate* No. Rate* No. Rate* No. Rate* No. Rate* No. Rate*
San Diego County (Actual Rate) 3,314 106.4 1,987 127.1 1,327 85.4 1,868 124.9 472 330.3 634 62.7 138 39.6 148 125.6 18 3.0 470 94.3 1,388 155.8 1,117 144.9 321 88.7
San Diego County (Age‐Adjusted Rate) 3,314 103.9
Central Region 784 161.5 500 201.5 284 119.6 371 260.7 193 351.8 159 76.5 37 57.3 16 99.8 <5 § 79 98.4 371 228.2 294 270.9 36 81.7
Central San Diego 350 210.9 236 260.5 114 151.2 204 249.2 79 710.8 51 87.0 9 104.4 5 87.2 <5 § 23 110.9 180 255.6 126 325.9 19 118.4
Mid‐City 175 107.2 112 137.8 63 76.9 75 163.9 28 149.0 46 66.1 14 58.9 9 169.7 <5 § 24 74.2 84 165.8 60 179.2 5 38.7
Southeast San Diego 259 165.6 152 199.4 107 133.5 92 625.1 86 344.7 62 77.9 14 43.6 <5 § <5 § 32 117.6 107 257.8 108 296.9 12 79.4
East Region 732 156.9 432 188.0 300 126.7 434 155.5 90 345.5 118 99.2 8 37.7 56 261.3 <5 § 90 129.7 321 265.5 253 196.6 68 116.3
Alpine 12 79.2 6 79.6 6 78.7 6 51.0 <5 § <5 § <5 § <5 § <5 § <5 § 5 157.4 <5 § <5 §
El Cajon 210 167.6 127 207.0 83 129.9 146 198.6 27 394.0 18 53.0 <5 § 14 219.8 <5 § 18 91.4 85 256.7 80 249.7 27 178.5
Harbison Crest/El Cajon** 325 232.1 193 280.9 132 185.1 218 256.1 35 501.1 32 88.4 <5 § 28 405.8 <5 § 33 152.5 135 376.2 122 327.4 35 197.6
Jamul 11 62.6 <5 § 7 93.7 8 83.7 <5 § <5 § <5 § <5 § <5 § <5 § <5 § 6 107.6 <5 §
La Mesa 87 145.0 58 202.6 29 92.5 44 118.0 14 340.7 8 64.9 <5 § 9 337.2 <5 § 16 195.9 28 160.3 36 229.5 7 79.1
Laguna‐Pine Valley <5 § <5 § <5 § <5 § <5 § <5 § <5 § <5 § <5 § <5 § <5 § <5 § <5 §
Lakeside 55 97.6 31 111.2 24 84.2 38 93.0 6 616.0 10 94.1 <5 § <5 § <5 § <5 § 31 215.4 16 98.7 6 94.2
Lemon Grove 67 223.7 32 219.7 35 227.5 40 427.7 10 234.0 14 109.3 <5 § <5 § <5 § 13 278.4 32 401.2 18 233.6 <5 §
Mountain Empire 7 82.3 <5 § 5 127.2 <5 § <5 § <5 § <5 § <5 § <5 § <5 § <5 § <5 § <5 §
Santee 27 52.2 12 48.0 15 56.2 18 47.2 <5 § <5 § <5 § 5 234.6 <5 § 5 69.0 9 65.7 8 53.3 5 82.7
Spring Valley 141 172.5 94 236.4 47 112.0 59 154.2 23 303.7 44 164.4 <5 § 11 294.1 <5 § 14 113.1 79 375.9 42 193.0 6 60.9
North Central Region 311 51.0 169 54.8 142 47.1 201 55.0 27 144.4 40 45.6 24 21.5 14 52.6 <5 § 56 54.1 110 56.8 82 56.8 62 84.2
Coastal 46 60.9 24 61.6 22 60.1 34 56.1 <5 § 7 84.9 <5 § <5 § <5 § 6 54.4 14 50.2 13 79.2 13 103.1
Del Mar‐Mira Mesa 57 36.0 27 34.0 30 37.9 31 40.9 <5 § 7 43.5 14 25.1 <5 § <5 § 12 60.0 15 32.2 20 43.7 10 69.6
Elliott‐Navajo 57 63.7 35 80.7 22 47.8 37 61.8 8 201.1 8 60.6 <5 § <5 § <5 § 11 101.5 23 90.6 13 57.5 10 73.2
Kearny Mesa 121 79.8 71 94.0 50 65.7 75 89.3 13 197.2 18 52.8 5 24.8 8 115.6 <5 § 23 104.6 45 88.8 30 83.0 22 113.5
Miramar <5 § <5 § <5 § <5 § <5 § <5 § <5 § <5 § <5 § <5 § <5 § <5 § <5 §
Peninsula 15 23.8 <5 § 7 24.4 13 27.3 <5 § <5 § <5 § <5 § <5 § <5 § 7 32.8 <5 § <5 §
University 14 21.1 <5 § 11 32.8 10 29.2 <5 § <5 § <5 § <5 § <5 § <5 § 6 29.0 <5 § 5 78.2
North Coastal Region 394 77.3 235 90.5 159 63.6 244 81.6 31 216.5 78 53.1 19 61.4 17 90.7 5 5.0 72 85.3 156 114.3 131 103.3 30 48.7
Carlsbad 43 37.1 23 40.8 20 33.6 32 37.8 <5 § <5 § <5 § <5 § <5 § 9 70.1 16 54.0 10 30.2 8 43.3
Oceanside 173 108.1 112 141.0 61 75.6 93 126.2 19 284.3 37 60.9 11 88.7 8 122.5 <5 § 30 121.2 76 170.1 55 139.9 11 58.7
Pendleton <5 § <5 § <5 § <5 § <5 § <5 § <5 § <5 § <5 § <5 § <5 § <5 § <5 §
San Dieguito 38 40.0 22 47.1 16 33.2 31 41.9 <5 § <5 § <5 § <5 § <5 § 9 89.8 15 61.3 10 33.6 <5 §
Vista 137 135.2 75 146.7 62 123.5 86 197.1 12 456.3 34 71.2 <5 § <5 § <5 § 23 139.5 47 162.5 56 232.5 7 67.3
North Inland Region 512 89.1 279 98.6 233 79.9 345 109.9 36 353.5 73 43.4 22 36.3 33 153.1 6 5.1 89 111.6 172 117.0 178 115.2 67 89.8
Anza‐Borrego Springs <5 § <5 § <5 § <5 § <5 § <5 § <5 § <5 § <5 § <5 § <5 § <5 § <5 §
Escondido 279 169.9 161 197.6 118 142.6 173 245.3 30 911.0 47 62.1 13 125.3 15 348.5 <5 § 38 146.7 92 203.3 124 316.9 21 117.8
Fallbrook 33 68.9 13 54.5 20 83.3 23 84.5 <5 § 5 28.1 <5 § <5 § <5 § 6 82.8 15 148.3 <5 § 7 82.1
North San Diego 39 36.2 18 34.6 21 37.8 30 47.8 <5 § <5 § <5 § <5 § <5 § 7 58.3 8 26.3 10 33.9 14 105.2
Palomar‐Julian <5 § <5 § <5 § <5 § <5 § <5 § <5 § <5 § <5 § <5 § <5 § <5 § <5 §
Pauma <5 § <5 § <5 § <5 § <5 § <5 § <5 § <5 § <5 § <5 § <5 § <5 § <5 §
Poway 29 33.4 15 35.3 14 31.5 17 29.3 <5 § <5 § <5 § <5 § <5 § <5 § 11 54.7 9 32.9 7 62.2
Ramona 33 93.1 18 101.1 15 85.1 28 111.9 <5 § <5 § <5 § <5 § <5 § 9 164.1 14 177.1 5 44.7 5 124.6
San Marcos 72 79.8 35 79.3 37 80.3 54 120.2 <5 § 12 36.1 <5 § <5 § <5 § 17 132.9 26 104.4 19 91.8 10 84.0
Valley Center 16 68.2 12 102.0 <5 § 12 80.9 <5 § <5 § <5 § <5 § <5 § 6 184.2 <5 § 6 78.4 <5 §
South Region 402 85.6 240 102.7 162 68.7 181 188.3 43 228.7 145 51.6 26 43.4 <5 § <5 § 66 81.3 156 119.8 123 113.9 55 111.3
Chula Vista 166 143.2 97 173.7 69 114.8 86 410.9 17 444.0 50 60.6 10 164.9 <5 § <5 § 30 157.8 53 171.5 48 178.2 34 231.8
Coronado 10 42.9 5 37.4 5 50.2 8 46.9 <5 § <5 § <5 § <5 § <5 § <5 § <5 § <5 § <5 §
National City 80 136.8 50 166.6 30 105.3 30 455.2 10 403.7 27 71.9 11 104.0 <5 § <5 § 10 81.7 40 253.1 24 196.9 5 82.3
South Bay 106 78.4 67 98.5 39 58.1 40 198.9 9 173.4 54 57.9 <5 § <5 § <5 § 17 71.5 45 119.7 37 119.7 7 53.0
Sweetwater 40 29.3 21 31.6 19 27.1 17 54.1 6 99.2 14 21.7 <5 § <5 § <5 § 8 39.0 16 40.1 10 30.4 6 50.4Unknown 179 ‐‐‐ 132 ‐‐‐ 47 ‐‐‐ 92 ‐‐‐ 52 ‐‐‐ 21 ‐‐‐ <5 ‐‐‐ 8 ‐‐‐ <5 ‐‐‐ 18 ‐‐‐ 102 ‐‐‐ 56 ‐‐‐ <5 ‐‐‐*Rates per 100,000 population. County age‐adjusted rates per 100,000 2000 US standard population.**Harbison Crest/El Cajon is an aggregation of the Harbison Crest and El Cajon SRAs. Due to geographic limitations, the Harbison Crest SRA is not shown alone. See the Data Guide for more information.
***Numbers may not add up to totals due to unknown or missing details.
†Schizophrenia and other psycho c disorder Emergency Department Discharge refers to (principal diagnosis) ICD‐9 codes 293.81, 293.82, 295, 297, 298.
‡API includes Asian, Pacific Islander, Na ve Hawaiian. Other includes 2 or more races, Na ve American/Alaska Na ve, American Indian, or other.
§Rates not calculated for fewer than 5 events. Rates not calculated in cases where zip code is unknown.
Source: Emergency Department Discharge Database (CA OSHPD), County of San Diego, Health & Human Services Agency, Public Health Services, Emergency Medical Services; SANDAG, Current Population Estimates, 10/2012.
Prepared by: County of San Diego, Health & Human Services Agency, Public Health Services, Community Health Statistics Unit, 2013.
Gender Race/Ethnicity Age Group
Male Female White Black Hispanic Ages 65+API‡ Other‡ Ages 0‐14 Ages 15‐24 Ages 25‐44 Ages 45‐64Geography2011 Total
Schizophrenia and Other Psycho c Disorder† Emergency Department Discharges Among San Diego County Residents by Loca on of Residence, 2011 Detail
County of San Diego, Health & Human Services Agency, Public Health Services, Community Health Statisitcs Unit Page 111

Self‐Inflicted Injury
County of San Diego, Health & Human Services Agency, Public Health Services, Community Health Statisitcs Unit Page 112

No. Rate* No. Rate* No. Rate* No. Rate* No. Rate* No. Rate* No. Rate* No. Rate* No. Rate* No. Rate* No. Rate*
San Diego County (Actual Rate) 1,796 58.0 2,040 65.5
San Diego County (Age‐Adjusted Rate) 1,796 56.3 2,040 63.3
Central Region 351 72.5 446 91.9
Central San Diego 151 91.2 191 115.1
Mid‐City 104 63.8 114 69.9
Southeast San Diego 96 61.6 141 90.1
East Region 352 76.0 343 73.5
Alpine 9 59.9 9 59.4
El Cajon 82 65.8 60 47.9
Harbison Crest/El Cajon** 138 99.2 131 93.5
Jamul 14 73.8 8 45.5
La Mesa 48 81.2 57 95.0
Laguna‐Pine Valley <5 § <5 §
Lakeside 36 64.3 28 49.7
Lemon Grove 17 57.0 21 70.1
Mountain Empire <5 § 5 58.8
Santee 40 78.2 32 61.9
Spring Valley 46 56.8 52 63.6
North Central Region 262 43.4 312 51.2
Coastal 33 43.8 38 50.3
Del Mar‐Mira Mesa 46 29.2 53 33.4
Elliott‐Navajo 36 40.4 50 55.9
Kearny Mesa 103 68.1 114 75.2
Miramar <5 § <5 §
Peninsula 24 38.1 38 60.3
University 19 30.3 19 28.6
North Coastal Region 292 57.7 351 68.8
Carlsbad 52 45.3 83 71.6
Oceanside 119 74.5 115 71.8
Pendleton <5 § <5 §
San Dieguito 40 42.8 51 53.7
Vista 81 80.7 98 96.7
North Inland Region 248 43.5 295 51.3
Anza‐Borrego Springs <5 § 5 107.1
Escondido 86 52.8 103 62.7
Fallbrook 17 35.9 22 46.0
North San Diego 52 48.8 64 59.5
Palomar‐Julian <5 § <5 §
Pauma <5 § 8 102.9
Poway 31 35.9 35 40.3
Ramona 15 43.0 19 53.6
San Marcos 34 37.8 34 37.7
Valley Center 8 34.3 <5 §
South Region 291 62.1 293 62.4
Chula Vista 118 102.4 114 98.3
Coronado <5 § 11 47.2
National City 32 54.9 38 65.0
South Bay 95 70.4 92 68.1
Sweetwater 42 31.0 38 27.8Unknown <5 ‐‐‐ <5 ‐‐‐*Rates per 100,000 population. County age‐adjusted rates per 100,000 2000 US standard population.**Harbison Crest/El Cajon is an aggregation of the Harbison Crest and El Cajon SRAs. Due to geographic limitations, the Harbison Crest SRA is not shown alone. See the Data Guide for more information.†Self‐inflicted injury hospitaliza on refers to (principal diagnosis) ICD‐9 Ecodes E950‐E959.§Rates not calculated for fewer than 5 events. Rates not calculated in cases where zip code is unknown.Source: Patient Discharge Database (CA OSHPD), County of San Diego, Health & Human Services Agency, Public Health Services, Epidemiology & Immunization Services Branch; SANDAG, Current Population Estimates, 10/2012.Prepared by: County of San Diego, Health & Human Services Agency, Public Health Services, Community Health Statistics Unit, 2013.
Self‐Inflicted Injury† Hospitaliza ons Among San Diego County Residents by Loca on of Residence
Geography2010 Total 2011 Total 2012 Total 2013 Total 2014 Total 2015 Total 2016 Total 2017 Total 2018 Total 2019 Total 2020 Total
County of San Diego, Health & Human Services Agency, Public Health Services, Community Health Statisitcs Unit Page 113

No. Rate* No. Rate* No. Rate* No. Rate* No. Rate* No. Rate* No. Rate* No. Rate* No. Rate* No. Rate* No. Rate* No. Rate* No. Rate*
San Diego County (Actual Rate) 1,796 58.0 756 48.7 1,040 67.5 1,190 79.3 130 88.7 333 33.6 78 22.8 40 34.6 85 14.3 480 96.8 647 72.6 485 63.8 99 28.2
San Diego County (Age‐Adjusted Rate) 1,796 56.3
Central Region 351 72.5 182 73.5 169 71.4 177 123.2 59 104.1 93 45.5 19 29.7 <5 § 6 6.7 69 83.0 160 99.1 105 98.4 11 25.4
Central San Diego 151 91.2 84 92.8 67 89.3 95 115.4 14 121.9 34 59.0 6 70.6 <5 § <5 § 25 108.7 70 100.4 45 118.6 9 57.9
Mid‐City 104 63.8 51 62.8 53 64.8 52 111.9 21 108.7 24 35.1 7 29.7 <5 § <5 § 14 42.1 47 93.2 39 119.0 <5 §
Southeast San Diego 96 61.6 47 61.9 49 61.4 30 201.4 24 92.7 35 44.7 6 18.9 <5 § <5 § 30 111.7 43 104.1 21 58.3 <5 §
East Region 352 76.0 135 59.2 217 92.3 268 96.0 24 90.3 39 33.7 8 38.7 10 47.6 26 28.9 101 147.4 106 87.5 109 85.5 10 17.9
Alpine 9 59.9 6 80.4 <5 § 8 67.7 <5 § <5 § <5 § <5 § <5 § <5 § <5 § 5 102.7 <5 §
El Cajon 82 65.8 29 47.6 53 83.3 63 85.5 7 100.0 9 27.2 <5 § <5 § 6 23.5 21 106.8 24 72.7 31 97.8 <5 §
Harbison Crest/El Cajon** 138 99.2 43 63.0 95 133.9 104 121.9 13 182.5 12 34.0 5 106.3 <5 § 9 32.4 36 167.2 43 120.0 47 127.3 <5 §
Jamul 14 73.8 <5 § 11 136.5 11 104.9 <5 § <5 § <5 § <5 § <5 § 6 189.0 <5 § <5 § <5 §
La Mesa 48 81.2 19 67.4 29 93.8 40 108.0 <5 § 5 42.2 <5 § <5 § <5 § 10 118.6 14 82.0 19 123.7 <5 §
Laguna‐Pine Valley <5 § <5 § <5 § <5 § <5 § <5 § <5 § <5 § <5 § <5 § <5 § <5 § <5 §
Lakeside 36 64.3 14 50.5 22 77.7 23 56.3 <5 § 8 77.2 <5 § <5 § <5 § 10 125.0 14 96.7 8 49.9 <5 §
Lemon Grove 17 57.0 7 48.3 10 65.3 13 137.3 <5 § <5 § <5 § <5 § <5 § 8 175.3 5 62.3 <5 § <5 §
Mountain Empire <5 § <5 § <5 § <5 § <5 § <5 § <5 § <5 § <5 § <5 § <5 § <5 § <5 §
Santee 40 78.2 17 68.6 23 87.2 31 81.6 <5 § 5 61.5 <5 § <5 § 5 50.9 14 200.1 8 57.7 12 81.4 <5 §
Spring Valley 46 56.8 24 60.9 22 52.9 36 94.1 <5 § 6 23.0 <5 § <5 § <5 § 16 132.4 15 71.2 11 51.0 <5 §
North Central Region 262 43.4 86 28.1 176 59.0 198 54.2 13 69.3 23 26.8 14 12.9 6 23.0 16 16.9 77 75.1 92 47.9 62 43.4 15 20.9
Coastal 33 43.8 13 33.5 20 54.7 30 49.3 <5 § <5 § <5 § <5 § <5 § 8 71.8 10 36.1 9 54.7 <5 §
Del Mar‐Mira Mesa 46 29.2 10 12.6 36 45.9 29 38.2 <5 § <5 § 7 12.7 <5 § 5 15.5 13 67.4 14 29.5 12 26.8 <5 §
Elliott‐Navajo 36 40.4 17 39.3 19 41.4 32 53.3 <5 § <5 § <5 § <5 § <5 § 8 72.1 18 71.5 8 35.6 <5 §
Kearny Mesa 103 68.1 31 41.1 72 94.9 71 84.2 9 134.0 15 44.8 <5 § <5 § 7 30.1 31 131.6 35 70.4 24 67.4 6 31.5
Miramar <5 § <5 § <5 § <5 § <5 § <5 § <5 § <5 § <5 § <5 § <5 § <5 § <5 §
Peninsula 24 38.1 9 26.3 15 52.2 22 45.9 <5 § <5 § <5 § <5 § <5 § 9 72.0 10 47.5 <5 § <5 §
University 19 30.3 6 19.3 13 41.1 14 42.5 <5 § <5 § <5 § <5 § <5 § 7 31.9 5 25.3 6 65.3 <5 §
North Coastal Region 292 57.7 114 44.2 178 71.8 223 74.5 12 82.6 37 25.7 7 23.3 8 44.0 14 13.9 80 95.6 88 64.5 75 60.0 35 58.7
Carlsbad 52 45.3 24 43.0 28 47.5 47 55.7 <5 § <5 § <5 § <5 § <5 § 11 90.0 18 59.8 13 39.9 7 39.3
Oceanside 119 74.5 48 60.6 71 88.2 86 115.8 8 115.3 14 23.4 <5 § 6 93.9 11 34.2 30 118.3 37 82.8 26 66.5 15 81.4
Pendleton <5 § <5 § <5 § <5 § <5 § <5 § <5 § <5 § <5 § <5 § <5 § <5 § <5 §
San Dieguito 40 42.8 14 30.4 26 54.7 35 47.7 <5 § <5 § <5 § <5 § <5 § 12 127.9 11 44.6 13 44.3 <5 §
Vista 81 80.7 28 55.2 53 106.6 55 125.4 <5 § 18 38.6 <5 § <5 § <5 § 27 161.1 22 76.6 23 97.6 9 89.2
North Inland Region 248 43.5 99 35.3 149 51.6 189 60.0 5 48.3 32 19.5 10 16.9 11 51.9 13 10.9 68 88.2 82 55.2 64 42.0 21 29.1
Anza‐Borrego Springs <5 § <5 § <5 § <5 § <5 § <5 § <5 § <5 § <5 § <5 § <5 § <5 § <5 §
Escondido 86 52.8 36 44.5 50 60.9 60 84.4 <5 § 24 32.4 <5 § <5 § 5 13.8 24 93.6 39 86.1 9 23.4 9 51.4
Fallbrook 17 35.9 6 25.5 11 46.3 12 43.9 <5 § <5 § <5 § <5 § <5 § 8 112.3 <5 § <5 § <5 §
North San Diego 52 48.8 23 44.7 29 52.7 40 63.8 <5 § <5 § 6 23.4 5 99.3 6 26.7 10 87.4 15 48.6 13 44.9 8 62.1
Palomar‐Julian <5 § <5 § <5 § <5 § <5 § <5 § <5 § <5 § <5 § <5 § <5 § <5 § <5 §
Pauma <5 § <5 § <5 § <5 § <5 § <5 § <5 § <5 § <5 § <5 § <5 § <5 § <5 §
Poway 31 35.9 8 19.0 23 52.1 28 48.3 <5 § <5 § <5 § <5 § <5 § 9 89.0 8 38.5 14 52.1 <5 §
Ramona 15 43.0 6 34.2 9 51.9 13 52.3 <5 § <5 § <5 § <5 § <5 § <5 § <5 § 7 63.5 <5 §
San Marcos 34 37.8 13 29.5 21 45.7 26 57.2 <5 § <5 § <5 § <5 § <5 § 13 103.6 8 31.7 13 63.8 <5 §
Valley Center 8 34.3 5 42.7 <5 § 6 40.1 <5 § <5 § <5 § <5 § <5 § <5 § <5 § <5 § <5 §
South Region 291 62.1 140 59.8 151 64.4 135 137.6 17 86.3 109 39.2 20 33.6 <5 § 10 9.9 85 105.2 119 90.2 70 66.0 7 14.4
Chula Vista 118 102.4 54 97.2 64 107.2 53 248.1 8 202.5 44 54.1 7 116.2 <5 § 8 32.7 38 202.2 43 138.8 27 102.0 <5 §
Coronado <5 § <5 § <5 § <5 § <5 § <5 § <5 § <5 § <5 § <5 § <5 § <5 § <5 §
National City 32 54.9 16 53.3 16 56.5 16 235.5 <5 § 12 32.3 <5 § <5 § <5 § 7 57.1 15 95.4 10 83.4 <5 §
South Bay 95 70.4 52 76.4 43 64.3 43 209.5 8 147.5 39 42.2 <5 § <5 § <5 § 23 96.3 45 118.6 22 71.9 <5 §
Sweetwater 42 31.0 17 25.8 25 36.0 19 60.2 <5 § 14 22.1 8 27.7 <5 § <5 § 16 82.6 14 34.4 10 31.3 <5 §Unknown <5 ‐‐‐ <5 ‐‐ <5 ‐‐‐ <5 ‐‐‐ <5 ‐‐‐ <5 ‐‐‐ <5 ‐‐‐ <5 ‐‐‐ <5 ‐‐‐ <5 ‐‐‐ <5 ‐‐‐ <5 ‐‐‐ <5 ‐‐‐*Rates per 100,000 population. County age‐adjusted rates per 100,000 2000 US standard population.**Harbison Crest/El Cajon is an aggregation of the Harbison Crest and El Cajon SRAs. Due to geographic limitations, the Harbison Crest SRA is not shown alone. See the Data Guide for more information.
***Numbers may not add up to totals due to unknown or missing details.
†Self‐inflicted injury hospitaliza on refers to (principal diagnosis) ICD‐9 Ecodes E950‐E959.
‡API includes Asian, Pacific Islander, Na ve Hawaiian. Other includes 2 or more races, Na ve American/Alaska Na ve, American Indian, or other.
§Rates not calculated for fewer than 5 events. Rates not calculated in cases where zip code is unknown.
Source: Patient Discharge Database (CA OSHPD), County of San Diego, Health & Human Services Agency, Public Health Services, Epidemiology & Immunization Services Branch; SANDAG, Current Population Estimates, 10/2012.
Prepared by: County of San Diego, Health & Human Services Agency, Public Health Services, Community Health Statistics Unit, 2013.
Ages 0‐14 Ages 15‐24 Ages 25‐44 Ages 45‐64 Ages 65+
Self‐Inflicted Injury† Hospitaliza ons Among San Diego County Residents by Loca on of Residence, 2010 Detail
Geography2010 Total
Gender Race/Ethnicity Age Group
Male Female White Black Hispanic API‡ Other‡
County of San Diego, Health & Human Services Agency, Public Health Services, Community Health Statisitcs Unit Page 114

No. Rate* No. Rate* No. Rate* No. Rate* No. Rate* No. Rate* No. Rate* No. Rate* No. Rate* No. Rate* No. Rate* No. Rate* No. Rate*
San Diego County (Actual Rate) 2,040 65.5 830 53.1 1,210 77.9 1,304 87.2 130 91.0 399 39.5 93 26.7 79 67.1 115 19.4 606 121.6 697 78.2 513 66.5 109 30.1
San Diego County (Age‐Adjusted Rate) 2,040 63.3
Central Region 446 91.9 226 91.1 220 92.6 214 150.4 62 113.0 126 60.6 26 40.3 10 62.4 15 16.6 117 145.7 182 111.9 113 104.1 19 43.1
Central San Diego 191 115.1 98 108.2 93 123.4 120 146.6 13 117.0 41 69.9 7 81.2 6 104.6 <5 § 39 188.1 85 120.7 54 139.7 12 74.8
Mid‐City 114 69.9 48 59.1 66 80.6 55 120.2 12 63.8 34 48.9 7 29.4 <5 § 7 20.7 30 92.8 40 78.9 31 92.6 6 46.5
Southeast San Diego 141 90.1 80 104.9 61 76.1 39 265.0 37 148.3 51 64.1 12 37.3 <5 § 7 19.3 48 176.3 57 137.4 28 77.0 <5 §
East Region 343 73.5 148 64.4 195 82.3 248 88.9 20 76.8 39 32.8 6 28.3 20 93.3 15 16.8 98 141.2 113 93.5 92 71.5 25 42.7
Alpine 9 59.4 6 79.6 <5 § 8 68.0 <5 § <5 § <5 § <5 § <5 § 6 283.0 <5 § <5 § <5 §
El Cajon 60 47.9 29 47.3 31 48.5 44 59.8 5 73.0 6 17.7 <5 § <5 § <5 § 21 106.7 15 45.3 18 56.2 <5 §
Harbison Crest/El Cajon** 131 93.5 54 78.6 77 108.0 92 108.1 9 128.8 17 47.0 <5 § 6 87.0 5 18.2 45 207.9 35 97.5 38 102.0 8 45.2
Jamul 8 45.5 <5 § <5 § 5 52.3 <5 § <5 § <5 § <5 § <5 § <5 § 5 115.4 <5 § <5 §
La Mesa 57 95.0 30 104.8 27 86.1 48 128.7 <5 § <5 § <5 § 5 187.3 <5 § 10 122.4 17 97.3 18 114.7 8 90.3
Laguna‐Pine Valley <5 § <5 § <5 § <5 § <5 § <5 § <5 § <5 § <5 § <5 § <5 § <5 § <5 §
Lakeside 28 49.7 12 43.0 16 56.2 22 53.8 <5 § <5 § <5 § <5 § <5 § 8 99.2 8 55.6 7 43.2 <5 §
Lemon Grove 21 70.1 8 54.9 13 84.5 13 139.0 <5 § <5 § <5 § <5 § <5 § <5 § 8 100.3 6 77.9 <5 §
Mountain Empire 5 58.8 <5 § <5 § <5 § <5 § <5 § <5 § <5 § <5 § <5 § <5 § <5 § <5 §
Santee 32 61.9 14 55.9 18 67.5 26 68.1 <5 § <5 § <5 § <5 § <5 § 5 69.0 12 87.6 10 66.7 <5 §
Spring Valley 52 63.6 18 45.3 34 81.0 30 78.4 7 92.4 8 29.9 <5 § 5 133.7 <5 § 14 113.1 26 123.7 10 46.0 <5 §
North Central Region 312 51.2 110 35.7 202 67.0 231 63.3 11 58.8 37 42.2 19 17.0 11 41.3 19 20.1 99 95.6 103 53.2 65 45.0 26 35.3
Coastal 38 50.3 13 33.4 25 68.3 32 52.8 <5 § <5 § <5 § <5 § <5 § 8 72.5 13 46.6 8 48.7 9 71.3
Del Mar‐Mira Mesa 53 33.4 23 29.0 30 37.9 41 54.1 <5 § <5 § 7 12.5 <5 § <5 § 20 100.0 15 32.2 7 15.3 7 48.7
Elliott‐Navajo 50 55.9 18 41.5 32 69.5 37 61.8 <5 § 7 53.1 <5 § <5 § <5 § 20 184.6 17 67.0 7 31.0 <5 §
Kearny Mesa 114 75.2 36 47.6 78 102.5 70 83.4 <5 § 23 67.5 10 49.6 6 86.7 8 34.0 32 145.5 37 73.0 32 88.5 5 25.8
Miramar <5 § <5 § <5 § <5 § <5 § <5 § <5 § <5 § <5 § <5 § <5 § <5 § <5 §
Peninsula 38 60.3 16 46.5 22 76.7 35 73.4 <5 § <5 § <5 § <5 § <5 § 13 105.5 14 65.6 9 63.2 <5 §
University 19 28.6 <5 § 15 44.7 16 46.8 <5 § <5 § <5 § <5 § <5 § 6 24.7 7 33.8 <5 § <5 §
North Coastal Region 351 68.8 110 42.4 241 96.3 267 89.3 9 62.8 44 30.0 12 38.8 13 69.3 25 24.9 115 136.3 112 82.0 82 64.7 17 27.6
Carlsbad 83 71.6 23 40.8 60 100.8 71 83.8 <5 § 6 34.9 <5 § <5 § 10 45.9 26 202.7 22 74.3 20 60.3 5 27.1
Oceanside 115 71.8 35 44.0 80 99.2 82 111.3 <5 § 21 34.5 <5 § 5 76.6 5 15.3 41 165.6 39 87.3 26 66.1 <5 §
Pendleton <5 § <5 § <5 § <5 § <5 § <5 § <5 § <5 § <5 § <5 § <5 § <5 § <5 §
San Dieguito 51 53.7 16 34.3 35 72.6 46 62.2 <5 § <5 § <5 § <5 § <5 § 23 229.5 15 61.3 7 23.5 <5 §
Vista 98 96.7 33 64.6 65 129.4 64 146.7 7 266.2 15 31.4 5 118.3 5 162.1 8 37.4 22 133.4 35 121.0 29 120.4 <5 §
North Inland Region 295 51.3 107 37.8 188 64.5 214 68.2 6 58.9 44 26.1 14 23.1 14 64.9 20 16.9 96 120.4 79 53.7 84 54.4 16 21.4
Anza‐Borrego Springs 5 107.1 <5 § <5 § 5 177.2 <5 § <5 § <5 § <5 § <5 § <5 § <5 § <5 § <5 §
Escondido 103 62.7 34 41.7 69 83.4 68 96.4 <5 § 23 30.4 <5 § 7 162.6 6 16.6 33 127.4 34 75.1 26 66.4 <5 §
Fallbrook 22 46.0 8 33.5 14 58.3 20 73.4 <5 § <5 § <5 § <5 § <5 § 5 69.0 8 79.1 8 60.9 <5 §
North San Diego 64 59.5 24 46.1 40 72.0 47 74.8 <5 § 5 45.7 7 26.6 <5 § 9 40.2 23 191.7 18 59.1 11 37.3 <5 §
Palomar‐Julian <5 § <5 § <5 § <5 § <5 § <5 § <5 § <5 § <5 § <5 § <5 § <5 § <5 §
Pauma 8 102.9 <5 § 7 185.7 <5 § <5 § <5 § <5 § <5 § <5 § <5 § <5 § <5 § <5 §
Poway 35 40.3 16 37.7 19 42.7 27 46.6 <5 § <5 § <5 § <5 § <5 § 14 127.8 6 29.8 9 32.9 <5 §
Ramona 19 53.6 8 44.9 11 62.4 14 56.0 <5 § <5 § <5 § <5 § <5 § <5 § <5 § 11 98.3 <5 §
San Marcos 34 37.7 11 24.9 23 49.9 25 55.6 <5 § 6 18.0 <5 § <5 § <5 § 11 86.0 7 28.1 12 58.0 <5 §
Valley Center <5 § <5 § <5 § <5 § <5 § <5 § <5 § <5 § <5 § <5 § <5 § <5 § <5 §
South Region 293 62.4 129 55.2 164 69.6 130 135.2 22 117.0 109 38.8 16 26.7 11 81.9 21 20.9 81 99.8 108 82.9 77 71.3 6 12.1
Chula Vista 114 98.3 52 93.1 62 103.2 48 229.3 9 235.0 40 48.5 7 115.5 8 312.0 7 28.7 34 178.9 34 110.0 35 129.9 <5 §
Coronado 11 47.2 <5 § 7 70.3 9 52.7 <5 § <5 § <5 § <5 § <5 § <5 § 5 83.2 <5 § <5 §
National City 38 65.0 9 30.0 29 101.8 18 273.1 <5 § 16 42.6 <5 § <5 § <5 § 8 65.4 15 94.9 12 98.4 <5 §
South Bay 92 68.1 50 73.5 42 62.6 37 183.9 6 115.6 41 44.0 <5 § <5 § 7 23.6 26 109.4 39 103.7 19 61.5 <5 §
Sweetwater 38 27.8 14 21.1 24 34.2 18 57.3 5 82.7 10 15.5 <5 § <5 § 5 15.9 10 48.8 15 37.6 8 24.3 <5 §Unknown <5 ‐‐‐ <5 ‐‐‐ <5 ‐‐‐ <5 ‐‐‐ <5 ‐‐‐ <5 ‐‐‐ <5 ‐‐‐ <5 ‐‐‐ <5 ‐‐‐ <5 ‐‐‐ <5 ‐‐‐ <5 ‐‐‐ <5 ‐‐‐*Rates per 100,000 population. County age‐adjusted rates per 100,000 2000 US standard population.**Harbison Crest/El Cajon is an aggregation of the Harbison Crest and El Cajon SRAs. Due to geographic limitations, the Harbison Crest SRA is not shown alone. See the Data Guide for more information.
**Numbers may not add up to totals due to unknown or missing details.
†Self‐inflicted injury hospitaliza on refers to (principal diagnosis) ICD‐9 Ecodes E950‐E959.
‡API includes Asian, Pacific Islander, Na ve Hawaiian. Other includes 2 or more races, Na ve American/Alaska Na ve, American Indian, or other.
§Rates not calculated for fewer than 5 events. Rates not calculated in cases where zip code is unknown.
Source: Patient Discharge Database (CA OSHPD), County of San Diego, Health & Human Services Agency, Public Health Services, Epidemiology & Immunization Services Branch; SANDAG, Current Population Estimates, 10/2012.
Prepared by: County of San Diego, Health & Human Services Agency, Public Health Services, Community Health Statistics Unit, 2013.
Gender Race/Ethnicity Age Group
Male Female White Black Hispanic Ages 65+API‡ Other‡ Ages 0‐14 Ages 15‐24 Ages 25‐44 Ages 45‐64Geography2011 Total
Self‐Inflicted Injury† Hospitaliza ons Among San Diego County Residents by Loca on of Residence, 2011 Detail
County of San Diego, Health & Human Services Agency, Public Health Services, Community Health Statisitcs Unit Page 115

No. Rate* No. Rate* No. Rate* No. Rate* No. Rate* No. Rate* No. Rate* No. Rate* No. Rate* No. Rate* No. Rate*
San Diego County (Actual Rate) 2,378 76.8 2,439 78.3
San Diego County (Age‐Adjusted Rate) 2,378 73.1 2,439 74.9
Central Region 357 73.7 381 78.5
Central San Diego 163 98.4 201 121.1
Mid‐City 108 66.2 103 63.1
Southeast San Diego 86 55.2 77 49.2
East Region 620 133.9 629 134.8
Alpine 21 139.7 14 92.4
El Cajon 144 115.6 127 101.4
Harbison Crest/El Cajon** 221 158.8 241 172.1
Jamul 25 131.9 30 170.7
La Mesa 79 133.7 108 180.0
Laguna‐Pine Valley <5 § <5 §
Lakeside 62 110.7 58 102.9
Lemon Grove 20 67.1 31 103.5
Mountain Empire 10 131.8 17 199.9
Santee 91 177.9 73 141.2
Spring Valley 89 109.9 56 68.5
North Central Region 364 60.3 342 56.1
Coastal 46 61.0 38 50.3
Del Mar‐Mira Mesa 59 37.4 50 31.5
Elliott‐Navajo 58 65.1 76 85.0
Kearny Mesa 127 84.0 125 82.4
Miramar <5 § <5 §
Peninsula 37 58.8 33 52.3
University 35 55.8 20 30.1
North Coastal Region 363 71.8 331 64.9
Carlsbad 58 50.6 56 48.3
Oceanside 146 91.4 160 99.9
Pendleton 6 16.0 <5 §
San Dieguito 55 58.8 44 46.4
Vista 98 97.6 70 69.1
North Inland Region 353 62.0 394 68.6
Anza‐Borrego Springs 5 112.6 7 150.0
Escondido 139 85.3 141 85.9
Fallbrook 39 82.4 55 114.9
North San Diego 33 31.0 59 54.8
Palomar‐Julian <5 § <5 §
Pauma 5 67.0 7 90.1
Poway 38 44.0 38 43.7
Ramona 37 106.1 27 76.2
San Marcos 43 47.8 42 46.6
Valley Center 12 51.4 15 63.9
South Region 277 59.1 317 67.5
Chula Vista 130 112.8 134 115.6
Coronado 9 36.4 9 38.6
National City 27 46.3 19 32.5
South Bay 84 62.3 127 94.0
Sweetwater 27 20.0 28 20.5Unknown 44 ‐‐‐ 45 ‐‐‐*Rates per 100,000 population. County age‐adjusted rates per 100,000 2000 US standard population.**Harbison Crest/El Cajon is an aggregation of the Harbison Crest and El Cajon SRAs. Due to geographic limitations, the Harbison Crest SRA is not shown alone. See the Data Guide for more information.†Self‐inflicted injury emergency department discharge refers to (principal diagnosis) ICD‐9 Ecodes E950‐E959.§Rates not calculated for fewer than 5 events. Rates not calculated in cases where zip code is unknown.Source: Emergency Department Discharge Database (CA OSHPD), County of San Diego, Health & Human Services Agency, Public Health Services, Emergency Medical Services; SANDAG, Current Population Estimates, 10/2012.Prepared by: County of San Diego, Health & Human Services Agency, Public Health Services, Community Health Statistics Unit, 2013.
Self‐Inflicted Injury† Emergency Department Discharges in San Diego County by Loca on of Residence
Geography2010 Total 2011 Total 2012 Total 2013 Total 2014 Total 2015 Total 2016 Total 2017 Total 2018 Total 2019 Total 2020 Total
County of San Diego, Health & Human Services Agency, Public Health Services, Community Health Statisitcs Unit Page 116

No. Rate* No. Rate* No. Rate* No. Rate* No. Rate* No. Rate* No. Rate* No. Rate* No. Rate* No. Rate* No. Rate* No. Rate* No. Rate*
San Diego County (Actual Rate) 2,378 76.8 1,016 65.4 1,362 88.3 1,520 101.3 184 125.5 499 50.3 75 22.0 64 55.3 142 23.8 872 175.9 851 95.5 452 59.4 61 17.4
San Diego County (Age‐Adjusted Rate) 2,378 73.1
Central Region 357 73.7 178 71.9 179 75.6 177 123.2 59 104.1 96 47.0 11 17.2 9 56.8 17 18.9 106 127.5 155 96.0 76 71.2 <5 §
Central San Diego 163 98.4 98 108.3 65 86.6 104 126.4 19 165.5 31 53.8 <5 § 5 88.1 5 25.8 36 156.6 80 114.7 41 108.0 <5 §
Mid‐City 108 66.2 42 51.7 66 80.7 51 109.8 18 93.2 29 42.4 6 25.5 <5 § 6 17.7 33 99.2 51 101.2 16 48.8 <5 §
Southeast San Diego 86 55.2 38 50.0 48 60.1 22 147.7 22 85.0 36 46.0 <5 § <5 § 6 16.4 37 137.7 24 58.1 19 52.8 <5 §
East Region 620 133.9 255 111.8 365 155.3 433 155.1 43 161.8 103 89.1 11 53.2 16 76.2 35 38.9 227 331.3 212 174.9 136 106.7 10 17.9
Alpine 21 139.7 14 187.7 7 92.4 15 127.0 <5 § <5 § <5 § <5 § <5 § 6 304.1 7 213.9 7 143.7 <5 §
El Cajon 144 115.6 68 111.6 76 119.5 98 133.0 11 157.2 26 78.4 <5 § <5 § 7 27.5 50 254.3 44 133.3 39 123.0 <5 §
Harbison Crest/El Cajon** 221 158.8 96 140.7 125 176.2 154 180.6 18 252.7 33 93.6 <5 § 6 88.1 13 46.8 80 371.7 67 186.9 55 148.9 6 35.1
Jamul 25 131.9 12 110.1 13 161.3 17 162.2 <5 § <5 § <5 § <5 § <5 § 14 441.1 6 125.1 <5 § <5 §
La Mesa 79 133.7 37 131.3 42 135.9 46 124.2 7 169.0 22 185.6 <5 § <5 § <5 § 32 379.4 24 140.5 21 136.7 <5 §
Laguna‐Pine Valley <5 § <5 § <5 § <5 § <5 § <5 § <5 § <5 § <5 § <5 § <5 § <5 § <5 §
Lakeside 62 110.7 21 75.8 41 144.8 45 110.2 <5 § 11 106.1 <5 § <5 § 5 43.6 21 262.5 22 151.9 13 81.1 <5 §
Lemon Grove 20 67.1 11 75.9 9 58.8 14 147.9 <5 § <5 § <5 § <5 § <5 § 8 175.3 7 87.2 <5 § <5 §
Mountain Empire 10 131.8 <5 § 8 228.2 7 169.1 <5 § <5 § <5 § <5 § <5 § 5 501.0 <5 § <5 § <5 §
Santee 91 177.9 33 133.2 58 219.8 74 194.9 <5 § 10 122.9 <5 § <5 § 5 50.9 32 457.3 31 223.5 20 135.6 <5 §
Spring Valley 89 109.9 27 68.5 62 149.1 59 154.2 9 116.2 17 65.3 <5 § <5 § <5 § 27 223.4 46 218.4 12 55.6 <5 §
North Central Region 364 60.3 149 48.8 215 72.0 257 70.4 30 159.9 36 42.0 22 20.3 13 49.8 23 24.3 125 121.8 133 69.3 63 44.1 20 27.8
Coastal 46 61.0 25 64.4 21 57.5 40 65.8 <5 § <5 § <5 § <5 § 5 65.0 10 89.7 19 68.6 10 60.8 <5 §
Del Mar‐Mira Mesa 59 37.4 23 29.1 36 45.9 37 48.7 5 135.1 5 31.6 7 12.7 <5 § <5 § 20 103.6 20 42.1 9 20.1 6 44.1
Elliott‐Navajo 58 65.1 29 67.1 29 63.2 40 66.6 8 199.0 6 46.2 <5 § <5 § <5 § 18 162.3 23 91.4 12 53.4 <5 §
Kearny Mesa 127 84.0 39 51.8 88 116.0 82 97.2 14 208.5 15 44.8 11 55.5 <5 § 7 30.1 49 208.0 46 92.5 19 53.3 6 31.5
Miramar <5 § <5 § <5 § <5 § <5 § <5 § <5 § <5 § <5 § <5 § <5 § <5 § <5 §
Peninsula 37 58.8 14 41.0 23 80.0 32 66.7 <5 § <5 § <5 § <5 § <5 § 15 120.0 12 57.0 5 34.9 <5 §
University 35 55.8 19 61.2 16 50.5 26 79.0 <5 § <5 § <5 § <5 § <5 § 12 54.7 12 60.8 8 87.1 <5 §
North Coastal Region 363 71.8 154 59.7 209 84.3 258 86.2 20 137.7 64 44.5 9 30.0 9 49.5 16 15.8 157 187.5 118 86.4 62 49.6 10 16.8
Carlsbad 58 50.6 17 30.5 41 69.6 49 58.1 <5 § 7 42.0 <5 § <5 § <5 § 20 163.6 17 56.5 17 52.1 <5 §
Oceanside 146 91.4 64 80.8 82 101.9 94 126.6 12 173.0 29 48.4 7 57.1 <5 § 8 24.9 58 228.7 49 109.7 26 66.5 5 27.1
Pendleton 6 16.0 <5 § <5 § <5 § <5 § <5 § <5 § <5 § <5 § 5 25.0 <5 § <5 § <5 §
San Dieguito 55 58.8 21 45.6 34 71.6 51 69.5 <5 § <5 § <5 § <5 § <5 § 27 287.8 18 73.0 7 23.9 <5 §
Vista 98 97.6 49 96.6 49 98.5 63 143.7 6 221.6 25 53.6 <5 § <5 § <5 § 47 280.5 33 115.0 12 50.9 <5 §
North Inland Region 353 62.0 129 46.0 224 77.5 256 81.3 10 96.6 68 41.5 6 10.1 12 56.6 29 24.3 135 175.1 113 76.1 64 42.0 12 16.6
Anza‐Borrego Springs 5 112.6 <5 § <5 § 5 178.4 <5 § <5 § <5 § <5 § <5 § <5 § <5 § <5 § <5 §
Escondido 139 85.3 55 68.0 84 102.3 92 129.4 7 208.0 35 47.2 <5 § <5 § 14 38.7 43 167.7 58 128.1 22 57.3 <5 §
Fallbrook 39 82.4 9 38.2 30 126.3 27 98.9 <5 § 9 52.2 <5 § <5 § <5 § 14 196.5 9 90.1 11 83.5 <5 §
North San Diego 33 31.0 12 23.3 21 38.2 30 47.9 <5 § <5 § <5 § <5 § <5 § 15 131.1 8 25.9 7 24.2 <5 §
Palomar‐Julian <5 § <5 § <5 § <5 § <5 § <5 § <5 § <5 § <5 § <5 § <5 § <5 § <5 §
Pauma 5 67.0 <5 § <5 § <5 § <5 § <5 § <5 § <5 § <5 § <5 § <5 § <5 § <5 §
Poway 38 44.0 17 40.3 21 47.6 28 48.3 <5 § 6 58.1 <5 § <5 § <5 § 20 197.8 6 28.8 10 37.2 <5 §
Ramona 37 106.1 11 62.7 26 150.0 34 136.9 <5 § <5 § <5 § <5 § 7 99.9 11 212.9 13 163.7 5 45.4 <5 §
San Marcos 43 47.8 14 31.8 29 63.1 27 59.4 <5 § 13 39.9 <5 § <5 § <5 § 22 175.4 10 39.6 7 34.4 <5 §
Valley Center 12 51.4 5 42.7 7 60.2 10 66.8 <5 § <5 § <5 § <5 § <5 § 6 194.1 <5 § <5 § <5 §
South Region 277 59.1 121 51.7 156 66.6 111 113.1 16 81.2 125 45.0 16 26.9 <5 § 21 20.7 114 141.1 96 72.8 40 37.7 6 12.4
Chula Vista 130 112.8 51 91.8 79 132.3 56 262.1 7 177.2 61 75.0 <5 § <5 § 14 57.2 54 287.3 42 135.6 18 68.0 <5 §
Coronado 9 36.4 5 34.4 <5 § 7 39.1 <5 § <5 § <5 § <5 § <5 § <5 § <5 § <5 § <5 §
National City 27 46.3 10 33.3 17 60.0 <5 § <5 § 15 40.4 5 47.4 <5 § <5 § 10 81.6 9 57.2 6 50.0 <5 §
South Bay 84 62.3 49 72.0 35 52.4 36 175.4 5 92.2 35 37.9 6 45.9 <5 § <5 § 32 133.9 38 100.2 9 29.4 <5 §
Sweetwater 27 20.0 6 9.1 21 30.3 8 25.4 <5 § 12 18.9 5 17.3 <5 § <5 § 17 87.7 <5 § <5 § <5 §Unknown 44 ‐‐‐ 30 ‐‐‐ 14 ‐‐‐ 28 ‐‐‐ 6 ‐‐‐ 7 ‐‐‐ <5 ‐‐‐ <5 ‐‐‐ <5 ‐‐‐ 8 ‐‐‐ 24 ‐‐‐ 11 ‐‐‐ <5 ‐‐‐*Rates per 100,000 population. County age‐adjusted rates per 100,000 2000 US standard population.**Harbison Crest/El Cajon is an aggregation of the Harbison Crest and El Cajon SRAs. Due to geographic limitations, the Harbison Crest SRA is not shown alone. See the Data Guide for more information.
***Numbers may not add up to totals due to unknown or missing details.
†Self‐inflicted injury emergency department discharge refers to (principal diagnosis) ICD‐9 Ecodes E950‐E959.
‡API includes Asian, Pacific Islander, Na ve Hawaiian. Other includes 2 or more races, Na ve American/Alaska Na ve, American Indian, or other.
§Rates not calculated for fewer than 5 events. Rates not calculated in cases where zip code is unknown.
Source: Emergency Department Discharge Database (CA OSHPD), County of San Diego, Health & Human Services Agency, Public Health Services, Emergency Medical Services; SANDAG, Current Population Estimates, 10/2012.
Prepared by: County of San Diego, Health & Human Services Agency, Public Health Services, Community Health Statistics Unit, 2013.
Ages 0‐14 Ages 15‐24 Ages 25‐44 Ages 45‐64 Ages 65+
Self‐Inflicted Injury† Emergency Department Discharges in San Diego County by Loca on of Residence, 2010 Detail
Geography2010 Total
Gender Race/Ethnicity Age Group
Male Female White Black Hispanic API‡ Other‡
County of San Diego, Health & Human Services Agency, Public Health Services, Community Health Statisitcs Unit Page 117
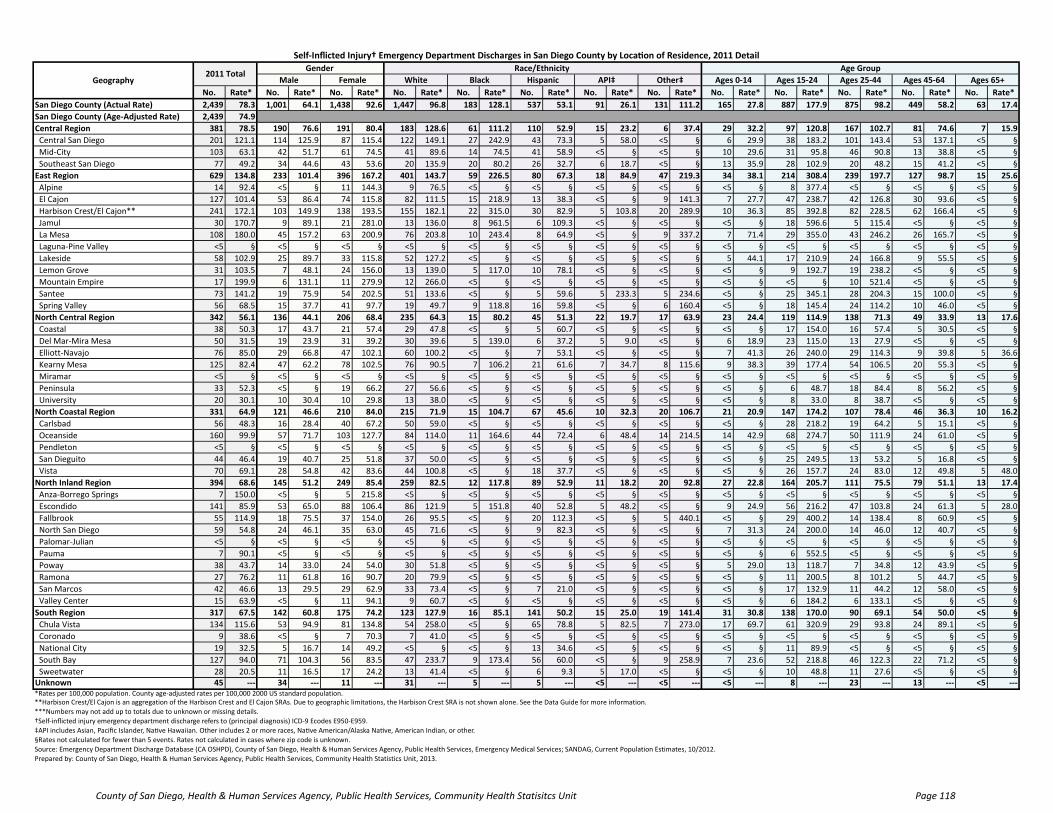
No. Rate* No. Rate* No. Rate* No. Rate* No. Rate* No. Rate* No. Rate* No. Rate* No. Rate* No. Rate* No. Rate* No. Rate* No. Rate*
San Diego County (Actual Rate) 2,439 78.3 1,001 64.1 1,438 92.6 1,447 96.8 183 128.1 537 53.1 91 26.1 131 111.2 165 27.8 887 177.9 875 98.2 449 58.2 63 17.4
San Diego County (Age‐Adjusted Rate) 2,439 74.9
Central Region 381 78.5 190 76.6 191 80.4 183 128.6 61 111.2 110 52.9 15 23.2 6 37.4 29 32.2 97 120.8 167 102.7 81 74.6 7 15.9
Central San Diego 201 121.1 114 125.9 87 115.4 122 149.1 27 242.9 43 73.3 5 58.0 <5 § 6 29.9 38 183.2 101 143.4 53 137.1 <5 §
Mid‐City 103 63.1 42 51.7 61 74.5 41 89.6 14 74.5 41 58.9 <5 § <5 § 10 29.6 31 95.8 46 90.8 13 38.8 <5 §
Southeast San Diego 77 49.2 34 44.6 43 53.6 20 135.9 20 80.2 26 32.7 6 18.7 <5 § 13 35.9 28 102.9 20 48.2 15 41.2 <5 §
East Region 629 134.8 233 101.4 396 167.2 401 143.7 59 226.5 80 67.3 18 84.9 47 219.3 34 38.1 214 308.4 239 197.7 127 98.7 15 25.6
Alpine 14 92.4 <5 § 11 144.3 9 76.5 <5 § <5 § <5 § <5 § <5 § 8 377.4 <5 § <5 § <5 §
El Cajon 127 101.4 53 86.4 74 115.8 82 111.5 15 218.9 13 38.3 <5 § 9 141.3 7 27.7 47 238.7 42 126.8 30 93.6 <5 §
Harbison Crest/El Cajon** 241 172.1 103 149.9 138 193.5 155 182.1 22 315.0 30 82.9 5 103.8 20 289.9 10 36.3 85 392.8 82 228.5 62 166.4 <5 §
Jamul 30 170.7 9 89.1 21 281.0 13 136.0 8 961.5 6 109.3 <5 § <5 § <5 § 18 596.6 5 115.4 <5 § <5 §
La Mesa 108 180.0 45 157.2 63 200.9 76 203.8 10 243.4 8 64.9 <5 § 9 337.2 7 71.4 29 355.0 43 246.2 26 165.7 <5 §
Laguna‐Pine Valley <5 § <5 § <5 § <5 § <5 § <5 § <5 § <5 § <5 § <5 § <5 § <5 § <5 §
Lakeside 58 102.9 25 89.7 33 115.8 52 127.2 <5 § <5 § <5 § <5 § 5 44.1 17 210.9 24 166.8 9 55.5 <5 §
Lemon Grove 31 103.5 7 48.1 24 156.0 13 139.0 5 117.0 10 78.1 <5 § <5 § <5 § 9 192.7 19 238.2 <5 § <5 §
Mountain Empire 17 199.9 6 131.1 11 279.9 12 266.0 <5 § <5 § <5 § <5 § <5 § <5 § 10 521.4 <5 § <5 §
Santee 73 141.2 19 75.9 54 202.5 51 133.6 <5 § 5 59.6 5 233.3 5 234.6 <5 § 25 345.1 28 204.3 15 100.0 <5 §
Spring Valley 56 68.5 15 37.7 41 97.7 19 49.7 9 118.8 16 59.8 <5 § 6 160.4 <5 § 18 145.4 24 114.2 10 46.0 <5 §
North Central Region 342 56.1 136 44.1 206 68.4 235 64.3 15 80.2 45 51.3 22 19.7 17 63.9 23 24.4 119 114.9 138 71.3 49 33.9 13 17.6
Coastal 38 50.3 17 43.7 21 57.4 29 47.8 <5 § 5 60.7 <5 § <5 § <5 § 17 154.0 16 57.4 5 30.5 <5 §
Del Mar‐Mira Mesa 50 31.5 19 23.9 31 39.2 30 39.6 5 139.0 6 37.2 5 9.0 <5 § 6 18.9 23 115.0 13 27.9 <5 § <5 §
Elliott‐Navajo 76 85.0 29 66.8 47 102.1 60 100.2 <5 § 7 53.1 <5 § <5 § 7 41.3 26 240.0 29 114.3 9 39.8 5 36.6
Kearny Mesa 125 82.4 47 62.2 78 102.5 76 90.5 7 106.2 21 61.6 7 34.7 8 115.6 9 38.3 39 177.4 54 106.5 20 55.3 <5 §
Miramar <5 § <5 § <5 § <5 § <5 § <5 § <5 § <5 § <5 § <5 § <5 § <5 § <5 §
Peninsula 33 52.3 <5 § 19 66.2 27 56.6 <5 § <5 § <5 § <5 § <5 § 6 48.7 18 84.4 8 56.2 <5 §
University 20 30.1 10 30.4 10 29.8 13 38.0 <5 § <5 § <5 § <5 § <5 § 8 33.0 8 38.7 <5 § <5 §
North Coastal Region 331 64.9 121 46.6 210 84.0 215 71.9 15 104.7 67 45.6 10 32.3 20 106.7 21 20.9 147 174.2 107 78.4 46 36.3 10 16.2
Carlsbad 56 48.3 16 28.4 40 67.2 50 59.0 <5 § <5 § <5 § <5 § <5 § 28 218.2 19 64.2 5 15.1 <5 §
Oceanside 160 99.9 57 71.7 103 127.7 84 114.0 11 164.6 44 72.4 6 48.4 14 214.5 14 42.9 68 274.7 50 111.9 24 61.0 <5 §
Pendleton <5 § <5 § <5 § <5 § <5 § <5 § <5 § <5 § <5 § <5 § <5 § <5 § <5 §
San Dieguito 44 46.4 19 40.7 25 51.8 37 50.0 <5 § <5 § <5 § <5 § <5 § 25 249.5 13 53.2 5 16.8 <5 §
Vista 70 69.1 28 54.8 42 83.6 44 100.8 <5 § 18 37.7 <5 § <5 § <5 § 26 157.7 24 83.0 12 49.8 5 48.0
North Inland Region 394 68.6 145 51.2 249 85.4 259 82.5 12 117.8 89 52.9 11 18.2 20 92.8 27 22.8 164 205.7 111 75.5 79 51.1 13 17.4
Anza‐Borrego Springs 7 150.0 <5 § 5 215.8 <5 § <5 § <5 § <5 § <5 § <5 § <5 § <5 § <5 § <5 §
Escondido 141 85.9 53 65.0 88 106.4 86 121.9 5 151.8 40 52.8 5 48.2 <5 § 9 24.9 56 216.2 47 103.8 24 61.3 5 28.0
Fallbrook 55 114.9 18 75.5 37 154.0 26 95.5 <5 § 20 112.3 <5 § 5 440.1 <5 § 29 400.2 14 138.4 8 60.9 <5 §
North San Diego 59 54.8 24 46.1 35 63.0 45 71.6 <5 § 9 82.3 <5 § <5 § 7 31.3 24 200.0 14 46.0 12 40.7 <5 §
Palomar‐Julian <5 § <5 § <5 § <5 § <5 § <5 § <5 § <5 § <5 § <5 § <5 § <5 § <5 §
Pauma 7 90.1 <5 § <5 § <5 § <5 § <5 § <5 § <5 § <5 § 6 552.5 <5 § <5 § <5 §
Poway 38 43.7 14 33.0 24 54.0 30 51.8 <5 § <5 § <5 § <5 § 5 29.0 13 118.7 7 34.8 12 43.9 <5 §
Ramona 27 76.2 11 61.8 16 90.7 20 79.9 <5 § <5 § <5 § <5 § <5 § 11 200.5 8 101.2 5 44.7 <5 §
San Marcos 42 46.6 13 29.5 29 62.9 33 73.4 <5 § 7 21.0 <5 § <5 § <5 § 17 132.9 11 44.2 12 58.0 <5 §
Valley Center 15 63.9 <5 § 11 94.1 9 60.7 <5 § <5 § <5 § <5 § <5 § 6 184.2 6 133.1 <5 § <5 §
South Region 317 67.5 142 60.8 175 74.2 123 127.9 16 85.1 141 50.2 15 25.0 19 141.4 31 30.8 138 170.0 90 69.1 54 50.0 <5 §
Chula Vista 134 115.6 53 94.9 81 134.8 54 258.0 <5 § 65 78.8 5 82.5 7 273.0 17 69.7 61 320.9 29 93.8 24 89.1 <5 §
Coronado 9 38.6 <5 § 7 70.3 7 41.0 <5 § <5 § <5 § <5 § <5 § <5 § <5 § <5 § <5 §
National City 19 32.5 5 16.7 14 49.2 <5 § <5 § 13 34.6 <5 § <5 § <5 § 11 89.9 <5 § <5 § <5 §
South Bay 127 94.0 71 104.3 56 83.5 47 233.7 9 173.4 56 60.0 <5 § 9 258.9 7 23.6 52 218.8 46 122.3 22 71.2 <5 §
Sweetwater 28 20.5 11 16.5 17 24.2 13 41.4 <5 § 6 9.3 5 17.0 <5 § <5 § 10 48.8 11 27.6 <5 § <5 §Unknown 45 ‐‐‐ 34 ‐‐‐ 11 ‐‐‐ 31 ‐‐‐ 5 ‐‐‐ 5 ‐‐‐ <5 ‐‐‐ <5 ‐‐‐ <5 ‐‐‐ 8 ‐‐‐ 23 ‐‐‐ 13 ‐‐‐ <5 ‐‐‐*Rates per 100,000 population. County age‐adjusted rates per 100,000 2000 US standard population.**Harbison Crest/El Cajon is an aggregation of the Harbison Crest and El Cajon SRAs. Due to geographic limitations, the Harbison Crest SRA is not shown alone. See the Data Guide for more information.
***Numbers may not add up to totals due to unknown or missing details.
†Self‐inflicted injury emergency department discharge refers to (principal diagnosis) ICD‐9 Ecodes E950‐E959.
‡API includes Asian, Pacific Islander, Na ve Hawaiian. Other includes 2 or more races, Na ve American/Alaska Na ve, American Indian, or other.
§Rates not calculated for fewer than 5 events. Rates not calculated in cases where zip code is unknown.
Source: Emergency Department Discharge Database (CA OSHPD), County of San Diego, Health & Human Services Agency, Public Health Services, Emergency Medical Services; SANDAG, Current Population Estimates, 10/2012.
Prepared by: County of San Diego, Health & Human Services Agency, Public Health Services, Community Health Statistics Unit, 2013.
Gender Race/Ethnicity Age Group
Male Female White Black Hispanic Ages 65+API‡ Other‡ Ages 0‐14 Ages 15‐24 Ages 25‐44 Ages 45‐64Geography2011 Total
Self‐Inflicted Injury† Emergency Department Discharges in San Diego County by Loca on of Residence, 2011 Detail
County of San Diego, Health & Human Services Agency, Public Health Services, Community Health Statisitcs Unit Page 118

Substance‐Related Disorders
County of San Diego, Health & Human Services Agency, Public Health Services, Community Health Statisitcs Unit Page 119
Acute Substance‐Related Disorders
County of San Diego, Health & Human Services Agency, Public Health Services, Community Health Statisitcs Unit Page 120

No. Rate* No. Rate* No. Rate* No. Rate* No. Rate* No. Rate* No. Rate* No. Rate* No. Rate* No. Rate* No. Rate*
San Diego County (Actual Rate) 861 27.8 884 28.4
San Diego County (Age‐Adjusted Rate) 861 26.7 884 27.1
Central Region 146 30.1 158 32.5
Central San Diego 72 43.5 86 51.8
Mid‐City 43 26.4 42 25.7
Southeast San Diego 31 19.9 30 19.2
East Region 191 41.2 188 40.3
Alpine 7 46.6 11 72.6
El Cajon 42 33.7 53 42.3
Harbison Crest/El Cajon** 63 45.3 86 61.4
Jamul 7 36.9 8 45.5
La Mesa 35 59.2 23 38.3
Laguna‐Pine Valley <5 § <5 §
Lakeside 24 42.8 15 26.6
Lemon Grove 13 43.6 6 20.0
Mountain Empire <5 § <5 §
Santee 17 33.2 19 36.8
Spring Valley 23 28.4 16 19.6
North Central Region 166 27.5 173 28.4
Coastal 25 33.2 31 41.0
Del Mar‐Mira Mesa 30 19.0 29 18.3
Elliott‐Navajo 24 26.9 31 34.7
Kearny Mesa 63 41.7 54 35.6
Miramar <5 § <5 §
Peninsula 15 23.8 19 30.1
University 9 14.3 9 13.5
North Coastal Region 108 21.4 141 27.7
Carlsbad 28 24.4 31 26.8
Oceanside 30 18.8 39 24.4
Pendleton <5 § <5 §
San Dieguito 25 26.7 34 35.8
Vista 25 24.9 36 35.5
North Inland Region 154 27.0 152 26.5
Anza‐Borrego Springs <5 § <5 §
Escondido 47 28.8 45 27.4
Fallbrook 8 16.9 9 18.8
North San Diego 38 35.7 32 29.7
Palomar‐Julian <5 § <5 §
Pauma <5 § <5 §
Poway 16 18.5 25 28.8
Ramona 20 57.4 12 33.9
San Marcos 18 20.0 20 22.2
Valley Center <5 § <5 §
South Region 96 20.5 72 15.3
Chula Vista 43 37.3 26 22.4
Coronado <5 § <5 §
National City 11 18.9 5 8.5
South Bay 22 16.3 23 17.0
Sweetwater 17 12.6 14 10.2Unknown <5 ‐‐‐ <5 ‐‐‐*Rates per 100,000 population. County age‐adjusted rates per 100,000 2000 US standard population.**Harbison Crest/El Cajon is an aggregation of the Harbison Crest and El Cajon SRAs. Due to geographic limitations, the Harbison Crest SRA is not shown alone. See the Data Guide for more information.†Acute substance‐related disorder hospitaliza on refers to (principal diagnosis) ICD‐9 codes 292, 305.2‐305.9.§Rates not calculated for fewer than 5 events. Rates not calculated in cases where zip code is unknown.Source: Patient Discharge Database (CA OSHPD), County of San Diego, Health & Human Services Agency, Public Health Services, Epidemiology & Immunization Services Branch; SANDAG, Current Population Estimates, 10/2012.Prepared by: County of San Diego, Health & Human Services Agency, Public Health Services, Community Health Statistics Unit, 2013.
Acute Substance‐related Disorder† Hospitaliza ons Among San Diego County Residents by Location of Residence
Geography2010 Total 2011 Total 2012 Total 2013 Total 2014 Total 2015 Total 2016 Total 2017 Total 2018 Total 2019 Total 2020 Total
County of San Diego, Health & Human Services Agency, Public Health Services, Community Health Statisitcs Unit Page 121

No. Rate* No. Rate* No. Rate* No. Rate* No. Rate* No. Rate* No. Rate* No. Rate* No. Rate* No. Rate* No. Rate* No. Rate* No. Rate*
San Diego County (Actual Rate) 861 27.8 485 31.2 376 24.4 593 39.5 55 37.5 135 13.6 23 6.7 23 19.9 6 1.0 224 45.2 280 31.4 242 31.8 109 31.0
San Diego County (Age‐Adjusted Rate) 861 26.7
Central Region 146 30.1 83 33.5 63 26.6 80 55.7 29 51.2 32 15.7 <5 § <5 § <5 § 19 22.9 63 39.0 50 46.9 14 32.3
Central San Diego 72 43.5 46 50.8 26 34.6 45 54.7 14 121.9 11 19.1 <5 § <5 § <5 § 9 39.1 32 45.9 30 79.1 <5 §
Mid‐City 43 26.4 24 29.6 19 23.2 27 58.1 <5 § 10 14.6 <5 § <5 § <5 § <5 § 17 33.7 15 45.8 7 54.8
Southeast San Diego 31 19.9 13 17.1 18 22.5 8 53.7 11 42.5 11 14.1 <5 § <5 § <5 § 6 22.3 14 33.9 5 13.9 6 40.1
East Region 191 41.2 97 42.5 94 40.0 136 48.7 9 33.9 28 24.2 6 29.0 7 33.3 <5 § 42 61.3 63 52.0 63 49.4 23 41.1
Alpine 7 46.6 <5 § <5 § 6 50.8 <5 § <5 § <5 § <5 § <5 § <5 § <5 § <5 § <5 §
El Cajon 42 33.7 17 27.9 25 39.3 31 42.1 <5 § <5 § <5 § <5 § <5 § 12 61.0 7 21.2 17 53.6 6 40.9
Harbison Crest/El Cajon** 63 45.3 28 41.0 35 49.3 48 56.3 <5 § 6 17.0 <5 § <5 § <5 § 17 79.0 17 47.4 22 59.6 7 40.9
Jamul 7 36.9 7 64.2 <5 § <5 § <5 § <5 § <5 § <5 § <5 § <5 § <5 § <5 § <5 §
La Mesa 35 59.2 17 60.3 18 58.2 31 83.7 <5 § <5 § <5 § <5 § <5 § 10 118.6 6 35.1 13 84.6 6 69.8
Laguna‐Pine Valley <5 § <5 § <5 § <5 § <5 § <5 § <5 § <5 § <5 § <5 § <5 § <5 § <5 §
Lakeside 24 42.8 12 43.3 12 42.4 16 39.2 <5 § <5 § <5 § <5 § <5 § 6 75.0 7 48.3 9 56.2 <5 §
Lemon Grove 13 43.6 <5 § 9 58.8 7 73.9 <5 § <5 § <5 § <5 § <5 § <5 § 7 87.2 <5 § <5 §
Mountain Empire <5 § <5 § <5 § <5 § <5 § <5 § <5 § <5 § <5 § <5 § <5 § <5 § <5 §
Santee 17 33.2 8 32.3 9 34.1 12 31.6 <5 § 5 61.5 <5 § <5 § <5 § <5 § 12 86.5 <5 § <5 §
Spring Valley 23 28.4 15 38.1 8 19.2 12 31.4 <5 § 7 26.9 <5 § <5 § <5 § <5 § 6 28.5 9 41.7 <5 §
North Central Region 166 27.5 102 33.4 64 21.4 122 33.4 5 26.6 14 16.3 8 7.4 7 26.8 <5 § 53 51.7 50 26.0 40 28.0 23 32.0
Coastal 25 33.2 19 48.9 6 16.4 18 29.6 <5 § <5 § <5 § <5 § <5 § 6 53.8 12 43.3 <5 § <5 §
Del Mar‐Mira Mesa 30 19.0 14 17.7 16 20.4 22 29.0 <5 § <5 § <5 § <5 § <5 § 8 41.5 7 14.7 9 20.1 6 44.1
Elliott‐Navajo 24 26.9 16 37.0 8 17.4 22 36.6 <5 § <5 § <5 § <5 § <5 § 10 90.1 <5 § 6 26.7 <5 §
Kearny Mesa 63 41.7 36 47.8 27 35.6 41 48.6 <5 § 5 14.9 6 30.3 <5 § <5 § 15 63.7 23 46.3 17 47.7 8 42.0
Miramar <5 § <5 § <5 § <5 § <5 § <5 § <5 § <5 § <5 § <5 § <5 § <5 § <5 §
Peninsula 15 23.8 13 38.0 <5 § 11 22.9 <5 § <5 § <5 § <5 § <5 § 9 72.0 <5 § <5 § <5 §
University 9 14.3 <5 § 5 15.8 8 24.3 <5 § <5 § <5 § <5 § <5 § 5 22.8 <5 § <5 § <5 §
North Coastal Region 108 21.4 60 23.3 48 19.4 75 25.1 <5 § 15 10.4 <5 § <5 § <5 § 34 40.6 32 23.4 27 21.6 12 20.1
Carlsbad 28 24.4 18 32.3 10 17.0 19 22.5 <5 § <5 § <5 § <5 § <5 § 11 90.0 7 23.3 7 21.5 <5 §
Oceanside 30 18.8 15 18.9 15 18.6 21 28.3 <5 § 6 10.0 <5 § <5 § <5 § 7 27.6 7 15.7 12 30.7 <5 §
Pendleton <5 § <5 § <5 § <5 § <5 § <5 § <5 § <5 § <5 § <5 § <5 § <5 § <5 §
San Dieguito 25 26.7 15 32.6 10 21.0 16 21.8 <5 § <5 § <5 § <5 § <5 § 15 159.9 6 24.3 <5 § <5 §
Vista 25 24.9 12 23.7 13 26.1 19 43.3 <5 § <5 § <5 § <5 § <5 § <5 § 12 41.8 5 21.2 5 49.5
North Inland Region 154 27.0 93 33.2 61 21.1 124 39.4 <5 § 19 11.6 <5 § <5 § <5 § 56 72.6 40 26.9 37 24.3 19 26.3
Anza‐Borrego Springs <5 § <5 § <5 § <5 § <5 § <5 § <5 § <5 § <5 § <5 § <5 § <5 § <5 §
Escondido 47 28.8 28 34.6 19 23.1 34 47.8 <5 § 8 10.8 <5 § <5 § <5 § 11 42.9 16 35.3 15 39.1 5 28.5
Fallbrook 8 16.9 5 21.2 <5 § 7 25.6 <5 § <5 § <5 § <5 § <5 § <5 § <5 § <5 § <5 §
North San Diego 38 35.7 20 38.8 18 32.7 32 51.1 <5 § <5 § <5 § <5 § <5 § 17 148.5 8 25.9 8 27.6 <5 §
Palomar‐Julian <5 § <5 § <5 § <5 § <5 § <5 § <5 § <5 § <5 § <5 § <5 § <5 § <5 §
Pauma <5 § <5 § <5 § <5 § <5 § <5 § <5 § <5 § <5 § <5 § <5 § <5 § <5 §
Poway 16 18.5 12 28.5 <5 § 11 19.0 <5 § <5 § <5 § <5 § <5 § 6 59.4 <5 § <5 § <5 §
Ramona 20 57.4 12 68.4 8 46.1 20 80.5 <5 § <5 § <5 § <5 § <5 § 9 174.2 5 63.0 <5 § <5 §
San Marcos 18 20.0 11 25.0 7 15.2 14 30.8 <5 § <5 § <5 § <5 § <5 § 10 79.7 <5 § <5 § <5 §
Valley Center <5 § <5 § <5 § <5 § <5 § <5 § <5 § <5 § <5 § <5 § <5 § <5 § <5 §
South Region 96 20.5 50 21.4 46 19.6 56 57.1 8 40.6 27 9.7 <5 § <5 § <5 § 20 24.8 32 24.3 25 23.6 18 37.1
Chula Vista 43 37.3 23 41.4 20 33.5 28 131.1 <5 § 11 13.5 <5 § <5 § <5 § 7 37.2 16 51.7 11 41.6 9 62.0
Coronado <5 § <5 § <5 § <5 § <5 § <5 § <5 § <5 § <5 § <5 § <5 § <5 § <5 §
National City 11 18.9 8 26.7 <5 § <5 § <5 § 5 13.5 <5 § <5 § <5 § <5 § <5 § <5 § <5 §
South Bay 22 16.3 12 17.6 10 15.0 9 43.8 <5 § 9 9.7 <5 § <5 § <5 § <5 § 10 26.4 6 19.6 <5 §
Sweetwater 17 12.6 7 10.6 10 14.4 13 41.2 <5 § <5 § <5 § <5 § <5 § 6 31.0 <5 § <5 § <5 §Unknown <5 ‐‐‐ <5 ‐‐‐ <5 ‐‐‐ <5 ‐‐‐ <5 ‐‐‐ <5 ‐‐‐ <5 ‐‐‐ <5 ‐‐‐ <5 ‐‐‐ <5 ‐‐‐ <5 ‐‐‐ 20 ‐‐‐ <5 ‐‐‐*Rates per 100,000 population. County age‐adjusted rates per 100,000 2000 US standard population.**Harbison Crest/El Cajon is an aggregation of the Harbison Crest and El Cajon SRAs. Due to geographic limitations, the Harbison Crest SRA is not shown alone. See the Data Guide for more information.
***Numbers may not add up to totals due to unknown or missing details.
†Acute substance‐related disorder hospitaliza on refers to (principal diagnosis) ICD‐9 codes 292, 305.2‐305.9.
‡API includes Asian, Pacific Islander, Na ve Hawaiian. Other includes 2 or more races, Na ve American/Alaska Na ve, American Indian, or other.
§Rates not calculated for fewer than 5 events. Rates not calculated in cases where zip code is unknown.
Source: Patient Discharge Database (CA OSHPD), County of San Diego, Health & Human Services Agency, Public Health Services, Epidemiology & Immunization Services Branch; SANDAG, Current Population Estimates, 10/2012.
Prepared by: County of San Diego, Health & Human Services Agency, Public Health Services, Community Health Statistics Unit, 2013.
Ages 0‐14 Ages 15‐24 Ages 25‐44 Ages 45‐64 Ages 65+
Acute Substance‐related Disorder† Hospitaliza ons Among San Diego County Residents by Loca on of Residence, 2010 Detail
Geography2010 Total
Gender Race/Ethnicity Age Group
Male Female White Black Hispanic API‡ Other‡
County of San Diego, Health & Human Services Agency, Public Health Services, Community Health Statisitcs Unit Page 122

No. Rate* No. Rate* No. Rate* No. Rate* No. Rate* No. Rate* No. Rate* No. Rate* No. Rate* No. Rate* No. Rate* No. Rate* No. Rate*
San Diego County (Actual Rate) 884 28.4 507 32.4 377 24.3 631 42.2 60 42.0 117 11.6 13 3.7 38 32.3 <5 § 258 51.8 288 32.3 228 29.6 108 29.8
San Diego County (Age‐Adjusted Rate) 884 27.1
Central Region 158 32.5 91 36.7 67 28.2 96 67.5 26 47.4 26 12.5 <5 § 6 37.4 <5 § 25 31.1 68 41.8 46 42.4 18 40.9
Central San Diego 86 51.8 60 66.2 26 34.5 58 70.9 12 108.0 12 20.5 <5 § <5 § <5 § 11 53.0 41 58.2 26 67.2 7 43.6
Mid‐City 42 25.7 19 23.4 23 28.1 29 63.4 5 26.6 5 7.2 <5 § <5 § <5 § 9 27.8 17 33.5 10 29.9 6 46.5
Southeast San Diego 30 19.2 12 15.7 18 22.5 9 61.2 9 36.1 9 11.3 <5 § <5 § <5 § 5 18.4 10 24.1 10 27.5 5 33.1
East Region 188 40.3 93 40.5 95 40.1 144 51.6 10 38.4 15 12.6 <5 § 13 60.7 <5 § 58 83.6 55 45.5 50 38.8 25 42.7
Alpine 11 72.6 5 66.4 6 78.7 10 85.0 <5 § <5 § <5 § <5 § <5 § 7 330.2 <5 § <5 § <5 §
El Cajon 53 42.3 37 60.3 16 25.0 39 53.0 <5 § 7 20.6 <5 § <5 § <5 § 17 86.3 16 48.3 17 53.1 <5 §
Harbison Crest/El Cajon** 86 61.4 50 72.8 36 50.5 66 77.5 <5 § 8 22.1 <5 § 7 101.4 <5 § 26 120.1 28 78.0 23 61.7 9 50.8
Jamul 8 45.5 <5 § 6 80.3 7 73.2 <5 § <5 § <5 § <5 § <5 § <5 § <5 § <5 § <5 §
La Mesa 23 38.3 11 38.4 12 38.3 19 50.9 <5 § <5 § <5 § <5 § <5 § 8 97.9 <5 § 7 44.6 5 56.5
Laguna‐Pine Valley <5 § <5 § <5 § <5 § <5 § <5 § <5 § <5 § <5 § <5 § <5 § <5 § <5 §
Lakeside 15 26.6 6 21.5 9 31.6 10 24.5 <5 § <5 § <5 § <5 § <5 § <5 § 6 41.7 <5 § <5 §
Lemon Grove 6 20.0 <5 § <5 § <5 § <5 § <5 § <5 § <5 § <5 § <5 § <5 § <5 § <5 §
Mountain Empire <5 § <5 § <5 § <5 § <5 § <5 § <5 § <5 § <5 § <5 § <5 § <5 § <5 §
Santee 19 36.8 8 32.0 11 41.2 16 41.9 <5 § <5 § <5 § <5 § <5 § 7 96.6 9 65.7 <5 § <5 §
Spring Valley 16 19.6 7 17.6 9 21.4 10 26.1 <5 § <5 § <5 § <5 § <5 § <5 § <5 § 7 32.2 <5 §
North Central Region 173 28.4 100 32.4 73 24.2 132 36.1 12 64.2 17 19.4 <5 § <5 § <5 § 58 56.0 50 25.8 47 32.5 18 24.4
Coastal 31 41.0 22 56.5 9 24.6 25 41.2 <5 § <5 § <5 § <5 § <5 § 13 117.8 8 28.7 10 60.9 <5 §
Del Mar‐Mira Mesa 29 18.3 18 22.7 11 13.9 24 31.7 <5 § <5 § <5 § <5 § <5 § 15 75.0 5 10.7 6 13.1 <5 §
Elliott‐Navajo 31 34.7 13 30.0 18 39.1 23 38.4 <5 § <5 § <5 § <5 § <5 § 13 120.0 6 23.6 11 48.7 <5 §
Kearny Mesa 54 35.6 29 38.4 25 32.8 37 44.1 7 106.2 7 20.5 <5 § <5 § <5 § 10 45.5 21 41.4 13 36.0 10 51.6
Miramar <5 § <5 § <5 § <5 § <5 § <5 § <5 § <5 § <5 § <5 § <5 § <5 § <5 §
Peninsula 19 30.1 14 40.7 5 17.4 16 33.5 <5 § <5 § <5 § <5 § <5 § <5 § 9 42.2 <5 § <5 §
University 9 13.5 <5 § 5 14.9 7 20.5 <5 § <5 § <5 § <5 § <5 § <5 § <5 § <5 § <5 §
North Coastal Region 141 27.7 83 32.0 58 23.2 109 36.5 <5 § 16 10.9 <5 § 5 26.7 <5 § 49 58.1 48 35.2 28 22.1 16 26.0
Carlsbad 31 26.8 17 30.2 14 23.5 26 30.7 <5 § <5 § <5 § <5 § <5 § 11 85.7 11 37.2 6 18.1 <5 §
Oceanside 39 24.4 25 31.5 14 17.4 30 40.7 <5 § <5 § <5 § <5 § <5 § 11 44.4 19 42.5 8 20.3 <5 §
Pendleton <5 § <5 § <5 § <5 § <5 § <5 § <5 § <5 § <5 § <5 § <5 § <5 § <5 §
San Dieguito 34 35.8 22 47.1 12 24.9 30 40.5 <5 § <5 § <5 § <5 § <5 § 17 169.6 8 32.7 <5 § 6 43.0
Vista 36 35.5 18 35.2 18 35.8 22 50.4 <5 § 9 18.8 <5 § <5 § <5 § 9 54.6 10 34.6 11 45.7 6 57.6
North Inland Region 152 26.5 97 34.3 55 18.9 120 38.2 <5 § 17 10.1 <5 § 8 37.1 <5 § 59 74.0 41 27.9 34 22.0 17 22.8
Anza‐Borrego Springs <5 § <5 § <5 § <5 § <5 § <5 § <5 § <5 § <5 § <5 § <5 § <5 68.6 <5 §
Escondido 45 27.4 35 43.0 10 12.1 36 51.0 <5 § 7 9.2 <5 § <5 § <5 § 11 42.5 16 35.4 11 28.1 6 33.7
Fallbrook 9 18.8 5 21.0 <5 § 8 29.4 <5 § <5 § <5 § <5 § <5 § <5 § <5 § <5 § <5 §
North San Diego 32 29.7 23 44.2 9 16.2 23 36.6 <5 § <5 § <5 § <5 § <5 § 19 158.3 9 29.6 <5 § <5 §
Palomar‐Julian <5 § <5 § <5 § <5 § <5 § <5 § <5 § <5 § <5 § <5 § <5 § <5 § <5 §
Pauma <5 § <5 § <5 § <5 § <5 § <5 § <5 § <5 § <5 § <5 § <5 § <5 § <5 §
Poway 25 28.8 12 28.3 13 29.2 21 36.2 <5 § <5 § <5 § <5 § <5 § 14 127.8 <5 § 8 29.3 <5 §
Ramona 12 33.9 7 39.3 5 28.4 11 44.0 <5 § <5 § <5 § <5 § <5 § <5 § 5 63.3 <5 § <5 §
San Marcos 20 22.2 11 24.9 9 19.5 13 28.9 <5 § <5 § <5 § <5 § <5 § 7 54.7 5 20.1 <5 § 5 42.0
Valley Center <5 § <5 § <5 § <5 § <5 § <5 § <5 § <5 § <5 § <5 § <5 § <5 § <5 §
South Region 72 15.3 43 18.4 29 12.3 30 31.2 7 37.2 26 9.2 <5 § <5 § <5 § 9 11.1 26 20.0 23 21.3 14 28.3
Chula Vista 26 22.4 15 26.9 11 18.3 9 43.0 <5 § 12 14.5 <5 § <5 § <5 § <5 § 8 25.9 8 29.7 6 40.9
Coronado <5 § <5 § <5 § <5 § <5 § <5 § <5 § <5 § <5 § <5 § <5 § <5 § <5 §
National City 5 8.5 <5 § <5 § <5 § <5 § <5 § <5 § <5 § <5 § <5 § <5 § <5 8.2 <5 §
South Bay 23 17.0 13 19.1 10 14.9 7 34.8 <5 § 10 10.7 <5 § <5 § <5 § <5 § 7 18.6 11 35.6 5 37.9
Sweetwater 14 10.2 9 13.5 5 7.1 6 19.1 <5 § <5 § <5 § <5 § <5 § <5 § 7 17.5 <5 § <5 §Unknown <5 ‐‐‐ <5 ‐‐‐ <5 ‐‐‐ <5 ‐‐‐ <5 ‐‐‐ <5 ‐‐‐ <5 ‐‐‐ <5 ‐‐‐ <5 ‐‐‐ <5 ‐‐‐ <5 ‐‐‐ <5 ‐‐‐ <5 ‐‐‐*Rates per 100,000 population. County age‐adjusted rates per 100,000 2000 US standard population.**Harbison Crest/El Cajon is an aggregation of the Harbison Crest and El Cajon SRAs. Due to geographic limitations, the Harbison Crest SRA is not shown alone. See the Data Guide for more information.
***Numbers may not add up to totals due to unknown or missing details.
†Acute substance‐related disorder hospitaliza on refers to (principal diagnosis) ICD‐9 codes 292, 305.2‐305.9.
‡API includes Asian, Pacific Islander, Na ve Hawaiian. Other includes 2 or more races, Na ve American/Alaska Na ve, American Indian, or other.
§Rates not calculated for fewer than 5 events. Rates not calculated in cases where zip code is unknown.
Source: Patient Discharge Database (CA OSHPD), County of San Diego, Health & Human Services Agency, Public Health Services, Epidemiology & Immunization Services Branch; SANDAG, Current Population Estimates, 10/2012.
Prepared by: County of San Diego, Health & Human Services Agency, Public Health Services, Community Health Statistics Unit, 2013.
Gender Race/Ethnicity Age Group
Male Female White Black Hispanic Ages 65+API‡ Other‡ Ages 0‐14 Ages 15‐24 Ages 25‐44 Ages 45‐64Geography2011 Total
Acute Substance‐related Disorder† Hospitaliza ons Among San Diego County Residents by Loca on of Residence, 2011 Detail
County of San Diego, Health & Human Services Agency, Public Health Services, Community Health Statisitcs Unit Page 123

No. Rate* No. Rate* No. Rate* No. Rate* No. Rate* No. Rate* No. Rate* No. Rate* No. Rate* No. Rate* No. Rate*
San Diego County (Actual Rate) 2,020 65.3 2,219 71.2
San Diego County (Age‐Adjusted Rate) 2,020 62.2 2,219 68.0
Central Region 490 101.2 451 92.9
Central San Diego 233 140.7 220 132.6
Mid‐City 124 76.1 128 78.4
Southeast San Diego 133 85.4 103 65.9
East Region 335 72.3 393 84.2
Alpine 10 66.5 11 72.6
El Cajon 64 51.4 89 71.1
Harbison Crest/El Cajon** 113 81.2 161 115.0
Jamul 8 42.2 14 79.6
La Mesa 47 79.5 57 95.0
Laguna‐Pine Valley <5 § <5 §
Lakeside 27 48.2 26 46.1
Lemon Grove 32 107.3 25 83.5
Mountain Empire <5 § 8 94.1
Santee 44 86.0 34 65.8
Spring Valley 50 61.7 55 67.3
North Central Region 274 45.4 332 54.4
Coastal 43 57.0 47 62.2
Del Mar‐Mira Mesa 44 27.9 50 31.5
Elliott‐Navajo 39 43.8 53 59.3
Kearny Mesa 103 68.1 129 85.0
Miramar <5 § <5 §
Peninsula 32 50.8 33 52.3
University 13 20.7 20 30.1
North Coastal Region 278 55.0 318 62.4
Carlsbad 32 27.9 37 31.9
Oceanside 127 79.5 165 103.1
Pendleton <5 § <5 §
San Dieguito 37 39.6 45 47.4
Vista 81 80.7 70 69.1
North Inland Region 314 55.1 333 58.0
Anza‐Borrego Springs <5 § <5 §
Escondido 108 66.2 136 82.8
Fallbrook 30 63.4 31 64.8
North San Diego 45 42.2 45 41.8
Palomar‐Julian <5 § <5 §
Pauma <5 § 7 90.1
Poway 38 44.0 32 36.8
Ramona 25 71.7 17 48.0
San Marcos 46 51.1 48 53.2
Valley Center 18 77.2 15 63.9
South Region 259 55.3 298 63.5
Chula Vista 122 105.9 137 118.2
Coronado 8 32.4 5 21.4
National City 47 80.6 38 65.0
South Bay 65 48.2 91 67.3
Sweetwater 17 12.6 27 19.8Unknown 70 ‐‐‐ 94 ‐‐‐*Rates per 100,000 population. County age‐adjusted rates per 100,000 2000 US standard population.**Harbison Crest/El Cajon is an aggregation of the Harbison Crest and El Cajon SRAs. Due to geographic limitations, the Harbison Crest SRA is not shown alone. See the Data Guide for more information.†Acute substance‐related disorder Emergency Department Discharge refers to (principal diagnosis) ICD‐9 codes 292, 305.2‐305.9.§Rates not calculated for fewer than 5 events. Rates not calculated in cases where zip code is unknown.Source: Emergency Department Discharge Database (CA OSHPD), County of San Diego, Health & Human Services Agency, Public Health Services, Emergency Medical Services; SANDAG, Current Population Estimates, 10/2012.Prepared by: County of San Diego, Health & Human Services Agency, Public Health Services, Community Health Statistics Unit, 2013.
Acute Substance‐related Disorder† Emergency Department Discharges Among San Diego County Residents by Loca on of Residence
Geography2010 Total 2011 Total 2012 Total 2013 Total 2014 Total 2015 Total 2016 Total 2017 Total 2018 Total 2019 Total 2020 Total
County of San Diego, Health & Human Services Agency, Public Health Services, Community Health Statisitcs Unit Page 124

No. Rate* No. Rate* No. Rate* No. Rate* No. Rate* No. Rate* No. Rate* No. Rate* No. Rate* No. Rate* No. Rate* No. Rate* No. Rate*
San Diego County (Actual Rate) 2,020 65.3 1,234 79.4 786 51.0 1,220 81.3 213 145.3 477 48.1 46 13.5 48 41.5 50 8.4 613 123.6 852 95.6 438 57.6 67 19.1
San Diego County (Age‐Adjusted Rate) 2,020 62.2
Central Region 490 101.2 307 123.9 183 77.3 227 158.0 120 211.7 128 62.6 7 11.0 5 31.5 12 13.4 118 141.9 228 141.2 122 114.3 10 23.1
Central San Diego 233 140.7 160 176.8 73 97.3 135 164.1 40 348.4 49 85.0 <5 § <5 § <5 § 36 156.6 129 185.0 61 160.7 <5 §
Mid‐City 124 76.1 67 82.5 57 69.7 60 129.2 28 144.9 32 46.7 <5 § <5 § 5 14.8 37 111.2 51 101.2 27 82.4 <5 §
Southeast San Diego 133 85.4 80 105.3 53 66.4 32 214.8 52 200.9 47 60.0 <5 § <5 § <5 § 45 167.5 48 116.2 34 94.4 <5 §
East Region 335 72.3 200 87.7 135 57.4 252 90.2 25 94.1 45 38.9 <5 § 6 28.6 8 8.9 113 164.9 143 118.0 64 50.2 7 12.5
Alpine 10 66.5 <5 § 7 92.4 10 84.7 <5 § <5 § <5 § <5 § <5 § <5 § 7 213.9 <5 § <5 §
El Cajon 64 51.4 45 73.9 19 29.9 49 66.5 <5 § 6 18.1 <5 § <5 § <5 § 28 142.4 23 69.7 12 37.9 <5 §
Harbison Crest/El Cajon** 113 81.2 75 109.9 38 53.6 82 96.1 7 98.3 17 48.2 <5 § <5 § <5 § 46 213.7 44 122.8 19 51.4 <5 §
Jamul 8 42.2 5 45.9 <5 § 5 47.7 <5 § <5 § <5 § <5 § <5 § <5 § <5 § <5 § <5 §
La Mesa 47 79.5 32 113.5 15 48.5 35 94.5 5 120.7 6 50.6 <5 § <5 § <5 § 14 166.0 22 128.8 8 52.1 <5 §
Laguna‐Pine Valley <5 § <5 § <5 § <5 § <5 § <5 § <5 § <5 § <5 § <5 § <5 § <5 § <5 §
Lakeside 27 48.2 11 39.7 16 56.5 25 61.2 <5 § <5 § <5 § <5 § <5 § 8 100.0 9 62.1 9 56.2 <5 §
Lemon Grove 32 107.3 20 137.9 12 78.4 21 221.8 6 136.4 <5 § <5 § <5 § <5 § 9 197.2 14 174.5 8 104.7 <5 §
Mountain Empire <5 § <5 § <5 § <5 § <5 § <5 § <5 § <5 § <5 § <5 § <5 § <5 § <5 §
Santee 44 86.0 23 92.9 21 79.6 39 102.7 <5 § <5 § <5 § <5 § <5 § 15 214.3 18 129.8 8 54.2 <5 §
Spring Valley 50 61.7 29 73.6 21 50.5 31 81.0 6 77.4 12 46.1 <5 § <5 § <5 § 17 140.7 22 104.5 10 46.4 <5 §
North Central Region 274 45.4 156 51.1 118 39.5 198 54.2 16 85.3 35 40.9 10 9.2 13 49.8 5 5.3 76 74.1 119 62.0 58 40.6 16 22.3
Coastal 43 57.0 23 59.2 20 54.7 41 67.4 <5 § <5 § <5 § <5 § <5 § 8 71.8 23 83.1 10 60.8 <5 §
Del Mar‐Mira Mesa 44 27.9 24 30.4 20 25.5 31 40.8 <5 § 7 44.3 <5 § <5 § <5 § 14 72.5 16 33.7 8 17.9 <5 §
Elliott‐Navajo 39 43.8 23 53.2 16 34.9 23 38.3 5 124.3 5 38.5 <5 § <5 § <5 § 9 81.1 17 67.5 9 40.0 <5 §
Kearny Mesa 103 68.1 59 78.3 44 58.0 67 79.4 8 119.1 19 56.7 5 25.2 <5 § <5 § 31 131.6 43 86.5 25 70.2 <5 §
Miramar <5 § <5 § <5 § <5 § <5 § <5 § <5 § <5 § <5 § <5 § <5 § <5 § <5 §
Peninsula 32 50.8 18 52.7 14 48.7 23 48.0 <5 § <5 § <5 § <5 § <5 § 11 88.0 14 66.5 5 34.9 <5 §
University 13 20.7 9 29.0 <5 § 13 39.5 <5 § <5 § <5 § <5 § <5 § <5 § 6 30.4 <5 § <5 §
North Coastal Region 278 55.0 161 62.4 117 47.2 189 63.2 19 130.8 58 40.3 <5 § 10 55.0 9 8.9 78 93.2 119 87.2 57 45.6 15 25.2
Carlsbad 32 27.9 15 26.9 17 28.8 29 34.4 <5 § <5 § <5 § <5 § <5 § 12 98.2 11 36.5 5 15.3 <5 §
Oceanside 127 79.5 70 88.3 57 70.8 79 106.4 12 173.0 28 46.7 <5 § 6 93.9 <5 § 35 138.0 52 116.4 31 79.2 7 38.0
Pendleton <5 § <5 § <5 § <5 § <5 § <5 § <5 § <5 § <5 § <5 § <5 § <5 § <5 §
San Dieguito 37 39.6 28 60.9 9 18.9 34 46.4 <5 § <5 § <5 § <5 § <5 § 13 138.6 12 48.7 9 30.7 <5 §
Vista 81 80.7 47 92.7 34 68.4 47 107.2 7 258.6 25 53.6 <5 § <5 § 6 28.2 17 101.4 44 153.3 12 50.9 <5 §
North Inland Region 314 55.1 190 67.7 124 42.9 220 69.9 13 125.6 62 37.8 10 16.9 8 37.7 6 5.0 128 166.0 104 70.1 65 42.7 11 15.2
Anza‐Borrego Springs <5 § <5 § <5 § <5 § <5 § <5 § <5 § <5 § <5 § <5 § <5 § <5 § <5 §
Escondido 108 66.2 66 81.6 42 51.1 59 83.0 7 208.0 39 52.6 <5 § <5 § 5 13.8 39 152.1 39 86.1 20 52.1 5 28.5
Fallbrook 30 63.4 16 67.9 14 58.9 19 69.6 <5 § 7 40.6 <5 § <5 § <5 § 11 154.4 14 140.2 <5 § <5 §
North San Diego 45 42.2 34 66.0 11 20.0 36 57.5 <5 § <5 § <5 § <5 § <5 § 25 218.4 14 45.4 <5 § <5 §
Palomar‐Julian <5 § <5 § <5 § <5 § <5 § <5 § <5 § <5 § <5 § <5 § <5 § <5 § <5 §
Pauma <5 § <5 § <5 § <5 § <5 § <5 § <5 § <5 § <5 § <5 § <5 § <5 § <5 §
Poway 38 44.0 22 52.2 16 36.2 30 51.8 <5 § <5 § <5 § <5 § <5 § 15 148.4 13 62.5 9 33.5 <5 §
Ramona 25 71.7 17 97.0 8 46.1 23 92.6 <5 § <5 § <5 § <5 § <5 § 13 251.6 <5 § 10 90.8 <5 §
San Marcos 46 51.1 25 56.8 21 45.7 36 79.2 <5 § 8 24.5 <5 § <5 § <5 § 17 135.5 14 55.4 13 63.8 <5 §
Valley Center 18 77.2 8 68.3 10 86.0 15 100.2 <5 § <5 § <5 § <5 § <5 § 7 226.5 5 107.7 6 78.0 <5 §
South Region 259 55.3 170 72.6 89 38.0 89 90.7 10 50.8 139 50.0 12 20.2 6 44.7 9 8.9 82 101.5 102 77.3 59 55.7 7 14.4
Chula Vista 122 105.9 79 142.2 43 72.0 49 229.4 <5 § 61 75.0 6 99.6 <5 § <5 § 39 207.5 43 138.8 34 128.5 <5 §
Coronado 8 32.4 5 34.4 <5 29.5 6 33.5 <5 § <5 § <5 § <5 § <5 § <5 § <5 § <5 § <5 §
National City 47 80.6 28 93.3 19 67.1 10 147.2 <5 § 32 86.2 <5 § <5 § <5 § 14 114.3 16 101.7 12 100.1 <5 §
South Bay 65 48.2 46 67.6 19 28.4 21 102.3 <5 § 35 37.9 <5 § <5 § <5 § 25 104.6 28 73.8 11 35.9 <5 §
Sweetwater 17 12.6 12 18.2 5 7.2 <5 § <5 § 9 14.2 <5 § <5 § <5 § <5 § 11 27.0 <5 § <5 §Unknown 70 ‐‐‐ 50 ‐‐‐ 20 ‐‐‐ 45 ‐‐‐ 10 ‐‐‐ 10 ‐‐‐ <5 ‐‐‐ <5 ‐‐‐ <5 ‐‐‐ 18 ‐‐‐ 37 ‐‐‐ 13 ‐‐‐ <5 ‐‐‐*Rates per 100,000 population. County age‐adjusted rates per 100,000 2000 US standard population.**Harbison Crest/El Cajon is an aggregation of the Harbison Crest and El Cajon SRAs. Due to geographic limitations, the Harbison Crest SRA is not shown alone. See the Data Guide for more information.
***Numbers may not add up to totals due to unknown or missing details.
†Acute substance‐related disorder Emergency Department Discharge refers to (principal diagnosis) ICD‐9 codes 292, 305.2‐305.9.
‡API includes Asian, Pacific Islander, Na ve Hawaiian. Other includes 2 or more races, Na ve American/Alaska Na ve, American Indian, or other.
§Rates not calculated for fewer than 5 events. Rates not calculated in cases where zip code is unknown.
Source: Emergency Department Discharge Database (CA OSHPD), County of San Diego, Health & Human Services Agency, Public Health Services, Emergency Medical Services; SANDAG, Current Population Estimates, 10/2012.
Prepared by: County of San Diego, Health & Human Services Agency, Public Health Services, Community Health Statistics Unit, 2013.
Ages 0‐14 Ages 15‐24 Ages 25‐44 Ages 45‐64 Ages 65+
Acute Substance‐related Disorder† Emergency Department Discharges Among San Diego County Residents by Loca on of Residence, 2010 Detail
Geography2010 Total
Gender Race/Ethnicity Age Group
Male Female White Black Hispanic API‡ Other‡
County of San Diego, Health & Human Services Agency, Public Health Services, Community Health Statisitcs Unit Page 125

No. Rate* No. Rate* No. Rate* No. Rate* No. Rate* No. Rate* No. Rate* No. Rate* No. Rate* No. Rate* No. Rate* No. Rate* No. Rate*
San Diego County (Actual Rate) 2,219 71.2 1,309 83.8 910 58.6 1,324 88.5 179 125.3 532 52.6 57 16.3 94 79.8 50 8.4 642 128.8 942 105.7 505 65.5 80 22.1
San Diego County (Age‐Adjusted Rate) 2,219 68.0
Central Region 451 92.9 258 104.0 193 81.3 223 156.7 86 156.8 101 48.6 20 31.0 16 99.8 10 11.1 99 123.3 217 133.5 108 99.5 17 38.6
Central San Diego 220 132.6 140 154.6 80 106.1 131 160.0 30 269.9 36 61.4 10 116.0 11 191.8 <5 § 38 183.2 116 164.7 55 142.2 8 49.8
Mid‐City 128 78.4 66 81.2 62 75.7 63 137.7 23 122.4 29 41.7 8 33.6 <5 § 6 17.8 34 105.1 58 114.5 27 80.6 <5 §
Southeast San Diego 103 65.9 52 68.2 51 63.6 29 197.1 33 132.3 36 45.2 <5 § <5 § <5 § 27 99.2 43 103.6 26 71.5 6 39.7
East Region 393 84.2 234 101.8 159 67.1 263 94.3 26 99.8 59 49.6 <5 § 31 144.6 9 10.1 116 167.2 178 147.2 77 59.8 13 22.2
Alpine 11 72.6 9 119.5 <5 § 8 68.0 <5 § <5 § <5 § <5 § <5 § <5 § 6 188.9 <5 § <5 §
El Cajon 89 71.1 52 84.8 37 57.9 68 92.5 5 73.0 5 14.7 <5 § 7 109.9 <5 § 26 132.0 38 114.8 20 62.4 <5 §
Harbison Crest/El Cajon** 161 115.0 96 139.7 65 91.1 117 137.4 12 171.8 12 33.2 <5 § 13 188.4 <5 § 47 217.2 70 195.1 37 99.3 6 33.9
Jamul 14 79.6 11 108.9 <5 § 9 94.2 <5 § <5 § <5 § <5 § <5 § 6 198.9 <5 § <5 § <5 §
La Mesa 57 95.0 36 125.8 21 67.0 36 96.5 <5 § 12 97.3 <5 § <5 § <5 § 16 195.9 28 160.3 9 57.4 <5 §
Laguna‐Pine Valley <5 § <5 § <5 § <5 § <5 § <5 § <5 § <5 § <5 § <5 § <5 § <5 § <5 §
Lakeside 26 46.1 9 32.3 17 59.7 18 44.0 <5 § <5 § <5 § <5 § <5 § 9 111.6 11 76.4 <5 § <5 §
Lemon Grove 25 83.5 17 116.7 8 52.0 16 171.1 <5 § 5 39.0 <5 § <5 § <5 § 7 149.9 11 137.9 7 90.9 <5 §
Mountain Empire 8 94.1 7 153.0 <5 § <5 § <5 § <5 § <5 § <5 § <5 § <5 § <5 § <5 § <5 §
Santee 34 65.8 22 87.9 12 45.0 23 60.2 <5 § 5 59.6 <5 § <5 § <5 § 6 82.8 22 160.5 6 40.0 <5 §
Spring Valley 55 67.3 27 67.9 28 66.7 30 78.4 5 66.0 14 52.3 <5 § <5 § <5 § 17 137.3 23 109.4 8 36.8 <5 §
North Central Region 332 54.4 201 65.2 131 43.5 222 60.8 21 112.3 48 54.7 14 12.6 21 78.9 <5 § 92 88.8 147 75.9 74 51.2 15 20.4
Coastal 47 62.2 26 66.8 21 57.4 41 67.6 <5 § <5 § <5 § <5 § <5 § 11 99.7 18 64.6 13 79.2 5 39.6
Del Mar‐Mira Mesa 50 31.5 33 41.6 17 21.5 31 40.9 5 139.0 <5 § <5 § 5 69.3 <5 § 14 70.0 25 53.6 7 15.3 <5 §
Elliott‐Navajo 53 59.3 36 83.0 17 36.9 39 65.1 6 150.8 <5 § <5 § <5 § <5 § 17 156.9 24 94.6 10 44.3 <5 §
Kearny Mesa 129 85.0 74 97.9 55 72.2 72 85.8 8 121.3 30 88.0 8 39.7 8 115.6 <5 § 33 150.1 59 116.4 31 85.8 <5 §
Miramar <5 § <5 § <5 § <5 § <5 § <5 § <5 § <5 § <5 § <5 § <5 § <5 § <5 §
Peninsula 33 52.3 <5 § 15 52.3 23 48.2 <5 § 7 83.4 <5 § <5 § <5 § 12 97.3 14 65.6 6 42.1 <5 §
University 20 30.1 14 42.5 6 17.9 16 46.8 <5 § <5 § <5 § <5 § <5 § 5 20.6 7 33.8 7 75.3 <5 §
North Coastal Region 318 62.4 174 67.0 144 57.6 239 79.9 7 48.9 53 36.1 <5 § 13 69.3 7 7.0 93 110.2 132 96.7 72 56.8 14 22.7
Carlsbad 37 31.9 18 32.0 19 31.9 33 39.0 <5 § <5 § <5 § <5 § <5 § 17 132.5 14 47.3 5 15.1 <5 §
Oceanside 165 103.1 93 117.0 72 89.3 120 162.8 5 74.8 28 46.1 <5 § 7 107.2 <5 § 41 165.6 71 158.9 42 106.8 7 37.4
Pendleton <5 § <5 § <5 § <5 § <5 § <5 § <5 § <5 § <5 § <5 § <5 § <5 § <5 §
San Dieguito 45 47.4 25 53.6 20 41.5 41 55.4 <5 § <5 § <5 § <5 § <5 § 14 139.7 18 73.6 8 26.9 <5 §
Vista 70 69.1 38 74.3 32 63.7 44 100.8 <5 § 20 41.9 <5 § <5 § <5 § 20 121.3 29 100.2 17 70.6 <5 §
North Inland Region 333 58.0 184 65.0 149 51.1 216 68.8 8 78.5 86 51.1 12 19.8 9 41.7 7 5.9 130 163.0 112 76.2 73 47.2 11 14.7
Anza‐Borrego Springs <5 § <5 § <5 § <5 § <5 § <5 § <5 § <5 § <5 § <5 § <5 § <5 § <5 §
Escondido 136 82.8 78 95.7 58 70.1 75 106.3 <5 § 54 71.3 <5 § <5 § <5 § 51 196.9 51 112.7 28 71.6 5 28.0
Fallbrook 31 64.8 12 50.3 19 79.1 24 88.1 <5 § 7 39.3 <5 § <5 § <5 § <5 § 13 128.5 15 114.2 <5 §
North San Diego 45 41.8 25 48.0 20 36.0 32 51.0 <5 § <5 § 6 22.8 <5 § <5 § 26 216.7 5 16.4 7 23.7 5 37.6
Palomar‐Julian <5 § <5 § <5 § <5 § <5 § <5 § <5 § <5 § <5 § <5 § <5 § <5 § <5 §
Pauma 7 90.1 5 124.9 <5 § <5 § <5 § <5 § <5 § <5 § <5 § <5 § <5 § <5 § <5 §
Poway 32 36.8 17 40.0 15 33.7 27 46.6 <5 § <5 § <5 § <5 § <5 § 16 146.1 12 59.6 <5 § <5 §
Ramona 17 48.0 11 61.8 6 34.0 11 44.0 <5 § 6 70.4 <5 § <5 § <5 § 6 109.4 6 75.9 5 44.7 <5 §
San Marcos 48 53.2 30 68.0 18 39.1 29 64.5 <5 § 12 36.1 <5 § <5 § <5 § 18 140.8 14 56.2 13 62.8 <5 §
Valley Center 15 63.9 <5 § 11 94.1 15 101.1 <5 § <5 § <5 § <5 § <5 § 8 245.6 6 133.1 <5 § <5 §
South Region 298 63.5 189 80.9 109 46.2 106 110.3 21 111.7 164 58.3 <5 § <5 § 13 12.9 88 108.4 114 87.5 74 68.5 9 18.2
Chula Vista 137 118.2 94 168.4 43 71.6 48 229.3 14 365.6 71 86.0 <5 § <5 § 8 32.8 41 215.7 47 152.1 37 137.4 <5 §
Coronado 5 21.4 <5 § <5 § <5 § <5 § <5 § <5 § <5 § <5 § <5 § <5 § <5 § <5 §
National City 38 65.0 24 80.0 14 49.2 12 182.1 <5 § 24 63.9 <5 § <5 § <5 § 12 98.1 12 75.9 11 90.2 <5 §
South Bay 91 67.3 55 80.8 36 53.7 27 134.2 <5 § 60 64.3 <5 § <5 § <5 § 26 109.4 41 109.0 19 61.5 <5 §
Sweetwater 27 19.8 14 21.1 13 18.5 15 47.7 <5 § 8 12.4 <5 § <5 § <5 § 8 39.0 12 30.1 5 15.2 <5 §Unknown 94 ‐‐‐ 69 ‐‐‐ 25 ‐‐‐ 55 ‐‐‐ 10 ‐‐‐ 21 ‐‐‐ <5 ‐‐‐ <5 ‐‐‐ <5 ‐‐‐ 24 ‐‐‐ 42 ‐‐‐ 27 ‐‐‐ <5 ‐‐‐*Rates per 100,000 population. County age‐adjusted rates per 100,000 2000 US standard population.**Harbison Crest/El Cajon is an aggregation of the Harbison Crest and El Cajon SRAs. Due to geographic limitations, the Harbison Crest SRA is not shown alone. See the Data Guide for more information.
***Numbers may not add up to totals due to unknown or missing details.
†Acute substance‐related disorder Emergency Department Discharge refers to (principal diagnosis) ICD‐9 codes 292, 305.2‐305.9.
‡API includes Asian, Pacific Islander, Na ve Hawaiian. Other includes 2 or more races, Na ve American/Alaska Na ve, American Indian, or other.
§Rates not calculated for fewer than 5 events. Rates not calculated in cases where zip code is unknown.
Source: Emergency Department Discharge Database (CA OSHPD), County of San Diego, Health & Human Services Agency, Public Health Services, Emergency Medical Services; SANDAG, Current Population Estimates, 10/2012.
Prepared by: County of San Diego, Health & Human Services Agency, Public Health Services, Community Health Statistics Unit, 2013.
Gender Race/Ethnicity Age Group
Male Female White Black Hispanic Ages 65+API‡ Other‡ Ages 0‐14 Ages 15‐24 Ages 25‐44 Ages 45‐64Geography2011 Total
Acute Substance‐related Disorder† Emergency Department Discharges Among San Diego County Residents by Loca on of Residence, 2011 Detail
County of San Diego, Health & Human Services Agency, Public Health Services, Community Health Statisitcs Unit Page 126

Chronic Substance‐Related Disorders
County of San Diego, Health & Human Services Agency, Public Health Services, Community Health Statisitcs Unit Page 127

No. Rate* No. Rate* No. Rate* No. Rate* No. Rate* No. Rate* No. Rate* No. Rate* No. Rate* No. Rate* No. Rate*
San Diego County (Actual Rate) 707 22.8 686 22.0
San Diego County (Age‐Adjusted Rate) 707 21.9 686 21.1
Central Region 84 17.3 102 21.0
Central San Diego 46 27.8 66 39.8
Mid‐City 22 13.5 23 14.1
Southeast San Diego 16 10.3 13 8.3
East Region 101 21.8 96 20.6
Alpine <5 § 7 46.2
El Cajon 27 21.7 16 12.8
Harbison Crest/El Cajon** 45 32.3 26 18.6
Jamul <5 15.8 5 28.4
La Mesa 12 20.3 15 25.0
Laguna‐Pine Valley <5 § <5 §
Lakeside 10 17.9 6 10.6
Lemon Grove <5 § <5 §
Mountain Empire 5 65.9 11 129.3
Santee 8 15.6 17 32.9
Spring Valley 10 12.3 6 7.3
North Central Region 139 23.0 129 21.2
Coastal 25 33.2 15 19.9
Del Mar‐Mira Mesa 28 17.8 26 16.4
Elliott‐Navajo 39 43.8 35 39.1
Kearny Mesa 27 17.9 33 21.8
Miramar <5 § <5 §
Peninsula 10 15.9 13 20.6
University 9 14.3 7 10.5
North Coastal Region 135 26.7 132 25.9
Carlsbad 36 31.4 27 23.3
Oceanside 37 23.2 46 28.7
Pendleton <5 § <5 §
San Dieguito 40 42.8 42 44.3
Vista 22 21.9 17 16.8
North Inland Region 147 25.8 146 25.4
Anza‐Borrego Springs <5 § <5 §
Escondido 41 25.2 27 16.4
Fallbrook 11 23.3 10 20.9
North San Diego 41 38.5 34 31.6
Palomar‐Julian <5 § <5 §
Pauma <5 § <5 §
Poway 30 34.8 34 39.1
Ramona 8 22.9 12 33.9
San Marcos 10 11.1 17 18.8
Valley Center <5 § 9 38.4
South Region 101 21.6 81 17.3
Chula Vista 13 11.3 8 6.9
Coronado 5 20.2 9 38.6
National City <5 § <5 §
South Bay 72 53.4 56 41.4
Sweetwater 11 8.1 6 4.4Unknown <5 ‐‐‐ <5 ‐‐‐*Rates per 100,000 population. County age‐adjusted rates per 100,000 2000 US standard population.**Harbison Crest/El Cajon is an aggregation of the Harbison Crest and El Cajon SRAs. Due to geographic limitations, the Harbison Crest SRA is not shown alone. See the Data Guide for more information.†Chronic substance‐related disorder hospitaliza on refers to (principal diagnosis) ICD‐9 code 304.§Rates not calculated for fewer than 5 events. Rates not calculated in cases where zip code is unknown.Source: Patient Discharge Database (CA OSHPD), County of San Diego, Health & Human Services Agency, Public Health Services, Epidemiology & Immunization Services Branch; SANDAG, Current Population Estimates, 10/2012.Prepared by: County of San Diego, Health & Human Services Agency, Public Health Services, Community Health Statistics Unit, 2013.
Chronic Substance‐related Disorder† Hospitaliza ons Among San Diego County Residents by Location of Residence
Geography2010 Total 2011 Total 2012 Total 2013 Total 2014 Total 2015 Total 2016 Total 2017 Total 2018 Total 2019 Total 2020 Total
County of San Diego, Health & Human Services Agency, Public Health Services, Community Health Statisitcs Unit Page 128

No. Rate* No. Rate* No. Rate* No. Rate* No. Rate* No. Rate* No. Rate* No. Rate* No. Rate* No. Rate* No. Rate* No. Rate* No. Rate*
San Diego County (Actual Rate) 707 22.8 435 28.0 272 17.6 485 32.3 19 13.0 123 12.4 6 1.8 18 15.5 <5 § 236 47.6 288 32.3 160 21.0 19 5.4
San Diego County (Age‐Adjusted Rate) 707 21.9
Central Region 84 17.3 51 20.6 33 13.9 48 33.4 10 17.6 16 7.8 <5 § <5 § <5 § 17 20.4 35 21.7 29 27.2 <5 §
Central San Diego 46 27.8 30 33.1 16 21.3 29 35.2 <5 § 10 17.4 <5 § <5 § <5 § 7 30.4 13 18.6 23 60.6 <5 §
Mid‐City 22 13.5 13 16.0 9 11.0 14 30.1 <5 § <5 § <5 § <5 § <5 § 5 15.0 14 27.8 <5 § <5 §
Southeast San Diego 16 10.3 8 10.5 8 10.0 5 33.6 5 19.3 <5 § <5 § <5 § <5 § 5 18.6 8 19.4 <5 § <5 §
East Region 101 21.8 55 24.1 46 19.6 67 24.0 5 18.8 17 14.7 <5 § <5 § <5 § 34 49.6 44 36.3 19 14.9 <5 §
Alpine <5 § <5 § <5 § <5 § <5 § <5 § <5 § <5 § <5 § <5 § <5 § <5 § <5 §
El Cajon 27 21.7 17 27.9 10 15.7 13 17.6 <5 § 6 18.1 <5 § <5 § <5 § 13 66.1 8 24.2 6 18.9 <5 §
Harbison Crest/El Cajon** 45 32.3 26 38.1 19 26.8 26 30.5 <5 § 9 25.5 <5 § <5 § <5 § 16 74.3 17 47.4 9 24.4 <5 §
Jamul <5 15.8 <5 § <5 § <5 § <5 § <5 § <5 § <5 § <5 § <5 § <5 § <5 § <5 §
La Mesa 12 20.3 6 21.3 6 19.4 9 24.3 <5 § <5 § <5 § <5 § <5 § 7 83.0 <5 § <5 § <5 §
Laguna‐Pine Valley <5 § <5 § <5 § <5 § <5 § <5 § <5 § <5 § <5 § <5 § <5 § <5 § <5 §
Lakeside 10 17.9 <5 § 8 28.3 6 14.7 <5 § <5 § <5 § <5 § <5 § <5 § <5 § <5 § <5 §
Lemon Grove <5 § <5 § <5 § <5 § <5 § <5 § <5 § <5 § <5 § <5 § <5 § <5 § <5 §
Mountain Empire 5 65.9 <5 § <5 § <5 § <5 § <5 § <5 § <5 § <5 § <5 § <5 § <5 § <5 §
Santee 8 15.6 <5 § 5 19.0 6 15.8 <5 § <5 § <5 § <5 § <5 § <5 § <5 § <5 § <5 §
Spring Valley 10 12.3 6 15.2 <5 § 8 20.9 <5 § <5 § <5 § <5 § <5 § <5 § 6 28.5 <5 § <5 §
North Central Region 139 23.0 83 27.2 56 18.8 96 26.3 <5 § 19 22.2 <5 § <5 § <5 § 56 54.6 55 28.7 25 17.5 <5 §
Coastal 25 33.2 15 38.6 10 27.4 17 27.9 <5 § <5 § <5 § <5 § <5 § 6 53.8 12 43.3 7 42.6 <5 §
Del Mar‐Mira Mesa 28 17.8 17 21.5 11 14.0 24 31.6 <5 § <5 § <5 § <5 § <5 § 20 103.6 <5 § 5 11.2 <5 §
Elliott‐Navajo 39 43.8 27 62.5 12 26.2 20 33.3 <5 § 12 92.5 <5 § <5 § <5 § 16 144.2 14 55.6 7 31.1 <5 §
Kearny Mesa 27 17.9 15 19.9 12 15.8 19 22.5 <5 § <5 § <5 § <5 § <5 § 10 42.5 13 26.1 <5 § <5 §
Miramar <5 § <5 § <5 § <5 § <5 § <5 § <5 § <5 § <5 § <5 § <5 § <5 § <5 §
Peninsula 10 15.9 <5 § 10 34.8 8 16.7 <5 § <5 § <5 § <5 § <5 § <5 § 8 38.0 <5 § <5 §
University 9 14.3 8 25.7 <5 § 8 24.3 <5 § <5 § <5 § <5 § <5 § <5 § 5 25.3 <5 § <5 §
North Coastal Region 135 26.7 77 29.9 58 23.4 112 37.4 <5 § 9 6.3 <5 § <5 § <5 § 51 60.9 42 30.8 34 27.2 7 11.7
Carlsbad 36 31.4 21 37.7 15 25.4 32 37.9 <5 § <5 § <5 § <5 § <5 § 14 114.5 13 43.2 9 27.6 <5 §
Oceanside 37 23.2 21 26.5 16 19.9 29 39.1 <5 § <5 § <5 § <5 § <5 § 11 43.4 13 29.1 11 28.1 <5 §
Pendleton <5 § <5 § <5 § <5 § <5 § <5 § <5 § <5 § <5 § <5 § <5 § <5 § <5 §
San Dieguito 40 42.8 23 50.0 17 35.8 33 45.0 <5 § <5 § <5 § <5 § <5 § 19 202.6 11 44.6 9 30.7 <5 §
Vista 22 21.9 12 23.7 10 20.1 18 41.0 <5 § <5 § <5 § <5 § <5 § 7 41.8 5 17.4 5 21.2 5 49.5
North Inland Region 147 25.8 91 32.4 56 19.4 116 36.9 <5 § 16 9.8 <5 § <5 § <5 § 62 80.4 57 38.4 24 15.8 <5 §
Anza‐Borrego Springs <5 § <5 § <5 § <5 § <5 § <5 § <5 § <5 § <5 § <5 § <5 § <5 § <5 §
Escondido 41 25.2 26 32.1 15 18.3 25 35.2 <5 § 10 13.5 <5 § <5 § <5 § 9 35.1 23 50.8 6 15.6 <5 §
Fallbrook 11 23.3 7 29.7 <5 § 10 36.6 <5 § <5 § <5 § <5 § <5 § <5 § <5 § <5 § <5 §
North San Diego 41 38.5 25 48.5 16 29.1 35 55.9 <5 § <5 § <5 § <5 § <5 § 25 218.4 12 38.9 <5 § <5 §
Palomar‐Julian <5 § <5 § <5 § <5 § <5 § <5 § <5 § <5 § <5 § <5 § <5 § <5 § <5 §
Pauma <5 § <5 § <5 § <5 § <5 § <5 § <5 § <5 § <5 § <5 § <5 § <5 § <5 §
Poway 30 34.8 20 47.4 10 22.7 25 43.1 <5 § <5 § <5 § <5 § <5 § 15 148.4 11 52.9 <5 § <5 §
Ramona 8 22.9 5 28.5 <5 § 8 32.2 <5 § <5 § <5 § <5 § <5 § <5 § <5 § <5 § <5 §
San Marcos 10 11.1 <5 § 6 13.1 7 15.4 <5 § <5 § <5 § <5 § <5 § 5 39.9 <5 § <5 § <5 §
Valley Center <5 § <5 § <5 § <5 § <5 § <5 § <5 § <5 § <5 § <5 § <5 § <5 § <5 §
South Region 101 21.6 78 33.3 23 9.8 46 46.9 <5 § 46 16.6 <5 § <5 § <5 § 16 19.8 55 41.7 29 27.4 <5 §
Chula Vista 13 11.3 10 18.0 <5 § 7 32.8 <5 § <5 § <5 § <5 § <5 § <5 § 6 19.4 <5 § <5 §
Coronado 5 20.2 <5 § <5 § <5 § <5 § <5 § <5 § <5 § <5 § <5 § <5 § <5 § <5 §
National City <5 § <5 § <5 § <5 § <5 § <5 § <5 § <5 § <5 § <5 § <5 § <5 § <5 §
South Bay 72 53.4 61 89.6 11 16.5 27 131.5 <5 § 40 43.3 <5 § <5 § <5 § 5 20.9 45 118.6 21 68.6 <5 §
Sweetwater 11 8.1 <5 § 8 11.5 8 25.4 <5 § <5 § <5 § <5 § <5 § 5 25.8 <5 § <5 § <5 §Unknown <5 ‐‐‐ <5 ‐‐‐ <5 ‐‐‐ <5 ‐‐‐ <5 ‐‐‐ <5 ‐‐‐ <5 ‐‐‐ <5 ‐‐‐ <5 ‐‐‐ <5 ‐‐‐ <5 ‐‐‐ <5 ‐‐‐ <5 ‐‐‐*Rates per 100,000 population. County age‐adjusted rates per 100,000 2000 US standard population.**Harbison Crest/El Cajon is an aggregation of the Harbison Crest and El Cajon SRAs. Due to geographic limitations, the Harbison Crest SRA is not shown alone. See the Data Guide for more information.
***Numbers may not add up to totals due to unknown or missing details.
†Chronic substance‐related disorder hospitaliza on refers to (principal diagnosis) ICD‐9 code 304.
‡API includes Asian, Pacific Islander, Na ve Hawaiian. Other includes 2 or more races, Na ve American/Alaska Na ve, American Indian, or other.
§Rates not calculated for fewer than 5 events. Rates not calculated in cases where zip code is unknown.
Source: Patient Discharge Database (CA OSHPD), County of San Diego, Health & Human Services Agency, Public Health Services, Epidemiology & Immunization Services Branch; SANDAG, Current Population Estimates, 10/2012.
Prepared by: County of San Diego, Health & Human Services Agency, Public Health Services, Community Health Statistics Unit, 2013.
Ages 0‐14 Ages 15‐24 Ages 25‐44 Ages 45‐64 Ages 65+
Chronic Substance‐related Disorder† Hospitaliza ons Among San Diego County Residents by Loca on of Residence, 2010 Detail
Geography2010 Total
Gender Race/Ethnicity Age Group
Male Female White Black Hispanic API‡ Other‡
County of San Diego, Health & Human Services Agency, Public Health Services, Community Health Statisitcs Unit Page 129

No. Rate* No. Rate* No. Rate* No. Rate* No. Rate* No. Rate* No. Rate* No. Rate* No. Rate* No. Rate* No. Rate* No. Rate* No. Rate*
San Diego County (Actual Rate) 686 22.0 424 27.1 262 16.9 450 30.1 21 14.7 124 12.3 16 4.6 34 28.9 <5 § 240 48.1 270 30.3 150 19.5 25 6.9
San Diego County (Age‐Adjusted Rate) 686 21.1
Central Region 102 21.0 63 25.4 39 16.4 54 37.9 13 23.7 25 12.0 <5 § <5 § <5 § 16 19.9 59 36.3 26 24.0 <5 §
Central San Diego 66 39.8 43 47.5 23 30.5 43 52.5 5 45.0 14 23.9 <5 § <5 § <5 § 9 43.4 41 58.2 16 41.4 <5 §
Mid‐City 23 14.1 14 17.2 9 11.0 10 21.9 <5 § <5 § <5 § <5 § <5 § 6 18.6 10 19.7 6 17.9 <5 §
Southeast San Diego 13 8.3 6 7.9 7 8.7 <5 § 5 20.0 7 8.8 <5 § <5 § <5 § <5 § 8 19.3 <5 § <5 §
East Region 96 20.6 50 21.8 46 19.4 71 25.4 <5 § 10 8.4 <5 § <5 § <5 § 35 50.4 38 31.4 15 11.7 8 13.7
Alpine 7 46.2 <5 § 5 65.6 6 51.0 <5 § <5 § <5 § <5 § <5 § <5 § <5 § <5 § <5 §
El Cajon 16 12.8 12 19.6 <5 § 13 17.7 <5 § <5 § <5 § <5 § <5 § 10 50.8 <5 § <5 § <5 §
Harbison Crest/El Cajon** 26 18.6 18 26.2 8 11.2 20 23.5 <5 § <5 § <5 § <5 § <5 § 13 60.1 7 19.5 6 16.1 <5 §
Jamul 5 28.4 <5 § <5 § <5 § <5 § <5 § <5 § <5 § <5 § <5 § <5 § <5 § <5 §
La Mesa 15 25.0 9 31.4 6 19.1 15 40.2 <5 § <5 § <5 § <5 § <5 § 5 61.2 7 40.1 <5 § <5 §
Laguna‐Pine Valley <5 § <5 § <5 § <5 § <5 § <5 § <5 § <5 § <5 § <5 § <5 § <5 § <5 §
Lakeside 6 10.6 <5 § <5 § 6 14.7 <5 § <5 § <5 § <5 § <5 § <5 § <5 § <5 § <5 §
Lemon Grove <5 § <5 § <5 § <5 § <5 § <5 § <5 § <5 § <5 § <5 § <5 § <5 § <5 §
Mountain Empire 11 129.3 6 131.1 5 127.2 9 199.5 <5 § <5 § <5 § <5 § <5 § <5 § <5 § <5 § <5 §
Santee 17 32.9 7 28.0 10 37.5 9 23.6 <5 § <5 § <5 § <5 § <5 § <5 § 11 80.3 <5 § <5 §
Spring Valley 6 7.3 <5 § <5 § <5 § <5 § <5 § <5 § <5 § <5 § <5 § <5 § <5 § <5 §
North Central Region 129 21.2 72 23.3 57 18.9 86 23.5 <5 § 19 21.7 <5 § 10 37.6 <5 § 52 50.2 50 25.8 24 16.6 <5 §
Coastal 15 19.9 11 28.2 <5 § 11 18.1 <5 § <5 § <5 § <5 § <5 § 5 45.3 9 32.3 <5 § <5 §
Del Mar‐Mira Mesa 26 16.4 8 10.1 18 22.8 20 26.4 <5 § <5 § <5 § <5 § <5 § 13 65.0 6 12.9 5 10.9 <5 §
Elliott‐Navajo 35 39.1 20 46.1 15 32.6 19 31.7 <5 § 12 90.9 <5 § <5 § <5 § 11 101.5 15 59.1 9 39.8 <5 §
Kearny Mesa 33 21.8 22 29.1 11 14.4 19 22.6 <5 § 5 14.7 <5 § <5 § <5 § 11 50.0 13 25.7 9 24.9 <5 §
Miramar <5 § <5 § <5 § <5 § <5 § <5 § <5 § <5 § <5 § <5 § <5 § <5 § <5 §
Peninsula 13 20.6 6 17.5 7 24.4 11 23.1 <5 § <5 § <5 § <5 § <5 § 7 56.8 6 28.1 <5 § <5 §
University 7 10.5 5 15.2 <5 § 6 17.5 <5 § <5 § <5 § <5 § <5 § 5 20.6 <5 § <5 § <5 §
North Coastal Region 132 25.9 77 29.7 55 22.0 106 35.4 <5 § 14 9.5 <5 § <5 § <5 § 56 66.4 39 28.6 28 22.1 9 14.6
Carlsbad 27 23.3 15 26.6 12 20.2 19 22.4 <5 § <5 § <5 § <5 § <5 § 10 77.9 7 23.6 8 24.1 <5 §
Oceanside 46 28.7 19 23.9 27 33.5 35 47.5 <5 § 6 9.9 <5 § <5 § <5 § 17 68.7 23 51.5 <5 § <5 §
Pendleton <5 § <5 § <5 § <5 § <5 § <5 § <5 § <5 § <5 § <5 § <5 § <5 § <5 §
San Dieguito 42 44.3 31 66.4 11 22.8 37 50.0 <5 § <5 § <5 § <5 § <5 § 23 229.5 5 20.4 10 33.6 <5 §
Vista 17 16.8 12 23.5 5 10.0 15 34.4 <5 § <5 § <5 § <5 § <5 § 6 36.4 <5 § 6 24.9 <5 §
North Inland Region 146 25.4 97 34.3 49 16.8 103 32.8 <5 § 14 8.3 5 8.3 11 51.0 <5 § 72 90.3 44 29.9 27 17.5 <5 §
Anza‐Borrego Springs <5 § <5 § <5 § <5 § <5 § <5 § <5 § <5 § <5 § <5 § <5 § <5 § <5 §
Escondido 27 16.4 17 20.9 10 12.1 18 25.5 <5 § 6 7.9 <5 § <5 § <5 § 6 23.2 16 35.4 <5 § <5 §
Fallbrook 10 20.9 9 37.7 <5 § 5 18.4 <5 § <5 § <5 § <5 § <5 § <5 § 6 59.3 <5 § <5 §
North San Diego 34 31.6 25 48.0 9 16.2 23 36.6 <5 § 6 54.9 <5 § <5 § <5 § 20 166.7 7 23.0 5 16.9 <5 §
Palomar‐Julian <5 § <5 § <5 § <5 § <5 § <5 § <5 § <5 § <5 § <5 § <5 § <5 § <5 §
Pauma <5 § <5 § <5 § <5 § <5 § <5 § <5 § <5 § <5 § <5 § <5 § <5 § <5 §
Poway 34 39.1 17 40.0 17 38.2 29 50.0 <5 § <5 § <5 § <5 § <5 § 24 219.1 <5 § 7 25.6 <5 §
Ramona 12 33.9 6 33.7 6 34.0 9 36.0 <5 § <5 § <5 § <5 § <5 § 9 164.1 <5 § <5 § <5 §
San Marcos 17 18.8 13 29.5 <5 § 12 26.7 <5 § <5 § <5 § <5 § <5 § 5 39.1 6 24.1 6 29.0 <5 §
Valley Center 9 38.4 7 59.5 <5 § 7 47.2 <5 § <5 § <5 § <5 § <5 § <5 § <5 § <5 § <5 §
South Region 81 17.3 65 27.8 16 6.8 30 31.2 <5 § 42 14.9 <5 § <5 § <5 § 9 11.1 40 30.7 30 27.8 <5 §
Chula Vista 8 6.9 5 9.0 <5 § <5 § <5 § <5 § <5 § <5 § <5 § <5 § <5 § <5 § <5 §
Coronado 9 38.6 <5 § 5 50.2 5 29.3 <5 § <5 § <5 § <5 § <5 § <5 § 5 83.2 <5 § <5 §
National City <5 § <5 § <5 § <5 § <5 § <5 § <5 § <5 § <5 § <5 § <5 § <5 § <5 §
South Bay 56 41.4 51 74.9 5 7.5 17 84.5 <5 § 36 38.6 <5 § <5 § <5 § <5 § 30 79.8 20 64.7 <5 §
Sweetwater 6 4.4 <5 § <5 § <5 § <5 § <5 § <5 § <5 § <5 § <5 § <5 § 5 15.2 <5 §Unknown <5 ‐‐‐ <5 ‐‐‐ <5 ‐‐‐ <5 ‐‐‐ <5 ‐‐‐ <5 ‐‐‐ <5 ‐‐‐ <5 ‐‐‐ <5 ‐‐‐ <5 ‐‐‐ <5 ‐‐‐ <5 ‐‐‐ <5 ‐‐‐*Rates per 100,000 population. County age‐adjusted rates per 100,000 2000 US standard population.**Harbison Crest/El Cajon is an aggregation of the Harbison Crest and El Cajon SRAs. Due to geographic limitations, the Harbison Crest SRA is not shown alone. See the Data Guide for more information.
***Numbers may not add up to totals due to unknown or missing details.
†Chronic substance‐related disorder hospitaliza on refers to (principal diagnosis) ICD‐9 code 304.
‡API includes Asian, Pacific Islander, Na ve Hawaiian. Other includes 2 or more races, Na ve American/Alaska Na ve, American Indian, or other.
§Rates not calculated for fewer than 5 events. Rates not calculated in cases where zip code is unknown.
Source: Patient Discharge Database (CA OSHPD), County of San Diego, Health & Human Services Agency, Public Health Services, Epidemiology & Immunization Services Branch; SANDAG, Current Population Estimates, 10/2012.
Prepared by: County of San Diego, Health & Human Services Agency, Public Health Services, Community Health Statistics Unit, 2013.
Gender Race/Ethnicity Age Group
Male Female White Black Hispanic Ages 65+API‡ Other‡ Ages 0‐14 Ages 15‐24 Ages 25‐44 Ages 45‐64Geography2011 Total
Chronic Substance‐related Disorder† Hospitaliza ons Among San Diego County Residents by Loca on of Residence, 2011 Detail
County of San Diego, Health & Human Services Agency, Public Health Services, Community Health Statisitcs Unit Page 130

No. Rate* No. Rate* No. Rate* No. Rate* No. Rate* No. Rate* No. Rate* No. Rate* No. Rate* No. Rate* No. Rate*
San Diego County (Actual Rate) 164 5.3 159 5.1
San Diego County (Age‐Adjusted Rate) 164 5.0 159 4.8
Central Region 44 9.1 32 6.6
Central San Diego 23 13.9 20 12.1
Mid‐City 15 9.2 5 3.1
Southeast San Diego 6 3.9 7 4.5
East Region 30 6.5 33 7.1
Alpine <5 § <5 §
El Cajon 10 8.0 8 6.4
Harbison Crest/El Cajon** 15 10.8 14 10.0
Jamul <5 § <5 §
La Mesa <5 § 8 13.3
Laguna‐Pine Valley <5 § <5 §
Lakeside <5 § <5 §
Lemon Grove <5 § <5 §
Mountain Empire <5 § <5 §
Santee 5 9.8 <5 §
Spring Valley <5 § 6 7.3
North Central Region 23 3.8 21 3.4
Coastal <5 § <5 §
Del Mar‐Mira Mesa 5 3.2 <5 §
Elliott‐Navajo <5 § <5 §
Kearny Mesa 7 4.6 10 6.6
Miramar <5 § <5 §
Peninsula <5 § <5 §
University <5 § <5 §
North Coastal Region 31 6.1 32 6.3
Carlsbad 7 6.1 <5 §
Oceanside 8 5.0 9 5.6
Pendleton <5 § <5 §
San Dieguito 10 10.7 9 9.5
Vista 6 6.0 10 9.9
North Inland Region 22 3.9 19 3.3
Anza‐Borrego Springs <5 § <5 §
Escondido 7 4.3 <5 §
Fallbrook <5 § <5 §
North San Diego <5 § <5 §
Palomar‐Julian <5 § <5 §
Pauma <5 § <5 §
Poway 5 5.8 <5 §
Ramona <5 § <5 §
San Marcos <5 § <5 §
Valley Center <5 § <5 §
South Region 11 2.3 18 3.8
Chula Vista 8 6.9 10 8.6
Coronado <5 § <5 §
National City <5 § <5 §
South Bay <5 § <5 §
Sweetwater <5 § <5 §Unknown <5 ‐‐‐ <5 ‐‐‐*Rates per 100,000 population. County age‐adjusted rates per 100,000 2000 US standard population.**Harbison Crest/El Cajon is an aggregation of the Harbison Crest and El Cajon SRAs. Due to geographic limitations, the Harbison Crest SRA is not shown alone. See the Data Guide for more information.†Chronic substance‐related disorder Emergency Department Discharge refers to (principal diagnosis) ICD‐9 code 304.§Rates not calculated for fewer than 5 events. Rates not calculated in cases where zip code is unknown.Source: Emergency Department Discharge Database (CA OSHPD), County of San Diego, Health & Human Services Agency, Public Health Services, Emergency Medical Services; SANDAG, Current Population Estimates, 10/2012.Prepared by: County of San Diego, Health & Human Services Agency, Public Health Services, Community Health Statistics Unit, 2013.
Chronic Substance‐related Disorder† Emergency Department Discharges Among San Diego County Residents by Loca on of Residence
Geography2010 Total 2011 Total 2012 Total 2013 Total 2014 Total 2015 Total 2016 Total 2017 Total 2018 Total 2019 Total 2020 Total
County of San Diego, Health & Human Services Agency, Public Health Services, Community Health Statisitcs Unit Page 131

No. Rate* No. Rate* No. Rate* No. Rate* No. Rate* No. Rate* No. Rate* No. Rate* No. Rate* No. Rate* No. Rate* No. Rate* No. Rate*
San Diego County (Actual Rate) 164 5.3 97 6.2 67 4.3 135 9.0 5 3.4 21 2.1 <5 § <5 § <5 § 35 7.1 73 8.2 52 6.8 <5 §
San Diego County (Age‐Adjusted Rate) 164 5.0
Central Region 44 9.1 26 10.5 18 7.6 35 24.4 <5 § 7 3.4 <5 § <5 § <5 § <5 § 24 14.9 18 16.9 <5 §
Central San Diego 23 13.9 13 14.4 10 13.3 20 24.3 <5 § <5 § <5 § <5 § <5 § <5 § 13 18.6 9 23.7 <5 §
Mid‐City 15 9.2 9 11.1 6 7.3 12 25.8 <5 § <5 § <5 § <5 § <5 § <5 § 7 13.9 7 21.4 <5 §
Southeast San Diego 6 3.9 <5 § <5 § <5 § <5 § <5 § <5 § <5 § <5 § <5 § <5 § <5 § <5 §
East Region 30 6.5 18 7.9 12 5.1 26 9.3 <5 § <5 § <5 § <5 § <5 § <5 § 16 13.2 9 7.1 <5 §
Alpine <5 § <5 § <5 § <5 § <5 § <5 § <5 § <5 § <5 § <5 § <5 § <5 § <5 §
El Cajon 10 8.0 9 14.8 <5 § 9 12.2 <5 § <5 § <5 § <5 § <5 § <5 § <5 § 5 15.8 <5 §
Harbison Crest/El Cajon** 15 10.8 12 17.6 <5 § 13 15.2 <5 § <5 § <5 § <5 § <5 § <5 § 8 22.3 5 13.5 <5 §
Jamul <5 § <5 § <5 § <5 § <5 § <5 § <5 § <5 § <5 § <5 § <5 § <5 § <5 §
La Mesa <5 § <5 § <5 § <5 § <5 § <5 § <5 § <5 § <5 § <5 § <5 § <5 § <5 §
Laguna‐Pine Valley <5 § <5 § <5 § <5 § <5 § <5 § <5 § <5 § <5 § <5 § <5 § <5 § <5 §
Lakeside <5 § <5 § <5 § <5 § <5 § <5 § <5 § <5 § <5 § <5 § <5 § <5 § <5 §
Lemon Grove <5 § <5 § <5 § <5 § <5 § <5 § <5 § <5 § <5 § <5 § <5 § <5 § <5 §
Mountain Empire <5 § <5 § <5 § <5 § <5 § <5 § <5 § <5 § <5 § <5 § <5 § <5 § <5 §
Santee 5 9.8 <5 § <5 § 5 13.2 <5 § <5 § <5 § <5 § <5 § <5 § <5 § <5 § <5 §
Spring Valley <5 § <5 § <5 § <5 § <5 § <5 § <5 § <5 § <5 § <5 § <5 § <5 § <5 §
North Central Region 23 3.8 14 4.6 9 3.0 19 5.2 <5 § <5 § <5 § <5 § <5 § 12 11.7 7 3.6 <5 § <5 §
Coastal <5 § <5 § <5 § <5 § <5 § <5 § <5 § <5 § <5 § <5 § <5 § <5 § <5 §
Del Mar‐Mira Mesa 5 3.2 <5 § <5 § 5 6.6 <5 § <5 § <5 § <5 § <5 § <5 § <5 § <5 § <5 §
Elliott‐Navajo <5 § <5 § <5 § <5 § <5 § <5 § <5 § <5 § <5 § <5 § <5 § <5 § <5 §
Kearny Mesa 7 4.6 <5 § <5 § 6 7.1 <5 § <5 § <5 § <5 § <5 § <5 § <5 § <5 § <5 §
Miramar <5 § <5 § <5 § <5 § <5 § <5 § <5 § <5 § <5 § <5 § <5 § <5 § <5 §
Peninsula <5 § <5 § <5 § <5 § <5 § <5 § <5 § <5 § <5 § <5 § <5 § <5 § <5 §
University <5 § <5 § <5 § <5 § <5 § <5 § <5 § <5 § <5 § <5 § <5 § <5 § <5 §
North Coastal Region 31 6.1 16 6.2 15 6.0 27 9.0 <5 § <5 § <5 § <5 § <5 § <5 § 11 8.1 14 11.2 <5 §
Carlsbad 7 6.1 <5 § <5 § 7 8.3 <5 § <5 § <5 § <5 § <5 § <5 § <5 § <5 § <5 §
Oceanside 8 5.0 5 6.3 <5 § 6 8.1 <5 § <5 § <5 § <5 § <5 § <5 § <5 § <5 § <5 §
Pendleton <5 § <5 § <5 § <5 § <5 § <5 § <5 § <5 § <5 § <5 § <5 § <5 § <5 §
San Dieguito 10 10.7 <5 § 6 12.6 9 12.3 <5 § <5 § <5 § <5 § <5 § <5 § <5 § 6 20.4 <5 §
Vista 6 6.0 <5 § <5 § 5 11.4 <5 § <5 § <5 § <5 § <5 § <5 § <5 § <5 § <5 §
North Inland Region 22 3.9 14 5.0 8 2.8 18 5.7 <5 § <5 § <5 § <5 § <5 § 10 13.0 9 6.1 <5 § <5 §
Anza‐Borrego Springs <5 § <5 § <5 § <5 § <5 § <5 § <5 § <5 § <5 § <5 § <5 § <5 § <5 §
Escondido 7 4.3 <5 § <5 § 6 8.4 <5 § <5 § <5 § <5 § <5 § <5 § 5 11.0 <5 § <5 §
Fallbrook <5 § <5 § <5 § <5 § <5 § <5 § <5 § <5 § <5 § <5 § <5 § <5 § <5 §
North San Diego <5 § <5 § <5 § <5 § <5 § <5 § <5 § <5 § <5 § <5 § <5 § <5 § <5 §
Palomar‐Julian <5 § <5 § <5 § <5 § <5 § <5 § <5 § <5 § <5 § <5 § <5 § <5 § <5 §
Pauma <5 § <5 § <5 § <5 § <5 § <5 § <5 § <5 § <5 § <5 § <5 § <5 § <5 §
Poway 5 5.8 5 11.9 <5 § 5 8.6 <5 § <5 § <5 § <5 § <5 § 5 49.5 <5 § <5 § <5 §
Ramona <5 § <5 § <5 § <5 § <5 § <5 § <5 § <5 § <5 § <5 § <5 § <5 § <5 §
San Marcos <5 § <5 § <5 § <5 § <5 § <5 § <5 § <5 § <5 § <5 § <5 § <5 § <5 §
Valley Center <5 § <5 § <5 § <5 § <5 § <5 § <5 § <5 § <5 § <5 § <5 § <5 § <5 §
South Region 11 2.3 7 3.0 <5 § 8 8.2 <5 § <5 § <5 § <5 § <5 § <5 § 6 4.5 <5 § <5 §
Chula Vista 8 6.9 5 9.0 <5 § 7 32.8 <5 § <5 § <5 § <5 § <5 § <5 § <5 § <5 § <5 §
Coronado <5 § <5 § <5 § <5 § <5 § <5 § <5 § <5 § <5 § <5 § <5 § <5 § <5 §
National City <5 § <5 § <5 § <5 § <5 § <5 § <5 § <5 § <5 § <5 § <5 § <5 § <5 §
South Bay <5 § <5 § <5 § <5 § <5 § <5 § <5 § <5 § <5 § <5 § <5 § <5 § <5 §
Sweetwater <5 § <5 § <5 § <5 § <5 § <5 § <5 § <5 § <5 § <5 § <5 § <5 § <5 §Unknown <5 ‐‐‐ <5 ‐‐‐ <5 ‐‐‐ <5 ‐‐‐ <5 ‐‐‐ <5 ‐‐‐ <5 ‐‐‐ <5 ‐‐‐ <5 ‐‐‐ <5 ‐‐‐ <5 ‐‐‐ <5 ‐‐‐ <5 ‐‐‐*Rates per 100,000 population. County age‐adjusted rates per 100,000 2000 US standard population.**Harbison Crest/El Cajon is an aggregation of the Harbison Crest and El Cajon SRAs. Due to geographic limitations, the Harbison Crest SRA is not shown alone. See the Data Guide for more information.
***Numbers may not add up to totals due to unknown or missing details.
†Chronic substance‐related disorder Emergency Department Discharge refers to (principal diagnosis) ICD‐9 code 304.
‡API includes Asian, Pacific Islander, Na ve Hawaiian. Other includes 2 or more races, Na ve American/Alaska Na ve, American Indian, or other.
§Rates not calculated for fewer than 5 events. Rates not calculated in cases where zip code is unknown.
Source: Emergency Department Discharge Database (CA OSHPD), County of San Diego, Health & Human Services Agency, Public Health Services, Emergency Medical Services; SANDAG, Current Population Estimates, 10/2012.
Prepared by: County of San Diego, Health & Human Services Agency, Public Health Services, Community Health Statistics Unit, 2013.
Ages 0‐14 Ages 15‐24 Ages 25‐44 Ages 45‐64 Ages 65+
Chronic Substance‐related Disorder† Emergency Department Discharges Among San Diego County Residents by Loca on of Residence, 2010 Detail
Geography2010 Total
Gender Race/Ethnicity Age Group
Male Female White Black Hispanic API‡ Other‡
County of San Diego, Health & Human Services Agency, Public Health Services, Community Health Statisitcs Unit Page 132

No. Rate* No. Rate* No. Rate* No. Rate* No. Rate* No. Rate* No. Rate* No. Rate* No. Rate* No. Rate* No. Rate* No. Rate* No. Rate*
San Diego County (Actual Rate) 159 5.1 95 6.1 64 4.1 121 8.1 8 5.6 22 2.2 <5 § <5 § <5 § 50 10.0 67 7.5 39 5.1 <5 §
San Diego County (Age‐Adjusted Rate) 159 4.8
Central Region 32 6.6 18 7.3 14 5.9 22 15.5 7 12.8 <5 § <5 § <5 § <5 § 9 11.2 14 8.6 7 6.4 <5 §
Central San Diego 20 12.1 15 16.6 5 6.6 15 18.3 <5 § <5 § <5 § <5 § <5 § 7 33.8 8 11.4 <5 § <5 §
Mid‐City 5 3.1 <5 § <5 § <5 § <5 § <5 § <5 § <5 § <5 § <5 § <5 § <5 § <5 §
Southeast San Diego 7 4.5 <5 § 5 6.2 5 34.0 <5 § <5 § <5 § <5 § <5 § <5 § <5 § <5 § <5 §
East Region 33 7.1 16 7.0 17 7.2 28 10.0 <5 § <5 § <5 § <5 § <5 § 19 27.4 10 8.3 <5 § <5 §
Alpine <5 § <5 § <5 § <5 § <5 § <5 § <5 § <5 § <5 § <5 § <5 § <5 § <5 §
El Cajon 8 6.4 5 8.2 <5 § 8 10.9 <5 § <5 § <5 § <5 § <5 § 5 25.4 <5 § <5 § <5 §
Harbison Crest/El Cajon** 14 10.0 7 10.2 7 9.8 13 15.3 <5 § <5 § <5 § <5 § <5 § 10 46.2 <5 § <5 § <5 §
Jamul <5 § <5 § <5 § <5 § <5 § <5 § <5 § <5 § <5 § <5 § <5 § <5 § <5 §
La Mesa 8 13.3 <5 § 5 15.9 5 13.4 <5 § <5 § <5 § <5 § <5 § <5 § <5 § <5 § <5 §
Laguna‐Pine Valley <5 § <5 § <5 § <5 § <5 § <5 § <5 § <5 § <5 § <5 § <5 § <5 § <5 §
Lakeside <5 § <5 § <5 § <5 § <5 § <5 § <5 § <5 § <5 § <5 § <5 § <5 § <5 §
Lemon Grove <5 § <5 § <5 § <5 § <5 § <5 § <5 § <5 § <5 § <5 § <5 § <5 § <5 §
Mountain Empire <5 § <5 § <5 § <5 § <5 § <5 § <5 § <5 § <5 § <5 § <5 § <5 § <5 §
Santee <5 § <5 § <5 § <5 § <5 § <5 § <5 § <5 § <5 § <5 § <5 § <5 § <5 §
Spring Valley 6 7.3 <5 § <5 § 6 15.7 <5 § <5 § <5 § <5 § <5 § <5 § <5 § <5 § <5 §
North Central Region 21 3.4 15 4.9 6 2.0 17 4.7 <5 § <5 § <5 § <5 § <5 § 5 4.8 13 6.7 <5 § <5 §
Coastal <5 § <5 § <5 § <5 § <5 § <5 § <5 § <5 § <5 § <5 § <5 § <5 § <5 §
Del Mar‐Mira Mesa <5 § <5 § <5 § <5 § <5 § <5 § <5 § <5 § <5 § <5 § <5 § <5 § <5 §
Elliott‐Navajo <5 § <5 § <5 § <5 § <5 § <5 § <5 § <5 § <5 § <5 § <5 § <5 § <5 §
Kearny Mesa 10 6.6 6 7.9 <5 § 7 8.3 <5 § <5 § <5 § <5 § <5 § <5 § 5 9.9 <5 § <5 §
Miramar <5 § <5 § <5 § <5 § <5 § <5 § <5 § <5 § <5 § <5 § <5 § <5 § <5 §
Peninsula <5 § <5 § <5 § <5 § <5 § <5 § <5 § <5 § <5 § <5 § <5 § <5 § <5 §
University <5 § <5 § <5 § <5 § <5 § <5 § <5 § <5 § <5 § <5 § <5 § <5 § <5 §
North Coastal Region 32 6.3 21 8.1 11 4.4 29 9.7 <5 § <5 § <5 § <5 § <5 § 5 5.9 19 13.9 8 6.3 <5 §
Carlsbad <5 § <5 § <5 § <5 § <5 § <5 § <5 § <5 § <5 § <5 § <5 § <5 § <5 §
Oceanside 9 5.6 <5 § 5 6.2 8 10.9 <5 § <5 § <5 § <5 § <5 § <5 § 6 13.4 <5 § <5 §
Pendleton <5 § <5 § <5 § <5 § <5 § <5 § <5 § <5 § <5 § <5 § <5 § <5 § <5 §
San Dieguito 9 9.5 9 19.3 <5 § 9 12.2 <5 § <5 § <5 § <5 § <5 § <5 § <5 § <5 § <5 §
Vista 10 9.9 7 13.7 <5 § 9 20.6 <5 § <5 § <5 § <5 § <5 § <5 § 6 20.7 <5 § <5 §
North Inland Region 19 3.3 11 3.9 8 2.7 15 4.8 <5 § <5 § <5 § <5 § <5 § 6 7.5 6 4.1 7 4.5 <5 §
Anza‐Borrego Springs <5 § <5 § <5 § <5 § <5 § <5 § <5 § <5 § <5 § <5 § <5 § <5 § <5 §
Escondido <5 § <5 § <5 § <5 § <5 § <5 § <5 § <5 § <5 § <5 § <5 § <5 § <5 §
Fallbrook <5 § <5 § <5 § <5 § <5 § <5 § <5 § <5 § <5 § <5 § <5 § <5 § <5 §
North San Diego <5 § <5 § <5 § <5 § <5 § <5 § <5 § <5 § <5 § <5 § <5 § <5 § <5 §
Palomar‐Julian <5 § <5 § <5 § <5 § <5 § <5 § <5 § <5 § <5 § <5 § <5 § <5 § <5 §
Pauma <5 § <5 § <5 § <5 § <5 § <5 § <5 § <5 § <5 § <5 § <5 § <5 § <5 §
Poway <5 § <5 § <5 § <5 § <5 § <5 § <5 § <5 § <5 § <5 § <5 § <5 § <5 §
Ramona <5 § <5 § <5 § <5 § <5 § <5 § <5 § <5 § <5 § <5 § <5 § <5 § <5 §
San Marcos <5 § <5 § <5 § <5 § <5 § <5 § <5 § <5 § <5 § <5 § <5 § <5 § <5 §
Valley Center <5 § <5 § <5 § <5 § <5 § <5 § <5 § <5 § <5 § <5 § <5 § <5 § <5 §
South Region 18 3.8 11 4.7 7 3.0 8 8.3 <5 § 10 3.6 <5 § <5 § <5 § 6 7.4 <5 § 9 8.3 <5 §
Chula Vista 10 8.6 7 12.5 <5 § <5 § <5 § 6 7.3 <5 § <5 § <5 § <5 § <5 § 6 22.3 <5 §
Coronado <5 § <5 § <5 § <5 § <5 § <5 § <5 § <5 § <5 § <5 § <5 § <5 § <5 §
National City <5 § <5 § <5 § <5 § <5 § <5 § <5 § <5 § <5 § <5 § <5 § <5 § <5 §
South Bay <5 § <5 § <5 § <5 § <5 § <5 § <5 § <5 § <5 § <5 § <5 § <5 § <5 §
Sweetwater <5 § <5 § <5 § <5 § <5 § <5 § <5 § <5 § <5 § <5 § <5 § <5 § <5 §Unknown <5 ‐‐‐ <5 ‐‐‐ <5 ‐‐‐ <5 ‐‐‐ <5 ‐‐‐ <5 ‐‐‐ <5 ‐‐‐ <5 ‐‐‐ <5 ‐‐‐ <5 ‐‐‐ <5 ‐‐‐ <5 ‐‐‐ <5 ‐‐‐*Rates per 100,000 population. County age‐adjusted rates per 100,000 2000 US standard population.**Harbison Crest/El Cajon is an aggregation of the Harbison Crest and El Cajon SRAs. Due to geographic limitations, the Harbison Crest SRA is not shown alone. See the Data Guide for more information.
***Numbers may not add up to totals due to unknown or missing details.
†Chronic substance‐related disorder Emergency Department Discharge refers to (principal diagnosis) ICD‐9 code 304.
‡API includes Asian, Pacific Islander, Na ve Hawaiian. Other includes 2 or more races, Na ve American/Alaska Na ve, American Indian, or other.
§Rates not calculated for fewer than 5 events. Rates not calculated in cases where zip code is unknown.
Source: Emergency Department Discharge Database (CA OSHPD), County of San Diego, Health & Human Services Agency, Public Health Services, Emergency Medical Services; SANDAG, Current Population Estimates, 10/2012.
Prepared by: County of San Diego, Health & Human Services Agency, Public Health Services, Community Health Statistics Unit, 2013.
Gender Race/Ethnicity Age Group
Male Female White Black Hispanic Ages 65+API‡ Other‡ Ages 0‐14 Ages 15‐24 Ages 25‐44 Ages 45‐64Geography2011 Total
Chronic Substance‐related Disorder† Emergency Department Discharges Among San Diego County Residents by Loca on of Residence, 2011 Detail
County of San Diego, Health & Human Services Agency, Public Health Services, Community Health Statisitcs Unit Page 133

Suicide
County of San Diego, Health & Human Services Agency, Public Health Services, Community Health Statisitcs Unit Page 134

Healthy People 2020 Target: 10.2 deaths per 100,000 population, age‐adjusted*
USA: 12.4 deaths per 100,000 popula on, age‐adjusted (2010)* ‡
California: 10.5 deaths per 100,000 popula on, age‐adjusted (2010)* ‡
No. Rate* No. Rate* No. Rate* No. Rate* No. Rate* No. Rate* No. Rate* No. Rate* No. Rate* No. Rate* No. Rate*
San Diego County (Actual Rate) 352 11.4 383 12.3
San Diego County (Age‐Adjusted Rate) 352 11.0 383 11.9
Central Region 50 10.3 66 13.6
Central San Diego 23 13.9 26 15.7
Mid‐City 24 14.7 21 12.9
Southeast San Diego <5 § 19 12.1
East Region 61 13.2 73 15.6
Alpine <5 § 5 33.0
El Cajon 17 13.7 13 10.4
Harbison Crest/El Cajon** 30 21.6 23 16.4
Jamul <5 § <5 §
La Mesa 11 18.6 10 16.7
Laguna‐Pine Valley <5 § <5 §
Lakeside 7 12.5 7 12.4
Lemon Grove <5 § 6 20.0
Mountain Empire <5 § <5 §
Santee 6 11.7 10 19.3
Spring Valley <5 § 8 9.8
North Central Region 81 13.4 70 11.5
Coastal 11 14.6 13 17.2
Del Mar‐Mira Mesa 13 8.3 9 5.7
Elliott‐Navajo 10 11.2 15 16.8
Kearny Mesa 35 23.1 25 16.5
Miramar <5 § <5 §
Peninsula 7 11.1 5 7.9
University 5 8.0 <5 §
North Coastal Region 55 10.9 67 13.1
Carlsbad 11 9.6 16 13.8
Oceanside 19 11.9 24 15.0
Pendleton <5 § 5 13.3
San Dieguito 10 10.7 8 8.4
Vista 12 11.9 14 13.8
North Inland Region 73 12.8 56 9.7
Anza‐Borrego Springs <5 § <5 §
Escondido 20 12.3 16 9.7
Fallbrook 8 16.9 9 18.8
North San Diego 7 6.6 11 10.2
Palomar‐Julian <5 § <5 §
Pauma <5 § <5 §
Poway 18 20.9 6 6.9
Ramona <5 § <5 §
San Marcos 11 12.2 5 5.5
Valley Center <5 § <5 §
South Region 30 6.4 51 10.9
Chula Vista 9 7.8 14 12.1
Coronado <5 § <5 §
National City <5 § 7 12.0
South Bay 12 8.9 14 10.4
Sweetwater 5 3.7 12 8.8Unknown <5 ‐‐‐ <5 ‐‐‐*Rates per 100,000 population. County age‐adjusted rates per 100,000 2000 US standard population.**Harbison Crest/El Cajon is an aggregation of the Harbison Crest and El Cajon SRAs. Due to geographic limitations, the Harbison Crest SRA is not shown alone. See the Data Guide for more information.†Suicide refers to (underlying cause of death) ICD‐10 codes U03, X60‐X84, Y87.0.‡Source: Na onal Vital Sta s cs System, CDC, NCHS. Online database accessed 06/01/2013: h p://wonder.cdc.gov.§Rates not calculated for fewer than 5 events. Rates not calculated in cases where zip code is unknown.Source: Death Statistical Master Files (CDPH), County of San Diego, Health & Human Services Agency, Public Health Services, Epidemiology & Immunization Services Branch; SANDAG, Current Population Estimates, 10/2012.Prepared by: County of San Diego, Health & Human Services Agency, Public Health Services, Community Health Statistics Unit, 2013.
Geography2010 Total 2011 Total 2012 Total 2013 Total 2014 Total 2015 Total 2016 Total 2017 Total 2018 Total 2019 Total 2020 Total
Suicide† Among San Diego County Residents by Loca on of Residence
County of San Diego, Health & Human Services Agency, Public Health Services, Community Health Statisitcs Unit Page 135

No. Rate* No. Rate* No. Rate* No. Rate* No. Rate* No. Rate* No. Rate* No. Rate* No. Rate* No. Rate* No. Rate* No. Rate* No. Rate*
San Diego County (Actual Rate) 352 11.4 276 17.8 76 4.9 270 18.0 9 6.1 48 4.8 23 6.7 <5 § <5 § 39 7.9 82 9.2 164 21.6 65 18.5
San Diego County (Age‐Adjusted Rate) 352 11.0
Central Region 50 10.3 44 17.8 6 2.5 33 23.0 <5 § 8 3.9 5 7.8 <5 § <5 § <5 § 17 10.5 22 20.6 9 20.8
Central San Diego 23 13.9 21 23.2 <5 § 21 25.5 <5 § <5 § <5 § <5 § <5 § <5 § 8 11.5 10 26.4 5 32.2
Mid‐City 24 14.7 20 24.6 <5 § 12 25.8 <5 § 5 7.3 <5 § <5 § <5 § <5 § 8 15.9 11 33.6 <5 §
Southeast San Diego <5 § <5 § <5 § <5 § <5 § <5 § <5 § <5 § <5 § <5 § <5 § <5 § <5 §
East Region 61 13.2 46 20.2 15 6.4 58 20.8 <5 § <5 § <5 § <5 § <5 § <5 § 12 9.9 38 29.8 7 12.5
Alpine <5 § <5 § <5 § <5 § <5 § <5 § <5 § <5 § <5 § <5 § <5 § <5 § <5 §
El Cajon 17 13.7 15 24.6 <5 § 16 21.7 <5 § <5 § <5 § <5 § <5 § <5 § <5 § 12 37.9 <5 §
Harbison Crest/El Cajon** 30 21.6 21 30.8 9 12.7 27 31.7 <5 § <5 § <5 § <5 § <5 § <5 § 6 16.7 18 48.7 <5 §
Jamul <5 § <5 § <5 § <5 § <5 § <5 § <5 § <5 § <5 § <5 § <5 § <5 § <5 §
La Mesa 11 18.6 8 28.4 <5 § 11 29.7 <5 § <5 § <5 § <5 § <5 § <5 § <5 § 8 52.1 <5 §
Laguna‐Pine Valley <5 § <5 § <5 § <5 § <5 § <5 § <5 § <5 § <5 § <5 § <5 § <5 § <5 §
Lakeside 7 12.5 6 21.7 <5 § 7 17.1 <5 § <5 § <5 § <5 § <5 § <5 § <5 § <5 § <5 §
Lemon Grove <5 § <5 § <5 § <5 § <5 § <5 § <5 § <5 § <5 § <5 § <5 § <5 § <5 §
Mountain Empire <5 § <5 § <5 § <5 § <5 § <5 § <5 § <5 § <5 § <5 § <5 § <5 § <5 §
Santee 6 11.7 5 20.2 <5 § 6 15.8 <5 § <5 § <5 § <5 § <5 § <5 § <5 § <5 § <5 §
Spring Valley <5 § <5 § <5 § <5 § <5 § <5 § <5 § <5 § <5 § <5 § <5 § <5 § <5 §
North Central Region 81 13.4 60 19.6 21 7.0 67 18.4 <5 § 7 8.2 5 4.6 <5 § <5 § 11 10.7 15 7.8 37 25.9 18 25.0
Coastal 11 14.6 8 20.6 <5 § 9 14.8 <5 § <5 § <5 § <5 § <5 § <5 § <5 § 6 36.5 <5 §
Del Mar‐Mira Mesa 13 8.3 10 12.6 <5 § 10 13.2 <5 § <5 § <5 § <5 § <5 § <5 § <5 § <5 § <5 §
Elliott‐Navajo 10 11.2 6 13.9 <5 § 10 16.6 <5 § <5 § <5 § <5 § <5 § <5 § <5 § 6 26.7 <5 §
Kearny Mesa 35 23.1 25 33.2 10 13.2 27 32.0 <5 § 5 14.9 <5 § <5 § <5 § <5 § 6 12.1 17 47.7 9 47.2
Miramar <5 § <5 § <5 § <5 § <5 § <5 § <5 § <5 § <5 § <5 § <5 § <5 § <5 §
Peninsula 7 11.1 6 17.6 <5 § 7 14.6 <5 § <5 § <5 § <5 § <5 § <5 § <5 § <5 § <5 §
University 5 8.0 5 16.1 <5 § <5 § <5 § <5 § <5 § <5 § <5 § <5 § <5 § <5 § <5 §
North Coastal Region 55 10.9 45 17.5 10 4.0 40 13.4 <5 § 11 7.6 <5 § <5 § <5 § 10 11.9 11 8.1 23 18.4 11 18.5
Carlsbad 11 9.6 7 12.6 <5 § 10 11.9 <5 § <5 § <5 § <5 § <5 § <5 § <5 § 8 24.5 <5 §
Oceanside 19 11.9 17 21.4 <5 § 14 18.9 <5 § 5 8.3 <5 § <5 § <5 § <5 § <5 § 10 25.6 <5 §
Pendleton <5 § <5 § <5 § <5 § <5 § <5 § <5 § <5 § <5 § <5 § <5 § <5 § <5 §
San Dieguito 10 10.7 8 17.4 <5 § 9 12.3 <5 § <5 § <5 § <5 § <5 § <5 § <5 § <5 § <5 §
Vista 12 11.9 10 19.7 <5 § 5 11.4 <5 § <5 § <5 § <5 § <5 § <5 § <5 § <5 § <5 §
North Inland Region 73 12.8 56 20.0 17 5.9 59 18.7 <5 § 9 5.5 5 8.5 <5 § <5 § 5 6.5 17 11.5 36 23.6 15 20.8
Anza‐Borrego Springs <5 § <5 § <5 § <5 § <5 § <5 § <5 § <5 § <5 § <5 § <5 § <5 § <5 §
Escondido 20 12.3 17 21.0 <5 § 17 23.9 <5 § <5 § <5 § <5 § <5 § <5 § 7 15.5 9 23.4 <5 §
Fallbrook 8 16.9 7 29.7 <5 § 8 29.3 <5 § <5 § <5 § <5 § <5 § <5 § <5 § 7 53.1 <5 §
North San Diego 7 6.6 5 9.7 <5 § 5 8.0 <5 § <5 § <5 § <5 § <5 § <5 § <5 § <5 § <5 §
Palomar‐Julian <5 § <5 § <5 § <5 § <5 § <5 § <5 § <5 § <5 § <5 § <5 § <5 § <5 §
Pauma <5 § <5 § <5 § <5 § <5 § <5 § <5 § <5 § <5 § <5 § <5 § <5 § <5 §
Poway 18 20.9 13 30.8 5 11.3 15 25.9 <5 § <5 § <5 § <5 § <5 § <5 § <5 § 9 33.5 <5 §
Ramona <5 § <5 § <5 § <5 § <5 § <5 § <5 § <5 § <5 § <5 § <5 § <5 § <5 §
San Marcos 11 12.2 8 18.2 <5 § 6 13.2 <5 § <5 § <5 § <5 § <5 § <5 § <5 § 7 34.4 <5 §
Valley Center <5 § <5 § <5 § <5 § <5 § <5 § <5 § <5 § <5 § <5 § <5 § <5 § <5 §
South Region 30 6.4 23 9.8 7 3.0 12 12.2 <5 § 10 3.6 5 8.4 <5 § <5 § 8 9.9 9 6.8 8 7.5 <5 §
Chula Vista 9 7.8 6 10.8 <5 § <5 § <5 § <5 § <5 § <5 § <5 § <5 § <5 § <5 § <5 §
Coronado <5 § <5 § <5 § <5 § <5 § <5 § <5 § <5 § <5 § <5 § <5 § <5 § <5 §
National City <5 § <5 § <5 § <5 § <5 § <5 § <5 § <5 § <5 § <5 § <5 § <5 § <5 §
South Bay 12 8.9 9 13.2 <5 § 5 24.4 <5 § <5 § <5 § <5 § <5 § <5 § <5 § <5 § <5 §
Sweetwater 5 3.7 5 7.6 <5 § <5 § <5 § <5 § <5 § <5 § <5 § <5 § <5 § <5 § <5 §Unknown <5 ‐‐‐ <5 ‐‐‐ <5 ‐‐‐ <5 ‐‐‐ <5 ‐‐‐ <5 ‐‐‐ <5 ‐‐‐ <5 ‐‐‐ <5 ‐‐‐ <5 ‐‐‐ <5 ‐‐‐ <5 ‐‐‐ <5 ‐‐‐* Rates per 100,000 population. County age‐adjusted rates per 100,000 2000 US standard population.**Harbison Crest/El Cajon is an aggregation of the Harbison Crest and El Cajon SRAs. Due to geographic limitations, the Harbison Crest SRA is not shown alone. See the Data Guide for more information.
***Numbers may not add up to totals due to unknown or missing details.
†Suicide refers to (underlying cause of death) ICD‐10 codes U03, X60‐X84, Y87.0.
‡API includes Asian, Pacific Islander, Na ve Hawaiian. Other includes 2 or more races, Na ve American/Alaska Na ve, American Indian, or other.
§Rates not calculated for fewer than 5 events. Rates not calculated in cases where zip code is unknown.
Source: Death Statistical Master Files (CDPH), County of San Diego, Health & Human Services Agency, Public Health Services, Epidemiology & Immunization Services Branch; SANDAG, Current Population Estimates, 10/2012.
Prepared by: County of San Diego, Health & Human Services Agency, Public Health Services, Community Health Statistics Unit, 2013.
White Ages 45‐64Black Hispanic Other‡API‡ Ages 0‐14 Ages 15‐24 Ages 25‐44Geography2010 Total
Gender Race/Ethnicity Age Group
Male Ages 65+Female
Suicide† Among San Diego County Residents by Loca on of Residence, 2010 Detail
County of San Diego, Health & Human Services Agency, Public Health Services, Community Health Statisitcs Unit Page 136

No. Rate* No. Rate* No. Rate* No. Rate* No. Rate* No. Rate* No. Rate* No. Rate* No. Rate* No. Rate* No. Rate* No. Rate* No. Rate*
San Diego County (Actual Rate) 383 12.3 292 18.7 91 5.9 284 19.0 19 13.3 47 4.6 21 6.0 11 9.3 <5 § 41 8.2 104 11.7 167 21.7 69 19.1
San Diego County (Age‐Adjusted Rate) 383 11.9
Central Region 66 13.6 52 21.0 14 5.9 36 25.3 9 16.4 10 4.8 8 12.4 <5 § <5 § 13 16.2 25 15.4 24 22.1 <5 §
Central San Diego 26 15.7 22 24.3 <5 § 17 20.8 <5 § <5 § <5 § <5 § <5 § <5 § 8 11.4 11 28.4 <5 §
Mid‐City 21 12.9 16 19.7 5 6.1 16 35.0 <5 § <5 § <5 § <5 § <5 § <5 § 10 19.7 8 23.9 <5 §
Southeast San Diego 19 12.1 14 18.4 5 6.2 <5 § <5 § 7 8.8 5 15.6 <5 § <5 § 7 25.7 7 16.9 5 13.7 <5 §
East Region 73 15.6 51 22.2 22 9.3 61 21.9 <5 § 9 7.6 <5 § <5 § <5 § <5 § 23 19.0 32 24.9 14 23.9
Alpine 5 33.0 <5 § <5 § <5 § <5 § <5 § <5 § <5 § <5 § <5 § <5 § <5 § <5 §
El Cajon 13 10.4 10 16.3 <5 § 11 15.0 <5 § <5 § <5 § <5 § <5 § <5 § 8 24.2 <5 § <5 §
Harbison Crest/El Cajon** 23 16.4 17 24.7 6 8.4 19 22.3 <5 § <5 § <5 § <5 § <5 § <5 § 8 22.3 11 29.5 <5 §
Jamul <5 § <5 § <5 § <5 § <5 § <5 § <5 § <5 § <5 § <5 § <5 § <5 § <5 §
La Mesa 10 16.7 9 31.4 <5 § 9 24.1 <5 § <5 § <5 § <5 § <5 § <5 § 5 28.6 <5 § <5 §
Laguna‐Pine Valley <5 § <5 § <5 § <5 § <5 § <5 § <5 § <5 § <5 § <5 § <5 § <5 § <5 §
Lakeside 7 12.4 <5 § <5 § 7 17.1 <5 § <5 § <5 § <5 § <5 § <5 § <5 § <5 § <5 §
Lemon Grove 6 20.0 5 34.3 <5 § <5 § <5 § <5 § <5 § <5 § <5 § <5 § <5 § <5 § <5 §
Mountain Empire <5 § <5 § <5 § <5 § <5 § <5 § <5 § <5 § <5 § <5 § <5 § <5 § <5 §
Santee 10 19.3 7 28.0 <5 § 10 26.2 <5 § <5 § <5 § <5 § <5 § <5 § <5 § 6 40.0 <5 §
Spring Valley 8 9.8 5 12.6 <5 § 5 13.1 <5 § <5 § <5 § <5 § <5 § <5 § <5 § <5 § <5 §
North Central Region 70 11.5 54 17.5 16 5.3 58 15.9 <5 § <5 § <5 § <5 § <5 § <5 § 20 10.3 30 20.8 16 21.7
Coastal 13 17.2 11 28.2 <5 § 13 21.4 <5 § <5 § <5 § <5 § <5 § <5 § <5 § <5 § <5 §
Del Mar‐Mira Mesa 9 5.7 6 7.6 <5 § 5 6.6 <5 § <5 § <5 § <5 § <5 § <5 § <5 § <5 § <5 §
Elliott‐Navajo 15 16.8 11 25.4 <5 § 12 20.0 <5 § <5 § <5 § <5 § <5 § <5 § <5 § 7 31.0 <5 §
Kearny Mesa 25 16.5 21 27.8 <5 § 20 23.8 <5 § <5 § <5 § <5 § <5 § <5 § 6 11.8 12 33.2 5 25.8
Miramar <5 § <5 § <5 § <5 § <5 § <5 § <5 § <5 § <5 § <5 § <5 § <5 § <5 §
Peninsula 5 7.9 <5 § <5 § 5 10.5 <5 § <5 § <5 § <5 § <5 § <5 § <5 § <5 § <5 §
University <5 § <5 § <5 § <5 § <5 § <5 § <5 § <5 § <5 § <5 § <5 § <5 § <5 §
North Coastal Region 67 13.1 53 20.4 14 5.6 59 19.7 <5 § 6 4.1 <5 § <5 § <5 § 8 9.5 19 13.9 26 20.5 13 21.1
Carlsbad 16 13.8 12 21.3 <5 § 15 17.7 <5 § <5 § <5 § <5 § <5 § <5 § <5 § 7 21.1 5 27.1
Oceanside 24 15.0 18 22.7 6 7.4 21 28.5 <5 § <5 § <5 § <5 § <5 § <5 § 8 17.9 9 22.9 6 32.0
Pendleton 5 13.3 5 19.1 <5 § 5 21.7 <5 § <5 § <5 § <5 § <5 § <5 § <5 § <5 § <5 §
San Dieguito 8 8.4 6 12.9 <5 § 8 10.8 <5 § <5 § <5 § <5 § <5 § <5 § <5 § 5 16.8 <5 §
Vista 14 13.8 12 23.5 <5 § 10 22.9 <5 § <5 § <5 § <5 § <5 § <5 § 7 24.2 <5 § <5 §
North Inland Region 56 9.7 43 15.2 13 4.5 47 15.0 <5 § <5 § <5 § <5 § <5 § <5 § 7 4.8 32 20.7 14 18.8
Anza‐Borrego Springs <5 § <5 § <5 § <5 § <5 § <5 § <5 § <5 § <5 § <5 § <5 § <5 § <5 §
Escondido 16 9.7 12 14.7 <5 § 14 19.8 <5 § <5 § <5 § <5 § <5 § <5 § <5 § 9 23.0 <5 §
Fallbrook 9 18.8 5 21.0 <5 § 8 29.4 <5 § <5 § <5 § <5 § <5 § <5 § <5 § 5 38.1 <5 §
North San Diego 11 10.2 9 17.3 <5 § 7 11.1 <5 § <5 § <5 § <5 § <5 § <5 § <5 § 7 23.7 <5 §
Palomar‐Julian <5 § <5 § <5 § <5 § <5 § <5 § <5 § <5 § <5 § <5 § <5 § <5 § <5 §
Pauma <5 § <5 § <5 § <5 § <5 § <5 § <5 § <5 § <5 § <5 § <5 § <5 § <5 §
Poway 6 6.9 5 11.8 <5 § 6 10.4 <5 § <5 § <5 § <5 § <5 § <5 § <5 § 5 18.3 <5 §
Ramona <5 § <5 § <5 § <5 § <5 § <5 § <5 § <5 § <5 § <5 § <5 § <5 § <5 §
San Marcos 5 5.5 5 11.3 <5 § <5 § <5 § <5 § <5 § <5 § <5 § <5 § <5 § <5 § <5 §
Valley Center <5 § <5 § <5 § <5 § <5 § <5 § <5 § <5 § <5 § <5 § <5 § <5 § <5 §
South Region 51 10.9 39 16.7 12 5.1 23 23.9 <5 § 16 5.7 7 11.7 <5 § <5 § 9 11.1 10 7.7 23 21.3 8 16.2
Chula Vista 14 12.1 10 17.9 <5 § 6 28.7 <5 § 7 8.5 <5 § <5 § <5 § <5 § <5 § 7 26.0 <5 §
Coronado <5 § <5 § <5 § <5 § <5 § <5 § <5 § <5 § <5 § <5 § <5 § <5 § <5 §
National City 7 12.0 <5 § <5 § <5 § <5 § <5 § <5 § <5 § <5 § <5 § <5 § <5 § <5 §
South Bay 14 10.4 12 17.6 <5 § 8 39.8 <5 § <5 § <5 § <5 § <5 § <5 § <5 § 6 19.4 <5 §
Sweetwater 12 8.8 10 15.0 <5 § <5 § <5 § <5 § <5 § <5 § <5 § <5 § <5 § 6 18.2 <5 §
Unknown <5 ‐‐‐ <5 ‐‐‐ <5 ‐‐‐ <5 ‐‐‐ <5 ‐‐‐ <5 ‐‐‐ <5 ‐‐‐ <5 ‐‐‐ <5 ‐‐‐ <5 ‐‐‐ <5 ‐‐‐ <5 ‐‐‐ <5 ‐‐‐* Rates per 100,000 population. County age‐adjusted rates per 100,000 2000 US standard population.
**Harbison Crest/El Cajon is an aggregation of the Harbison Crest and El Cajon SRAs. Due to geographic limitations, the Harbison Crest SRA is not shown alone. See the Data Guide for more information.
***Numbers may not add up to totals due to unknown or missing details.
†Suicide refers to (underlying cause of death) ICD‐10 codes U03, X60‐X84, Y87.0.
‡API includes Asian, Pacific Islander, Na ve Hawaiian. Other includes 2 or more races, Na ve American/Alaska Na ve, American Indian, or other.
§Rates not calculated for fewer than 5 events. Rates not calculated in cases where zip code is unknown.
Source: Death Statistical Master Files (CDPH), County of San Diego, Health & Human Services Agency, Public Health Services, Epidemiology & Immunization Services Branch; SANDAG, Current Population Estimates, 10/2012.
Prepared by: County of San Diego, Health & Human Services Agency, Public Health Services, Community Health Statistics Unit, 2013.
Other‡ Ages 0‐14 Ages 15‐24 Ages 25‐44 Ages 45‐64 Ages 65+
Suicide† Among San Diego County Residents by Loca on of Residence, 2011 Detail
Geography2011 Total
Gender Race/Ethnicity Age Group
Male Female White Black Hispanic API‡
County of San Diego, Health & Human Services Agency, Public Health Services, Community Health Statisitcs Unit Page 137
DATA GUIDE
County of San Diego, Health & Human Services Agency, Public Health Services, Community Health Statisitcs Unit Page 138

Important Information for Data Users
Important Information for Data Users Please Review This Section before Using the Following Public Health Data
For abbreviations used in data sources, see Data Sources.
Diagnoses: Disease definitions for most indicators are based on ICD‐CM coding. Two versions of ICD coding are used in this document depending upon the data source, ICD‐9 or ICD‐10. ICD‐CM based data for San Diego is comparable whether obtained using the 9th or 10th revision; codes used are listed in footnotes for appropriate tables. Healthy People 2020, USA, California data are shown if available and comparable to local data. The death data used in this document only include underlying cause of death. That means that deaths are categorized only by the disease or injury that initiated the chain of events leading to death and not by the immediate cause or any other contributing causes. For example, a diabetic who died of heart disease resulting from complications of diabetes would only be included among diabetes‐related deaths. Similarly, Hospital Discharge and Emergency Department Discharge data is reported by the primary diagnosis at time of discharge for which the medical encounter occurred. In some cases, indicators are based on case definitions; meeting specified clinical and/or laboratory criteria not ICD‐CM coding.
Comparing Data: Caution must be used when exploring data from multiple sources or even the same data prepared by different analysts; comparisons may not be appropriate. Attention to accompanying information is important in order to note differences, including, but not limited to: data sources, data preparation, diagnoses/case definitions, rate constant (i.e. per 100,000 or 1,000), geographic units, persons included in the data (i.e. location of occurrence vs. location of residence, or among live births not total pregnancies). Data from different tables must not be modified (i.e. aggregated or subtracted). For example, pedestrian deaths cannot be added to nonfatal pedestrian injuries to determine total injuries. In this case, one database is recorded by location of residence, while the other is by location of occurrence. If you need assistance or additional data not contained here, please contact the Community Health Statistics unit. Geography: Understanding Geographic Units used in Health Data Many different geographic units are used throughout San Diego County. In this document, boundaries for Regions and Subregional Areas (SRAs) used here are based on census tracts and approximate Health and Human Service Agency Region (HHSA Region)
County of San Diego, Health & Human Services Agency, Public Health Services, Community Health Statisitcs Unit Page 139
Important Information for Data Users
boundaries which are based on zip codes. The exception to this is California Health Interview Survey (CHIS) data, which use zip code based HHSA Regions. Many data users have expressed the desire for community level data, beyond the HHSA Region (which are large aggregations of zip codes). Several levels of geography may be considered, such as Subregional Area, Census Tract, Zip Code, or City. In order to provide community level health data and compare populations, it is important to have stable geographic units and units that are compatible with population data estimates. While most health data is reported by zip code, zip codes may change at any time throughout the year – making annual aggregated estimates difficult. Additionally, since zip codes may change from one year to the next, comparing zip code data over time may introduce a level of imprecision. Subregional Areas (SRAs) are small, community level geographic units based on census tracts which are stable between census years (i.e. change only every 10 years, if at all). Population estimates are available at this level with high level of accuracy. However, health data for an SRA must be estimated based on reported zip code data. Types of data available for Geographic Boundaries
Zip Codes: Census Tracts:
HHSA Region Subregional Area (SRA)
Health Services Major Statistical Area (MSA)
Region (approximated HHSA Region)
In this document, community level (SRA) data is aggregated to larger regional levels. Currently, Region aggregations based on SRAs closely approximate, but do not directly correspond to HHSA Regions. In order to have more accurate community level data and enable reliable comparisons over time and place, SRA Region aggregations are used in lieu of HHSA Regions. A list of Subregional Areas (SRAs) representing each Region, as well as to zip code, is included at the end of this section. Other data preparers that provide direct HHSA Region level data may differ slightly from the data presented here; however, any difference would not be expected to impact any decisions related to policy, planning, or resources for any particular area. There are 3 zip codes which are primarily affected by the differences in method of aggregation to Region or HHSA Region (see table below). Again, the only data in this document to which the above information does not apply is the CHIS (California Health Interview Survey) data in the Public Health Data Section. Data in this survey is collected by HHSA Region and cannot be estimated for SRA based Regions.
County of San Diego, Health & Human Services Agency, Public Health Services, Community Health Statisitcs Unit Page 140

Important Information for Data Users
Methods of Aggregating Data
HHSA Community Profiles
HHSA REGION Zip Code Subregional Area (SRA) Region
North Coastal 92014 Del Mar‐Mira Mesa North Central
North Coastal 92091 North San Diego North Inland
North Central 92131 Poway North Inland
Harbison Crest/El Cajon Due to data aggregation methods, health data for the Harbison Crest SRA may be misleading. Health data are presented as an aggregate of the two SRAs, Harbison Crest/El Cajon for better data stability and representation of the area. Rates, Age Adjusted Rates: Understanding Rates and Age Adjusted Rates The public health data in the Community Profiles includes crude rates (from this point forward referred to as rates) for Regional and Subregional (SRA) level data. Additionally, age adjusted rates are provided for County level data in many cases. For comparison, Healthy People 2020 Targets are included, along with comparable USA and California rates. Many Healthy People 2020 Targets are based on age adjusted rates; these are indicated by “age adjusted population”. When a Healthy People target listed is based on an age adjusted rate, the comparable rates for USA and California are also age adjusted. A rate is the number of cases divided by the population, usually multiplied by a constant. For example 987 cases, divided by population of 654,321 multiplied by 100,000 would be a rate of 150.8 per 100,000 population. This means for every 100,000 people, 150‐151 cases would be expected. Calculations of age adjusted rates are slightly more complex. They take into account the age of each case relative to a standard age distribution of a reference population. Recently a new reference population was determined referred to as “2000 US standard population”, previously used was a reference population from 1940. The 2000 US standard population proportions more closely reflect the current age distribution of the entire US population. Age adjusted rates represent the rates that would be expected if a population of interest had the same age distribution as the standard population. This removes the effect of age when comparing rates to identify risk in a population. This is important in many cases when comparing risk “across populations with different underlying age structures.”1
County of San Diego, Health & Human Services Agency, Public Health Services, Community Health Statisitcs Unit Page 141

Important Information for Data Users
Since many causes of mortality disproportionately affect older persons, disease mortality is often reported as age adjusted rates. This is the case with many Healthy People 2010 Targets, particularly death rates. Age adjusted rates are used to compare relative risk (over time or between populations), while removing the effect of differences in the age of a population. Age‐adjusting shows differences between groups that are not due to differences in age distribution. “Age adjusted rates should be viewed as relative indexes rather than as direct or actual measures” of risk.2 For many users of this data the magnitude of an issue is important, not only the risk outside of age. Often planning and resource needs are based on data. In this case, knowing that a group contains an older population is valid and important for planning for those diseases which affect different aged population sectors. Additionally, differences may be due to other reasons besides age, such as gender or race/ethnicity. One may want to consider several of these demographic factors when examining a health issue. Each Profile contains demographic data for each Region and SRA, including: age, gender, race/ethnicity distributions, income, occupation, housing, and education data. Many of these factors have been implicated at the roots of health disparities. 1: http://wonder.cdc.gov/wonder/help/ucd.html 2: http://wonder.cdc.gov/wonder/help/faq.html#6
County of San Diego, Health & Human Services Agency, Public Health Services, Community Health Statisitcs Unit Page 142

Region Subregional Area (SRA) Enclosing Zip Code(s)*
Central
Central San Diego 92101, 92102, 92103, 92104, 92134, 92136
Mid City 92105, 92115, 92116, 92182
Southeastern San Diego 92113, 92114, 92139
East
Alpine 91901
El Cajon 92019, 92020
Harbison Crest/El Cajon** 92019, 92020, 92021
Jamul 91917, 91935, 91978
La Mesa 91941, 91942
Laguna‐Pine Valley 91916, 91931, 91948
Lakeside 92040
Lemon Grove 91945
Mountain Empire 91905, 91906, 91934, 91962, 91963, 91980
Santee 92071
Spring Valley 91977
North Central
Coastal 92037, 92093, 92109
Del Mar‐Mira Mesa 92014, 92126, 92130
Elliott‐Navajo 92119, 92120, 92124
Kearny Mesa 92108, 92110, 92111, 92117, 92123
Miramar 92145
Peninsula 92106, 92107, 92140, 92147
University 92121, 92122, 92161
North Coastal
Carlsbad 92008, 92009, 92010, 92011
Oceanside 92054, 92056, 92057, 92058
Pendleton 92055, 92672
San Dieguito 92007, 92024, 92067, 92075
Vista 92081, 92083, 92084
North Inland
Anza‐Borrego Springs 92004, 92036, 92259
Escondido 92025, 92026, 92027, 92096
Fallbrook 92003, 92028
North San Diego 92091, 92127, 92128, 92129
Palomar‐Julian 92066, 92070, 92086, 92536
Pauma 92059, 92061
Poway 92064, 92131
Ramona 92065
San Marcos 92069, 92078
Valley Center 92082
South
Chula Vista 91910, 91911
Coronado 92118, 92135, 92155
National City 91950
South Bay 91932, 92154, 92173
Sweetwater 91913, 91914, 91915 *Zip code(s) to Subregional Areas are defined by the San Diego Association of Governments (SANDAG) and are subject to change at any moment and include enclosing zip codes only. This list is valid for data years 2010 and 2011.
**Harbison Crest/El Cajon is an aggregation of the Harbison Crest and El Cajon SRAs. Due to geographical limitations, Harbison Crest is not shown alone. See data guide for more information.
Source: San Diego Association of Governments (SANDAG), Zip Code to SRA Crosswalk, October 2012.
County of San Diego, Health & Human Services Agency, Public Health Services, Community Health Statisitcs Unit Page 143

Data Sources
Data Sources Health and demographic data are available from a variety of sources, represented by three different categories of data. Population data, such as the census, are collected from the entire population. Sample or survey data are collected from a portion of the population and extrapolated to represent the entire population. Administrative data are collected based on an organization’s day‐to‐day operations, such as the prehospital database. The following data sources were used in the preparation of this report. American Community Survey (ACS): ACS is a new nationwide survey designed to provide communities a fresh look at how they are changing. It is intended to eliminate the need for the long form in the 2010 Census. The ACS collects information from U.S. households similar to what was collected on the Census 2000 long form, such as income, commute time to work, home value, veteran status, and other important data. Information is available by county. Emergency Department Data (ED Data): ED data is collected and maintained for most emergency hospitals in San Diego County. ED data elements include patient’s home zip code, demographic information, source of payment, disposition, diagnoses, and procedures performed for all patients treated and discharged from the ED. HIV/AIDS Reporting System (HARS): HARS is used to report HIV and AIDS cases in San Diego County. HIV reporting began recently (July 2002), has not been evaluated, and therefore is not available for zip code level analysis. The number of AIDS cases is available by zip code if the total is 5 or more. Hospital Discharge Data: Discharge data is collected and maintained for most inpatient facilities in San Diego County. Discharge data elements include patient’s home zip code, demographic information, source of payment, disposition, diagnoses, and procedures performed for all patients admitted to the hospital for any condition. Medical Examiner’s Data: The County of San Diego’s Emergency Medical Services (EMS) receives an Investigative Summary and Autopsy for every individual who dies in San Diego County from a traumatic injury. Medical Examiner’s Records contain injury related information, including date and time of injury, incident location, patient home zip code, external cause of injury (ICD‐9 CM Ecode), age, sex, race/ethnicity, vehicle make and type, law enforcement agency and report number, mechanism of injury, and detailed narrative of injuries sustained. Prehospital Database: The County of San Diego’s Emergency Medical Services (EMS) receives a prehospital patient record (PPR) for every patient seen by a paramedic or emergency medical technician from 911 calls. The PPR contains information including
County of San Diego, Health & Human Services Agency, Public Health Services, Community Health Statisitcs Unit Page 144

Data Sources
demographics, incident zip code location, chief complaint, patient status, injury event information, restraint use, contributing factors, times and outcomes. At this time, only those calls in which a paramedic or EMT made contact with a Mobile Intensive Care Nurse (MICN) at a base hospital are included in this data.
San Diego Association of Governments (SANDAG): SANDAG creates and maintains a tremendous quantity of demographic, economic, land use, transportation, and criminal justice information about the San Diego region. Demographic data includes population characteristics like age, education, and employment. SANDAG develops annual demographic estimates and long range forecasts in addition to maintaining census data files. Data is available by County, SRA, zip code, and census tract.
STD Morbidity Surveillance Data: Data is available for three STDs: chlamydia, gonorrhea and syphilis (primary and secondary). Information on age, gender, and race/ethnicity are available for all 3 diseases. Data is also available at the zip code level, although this data is incomplete. Statewide Integrated Traffic Record System (SWITRS): SWITRS is traffic collision data collected by the California Highway Patrol. Collisions with personal injury on public roads are included. Detailed information on the circumstances of the crash, drivers, passengers, and other victims are available by incident zip code. Trauma Registry: EMS receives a Trauma Registry for every trauma patient admitted to any of the designated trauma center hospitals who meets one or more of the following criteria: length of hospitalization of 24 hours or more, death due to traumatic injuries, or transfer to or from another acute care hospital. Vital Records Data: A birth certificate is required for every live birth in San Diego County; a death certificate is completed for every person who dies in San Diego County. Vital records data includes information on birth (e.g. weight) or death (e.g. underlying and contributing causes of death) and basic demographic information by zip code. Additional abbreviations used in sources: CDPH – State of California, Department of Public Health CDC – Centers for Disease Control and Prevention CHIP – Community Health Improvement Partners HASD & IC – Hospital Association of San Diego & Imperial Counties NCHS – National Center for Health Statistics NVSS – National Vital Statistics System OSHPD – California Office of Statewide Health Planning and Development
County of San Diego, Health & Human Services Agency, Public Health Services, Community Health Statisitcs Unit Page 145

Glossary
Glossary of Health Indicator Terms The following are definitions of health indicator terms for population and service data used in this document, including which databases data comes from (noted in italics). For more information, see Data Sources. Disease data here represent only principal diagnoses (or underlying cause of death) and do not include secondary diagnoses. Injury data using ICD‐10 coding (death) only uses underlying cause of death; injury data using Ecodes from Emergency Department and Hospital discharges include only primary Ecode (mechanism of injury). The majority of the data here are reported by location of residence of the subject. Non‐fatal motor vehicle injury data from SWITRS is reported by location of occurrence; while motor vehicle death data (from Death Statistical Master Files) is reported by location of residence.
Population and Service Data Definitions by Profile: Non‐Communicable (Chronic) Disease Profile Arthritis: ICD‐9 codes 95.6, 95.7, 98.5, 99.3, 136.1, 274, 277.2, 287.0, 344.6, 353.0, 354.0, 355.5, 357.1, 390, 391, 437.4, 443.0, 446, 447.6, 696.0, 710‐716, 719.0, 719.2‐719.9, 720‐721, 725‐727, 728.0‐ 728.3, 728.6‐728.9, 729.0‐729.1, and 729.4. Hospital, Emergency Department. Asthma: ICD‐9 code 493; ICD‐10 codes J45‐J46. Death, Hospital, Emergency Department. Cervical Cancer: ICD‐10 code C53. Death. Colorectal Cancer: cancer of the colon, rectum or anus, ICD‐10 codes C18‐C21. Death. Chronic Obstructive Pulmonary Disease (COPD): ICD‐9 codes 490‐492, 496; ICD‐10 codes J40‐J44. Death, Hospital, Emergency Department. Coronary Heart Disease: ischemic and hypertensive heart disease, ICD‐9 codes 402, 410‐414, 429.2; ICD‐10 codes I11, I20‐I25. Death, Hospital, Emergency Department. Cardiac Provider Impressions: cardiac chest pain, congestive heart failure, palpitations and STEMI (st‐elevation myocardial infarction). Prehospital (911).
County of San Diego, Health & Human Services Agency, Public Health Services, Community Health Statisitcs Unit Page 146

Glossary
Diabetes: diabetes mellitus, includes insulin‐dependent and non‐insulin dependent diabetes, ICD‐9 code 250; ICD‐10 codes E10‐E14. Death, Hospital, Emergency Department. Diabetes Provider Impressions: hypoglycemia. Prehospital (911). Dorsopathy: ICD‐9 codes 720‐724. Hospital, Emergency Department. Female Breast Cancer: ICD‐10 code C50. Death. Lung Cancer: cancer of the trachea, bronchus or lung, ICD‐10 codes C33‐C34. Death. Overall Cancer: ICD‐10 codes C00‐C97. Death. Parkinson’s Disease: ICD‐9 codes 332.0 – 332.9. Hospital, Emergency Department. Prostate Cancer: ICD‐10 code C61. Death. Respiratory‐Related Provider Impressions: asthma, chronic obstructive pulmonary disease (COPD) and respiratory distress. Prehospital (911). Stroke: cerebrovascular disease, ICD‐9 codes 430‐438; ICD‐10 codes I60‐I69. Death, Hospital, Emergency Department. Stroke Provider Impressions: cerebrovascular accident (CVA), CVA onset within 2 hours, or CVA onset within 3 hours. Prehospital (911). Communicable Disease AIDS Incidence: new cases reported by providers* to County Public Health Services, cases need not be investigated and confirmed, see CDC clinical case definition. HIV/AIDS Reporting System. Chlamydia Incidence: new cases reported by providers* to County Public Health Services, cases need not be investigated and confirmed, see CDC clinical case definition. For estimated Chlamydia (Regional Tables), cases with unknown residence are statistically distributed to Regions to better estimate Regional needs. SRA Tables do not include a substantial number of cases reported in San Diego County, due to cases with unknown residence. Approximately 30%, or 2500 Chlamydia cases per year, are missing residence data. Chlamydia numbers are underestimated at the SRA level. STD Reporting. Chronic Hepatitis C: cases reported by providers* to County Public Health Services, see CDC clinical case definition. Hepatitis Reporting.
County of San Diego, Health & Human Services Agency, Public Health Services, Community Health Statisitcs Unit Page 147

Glossary
Gonorrhea Incidence: new cases reported by providers* to County Public Health Services, cases need not be investigated and confirmed, see CDC clinical case definition. For estimated Gonorrhea, cases with unknown residence are statistically distributed to Regions to better estimate Regional needs. SRA Tables do not include a substantial number of cases reported in San Diego County, due to cases with unknown residence. Approximately 30%, or 600 gonorrhea cases per year, are missing residence data. Gonorrhea numbers are underestimated at the SRA level. STD Reporting. HIV Incidence: new cases reported by providers* to County Public Health Services, cases need not be investigated and confirmed, see CDC clinical case definition. HIV/AIDS Reporting System. Influenza: ICD‐9 codes 487‐488; ICD‐10 codes J10‐J11. Death, Hospital, Emergency Department. Pneumonia: ICD‐9 codes 480‐486; ICD‐10 codes J12‐J18. Death, Hospital, Emergency Department. Primary and Secondary Syphilis: new cases reported to and confirmed by County Public Health Services, see CDC clinical case definition. STD Reporting. Tuberculosis (TB) Incidence: new active cases reported to and confirmed by County Public Health Services, see CDC clinical case definition. TB Registry. Injury Active Restraint Use: those injured in motor vehicle crashes occurring on public roads where active restraints were used. Rates are calculated amongst those whose status of restraint use/non‐use was known. Data applies to those ages 6 years and older. Data is by location of occurrence. SWITRS. Alcohol‐involved Motor Vehicle Crashed: those injured in motor vehicle crashes occurring on public roads where alcohol was involved. The drinking driver need not be injured and need not be declared at fault, nor tested for being under the influence of alcohol. Data is by location of occurrence. SWITRS. Assault Injury: injuries that are intentionally inflicted by another, ICD‐9 codes E960‐E969. Hospital, Emergency Department. Child Restraint Use: those injured in motor vehicle crashes occurring on public roads where child restraints were used. Rates are calculated amongst those whose status of
County of San Diego, Health & Human Services Agency, Public Health Services, Community Health Statisitcs Unit Page 148

Glossary
restraint use/non‐use was known. Data applies to those ages 0‐5 years. Data is by location of occurrence. SWITRS. Dental‐related: injury as well as non‐injury medical/dental primary diagnoses, ICD‐9 codes 521‐523, 525.3, 525.9, 873.63, 873.73. Emergency Department. Drinking Drivers Motor Vehicle Crashes: drivers noted as drinking, involved in motor vehicle crashes occurring on public roads with injury to any party. The drinking drivers need not be injured and need not be determined to be at fault nor impaired. Data is by location of occurrence. SWITRS. Drowning: Accidental drowning and submersion, including those caused by accident to watercraft or related to water‐transport, ICD‐10 codes W65‐W74, V90, V92. Death. Exposure to smoke, fire or flame: ICD‐10 codes X00‐X09. Death. Fall‐related: accidental falls, ICD‐9 Ecodes E880‐E886, E888; ICD‐10 codes W00‐W19. Death, Hospital, Emergency Department. Firearm‐related: all intents, ICD‐9 Ecodes E922, E955.0‐E955.4, E965.0‐E965.4, E970, E985.0‐E985.4; ICD‐10 codes W32‐W34, X72‐X74, U01.4, X93‐X95, Y22‐Y24, Y35.0. Death, Hospital, Emergency Department. Hip Fractures: ICD‐9 code 820; ICD‐10 code S72. Death, Hospital, Emergency Department. Homicide: deaths that are intentionally inflicted by another, ICD‐10 codes U01‐U02, X85‐Y09, Y87.1. Death. Motor Vehicle Injury: unintentional injury of anyone involved in a motor vehicle crash (collision or non‐collision) on a public road, including occupants, pedestrians, and cyclists, ICD‐9 Ecodes E810‐819; ICD‐10 codes V30‐V39 (.4‐.9), V40‐V49 (.4‐.9), V50‐V59 (.4‐.9), V60‐V69 (.4‐.9), V70‐V79 (.4‐.9), V81.1, V82.1, V83‐V86 (.0‐.3), V20‐V28 (.3‐.9), V29 (.4‐.9), V12‐V14 (.3‐.9), V19 (.4‐.6), V02‐V04 (.1, .9), V09.2, V80 (.3‐.5), V87 (.0‐.8), V89.2. Death, Hospital. Overdose/Poisoning: all intents, ICD‐9 Ecodes E850‐E869, E950‐E952, E962, E972, E980‐E982; ICD‐10 codes X40‐X49, X60‐X69, X85‐X90, Y10‐Y19, Y35.2, Y40‐59, Y60‐69, U01.6‐U01.7. Death, Hospital, Emergency Department. Pedalcycle Injury: unintentional injury of persons using pedal‐driven vehicles involved in motor vehicle crashes on public roads. SWITRS. Pedestrian Injury attributed to Motor Vehicle Accidents: unintentional injury of pedestrians involved in motor vehicle crashes on a public road, ICD‐9 codes E810‐
County of San Diego, Health & Human Services Agency, Public Health Services, Community Health Statisitcs Unit Page 149

Glossary
819(.7); ICD‐10 codes V02‐V04 (.1, .9), V09.2. Death, Hospital, Emergency Department, SWITRS. Self‐inflicted Injury: injuries that are intentionally inflicted by self, ICD‐9 Ecodes E950‐E959. Hospital, Emergency Department. Suicide: deaths that are intentionally inflicted by self, ICD‐10 codes U03, X60‐X84, Y87.0. Death. Total Motor Vehicle Accident Injuries: those injured in motor vehicle crashes occurring on public roads; injured may be cyclists, pedestrians or occupants of motor vehicles (such as cars, trucks, or buses). Data here is based on injuries involving a motor vehicle in transport (in motion or readiness for motion) and is not defined by ICD codes of collision or non‐collision. Data is by location of occurrence. SWITRS. Unintentional Injury: ICD‐9 Ecodes E800‐E869, E880‐E929; ICD‐10 codes V01‐X59, Y85‐Y86. This generalized unintentional injury may overlap with specific indicators below, such as drowning, smoke/fire, suffocation, falls, motor vehicle or pedestrian deaths, as well as the unintentional portion of overdose/poisoning and firearm injuries. Death, Hospital, Emergency Department. Unintentional Suffocation: ICD‐10 codes W75‐W84. Death. Maternal & Child Health Early Prenatal Care: care beginning during the 1st trimester of pregnancy. Rates (%) are calculated amongst those births whose start time of prenatal care is known (i.e. those whose start time of care is unknown or missing are excluded from the denominator). MCFHS. Fetal mortality: number of deaths of fetuses at least 20 complete weeks gestation per 1,000 live births and fetal deaths. MCFHS. Infant mortality: number of deaths of infants under one year of age per 1,000 live births. MCFHS. Live Birth: a product of conception, which after complete expulsion or extraction from the mother, breathes or shows any other evidence of life. This is not synonymous with the term “pregnancy”, which can result in a miscarriage, fetal death, induced abortion or live birth. MCFHS. Low birth weight: birth weight less than 2,500 g (approximately 5lbs, 8oz). MCFHS.
County of San Diego, Health & Human Services Agency, Public Health Services, Community Health Statisitcs Unit Page 150

Glossary
Maternal Complications: ICD‐9 codes 641, 642.0‐642.7, 642.9, 643.2, 646.2, 646.6, 646.7, 648.0, 648.5, 648.6, 648.8, 658.4, 659.2, 659.3, 664.2, 664.3, 664.5, 665.0‐665.9, 666, 668, 669.0‐669.4, 670, 671.3‐671.5, 672, 673, 674.0‐674.3, 674.50‐674.54, 674.8‐674.9. Hospital, Emergency Department. Preterm birth: birth prior to 37 completed weeks of gestation. MCFHS. Sudden Infant Death Syndrome: the sudden death of an infant less than 1 year of age that cannot be explained after a thorough investigation is conducted, including a complete autopsy, examination of the death scene, and a review of the clinical history. Death. Very low birth weight: birth weight less than 1,500 g (approximately 3lbs, 5oz). MCFHS. Behavioral Health Acute Alcohol‐Related Disorders: ICD‐9 codes 291, 305.0, 980.0. Emergency Department. Acute Substance‐Related Disorders: ICD‐9 codes 292, 305.2‐305.9. Hospital, Emergency Department. Alzheimer’s Disease: ICD‐9 code 331; ICD‐10 code G30. Death, Hospital, Emergency Department. Anxiety Disorders: ICD‐9 codes 293.84, 300, 308, 309.81, 313.00‐313.22, 313.3, 313.83‐313.84. Hospital, Emergency Department. Attention‐Deficit, Conduct, and Disruptive Behavior: ICD‐9 codes 312.00‐312.23, 312.4, 312.8,312.9, 313.81, 314. Hospital, Emergency Department. Chronic Alcohol‐Related Disorders: ICD‐9 code 303. Hospital, Emergency Department. Chronic Substance‐Related Disorders: ICD‐9 code 304. Hospital, Emergency Department. Dementia: ICD‐9 code 290; ICD‐10 codes F10, F03. Death, Hospital, Emergency Department. Developmental Disorders: ICD‐9 codes 307.0, 307.9, 315, 317‐319, V40.0‐V41.0. Hospital, Emergency Department.
County of San Diego, Health & Human Services Agency, Public Health Services, Community Health Statisitcs Unit Page 151

Glossary
Disorders Usually Diagnosed in Infancy, Childhood, or Adolescence: ICD‐9 codes 299, 307.2, 307.3, 307.6, 307.7, 309.21, 313.23, 313.89, 313.9. Hospital, Emergency Department. Impulse Control Disorder: ICD‐9 code 312.3. Hospital, Emergency Department. Mood Disorders: ICD‐9 codes 293.83, 296, 300.4, 311. Hospital, Emergency Department. Overdose/Poisoning: all intents, ICD‐9 Ecodes E850‐E869, E950‐E952, E962; ICD‐10 codes X40‐X49, X60‐X69, X85‐X90, Y10‐Y19, Y35.2, Y40‐59, Y60‐69, U01.6‐U01.7. Death, Hospital, Emergency Department. Personality Disorders: ICD‐9 code 301. Hospital, Emergency Department. Schizophrenia and Other Psychotic Disorders: ICD‐9 codes 293.81, 293.82, 295, 297, 298. Hospital, Emergency Department. Self‐inflicted Injury: injuries that are intentionally inflicted by self, ICD‐9 Ecodes E950‐E959. Hospital, Emergency Department. Suicide: deaths that are intentionally inflicted by self, ICD‐10 codes U03, X60‐X84, Y87.0. Death. * Providers may refer to health care providers (e.g. physicians, nurses, or hospital administrators), laboratories, or school administrators who are legally mandated to report diseases indicated in CCR, Title 17, sections 2500, 2508, and 2505.
County of San Diego, Health & Human Services Agency, Public Health Services, Community Health Statisitcs Unit Page 152

For more information, contact the Community Health Statistics Unit:
Alicia Sampson, Epidemiologist
Leslie Upledger Ray, Senior Epidemiologist Community Health Statistics Located at Emergency Medical Services
6255 Mission Gorge Road, San Diego, CA 92120 [email protected]
www.SDHealthStatistics.com
County of San Diego, Health & Human Services Agency, Public Health Services, Community Health Statisitcs Unit Page 153
Related Documents