SAN BENITO COUNTY WORKFORCE INVESTMENT BOARD FIVE YEAR STRATEGIC PLAN SAN BENITO WORKFORCE INVESTMENT BOARD 1111 San Felipe Road, Suite 107 Hollister, CA 95023 831‐637‐5627

Welcome message from author
This document is posted to help you gain knowledge. Please leave a comment to let me know what you think about it! Share it to your friends and learn new things together.
Transcript

SAN BENITO COUNTY WORKFORCE INVESTMENT BOARD FIVE YEAR STRATEGIC PLAN
SAN BENITO WORKFORCE INVESTMENT BOARD
1111 San Felipe Road, Suite 107 Hollister, CA 95023 831‐637‐5627

2
Table of Contents
SECTIONI:VISION.....................................................................................................................3
SECTIONII:ECONOMICANDWORKFORCEINFORMATIONANALYSIS...................5
SECTIONIII:BUSINESSSERVICEPLAN............................................................................20
SECTIONIV:ADULTSTRATEGIES.....................................................................................26
SECTIONV:YOUTHSTRATEGIES......................................................................................33
SECTIONVI:ADMINISTRATION........................................................................................36
SECTIONVII:MEMORANDAOFUNDERSTANDING.....................................................41
SECTIONVIII:LOCALWIACOMMONMEASURESPERFORMANCEGOALS...........43

3
SECTION I: VISION BusinessandIndustryGoal:Meettheneedsofhighdemandsectorsoftheregionaleconomy.Describethevisionforbringingtogetherkeystakeholdersinworkforcedevelopment,includingbusinessandindustryemployers,organizedlabor,economicdevelopmentspecialistsandeducationexpertstoidentifytheworkforcechallengesfacingthelocalarea,andalsodevelopinnovativestrategiesandsolutionsthateffectivelyleverageresourcestoaddressregionalworkforcechallenges.SanBenitoCountyislocatedintheCoastRangeMountainsofthestate,andisapproximately40mileseastofMonterey,CAand50milessoutheastofSanJose,CA.ItconsistsofthetwoincorporatedcitiesofHollisterandSanJuanBautista,thefourunincorporatedtownsofAromas,Bitterwater,Dunneville,NewIdria,Paicines,Panoche,TresPinos,andthepopulatedareaknownasLlanada.The2010Censuslistedthecounty’spopulationat55,269makingitthe16thsmallestofCalifornia’s58counties,andwith1,390squaremilesitis24thingeographicalsize.Nearlytwo‐thirdsofthecounty’spopulationlivesinthecountyseatofHollister.TheWorkforceInvestmentBoardofSanBenitoCounty(SBWIB)isanestedboardwhollyincorporatedintothecountygovernmentalstructure.TheWIBispartoftheCommunityServicesandWorkforceDevelopmentDepartmentofthecounty,whichrunsoneOne‐StopCareerCenterlocatedinHollister.TheSBWIBisthesmallestWIBinthestateintermsofWorkforceInvestmentAct(WIA)monetaryallocation,receivingjustover$673,000inProgramYear2012‐13.1TheSBWIBcurrentlyhasrepresentativesfromtherequiredprivatesector,publicsector,educationcommunity,economicdevelopmentorganizations,andorganizedlabor.TheSBWIBmeetsquarterlyataminimumwiththeExecutiveCommitteeempoweredtotakeactiononbehalfoftheentireWIBoutsideofsettingpolicy.SBWIB’smissionistoprovideavarietyoftrainings,services,andresourcestotheunemployed,under‐employed,anddislocatedworkers,whichwillraisetheeducationandskilllevelsoftheworkforcetoensuretheircontinuedsuccessintheworkplace.ThevisionoftheSBWIBisthatSanBenitoCountywillhaveatrained,skilled,andrelevantworkforcethatmeetstheneedsofemployersandincreasesthequalityoflifeinthecommunity.TheSBWIBstrivestoremoveemploymentbarriersthroughtrainingprogramsdesignedtoprovidetheregion’semployerswithaskilledworkforce.TheSBWIBrepresentativesfromthevarioussectorsformthestrategicbody,whichdiscussesanddecidesuponthecounty’sjobtrainingdesignandprogrammaticfocus.In
1http://www.edd.ca.gov/Jobs_and_Training/pubs/wsin11‐48.pdf

4
addition,thePrograms,PlanningandBusinessServicesCommittee(PPBSC)furthermeetstodiscussstrategiesonhowtoaddressSanBenito’sworkforcechallenges.StatePriorities:Armedwiththenewlyresearchedcompetitiveandemergentregionalindustrysectors(BWResearchPartnership’sEconomicandWorkforceInformationReport),aswellaspaststudiesfocusedonregionallabormarketinformation(LMI),theSBWIBandPPBSCareideallysituatedtoaddresstheskillsgapsthatexistforskilledworkersinthecompetitiveandemergentindustries.2TheLMI,whichwilldrivefuturedecisions,willbedetailedinSectionII,whiletheBusinessServicesPlan,designedtoaddresstheskillsgaps,willbedetailedinSectionIII.Inaddition,overthenext12‐16months,theSBWIBwillbedevelopingregionalworkforceandeconomicdevelopmentnetworksthatwillbedesignedtoaddresstheworkforceeducationandtrainingpriorities.Basedontheregionaleconomicandworkforceinformationanalysis,identifytheindustrysectorsandoccupationalclusterswithintheregionthatarehigh‐growth,high‐demand,projectingskillsshortages(duetoreplacementsand/orgrowth),and/orvitaltotheregionaleconomyAsdetailedfurtherinSectionIIofthisPlan,theindustriestheSBWIBwillfocusonarethosethatwillmakeasignificantimpactontheregion’seconomyinthecomingyears.AsidentifiedintheLMIstudycommissionedbytheSBWIB,andconductedbyBWResearchPartnership,theindustriestheSBWIBwillfocusoninclude:
1. Manufacturing2. ConstructionandRealEstate3. Arts,Entertainment,Tourism,andRetail
2http://www.calmis.ca.gov/htmlfile/county/sbenito.htm

5
SECTION II: ECONOMIC AND WORKFORCE INFORMATION ANALYSIS SystemAlignmentandAccountabilityGoal:Supportsystemalignment,serviceintegrationandcontinuousimprovement,usingdatatosupportevidence‐basedpolicymaking.Coordinateanddevelophighquality,actionableLMIdatathatassessesregionalindustryandoccupationaltrendsandneedsandincludea“skillsgap”analysis.
SanBenitoCounty,likeothercommunitiesacrossCaliforniaandthenation,islookingtoreboundfromtheeconomicdownturnoftenreferredtoasthe“greatrecession”thatbeganin2008.Thistimeofeconomictransitionprovidespolicymakersandworkforcedevelopersanopportunitytoseehowthecounty’seconomyhasbeenimpactedandhowtodevelopnewstrategiesandthinkingaboutsupportingemployersandgettingpeoplebacktowork.
ThetablesbelowshowSanBenitoCounty’shistoricunemploymentrate,showingannualaverages,from1990to2012.Overthat22‐yearperiod,thecountyhasneverfacedanunemploymentrateatorbelowthestate’saverage,generallyremainingseveralpercentagepointsabove.Thisoverallemploymentpictureshowsacommunitythathasgenerallyfacedaverylooselabormarketwithmorepeoplethanavailablejobs.

6
From2007to2010,employmentinSanBenitoCountyexperiencedasubstantialdeclineevengreaterproportionallythanwhatwasexperiencedintherestofCaliforniaorinthecountry.Neighboringcounties,suchasMontereyandMerced,sawasmalldeclineinoverallemploymentbetween2007and2010andhavesincereturnedorcomeclosetopre‐recessionemploymentlevels.
Overthelasttwentyyears,SanBenitohasfacedrelativelyhighlevelsofunemploymentandnotenoughjobcreation.ThegreatrecessionwasparticularlypainfulforSanBenito,andinamatterofthreeyears,theCountylostoneineveryeightjobs.
0
2
4
6
8
10
12
14
16
18
20
1990 1992 1994 1996 1998 2000 2002 2004 2006 2008 2010 2012
Un
emp
loym
ent
Rat
e
California SanBenitoCounty

7
CountywideWorkforceProfile
Theterm“demand‐driven”isoftenusedintheworkforcedevelopmentworldtoindicatetheimportanceofdevelopingandprovidingprogramsandservicesthatareresponsivetotheneedsofemployers.Toprovideaworkforcedevelopmentsystemthatistrulydemand‐driven,thatfoundationmustbebuiltuponacomprehensiveunderstandingofthecounty’semployersandtheirbehaviorasitrelatestorecruiting,hiringanddevelopingtalent.Thisprofilewillincludeadescriptionofhowtheregion’sindustries,occupationsandskillsarechangingtomeettheneedsofemployerswhoareconstantlyadaptingtothedesiresoftheircustomers.
SanBenitoIndustryClustersofImportance
Anemphasisonindustryclustersinagivenregionhasseveraladvantages;theyallowustomovebeyondthegeneralindustryassessmenttoidentifyregionaleconomicdrivers,sharedresourcesthatareneeded(includinghumanresources),andabetterunderstandingofthemarketsinwhichemployerscompeteandcooperate.Analysesofindustryclustersarevaluabletoolstounderstandinghowtheregionaleconomyissegmentedintermsofdifferinggrowthexpectations,workforceneeds,andinfrastructurerequirements.
‐15%
‐12%
‐9%
‐6%
‐3%
0%
3%
2007 2008 2009 2010 2011 2012
SanBenitoCountyCaliforniaMontereyCountySantaCruzCountyMercedCounty

8
MichaelPorter,aHarvardeconomistandpioneerofindustryclusterresearch,definedanindustryclusterasageographicconcentrationofinter‐connectedcompaniesandinstitutionsworkinginasharedindustry.Thisdefinitionhasbeenexpandedovertheyearstoaccountforemployersinsharedtechnologies,supplychains,services,and/orcustomerswhosecompetitionand/orcollaborationcreateopportunitiesfornewbusinesscreation,increasedregionalwealth,andnewemployment.Oftentimes,industryclustersarenotinthesameorevencloselymatchedindustryclassificationsstructures.
Thereremainthreekeyreasonsforfocusingonindustryclusters:
1. Anemphasisonindustryclustersallowsyoutomoreeffectivelyengagewithemployerswhoarefocusedontheirindustry,relatedtechnologies,andcustomers,butwhomaybelessfocusedonoverallregionaleconomictrends.Anemphasisonindustryclustersallowsyoutobetterunderstandtheprioritiesandworkforceneedsoftheemployersthataredrivinggrowthinthecounty'seconomy.
2. AdeeperunderstandingoftherelevantindustryclustersinSanBenitoprovidesvaluableinformationforjob‐seekersandcurrentworkerswhoarelookingtodevelopnewskillsandfindcareerpathwaysthatallowthemtostayproductiveandindemandwithregionalemployers.Oneofthekeychallengesforjob‐seekersworkingtostayrelevantandusefulforpotentialemployersistogetthemtounderstandhowtheycanbevaluableforemployers.EducationonthekeyindustryclustersinSanBenitoprovidesjob‐seekersavaluablefoundationforunderstandingwhatskillsandabilitiestheyshouldworktowardandwhatemploymentopportunitiesconnecttostrongerpathwaysandgreatercareerfulfillment.
3. Thecounty‐specificindustryclustersapproachprovidesanemployer‐drivenperspectivetounderstandingtheskillsemployersarelookingforandhowtobetterconnecteducationandtrainingtolocalandcountywideworkforcedevelopmentstrategies.
SanBenito'sProfiledIndustryClusters
ThefollowingindustryclustersweredevelopedbasedonanalysisofSanBenito’seconomyandtheidentificationoftheindustriesandemploymentopportunitiesthatareavailablewithintheCounty:
Arts,Entertainment,Tourism&Retail(1)consistsofallemployersinretailtradeaswellasthoseinvolvedinfoodservices,accommodationsandarts,entertainmentandrecreation.Fromaworkforceperspective,thisisasizableemployerclusterwithalargeportionofjobsinentry‐levelcustomerserviceandsales.
Healthcare,Education&GovernmentAssistance(2)isoneofthelargerindustryclustersinthecountyandunliketheotherindustryclustersis

9
almostcompletelypopulation‐serving.Employmentinthisindustryislargelydrivenbydemographics,andthebudgetprioritiesoflocal,state,andnationallegislativebodies.Thisclusterincludesprivateandpubliceducation,healthcareandsocialassistanceandgovernment.
Business&PersonalSupportServices(3)isaparticularlyimportantclusterforSanBenitogiventhelargenumberofsmallandmedium‐sizedbusinessesthatarefoundinthecounty.TheBusiness&PersonalSupportServicesclusterinSanBenitoCountyiscomprisedofadministrative,support&wastemanagementservicesaswellasotherrelatedprivatesectorservices.
Manufacturing(4),alongwithagriculture,istheindustryclusterwiththehighestconcentrationofemploymentinSanBenito.Unlikeagriculture,itisexpectedtoseeconsiderableincreasesinemploymentoverthenextfiveyears.Thisclusterincludesallmanufacturingfromfoodmanufacturingtocomputerandelectronicsproductmanufacturing.
Construction&RealEstate(5)includesallconstructionactivitiesfromconstructionofbuildingstospecialtytradecontractorsaswellasallrealestateservices,whichincluderentalsandleasingservices.
Agriculture(6)hasbeenafoundationalemployerinSanBenitothroughoutmostofitshistory.Thisclusterdefinitionincludesagriculture,forestryfishingandhunting,althoughinSanBenitoalmostallemploymentisdirectlyconnectedtoAgriculture.

10
ThefigurebelowrevealsseveralpiecesofkeyinformationregardingSanBenito’sindustryclusters.Thesizeofthesphereshowstherelativesizeofeachcluster,intermsofcurrentemployment.TheverticalaxisindicatestherelativeemploymentconcentrationoftheclusterincomparisontotheCaliforniaaverage.3Thehorizontalaxisindicatestheexpectedgrowthinoverallindustryclusteremploymentfrom2012to2017.
3Alocationquotient(LQ)of1.0indicatesthataregionhastheaverageemploymentforagivenindustryclusterincomparisontotheCaliforniaeconomy.AnLQof2.0indicatestheregionalhastwicetheaverageemploymentforagivenindustryclusterincomparisontothecountry’seconomy.
(1)
(2)
(3)
(4)
(5)
(6)
0.5
1.0
1.5
-4% 0% 4% 8% 12% 16% 20% 24%
2012
L
Q
2012-2017 % Employment Growth(1) Arts, Entertainment, Tourism & Retail(2) Healthcare, Education & Government Assistance(3) Business & Personal Support Services(4) Manufacturing(5) Construction & Real Estate(6) Agriculture
LQ = 5.51Growth = ‐13.5%

11
Astheindustryclusterchartshows,thetwoclustersthathavethehighestconcentrationinSanBenito,manufacturingandagriculturearegoinginoppositedirectionsintermsofexpectedemployment.ManufacturingisexpectedtoseeconsiderablegrowthinSanBenitooverthenextfiveyears,whileagricultureisexpectedtoseeconsiderabledeclinesintotalemployment.Whiletheseindustryforecastsareseldomifevercompletelyaccurate,thesignificantdifferencesinthedirectionoftotalemploymentbetweenthesetwoimportantclustersinSanBenitoisworthnoting.SanBenitoCountyOccupationsOccupationalTiers
Theunemploymentrate,numberofjobscreated,numberofpeopleemployed,andnumberofpeopleunemployed–allthesegeneralstatisticshavesomevaluewhenyouarelookingatSanBenito'soveralleconomy,buttheyalsohidesomecriticalinformationaswell,startingwiththerealitythatnotalljobsareequal.Apart‐timejobthatpaysminimum‐wagewithlimitedtrainingandon‐the‐jobskilldevelopmentisconsiderablylessvaluablethanahigh‐paying,full‐timepositionwithfullbenefitsthatcontinuallydevelopsandtrainsanindividualforincreasinglevelsofresponsibility.
ArecentstudybyDavidAutor4revealedthechangesinthenation'soccupationalprofile.Autorprovidedanin‐depthexaminationofthequalityandquantityofthejobsthatemployershavedemandedoverthelast30years.Inhisanalysis,AutordevelopedanoccupationalsegmentationthatBWResearchalsousesinregionaloccupationalanalyses.Thisoccupationalsegmentationtechniquedelineatesalloccupationsintooneofthreetiers.Theoccupationaltiersarebroadlydefinedasfollows:
Tier1Occupationsincludemanagers(ChiefExecutives,FinancialManagers,andSalesManagers),professionalpositions(Lawyers,Accountants,andPhysicians)andhighly‐skilledtechnicaloccupations,suchasScientists,ComputerProgrammers,andEngineers.Theseoccupationsaretypicallythehighest‐paying,highest‐skilledoccupationsintheeconomy.In2012,theaverageearningsforTier1occupationsinCaliforniawas$38.17anhourorapproximately$79,400ayear(assuminga40hourworkweekfortheentireyear).
Tier2Occupationsincludesalespositions(SalesRepresentatives),teachers,andlibrarians,officeandadministrativepositions(AccountingClerksandSecretaries),andmanufacturing,operations,andproductionpositions(Assemblers,Electricians,andMachinists).Theseoccupationshavehistoricallyprovidedthemajorityof
4ThePolarizationofJobOpportunitiesintheUSLaborMarket;ImplicationsforEmploymentandEarnings,April2010.

12
employmentopportunitiesandcouldbereferredtoasmiddle‐wage,middle‐skillpositions.In2012,theaveragewageforTier2occupationsinCaliforniawas$21.22anhourorapproximately$44,100ayear(assuminga40hourworkweekfortheentireyear).
Tier3Occupationsincludeprotectiveservices(SecurityGuards),foodserviceandretailpositions(Waiters,Cooks,andCashiers),buildingandgroundscleaningpositions(Janitors),andpersonalcarepositions(HomeHealthAidesandChildCareWorkers).Theseoccupationstypicallyrepresentlower‐skilledservicepositionswithlowerwagesthatrequirelittleformaltrainingand/oreducation.In2012,theaveragewageforTier3occupationsinCaliforniawas$11.96anhourorapproximately$24,900ayear(assuminga40hourworkweekfortheentireyear).
Dr.Autor’sresearchonoccupationaltiersrevealedthatTier2occupationshavebeendecliningconsiderablysincethemid‐1970sasmanyofthesejobshavebeenlosttoautomationormorerecentlyoffshoredtolessexpensivelabormarkets.ThegreatrecessiononlyexpeditedthislongruntrendasnationallyandregionallyTier1andTier3jobsincreasedduringtherecessionwhileTier2jobsdeclined.Whilethistrendistrueforthecountryasawhole,itisnotentirelyaccurateinSanBenito,however,weareseeingconsiderablymorechurnandchangeinTier2occupations.
Thetablebelowrevealsthatapproximately45percentofSanBenitoCounty’sjobscanfoundamongTier2occupations,withjustbelowathirdinTier3andabout15percentinTier1.SanBenitoCountyhasmoreTier3occupationsproportionallythanCaliforniaasawholebutactuallyhaslessTier3occupationsproportionallythaneitherMontereyorMerced.
Table1:OverallOccupationalTiersbyRegion5
OverallOccupationalTiers
Tier1 Tier2 Tier3SanBenitoCounty 15.3% 44.3% 31.8%California 19.4% 43.3% 28.2%MontereyCounty 13.4% 34.3% 42.1%SantaCruzCounty 19.3% 41.3% 31.2%MercedCounty 10.4% 44.3% 36.2%
Itshouldbenotedthatnotalloccupationsfitintooneofthethreeoccupationaltiers.Approximately10percentofalloccupationsarenotplacedintooneofthethreetiers.
5Source:EMSICompleteEmployment2013.2

13
AnanalysisofSanBenito’soccupationsbytiersandindustryrevealsaninterestingprofileofwherejobsarelocatedwithintheregion.JustunderfortypercentofallTier1SanBenitoCountyoccupationsarefoundinoneoftwoindustryclustersHealthcare,Education,&GovernmentAssistance(25%)aswellasManufacturing(15%),
ItshouldbenotedthatSanBenitoCounty’saverageannualearningsperjobis$41,700for2013,about82percentofthenationalaverage..Anearningperjobindexof1.00indicatesaverageannualearningsof$41,700foragivenoccupationwhileanindexscoreof2.00indicatesaverageannualearningsof$83,400foragivenoccupation.
Table2:OverallOccupationalTiersforSanBenitoCountyIndustries6
IndustryDescriptionOccupationalTiers Earnings
PerJobIndexTier1 Tier2 Tier3
Arts,Entertainment,Tourism&Retail 12.6% 14.2% 37.4% 0.79
Healthcare,Education&GovernmentAssistance 25.0% 21.1% 12.6% 1.41
Business&PersonalSupportServices 6.7% 7.1% 20.8% 0.58Manufacturing 14.5% 19.2% 6.0% 1.34Construction&RealEstate 13.0% 20.2% 1.9% 0.74Agriculture 2.4% 3.9% 18.5% 0.94ThetablebelowillustratesSanBenito’soccupationalcompositionbyindustryclusters.IndustryclusterssuchasManufacturingandConstruction&RealEstatehavealargerportionofoccupationsinTier1comparedtoTier3,whileallotherindustryclustersinSanBenitohavemoreTier3thanTier1occupations.
Table3:OccupationalTierCompositionwithinIndustriesinSanBenitoCounty7
IndustryDescriptionOccupationalTiers
Tier1 Tier2 Tier3Arts,Entertainment,Tourism&Retail 9.5% 30.8% 58.3%Healthcare,Education&GovernmentAssistance 19.5% 47.5% 20.4%
Business&PersonalSupportServices 9.0% 27.4% 57.8%Manufacturing 16.3% 62.5% 14.0%Construction&RealEstate 16.9% 76.1% 5.1%Agriculture 3.4% 15.9% 54.4%
6Source:EMSICompleteEmployment2013.27Source:EMSICompleteEmployment2013.2

14
Thefollowingthreefiguresrevealtheoveralloccupationaldemand,bothwithinSanBenitoCountyaswellaswithinCaliforniaandtheneighboringcountiesforthethreeoccupationaltiers.Asthefiguresreveal,CaliforniahasexperiencedanincreaseinTier1andTier3occupationsofthetotaloccupationalpoolwhileTier2occupationshavedeclinedandareexpectedtodecline.
InSanBenito,Tier1occupationshaveandareexpectedtoremainflatintermsoftheirproportionofCountywideemploymentwhileTier2isdeclining,Tier3isincreasing.
Figure1:Tier1OccupationShareofTotalEmploymentbyRegionfrom2002to20178
8Source:EMSICompleteEmployment2013.2–Combinedoccupationaltierdefinitionsdonotcaptureallemployment.
14.5
%
13.9
%
15.3
%
15.6
%18.3
%
18.8
%
19.4
%
19.6
%
13.6
%
13.5
%
13.4
%
13.3
%
17.8
%
19.0
%
19.3
%
19.2
%
9.6
%
10.3
%
10.4
%
10.7
%
0%
10%
20%
30%
2002 2007 2012 2017
San Benito CountyCaliforniaMonterey CountySanta Cruz CountyMerced County

15
Figure2:Tier2OccupationShareofTotalEmploymentbyRegionfrom2002to20179
9Source:EMSICompleteEmployment2013.2
45.5
%
46.3
%
44.3
%
44.9
%
46.1
%
45.4
%
43.3
%
42.4
%
37.9
%
36.5
%
34.3
%
33.9
%
43.5
%
43.2
%
41.3
%
40.5
%
44.9
%
45.7
%
44.3
%
44.1
%
10%
20%
30%
40%
50%
2002 2007 2012 2017
San Benito CountyCaliforniaMonterey CountySanta Cruz CountyMerced County

16
Figure3:Tier3OccupationShareofTotalEmploymentbyRegionfrom2002to201710
10Source:EMSICompleteEmployment2013.2
31.2
%
31.9
%
31.8
%
31.0
%
26.3
%
27.1
%
28.2
%
29.1
%
37.9
%
39.8
% 42.1
%
43.3
%
30.0
%
29.8
%
31.2
%
32.5
%35.2
%
35.0
%
36.2
%
36.6
%
10%
20%
30%
40%
50%
2002 2007 2012 2017
San Benito CountyCaliforniaMonterey CountySanta Cruz CountyMerced County

17
KeyOccupationsforSanBenitoCounty
ThetablesonthefollowingthreepagesidentifytheSanBenitoCountyoccupationsineachtierwiththemostjobopenings(newjobs+replacementjobs)expectedfrom2012to2017.Thetableincludesboththegrowthpercentage,whichindicatestheproportionalincreaseindemandforthatoccupationalcategory,aswellastheearningsindex,whichindicatestheproportionalaverageearningsforeachoccupationincomparisontothe2012averageearningsinSanBenitoof$41,700annually.Forexample,anearningsindexof1.00indicatesthatoccupationalcategoryhasanaverageearningsof$41,700,whileanearningsindexof2.0indicatesanannualaverageearningsof$83,400forthatoccupationalcategory.
Table4:KeyTier1OccupationsforSanBenitoCounty11
SOCDescription2012Jobs
Growth2012‐2017
%Growth
TotalJobOpenings
(new+repl.)
Earningsindex
RegisteredNurses 161 111 69% 325 2.71Property,RealEstate,andCommunityAssociationManagers 120 81 68% 256 0.70
PersonalFinancialAdvisors 63 96 152% 236 1.36
Managers,AllOther 159 32 20% 156 1.20
ManagementAnalysts 78 41 53% 124 1.49
GeneralandOperationsManagers 307 ‐33 ‐11% 96 2.97
FinancialManagers 79 22 28% 84 2.33BusinessOperationsSpecialists,AllOther 82 13 16% 83 1.99
AppraisersandAssessorsofRealEstate 50 19 38% 82 0.75
AccountantsandAuditors 178 ‐22 ‐12% 67 1.40
IndustrialProductionManagers 37 20 54% 60 2.55
IndustrialEngineers 43 15 35% 59 2.27
CoachesandScouts 36 17 47% 58 0.69
Lawyers 70 2 3% 51 2.50
SalesManagers 64 6 9% 46 2.93
MarriageandFamilyTherapists 13 11 85% 44 0.80
FinancialAnalysts 30 11 37% 43 1.66ElectronicsEngineers,ExceptComputer
24 11 46% 41 2.67
MusiciansandSingers 38 7 18% 39 0.90ArchitecturalandEngineeringManagers
33 6 18% 35 3.58
11Source:EMSICompleteEmployment2013.2&CaliforniaEmploymentDevelopmentDepartment(EDD)OccupationalEmploymentProjections2012.

18
Table5:KeyTier2OccupationsforSanBenitoCounty12
Description2012Jobs
Growth2012‐2017
%Growth
TotalJobOpenings
(new+repl.)
Earningsindex
RealEstateSalesAgents 398 228 57% 775 0.56
ButchersandMeatCutters 34 115 338% 281 0.94PackagingandFillingMachineOperatorsandTenders
97 100 103% 260 0.52
FoodBatchmakers 53 88 166% 247 0.60HeavyandTractor‐TrailerTruckDrivers
305 14 5% 211 0.88
First‐LineSupervisorsofRetailSalesWorkers
303 34 11% 198 0.69
Securities,Commodities,andFinancialServicesSalesAgents
56 64 114% 194 1.07
InsuranceSalesAgents 103 52 50% 187 1.09
StockClerksandOrderFillers 232 30 13% 184 0.54
Electricians 116 ‐41 ‐35% 176 1.40
OfficeClerks,General 264 14 5% 173 0.80Meat,Poultry,andFishCuttersandTrimmers
14 70 500% 167 0.62
Inspectors,Testers,Sorters,Samplers,andWeighers
79 60 76% 162 0.95
TeamAssemblers 170 29 17% 151 0.74
RealEstateBrokers 81 42 52% 150 0.93Self‐EnrichmentEducationTeachers 49 55 112% 133 0.65
PoliceandSheriff'sPatrolOfficers 137 ‐5 ‐4% 121 2.13
Carpenters 237 ‐42 ‐18% 117 0.97
Helpers‐‐ProductionWorkers 73 34 47% 116 0.53
CustomerServiceRepresentatives 139 15 11% 112 1.00
12Source:EMSICompleteEmployment2013.2&CaliforniaEmploymentDevelopmentDepartment(EDD)OccupationalEmploymentProjections2012.

19
Table6:KeyTier3OccupationsforSanBenitoCounty13
Description 2012Jobs
Growth2012‐2017
%Growth
TotalJobOpenings
(new+repl.)
Earningsindex
Cashiers 399 177 44% 756 0.61
RetailSalespersons 471 128 27% 546 0.49LaborersandFreight,Stock,andMaterialMovers,Hand 353 130 37% 506 0.67
CombinedFoodPreparationandServingWorkers,IncludingFastFood
277 107 39% 375 0.52
MaidsandHousekeepingCleaners 167 118 71% 324 0.48CounterAttendants,Cafeteria,FoodConcession,andCoffeeShop
97 56 58% 275 0.52
ChildcareWorkers 392 ‐24 ‐6% 211 0.47
FoodPreparationWorkers 111 61 55% 210 0.53
PackersandPackagers,Hand 196 31 16% 209 0.47
PersonalCareAides 58 90 155% 198 0.57IndustrialTruckandTractorOperators
120 43 36% 171 0.76
LandscapingandGroundskeepingWorkers
203 21 10% 157 0.56
JanitorsandCleaners,ExceptMaidsandHousekeepingCleaners
260 10 4% 152 0.55
SecurityGuards 48 52 108% 136 0.71Hairdressers,Hairstylists,andCosmetologists 99 46 46% 135 0.44
RefuseandRecyclableMaterialCollectors 13 49 377% 134 1.07
HomeHealthAides 28 57 204% 133 0.50FarmworkersandLaborers,Crop,Nursery,andGreenhouse
1,137 ‐559 ‐49%127
0.44
WaitersandWaitresses 186 ‐83 ‐45% 105 0.45NursingAides,Orderlies,andAttendants
43 37 86% 97 0.78
MostoftheanalysesinthisportionofthePlanfocusonthechangesinSanBenitoCountythathaveoccurredfrom2007throughtheendof2012.ThistimeframeallowstheSBWIBtolookattheeconomyrightbeforethegreatrecessionandaskhowthissignificantdownturnintheeconomyimpactedtheregion’sworkforceneeds.Lookingforward,thestudyfocusedon2012to2017,using2012asthebaseyearand2017asthefarthestoutamongtheforecastsutilizedforthisreport.Armedwiththisdata,theSBWIBcanbetterassesstheneedsofitsregionalworkforceandbetterfocusfundingandstrategiestothoseneeds.
13Source:EMSICompleteEmployment2013.2

20
SECTION III: BUSINESS SERVICE PLAN BusinessandIndustryGoal:Meettheworkforceneedsofhighdemandsectorsofthestateandregionaleconomies.TheSBWIBshallestablishaBusinessServicePlanthatintegrateslocalbusinessinvolvementwithworkforceinitiatives.Programs,PlanningandBusinessServicesCommittee:ThePPBSCisresponsibleforreviewingandadvisingtheSBWIBonallmattersrelatingtoprogramplanningincludingthepreparationofdraftandfinallocalplans,budgets,RequestsforProposals(RFP),evaluationofRFPresponses,incorporationofselectedproposalsintotheBusinessServicesPlan,recommendationsontheawardingofcontractstoserviceproviders,indentifyingeligibleintensiveservicesandtrainingproviders,aswellasmakingrecommendationsonlocalpolicyonIndividualTrainingAccounts(ITAs).Currently,theSBWIBViceChairsitsastheChairofthePPBSCandisjoinedbysixothermembersoftheSBWIB.Threemembersfromtheprivatesectorrepresentthefollowingindustries:construction,manufacturing,lifesciences,andmedicalservices.Threemembersfromthepublicsectorinclude:adevelopmentaldisabilityserviceprovider,andrepresentativesfromtwoorganizedlaborunions.Therewillbeaconcertedeffortgiventoexpandingthesub‐committeetofullyrepresentthevariousvoicesneededtoeffectivelyrepresentthevarietyofworkforceneedsandconstituenciesasreflectedonthelargerSBWIB.ThePPBSCwillbetaskedwithfurtherdevelopmentandrecommendationfortheBusinessServicePlaninanefforttoincreaseemployerinvolvementintheactivitiesofSBWIB.ThegoalofthePPBSCwillbetoensuretheprogramsandinitiativesundertakenbytheSBWIBareinconformancewiththestatedneedsoftheregionandidentifiedskillsgapsoftheregionalworkforce.ThecommitteewillendeavortorecommendrequiredrevisionstothegoalsandstrategiesoftheSBWIBinordertomaximizeefficiency,leveragescantresources,andprovideoutstandingservicetoallbusinessstakeholdersintheregion.
SBWIBServices:AdescriptionofthetypesofservicesSBWIBofferstobusinesses,includingadescriptionofhowSBWIBintendsto:
1. Determinetheemployerneedsinthelocalorregionalarea;2. Integratebusinessservices,includingWagner‐PeyserActservices,to
employersthroughtheOne‐Stopdeliverysystem;and3. Leverageandbraidotherresourcesthrougheducation,economic
developmentandindustryassociationstosupportOJTandotherCTventures.

21
TheSBWIB,inconjunctionwiththePPBSC,willengagethebusinesscommunitythroughtheirBusinessServicesrepresentativesintheOne‐StopCareerCenter.ArmedwiththeidentifiedindustriesasdetailedinSectionIIofthisPlan,theBusinessServicesrepresentativeswillbegintheprocessofestablishingnotonlylinkageswiththeidentifiedoccupationalindustryclusters,butbegintoestablishnetworkstoleverageresourcesacrosstheidentifiedindustries.ThissectormappingapproachwillallowtheSBWIBtoidentifyemployerneedsinagivenindustry,employmentchallenges,specializedskillsgaps,andgrowthopportunitiesthroughouttheregion.Theidentifiedclustersinclude:Manufacturing,ConstructionandRealEstate,andArts,Entertainment,Tourism,andRetail.
TheSBWIBwillstrivetobraidmultipleresourcestoaddresstheemploymentneedsoftheregion.Fromapprenticeshiptraining,On‐the‐JobTraining(OJT)andCustomizedTraining,toemployersponsoredjobtrainingandotherorganizationsandagencies(i.e.EDD),whichhavemissionsinlinewithSBWIB’s,theSBWIB,PPBSC,andtheBusinessServicesrepresentativesoftheOne‐StopCareerCenter,willallworkinconcerttobringinnovativeemploymenttrainingstrategiestobearonthehighgrowthindustriesoftheregion.PartofthateffortwillbetoidentifyneededapprenticeshipprogramsfortheidentifiedsectorandworkingwithGalivanCollegetoestablishcomplimentaryprograms.TodateGalivanonlyhastwoapprenticeshipprogramsforDrywallingandCarpentry.ItwillbeincumbentupontheSBWIBandPPBSCtoidentifyandpursueothersourcesoffundingwhichwouldallowfortheexpansionofthesekindsofprograms.RecentlytheregionalEconomicDevelopmentCorporation(EDC)inSanBenitoCountyhasexperiencedachurninthepostofExecutiveDirector.CurrentlytheEDCisnotfunctioning,andthelocalandregionalChambersofCommercearenotnecessarilysteppingintothevoidtoattractandpromotebusinessexpansionandinvestmentinSanBenitoCounty.ThisisanopportunetimefortheSBWIBtostepintothatvoidandbecomeatrueconvenerandengineforeconomicgrowth,butwithlimitedresourcesSBWIBwillbechallengedtodoso.Nonetheless,inthefaceofacompletelackofanEDCpresence,theSBWIBisideallysituatedtofillthevacuum,andsearchoutotherpartnerswithwhichtoleveragejob‐trainingresourcesforlocalbusinessclientele.DescribehowSBWIBintendstoaccomplishthefollowing:
1. Identifytheworkforcetrainingandeducationalbarriersthathinderjobcreationinthelocalareaorregionaleconomy;
2. Identifyskillgapsintheavailablelaborforcethatcontributetothelackoflocalbusinesscompetitiveness;and
3. Identifyprioritysectorsthatwouldlikelycontributetojobgrowthinthelocalareaorregionaleconomyiftheinvestmentsweremadefortrainingandeducationalprograms.
InrecentyearstheSBWIBhasengagedinaprovidinga“fullbodyscan”ofthecommunityincludingdesigningstrategiestopreparethelocalworkforceforthe

22
jobsthatdocurrentlyexist,seekingoutwaystoavertlayoffsandkeepbusinessopen,attractingqualitybusinesseswillingtoworkwiththelocalpopulation,andworkingwithmiddleandhighschoolstoengageyouthindiscussionsaroundexcitingcareers.
Underminingtheseefforts,areseveralcontractions:thestructureoftheSBWIBitself,unevenorlimitedknowledgeofSBWIBmembersaboutroles,responsibilities,andexpectations,alackofcommunityawarenessastothevalueoftheWIAsystem,communityapathy,alackofcommunitywideeconomicdevelopmentstrategiesoutsideoftheSBWIBitself,andlimitedstaffresourcesespeciallyintermsofWIAallocations.Specifically,alackofrobustfundingfortheneedidentifiedintheregionisthesinglemostfrequentlyidentifiedfactorthathindersaregion‐widestrategyandabilityoftheSBWIBtoaddresstheworkforceneedsinthecommunity.
Withthatsaid,theSBWIBhascreatedwithGalivanCollegeastrongrelationshiptoidentifytheeducationalbarriersoftheregion,andwillbedevelopingabusiness/industryworkinggrouptoidentifyspecifictrainingbarriersforlocalprograms.
AlookatSanBenito’sregionalpopulationdemographicsgivesinsightintosomeofthechallengestheregionfacesintermsofskillgapsandneededstrategiestoalleviatesuchdisparities.

23
Overthelast12years,SanBenitoCounty’soverallpopulationhasgrownatarateconsiderablyslowerthanCaliforniaasawhole.InfactSanBenitoexperiencedadeclineintotalpopulationfrom2003to2007andhasgenerallyexperiencelittletonogrowthinpopulationfrom2001to2009,withaslightuptickinpopulationfrom2009to2012.
Figure4:OverallChangeinPopulationbyRegionfrom2001to201214
14Source:EMSICompleteEmployment2013.2
‐3%
0%
3%
6%
9%
12%
15%
18%
21%
2001 2002 2003 2004 2005 2006 2007 2008 2009 2010 2011 2012
SanBenitoCountyCaliforniaMontereyCountySantaCruzCountyMercedCounty

24
Examiningpercapitaincomebyregion,SanBenitoisbelowtheCaliforniaaveragebutslightlyaheadofMontereyCountyandconsiderablyhigherthanMerced.Itisimportanttonotethatthisisanaveragemeasureanddoesnotaccountforthedistributionofincomeorthepercentageofthepopulationthatisaboveorbelowthisamount.
Figure5:PerCapitaIncomebyRegion(2011)15
ThereareseveralwaysofexaminingtheskillsgapinSanBenitoCounty.OnewayistoexamineandcomparehowresidentsofSanBenitointhelaborforce(identifiedastheresidentworkforce)andthoseworkingoremployedinSanBenitoCounty(regardlessofwheretheylive)lookintermsofthegeneraloccupationalcategoriesandskillsthattheyprovide.Overall,SanBenitoCountyhasmoreemployedresidentsthanitdoesavailablejobsintheCounty,approximately25,000employedresidentsand20,000jobsinCounty.TheonlygeneraloccupationalskillcategorythathasahigherlevelofjobsthanresidentsthatareworkinginthemarethoselargelyTier2andTier3occupationsfoundinmanufacturing(productionoccupations)andlogistics(transportationandmaterialmovingoccupations).
15Source:ACS20115‐yearestimates.
$18,304
$25,508
$26,300
$29,634
$32,975
$0 $10,000 $20,000 $30,000 $40,000
Merced County
Monterey County
San BenitoCounty
California
Santa CruzCounty

25
Figure6:ResidentWorkforcevs.EmployerWorkforcefortheCounty16
Therefore,itwillbeincumbentupontheSBWIBtocontinuallyseekoutstrategiesandpartnershipstoestablishwell‐fundedandwellthought‐outtrainingprogramsinthehighjobgrowth,prioritysectorsofmanufacturingandlogistics.Inaddition,theSBWIBwillalsoremainfocusedontheotheridentifiedhighgrowthsectorsofConstruction&RealEstate,andArt,Entertainment,Tourism&Retail.
16Source:EMSICompleteEmployment2013.2andAmericanCommunitySurvey(ACS)5‐yearestimates.
6,93
8
4,10
3
6,67
2
4,16
0
3,04
4
6,08
5
3,39
9
4,81
5
2,61
0
3,17
8
0
2,000
4,000
6,000
8,000
10,000
Management,business,
science, andarts
occupations
Serviceoccupations
Sales andoffice
occupations
Naturalresources,
construction,and
maintenanceoccupations
Production,transportation,
and materialmoving
occupations
Resident Workforce (ACS)
Employed in San Benito County (EMSI)

26
SECTION IV: ADULT STRATEGIES AdultsGoal:IncreasethenumberofCalifornianswhoobtainamarketableandindustry‐recognizedcredentialordegree,withaspecialemphasisonunemployed,underemployed,low‐skilled,low‐income,veterans,individualswithdisabilities,andotherat‐riskpopulations.Describethevisionforalignmentoftheregionaleducationsystemtodevelopcareerpathwaysandmeettheeducationalneedsofworkersandpriority‐sectoremployersinthelocalareaorregionaleconomy.Includedetailedactionstoaddressthefollowingstatepriorities:
1. Increasethenumberofcareerpathwayprogramsindemandindustries;2. Increasethenumberofadultbasiceducationstudentswhosuccessfully
transitiontopostsecondaryeducation,trainingoremploymentandreducethetimestudentsspendinremediation;
3. Increasethenumberofunderpreparedjobseekersanddisplacedworkerswhoenterandsuccessfullycompleteeducationandtrainingprogramsindemandindustriesandoccupations;
4. Developandimplementastrategiclayoffaversionstrategythathelpsretainworkersintheircurrentjobsandprovidesrapidtransitionstonewemploymentminimizingperiodsofunemployment;and
5. Expandtheavailabilityofandparticipationin“EarnandLearn”modelssuchasapprenticeships,OJTandotherCTwhereworkerscanbuildskillswhileworking.
GalivanCollegeistheonlycommunitycollegeintheregionofSanBenitoCounty.Muchofthecommunitycollege’sfundinghasbeenreducedatthestateleveltocomportwiththeGovernor’sausteritymeasuresenactedoverthelastcoupleofbudgetcycles.Duetothisreductioninfunding,theAdultEducationprogramsatGalivanhavebeenallbutcompletelydecimated,reduced,oreliminated.
GivenSBWIBisCalifornia’ssmallestWIBintermsoffunding,itishighlyunlikelySBWIBwillbeabletostepinandfullyreestablishtheAdultEducationprogramsintheregionalone.Therefore,SBWIBwillbechargedwithpartneringwithGalivan,andtheK‐12educationalsystemtoidentifyalternativesourcesoffundingwhichcouldbecometheseedcapitalformoreprograms.
Additionally,representativesfromGalivanCollegecite90%ofallincomingstudentsfromtheK‐12educationalsystemarebelowproficiencyinMathskills,while80%aredeficientinEnglishskills.RemediationisakeyfunctionofGalivan’scurriculum.Thepreparationofthecurrentworkforceisunderstrain,anditwillbeamainchargeoftheSBWIBandPPBSCtoidentifyfundingandaggressivelypursuethosesourceswhethertheybefederal,state,orapproachingthelocalbusinesscommunitytoassist.
Inadditiontotheeducationchallengesfacedbytheregion,thedemographicsofSanBenitoCountyalsopresentitwithauniquesetofchallenges.Thefigurebelow

27
showsthe2012agedistributionofSanBenitoCountyaswellasCaliforniaandthethreeneighboringcounties.Overall,SanBenitohasalargerportionofitspopulation19yearsoldoryounger(31%vs.27%)comparedtoCalifornia,butasmallerportionofitspopulation20to39yearsold(25%to29%)and65yearsandolder(10%vs.12%).
Figure7:AgeDistributionbyRegion(2012)
From2001to2012,SanBenitohasseenitspopulationgetconsiderablyolder.Ifthesetrendscontinue,SanBenitowillgofromaCountythatwaslargelyyoungerthanthestateaverage,toonethatislargelyolderthanthestateaverage.
31.0
%
25.3
%
33.4
%
10.4
%
27.3
%
28.7
% 32.1
%
11.9
%
29.8
%
29.5
%
29.6
%
11.1
%
25.1
% 28.5
%
34.3
%
12.1
%
34.3
%
28.6
%
27.2
%
9.8
%
0%
10%
20%
30%
40%
19 and under 20 to 39 years 40 to 64 years 65 years and older
San Benito CountyCaliforniaMonterey CountySanta Cruz CountyMerced County

28
Figure8:ChangewithinAgeCohortsbyRegionfrom2001to201217
17Source:EMSICompleteEmployment2013.2
-7.3
%
-10.
4%
21.3
%
35.7
%
0.5
% 3.7
%
22.3
%
24.1
%
-0.5
%
-1.2
%
12.8
%
15.9
%
-5.5
% -1.4
%
9.7
%
28.0
%
10.0
%
23.2
%
29.7
%
27.5
%
-15%
0%
15%
30%
45%
19 and under 20 to 39 years 40 to 64 years 65 years and older
San Benito CountyCaliforniaMonterey CountySanta Cruz CountyMerced County
29
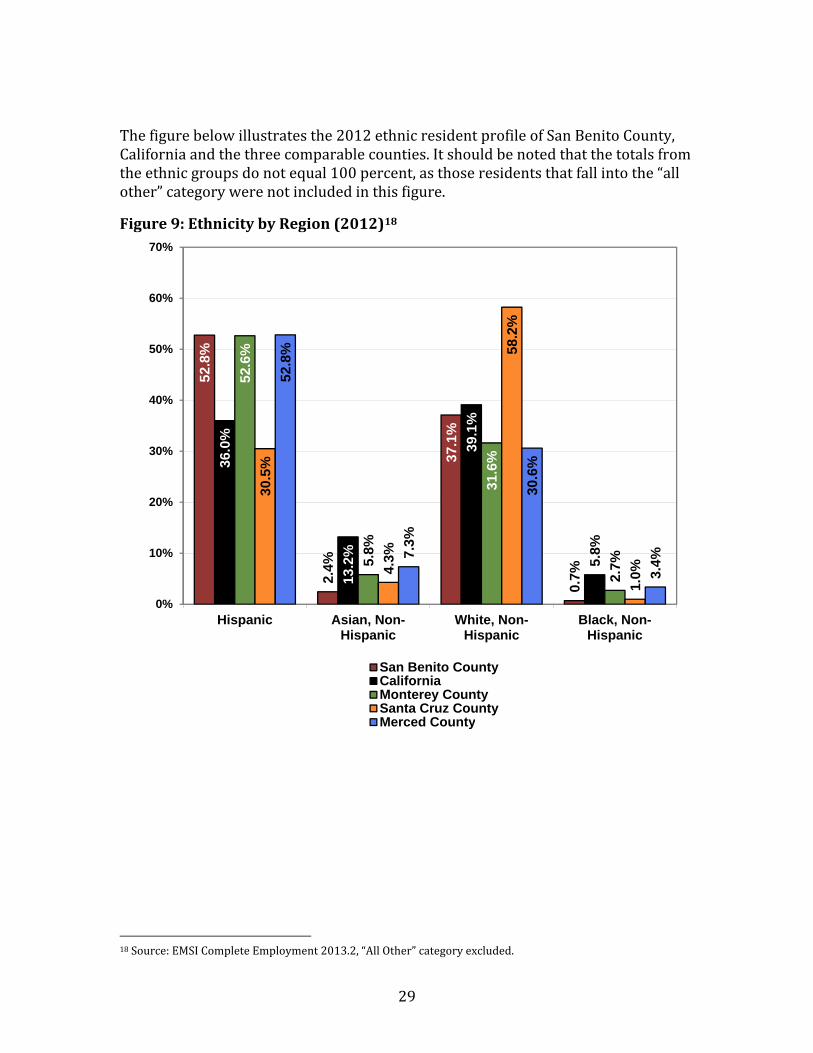
Thefigurebelowillustratesthe2012ethnicresidentprofileofSanBenitoCounty,Californiaandthethreecomparablecounties.Itshouldbenotedthatthetotalsfromtheethnicgroupsdonotequal100percent,asthoseresidentsthatfallintothe“allother”categorywerenotincludedinthisfigure.
Figure9:EthnicitybyRegion(2012)18
18Source:EMSICompleteEmployment2013.2,“AllOther”categoryexcluded.
52.8
%
2.4
%
37.1
%
0.7
%
36.0
%
13.2
%
39.1
%
5.8
%
52.6
%
5.8
%
31.6
%
2.7
%
30.5
%
4.3
%
58.2
%
1.0
%
52.8
%
7.3
%
30.6
%
3.4
%
0%
10%
20%
30%
40%
50%
60%
70%
Hispanic Asian, Non-Hispanic
White, Non-Hispanic
Black, Non-Hispanic
San Benito CountyCaliforniaMonterey CountySanta Cruz CountyMerced County

30
Thefigurebelowdescribesthechangeinethnicpopulationsfrom2001to2012inSanBenitoCounty,CaliforniaandthethreecomparableCounties.Astheresultsshow,thecountyhasfollowedthestatewidetrendofincreasingHispanicandAsianpopulationswhilegenerallyexperiencingadeclineinWhite,Non‐HispanicandBlack,Non‐Hispanicpopulations.
Figure10:ChangewithinEthnicityCohortsbyRegionfrom2001to201219
19Source:EMSICompleteEmployment2013.2,“AllOther”categoryexcluded(thecategoryexperiencedover100percentgrowthfrom2001to2012acrossallregions).
17.1
%
5.5
%
-16.
4%
-25.
8%
25.0
%
29.0
%
-7.2
% -1.1
%
19.2
%
2.0
%
-16.
9%
-18.
0%
21.1
% 25.9
%
-7.5
%
15.4
%
40.9
%
28.3
%
-8.8
%
12.8
%
-30%
-20%
-10%
0%
10%
20%
30%
40%
50%
Hispanic Asian, Non-Hispanic
White, Non-Hispanic
Black, Non-Hispanic
San Benito CountyCaliforniaMonterey CountySanta Cruz CountyMerced County

31
Intermsofeducationalattainment,SanBenitoCountyhasalowerportionofitsadultsresidents(25yearsorolder)withaBachelor’sdegreeormore,thanCaliforniaoranyofthecomparablecountiesexceptforMerced.With15percentofSanBenito’soccupations,classifiedatTier1,theCountyhasarelativelylowpercentageofresidentswithaBachelor’sdegreeorhigher.Figure11:EducationalAttainmentforResidents25andoverbyRegion(2011)20
Obviously,SBWIBhasitsworkcutoutforitintermsofsuccessfullyaddressingtheneedsofitsadultworkforceandtransitioningthemintoeitherOJTorCustomizedTrainingopportunities,apprenticeshipprograms,orsomeotherformof“EarnandLearn”program.AnexampleofpastsuccessforSBWIB,andamodeltoreplicateforhighdemandoccupationalsectorsgoingforward,isthecreationoftheCleanEnergyTechnologyTrainingCenter(CETTC).TheCETTCfocusesoncreatingaworld‐classgreenworkforcebyprovidinglocalaccesstotrainingandeducations.Thepartnersoftheinitiativeincludedbothprivateandpublicentities(SBWIB,andtheInternationalBrotherhoodofElectricalWorkerstonametwo).WorkingcloselywithGalivan,SBWIBandPPBSCwillneedtocreateanaccepteduniformskillsassessmentformtoassessapotentialOne‐StopCareerCenterclient’sreadinessforpostsecondaryeducationprograms.SBWIBandPPBSCwillalsoneedtoseekoutpotentialpartnerswhocanalsoassistinabraidedstrategytocreatemorepathwaysforjobseekerstoreceiveneededtrainingandremedialeducation.
20Source:AmericanCommunitySurvey(ACS)5‐yearestimates2011
58.5%
33.9%
51.4%
41.2%
48.9%
12.0%
34.3%
21.6%
29.4%
17.4%
0% 20% 40% 60% 80% 100%
Merced County
Santa Cruz County
Monterey County
California
San Benito County
Bachelor's Degree or more
High School Diploma or less

32
TheOne‐StopCareerCenterstaffwillneedtocontinueitsintensivecasemanagementforallincomingjobseekers.Asstatedbefore,withthelimitednumberofWIAdollarsallocatedtoSanBenito,themissionoftheSBWIBinrelationtothestatedneedareincongruent,andcasemanagementbecomesharderastheneedintheregionrises.Thiswaspainfullyevidentintherecessioninthelatterpartofthefirstdecadeofthetwenty‐firstcentury.However,SBWIBwillbegintodevotetrainingresourcestothosejobseekerslookingtoentertheidentifiedhigh‐growthprioritycareersectors.Sittingastheonlyregionalcollectionofbusiness,education,organizedlabor,andjobtrainingprofessionalsintheregion,SBWIBistheonlybodyequippedwiththeabilitytoreachouttotheregionalbusinesscommunity,identifytheneedsoftheeconomy,assesstheeducationalrealitiesthatfacetheeducationsystem,identifytheskillsgapsandleveragefundingtoaddressthoseshortages.Partofthisstrategywillbetolookatinnovativeapproachestocareerexperienceattainment,bypartneringwithbusinessesonthecreationofinternshipprogramsforbothadultandyouthjobseekers.Byworkingcloselywiththebusinesscommunity,especiallyintheidentifiedhigh‐growthindustries,notonlywillSBWIBstaffbeabletoidentifyinternshippossibilities,theywillalsobeabletomarkettheOJTandCustomizedTrainingmodelsasviableearnandlearnopportunitiesforjobseekersinthesystem.ThroughtherenewedeffortsoftheBusinessServicesstaffoftheOne‐StopCareerCenter,itisenvisionedthatstaffwillhaveabetterfeelforcurrentbusinessstrainsandchallenges,andwillbeabletobetteraddresstheirneedsintermsofearlydetectionoflay‐offaversiontactics.Byidentifyingthebusinessclimatechallenges,andidentifyingtheresourcesbeingaccumulatedundertheSBWIBauspicesofexistingastheoneandonlyregionaljobtrainingandeducationconvener,SBWIBwillbeinabetterpositiontodeploythealreadylimitedresourcesinamoreefficientmannertobusinessesinneed.SBWIBremainsthesoleresourcefortheregionalworkforcetoattainskillstraininginacomprehensivemanner.ThedevelopmentoftheBusinessServicesPlanasidentifiedinSectionIIIofthisPlanwillgoalongwayinsettingtheSanBenitoworkforceonthepathtocontinuedrecoveryandultimatelyprosperity.

33
SECTION V: YOUTH STRATEGIES YouthGoal:Increasethenumberofhighschoolstudents,withemphasisonat‐riskyouthandthosefromlow‐incomecommunities,whograduatepreparedforpost‐secondaryvocationaltraining,furthereducation,and/oracareer.Describethevisionforincreasingtheeducational,training,andcareerattainmentofyouth,consistentwiththefollowingstatepriorities:
1. Increasethenumberofhighschoolstudentswhocompleteachallengingeducation,includingmathgatewaycourseworkandindustry‐themedpathwaysthatpreparethemforcollege,“EarnandLearn”trainingthroughapprenticeships,OJT,etc.,andotherpostsecondarytraining;and
2. Increasetheopportunitiesforhighschoolstudentsanddisconnectedyouthtotransitionintopostsecondaryeducationandcareers.
3. Thevisionshouldincludethefollowing:a. Adescriptionofthelocalareasorregion’seligibleyouthpopulationand
anyspecialorspecificneedstheymayfacewhichareuniquetothelocalareaorregion;
b. Youthactivitiesavailableinthelocalareaorregion(identifysuccessfulproviderssuchasJobsCorps);
c. AdescriptionoftheWIB’sstrategiestopromotecollaborationbetweentheworkforceinvestmentsystem,education,humanservices,juvenilejustice,JobsCorps,andothersystemstobetterserveyouththataremostinneedandhavesignificantbarrierstoemployment,andtosuccessfullyconnectthemtoeducationandtrainingopportunitiesthatleadtosuccessfulemployment;
d. OrganizationsorbodiessuchastheYouthCouncil,designedtoguideandinformanintegratedvisionforservingyouthintheregionaleconomywithinthecontextofworkforceinvestment,socialservices,juvenilejustice,andeducation(describemembershipofsuchbodiesandthefunctionsandresponsibilitiesinestablishingprioritiesandservicesforyouth);
e. Adescriptionoftheuseanddevelopmentofdemand‐drivenmodelswithbusinessandindustryworkingcollaborativelywiththeworkforceinvestmentsystemandeducationpartnerstodevelopstrategiesforbringingtheseyouthsuccessfullyintotheworkforcepipelinewiththerightskills;
f. Practicesusedtoensurecontinuousqualityimprovementintheyouthprogram;and
g. TheWIB’sstrategy,goalsandobjectivesforensuringthateveryyouthhastheopportunityfordevelopingandachievingcareergoalsthrougheducationand/orworkforcetraining(includingtheyouthmostinneedofassistance,suchasout‐of‐schoolyouth,homelessyouth,youthin

34
fostercare,youthagingoutoffostercare,youthoffenders,childrenofincarceratedparents,migrantandseasonalfarmworkeryouth,youthwithdisabilitiesandotherat‐riskyouth).
TheYouthCouncil(Council)sitsnotonlyasanadvisortotheSBWIB,butalsositsasayouthpolicymaker,andsystemsbuilder.TheCouncilhasidentifiedseveralprioritiesoverthepasttwoyearsintermsofareasoffocus.Oneofthoseprioritiesiscareerpreparationfortheregion’syouth.Throughavigorousoutreacheffort,theCouncilhasidentifiedthefollowingstrategiesforengagingyouthintheregionandgettingthemintointernships,OJTopportunitiesandotherpostsecondaryeducationopportunities:
1. Createentrepreneurshipopportunitieswithregionaleconomicdevelopmentassociationsandbusinesses;
2. Integratecollegeprepcourseworkwithintheeducationalcurriculum;specificallyfocusingonsoftskillstraining,anddevelopmentofclient‐centeredvocationalplans;
3. Secureandleveragein‐kindresources(careerkeynotespeakers,jobshadowing,internships,OJTs,listingsofregionalbusinessesandindividualswillingtoparticipateinHire‐A‐Youthprograms);
4. Increasetrainingfundingby25‐50%;reassesstheallotmentofworkexperiencehours;and
5. Participateincommunity‐widecareerfairsatallschoollocations;gatherbrochuresfromallparticipatingcolleges;havetheOne‐StopCareerCenterhostcollegerepresentativeswhowillgivepresentationsonwhatcollegesarelookingforintheincomingclassesofstudents.
Additionally,theCouncilhasidentifiedanothersetofstrategiesforreachingyouthintermsofacademicreadiness:
1. Creationofmentoringnetworks(e.g.PuenteatGalivanCollege);2. Increaseyouthawarenessofanduseofresourcessuchason‐campus
tutoringusingclassannouncementsandfreedigitalmarketingtechniques;3. ParticipateinResourceFairsinordertoengageanddiscusswithyouth
collegeandtrainingopportunities;4. Arenewedfocusonentryleveljobsthroughvocationaltrainingskills
attainment;RegionalOccupationalProgram;continuallythinkoutsideoftheboxintermsofyouthengagement;
5. Solicitbusinesssponsorshipsforcareer‐orientedclubs;and6. Partnerwithonandoffsiteorganizationsthatprovideafterschoolprograms
andtutoring.With31%ofthecounty’spopulationbeing19oryounger(seeSectionIV,Figure7),andmanyoftheyouthgraduatingfromtheK‐12systemwithsignificantdeficienciesinbothEnglish(80%)andMath(90%),andmuchoftheregionaleconomystill

35
depressedfromtheleanyearsoftherecession,itisespeciallydifficulttoengageyouthintheregion.,andprovidethemwithcareertrainingopportunitiesinabusinessenvironmentnotfinanciallyrobustenoughtohirethem.However,unlikeintheadultprogram/economicdevelopmentarena,thereareotherorganizationschargedwithassistingtheyouthoftheregion.NotwithstandingtheK‐12andpostsecondaryeducationalsystems,HeadStartrunsaprogram,aswellastheestablishmentoftheCommunityFoundationforSanBenitoCounty’sYOUthMatter!programwhichattemptstoengageyouthindecisionsaboutthecounty’sfuture,benchmarkstheirresponsesforfutureyear’scomparisons,andsharetheopinionsoflocalyouth.TheYMCA,HollisterYouthAlliance,andtheUnitedWayhaveallusedtheYOUthMatter!surveytomapoutstrategies.TheCouncilwillmarshalresourcestoassistinthisyouthmappinginitiativeandbolsterthesuccessfulengagementactivitiesoftheregion.Inaddition,theCouncilhasalsopublisheditsYouthServicesDirectorywhichcompilesalloftheregionalyouthactivitiesandserviceprovidersinthecounty.TheCouncilisWIA‐mandated(WIATitleI,Chapter2Section117(h)(4))21,andconsistsofseveralmemberswhichrepresentvariousinterestsinyouthengagement,employment,training,education,andjuvenilejustice.However,astherestoftheWIA‐fundedsysteminthecountyis,theCouncilisextremelylimitedinitsabilitytocreatesustainablepartnershipswithbusinessrepresentativeswithonlyapproximately$200,000toservealloftheidentifiedneedsandgapsintheyouthpopulation.Withthatsaid,however,theCouncilwillworkcloselywiththeSBWIBtoidentifybusinesspartnersinthehigh‐growthprioritybusinesssectorswithwhichtopartnerandestablishtheEarnandLearnopportunitiessoughtbythestate.Thiswillentailtheimplementationofaqualityassessmentandimprovementplantoevaluatethelevelofengagementattainedandbenchmarkagainstpastperformance.
21http://www.doleta.gov/usworkforce/wia/wialaw.pdf

36
SECTION VI: ADMINISTRATION SystemAlignmentandAccountabilityGoal:Supportsystemalignment,serviceintegrationandcontinuousimprovementusingdatatosupportevidence‐basedpolicymaking.
1. DescribehowtheWIBisacommunityleaderonworkforceissuescomparedwithotherorganizations;
2. Describehowthelocalplanningprocesstookintoaccounttheentireworkforcetrainingpipelinefortherelevantregionaleconomy,includingpartnersinK‐12education,careertechnicalandvocationaleducation,thecommunitycollegesystem,otherpostsecondaryinstitutions,andotherlocalworkforceinvestmentareas;
3. Describehowthelocalplanningprocessinvolvedkeystakeholders,includingthemajorpriority‐sectoremployersintherelevantregionaleconomyandorganizedlabor(includewrittendocumentationofstakeholderinvolvement);
4. DescribetheprocessusedbytheWIBtoprovideanopportunityforpubliccomment,includingcommentbyrepresentativesofbusinesses,andcommentbyrepresentativesoflabororganizations,andinputintothedevelopmentoftheLocalPlan,priortosubmissionoftheplan–includewiththeLocalPlananysuchcommentsthatrepresentdisagreementwiththeplan;
5. Identifytheentityresponsibleforthedisbursementofgrantfunds,providingadescriptionofthecompetitiveprocessusedtoawardgrantsandcontractsintheregionforactivitiescarriesoutundertheplan;
6. DescribethelocalOne‐StopsystemincludingasanattachmentalistoftheOne‐Stoplocationsintheregion;
7. ProvideacomprehensivelistofallservicesprovidedineachOne‐Stopintheregion;
8. DescribetheWIB’sstrategiestoensurethatthefullrangeofemploymentandtrainingprogramsandservicesdeliveredthroughtheOne‐Stopdeliverysystemareaccessibleto,andwillmeettheneedsof,dislocatedworkers,displacedhomemakers,low‐incomeindividuals,migrantandseasonalfarmworkers,women,minorities,individualstrainingfornon‐traditionalemployment,veterans,publicassistancerecipientsandindividualswithmultiplebarrierstoemployment(includingolderindividuals,limitedEnglishproficiencyindividuals,andpersonswithdisabilities);
9. DescribetheWIB’sstrategiestosupportthecreation,sustainability,andgrowthofsmallbusinessesandsupportfortheworkforceneedsofsmallbusinessesaspartofthelargereconomicstrategy;
10. Describethestrategiesinplacetoensurethatsufficientsystemresourcesarebeingspenttosupporttrainingofindividualsinprioritysectors;
11. DescribehowWIAfundswillbeusedtoleverageandbraidotherfederal,state,localandprivateresources(howdothesecoordinatedandleveragedresources

37
leadtoamoreeffectivelocalsystemthatexpandstheinvolvementofbusiness,employersandindividuals?);
12. DescribehowtheWIBwillensurethecontinuousimprovementoftrainingproviderslistedontheETPLandensurethatsuchprovidersmeettheemploymentneedsoflocalareaemployersandparticipants;
13. DescribehowtheWIBisservingUIandTAAprogramservicerecipients;14. DescribehowtheWIBrecognizesopportunitiestoprepareworkersfor“green
jobs”relatedtoothersourcesoffederalfunding;15. DescribethepoliciesinplacetointegratethefederalregisteredandstateDAS‐
approvedapprenticeshipprogramsandtheJobCorpsinthelocalOne‐Stopsystem;
16. ProvideacopyoftheWIB’sBylaws;and17. DescribetheprocessbywhichtheLocalPlanwillbeupdatedtoincludenew
andrelevantinformation.AsstatedearlierinseveralsectionsofthePlan,withthedissolutionoftheregionalEDC,theSBWIBstandsaloneasthelonecommunityleaderonworkforceissues.Theresimplyisnotanotherorganizationdesignedorequippedtoperformsuchafunctioninthecounty.SBWIBengagedanindependentcontractortoperformthegatheringofallinformationincludedinthisPlan.Theconsultantconductednumerousstakeholderinterviewstosolicitfeedbackonlocalandstatepriorities.Detaileddiscussionswithrepresentativesfromthelocaleducationsystems,bothK‐12andpostsecondaryeducation,informedthePlanintermsofeducationpipeline,challengesandstrategies.ThePlanwaspostedontheSBWIB’swebsitefor30daysbeginningonMay31,2013.Noticewasalsopostedinthelocalnewspaper.GoingforwardthePPBSCwillnotonlyestablishnewbutalsomaintainandnurtureexistingfeedbackloopsestablishedwithlocalandregionalemployersontheplanningprocessforprogramsandstrategies.TheSBWIBistheidentifiedentitydesignatedtodisbursegrantfunds.FundsaregrantedthroughacompetitiveRFPprocess.TheRFPisdistributedbySBWIBandtheevaluationoftheRFPsisalsoconductedbytheSBWIB,specificallybythePPBSC.ThereisonlyoneOne‐StopCareerCenterinthecounty.TheCenterislocatedwithinthecountybuildinginHollisterwheretheremainderoftheCommunityServicesandWorkforceDevelopmentDepartmentofthecountyisalsolocated.InsideoftheCenterarelocatedrepresentativesfromthecounty,aswellasthemandatorypartnersincluding,butnotlimitedto:theCaliforniaDepartmentofVocationalRehabilitation,CountyOfficeofEducation,EDD.GalivanCollege,andmanyothers.TheCenterislocatedat:1111SanFelipeRoadinHollister,CA95023.TheCenteriswhollynestedwithinthecountystructureitselfandisnotoperatedbyanoutsideentity.

38
ListingofservicesofferedintheOne‐StopCareerCenter:
AssistanceStartingaBusiness BusinessResourceLibrary CareerTraining ChildCareResourceandReferral ComputerWorkStations DownsizingAversionReferrals EmployeeRetentionandCoaching FirstMonth’sRentalAssistance FormsAssistance InterviewAssistance InterviewFacility JobDescriptionDevelopment JobPlacementAssistance JobSearchWorkshops JobsSearchAssistance LMI ManagementWorkshops&Seminars OJT PacificGasandElectricAssistanceorPropane Re‐TrainingCourses RecruitmentActivities Referrals ReferralsforOtherServices RehabilitationAssessment ResumeAssistance RetrainingInformation,Opportunities,andSchools SeniorEmploymentServices SkillsTraining SpecialApplicantScreening StopEvictionAssistance UnemploymentInsurance VocationalandCareerAssessment
SmallbusinessisthelifebloodofnotonlySanBenitoCounty,butthenationasawhole.Nomoreimportantthananywhereelse,theSBWIBunderstandstheneedtocreate,sustainandgrowsmallbusinessinordertoestablishaninfrastructuredesignedtosupporttheworkforceoftheregion.ThedepressedeconomicandbusinessattractioneffortsintheregionmakeitallthemoreimportantforSBWIBtoestablishandmaintainstronglinkageswithsmallbusinessesintheregion.Fromentrepreneurialopportunities,toretailestablishments,theSBWIBwillbeworkingwithlocalbusinessownersandassociationstoidentifyworkforceand

39
skillsneeds.TheSBWIBhasdiscussedcreatingataskforcetodojustthis,andwithitsplanstoestablishbusinessnetworksthroughouttheregion,theywillfeedtheirfindingsandaccomplishmentsintothelargerstrategiesestablishedinthePlan.However,tobeatthesamerefrain,fundingisanissuefortheSBWIB.Withonly$600,000toexpendforalloftheworkforcetraining,services,andactivitiesintheregion,realisticplansneedtobeestablished,andefficientuseofthefundingwillfirstneedtobevettedatthePPBSCandthenwithneedthefullSBWIB’sfinaldecisiononanyexpenditure.ThesedecisionswillnowbeviewedthroughthenewlyestablishedlensoftheprioritysectorsasestablishedinthisPlan.Withfundingbeingthemainimpedimentfortheregiontoaccomplishitsstatedgoals,itisincumbentupontheSBWIBtocontinuallyseekoutfundedpartnerswhowillassisttheWIBinaccomplishingitsstatedgoals.Thisisanongoingobstacleandawell‐establishedgoaloftheregion.Braidingnotonlyservices,butleveragingfundingsourcesisinherentintheregion’sworkforcestrategicfabric.BeingwhollynestedwithinthecountystructureallowstheSBWIBtobenefitfromcertainfundingnottiedtoWIA(i.e.TANF,etc.),andmakingsurethereisstrategicalignmentwithsuchprogramsisalsoapriorityoftheSBWIB.Toensurejobseekersareappropriatelyprovidedqualitytraining,theSBWIBhasdiscussedtheneedtoevaluatetheserviceprovidersontheEligibleTrainingProviderList(ETPL).EstablishingbenchmarkcriteriaforlocaltraininginstitutionsandspecificallyfortheemergingemploymentsectorsidentifiedinthisPlan,willbeagoalinthecomingyearfortheSBWIB.EDDisafullpartnerwithintheOne‐StopCareerCenter,andanyassistanceneededwithUnemploymentInsurance,claimantscanalwaysavailthemselvesofWagner‐Peyserstaff.Additionally,TradeAdjustmentAssistancerecipientscanalsoreceiveassistanceattheOne‐StopCareerCenter.TheGreenEconomyhasbeenontheradaroftheSBWIBforseveralyearsnow,asevidencedbythecreationoftheabove‐referencedCleanEnergyTechnologyCenter.FindingadditionalopportunitiestopartnerlocallyandregionallywithothercountiesandinitiativesisalwaysattheforefrontoftheSBWIB’scollectivefocus.Unionrepresentationintheregionisverylimitedandapprenticeshipprogramsinnon‐uniontradesisvirtuallynon‐existent.Duringtherecession,theconstructionindustryexperiencedasignificantdecline,andconsequentlythenumberofapprenticeshipclasseshasdeclinedoverthepasttwoyears.However,sinceJanuary2013classesareonceagainbeginningtoincrease.Therearenowonepre‐apprenticeshipclass,onemetallathersclass,andtwoframingclasses.TheSBWIB,withrepresentativesfromorganizedlabor,willcontinuetoworkwiththetradestoestablishmorecoursesandprograms.ThisplanwillbeannuallyrevisitedbythePPBSCandSBWIBtoidentifyareasoffocus,andareasinneedofrevision.Theannualrevisionwillincludeare‐evaluation

40
ofthepriorityhigh‐growthsectors,andtheapplicabilityofthemtotheregion’seconomyasestablishedbyLMI.Additionally,thePPBSCandSBWIBwillmakerecommendationsastowhichportionsofthePlantheywishtoupdateandhowtheyseektomodifythePlan’sstrategies,andwillseekthepublic’sinputonayearlybasisthroughapubliccommentprocess.CopiesoftheSBWIBbylawsareattached.

41
SECTION VII: MEMORANDA OF UNDERSTANDING WIArequiresanexecutedMOUbetweentheWIBandeachoftheOne‐StoppartnersconcerningtheoperationoftheOne‐Stopdeliverysystem.AcopyofeachMOUmustbeincludedwiththeLocalPlanpursuanttoWIASection118(b)(2)(B).IftheLocalPlanidentifiesspecificservicesthataredeliveredbyaOne‐Stoppartner,theMOUwiththatpartnershalldescribewhattherelationshipisandcontaintherequiredelementsbelow.AcopyofanexecutedMOUshallbeincludedforeveryrequiredpartnerprogramidentifiedinWIA.
TheMOUsmaybedevelopedasasingleumbrelladocument,orassingularagreementsbetweenthepartnersandtheWIB.TheMOUsshouldpresentinspecifictermsmembercontributionsandthemutualmethodologiesusedinoverseeingtheoperationsoftheOne‐Stopsystem.WIASection121(c)(1)and(2)andUICodeSection14230(d)requireeachMOUtodescribe:
1. TheservicestobeprovidedthroughtheOne‐Stopsystem;2. Howtheservicesandoperatingcostswillbefunded(pleaseincludeany
ResourceSharingAgreements);3. ThemethodsusedforreferralofindividualsbetweentheOne‐Stopoperator
andpartners;4. ThedurationoftheMOU;5. TheproceduresthathavebeendevelopedforamendingtheMOU;6. OtherprovisionsasdeemednecessarybytheWIB;and7. TheWIB’spolicyforidentifyingindividualswhoshouldbereferred
immediatelytotrainingservices.DuetothenumberandlengthofeachMOU,theMOUscurrentlyineffectarenotincludedinthisdocumentduringthePublicCommentperiod.However,copiesofthefollowingMOUsarekeptonfilewiththeCountyofSanBenitoandwillbemadeavailabletothepublicuponrequest:
Aromas‐SanJuanUnifiedSchoolDistrict GavilanCollege GoKids,Inc. GreenThumb(ExperienceWorks) StateofCaliforniaDepartmentofRehabilitation StateofCalifornia’sEmploymentDevelopmentDepartment SanBenitoCountyHealthandHumanServicesAgency SanBenitoCountyOfficeofEducation SanBenito–EconomicDevelopmentCorporation

42
SanBenitoHighSchool SantaClaraCountyRegionalOccupationalProgram–South(SCROP) SmallBusinessDevelopmentCorporation(SBDC)

43
SECTION VIII: LOCAL WIA COMMON MEASURES PERFORMANCE GOALS
WIASECTION136(b)COMMONMEASURES
2012/13STATEGOAL
2013/14LWIAGOAL
ADULT EnteredEmployment 59.0% 73%EmploymentRetention 81.0% 75.5%AverageSix‐MonthsEarnings $13,700 $10,500 DISLOCATEDWORKER EnteredEmployment 64.5% 70%EmploymentRetention 84.0% 77%AverageSix‐MonthsEarnings $18,543 $13,500 YOUTHCOMMONMEASURES PlacementinEmploymentorEducation 72.0% 65%AttainmentofaDegreeorCertificate 60.0% 61%LiteracyandNumeracy 54.0% 40%

44
ATTACHMENT1
ONE‐STOPCAREERCENTERLOCATIONS1111SanFelipeRoadHollister,CA95023831‐637‐5627

45
ATTACHMENT2
SANBENITOWORKFORCEINVESTMENTBOARDBYLAWS
TOBEINSERTED
Related Documents