Samsung Electro-Mechanics Co., Ltd. and Subsidiaries Consolidated Financial Statements December 31, 2021 and 2020

Welcome message from author
This document is posted to help you gain knowledge. Please leave a comment to let me know what you think about it! Share it to your friends and learn new things together.
Transcript
Samsung Electro-Mechanics Co., Ltd. and Subsidiaries Consolidated Financial Statements December 31, 2021 and 2020
Samsung Electro-Mechanics Co., Ltd. and Subsidiaries Index December 31, 2021 and 2020
Page(s) Independent Auditor’s Report ………………………………………………………………………………… 1 ~ 4
Consolidated Financial Statements
Consolidated Statements of Financial Position …………………………………………………………… 5 ~ 6
Consolidated Statements of Comprehensive Income …………………………………………….……… 7 ~ 8
Consolidated Statements of Changes in Equity …………………………………………………….…… 9 ~ 10
Consolidated Statements of Cash Flows ……………………………………………………………………… 11
Notes to the Consolidated Financial Statements ……………………………………………………… 12 ~ 77
Independent Auditor’s Report
(English Translation of a Report Originally Issued in Korean)
To the Shareholders and Board of Directors of
Samsung Electro-Mechanics Co., Ltd.
Opinion
We have audited the accompanying consolidated financial statements of Samsung Electro-Mechanics Co., Ltd.
and its subsidiaries (collectively referred to as the "Group"), which comprise the consolidated statements of
financial position as at December 31, 2021 and 2020, and the consolidated statements of comprehensive
income, consolidated statements of changes in equity and consolidated statements of cash flows for the years
then ended, and notes to the consolidated financial statements, including a summary of significant accounting
policies.
In our opinion, the accompanying consolidated financial statements present fairly, in all material respects, the
consolidated financial position of the Group as at December 31, 2021 and 2020, and its consolidated financial
performance and its consolidated cash flows for the years then ended in accordance with International Financial
Reporting Standards as adopted by the Republic of Korea (“Korean IFRS”).
Basis for Opinion
We conducted our audits in accordance with Korean Standards on Auditing. Our responsibilities under those
standards are further described in the Auditor’s Responsibilities for the Audit of the Consolidated Financial
Statements section of our report. We are independent of the Group in accordance with the ethical requirements
of the Republic of Korea that are relevant to our audit of the consolidated financial statements and we have
fulfilled our other ethical responsibilities in accordance with the ethical requirements. We believe that the audit
evidence we have obtained is sufficient and appropriate to provide a basis for our audit opinion.
Emphasis of Matter
Without modifying our opinion, we draw attention to Note 28 to the consolidated financial statements of the
Group. As explained in Note 28, the Group classified the rigid flex printed circuit board business to discontinued
operations for the year ended December 31, 2021. Accordingly, related gains or losses are classified and
presented as the profit (loss) from discontinued operations in the consolidated statement of comprehensive
income, and comparative consolidated statement of comprehensive income was restated.
2
Key Audit Matters
Key audit matters are those matters that, in our professional judgment, were of most significance in our audit of
the consolidated financial statements of the current period. These matters were addressed in the context of our
audit of the consolidated financial statements as a whole, and in forming our opinion thereon, and we do not
provide a separate opinion on these matters.
Revenue recognition cut- off related to sales of goods
Reason why the matter was determined to be a key audit matter
As described in Note 2 to the consolidated financial statements, the Group is engaged in manufacturing and
selling electronics components. Revenue from contracts with customers is recognized when control of the goods
is transferred to the customer with the relevant consideration.
The timing of the transfer of control of the Group’s products may vary depending on transaction agreements
with customers and export terms and conditions, and management’s judgement on the timing of revenue
recognition is required. Considering the possibility of deliberate manipulation or potential error, we determined
the revenue recognition cut-off related to sales of goods as a Key Audit Matter.
How our audit addressed the Key Audit Matter
Key audit procedures we have performed in relation to the Group’s revenue recognition cut-off are as follows. • Evaluated reasonableness of the Group’s accounting policy and standard for revenue recognition cut-off.
• Obtained an understanding of controls over sales and accounting systems and evaluated the design and
operational effectiveness of those controls. • Examined the relevant transaction agreements and evidences through audit sampling at transaction level
from sales records that occurred before and after the end of the reporting period. • Determined whether there are any unusual changes by analyzing monthly sales trend of major customers.
• Examined the cause of cancellation and the relevant evidences through audit sampling from sales records
canceled within a short period after the end of the reporting period.
Other Matters
Auditing standards and their application in practice vary among countries. The procedures and practices used
in the Republic of Korea to audit such consolidated financial statements may differ from those generally
accepted and applied in other countries.
The accompanying consolidated financial statements as of and for the years ended December 31, 2021 and
2020, have been translated into the U.S. dollars solely for the convenience of the reader and have been
translated on the basis set forth in Note 2 to the consolidated financial statements.
3
Responsibilities of Management and Those Charged with Governance for the Consolidated Financial
Statements
Management is responsible for the preparation and fair presentation of the consolidated financial statements in
accordance with Korean IFRS, and for such internal control as management determines is necessary to enable
the preparation of consolidated financial statements that are free from material misstatement, whether due to
fraud or error.
In preparing the consolidated financial statements, management is responsible for assessing the Group’s ability
to continue as a going concern, disclosing, as applicable, matters related to going concern and using the going
concern basis of accounting unless management either intends to liquidate the Group or to cease operations.
Those charged with governance are responsible for overseeing the Group’s financial reporting process.
Auditor’s Responsibilities for the Audit of the Consolidated Financial Statements
Our objectives are to obtain reasonable assurance about whether the consolidated financial statements as a
whole are free from material misstatement, whether due to fraud or error, and to issue an auditor’s report that
includes our opinion. Reasonable assurance is a high level of assurance, but is not a guarantee that an audit
conducted in accordance with Korean Standards on Auditing will always detect a material misstatement when
it exists. Misstatements can arise from fraud or error and are considered material if, individually or in the
aggregate, they could reasonably be expected to influence the economic decisions of users taken on the basis
of these consolidated financial statements.
As part of an audit in accordance with Korean Standards on Auditing, we exercise professional judgment and
maintain professional skepticism throughout the audit. We also:
• Identify and assess the risks of material misstatement of the consolidated financial statements, whether due
to fraud or error, design and perform audit procedures responsive to those risks, and obtain audit evidence that
is sufficient and appropriate to provide a basis for our opinion. The risk of not detecting a material misstatement
resulting from fraud is higher than for one resulting from error, as fraud may involve collusion, forgery, intentional
omissions, misrepresentations, or the override of internal control. • Obtain an understanding of internal control relevant to the audit in order to design audit procedures that are
appropriate in the circumstances, but not for the purpose of expressing an opinion on the effectiveness of the
entity's internal control. • Evaluate the appropriateness of accounting policies used and the reasonableness of accounting estimates
and related disclosures made by management. • Conclude on the appropriateness of management’s use of the going concern basis of accounting and, based
on the audit evidence obtained, whether a material uncertainty exists related to events or conditions that may
cast significant doubt on the Group’s ability to continue as a going concern. If we conclude that a material
uncertainty exists, we are required to draw attention in our auditor’s report to the related disclosures in the
consolidated financial statements or, if such disclosures are inadequate, to modify our opinion. Our conclusions
are based on the audit evidence obtained up to the date of our auditor’s report. However, future events or
conditions may cause the Group to cease to continue as a going concern. • Evaluate the overall presentation, structure and content of the consolidated financial statements, including the
disclosures, and whether the consolidated financial statements represent the underlying transactions and
events in a manner that achieves fair presentation. • Obtain sufficient appropriate audit evidence regarding the financial information of the entities or business
activities within the Group to express an opinion on the consolidated financial statements. We are responsible
for the direction, supervision and performance of the Group audit. We remain solely responsible for our audit
opinion.
4
We communicate with those charged with governance regarding, among other matters, the planned scope and
timing of the audit and significant audit findings, including any significant deficiencies in internal control that we
identify during our audit.
We also provide those charged with governance with a statement that we have complied with relevant ethical
requirements regarding independence, and to communicate with them all relationships and other matters that
may reasonably be thought to bear on our independence, and where applicable, related safeguards.
From the matters communicated with those charged with governance, we determine those matters that were of
most significance in the audit of the consolidated financial statements of the current period and are therefore
the key audit matters. We describe these matters in our auditor’s report unless law or regulation precludes public
disclosure about the matter or when, in extremely rare circumstances, we determine that a matter should not
be communicated in our report because the adverse consequences of doing so would reasonably be expected
to outweigh the public interest benefits of such communication.
The engagement partner on the audit resulting in this independent auditor’s report is Joonki Hong, Certified
Public Accountant.
Seoul, Korea
February 22, 2022
This report is effective as of February 22, 2022, the audit report date. Certain subsequent events or
circumstances, which may occur between the audit report date and the time of reading this report, could have
a material impact on the accompanying consolidated financial statements and notes thereto. Accordingly, the
readers of the audit report should understand that there is a possibility that the above audit report may have
to be revised to reflect the impact of such subsequent events or circumstances, if any.
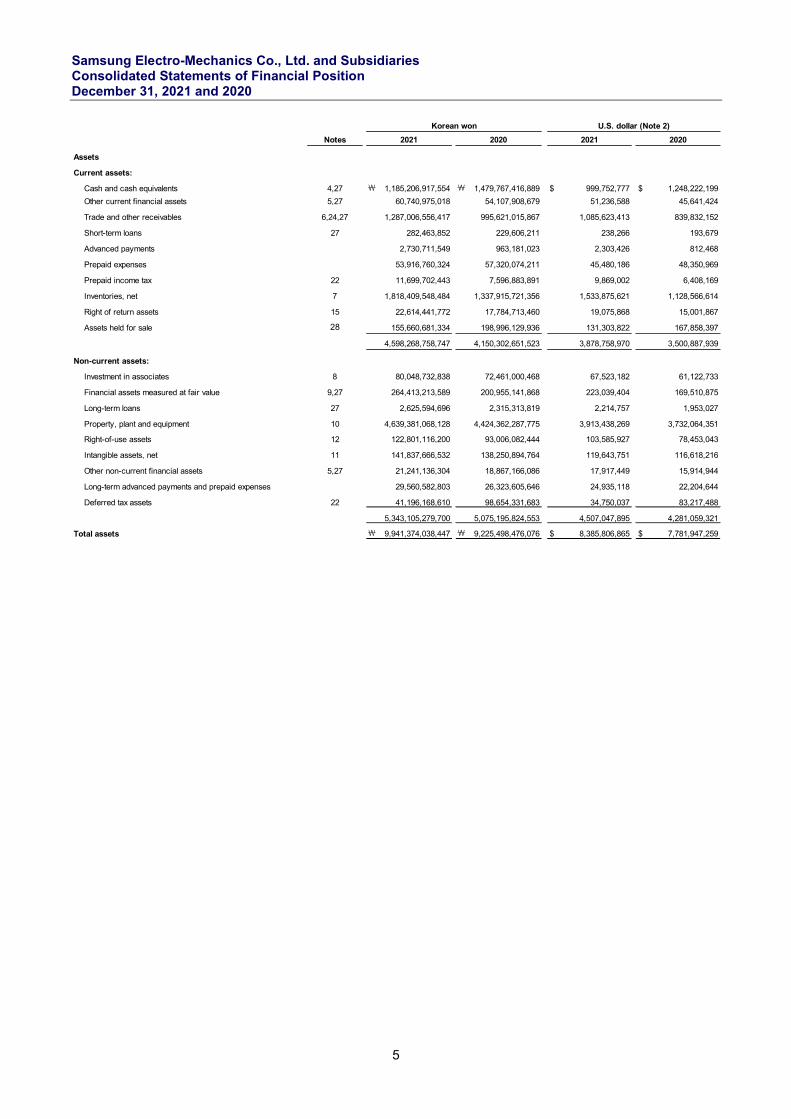
Samsung Electro-Mechanics Co., Ltd. and Subsidiaries Consolidated Statements of Financial Position December 31, 2021 and 2020
5
Notes
Assets
Current assets:
Cash and cash equivalents 4,27 ₩ 1,185,206,917,554 ₩ 1,479,767,416,889 $ 999,752,777 $ 1,248,222,199
Other current financial assets 5,27 60,740,975,018 54,107,908,679 51,236,588 45,641,424
Trade and other receivables 6,24,27 1,287,006,556,417 995,621,015,867 1,085,623,413 839,832,152
Short-term loans 27 282,463,852 229,606,211 238,266 193,679
Advanced payments 2,730,711,549 963,181,023 2,303,426 812,468
Prepaid expenses 53,916,760,324 57,320,074,211 45,480,186 48,350,969
Prepaid income tax 22 11,699,702,443 7,596,883,891 9,869,002 6,408,169
Inventories, net 7 1,818,409,548,484 1,337,915,721,356 1,533,875,621 1,128,566,614
Right of return assets 15 22,614,441,772 17,784,713,460 19,075,868 15,001,867
Assets held for sale 28 155,660,681,334 198,996,129,936 131,303,822 167,858,397
4,598,268,758,747 4,150,302,651,523 3,878,758,970 3,500,887,939
Non-current assets:
Investment in associates 8 80,048,732,838 72,461,000,468 67,523,182 61,122,733
Financial assets measured at fair value 9,27 264,413,213,589 200,955,141,868 223,039,404 169,510,875
Long-term loans 27 2,625,594,696 2,315,313,819 2,214,757 1,953,027
Property, plant and equipment 10 4,639,381,068,128 4,424,362,287,775 3,913,438,269 3,732,064,351
Right-of-use assets 12 122,801,116,200 93,006,082,444 103,585,927 78,453,043
Intangible assets, net 11 141,837,666,532 138,250,894,764 119,643,751 116,618,216
Other non-current financial assets 5,27 21,241,136,304 18,867,166,086 17,917,449 15,914,944
Long-term advanced payments and prepaid expenses 29,560,582,803 26,323,605,646 24,935,118 22,204,644
Deferred tax assets 22 41,196,168,610 98,654,331,683 34,750,037 83,217,488
5,343,105,279,700 5,075,195,824,553 4,507,047,895 4,281,059,321
Total assets ₩ 9,941,374,038,447 ₩ 9,225,498,476,076 $ 8,385,806,865 $ 7,781,947,259
Korean won U.S. dollar (Note 2)
20212021 2020 2020
Samsung Electro-Mechanics Co., Ltd. and Subsidiaries Consolidated Statements of Financial Position December 31, 2021 and 2020
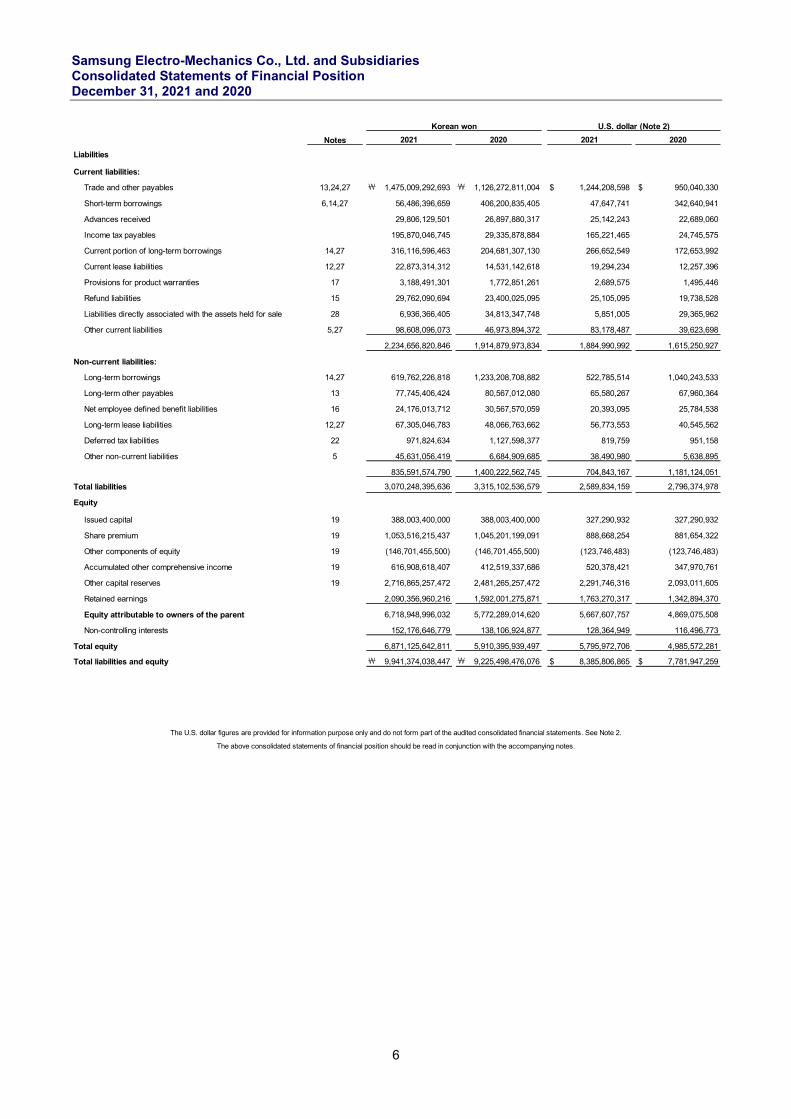
6
Notes
Liabilities
Current liabilities:
Trade and other payables 13,24,27 ₩ 1,475,009,292,693 ₩ 1,126,272,811,004 $ 1,244,208,598 $ 950,040,330
Short-term borrowings 6,14,27 56,486,396,659 406,200,835,405 47,647,741 342,640,941
Advances received 29,806,129,501 26,897,880,317 25,142,243 22,689,060
Income tax payables 195,870,046,745 29,335,878,884 165,221,465 24,745,575
Current portion of long-term borrowings 14,27 316,116,596,463 204,681,307,130 266,652,549 172,653,992
Current lease liabilities 12,27 22,873,314,312 14,531,142,618 19,294,234 12,257,396
Provisions for product warranties 17 3,188,491,301 1,772,851,261 2,689,575 1,495,446
Refund liabilities 15 29,762,090,694 23,400,025,095 25,105,095 19,738,528
Liabilities directly associated with the assets held for sale 28 6,936,366,405 34,813,347,748 5,851,005 29,365,962
Other current liabilities 5,27 98,608,096,073 46,973,894,372 83,178,487 39,623,698
2,234,656,820,846 1,914,879,973,834 1,884,990,992 1,615,250,927
Non-current liabilities:
Long-term borrowings 14,27 619,762,226,818 1,233,208,708,882 522,785,514 1,040,243,533
Long-term other payables 13 77,745,406,424 80,567,012,080 65,580,267 67,960,364
Net employee defined benefit liabilities 16 24,176,013,712 30,567,570,059 20,393,095 25,784,538
Long-term lease liabilities 12,27 67,305,046,783 48,066,763,662 56,773,553 40,545,562
Deferred tax liabilities 22 971,824,634 1,127,598,377 819,759 951,158
Other non-current liabilities 5 45,631,056,419 6,684,909,685 38,490,980 5,638,895
835,591,574,790 1,400,222,562,745 704,843,167 1,181,124,051
Total liabilities 3,070,248,395,636 3,315,102,536,579 2,589,834,159 2,796,374,978
Equity
Issued capital 19 388,003,400,000 388,003,400,000 327,290,932 327,290,932
Share premium 19 1,053,516,215,437 1,045,201,199,091 888,668,254 881,654,322
Other components of equity 19 (146,701,455,500) (146,701,455,500) (123,746,483) (123,746,483)
Accumulated other comprehensive income 19 616,908,618,407 412,519,337,686 520,378,421 347,970,761
Other capital reserves 19 2,716,865,257,472 2,481,265,257,472 2,291,746,316 2,093,011,605
Retained earnings 2,090,356,960,216 1,592,001,275,871 1,763,270,317 1,342,894,370
Equity attributable to owners of the parent 6,718,948,996,032 5,772,289,014,620 5,667,607,757 4,869,075,508
Non-controlling interests 152,176,646,779 138,106,924,877 128,364,949 116,496,773
Total equity 6,871,125,642,811 5,910,395,939,497 5,795,972,706 4,985,572,281
Total liabilities and equity ₩ 9,941,374,038,447 ₩ 9,225,498,476,076 $ 8,385,806,865 $ 7,781,947,259
Korean won U.S. dollar (Note 2)
2021
The U.S. dollar figures are provided for information purpose only and do not form part of the audited consolidated financial statements. See Note 2.
The above consolidated statements of financial position should be read in conjunction with the accompanying notes.
2020 20202021
Samsung Electro-Mechanics Co., Ltd. and Subsidiaries Consolidated Statements of Comprehensive Income December 31, 2021 and 2020
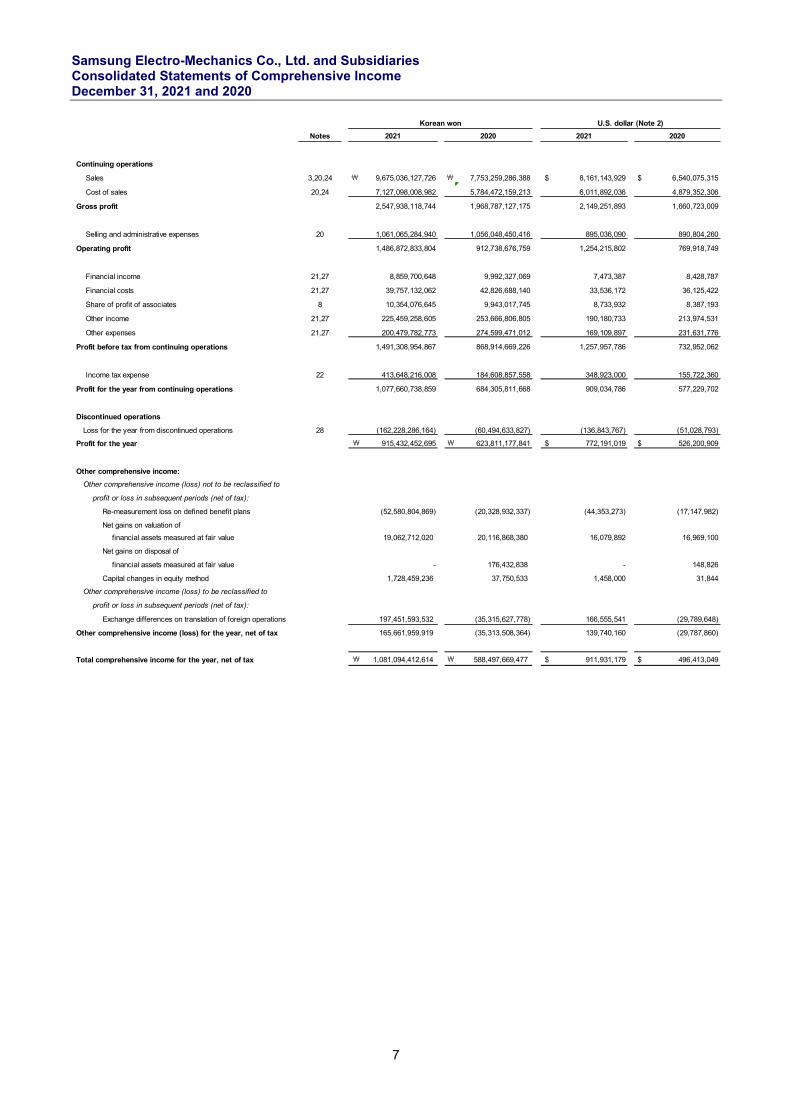
7
Notes
Continuing operations
Sales 3,20,24 ₩ 9,675,036,127,726 ₩ 7,753,259,286,388 $ 8,161,143,929 $ 6,540,075,315
Cost of sales 20,24 7,127,098,008,982 5,784,472,159,213 6,011,892,036 4,879,352,306
Gross profit 2,547,938,118,744 1,968,787,127,175 2,149,251,893 1,660,723,009
Selling and administrative expenses 20 1,061,065,284,940 1,056,048,450,416 895,036,090 890,804,260
Operating profit 1,486,872,833,804 912,738,676,759 1,254,215,802 769,918,749
Financial income 21,27 8,859,700,648 9,992,327,069 7,473,387 8,428,787
Financial costs 21,27 39,757,132,062 42,826,688,140 33,536,172 36,125,422
Share of profit of associates 8 10,354,076,645 9,943,017,745 8,733,932 8,387,193
Other income 21,27 225,459,258,605 253,666,806,805 190,180,733 213,974,531
Other expenses 21,27 200,479,782,773 274,599,471,012 169,109,897 231,631,776
Profit before tax from continuing operations 1,491,308,954,867 868,914,669,226 1,257,957,786 732,952,062
Income tax expense 22 413,648,216,008 184,608,857,558 348,923,000 155,722,360
Profit for the year from continuing operations 1,077,660,738,859 684,305,811,668 909,034,786 577,229,702
Discontinued operations
Loss for the year from discontinued operations 28 (162,228,286,164) (60,494,633,827) (136,843,767) (51,028,793)
Profit for the year \ 915,432,452,695 \ 623,811,177,841 $ 772,191,019 $ 526,200,909
Other comprehensive income:
Other comprehensive income (loss) not to be reclassified to
profit or loss in subsequent periods (net of tax):
Re-measurement loss on defined benefit plans (52,580,804,869) (20,328,932,337) (44,353,273) (17,147,982)
Net gains on valuation of
financial assets measured at fair value 19,062,712,020 20,116,868,380 16,079,892 16,969,100
Net gains on disposal of
financial assets measured at fair value - 176,432,838 - 148,826
Capital changes in equity method 1,728,459,236 37,750,533 1,458,000 31,844
Other comprehensive income (loss) to be reclassified to
profit or loss in subsequent periods (net of tax):
Exchange differences on translation of foreign operations 197,451,593,532 (35,315,627,778) 166,555,541 (29,789,648)
Other comprehensive income (loss) for the year, net of tax 165,661,959,919 (35,313,508,364) 139,740,160 (29,787,860)
Total comprehensive income for the year, net of tax \ 1,081,094,412,614 \ 588,497,669,477 $ 911,931,179 $ 496,413,049
Korean won U.S. dollar (Note 2)
2021 2020 2021 2020
Samsung Electro-Mechanics Co., Ltd. and Subsidiaries Consolidated Statements of Comprehensive Income December 31, 2021 and 2020
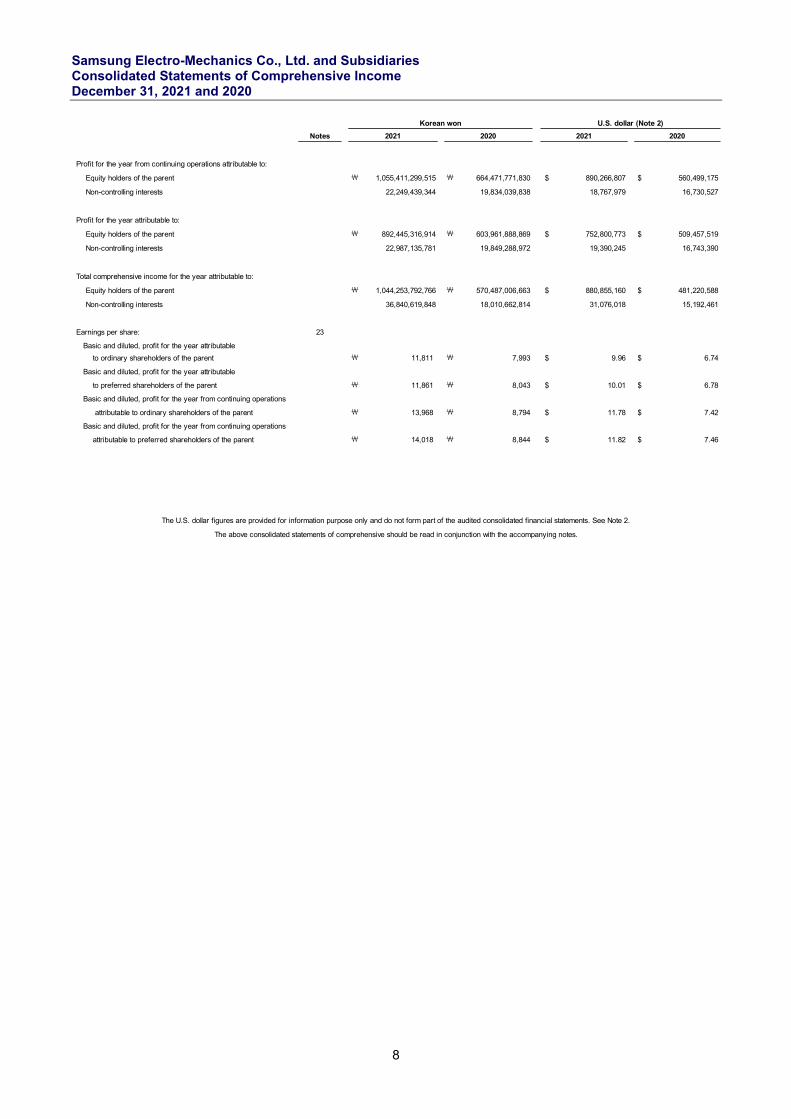
8
Notes
Profit for the year from continuing operations attributable to:
Equity holders of the parent ₩ 1,055,411,299,515 ₩ 664,471,771,830 $ 890,266,807 $ 560,499,175
Non-controlling interests 22,249,439,344 19,834,039,838 18,767,979 16,730,527
Profit for the year attributable to:
Equity holders of the parent ₩ 892,445,316,914 ₩ 603,961,888,869 $ 752,800,773 $ 509,457,519
Non-controlling interests 22,987,135,781 19,849,288,972 19,390,245 16,743,390
Total comprehensive income for the year attributable to:
Equity holders of the parent ₩ 1,044,253,792,766 ₩ 570,487,006,663 $ 880,855,160 $ 481,220,588
Non-controlling interests 36,840,619,848 18,010,662,814 31,076,018 15,192,461
Earnings per share: 23
Basic and diluted, profit for the year attributable
to ordinary shareholders of the parent ₩ 11,811 ₩ 7,993 $ 9.96 $ 6.74
Basic and diluted, profit for the year attributable
to preferred shareholders of the parent ₩ 11,861 ₩ 8,043 $ 10.01 $ 6.78
Basic and diluted, profit for the year from continuing operations
attributable to ordinary shareholders of the parent ₩ 13,968 ₩ 8,794 $ 11.78 $ 7.42
Basic and diluted, profit for the year from continuing operations
attributable to preferred shareholders of the parent ₩ 14,018 ₩ 8,844 $ 11.82 $ 7.46
The above consolidated statements of comprehensive should be read in conjunction with the accompanying notes.
The U.S. dollar figures are provided for information purpose only and do not form part of the audited consolidated financial statements. See Note 2.
Korean won U.S. dollar (Note 2)
2021 2020 2021 2020
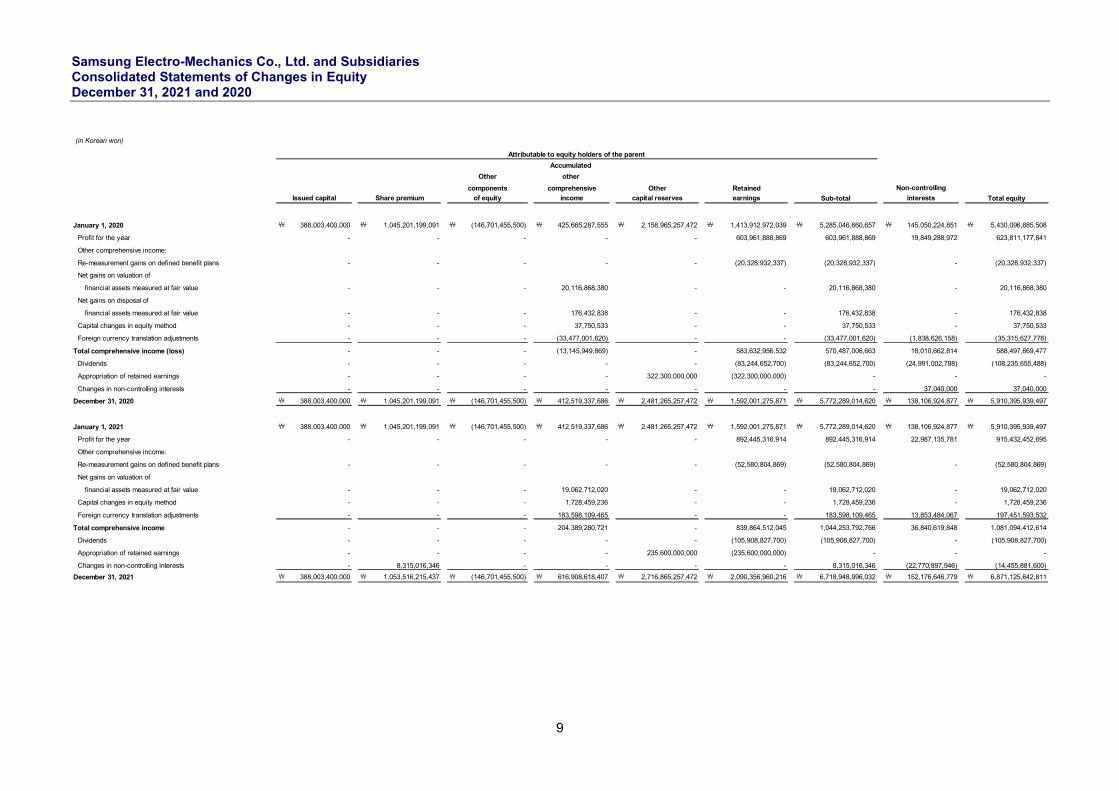
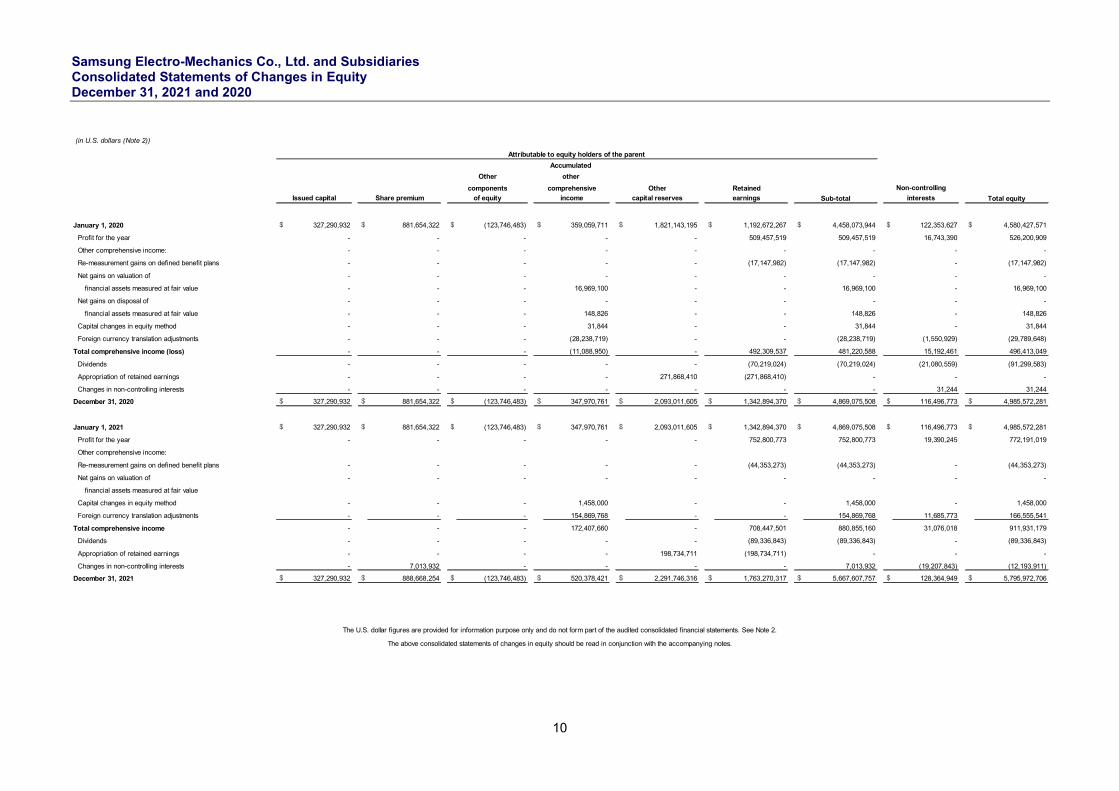
Samsung Electro-Mechanics Co., Ltd. and Subsidiaries Consolidated Statements of Changes in Equity December 31, 2021 and 2020
9
(in Korean won)
January 1, 2020 ₩ 388,003,400,000 ₩ 1,045,201,199,091 ₩ (146,701,455,500) ₩ 425,665,287,555 ₩ 2,158,965,257,472 ₩ 1,413,912,972,039 ₩ 5,285,046,660,657 ₩ 145,050,224,851 ₩ 5,430,096,885,508
Profit for the year - - - - - 603,961,888,869 603,961,888,869 19,849,288,972 623,811,177,841
Other comprehensive income:
Re-measurement gains on defined benefit plans - - - - - (20,328,932,337) (20,328,932,337) - (20,328,932,337)
Net gains on valuation of
financial assets measured at fair value - - - 20,116,868,380 - - 20,116,868,380 - 20,116,868,380
Net gains on disposal of
financial assets measured at fair value - - - 176,432,838 - - 176,432,838 - 176,432,838
Capital changes in equity method - - - 37,750,533 - - 37,750,533 - 37,750,533
Foreign currency translation adjustments - - - (33,477,001,620) - - (33,477,001,620) (1,838,626,158) (35,315,627,778)
Total comprehensive income (loss) - - - (13,145,949,869) - 583,632,956,532 570,487,006,663 18,010,662,814 588,497,669,477
Dividends - - - - - (83,244,652,700) (83,244,652,700) (24,991,002,788) (108,235,655,488)
Appropriation of retained earnings - - - - 322,300,000,000 (322,300,000,000) - - -
Changes in non-controlling interests - - - - - - - 37,040,000 37,040,000
December 31, 2020 ₩ 388,003,400,000 ₩ 1,045,201,199,091 ₩ (146,701,455,500) ₩ 412,519,337,686 ₩ 2,481,265,257,472 ₩ 1,592,001,275,871 ₩ 5,772,289,014,620 ₩ 138,106,924,877 ₩ 5,910,395,939,497
January 1, 2021 ₩ 388,003,400,000 ₩ 1,045,201,199,091 ₩ (146,701,455,500) ₩ 412,519,337,686 ₩ 2,481,265,257,472 ₩ 1,592,001,275,871 ₩ 5,772,289,014,620 ₩ 138,106,924,877 ₩ 5,910,395,939,497
Profit for the year - - - - - 892,445,316,914 892,445,316,914 22,987,135,781 915,432,452,695
Other comprehensive income:
Re-measurement gains on defined benefit plans - - - - - (52,580,804,869) (52,580,804,869) - (52,580,804,869)
Net gains on valuation of
financial assets measured at fair value - - - 19,062,712,020 - - 19,062,712,020 - 19,062,712,020
Capital changes in equity method - - - 1,728,459,236 - - 1,728,459,236 - 1,728,459,236
Foreign currency translation adjustments - - - 183,598,109,465 - - 183,598,109,465 13,853,484,067 197,451,593,532
Total comprehensive income - - - 204,389,280,721 - 839,864,512,045 1,044,253,792,766 36,840,619,848 1,081,094,412,614
Dividends - - - - - (105,908,827,700) (105,908,827,700) - (105,908,827,700)
Appropriation of retained earnings - - - - 235,600,000,000 (235,600,000,000) - - -
Changes in non-controlling interests - 8,315,016,346 - - - - 8,315,016,346 (22,770,897,946) (14,455,881,600)
December 31, 2021 ₩ 388,003,400,000 ₩ 1,053,516,215,437 ₩ (146,701,455,500) ₩ 616,908,618,407 ₩ 2,716,865,257,472 ₩ 2,090,356,960,216 ₩ 6,718,948,996,032 ₩ 152,176,646,779 ₩ 6,871,125,642,811
Other
capital reserves Total equity
Non-controlling
interestsof equity income
components comprehensive
Attributable to equity holders of the parent
Sub-total
Accumulated
Other
other
Retained
earningsIssued capital Share premium
Samsung Electro-Mechanics Co., Ltd. and Subsidiaries Consolidated Statements of Changes in Equity December 31, 2021 and 2020
10
(in U.S. dollars (Note 2))
January 1, 2020 $ 327,290,932 $ 881,654,322 $ (123,746,483) $ 359,059,711 $ 1,821,143,195 $ 1,192,672,267 $ 4,458,073,944 $ 122,353,627 $ 4,580,427,571
Profit for the year - - - - - 509,457,519 509,457,519 16,743,390 526,200,909
Other comprehensive income: - - - - - - - - -
Re-measurement gains on defined benefit plans - - - - - (17,147,982) (17,147,982) - (17,147,982)
Net gains on valuation of - - - - - - - - -
financial assets measured at fair value - - - 16,969,100 - - 16,969,100 - 16,969,100
Net gains on disposal of - - - - - - - - -
financial assets measured at fair value - - - 148,826 - - 148,826 - 148,826
Capital changes in equity method - - - 31,844 - - 31,844 - 31,844
Foreign currency translation adjustments - - - (28,238,719) - - (28,238,719) (1,550,929) (29,789,648)
Total comprehensive income (loss) - - - (11,088,950) - 492,309,537 481,220,588 15,192,461 496,413,049
Dividends - - - - - (70,219,024) (70,219,024) (21,080,559) (91,299,583)
Appropriation of retained earnings - - - - 271,868,410 (271,868,410) - - -
Changes in non-controlling interests - - - - - - - 31,244 31,244
December 31, 2020 $ 327,290,932 $ 881,654,322 $ (123,746,483) $ 347,970,761 $ 2,093,011,605 $ 1,342,894,370 $ 4,869,075,508 $ 116,496,773 $ 4,985,572,281
January 1, 2021 $ 327,290,932 $ 881,654,322 $ (123,746,483) $ 347,970,761 $ 2,093,011,605 $ 1,342,894,370 $ 4,869,075,508 $ 116,496,773 $ 4,985,572,281
Profit for the year - - - - - 752,800,773 752,800,773 19,390,245 772,191,019
Other comprehensive income:
Re-measurement gains on defined benefit plans - - - - - (44,353,273) (44,353,273) - (44,353,273)
Net gains on valuation of - - - - - - - - -
financial assets measured at fair value
Capital changes in equity method - - - 1,458,000 - - 1,458,000 - 1,458,000
Foreign currency translation adjustments - - - 154,869,768 - - 154,869,768 11,685,773 166,555,541
Total comprehensive income - - - 172,407,660 - 708,447,501 880,855,160 31,076,018 911,931,179
Dividends - - - - - (89,336,843) (89,336,843) - (89,336,843)
Appropriation of retained earnings - - - - 198,734,711 (198,734,711) - - -
Changes in non-controlling interests - 7,013,932 - - - - 7,013,932 (19,207,843) (12,193,911)
December 31, 2021 $ 327,290,932 $ 888,668,254 $ (123,746,483) $ 520,378,421 $ 2,291,746,316 $ 1,763,270,317 $ 5,667,607,757 $ 128,364,949 $ 5,795,972,706
Other
Total equity
other
Accumulated
Attributable to equity holders of the parent
Sub-total
The U.S. dollar figures are provided for information purpose only and do not form part of the audited consolidated financial statements. See Note 2.
The above consolidated statements of changes in equity should be read in conjunction with the accompanying notes.
components comprehensive Other Retained Non-controlling
Issued capital Share premium of equity income capital reserves earnings interests
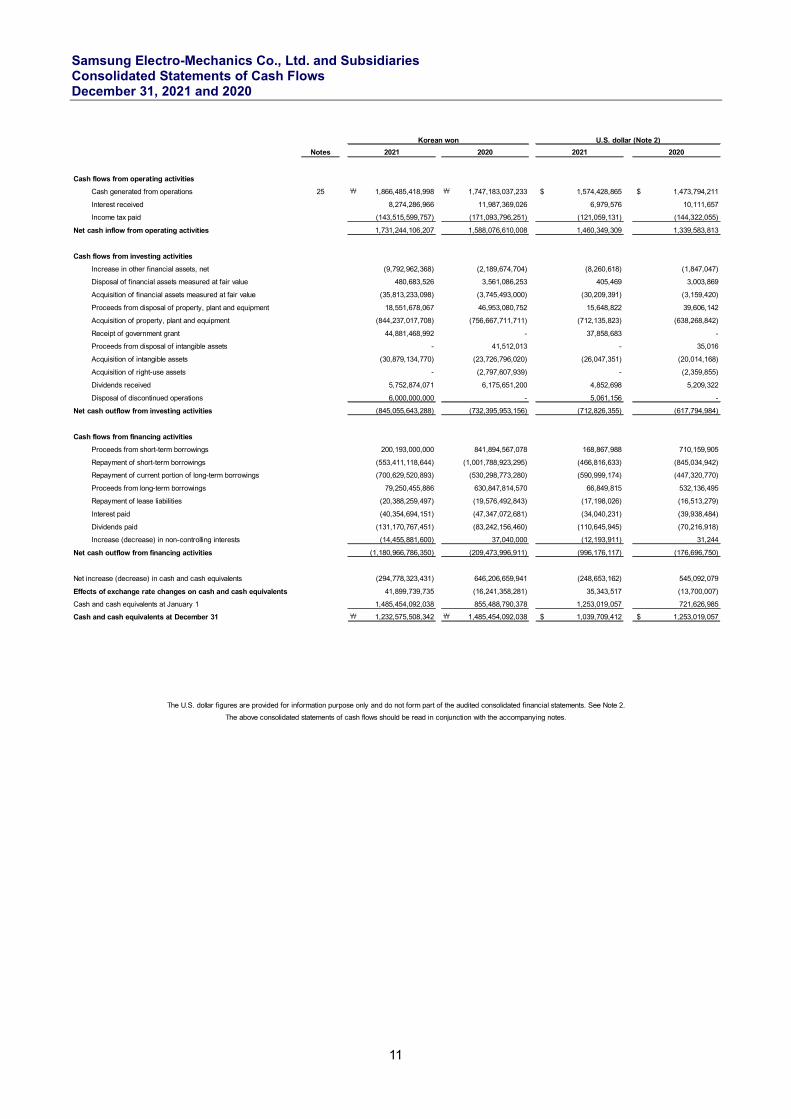
Samsung Electro-Mechanics Co., Ltd. and Subsidiaries Consolidated Statements of Cash Flows December 31, 2021 and 2020
11
Notes
Cash flows from operating activities
Cash generated from operations 25 ₩ 1,866,485,418,998 ₩ 1,747,183,037,233 $ 1,574,428,865 $ 1,473,794,211
Interest received 8,274,286,966 11,987,369,026 6,979,576 10,111,657
Income tax paid (143,515,599,757) (171,093,796,251) (121,059,131) (144,322,055)
Net cash inflow from operating activities 1,731,244,106,207 1,588,076,610,008 1,460,349,309 1,339,583,813
Cash flows from investing activities
Increase in other financial assets, net (9,792,962,368) (2,189,674,704) (8,260,618) (1,847,047)
Disposal of financial assets measured at fair value 480,683,526 3,561,086,253 405,469 3,003,869
Acquisition of financial assets measured at fair value (35,813,233,098) (3,745,493,000) (30,209,391) (3,159,420)
Proceeds from disposal of property, plant and equipment 18,551,678,067 46,953,080,752 15,648,822 39,606,142
Acquisition of property, plant and equipment (844,237,017,708) (756,667,711,711) (712,135,823) (638,268,842)
Receipt of government grant 44,881,468,992 - 37,858,683 -
Proceeds from disposal of intangible assets - 41,512,013 - 35,016
Acquisition of intangible assets (30,879,134,770) (23,726,796,020) (26,047,351) (20,014,168)
Acquisition of right-use assets - (2,797,607,939) - (2,359,855)
Dividends received 5,752,874,071 6,175,651,200 4,852,698 5,209,322
Disposal of discontinued operations 6,000,000,000 - 5,061,156 -
Net cash outflow from investing activities (845,055,643,288) (732,395,953,156) (712,826,355) (617,794,984)
Cash flows from financing activities
Proceeds from short-term borrowings 200,193,000,000 841,894,567,078 168,867,988 710,159,905
Repayment of short-term borrowings (553,411,118,644) (1,001,788,923,295) (466,816,633) (845,034,942)
Repayment of current portion of long-term borrowings (700,629,520,893) (530,298,773,280) (590,999,174) (447,320,770)
Proceeds from long-term borrowings 79,250,455,886 630,847,814,570 66,849,815 532,136,495
Repayment of lease liabilities (20,388,259,497) (19,576,492,843) (17,198,026) (16,513,279)
Interest paid (40,354,694,151) (47,347,072,681) (34,040,231) (39,938,484)
Dividends paid (131,170,767,451) (83,242,156,460) (110,645,945) (70,216,918)
Increase (decrease) in non-controlling interests (14,455,881,600) 37,040,000 (12,193,911) 31,244
Net cash outflow from financing activities (1,180,966,786,350) (209,473,996,911) (996,176,117) (176,696,750)
Net increase (decrease) in cash and cash equivalents (294,778,323,431) 646,206,659,941 (248,653,162) 545,092,079
Effects of exchange rate changes on cash and cash equivalents 41,899,739,735 (16,241,358,281) 35,343,517 (13,700,007)
Cash and cash equivalents at January 1 1,485,454,092,038 855,488,790,378 1,253,019,057 721,626,985
Cash and cash equivalents at December 31 ₩ 1,232,575,508,342 ₩ 1,485,454,092,038 $ 1,039,709,412 $ 1,253,019,057
Korean won U.S. dollar (Note 2)
The above consolidated statements of cash flows should be read in conjunction with the accompanying notes.
2021 2020 2021 2020
The U.S. dollar figures are provided for information purpose only and do not form part of the audited consolidated financial statements. See Note 2.
Samsung Electro-Mechanics Co., Ltd. and Subsidiaries Notes to the Consolidated Financial Statements December 31, 2021 and 2020
12
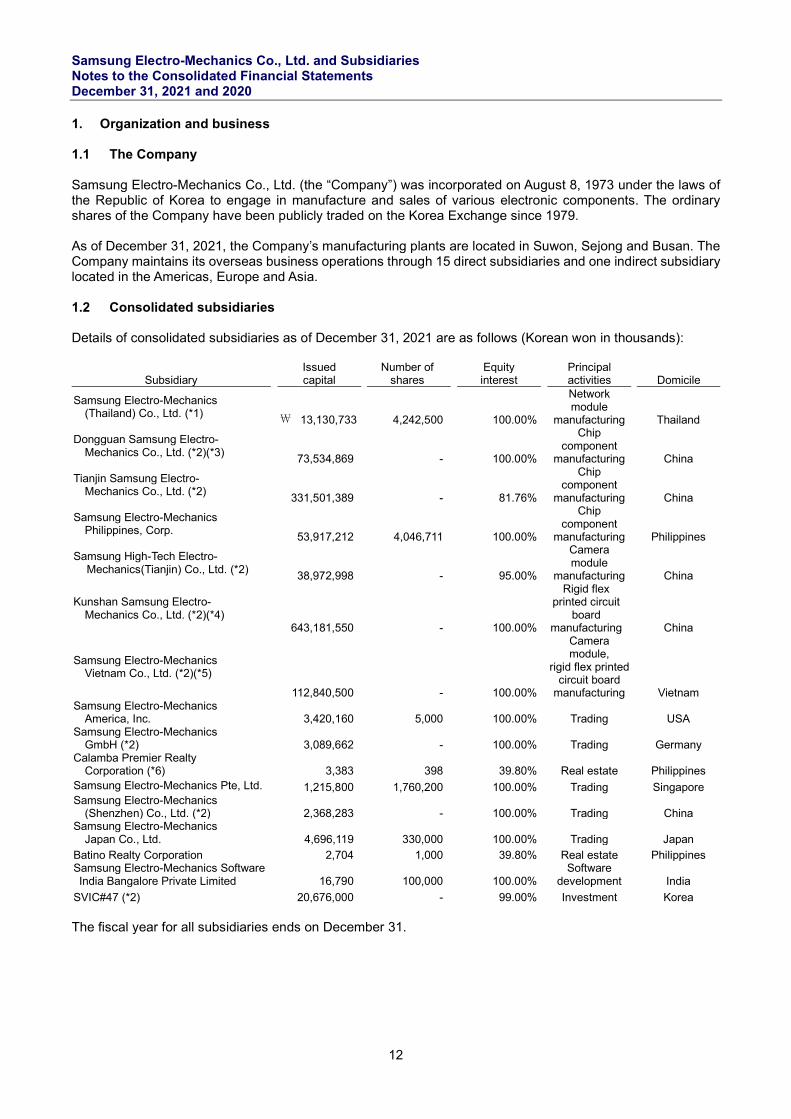
1. Organization and business 1.1 The Company Samsung Electro-Mechanics Co., Ltd. (the “Company”) was incorporated on August 8, 1973 under the laws of the Republic of Korea to engage in manufacture and sales of various electronic components. The ordinary shares of the Company have been publicly traded on the Korea Exchange since 1979. As of December 31, 2021, the Company’s manufacturing plants are located in Suwon, Sejong and Busan. The Company maintains its overseas business operations through 15 direct subsidiaries and one indirect subsidiary located in the Americas, Europe and Asia. 1.2 Consolidated subsidiaries Details of consolidated subsidiaries as of December 31, 2021 are as follows (Korean won in thousands):
Subsidiary Issued capital
Number of shares
Equity interest
Principal activities Domicile
Samsung Electro-Mechanics (Thailand) Co., Ltd. (*1)
\ 13,130,733 4,242,500 100.00%
Network module
manufacturing Thailand
Dongguan Samsung Electro- Mechanics Co., Ltd. (*2)(*3)
73,534,869 - 100.00%
Chip component
manufacturing China
Tianjin Samsung Electro- Mechanics Co., Ltd. (*2)
331,501,389 - 81.76%
Chip component
manufacturing China
Samsung Electro-Mechanics Philippines, Corp.
53,917,212 4,046,711 100.00%
Chip component
manufacturing Philippines
Samsung High-Tech Electro- Mechanics(Tianjin) Co., Ltd. (*2)
38,972,998 - 95.00%
Camera module
manufacturing China
Kunshan Samsung Electro- Mechanics Co., Ltd. (*2)(*4)
643,181,550 - 100.00%
Rigid flex printed circuit
board manufacturing China
Samsung Electro-Mechanics Vietnam Co., Ltd. (*2)(*5)
112,840,500 - 100.00%
Camera module,
rigid flex printed circuit board
manufacturing Vietnam Samsung Electro-Mechanics
America, Inc.
3,420,160 5,000 100.00%
Trading USA Samsung Electro-Mechanics
GmbH (*2)
3,089,662 - 100.00%
Trading Germany Calamba Premier Realty Corporation (*6)
3,383 398 39.80%
Real estate Philippines
Samsung Electro-Mechanics Pte, Ltd. 1,215,800 1,760,200 100.00% Trading Singapore Samsung Electro-Mechanics
(Shenzhen) Co., Ltd. (*2)
2,368,283 - 100.00%
Trading China Samsung Electro-Mechanics
Japan Co., Ltd.
4,696,119 330,000 100.00%
Trading Japan Batino Realty Corporation 2,704 1,000 39.80% Real estate Philippines Samsung Electro-Mechanics Software India Bangalore Private Limited
16,790 100,000 100.00%
Software development India
SVIC#47 (*2) 20,676,000 - 99.00% Investment Korea The fiscal year for all subsidiaries ends on December 31.
Samsung Electro-Mechanics Co., Ltd. and Subsidiaries Notes to the Consolidated Financial Statements December 31, 2021 and 2020
13
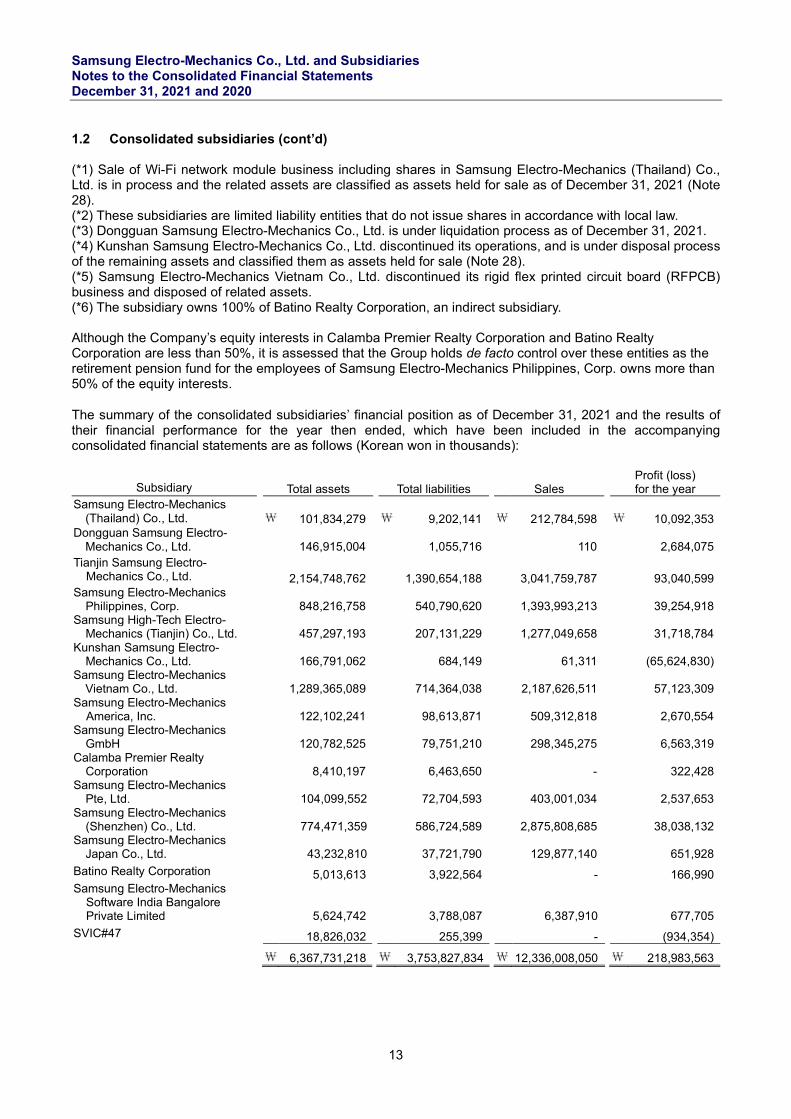
1.2 Consolidated subsidiaries (cont’d) (*1) Sale of Wi-Fi network module business including shares in Samsung Electro-Mechanics (Thailand) Co., Ltd. is in process and the related assets are classified as assets held for sale as of December 31, 2021 (Note 28). (*2) These subsidiaries are limited liability entities that do not issue shares in accordance with local law. (*3) Dongguan Samsung Electro-Mechanics Co., Ltd. is under liquidation process as of December 31, 2021. (*4) Kunshan Samsung Electro-Mechanics Co., Ltd. discontinued its operations, and is under disposal process of the remaining assets and classified them as assets held for sale (Note 28). (*5) Samsung Electro-Mechanics Vietnam Co., Ltd. discontinued its rigid flex printed circuit board (RFPCB) business and disposed of related assets. (*6) The subsidiary owns 100% of Batino Realty Corporation, an indirect subsidiary. Although the Company’s equity interests in Calamba Premier Realty Corporation and Batino Realty Corporation are less than 50%, it is assessed that the Group holds de facto control over these entities as the retirement pension fund for the employees of Samsung Electro-Mechanics Philippines, Corp. owns more than 50% of the equity interests.
The summary of the consolidated subsidiaries’ financial position as of December 31, 2021 and the results of their financial performance for the year then ended, which have been included in the accompanying consolidated financial statements are as follows (Korean won in thousands):
Subsidiary Total assets Total liabilities Sales Profit (loss) for the year
Samsung Electro-Mechanics (Thailand) Co., Ltd.
\ 101,834,279
\ 9,202,141
\ 212,784,598
\ 10,092,353 Dongguan Samsung Electro-
Mechanics Co., Ltd. 146,915,004 1,055,716 110 2,684,075
Tianjin Samsung Electro- Mechanics Co., Ltd.
2,154,748,762 1,390,654,188 3,041,759,787 93,040,599 Samsung Electro-Mechanics Philippines, Corp.
848,216,758 540,790,620 1,393,993,213 39,254,918 Samsung High-Tech Electro- Mechanics (Tianjin) Co., Ltd.
457,297,193 207,131,229 1,277,049,658 31,718,784 Kunshan Samsung Electro- Mechanics Co., Ltd.
166,791,062 684,149 61,311 (65,624,830) Samsung Electro-Mechanics
Vietnam Co., Ltd. 1,289,365,089 714,364,038 2,187,626,511 57,123,309
Samsung Electro-Mechanics America, Inc. 122,102,241 98,613,871 509,312,818 2,670,554
Samsung Electro-Mechanics GmbH
120,782,525 79,751,210 298,345,275 6,563,319 Calamba Premier Realty Corporation
8,410,197 6,463,650 - 322,428 Samsung Electro-Mechanics Pte, Ltd.
104,099,552 72,704,593 403,001,034 2,537,653 Samsung Electro-Mechanics (Shenzhen) Co., Ltd. 774,471,359 586,724,589 2,875,808,685 38,038,132
Samsung Electro-Mechanics Japan Co., Ltd. 43,232,810 37,721,790 129,877,140 651,928
Batino Realty Corporation 5,013,613 3,922,564 - 166,990 Samsung Electro-Mechanics
Software India Bangalore Private Limited
5,624,742 3,788,087 6,387,910 677,705
SVIC#47 18,826,032 255,399 - (934,354)
\ 6,367,731,218 \ 3,753,827,834 \ 12,336,008,050 \ 218,983,563
Samsung Electro-Mechanics Co., Ltd. and Subsidiaries Notes to the Consolidated Financial Statements December 31, 2021 and 2020
14
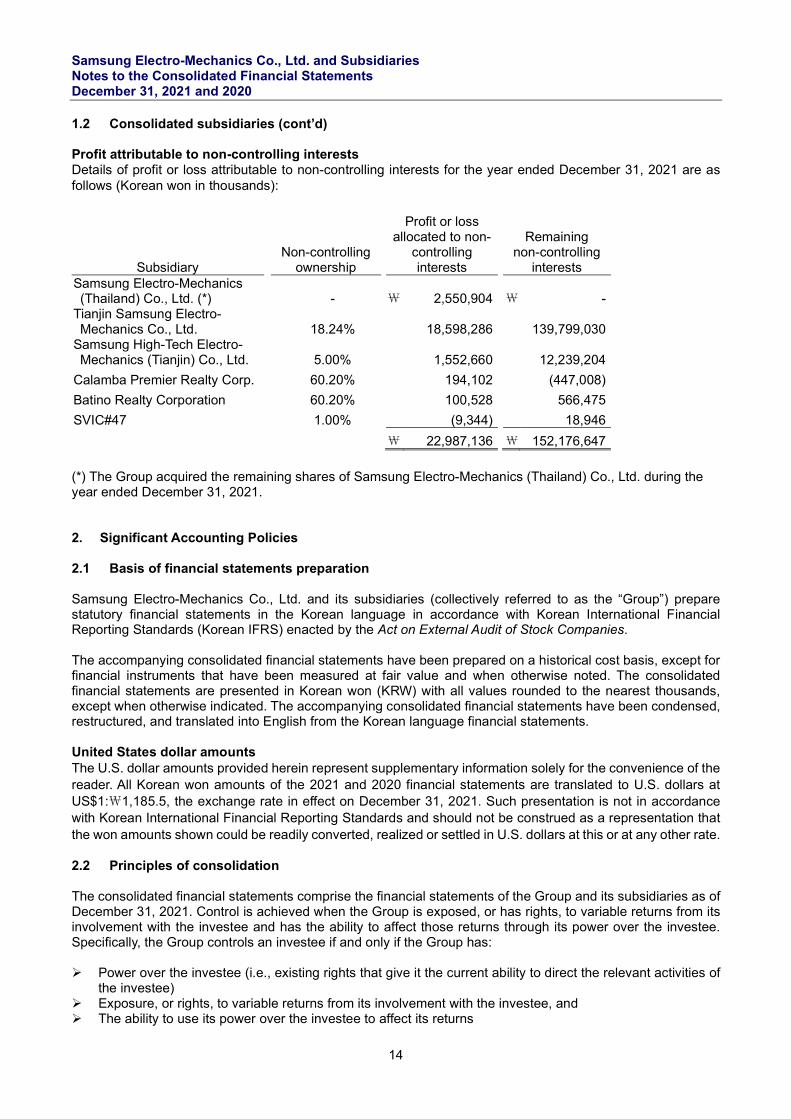
1.2 Consolidated subsidiaries (cont’d) Profit attributable to non-controlling interests Details of profit or loss attributable to non-controlling interests for the year ended December 31, 2021 are as follows (Korean won in thousands):
(*) The Group acquired the remaining shares of Samsung Electro-Mechanics (Thailand) Co., Ltd. during the year ended December 31, 2021. 2. Significant Accounting Policies 2.1 Basis of financial statements preparation Samsung Electro-Mechanics Co., Ltd. and its subsidiaries (collectively referred to as the “Group”) prepare statutory financial statements in the Korean language in accordance with Korean International Financial Reporting Standards (Korean IFRS) enacted by the Act on External Audit of Stock Companies. The accompanying consolidated financial statements have been prepared on a historical cost basis, except for financial instruments that have been measured at fair value and when otherwise noted. The consolidated financial statements are presented in Korean won (KRW) with all values rounded to the nearest thousands, except when otherwise indicated. The accompanying consolidated financial statements have been condensed, restructured, and translated into English from the Korean language financial statements. United States dollar amounts The U.S. dollar amounts provided herein represent supplementary information solely for the convenience of the reader. All Korean won amounts of the 2021 and 2020 financial statements are translated to U.S. dollars at US$1:₩1,185.5, the exchange rate in effect on December 31, 2021. Such presentation is not in accordance with Korean International Financial Reporting Standards and should not be construed as a representation that the won amounts shown could be readily converted, realized or settled in U.S. dollars at this or at any other rate. 2.2 Principles of consolidation The consolidated financial statements comprise the financial statements of the Group and its subsidiaries as of December 31, 2021. Control is achieved when the Group is exposed, or has rights, to variable returns from its involvement with the investee and has the ability to affect those returns through its power over the investee. Specifically, the Group controls an investee if and only if the Group has:
Power over the investee (i.e., existing rights that give it the current ability to direct the relevant activities of
the investee) Exposure, or rights, to variable returns from its involvement with the investee, and The ability to use its power over the investee to affect its returns
Subsidiary
Non-controlling
ownership
Profit or loss allocated to non-
controlling interests
Remaining non-controlling
interests Samsung Electro-Mechanics (Thailand) Co., Ltd. (*)
- \ 2,550,904 \ -
Tianjin Samsung Electro- Mechanics Co., Ltd.
18.24% 18,598,286 139,799,030
Samsung High-Tech Electro- Mechanics (Tianjin) Co., Ltd.
5.00% 1,552,660 12,239,204
Calamba Premier Realty Corp. 60.20% 194,102 (447,008)
Batino Realty Corporation 60.20% 100,528 566,475
SVIC#47 1.00% (9,344) 18,946
\ 22,987,136 \ 152,176,647
Samsung Electro-Mechanics Co., Ltd. and Subsidiaries Notes to the Consolidated Financial Statements December 31, 2021 and 2020
15
2.2 Principles of consolidation (cont’d) When the Group has less than a majority of the voting or similar rights of an investee, the Group considers all relevant facts and circumstances in assessing whether it has power over an investee, including:
The contractual arrangement with the other vote holders of the investee Rights arising from other contractual arrangements The Group’s voting rights and potential voting rights
The Group re-assesses whether it controls an investee if facts and circumstances indicate that there are changes to one or more of the three elements of control. Consolidation of a subsidiary begins when the Group obtains control over the subsidiary and ceases when the Group loses control of the subsidiary. Assets, liabilities, income, and expenses of a subsidiary acquired or disposed of during the year are included in the consolidated statement of comprehensive income from the date the Group gains control until the date the Group ceases to control the subsidiary.
Profit or loss and each component of other comprehensive income (OCI) are attributed to the equity holders of the parent of the Group and to the non-controlling interests, even if this results in the non-controlling interests having a deficit balance. When necessary, adjustments are made to the financial statements of subsidiaries to bring their accounting policies into line with the Group’s accounting policies. All intra-group assets and liabilities, equity, income, expenses, and cash flows relating to transactions between members of the Group are eliminated in full on consolidation.
A change in the ownership interest of a subsidiary, without a loss of control, is accounted for as an equity transaction.
If the Group loses control over a subsidiary, it derecognizes the related assets (including goodwill), liabilities, non-controlling interest, and other components of equity while any related gain or loss is recognized in profit or loss. Any remaining investment is recognized at fair value. 2.3 Business combinations and goodwill Business combinations are accounted for using the acquisition method. The cost of an acquisition is measured as the aggregate of the consideration transferred, measured at acquisition date fair value and the amount of any non-controlling interest in the acquiree. For each business combination, the acquirer measures the non-controlling interest in the acquiree either at fair value or at the proportionate share of the acquiree’s identifiable net assets. Acquisition costs incurred are expensed and included in administrative expenses.
When the Group acquires a business, it assesses the financial assets and liabilities assumed for appropriate classification and designation in accordance with the contractual terms, economic circumstances, and pertinent conditions as of the acquisition date. If the business combination is achieved in stages, any previously held equity interest is re-measured at its acquisition date fair value and any resulting gain or loss is recognized in profit or loss. It is then considered in the determination of goodwill. Any contingent consideration to be transferred by the acquirer will be measured at fair value at the acquisition date. Contingent consideration classified as equity is not remeasured and its subsequent settlement is accounted for within equity. Contingent consideration classified as an asset or liability that is a financial instrument and within the scope of Korean IFRS 1109 Financial Instruments, is measured at fair value with the changes in fair value recognized in the statement of profit or loss in accordance with Korean IFRS 1109. Other contingent consideration that is not within the scope of Korean IFRS 1109 is measured at fair value at each reporting date with changes in fair value recognized in profit or loss.
Samsung Electro-Mechanics Co., Ltd. and Subsidiaries Notes to the Consolidated Financial Statements December 31, 2021 and 2020
16
2.3 Business combinations and goodwill (cont’d)
Goodwill is initially measured at cost, being the excess of the aggregate of the consideration transferred and the amount recognized for non-controlling interests, and any previous interest held, over the net identifiable assets acquired and liabilities assumed. If the fair value of the net assets acquired is in excess of the aggregate consideration transferred, the Group re-assesses whether it has correctly identified all of the assets acquired and all of the liabilities assumed and reviews the procedures used to measure the amounts to be recognized at the acquisition date. If the re-assessment still results in an excess of the fair value of net assets acquired over the aggregate consideration transferred, then the gain is recognized in profit or loss.
After initial recognition, goodwill is measured at cost less any accumulated impairment losses. For the purpose of impairment testing, goodwill acquired in a business combination is, from the acquisition date, allocated to each of the Group’s cash generating units that are expected to benefit from the combination, irrespective of whether other assets or liabilities of the acquiree are assigned to those units.
Where goodwill has been allocated to a cash-generating unit and part of the operation within that unit is disposed of, the goodwill associated with the disposed operation is included in the carrying amount of the operation when determining the gain or loss on disposal. Goodwill disposed in these circumstances is measured based on the relative values of the disposed operation and the portion of the cash-generating unit retained. 2.4 Investment in associates and joint arrangements Investment in associates An associate is an entity over which the Group has significant influence. Significant influence is the power to participate in the financial and operating policy decisions of the investee but is not control or joint control over those policies.
The Group’s investments in its associate and are accounted for using the equity method. Under the equity method, the investment in an associate is initially recognized at cost. The carrying amount of the investment is adjusted to recognize changes in the Group’s share of net assets of the associate since the acquisition date. Goodwill relating to the associate is included in the carrying amount of the investment and is neither amortised nor individually tested for impairment.
The consolidated statement of comprehensive income reflects the share of the results of financial performance of the associate. Where there has been a change recognized directly in the equity of the associate, the Group recognizes its share of any changes and discloses this, when applicable, in the statement of changes in equity. Unrealized gains and losses resulting from transactions between the Group and the associate are eliminated to the extent of the interest in the associate. The share of profit of associates is shown on the face of the statements of profit or loss and other comprehensive income. This is the profit attributable to equity holders of the associate and therefore is profit after tax and non-controlling interests in the subsidiaries of the associates. The financial statements of the associate are prepared for the same reporting period as the Group. Where necessary, adjustments are made to bring the accounting policies in line with those of the Group. After application of the equity method, the Group determines whether it is necessary to recognize an additional impairment loss on the Group’s investment in its associates. At each reporting date, the Group determines whether there is objective evidence that the investment in the associate is impaired. If this is the case, the Group calculates the amount of impairment as the difference between the recoverable amount of the associate and its carrying value and recognizes the amount in the statements of profit or loss and other comprehensive income.
Upon loss of significant influence over the associate, the Group measures and recognizes any retaining investment at its fair value. Any difference between the carrying amount of the associate upon loss of significant influence and the fair value of the retaining investment and proceeds from disposal is recognized in profit or loss.
Samsung Electro-Mechanics Co., Ltd. and Subsidiaries Notes to the Consolidated Financial Statements December 31, 2021 and 2020
17
2.4 Investment in associates and Joint arrangements (cont’d) Joint arrangements A joint arrangement, wherein two or more parties have joint control, is classified as either a joint operation or a joint venture. A joint operator recognizes its direct right to the assets, liabilities, revenues and expenses of joint operations and its share of any jointly held or incurred assets, liabilities, revenues and expenses. Interests in joint ventures are accounted for using the equity method, after initially being recognized at cost in the consolidated statement of financial position. 2.5 Current versus non-current classification The Group presents assets and liabilities in the statement of financial position based on current/non-current classification.
An asset is current when it is: Expected to be realized or intended to be sold or consumed in the normal operating cycle Held primarily for the purpose of trading Expected to be realized within twelve months after the reporting period, or Cash or cash equivalent unless restricted from being exchanged or used to settle a liability for at least
twelve months after the reporting period
All other assets are classified as non-current. A liability is current when: It is expected to be settled in the normal operating cycle It is held primarily for the purpose of trading It is due to be settled within twelve months after the reporting period, or There is no unconditional right to defer the settlement of the liability for at least twelve months after the
reporting period
The Group classifies all other liabilities as non-current.
Deferred tax assets and liabilities are classified as non-current assets and liabilities.
2.6 Foreign currency translation The Group’s consolidated financial statements are presented in Korean won, which is also its functional currency. Each entity in the Group determines its own functional currency and items included in the financial statements of each entity are measured using that functional currency. Transactions and balances Transactions in foreign currencies are initially recorded by the Group entities at their respective functional currency rates prevailing at the date of the transaction. Monetary assets and liabilities denominated in foreign currencies are retranslated at the functional currency spot rate of exchange ruling at the reporting date.
Non-monetary items that are measured in terms of historical cost in a foreign currency are translated using the exchange rates as of the dates of the initial transactions. Non-monetary items measured at fair value in a foreign currency are translated using the exchange rates at the date when the fair value is determined. In determining the spot exchange rate to use on initial recognition of the related asset, expense or income (or part of it) on the derecognition of a non-monetary asset or non-monetary liability relating to advance consideration, the date of the transaction is the date on which the Group initially recognizes the non-monetary asset or non-monetary liability arising from the advance consideration. If there are multiple payments or receipts in advance, the Group determines the transaction date for each payment or receipt of advance consideration.
Samsung Electro-Mechanics Co., Ltd. and Subsidiaries Notes to the Consolidated Financial Statements December 31, 2021 and 2020
18
2.6 Foreign currency translation (cont’d) Foreign operations The assets and liabilities of foreign operations are translated into Korean won at the rate of exchange prevailing at the reporting date and their statements of profit or loss and other comprehensive incomes are translated at average exchange rate during the applicable period. The exchange differences arising on the translation are recognized in other comprehensive income. On disposal of a foreign operation, the gain or loss on translation of foreign operations recorded in other comprehensive income is reclassified to the statements of profit or loss and other comprehensive income. Any goodwill arising on the acquisition of a foreign operation and any fair value adjustments to the carrying amounts of assets and liabilities arising on the acquisition are treated as assets and liabilities of the foreign operation and translated at the spot rate of exchange at the reporting date. 2.7 Cash and cash equivalents Cash and cash equivalents in the consolidated statement of financial position comprise cash at banks and on hand and short-term deposits with a maturity of three months or less, which represent cash and cash equivalents on the consolidated statements of cash flows. 2.8 Financial instruments: Initial recognition and subsequent measurement A financial instrument is any contract that gives rise to a financial asset of one entity and a financial liability or equity instrument of another entity.
Financial assets Initial recognition and measurement Financial assets are classified, at initial recognition, as subsequently measured at amortised cost, fair value through other comprehensive income (OCI), and fair value through profit or loss. The classification of financial assets at initial recognition depends on the financial asset’s contractual cash flow characteristics and the Group’s business model for managing them. With the exception of trade receivables that do not contain a significant financing component or for which the Group has applied the practical expedient, the Group initially measures a financial asset at its fair value plus, in the case of a financial asset not at fair value through profit or loss, transaction costs. Trade receivables that do not contain a significant financing component or for which the Group has applied the practical expedient are measured at the transaction price determined under Korean IFRS 1115. In order for a financial asset to be classified and measured at amortised cost or fair value through OCI, it needs to give rise to cash flows that are ‘solely payments of principal and interest (SPPI)’ on the principal amount outstanding. This assessment is referred to as the SPPI test and is performed at an instrument level. The Group’s business model for managing financial assets refers to how it manages its financial assets in order to generate cash flows. The business model determines whether cash flows will result from collecting contractual cash flows, selling the financial assets, or both. Purchases or sales of financial assets that require delivery of assets within a time frame established by regulation or convention in the marketplace (regular way trades) are recognised on the trade date, i.e., the date that the Group commits to purchase or sell the asset. Subsequent measurement For purposes of subsequent measurement, financial assets are classified in four categories: Financial assets measured at amortised cost (debt instruments) Financial assets measured at fair value through OCI with recycling of cumulative gains and losses (debt
instruments) Financial assets measured at fair value through OCI with no recycling of cumulative gains and losses upon Financial assets measured at fair value through profit or loss
Samsung Electro-Mechanics Co., Ltd. and Subsidiaries Notes to the Consolidated Financial Statements December 31, 2021 and 2020
19
2.8 Financial instruments: Initial recognition and subsequent measurement (cont’d) Financial assets measured at amortised cost (debt instruments) This category is the most relevant to the Group. The Group measures financial assets at amortised cost if both of the following conditions are met: The financial asset is held within a business model with the objective to hold financial assets in order to
collect contractual cash flows The contractual terms of the financial asset give rise on specified dates to cash flows that are solely
payments of principal and interest on the principal amount outstanding
Financial assets at amortised cost are subsequently measured using the effective interest (EIR) method and are subject to impairment. Gains and losses are recognised in profit or loss when the asset is derecognised, modified or impaired. Financial assets measured at fair value through OCI (debt instruments) The Group measures debt instruments at fair value through OCI if both of the following conditions are met: The financial asset is held within a business model with the objective of both holding to collect contractual
cash flows and selling, and
The contractual terms of the financial asset give rise on specified dates to cash flows that are solely payments of principal and interest on the principal amount outstanding
For debt instruments measured at fair value through OCI, interest income, foreign exchange revaluation and impairment losses or reversals are recognized in the statement of profit or loss and computed in the same manner as for financial assets measured at amortised cost. The remaining fair value changes are recognized in OCI. Upon derecognition, the cumulative fair value change recognized in OCI is recycled to profit or loss. The Group’s debt instruments at fair value through OCI includes investments in quoted debt instruments included under other non-current financial assets.
The Group elected to classify irrevocably its non-listed equity investments under this category.
Financial assets measured at fair value through OCI (equity instruments) Upon initial recognition, the Group can elect to classify irrevocably its equity investments as equity instruments designated at fair value through OCI when they meet the definition of equity under Korean IFRS 1032 Financial Instruments: Presentation and are not held for trading. The classification is determined on an instrument-by-instrument basis. Gains and losses on these financial assets are never recycled to profit or loss. Dividends are recognised as other income in the statement of profit or loss when the right of payment has been established, except when the Group benefits from such proceeds as a recovery of part of the cost of the financial asset, in which case, such gains are recorded in OCI. Equity instruments designated at fair value through OCI are not subject to impairment assessment.
Samsung Electro-Mechanics Co., Ltd. and Subsidiaries Notes to the Consolidated Financial Statements December 31, 2021 and 2020
20
2.8 Financial instruments: Initial recognition and subsequent measurement (cont’d) Financial assets measured at fair value through profit or loss
Financial assets measured at fair value through profit or loss are carried in the statement of financial position at fair value with net changes in fair value recognized in the statement of profit or loss. A derivative embedded in a hybrid contract, with a financial liability or non-financial host, is separated from the host and accounted for as a separate derivative if: the economic characteristics and risks are not closely related to the host; a separate instrument with the same terms as the embedded derivative would meet the definition of a derivative; and the hybrid contract is not measured at fair value through profit or loss. Embedded derivatives are measured at fair value with changes in fair value recognised in profit or loss. Reassessment only occurs if there is either a change in the terms of the contract that significantly modifies the cash flows that would otherwise be required or a reclassification of a financial asset out of the fair value through profit or loss category. A derivative embedded within a hybrid contract containing a financial asset host is not accounted for separately. The financial asset host together with the embedded derivative is required to be classified in its entirety as a financial asset at fair value through profit or loss. Derecognition A financial asset (or, where applicable a part of a financial asset or part of a group of similar financial assets) is derecognized when: The rights to receive cash flows from the asset have expired. The Group has transferred its rights to receive cash flows from the asset or has assumed an obligation to
pay the received cash flows in full without material delay to a third party under a ‘pass-through’ arrangement; and either (a) the Group has transferred substantially all the risks and rewards of the asset, or (b) the Group has neither transferred nor retained substantially all the risks and rewards of the asset but has transferred control of the asset.
When the Group has transferred its rights to receive cash flows from an asset or has entered into a pass-through arrangement, it evaluates if, and to what extent, it has retained the risks and rewards of ownership. When it has neither transferred nor retained substantially all of the risks and rewards of the asset, nor transferred control of the asset, the Group continues to recognize the transferred asset to the extent of the Group’s continuing involvement. In that case, the Group also recognizes an associated liability. The transferred asset and the associated liability are measured on a basis that reflects the rights and obligations that the Group has retained. Continuing involvement that takes the form of a guarantee over the transferred asset is measured at the lower of the original carrying amount of the asset and the maximum amount of consideration that the Group could be required to repay.
Financial assets measured at fair value through profit or loss include financial assets held for trading and financial assets designated upon initial recognition at fair value through profit or loss. Financial assets are classified as held for trading if they are acquired for the purpose of selling or repurchasing in the near term. Derivatives, including separated embedded derivatives, are also classified as held for trading unless they are designated as effective hedging instruments. Financial assets with cash flows that are not solely payments of principal and interest are classified and measured at fair value through profit or loss, irrespective of the business model. Notwithstanding the criteria for debt instruments to be classified at amortised cost or at fair value through OCI, as described above, debt instruments may be designated at fair value through profit or loss on initial recognition if doing so eliminates, or significantly reduces, an accounting mismatch.
Samsung Electro-Mechanics Co., Ltd. and Subsidiaries Notes to the Consolidated Financial Statements December 31, 2021 and 2020
21
2.8 Financial instruments: Initial recognition and subsequent measurement (cont’d) Impairment of financial assets Further disclosures relating to impairment of financial assets are also provided in the following notes: Disclosures for significant assumptions Debt instruments at fair value through OCI Trade receivables, including contract assets The Group recognises an allowance for expected credit losses (ECLs) for all debt instruments not held at fair value through profit or loss. ECLs are based on the difference between the contractual cash flows due in accordance with the contract and all the cash flows that the Group expects to receive, discounted at an approximation of the original effective interest rate. The expected cash flows will include cash flows from the sale of collateral held or other credit enhancements that are integral to the contractual terms. ECLs are recognised in two stages. For credit exposures for which there has not been a significant increase in credit risk since initial recognition, ECLs are provided for credit losses that result from default events that are possible within the next 12-months (a 12-month ECL). For those credit exposures for which there has been a significant increase in credit risk since initial recognition, a loss allowance is required for credit losses expected over the remaining life of the exposure, irrespective of the timing of the default (a lifetime ECL). For trade receivables and contract assets, the Group applies a simplified approach in calculating ECLs. Therefore, the Group does not track changes in credit risk, but instead recognises a loss allowance based on lifetime ECLs at each reporting date. The Group has established a provision matrix that is based on its historical credit loss experience, adjusted for forward-looking factors specific to the debtors and the economic environment. Financial liabilities Initial recognition and measurement Financial liabilities within the scope of Korean IFRS 1039 are classified at initial recognition, as financial liabilities at fair value through profit or loss, loans and borrowings, payables, or as derivatives designated as hedging instruments in an effective hedge, as appropriate.
All financial liabilities are recognized initially at fair value and in the case of loans and borrowings and payable, net of directly attributable transaction costs.
The Group’s financial liabilities include trade and other payables, loans and borrowings including bank overdrafts, financial guarantee contracts and derivative financial instruments. Subsequent measurement The measurement of financial liabilities depends on their classification.
Financial liabilities at fair value through profit or loss Financial liabilities at fair value through profit or loss includes financial liabilities held for trading and financial liabilities designated upon initial recognition as of fair value through profit or loss. Financial liabilities are classified as held for trading if they are acquired for the purpose of selling in the near term. This category includes derivative financial instruments entered into by the Group that are not designated as hedging instruments in hedge relationships as defined by Korean IFRS 1109. Separated embedded derivatives are also classified as held for trading unless they are designated as effective hedging instruments. Gains or losses on liabilities held for trading are recognized in the consolidated statement of profit or loss. Financial liabilities designated upon initial recognition at fair value through profit or loss are designated at the initial date of recognition, and only if the criteria in Korean IFRS 1109 are satisfied. The Group has not designated any financial liability as of fair value through profit or loss.
Samsung Electro-Mechanics Co., Ltd. and Subsidiaries Notes to the Consolidated Financial Statements December 31, 2021 and 2020
22
2.8 Financial instruments – impairment of financial assets (cont’d) Loans and borrowings After initial recognition, interest bearing loans and borrowings are subsequently measured at amortised cost using the effective interest rate method. Gains and losses are recognized in the consolidated statement of profit or loss when the liabilities are derecognized as well as through the effective interest rate method (EIR) amortisation process. Amortised cost is calculated by taking into account any discount or premium on acquisition and fee or costs that are an integral part of the EIR. Derecognition A financial liability is derecognized when the obligation under the liability is discharged or cancelled or expires. When an existing financial liability is replaced by another from the same lender on substantially different terms, or the terms of an existing liability are substantially modified, such an exchange or modification is treated as a derecognition of the original liability and the recognition of a new liability, and the difference in the respective carrying amounts is recognized in the statements of profit or loss.
Offsetting of financial instruments Financial assets and financial liabilities are offset and the net amount reported in the consolidated statement of financial position if there is a currently enforceable legal right to offset the recognized amounts and there is an intention to settle on a net basis, or to realize the assets and settle the liabilities simultaneously. 2.9 Fair value measurement The Group measures financial instruments, at fair value at each balance sheet date. Fair value related disclosures for financial instruments that are measured at fair value or where fair values are disclosed, are summarized in the following notes:
Notes Quantitative disclosures of fair value measurement hierarchy 27 Investment in unquoted equity shares 9 Financial instruments (including those carried at amortised cost) 27 Fair value is the price that would be received to sell an asset or paid to transfer a liability in an orderly transaction between market participants at the measurement date. The fair value measurement is based on the presumption that the transaction to sell the asset or transfer the liability takes place either: In the principal market for the asset or liability, or In the absence of a principal market, in the most advantageous market for the asset or liability
The principal or the most advantageous market must be accessible by the Group.
The fair value of an asset or a liability is measured using the assumptions that market participants would use when pricing the asset or liability, assuming that market participants act in their economic best interest.
A fair value measurement of a non-financial asset takes into account a market participant's ability to generate economic benefits by using the asset in its highest and best use or by selling it to another market participant that would use the asset in its highest and best use.
The Group uses valuation techniques that are appropriate in the circumstances and for which sufficient data are available to measure fair value, maximizing the use of relevant observable inputs and minimizing the use of unobservable inputs.
Samsung Electro-Mechanics Co., Ltd. and Subsidiaries Notes to the Consolidated Financial Statements December 31, 2021 and 2020
23
2.9 Fair value measurement (cont’d) All assets and liabilities for which fair value is measured or disclosed in the financial statements are categorized within the fair value hierarchy, described as follows, based on the lowest level input that is significant to the fair value measurement as a whole: Level 1 — Quoted (unadjusted) market prices in active markets for identical assets or liabilities Level 2 — Valuation techniques for which the lowest level input that is significant to the fair value
measurement is directly or indirectly observable Level 3 — Valuation techniques for which the lowest level input that is significant to the fair value
measurement is unobservable
For assets and liabilities that are recognized in the consolidated financial statements on a recurring basis, the Group determines whether transfers have occurred between levels in the hierarchy by re-assessing categorization (based on the lowest level input that is significant to the fair value measurement as a whole) at the end of each reporting period.
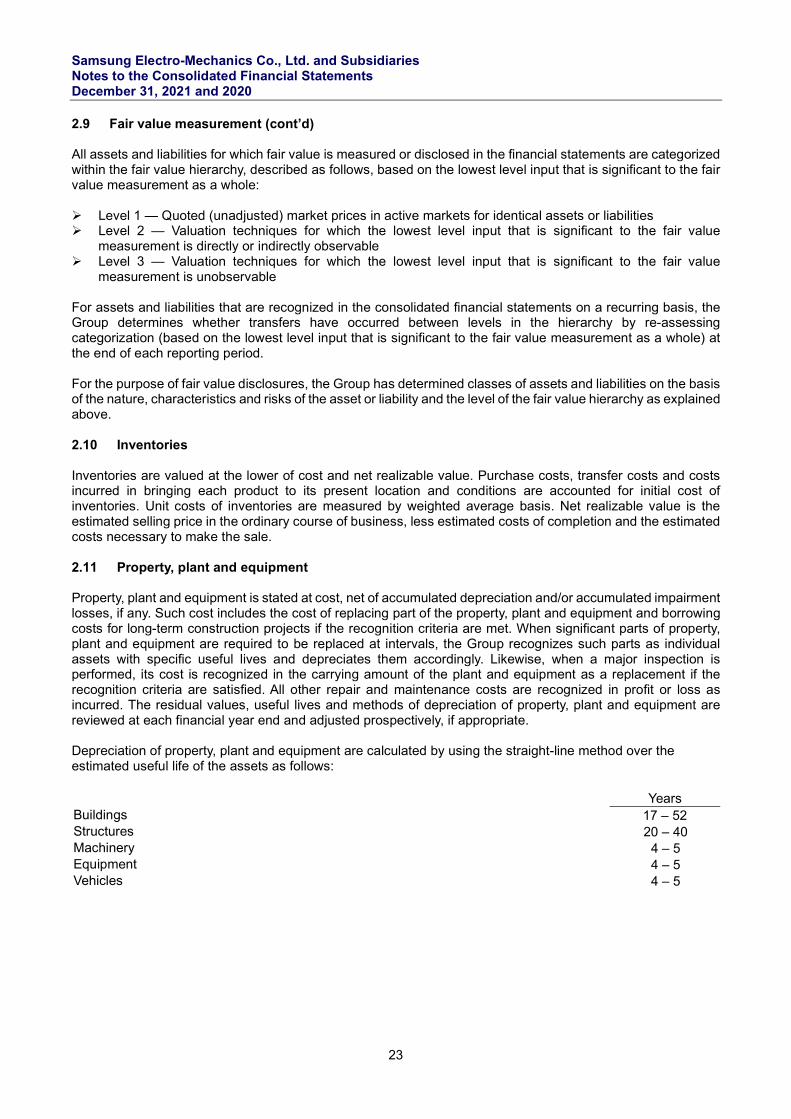
For the purpose of fair value disclosures, the Group has determined classes of assets and liabilities on the basis of the nature, characteristics and risks of the asset or liability and the level of the fair value hierarchy as explained above. 2.10 Inventories Inventories are valued at the lower of cost and net realizable value. Purchase costs, transfer costs and costs incurred in bringing each product to its present location and conditions are accounted for initial cost of inventories. Unit costs of inventories are measured by weighted average basis. Net realizable value is the estimated selling price in the ordinary course of business, less estimated costs of completion and the estimated costs necessary to make the sale. 2.11 Property, plant and equipment Property, plant and equipment is stated at cost, net of accumulated depreciation and/or accumulated impairment losses, if any. Such cost includes the cost of replacing part of the property, plant and equipment and borrowing costs for long-term construction projects if the recognition criteria are met. When significant parts of property, plant and equipment are required to be replaced at intervals, the Group recognizes such parts as individual assets with specific useful lives and depreciates them accordingly. Likewise, when a major inspection is performed, its cost is recognized in the carrying amount of the plant and equipment as a replacement if the recognition criteria are satisfied. All other repair and maintenance costs are recognized in profit or loss as incurred. The residual values, useful lives and methods of depreciation of property, plant and equipment are reviewed at each financial year end and adjusted prospectively, if appropriate.
Depreciation of property, plant and equipment are calculated by using the straight-line method over the estimated useful life of the assets as follows:
Years Buildings 17 – 52 Structures 20 – 40 Machinery 4 – 5 Equipment 4 – 5 Vehicles 4 – 5
Samsung Electro-Mechanics Co., Ltd. and Subsidiaries Notes to the Consolidated Financial Statements December 31, 2021 and 2020
24
2.12 Leases The Group assess whether the contract contains lease when the contract is settled, by considering if the right to control the use of the identified asset is transferred in exchange for price. Group as lessee The Group applies a single approach on identification and measurement, except for short-term leases and leases of low-value assets. The Group identifies lease liability, as obligation to pay for the lease, and right-of-use asset, as right to control the underlying asset. At the commencement date, the day that the underlying asset of the lease becomes available, the Group identifies the right-of-use asset. The right-of-use asset is measured as cost initially, and as cost model in subsequent measurements. Besides of accumulated depreciation and impairment loss being deducted, adjustments from remeasurement of lease liability is reflected in the cost model. The cost of right-of-use assets includes the amount of the recognized lease liability, the initial direct cost, and the lease fee paid on lease commencement date or before, less the incentive received. Right-of-use assets are depreciated on a straight-line basis over a short period of the lease term and the estimated useful life of the following assets: If the ownership on the underlying asset is transferred to the Group when the lease is terminated, or the exercise price of a purchase option is reflected on the cost of right-of-use asset, depreciation will be calculated based on estimated useful life of the underlying asset. Rights-of-use assets are also susceptible to impairment. See note 2.15, accounting policy on the impairment of non-financial assets. On the commencement date, the Group measures the lease liability with the present value of the lease payments to be made during the lease term. The lease payments consist of fixed payments (including in-substance fixed payments), less lease incentives receivable, variable payments that depend on an index or a rate and amounts expected to be payable under residual value guarantees. Lease payments also contains exercise price, when it is reasonably certain that the purchase option will be exercised, and penalties for terminating lease when the lease term reflects the Group’s exercise of an option to terminate the lease. The variable payments that do not depend on an index or a rate will be recognized as expense in the period in which the event or condition that triggers those payments occurs, unless the payments are accrued in regard of manufacturing the inventory assets. The Group utilizes incremental borrowing rate on the commencement date as the interest rates implicit in the lease are cannot be readily determined to calculate the present value of the lease payment. After the commencement date, lease liability will be increased by the interests accrued and decreased by payments made. Additionally, book value of lease liability will be remeasured with the change in lease term, lease payments (e.g., fluctuation of unpaid lease payments occurred by an index or a rate) or reassessment on exercise of purchase option on underlying asset. The Group’s lease liabilities are included in interest bearing debts (See note 27). The Group applies recognition exemption on short-term leases of machineries and equipment. It is same on lease of low-value assets, furniture and fixtures. Lease payments on those leases will be recognized on straight-line basis. 2.13 Borrowing costs Borrowing costs directly attributable to the acquisition, construction or production of an asset that necessarily takes a substantial period of time to get ready for its intended use or sale are capitalized as part of the cost of the respective assets. All other borrowing costs are expensed in the period they occur.
Samsung Electro-Mechanics Co., Ltd. and Subsidiaries Notes to the Consolidated Financial Statements December 31, 2021 and 2020
25
2.14 Intangible assets Intangible assets acquired separately are measured on initial recognition at cost. The cost of intangible assets acquired in a business combination is its fair value as of the date of acquisition. Following initial recognition, intangible assets are carried at cost less any accumulated amortisation and any accumulated impairment losses. Internally generated intangible assets, excluding capitalized development costs, are not capitalized and expenditure is reflected in the statements of profit or loss and other comprehensive income in the year in which the expenditure is incurred.
The useful lives of intangible assets are assessed as either finite or indefinite. Intangible assets with finite lives are amortised over the useful economic life and assessed for impairment whenever there is an indication that the intangible asset may be impaired. The amortisation period and the amortisation method for an intangible asset with a finite useful life is reviewed at least at each financial year end. Changes in the expected useful life or the expected pattern of consumption of future economic benefits embodied in the asset is accounted for by changing the amortisation period or method, as appropriate, and are treated as changes in accounting estimates. The amortisation expense on intangible assets with finite lives is recognized in the statements of profit or loss and other comprehensive income in the expense category consistent with the function of the intangible asset. Intangible assets with indefinite useful lives are not amortised, but are tested for impairment annually, either individually or at the cash generating unit level. The assessment of indefinite life is reviewed annually to determine whether the indefinite life continues to be supportable. If not, the change in useful life from indefinite to finite is made on a prospective basis. Gains or losses arising from derecognition of an intangible asset are measured as the difference between the net disposal proceeds and the carrying amount of the asset and are recognized in the consolidated statement of loss or profit when the asset is derecognized. Research and development costs Expenditures on research activities are recognized as expense in the period in which they incur. Expenditures on development activities are capitalized as intangible assets (development costs) when the assets become ready to use (development activities for the project are finished). The expenditures on specific projects are recognized as an intangible asset when the Group can demonstrate:
The technical feasibility of completing the intangible asset so that it will be available for use or sale Its intention to complete and its ability to use or sell the asset How the asset will generate future economic benefits The availability of resources to complete the asset The ability to measure reliably the expenditure during development Goodwill Goodwill is accounted for as an intangible asset and is initially measured consideration paid which exceeds the cost of the investment over the Company’s share of the fair value of the subsidiary’s net identifiable assets. Patents, licenses, software, and membership The patents have been granted for a period of 7~10 years by the relevant government agency with the option of renewal at the end of this period. Licenses for the use of intellectual property and software are granted for periods 5 and 4~5 years, respectively. Memberships for usage rights that are not kept for investment purposes, are regarded to have indefinite useful lives and are not amortised. The Group amortises intangible assets with a limited useful life using the straight-line method over the following periods: Estimated useful life Patents 7~10 years Industrial property rights 5 years Other intangible assets 5 years Software 4 ~ 5 years
Samsung Electro-Mechanics Co., Ltd. and Subsidiaries Notes to the Consolidated Financial Statements December 31, 2021 and 2020
26
2.15 Impairment of non-financial assets The Group assesses at each reporting date whether there is an indication that an asset may be impaired. If any indication exists, or when annual impairment testing for an asset is required, the Group estimates the asset’s recoverable amount. An asset’s recoverable amount is the higher of an asset’s or cash-generating unit’s (CGU) fair value less costs of disposal and its value in use. Recoverable amount is determined for an individual asset, unless the asset does not generate cash inflows that are largely independent of those from other assets or groups of assets. When the carrying amount of an asset or CGU exceeds its recoverable amount, the asset is considered impaired and is written down to its recoverable amount.
In assessing value in use, the estimated future cash flows are discounted to their present value using a pre-tax discount rate that reflects current market assessments of the time value of money and the risks specific to the asset. In determining net fair value costs to sell, an appropriate valuation model is used. These calculations are corroborated by valuation multiples, quoted share prices for publicly traded subsidiaries or other available fair value indicators.
The Group bases its impairment calculation on detailed budgets and forecast calculations, which are prepared separately for each of the Group’s CGUs to which the individual assets are allocated. These budgets and forecast calculations generally cover a period of five years. For longer periods, a long-term growth rate is calculated and applied to project future cash flows after the fifth year. Impairment losses of continuing operations are recognized in the consolidated statement of comprehensive income in expense categories consistent with the function of the impaired asset, except for property previously revalued with the revaluation was taken to other comprehensive income. In this case, the impairment is also recognized in other comprehensive income up to the amount of any previous revaluation. For assets excluding goodwill, an assessment is made at each reporting date to determine whether there is an indication that previously recognized impairment losses no longer exist or have decreased. If such indication exists, the Group estimates the asset’s or cash-generating unit’s recoverable amount. A previously recognized impairment loss is reversed only if there has been a change in the assumptions used to determine the asset’s recoverable amount since the last impairment loss was recognized. The reversal is limited so that the carrying amount of the asset does not exceed its recoverable amount, nor exceed the carrying amount that would have been determined, net of depreciation, had no impairment loss been recognized for the asset in prior years. Such reversal is recognized in the statements of profit or loss and other comprehensive income unless the asset is carried at a revalued amount, in which case the reversal is treated as a revaluation increase. The following criteria are also applied in assessing impairment of specific assets: Intangible assets Intangible assets with indefinite useful lives are tested for impairment annually as of December 31 either individually or at the cash generating unit level, as appropriate and when circumstances indicate that the carrying value may be impaired. 2.16 Trade and Other Payables These amounts represent liabilities for goods and services provided to the Group prior to the end of reporting period which are unpaid. Trade and other payables are presented as current liabilities, unless payment is not due within 12 months after the reporting period.
Samsung Electro-Mechanics Co., Ltd. and Subsidiaries Notes to the Consolidated Financial Statements December 31, 2021 and 2020
27
2.17 Provisions Provisions are recognized when the Group has a present obligation (legal or constructive) as a result of a past event, it is probable that an outflow of resources embodying economic benefits will be required to settle the obligation and a reliable estimate can be made of the amount of the obligation. When the Group expects some or all of a provision to be reimbursed, for example under an insurance contract, the reimbursement is recognized as a separate asset but only when the reimbursement is virtually certain. The expense relating to any provision is presented in the consolidated statement of comprehensive income net of any reimbursement.
If the effect of the time value of money is material, provisions are discounted using a current pre-tax rate that reflects, when appropriate, the risks specific to the liability. When discounting is used, the increase in the provision due to the passage of time is recognized as a finance cost. Provision for product warranties The Group accrues provision for warranty corresponding to the estimated costs of future repairs and returns, based on the past experience. The provision for product warranties is charged to selling and administrative expenses when the goods covered by warranties are sold to customers. Asset (allowance) and liability (emission obligation) The Group is allocated with emission allowances free of charge by the government in accordance with the Act on Allocation and Trading of Emission Allowances in the Republic of Korea. The allowances are allocated to the Group every year for planned periods, and the Group should submit the equivalent number of emission allowances for actual emissions. The Group measures the emission allowances that it receives from the government free of charge at nil, and measures any purchased emission allowances at cost. In addition, emission allowances are derecognized in the financial statements when they are delivered to the government or sold. A liability (emission obligation) is recognized only where actual emissions exceed the allocated emission allowances, and the cost of emissions is recognized as an operating cost. The liability is measured by adding the following (1) and (2). (1) The carrying value of emission allowances for the year to be delivered to the government (2) The best estimate of expenditures, as of the end of a reporting period, in performing emission obligations
exceeding the above emission allowances
Samsung Electro-Mechanics Co., Ltd. and Subsidiaries Notes to the Consolidated Financial Statements December 31, 2021 and 2020
28
2.18 Employee benefits Post-employment benefits The Group operates both defined contribution and defined benefit pension plans. For defined contribution plans, the Group pays contribution to publicly or privately administered pension insurance plans on mandatory, contractual or voluntary basis. The Group has no further payment obligation once the contribution has been paid. The contribution is recognized as employee benefit expense when they are due. The Group operates a defined benefit pension plan in Korea, the cost of providing benefits under the defined benefit plan is determined using the projected unit credit method. Re-measurements, comprising of actuarial gains and losses, the effect of the asset ceiling, excluding net interest (not applicable to the Group) and the return on plan assets (excluding net interest), are recognized immediately in the statement of financial position with a corresponding debit or credit to retained earnings through OCI in the period in which they occur. Re-measurements are not reclassified to profit or loss in subsequent periods. Past service costs are recognized in profit or loss on the earlier of: The date of the plan amendment or curtailment, and The date that the Group recognizes restructuring-related costs
Net interest is calculated by applying the discount rate to the net defined benefit liability or asset. The Group recognizes the following changes in the net defined benefit obligation under ‘cost of sales’ and ‘Selling and administrative expenses’ in consolidated statement of comprehensive income. Other long-term employee benefits The Group provide long-term employee benefits that are entitled to employees with service period for ten years and above. The expected costs of these benefits are accrued over the period of employment using the same accounting methodology as used for defined benefit pension plans. The Group recognizes service cost, net interest on other long-term employee benefits and remeasurements as profit or loss for the year. These liabilities are valued annually by an independent qualified actuary. 2.19 Treasury shares Own equity instruments which are reacquired (treasury shares) are recognized at cost and deducted from equity. No gain or loss is recognized in the statements of profit or loss and other comprehensive income on the purchase, sale, issue or cancellation of the Group’s own equity instruments. Any difference between the carrying amount and the consideration is recognized in other capital reserves. 2.20 Cash dividend The Company recognizes a liability to pay a dividend when the distribution is authorized and the distribution is no longer at the discretion of the Company. A distribution is authorized when it is approved by the shareholders. A corresponding amount is recognized directly in equity.
Samsung Electro-Mechanics Co., Ltd. and Subsidiaries Notes to the Consolidated Financial Statements December 31, 2021 and 2020
29
2.21 Revenue recognition Sale of goods The Group is in the business of manufacturing and selling electronics equipment. Revenue from contracts with customers is recognised when control of the goods or services are transferred to the customer at an amount that reflects the consideration to which the Group expects to be entitled in exchange for those goods or services. Revenue from sale of equipment is recognised at the point in time when control of the asset is transferred to the customer, generally on delivery of the equipment. Royalty revenue The Group entered into royalty agreements with its subsidiaries. The Group is obligated to provide know-how to customers over the service period; therefore, the Group will recognize a certain amount of the allocated transaction price for each performance obligation over the service period as revenue. Warranty obligations The Group typically provides warranties for general repairs of defects that existed at the time of sale, as required by law. These assurance-type warranties are accounted for under Korean IFRS 1037 Provisions, Contingent Liabilities and Contingent Assets. See the Note 16 on warranty provisions. Assets and liabilities arising from rights of return Right of return asset represents the Group’s right to recover the goods expected to be returned by customers. The asset is measured at the former carrying amount of the inventory, less any expected costs to recover the goods, including any potential decreases in the value of the returned goods. The Group updates the measurement of the asset recorded for any revisions to its expected level of returns, as well as any additional decreases in the value of the returned products. A refund liability is the obligation to refund some or all of the consideration received (or receivable) from the customer and is measured at the amount the Group ultimately expects it will have to return to the customer. The Group updates its estimates of refund liabilities (and the corresponding change in the transaction price) at the end of each reporting period. See above accounting policy on variable consideration. 2.22 Taxes Current income tax Current income tax assets and liabilities for the current and prior periods are measured at the amount expected to be recovered from or paid to the taxation authorities. The tax rates and tax laws used to compute the amount are those that are enacted or substantively enacted, at the reporting date in the countries where the Group operates and generates taxable income.
Current income tax relating to items recognized directly in equity is recognized in equity and not in the statements of profit or loss and other comprehensive income. Management periodically evaluates positions taken in the tax returns with respect to situations in which applicable tax regulations are subject to interpretation and establishes provisions where appropriate. Deferred tax Deferred tax is provided using the liability method on temporary differences between the tax bases of assets and liabilities and their carrying amounts for financial reporting purposes at the reporting date. Deferred tax liabilities are recognized for all taxable temporary differences, except: When the deferred tax liability arises from the initial recognition of goodwill. When the deferred tax liability arises from the initial recognition of an asset or liability in a transaction that
is not a business combination and, at the time of the transaction, affects neither the accounting profit nor taxable profit or loss.
In respect of taxable temporary differences associated with investments in subsidiaries, associates and interests in joint ventures, where the timing of the reversal of the temporary differences can be controlled and it is probable that the temporary differences will not reverse in the foreseeable future.
Samsung Electro-Mechanics Co., Ltd. and Subsidiaries Notes to the Consolidated Financial Statements December 31, 2021 and 2020
30
2.22 Taxes (cont’d) Deferred tax assets are recognized for all deductible temporary differences, the carry forward of unused tax credits and unused tax losses, to the extent that it is probable that taxable profit will be available against which the deductible temporary differences, and the carry forward of unused tax credits and unused tax losses can be utilized except:
When the deferred tax asset relating to the deductible temporary difference arises from the initial recognition
of an asset or liability in a transaction that is not a business combination and, at the time of the transaction, affects neither the accounting profit nor taxable profit or loss.
In respect of deductible temporary differences associated with investments in subsidiaries, associates and interests in joint ventures, deferred tax assets are recognized only to the extent that it is probable that the temporary differences will reverse in the foreseeable future and taxable profit will be available against which the temporary differences can be utilized.
The carrying amount of deferred tax assets is reviewed at each reporting date and reduced to the extent that it is no longer probable that sufficient taxable profit will be available to allow all or part of the deferred tax asset to be utilized. Unrecognized deferred tax assets are reassessed at each reporting date and are recognized to the extent that it has become probable that future taxable profits will allow the deferred tax asset to be recovered.
Deferred tax assets and liabilities are measured at the tax rates that are expected to apply in the year when the asset is realized or the liability is settled, based on tax rates (and tax laws) that have been enacted or substantively enacted at the reporting date.
Deferred tax relating to items recognized outside profit or loss is recognized outside profit or loss. Deferred tax items are recognized in correlation to the underlying transaction either in other comprehensive income or directly in equity.
Deferred tax assets and deferred tax liabilities are offset, if a legally enforceable right exists to set off current tax assets against current income tax liabilities and the deferred taxes relate to the same taxable entity and the same taxation authority. 2.23 Government grants Government grants relating to assets are recognized as deferred income and they are credited to profit or loss in depreciation expenses over the useful life of the related assets and the period necessary to match them with the costs that they are intended to compensate. 2.24 Greenhouse Gas Emission Permits and Obligations
Emission permits and emission obligations for compliance With enforcement of The Act on the Allocation and Trading of Greenhouse Gas Emission Permits, emission permits that are allocated free of charge from the government are measured at zero, and emission permits purchased are recognized at acquisition cost by including any directly attributable costs incurred during the normal course of business. Emission permits are carried at cost less accumulated impairment losses, and those to be submitted to the government within one year from the end of reporting period are classified as current assets.
Samsung Electro-Mechanics Co., Ltd. and Subsidiaries Notes to the Consolidated Financial Statements December 31, 2021 and 2020
31
2.24 Greenhouse Gas Emission Permits and Obligations (cont’d) Emission obligation is a present obligation of submitting the allowances to the government. Emissions obligations are measured as the sum of the carrying amount of the allocated allowances that will be submitted to the government and the best estimate of expenditure required to settle the obligation at the end of reporting period for any excess emission. The emission obligations to be settled within one year from the end of the reporting period are classified as current liabilities. The Group derecognizes the emission permits when the emission allowance is disposed or submitted to the government or becomes unable to be disposed or submitted, and accordingly, the future economic benefits are no longer expected to be probable. The Group derecognizes the emission obligations when the Group submits the emission permits to the government. The emission permits and emission obligations are classified as intangible assets and provisions, respectively, in the statement of financial position. Emission permits held for trading Emission permits held for trading are classified as current assets and measured at fair value, and changes in fair value are recognized as profit or loss for the year. Changes in fair value and gain (loss) on disposal are recognized as other income and other expenses, respectively. 2.25 New and amended standards adopted by the Group The Group has applied the following standards and amendments for the first time for their annual reporting period commencing January 1, 2021. Amendments to Korean IFRS 1116 Lease – Practical expedient for COVID-19 - Related Rent Concessions As a practical expedient, a lessee may elect not to assess whether a rent concession occurring as a direct consequence of the COVID-19 pandemic is a lease modification. A lessee that makes this election shall account for any change in lease payments resulting from the rent concession the same way it would account for the change applying this Standard if the change were not a lease modification. The amendment does not have a significant impact on the consolidated financial statements. Amendments to Korean IFRS 1109 Financial Instruments, Korean IFRS 1039 Financial Instruments: Recognition and Measurement, Korean IFRS 1107 Financial Instruments: Disclosure, Korean IFRS 1104 Insurance Contracts and Korean IFRS 1116 Lease – Interest Rate Benchmark Reform (Phase 2 amendments) In relation to interest rate benchmark reform, the amendments provide exceptions including adjust effective interest rate instead of book amounts when interest rate benchmark of financial instruments at amortised costs is replaced and apply hedge accounting without discontinuance although the interest rate benchmark is replaced in hedging relationship. The amendment does not have a significant impact on the consolidated financial statements. 2.26 New standards and interpretations not yet adopted by the Group The following new accounting standards and interpretations have been published that are not mandatory for December 31, 2021 reporting periods and have not been early adopted by the Group. Amendment to Korean IFRS 1116 - Covid-19 - Related Rent Concessions beyond June 30, 2021 The application of the practical expedient, a lessee may elect not to assess whether a rent concession occurring as a direct consequence of the COVID-19 pandemic is a lease modification, is extended to lease payments originally due on or before June 30, 2022. The amendment should be applied for annual periods beginning on or after April 1, 2021, and earlier application is permitted. The Group is in review for the impact of these amendments on the consolidated financial statements.
Samsung Electro-Mechanics Co., Ltd. and Subsidiaries Notes to the Consolidated Financial Statements December 31, 2021 and 2020
32
2.26 New standards and interpretations not yet adopted by the Group (cont’d) Amendments to Korean IFRS 1103 Business Combination – Reference to the Conceptual Framework The amendments update a reference of definition of assets and liabilities to be recognized in a business combination in revised Conceptual Framework for Financial Reporting. However, the amendments add an exception for the recognition of liabilities and contingent liabilities within the scope of Korea IFRS 1037 Provisions, Contingent Liabilities and Contingent Assets, and Korean IFRS 2121 Levies. The amendments also clarify that contingent assets should not be recognized at the acquisition date. The amendments should be applied for annual periods beginning on or after January 1, 2022, and earlier application is permitted. The Group is in review for the impact of these amendments on the consolidated financial statements. Amendments to Korean IFRS 1016 Property, Plant and Equipment - Proceeds before intended use The amendments prohibit an entity from deducting from the cost of an item of property, plant and equipment any proceeds from selling items produced while the entity is preparing the asset for its intended use. Instead, the entity will recognize the proceeds from selling such items, and the costs of producing those items, in profit or loss. The amendments should be applied for annual periods beginning on or after January 1, 2022, and earlier application is permitted. The Group is in review for the impact of these amendments on the consolidated financial statements. Amendments to Korean IFRS 1037 Provisions, Contingent Liabilities and Contingent Assets - Onerous Contracts : Cost of Fulfilling a Contract The amendments clarify that the direct costs of fulfilling a contract include both the incremental costs of fulfilling the contract and an allocation of other costs directly related to fulfilling contracts when assessing whether the contract is onerous. The amendments should be applied for annual periods beginning on or after January 1, 2022, and earlier application is permitted. The Group is in review for the impact of these amendments on the consolidated financial statements. Amendments to Korean IFRS 1001 Presentation of Financial Statements - Classification of Liabilities as Current or Non-current The amendments clarify that liabilities are classified as either current or non-current, depending on the substantive rights that exist at the end of the reporting period. Classification is unaffected by the likelihood that an entity will exercise right to defer settlement of the liability or the expectations of management. Also, the settlement of liability includes the transfer of the entity’s own equity instruments, however, it would be excluded if an option to settle them by the entity’s own equity instruments if compound financial instruments is met the definition of equity instruments and recognized separately from the liability. The amendments should be applied for annual periods beginning on or after January 1, 2023, and earlier application is permitted. The Group is in review for the impact of these amendments on the consolidated financial statements. Korean IFRS 1001 Presentation of Financial Statements - Disclosure of Accounting Policies The amendments to Korean IFRS 1001 define and require entities to disclose their material accounting policies. The IASB amended IFRS Practice Statement 2 Disclosure of Accounting Policies to provide guidance on how to apply the concept of materiality to accounting policy disclosures. The amendments should be applied for annual periods beginning on or after January 1, 2023, and earlier application is permitted. The Group is in review for the impact of these amendments on the consolidated financial statements. Korean IFRS 1008 Accounting policies, changes in accounting estimates and errors - Definition of Accounting Estimates The amendments define accounting estimates and clarify how to distinguish them from changes in accounting policies. The amendments should be applied for annual periods beginning on or after January 1, 2023, and earlier application is permitted. The Group is in review for the impact of these amendments on the consolidated financial statements. Korean IFRS 1012 Income Taxes - Deferred Tax related to Assets and Liabilities arising from a Single Transaction The amendments include an additional condition to the exemption to initial recognition of an asset or liability that a transaction does not give rise to equal taxable and deductible temporary differences at the time of the transaction. The amendments should be applied for annual periods beginning on or after January 1, 2023, and earlier application is permitted. The Group is in review for the impact of these amendments on the consolidated financial statements.
Samsung Electro-Mechanics Co., Ltd. and Subsidiaries Notes to the Consolidated Financial Statements December 31, 2021 and 2020
33
2.26 New standards and interpretations not yet adopted by the Group (cont’d) Annual improvements to Korean IFRS 2018-2020 Annual improvements of Korean IFRS 2018-2020 Cycle should be applied for annual periods beginning on or after January 1, 2022, and earlier application is permitted. The Group is in review for the impact of these amendments on the consolidated financial statements.
· Korean IFRS 1101 First time Adoption of Korean International Financial Reporting Standards – Subsidiaries that are first-time adopters
· Korean IFRS 1109 Financial Instruments – Fees related to the 10% test for derecognition of financial liabilities
· Korean IFRS 1116 Leases – Lease incentives
· Korean IFRS 1041 Agriculture – Measuring fair value 2.27 Significant accounting judgments, estimates and assumptions The preparation of consolidated financial statements requires the Group to make estimates and assumptions concerning the future. Management also needs to exercise judgement in applying the Group’s accounting policies. Estimates and assumptions are continually evaluated and are based on historical experience and other factors, including expectations of future events that are believed to be reasonable under the circumstances. As the resulting accounting estimates will, by definition, seldom equal the related actual results, it can contain a significant risk of causing a material adjustment. The estimates and assumptions that have a significant risk of causing a material adjustment to the carrying amounts of assets and liabilities within the next financial year are discussed below. Additional information of significant judgement and assumptions of certain items are included in relevant notes. Impairment of non-financial assets The Group assesses, at each reporting date, whether there is an indication that an asset may be impaired. Goodwill and intangible assets with indefinite useful lives are tested for impairment annually, or when circumstances indicate that the carrying value may be impaired. Other non-financial assets are tested for impairment when circumstances indicate that its carrying amount may not be recoverable. In determining a value in use, management estimates future cash flows to be derived from the asset or CGU and applies the appropriate discount rate to those future cash flows.
Samsung Electro-Mechanics Co., Ltd. and Subsidiaries Notes to the Consolidated Financial Statements December 31, 2021 and 2020
34
2.27 Significant accounting judgments, estimates and assumptions (cont’d) Deferred tax assets Deferred tax assets are recognized for unused tax losses in the extent that it is probable that future taxable income will be available for tax losses. Management of the associate makes key judgments to determine the amount of deferred tax assets that are recognized based on the timing and level of future tax strategy and tax benefits. Net defined benefit liabilities The cost of defined benefit pension plans and the present value of the pension obligation are determined using actuarial valuations. An actuarial valuation involves making various assumptions. These include the determination of the discount rate, future salary increases, mortality rates and future pension increases. Due to the complexity of the valuation, the underlying assumptions and its long-term nature, a defined benefit obligation is highly sensitive to changes in these assumptions. All assumptions are reviewed at each reporting date. Fair value of financial instruments When the fair values of financial assets and financial liabilities recorded in the statement of financial position cannot be measured based on quoted prices in active markets, their fair value is measured using valuation techniques including the DCF model. The inputs to these models are taken from observable markets where possible, but where this is not feasible, a degree of judgment is required in establishing fair values. Judgments include considerations of inputs such as liquidity risk, credit risk and volatility. Changes in assumptions about these factors could affect the reported fair value of financial instruments. Impact of Coronavirus disease 2019 (“COVID-19”) The spread of COVID-19 from 2020 has a material impact on the global economy. It may have a negative impact, such as, decrease in productivity, decrease, or delay in sales, collection of existing receivables and others. Accordingly, it may have a negative impact on the financial position and financial performance of the Group. 2.28 Approval of the financial statements Approval of the consolidated financial statements of the Group for the year ended December 31, 2021 were approved by the Board of Directors’ meeting on January 26, 2022 for submission to the general shareholders’ meeting.
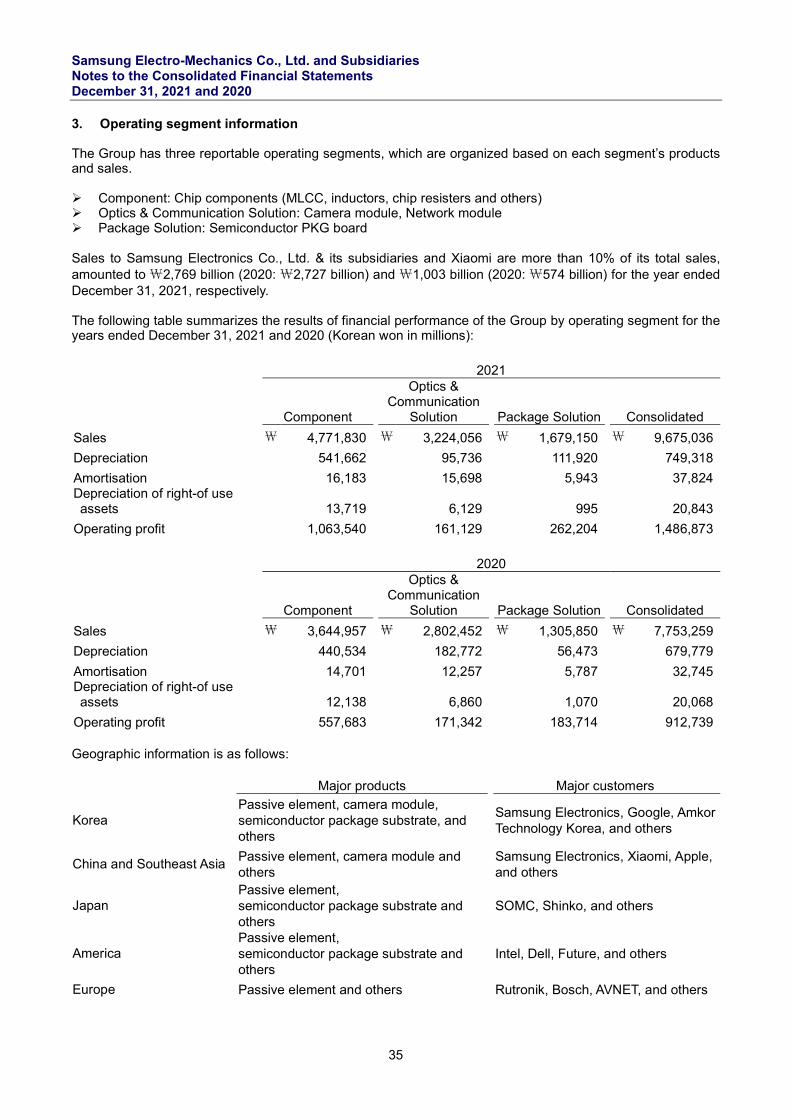
Samsung Electro-Mechanics Co., Ltd. and Subsidiaries Notes to the Consolidated Financial Statements December 31, 2021 and 2020
35
3. Operating segment information The Group has three reportable operating segments, which are organized based on each segment’s products and sales. Component: Chip components (MLCC, inductors, chip resisters and others) Optics & Communication Solution: Camera module, Network module Package Solution: Semiconductor PKG board
Sales to Samsung Electronics Co., Ltd. & its subsidiaries and Xiaomi are more than 10% of its total sales, amounted to \2,769 billion (2020: \2,727 billion) and \1,003 billion (2020: \574 billion) for the year ended December 31, 2021, respectively. The following table summarizes the results of financial performance of the Group by operating segment for the years ended December 31, 2021 and 2020 (Korean won in millions):
Geographic information is as follows: Major products Major customers
Korea Passive element, camera module, semiconductor package substrate, and others
Samsung Electronics, Google, Amkor Technology Korea, and others
China and Southeast Asia Passive element, camera module and others
Samsung Electronics, Xiaomi, Apple, and others
Japan Passive element, semiconductor package substrate and others
SOMC, Shinko, and others
America Passive element, semiconductor package substrate and others
Intel, Dell, Future, and others
Europe Passive element and others Rutronik, Bosch, AVNET, and others
2021
Component
Optics & Communication
Solution Package Solution Consolidated
Sales ₩ 4,771,830 ₩ 3,224,056 ₩ 1,679,150 ₩ 9,675,036
Depreciation 541,662 95,736 111,920 749,318
Amortisation 16,183 15,698 5,943 37,824 Depreciation of right-of use assets
13,719 6,129 995 20,843
Operating profit 1,063,540 161,129 262,204 1,486,873
2020
Component
Optics & Communication
Solution Package Solution Consolidated
Sales ₩ 3,644,957 ₩ 2,802,452 ₩ 1,305,850 ₩ 7,753,259
Depreciation 440,534 182,772 56,473 679,779
Amortisation 14,701 12,257 5,787 32,745 Depreciation of right-of use assets
12,138 6,860 1,070 20,068
Operating profit 557,683 171,342 183,714 912,739
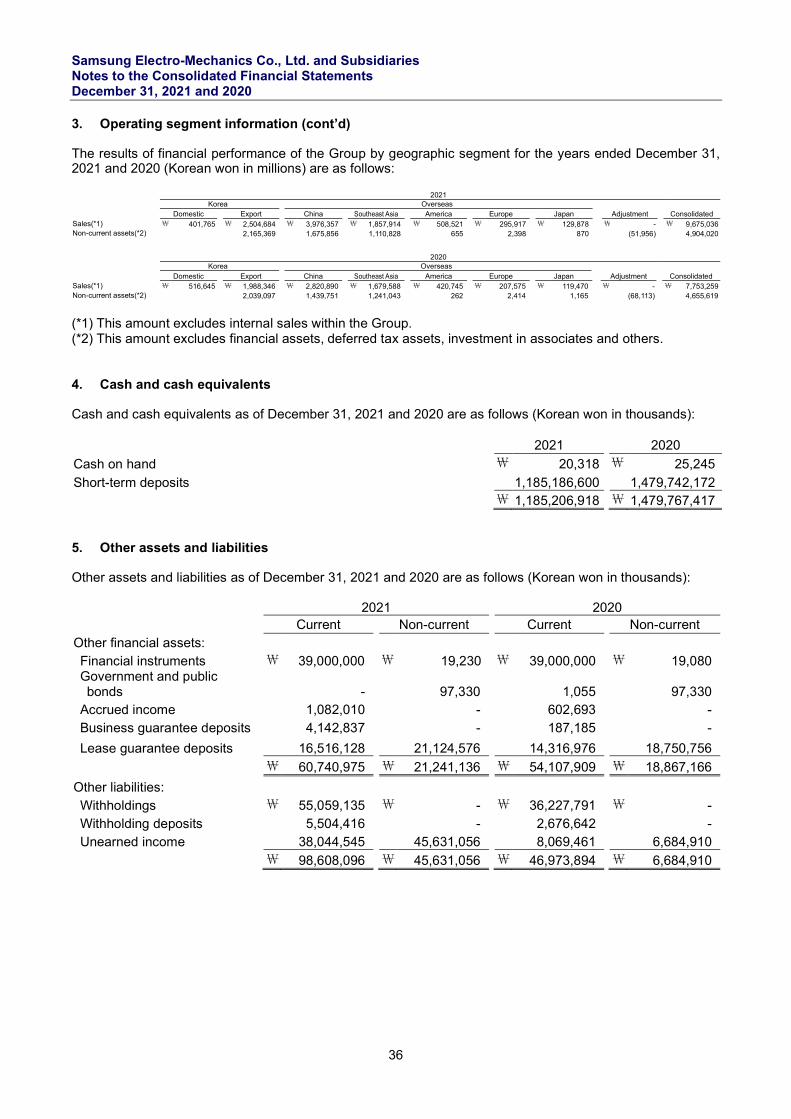
Samsung Electro-Mechanics Co., Ltd. and Subsidiaries Notes to the Consolidated Financial Statements December 31, 2021 and 2020
36
3. Operating segment information (cont’d) The results of financial performance of the Group by geographic segment for the years ended December 31, 2021 and 2020 (Korean won in millions) are as follows: 2021 Korea Overseas Domestic Export China Southeast Asia America Europe Japan Adjustment Consolidated Sales(*1) \ 401,765 \ 2,504,684 \ 3,976,357 \ 1,857,914 \ 508,521 \ 295,917 \ 129,878 \ - \ 9,675,036 Non-current assets(*2) 2,165,369 1,675,856 1,110,828 655 2,398 870 (51,956) 4,904,020
2020 Korea Overseas Domestic Export China Southeast Asia America Europe Japan Adjustment Consolidated Sales(*1) \ 516,645 \ 1,988,346 \ 2,820,890 \ 1,679,588 \ 420,745 \ 207,575 \ 119,470 \ - \ 7,753,259 Non-current assets(*2) 2,039,097 1,439,751 1,241,043 262 2,414 1,165 (68,113) 4,655,619
(*1) This amount excludes internal sales within the Group. (*2) This amount excludes financial assets, deferred tax assets, investment in associates and others. 4. Cash and cash equivalents Cash and cash equivalents as of December 31, 2021 and 2020 are as follows (Korean won in thousands): 2021 2020
Cash on hand ₩ 20,318 ₩ 25,245
Short-term deposits 1,185,186,600 1,479,742,172 ₩ 1,185,206,918 ₩ 1,479,767,417 5. Other assets and liabilities Other assets and liabilities as of December 31, 2021 and 2020 are as follows (Korean won in thousands):
2021 2020 Current Non-current Current Non-current
Other financial assets:
Financial instruments ₩ 39,000,000 ₩ 19,230 ₩ 39,000,000 ₩ 19,080 Government and public bonds
- 97,330 1,055 97,330
Accrued income 1,082,010 - 602,693 -
Business guarantee deposits 4,142,837 - 187,185 -
Lease guarantee deposits 16,516,128 21,124,576 14,316,976 18,750,756
₩ 60,740,975 ₩ 21,241,136 ₩ 54,107,909 ₩ 18,867,166
Other liabilities:
Withholdings ₩ 55,059,135 ₩ - ₩ 36,227,791 ₩ - Withholding deposits
5,504,416 - 2,676,642 - Unearned income 38,044,545 45,631,056 8,069,461 6,684,910
₩ 98,608,096 ₩ 45,631,056 ₩ 46,973,894 ₩ 6,684,910
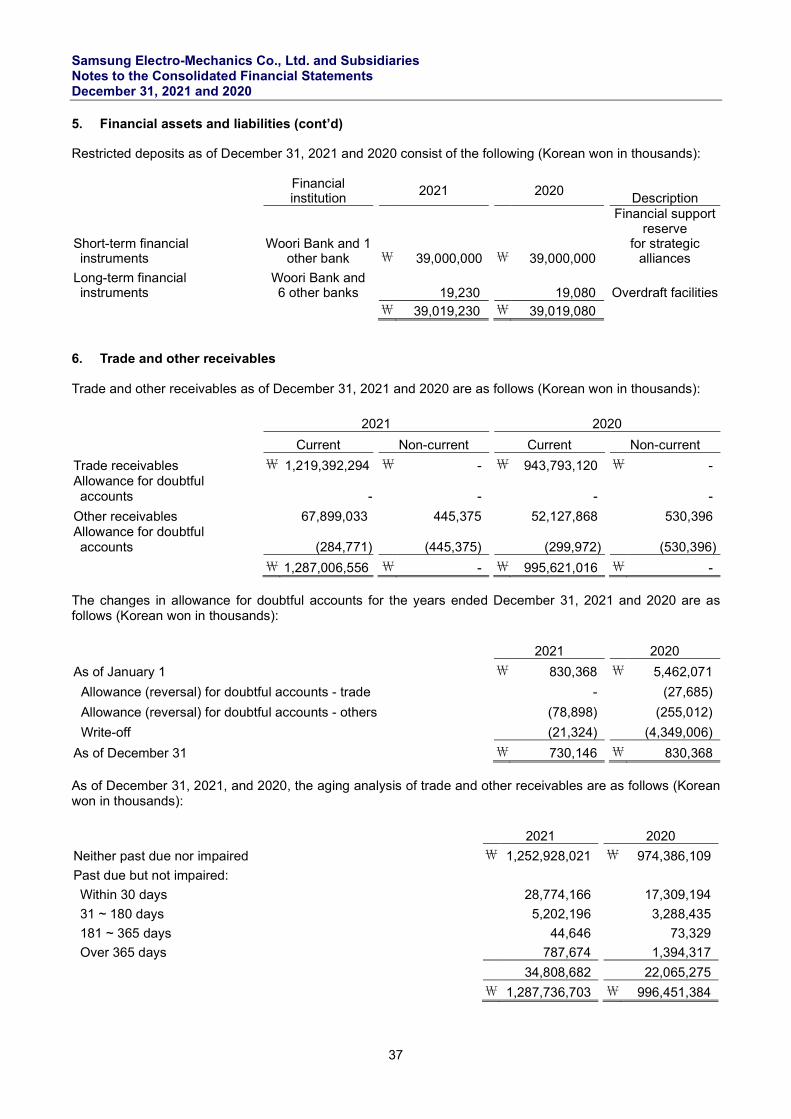
Samsung Electro-Mechanics Co., Ltd. and Subsidiaries Notes to the Consolidated Financial Statements December 31, 2021 and 2020
37
5. Financial assets and liabilities (cont’d) Restricted deposits as of December 31, 2021 and 2020 consist of the following (Korean won in thousands):
Financial
institution 2021 2020
Description
Short-term financial instruments
Woori Bank and 1 other bank
₩ 39,000,000 ₩ 39,000,000
Financial support reserve
for strategic alliances
Long-term financial instruments
Woori Bank and 6 other banks
19,230 19,080
Overdraft facilities
₩ 39,019,230 ₩ 39,019,080
6. Trade and other receivables Trade and other receivables as of December 31, 2021 and 2020 are as follows (Korean won in thousands):
The changes in allowance for doubtful accounts for the years ended December 31, 2021 and 2020 are as follows (Korean won in thousands):
As of December 31, 2021, and 2020, the aging analysis of trade and other receivables are as follows (Korean won in thousands):
2021 2020 Current Non-current Current Non-current
Trade receivables ₩ 1,219,392,294 ₩ - ₩ 943,793,120 ₩ - Allowance for doubtful accounts
- - - -
Other receivables 67,899,033 445,375 52,127,868 530,396 Allowance for doubtful accounts
(284,771) (445,375) (299,972) (530,396)
₩ 1,287,006,556 ₩ - ₩ 995,621,016 ₩ -
2021 2020
As of January 1 ₩ 830,368 ₩ 5,462,071
Allowance (reversal) for doubtful accounts - trade - (27,685)
Allowance (reversal) for doubtful accounts - others (78,898) (255,012)
Write-off (21,324) (4,349,006)
As of December 31 ₩ 730,146 ₩ 830,368
2021 2020
Neither past due nor impaired ₩ 1,252,928,021 ₩ 974,386,109
Past due but not impaired: Within 30 days 28,774,166 17,309,194
31 ~ 180 days 5,202,196 3,288,435
181 ~ 365 days 44,646 73,329
Over 365 days 787,674 1,394,317
34,808,682 22,065,275
₩ 1,287,736,703 ₩ 996,451,384
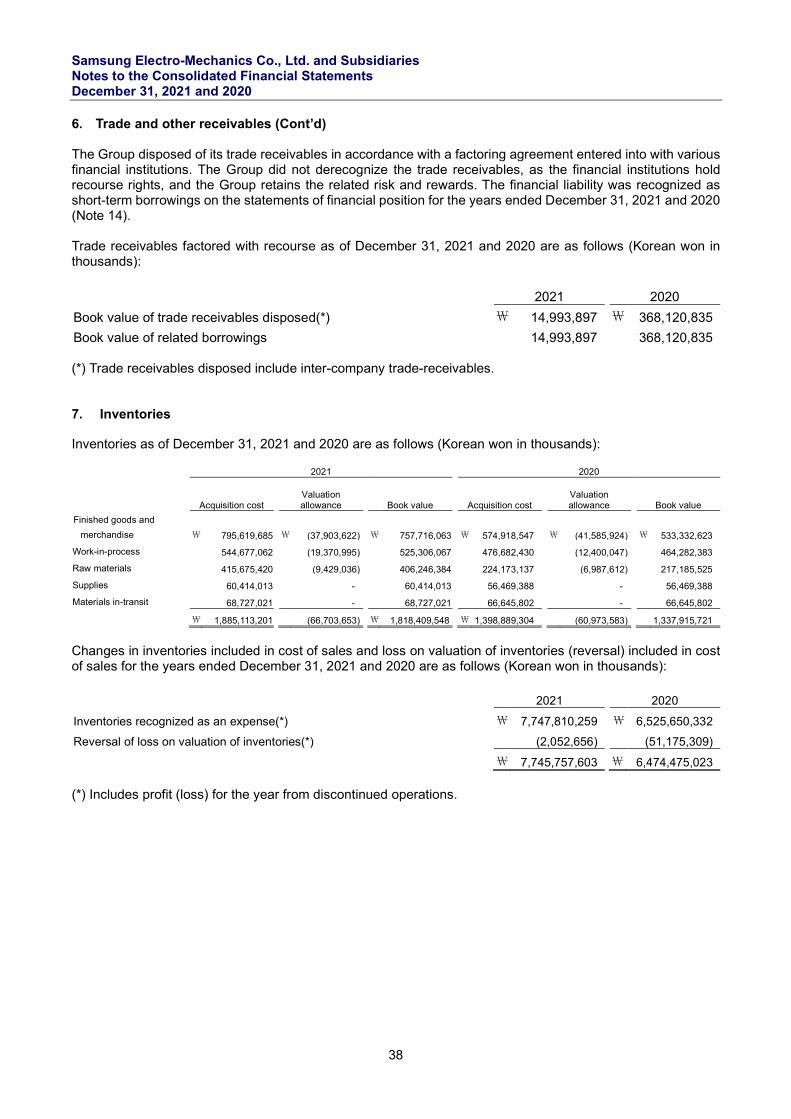
Samsung Electro-Mechanics Co., Ltd. and Subsidiaries Notes to the Consolidated Financial Statements December 31, 2021 and 2020
38
6. Trade and other receivables (Cont’d) The Group disposed of its trade receivables in accordance with a factoring agreement entered into with various financial institutions. The Group did not derecognize the trade receivables, as the financial institutions hold recourse rights, and the Group retains the related risk and rewards. The financial liability was recognized as short-term borrowings on the statements of financial position for the years ended December 31, 2021 and 2020 (Note 14). Trade receivables factored with recourse as of December 31, 2021 and 2020 are as follows (Korean won in thousands):
(*) Trade receivables disposed include inter-company trade-receivables. 7. Inventories Inventories as of December 31, 2021 and 2020 are as follows (Korean won in thousands):
2021 2020
Acquisition cost Valuation allowance Book value Acquisition cost
Valuation allowance Book value
Finished goods and
merchandise ₩ 795,619,685 ₩ (37,903,622) ₩ 757,716,063 ₩ 574,918,547 ₩ (41,585,924) ₩ 533,332,623
Work-in-process 544,677,062 (19,370,995) 525,306,067 476,682,430 (12,400,047) 464,282,383
Raw materials 415,675,420 (9,429,036) 406,246,384 224,173,137 (6,987,612) 217,185,525
Supplies 60,414,013 - 60,414,013 56,469,388 - 56,469,388
Materials in-transit 68,727,021 - 68,727,021 66,645,802 - 66,645,802
₩ 1,885,113,201 (66,703,653) ₩ 1,818,409,548 ₩ 1,398,889,304 (60,973,583) 1,337,915,721
Changes in inventories included in cost of sales and loss on valuation of inventories (reversal) included in cost of sales for the years ended December 31, 2021 and 2020 are as follows (Korean won in thousands):
(*) Includes profit (loss) for the year from discontinued operations.
2021 2020
Book value of trade receivables disposed(*) ₩ 14,993,897 ₩ 368,120,835
Book value of related borrowings 14,993,897 368,120,835
2021 2020
Inventories recognized as an expense(*) ₩ 7,747,810,259 ₩ 6,525,650,332
Reversal of loss on valuation of inventories(*) (2,052,656) (51,175,309)
₩ 7,745,757,603 ₩ 6,474,475,023
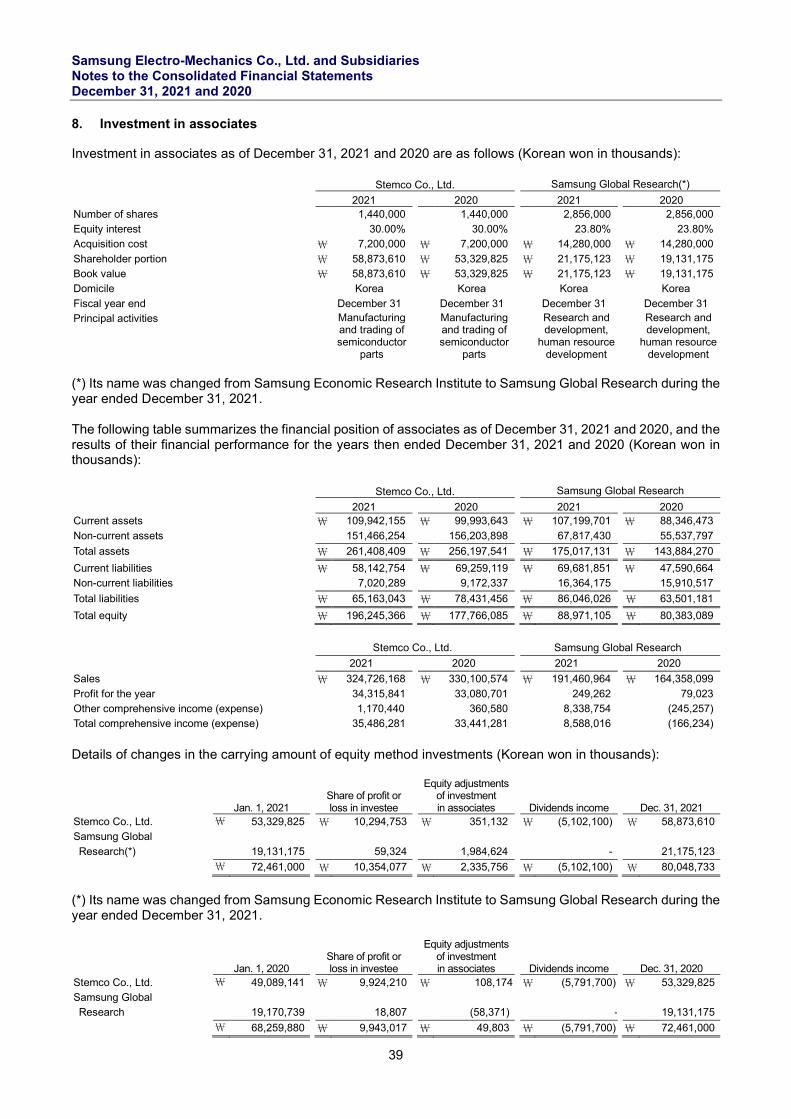
Samsung Electro-Mechanics Co., Ltd. and Subsidiaries Notes to the Consolidated Financial Statements December 31, 2021 and 2020
39
8. Investment in associates Investment in associates as of December 31, 2021 and 2020 are as follows (Korean won in thousands):
Stemco Co., Ltd. Samsung Global Research(*) 2021 2020 2021 2020
Number of shares 1,440,000 1,440,000 2,856,000 2,856,000 Equity interest 30.00% 30.00% 23.80% 23.80% Acquisition cost \ 7,200,000 \ 7,200,000 \ 14,280,000 \ 14,280,000
Shareholder portion \ 58,873,610 \ 53,329,825 \ 21,175,123 \ 19,131,175 Book value \ 58,873,610 \ 53,329,825 \ 21,175,123 \ 19,131,175 Domicile Korea Korea Korea Korea
Fiscal year end December 31 December 31 December 31 December 31 Principal activities
Manufacturing and trading of semiconductor
parts
Manufacturing and trading of semiconductor
parts
Research and development,
human resource development
Research and development,
human resource development
(*) Its name was changed from Samsung Economic Research Institute to Samsung Global Research during the year ended December 31, 2021. The following table summarizes the financial position of associates as of December 31, 2021 and 2020, and the results of their financial performance for the years then ended December 31, 2021 and 2020 (Korean won in thousands):
Stemco Co., Ltd. Samsung Global Research 2021 2020 2021 2020
Current assets \ 109,942,155 \ 99,993,643 \ 107,199,701 \ 88,346,473
Non-current assets 151,466,254 156,203,898 67,817,430 55,537,797
Total assets \ 261,408,409 \ 256,197,541 \ 175,017,131 \ 143,884,270
Current liabilities \ 58,142,754 \ 69,259,119 \ 69,681,851 \ 47,590,664 Non-current liabilities 7,020,289 9,172,337 16,364,175 15,910,517
Total liabilities \ 65,163,043 \ 78,431,456 \ 86,046,026 \ 63,501,181
Total equity \ 196,245,366 \ 177,766,085 \ 88,971,105 \ 80,383,089
Stemco Co., Ltd. Samsung Global Research
2021 2020 2021 2020
Sales \ 324,726,168 \ 330,100,574 \ 191,460,964 \ 164,358,099
Profit for the year 34,315,841 33,080,701 249,262 79,023 Other comprehensive income (expense) 1,170,440 360,580 8,338,754 (245,257) Total comprehensive income (expense) 35,486,281 33,441,281 8,588,016 (166,234)
Details of changes in the carrying amount of equity method investments (Korean won in thousands):
Jan. 1, 2021 Share of profit or loss in investee
Equity adjustments of investment in associates Dividends income Dec. 31, 2021
Stemco Co., Ltd. \ 53,329,825 \ 10,294,753 \ 351,132 \ (5,102,100) \ 58,873,610 Samsung Global
Research(*) 19,131,175 59,324 1,984,624 - 21,175,123
\ 72,461,000 \ 10,354,077 \ 2,335,756 \ (5,102,100) \ 80,048,733
(*) Its name was changed from Samsung Economic Research Institute to Samsung Global Research during the year ended December 31, 2021.
Jan. 1, 2020 Share of profit or loss in investee
Equity adjustments of investment in associates Dividends income Dec. 31, 2020
Stemco Co., Ltd. \ 49,089,141 \ 9,924,210 \ 108,174 \ (5,791,700) \ 53,329,825 Samsung Global Research 19,170,739 18,807 (58,371) - 19,131,175
\ 68,259,880 \ 9,943,017 \ 49,803 \ (5,791,700) \ 72,461,000
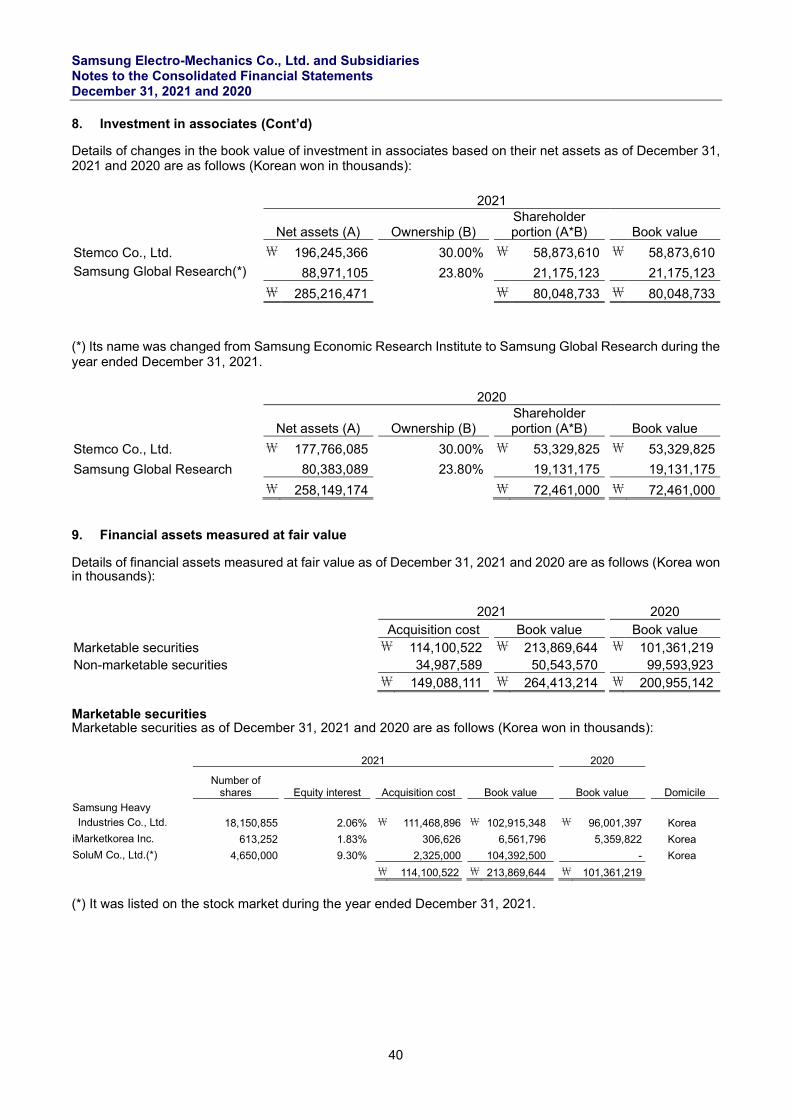
Samsung Electro-Mechanics Co., Ltd. and Subsidiaries Notes to the Consolidated Financial Statements December 31, 2021 and 2020
40
8. Investment in associates (Cont’d) Details of changes in the book value of investment in associates based on their net assets as of December 31, 2021 and 2020 are as follows (Korean won in thousands):
(*) Its name was changed from Samsung Economic Research Institute to Samsung Global Research during the year ended December 31, 2021.
9. Financial assets measured at fair value Details of financial assets measured at fair value as of December 31, 2021 and 2020 are as follows (Korea won in thousands):
Marketable securities Marketable securities as of December 31, 2021 and 2020 are as follows (Korea won in thousands):
2021 2020
Number of shares Equity interest Acquisition cost Book value Book value Domicile
Samsung Heavy Industries Co., Ltd. 18,150,855 2.06% ₩ 111,468,896 ₩ 102,915,348 ₩ 96,001,397 Korea
iMarketkorea Inc. 613,252 1.83% 306,626 6,561,796 5,359,822 Korea
SoluM Co., Ltd.(*) 4,650,000 9.30% 2,325,000 104,392,500 - Korea ₩ 114,100,522 ₩ 213,869,644 ₩ 101,361,219
(*) It was listed on the stock market during the year ended December 31, 2021.
2021
Net assets (A) Ownership (B)
Shareholder portion (A*B) Book value
Stemco Co., Ltd. ₩ 196,245,366 30.00% ₩ 58,873,610 ₩ 58,873,610
Samsung Global Research(*) 88,971,105 23.80% 21,175,123 21,175,123
₩ 285,216,471 ₩ 80,048,733 ₩ 80,048,733
2020
Net assets (A) Ownership (B)
Shareholder portion (A*B) Book value
Stemco Co., Ltd. ₩ 177,766,085 30.00% ₩ 53,329,825 ₩ 53,329,825
Samsung Global Research 80,383,089 23.80% 19,131,175 19,131,175
₩ 258,149,174 ₩ 72,461,000 ₩ 72,461,000
2021 2020 Acquisition cost Book value Book value
Marketable securities ₩ 114,100,522 ₩ 213,869,644 ₩ 101,361,219 Non-marketable securities 34,987,589 50,543,570 99,593,923
₩ 149,088,111 ₩ 264,413,214 ₩ 200,955,142
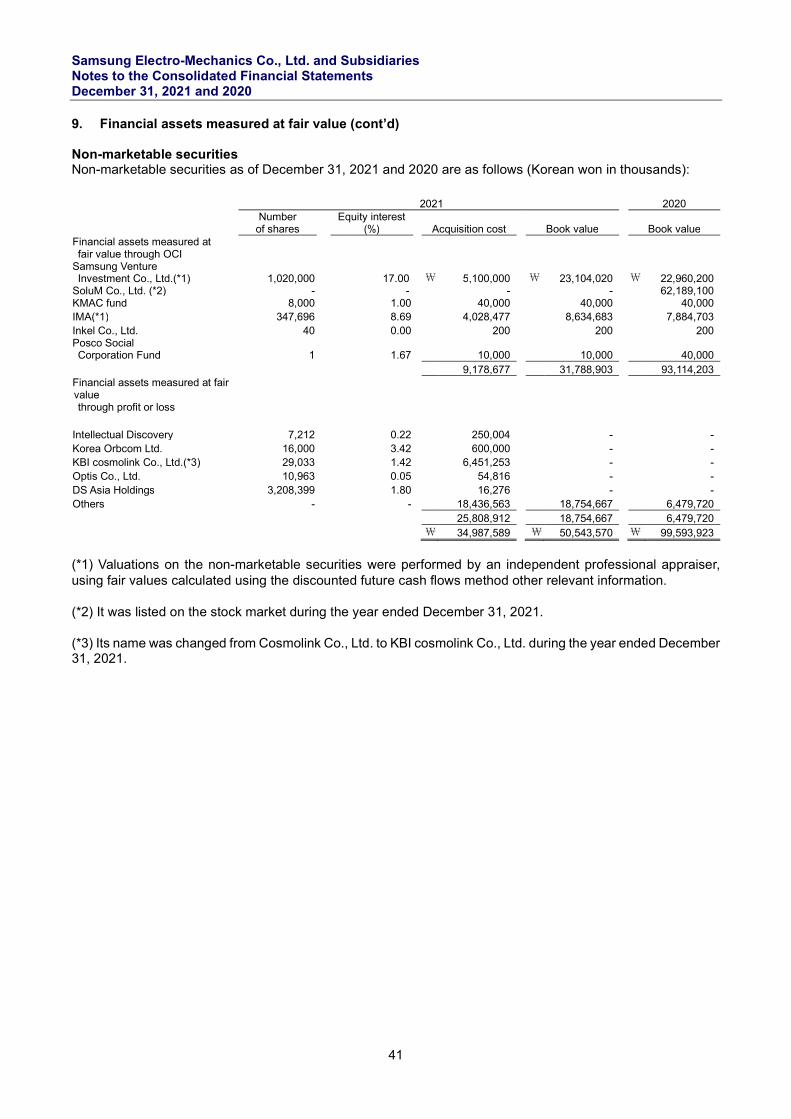
Samsung Electro-Mechanics Co., Ltd. and Subsidiaries Notes to the Consolidated Financial Statements December 31, 2021 and 2020
41
9. Financial assets measured at fair value (cont’d) Non-marketable securities Non-marketable securities as of December 31, 2021 and 2020 are as follows (Korean won in thousands): 2021 2020
Number
of shares
Equity interest (%)
Acquisition cost
Book value
Book value
Financial assets measured at fair value through OCI
17.00
\ 5,100,000
\ 23,104,020
\ 22,960,200 Samsung Venture Investment Co., Ltd.(*1) 1,020,000 SoluM Co., Ltd. (*2) - - - - 62,189,100 KMAC fund 8,000 1.00 40,000 40,000 40,000 IMA(*1) 347,696 8.69 4,028,477 8,634,683 7,884,703 Inkel Co., Ltd. 40 0.00 200 200 200 Posco Social Corporation Fund 1 1.67 10,000 10,000 40,000
9,178,677 31,788,903 93,114,203 Financial assets measured at fair value through profit or loss
Intellectual Discovery 7,212 0.22 250,004 - - Korea Orbcom Ltd. 16,000 3.42 600,000 - - KBI cosmolink Co., Ltd.(*3) 29,033 1.42 6,451,253 - - Optis Co., Ltd. 10,963 0.05 54,816 - - DS Asia Holdings 3,208,399 1.80 16,276 - - Others - - 18,436,563 18,754,667 6,479,720 25,808,912 18,754,667 6,479,720 \ 34,987,589 \ 50,543,570 \ 99,593,923
(*1) Valuations on the non-marketable securities were performed by an independent professional appraiser, using fair values calculated using the discounted future cash flows method other relevant information. (*2) It was listed on the stock market during the year ended December 31, 2021. (*3) Its name was changed from Cosmolink Co., Ltd. to KBI cosmolink Co., Ltd. during the year ended December 31, 2021.
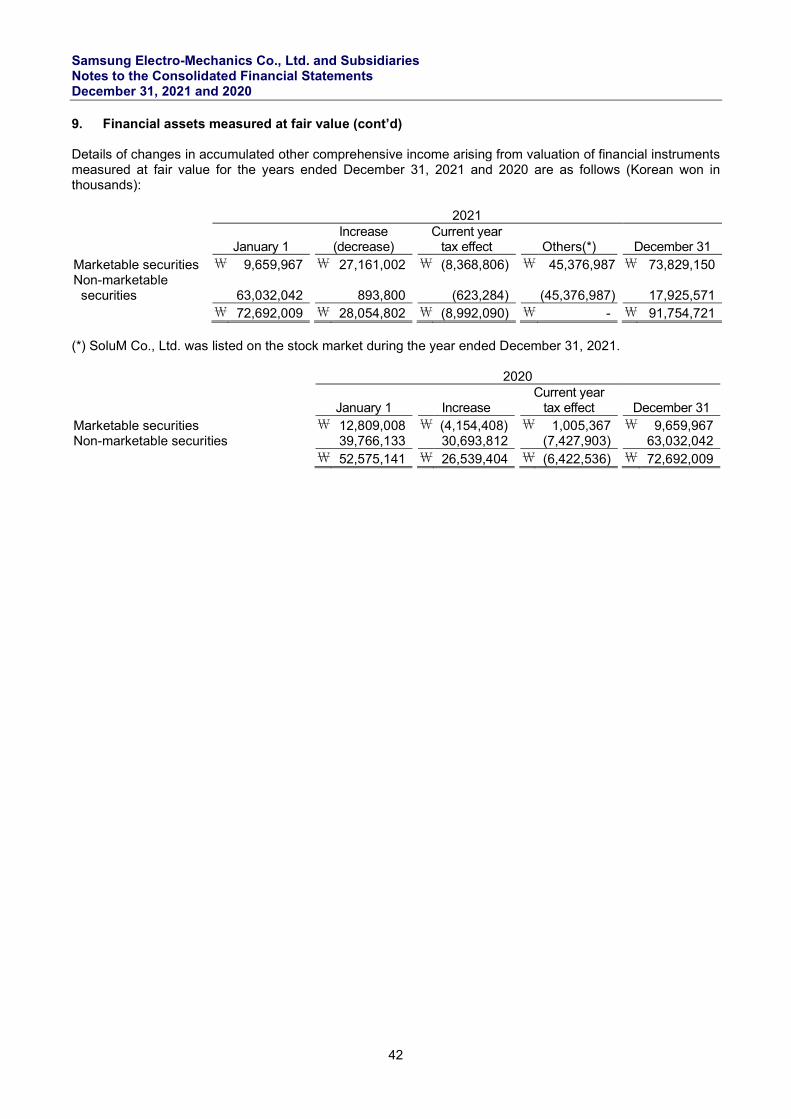
Samsung Electro-Mechanics Co., Ltd. and Subsidiaries Notes to the Consolidated Financial Statements December 31, 2021 and 2020
42
9. Financial assets measured at fair value (cont’d) Details of changes in accumulated other comprehensive income arising from valuation of financial instruments measured at fair value for the years ended December 31, 2021 and 2020 are as follows (Korean won in thousands): 2021
January 1 Increase
(decrease) Current year
tax effect Others(*)
December 31 Marketable securities \ 9,659,967 \ 27,161,002 \ (8,368,806) \ 45,376,987 \ 73,829,150 Non-marketable
securities
63,032,042 893,800 (623,284) (45,376,987)
17,925,571 \ 72,692,009 \ 28,054,802 \ (8,992,090) \ - \ 91,754,721 (*) SoluM Co., Ltd. was listed on the stock market during the year ended December 31, 2021. 2020
January 1
Increase Current year
tax effect December 31 Marketable securities \ 12,809,008 \ (4,154,408) \ 1,005,367 \ 9,659,967 Non-marketable securities 39,766,133 30,693,812 (7,427,903) 63,032,042 \ 52,575,141 \ 26,539,404 \ (6,422,536) \ 72,692,009
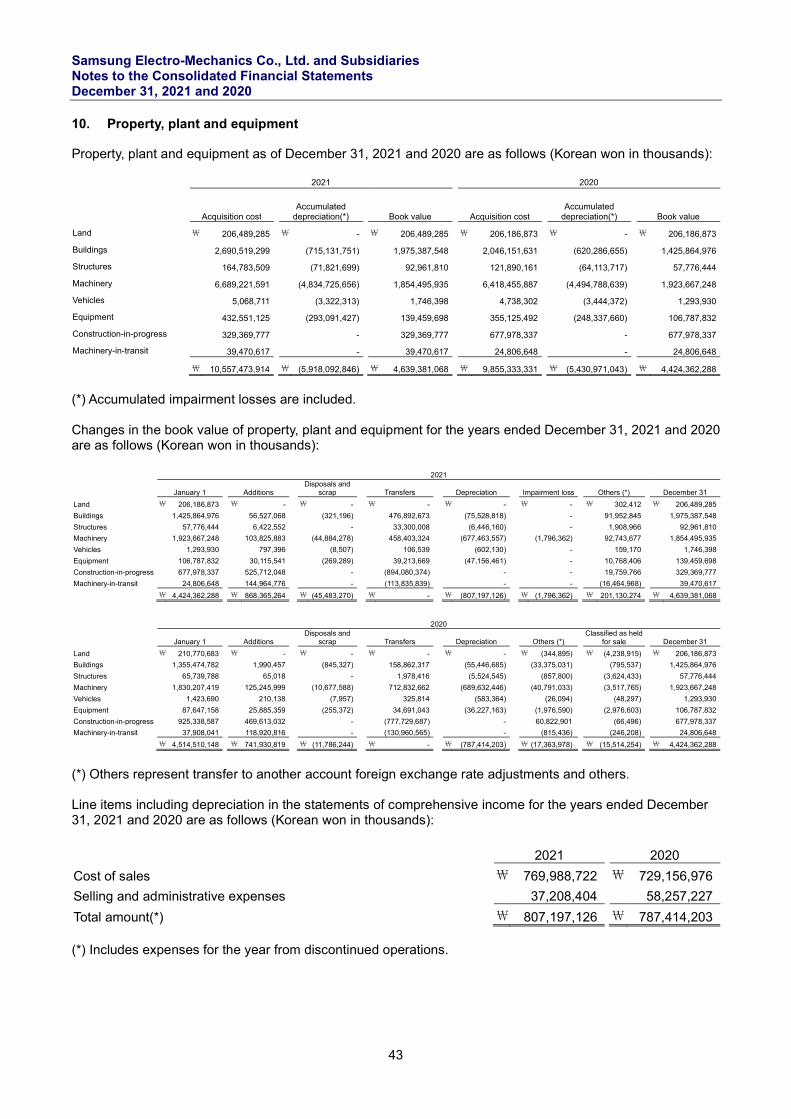
Samsung Electro-Mechanics Co., Ltd. and Subsidiaries Notes to the Consolidated Financial Statements December 31, 2021 and 2020
43
10. Property, plant and equipment Property, plant and equipment as of December 31, 2021 and 2020 are as follows (Korean won in thousands):
2021 2020
Acquisition cost Accumulated
depreciation(*) Book value Acquisition cost Accumulated
depreciation(*) Book value
Land ₩ 206,489,285 ₩ - ₩ 206,489,285 ₩ 206,186,873 ₩ - ₩ 206,186,873
Buildings 2,690,519,299 (715,131,751) 1,975,387,548 2,046,151,631 (620,286,655) 1,425,864,976
Structures 164,783,509 (71,821,699) 92,961,810 121,890,161 (64,113,717) 57,776,444
Machinery 6,689,221,591 (4,834,725,656) 1,854,495,935 6,418,455,887 (4,494,788,639) 1,923,667,248
Vehicles 5,068,711 (3,322,313) 1,746,398 4,738,302 (3,444,372) 1,293,930
Equipment 432,551,125 (293,091,427) 139,459,698 355,125,492 (248,337,660) 106,787,832
Construction-in-progress 329,369,777 - 329,369,777 677,978,337 - 677,978,337
Machinery-in-transit 39,470,617 - 39,470,617 24,806,648 - 24,806,648
₩ 10,557,473,914 ₩ (5,918,092,846) ₩ 4,639,381,068 ₩ 9,855,333,331 ₩ (5,430,971,043) ₩ 4,424,362,288
(*) Accumulated impairment losses are included. Changes in the book value of property, plant and equipment for the years ended December 31, 2021 and 2020 are as follows (Korean won in thousands): 2021
January 1 Additions Disposals and
scrap
Transfers Depreciation Impairment loss Others (*)
December 31
Land \ 206,186,873 \ - \ - \ - \ - \ - \ 302,412 \ 206,489,285
Buildings 1,425,864,976 56,527,068 (321,196) 476,892,673 (75,528,818) - 91,952,845 1,975,387,548
Structures 57,776,444 6,422,552 - 33,300,008 (6,446,160) - 1,908,966 92,961,810
Machinery 1,923,667,248 103,825,883 (44,884,278) 458,403,324 (677,463,557) (1,796,362) 92,743,677 1,854,495,935
Vehicles 1,293,930 797,396 (8,507) 106,539 (602,130) - 159,170 1,746,398
Equipment 106,787,832 30,115,541 (269,289) 39,213,669 (47,156,461) - 10,768,406 139,459,698
Construction-in-progress 677,978,337 525,712,048 - (894,080,374) - - 19,759,766 329,369,777
Machinery-in-transit 24,806,648 144,964,776 - (113,835,839) - - (16,464,968) 39,470,617
\ 4,424,362,288 \ 868,365,264 \ (45,483,270) \ - \ (807,197,126) \ (1,796,362) \ 201,130,274 \ 4,639,381,068
2020
January 1 Additions Disposals and
scrap
Transfers Depreciation Others (*) Classified as held
for sale
December 31
Land \ 210,770,683 \ - \ - \ - \ - \ (344,895) \ (4,238,915) \ 206,186,873
Buildings 1,355,474,782 1,990,457 (845,327) 158,862,317 (55,446,685) (33,375,031) (795,537) 1,425,864,976
Structures 65,739,788 65,018 - 1,978,416 (5,524,545) (857,800) (3,624,433) 57,776,444
Machinery 1,830,207,419 125,245,999 (10,677,588) 712,832,662 (689,632,446) (40,791,033) (3,517,765) 1,923,667,248
Vehicles 1,423,690 210,138 (7,957) 325,814 (583,364) (26,094) (48,297) 1,293,930
Equipment 87,647,158 25,885,359 (255,372) 34,691,043 (36,227,163) (1,976,590) (2,976,603) 106,787,832
Construction-in-progress 925,338,587 469,613,032 - (777,729,687) - 60,822,901 (66,496) 677,978,337
Machinery-in-transit 37,908,041 118,920,816 - (130,960,565) - (815,436) (246,208) 24,806,648
\ 4,514,510,148 \ 741,930,819 \ (11,786,244) \ - \ (787,414,203) \ (17,363,978) \ (15,514,254) \ 4,424,362,288
(*) Others represent transfer to another account foreign exchange rate adjustments and others. Line items including depreciation in the statements of comprehensive income for the years ended December 31, 2021 and 2020 are as follows (Korean won in thousands):
(*) Includes expenses for the year from discontinued operations.
2021 2020
Cost of sales ₩ 769,988,722 ₩ 729,156,976
Selling and administrative expenses 37,208,404 58,257,227
Total amount(*) ₩ 807,197,126 ₩ 787,414,203
Samsung Electro-Mechanics Co., Ltd. and Subsidiaries Notes to the Consolidated Financial Statements December 31, 2021 and 2020
44
10. Property, plant and equipment (cont’d) If a tangible asset is acquired at a price less than its fair value due to government subsidies, the acquisition cost of the tangible asset is the fair value at the acquisition date. Government subsidies are recognized unearned income and are depreciated over the useful life of the asset. The amount offset by depreciation is \10,660,784 thousand (2020: \6,104,502 thousand). Borrowing costs incurred amounting to \4,526,071 thousand (2020: \14,770,941 thousand) for the year ended December 31, 2021, which were directly attributable to the acquisition and construction of qualifying property, plant and equipment, are capitalized as part of the cost of those assets. The Group revalued certain property, plant and equipment in accordance with the Korean Asset Revaluation Act on January 1, 1981 and July 1, 1998. The revalued amounts are recorded as deemed cost at the revaluation date in accordance with Korean IFRS 1101. The difference between the revaluation amount and book value prior to revaluation is recorded as revaluation surplus in retained earnings and may not be utilized for cash dividends. Property, plant and equipment are insured against fire and other casualty losses for up to \11,416,607,275 thousand and \9,188,026,580 thousand as of December 31, 2021 and 2020, respectively.
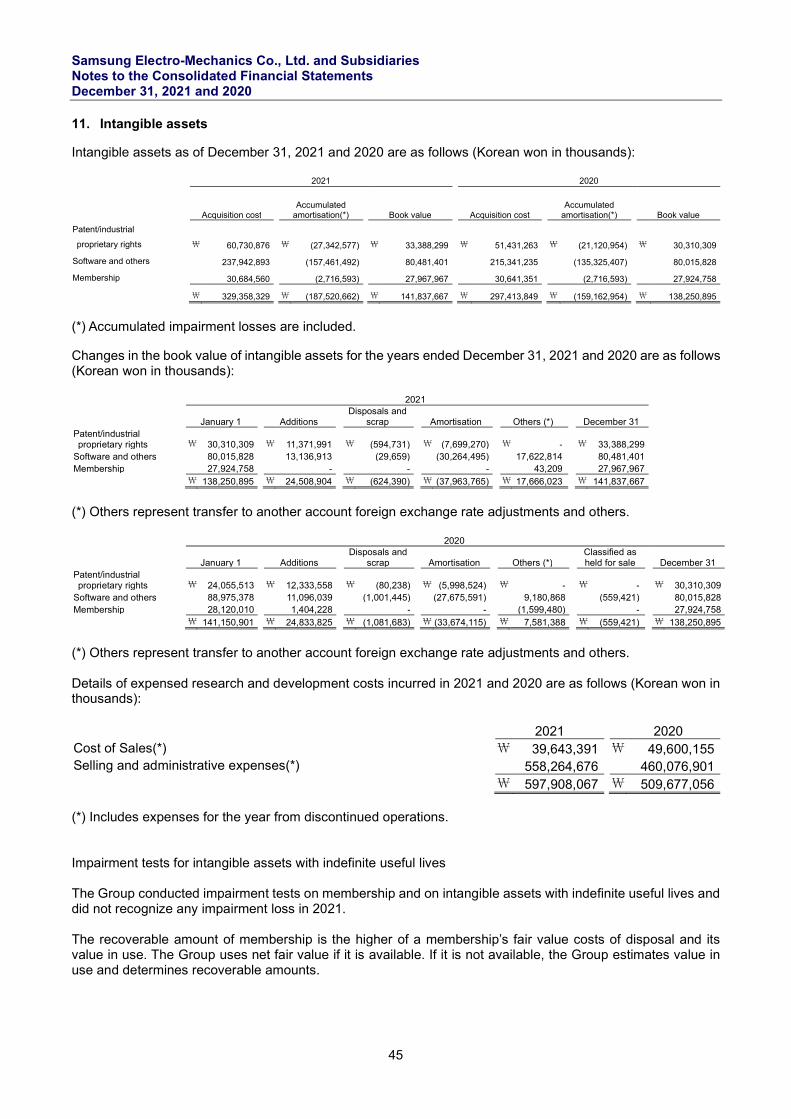
Samsung Electro-Mechanics Co., Ltd. and Subsidiaries Notes to the Consolidated Financial Statements December 31, 2021 and 2020
45
11. Intangible assets Intangible assets as of December 31, 2021 and 2020 are as follows (Korean won in thousands):
2021 2020
Acquisition cost Accumulated
amortisation(*) Book value Acquisition cost Accumulated
amortisation(*) Book value
Patent/industrial
proprietary rights ₩ 60,730,876 ₩ (27,342,577) ₩ 33,388,299 ₩ 51,431,263 ₩ (21,120,954) ₩ 30,310,309
Software and others 237,942,893 (157,461,492) 80,481,401 215,341,235 (135,325,407) 80,015,828
Membership 30,684,560 (2,716,593) 27,967,967 30,641,351 (2,716,593) 27,924,758
₩ 329,358,329 ₩ (187,520,662) ₩ 141,837,667 ₩ 297,413,849 ₩ (159,162,954) ₩ 138,250,895
(*) Accumulated impairment losses are included. Changes in the book value of intangible assets for the years ended December 31, 2021 and 2020 are as follows (Korean won in thousands):
2021
January 1 Additions Disposals and
scrap Amortisation Others (*) December 31 Patent/industrial proprietary rights \ 30,310,309 \ 11,371,991 \ (594,731) \ (7,699,270) \ - \ 33,388,299 Software and others 80,015,828 13,136,913 (29,659) (30,264,495) 17,622,814 80,481,401 Membership 27,924,758 - - - 43,209 27,967,967 \ 138,250,895 \ 24,508,904 \ (624,390) \ (37,963,765) \ 17,666,023 \ 141,837,667
(*) Others represent transfer to another account foreign exchange rate adjustments and others. 2020
January 1 Additions Disposals and
scrap Amortisation Others (*) Classified as held for sale December 31
Patent/industrial proprietary rights \ 24,055,513 \ 12,333,558 \ (80,238) \ (5,998,524) \ - \ - \ 30,310,309 Software and others 88,975,378 11,096,039 (1,001,445) (27,675,591) 9,180,868 (559,421) 80,015,828 Membership 28,120,010 1,404,228 - - (1,599,480) - 27,924,758 \ 141,150,901 \ 24,833,825 \ (1,081,683) \ (33,674,115) \ 7,581,388 \ (559,421) \ 138,250,895
(*) Others represent transfer to another account foreign exchange rate adjustments and others. Details of expensed research and development costs incurred in 2021 and 2020 are as follows (Korean won in thousands): 2021 2020 Cost of Sales(*) \ 39,643,391 \ 49,600,155 Selling and administrative expenses(*) 558,264,676 460,076,901 \ 597,908,067 \ 509,677,056 (*) Includes expenses for the year from discontinued operations. Impairment tests for intangible assets with indefinite useful lives The Group conducted impairment tests on membership and on intangible assets with indefinite useful lives and did not recognize any impairment loss in 2021. The recoverable amount of membership is the higher of a membership’s fair value costs of disposal and its value in use. The Group uses net fair value if it is available. If it is not available, the Group estimates value in use and determines recoverable amounts.
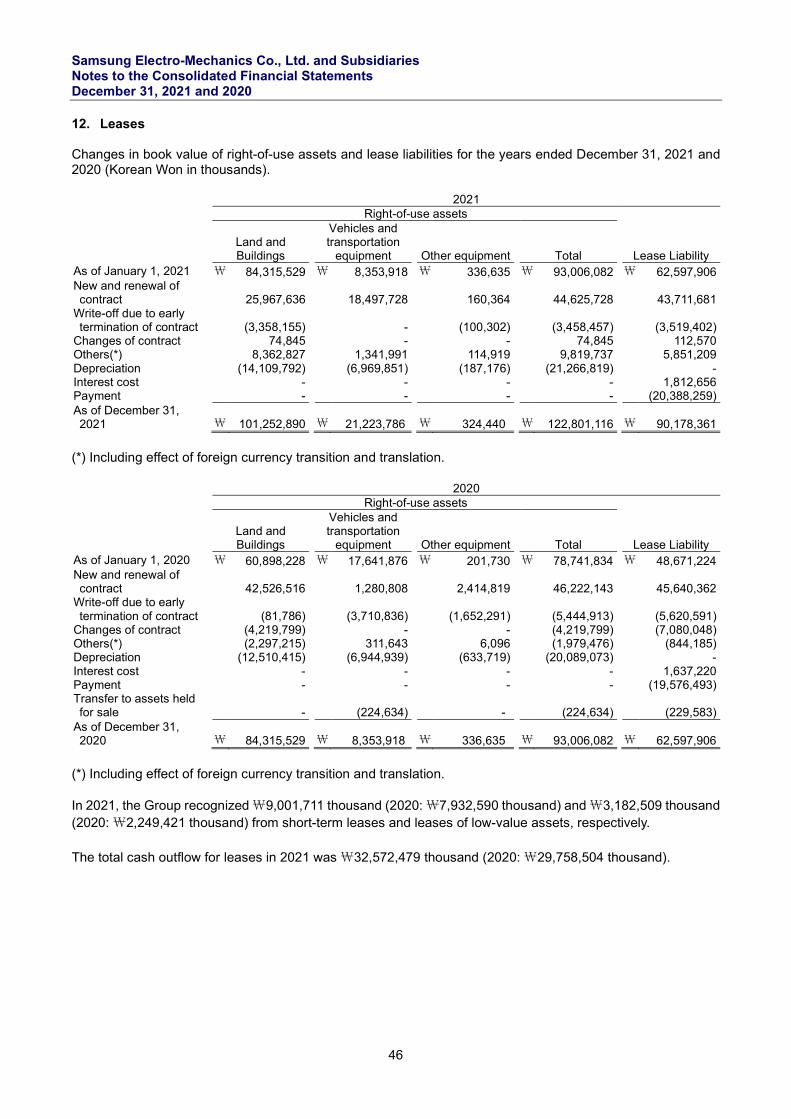
Samsung Electro-Mechanics Co., Ltd. and Subsidiaries Notes to the Consolidated Financial Statements December 31, 2021 and 2020
46
12. Leases Changes in book value of right-of-use assets and lease liabilities for the years ended December 31, 2021 and 2020 (Korean Won in thousands). 2021 Right-of-use assets
Lease Liability Land and Buildings
Vehicles and transportation
equipment Other equipment Total
As of January 1, 2021 \ 84,315,529 \ 8,353,918 \ 336,635 \ 93,006,082 \ 62,597,906 New and renewal of contract 25,967,636 18,497,728 160,364 44,625,728 43,711,681
Write-off due to early termination of contract (3,358,155) - (100,302) (3,458,457) (3,519,402)
Changes of contract 74,845 - - 74,845 112,570 Others(*) 8,362,827 1,341,991 114,919 9,819,737 5,851,209 Depreciation (14,109,792) (6,969,851) (187,176) (21,266,819) - Interest cost - - - - 1,812,656 Payment - - - - (20,388,259) As of December 31, 2021 \ 101,252,890 \ 21,223,786 \ 324,440 \ 122,801,116 \ 90,178,361
(*) Including effect of foreign currency transition and translation. 2020 Right-of-use assets
Lease Liability Land and Buildings
Vehicles and transportation
equipment Other equipment Total
As of January 1, 2020 \ 60,898,228 \ 17,641,876 \ 201,730 \ 78,741,834 \ 48,671,224 New and renewal of contract 42,526,516 1,280,808 2,414,819 46,222,143 45,640,362
Write-off due to early termination of contract (81,786) (3,710,836) (1,652,291) (5,444,913) (5,620,591)
Changes of contract (4,219,799) - - (4,219,799) (7,080,048) Others(*) (2,297,215) 311,643 6,096 (1,979,476) (844,185) Depreciation (12,510,415) (6,944,939) (633,719) (20,089,073) - Interest cost - - - - 1,637,220 Payment - - - - (19,576,493) Transfer to assets held for sale - (224,634) - (224,634) (229,583)
As of December 31, 2020 \ 84,315,529 \ 8,353,918 \ 336,635 \ 93,006,082 \ 62,597,906
(*) Including effect of foreign currency transition and translation. In 2021, the Group recognized \9,001,711 thousand (2020: \7,932,590 thousand) and \3,182,509 thousand (2020: \2,249,421 thousand) from short-term leases and leases of low-value assets, respectively. The total cash outflow for leases in 2021 was \32,572,479 thousand (2020: \29,758,504 thousand).
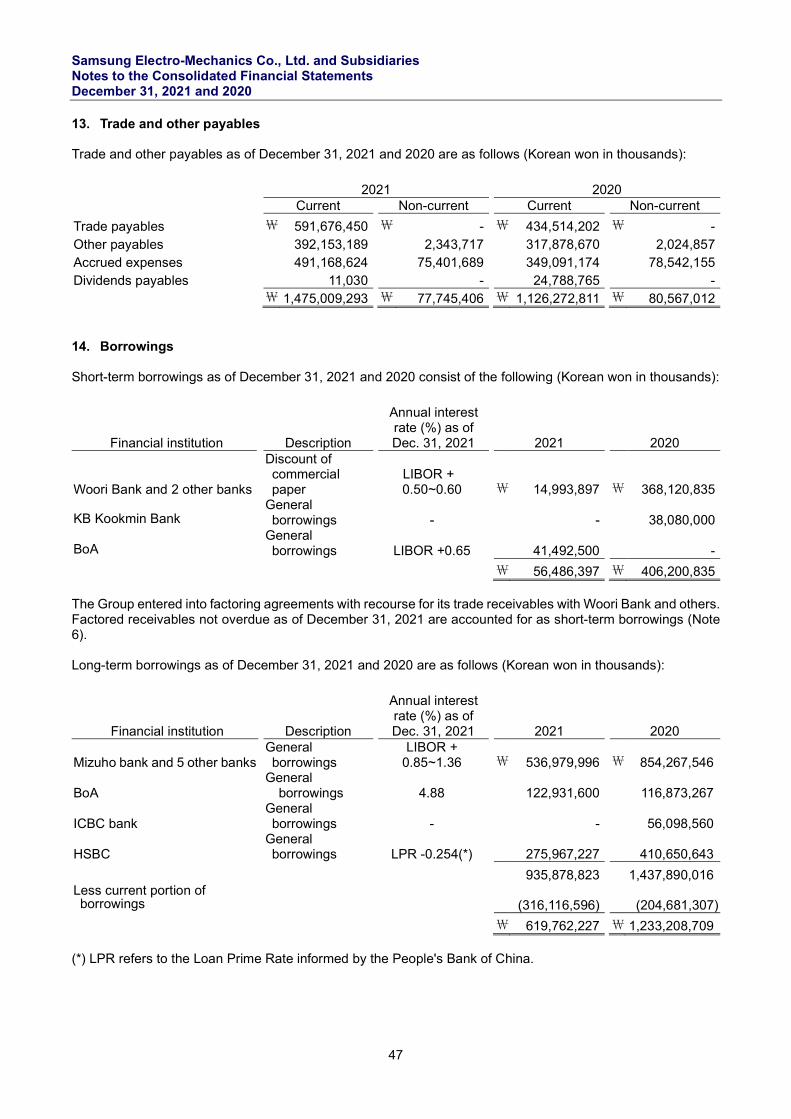
Samsung Electro-Mechanics Co., Ltd. and Subsidiaries Notes to the Consolidated Financial Statements December 31, 2021 and 2020
47
13. Trade and other payables Trade and other payables as of December 31, 2021 and 2020 are as follows (Korean won in thousands):
14. Borrowings Short-term borrowings as of December 31, 2021 and 2020 consist of the following (Korean won in thousands):
The Group entered into factoring agreements with recourse for its trade receivables with Woori Bank and others. Factored receivables not overdue as of December 31, 2021 are accounted for as short-term borrowings (Note 6). Long-term borrowings as of December 31, 2021 and 2020 are as follows (Korean won in thousands):
(*) LPR refers to the Loan Prime Rate informed by the People's Bank of China.
2021 2020 Current Non-current Current Non-current
Trade payables ₩ 591,676,450 ₩ - ₩ 434,514,202 ₩ - Other payables 392,153,189 2,343,717 317,878,670 2,024,857 Accrued expenses 491,168,624 75,401,689 349,091,174 78,542,155 Dividends payables 11,030 - 24,788,765 -
₩ 1,475,009,293 ₩ 77,745,406 ₩ 1,126,272,811 ₩ 80,567,012
Financial institution
Description
Annual interest rate (%) as of Dec. 31, 2021
2021 2020
Woori Bank and 2 other banks
Discount of commercial paper
LIBOR + 0.50~0.60 ₩ 14,993,897 ₩ 368,120,835
KB Kookmin Bank General borrowings - - 38,080,000
BoA General borrowings LIBOR +0.65 41,492,500 -
₩ 56,486,397 ₩ 406,200,835
Financial institution
Description
Annual interest rate (%) as of Dec. 31, 2021
2021 2020
Mizuho bank and 5 other banks General borrowings
LIBOR + 0.85~1.36 ₩ 536,979,996 ₩ 854,267,546
BoA General borrowings 4.88 122,931,600 116,873,267
ICBC bank General borrowings - - 56,098,560
HSBC General borrowings LPR -0.254(*) 275,967,227 410,650,643
935,878,823 1,437,890,016 Less current portion of borrowings
(316,116,596) (204,681,307)
₩ 619,762,227 ₩ 1,233,208,709
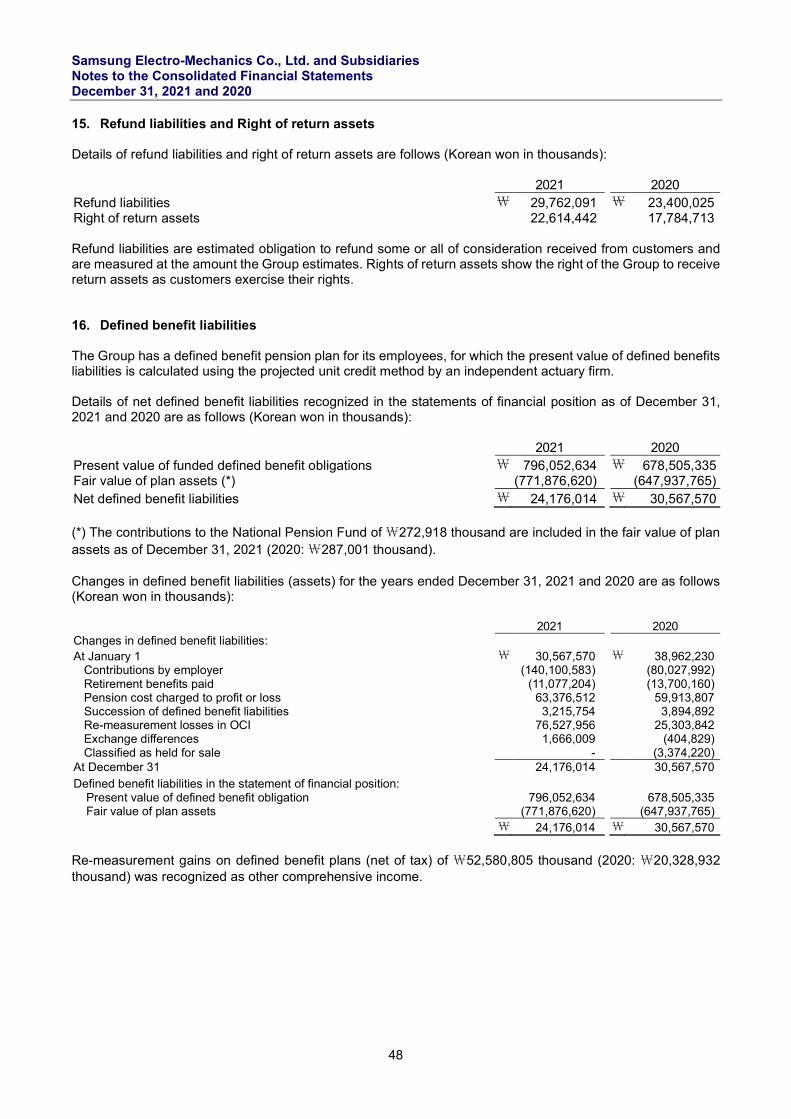
Samsung Electro-Mechanics Co., Ltd. and Subsidiaries Notes to the Consolidated Financial Statements December 31, 2021 and 2020
48
15. Refund liabilities and Right of return assets Details of refund liabilities and right of return assets are follows (Korean won in thousands):
2021 2020 Refund liabilities \ 29,762,091 \ 23,400,025 Right of return assets 22,614,442 17,784,713 Refund liabilities are estimated obligation to refund some or all of consideration received from customers and are measured at the amount the Group estimates. Rights of return assets show the right of the Group to receive return assets as customers exercise their rights. 16. Defined benefit liabilities The Group has a defined benefit pension plan for its employees, for which the present value of defined benefits liabilities is calculated using the projected unit credit method by an independent actuary firm. Details of net defined benefit liabilities recognized in the statements of financial position as of December 31, 2021 and 2020 are as follows (Korean won in thousands):
2021 2020 Present value of funded defined benefit obligations \ 796,052,634 \ 678,505,335 Fair value of plan assets (*) (771,876,620) (647,937,765) Net defined benefit liabilities \ 24,176,014 \ 30,567,570 (*) The contributions to the National Pension Fund of \272,918 thousand are included in the fair value of plan assets as of December 31, 2021 (2020: \287,001 thousand). Changes in defined benefit liabilities (assets) for the years ended December 31, 2021 and 2020 are as follows (Korean won in thousands):
2021 2020 Changes in defined benefit liabilities:
At January 1 \ 30,567,570 \ 38,962,230 Contributions by employer (140,100,583) (80,027,992) Retirement benefits paid (11,077,204) (13,700,160) Pension cost charged to profit or loss 63,376,512 59,913,807 Succession of defined benefit liabilities 3,215,754 3,894,892 Re-measurement losses in OCI 76,527,956 25,303,842 Exchange differences 1,666,009 (404,829) Classified as held for sale - (3,374,220)
At December 31 24,176,014 30,567,570 Defined benefit liabilities in the statement of financial position:
Present value of defined benefit obligation 796,052,634 678,505,335 Fair value of plan assets (771,876,620) (647,937,765)
\ 24,176,014 \ 30,567,570
Re-measurement gains on defined benefit plans (net of tax) of \52,580,805 thousand (2020: \20,328,932 thousand) was recognized as other comprehensive income.
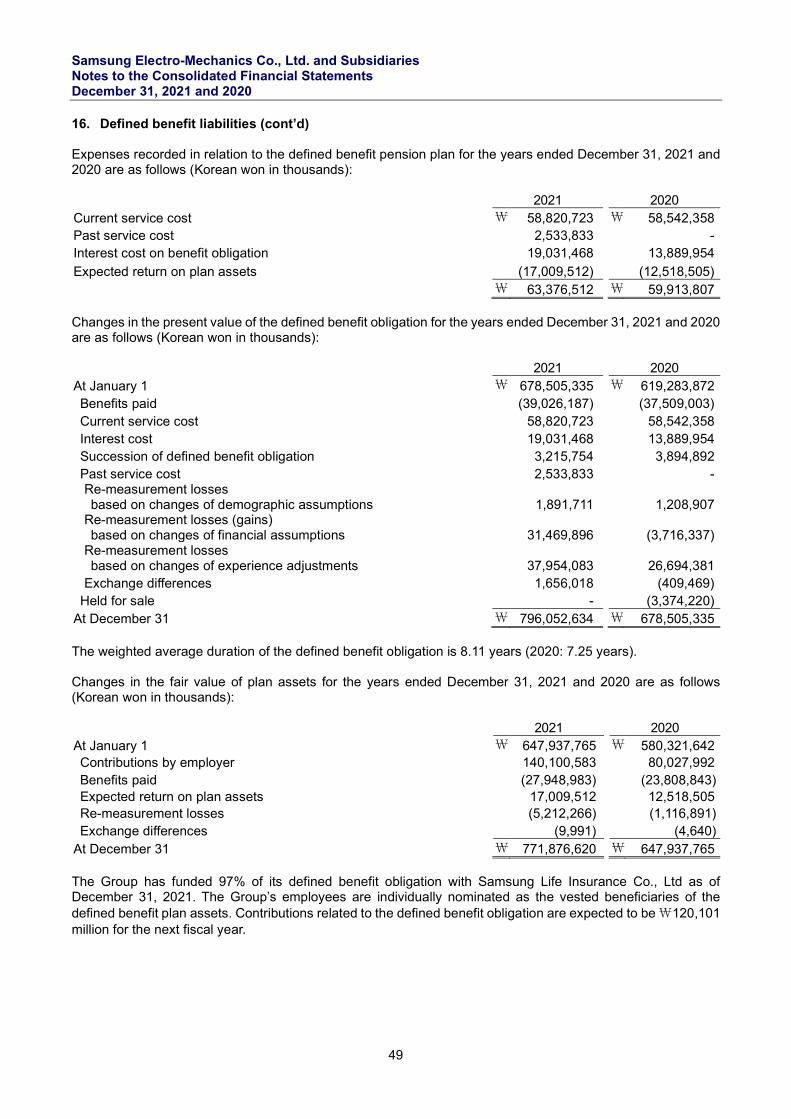
Samsung Electro-Mechanics Co., Ltd. and Subsidiaries Notes to the Consolidated Financial Statements December 31, 2021 and 2020
49
16. Defined benefit liabilities (cont’d) Expenses recorded in relation to the defined benefit pension plan for the years ended December 31, 2021 and 2020 are as follows (Korean won in thousands):
2021 2020 Current service cost \ 58,820,723 \ 58,542,358 Past service cost 2,533,833 - Interest cost on benefit obligation 19,031,468 13,889,954
Expected return on plan assets (17,009,512) (12,518,505) \ 63,376,512 \ 59,913,807 Changes in the present value of the defined benefit obligation for the years ended December 31, 2021 and 2020 are as follows (Korean won in thousands):
2021 2020 At January 1 \ 678,505,335 \ 619,283,872 Benefits paid (39,026,187) (37,509,003) Current service cost 58,820,723 58,542,358 Interest cost 19,031,468 13,889,954 Succession of defined benefit obligation 3,215,754 3,894,892 Past service cost 2,533,833 - Re-measurement losses based on changes of demographic assumptions 1,891,711 1,208,907
Re-measurement losses (gains) based on changes of financial assumptions 31,469,896 (3,716,337)
Re-measurement losses based on changes of experience adjustments 37,954,083 26,694,381
Exchange differences 1,656,018 (409,469) Held for sale - (3,374,220)
At December 31 \ 796,052,634 \ 678,505,335 The weighted average duration of the defined benefit obligation is 8.11 years (2020: 7.25 years). Changes in the fair value of plan assets for the years ended December 31, 2021 and 2020 are as follows (Korean won in thousands):
2021 2020 At January 1 \ 647,937,765 \ 580,321,642 Contributions by employer 140,100,583 80,027,992 Benefits paid (27,948,983) (23,808,843) Expected return on plan assets 17,009,512 12,518,505 Re-measurement losses (5,212,266) (1,116,891) Exchange differences (9,991) (4,640)
At December 31 \ 771,876,620 \ 647,937,765 The Group has funded 97% of its defined benefit obligation with Samsung Life Insurance Co., Ltd as of December 31, 2021. The Group’s employees are individually nominated as the vested beneficiaries of the defined benefit plan assets. Contributions related to the defined benefit obligation are expected to be \120,101 million for the next fiscal year.
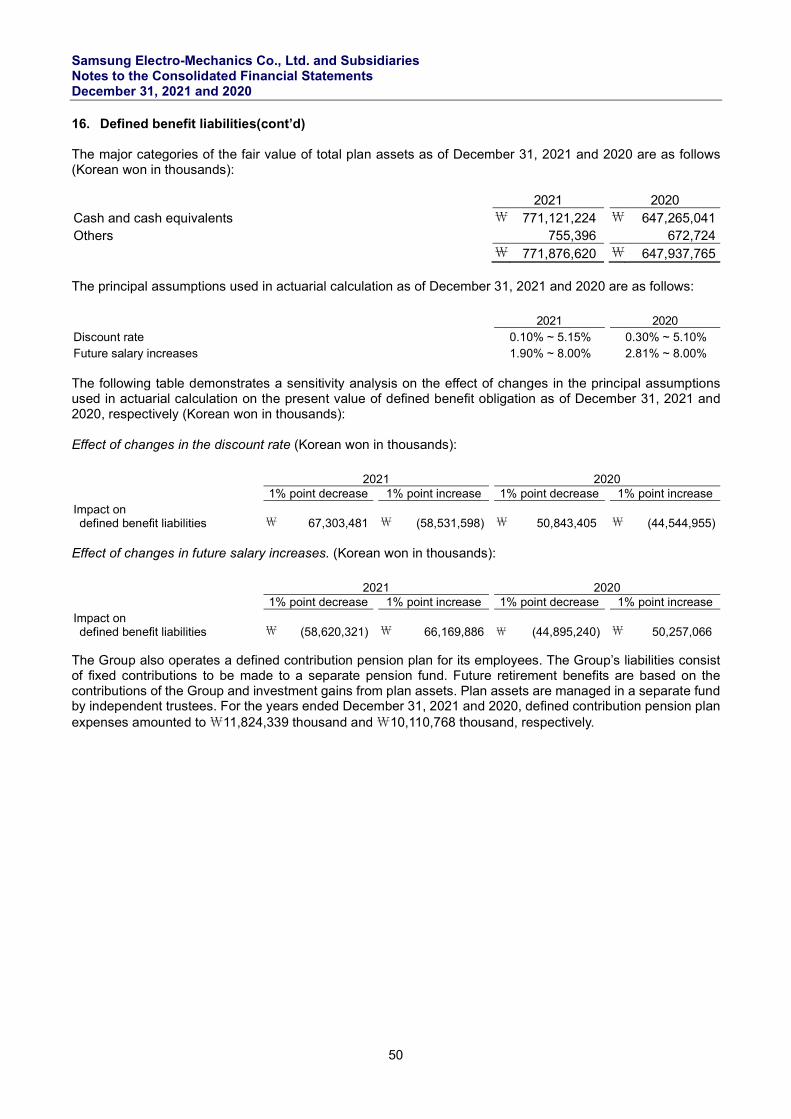
Samsung Electro-Mechanics Co., Ltd. and Subsidiaries Notes to the Consolidated Financial Statements December 31, 2021 and 2020
50
16. Defined benefit liabilities(cont’d) The major categories of the fair value of total plan assets as of December 31, 2021 and 2020 are as follows (Korean won in thousands):
2021 2020 Cash and cash equivalents \ 771,121,224 \ 647,265,041 Others 755,396 672,724 \ 771,876,620 \ 647,937,765 The principal assumptions used in actuarial calculation as of December 31, 2021 and 2020 are as follows:
The following table demonstrates a sensitivity analysis on the effect of changes in the principal assumptions used in actuarial calculation on the present value of defined benefit obligation as of December 31, 2021 and 2020, respectively (Korean won in thousands): Effect of changes in the discount rate (Korean won in thousands):
Effect of changes in future salary increases. (Korean won in thousands):
The Group also operates a defined contribution pension plan for its employees. The Group’s liabilities consist of fixed contributions to be made to a separate pension fund. Future retirement benefits are based on the contributions of the Group and investment gains from plan assets. Plan assets are managed in a separate fund by independent trustees. For the years ended December 31, 2021 and 2020, defined contribution pension plan expenses amounted to \11,824,339 thousand and \10,110,768 thousand, respectively.
2021 2020 Discount rate 0.10% ~ 5.15% 0.30% ~ 5.10% Future salary increases 1.90% ~ 8.00% 2.81% ~ 8.00%
2021 2020 1% point decrease 1% point increase 1% point decrease 1% point increase
Impact on defined benefit liabilities
₩ 67,303,481 ₩ (58,531,598) ₩ 50,843,405 ₩ (44,544,955)
2021 2020 1% point decrease 1% point increase 1% point decrease 1% point increase
Impact on defined benefit liabilities
₩ (58,620,321) ₩ 66,169,886 ₩ (44,895,240) ₩ 50,257,066
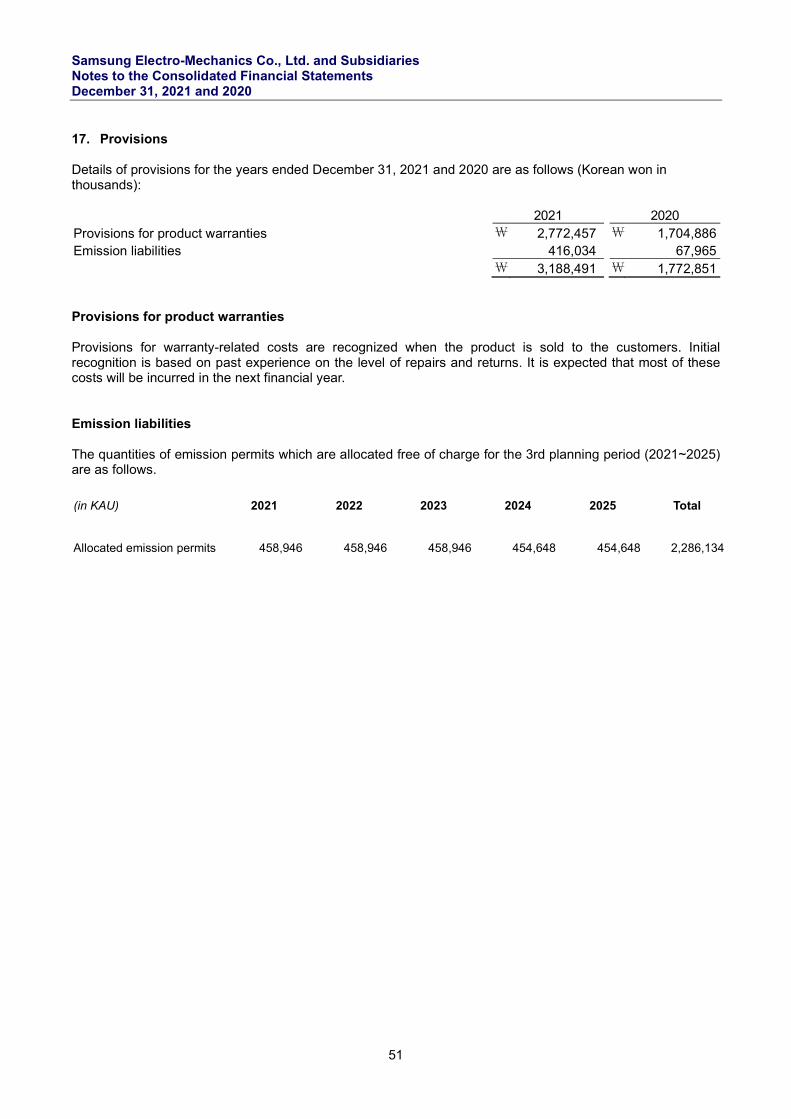
Samsung Electro-Mechanics Co., Ltd. and Subsidiaries Notes to the Consolidated Financial Statements December 31, 2021 and 2020
51
17. Provisions Details of provisions for the years ended December 31, 2021 and 2020 are as follows (Korean won in thousands):
2021 2020 Provisions for product warranties \ 2,772,457 \ 1,704,886 Emission liabilities 416,034 67,965 \ 3,188,491 \ 1,772,851 Provisions for product warranties Provisions for warranty-related costs are recognized when the product is sold to the customers. Initial recognition is based on past experience on the level of repairs and returns. It is expected that most of these costs will be incurred in the next financial year. Emission liabilities The quantities of emission permits which are allocated free of charge for the 3rd planning period (2021~2025) are as follows.
(in KAU) 2021 2022 2023 2024 2025 Total
Allocated emission permits 458,946 458,946 458,946 454,648 454,648 2,286,134
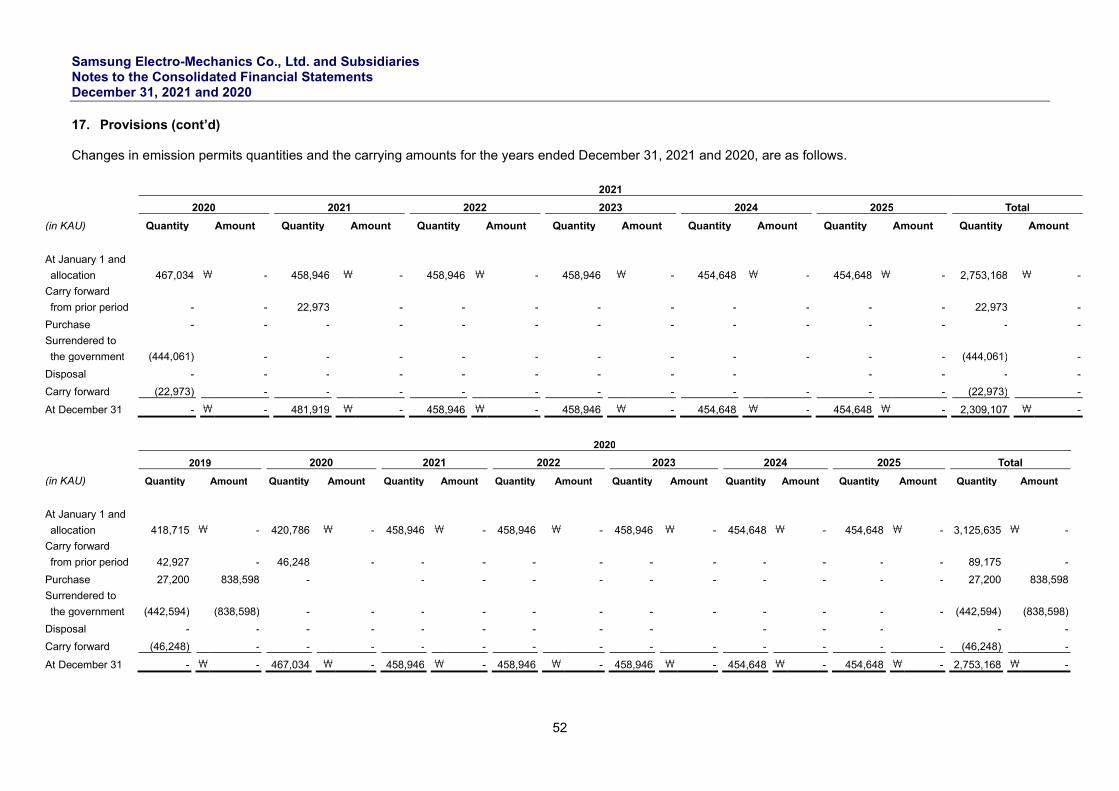
Samsung Electro-Mechanics Co., Ltd. and Subsidiaries Notes to the Consolidated Financial Statements December 31, 2021 and 2020
52
17. Provisions (cont’d) Changes in emission permits quantities and the carrying amounts for the years ended December 31, 2021 and 2020, are as follows.
(in KAU)
2021
2020 2021 2022 2023 2024 2025 Total
Quantity Amount Quantity Amount Quantity Amount Quantity Amount Quantity Amount Quantity Amount Quantity Amount
At January 1 and
allocation 467,034 \ - 458,946 \ - 458,946 \ - 458,946 \ -
454,648 \ - 454,648 \ - 2,753,168 \ -
Carry forward
from prior period - - 22,973 - - - - -
- - - - 22,973 -
Purchase - - - - - - - - - - - - - -
Surrendered to
the government (444,061) - - - - - - -
- - - - (444,061) -
Disposal - - - - - - - - - - - - -
Carry forward (22,973) - - - - - - - - - - - (22,973) -
At December 31 - \ - 481,919 \ - 458,946 \ - 458,946 \ - 454,648 \ - 454,648 \ - 2,309,107 \ -
(in KAU)
2020
2019 2020 2021 2022 2023 2024 2025 Total
Quantity Amount Quantity Amount Quantity Amount Quantity Amount Quantity Amount Quantity Amount Quantity Amount Quantity Amount
At January 1 and
allocation 418,715 \ - 420,786 \ - 458,946 \ - 458,946 \ -
458,946 \ - 454,648 \ - 454,648 \ - 3,125,635 \ - Carry forward
from prior period 42,927 - 46,248 - - - - -
- - - - - - 89,175 - Purchase 27,200 838,598 - - - - - - - - - - - 27,200 838,598 Surrendered to
the government (442,594) (838,598) - - - - - -
- - - - - - (442,594) (838,598) Disposal - - - - - - - - - - - - - - Carry forward (46,248) - - - - - - - - - - - - - (46,248) - At December 31 - \ - 467,034 \ - 458,946 \ - 458,946 \ - 458,946 \ - 454,648 \ - 454,648 \ - 2,753,168 \ -
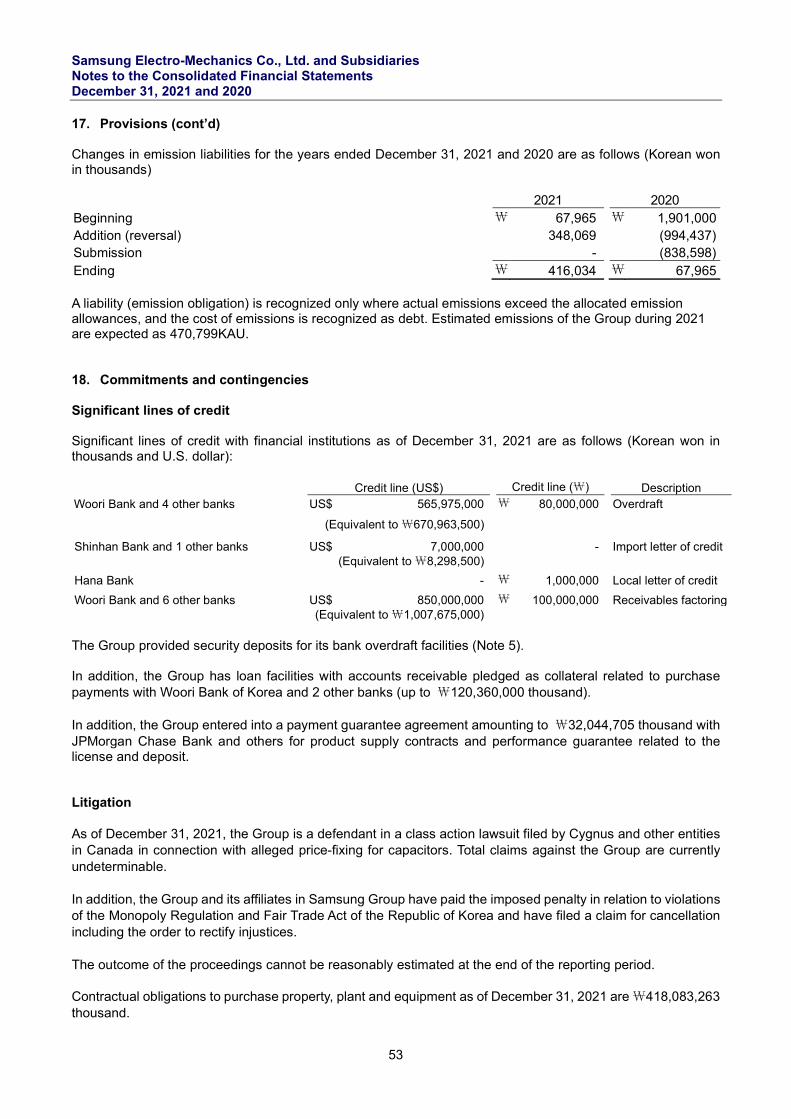
Samsung Electro-Mechanics Co., Ltd. and Subsidiaries Notes to the Consolidated Financial Statements December 31, 2021 and 2020
53
17. Provisions (cont’d) Changes in emission liabilities for the years ended December 31, 2021 and 2020 are as follows (Korean won in thousands)
2021 2020 Beginning \ 67,965 \ 1,901,000 Addition (reversal) 348,069 (994,437) Submission - (838,598) Ending \ 416,034 \ 67,965 A liability (emission obligation) is recognized only where actual emissions exceed the allocated emission allowances, and the cost of emissions is recognized as debt. Estimated emissions of the Group during 2021 are expected as 470,799KAU. 18. Commitments and contingencies Significant lines of credit Significant lines of credit with financial institutions as of December 31, 2021 are as follows (Korean won in thousands and U.S. dollar):
Credit line (US$) Credit line (\) Description Woori Bank and 4 other banks US$ 565,975,000 \ 80,000,000 Overdraft
(Equivalent to \670,963,500)
Shinhan Bank and 1 other banks US$ 7,000,000 - Import letter of credit (Equivalent to \8,298,500)
Hana Bank - \ 1,000,000 Local letter of credit
Woori Bank and 6 other banks US$ 850,000,000 \ 100,000,000 Receivables factoring (Equivalent to \1,007,675,000)
The Group provided security deposits for its bank overdraft facilities (Note 5). In addition, the Group has loan facilities with accounts receivable pledged as collateral related to purchase payments with Woori Bank of Korea and 2 other banks (up to ₩120,360,000 thousand). In addition, the Group entered into a payment guarantee agreement amounting to ₩32,044,705 thousand with JPMorgan Chase Bank and others for product supply contracts and performance guarantee related to the license and deposit. Litigation As of December 31, 2021, the Group is a defendant in a class action lawsuit filed by Cygnus and other entities in Canada in connection with alleged price-fixing for capacitors. Total claims against the Group are currently undeterminable. In addition, the Group and its affiliates in Samsung Group have paid the imposed penalty in relation to violations of the Monopoly Regulation and Fair Trade Act of the Republic of Korea and have filed a claim for cancellation including the order to rectify injustices. The outcome of the proceedings cannot be reasonably estimated at the end of the reporting period. Contractual obligations to purchase property, plant and equipment as of December 31, 2021 are \418,083,263 thousand.
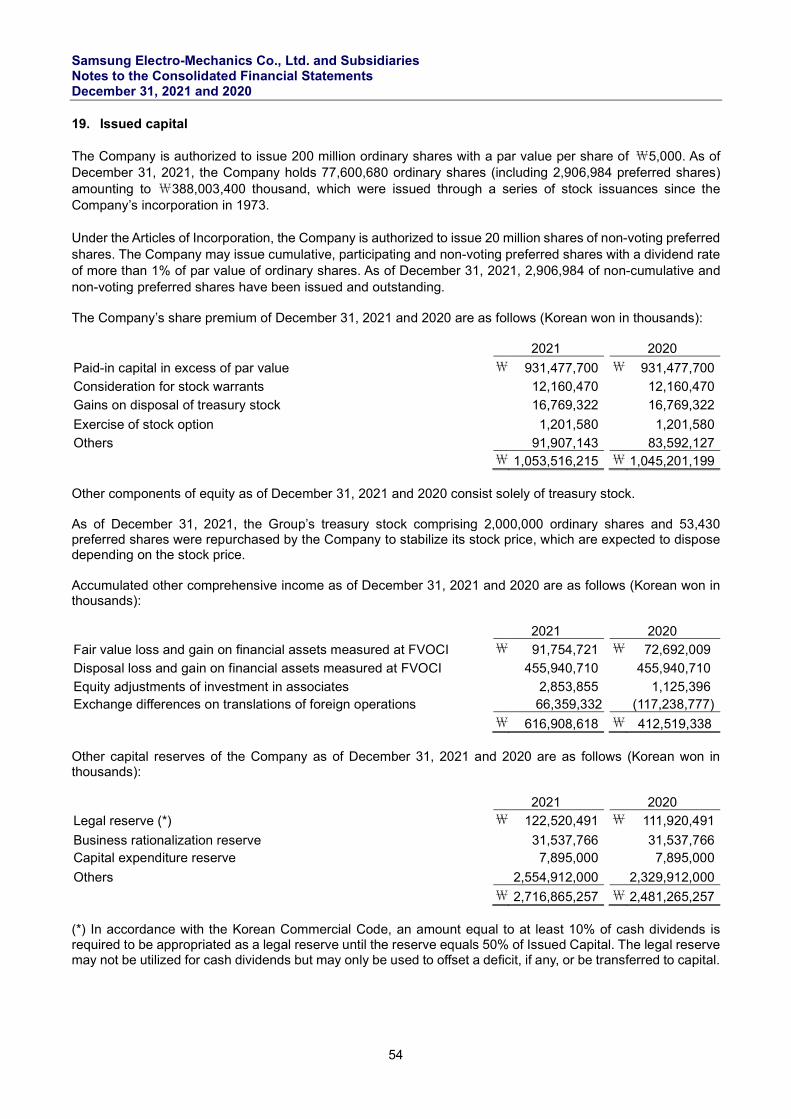
Samsung Electro-Mechanics Co., Ltd. and Subsidiaries Notes to the Consolidated Financial Statements December 31, 2021 and 2020
54
19. Issued capital The Company is authorized to issue 200 million ordinary shares with a par value per share of ₩5,000. As of December 31, 2021, the Company holds 77,600,680 ordinary shares (including 2,906,984 preferred shares) amounting to ₩388,003,400 thousand, which were issued through a series of stock issuances since the Company’s incorporation in 1973. Under the Articles of Incorporation, the Company is authorized to issue 20 million shares of non-voting preferred shares. The Company may issue cumulative, participating and non-voting preferred shares with a dividend rate of more than 1% of par value of ordinary shares. As of December 31, 2021, 2,906,984 of non-cumulative and non-voting preferred shares have been issued and outstanding. The Company’s share premium of December 31, 2021 and 2020 are as follows (Korean won in thousands): 2021 2020
Paid-in capital in excess of par value ₩ 931,477,700 ₩ 931,477,700
Consideration for stock warrants 12,160,470 12,160,470
Gains on disposal of treasury stock 16,769,322 16,769,322
Exercise of stock option 1,201,580 1,201,580
Others 91,907,143 83,592,127
₩ 1,053,516,215 ₩ 1,045,201,199
Other components of equity as of December 31, 2021 and 2020 consist solely of treasury stock. As of December 31, 2021, the Group’s treasury stock comprising 2,000,000 ordinary shares and 53,430 preferred shares were repurchased by the Company to stabilize its stock price, which are expected to dispose depending on the stock price. Accumulated other comprehensive income as of December 31, 2021 and 2020 are as follows (Korean won in thousands): 2021 2020
Fair value loss and gain on financial assets measured at FVOCI ₩ 91,754,721 ₩ 72,692,009
Disposal loss and gain on financial assets measured at FVOCI 455,940,710 455,940,710
Equity adjustments of investment in associates 2,853,855 1,125,396 Exchange differences on translations of foreign operations
66,359,332 (117,238,777)
₩ 616,908,618 ₩ 412,519,338
Other capital reserves of the Company as of December 31, 2021 and 2020 are as follows (Korean won in thousands): 2021 2020
Legal reserve (*) ₩ 122,520,491 ₩ 111,920,491
Business rationalization reserve 31,537,766 31,537,766
Capital expenditure reserve 7,895,000 7,895,000
Others 2,554,912,000 2,329,912,000
₩ 2,716,865,257 ₩ 2,481,265,257
(*) In accordance with the Korean Commercial Code, an amount equal to at least 10% of cash dividends is required to be appropriated as a legal reserve until the reserve equals 50% of Issued Capital. The legal reserve may not be utilized for cash dividends but may only be used to offset a deficit, if any, or be transferred to capital.
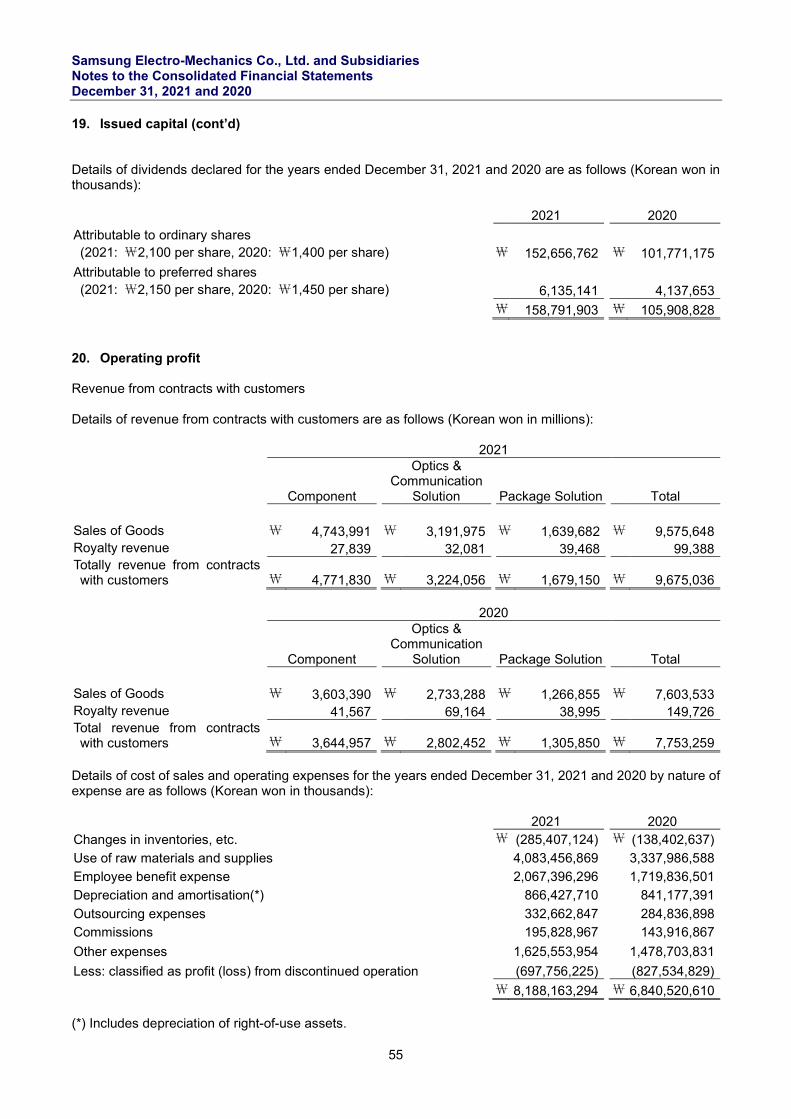
Samsung Electro-Mechanics Co., Ltd. and Subsidiaries Notes to the Consolidated Financial Statements December 31, 2021 and 2020
55
19. Issued capital (cont’d) Details of dividends declared for the years ended December 31, 2021 and 2020 are as follows (Korean won in thousands): 2021 2020
Attributable to ordinary shares (2021: ₩2,100 per share, 2020: ₩1,400 per share)
₩ 152,656,762 ₩ 101,771,175
Attributable to preferred shares (2021: ₩2,150 per share, 2020: ₩1,450 per share)
6,135,141 4,137,653
₩ 158,791,903 ₩ 105,908,828
20. Operating profit Revenue from contracts with customers Details of revenue from contracts with customers are as follows (Korean won in millions):
2021
Component
Optics & Communication
Solution Package Solution Total Sales of Goods \ 4,743,991 \ 3,191,975 \ 1,639,682 \ 9,575,648 Royalty revenue 27,839 32,081 39,468 99,388 Totally revenue from contracts with customers
\ 4,771,830 \ 3,224,056 \ 1,679,150 \ 9,675,036
2020
Component
Optics & Communication
Solution Package Solution Total Sales of Goods \ 3,603,390 \ 2,733,288 \ 1,266,855 \ 7,603,533 Royalty revenue 41,567 69,164 38,995 149,726 Total revenue from contracts with customers
\ 3,644,957 \ 2,802,452 \ 1,305,850 \ 7,753,259
Details of cost of sales and operating expenses for the years ended December 31, 2021 and 2020 by nature of expense are as follows (Korean won in thousands): 2021 2020 Changes in inventories, etc. ₩ (285,407,124) ₩ (138,402,637)
Use of raw materials and supplies 4,083,456,869 3,337,986,588
Employee benefit expense 2,067,396,296 1,719,836,501
Depreciation and amortisation(*) 866,427,710 841,177,391
Outsourcing expenses 332,662,847 284,836,898 Commissions 195,828,967 143,916,867
Other expenses 1,625,553,954 1,478,703,831
Less: classified as profit (loss) from discontinued operation (697,756,225) (827,534,829)
₩ 8,188,163,294 ₩ 6,840,520,610
(*) Includes depreciation of right-of-use assets.
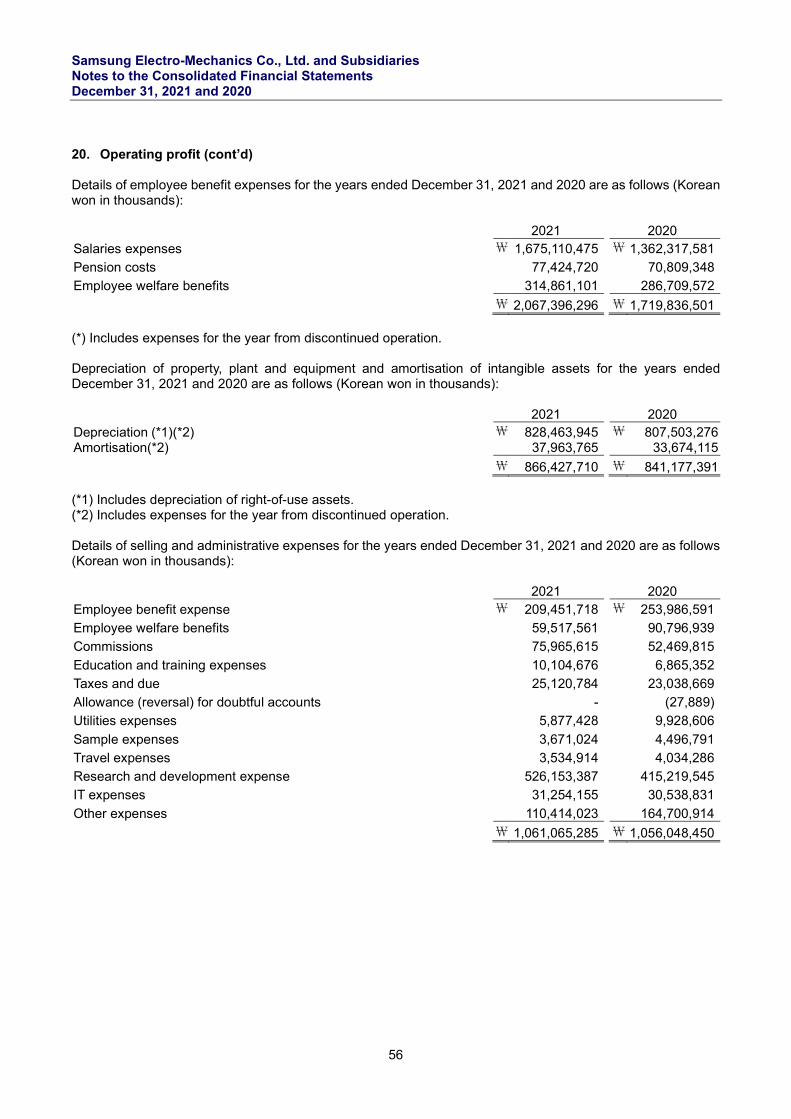
Samsung Electro-Mechanics Co., Ltd. and Subsidiaries Notes to the Consolidated Financial Statements December 31, 2021 and 2020
56
20. Operating profit (cont’d) Details of employee benefit expenses for the years ended December 31, 2021 and 2020 are as follows (Korean won in thousands): 2021 2020 Salaries expenses ₩ 1,675,110,475 ₩ 1,362,317,581
Pension costs 77,424,720 70,809,348
Employee welfare benefits 314,861,101 286,709,572
₩ 2,067,396,296 ₩ 1,719,836,501 (*) Includes expenses for the year from discontinued operation. Depreciation of property, plant and equipment and amortisation of intangible assets for the years ended December 31, 2021 and 2020 are as follows (Korean won in thousands): 2021 2020 Depreciation (*1)(*2) ₩ 828,463,945 ₩ 807,503,276 Amortisation(*2) 37,963,765 33,674,115
₩ 866,427,710 ₩ 841,177,391 (*1) Includes depreciation of right-of-use assets. (*2) Includes expenses for the year from discontinued operation. Details of selling and administrative expenses for the years ended December 31, 2021 and 2020 are as follows (Korean won in thousands): 2021 2020 Employee benefit expense ₩ 209,451,718 ₩ 253,986,591
Employee welfare benefits 59,517,561 90,796,939
Commissions 75,965,615 52,469,815
Education and training expenses 10,104,676 6,865,352
Taxes and due 25,120,784 23,038,669
Allowance (reversal) for doubtful accounts - (27,889)
Utilities expenses 5,877,428 9,928,606
Sample expenses 3,671,024 4,496,791
Travel expenses 3,534,914 4,034,286
Research and development expense 526,153,387 415,219,545
IT expenses 31,254,155 30,538,831
Other expenses 110,414,023 164,700,914
₩ 1,061,065,285 ₩ 1,056,048,450
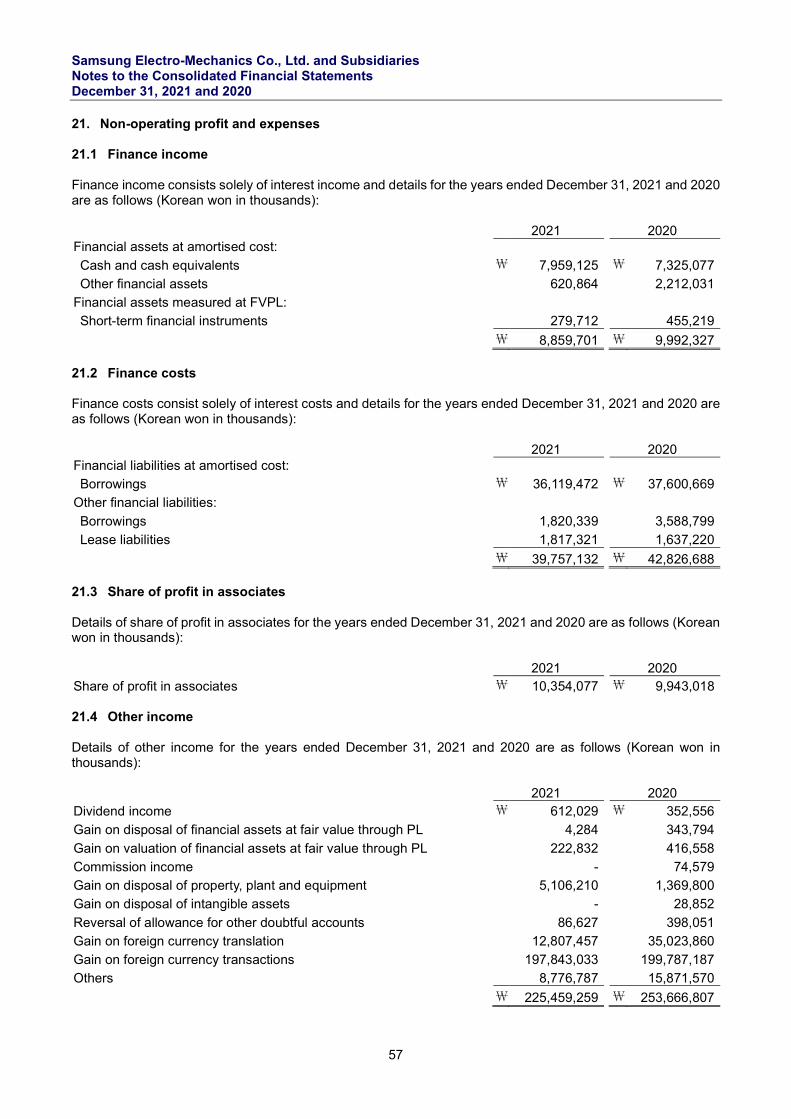
Samsung Electro-Mechanics Co., Ltd. and Subsidiaries Notes to the Consolidated Financial Statements December 31, 2021 and 2020
57
21. Non-operating profit and expenses 21.1 Finance income Finance income consists solely of interest income and details for the years ended December 31, 2021 and 2020 are as follows (Korean won in thousands): 2021 2020 Financial assets at amortised cost:
Cash and cash equivalents ₩ 7,959,125 ₩ 7,325,077
Other financial assets 620,864 2,212,031
Financial assets measured at FVPL:
Short-term financial instruments 279,712 455,219
₩ 8,859,701 ₩ 9,992,327 21.2 Finance costs Finance costs consist solely of interest costs and details for the years ended December 31, 2021 and 2020 are as follows (Korean won in thousands): 2021 2020 Financial liabilities at amortised cost:
Borrowings ₩ 36,119,472 ₩ 37,600,669
Other financial liabilities:
Borrowings 1,820,339 3,588,799
Lease liabilities 1,817,321 1,637,220
₩ 39,757,132 ₩ 42,826,688 21.3 Share of profit in associates Details of share of profit in associates for the years ended December 31, 2021 and 2020 are as follows (Korean won in thousands): 2021 2020 Share of profit in associates ₩ 10,354,077 ₩ 9,943,018 21.4 Other income Details of other income for the years ended December 31, 2021 and 2020 are as follows (Korean won in thousands): 2021 2020 Dividend income ₩ 612,029 ₩ 352,556
Gain on disposal of financial assets at fair value through PL 4,284 343,794
Gain on valuation of financial assets at fair value through PL 222,832 416,558
Commission income - 74,579
Gain on disposal of property, plant and equipment 5,106,210 1,369,800
Gain on disposal of intangible assets - 28,852
Reversal of allowance for other doubtful accounts 86,627 398,051
Gain on foreign currency translation 12,807,457 35,023,860
Gain on foreign currency transactions 197,843,033 199,787,187
Others 8,776,787 15,871,570
₩ 225,459,259 ₩ 253,666,807
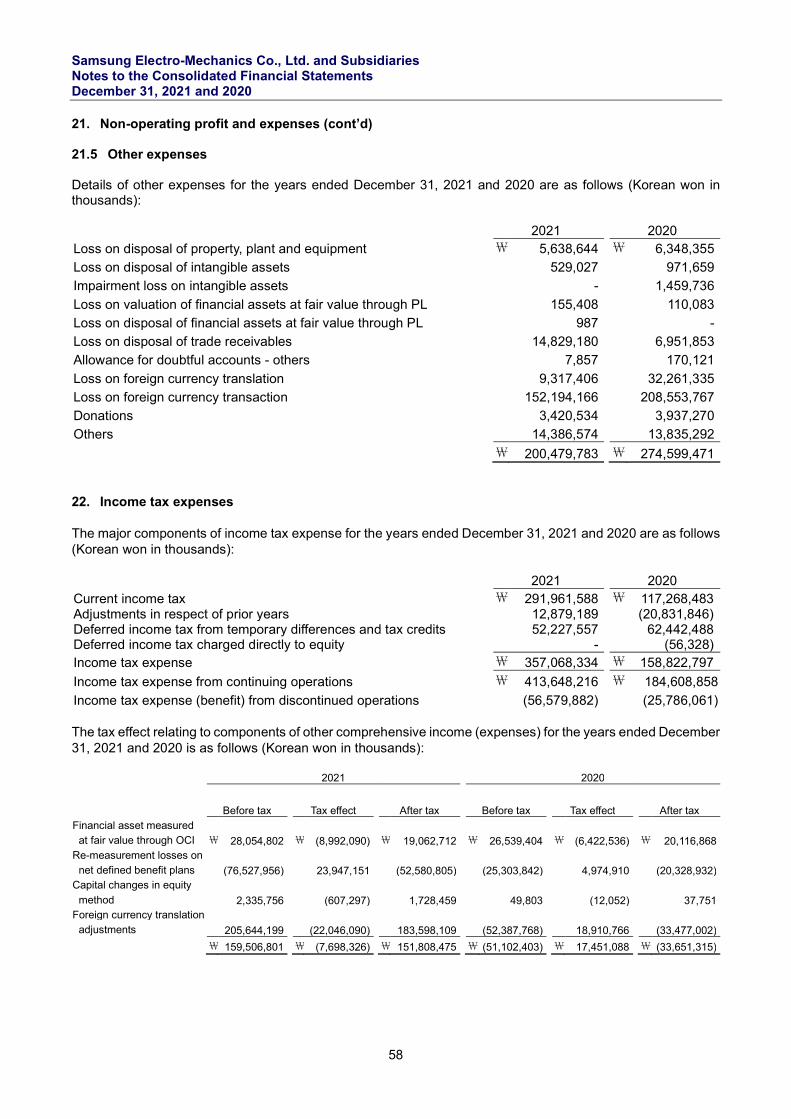
Samsung Electro-Mechanics Co., Ltd. and Subsidiaries Notes to the Consolidated Financial Statements December 31, 2021 and 2020
58
21. Non-operating profit and expenses (cont’d) 21.5 Other expenses Details of other expenses for the years ended December 31, 2021 and 2020 are as follows (Korean won in thousands): 2021 2020 Loss on disposal of property, plant and equipment ₩ 5,638,644 ₩ 6,348,355
Loss on disposal of intangible assets 529,027 971,659
Impairment loss on intangible assets - 1,459,736
Loss on valuation of financial assets at fair value through PL 155,408 110,083
Loss on disposal of financial assets at fair value through PL 987 -
Loss on disposal of trade receivables 14,829,180 6,951,853
Allowance for doubtful accounts - others 7,857 170,121
Loss on foreign currency translation 9,317,406 32,261,335
Loss on foreign currency transaction 152,194,166 208,553,767
Donations 3,420,534 3,937,270
Others 14,386,574 13,835,292
₩ 200,479,783 ₩ 274,599,471 22. Income tax expenses The major components of income tax expense for the years ended December 31, 2021 and 2020 are as follows (Korean won in thousands): 2021 2020 Current income tax ₩ 291,961,588 ₩ 117,268,483 Adjustments in respect of prior years 12,879,189 (20,831,846) Deferred income tax from temporary differences and tax credits 52,227,557 62,442,488 Deferred income tax charged directly to equity - (56,328) Income tax expense ₩ 357,068,334 ₩ 158,822,797
Income tax expense from continuing operations ₩ 413,648,216 ₩ 184,608,858
Income tax expense (benefit) from discontinued operations (56,579,882) (25,786,061)
The tax effect relating to components of other comprehensive income (expenses) for the years ended December 31, 2021 and 2020 is as follows (Korean won in thousands):
2021 2020
Before tax Tax effect After tax Before tax Tax effect After tax
Financial asset measured at fair value through OCI ₩ 28,054,802 ₩ (8,992,090) ₩ 19,062,712 ₩ 26,539,404 ₩ (6,422,536) ₩ 20,116,868
Re-measurement losses on net defined benefit plans (76,527,956) 23,947,151 (52,580,805) (25,303,842) 4,974,910 (20,328,932)
Capital changes in equity
method 2,335,756 (607,297) 1,728,459 49,803 (12,052) 37,751 Foreign currency translation
adjustments 205,644,199 (22,046,090) 183,598,109 (52,387,768) 18,910,766 (33,477,002) ₩ 159,506,801 ₩ (7,698,326) ₩ 151,808,475 ₩ (51,102,403) ₩ 17,451,088 ₩ (33,651,315)
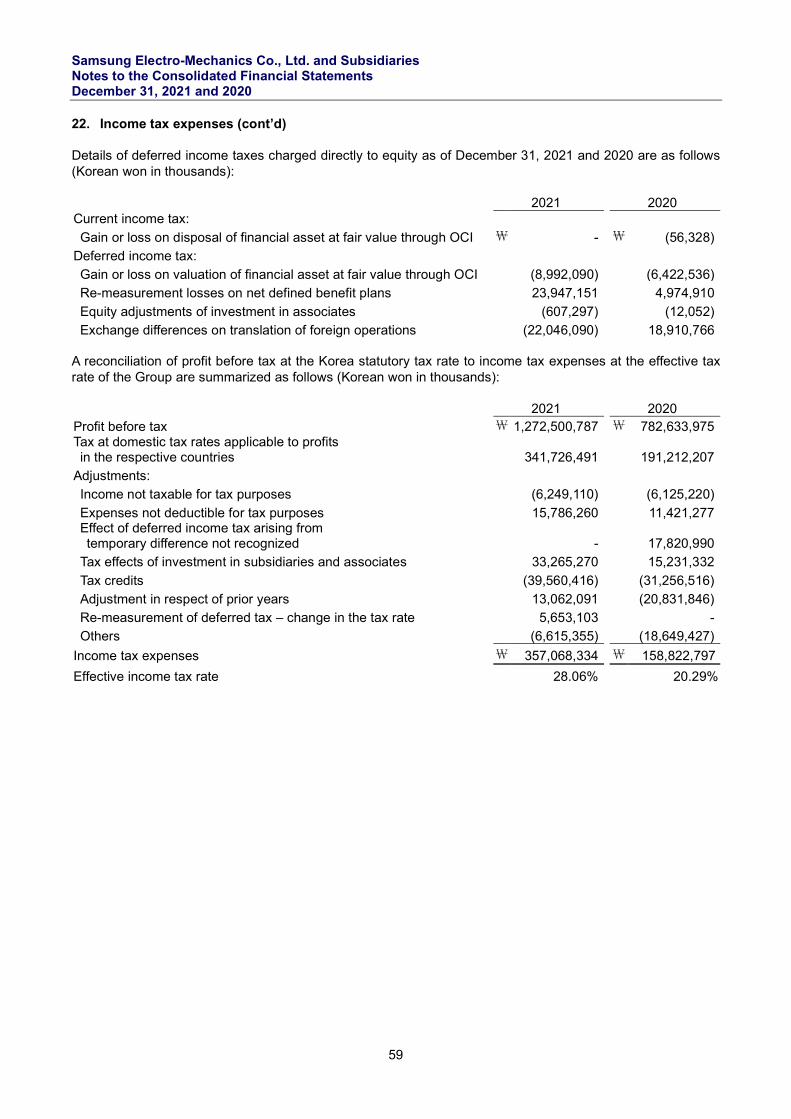
Samsung Electro-Mechanics Co., Ltd. and Subsidiaries Notes to the Consolidated Financial Statements December 31, 2021 and 2020
59
22. Income tax expenses (cont’d) Details of deferred income taxes charged directly to equity as of December 31, 2021 and 2020 are as follows (Korean won in thousands): 2021 2020 Current income tax:
Gain or loss on disposal of financial asset at fair value through OCI ₩ - ₩ (56,328)
Deferred income tax: Gain or loss on valuation of financial asset at fair value through OCI (8,992,090) (6,422,536)
Re-measurement losses on net defined benefit plans 23,947,151 4,974,910
Equity adjustments of investment in associates (607,297) (12,052)
Exchange differences on translation of foreign operations (22,046,090) 18,910,766 A reconciliation of profit before tax at the Korea statutory tax rate to income tax expenses at the effective tax rate of the Group are summarized as follows (Korean won in thousands): 2021 2020 Profit before tax ₩ 1,272,500,787 ₩ 782,633,975 Tax at domestic tax rates applicable to profits in the respective countries
341,726,491 191,212,207
Adjustments:
Income not taxable for tax purposes (6,249,110) (6,125,220)
Expenses not deductible for tax purposes 15,786,260 11,421,277 Effect of deferred income tax arising from temporary difference not recognized
- 17,820,990
Tax effects of investment in subsidiaries and associates 33,265,270 15,231,332
Tax credits (39,560,416) (31,256,516)
Adjustment in respect of prior years 13,062,091 (20,831,846)
Re-measurement of deferred tax – change in the tax rate 5,653,103 -
Others (6,615,355) (18,649,427)
Income tax expenses ₩ 357,068,334 ₩ 158,822,797
Effective income tax rate 28.06% 20.29%
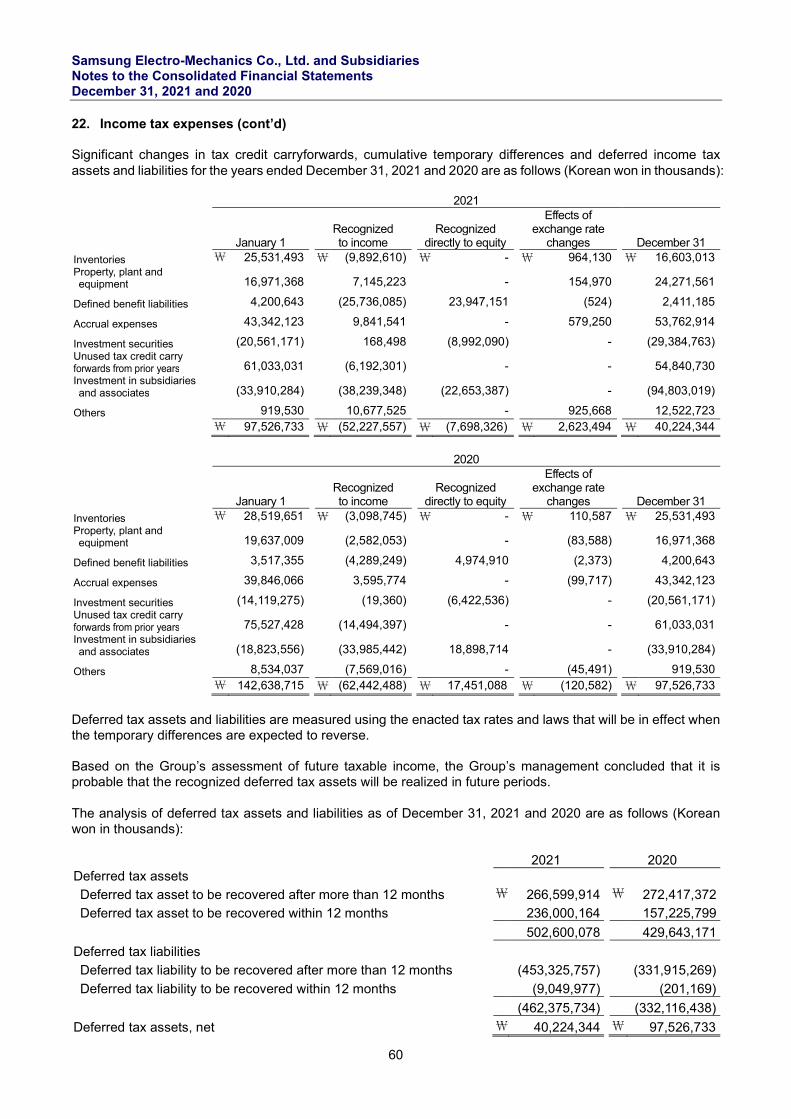
Samsung Electro-Mechanics Co., Ltd. and Subsidiaries Notes to the Consolidated Financial Statements December 31, 2021 and 2020
60
22. Income tax expenses (cont’d) Significant changes in tax credit carryforwards, cumulative temporary differences and deferred income tax assets and liabilities for the years ended December 31, 2021 and 2020 are as follows (Korean won in thousands):
2021
January 1 Recognized to income
Recognized
directly to equity
Effects of exchange rate
changes December 31 Inventories \ 25,531,493 \ (9,892,610) \ - \ 964,130 \ 16,603,013 Property, plant and equipment 16,971,368 7,145,223 - 154,970 24,271,561
Defined benefit liabilities 4,200,643 (25,736,085) 23,947,151 (524) 2,411,185
Accrual expenses 43,342,123 9,841,541 - 579,250 53,762,914
Investment securities (20,561,171) 168,498 (8,992,090) - (29,384,763) Unused tax credit carry forwards from prior years 61,033,031 (6,192,301) - - 54,840,730 Investment in subsidiaries and associates (33,910,284) (38,239,348) (22,653,387) - (94,803,019)
Others 919,530 10,677,525 - 925,668 12,522,723 \ 97,526,733 \ (52,227,557) \ (7,698,326) \ 2,623,494 \ 40,224,344
2020
January 1 Recognized to income
Recognized
directly to equity
Effects of exchange rate
changes December 31 Inventories \ 28,519,651 \ (3,098,745) \ - \ 110,587 \ 25,531,493 Property, plant and equipment 19,637,009 (2,582,053) - (83,588) 16,971,368
Defined benefit liabilities 3,517,355 (4,289,249) 4,974,910 (2,373) 4,200,643
Accrual expenses 39,846,066 3,595,774 - (99,717) 43,342,123
Investment securities (14,119,275) (19,360) (6,422,536) - (20,561,171) Unused tax credit carry forwards from prior years 75,527,428 (14,494,397) - - 61,033,031 Investment in subsidiaries and associates (18,823,556) (33,985,442) 18,898,714 - (33,910,284)
Others 8,534,037 (7,569,016) - (45,491) 919,530 \ 142,638,715 \ (62,442,488) \ 17,451,088 \ (120,582) \ 97,526,733
Deferred tax assets and liabilities are measured using the enacted tax rates and laws that will be in effect when the temporary differences are expected to reverse. Based on the Group’s assessment of future taxable income, the Group’s management concluded that it is probable that the recognized deferred tax assets will be realized in future periods. The analysis of deferred tax assets and liabilities as of December 31, 2021 and 2020 are as follows (Korean won in thousands): 2021 2020 Deferred tax assets
Deferred tax asset to be recovered after more than 12 months ₩ 266,599,914 ₩ 272,417,372
Deferred tax asset to be recovered within 12 months 236,000,164 157,225,799
502,600,078 429,643,171
Deferred tax liabilities
Deferred tax liability to be recovered after more than 12 months (453,325,757) (331,915,269)
Deferred tax liability to be recovered within 12 months (9,049,977) (201,169)
(462,375,734) (332,116,438)
Deferred tax assets, net ₩ 40,224,344 ₩ 97,526,733
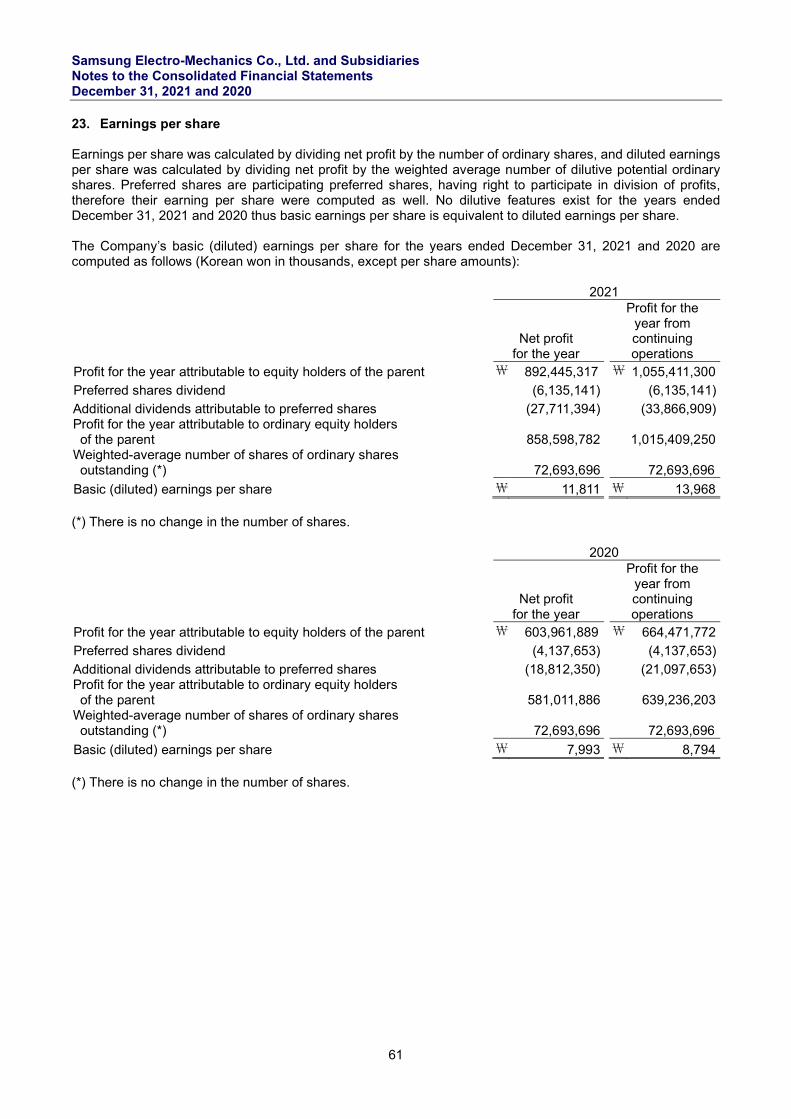
Samsung Electro-Mechanics Co., Ltd. and Subsidiaries Notes to the Consolidated Financial Statements December 31, 2021 and 2020
61
23. Earnings per share Earnings per share was calculated by dividing net profit by the number of ordinary shares, and diluted earnings per share was calculated by dividing net profit by the weighted average number of dilutive potential ordinary shares. Preferred shares are participating preferred shares, having right to participate in division of profits, therefore their earning per share were computed as well. No dilutive features exist for the years ended December 31, 2021 and 2020 thus basic earnings per share is equivalent to diluted earnings per share. The Company’s basic (diluted) earnings per share for the years ended December 31, 2021 and 2020 are computed as follows (Korean won in thousands, except per share amounts): 2021
Net profit
for the year
Profit for the year from continuing operations
Profit for the year attributable to equity holders of the parent ₩ 892,445,317 ₩ 1,055,411,300
Preferred shares dividend (6,135,141) (6,135,141)
Additional dividends attributable to preferred shares (27,711,394) (33,866,909) Profit for the year attributable to ordinary equity holders of the parent
858,598,782 1,015,409,250
Weighted-average number of shares of ordinary shares outstanding (*)
72,693,696 72,693,696
Basic (diluted) earnings per share ₩ 11,811 ₩ 13,968 (*) There is no change in the number of shares. 2020
Net profit
for the year
Profit for the year from continuing operations
Profit for the year attributable to equity holders of the parent ₩ 603,961,889 ₩ 664,471,772
Preferred shares dividend (4,137,653) (4,137,653)
Additional dividends attributable to preferred shares (18,812,350) (21,097,653) Profit for the year attributable to ordinary equity holders of the parent
581,011,886 639,236,203
Weighted-average number of shares of ordinary shares outstanding (*)
72,693,696 72,693,696
Basic (diluted) earnings per share ₩ 7,993 ₩ 8,794 (*) There is no change in the number of shares.
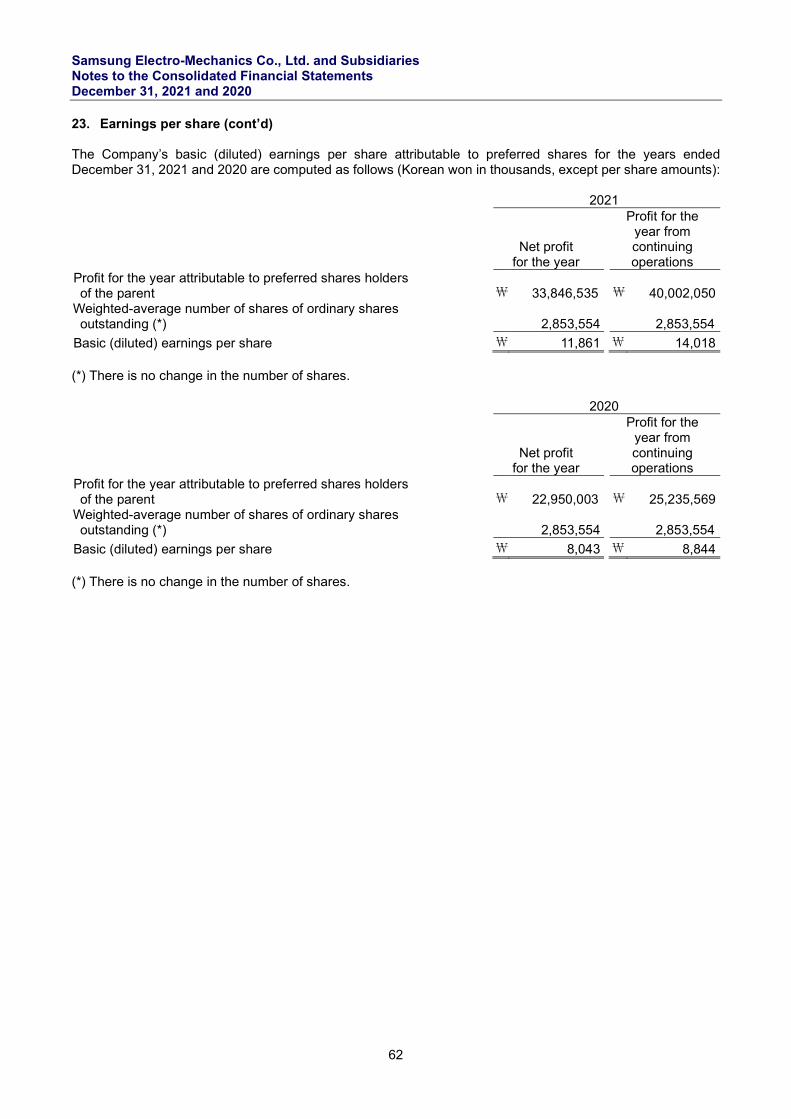
Samsung Electro-Mechanics Co., Ltd. and Subsidiaries Notes to the Consolidated Financial Statements December 31, 2021 and 2020
62
23. Earnings per share (cont’d) The Company’s basic (diluted) earnings per share attributable to preferred shares for the years ended December 31, 2021 and 2020 are computed as follows (Korean won in thousands, except per share amounts): 2021
Net profit
for the year
Profit for the year from continuing operations
Profit for the year attributable to preferred shares holders of the parent
₩ 33,846,535 ₩ 40,002,050
Weighted-average number of shares of ordinary shares outstanding (*)
2,853,554 2,853,554
Basic (diluted) earnings per share ₩ 11,861 ₩ 14,018 (*) There is no change in the number of shares. 2020
Net profit
for the year
Profit for the year from continuing operations
Profit for the year attributable to preferred shares holders of the parent
₩ 22,950,003 ₩ 25,235,569
Weighted-average number of shares of ordinary shares outstanding (*)
2,853,554 2,853,554
Basic (diluted) earnings per share ₩ 8,043 ₩ 8,844 (*) There is no change in the number of shares.
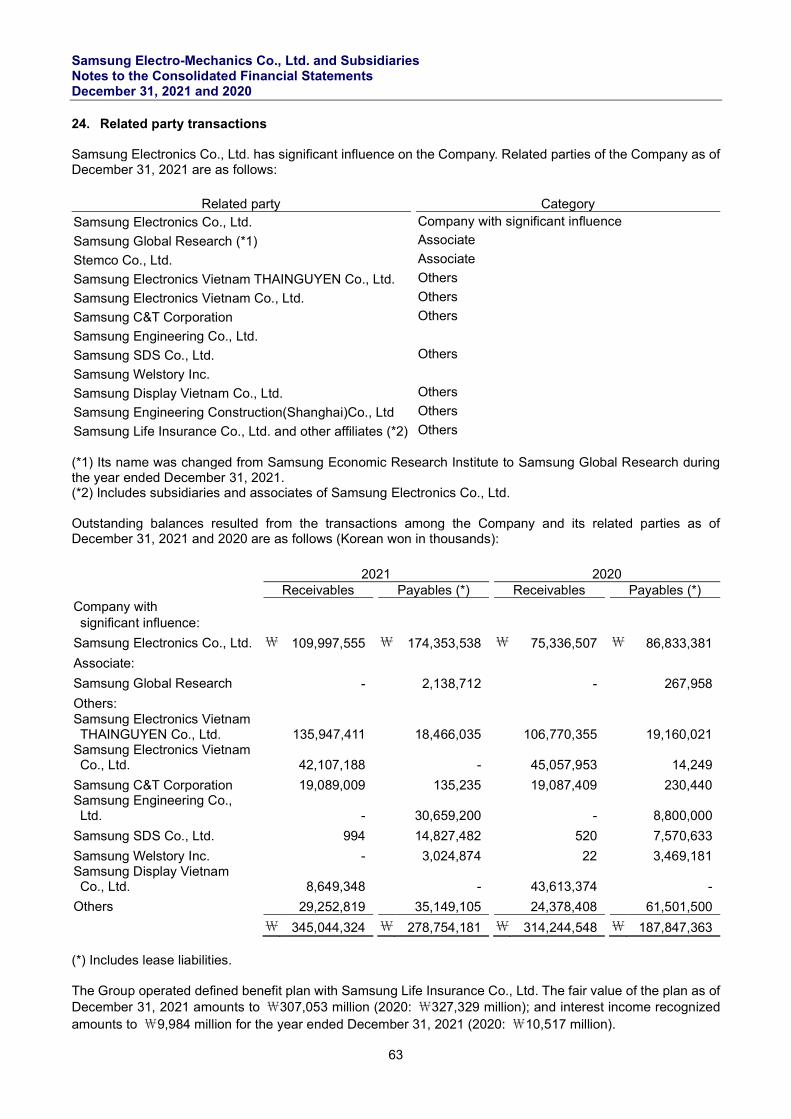
Samsung Electro-Mechanics Co., Ltd. and Subsidiaries Notes to the Consolidated Financial Statements December 31, 2021 and 2020
63
24. Related party transactions Samsung Electronics Co., Ltd. has significant influence on the Company. Related parties of the Company as of December 31, 2021 are as follows:
Related party Category Samsung Electronics Co., Ltd. Company with significant influence
Samsung Global Research (*1) Associate
Stemco Co., Ltd. Associate
Samsung Electronics Vietnam THAINGUYEN Co., Ltd. Others
Samsung Electronics Vietnam Co., Ltd. Others
Samsung C&T Corporation Others
Samsung Engineering Co., Ltd.
Samsung SDS Co., Ltd. Others
Samsung Welstory Inc.
Samsung Display Vietnam Co., Ltd. Others
Samsung Engineering Construction(Shanghai)Co., Ltd Others
Samsung Life Insurance Co., Ltd. and other affiliates (*2) Others (*1) Its name was changed from Samsung Economic Research Institute to Samsung Global Research during the year ended December 31, 2021. (*2) Includes subsidiaries and associates of Samsung Electronics Co., Ltd. Outstanding balances resulted from the transactions among the Company and its related parties as of December 31, 2021 and 2020 are as follows (Korean won in thousands):
(*) Includes lease liabilities. The Group operated defined benefit plan with Samsung Life Insurance Co., Ltd. The fair value of the plan as of December 31, 2021 amounts to ₩307,053 million (2020: ₩327,329 million); and interest income recognized amounts to ₩9,984 million for the year ended December 31, 2021 (2020: ₩10,517 million).
2021 2020 Receivables Payables (*) Receivables Payables (*)
Company with significant influence:
Samsung Electronics Co., Ltd. \ 109,997,555 \ 174,353,538 \ 75,336,507 \ 86,833,381
Associate: Samsung Global Research - 2,138,712 - 267,958
Others: Samsung Electronics Vietnam THAINGUYEN Co., Ltd.
135,947,411 18,466,035 106,770,355 19,160,021 Samsung Electronics Vietnam Co., Ltd.
42,107,188 - 45,057,953 14,249
Samsung C&T Corporation 19,089,009 135,235 19,087,409 230,440 Samsung Engineering Co., Ltd.
- 30,659,200 - 8,800,000
Samsung SDS Co., Ltd. 994 14,827,482 520 7,570,633
Samsung Welstory Inc. - 3,024,874 22 3,469,181 Samsung Display Vietnam Co., Ltd.
8,649,348 - 43,613,374 -
Others 29,252,819 35,149,105 24,378,408 61,501,500
\ 345,044,324 \ 278,754,181 \ 314,244,548 \ 187,847,363
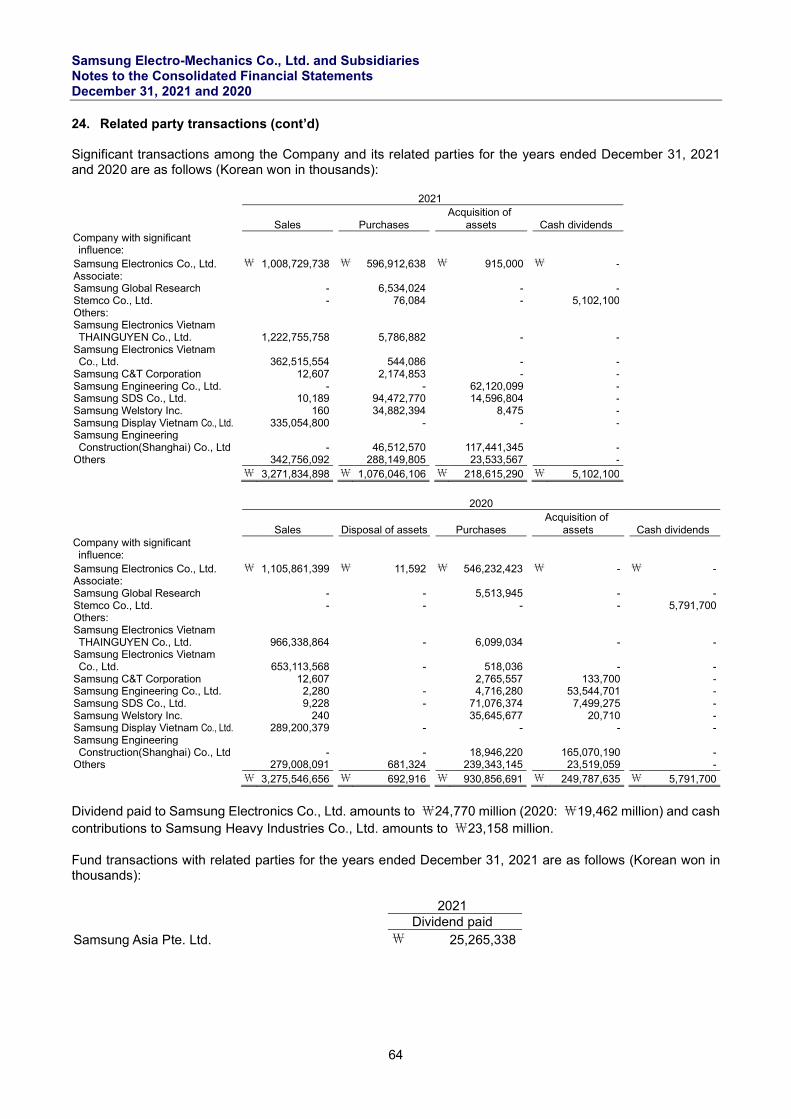
Samsung Electro-Mechanics Co., Ltd. and Subsidiaries Notes to the Consolidated Financial Statements December 31, 2021 and 2020
64
24. Related party transactions (cont’d) Significant transactions among the Company and its related parties for the years ended December 31, 2021 and 2020 are as follows (Korean won in thousands): 2021
Sales Purchases Acquisition of
assets Cash dividends Company with significant influence:
Samsung Electronics Co., Ltd. \ 1,008,729,738 \ 596,912,638 \ 915,000 \ - Associate: Samsung Global Research - 6,534,024 - - Stemco Co., Ltd. - 76,084 - 5,102,100 Others: Samsung Electronics Vietnam THAINGUYEN Co., Ltd. 1,222,755,758 5,786,882 - -
Samsung Electronics Vietnam Co., Ltd. 362,515,554 544,086 - -
Samsung C&T Corporation 12,607 2,174,853 - - Samsung Engineering Co., Ltd. - - 62,120,099 - Samsung SDS Co., Ltd. 10,189 94,472,770 14,596,804 - Samsung Welstory Inc. 160 34,882,394 8,475 - Samsung Display Vietnam Co., Ltd. 335,054,800 - - - Samsung Engineering Construction(Shanghai) Co., Ltd - 46,512,570 117,441,345 -
Others 342,756,092 288,149,805 23,533,567 - \ 3,271,834,898 \ 1,076,046,106 \ 218,615,290 \ 5,102,100
2020
Sales Disposal of assets Purchases Acquisition of
assets Cash dividends Company with significant influence:
Samsung Electronics Co., Ltd. \ 1,105,861,399 \ 11,592 \ 546,232,423 \ - \ - Associate: Samsung Global Research - - 5,513,945 - - Stemco Co., Ltd. - - - - 5,791,700 Others: Samsung Electronics Vietnam THAINGUYEN Co., Ltd. 966,338,864 - 6,099,034 - -
Samsung Electronics Vietnam Co., Ltd. 653,113,568 - 518,036 - -
Samsung C&T Corporation 12,607 2,765,557 133,700 - Samsung Engineering Co., Ltd. 2,280 - 4,716,280 53,544,701 - Samsung SDS Co., Ltd. 9,228 - 71,076,374 7,499,275 - Samsung Welstory Inc. 240 35,645,677 20,710 - Samsung Display Vietnam Co., Ltd. 289,200,379 - - - - Samsung Engineering Construction(Shanghai) Co., Ltd - - 18,946,220 165,070,190 -
Others 279,008,091 681,324 239,343,145 23,519,059 - \ 3,275,546,656 \ 692,916 \ 930,856,691 \ 249,787,635 \ 5,791,700
Dividend paid to Samsung Electronics Co., Ltd. amounts to ₩24,770 million (2020: ₩19,462 million) and cash contributions to Samsung Heavy Industries Co., Ltd. amounts to ₩23,158 million. Fund transactions with related parties for the years ended December 31, 2021 are as follows (Korean won in thousands): 2021 Dividend paid Samsung Asia Pte. Ltd. ₩ 25,265,338
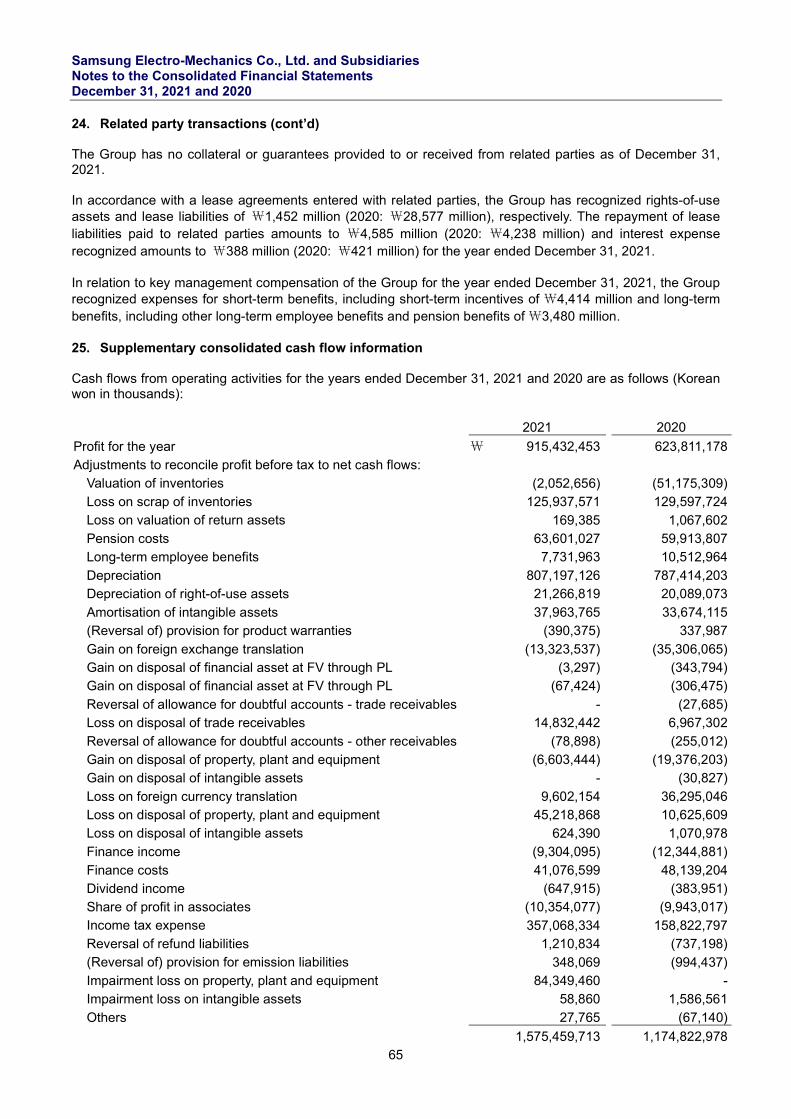
Samsung Electro-Mechanics Co., Ltd. and Subsidiaries Notes to the Consolidated Financial Statements December 31, 2021 and 2020
65
24. Related party transactions (cont’d) The Group has no collateral or guarantees provided to or received from related parties as of December 31, 2021. In accordance with a lease agreements entered with related parties, the Group has recognized rights-of-use assets and lease liabilities of ₩1,452 million (2020: ₩28,577 million), respectively. The repayment of lease liabilities paid to related parties amounts to ₩4,585 million (2020: ₩4,238 million) and interest expense recognized amounts to ₩388 million (2020: ₩421 million) for the year ended December 31, 2021. In relation to key management compensation of the Group for the year ended December 31, 2021, the Group recognized expenses for short-term benefits, including short-term incentives of \4,414 million and long-term benefits, including other long-term employee benefits and pension benefits of \3,480 million. 25. Supplementary consolidated cash flow information Cash flows from operating activities for the years ended December 31, 2021 and 2020 are as follows (Korean won in thousands): 2021 2020
Profit for the year \ 915,432,453 623,811,178 Adjustments to reconcile profit before tax to net cash flows:
Valuation of inventories (2,052,656) (51,175,309) Loss on scrap of inventories 125,937,571 129,597,724 Loss on valuation of return assets 169,385 1,067,602 Pension costs 63,601,027 59,913,807 Long-term employee benefits 7,731,963 10,512,964
Depreciation 807,197,126 787,414,203 Depreciation of right-of-use assets 21,266,819 20,089,073
Amortisation of intangible assets 37,963,765 33,674,115 (Reversal of) provision for product warranties (390,375) 337,987
Gain on foreign exchange translation (13,323,537) (35,306,065) Gain on disposal of financial asset at FV through PL (3,297) (343,794) Gain on disposal of financial asset at FV through PL (67,424) (306,475)
Reversal of allowance for doubtful accounts - trade receivables - (27,685) Loss on disposal of trade receivables 14,832,442 6,967,302
Reversal of allowance for doubtful accounts - other receivables (78,898) (255,012) Gain on disposal of property, plant and equipment (6,603,444) (19,376,203) Gain on disposal of intangible assets - (30,827)
Loss on foreign currency translation 9,602,154 36,295,046 Loss on disposal of property, plant and equipment 45,218,868 10,625,609 Loss on disposal of intangible assets 624,390 1,070,978 Finance income (9,304,095) (12,344,881)
Finance costs 41,076,599 48,139,204 Dividend income (647,915) (383,951) Share of profit in associates (10,354,077) (9,943,017) Income tax expense 357,068,334 158,822,797 Reversal of refund liabilities 1,210,834 (737,198) (Reversal of) provision for emission liabilities 348,069 (994,437) Impairment loss on property, plant and equipment 84,349,460 - Impairment loss on intangible assets 58,860 1,586,561
Others 27,765 (67,140)
1,575,459,713 1,174,822,978
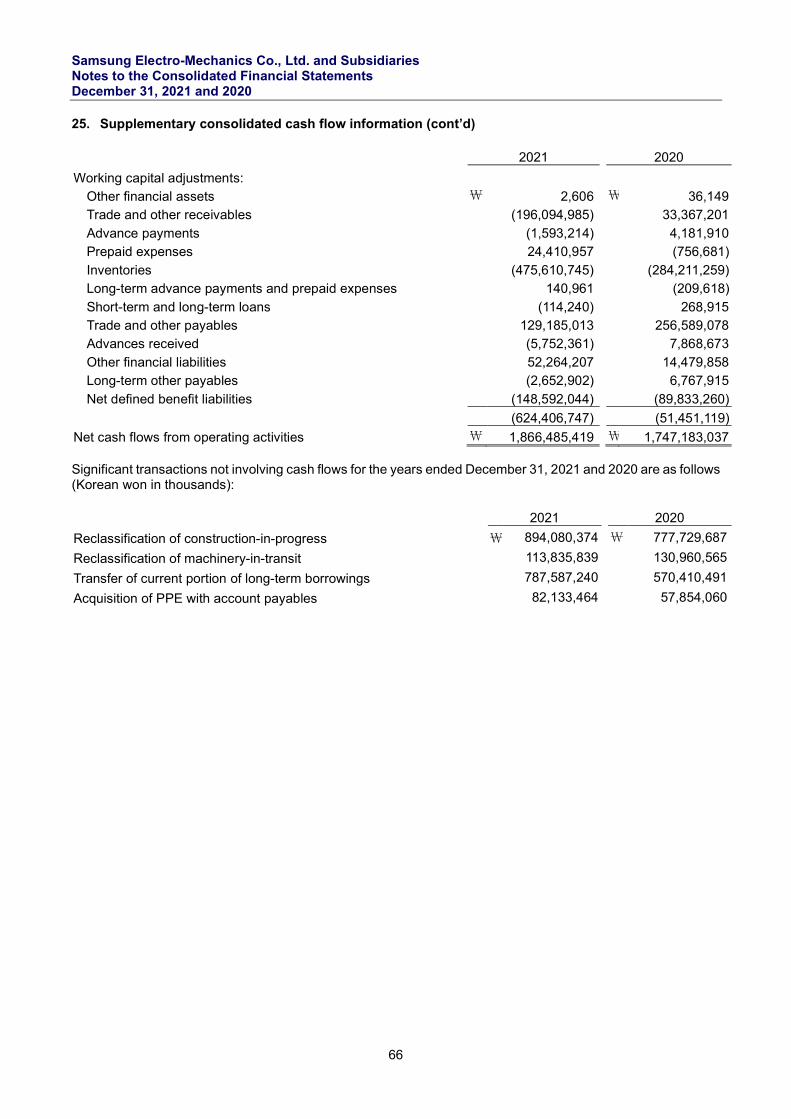
Samsung Electro-Mechanics Co., Ltd. and Subsidiaries Notes to the Consolidated Financial Statements December 31, 2021 and 2020
66
25. Supplementary consolidated cash flow information (cont’d)
2021 2020
Working capital adjustments:
Other financial assets \ 2,606 \ 36,149 Trade and other receivables (196,094,985) 33,367,201
Advance payments (1,593,214) 4,181,910 Prepaid expenses 24,410,957 (756,681)
Inventories (475,610,745) (284,211,259) Long-term advance payments and prepaid expenses 140,961 (209,618)
Short-term and long-term loans (114,240) 268,915 Trade and other payables 129,185,013 256,589,078 Advances received (5,752,361) 7,868,673
Other financial liabilities 52,264,207 14,479,858 Long-term other payables (2,652,902) 6,767,915
Net defined benefit liabilities (148,592,044) (89,833,260)
(624,406,747) (51,451,119)
Net cash flows from operating activities \ 1,866,485,419 \ 1,747,183,037 Significant transactions not involving cash flows for the years ended December 31, 2021 and 2020 are as follows (Korean won in thousands): 2021 2020
Reclassification of construction-in-progress \ 894,080,374 \ 777,729,687
Reclassification of machinery-in-transit 113,835,839 130,960,565
Transfer of current portion of long-term borrowings 787,587,240 570,410,491
Acquisition of PPE with account payables 82,133,464 57,854,060
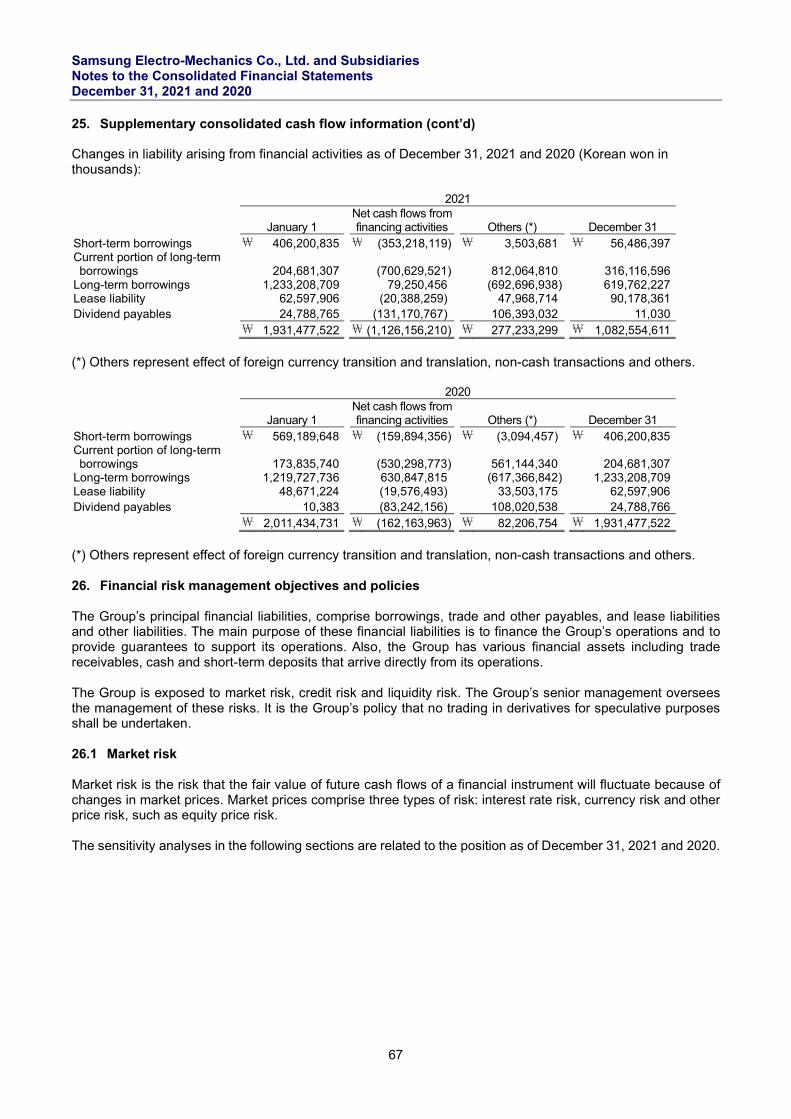
Samsung Electro-Mechanics Co., Ltd. and Subsidiaries Notes to the Consolidated Financial Statements December 31, 2021 and 2020
67
25. Supplementary consolidated cash flow information (cont’d) Changes in liability arising from financial activities as of December 31, 2021 and 2020 (Korean won in thousands): 2021
January 1 Net cash flows from
financing activities Others (*) December 31 Short-term borrowings \ 406,200,835 \ (353,218,119) \ 3,503,681 \ 56,486,397 Current portion of long-term borrowings 204,681,307 (700,629,521) 812,064,810 316,116,596
Long-term borrowings 1,233,208,709 79,250,456 (692,696,938) 619,762,227 Lease liability 62,597,906 (20,388,259) 47,968,714 90,178,361 Dividend payables 24,788,765 (131,170,767) 106,393,032 11,030 \ 1,931,477,522 \ (1,126,156,210) \ 277,233,299 \ 1,082,554,611
(*) Others represent effect of foreign currency transition and translation, non-cash transactions and others. 2020
January 1 Net cash flows from
financing activities Others (*) December 31 Short-term borrowings \ 569,189,648 \ (159,894,356) \ (3,094,457) \ 406,200,835 Current portion of long-term borrowings 173,835,740 (530,298,773) 561,144,340 204,681,307
Long-term borrowings 1,219,727,736 630,847,815 (617,366,842) 1,233,208,709 Lease liability 48,671,224 (19,576,493) 33,503,175 62,597,906 Dividend payables 10,383 (83,242,156) 108,020,538 24,788,766 \ 2,011,434,731 \ (162,163,963) \ 82,206,754 \ 1,931,477,522
(*) Others represent effect of foreign currency transition and translation, non-cash transactions and others. 26. Financial risk management objectives and policies The Group’s principal financial liabilities, comprise borrowings, trade and other payables, and lease liabilities and other liabilities. The main purpose of these financial liabilities is to finance the Group’s operations and to provide guarantees to support its operations. Also, the Group has various financial assets including trade receivables, cash and short-term deposits that arrive directly from its operations. The Group is exposed to market risk, credit risk and liquidity risk. The Group’s senior management oversees the management of these risks. It is the Group’s policy that no trading in derivatives for speculative purposes shall be undertaken. 26.1 Market risk Market risk is the risk that the fair value of future cash flows of a financial instrument will fluctuate because of changes in market prices. Market prices comprise three types of risk: interest rate risk, currency risk and other price risk, such as equity price risk. The sensitivity analyses in the following sections are related to the position as of December 31, 2021 and 2020.
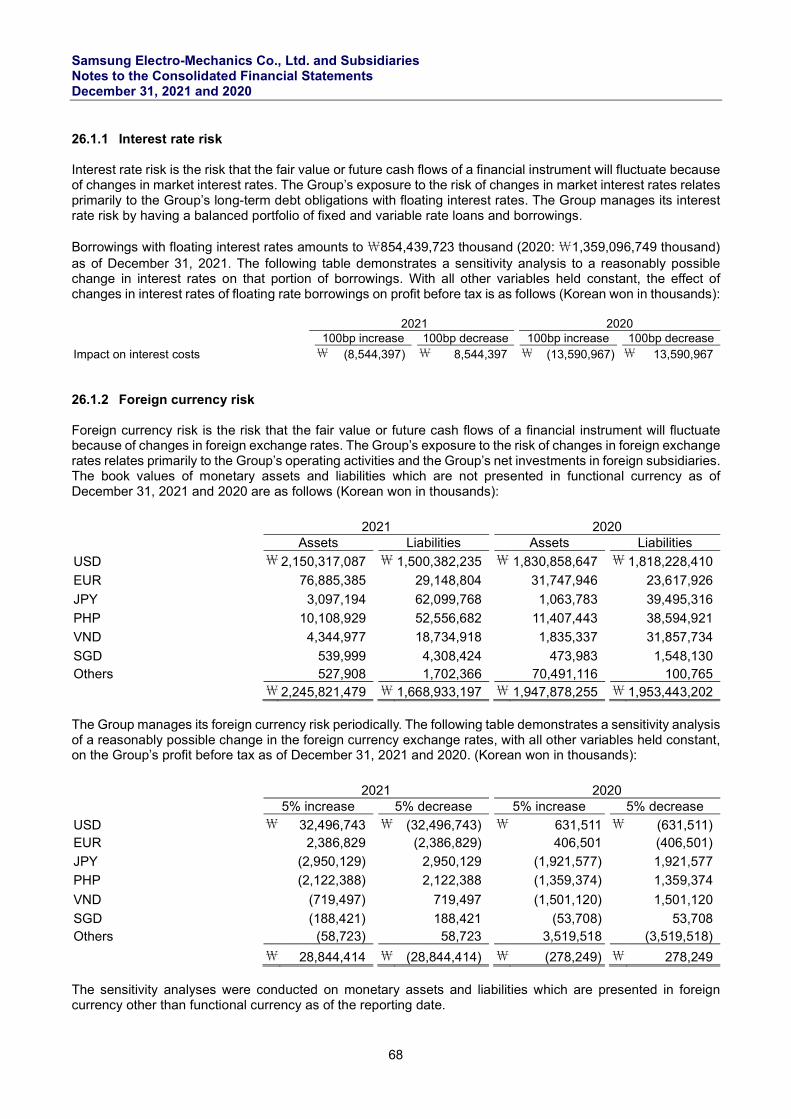
Samsung Electro-Mechanics Co., Ltd. and Subsidiaries Notes to the Consolidated Financial Statements December 31, 2021 and 2020
68
26.1.1 Interest rate risk Interest rate risk is the risk that the fair value or future cash flows of a financial instrument will fluctuate because of changes in market interest rates. The Group’s exposure to the risk of changes in market interest rates relates primarily to the Group’s long-term debt obligations with floating interest rates. The Group manages its interest rate risk by having a balanced portfolio of fixed and variable rate loans and borrowings. Borrowings with floating interest rates amounts to \854,439,723 thousand (2020: \1,359,096,749 thousand) as of December 31, 2021. The following table demonstrates a sensitivity analysis to a reasonably possible change in interest rates on that portion of borrowings. With all other variables held constant, the effect of changes in interest rates of floating rate borrowings on profit before tax is as follows (Korean won in thousands):
2021 2020 100bp increase 100bp decrease 100bp increase 100bp decrease
Impact on interest costs \ (8,544,397) \ 8,544,397 \ (13,590,967) \ 13,590,967 26.1.2 Foreign currency risk Foreign currency risk is the risk that the fair value or future cash flows of a financial instrument will fluctuate because of changes in foreign exchange rates. The Group’s exposure to the risk of changes in foreign exchange rates relates primarily to the Group’s operating activities and the Group’s net investments in foreign subsidiaries. The book values of monetary assets and liabilities which are not presented in functional currency as of December 31, 2021 and 2020 are as follows (Korean won in thousands):
The Group manages its foreign currency risk periodically. The following table demonstrates a sensitivity analysis of a reasonably possible change in the foreign currency exchange rates, with all other variables held constant, on the Group’s profit before tax as of December 31, 2021 and 2020. (Korean won in thousands):
The sensitivity analyses were conducted on monetary assets and liabilities which are presented in foreign currency other than functional currency as of the reporting date.
2021 2020 Assets Liabilities Assets Liabilities
USD ₩ 2,150,317,087 ₩ 1,500,382,235 ₩ 1,830,858,647 ₩ 1,818,228,410
EUR 76,885,385 29,148,804 31,747,946 23,617,926
JPY 3,097,194 62,099,768 1,063,783 39,495,316
PHP 10,108,929 52,556,682 11,407,443 38,594,921
VND 4,344,977 18,734,918 1,835,337 31,857,734
SGD 539,999 4,308,424 473,983 1,548,130 Others 527,908 1,702,366 70,491,116 100,765 ₩ 2,245,821,479 ₩ 1,668,933,197 ₩ 1,947,878,255 ₩ 1,953,443,202
2021 2020 5% increase 5% decrease 5% increase 5% decrease
USD ₩ 32,496,743 ₩ (32,496,743) ₩ 631,511 ₩ (631,511) EUR 2,386,829 (2,386,829) 406,501 (406,501)
JPY (2,950,129) 2,950,129 (1,921,577) 1,921,577
PHP (2,122,388) 2,122,388 (1,359,374) 1,359,374
VND (719,497) 719,497 (1,501,120) 1,501,120
SGD (188,421) 188,421 (53,708) 53,708 Others (58,723) 58,723 3,519,518 (3,519,518)
₩ 28,844,414 ₩ (28,844,414) ₩ (278,249) ₩ 278,249
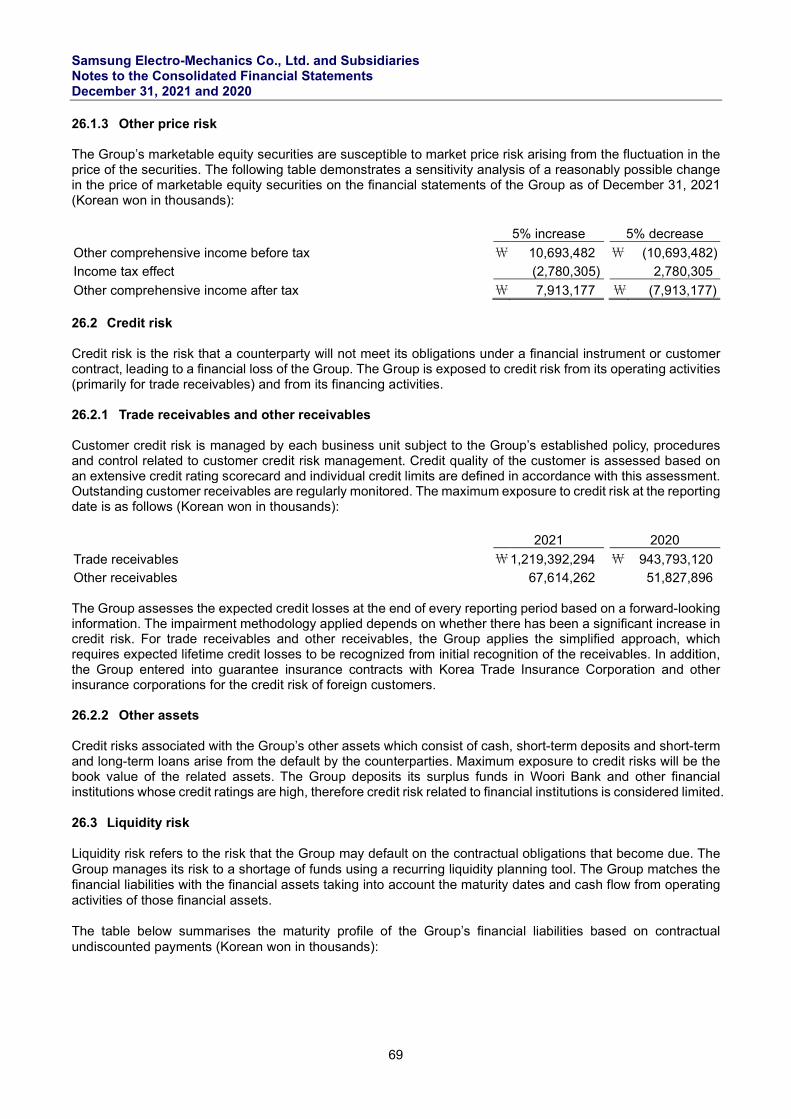
Samsung Electro-Mechanics Co., Ltd. and Subsidiaries Notes to the Consolidated Financial Statements December 31, 2021 and 2020
69
26.1.3 Other price risk The Group’s marketable equity securities are susceptible to market price risk arising from the fluctuation in the price of the securities. The following table demonstrates a sensitivity analysis of a reasonably possible change in the price of marketable equity securities on the financial statements of the Group as of December 31, 2021 (Korean won in thousands): 5% increase 5% decrease
Other comprehensive income before tax \ 10,693,482 \ (10,693,482)
Income tax effect (2,780,305) 2,780,305
Other comprehensive income after tax \ 7,913,177 \ (7,913,177) 26.2 Credit risk Credit risk is the risk that a counterparty will not meet its obligations under a financial instrument or customer contract, leading to a financial loss of the Group. The Group is exposed to credit risk from its operating activities (primarily for trade receivables) and from its financing activities. 26.2.1 Trade receivables and other receivables Customer credit risk is managed by each business unit subject to the Group’s established policy, procedures and control related to customer credit risk management. Credit quality of the customer is assessed based on an extensive credit rating scorecard and individual credit limits are defined in accordance with this assessment. Outstanding customer receivables are regularly monitored. The maximum exposure to credit risk at the reporting date is as follows (Korean won in thousands): 2021 2020
Trade receivables \ 1,219,392,294 \ 943,793,120 Other receivables 67,614,262 51,827,896 The Group assesses the expected credit losses at the end of every reporting period based on a forward-looking information. The impairment methodology applied depends on whether there has been a significant increase in credit risk. For trade receivables and other receivables, the Group applies the simplified approach, which requires expected lifetime credit losses to be recognized from initial recognition of the receivables. In addition, the Group entered into guarantee insurance contracts with Korea Trade Insurance Corporation and other insurance corporations for the credit risk of foreign customers. 26.2.2 Other assets Credit risks associated with the Group’s other assets which consist of cash, short-term deposits and short-term and long-term loans arise from the default by the counterparties. Maximum exposure to credit risks will be the book value of the related assets. The Group deposits its surplus funds in Woori Bank and other financial institutions whose credit ratings are high, therefore credit risk related to financial institutions is considered limited. 26.3 Liquidity risk Liquidity risk refers to the risk that the Group may default on the contractual obligations that become due. The Group manages its risk to a shortage of funds using a recurring liquidity planning tool. The Group matches the financial liabilities with the financial assets taking into account the maturity dates and cash flow from operating activities of those financial assets. The table below summarises the maturity profile of the Group’s financial liabilities based on contractual undiscounted payments (Korean won in thousands):
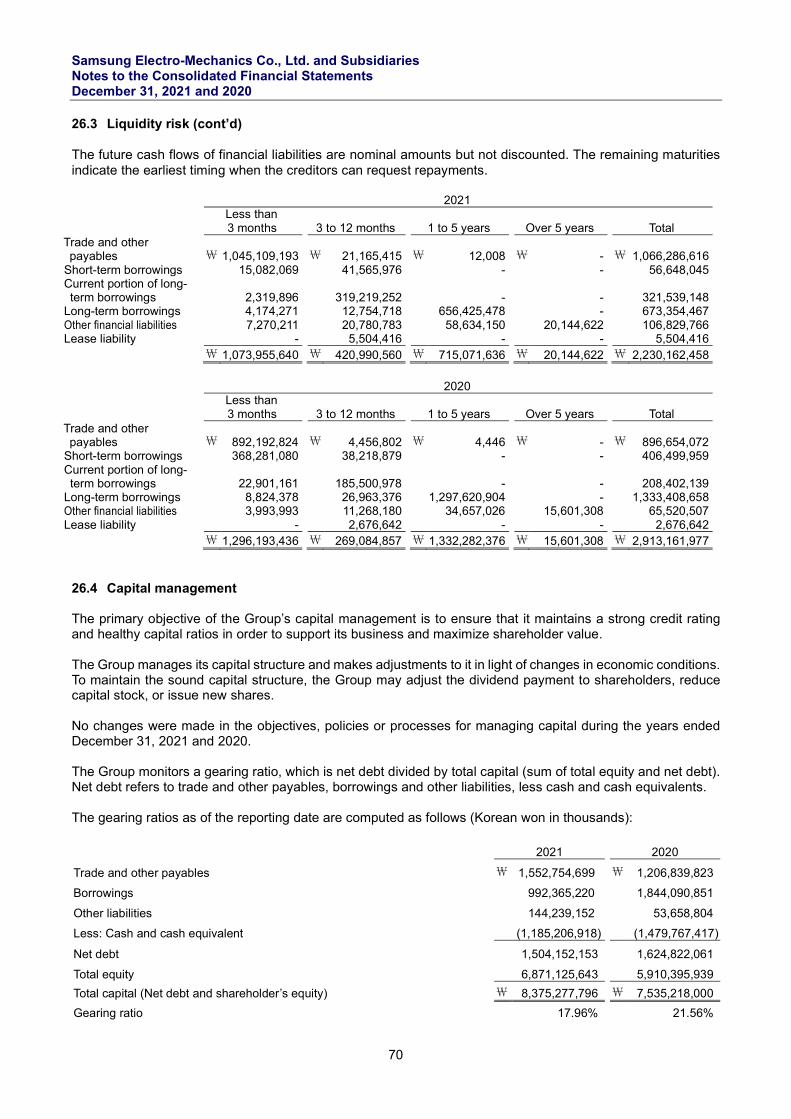
Samsung Electro-Mechanics Co., Ltd. and Subsidiaries Notes to the Consolidated Financial Statements December 31, 2021 and 2020
70
26.3 Liquidity risk (cont’d) The future cash flows of financial liabilities are nominal amounts but not discounted. The remaining maturities indicate the earliest timing when the creditors can request repayments.
2021
Less than 3 months 3 to 12 months 1 to 5 years Over 5 years Total
Trade and other payables \ 1,045,109,193 \ 21,165,415 \ 12,008 \ - \ 1,066,286,616
Short-term borrowings 15,082,069 41,565,976 - - 56,648,045 Current portion of long-term borrowings 2,319,896 319,219,252 - - 321,539,148
Long-term borrowings 4,174,271 12,754,718 656,425,478 - 673,354,467 Other financial liabilities 7,270,211 20,780,783 58,634,150 20,144,622 106,829,766 Lease liability - 5,504,416 - - 5,504,416 \ 1,073,955,640 \ 420,990,560 \ 715,071,636 \ 20,144,622 \ 2,230,162,458
2020
Less than 3 months 3 to 12 months 1 to 5 years Over 5 years Total
Trade and other payables \ 892,192,824 \ 4,456,802 \ 4,446 \ - \ 896,654,072
Short-term borrowings 368,281,080 38,218,879 - - 406,499,959 Current portion of long-term borrowings 22,901,161 185,500,978 - - 208,402,139
Long-term borrowings 8,824,378 26,963,376 1,297,620,904 - 1,333,408,658 Other financial liabilities 3,993,993 11,268,180 34,657,026 15,601,308 65,520,507 Lease liability - 2,676,642 - - 2,676,642 \ 1,296,193,436 \ 269,084,857 \ 1,332,282,376 \ 15,601,308 \ 2,913,161,977
26.4 Capital management The primary objective of the Group’s capital management is to ensure that it maintains a strong credit rating and healthy capital ratios in order to support its business and maximize shareholder value. The Group manages its capital structure and makes adjustments to it in light of changes in economic conditions. To maintain the sound capital structure, the Group may adjust the dividend payment to shareholders, reduce capital stock, or issue new shares. No changes were made in the objectives, policies or processes for managing capital during the years ended December 31, 2021 and 2020. The Group monitors a gearing ratio, which is net debt divided by total capital (sum of total equity and net debt). Net debt refers to trade and other payables, borrowings and other liabilities, less cash and cash equivalents. The gearing ratios as of the reporting date are computed as follows (Korean won in thousands):
2021 2020
Trade and other payables ₩ 1,552,754,699 ₩ 1,206,839,823
Borrowings 992,365,220 1,844,090,851
Other liabilities 144,239,152 53,658,804
Less: Cash and cash equivalent (1,185,206,918) (1,479,767,417)
Net debt 1,504,152,153 1,624,822,061
Total equity 6,871,125,643 5,910,395,939
Total capital (Net debt and shareholder’s equity) ₩ 8,375,277,796 ₩ 7,535,218,000
Gearing ratio 17.96% 21.56%
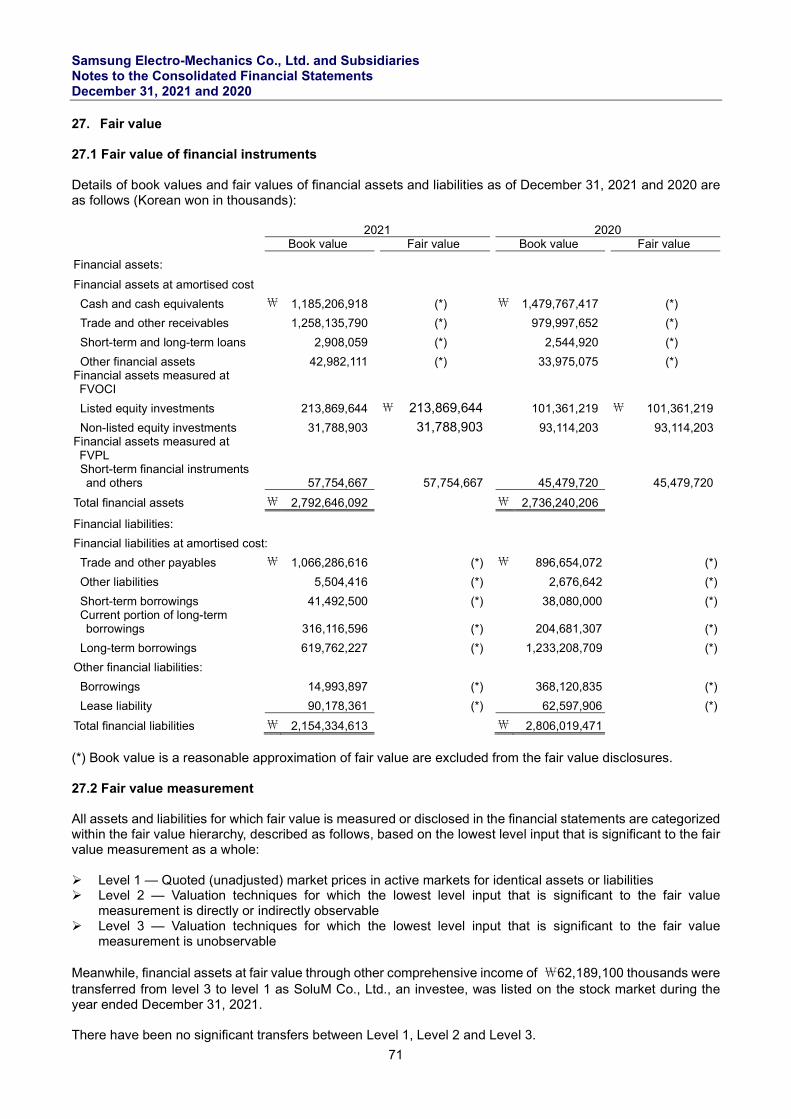
Samsung Electro-Mechanics Co., Ltd. and Subsidiaries Notes to the Consolidated Financial Statements December 31, 2021 and 2020
71
27. Fair value 27.1 Fair value of financial instruments Details of book values and fair values of financial assets and liabilities as of December 31, 2021 and 2020 are as follows (Korean won in thousands):
2021 2020 Book value Fair value Book value Fair value
Financial assets:
Financial assets at amortised cost
Cash and cash equivalents ₩ 1,185,206,918 (*) ₩ 1,479,767,417 (*)
Trade and other receivables 1,258,135,790 (*) 979,997,652 (*)
Short-term and long-term loans 2,908,059 (*) 2,544,920 (*)
Other financial assets 42,982,111 (*) 33,975,075 (*) Financial assets measured at FVOCI
Listed equity investments 213,869,644 ₩ 213,869,644 101,361,219 ₩ 101,361,219
Non-listed equity investments 31,788,903 31,788,903 93,114,203 93,114,203 Financial assets measured at FVPL
Short-term financial instruments and others
57,754,667 57,754,667 45,479,720 45,479,720
Total financial assets ₩ 2,792,646,092 ₩ 2,736,240,206
Financial liabilities:
Financial liabilities at amortised cost:
Trade and other payables ₩ 1,066,286,616 (*) ₩ 896,654,072 (*)
Other liabilities 5,504,416 (*) 2,676,642 (*)
Short-term borrowings 41,492,500 (*) 38,080,000 (*) Current portion of long-term borrowings
316,116,596 (*) 204,681,307 (*)
Long-term borrowings 619,762,227 (*) 1,233,208,709 (*)
Other financial liabilities: Borrowings 14,993,897 (*) 368,120,835 (*)
Lease liability 90,178,361 (*) 62,597,906 (*)
Total financial liabilities ₩ 2,154,334,613 ₩ 2,806,019,471
(*) Book value is a reasonable approximation of fair value are excluded from the fair value disclosures. 27.2 Fair value measurement All assets and liabilities for which fair value is measured or disclosed in the financial statements are categorized within the fair value hierarchy, described as follows, based on the lowest level input that is significant to the fair value measurement as a whole: Level 1 — Quoted (unadjusted) market prices in active markets for identical assets or liabilities Level 2 — Valuation techniques for which the lowest level input that is significant to the fair value
measurement is directly or indirectly observable Level 3 — Valuation techniques for which the lowest level input that is significant to the fair value
measurement is unobservable Meanwhile, financial assets at fair value through other comprehensive income of ₩62,189,100 thousands were transferred from level 3 to level 1 as SoluM Co., Ltd., an investee, was listed on the stock market during the year ended December 31, 2021. There have been no significant transfers between Level 1, Level 2 and Level 3.
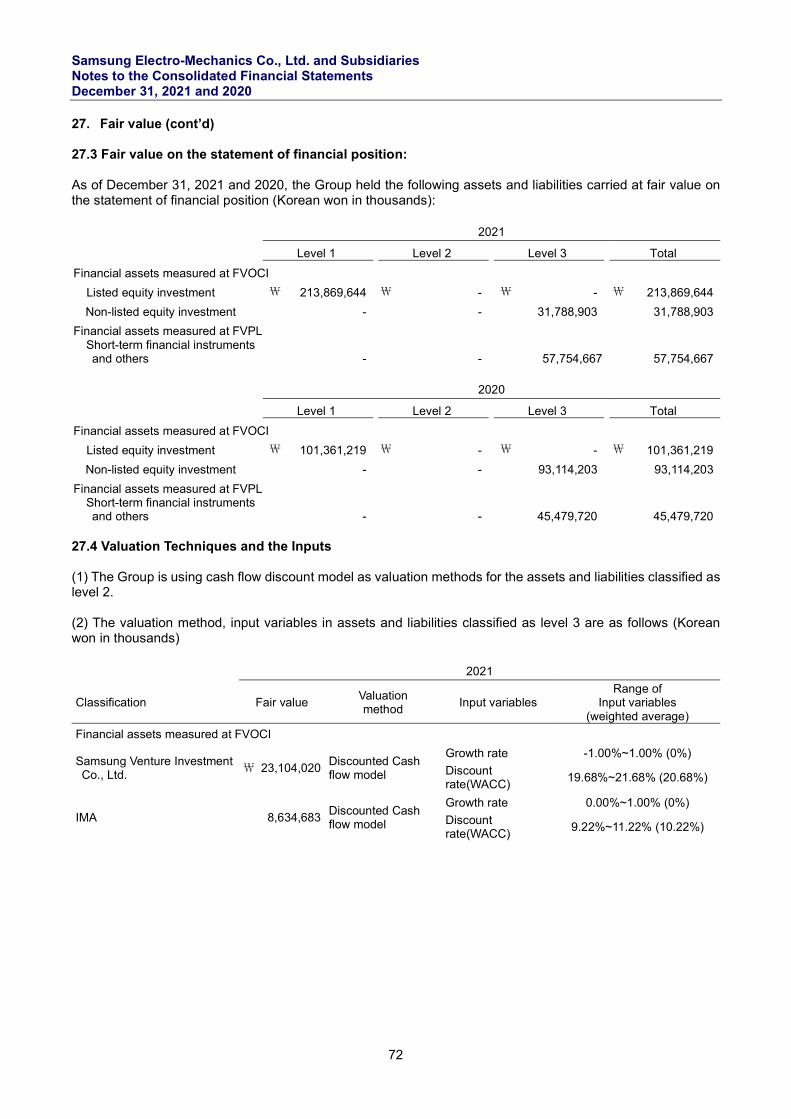
Samsung Electro-Mechanics Co., Ltd. and Subsidiaries Notes to the Consolidated Financial Statements December 31, 2021 and 2020
72
27. Fair value (cont’d) 27.3 Fair value on the statement of financial position: As of December 31, 2021 and 2020, the Group held the following assets and liabilities carried at fair value on the statement of financial position (Korean won in thousands):
2021
Level 1 Level 2
Level 3 Total
Financial assets measured at FVOCI
Listed equity investment ₩ 213,869,644 ₩ - ₩ - ₩ 213,869,644
Non-listed equity investment - - 31,788,903 31,788,903
Financial assets measured at FVPL Short-term financial instruments
and others
- - 57,754,667 57,754,667
2020
Level 1 Level 2
Level 3 Total
Financial assets measured at FVOCI
Listed equity investment ₩ 101,361,219 ₩ - ₩ - ₩ 101,361,219
Non-listed equity investment - - 93,114,203 93,114,203
Financial assets measured at FVPL Short-term financial instruments
and others
- - 45,479,720 45,479,720 27.4 Valuation Techniques and the Inputs (1) The Group is using cash flow discount model as valuation methods for the assets and liabilities classified as level 2. (2) The valuation method, input variables in assets and liabilities classified as level 3 are as follows (Korean won in thousands) 2021
Classification Fair value Valuation method
Input variables Range of
Input variables (weighted average)
Financial assets measured at FVOCI
Samsung Venture Investment Co., Ltd.
₩ 23,104,020 Discounted Cash flow model
Growth rate -1.00%~1.00% (0%)
Discount rate(WACC)
19.68%~21.68% (20.68%)
IMA 8,634,683 Discounted Cash flow model
Growth rate 0.00%~1.00% (0%)
Discount rate(WACC)
9.22%~11.22% (10.22%)
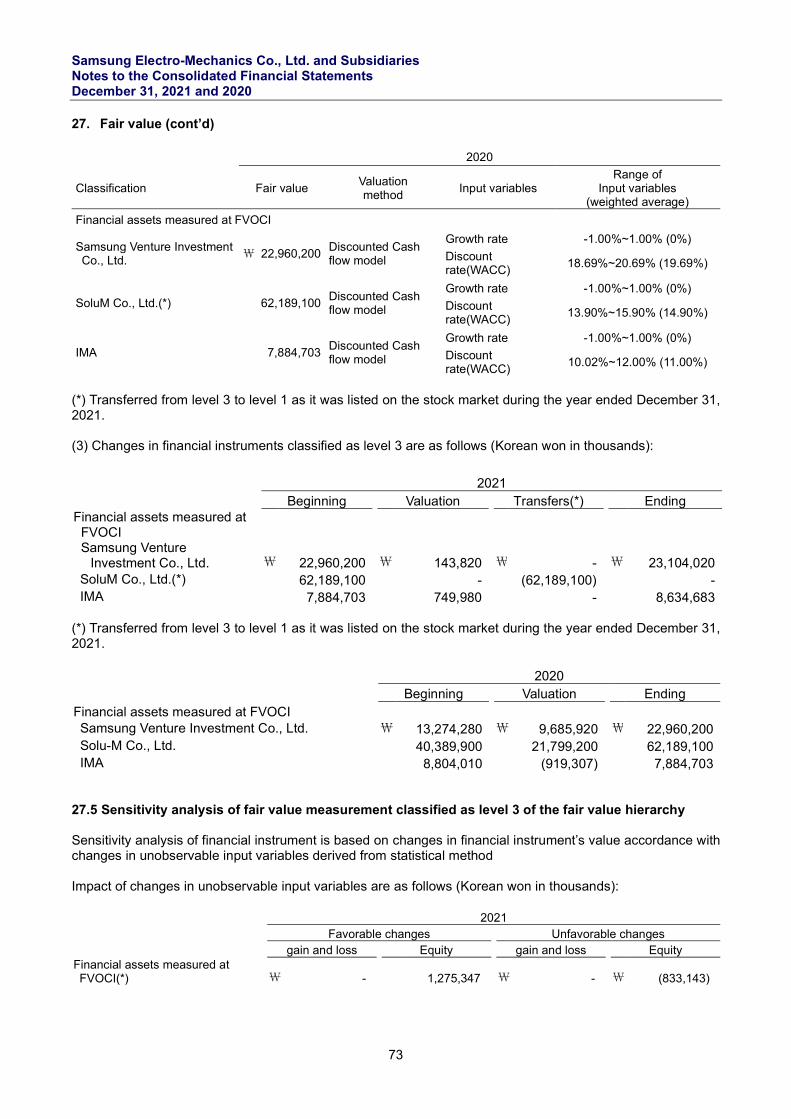
Samsung Electro-Mechanics Co., Ltd. and Subsidiaries Notes to the Consolidated Financial Statements December 31, 2021 and 2020
73
27. Fair value (cont’d) 2020
Classification Fair value Valuation method
Input variables Range of
Input variables (weighted average)
Financial assets measured at FVOCI
Samsung Venture Investment Co., Ltd.
₩ 22,960,200 Discounted Cash flow model
Growth rate -1.00%~1.00% (0%)
Discount rate(WACC)
18.69%~20.69% (19.69%)
SoluM Co., Ltd.(*) 62,189,100 Discounted Cash flow model
Growth rate -1.00%~1.00% (0%)
Discount rate(WACC)
13.90%~15.90% (14.90%)
IMA 7,884,703 Discounted Cash flow model
Growth rate -1.00%~1.00% (0%)
Discount rate(WACC)
10.02%~12.00% (11.00%)
(*) Transferred from level 3 to level 1 as it was listed on the stock market during the year ended December 31, 2021. (3) Changes in financial instruments classified as level 3 are as follows (Korean won in thousands):
(*) Transferred from level 3 to level 1 as it was listed on the stock market during the year ended December 31, 2021.
2020 Beginning Valuation Ending
Financial assets measured at FVOCI Samsung Venture Investment Co., Ltd. ₩ 13,274,280 ₩ 9,685,920 ₩ 22,960,200 Solu-M Co., Ltd. 40,389,900 21,799,200 62,189,100 IMA 8,804,010 (919,307) 7,884,703
27.5 Sensitivity analysis of fair value measurement classified as level 3 of the fair value hierarchy Sensitivity analysis of financial instrument is based on changes in financial instrument’s value accordance with changes in unobservable input variables derived from statistical method Impact of changes in unobservable input variables are as follows (Korean won in thousands):
2021 Favorable changes Unfavorable changes gain and loss Equity gain and loss Equity
Financial assets measured at FVOCI(*)
\ - 1,275,347 \ - \ (833,143)
2021 Beginning Valuation Transfers(*) Ending
Financial assets measured at FVOCI
Samsung Venture Investment Co., Ltd. ₩ 22,960,200 ₩ 143,820 ₩ -
₩ 23,104,020
SoluM Co., Ltd.(*) 62,189,100 - (62,189,100) - IMA 7,884,703 749,980 - 8,634,683
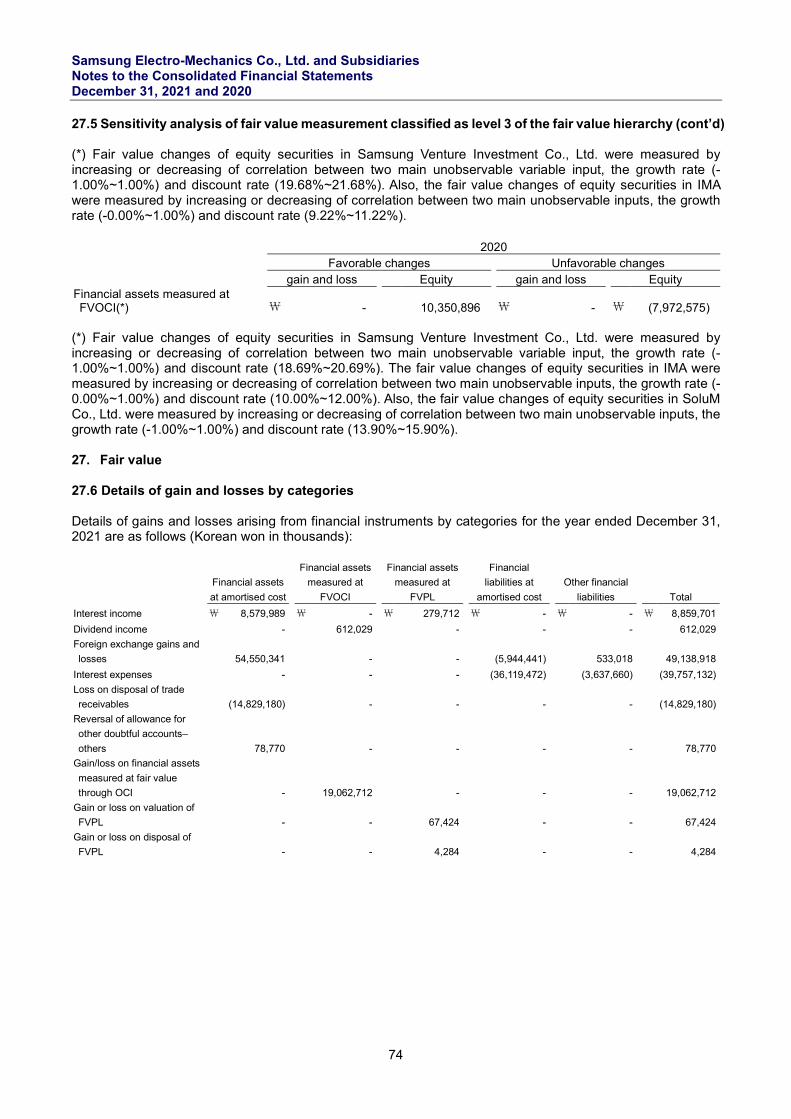
Samsung Electro-Mechanics Co., Ltd. and Subsidiaries Notes to the Consolidated Financial Statements December 31, 2021 and 2020
74
27.5 Sensitivity analysis of fair value measurement classified as level 3 of the fair value hierarchy (cont’d) (*) Fair value changes of equity securities in Samsung Venture Investment Co., Ltd. were measured by increasing or decreasing of correlation between two main unobservable variable input, the growth rate (-1.00%~1.00%) and discount rate (19.68%~21.68%). Also, the fair value changes of equity securities in IMA were measured by increasing or decreasing of correlation between two main unobservable inputs, the growth rate (-0.00%~1.00%) and discount rate (9.22%~11.22%).
2020 Favorable changes Unfavorable changes gain and loss Equity gain and loss Equity
Financial assets measured at FVOCI(*)
\ - 10,350,896 \ - \ (7,972,575)
(*) Fair value changes of equity securities in Samsung Venture Investment Co., Ltd. were measured by increasing or decreasing of correlation between two main unobservable variable input, the growth rate (-1.00%~1.00%) and discount rate (18.69%~20.69%). The fair value changes of equity securities in IMA were measured by increasing or decreasing of correlation between two main unobservable inputs, the growth rate (-0.00%~1.00%) and discount rate (10.00%~12.00%). Also, the fair value changes of equity securities in SoluM Co., Ltd. were measured by increasing or decreasing of correlation between two main unobservable inputs, the growth rate (-1.00%~1.00%) and discount rate (13.90%~15.90%). 27. Fair value 27.6 Details of gain and losses by categories Details of gains and losses arising from financial instruments by categories for the year ended December 31, 2021 are as follows (Korean won in thousands):
Financial assets
at amortised cost
Financial assets
measured at
FVOCI
Financial assets
measured at
FVPL
Financial
liabilities at
amortised cost
Other financial
liabilities Total
Interest income ₩ 8,579,989 ₩ - ₩ 279,712 ₩ - ₩ - ₩ 8,859,701
Dividend income - 612,029 - - - 612,029
Foreign exchange gains and
losses 54,550,341 - - (5,944,441) 533,018 49,138,918
Interest expenses - - - (36,119,472) (3,637,660) (39,757,132)
Loss on disposal of trade
receivables (14,829,180) - - - - (14,829,180)
Reversal of allowance for
other doubtful accounts–
others 78,770 - - - - 78,770
Gain/loss on financial assets
measured at fair value
through OCI - 19,062,712 - - - 19,062,712
Gain or loss on valuation of
FVPL - - 67,424 - - 67,424
Gain or loss on disposal of
FVPL - - 4,284 - - 4,284
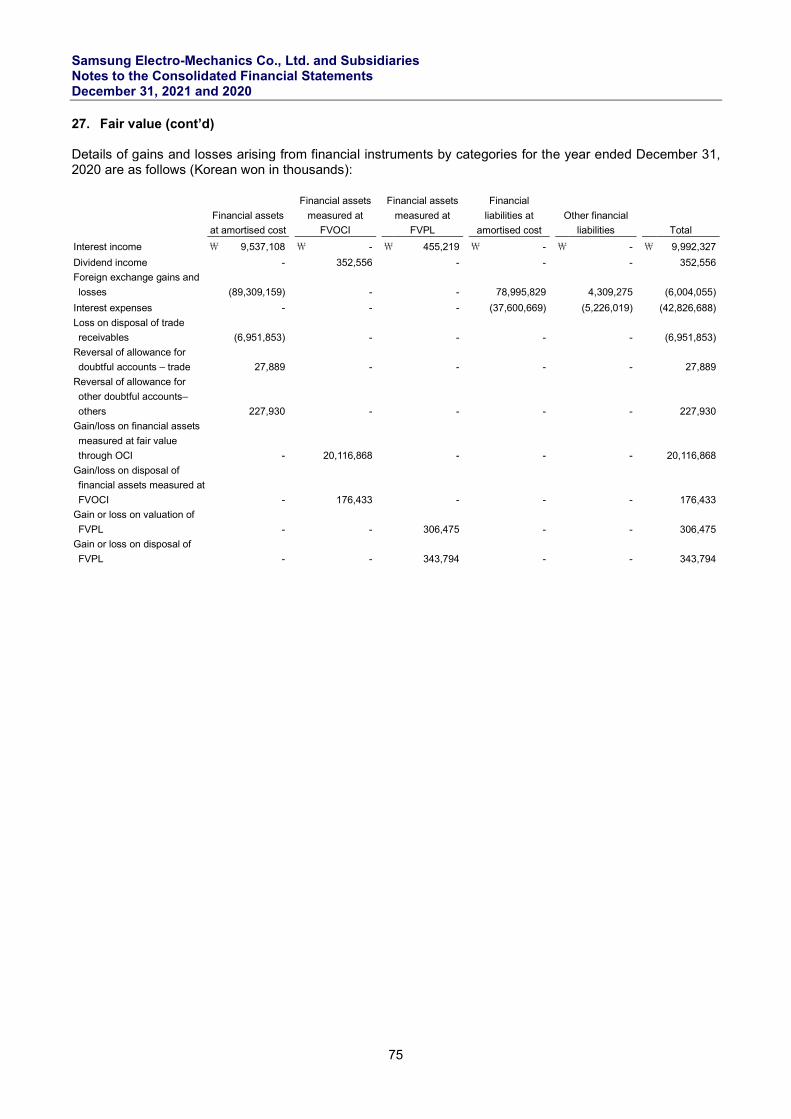
Samsung Electro-Mechanics Co., Ltd. and Subsidiaries Notes to the Consolidated Financial Statements December 31, 2021 and 2020
75
27. Fair value (cont’d) Details of gains and losses arising from financial instruments by categories for the year ended December 31, 2020 are as follows (Korean won in thousands):
Financial assets
at amortised cost
Financial assets
measured at
FVOCI
Financial assets
measured at
FVPL
Financial
liabilities at
amortised cost
Other financial
liabilities Total
Interest income ₩ 9,537,108 ₩ - ₩ 455,219 ₩ - ₩ - ₩ 9,992,327
Dividend income - 352,556 - - - 352,556
Foreign exchange gains and
losses (89,309,159) - - 78,995,829 4,309,275 (6,004,055)
Interest expenses - - - (37,600,669) (5,226,019) (42,826,688)
Loss on disposal of trade
receivables (6,951,853) - - - - (6,951,853)
Reversal of allowance for
doubtful accounts – trade 27,889 - - - - 27,889
Reversal of allowance for
other doubtful accounts–
others 227,930 - - - - 227,930
Gain/loss on financial assets
measured at fair value
through OCI - 20,116,868 - - - 20,116,868
Gain/loss on disposal of
financial assets measured at
FVOCI - 176,433 - - - 176,433
Gain or loss on valuation of
FVPL - - 306,475 - - 306,475
Gain or loss on disposal of
FVPL - - 343,794 - - 343,794
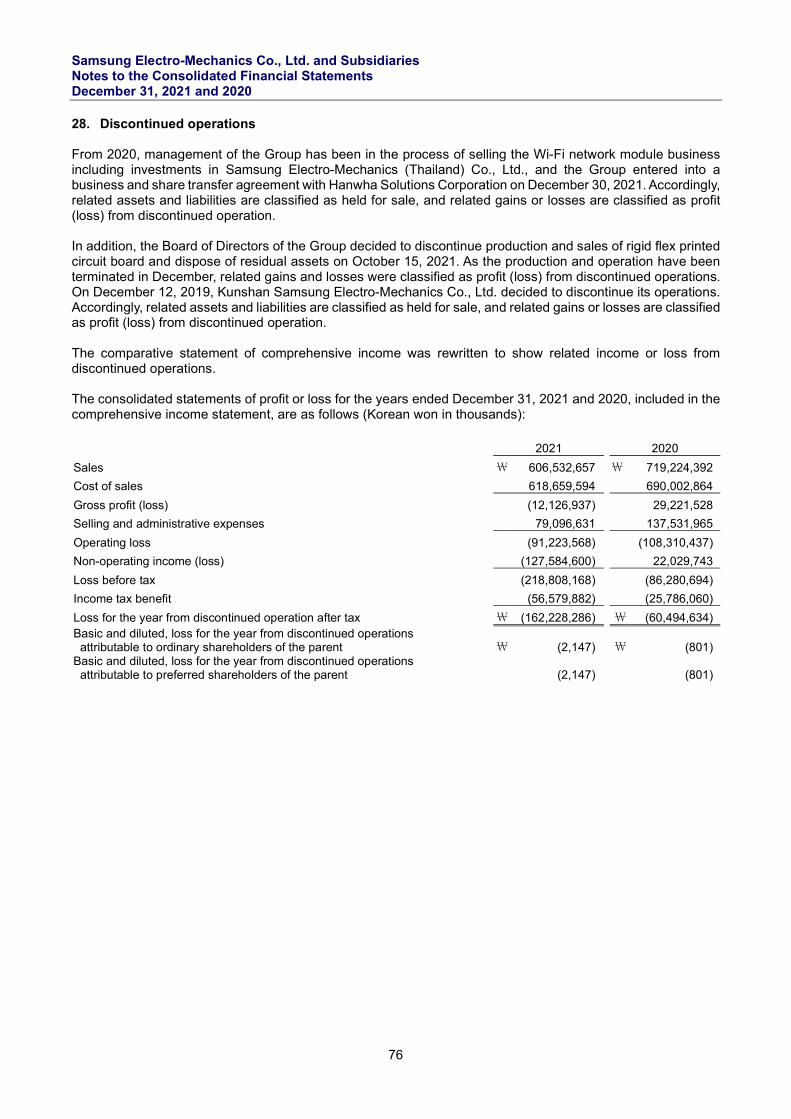
Samsung Electro-Mechanics Co., Ltd. and Subsidiaries Notes to the Consolidated Financial Statements December 31, 2021 and 2020
76
28. Discontinued operations From 2020, management of the Group has been in the process of selling the Wi-Fi network module business including investments in Samsung Electro-Mechanics (Thailand) Co., Ltd., and the Group entered into a business and share transfer agreement with Hanwha Solutions Corporation on December 30, 2021. Accordingly, related assets and liabilities are classified as held for sale, and related gains or losses are classified as profit (loss) from discontinued operation. In addition, the Board of Directors of the Group decided to discontinue production and sales of rigid flex printed circuit board and dispose of residual assets on October 15, 2021. As the production and operation have been terminated in December, related gains and losses were classified as profit (loss) from discontinued operations. On December 12, 2019, Kunshan Samsung Electro-Mechanics Co., Ltd. decided to discontinue its operations. Accordingly, related assets and liabilities are classified as held for sale, and related gains or losses are classified as profit (loss) from discontinued operation. The comparative statement of comprehensive income was rewritten to show related income or loss from discontinued operations. The consolidated statements of profit or loss for the years ended December 31, 2021 and 2020, included in the comprehensive income statement, are as follows (Korean won in thousands): 2021 2020
Sales \ 606,532,657 \ 719,224,392
Cost of sales 618,659,594 690,002,864
Gross profit (loss) (12,126,937) 29,221,528
Selling and administrative expenses 79,096,631 137,531,965
Operating loss (91,223,568) (108,310,437)
Non-operating income (loss) (127,584,600) 22,029,743
Loss before tax (218,808,168) (86,280,694)
Income tax benefit (56,579,882) (25,786,060)
Loss for the year from discontinued operation after tax \ (162,228,286) \ (60,494,634) Basic and diluted, loss for the year from discontinued operations
attributable to ordinary shareholders of the parent \ (2,147) \ (801)
Basic and diluted, loss for the year from discontinued operations attributable to preferred shareholders of the parent
(2,147) (801)
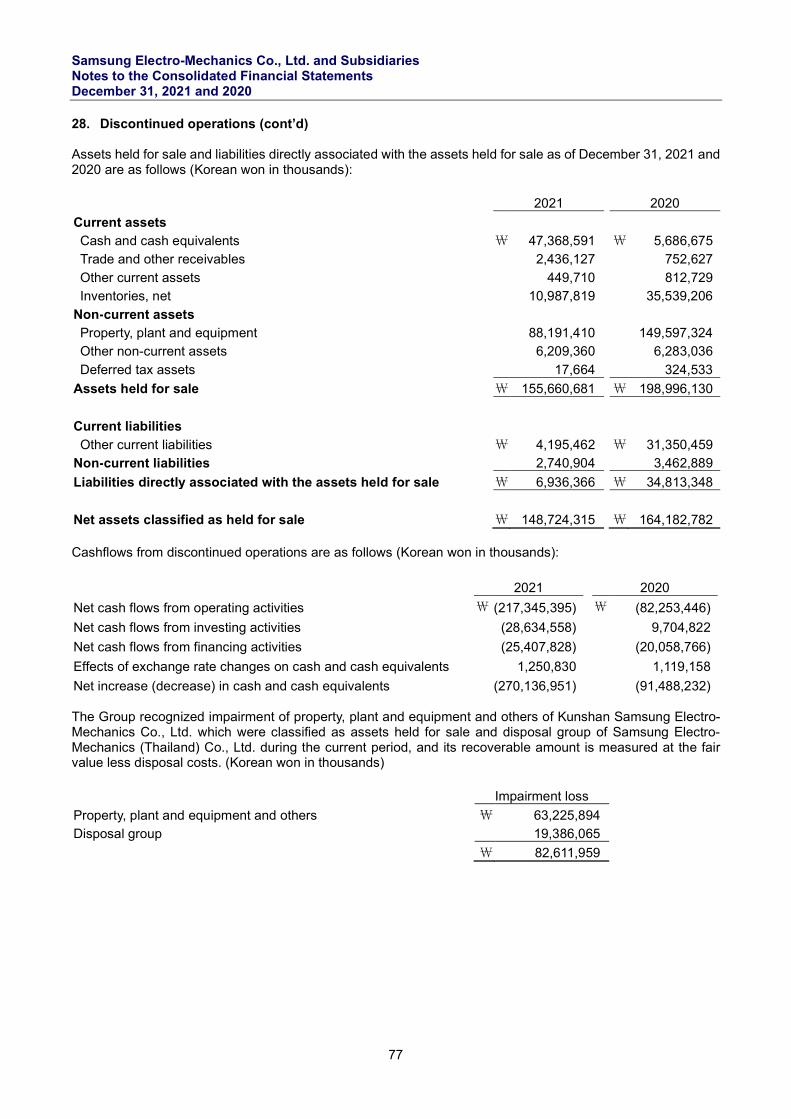
Samsung Electro-Mechanics Co., Ltd. and Subsidiaries Notes to the Consolidated Financial Statements December 31, 2021 and 2020
77
28. Discontinued operations (cont’d) Assets held for sale and liabilities directly associated with the assets held for sale as of December 31, 2021 and 2020 are as follows (Korean won in thousands): 2021 2020
Current assets Cash and cash equivalents \ 47,368,591 \ 5,686,675 Trade and other receivables 2,436,127 752,627
Other current assets 449,710 812,729 Inventories, net 10,987,819 35,539,206
Non-current assets Property, plant and equipment 88,191,410 149,597,324 Other non-current assets 6,209,360 6,283,036
Deferred tax assets 17,664 324,533
Assets held for sale \ 155,660,681 \ 198,996,130
Current liabilities
Other current liabilities \ 4,195,462 \ 31,350,459 Non-current liabilities 2,740,904 3,462,889
Liabilities directly associated with the assets held for sale \ 6,936,366 \ 34,813,348
Net assets classified as held for sale \ 148,724,315 \ 164,182,782 Cashflows from discontinued operations are as follows (Korean won in thousands):
The Group recognized impairment of property, plant and equipment and others of Kunshan Samsung Electro-Mechanics Co., Ltd. which were classified as assets held for sale and disposal group of Samsung Electro-Mechanics (Thailand) Co., Ltd. during the current period, and its recoverable amount is measured at the fair value less disposal costs. (Korean won in thousands) Impairment loss
Property, plant and equipment and others \ 63,225,894 Disposal group 19,386,065
\ 82,611,959
2021 2020
Net cash flows from operating activities ₩ (217,345,395) ₩ (82,253,446)
Net cash flows from investing activities (28,634,558) 9,704,822
Net cash flows from financing activities (25,407,828) (20,058,766)
Effects of exchange rate changes on cash and cash equivalents 1,250,830 1,119,158
Net increase (decrease) in cash and cash equivalents (270,136,951) (91,488,232)
Related Documents