Sampling Technique s Quadrats

Sampling Techniques Quadrats. Sampling The best way to get information about a particular ecosystem would be to count every individual of every species.
Dec 16, 2015
Welcome message from author
This document is posted to help you gain knowledge. Please leave a comment to let me know what you think about it! Share it to your friends and learn new things together.
Transcript

Sampling Techniques
Quadrats
Sampling
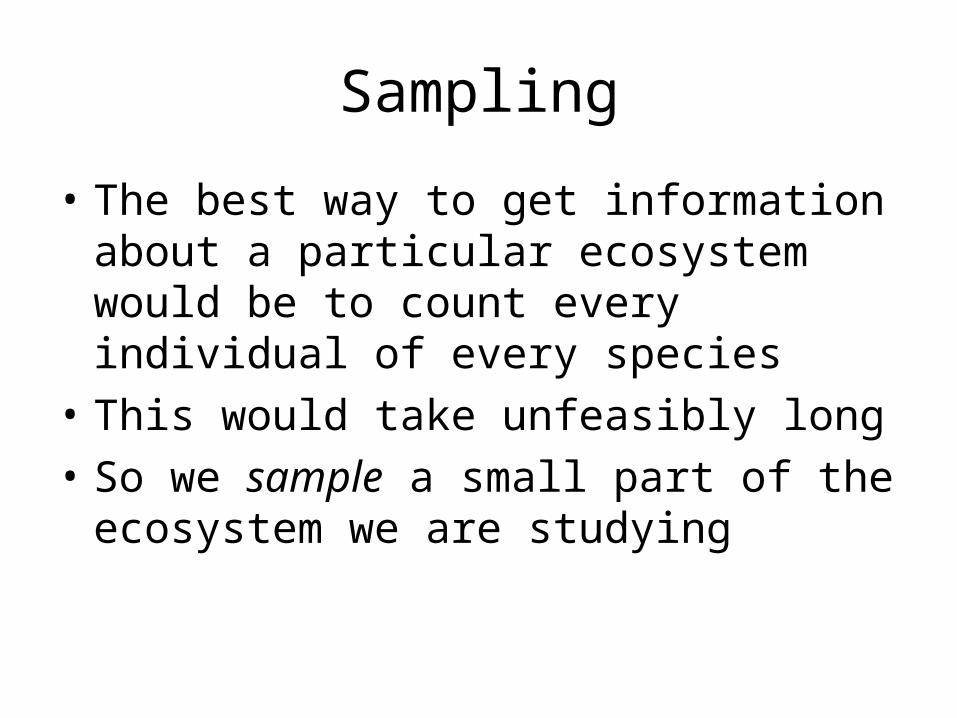
• The best way to get information about a particular ecosystem would be to count every individual of every species
• This would take unfeasibly long
• So we sample a small part of the ecosystem we are studying

Quadrats
• A square of known size used to sample the ground-living (sessile) organisms in an ecosystem
• Traditionally used to count plants in a particular area
• Can be used to study changes over distance

Counting with quadrats
• Best done in reasonably uniform ecosystems, e.g. grassland
• Many need to be placed randomly• Averages worked out• Multiplied by area/quadrat size• Works well for common species• Rare species are usually underestimated or
occasionally grossly overestimated• Suggest why? (Imagine using quadrats to count trees on the
grass outside business and no, it’s not because they wouldn’t fit over the top.)
Placing quadrats randomly
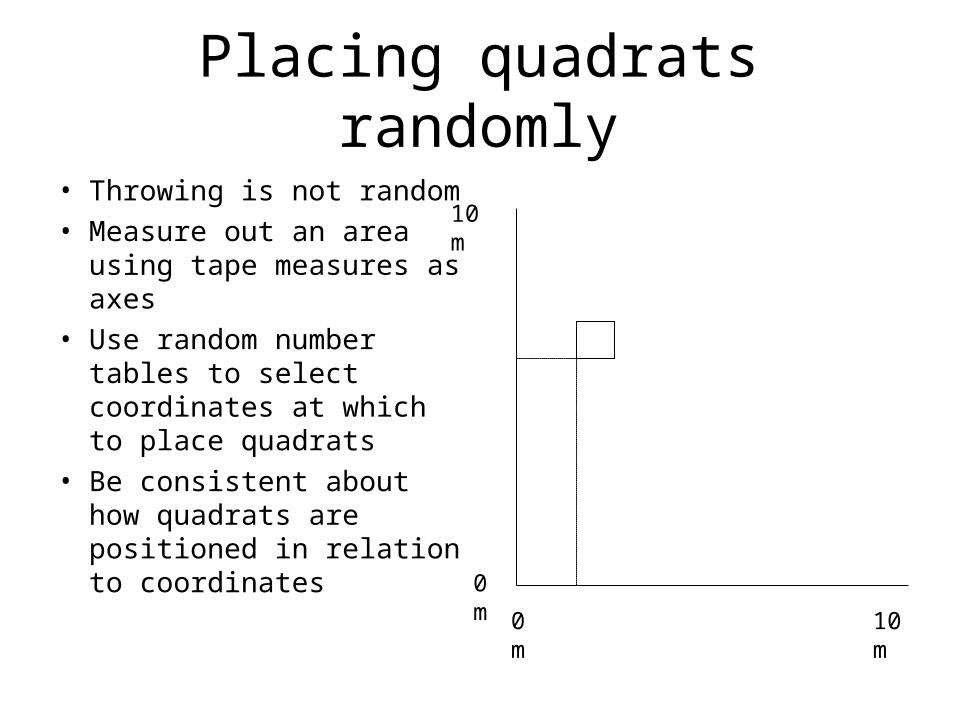
• Throwing is not random• Measure out an area
using tape measures as axes
• Use random number tables to select coordinates at which to place quadrats
• Be consistent about how quadrats are positioned in relation to coordinates
10 m0 m
10 m
0 m

Measuring changes
• Studying how the environment changes over a distance is done using a transect
• A tape measure is placed in a line• Quadrats are placed at
standardized distances along the line
• Quadrats laid adjacent to each other along the line is called a belt transect
• Quadrats at intervals (e.g. 5 m) is called an interrupted transect
• Again, placement of the quadrat in relation to the measurement on the tape needs to be standardized beforehand, e.g. bottom left corner of quadrat on tape.

Ways of counting what’s in a quadrat
1. Subjective rating
2. Percentage cover
3. Percentage frequency
4. Species density
• Increasing accuracy• Decreasing speed
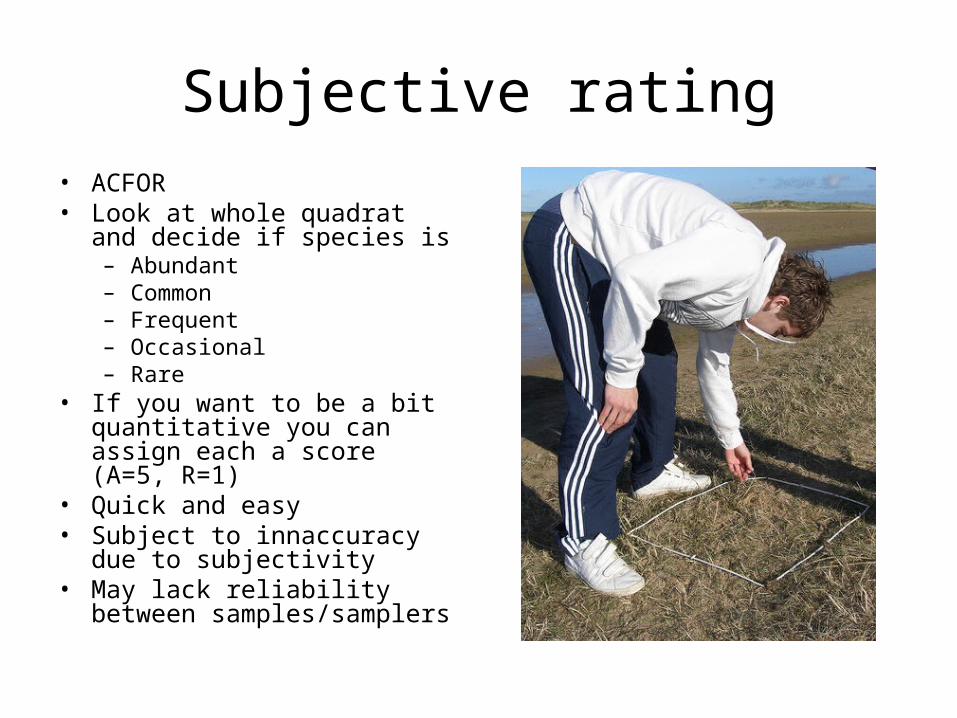
Subjective rating• ACFOR• Look at whole quadrat and
decide if species is– Abundant– Common– Frequent– Occasional– Rare
• If you want to be a bit quantitative you can assign each a score (A=5, R=1)
• Quick and easy• Subject to innaccuracy due to
subjectivity• May lack reliability between
samples/samplers
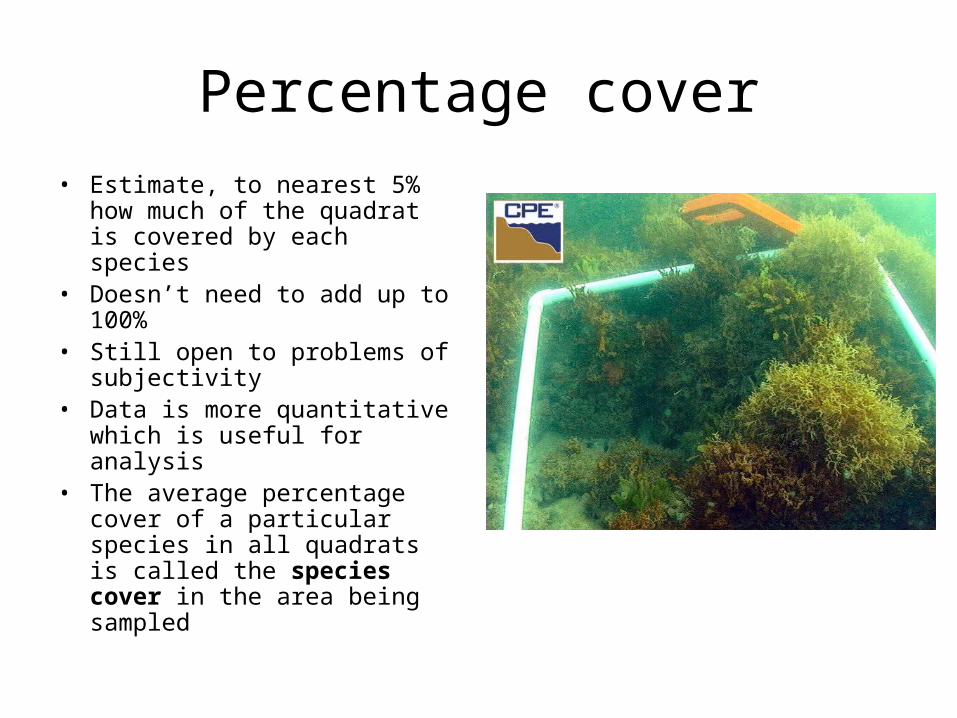
Percentage cover
• Estimate, to nearest 5% how much of the quadrat is covered by each species
• Doesn’t need to add up to 100%
• Still open to problems of subjectivity
• Data is more quantitative which is useful for analysis
• The average percentage cover of a particular species in all quadrats is called the species cover in the area being sampled

Species frequency/percentage frequency
• Needs a grid-type quadrat (25 mini squares)
• Count how many squares the species appears in
• Multiply by 4 to get %• Much more objective and
therefore reliable• Tends to produce an
overestimate, therefore inaccurate
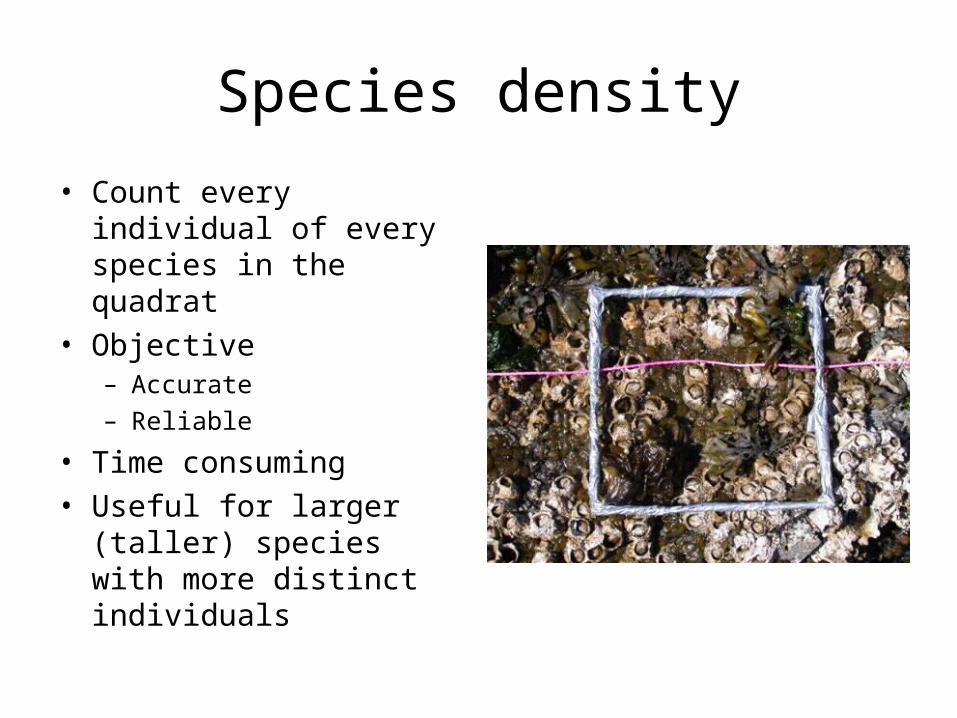
Species density
• Count every individual of every species in the quadrat
• Objective– Accurate– Reliable
• Time consuming• Useful for larger (taller)
species with more distinct individuals
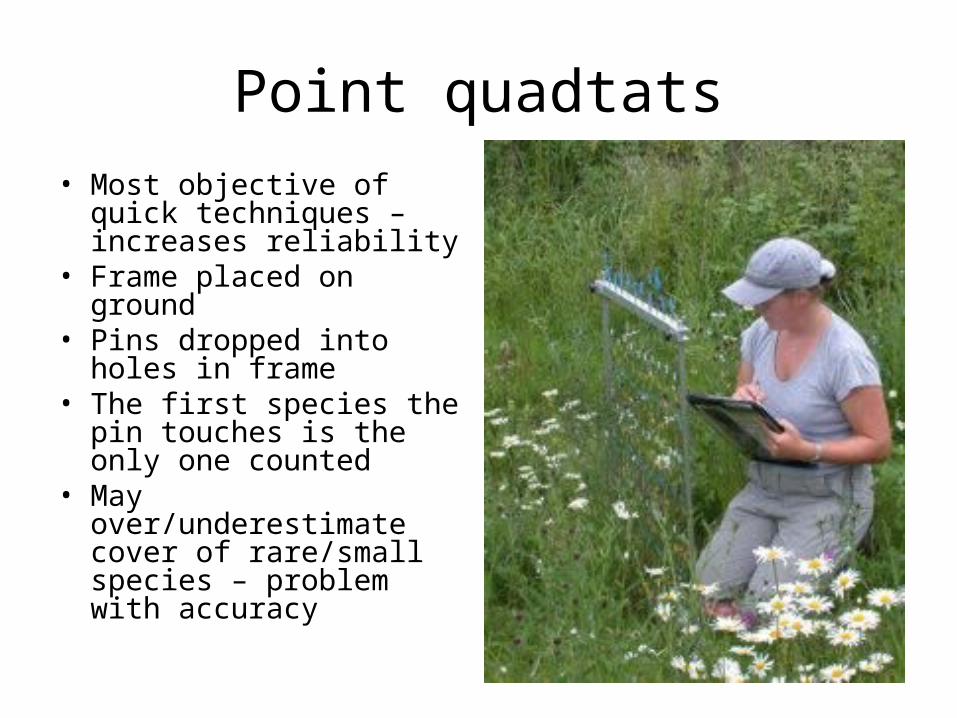
Point quadtats
• Most objective of quick techniques – increases reliability
• Frame placed on ground• Pins dropped into holes in
frame• The first species the pin
touches is the only one counted
• May over/underestimate cover of rare/small species – problem with accuracy
Related Documents