Article Rev Bras Cienc Solo 2017;41:e0160426 1 https://doi.org/10.1590/18069657rbcs20160426 * Corresponding author: E-mail: [email protected] Received: September 20, 2016 Approved: December 13, 2016 How to cite: Santos EOJ, Gontijo I, Silva MB, Partelli FL. Sampling design of soil physical properties in a conilon coffee field. Rev Bras Cienc Solo. 2017;41:e0160426. https://doi.org/10.1590/18069657rbcs20160426 Copyright: This is an open-access article distributed under the terms of the Creative Commons Attribution License, which permits unrestricted use, distribution, and reproduction in any medium, provided that the original author and source are credited. Sampling Design of Soil Physical Properties in a Conilon Coffee Field Eduardo Oliveira de Jesus Santos (1) , Ivoney Gontijo (2)* , Marcelo Barreto da Silva (2) and Fábio Luiz Partelli (2) (1) Instituto de Defesa Agropecuária e Florestal do Espírito Santo, Pedro Canário, Espírito Santo, Brasil. (2) Universidade Federal do Espírito Santo, Centro Universitário Norte do Espírito Santo, Departamento de Ciências Agrárias e Biológicas, São Mateus, Espírito Santo, Brasil. ABSTRACT: Establishing the number of samples required to determine values of soil physical properties ultimately results in optimization of labor and allows better representation of such attributes. The objective of this study was to analyze the spatial variability of soil physical properties in a Conilon coffee field and propose a soil sampling method better attuned to conditions of the management system. The experiment was performed in a Conilon coffee field in Espírito Santo state, Brazil, under a 3.0 × 2.0 × 1.0 m (4,000 plants ha -1 ) double spacing design. An irregular grid, with dimensions of 107 × 95.7 m and 65 sampling points, was set up. Soil samples were collected from the 0.00-0.20 m depth from each sampling point. Data were analyzed under descriptive statistical and geostatistical methods. Using statistical parameters, the adequate number of samples for analyzing the attributes under study was established, which ranged from 1 to 11 sampling points. With the exception of particle density, all soil physical properties showed a spatial dependence structure best fitted to the spherical model. Establishment of the number of samples and spatial variability for the physical properties of soils may be useful in developing sampling strategies that minimize costs for farmers within a tolerable and predictable level of error. Keywords: Coffea canephora, geostatistics, soil sampling. Division – Soil Processes and Properties | Commission – Soil Physics

Welcome message from author
This document is posted to help you gain knowledge. Please leave a comment to let me know what you think about it! Share it to your friends and learn new things together.
Transcript
ArticleRev Bras Cienc Solo 2017;41:e0160426
1https://doi.org/10.1590/18069657rbcs20160426
* Corresponding author: E-mail: [email protected]
Received: September 20, 2016Approved: December 13, 2016
How to cite: Santos EOJ, Gontijo I, Silva MB, Partelli FL. Sampling design of soil physical properties in a conilon coffee field. Rev Bras Cienc Solo. 2017;41:e0160426. https://doi.org/10.1590/18069657rbcs20160426
Copyright: This is an open-access article distributed under the terms of the Creative Commons Attribution License, which permits unrestricted use, distribution, and reproduction in any medium, provided that the original author and source are credited.
Sampling Design of Soil Physical Properties in a Conilon Coffee FieldEduardo Oliveira de Jesus Santos(1), Ivoney Gontijo(2)*, Marcelo Barreto da Silva(2) and Fábio Luiz Partelli(2)
(1) Instituto de Defesa Agropecuária e Florestal do Espírito Santo, Pedro Canário, Espírito Santo, Brasil.(2) Universidade Federal do Espírito Santo, Centro Universitário Norte do Espírito Santo, Departamento de
Ciências Agrárias e Biológicas, São Mateus, Espírito Santo, Brasil.
ABSTRACT: Establishing the number of samples required to determine values of soil physical properties ultimately results in optimization of labor and allows better representation of such attributes. The objective of this study was to analyze the spatial variability of soil physical properties in a Conilon coffee field and propose a soil sampling method better attuned to conditions of the management system. The experiment was performed in a Conilon coffee field in Espírito Santo state, Brazil, under a 3.0 × 2.0 × 1.0 m (4,000 plants ha-1) double spacing design. An irregular grid, with dimensions of 107 × 95.7 m and 65 sampling points, was set up. Soil samples were collected from the 0.00-0.20 m depth from each sampling point. Data were analyzed under descriptive statistical and geostatistical methods. Using statistical parameters, the adequate number of samples for analyzing the attributes under study was established, which ranged from 1 to 11 sampling points. With the exception of particle density, all soil physical properties showed a spatial dependence structure best fitted to the spherical model. Establishment of the number of samples and spatial variability for the physical properties of soils may be useful in developing sampling strategies that minimize costs for farmers within a tolerable and predictable level of error.
Keywords: Coffea canephora, geostatistics, soil sampling.
Division – Soil Processes and Properties | Commission – Soil Physics
Santos et al. Sampling design of soil physical properties in a conilon coffee field...
2Rev Bras Cienc Solo 2017;41:e0160426
INTRODUCTIONCurrently, Conilon coffee (Coffea canephora Pierre ex A. Froehner) farmers have embraced a modernization process through use of agricultural machinery and tractors to accomplish various management tasks such as soil conditioning, fertilization, chemical spraying, harvest, and other farming practices. However, inadequate soil management and intense agricultural machine traffic may result in a change in soil physical properties, leading to many problems, such as soil degradation and compaction (Berisso et al., 2013).
Crop yield is influenced by soil properties; the spatial pattern of yield could be the result of a corresponding variation in certain physical soil properties (Mzuku et al., 2005). Thus, determining a more efficient soil sampling design can help achieve more effective site-specific management and, consequently, increase crop yield.
The soil under study was within a region denominated as coastal plains. Soils within this region were previously studied by Duarte et al. (2000) and Melo et al. (2002) in the state of Espírito Santo. These authors reported the presence of primarily Ultisols and Oxisols, with particular properties such as low contents of Fe and the presence of a cohesive subsurface horizon.
Determination of soil physical properties is important for monitoring the development of a coffee field since these are primordial factors for the characterization of soil structural quality and a determining factor for increasing and preserving high yield areas, as well as for sustaining the practice of coffee farming. Spatial variation may occur even within homogeneous areas and across short distances, influencing the yield of Conilon coffee (Oliveira et al., 2009). In this respect, Gontijo et al. (2007) emphasize that during the traditional sampling process, sub-samples may end up being collected next to each other, thus duplicating information on the values attributed to the soil. Therefore, knowledge regarding the continuity of the spatial distribution between sub-samples, represented by the range, will allow the construction of independent datasets, enabling the use of classical statistics without restrictions.
The soil sampling process is one of the most important procedures in research programs and for monitoring agricultural crop development since there is no use in subjecting soil samples to rigorous and sophisticated analysis if they do not appropriately characterize the area where soil management will be performed (Chung et al., 1995). A representative sampling system is one which best characterizes the area under study yet is designed with the least number of sampling points so as to avoid overloading the sampling system. That way, descriptive statistics may help indicate an adequate number of sampling points to bring the variation in results down to an acceptable level (Rozane et al., 2011).
Due to variation in values of soil properties across the field area, rigorous criteria must be established during the sampling process, which will ultimately allow representative information to be extracted from a determined area by using adequate sampling methods (Montanari et al., 2012). In the case of descriptive statistics, which does not consider spatial dependence between sub-samples of a determined soil property, an excessive quantity of sub-samples may be collected in order to attain a desired precision. Therefore, knowledge of soil spatial variability by means of geostatistical methods is essential for guiding the sampling process, thus avoiding non-representative sampling (Gontijo et al., 2007).
The hypothesis of this study was that it is possible to determine a sampling design to efficiently characterize soil physical properties, associating better sampling representativeness with less sampling effort. The objective of this study was to analyze the spatial variability of soil physical properties in a Conilon coffee field and to propose a method for soil sampling which will better fit the conditions of the management system.
Santos et al. Sampling design of soil physical properties in a conilon coffee field...
3Rev Bras Cienc Solo 2017;41:e0160426
MATERIALS AND METHODSThe experimental area was located in a Conilon coffee field in the municipality of São Mateus, state of Espírito Santo, Brazil, at coordinates UTM 7935440 m latitude South and 384440 m longitude West, with mean altitude of 81 m, zone 24K datum WGS 1984. The region has a tropical climate, Aw according to Köppen’s classification system, with a dry winter and maximum rainfall during summer (Alvares et al., 2013). The annual mean temperature was 24.6 °C, with monthly mean values of 17.1 and 32.2 °C during the coldest and the hottest months of the year, respectively, and average cumulative rainfall of 1,296 mm (Incaper, 2016).
The soil was classified according to the U.S. Soil Taxonomy as a Typic Hapludox (Soil Survey Staff, 2010), with sandy clay loam texture and contents of clay, silt, and total sand of 231, 150, and 619 g kg-1, respectively.
The experimental area was planted to Conilon coffee of the ‘Bamburral’ genotype. The crop was established in 2010, using a 3.0 × 2.0 × 1.0 m (4,000 plants ha-1) double spacing between plants under a drip irrigation system, in an area previously planted to papaya. When coffee plantation was implemented, 1,500 kg ha-1 of dolomitic limestone was added to the soil, throughout the area. At the planting, for each meter of furrow, 5 kg of chicken manure were added, in addition to 100 g of simple superphosphate at the planting pit. After removal of a papaya crop in 2012, when the coffee field was 2 years old, the planted area received a fertigation system. Management of soil fertilization and liming was performed manually, following technical recommendations based on soil and leaf analyses according to Prezotti et al. (2007).
Weeds were controlled by manual hoeing and/or by herbicides applied with the aid of a 2,000 L capacity sprayer. Plant health was controlled according to the incidence of pests and diseases in the crop. To perform these agricultural operations, a tractor (front wheel assist) with an approximate weight of 1,620 kg, 7.00-18 front tires, 12.4-28 rear tires, 55 HP, and 45.6 power takeoff HP was used.
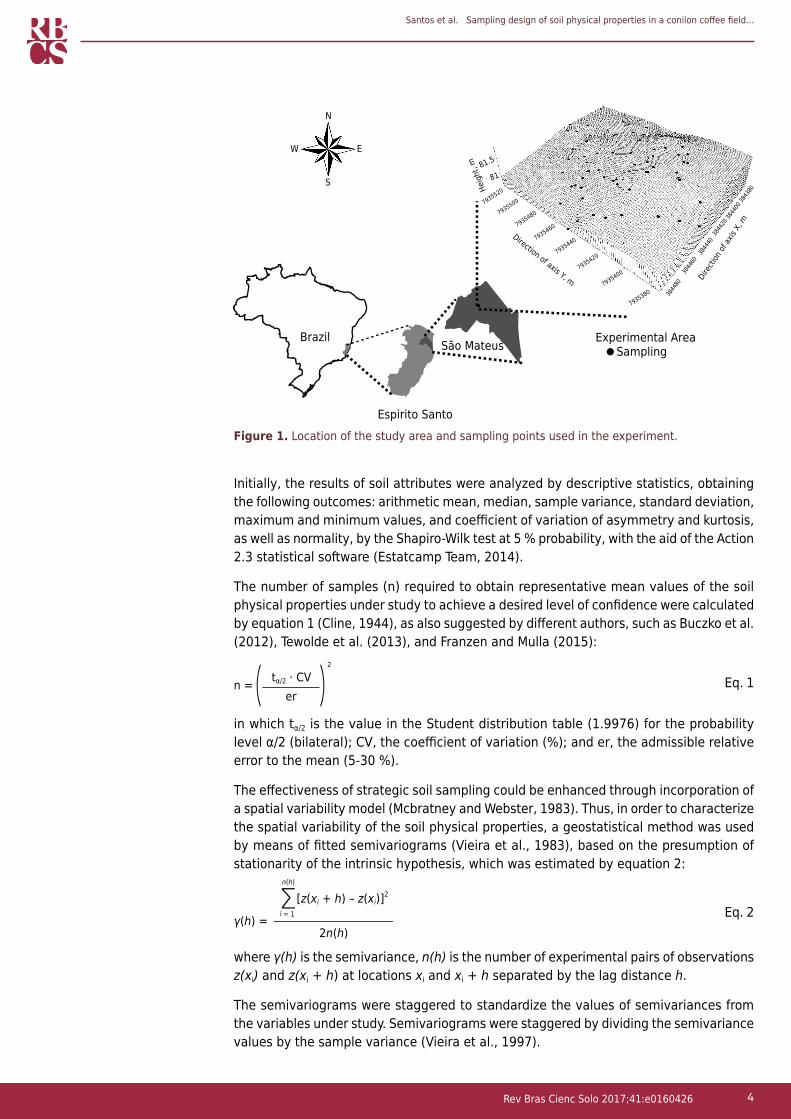
Undisturbed soil samples were collected in December 2013 using a stainless steel volumetric core, and disturbed samples were obtained with the aid of a probe sampler. Samples were collected from the area under the projection of the coffee tree canopy at a 0.00-0.20 m depth in an irregular grid of 107 × 95.7 m (10,240 m2), with 65 sampling points (Figure 1). The coordinates of each sampling point were defined with the aid of a pair of GPS TechGeo® receptors, model GTR G2 geodesic.
To determine soil microporosity (Mi), water content at field capacity (θCC), and permanent wilting point (θPMP) according to Donagema et al. (2011), undisturbed samples were saturated for a 48 h period by gradual addition of water to a plastic tray until achieving a level of ⅔ of the cores’ height and then weighed and subjected to tensions of 6 kPa in a Eijkelkamp® tension table and to 10 and 1,500 kPa in a Richards Soil Moisture® chamber with porous plate. Finally, samples were placed in a laboratory oven at 105 °C for 24 h to obtain values for the weight of dry soil.
Soil bulk density (BD), Mg m-3, was calculated by the ratio between the soil’s dry weight and the internal core volume. The total porosity (TP), in m3 m-3, was estimated by the ratio between BD and particle density (PD) through the equation TPV = [1 - (BD/PD)]. Soil macroporosity (Ma) was determined by the difference between TP and the soil microporosity (Mi). Disturbed samples were used to determine the PD (Mg m-3) by the volumetric flask method and the particle size fractions by the densimeter method. Physical analysis of the soil was performed and the values of the attributes were determined according to Donagema et al. (2011). Values of soil water storage capacity (SWSC) at the 0.00-0.20 m depth, expressed in mm, were calculated by the expression SWSC = [(θCC - θPMP) × BD × 200].
Santos et al. Sampling design of soil physical properties in a conilon coffee field...
4Rev Bras Cienc Solo 2017;41:e0160426
Initially, the results of soil attributes were analyzed by descriptive statistics, obtaining the following outcomes: arithmetic mean, median, sample variance, standard deviation, maximum and minimum values, and coefficient of variation of asymmetry and kurtosis, as well as normality, by the Shapiro-Wilk test at 5 % probability, with the aid of the Action 2.3 statistical software (Estatcamp Team, 2014).
The number of samples (n) required to obtain representative mean values of the soil physical properties under study to achieve a desired level of confidence were calculated by equation 1 (Cline, 1944), as also suggested by different authors, such as Buczko et al. (2012), Tewolde et al. (2013), and Franzen and Mulla (2015):
n =
2
tα/2 · CVer
Eq. 1
in which tα/2 is the value in the Student distribution table (1.9976) for the probability level α/2 (bilateral); CV, the coefficient of variation (%); and er, the admissible relative error to the mean (5-30 %).
The effectiveness of strategic soil sampling could be enhanced through incorporation of a spatial variability model (Mcbratney and Webster, 1983). Thus, in order to characterize the spatial variability of the soil physical properties, a geostatistical method was used by means of fitted semivariograms (Vieira et al., 1983), based on the presumption of stationarity of the intrinsic hypothesis, which was estimated by equation 2:
γ(h) =2n(h)
[z(xi + h) – z(xi)]2Σi = 1
n(h)
Eq. 2
where γ(h) is the semivariance, n(h) is the number of experimental pairs of observations z(xi) and z(xi + h) at locations xi and xi + h separated by the lag distance h.
The semivariograms were staggered to standardize the values of semivariances from the variables under study. Semivariograms were staggered by dividing the semivariance values by the sample variance (Vieira et al., 1997).
""""""""""""""""""""""""""""""""""""""""""""""""""""""""""""""""""""""""""""""""""
Brazil
Espirito Santo
SamplingExperimental AreaSão Mateus
Direction of axis Y, m Dire
ction
of ax
is X,
m
Heig
ht, m 81.5
81
7935520
7935500
7935480
7935460
7935440
7935420
7935400
7935380 3844
8038
4460
3844
4038
4420
3844
0038
4380
N
S
W E
Figure 1. Location of the study area and sampling points used in the experiment.
Santos et al. Sampling design of soil physical properties in a conilon coffee field...
5Rev Bras Cienc Solo 2017;41:e0160426
Geostatistical analysis was performed with the aid of the software GS+ Version 7® (Gamma Design Software, 2004). To fit semivariograms, theoretic models such as the spherical, exponential, and Gaussian models were tested, and their parameters were defined: nugget effect (Co), sill (Co + C), and range (a). When undecided about more than one model for the same semivariogram, the highest value for the regression coefficient (CVRC) was considered, obtained by the crossed validation method (Amado et al., 2007). The spatial dependency index (SDI) was determined, defined as the proportion in percentage of the nugget effect (Co) relative to the sill (Co + C), given by equation 3:
SDI =C0 + CC0 100 Eq. 3
The spatial dependency index was classified according to Cambardella et al. (1994) as follows: (a) strong SDI ≤25 %; (b) moderate SDI between 25 and 75 %, and (c) weak SDI ≥75 %.
Subsequently, models of fitted semivariograms were used to develop interpolated maps of the variables under study through interpolation of their values, using the ordinary kriging method. The software ArcGIS 10.2.2 (ESRI, 2014) was used to elaborate spatial variability maps.
RESULTS AND DISCUSIONThe mean and median values of particle density (PD), macroporosity (Ma), soil water storage capacity, and the particle size fractions of total sand and clay are very close, indicating symmetric distribution (Table 1), a fact confirmed by the asymmetry values near zero.
However, data normality by the Shapiro-Wilk test at 5 % probability was observed for the properties of soil density, May, total sand, and clay. Isaaks and Srivastara (1989) confirm that when applying geostatistical analysis, the occurrence or lack of the proportional effect, in which the mean and the variance of data are not constant within the area under study, is more important than the normality of data.
The coefficient of variation (CV) was considered low (≤12 %) for BD, PD, TP, and total sand, and medium (12 % < CV < 62 %) for the rest of the soil properties, according to the classification criteria proposed by Warrick and Nielsen (1980). Similar classifications were
Table 1. Descriptive statistics of bulk density (BD), particle density (PD), macroporosity (Ma), microporosity (Mi), total porosity (TP), soil water storage capacity (SWSC), total sand (TS), silt content (Silt), and clay content (Clay) obtained from 65 sampling points in a Conilon coffee fieldDescriptive statistic BD PD Ma Mi TP SWSC TS Silt Clay
Mg m-3 m3 m-3 mm g kg-1
Mean 1.43 2.54 23.35 22.35 45.79 8.92 620.26 151.12 228.62Median 1.43 2.53 23.66 21.65 46.28 8.73 624 148 220SV 0.01 1 10-3 41.54 18.05 20.16 9.11 2,924.4 775.67 1,749.62SD 0.11 0.03 6.45 4.25 4.49 3.02 54.08 27.85 41.83CV 7.62 1.34 27.60 19.0 9.81 33.84 8.72 18.43 18.30Minimum 1.12 2.44 4.62 16.43 28.08 3.49 510 104 140Maximum 1.84 2.63 36.98 40.62 54.48 16.79 716 256 320Ass. 0.49 -0.05 -0.31 1.46 -0.84 0.65 -0.32 0.92 0.22Kurt. 2.05 0.93 -0.29 3.47 2.17 0.34 -0.84 1.56 - 0.53p-value 0.07* 1 10-4 0.42* 4 10-5 0.02 0.03 0.05* 0.01 0.08*
SV: sample variance; SD: standard deviation; CV: coefficient of variation; Ass.: asymmetry coefficient; Kurt.: kurtosis coefficient. *: normal distribution by the Shapiro-Wilk test at 5 % probability.
Santos et al. Sampling design of soil physical properties in a conilon coffee field...
6Rev Bras Cienc Solo 2017;41:e0160426
found by Kamimura et al. (2013) for all soil physical properties, except for microporosity (Mi), in a Typic Hapludox soil under coffee. Grego and Vieira (2005) found a medium CV for soil water storage capacity (SWSC). The SWSC generally shows high variation since it depends on a series of factors, including relative distribution of the size, the form, and the arrangement of soil particles (Moraes and Libardi, 1993), factors that are related to soil and water management.
Representative sampling is imperative to provide adequate monitoring of soil conditions, especially those related to compaction. The soil compaction process restricts the normal growth of roots, nutrient uptake, and water infiltration, which may affect the sustainability of the Conilon coffee field.
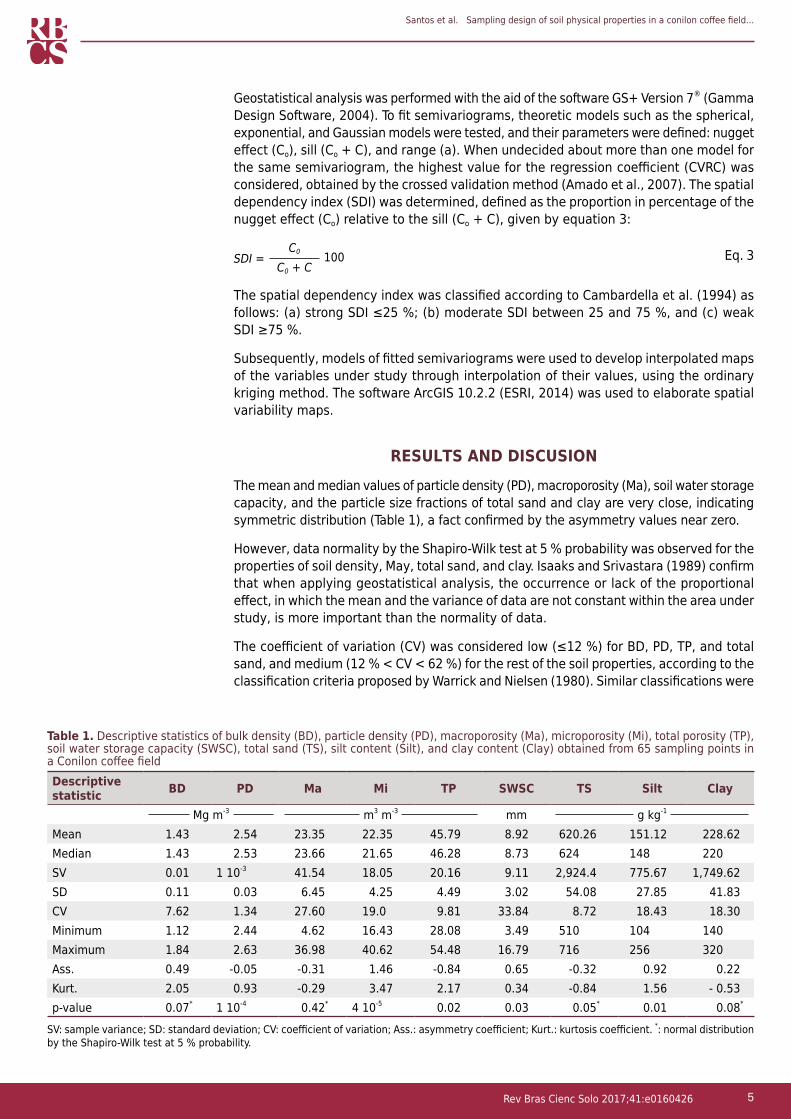
The number of sampling points required to obtain representative mean values from physical soil properties for the desired confidence level may be calculated by equation 1. Figure 2 shows the number of soil samples required to represent the area under study, at the 5 % level, for variations from 5 to 30 % of the mean value, measured by the relative error. The number of samples required to obtain a variation of 10 % of the mean value, with a significance level of 5 %, was 1 for PD, BD, TP, and total sand; 3 for clay and silt; 4 for Mi; 8 for Ma, and 11 for SWSC. Definition of the number of sampling points to make a compound sample is conditioned on the level of precision desired (Rozane et al., 2011) by associating better representation of the properties evaluated with less sampling effort, thus optimizing the sampling process.
Relative error around mean (%)
Num
ber o
f sam
ples
Bulk Density Macroporosity
Microporosity Total Porosity Soil Water Storage Capacity
Total Sand Silt Clay
Particle Density
30252015105 30252015105 302520151050.0
0.5
1.0
1.5
2.0
2.5
3.0
3.5
0
2
4
6
8
10
12
16
14
0
2
4
6
8
10
12
16
14
0
2
4
6
8
10
12
16
14
0
1
2
3
4
5
0
10
20
30
40
50
0.00
0.02
0.04
0.06
0.08
0.0
0.5
1.0
2.0
2.5
1.5
0
10
20
30
35
5
15
25
Figure 2. Number of sampling points for estimation of soil density, particle density, soil macroporosity and microporosity, total porosity, soil water storage capacity, total sand, silt, and clay, according to the relative error from the mean, at 5 % significance.
Santos et al. Sampling design of soil physical properties in a conilon coffee field...
7Rev Bras Cienc Solo 2017;41:e0160426
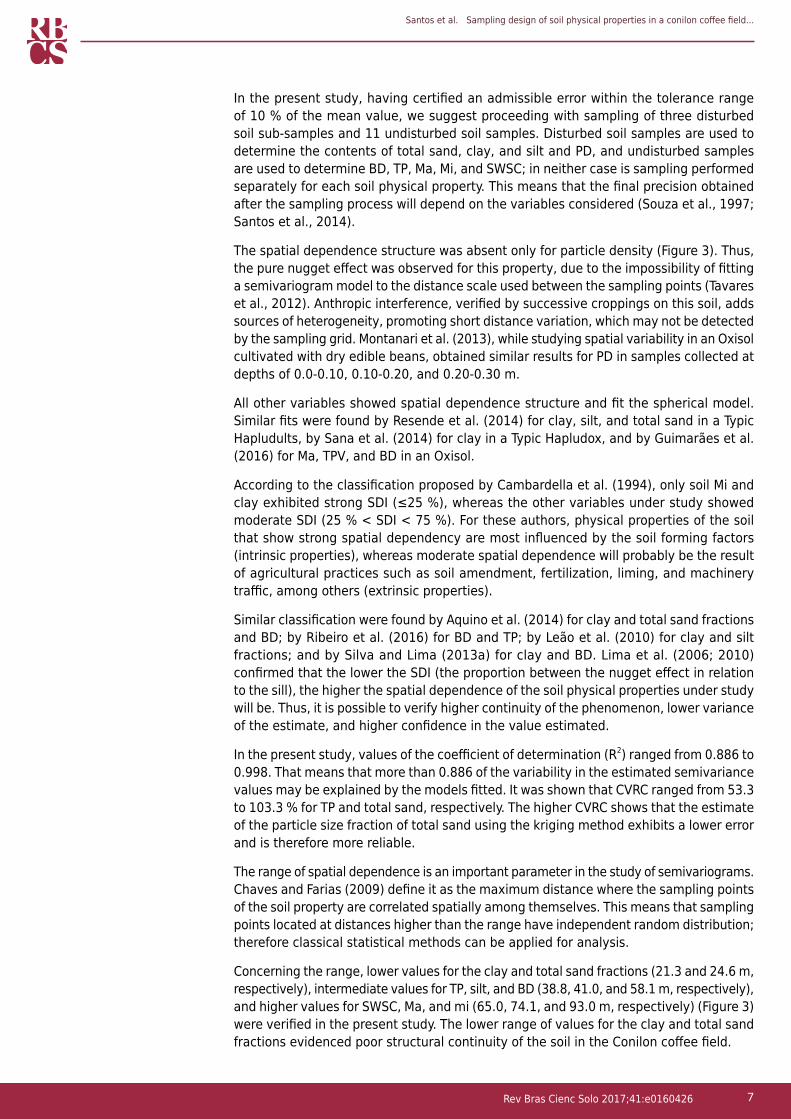
In the present study, having certified an admissible error within the tolerance range of 10 % of the mean value, we suggest proceeding with sampling of three disturbed soil sub-samples and 11 undisturbed soil samples. Disturbed soil samples are used to determine the contents of total sand, clay, and silt and PD, and undisturbed samples are used to determine BD, TP, Ma, Mi, and SWSC; in neither case is sampling performed separately for each soil physical property. This means that the final precision obtained after the sampling process will depend on the variables considered (Souza et al., 1997; Santos et al., 2014).
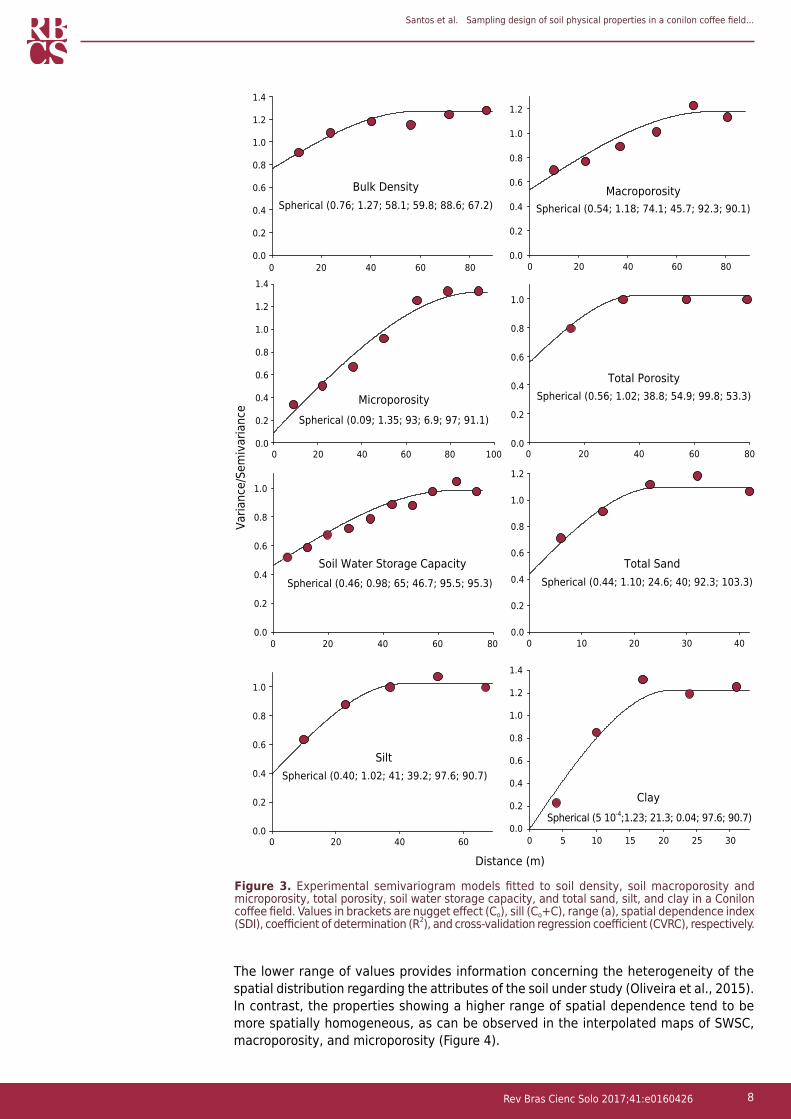
The spatial dependence structure was absent only for particle density (Figure 3). Thus, the pure nugget effect was observed for this property, due to the impossibility of fitting a semivariogram model to the distance scale used between the sampling points (Tavares et al., 2012). Anthropic interference, verified by successive croppings on this soil, adds sources of heterogeneity, promoting short distance variation, which may not be detected by the sampling grid. Montanari et al. (2013), while studying spatial variability in an Oxisol cultivated with dry edible beans, obtained similar results for PD in samples collected at depths of 0.0-0.10, 0.10-0.20, and 0.20-0.30 m.
All other variables showed spatial dependence structure and fit the spherical model. Similar fits were found by Resende et al. (2014) for clay, silt, and total sand in a Typic Hapludults, by Sana et al. (2014) for clay in a Typic Hapludox, and by Guimarães et al. (2016) for Ma, TPV, and BD in an Oxisol.
According to the classification proposed by Cambardella et al. (1994), only soil Mi and clay exhibited strong SDI (≤25 %), whereas the other variables under study showed moderate SDI (25 % < SDI < 75 %). For these authors, physical properties of the soil that show strong spatial dependency are most influenced by the soil forming factors (intrinsic properties), whereas moderate spatial dependence will probably be the result of agricultural practices such as soil amendment, fertilization, liming, and machinery traffic, among others (extrinsic properties).
Similar classification were found by Aquino et al. (2014) for clay and total sand fractions and BD; by Ribeiro et al. (2016) for BD and TP; by Leão et al. (2010) for clay and silt fractions; and by Silva and Lima (2013a) for clay and BD. Lima et al. (2006; 2010) confirmed that the lower the SDI (the proportion between the nugget effect in relation to the sill), the higher the spatial dependence of the soil physical properties under study will be. Thus, it is possible to verify higher continuity of the phenomenon, lower variance of the estimate, and higher confidence in the value estimated.
In the present study, values of the coefficient of determination (R2) ranged from 0.886 to 0.998. That means that more than 0.886 of the variability in the estimated semivariance values may be explained by the models fitted. It was shown that CVRC ranged from 53.3 to 103.3 % for TP and total sand, respectively. The higher CVRC shows that the estimate of the particle size fraction of total sand using the kriging method exhibits a lower error and is therefore more reliable.
The range of spatial dependence is an important parameter in the study of semivariograms. Chaves and Farias (2009) define it as the maximum distance where the sampling points of the soil property are correlated spatially among themselves. This means that sampling points located at distances higher than the range have independent random distribution; therefore classical statistical methods can be applied for analysis.
Concerning the range, lower values for the clay and total sand fractions (21.3 and 24.6 m, respectively), intermediate values for TP, silt, and BD (38.8, 41.0, and 58.1 m, respectively), and higher values for SWSC, Ma, and mi (65.0, 74.1, and 93.0 m, respectively) (Figure 3) were verified in the present study. The lower range of values for the clay and total sand fractions evidenced poor structural continuity of the soil in the Conilon coffee field.
Santos et al. Sampling design of soil physical properties in a conilon coffee field...
8Rev Bras Cienc Solo 2017;41:e0160426
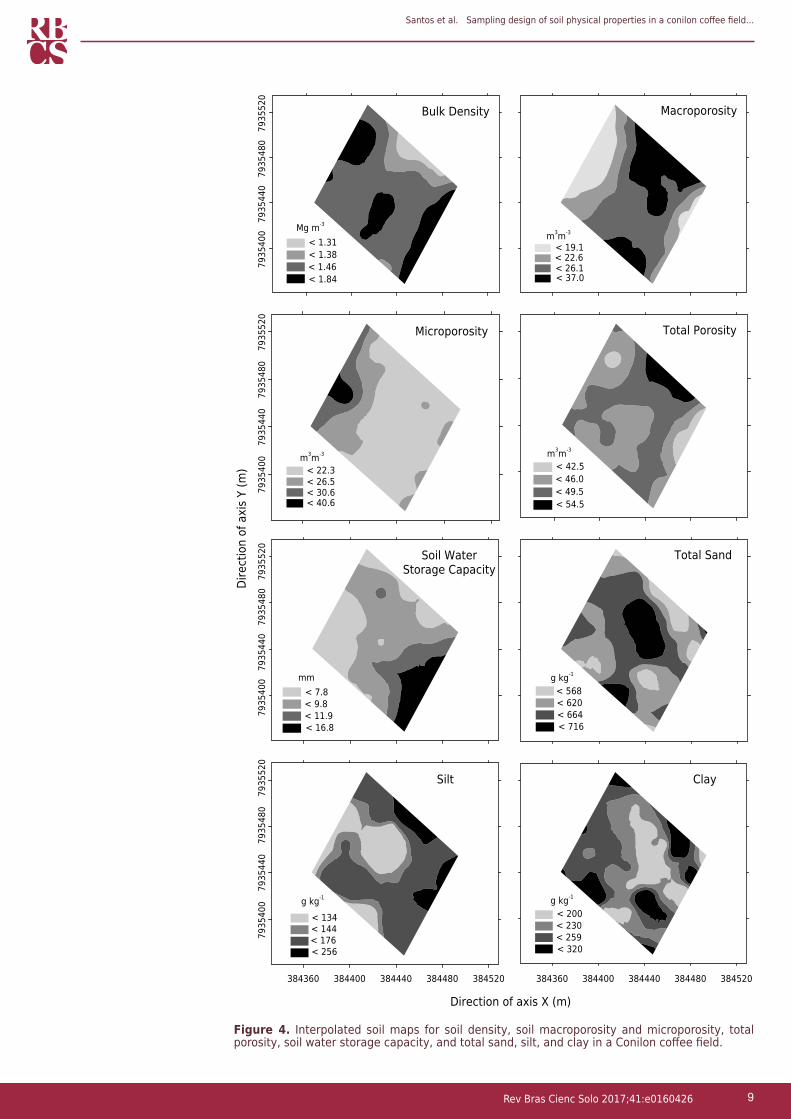
The lower range of values provides information concerning the heterogeneity of the spatial distribution regarding the attributes of the soil under study (Oliveira et al., 2015). In contrast, the properties showing a higher range of spatial dependence tend to be more spatially homogeneous, as can be observed in the interpolated maps of SWSC, macroporosity, and microporosity (Figure 4).
Bulk Density Macroporosity
Microporosity
Total Porosity
Soil Water Storage Capacity Total Sand
Silt
Clay
Varia
nce/
Sem
ivar
ianc
e
3025201510506040200
Distance (m)
0.0
0.2
0.4
0.6
0.8
1.0
0.0
0.2
0.4
0.6
0.8
1.0
1.2
1.4
Spherical (0.40; 1.02; 41; 39.2; 97.6; 90.7)
Spherical (5 10-4;1.23; 21.3; 0.04; 97.6; 90.7)
Spherical (0.46; 0.98; 65; 46.7; 95.5; 95.3) Spherical (0.44; 1.10; 24.6; 40; 92.3; 103.3)
Spherical (0.09; 1.35; 93; 6.9; 97; 91.1)
Spherical (0.56; 1.02; 38.8; 54.9; 99.8; 53.3)
Spherical (0.76; 1.27; 58.1; 59.8; 88.6; 67.2) Spherical (0.54; 1.18; 74.1; 45.7; 92.3; 90.1)
403020100806040200
806040200100806040200
806040200806040200
0.0
0.2
0.4
0.6
0.8
1.0
1.2
0.0
0.2
0.4
0.6
0.8
1.0
0.0
0.2
0.4
0.6
0.8
1.0
0.0
0.2
0.4
0.6
0.8
1.0
1.2
1.4
0.0
0.2
0.4
0.6
0.8
1.0
1.2
1.4
0.0
0.2
0.4
0.6
0.8
1.0
1.2
Figure 3. Experimental semivariogram models fitted to soil density, soil macroporosity and microporosity, total porosity, soil water storage capacity, and total sand, silt, and clay in a Conilon coffee field. Values in brackets are nugget effect (Co), sill (Co+C), range (a), spatial dependence index (SDI), coefficient of determination (R2), and cross-validation regression coefficient (CVRC), respectively.
Santos et al. Sampling design of soil physical properties in a conilon coffee field...
9Rev Bras Cienc Solo 2017;41:e0160426
7935
400
7935
440
7935
480
7935
520
Mg m-3
< 1.84< 1.46< 1.38< 1.31
Bulk Density
m3m-3
< 37.0< 26.1< 22.6< 19.1
Macroporosity
7935
400
7935
440
7935
480
7935
520
m3m-3
< 40.6< 30.6< 26.5< 22.3
Microporosity
Dire
ctio
n of
axi
s Y
(m)
Total Porosity
m3m-3
< 54.5< 49.5< 46.0< 42.5
mm
< 16.8< 11.9< 9.8< 7.8
Soil WaterStorage Capacity
g kg-1
< 716< 664< 620< 568
Total Sand
384360 384400 384440 384480 384520
g kg-1
< 256< 176< 144< 134
Silt
Direction of axis X (m)
g kg-1
< 320< 259< 230< 200
Clay
384360 384400 384440 384480 384520
7935
400
7935
440
7935
480
7935
520
7935
400
7935
440
7935
480
7935
520
Figure 4. Interpolated soil maps for soil density, soil macroporosity and microporosity, total porosity, soil water storage capacity, and total sand, silt, and clay in a Conilon coffee field.
Santos et al. Sampling design of soil physical properties in a conilon coffee field...
10Rev Bras Cienc Solo 2017;41:e0160426
Once semivariograms of soil properties under study are fitted and after identifying their spatial dependence structure by means of the kriging technique, it is possible to perform interpolation of values at any point in the field without unbiased estimates and with minimum variance (Oliver and Webster, 2014), thus making kriging an optimal estimator. The parameters of models fitted to semivariograms utilizing the kriging process allow production of spatial variability maps of the physical attributes from soils planted to Conilon coffee (Figure 4).
In the spatial variability map of soil density, higher values (1.46-1.84 Mg m-3) represented 25.2 % of the area under study and were located at the extremities (Figure 4). Silva and Lima (2013b) emphasize that regions of the field with higher values of BD tend to reduce availability of nutrients to plants, with consequent reduction in yield. Regarding the SWSC map, higher values of SWSC, represented by the range of values from 9.8 to 16.8 mm, are located in the southern region of the field.
The range of values for soil macroporosity are from 22.6 to 37.0 m3 m-3, and values for soil microporosity are lower than 22.3 m3 m-3, corresponding to 65.2 and 65.5 % of the experimental area (Figure 4), respectively, and are located in the central-south and northeast regions of the experimental area. In the spatial variability map of TP, values from 42.5 and 49.5 m3 m-3 correspond to 88.3 % of the area under study and are well distributed throughout the field. It should be noted that gas flow in the soil, that is, oxygenation of the root system of the coffee plant, is intimately related to the volume of soil macro-pores (Silva et al., 2005).
The values of total sand contents ranging from 568 to 664 g kg-1 correspond to 74.2 % of the experimental area and are well distributed throughout the field. An inverse relation between the interpolated maps from clay and sand is verified, which is to say, in regions with higher contents of clay, lower contents of total sand are observed, and vice-versa.
The semivariogram range may assist in the sampling process since it provides the correct distribution of the number of samples for estimation of soil properties, according to the scale under study (Santos et al., 2013). Thus, in order to ensure spatial independence, disturbed soil samples must be collected from a distance higher than the range value. However, for undisturbed soil samples that show high range values, the process of sampling 11 points in a zigzag pattern is recommended.
CONCLUSIONS
In a Conilon Coffee plantation, cultivated in a Typic Hapludox, with sandy clay loam texture, collecting three disturbed soil samples (total sand, silt, and clay) and 11 undisturbed soil samples (soil bulk density and particle density, macroporosity, microporosity, total pore volume, and soil water storage capacity) is recommended in order to determine mean values for physical soil properties, associating low sampling expenses and better representation.
Determination of the number of samples and spatial variability of soil physical properties may be used to develop sampling strategies that minimize costs to farmers within a tolerable and identifiable level of error.
ACKNOWLEDGMENTS
The authors thank the farmer Mr. Eliseu Bonomo, for allowing the implementation of the experimental area and to the Agronomic Engineer Ítalo Bonomo, for the technical advisory during the research. To FAPES for the financial support.
Santos et al. Sampling design of soil physical properties in a conilon coffee field...
11Rev Bras Cienc Solo 2017;41:e0160426
REFERENCESAlvares CA, Stape JL, Sentelhas PC, Gonçalves JLM, Sparovek G. Koppen’s climate classification map for Brazil. Meteorol Z. 2013;22:711-28. https://doi.org/10.1127/0941-2948/2013/0507
Amado TJC, Pontelli CB, Santi AL, Viana JHM, Sulzbach LAS. Variabilidade espacial e temporal da produtividade de culturas sob sistema de plantio direto. Pesq Agropec Bras. 2007;42:1101-10. https://doi.org/10.1590/S0100-204X2007000800006
Aquino RE, Campos MCC, Marques Júnior J, Oliveira IA, Mantovaneli BC, Soares MDR. Geoestatística na avaliação dos atributos físicos em Latossolo sob floresta nativa e pastagem na região de Manicoré, Amazonas. Rev Bras Cienc Solo. 2014;38:397-406. https://doi.org/10.1590/S0100-06832014000200004
Berisso FE, Schjønning P, Lamandé M, Weisskopf P, Stettler M, Keller T. Effects of the stress field induced by a running tyre on the soil pore system. Soil Till Res. 2013;131:36-46. https://doi.org/10.1016/j.still.2013.03.005
Buczko U, Kurfürst U, Kuchenbuch RO, Munzert M. Factors affecting sampling error of nutrient element contents of arable fields. Commun Soil Sci Plant Anal. 2012;43:1576-98. https://doi.org/10.1080/00103624.2012.675392
Cambardella CA, Moornam TB, Parkin TB, Karlen DL, Novak JM, Turco RF, Konopka AE. Field-scale variability of soil properties in central Iowa soils. Soil Sci Soc Am J. 1994;58:1501-11. https://doi.org/10.2136/sssaj1994.03615995005800050033x
Chaves LHG, Farias CHA. Variabilidade espacial de cobre e manganês em Argissolo sob cultivo de cana-de-açúcar. Rev Cienc Agron. 2009;40:211-18.
Chung CK, Chong SK, Varsa EC. Sampling strategies for fertility on a stoy silt loam soil. Commun Soil Sci Plant Anal. 1995;26:741-63. https://doi.org/10.1080/00103629509369332
Cline MG. Principles of soil sampling. Soil Sci. 1944;58:275-88.
Donagema GK, Campos DVB, Calderano SB, Teixeira WG, Viana JHM, organizadores. Manual de métodos de análise do solo. 2a ed. rev. Rio de Janeiro: Embrapa Solos; 2011.
Duarte MN, Curi N, Pérez DV, Kampf N, Claessen MEC. Mineralogia, química e micromorfologia de solos de uma microbacia nos Tabuleiros Costeiros do Espírito Santo. Pesq Agropec Bras. 2000;35:1237-50. https://doi.org/10.1590/S0100-204X2000000600021
Environmental Systems Research Institute - Esri. ArcGIS Desktop [computer programme]. Version 10.1. Redlands: 2014. Available at: http://www.esri.com/software/arcgis.
Estatcamp Team. Software Action. Estatcamp - Consulting in statistics and quality, São Carlos, SP, Brazil. 2014 [acesso em 04 Dez 2014]. Disponível em: http://www.portalaction.com.br.
Franzen D, Mulla D. A history of precision agriculture. In: Zhang Q, editor. Precision agriculture technology for crop farming. Washington, DC: CRC Press; 2015. p.1-19.
Gamma Design Software. Geoestatistics for the environmental sciences. Version 7.0 [computer programme]. Michigan; 2004. CD ROM
Gontijo I, Dias Junior MS, Oliveira MS, Araujo Junior CF, Pires BS, Oliveira CA. Planejamento amostral da pressão de preconsolidação de um Latossolo Vermelho Distroférrico. Rev Bras Cienc Solo. 2007;31:1245-54. https://doi.org/10.1590/S0100-06832007000600003
Grego CR, Vieira SR. Variabilidade espacial de propriedades físicas do solo em uma parcela experimental. Rev Bras Cienc Solo. 2005:29;169-77. https://doi.org/10.1590/S0100-06832005000200002
Guimarães WD, Gripp Junior J, Marques EAG, Santos NT, Fernandes RBA. Variabilidade espacial de atributos físicos de solos ocupados por pastagens. Rev Cienc Agron. 2016:47;247-55. https://doi.org/10.5935/1806-6690.20160029
Instituto Capixaba de Pesquisa, Assistência Técnica e Extensão Rural - Incaper. Sistema de Informações Meteorológicas: Série histórica. Vitória, ES: Secretaria de Estado da Agricultura, Abastecimento, Aquicultura e Pesca; 2016 [acesso: 21 Nov 2016]. Disponível em: http://hidrometeorologia.incaper.es.gov.br/?pagina=saomateus_sh.
Santos et al. Sampling design of soil physical properties in a conilon coffee field...
12Rev Bras Cienc Solo 2017;41:e0160426
Isaaks EH, Srivastava RM. An introduction to applied geostatistics. New York: Oxford University Press; 1989.
Kamimura KM, Santos GR, Oliveira MS, Dias Júnior MS, Guimarães PTG. Variabilidade espacial de atributos físicos de um Latossolo Vermelho-Amarelo, sob lavoura cafeeira. Rev Bras Cienc Solo. 2013:37;877-88. https://doi.org/10.1590/S0100-06832013000400006
Leão MGA, Marques Júnior J, Souza ZM, Pereira GT. Variabilidade espacial da textura de um Latossolo sob cultivo de citros. Cienc Agrotec. 2010;34:121-31. https://doi.org/10.1590/S1413-70542010000100016
Lima JSS, Souza GS, Silva SA. Amostragem e variabilidade espacial de atributos químicos do solo em área de vegetação natural em regeneração. Rev Árv. 2010;34:127-36. https://doi.org/10.1590/S0100-67622010000100014
Lima JSS, Oliveira JTS, Oliveira RB, Almeida VS, Vanzo FL. Estudo viabilidade de métodos geoestatísticos na mensuração da variabilidade espacial da dureza da madeira de Paraju (Manilkara sp.). Rev Árv. 2006;30:651-7. https://doi.org/10.1590/S0100-67622006000400019
Mcbratney AB, Webster R. How many observations are needed for regional estimation of soil properties? Soil Sci. 1983;135:177-83.
Melo VF, Novais RF, Schaefer CEGR, Fontes MPF, Singh B. Mineralogia das frações areia, silte e argila de sedimentos do grupo Barreiras no município de Aracruz, estado do Espírito Santo. Rev Bras Cienc Solo. 2002;26:29-41. https://doi.org/10.1590/S0100-06832002000100004
Montanari R, Pellin DMP, Silva Júnior CA; Carvalho MP, Gioia MT, Dalchiavon FC, González AP. Correlação entre produção de feijão e atributos físicos de um Latossolo em Mato Grosso do Sul. Rev Ceres. 2013;60:772-84. https://doi.org/10.1590/S0034-737X2013000600005
Montanari R, Souza GSA, Pereira GT, Marques Júnior J, Siqueira DS, Siqueira GM. The use of scaled semivariograms to plan soil sampling in sugarcane fields. Precision Agric. 2012;13:542-52. https://doi.org/10.1007/s11119-012-9265-6
Moraes SO, Libardi PL. Problemas metodológicos na obtenção da curva de retenção de água pelo solo. Sci. Agric. 1993;50:383-92. https://doi.org/10.1590/S0103-90161993000300010
Mzuku M., Khosla R, Reich R, Inman D, Smith F, MacDonald L. Spatial variability of measured soil properties across site-specific management zones. Soil Sci Soc Am J. 2005;69:1572-9. https://doi.org/10.2136/sssaj2005.0062
Oliveira IA, Marques Júnior J, Campos MCC, Aquino RE, Freitas L, Siqueira DS, Cunha JM. Variabilidade espacial e densidade amostral da suscetibilidade magnética e dos atributos de Argissolos da região de Manicoré, AM. Rev Bras Cienc Solo. 2015;39:668-81. https://doi.org/10.1590/01000683rbcs20140496
Oliveira PCG, Farias PRS, Lima HV, Fernandes AO, Oliveira FA, Pita JD. Variabilidade espacial de propriedades químicas do solo e da produtividade de citros na Amazônia Oriental. Rev Bras Eng Agríc Amb. 2009;13:708-15. https://doi.org/10.1590/S1415-43662009000600007
Oliver MA, Webster R. A tutorial guide to geostatistics: Computing and modelling variograms and kriging. Catena. 2014;113:56-69. https://doi.org/10.1016/j.catena.2013.09.006
Prezotti LC, Gomes JA, Dadalto GG, Oliveira JA. Manual de Recomendação de Calagem e Adubação para o Estado do Espírito Santo: 5a aproximação. Vitória, ES: SEEA, Incaper, Cedagro; 2007.
Resende JMA, Marques Júnior J, Martins Filho MV, Dantas JS, Siqueira DS, Teixeira DB. Variabilidade espacial de atributos de solos coesos do leste maranhense. Rev Bras Cienc Solo. 2014;38:1077-90. https://doi.org/10.1590/S0100-06832014000400004
Ribeiro LS, Oliveira IR, Dantas JS, Silva CV, Silva GB, Azevedo JR. Variabilidade espacial de atributos físicos de solo coeso sob sistemas de manejo convencional e de plantio direto. Pesq Agropec Bras. 2016;51:1699-1702. https://doi.org/10.1590/S0100-204X2016000900071
Rozane DE, Romualdo LM, Centurion JF, Barbosa JC. Dimensionamento do número de amostras para avaliação da fertilidade do solo. Semina: Cienc Agrár. 2011;32:111-8. https://doi.org/10.5433/1679-0359.2011v32n1p111
Santos et al. Sampling design of soil physical properties in a conilon coffee field...
13Rev Bras Cienc Solo 2017;41:e0160426
Sana RS, Anghinoni I, Brandão ZN, Holzschuh MJ. Variabilidade espacial de atributos físico-químicos do solo e seus efeitos na produtividade do algodoeiro. Rev Bras Eng Agríc Amb. 2014;18:994-1002. https://doi.org/10.1590/1807-1929/agriambi.v18n10p994-1002
Santos EOJ, Gontijo I, Silva MB. Planejamento amostral dos teores de Cu, Fe, Mn, Zn e Na em um Latossolo cultivado com café conilon. Rev Cienc Agrovet. 2014;13:318-26.
Santos EOJ, Gontijo I, Silva MB. Planejamento amostral de propriedades químicas do solo em lavoura de café conilon. Coffe Sci. 2013;8:423-31.
Silva MAS, Mafra ÁL, Albuquerque JA, Bayer C, Mielniczuk J. Atributos físicos do solo relacionados ao armazenamento de água em um Argissolo Vermelho sob diferentes sistemas de preparo. Cienc Rural. 2005;35:554-52. https://doi.org/10.1590/S0103-84782005000300009
Silva SA, Lima JSS. Atributos físicos do solo e sua relação espacial com a produtividade do café conilon. Coffe Sci. 2013a;8:395-403.
Silva SA, Lima JSS. Relação espacial entre o estoque de nutrientes e a densidade de solo cultivado com cafeeiro. Pesq Agropec Trop. 2013b;43:377-84.
Souza LS, Cogo NP, Vieira SR. Variabilidade de propriedades físicas e químicas do solo em um pomar cítrico. Rev Bras Cienc Solo. 1997;21:367-72. https://doi.org/10.1590/S0100-06831997000300003
Tavares UE, Rolim MM, Pedrosa EMR, Montenegro AAA, Magalhães AG, Barreto MTL. Variabilidade espacial de atributos físicos e mecânicos de um Argissolo sob cultivo de cana-de-açúcar. Rev Bras Eng Agríc Amb. 2012;16:1206-14. https://doi.org/10.1590/S1415-43662012001100009
Tewolde H, Way TR, Pote DH, Adeli A, Brooks JP, Shankle MW. Method of soil sampling following subsurface banding of solid manures. Agron J. 2013;105:519-26. https://doi.org/10.2134/agronj2012.0400n
Soil Survey Staff. Keys to soil taxonomy. 11th ed. Washington, DC: United States Department of Agriculture, Natural Resources Conservation Service; 2010.
Vieira SR, Tillotson PM, Biggar JW, Nielsen DR. Scaling of semivariograms and the kriging estimation of field-measured properties. Rev Bras Cienc Solo. 1997;21:525-33. https://doi.org/10.1590/S0100-06831997000400001
Vieira SR, Hatfield JL, Nielsen DR, Biggar JW. Geostatistical theory and application to variability of some agronomical properties. Hilgardia. 1983;51:1-75. https://doi.org/10.3733/hilg.v51n03p075
Warrick AW, Nielsen DR. Spatial variability of soil physical properties in the field. In: Hillel D, editor. Applications of soil physics. New York: Academic Press; 1980. p.319-44.
Related Documents