Sampling and Reconstruction of Analog Signals With Aliasing K L UNIVERSITY ELECTRONICS AND COMMUNICATION ENGINEERING A Project Based Lab Report On SAMPLING AND RECONSTRUCTION OF ANALOG SIGNALS WITH ALIASING Submitted in partial fulfilment of the Requirements for the award of the Degree of Bachelor of Technology in Electronics & Communication Engineering By J.NAGA SAI-150040317 Under the guidance of Mr.K.Manoj Dept. of Electronics and Communication Engineering, K.L. UNIVERSITY Green fields,Vaddeswaram-522502, Guntur Dist. 2016-17 Department of Electronics & Communication Engineering

Welcome message from author
This document is posted to help you gain knowledge. Please leave a comment to let me know what you think about it! Share it to your friends and learn new things together.
Transcript

Sampling and Reconstruction of Analog Signals With Aliasing
K L UNIVERSITY ELECTRONICS AND COMMUNICATION ENGINEERING
A
Project Based Lab Report On
SAMPLING AND RECONSTRUCTION OF ANALOG SIGNALS WITH ALIASING
Submitted in partial fulfilment of the Requirements for the
award of the Degree of
Bachelor of Technology
in
Electronics & Communication Engineering
By
J.NAGA SAI-150040317
Under the guidance of
Mr.K.Manoj
Dept. of Electronics and Communication Engineering, K.L. UNIVERSITY
Green fields,Vaddeswaram-522502, Guntur
Dist.
2016-17
Department of Electronics & Communication Engineering

Sampling and Reconstruction of Analog Signals With Aliasing
K L UNIVERSITY ELECTRONICS AND COMMUNICATION ENGINEERING
K.L.UNIVERSITY
__________________________________________________________________
CERTIFICATE
This is to certify that the project entitled “SAMPLING AND RECONSTRUCTION OF ANAALOG
SIGNALS WITH ALAISING” is the bonafide work carried out by J.NAGA SAI(150040317) students
of II year B.Tech, E.C.E dept, College of Engineering, K.L.University, in the Signal Analysis Laboratory''
for the academic year 2015-2016.
Signature of the Project guide Signature of Course Coordinator
Mr.K.Manoj Dr.M.Venu Gopal Rao
Head of the department Dr.ASCS
Sastry

Sampling and Reconstruction of Analog Signals With Aliasing
K L UNIVERSITY ELECTRONICS AND COMMUNICATION ENGINEERING
ACKNOWLEDGMENT
Our sincere thanks to Mr.K.Manoj in the Lab for his outstanding support throughout the project for the
successful completion of the work.
My sincere thanks to Dr.M.Venu Gopal Rao, Course coordinator of Signal Processing for helping us in
the completion of our project based laboratory.
We express our gratitude to A.S.C.S.Sastry Head of the Department for Electronics &Communication
Engineering for providing us with adequate facilities, ways and means by which we are able to complete
this term paper work.
We would like to place on record the deep sense of gratitude to the honourable Vice Chancellor, K L
University for providing the necessary facilities to carry the concluded term paper work.
Last but not the least, we thank all Teaching and Non-Teaching Staff of our department and especially my
classmates and my friends for their support in the completion of our project work.
Place: KL University Name : J NAGA SAI
Date: Adm no : 150040317

Sampling and Reconstruction of Analog Signals With Aliasing
K L UNIVERSITY ELECTRONICS AND COMMUNICATION ENGINEERING
INDEX
1. Abstract
2. Chapter 1 : INTRODUCTION
3. Chapter 2 : SAMPLING
4. Chapter 3 : NYQUIST SAMPLING THEOREM
5. Chapter 4 : RECONSTRUCTION
6. Chapter 5 :INTERPOLATION
7. Chapter 6 : RESULTS

Sampling and Reconstruction of Analog Signals With Aliasing
K L UNIVERSITY ELECTRONICS AND COMMUNICATION ENGINEERING
ABSTRACT
1.Generate and display of analog and discrete time signals.
2. Reconstruction of analog signals from discrete time signals
3. Performing ADC and DAC operations.
Task1: Consider an analog signal
Generate and plot this signal and its spectrum.
Task2: Perform an ideal ADC operation to generate discrete-time sequence x[n] from Analog signal xa
(t). Assume that the sampling frequency Fs=200 sam/sec. Plot x[n] and its DTFT, .
Task3: The filtered signal is applied as input to an ideal DAC (i.e., an ideal interpolator) to obtain the analog
signal The ideal DAC is also operating at Fs= 200 sam/sec. Obtain the reconstructed signal ya (t)
and determine whether sampling / reconstruction operation resulted in any aliasing. Also plot the Fourier
transforms Xa ( jΩ) , and Ya( jΩ).

Sampling and Reconstruction of Analog Signals With Aliasing
K L UNIVERSITY ELECTRONICS AND COMMUNICATION ENGINEERING
CHAPTER 1
1. INTRODUCTION:
A signal is defined as any physical quantity that varies with time, space, or any other independent variable
or variables. Signals are classified into two types periodic signals and aperiodic signals. Periodic signals
are defined as signals which repeat at time T. Aperiodic signals are defined as which don’t repeat at certain
intervals of time. These signals are again classified into analog and digital signals. The continuous time
signal is an analog and discrete time signal is a digital signal. The signals are functions of a continuous
variable, such as time or space, and usually take on values in a continuous range. Such signals may be
processed directly by appropriate analog systems such as filters or frequency analyzers or frequency
multipliers for the purpose of changing their characteristics or extracting some desired information. Digital
signal processing provides an alternative method for processing the analog signal.
Fig.1.1 Block Diagram of digital signal processing
An analog signal is converted into a digital signal in A/D convertor by the following steps:
1. Sampling.
2. Quantising
3. coding
The sampler samples the input signal with a sampling interval T. The output signal is discrete-in-time but
continuous in amplitude .The output of the sampler is applied to the quantizer .It converts the signal into

Sampling and Reconstruction of Analog Signals With Aliasing
K L UNIVERSITY ELECTRONICS AND COMMUNICATION ENGINEERING
discrete –time, discrete-amplitude signal. The final step is coding the coder maps each quantized sample
value in digital word.
Fig.1.2 Block diagram of analog to digital conversion
1. Sampling: This is the conversion of a continuous-time signal into a discrete time signal obtained by
taking “samples’" of the continuous time signal at discrete time instants.
Thus, if xa(t) is the input to the sampler, the output is xa (nT ) = x(n), w here T is called the sampling
interval.
2. Quantization: This is the conversion o f a discrete-time continuous-valued signal in to a
discretetime, discrete-valued signal. The value of each signal sample is represented by a value
selected from a finite set of possible values. The d difference between the un quantized sample x
(n) an d the quantized output x q(n) is called the quantization error.
3. Aliasing is an effect that causes different signals to become indistinguishable (or aliases of one
another) when sampled.. It also refers to the distortion that results when the signal reconstructed
from samples is different from the original continuous signal.
(or)
Aliasing is the generation of a false (alias) frequency along with the correct one when doing
frequency sampling.

Sampling and Reconstruction of Analog Signals With Aliasing
K L UNIVERSITY ELECTRONICS AND COMMUNICATION ENGINEERING
CHAPTER 2
2. SAMPLING:
In signal processing, sampling is the reduction of a continuous signal to a discrete signal.
A common example is the conversion of a sound wave (a continuous signal) to a sequence of samples (a
discrete-time signal). A sample refers to a value or set of values at a point in time and/or space. A sampler
is a subsystem or operation that extracts samples from a continuous signal. A theoretical ideal sampler
produces samples equivalent to the instantaneous value of the continuous signal at the desired points.
X(n) = Xa (nT). -∞ < n < ∞
Where X( n ) is the discrete-time signal obtained by “ taking samples” of the analog signal Xa(t) every T
seconds. The time interval T between successive samples is called the sampling period or sample interval
and its reciprocal 1 / T = Fs is called the sampling rate.
T=nT=n/Fs
consider an analog sinusoidal signal of the form
Xa(t) = A cos ( 2π Ft + φ )
When sampled periodically at a rate Fs=1 / T samples per second Xa( nT ) =x(n) = A cos(2πFnT +φ)=A cos (2πnF/Fs+φ)
By comparing both the Eq(1) and Eq(2) we obtain the relation between the frequency variables.
f=F/Fs
(or) ω=ΩT
where,
Fs=sampling frequency
F=frequency of analog f=frequency
of digital signal

Sampling and Reconstruction of Analog Signals With Aliasing
K L UNIVERSITY ELECTRONICS AND COMMUNICATION ENGINEERING
Fig 2.1 Periodic sampling of an analog signal
The range of frequency variable F or Ω for continuous sinusoidal signals are
-∞< F < ∞
-∞< Ω < ∞
For a discrete sinusoidal signals,
-1/2<f<1/2
-π<ω<π
The range of the frequency of the continuous-time sinusoid when sampled at a rate Fs = 1 / T
-1/2T=-Fs/2≤F≤Fs/2=1/2T
Equivalently
-π/T=-πFs≤Ω≤πFs=π/T
There are two types of sampling. They are
(i) Natural sampling
(ii) Flat top sampling Natural
Sampling:
The natural sampling is one which can be represented with respect to amplitude of the analog signal.
Flat top Sampling:
The flat top sampling is the one which can be represented in only a particular amplitude which cannot be
changed with respect to the analog signal.
Sampling and Reconstruction of Analog Signals With Aliasing
K L UNIVERSITY ELECTRONICS AND COMMUNICATION ENGINEERING
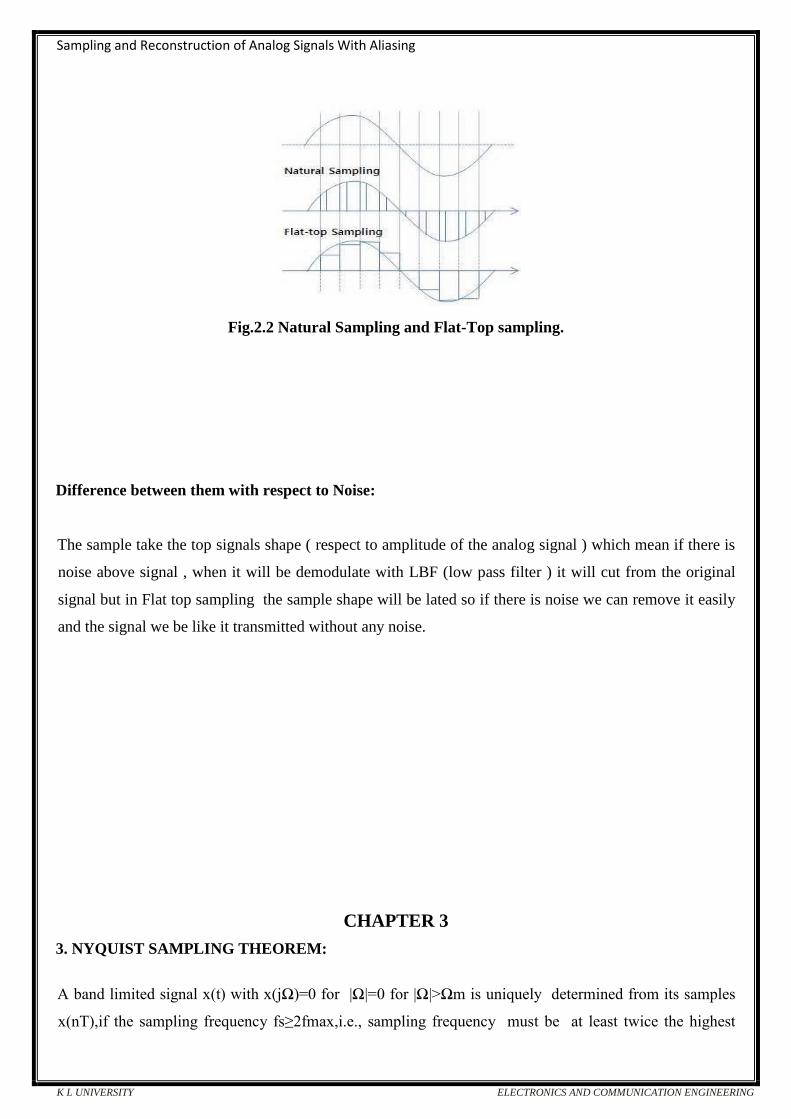
Fig.2.2 Natural Sampling and Flat-Top sampling.
Difference between them with respect to Noise:
The sample take the top signals shape ( respect to amplitude of the analog signal ) which mean if there is
noise above signal , when it will be demodulate with LBF (low pass filter ) it will cut from the original
signal but in Flat top sampling the sample shape will be lated so if there is noise we can remove it easily
and the signal we be like it transmitted without any noise.
CHAPTER 3
3. NYQUIST SAMPLING THEOREM:
A band limited signal x(t) with x(jΩ)=0 for |Ω|=0 for |Ω|>Ωm is uniquely determined from its samples
x(nT),if the sampling frequency fs≥2fmax,i.e., sampling frequency must be at least twice the highest

Sampling and Reconstruction of Analog Signals With Aliasing
K L UNIVERSITY ELECTRONICS AND COMMUNICATION ENGINEERING
frequency present in the signal. Where fmax is the largest frequency component in the analog signal. With
the sampling rate selected in this manner, any frequency component, say |F i| < fmax, in the analog signal
is mapped into a discrete-time sinusoid with a frequency.
Fmax=Fs/2=1/2T
Ωmax=πFs=π/T
-1/2≤fi=Fi/Fs≤1/2 or -π≤ωi=2πfi≤π
If the highest frequency contained in an analog signal Xa(t) is fmax = B and the signal is sampled at a
rate Fs > 2fmax = 2B then Xa(t) can be exactly recovered from its sample values using the interpolation
function.
g(t)=
Thus Xa(t) may be expressed as
Xa(t)=
When sampling of Xa(t) is performed at the minimum sampling rate Fs=2B then the reconstruction formula
becomes
Fig.3.1 Fourier Transform of a band limited function
The sampling rate Fn==2B=2fmax is called the Nyquist rate. The Nyquist rate, named after Harry
Nyquist, is twice the bandwidth of a bandlimited function or a bandlimited channel. This term means
two different things under two different circumstances:

Sampling and Reconstruction of Analog Signals With Aliasing
K L UNIVERSITY ELECTRONICS AND COMMUNICATION ENGINEERING
1. As a lower bound for the sample rate for alias-free signal sampling[1] (not to be confused with the
Nyquist frequency, which is half the sampling rate of a discrete-time system) and
2. As an upper bound for the symbol rate across a bandwidth-limited baseband channel such as a
telegraph line or passbandchannel such as a limited radio frequency band or a frequency division
multiplex channel.
The Bandwidth is aslo known as the Nyquist frequency and the twice the band width is known as the
Nyquist rate. The sampling frequency must be exceeded in order to avoid the aliasing effects.
CHAPTER 4
4. RECONSTRUCTION OF SIGNALS:
We have discussed that a band limited signal x(t) can be reconstructed from its samples if the sampling
rate is nyquist rate. This reconstruction is accomplished by passing the sampled signal through an ideal low
pass filter of bandwidth D Hz. That sampled signal must be passed through an ideal low pass filter having
bandwidth D Hz and gain T. This is the description for the process of reconstruction in the frequency
domain to find the DTFT of the discrete-time signal.
Fig.4.1 Reconstruction n the frequency domain to find DTFT This
reconstruction can be thought of as a 2-step process:
• First the samples are converted into a weighted impulse train.
Sampling and Reconstruction of Analog Signals With Aliasing
K L UNIVERSITY ELECTRONICS AND COMMUNICATION ENGINEERING
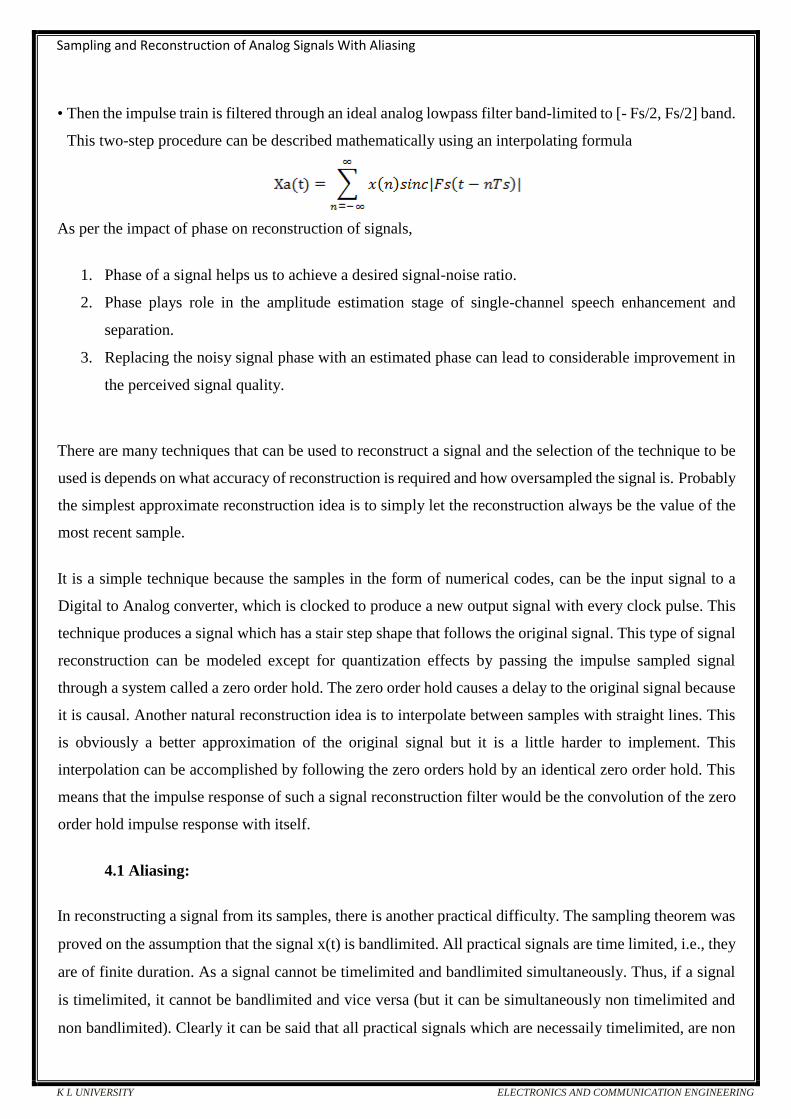
• Then the impulse train is filtered through an ideal analog lowpass filter band-limited to [- Fs/2, Fs/2] band.
This two-step procedure can be described mathematically using an interpolating formula
As per the impact of phase on reconstruction of signals,
1. Phase of a signal helps us to achieve a desired signal-noise ratio.
2. Phase plays role in the amplitude estimation stage of single-channel speech enhancement and
separation.
3. Replacing the noisy signal phase with an estimated phase can lead to considerable improvement in
the perceived signal quality.
There are many techniques that can be used to reconstruct a signal and the selection of the technique to be
used is depends on what accuracy of reconstruction is required and how oversampled the signal is. Probably
the simplest approximate reconstruction idea is to simply let the reconstruction always be the value of the
most recent sample.
It is a simple technique because the samples in the form of numerical codes, can be the input signal to a
Digital to Analog converter, which is clocked to produce a new output signal with every clock pulse. This
technique produces a signal which has a stair step shape that follows the original signal. This type of signal
reconstruction can be modeled except for quantization effects by passing the impulse sampled signal
through a system called a zero order hold. The zero order hold causes a delay to the original signal because
it is causal. Another natural reconstruction idea is to interpolate between samples with straight lines. This
is obviously a better approximation of the original signal but it is a little harder to implement. This
interpolation can be accomplished by following the zero orders hold by an identical zero order hold. This
means that the impulse response of such a signal reconstruction filter would be the convolution of the zero
order hold impulse response with itself.
4.1 Aliasing:
In reconstructing a signal from its samples, there is another practical difficulty. The sampling theorem was
proved on the assumption that the signal x(t) is bandlimited. All practical signals are time limited, i.e., they
are of finite duration. As a signal cannot be timelimited and bandlimited simultaneously. Thus, if a signal
is timelimited, it cannot be bandlimited and vice versa (but it can be simultaneously non timelimited and
non bandlimited). Clearly it can be said that all practical signals which are necessaily timelimited, are non

Sampling and Reconstruction of Analog Signals With Aliasing
K L UNIVERSITY ELECTRONICS AND COMMUNICATION ENGINEERING
bandlimited, they have infinite bandwidth and the spectrum X'(f) consists of overlapping cycles of X(f)
repeating every fs Hz (sampling frequency). Because of infinite bandwidth, the spectral overlap will always
be present regardless of what ever may be the sampling rate chosen. Because of the overlapping tails,X'(f)
has not complete information about X(f) and it is not possible, even theoretically to recover x(t) from the
sampled signal x'(t).
The loss of the tail of X(f) beyond |f | > fs/2 Hz. The reappearance of this tail inverted or folded onto the
spectrum. The spectra cross at frequency fs/2 = 1/2T Hz. This frequency is called the folding frequency.
The spectrum folds onto itself at the folding frequency. For instance, a component of frequency (fs/2)+ fx
shows up as or act like a component of lower frequency (fs/2)- fx in the reconstructed signal. Thus the
components of frequencies above fs/2 reappear as components of frequencies below fs/2. This tail inversion
is known as spectral folding or aliasing which is shown in Fig. 5. In this process of aliasing not only we are
losing all the components of frequencies above fs/2Hz, but these very components reappear as lower
frequency components. This reappearance destroys the integrity of the lower frequency components.
4.2 Sampling and reconstruction in digital signal processing:
Fig.4.2 ideal digital processing of analog signal
1. CD converter produces a sequence x[n] from x(t).
2. X[n] is processed in discrete-time domain to give y(n).
3. DC converted creates y(t) from y[n].
Sampling and Reconstruction of Analog Signals With Aliasing
K L UNIVERSITY ELECTRONICS AND COMMUNICATION ENGINEERING
Fig.4.3 Practical digital processing of an analog signal
Anti-aliasing filter is a filter which is used before a signal sampler, to restrict the bandwidth of a signal to
approximately satisfy the sampling theorem. The potential defectors are all the frequency components
beyond fs/2 Hz. We should have to eliminate these components from x(t) before sampling x(t). As a result
of this we lose only the components beyond the folding frequency fs/2 Hz. These frequency components
cannot reappear to corrupt the components with frequencies below the folding frequency. This suppression
of higher frequencies can be accomplished by an ideal filter of bandwidths f/2 Hz. This filter is called the
anti-aliasing filter. The anti-aliasing operation must be performed before the signal is sampled. The anti-
aliasing filter, being an ideal filter is unrealizable. In practice, we use a steep cutoff filter, which leaves a
sharply attenuated residual spectrum beyond the folding frequency fs/2.
1. X(t) may not be precisely band limited , a low pass filter or anti-aliasing filter is needed to process
x(t).
2. Ideal CD converter is approximated by AD converter
• Not practical to generate δ(t)
• AD converter introduces quantization error.
3. Ideal DC converter is approximated by DA converter because ideal reconstruction of is impossible
Not practical to perform infinite summation Not practical to have future data.
CHAPTER 5
5.1 INTERPOLATION:
The process of reconstructing a continuous time signal x(t) from its samples is known as interpolation.
Interpolation is often has a number of data points, obtained by the sampling or experimentation, which
represent the values of a function for a limited number of values of the independent variable. It is often
required to interpolate the value of that function for an intermediate value of the independent variable. This
may be achieved by curve fitting or regression analysis. Another interpretation of is that it is an infinite-
order interpolation. We want finite-order (and in fact low-order) interpolations.
.
Sinc Interpolation:
Sinc interpolation is a method to construct a continuous-time bandlimited function from a sequence of real
numbers.

Sampling and Reconstruction of Analog Signals With Aliasing
K L UNIVERSITY ELECTRONICS AND COMMUNICATION ENGINEERING
Fig 5.2 Sinc Interpolation
The function sinc(x) is defined by sinc(x)=sin(x)/x for x≠0, with sinc(0)=1. The above formula represents
a linear convolution between the sequences Xn and scaled and shifted samples of the sinc function. In this
Demonstration, a limited number of samples Xn are generated, and the above sum is carried out for N
samples, labeled from k=0 to x=k(n-1). Due to the shifting of the sinc function by integer multiples of T,
this results in x(t) having the exact value of a sample located at a multiple of . This can be seen by
observing that the absolute error is always zero at times which are integer multiples of , in other words at
the sample locations. In this implementation, the sinc function is sampled at a much higher rate than the
sampling frequency used for the original function, in order to produce a smoother plotted result
5.2 FILTERS:
A filter is a device or process that removes from a signal some unwanted component or feature. Filters are
used to remove frequencies and others in order to suppress interfering signals and reduce background
noise . In signal processing, a filter is a device or process that removes from a signal some unwanted
component or feature. Filtering is a class of signal processing, the defining feature of filters being the
complete or partial suppression of some aspect of the signal. Most often, this means removing some
frequencies and not others in order to suppress interfering signals and reduce background noise. However,
filters do not exclusively act in the frequency domain; especially in the field of image processing many
other targets for filtering exist. Correlations can be removed for certain frequency components and not for
others without having to act in the frequency domain. The frequency response can be classified into a
number of different band forms describing which frequency bands the filter passes (the pass band) and
which it rejects:
• Low-pass filter – low frequencies are passed, high frequencies are attenuated.

Sampling and Reconstruction of Analog Signals With Aliasing
K L UNIVERSITY ELECTRONICS AND COMMUNICATION ENGINEERING
• High-pass filter – high frequencies are passed, low frequencies are attenuated.
• Band-pass filter – only frequencies in a frequency band are passed.
• Band-stop filter or band-reject filter – only frequencies in a frequency band are attenuated.
• Notch filter – rejects just one specific frequency - an extreme band-stop filter.
• Comb filter – has multiple regularly spaced narrow passbands giving the bandform the appearance
of a comb.
Figure 5.3 Different types of filters
• All-pass filter – all frequencies are passed, but the phase of the output is modified
CHAPTER 6
TASKS AND THEIR RESULTS:
1. Task1: Consider an analog signal 4+2*cos(150*pi*t+pi/3)+4*sin(350*pi*t) Generate and plot this
signal and its spectrum.
clear all; close all; clc; fs=100000; N=3000; Ts=1/fs; t = -(N/2)*Ts:Ts:((N/2)-1)*Ts; m = 4+2*cos(150*pi*t+pi/3)+4*sin(350*pi*t); f1 = (-N/2:1:N/2-1)*fs/N; M =
(2/N)*fftshift(fft(m)); Ma = abs(M); figure(1); subplot(2,1,1); plot(t,m/max(m), 'm', 'LineWidth',2);axis([-0.01 0.01 -1.2 1.2]); grid on; subplot(2,1,2);

Sampling and Reconstruction of Analog Signals With Aliasing
K L UNIVERSITY ELECTRONICS AND COMMUNICATION ENGINEERING
plot(f1,Ma/max(Ma),'r','Linewidth',2); axis([-800 800 -0.001 1.2]); xlabel('frequency'); ylabel('Magnitude|'); title(' Magnitude Spectrum'); grid
on;
Task2: Perform an ideal ADC operation to generate discrete-time sequence x[n] from analog
signal xa(t). Assume that the sampling frequency Fs=200 sam/sec. Plot x[n] and its DTFT, X[e jw]
clc;clear all;close all; Dt
= 0.1; t = -5:Dt:5; Ts =
0.005; n = -25:1:25; x = 4+2*cos((150*pi*n/200)+pi/3)+4*sin((350*pi*n/200)-2*pi*n); figure(); subplot(2,1,1) plot(n*Ts*1000,x); subplot(2,1,2); stem(n*Ts*1000,x); K = 1000; k = 0:1:K; w = pi*k/K; X
= x * exp(-i*n'*w); X = real(X); w = [-fliplr(w), w(2:K+1)]; X = [fliplr(X), X(2:K+1)]; %figure(); %stem(w/pi,X); figure() plot(w/pi,X)
-800 -600 -400 -200 0 200 400 600 800 0
0.5
1
frequency
Magnitude Spectrum

Sampling and Reconstruction of Analog Signals With Aliasing
K L UNIVERSITY ELECTRONICS AND COMMUNICATION ENGINEERING
Task 3: The filtered signal is applied as input to an ideal DAC (i.e., an ideal interpolator) to obtain the
analog signal ya(t). The ideal DAC is also operating at Fs=200 sam/sec. Obtain the reconstructed
signal ya(t) and determine whether sampling / reconstruction operation resulted in any aliasing
clc;close all;clear all;
Ts = 0.005; Fs = 1/Ts; n = -50:1:50; nTs = n*Ts;
-150 -100 -50 0 50 100 150 -5
0
5
10
-1 -0.8 -0.6 -0.4 -0.2 0 0.2 0.4 0.6 0.8 1 -50
0
50
100
150
200
250

Sampling and Reconstruction of Analog Signals With Aliasing
K L UNIVERSITY ELECTRONICS AND COMMUNICATION ENGINEERING
x = 4+2*cos((150*pi*n*Ts)+pi/3)+4*sin((350*pi*n*Ts)-2*pi*n);
Dt = 0.0000005;
t = -0.005:Dt:0.005;
xa = x * sinc(Fs*(ones(length(nTs),1)*t-nTs'*ones(1,length(t))))
plot(t*1000,xa);
CONCLUSION:
By doing this project we have understood about the sampling and the impact of the phase on the sampling
and reconstruction of signals. We have taken an analog signal and then sampled it at certain phase and
reconstructed the sampled signal at a particular time period and analysed the spectrum signal. We have
reconstructed the signal by using various interpolation methods. We have understood of sampling,
reconstruction of signal, interpolation and the impact of phase on sampling and reconstruction of signals.
REFERENCES:
[I]Solution-manual-Digital-Signal-Processing-Using-Matlab-Proakis-2-edition.
[2] Digital signal processing using matlab by proakis and vinay.k 3rd edition.
[3]Digital signal processing by proakis 3rd edition.
[4] F. Kaiser, "Nonrecursive digital filter design using IO- sinh window function" in Proc. IEEE Int. Symp.
Circuits and Systems (ISCAS74), San Francisco, Calif, USA, 1974, pp.20-23
-5 -4 -3 -2 -1 0 1 2 3 4 5 -1
0
1
2
3
4
5
6
7
8
Related Documents