Sample Graphs/Charts

Sample Graphs/Charts
Dec 31, 2015
Sample Graphs/Charts. Seashore/Ocean Biome. - PowerPoint PPT Presentation
Welcome message from author
This document is posted to help you gain knowledge. Please leave a comment to let me know what you think about it! Share it to your friends and learn new things together.
Transcript
Sample Graphs/Charts
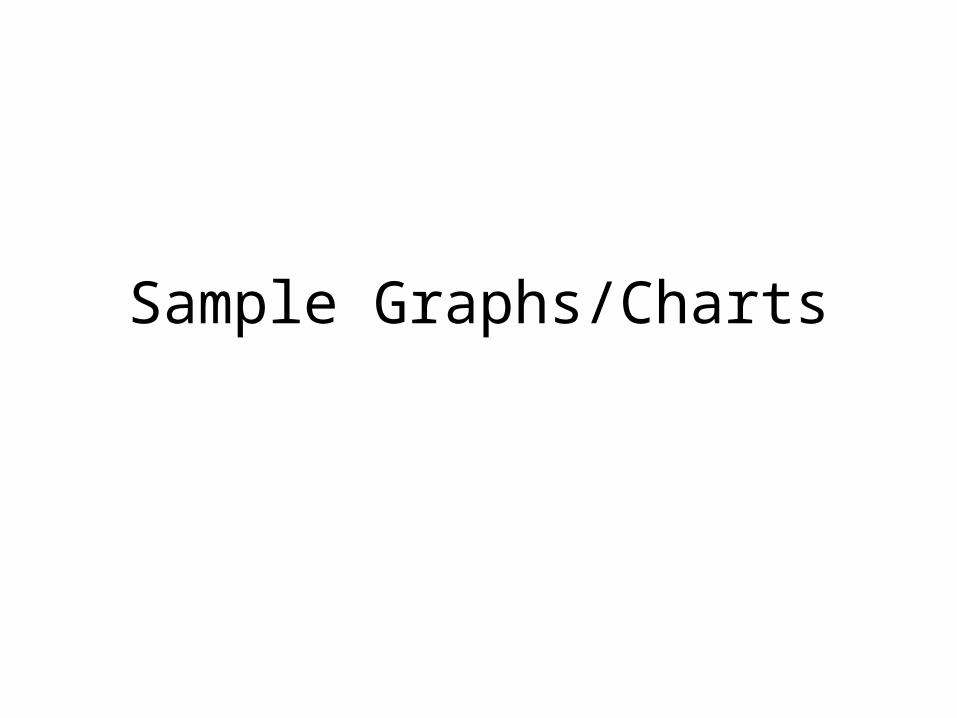
Seashore/Ocean Biome
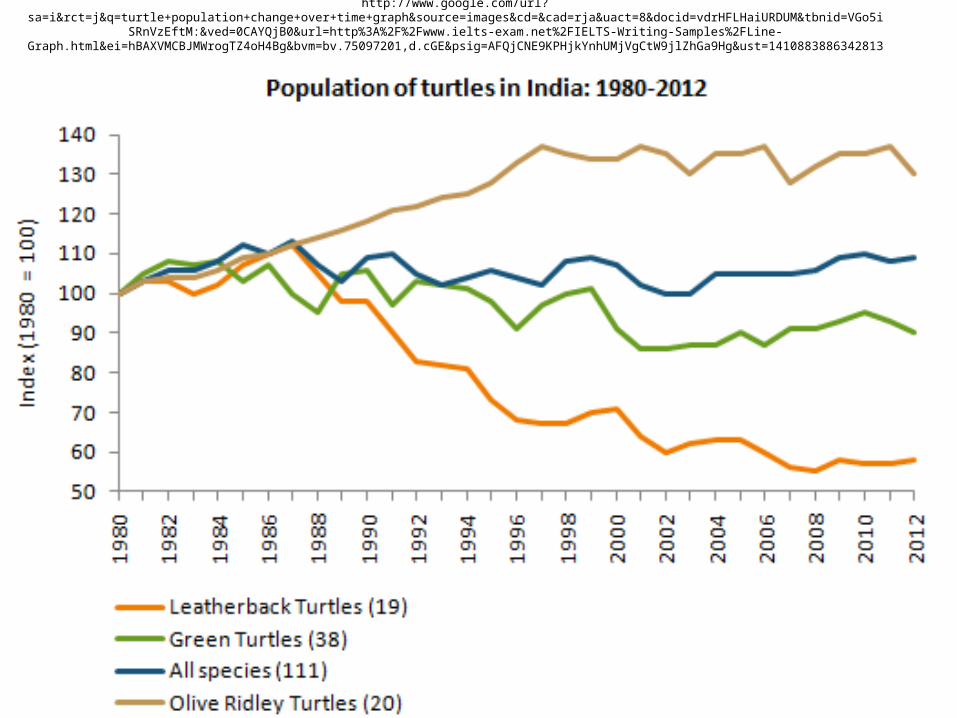
http://www.google.com/url?sa=i&rct=j&q=turtle+population+change+over+time+graph&source=images&cd=&cad=rja&uact=8&docid=vdrHFLHaiURDUM&tbnid=VGo5iSRnVzEftM:&ved=0CAYQjB0&url=http
%3A%2F%2Fwww.ielts-exam.net%2FIELTS-Writing-Samples%2FLine-Graph.html&ei=hBAXVMCBJMWrogTZ4oH4Bg&bvm=bv.75097201,d.cGE&psig=AFQjCNE9KPHjkYnhUMjVgCtW9jlZhGa9Hg&ust=1410883886342813
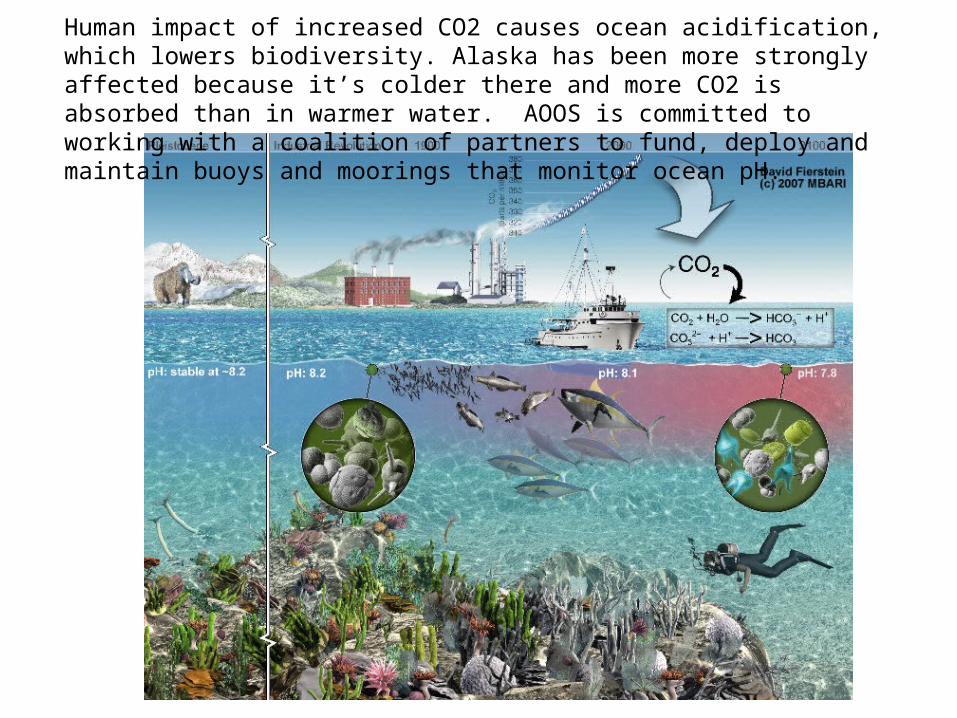
Human impact of increased CO2 causes ocean acidification, which lowers biodiversity. Alaska has been more strongly affected because it’s colder there and more CO2 is absorbed than in warmer water. AOOS is committed to working with a coalition of partners to fund, deploy and maintain buoys and moorings that monitor ocean pH.
Related Documents