Mühendislik Bilimleri ve Tasarım Dergisi 8(3), 783 – 790, 2020 e-ISSN: 1308-6693 Araştırma Makalesi Journal of Engineering Sciences and Design DOI: 10.21923/jesd.745275 Research Article 783 SAMPLE ENTROPY ANALYSIS OF HEART RATE VARIABILITY IN RR INTERVAL DETECTION Veysel ALCAN * Tarsus University, Engineering Faculty, Department of Electrical and Electronics Engineering, Tarsus, Mersin Turkey Keywords Abstract Sample Entropy, Heart Rate Variability, Noisy Factor, Irregularity. Entropy is a robust method that is able to measure irregularities or the general behavior of the complex time series which could be continuously interact with many different and independent factors in time. This study aimed to investigate the sample entropy measurement of heart rate variability (HRV) for evaluating of 50Hz interference and baseline wander (BW) noise effects on RR interval. Three different synthetic electrocardiogram (ECG) signals were recorded using the simulator device. Sample Entropy (SampEn) values of full length and windowed length of data were calculated to track and identify RR intervals. It was found that adult normal sinus rhythm (NSR) signal without noise had the most regular and consistent results while adult ECG signal with BW noisy had the most irregular and inconsistent results. Furthermore, the BW noisy had more effect on irregularity ECG signal than 50 Hz interference. Consequently, the SampEn provided the measurement of irregularity and randomness of ECG data. However, it was found that the determination of RR intervals for classification and decision support systems was not practical in real-time analysis of HRV from raw ECG recordings because of noisy affect. RR INTERVAL TESPİTİNDE KALP ATIM HIZI DEĞİŞKENLİĞİNİN ÖRNEK ENTROPİ ANALİZİ Anahtar Kelimeler Öz Örnek Entropy, Kalp Hızı Değişkenliği, Gürültü Faktörü, Düzensizlik. Entropi, zaman içinde birçok farklı ve bağımsız faktörlerle sürekli olarak etkileşime girebilecek karmaşık zaman serilerinin düzensizliklerini veya genel davranışlarını ölçebilen sağlam bir yöntemdir. Bu çalışma, 50Hz gürültüsünün ve taban hattı kayması (BW) gürültüsünün RR aralığı üzerindeki etkilerini değerlendirmek için kalp hızı değişkenliğinin (HRV) örnek entropi (SampEn) ölçümünü araştırmayı amaçlamıştır. Stimülatör cihazı kullanılarak üç farklı sentetik elektrokardiyogram (EKG) sinyali kaydedilmiştir. RR aralıklarını izlemek ve tanımlamak için tam uzunluktaki ve pencereli veri uzunluğundaki SampEn değerleri hesaplanmıştır. BW gürültüsüne sahip yetişkin EKG sinyali en düzensiz ve tutarsız sonuçlara sahipken Gürültüsüz erişkin Normal Sinüs Ritim (NSR) sinyalinin en düzenli ve tutarlı sonuçlara sahip olduğu bulunmuştur. Ayrıca, EKG sinyali üzerindeki düzensizliklerde BW gürültüsü 50 Hz gürültüsüne göre daha fazla etkiye sahipti. Sonuç olarak, SampEn, EKG verilerinin düzensizliği ve rasgeleliğinin ölçülmesini sağlamıştır. Bununla birlikte, sınıflandırma ve karar destek sistemleri için RR aralıklarının belirlenmesi, gürültülü etki nedeniyle ham EKG kayıtlarından HRV'nin gerçek zamanlı analizinde pratik olmadığı bulunmuştur. Alıntı / Cite Alcan, V., (2020). Sample Entropy Analysis Of Heart Rate Variability In RR Interval Detection, Journal of Engineering Sciences and Design, 8(3), 783-790. * İlgili yazar / Corresponding author: [email protected], +90-324-600-0033

Welcome message from author
This document is posted to help you gain knowledge. Please leave a comment to let me know what you think about it! Share it to your friends and learn new things together.
Transcript
Mühendislik Bilimleri ve Tasarım Dergisi 8(3), 783 – 790, 2020 e-ISSN: 1308-6693
Araştırma Makalesi
Journal of Engineering Sciences and Design DOI: 10.21923/jesd.745275
Research Article
783
SAMPLE ENTROPY ANALYSIS OF HEART RATE VARIABILITY IN RR INTERVAL DETECTION
Veysel ALCAN*
Tarsus University, Engineering Faculty, Department of Electrical and Electronics Engineering, Tarsus, Mersin
Turkey
Keywords Abstract Sample Entropy, Heart Rate Variability, Noisy Factor, Irregularity.
Entropy is a robust method that is able to measure irregularities or the general behavior of the complex time series which could be continuously interact with many different and independent factors in time. This study aimed to investigate the sample entropy measurement of heart rate variability (HRV) for evaluating of 50Hz interference and baseline wander (BW) noise effects on RR interval. Three different synthetic electrocardiogram (ECG) signals were recorded using the simulator device. Sample Entropy (SampEn) values of full length and windowed length of data were calculated to track and identify RR intervals. It was found that adult normal sinus rhythm (NSR) signal without noise had the most regular and consistent results while adult ECG signal with BW noisy had the most irregular and inconsistent results. Furthermore, the BW noisy had more effect on irregularity ECG signal than 50 Hz interference. Consequently, the SampEn provided the measurement of irregularity and randomness of ECG data. However, it was found that the determination of RR intervals for classification and decision support systems was not practical in real-time analysis of HRV from raw ECG recordings because of noisy affect.
RR INTERVAL TESPİTİNDE KALP ATIM HIZI DEĞİŞKENLİĞİNİN ÖRNEK ENTROPİ ANALİZİ
Anahtar Kelimeler Öz Örnek Entropy, Kalp Hızı Değişkenliği, Gürültü Faktörü, Düzensizlik.
Entropi, zaman içinde birçok farklı ve bağımsız faktörlerle sürekli olarak etkileşime girebilecek karmaşık zaman serilerinin düzensizliklerini veya genel davranışlarını ölçebilen sağlam bir yöntemdir. Bu çalışma, 50Hz gürültüsünün ve taban hattı kayması (BW) gürültüsünün RR aralığı üzerindeki etkilerini değerlendirmek için kalp hızı değişkenliğinin (HRV) örnek entropi (SampEn) ölçümünü araştırmayı amaçlamıştır. Stimülatör cihazı kullanılarak üç farklı sentetik elektrokardiyogram (EKG) sinyali kaydedilmiştir. RR aralıklarını izlemek ve tanımlamak için tam uzunluktaki ve pencereli veri uzunluğundaki SampEn değerleri hesaplanmıştır. BW gürültüsüne sahip yetişkin EKG sinyali en düzensiz ve tutarsız sonuçlara sahipken Gürültüsüz erişkin Normal Sinüs Ritim (NSR) sinyalinin en düzenli ve tutarlı sonuçlara sahip olduğu bulunmuştur. Ayrıca, EKG sinyali üzerindeki düzensizliklerde BW gürültüsü 50 Hz gürültüsüne göre daha fazla etkiye sahipti. Sonuç olarak, SampEn, EKG verilerinin düzensizliği ve rasgeleliğinin ölçülmesini sağlamıştır. Bununla birlikte, sınıflandırma ve karar destek sistemleri için RR aralıklarının belirlenmesi, gürültülü etki nedeniyle ham EKG kayıtlarından HRV'nin gerçek zamanlı analizinde pratik olmadığı bulunmuştur.
Alıntı / Cite Alcan, V., (2020). Sample Entropy Analysis Of Heart Rate Variability In RR Interval Detection, Journal of Engineering Sciences and Design, 8(3), 783-790.
* İlgili yazar / Corresponding author: [email protected], +90-324-600-0033
ALCAN 10.21923/jesd.745275
784
Yazar Kimliği / Author ID (ORCID Number) Makale Süreci / Article Process V. Alcan, 0000-0002-7786-8591
Başvuru Tarihi / Submission Date Revizyon Tarihi / Revision Date Kabul Tarihi / Accepted Date Yayım Tarihi / Published Date
29.05.2020 01.07.2020 07.07.2020 24.09.2020
1. Introduction Heart rate variability (HRV) have a strong relationship with heart rate. Therfore, this is gold standard clinical tool to assess cardiovascular autonomic function and cardiac event risks (Villarel et al,, 2002). HRV represents the variability of intervals between consecutive R-peaks (RR) on QRS complex measured on the electrocardiogram (ECG) signal (Malik et al., 1196). Irregular and decreased HRV is associated with numerous pathologies for cardiac events, including sudden cardiac death. Over the past decades, HRVmeasurement from the wearable ECG systems became so popular and have been conducted to wide applications (Guo et al., 2015; Rosenberg et al., 2013; Baig et al., 2013). These systems are utilized for long-term monitoring of the cardiovascular-related diseases and provide decision support system. Although HRV has traditionally been analyzed using linear methods such as time and frequency domain analysis as well as nonlinear dynamic analysis techniques depends in which the time series requires characterizing the signal according to its characteristics such as linear, nonlinear, random and chaotic (Pincus, 1991; Richman and Moorman, 2000; Lake et al., 2002). For accurate HRV measurements, it is very important to analyze normal RR intervals by excluding abnormal RR intervals come from ectopic pulses, noise, artifacts, etc. The exclusion of abnormal RR is possible with short-term clinical ECG recordings under standard conditions where the recorded signals typically contain minimal artifacts. However, it is inevitable the abnormal beats and artifacts appear in ECG signals in long-term recordings and moving conditions of subject. In addition, abnormal RR intervals may be caused by fluctuations in body function such as the body's response to changes in reflexes, physical activity, hormones, endocrine, temperature, as well as the state of the changes dynamism related to physiological or pathological events such as circadian rhythms (Steşn et al., 2005; Kleiger et al., 2005). It is therefore a difficult task to identify and interpret abnormal RR intervals because of its complexity and irregularity, in particular in long-term recordings (24 hours and over). The quantifiy measurement of the complexity could provide usefull information from nonlinear properties rather any analysis using time domain measurements. Therefore, entropy has recently emerged as a remarkable method for the analysis of nonlinear dynamic time series and quantitative measurement of complexity when many different and independent elements are continuously interacting in time (Pincus, 1991; Richman and Moorman, 2000; Ferrario et al., 2006). Many entropy algorithms have been introduced for complexity measurement, for example, approximate entropy (ApEn), sample entropy (SampEn), multiscale entropy (MSE), fuzzy entropy (FuzzyEn), permutation entropy (PerEn), distribution entropy (DistEn) etc. Initially, ApEn was developed to classify medical systems such as heartbeats (Pincus, 1991). ApEn measures the likelihood that the patterns obtained in the m dimension are similar in subsequent incremental comparisons. The likelihood of being similar implies higher regularity. And this produces smaller ApEn values or vice versa. Consequently, the conditional probabilities in the correlation integral determine the ApEn value. However, ApEn has bias such as the inclusion of self-matching of template vectors in the calculations, being largely dependent on data length and lack of consistency in predictions. Therefore, SampEn algorithm was introduced the to address ApEn biases. (Richman and Moorman, 2000). In practice, however, there are some difficulties in applying complexity measures, such as the effect of noise, lengths of data or parameter settings (Xiong et al., 2017; Kuntzelman et al., 2018, Kaya et al., 2019; Alcan and Uçar, 2019). Thus, in order to investigate what are the limitation of entropy measures from time series with various types noisy and how to provide appropriate interpretations, this study presents the sample entropy measurement of HRV for evaluating of the powerline interference and baseline wander (BW) noise afftects on RR interval using the windowing analysis. 2. Material and Method 2.1. Data ECG data was recorded from Fluke ProSim 8 vital sign patient monitor simulator device (Fluke Corp., Everett WA, USA). Data was sampled by the CED Micro1401 data acquisition (DAQ) unit (Cembridge Electronic Design Ltd, UK). DAQ unit was coupled with simultaneous output of simulator device at 360 Hz sampling rate, 16 bit resolution, and ±5V input ranges. Data was stored on PC for further analysis (Figure 1) Raw ECG signals can often contain various artefacts and noises, such as baseline wander, powerline interference, EMG noise and electrode motion artifacts. Thus, three different types of ECG signals from the simülatör were recorded (Figure 2). We determined the physiological parameters and morpology of the normal sinus rhtym (NSR) ECG signals according to the range of values of a normal (healthy) adult person.
ALCAN 10.21923/jesd.745275
785
Figure 1. Schematic representation of data recording process
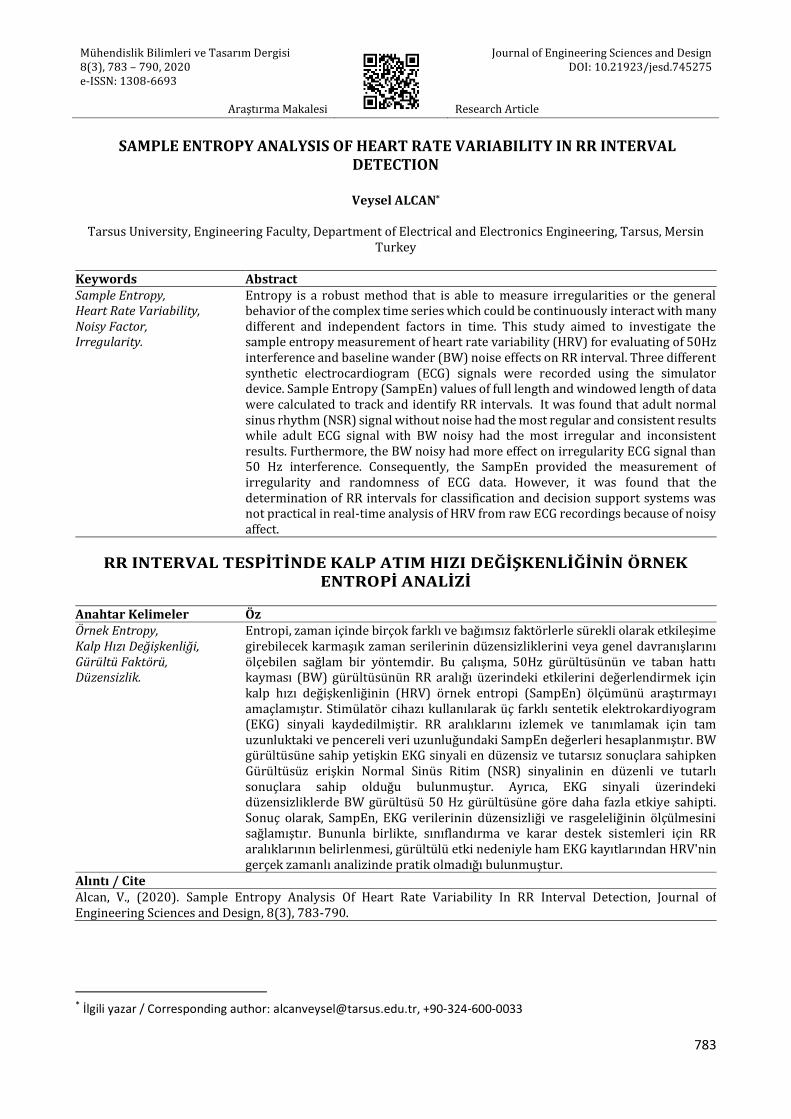
Figure 2. The synthetic NSR recorded from simulator device a) without noise b) with 50 Hz power line artifact c) with
baseline wander noise
The first type signal was the noiseless (non-artefact) ECG signal of a normal adult. (Figüre 2a) The second type signal was the NSR signal with 25% 50 Hz alternative current (AC) interference (Figüre 2b) in the output which is one of the major artefact in ECG recording. The third signal was adult NSR signal with 25% baseline wander (BW) noise (Figure 2c). BW is a low frequency artifact in the ECG caused by breathing, electrically charged electrodes, or movement of the person. This artefact and may prevent detection of ST changes. Both the second and the third type of signals with noisy had also a standard deviation of 5% shown in Table 1.
ALCAN 10.21923/jesd.745275
786
Table 1. The properties of the synthetic ECG signals recorded from the stiimulator device
Parameters Normal Sinus Rhtym ECG Signal Types for Adult
Without artefact With 50 Hz AC interference
With Baseline Wander
ECG Rate 60 bpm 60 bpm 60 bpm
Resp Rate 20 brpm 20 brpm 20 brpm
Tempeture 37.0 C 37.0 C 37.0 C
IBP channel 1 120/80 mmHg 120/80 mmHg 120/80 mmHg
IBP channel 2 28/15 mmHg 28/15 mmHg 28/15 mmHg
NIBP 120/80 (93) mmHg 120/80 (93) mmHg 120/80 (93) mmHg
SpO2 97% 97% 97%
ST Devination Off 5% 5%
Amplitude 1.00 mV 1.00 mV 1.00 mV
Artifact Size: non 25% 25%
Artifact Lead non All Leads All Leads
ECG= electrocardiagram, resp rate= resiratory rate, IBP = invasive blood pressure, NIPB = non-invasive blood pressure, SpO2= signal and blood-oxygen saturation, bpm= beats per minute, brpm= breaths per minute, mmHg=millimeters of mercury, Hz= hertz, AC=alternatice
current, mV=milivolt, SD= standard devination
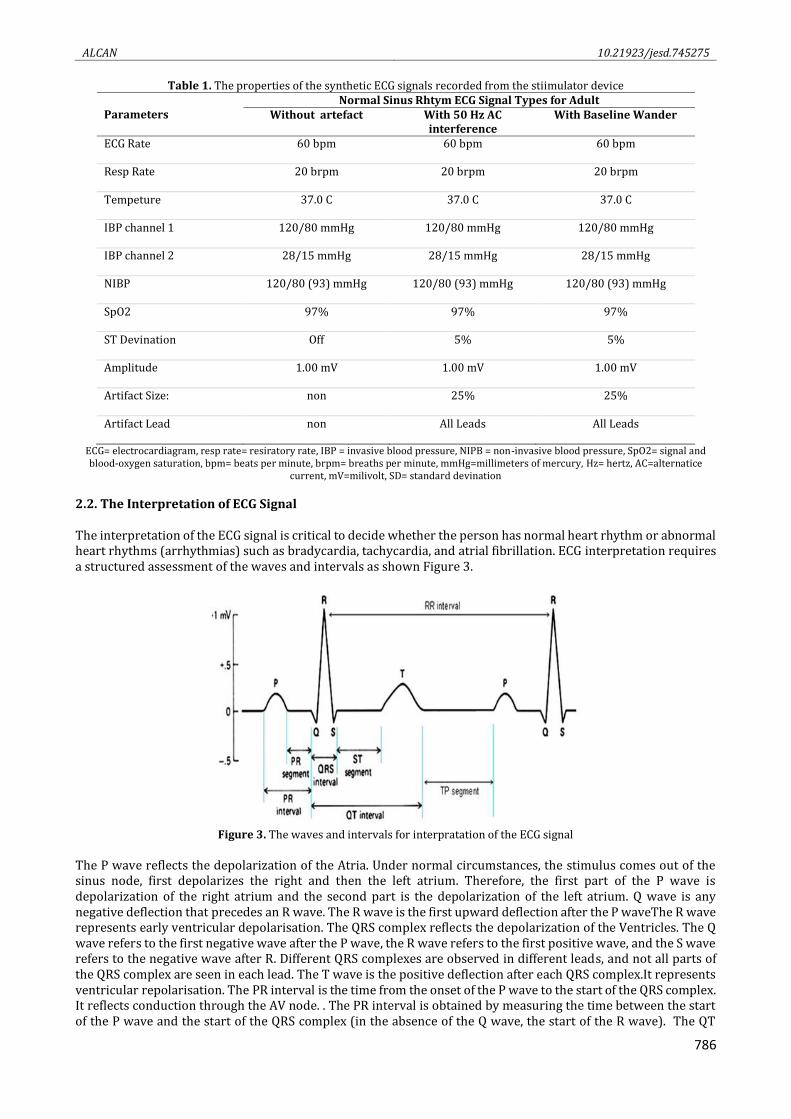
2.2. The Interpretation of ECG Signal The interpretation of the ECG signal is critical to decide whether the person has normal heart rhythm or abnormal heart rhythms (arrhythmias) such as bradycardia, tachycardia, and atrial fibrillation. ECG interpretation requires a structured assessment of the waves and intervals as shown Figure 3.
Figure 3. The waves and intervals for interpratation of the ECG signal
The P wave reflects the depolarization of the Atria. Under normal circumstances, the stimulus comes out of the sinus node, first depolarizes the right and then the left atrium. Therefore, the first part of the P wave is depolarization of the right atrium and the second part is the depolarization of the left atrium. Q wave is any negative deflection that precedes an R wave. The R wave is the first upward deflection after the P waveThe R wave represents early ventricular depolarisation. The QRS complex reflects the depolarization of the Ventricles. The Q wave refers to the first negative wave after the P wave, the R wave refers to the first positive wave, and the S wave refers to the negative wave after R. Different QRS complexes are observed in different leads, and not all parts of the QRS complex are seen in each lead. The T wave is the positive deflection after each QRS complex.It represents ventricular repolarisation. The PR interval is the time from the onset of the P wave to the start of the QRS complex. It reflects conduction through the AV node. . The PR interval is obtained by measuring the time between the start of the P wave and the start of the QRS complex (in the absence of the Q wave, the start of the R wave). The QT
ALCAN 10.21923/jesd.745275
787
interval reflects the total time spent for depolarization and repolarization of the ventricles. The QT interval is determined by measuring the time from the start of the QRS complex to the end of the T wave.The ST segment shows the electrically quiet period between depolarization and repolarization of the ventricles. The ST segment is the range that connects the J (junction) point where the QRS complex ends with the start of the T wave. The ST Segment represents the interval between ventricular depolarization and repolarization. The J point is the the junction between the termination of the QRS complex and the beginning of the ST segment. The RR interval is the time changed between two successive R-waves of the QRS complex on the ECG. 2.3. Sample Entropy In this study, SampEn algorithm was used to effectively predict the randomness, degree of regularity or irregularity of a data set. SampEn (m, r, N) is the negative value of the logarithm of the conditional probability. It counts on all other vectors except for each vector itself, looking for the condition that two similar m-point sequences remain similar at the next m + 1 point. In SampEn, the percentage of Xm (j) vectors within the tolerance range r of Xm (i), excluding self-matching, is calculated by the Equation 1.
𝐴𝑖(𝑚)
(𝑟) = 𝑁𝑖
(𝑚)(𝑟)
𝑁 − mτ − 1′
(1)
where, m denotes the embedded size (length of patterns to be compared), r denotes similarity criterion, τ denotes time delay variable and N denotes the length of the data. Ni (m) (r) denotes the number of js in the range di, j ≤ r, and 1 ≤ j ≤ N - mτ is j ≠ i. Then the percentage average Ai (m) (r) above 1 ≤ i ≤ N - mτ is determined by the Equation 2.
Ѱ 𝑚(𝑟) = 1
𝑁−mτ∑ 𝐴𝑖
(𝑚) (𝑟)𝑁−mτ
𝑖=1
(2)
Similarly, Ѱ (m + 1) (r) is defined after increasing the dimension to m + 1. The SampEn value of the u time series is then defined as the negative natural logarithm of the probability of similar patterns of length m to the probability of similar patterns of length m + 1, and SampEn is calculated with the Equation 3.
𝑆𝑎𝑚𝑝𝐸𝑛 (𝑚, τ, r ) = - ln Ѱ (𝑚+1) (𝑟)
Ѱ (𝑚) (𝑟)
(3) 3. Experimental Results In this study, SampEn parameters were selected as m =2, τ =1, and r= 0.2*SD (Standard Deviation) based on literature. The data length of each ECG signal had 3600 data points. SampEn of ECG signals were calculated with two different approaches. Firstly, SampEn values of full length of data were calcuated. Table 2 shows the analysis results of full length data.
Table 2. Entropy values of the full length data for three different ECG signals
Entropy Algortihm
ECG Adult Normal Sinus Rhtym Signal Types
Without Noisy
50 Hz AC interference
BW Noisy
SampEn 0,0289 0,4240 0,7773
SampEn=sample entropy,BW=baseline wander
As expected from the background of entropy, the SampEn value of the ECG signal without noise is very low while it is high in signals with noisy. This result provides a quantitative measure of regularity or irregularity in signals. In particular, when the algorithm is considered, it is understood that the comparison of the template vectors in the data series of the regular signals is similar to the next vector and therefore the entropy value is low and vice versa. BW type noise appears to have more effect on the randomness or irregularity of the signal than the 50Hz AC interference. This may be due to the fact that the 50 Hz noise is a more regular noise type in terms of reproducibility throughout the series. In other words, the effect of 50 Hz AC interference on signal complexity is less than BW. Both types of noise caused high entropy values rather than pathological conditions. This may lead to controversial for the interpretation of these signals and the validity of entropy calculations. Especially in arrhythmic ECG evaluation, the reason of the high entropy value will be uncertain because of the noise or pathological condition.
ALCAN 10.21923/jesd.745275
788
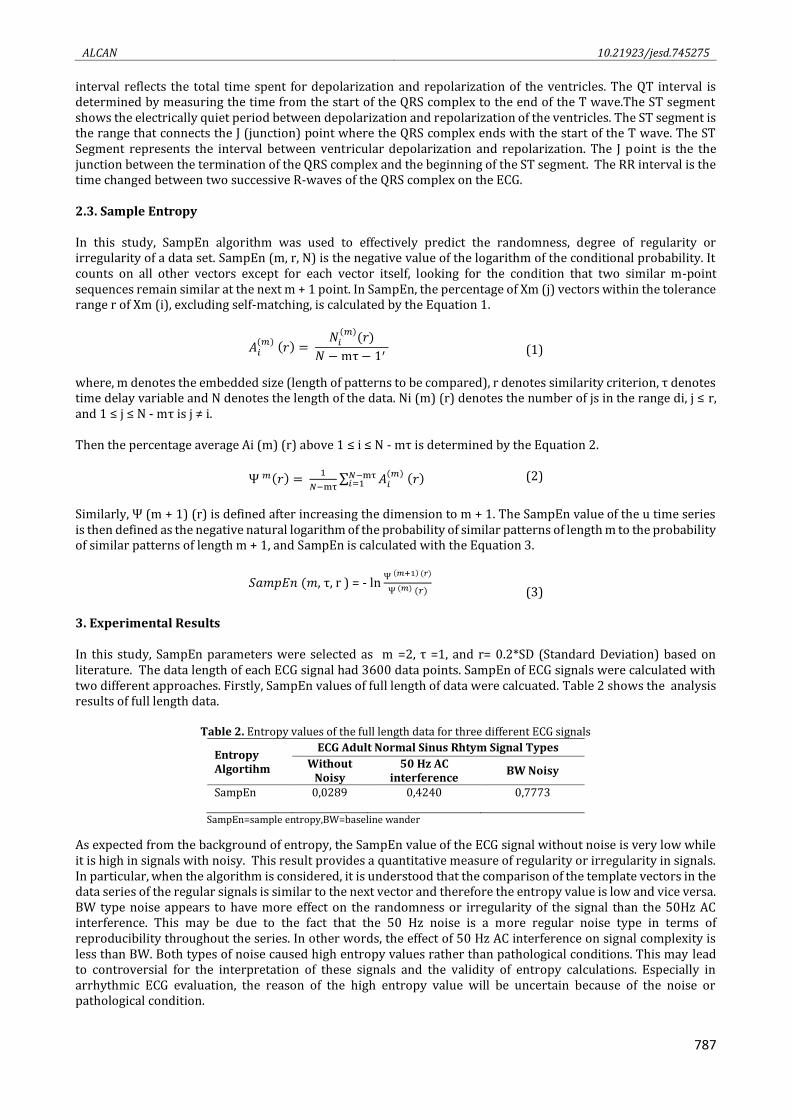
Secondly, windowing technique for the analysis of ECG signals was used to see how SampEn performs to follow the wave and intervals of the ECG signal in particular how sensitive to the noise affect. For windowing technique, the window length was determined as 100 data points. Totally thirty-six intermediate results corresponding to windows were calculated. The overlap between windows was not taken account to avoid more time-consuming for long-term monitoring applications. Figure 4 shows the intermediate values of the entropy for adult NSR signal without noise.
Figure 4. The intermediate values of the entropy for NSR signal without noise
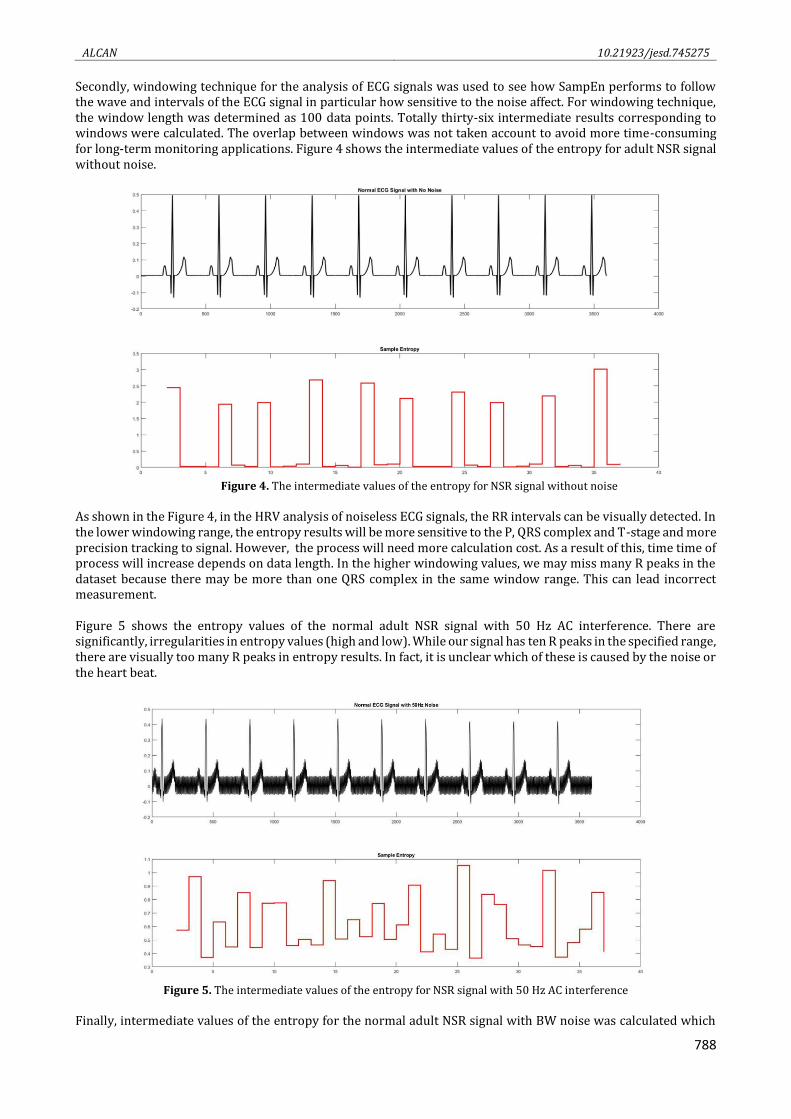
As shown in the Figure 4, in the HRV analysis of noiseless ECG signals, the RR intervals can be visually detected. In the lower windowing range, the entropy results will be more sensitive to the P, QRS complex and T-stage and more precision tracking to signal. However, the process will need more calculation cost. As a result of this, time time of process will increase depends on data length. In the higher windowing values, we may miss many R peaks in the dataset because there may be more than one QRS complex in the same window range. This can lead incorrect measurement. Figure 5 shows the entropy values of the normal adult NSR signal with 50 Hz AC interference. There are significantly, irregularities in entropy values (high and low). While our signal has ten R peaks in the specified range, there are visually too many R peaks in entropy results. In fact, it is unclear which of these is caused by the noise or the heart beat.
Figure 5. The intermediate values of the entropy for NSR signal with 50 Hz AC interference
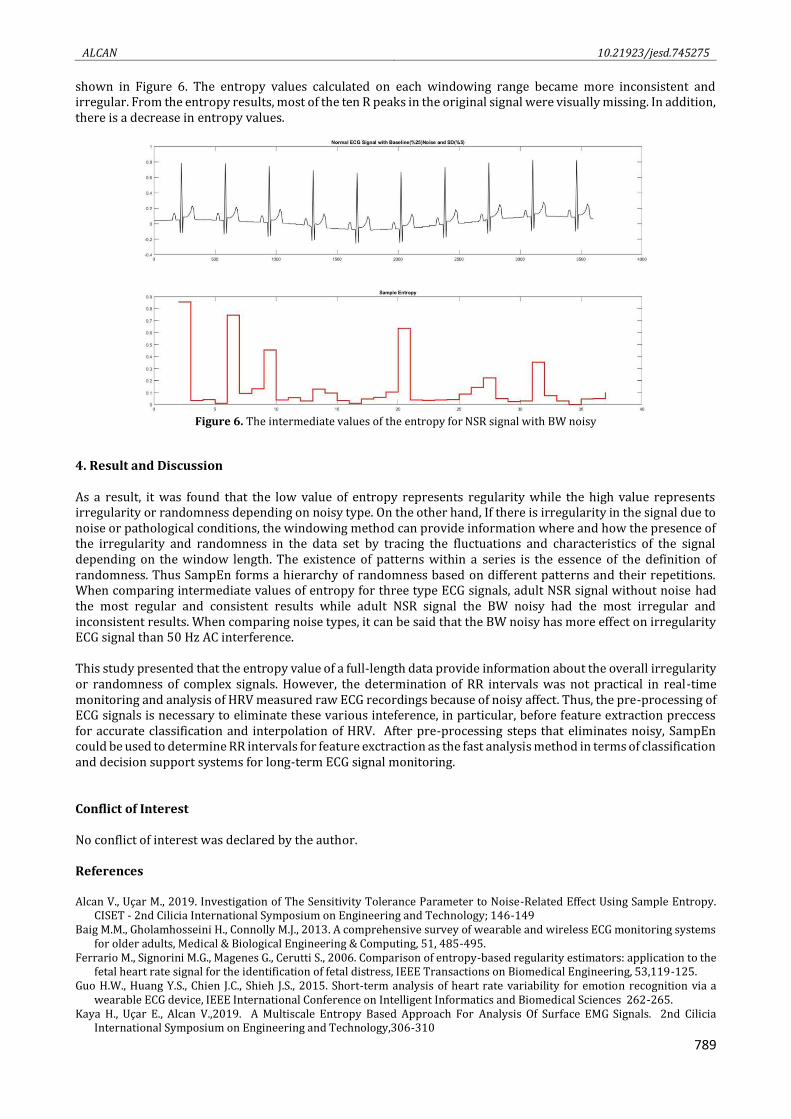
Finally, intermediate values of the entropy for the normal adult NSR signal with BW noise was calculated which
ALCAN 10.21923/jesd.745275
789
shown in Figure 6. The entropy values calculated on each windowing range became more inconsistent and irregular. From the entropy results, most of the ten R peaks in the original signal were visually missing. In addition, there is a decrease in entropy values.
Figure 6. The intermediate values of the entropy for NSR signal with BW noisy
4. Result and Discussion As a result, it was found that the low value of entropy represents regularity while the high value represents irregularity or randomness depending on noisy type. On the other hand, If there is irregularity in the signal due to noise or pathological conditions, the windowing method can provide information where and how the presence of the irregularity and randomness in the data set by tracing the fluctuations and characteristics of the signal depending on the window length. The existence of patterns within a series is the essence of the definition of randomness. Thus SampEn forms a hierarchy of randomness based on different patterns and their repetitions. When comparing intermediate values of entropy for three type ECG signals, adult NSR signal without noise had the most regular and consistent results while adult NSR signal the BW noisy had the most irregular and inconsistent results. When comparing noise types, it can be said that the BW noisy has more effect on irregularity ECG signal than 50 Hz AC interference. This study presented that the entropy value of a full-length data provide information about the overall irregularity or randomness of complex signals. However, the determination of RR intervals was not practical in real-time monitoring and analysis of HRV measured raw ECG recordings because of noisy affect. Thus, the pre-processing of ECG signals is necessary to eliminate these various inteference, in particular, before feature extraction preccess for accurate classification and interpolation of HRV. After pre-processing steps that eliminates noisy, SampEn could be used to determine RR intervals for feature exctraction as the fast analysis method in terms of classification and decision support systems for long-term ECG signal monitoring. Conflict of Interest No conflict of interest was declared by the author. References Alcan V., Uçar M., 2019. Investigation of The Sensitivity Tolerance Parameter to Noise-Related Effect Using Sample Entropy.
CISET - 2nd Cilicia International Symposium on Engineering and Technology; 146-149 Baig M.M., Gholamhosseini H., Connolly M.J., 2013. A comprehensive survey of wearable and wireless ECG monitoring systems
for older adults, Medical & Biological Engineering & Computing, 51, 485-495. Ferrario M., Signorini M.G., Magenes G., Cerutti S., 2006. Comparison of entropy-based regularity estimators: application to the
fetal heart rate signal for the identification of fetal distress, IEEE Transactions on Biomedical Engineering, 53,119-125. Guo H.W., Huang Y.S., Chien J.C., Shieh J.S., 2015. Short-term analysis of heart rate variability for emotion recognition via a
wearable ECG device, IEEE International Conference on Intelligent Informatics and Biomedical Sciences 262-265. Kaya H., Uçar E., Alcan V.,2019. A Multiscale Entropy Based Approach For Analysis Of Surface EMG Signals. 2nd Cilicia
International Symposium on Engineering and Technology,306-310
ALCAN 10.21923/jesd.745275
790
Kleiger R.E., Stein P.K., Bigger J.T., 2005. Jr. Heart rate variability: measurement and clinical utility, Annual Noninvasive Electrocardiology, 10,88-101.
Kuntzelman K., Jack Rhodes L., Harrington L. N., Miskovic V., 2018. A practical comparison of algorithms for the measurement of multiscale entropy in neural time series data, Brain and Cognition, 123, 126-135.
Lake D.E., Richman J.S., Griffin M.P., Moorman J.R., 2002. Sample entropy analysis of neonatal heart rate variability, American
Journal of Physiology-Regulatory, Integrative and Comparative Physiology, 283, 789-797. Malik M., Bigger T., Camm A.J., Kleiger R.E., Malliani A., Moss A.J., et al.,1996. Heart rate variability: standards of measurement,
physiological interpretation and clinical use, European Heart Journal,17, 354-814. Pincus S.M., 1991. Approximate entropy as a measure of system complexity, Proceedings of the National Academy of Sciences,
88, 2297-2301. Richman J.S., Moorman J.R., 2000. Physiological time-series analysis using approximate entropy and sample entropy.
The American Journal of Physiology-Heart and Circulatory Physiology, 278, H2039–H2049. Rosenberg M.A., Samuel M., Thosani A., Zimetbaum P.J., 2013. Use of a noninvasive continuous monitoring device in the
management of atrial fibrillation: A pilot study, Pacing and Clinical Electrophysiology, 36, 328-333. Stein P.K., Reddy A., 2005. Non-linear heart rate variability and risk stratification in cardiovascular disease, Indian
Pacing and Electrophysiology Journal, 5, 210-220. Villareal R.P., Liu B.C., Massumi A., 2002. Heart rate variability and cardiovascular mortality. Current Atherosclerosis
Reports, 4, 120-127. Xiong W., Faes L., Ivanov, P.C., 2017. Entropy measures, entropy estimators, and their performance in quantifying complex
dynamics: effects of artifacts, nonstationarity, and long-range correlations, Physical Review, E 95, no. 6, 2017.
Related Documents