STUDENT RETENTION IN TWO-YEAR CONSTRUCTION MANAGEMENT PROGRAMS by Gary A. Spoerre B.S., University of Iowa, 1992 A Research Paper Submitted in Partial Fulfillment of the Requirements for the Master of Science in Education Degree Department of Workforce Education and Development in the Graduate School Southern Illinois University Carbondale April 16, 2010

Welcome message from author
This document is posted to help you gain knowledge. Please leave a comment to let me know what you think about it! Share it to your friends and learn new things together.
Transcript

STUDENT RETENTION IN TWO-YEAR CONSTRUCTION MANAGEMENT PROGRAMS
by
Gary A. Spoerre
B.S., University of Iowa, 1992
A Research Paper Submitted in Partial Fulfillment of the Requirements for the
Master of Science in Education Degree
Department of Workforce Education and Development in the Graduate School
Southern Illinois University Carbondale April 16, 2010

i
TABLE OF CONTENTS
Chapter Page
1. INTRODUCTION
Background of the Study .................................................................................... 1
Purpose of the Study ........................................................................................... 4
Statement of the Problem .................................................................................... 5
Research Questions ............................................................................................. 5
Limitations .......................................................................................................... 5
Definition of Terms ............................................................................................. 6
2. REVIEW OF RELATED LITERATURE
Overview ............................................................................................................. 7
Academic/Career Goals ...................................................................................... 7
Persistence, Social Capital, Self-Efficacy and Hardiness ................................... 9
Retention ........................................................................................................... 11
Summary ........................................................................................................... 14
3. RESEARCH METHOD
Introduction ....................................................................................................... 16
Description of Research Type ........................................................................... 16
Participant Data ................................................................................................. 17
Data Collection Instrument ............................................................................... 17
Procedures ......................................................................................................... 18
Data Analysis .................................................................................................... 19

ii
4. RESEARCH RESULTS
Introduction ....................................................................................................... 22
Research Question 1 ......................................................................................... 23
Research Question 2 ......................................................................................... 24
Research Question 3 ......................................................................................... 26
5. SUMMARY, CONCLUSIONS, RECOMMENDATIONS
Summary ........................................................................................................... 28
Findings ............................................................................................................ 29
Conclusions ....................................................................................................... 30
Recommendations ............................................................................................. 31
REFERENCES ............................................................................................................. 34
APPENDICES
A. Permission Documentation ........................................................................ 40
B. Human Subjects Committee Approval ....................................................... 42
C. JALC Construction Management Program Flyer....................................... 45
D. Data ............................................................................................................ 47
VITA ........................................................................................................................... 53

iii
LIST OF TABLES
Table Page
1. Research Questions and Data Collection Tools ............................................... 18
2. Program Year Retention Rates and Graduation Rates ...................................... 24
3. Summary Correlations for Retention Score and Student Characteristics ......... 26
4. Summary Correlations for Graduation and Student Characteristics ................. 27

1
CHAPTER 1
INTRODUCTION
Background of the Study
Management models in residential construction have changed several times since
the invention of the balloon frame in the early 1800s. Changes in materials and assembly
methods, as well as changing economic pressures, have led to changes in the way that
work crews were managed (Monteyne, 2004). Today, as the result of advances in
building materials and construction methods, management models continue to change.
Construction managers are in demand due to population increases, business growth, and
the increasing complexity of construction projects. The number of job openings for
construction managers in the United States exceeds the number of qualified applicants
and is expected to drive faster than average employment growth. The growing number of
energy efficient structures will further add to the demand for construction managers,
leading to excellent job opportunities for qualified management personnel (U.S.
Department of Labor, 2010).
Despite the recent down-turn in the housing market and the increasing cost of
energy, population increases will out-strip the available housing and new construction
requiring more efficient building practices will be needed. During a conference on the
future of the built environment, Caulfield (2007) related several surprising statistics. The
built environment is the largest asset component in the United States, consuming 40 to
45% of the energy output and producing 60% of the CO2 emissions. Between the years
2000 and 2030, the population will increase by one-third, to 400 million, and the country

2
will need 100 billion square feet of new residential space to accommodate that growth,
which equates to approximately 59 million new and replacement housing units.
In the pre-WWII construction model, a builder was a senior carpenter who trained
on the job and assumed the responsibilities of directing the work of the entire project. In
addition to managing the building process, builders were responsible for developing
experienced and highly motivated work crews. This process produced individuals who
were ready to take the builder’s place, or move on to start their own companies and
develop crews of their own. In time, the standardization of building materials and the
availability of long-term mortgages combined to bring drastic changes to the building
process, which forced the builder’s model to change.
The skillful marketing of the American Dream after WWII led to a construction
boom that forced productivity increases on the carpenters and pressured builders into
becoming specialized, mass-production supervisors of an increasingly deskilled
workforce (Monteyne, 2004). These narrowly trained builder/crew combinations, along
with continued pressure from the industry to increase productivity, led to the
development of the general contractor/subcontractor model. This general contractor
typically rose through the ranks of the craft, and maintained a close relationship with the
processes, obstacles, and lives of the workforce. As productivity and resource pressures
continued, many of the craftspeople who previously worked for the general contractors
were shifted to specialty trade subcontractors. Some of the duties of the general
contractor were transitioned to a new specialist known as the construction manager
(Erlich & Grabelsky, 2005) whose expertise in schedule maintenance and resource
efficiency did not necessarily originate from experience in the trade, or exposure to the

3
lives of trade workers. The efficiencies gained through this model change have worked
well for commercial construction and for high-volume residential construction, but using
this model in a down-turn economy makes it difficult for residential construction
companies to maintain profitability. For residential construction companies to remain
viable in this environment, a broadly-trained construction manager is needed, one similar
to the general contractor from the old model.
Construction industry growth requires a steady supply of managers. Normal
channels, such as formal trade apprenticeships and postsecondary education, continue to
supply managers but are not meeting the demand (U.S. Department of Labor, 2010).
Trade worker shortages in commercial construction have decreased the availability of
manager candidates, and for those who do become managers, readily available work in
commercial construction often routes them away from the residential market.
Additionally, an emphasis on having a college degree has been institutionalized by the
secondary education system, a direction that tends to provide a negative perception of the
trades, further limiting the number of manager candidates available. For an industry that
largely depends on knowledge that is passed down on the job, this lack of available
workers could eventually cripple the process. At a loss for skilled work-crews, the
industry’s transition to greener, more energy conscious initiatives will be at risk (Rolph,
2008).
One way to abate the construction manager shortage is for educational institutions
offering construction management programs to graduate more students into residential
construction. Since 2006, the National Housing Endowment (the philanthropic arm of the
National Association of Home Builders) has been working to increase the number of

4
qualified graduates entering the residential construction profession. Through their
Homebuilding Education Leadership Program, grants are awarded for the purpose of
helping two- and four-year colleges create and expand residential construction programs
that work to increase the number of qualified graduates entering the residential
construction profession (National Housing Endowment, 2009). These new and expanded
programs are intended to offset manager losses due to industry attrition as well as losses
to the commercial construction industry. This creation and expansion initiative will
benefit the industry in the future, but near-term solutions must also be investigated.
Current programs, focusing on retention and recruitment, are a primary candidate for
providing an immediate and cost-effective solution for increasing the number of
management graduates into the residential construction industry. Though it costs less to
keep the current students in these programs, educational institutions often focus on
student recruitment rather than student retention (Fike & Fike, 2008). By shifting the
focus to analyzing and increasing student retention rates in qualified construction
management programs, institutions can graduate more candidates sooner and possibly
forestall the negative effects of the shortage.
Purpose of the Study
The purpose of this study was to contribute to the understanding of the continued
loss of construction management personnel in the residential construction industry. More
specifically, the study attempted to identify significant factors associated with retention
in postsecondary construction management education programs.

5
Statement of the Problem
There are not enough construction management graduates entering the residential
construction industry to off-set future population growth and current industry attrition.
Understanding the relationship between an institution’s retention rate and the
characteristics of the current student body will allow educational institutions with
construction management programs to better supply the residential construction industry
with qualified graduates. Therefore, the problem of this research study was to determine
the relationship between retention and selected student academic factors in a community
college construction management program.
Research Questions
The following research questions were used for this study:
1. What are the term retention rates of community college construction
management students for the program years 2002 through 2006?
2. Do selected student academic factors influence construction management
student retention in a community college construction program?
3. Do selected student academic factors influence graduation in a community
college construction program?
Limitations
As a sample population, it is uncertain how closely this group represents the
national population of construction management students in two-year programs, so the
results of this study should not be used to predict results in other programs. This study

6
was used to identify relationships between retention and selected student academic
factors. Because the data were shown to be nonnormal, causality could not be determined
and predictive measures such as regression analysis could not be used. Additionally, no
distinction was made in this study between nongraduating students, students who chose
to continue their course of study at another institution, or students who left the program
of study for gainful employment.
Definition of Terms
Retention rate: The percentage measure of students who have chosen to continue
instruction into the next term as compared to the number of students who started the
current term.
Construction management: The study and practice of the managerial and
technological aspects of the construction industry.
Residential construction industry: Companies that design, develop, and/or
provide general contracting, remodeling, and renovation services for residential
buildings, including single-family houses, multifamily housing, townhomes, apartments,
and modular housing.
Program year: The year in which the student begins the program of study. A
student in the 2002 program year would begin their two-year program in the Fall of 2002
and would span the academic terms of Fall 2002, Spring 2003, Fall 2003, and Spring
2004.

7
CHAPTER 2
REVIEW OF RELATED LITERATURE
Overview
The problem of this research study was to determine the relationship between
retention and selected student academic factors in a community college construction
management program. The residential construction industry is predicted to experience a
skilled management short-fall for the next eight years (U.S. Department of Labor, 2010),
and increasing the retention rate of existing programs will provide an effective and
efficient means of increasing the number of qualified graduates entering the field.
This literature review investigated the social stigma that exists between academic
and career goals, the importance of self-efficacy to persistence in educational goals, and
the role of the institution on student retention. This is by no means an exhaustive study of
the available literature, but a broad view of three aspects that are contributors to the
management shortages the industry is experiencing.
Academic/Career Goals
The academic/career split that has characterized the American education system
for nearly a century has developed into a societal perception of head work and hand
work. This very depiction leads many young people to view trade work as something one
does if they cannot go to college. In the U.S. since WWII, the focus and energy shift to
obtaining a four-year college degree has been very strong. Current demand for trade
workers continues to rise, and despite the fact that trade professions offer the potential to

8
make a comfortable upper-middle-class living almost immediately, young people are still
put off by the negative perception of trade work (Rolph, 2008). A report on the future of
work (Mandel, 2007) continued this negative perception. It was reported that the
percentage of 25 to 29-year-olds with at least a bachelor’s degree had fallen this decade,
which raised “the real possibility that this generation of young Americans may actually
be less educated than the previous one, creating a growing gap between the kinds of
people companies need and the workers who are actually available” (p. 46). While it is
doubtful this national writer intended to disparage workers without college degrees, it
demonstrates the systemic nature of the head/hand mentality and its acceptance in this
society.
Career and technical education saw an early separation from the traditional
academic elite. In 1917, the Smith-Hughes Act mandated separate funding streams,
governing boards and instructional programs for vocational teacher education. This
separation led to problems, as well as solutions for workforce education. It was practiced
and believed that the purpose of the school system was to efficiently guide people into a
position where they were likely to provide the best citizenship. Immigrant and working-
class children were thus trained for manual labor. The head/hand mentality quietly
became institutionalized and continues to shape perceptions about work today. Changes
need to be made to the policies and language of vocational education to alter the way
trade knowledge is viewed by society (Rose, 2008).
Society’s view of trade knowledge is persistent because it is viewer specific.
There is currently no accepted framework for the uniform management of knowledge and
as a result, misunderstandings persist regarding the relative importance of different types

9
of knowledge (Dueck, 2001). Individual personality types have specific temperaments
(Keirsey, 1998) and not surprisingly have adopted their own differing points of view
regarding knowledge management. What is critical to one may be important to another
and only a curiosity to someone else.
Persistence, Social Capital, Self-Efficacy and Hardiness
The ability to continue in a course of study is known as persistence, and is
broadly affected by many social factors, collectively described as social capital. Personal
networks, socioeconomic status and social class are included in social capital, and are
described as the community and personal relationships that a person has to assist their
personal development and advancement (Wells, 2008). This social capital brings to bear
specific influences on a student’s confidence as well as on their ability to cope with and
overcome obstacles.
Self-efficacy is the belief that a person is able to exercise influence over events in
their life, that they are confident in their ability to bring about the desired effect or
outcome. A strong sense of self-efficacy will enhance a student’s accomplishments and
personal well-being. Conversely, students lacking self efficacy doubt their ability and
may fall victim to stress and depression when failure occurs. Devonport and Lane (2006)
investigated the relationship between self-efficacy, coping and student retention and
found a significant relationship between self-efficacy and academic performance. Larson
and Borgen (2006) found that personality mattered significantly in career self-efficacy,
job performance, and job satisfaction. Self-efficacy can be developed in several ways: (a)
through the experience of overcoming progressively difficult obstacles, (b) by watching

10
someone like themselves work hard and succeed, (c) by someone giving them genuine
verbal support, and (d) by using positive reinforcement to change their negative reactions
to stress (Bandura, 1994). Persistence is the result of social capital, self-efficacy, and at
least one more quality, hardiness.
Hardy individuals have a robust approach to life; hardiness allows them to stay
committed to tasks, despite apparent hardships. These individuals believe their work to
be valid, and that their efforts may actually influence the outcome of the situation at
hand. Students with higher levels of hardiness tend to persist in their academic
challenges. Maddi, Harvey, Khoshaba, Lu, Persico, and Brow (2006) described hardiness
as a personality characteristic that is a combination of commitment, control and
challenge. Hardy individuals also believe that challenges provide opportunities for
growth, regardless of the outcome.
Among healthcare professionals, hardiness is studied to gauge its effects on
coping and burnout, factors that also affect student persistence. Rowe (1997) conducted a
study of 448 healthcare professionals to investigate the relationships among hardiness,
stress, temperament, coping and burnout. It was found that perceived stress most
significantly influences burnout, and particular dimensions of temperament showed
higher levels of adaptability, leading to more personal accomplishment and less burnout.
Also, when subjects were instructed to develop proactive intervention strategies, they
were more effectively able to cope with stressors and felt a greater sense of personal
accomplishment.

11
These four qualities – persistence, social capital, self-efficacy and hardiness all
come together to help students adjust and respond to the challenges they encounter in
their transition from high school to postsecondary education.
Retention
Retention initiatives have been in use for many years and much of the retention
research has been concentrated around first-year students and their emotional,
interpersonal, and financial condition (Giaquinto, 2009-2010). Recent research has
recognized this limitation and studies have included other elements of the student-
institution relationship such as new student perceptions of the institution, interactions
between student characteristics and intervention types, the effects of instruction, and the
benefits of success courses.
Oriano-Darnell (2008) described the benefits of using the Survey of Entering
Student Engagement (SENSE), an instrument designed to provide information about each
student’s initial college experience. From this data, participating colleges were able to
develop action plans that more effectively served new students’ needs during this
transition, and lead to a successful learning experience.
Valuable lessons can also be learned from colleges that have implemented
successful minority retention programs. Forde (2008) described the Office of
Multicultural Affairs (OMA) at Wake Forest University, which has worked to develop an
operational infrastructure that is part of the campus community and demonstrates a strong
interest in each student’s success. Now, more than 20 years later, they boast one of the
highest graduation rates of Black students in the country. The lesson: colleges need to be

12
more responsible for the success of their students. Roach (2008) agreed. Students must
know they are being cared for and that everyone is concerned about their success. By
comparing the six-year graduation rates across racial and gender lines, programs had a
better understanding of the situation and were able to target these differences with
effective interventions. Student monitoring programs help to do this by providing early
intervention opportunities, before the student’s academic condition becomes critical.
Given the popularity of community colleges and the unique function they serve in
society, it is understandable that an institution’s administration act in an almost hyper-
vigilant capacity to regard each student as important. Open enrollment policies mean that
everyone can walk through the door, and a college needs to be structured to help
everyone succeed. Noonan-Terry and Waiwaiole (2008) recognized the retention
challenges presented by this environment, and the broad interventions that are required to
abate them. College environments must be structured to encourage students’ participation
with peers and faculty, as well as providing support and guidance. From the faculty to the
grounds-keeper, everyone on campus is responsible for keeping interest in success at a
very high level. By creating and maintaining an environment that promotes access to
positive opportunities, the college has demonstrated a genuine interest in helping the
students succeed. This serves to create learning communities where students are able to
make valid self-assessments and act to improve their opportunity for success.
Emotional Intelligence (EI) is a grouping of social and emotional factors that have
been shown to affect retention in first-year students, as shown by Parker, Hogan,
Eastabrook, Oke, and Wood (2006). Students who persisted into their second year of
postsecondary study were shown to have significantly higher EI competencies as

13
compared to students who withdrew from the university prior to completing their first
year of study. EI competencies that were measured included modifying and maintaining
previous relationships (interpersonal abilities), developing new friendships (intrapersonal
abilities), adjusting to a new learning environment (adaptability), and functioning
independently as an adult (management abilities). This is consistent with the findings of
Devonport and Lane (2006) indicating a strong relationship between self-efficacy and
retention. While this study was comprised mainly of white females and is therefore not
representative of all postsecondary education, it supplies a strong indication of EI’s role
in student retention.
Social anxiety was yet another factor to be considered with regard to retention.
Strahan (2002) conducted a two-year longitudinal study to examine the role of social
anxiety as it relates to academic performance and found that while many students
experienced high levels of anxiety during their first-year transition to an academic
environment, the study did not suggest that they were incapacitated by it. For students
who experience very high degrees of distress, treatment groups could be formed where
they could express their feelings, improve their comfort level, and function socially. This
has been shown to be true by Fava and Tomba (2009), in their study of the effects of
well-being therapy on mood and anxiety disorders. Their findings indicate that
psychological distress and vulnerability to life events can be managed and even
prevented by interventive measures that increase an individual’s level of well-being.
While the subject groups in both studies differ in origin, they share their degree of
distress and present comparable results.
In an effort to improve first-year retention and student satisfaction, intervention

14
programs of some type are commonly offered by educational institutions. Bai and Pan
(2009) recognized that past research focus had been placed on main-effects analysis, and
little research had explored the interaction between student characteristics and
intervention types. From their results, it can be inferred that intervention effectiveness
can be improved by selecting intervention strategies based on student characteristics,
rather than subjecting everyone to a general orientation.
Giaquinto (2009) added another element to the body of retention studies, that of
an instructional mismatch between the perceptions of first-year students and their
instructors. By concentrating on the students as information is received (or not),
instructors can better understand where a student’s cognitive development exists and can
be clear about the work that is required to close the gap. Many strategies were outlined to
engage first-year students, with the expressed suggestion that instructors actively teach
students methods for managing their own learning. An extension of this perspective is
seen in Loui, Robbins, Johnson, and Venkatesan’s (2008-2009) use of peer-led study
sessions. It was found that in two of the study’s three terms, there was a statistically
significant association between final exam scores and study session attendance.
Differences in sample size and student demographic may have contributed to the lack of
significance for the third term. For the same period, no statistically significant association
was demonstrated between student persistence and study session attendance.
Summary
Related literature indicates that many factors affect retention rates at two-year
colleges. Social stigma involving trade and trade-related work has a contributory effect

15
(Rolph, 2008), as does a student’s emotional intelligence (Parker, Hogan, Eastabrook,
Oke, & Wood, 2006), self-efficacy (Devonport & Lane, 2006), and social anxiety if the
level is high enough (Strahan, 2002). But the bulk of the potential for improvement lies
within the administrative and environmental structure that has been set up by each
educational institution. Though the methods for improvement are unique to each
institution (Roach, 2008), creating opportunities for students to genuinely participate in
college communities is at the heart of increasing graduation rates.
Looking closely at initiatives that were specifically designed to improve minority
student retention will reveal methods that drive improvements across all student
demographics (Forde, 2008). Leadership and mentoring programs, a strong interest in
student success, and the development of learning communities (Noonan-Terry &
Waiwaiole, 2008) are several steps that can be made to improve retention rates. By
carefully analyzing who is staying and who is leaving, educational institutions can begin
to take more ownership in each student’s success (Forde, 2008).
Management shortfalls in residential construction will negatively affect the
industry’s ability to aggressively respond to energy conservation goals. From a largely
deskilled workforce, two and four-year colleges are being challenged to provide a highly
skilled workforce that has the mettle to persevere in the current economic down-turn. By
paying close attention to improving graduation rates among qualified institutions,
colleges and universities can minimize the impact of this management short-fall.

16
CHAPTER 3
RESEARCH METHOD
Introduction
The problem of this research study was to determine the relationship between
retention and selected student academic factors in a community college construction
management program. More specifically, the study attempted to identify significant
factors associated with retention and graduation in postsecondary construction
management education programs.
The number of construction management graduates entering the residential
construction industry is insufficient to off-set future population growth and current
industry attrition. Understanding the relationship between an institution’s retention rate
and the characteristics of the current student body will allow educational institutions with
construction management programs to better supply the residential construction industry
with qualified graduates.
Description of Research Type
This quantitative, secondary data analysis looked at student enrollment data from
an accredited, two-year postsecondary construction management program. The
curriculum for this program is to be completed in four semesters, not including summer
sessions, and the load per student is approximately 18 credit hours per semester.
Enrollment data from Fall 2002 through Fall 2006 were used to evaluate the program’s
17
retention rates and identify associations that can lead to a higher graduation rate for this
program.
Participant Data
The data used for this study spanned the academic years 2002 through 2006 and
represented 233 full-time students in their first year of study in the Construction
Management Technology Program at John A. Logan College in Carterville, Illinois. John
A. Logan College is an open-enrollment institution that requires proof of high school
graduation or GED. Students must also take the ACT or ASSETT test to determine their
placement in math and English courses. While most students are from district high
schools, this is a state-wide program that also recruits nontraditional students from the
construction industry. Coursework is semester-specific and involves approximately 50
new students each Fall semester.
Data Collection Instrument
John A. Logan College uses the APECS system to manage student data, as well as
registration and graduation requirements. Program specific enrollment information by
semester was not yet available through the APECS system, so an alternative method was
used for identifying first semester enrollees. All students enrolled in the Construction
Management program are required to take CMG 110 Wood Frame Construction in their
first semester. This course is only offered in the Fall and for the purpose of this study was
chosen as the query instrument for identifying first semester enrollees. Once the subject
population was extracted from APECS and imported into Excel, individual data sets were

18
formed that would allow comparisons of student results in each program year. Table 1
illustrates the tools used for each research question.
Table 1
Data Collection Tools ______________________________________________________________________
Research Question Data Source ______________________________________________________________________
RQ1 MS Excel and APECS Student Information System
RQ2 MS Excel and SPSS Statistical Analysis Tools
RQ3 MS Excel and SPSS Statistical Analysis Tools ______________________________________________________________________
Procedures
Because this research included student academic data, approval for use was
granted by the Human Subjects Committee at Southern Illinois University Carbondale
(Appendix A). The APECS system was queried for the CMG 110 rosters for each
academic year beginning in 2002, and academic information for each student on the
roster was recorded in a data set. In order to provide anonymity while preserving
traceability, all student identifiers were removed and replaced with subject numbers that
signify year and subject. Data gathered for each student included six variables: (a)
consecutive semesters of registration; (b) grade point average; (c) whether or not the
student had previous exposure to postsecondary coursework; (d) the number of courses
that were dropped, withdrawn from, or not completed by the student; (e) the number of

19
courses that were failed by the student; and (f) course completion rate (the number of
credit hours earned as compared to the credit hours attempted).
Correlation coefficients between retention scores and student academic factors
were calculated using SPSS (Version 17) and MS Excel (Version 2007) statistical
processing tools. Retention scores are numerical values assigned to consecutive terms of
study and are designed to indicate academic advancement toward graduation. In this
four-term program, one term would equal 0.25, two terms would equal 0.50, three terms
would equal 0.75, and four terms would equal 1.00. As an example, a student who is
enrolled for the first two consecutive semesters, who skips the third semester, and enrolls
for the fourth semester would be given a retention score of 0.50 because only two
consecutive semesters were completed. A student with previous coursework who
completes their degree in one, two or three consecutive semesters of enrollment would be
given a retention score of 1.00 because: (a) they have completed their degree, and (b) a
score of 0.25, 0.50, or 0.75 would indicate these students have not completed their course
of study and would falsely lower the retention score sample.
Data Analysis
Term retention rates were calculated for each program year and correlated with
academic factors for each student. To answer Research Question 1, term retention rates
were calculated for consecutive terms only. Retention rates for each term were found by
dividing the number of students who registered for the next consecutive term by the
number of students who began the program in that academic year. Following is an
example: if 50 students began the program in the Fall semester of 2002 but only 46

20
registered for courses in Spring 2003, the retention rate for the first semester (SEM1) of
program year 2002 would be (46/50)*100 = 92%. If 45 of those students registered for
classes the following Fall, the retention rate for the second semester (SEM2) of program
year 2002 would be (45/50)*100 = 90%. If a student failed to register for courses the
following semester, any future registrations would not be included in the retention rate
calculations because those terms would not be consecutive. For students with previous
coursework whose degrees were awarded prior to completing four terms, their remaining
terms would be counted in that semester’s retention rate. No distinction was made
between graduating students and students with insufficient credit hours who continued
their studies past the fourth semester; both were included in the graduation rate (GRAD
Rate) if their degree was completed prior to January 2009.
For Research Questions 2 and 3, retention scores were assigned to each student
based on their number of consecutive terms of enrollment, and retention scores for all
program years were combined to provide a stronger result. To ensure that variance within
each program year was similar, the Kruskal-Wallis test for nonparametric data (Pearson,
2010) was used. This test assumes the test groups are from the same population, and a
significant result of p < .05 would indicate that at least one of the groups was different
from another group. The Kruskal-Wallis test was used instead of the one-way ANOVA
because the data sets proved to be nonnormal.
The Spearman’s rank order correlation was used to compare each term’s retention
rate with student academic factors such as grade point average, whether or not the student
had previous exposure to postsecondary coursework, the number of courses that were
dropped/withdrawn from/not completed by the student, the number of courses that were

21
failed by the student, the course completion rate, and whether or not a student graduated.
Spearman’s rank order correlation, rather than Pearson’s correlation, was chosen because
the data sets are not normally distributed and the variables have a large number of
categories. Additional requirements for use of Spearman’s rank order correlation are that
variables are ordinal, independent and not causally related (Pearson, 2010).

22
CHAPTER 4
RESEARCH RESULTS
Introduction
The problem of this research study was to determine the relationship between
retention and selected student academic factors in a community college construction
management program. Creating new programs or recruiting more students would
eventually add graduates to the industry, but increasing the retention rate of current
programs is a more efficient method for solving this problem. Understanding the
relationship between retention rate and student body characteristics will help programs
retain more students and increase graduation rates.
The data collected for this study came from the academic records of 233 full-time
students in their first years of study, spanning five academic years from 2002 through
2006. These students were enrolled in the Construction Management Technology
Program at John A. Logan College in Carterville, Illinois. Coursework was semester-
specific, required four semesters to complete, and did not include Summer coursework.
Throughout the five years of this study, the curriculum, faculty, and facility were held
constant with only minor changes taking place in the part-time faculty.
Graphing the means for retention score, grade point average, and course
completion rate showed them all to be very close and combining these five groups would
not likely drive an incorrect inference about their association with the other variables. A
Kruskal-Wallis test was conducted comparing the student retention scores for each of the
program years. No significant difference was found (H(4) = 3.53, p > .05), indicating that

23
the groups did not differ significantly from each other. Being in different program years
did not seem to influence the students’ retention scores and the five data groups were
combined.
The results for each variable are ordinal, meaning their value represents a level
that is higher or lower than the other subjects in the sample. Research results are
presented according to each research question.
Research Question 1
What are the term retention rates of community college construction management
students for the program years 2002 through 2006? Table 2 data reveal that term
retention rates consistently decrease throughout a program year, and that less term-to-
term reduction is seen between semesters 3 and 4 than for all other semesters. Table 2
also shows that term-to-term variability across program years is not consistent.

24
Table 2
Program Year Retention Rates (RRate) for included terms and Graduation Rates (GRADRate), as well as Term-to-Term Reductions (Δ) ______________________________________________________________________
RRate RRate RRate GRAD Year n SEM1 Δ1 SEM2 Δ2 SEM3 Δ3 Rate Δ4 ______________________________________________________________________
2002 39 90% 10% 62% 31% 56% 8% 51% 9% 2003 50 88% 12% 70% 20% 60% 14% 38% 37% 2004 44 89% 11% 77% 13% 70% 9% 55% 23% 2005 50 86% 14% 76% 12% 70% 8% 48% 31% 2006 50 82% 18% 66% 20% 56% 15% 16% 71% ______________________________________________________________________
Avg. Term Reduction 13% 19% 11% 34% ______________________________________________________________________ Note. Δ = term-to-term reductions only and does not account for the number of students who started the program year, as seen in RRate.
Research Question 2
Do selected student academic factors influence construction management student
retention in a community college construction program? Table 3 contains correlation
coefficients and indications of statistical significance. Generally, correlations greater than
0.7 are considered strong, correlations between 0.7 and 0.3 are considered moderate, and
correlations less than 0.3 are considered weak. The asterisks indicate significant
relationships, meaning they are reliable at the given levels, but provide no indication of
relationship strength (Cronk, 2004).
Information in Table 3 reveals that two variables, GPA (student grade point
average) and CCR (course completion rate), show an association to student retention
scores. A moderate positive correlation was found between GPA and RS (retention
scores) (r(231) = .40, p < .01), indicating a significant relationship between the two

25
variables. Students with higher GPA’s tend to continue in their studies. A moderate
positive correlation was also found between CCR and RS (r(231) = .48, p < .01),
indicating a significant relationship between the two variables. Students who complete
the courses they register for tend to continue in their studies. Additionally, a strong
positive correlation was seen between GPA and CCR (r(231) = .75, p < .01), indicating a
significant relationship between those variables. Students with higher GPA’s tend to
complete the courses in which they enroll. Table 3 also shows that previous coursework
and courses dropped, withdrawn from or incomplete had no significant relationship with
a student’s retention score.
Because the Spearman correlation coefficient was used, it was not possible to
determine causality between the variables. If the data sets were normal, causality could
be determined, and expected results could be calculated for various levels of student
characteristics using regression analysis.

26
Table 3
Summary Correlations, Means (M) and Standard Deviations (SD) for Retention Score and Student Characteristics ______________________________________________________________________
Measure 1 2 3 4 5 6 M SD ______________________________________________________________________ 1. RS --- .40** - .02 - .04 - .26** .48** .78 .29 2. GPA .40** --- .18** - .35** - .67** .75** 2.52 .93 3. PCW - .02 .18** --- - .17** - .07 .11 .70 .46 4. CDWI - .04 - .35** - .17** --- .20** - .45** 1.25 1.66 5. CF - .26** - .67** - .07 .20** --- - .73** 1.12 2.08 6. CCR .48** .75** .11 - .45** - .73** --- .82 .30 ______________________________________________________________________ Note. RS = retention score; GPA = grade point average; PCW = previous coursework; CDWI = courses dropped, withdrawn or incomplete; CF = courses failed; CCR = course completion rate. n = 233. ** p<.01.
Research Question 3
Do selected student academic factors influence graduation in a community
college construction program? Table 4 reveals that three variables, RS, GPA and CCR,
show an association to student graduation in this construction management program. A
moderate positive correlation was found between RS and Graduation (r(231) = .55, p <
.01), indicating a significant relationship between the two variables. Students with higher
retention scores tend to graduate from this program.
A moderate positive correlation was found between GPA and Graduation (r(231)
= .48, p < .01), indicating a significant relationship between the two variables. Students
with higher GPA’s tend to graduate from this program.
A moderate positive correlation was found between CCR and Graduation (r(231)
= .57, p < .01), indicating a significant relationship between the two variables. Students
with higher course completion rates tend to graduate from this program.

27
Table 4
Summary Correlations, Means (M) and Standard Deviations (SD) for Construction Management Graduation and Student Characteristics ______________________________________________________________________
Measure Graduation M SD ______________________________________________________________________ 1. RS .55** .78 .29 2. GPA .48** 2.52 .93 3. PCW .13 .70 .46 4. CDWI -.26** 1.25 1.66 5. CF -.40** 1.12 2.08 6. CCR .57** .82 .30 ______________________________________________________________________ Note. RS = retention score; GPA = grade point average; PCW = previous coursework; CDWI = courses dropped, withdrawn or incomplete; CF = courses failed; CCR = course completion rate. n = 233. ** p<.01.

28
CHAPTER 5
SUMMARY, CONCLUSIONS AND RECOMMENDATIONS
Summary
The problem of this research study was to determine the relationship between
retention and selected student academic factors in a community college construction
management program. Not everyone agrees that construction managers have made the
industry better (Erlich & Grabelsky, 2005), but improving retention will lead to
graduation increases, and industry shortages of construction managers will be efficiently
decreased.
A review of literature indicated that a new level of management resource will be
required as construction methods and materials became more sophisticated, and that
construction managers will be in demand for several years to come. Increasing student
retention rates at current educational institutions provides an effective and efficient
solution to this increased demand. Several factors are known to affect student retention
rates, but recent studies involving student, institutional and curricular characteristics have
also revealed significant relationships. By addressing these new factors, increased
graduation rates will follow the rise in student retention.
Data for the study were extracted from the institutional student information
system and comprised five program years of registration information for a two-year
construction management program at John A. Logan College in Carterville, Illinois.
Participants were full-time students, typically male, with an average graduation rate of
41.6% during the span of the study.

29
Using SPSS, the data sets were analyzed and found to be nonnormal. Retention
rates were calculated for each term as well as the degree of change in enrollment.
Because it was found that no significant difference existed in the retention scores for each
program year, the data sets were grouped into one large set before testing for association.
Findings
For the program years 2002 through 2006, no appreciable difference was
observed in the means of the student characteristics, indicating that institutional factors
such as faculty, curriculum and facility were stable from year to year, and changes
observed in program retention rates were primarily due to changes in the student body or
possibly the way students were advised in scheduling their coursework. While retention
rates were variable from group to group, all five groups showed the lowest decrease in
term-to-term enrollment between the third and fourth semesters.
From the 233 students making up the participant pool for this study, several
significant relationships were highlighted. It was found that students with higher grade
point averages and students with higher course completion rates tended to be the same
students who continued in the program. It was also found that students with high GPA’s
were also the same students who tended to complete the courses they enrolled in. Lastly,
it was found that students who graduated from this program tended to be the students
who: (a) attended consecutive semesters, (b) had higher grade point averages, and (c)
completed the courses they were enrolled in. No significant relationship existed between
retention and students with previous coursework or the number of courses dropped,
withdrawn, or incomplete. Students with failed courses showed a predictably significant
30
negative correlation with grade point average and course completion rates, but only a
weak negative correlation to retention.
Term-to-term student enrollment reductions between Fall and Spring semesters
are comparable, but markedly higher between Spring and Fall semesters. Summer takes
place between the Spring and Fall semesters, and it is possible that students have a better
opportunity to reassess their career choice during this time.
The average graduation rate for students enrolled during this study was 41.6%. Of
those graduates, 52.6% required more than the prescribed four semesters to complete the
program of study.
Conclusions
The following conclusions were derived from the results of this study:
1. Student academic factors, such as grade point average and course completion rate,
are significant factors in student retention and graduation.
2. Retention rates varied depending on semester and program year, and graduation
rates varied depending on program year.
3. Previous exposure to postsecondary coursework did not influence student
retention or graduation rates.
4. Based on graduation rates and the number of semesters enrolled by graduates, the
prescribed program of study may be too aggressive for many of the students enrolling in
this program.
5. Of the students who did not graduate, many did well in the construction courses
but failed to pass the math and communications courses.

31
Recommendations
Based on the findings of this study, the following recommendations are offered in
the separate categories of (a) Practice and (b) Research:
Practice
1. Set appropriate expectations for students entering the program. Assemble a list of
best practices and ensure that students recognize the risk associated with deviating from
the prescribed course of study.
2. Advise students in this program using the same academic advisor to maintain a
close relationship between student and advisor. Students should be required to maintain a
portfolio and work with their advisor to investigate placement opportunities.
3. Strengthen the enrollment in professional internships during the summer session.
Construction Management students do not live on campus, and often work in
construction while attending classes. Both of these factors lead to heavier emphasis being
placed on time spent away from school. Students who know they will have the
opportunity to exercise their knowledge and develop professional relationships during
this period will likely maintain a closer adherence to the course requirements and follow
through with graduation. Activities during the school year would include membership in
professional organizations, construction activities in volunteer groups, and outreach
activities in local schools that promote careers in the industry. These activities would be
monitored by a faculty member or student advisor. Consideration should also be given to
evening coursework offerings if students are required to work during the day.

32
4. Formalize a placement process that is linked to the summer internships. This
exposure lets students experience various phases of the construction process and allows
them to draw on their strengths very early on.
5. Actively recruit both male and female students with architectural, math, science,
and engineering interests. This would add positive inertia to the classes and likely benefit
many of the students who possess lower levels of confidence in these areas. Student
records indicated that while many of the students did well in the building science courses,
those who did not continue in the program had difficulty with the math and
communications requirements.
Research
1. Investigate the percentage of students who are proficient in building science but
lack the basic math and communication skills to continue in the program. Construction
Managers must be confident using numbers and are required to communicate with many
different groups of people. An increased emphasis in these areas would benefit all
students.
2. Investigate the order of coursework in the curriculum. Term to term enrollment
reductions were the greatest between Spring and Fall terms. This may be due a higher
percentage of abstract coursework during the Spring semester which requires a broader
understanding of the construction process. Students lacking confidence in problem
solving that draws from several sources may be uncomfortable continuing in the program
and may prematurely terminate their enrollment. A block curriculum may benefit this

33
group of students. Their confidence may stay higher and proficiency gains may be greater
with this type of offering.
3. Investigate the relationship between student success courses and retention in this
program. These courses indoctrinate students to the institution, the program and the
industry, and emphasize the resources available in each. A course of this type may help
students develop stronger connections between their coursework and industry use, and
would likely reinforce the perception that maintaining a high level of accountability leads
to success.
4. Investigate personality type as it pertains to successful program completion. What
personality types comprise the construction management industry and do students in this
program share those traits?
5. Investigate methods for strengthening student involvement in the construction
student community. The construction student often works in construction and typically
does not have the same opportunities available for study and problem investigation as
students in other disciplines.
34
REFERENCES
Bai, H., Wei, P. (2009-2010). A multilevel approach to assessing the interaction effects
on college student retention. Journal of College Student Retention: Research,
Theory and Practice, 11(1), 287-301. doi:10.2190/CS.11.2.g
Bandura, A. (1994). Self-efficacy. In V.S. Ramachaudran (Ed.), Encyclopedia of human
behavior (pp. 71-81). New York: Academic Press. Retrieved from https://i-
share.carli.illinois.edu/sic/cgi-bin/Pwebrecon.cgi?DB=local&v1=1&BBRecID
=1176111
Caulfield, J. (2007, September). Walk this way. Builder, 30(11). Retrieved from
http://www.builderonline.com/business/walk-this-way.aspx
Cronk, B. C. (2004). Prediction and association. In How to use SPSS:A Step-by-Step
Guide to Analysis and Interpretation (pp. 42). Glendale, CA. Pyrczak.
Devonport, T. J., & Lane, A. M. (2006). Relationships between self efficacy, coping and
student retention. Social Behavior and Personality: An International Journal,
34(2), 127-138. Retrieved from http://proxy.lib.siu.edu/login?url=http://search.
ebscohost.com/login.aspx?direct=true&db=aph&AN=19785121&site=ehost-
live&scope=site
Dueck, G. (2001). Views of knowledge are human views. IBM Systems Journal, 40(4)
885-888. Retrieved from
http://firstsearch.oclc.org.proxy.lib.siu.edu/WebZ/FSFETCH?
fetchtype=fullrecord:sessionid=fsapp5-35739-g6e0kjdm-4w98cp:entitypagenum
=2:0:recno=2:resultset=1:format=FI:next=html/record.html:bad=error/badfetch.ht
ml:entitytoprecno=2:entitycurrecno=2:numrecs=1

35
Erlich, M., Grabelsky, J. (2005, November) Standing at a crossroads: The building trades
in the Twenty-First Century. Labor History, 46(4), 421-445. doi: 10.1080/
00236560500266241
Fava, G.A., & Tomba, E. (2009, December). Increasing psychological well-being and
resilience by psychotherapeutic methods. Journal of Personality, 77(6) 1903-
1934. doi: 10.1111/j.1467-6494.2009.00604.x
Fike, D. S., & Fike, R. (2008). Predictors of first-year student retention in the community
college. Community College Review, 36(2), 68-88. Retrieved from
http://proxy.lib.
siu.edu/login?url=http://search.ebscohost.com/login.aspx?direct=true&db=tfh&A
N=34395345&site=ehost-live&scope=site
Forde, D. (2008, October 16). Structured for success. Diverse: Issues In Higher
Education, 25(18), 22-23. Retrieved from http://proxy.lib.siu.edu/login?url=http://
search.ebscohost
.com/login.aspx?direct=true&db=tfh&AN=34801829&site=ehost -
live&scope=site
Giaquinto, R.A., (2009-2010). Instructional issues and retention of first-year students.
Journal of College Student Retention: Research, Theory and Practice, 11(2), 267-
285. doi:10.2190/CS.11.2.f
Keirsey, D. (1998). Temperament and character. In Please Understand Me II (pp. 29-31).
Del Mar, CA: Prometheus Nemesis.
Larson, L. M., & Borgen, F. H. (2006). Do personality traits contribute to vocational self-
efficacy? Journal of Career Assessment, 14(3), 295-311. Retrieved from http://

36
ejournals.ebsco.com.proxy.lib.siu.edu/direct.asp?ArticleID=4F9F95420A6FD5D
419D4
Loui, M.C., Robbins, B.A., Johnson, E.C., & Venkatesan, N. (2009). Assessment of peer-
led team learning in an engineering course for freshman. Manuscript submitted
for publication, Department of Electrical and Computer Engineering, University
of Illinois, Urbana-Champaign, IL. Retrieved from:
https://netfiles.uiuc.edu/loui/www /PLTLQuant.pdf
Maddi, S. R., Harvey, R. H., Khoshaba, D. M., Lu, J. L., Persico, M., & Brow, M. (2006,
April). The personality construct of hardiness, III: Relationships with repression,
innovativeness, authoritarianism and performance. Journal of Personality, 74(2),
575-598. doi:10.1111/j.1467-6494.2006.00385x
Mandel, M. (2007, August 20 & 27). Which way to the future? Business Week. Retrieved
from http://www.businessweek.com/magazine/content/07_34/ b4047403.htm
Monteyne, D. (2004). Framing the American dream. Journal of Architectural Education,
58(1), 24-33. doi:10.1162/1046488041578194
National Housing Endowment (n.d.). H.E.L.P. recipients. [Online newsroom]. Retrieved
from http://www.nationalhousingendowment.org/page.aspx/generic/
sectionID=1797/channelID=1407
Noonan-Terry, C. M., & Waiwaiole, E. (2008). Making a positive impact on students’
lives. Diverse: Issues In Higher Education, 25(18), 35. Retrieved from http://
proxy.lib.siu.edu/login?url=http://search.ebscohost.com/login.aspx?direct=true&d
b=aph&AN=34801834&site=ehost-live&scope=site

37
Oriano-Darnall, A. (2008). New survey helps community colleges focus up front.
Diverse: Issues In Higher Education 25(13), 15. Retrieved from
http://proxy.lib.siu.edu/
login?url=http://search.ebscohost.com/login.aspx?direct=true&db=aph&AN=340
13064&site=ehost-live&scope=site
Parker, J. D. A., Hogan, M. J., Eastabrook, J. M., Oke, A. & Wood, L. M. (2006).
Emotional intelligence and student retention: Predicting the successful transition
from high school to university. Personality and Individual Differences, 41(7),
1329-1336. doi:10.1016/j.paid.2006.04.022
Pearson, R.W. (2010). Statistics as relationships. In Statistical persuasion (pp. 238, 219).
Thousand Oaks, CA. Sage
Roach, R. (2008). Monitoring the graduation gap. Diverse: Issues In Higher Education,
25(11), 16-17. Retrieved from http://proxy.lib.siu.edu/login?url=http://search.
ebscohost.com/login.aspx?direct=true&db=aph&AN=33114763&site=ehost-
live&scope=site
Rolph, A. (2008, March 23). Good pay, steady work, few takers as young people spurn
the trades. Seattle Post-Intelligencer. Retrieved from http://www.seattlepi.com/
business/356181_trades24.html
Rose, M. (2008, May). Intelligence, knowledge, and the hand/brain divide. Phi Delta
Kappan, 89(9), 632-639. Retrieved from http://proxy.lib.siu.edu/login?url=http://
search.ebscohost.com/login.aspx?direct=true&db=aph&AN=31900378&site=eho
st-live&scope=site
38
Rowe, M. M. (1997, May/June). Hardiness, stress, temperament, coping, and burnout in
health professionals. American Journal of Health Behavior, 21(3), 163-171.
Retrieved from
http://proxy.lib.siu.edu/login?url=http://search.ebscohost.com/login
.aspx?direct=true&db=rzh&AN=1998032545&site=ehost-live&scope=site
Strahan, E. Y. (2002, February). The effects of social anxiety and social skills on
academic performance. Personality and Individual Differences, 34(2), 347-366.
doi:10.1016 /S0191-8869(02)00049-1
U.S. Department of Labor, Bureau of Labor Statistics, Construction Managers. (2010).
Occupational Outlook Handbook (2010-11 Edition). Retrieved from
http://www.bls.gov/oco/ocos005.htm
Wells, R. (2008, July). The effects of social and cultural capital on student persistence:
Are community colleges more meritocratic? Community College Review, 36(1),
25-46. Retrieved from http://proxy.lib.siu.edu/login?url=http://search.ebscohost
.com/login.aspx?direct=true&db=aph&AN=32760450&site=ehost-live&scope
=site

APPENDICES

40
Appendix A
Permission Documentation
41

42
Appendix B
Human Subjects Committee Approval

43

44

45
Appendix C
JALC Construction Management Program Flyer

46

47
Appendix D
Data
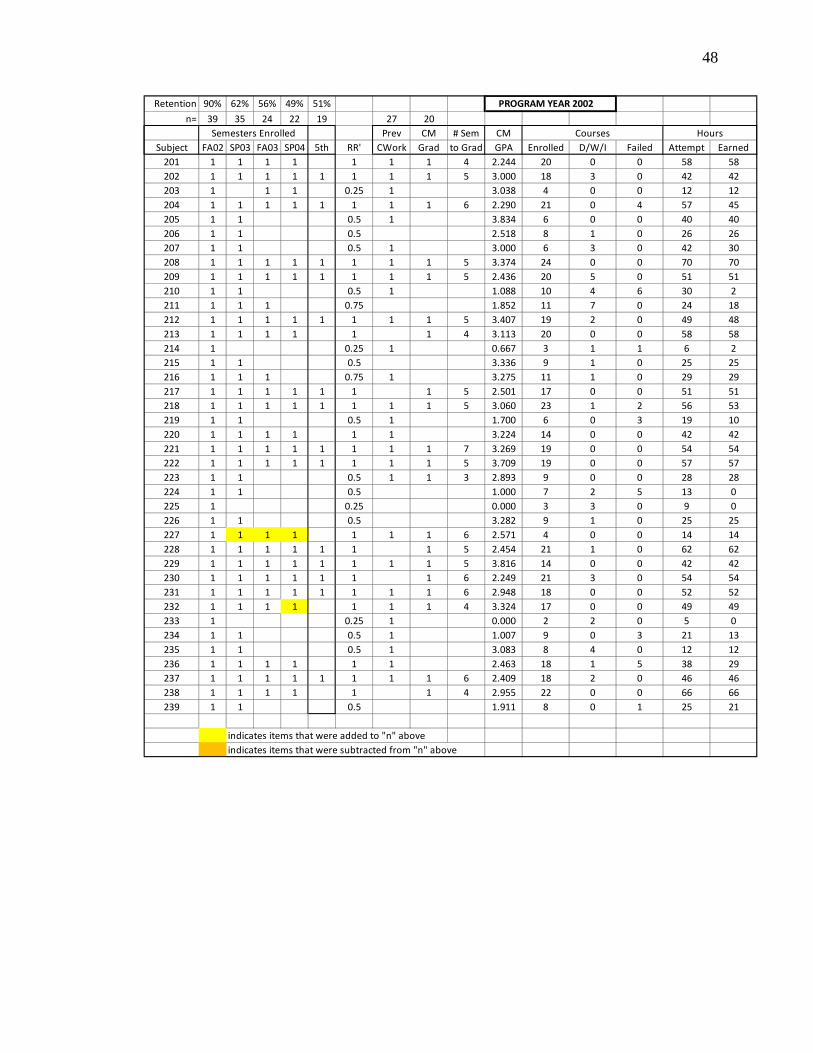
48
Retention 90% 62% 56% 49% 51% PROGRAM YEAR 2002
n= 39 35 24 22 19 27 20Prev CM # Sem CM
Subject FA02 SP03 FA03 SP04 5th RR' CWork Grad to Grad GPA Enrolled D/W/I Failed Attempt Earned201 1 1 1 1 1 1 1 4 2.244 20 0 0 58 58202 1 1 1 1 1 1 1 1 5 3.000 18 3 0 42 42203 1 1 1 0.25 1 3.038 4 0 0 12 12204 1 1 1 1 1 1 1 1 6 2.290 21 0 4 57 45205 1 1 0.5 1 3.834 6 0 0 40 40206 1 1 0.5 2.518 8 1 0 26 26207 1 1 0.5 1 3.000 6 3 0 42 30208 1 1 1 1 1 1 1 1 5 3.374 24 0 0 70 70209 1 1 1 1 1 1 1 1 5 2.436 20 5 0 51 51210 1 1 0.5 1 1.088 10 4 6 30 2211 1 1 1 0.75 1.852 11 7 0 24 18212 1 1 1 1 1 1 1 1 5 3.407 19 2 0 49 48213 1 1 1 1 1 1 4 3.113 20 0 0 58 58214 1 0.25 1 0.667 3 1 1 6 2215 1 1 0.5 3.336 9 1 0 25 25216 1 1 1 0.75 1 3.275 11 1 0 29 29217 1 1 1 1 1 1 1 5 2.501 17 0 0 51 51218 1 1 1 1 1 1 1 1 5 3.060 23 1 2 56 53219 1 1 0.5 1 1.700 6 0 3 19 10220 1 1 1 1 1 1 3.224 14 0 0 42 42221 1 1 1 1 1 1 1 1 7 3.269 19 0 0 54 54222 1 1 1 1 1 1 1 1 5 3.709 19 0 0 57 57223 1 1 0.5 1 1 3 2.893 9 0 0 28 28224 1 1 0.5 1.000 7 2 5 13 0225 1 0.25 0.000 3 3 0 9 0226 1 1 0.5 3.282 9 1 0 25 25227 1 1 1 1 1 1 1 6 2.571 4 0 0 14 14228 1 1 1 1 1 1 1 5 2.454 21 1 0 62 62229 1 1 1 1 1 1 1 1 5 3.816 14 0 0 42 42230 1 1 1 1 1 1 1 6 2.249 21 3 0 54 54231 1 1 1 1 1 1 1 1 6 2.948 18 0 0 52 52232 1 1 1 1 1 1 1 4 3.324 17 0 0 49 49233 1 0.25 1 0.000 2 2 0 5 0234 1 1 0.5 1 1.007 9 0 3 21 13235 1 1 0.5 1 3.083 8 4 0 12 12236 1 1 1 1 1 1 2.463 18 1 5 38 29237 1 1 1 1 1 1 1 1 6 2.409 18 2 0 46 46238 1 1 1 1 1 1 4 2.955 22 0 0 66 66239 1 1 0.5 1.911 8 0 1 25 21
indicates items that were added to "n" aboveindicates items that were subtracted from "n" above
Semesters Enrolled Courses Hours

49
Retention 88% 70% 60% 38% 38% PROGRAM YEAR 2003
n= 50 44 35 30 19 29 19Prev CM # Sem CM
Subject FA03 SP04 FA04 SP05 5th RR' CWork Grad to Grad GPA Enrolled D/W/I Failed Attempt Earned301 1 1 0.5 1.084 10 2 5 25 9302 1 1 1 1 1 1 1 4 3.348 19 0 0 58 58303 1 1 1 1 1 1 3.619 13 0 0 39 39304 1 1 1 1 1 1 3.158 19 2 0 52 52305 1 1 1 1 1 1 2.063 15 0 1 42 39306 1 1 1 0.75 1.215 16 5 2 28 20307 1 1 1 1 1 2.180 20 4 0 52 49308 1 1 1 1 1 1 1 1 5 3.932 14 0 0 44 44309 1 1 1 1 1 1 1 4 3.713 17 0 0 51 51310 1 1 1 1 1 1 1 5 2.339 21 0 0 64 64311 1 1 1 1 1 1 1 1 5 3.567 17 0 0 50 50312 1 1 1 1 1 1 1 4 3.382 21 1 0 60 60313 1 1 1 1 1 1 2.201 21 4 6 48 34314 1 1 1 1 1 1 4 3.612 20 0 0 60 60315 1 1 0.5 1 1.525 7 0 7 17 0316 1 1 1 1 1 2.892 16 1 0 43 43317 1 1 1 1 1 1 1 6 3.089 17 2 0 43 43318 1 1 0.5 1 1.222 8 2 3 19 9319 1 1 0.5 0.625 12 3 1 30 27320 1 1 1 1 1 1 1 4 2.831 20 1 0 59 59321 1 1 1 1 1 1 3.550 23 1 1 52 51322 1 1 1 1 1 1.145 15 1 4 38 27323 1 0.25 1 1.000 4 0 4 13 0324 1 0.25 3.063 5 0 0 16 16325 1 1 1 1 1 1 1 6 2.617 17 4 0 40 40326 1 1 1 1 1 1 1 4 3.062 13 0 0 38 38327 1 1 0.5 1 3.462 8 1 0 22 22328 1 1 1 1 1 1.836 17 0 1 46 44329 1 0.25 1 1.000 5 0 3 9 0330 1 1 1 1 1 1 1 5 2.733 22 0 0 66 66331 1 1 1 1 1 3.137 20 0 0 60 60332 1 1 1 1 1 1 3.373 16 0 0 48 48333 1 1 0.5 1 2.167 9 1 4 25 12334 1 1 1 1 1 1.274 21 3 7 53 35335 1 1 1 0.75 2.111 12 0 1 41 36336 1 1 1 0.75 1 3.409 7 0 0 21 21337 1 1 1 1 1 1 1 5 3.191 20 0 0 61 61338 1 0.25 1.000 4 1 3 8 0339 1 1 1 0.75 1 2.733 13 0 2 39 33340 1 1 1 1 1 1 1 4 2.756 20 1 0 58 58341 1 0.25 1 2.667 5 0 0 9 9342 1 1 1 1 1 1 1 4 3.682 17 1 0 45 45343 1 0.25 0.667 4 1 1 9 5344 1 1 1 0.75 1 1 4 3.719 14 0 0 43 43345 1 1 0.5 1 1.334 10 2 3 24 15346 1 1 0.5 2.250 8 2 0 19 19347 1 1 1 1 1 1 1 4 2.298 21 0 0 63 63348 1 1 1 1 1 1 1 1 5 2.280 22 2 0 61 61349 1 1 1 1 1 1 1 4 2.741 19 2 0 48 48350 1 1 0.5 1.278 8 1 4 23 9
indicates items that were added to "n" aboveindicates items that were subtracted from "n" above
Courses HoursSemesters Enrolled

50
Retention 89% 77% 70% 55% 55% PROGRAM YEAR 2004
n= 44 39 34 31 24 32 24Prev CM # Sem CM
Subject FA04 SP05 FA05 SP06 5th RR' CWork Grad to Grad GPA Enrolled D/W/I Failed Attempt Earned401 1 1 0.5 1 1.091 9 3 4 22 7402 1 1 1 1 1 1 3.026 22 1 0 64 64403 1 0.25 1 1.600 2 0 1 5 4404 1 1 1 1 1 1 1 4 2.944 19 1 0 55 55405 1 1 1 1 1 1 2.500 18 4 0 46 43406 1 1 1 1 1 2.217 19 4 2 42 39407 1 1 1 1 1 2.665 20 0 0 61 61408 1 1 1 1 1 1 1 1 6 2.877 21 0 0 56 56409 1 1 1 1 1 1 1 1 5 3.058 21 0 1 66 61410 1 1 1 1 1 1 1 5 2.798 16 1 0 45 45411 1 1 1 1 1 1 1 4 3.286 16 0 0 48 48412 1 1 0.5 2.046 9 2 4 24 11413 1 0.25 1 1.000 4 4 0 5 0414 1 1 1 1 1 1 1 4 3.384 22 2 0 61 61415 1 1 1 1 1 1 1 4 2.659 19 0 0 57 57416 1 1 1 1 1 1 2.471 22 1 1 60 60417 1 1 1 1 1 1 1 3 3.530 15 1 0 42 42418 1 1 1 1 1 1 1 3 3.889 11 0 0 31 31419 1 1 1 1 1 3.291 13 0 0 39 39420 1 1 1 1 1 1 1 1 5 2.330 18 1 1 48 48421 1 1 0.5 2.693 9 4 0 26 16422 1 1 1 1 1 1 1 1 5 3.030 20 1 0 58 58423 1 1 1 1 1 1 1 4 3.582 18 0 0 50 50424 1 1 1 1 1 1 2.088 22 0 1 64 61425 1 1 1 1 1 1 1 1 5 2.150 18 0 1 48 48426 1 1 1 1 1 1 1 4 3.693 17 1 0 48 48427 1 1 1 1 1 2.651 21 2 0 57 57428 1 1 1 1 1 1 4 2.486 24 1 0 70 70429 1 1 0.5 1 1.278 11 4 3 18 10430 1 1 1 1 1 1 1 7 3.464 18 4 0 54 41431 1 1 1 0.75 1 1 3 3.644 13 0 0 39 39432 1 1 1 1 1 1 4 3.194 25 0 0 75 75433 1 1 1 1 1 1 1 2 2.488 11 0 0 33 33434 1 1 1 0.75 1 1.819 17 2 4 43 31435 1 1 1 1 1 1 4 3.316 24 0 0 71 71436 1 1 1 1 1 1 1 4 4.000 12 0 0 38 38437 1 1 1 1 1 1 2.897 20 2 1 49 49438 1 1 1 1 1 1 1 4 3.832 20 0 0 62 62439 1 0.25 1 2.250 4 0 1 12 9440 1 1 1 0.75 1.256 14 0 6 31 25441 1 0.25 1 1.000 4 1 3 9 0442 1 1 1 1 1 1 1 1 5 2.705 19 1 0 54 54443 1 1 0.5 1 1 4 3.100 6 0 0 18 18444 1 0.25 1 0.000 5 5 0 16 0
indicates items that were added to "n" aboveindicates items that were subtracted from "n" above
Courses HoursSemesters Enrolled

51
Retention 86% 76% 70% 48% 48% PROGRAM YEAR 2005
n= 50 43 38 35 24 39 24
Prev CM # Sem CMSubject FA05 SP06 FA06 SP07 5th RR' CWork Grad to Grad GPA Enrolled D/W/I Failed Attempt Earned
501 1 1 0.5 1.500 11 2 6 20 10502 1 1 1 1 1 1 1 1 5 3.211 18 1 0 51 51503 1 1 1 1 1 2.264 27 4 7 66 47504 1 1 1 1 1 1 3.905 19 0 0 58 58505 1 1 1 1 1 1 2.864 21 1 0 60 60506 1 0.25 1 2.800 5 0 0 15 15507 1 1 1 1 1 1 1 1 5 2.688 19 1 2 48 48508 1 1 1 1 1 1 1 5 3.722 18 0 0 54 54509 1 1 1 1 1 1 2.948 19 1 0 55 52510 1 1 1 1 1 1 1 1 6 1.709 18 1 4 43 40511 1 1 1 1 1 1 1 4 3.474 24 2 0 67 67512 1 1 1 1 1 1 1 1 5 2.572 21 1 1 57 54513 1 1 1 1 1 1 1 5 3.486 18 0 0 53 53514 1 1 1 1 1 1 1 4 2.354 23 2 1 57 57515 1 1 1 1 1 1 1 1 6 2.263 22 1 2 60 57516 1 1 1 1 1 1 1 1 6 2.518 24 1 0 66 66517 1 0.25 1 2.750 5 0 0 12 12518 1 1 1 1 1 1 1 1 5 3.104 20 0 0 61 61519 1 1 0.5 1.529 8 0 1 25 22520 1 1 1 1 1 1 1 4 3.581 25 3 0 69 63521 1 1 1 1 1 1 2.083 18 3 1 48 42522 1 0.25 1 1.000 4 0 4 12 0523 1 1 1 1 1 1 1 1 5 2.723 16 0 0 48 48524 1 1 1 1 1 1 1 4 2.305 20 0 0 59 59525 1 1 0.5 1 3.382 10 1 0 28 28526 1 1 1 1 1 1 1 1 5 3.752 19 0 0 58 58527 1 1 1 1 1 1 4 3.565 24 2 0 67 67528 1 1 1 1 1 1 2.130 23 2 0 70 64529 1 1 1 1 1 1 1 4 2.649 25 1 0 70 70530 1 1 1 0.5 1 1 6 3.725 14 0 0 39 39531 1 0.25 1 1.000 5 1 4 14 0532 1 0.25 1 1.000 3 0 3 9 0533 1 1 1 1 1 1 1 1 5 2.445 20 0 0 61 61534 1 1 1 1 1 2.603 18 1 1 58 52535 1 1 1 1 1 1 1 5 2.826 24 1 0 67 67536 1 1 1 0.75 3.251 21 6 0 44 32537 1 1 1 1 1 1 2.605 18 7 0 42 31538 1 1 1 1 1 1 1.046 19 9 2 57 24539 1 1 1 1 1 1 2.532 16 2 0 47 44540 1 1 1 0.75 1 3.174 13 2 0 40 34541 1 1 1 1 1 1 1 3 4.000 15 0 0 44 44542 1 1 1 1 1 1 2.497 26 1 0 68 65543 1 1 1 0.75 1 1.667 13 1 5 40 22544 1 1 1 1 1 1 1 4 2.624 17 0 1 51 48545 1 0.25 1 1.778 4 1 0 14 9546 1 0.25 1.308 6 1 0 17 13547 1 1 0.5 1 2.285 10 2 4 30 12548 1 1 1 1 1 1 1 4 2.539 19 3 1 57 45549 1 1 1 1 1 1 1 1 5 3.495 14 1 0 41 38550 1 1 1 1 1 1.839 17 7 1 48 28
indicates items that were added to "n" aboveindicates items that were subtracted from "n" above
Courses HoursSemesters Enrolled

52
Retention 82% 66% 56% 16% 16% PROGRAM YEAR 2006
n= 50 41 33 28 8 37 8Prev CM # Sem CM
Subject FA06 SP07 FA07 SP08 5th RR' CWork Grad to Grad GPA Enrolled D/W/I Failed Attempt Earned601 1 0.25 0.444 3 0 2 9 4602 1 0.25 1 0.593 4 0 2 13 5603 1 1 1 1 1 1 1.580 19 6 1 58 40604 1 1 1 1 1 1 1 4 3.460 16 0 0 47 47605 1 1 0.5 1 3.107 9 2 0 30 22606 1 1 0.5 1.341 8 1 3 27 13607 1 1 1 1 1 1 3.177 24 0 0 69 69608 1 1 1 1 1 1 2.279 21 2 0 49 45609 1 1 1 1 1 1 1 1 5 3.703 20 0 0 62 62610 1 1 1 1 1 1 1.989 23 2 8 71 41611 1 1 1 1 1 1 1 4 3.938 15 0 0 45 45612 1 0.25 1.000 4 0 4 13 0613 1 1 1 0.75 1.519 12 4 1 25 22614 1 1 1 1 1 2.108 18 1 1 51 45615 1 0.25 1 0.000 4 4 0 13 0616 1 1 1 0.25 1 3.359 12 0 0 35 35617 1 1 1 1 1 1 2.880 19 2 0 55 51618 1 1 1 1 1 1 2.393 18 0 2 53 48619 1 1 1 1 1 1 3.144 18 1 0 57 53620 1 1 0.5 1 2.215 9 0 1 26 23621 1 0.25 1 3.385 5 0 0 13 13622 1 1 0.5 1 3.032 12 6 1 37 13623 1 1 1 1 1 1 2.933 20 2 0 61 54624 1 1 1 1 1 3.335 17 0 0 50 50625 1 1 1 0.75 1 1.659 13 2 4 37 18626 1 1 1 1 1 1 1.347 21 0 8 61 39627 1 1 1 1 1 1 1.278 17 0 11 53 15628 1 1 1 1 1 1 1 1 5 3.015 19 0 0 54 54629 1 1 1 1 1 2.436 18 1 0 54 51630 1 0.25 1 2.000 4 3 0 12 3631 1 0.25 1 3.231 4 0 0 13 13632 1 1 1 1 1 1.081 19 7 6 59 16633 1 1 1 1 1 1 2.804 18 0 0 54 54634 1 1 1 1 1 1 1 4 3.410 23 0 0 70 70635 1 1 1 0.75 3.433 17 2 1 49 40636 1 1 1 0.5 1 2.531 14 0 0 42 42637 1 1 1 1 1 1 2.536 19 0 0 60 60638 1 1 1 1 1 1 1 1 5 3.334 21 0 0 67 67639 1 1 1 1 1 0.810 16 3 13 50 0640 1 1 1 1 1 2.738 22 1 0 66 63641 1 1 1 1 1 1 1 4 4.000 15 0 0 45 45642 1 1 0.5 1 1.000 8 4 4 22 10643 1 1 1 1 1 1 1 5 3.322 25 2 0 72 68644 1 1 1 1 1 1 3.597 17 0 0 51 51645 1 1 1 1 1 2.030 20 2 0 57 50646 1 1 1 1 1 1 1.095 23 2 7 71 43647 1 1 0.5 1 2.800 8 0 0 24 24648 1 1 0.5 1 1.417 8 2 2 23 12649 1 1 1 0.75 1 3.329 10 0 0 29 29650 1 0.25 1 3.000 4 0 0 12 12
indicates items that were added to "n" aboveindicates items that were subtracted from "n" above
Courses HoursSemesters Enrolled
53
VITA
Graduate School Southern Illinois University
Gary A. Spoerre Date of Birth: November 3. 1962
1003 Meadowlark Drive, Carterville, Illinois 62918
University of Iowa Bachelor of Science, Industrial Engineering, May 1992
Research Paper Title: Student Retention in Two-Year Construction Management Programs
Major Professor: Marcia A. Anderson
Related Documents