TM-SV-08-1 UNIVERSITY OF CALIFORNIA – COOPERATIVE EXTENSION 2008 SAMPLE COSTS TO PRODUCE PROCESSING TOMATOES TRANSPLANTED IN THE SACRAMENTO VALLEY Prepared by: Gene Miyao UC Cooperative Extension Farm Advisor, Yolo, Solano, & Sacramento Counties Karen M. Klonsky UC Cooperative Extension Specialist, Department of Agricultural and Resource Economics, UC Davis Pete Livingston UC Cooperative Extension Staff Research Associate, Department of Agricultural and Resource Economics, UC Davis

Welcome message from author
This document is posted to help you gain knowledge. Please leave a comment to let me know what you think about it! Share it to your friends and learn new things together.
Transcript
TM-SV-08-1
UNIVERSITY OF CALIFORNIA – COOPERATIVE EXTENSION
2008
SAMPLE COSTS TO PRODUCE
PROCESSING TOMATOES
TRANSPLANTED IN THE SACRAMENTO VALLEY
Prepared by: Gene Miyao UC Cooperative Extension Farm Advisor, Yolo, Solano, & Sacramento
Counties Karen M. Klonsky UC Cooperative Extension Specialist, Department of Agricultural and Resource
Economics, UC Davis Pete Livingston UC Cooperative Extension Staff Research Associate, Department of
Agricultural and Resource Economics, UC Davis
2008 Transplanted Processing Tomato Cost and Returns Study Sacramento Valley UC Cooperative Extension 2
UC COOPERATIVE EXTENSION
SAMPLE COSTS TO PRODUCE PROCESSING TOMATOES TRANSPLANTED
In the Sacramento Valley – 2008
CONTENTS
INTRODUCTION.............................................................................................................................................................................. 2 ASSUMPTIONS................................................................................................................................................................................. 3 CULTURAL PRACTICES AND MATERIAL INPUTS.................................................................................................................................. 3 CASH OVERHEAD.................................................................................................................................................................................. 5 NON-CASH OVERHEAD ........................................................................................................................................................................ 6 REFERENCES.................................................................................................................................................................................... 8 TABLE 1. COSTS PER ACRE TO PRODUCE PROCESSING TOMATOES .................................................................................................. 10 TABLE 2. COSTS AND RETURNS PER ACRE TO PRODUCE PROCESSING TOMATOES.......................................................................... 12 TABLE 3. MONTHLY CASH COSTS PER ACRE TO PRODUCE PROCESSING TOMATOES...................................................................... 14 TABLE 4. WHOLE FARM ANNUAL EQUIPMENT, INVESTMENT, AND BUSINESS OVERHEAD COSTS ................................................ 15 TABLE 5. HOURLY EQUIPMENT COSTS .............................................................................................................................................. 17 TABLE 6. RANGING ANALYSIS ........................................................................................................................................................... 18 TABLE 7. COSTS AND RETURNS/ BREAKEVEN ANALYSIS................................................................................................................. 19 TABLE 8. DETAILS OF OPERATIONS ................................................................................................................................................... 20
INTRODUCTION
The sample costs to produce transplanted processing tomatoes in the Sacramento Valley is based on the 2007 cost and returns study practices using 2008 prices and are presented in this study. The price adjustments are for fuel, fertilizers, pesticides, water, labor rates, interest rates, and some cash overhead costs. This study is intended as a guide only, and can be used to make production decisions, determine potential returns, prepare budgets and evaluate production loans. Practices described are based on production practices considered typical for the crop and area, but may not apply to every situation. Sample costs for labor, materials, equipment, and custom services are based on current figures. Blank columns, “Your Costs”, in Tables 1 and 2 are provided to enter actual costs of an individual farm operation. The hypothetical farm operations, production practices, overhead, and calculations are described under the assumptions. For additional information or an explanation of the calculations used in the study, call the Department of Agricultural and Resource Economics, University of California, Davis, (530) 752-2414 or the local UC Cooperative Extension office. Two additional cost of production study for processing tomatoes grown in this region are also available: “Sample Costs To Produce Processing Tomatoes, Direct Seeded, In the Sacramento Valley - 2007”, and “Sample Costs To Produce Processing Tomatoes, Transplanted, In the Sacramento Valley – 2007”.
Sample Cost of Production Studies for many commodities are available and can be requested through the Department of Agricultural Economics, UC Davis, (530) 752-2414. Current studies can be downloaded from the department website http://coststudies.ucdavis.edu/ or obtained from selected county UC Cooperative Extension offices. The University of California prohibits discrimination or harassment of any person on the basis of race, color, national origin, religion, sex, gender identity , pregnancy (including childbirth, and medical conditions related to pregnancy or childbirth), physical or mental disability , medical condition (cancer-related or genetic characteristics), ancestry, marital status, age, sexual orientation, citizenship, or service in the uniformed services (as defined by the Uniformed Services Employment and Reemployment Rights Act of 1994: service in the uniformed services includes membership, application for membership, performance of service, application for service, or obligation for service in the uniformed services) in any of its programs or activities. University policy also prohibits reprisal or retaliation against any person in any of its programs or activities for making a complaint of discrimination or sexual harassment or for using or participating in the investigation or resolution process of any such complaint. University policy is intended to be consistent with the provisions of applicable State and Federal laws. Inquiries regarding the University’s nondiscrimination policies may be directed to the Affirmative Action/Equal Opportunity Director, University of California, Agriculture and Natural Resources, 1111 Franklin Street, 6th Floor, Oakland, CA 94607, (510) 987-0096.
2008 Transplanted Processing Tomato Cost and Returns Study Sacramento Valley UC Cooperative Extension 3
ASSUMPTIONS The following assumptions refer to tables 1 to 8 and pertain to sample costs and returns to produce transplanted processing tomatoes in the Sacramento Valley. Input prices and interest rates are based on 2008 values. However, production practices were not updated from the 2007 study. Practices described are not recommendations by the University of California, but represent production practices considered typical of a well-managed farm for this crop and area. Some of the costs and practices listed may not be applicable to all situations nor used during every production year and/or additional ones not indicated may be needed. Processing tomato cultural practices and material input costs will vary by grower and region, and can be significant. The practices and inputs used in the cost study serve as a guide only. The costs are shown on an annual, per acre basis. The use of trade names in this report does not constitute an endorsement or recommendation by the University of California nor is any criticism implied by omission of other similar products.
Farm. The hypothetical field and row-crop farm consists of 2,900 non-contiguous acres of rented land. Tomatoes are transplanted on 630 acres (70% of the tomato acreage) and direct seeded on 270 acres (30% of the tomato acreage) for a total of 900 acres. Two thousand acres are planted to other rotational crops including alfalfa hay, field corn, safflower, sunflower, dry beans and/or wheat. For direct seeded tomato operations, please refer to the study titled, “Sample Costs to Produce Processing Tomatoes, Directed Seeded, in the Sacramento Valley - 2007”. The grower also owns various investments such as a shop and an equipment yard. In this report, practices completed on less than 100% of the acres are denoted as a percentage of the total tomato crop acreage.
CULTURAL PRACTICES AND MATERIAL INPUTS
Land Preparation. Primary tillage which includes laser leveling, discing, rolling, subsoiling, land planing, and listing beds is done from August through early November in the year preceding transplanting. To maintain surface grade, 4% of the acres are laser leveled each year. Fields are stubble-disced and rolled (using a rice roller). Fields are subsoiled in two passes to a 30-inch depth and rolled. A medium-duty disk with a flat roller following is used. Ground is smoothed in two passes with a triplane. Beds on five-foot centers are made with a six-bed lister, and then shaped with a bed-shaper cultivator. Transplanting. Planting is spread over a three-month period (late March through early June) to meet contracted weekly delivery schedules at harvest. The transplants are planted in a single line per bed. Direct seed is for the early season and precedes transplanting. All of the 630 acres are custom planted with greenhouse-grown transplants. Costs for extra seed (15%) purchased to allow for less than 100% germination and for non-plantable transplants are included in the respective categories in Table 2. Fertilization. In the fall, ahead of listing beds, a soil amendment, gypsum at 3.0 tons per acre is custom broadcast spread on 20% of the acres. After listing, as part of the bed shaping operation, 11-52-0 is shanked into the beds at 100 pounds per acre. Prior to planting, liquid starter fertilizer, 8-24-6 plus zinc, is banded below the seed line at 15 gallons of material per acre. Nitrogen fertilizer, UN-32 at 150 pounds of N per acre is sidedress-banded at layby. Additional N is applied under special needs on 20% of acres as CAN 17 at 100 pounds of product per acre as a sidedress. Irrigation. In this study, water is calculated to cost $31.92 per acre-foot or $2.66 per acre-inch and is a combination of 1/2 well water ($47.67 per acre-foot) and 1/2 canal delivered surface water ($16.17 per acre-foot). The irrigation costs shown in Tables 1 and 3 include water, pumping, and labor charges. The transplants receive a single sprinkler irrigation after planting. Prior to initial furrow irrigation, fields are all chiseled to 12 inches deep in the furrow. Eight furrow irrigations are applied during the season. In

2008 Transplanted Processing Tomato Cost and Returns Study Sacramento Valley UC Cooperative Extension 4
this study 3.5 acre-feet (42 acre-inches) is applied to the crop – 2.0 acre-inches by sprinkler and 40 acre-inches by furrow. Although sub-surface drip irrigation is gaining in popularity, it is not used in this study. Pest Management. The pesticides and rates mentioned in this cost study are listed in Integrated Pest Management for Tomatoes and UC Pest Management Guidelines, Tomato. For more information on other pesticides available, pest identification, monitoring, and management visit the UC IPM website at www.ipm.ucdavis.edu. Written recommendations are required for many pesticides and are made by licensed pest control advisors. For information and pesticide use permits, contact the local county agricultural commissioner's office. Weeds. Beginning in January, Roundup plus Goal is sprayed on the fallow beds to control emerged weeds and repeated later with Roundup only. Before planting, the beds are cultivated twice to control weeds and to prepare the seedbed. Wilcox Performer conditions bed and applies starter fertilizer. Trifluralin is broadcast sprayed at 1.0 pint per acre and incorporated with a power mulcher. To control nutsedge, Dual Magnum at 1.5 pints of product per acre is added to trifluralin as a tank-mix and applied to 30% or 189 acres. Matrix is applied to 80% or 504 acres in an 18-inch band at a rate of 2.0 ounces of material per acre to control a range of weeds.
A combination of hand weeding and mechanical cultivation is also used for weed control. The crop is mechanically cultivated with sled-mounted cultivators three times during the season. A contract labor crew hand removes weeds. Insects and Diseases. The primary insect pests of seedlings included in this study are flea beetle, darkling ground beetle, and cutworm. Foliage and fruit feeders included are tomato fruitworm, various armyworm species, russet mite, stinkbug, and potato aphid. Diseases are primarily bacterial speck, late blight, and blackmold fruit rot. A Kocide and Dithane tank mix for bacterial speck is applied to 30% of the acres. All of the above applications are made by ground. The following applications are made by aircraft. Sulfur dust for russet mite control is applied to 70% of the acres. Asana for general insect control is applied to 40% of the acres. Confirm for worm control is applied to 100% of the acres. Bravo is applied in June to 5% of the acres for late blight control and again in September as a fruit protectant fungicide on 15% of the acres. Fruit Ripener. Ethrel, a fruit ripening agent, is applied by ground before harvest to 5% of the acres at 4.0 pints per acre. Harvest. The fruit is mechanically harvested using one primary harvester for 90% of the acres and one older harvester for special harvest situations and as a backup to the primary harvester. Typically growers with this acreage of processing tomatoes own tractors, trailer dollies, generator-light machines, and harvest support equipment. Four manual sorters, a harvester driver, and two bulk-trailer tractor operators are used per harvester. A seasonal average of 1.5 loads per hour at 25 tons per load are harvested with two (one day and one night) shifts of 10 hours each. Harvest efficiency includes down time, scheduled daily breaks, and transportation between fields. The processor pays the transportation cost of the tomatoes from the field to the processing plant. Costs for harvest operations are shown in Tables 1, 3 and 7; the equipment used is listed in Tables 4 and 5. If tomatoes are custom harvested, harvest expenses are subtracted from harvest costs in Tables 1 and 3, and the custom harvest charges added. The equipment for harvest operations is then subtracted from investment costs in Table 4. Growers may choose to own harvesting equipment, purchased either new or
2008 Transplanted Processing Tomato Cost and Returns Study Sacramento Valley UC Cooperative Extension 5
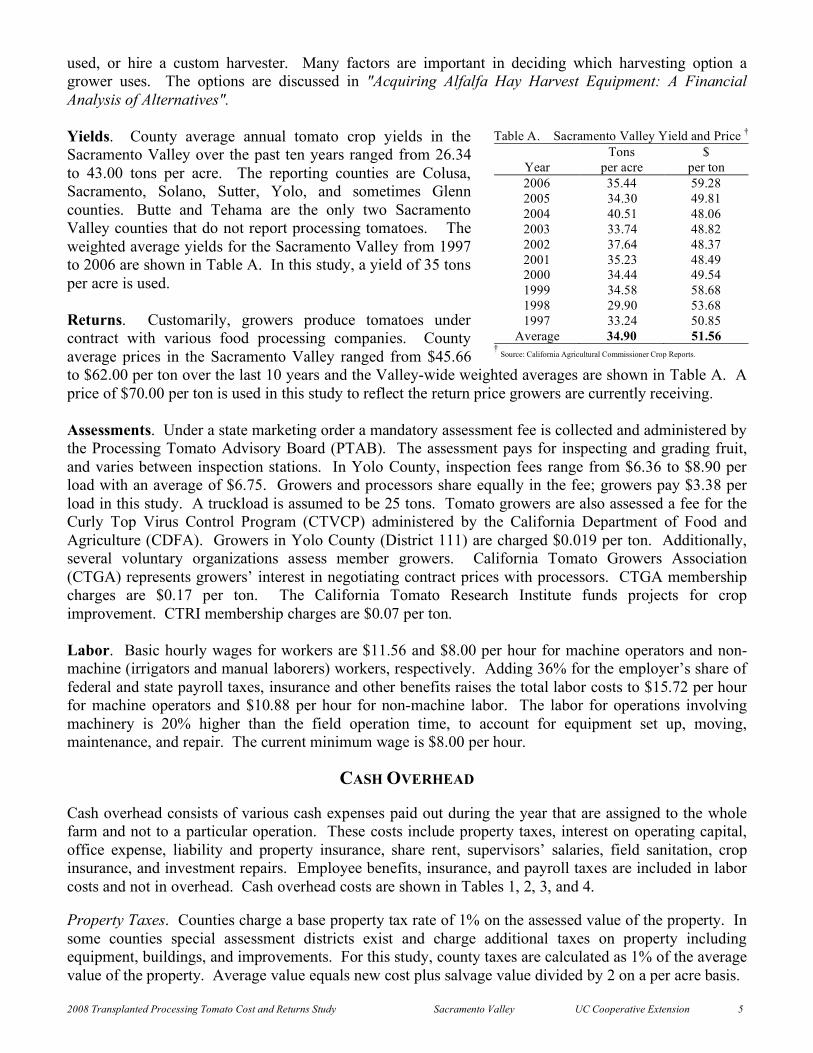
Table A. Sacramento Valley Yield and Price † Tons $
Year per acre per ton 2006 35.44 59.28 2005 34.30 49.81 2004 40.51 48.06 2003 33.74 48.82 2002 37.64 48.37 2001 35.23 48.49 2000 34.44 49.54 1999 34.58 58.68 1998 29.90 53.68 1997 33.24 50.85
Average 34.90 51.56 †
Source: California Agricultural Commissioner Crop Reports.
used, or hire a custom harvester. Many factors are important in deciding which harvesting option a grower uses. The options are discussed in "Acquiring Alfalfa Hay Harvest Equipment: A Financial Analysis of Alternatives". Yields. County average annual tomato crop yields in the Sacramento Valley over the past ten years ranged from 26.34 to 43.00 tons per acre. The reporting counties are Colusa, Sacramento, Solano, Sutter, Yolo, and sometimes Glenn counties. Butte and Tehama are the only two Sacramento Valley counties that do not report processing tomatoes. The weighted average yields for the Sacramento Valley from 1997 to 2006 are shown in Table A. In this study, a yield of 35 tons per acre is used. Returns. Customarily, growers produce tomatoes under contract with various food processing companies. County average prices in the Sacramento Valley ranged from $45.66 to $62.00 per ton over the last 10 years and the Valley-wide weighted averages are shown in Table A. A price of $70.00 per ton is used in this study to reflect the return price growers are currently receiving.
Assessments. Under a state marketing order a mandatory assessment fee is collected and administered by the Processing Tomato Advisory Board (PTAB). The assessment pays for inspecting and grading fruit, and varies between inspection stations. In Yolo County, inspection fees range from $6.36 to $8.90 per load with an average of $6.75. Growers and processors share equally in the fee; growers pay $3.38 per load in this study. A truckload is assumed to be 25 tons. Tomato growers are also assessed a fee for the Curly Top Virus Control Program (CTVCP) administered by the California Department of Food and Agriculture (CDFA). Growers in Yolo County (District 111) are charged $0.019 per ton. Additionally, several voluntary organizations assess member growers. California Tomato Growers Association (CTGA) represents growers’ interest in negotiating contract prices with processors. CTGA membership charges are $0.17 per ton. The California Tomato Research Institute funds projects for crop improvement. CTRI membership charges are $0.07 per ton. Labor. Basic hourly wages for workers are $11.56 and $8.00 per hour for machine operators and non-machine (irrigators and manual laborers) workers, respectively. Adding 36% for the employer’s share of federal and state payroll taxes, insurance and other benefits raises the total labor costs to $15.72 per hour for machine operators and $10.88 per hour for non-machine labor. The labor for operations involving machinery is 20% higher than the field operation time, to account for equipment set up, moving, maintenance, and repair. The current minimum wage is $8.00 per hour.
CASH OVERHEAD
Cash overhead consists of various cash expenses paid out during the year that are assigned to the whole farm and not to a particular operation. These costs include property taxes, interest on operating capital, office expense, liability and property insurance, share rent, supervisors’ salaries, field sanitation, crop insurance, and investment repairs. Employee benefits, insurance, and payroll taxes are included in labor costs and not in overhead. Cash overhead costs are shown in Tables 1, 2, 3, and 4. Property Taxes. Counties charge a base property tax rate of 1% on the assessed value of the property. In some counties special assessment districts exist and charge additional taxes on property including equipment, buildings, and improvements. For this study, county taxes are calculated as 1% of the average value of the property. Average value equals new cost plus salvage value divided by 2 on a per acre basis.
2008 Transplanted Processing Tomato Cost and Returns Study Sacramento Valley UC Cooperative Extension 6
Interest o n Operating Capital. Interest on operating capital is based on cash operating costs and is calculated monthly until harvest at a nominal rate of 6.75% per year. A nominal interest rate is the typical market cost of borrowed funds. Insurance. Insurance for farm investments varies depending on the assets included and the amount of coverage. Property insurance provides coverage for property loss and is charged at 0.740% of the average value of the assets over their useful life. Liability insurance covers accidents on the farm and costs $1,438 for the entire farm or $0.50 per acre. Office Expense. Office and business expenses are estimated to be $50,489 for the entire farm or $17.41 per acre. These expenses include office supplies, telephones, bookkeeping, accounting, legal fees, road maintenance, office and shop utilities, and miscellaneous administrative expenses. Share Rent. Rent arrangements will vary. The tomato land in this study is leased on a share-rent basis with the landowner receiving 12% of the gross returns. The land rented includes developed wells and irrigation system. Field Supervisors’ Salary. Supervisor salaries for tomatoes, including insurance, payroll taxes, and benefits, and are $94,500 per year for two supervisors. Two thirds of the supervisors’ time is allocated to tomatoes. The costs are $70.00 per acre. Any returns above total costs are considered returns on risk and investment to management (or owners). Field Sanitation. Sanitation services provide portable toilet and washing facilities for the ranch during the crop season. The cost includes delivery and weekly service. Costs will vary depending upon the crops and number of portable units required. Crop Insurance. The insurance protects the grower from crop losses due to adverse weather conditions, fire, unusual diseases and/or insects, wildlife, earthquake, volcanic eruption, and failure of the irrigation system. The grower can choose the protection level at 50% to 75% of production history or county yields. In this study, no level is chosen. The cost shown in the study is the average of the costs paid by the growers who reviewed this study.
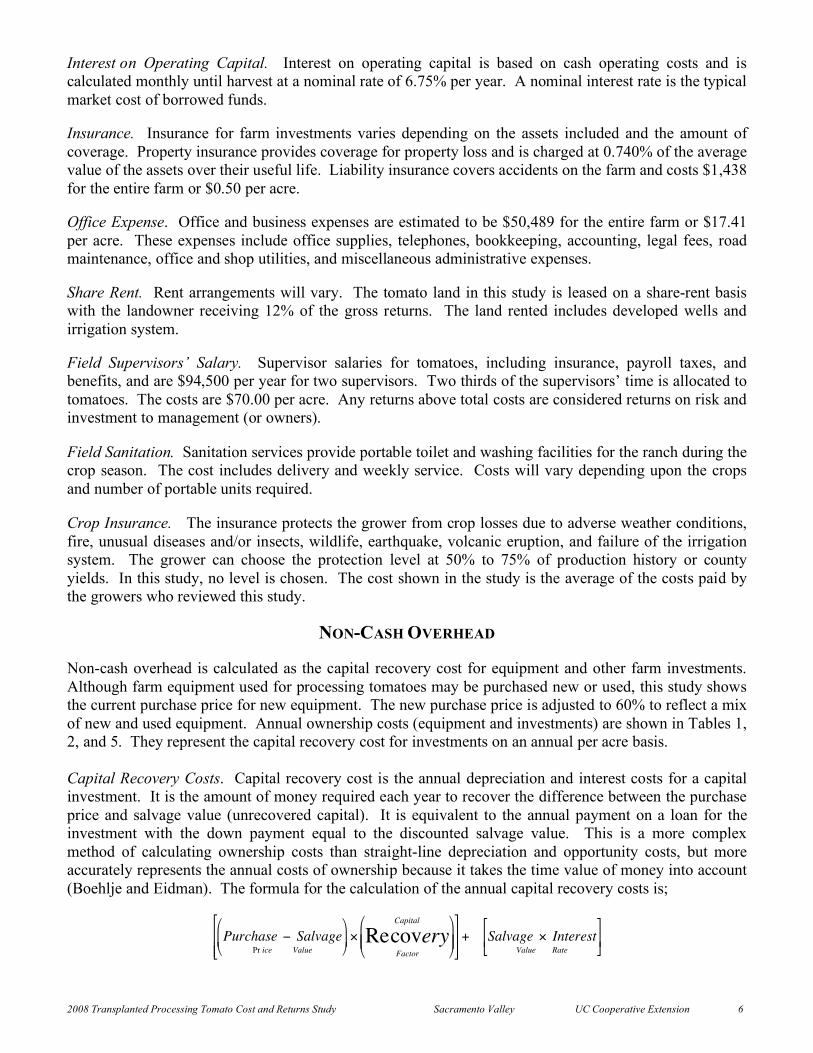
NON-CASH OVERHEAD Non-cash overhead is calculated as the capital recovery cost for equipment and other farm investments. Although farm equipment used for processing tomatoes may be purchased new or used, this study shows the current purchase price for new equipment. The new purchase price is adjusted to 60% to reflect a mix of new and used equipment. Annual ownership costs (equipment and investments) are shown in Tables 1, 2, and 5. They represent the capital recovery cost for investments on an annual per acre basis. Capital Recovery Costs. Capital recovery cost is the annual depreciation and interest costs for a capital investment. It is the amount of money required each year to recover the difference between the purchase price and salvage value (unrecovered capital). It is equivalent to the annual payment on a loan for the investment with the down payment equal to the discounted salvage value. This is a more complex method of calculating ownership costs than straight-line depreciation and opportunity costs, but more accurately represents the annual costs of ownership because it takes the time value of money into account (Boehlje and Eidman). The formula for the calculation of the annual capital recovery costs is;
!
Purchase " SalvagePr ice Value
#
$ %
&
' ( )
Factor
Capital
Recovery#
$ % %
&
' ( (
*
+ , ,
-
. / /
+ Salvage ) InterestValue Rate
*
+ ,
-
. /
2008 Transplanted Processing Tomato Cost and Returns Study Sacramento Valley UC Cooperative Extension 7
Salvage Value. Salvage value is an estimate of the remaining value of an investment at the end of its useful life. For farm machinery the remaining value is a percentage of the new cost of the investment (Boehlje and Eidman). The percent remaining value is calculated from equations developed by the American Society of Agricultural Engineers (ASAE) based on equipment type and years of life. The life in years is estimated by dividing the wear out life, as given by ASAE by the annual hours of use in this operation. For other investments including irrigation systems, buildings, and miscellaneous equipment, the value at the end of its useful life is zero. The salvage value for land is equal to the purchase price because land does not depreciate. The purchase price and salvage value for certain equipment and investments are shown in Table 5. Capital Recovery Factor. Capital recovery factor is the amortization factor or annual payment whose present value at compound interest is 1. The amortization factor is a table value that corresponds to the interest rate and the life of the equipment. Interest Rate. The interest rate of 4.25% used to calculate capital recovery cost is the effective long-term interest rate in January 2008. The interest rate is used to reflect the long-term realized rate of return to these specialized resources that can only be used effectively in the agricultural sector. Equipment Costs. Equipment costs are composed of three parts: non-cash overhead, cash overhead, and operating costs. Some of the cost factors have been discussed in previous sections. The operating costs consist of repairs, fuel, and lubrication. The fuel, lube, and repair cost per acre for each operation in Table 1 is determined by multiplying the total hourly operating cost in Table 5 for each piece of equipment used for the selected operation by the hours per acre. Tractor time is 10% higher than implement time for a given operation to account for setup, travel and down time. Repairs, Fuel and Lube. Repair costs are based on purchase price, annual hours of use, total hours of life, and repair coefficients formulated by the ASAE . Fuel and lubrication costs are also determined by ASAE equations based on maximum Power-Take-Off horsepower, and fuel type. Prices for on-farm delivery of diesel and unleaded gasoline are $3.54 and $3.57 per gallon, respectively. Irrigation System. Irrigation equipment owned by the grower consists of main lines, hand moved sprinklers, portable pumps, V-ditchers, and siphon tubes. Risk. Risks associated with processing tomato production are not assigned a production cost. All acres are contracted prior to harvest and all tonnage-time delivery contracts are assumed to have been met. No excess acres are grown to fulfill contracts. While this study makes an effort to model a production system based on typical, real world practices, it cannot fully represent financial, agronomic and market risks which affect the profitability and economic viability of processing tomato production. Table Values. Due to rounding the totals may be slightly different from the sum of the components.
2008 Transplanted Processing Tomato Cost and Returns Study Sacramento Valley UC Cooperative Extension 8
REFERENCES
American Society of Agricultural Engineers. 2003. American Society of Agricultural Engineers Standards
Yearbook. Russell H. Hahn and Evelyn E. Rosentreter (ed.) St. Joseph, Missouri. 41st edition.
Barker, Doug. California Workers’ Compensation Rating Data for Selected Agricultural Classifications as of January 2008. California Department of Insurance, Rate Regulation Branch.
Boehlje, Michael D., and Vernon R. Eidman. 1984. Farm Management. John Wiley and Sons. New
York, NY. Blank, Steve, Karen Klonsky, Kim Norris, and Steve Orloff. 1992. Acquiring Alfalfa Hay Harvest
Equipment: A Financial Analysis of Alternatives. University of California. Oakland, CA. Giannini Information Series No. 92-1. http://giannini.ucop.edu/InfoSeries/921-HayEquip.pdf. Internet accessed May, 2008.
California State Automobile Association. 2008. Gas Price Averages 2007 - 2008. AAA Press Room, San
Francisco, CA. http://www.csaa.com/portal/site/CSAA/menuitem.5313747aa611bd4e320cfad592278a0c/?vgnextoid=8d642ce6cda97010VgnVCM1000002872a8c0RCRD. Internet accessed April, 2008.
California State Board of equalization. Fuel Tax Division Tax Rates.
http://www.boe.ca.gov/sptaxprog/spftdrates.htm. Internet accessed April, 2008. CDFA-California County Agricultural Commissioners, California Annual Agricultural Crop Reports.
1998 – 2007. California Department of Food and Agricultural, Sacramento, CA. http://www.nass.usda.gov/ca/bul/agcom/indexcac.htm. Internet accessed May, 2008.
Energy Information Administration. 2008. Weekly Retail on Highway Diesel Prices.
http://tonto.eia.doe.gov/oog/info/gdu/gasdiesel.asp. Internet accessed April, 2008. Integrated Pest Management Education and Publications. 2008. “UC Pest Management Guidelines,
Tomatoes.” In M. L. Flint (ed.) UC IPM Pest Management Guidelines. University of California. Division of Agriculture and Natural Resources. Oakland, CA. Publication 3339. http://www.ipm.ucdavis.edu/PMG/selectnewpest.tomatoes.html. Internet accessed May, 2008.
Miyao, Gene, Karen M. Klonsky, and Pete Livingston. 2007. “Sample Costs To Produce Processing
Tomatoes, Transplanted, In the Sacramento Valley - 2007”. University of California, Cooperative Extension. Department of Agricultural and Resource Economics. Davis, CA. http://coststudies.ucdavis.edu/. Internet accessed April, 2008.
Miyao, Gene, Karen M. Klonsky, and Pete Livingston. 2007. Sample Costs to Produce Processing
Tomatoes, Direct Seeded, in the Sacramento Valley – 2007. University of California, Cooperative Extension. Department of Agricultural and Resource Economics. Davis, CA. http://coststudies.ucdavis.edu/. Internet accessed, April, 2008.
2008 Transplanted Processing Tomato Cost and Returns Study Sacramento Valley UC Cooperative Extension 9
Statewide Integrated Pest Management Project. 1998. Integrated Pest Management for Tomatoes. Fourth Edition. University of California. Division of Agriculture and Natural Resources. Oakland, CA. Publication 3274. http://www.ipm.ucdavis.edu/PMG/selectnewpest.tomatoes.html. Internet accessed April, 2008.
USDA-ERS. 2008. Farm Sector: Farm Financial Ratios. Agriculture and Rural Economics Division,
ERS. USDA. Washington, DC. http://usda.mannlib.cornell.edu/reports/nassr/price/zap-bb/agpran04.txt; Internet accessed January, 2008.
________________________
For information concerning the above or other University of California publications, contact UC DANR Communications Services at 800-994-8849, online at http://anrcatalog.ucdavis.edu/InOrder/Shop/Shop.asp, or your local county UC Cooperative Extension office.
2008 Transplanted Processing Tomato Cost and Returns Study Sacramento Valley UC Cooperative Extension 10
UC COOPERATIVE EXTENSION Table 1. COSTS PER ACRE TO PRODUCE TOMATOES
SACRAMENTO VALLEY – 2008 TRANSPLANTED
Labor Rate: $15.72/hr. machine labor Interest Rate: 6.75%
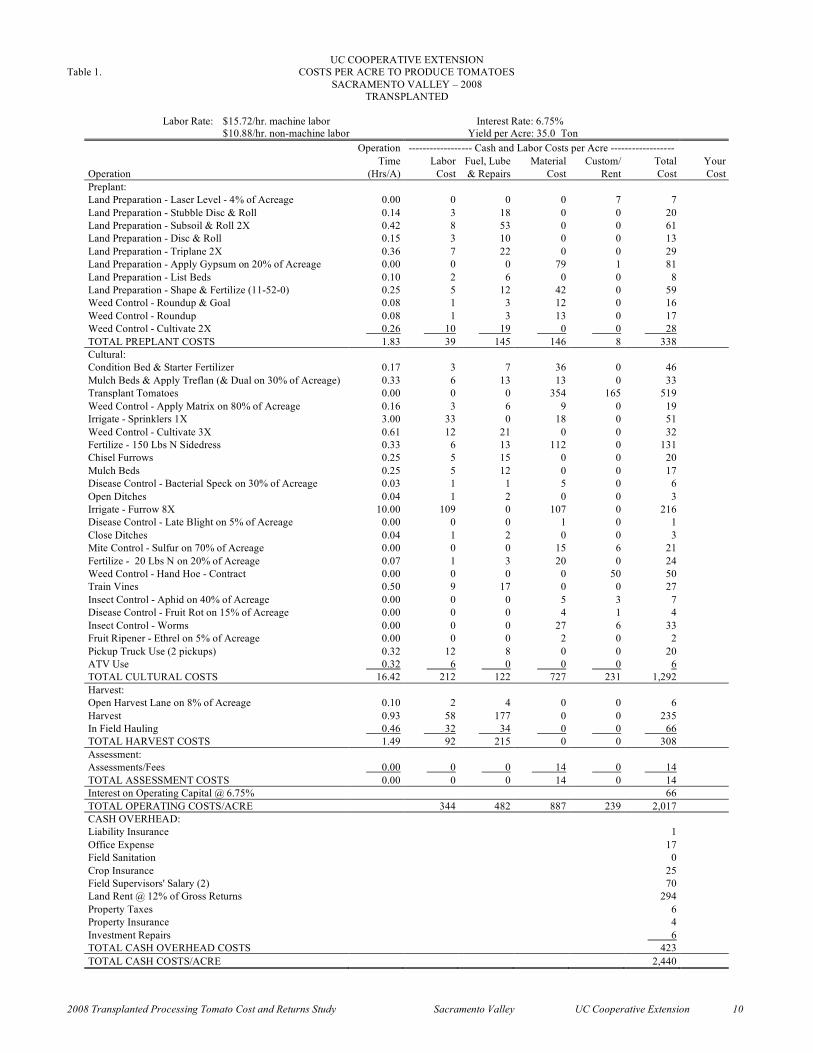
$10.88/hr. non-machine labor Yield per Acre: 35.0 Ton Operation ------------------ Cash and Labor Costs per Acre ------------------ Time Labor Fuel, Lube Material Custom/ Total Your Operation (Hrs/A) Cost & Repairs Cost Rent Cost Cost Preplant: Land Preparation - Laser Level - 4% of Acreage 0.00 0 0 0 7 7 Land Preparation - Stubble Disc & Roll 0.14 3 18 0 0 20 Land Preparation - Subsoil & Roll 2X 0.42 8 53 0 0 61 Land Preparation - Disc & Roll 0.15 3 10 0 0 13 Land Preparation - Triplane 2X 0.36 7 22 0 0 29 Land Preparation - Apply Gypsum on 20% of Acreage 0.00 0 0 79 1 81 Land Preparation - List Beds 0.10 2 6 0 0 8 Land Preparation - Shape & Fertilize (11-52-0) 0.25 5 12 42 0 59 Weed Control - Roundup & Goal 0.08 1 3 12 0 16 Weed Control - Roundup 0.08 1 3 13 0 17 Weed Control - Cultivate 2X 0.26 10 19 0 0 28 TOTAL PREPLANT COSTS 1.83 39 145 146 8 338 Cultural: Condition Bed & Starter Fertilizer 0.17 3 7 36 0 46 Mulch Beds & Apply Treflan (& Dual on 30% of Acreage) 0.33 6 13 13 0 33 Transplant Tomatoes 0.00 0 0 354 165 519 Weed Control - Apply Matrix on 80% of Acreage 0.16 3 6 9 0 19 Irrigate - Sprinklers 1X 3.00 33 0 18 0 51 Weed Control - Cultivate 3X 0.61 12 21 0 0 32 Fertilize - 150 Lbs N Sidedress 0.33 6 13 112 0 131 Chisel Furrows 0.25 5 15 0 0 20 Mulch Beds 0.25 5 12 0 0 17 Disease Control - Bacterial Speck on 30% of Acreage 0.03 1 1 5 0 6 Open Ditches 0.04 1 2 0 0 3 Irrigate - Furrow 8X 10.00 109 0 107 0 216 Disease Control - Late Blight on 5% of Acreage 0.00 0 0 1 0 1 Close Ditches 0.04 1 2 0 0 3 Mite Control - Sulfur on 70% of Acreage 0.00 0 0 15 6 21 Fertilize - 20 Lbs N on 20% of Acreage 0.07 1 3 20 0 24 Weed Control - Hand Hoe - Contract 0.00 0 0 0 50 50 Train Vines 0.50 9 17 0 0 27 Insect Control - Aphid on 40% of Acreage 0.00 0 0 5 3 7 Disease Control - Fruit Rot on 15% of Acreage 0.00 0 0 4 1 4 Insect Control - Worms 0.00 0 0 27 6 33 Fruit Ripener - Ethrel on 5% of Acreage 0.00 0 0 2 0 2 Pickup Truck Use (2 pickups) 0.32 12 8 0 0 20 ATV Use 0.32 6 0 0 0 6 TOTAL CULTURAL COSTS 16.42 212 122 727 231 1,292 Harvest: Open Harvest Lane on 8% of Acreage 0.10 2 4 0 0 6 Harvest 0.93 58 177 0 0 235 In Field Hauling 0.46 32 34 0 0 66 TOTAL HARVEST COSTS 1.49 92 215 0 0 308 Assessment: Assessments/Fees 0.00 0 0 14 0 14 TOTAL ASSESSMENT COSTS 0.00 0 0 14 0 14 Interest on Operating Capital @ 6.75% 66 TOTAL OPERATING COSTS/ACRE 344 482 887 239 2,017 CASH OVERHEAD: Liability Insurance 1 Office Expense 17 Field Sanitation 0 Crop Insurance 25 Field Supervisors' Salary (2) 70 Land Rent @ 12% of Gross Returns 294 Property Taxes 6 Property Insurance 4 Investment Repairs 6 TOTAL CASH OVERHEAD COSTS 423 TOTAL CASH COSTS/ACRE 2,440
2008 Transplanted Processing Tomato Cost and Returns Study Sacramento Valley UC Cooperative Extension 11
UC COOPERATIVE EXTENSION Table 1 continued
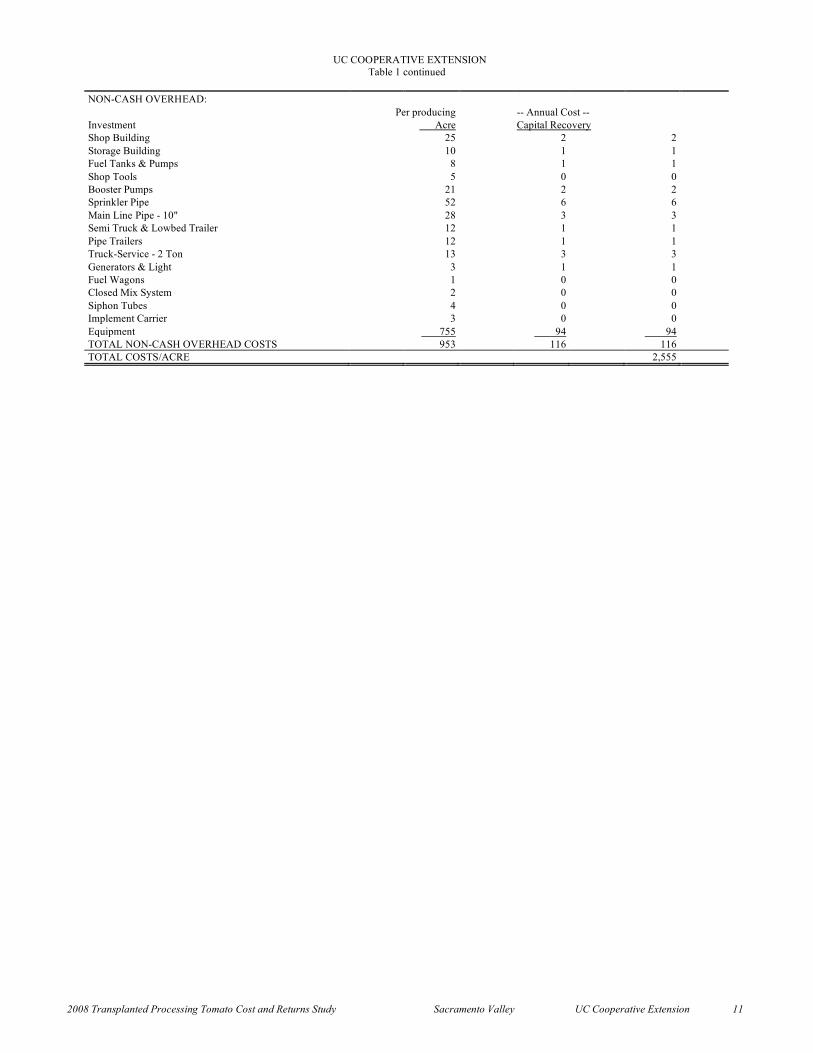
NON-CASH OVERHEAD: Per producing -- Annual Cost -- Investment Acre Capital Recovery Shop Building 25 2 2 Storage Building 10 1 1 Fuel Tanks & Pumps 8 1 1 Shop Tools 5 0 0 Booster Pumps 21 2 2 Sprinkler Pipe 52 6 6 Main Line Pipe - 10" 28 3 3 Semi Truck & Lowbed Trailer 12 1 1 Pipe Trailers 12 1 1 Truck-Service - 2 Ton 13 3 3 Generators & Light 3 1 1 Fuel Wagons 1 0 0 Closed Mix System 2 0 0 Siphon Tubes 4 0 0 Implement Carrier 3 0 0 Equipment 755 94 94 TOTAL NON-CASH OVERHEAD COSTS 953 116 116 TOTAL COSTS/ACRE 2,555

2008 Transplanted Processing Tomato Cost and Returns Study Sacramento Valley UC Cooperative Extension 12
UC COOPERATIVE EXTENSION Table 2. COSTS and RETURNS PER ACRE to PRODUCE TOMATOES
SACRAMENTO VALLEY – 2008 TRANSPLANTED
Labor Rate: $15.72/hr. machine labor Interest Rate: 6.75%
$10.88/hr. non-machine labor Yield per Acre: 35.0 Ton
Price or Value or Your Quantity/Acre Unit Cost/Unit Cost/Acre Cost GROSS RETURNS Processing Tomatoes 35.00 Ton 70.00 2,450 TOTAL GROSS RETURNS FOR PROCESSING TOMATOES 2,450 OPERATING COSTS Custom: Laser Level 0.04 Acre 165.00 7 Gypsum Application 0.20 Ton 7.00 1 Transplanting 8.70 Thou 19.00 165 Air Application - Spray 10 Gal/Acre 1.60 Acre 6.25 10 Air Application - Dust 28.00 Lb 0.20 6 Fertilizer: Gypsum 0.60 Ton 132.00 79 11-52-0 100.00 Lb 0.419 42 8-24-6 15.00 Lb 2.28 34 Zinc Chelate 6% 2.00 Pint 0.913 2 UN-32 150.00 Lb N 0.745 112 CAN 17 118.00 Lb 0.171 20 Herbicide: Roundup Ultra 2.50 Pint 8.59 21 Goal 2XL 3.00 FlOz 1.03 3 Dual Magnum 0.45 Pint 18.63 8 Treflan HFP 1.00 Pint 4.84 5 Matrix DF 0.48 Oz 19.25 9 Seed: Tomato Seed 10.01 Thou 11.00 110 Transplant: Transplants - Growing 8.70 Thou 28.00 244 Irrigation: Water 42.00 AcIn 2.67 112 Pump - Fuel, Lube, & Repairs 1.00 Acre 13.00 13 Fungicide: Kocide 101 0.60 Lb 3.62 2 Dithane DF 0.60 Lb 3.89 2 Sulfur, Dust 98% 28.00 Lb 0.55 15 Insecticide: Bravo Weatherstik 0.60 Pint 7.85 5 Warrior T 1.54 FlOz 3.05 5 Confirm 12.00 FlOz 2.23 27 Contract: Contract Labor 5.00 Hour 9.99 50 Growth Regulator: Ethrel 0.03 Gal 63.00 2 Assessment: CDFA-CTVP 35.00 Ton 0.019 1 CTGA 35.00 Ton 0.17 6 CTRI 35.00 Ton 0.07 2 PTAB 35.00 Ton 0.135 5 Labor (machine) 9.34 Hrs 15.72 147 Labor (non-machine) 18.08 Hrs 10.88 197 Fuel - Gas 1.85 Gal 3.57 7 Fuel - Diesel 77.61 Gal 3.54 275 Lube 42 Machinery repair 159 Interest on Operating Capital @ 6.75% 66 TOTAL OPERATING COSTS/ACRE 2,017 NET RETURNS ABOVE OPERATING COSTS/ACRE 406
2008 Transplanted Processing Tomato Cost and Returns Study Sacramento Valley UC Cooperative Extension 13
UC COOPERATIVE EXTENSION Table 2 continued
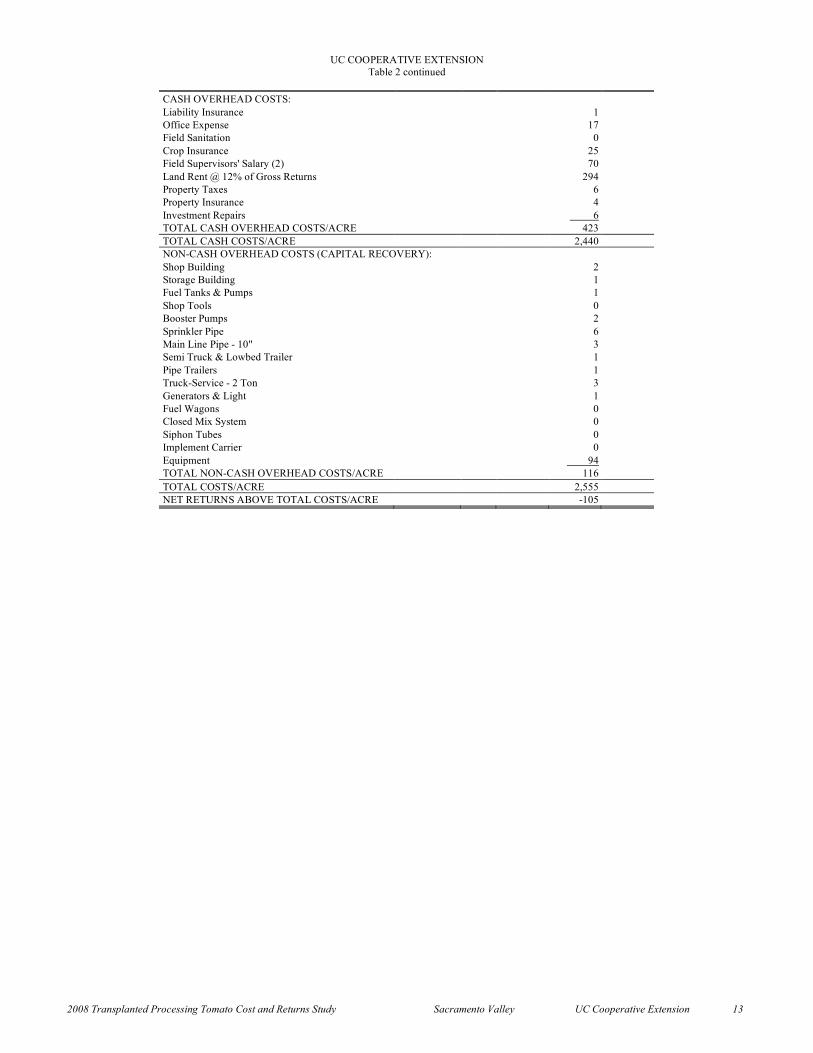
CASH OVERHEAD COSTS: Liability Insurance 1 Office Expense 17 Field Sanitation 0 Crop Insurance 25 Field Supervisors' Salary (2) 70 Land Rent @ 12% of Gross Returns 294 Property Taxes 6 Property Insurance 4 Investment Repairs 6 TOTAL CASH OVERHEAD COSTS/ACRE 423 TOTAL CASH COSTS/ACRE 2,440 NON-CASH OVERHEAD COSTS (CAPITAL RECOVERY): Shop Building 2 Storage Building 1 Fuel Tanks & Pumps 1 Shop Tools 0 Booster Pumps 2 Sprinkler Pipe 6 Main Line Pipe - 10" 3 Semi Truck & Lowbed Trailer 1 Pipe Trailers 1 Truck-Service - 2 Ton 3 Generators & Light 1 Fuel Wagons 0 Closed Mix System 0 Siphon Tubes 0 Implement Carrier 0 Equipment 94 TOTAL NON-CASH OVERHEAD COSTS/ACRE 116 TOTAL COSTS/ACRE 2,555 NET RETURNS ABOVE TOTAL COSTS/ACRE -105
2008 Transplanted Processing Tomato Cost and Returns Study Sacramento Valley UC Cooperative Extension 14
UC COOPERATIVE EXTENSION Table 3. MONTHLY CASH COST PER ACRE TO PRODUCE TOMATOES
SACRAMENTO VALLEY – 2008 TRANSPLANTED
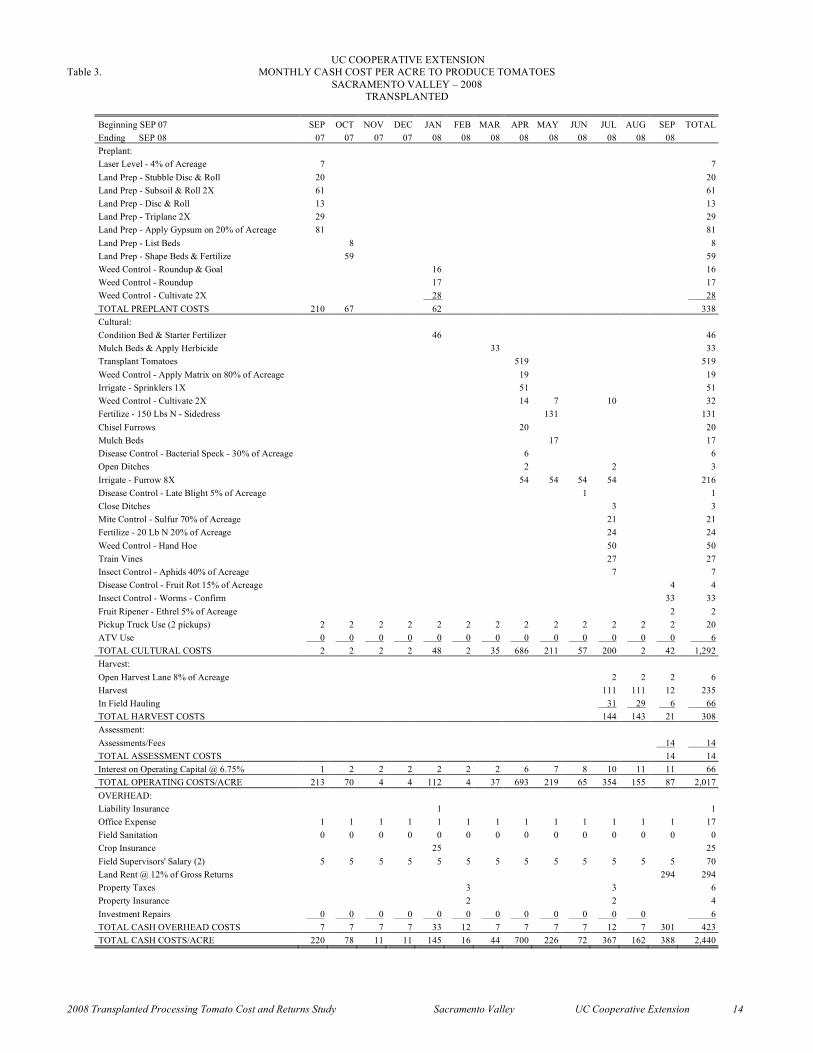
Beginning SEP 07 SEP OCT NOV DEC JAN FEB MAR APR MAY JUN JUL AUG SEP TOTAL Ending SEP 08 07 07 07 07 08 08 08 08 08 08 08 08 08 Preplant: Laser Level - 4% of Acreage 7 7 Land Prep - Stubble Disc & Roll 20 20 Land Prep - Subsoil & Roll 2X 61 61 Land Prep - Disc & Roll 13 13 Land Prep - Triplane 2X 29 29 Land Prep - Apply Gypsum on 20% of Acreage 81 81 Land Prep - List Beds 8 8 Land Prep - Shape Beds & Fertilize 59 59 Weed Control - Roundup & Goal 16 16 Weed Control - Roundup 17 17 Weed Control - Cultivate 2X 28 28 TOTAL PREPLANT COSTS 210 67 62 338 Cultural: Condition Bed & Starter Fertilizer 46 46 Mulch Beds & Apply Herbicide 33 33 Transplant Tomatoes 519 519 Weed Control - Apply Matrix on 80% of Acreage 19 19 Irrigate - Sprinklers 1X 51 51 Weed Control - Cultivate 2X 14 7 10 32 Fertilize - 150 Lbs N - Sidedress 131 131 Chisel Furrows 20 20 Mulch Beds 17 17 Disease Control - Bacterial Speck - 30% of Acreage 6 6 Open Ditches 2 2 3 Irrigate - Furrow 8X 54 54 54 54 216 Disease Control - Late Blight 5% of Acreage 1 1 Close Ditches 3 3 Mite Control - Sulfur 70% of Acreage 21 21 Fertilize - 20 Lb N 20% of Acreage 24 24 Weed Control - Hand Hoe 50 50 Train Vines 27 27 Insect Control - Aphids 40% of Acreage 7 7 Disease Control - Fruit Rot 15% of Acreage 4 4 Insect Control - Worms - Confirm 33 33 Fruit Ripener - Ethrel 5% of Acreage 2 2 Pickup Truck Use (2 pickups) 2 2 2 2 2 2 2 2 2 2 2 2 2 20 ATV Use 0 0 0 0 0 0 0 0 0 0 0 0 0 6 TOTAL CULTURAL COSTS 2 2 2 2 48 2 35 686 211 57 200 2 42 1,292 Harvest: Open Harvest Lane 8% of Acreage 2 2 2 6 Harvest 111 111 12 235 In Field Hauling 31 29 6 66 TOTAL HARVEST COSTS 144 143 21 308 Assessment: Assessments/Fees 14 14 TOTAL ASSESSMENT COSTS 14 14 Interest on Operating Capital @ 6.75% 1 2 2 2 2 2 2 6 7 8 10 11 11 66 TOTAL OPERATING COSTS/ACRE 213 70 4 4 112 4 37 693 219 65 354 155 87 2,017 OVERHEAD: Liability Insurance 1 1 Office Expense 1 1 1 1 1 1 1 1 1 1 1 1 1 17 Field Sanitation 0 0 0 0 0 0 0 0 0 0 0 0 0 0 Crop Insurance 25 25 Field Supervisors' Salary (2) 5 5 5 5 5 5 5 5 5 5 5 5 5 70 Land Rent @ 12% of Gross Returns 294 294 Property Taxes 3 3 6 Property Insurance 2 2 4 Investment Repairs 0 0 0 0 0 0 0 0 0 0 0 0 6 TOTAL CASH OVERHEAD COSTS 7 7 7 7 33 12 7 7 7 7 12 7 301 423 TOTAL CASH COSTS/ACRE 220 78 11 11 145 16 44 700 226 72 367 162 388 2,440
2008 Transplanted Processing Tomato Cost and Returns Study Sacramento Valley UC Cooperative Extension 15
UC COOPERATIVE EXTENSION Table 4. WHOLE FARM ANNUAL EQUIPMENT, INVESTMENT, AND BUSINESS OVERHEAD COSTS
SACRAMENTO VALLEY – 2008 TRANSPLANTED
ANNUAL EQUIPMENT COSTS
- Cash Overhead - Yrs Salvage Capital Insur-
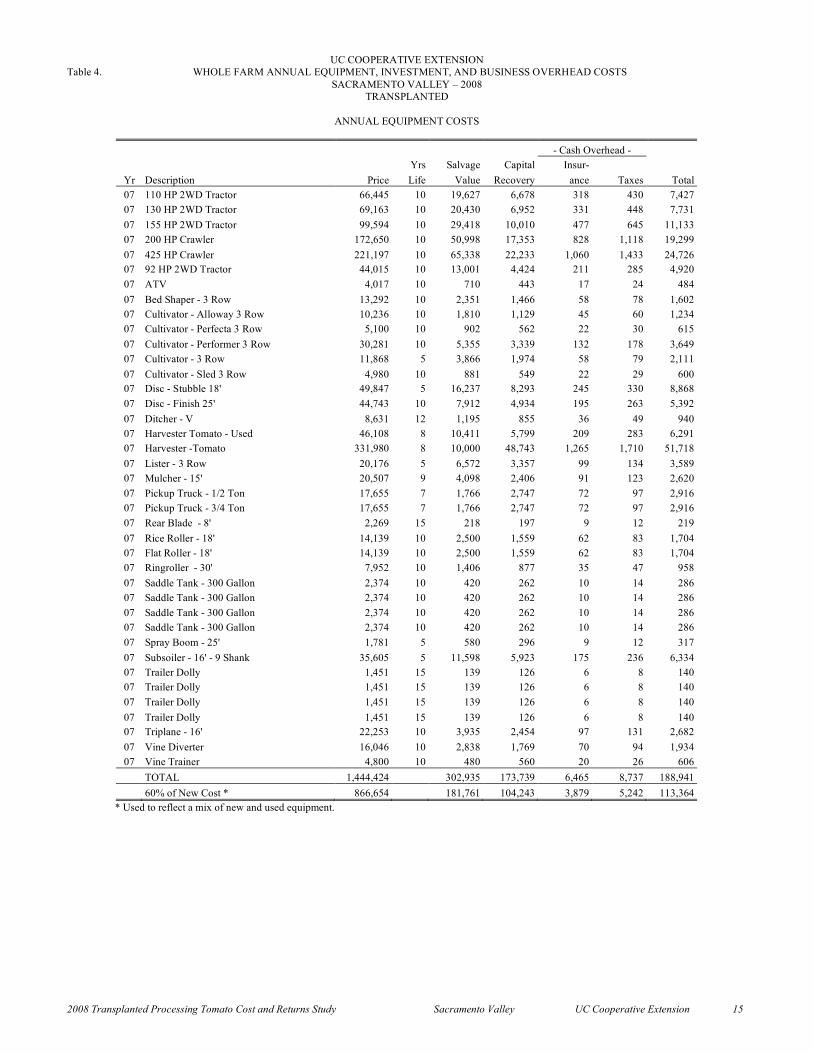
Yr Description Price Life Value Recovery ance Taxes Total 07 110 HP 2WD Tractor 66,445 10 19,627 6,678 318 430 7,427 07 130 HP 2WD Tractor 69,163 10 20,430 6,952 331 448 7,731 07 155 HP 2WD Tractor 99,594 10 29,418 10,010 477 645 11,133 07 200 HP Crawler 172,650 10 50,998 17,353 828 1,118 19,299 07 425 HP Crawler 221,197 10 65,338 22,233 1,060 1,433 24,726 07 92 HP 2WD Tractor 44,015 10 13,001 4,424 211 285 4,920 07 ATV 4,017 10 710 443 17 24 484 07 Bed Shaper - 3 Row 13,292 10 2,351 1,466 58 78 1,602 07 Cultivator - Alloway 3 Row 10,236 10 1,810 1,129 45 60 1,234 07 Cultivator - Perfecta 3 Row 5,100 10 902 562 22 30 615 07 Cultivator - Performer 3 Row 30,281 10 5,355 3,339 132 178 3,649 07 Cultivator - 3 Row 11,868 5 3,866 1,974 58 79 2,111 07 Cultivator - Sled 3 Row 4,980 10 881 549 22 29 600 07 Disc - Stubble 18' 49,847 5 16,237 8,293 245 330 8,868 07 Disc - Finish 25' 44,743 10 7,912 4,934 195 263 5,392 07 Ditcher - V 8,631 12 1,195 855 36 49 940 07 Harvester Tomato - Used 46,108 8 10,411 5,799 209 283 6,291 07 Harvester -Tomato 331,980 8 10,000 48,743 1,265 1,710 51,718 07 Lister - 3 Row 20,176 5 6,572 3,357 99 134 3,589 07 Mulcher - 15' 20,507 9 4,098 2,406 91 123 2,620 07 Pickup Truck - 1/2 Ton 17,655 7 1,766 2,747 72 97 2,916 07 Pickup Truck - 3/4 Ton 17,655 7 1,766 2,747 72 97 2,916 07 Rear Blade - 8' 2,269 15 218 197 9 12 219 07 Rice Roller - 18' 14,139 10 2,500 1,559 62 83 1,704 07 Flat Roller - 18' 14,139 10 2,500 1,559 62 83 1,704 07 Ringroller - 30' 7,952 10 1,406 877 35 47 958 07 Saddle Tank - 300 Gallon 2,374 10 420 262 10 14 286 07 Saddle Tank - 300 Gallon 2,374 10 420 262 10 14 286 07 Saddle Tank - 300 Gallon 2,374 10 420 262 10 14 286 07 Saddle Tank - 300 Gallon 2,374 10 420 262 10 14 286 07 Spray Boom - 25' 1,781 5 580 296 9 12 317 07 Subsoiler - 16' - 9 Shank 35,605 5 11,598 5,923 175 236 6,334 07 Trailer Dolly 1,451 15 139 126 6 8 140 07 Trailer Dolly 1,451 15 139 126 6 8 140 07 Trailer Dolly 1,451 15 139 126 6 8 140 07 Trailer Dolly 1,451 15 139 126 6 8 140 07 Triplane - 16' 22,253 10 3,935 2,454 97 131 2,682 07 Vine Diverter 16,046 10 2,838 1,769 70 94 1,934 07 Vine Trainer 4,800 10 480 560 20 26 606
TOTAL 1,444,424 302,935 173,739 6,465 8,737 188,941 60% of New Cost * 866,654 181,761 104,243 3,879 5,242 113,364
* Used to reflect a mix of new and used equipment.
2008 Transplanted Processing Tomato Cost and Returns Study Sacramento Valley UC Cooperative Extension 16
UC COOPERATIVE EXTENSION Table 4 continued
ANNUAL INVESTMENT COSTS
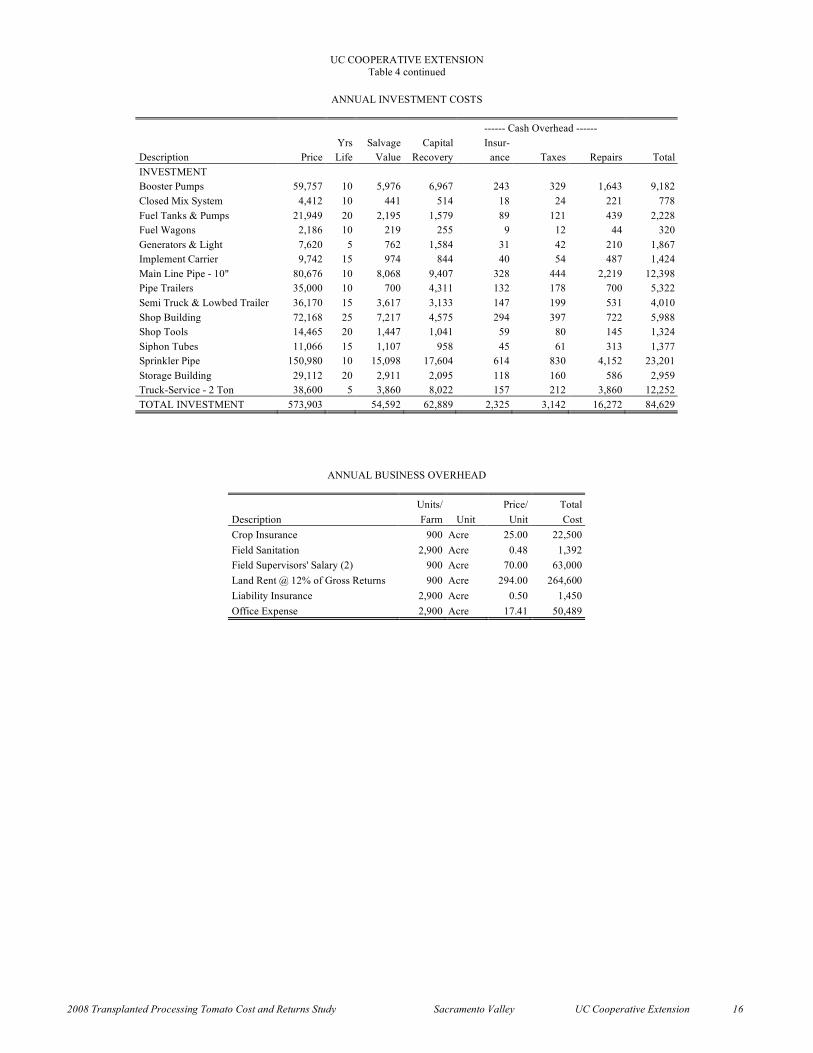
------ Cash Overhead ------ Yrs Salvage Capital Insur- Description Price Life Value Recovery ance Taxes Repairs Total INVESTMENT Booster Pumps 59,757 10 5,976 6,967 243 329 1,643 9,182 Closed Mix System 4,412 10 441 514 18 24 221 778 Fuel Tanks & Pumps 21,949 20 2,195 1,579 89 121 439 2,228 Fuel Wagons 2,186 10 219 255 9 12 44 320 Generators & Light 7,620 5 762 1,584 31 42 210 1,867 Implement Carrier 9,742 15 974 844 40 54 487 1,424 Main Line Pipe - 10" 80,676 10 8,068 9,407 328 444 2,219 12,398 Pipe Trailers 35,000 10 700 4,311 132 178 700 5,322 Semi Truck & Lowbed Trailer 36,170 15 3,617 3,133 147 199 531 4,010 Shop Building 72,168 25 7,217 4,575 294 397 722 5,988 Shop Tools 14,465 20 1,447 1,041 59 80 145 1,324 Siphon Tubes 11,066 15 1,107 958 45 61 313 1,377 Sprinkler Pipe 150,980 10 15,098 17,604 614 830 4,152 23,201 Storage Building 29,112 20 2,911 2,095 118 160 586 2,959 Truck-Service - 2 Ton 38,600 5 3,860 8,022 157 212 3,860 12,252 TOTAL INVESTMENT 573,903 54,592 62,889 2,325 3,142 16,272 84,629
ANNUAL BUSINESS OVERHEAD
Units/ Price/ Total Description Farm Unit Unit Cost Crop Insurance 900 Acre 25.00 22,500 Field Sanitation 2,900 Acre 0.48 1,392 Field Supervisors' Salary (2) 900 Acre 70.00 63,000 Land Rent @ 12% of Gross Returns 900 Acre 294.00 264,600 Liability Insurance 2,900 Acre 0.50 1,450 Office Expense 2,900 Acre 17.41 50,489
2008 Transplanted Processing Tomato Cost and Returns Study Sacramento Valley UC Cooperative Extension 17
UC COOPERATIVE EXTENSION
Table 5. HOURLY EQUIPMENT COSTS SACRAMENTO VALLEY – 2008
TRANSPLANTED
------------------- COSTS PER HOUR ---------------------------- Actual - Cash Overhead - -------- Operating -------- Hours Capital Insur- Fuel & Total Total
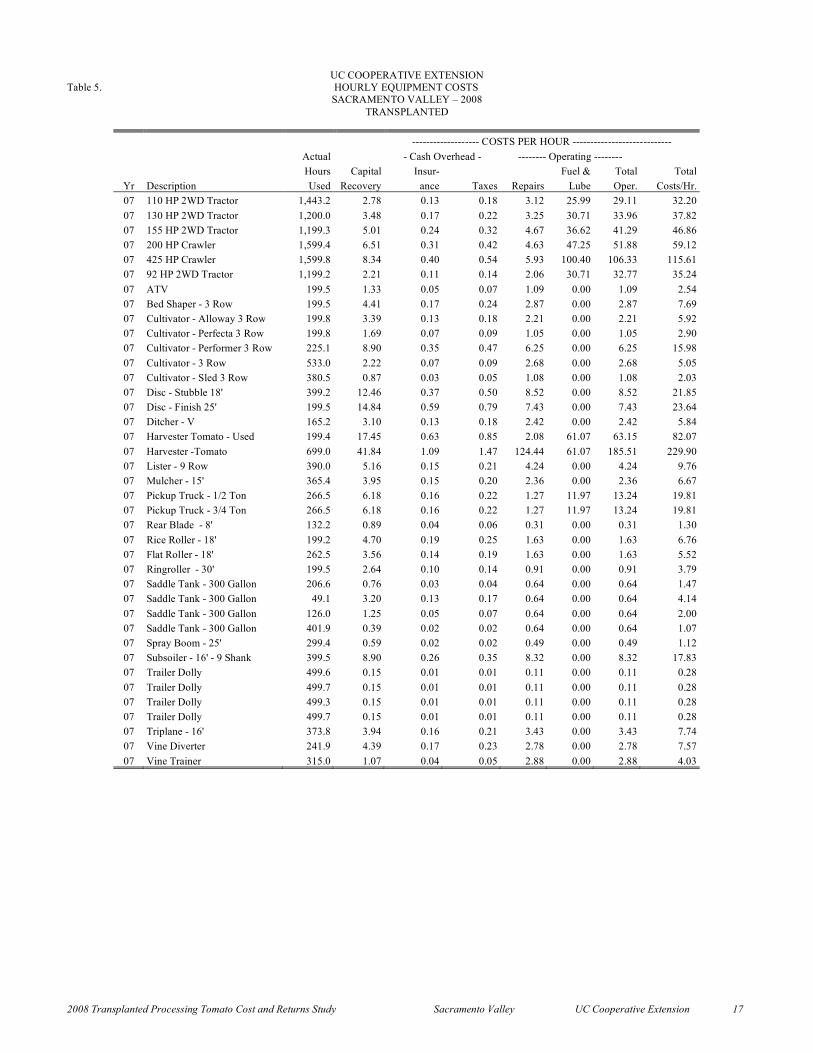
Yr Description Used Recovery ance Taxes Repairs Lube Oper. Costs/Hr. 07 110 HP 2WD Tractor 1,443.2 2.78 0.13 0.18 3.12 25.99 29.11 32.20 07 130 HP 2WD Tractor 1,200.0 3.48 0.17 0.22 3.25 30.71 33.96 37.82 07 155 HP 2WD Tractor 1,199.3 5.01 0.24 0.32 4.67 36.62 41.29 46.86 07 200 HP Crawler 1,599.4 6.51 0.31 0.42 4.63 47.25 51.88 59.12 07 425 HP Crawler 1,599.8 8.34 0.40 0.54 5.93 100.40 106.33 115.61 07 92 HP 2WD Tractor 1,199.2 2.21 0.11 0.14 2.06 30.71 32.77 35.24 07 ATV 199.5 1.33 0.05 0.07 1.09 0.00 1.09 2.54 07 Bed Shaper - 3 Row 199.5 4.41 0.17 0.24 2.87 0.00 2.87 7.69 07 Cultivator - Alloway 3 Row 199.8 3.39 0.13 0.18 2.21 0.00 2.21 5.92 07 Cultivator - Perfecta 3 Row 199.8 1.69 0.07 0.09 1.05 0.00 1.05 2.90 07 Cultivator - Performer 3 Row 225.1 8.90 0.35 0.47 6.25 0.00 6.25 15.98 07 Cultivator - 3 Row 533.0 2.22 0.07 0.09 2.68 0.00 2.68 5.05 07 Cultivator - Sled 3 Row 380.5 0.87 0.03 0.05 1.08 0.00 1.08 2.03 07 Disc - Stubble 18' 399.2 12.46 0.37 0.50 8.52 0.00 8.52 21.85 07 Disc - Finish 25' 199.5 14.84 0.59 0.79 7.43 0.00 7.43 23.64 07 Ditcher - V 165.2 3.10 0.13 0.18 2.42 0.00 2.42 5.84 07 Harvester Tomato - Used 199.4 17.45 0.63 0.85 2.08 61.07 63.15 82.07 07 Harvester -Tomato 699.0 41.84 1.09 1.47 124.44 61.07 185.51 229.90 07 Lister - 9 Row 390.0 5.16 0.15 0.21 4.24 0.00 4.24 9.76 07 Mulcher - 15' 365.4 3.95 0.15 0.20 2.36 0.00 2.36 6.67 07 Pickup Truck - 1/2 Ton 266.5 6.18 0.16 0.22 1.27 11.97 13.24 19.81 07 Pickup Truck - 3/4 Ton 266.5 6.18 0.16 0.22 1.27 11.97 13.24 19.81 07 Rear Blade - 8' 132.2 0.89 0.04 0.06 0.31 0.00 0.31 1.30 07 Rice Roller - 18' 199.2 4.70 0.19 0.25 1.63 0.00 1.63 6.76 07 Flat Roller - 18' 262.5 3.56 0.14 0.19 1.63 0.00 1.63 5.52 07 Ringroller - 30' 199.5 2.64 0.10 0.14 0.91 0.00 0.91 3.79 07 Saddle Tank - 300 Gallon 206.6 0.76 0.03 0.04 0.64 0.00 0.64 1.47 07 Saddle Tank - 300 Gallon 49.1 3.20 0.13 0.17 0.64 0.00 0.64 4.14 07 Saddle Tank - 300 Gallon 126.0 1.25 0.05 0.07 0.64 0.00 0.64 2.00 07 Saddle Tank - 300 Gallon 401.9 0.39 0.02 0.02 0.64 0.00 0.64 1.07 07 Spray Boom - 25' 299.4 0.59 0.02 0.02 0.49 0.00 0.49 1.12 07 Subsoiler - 16' - 9 Shank 399.5 8.90 0.26 0.35 8.32 0.00 8.32 17.83 07 Trailer Dolly 499.6 0.15 0.01 0.01 0.11 0.00 0.11 0.28 07 Trailer Dolly 499.7 0.15 0.01 0.01 0.11 0.00 0.11 0.28 07 Trailer Dolly 499.3 0.15 0.01 0.01 0.11 0.00 0.11 0.28 07 Trailer Dolly 499.7 0.15 0.01 0.01 0.11 0.00 0.11 0.28 07 Triplane - 16' 373.8 3.94 0.16 0.21 3.43 0.00 3.43 7.74 07 Vine Diverter 241.9 4.39 0.17 0.23 2.78 0.00 2.78 7.57 07 Vine Trainer 315.0 1.07 0.04 0.05 2.88 0.00 2.88 4.03
2008 Transplanted Processing Tomato Cost and Returns Study Sacramento Valley UC Cooperative Extension 18
UC COOPERATIVE EXTENSION Table 6. RANGING ANALYSIS
SACRAMENTO VALLEY – 2008 TRANSPLANTED
COSTS PER ACRE AT VARYING YIELDS FOR PROCESSING TOMATOES
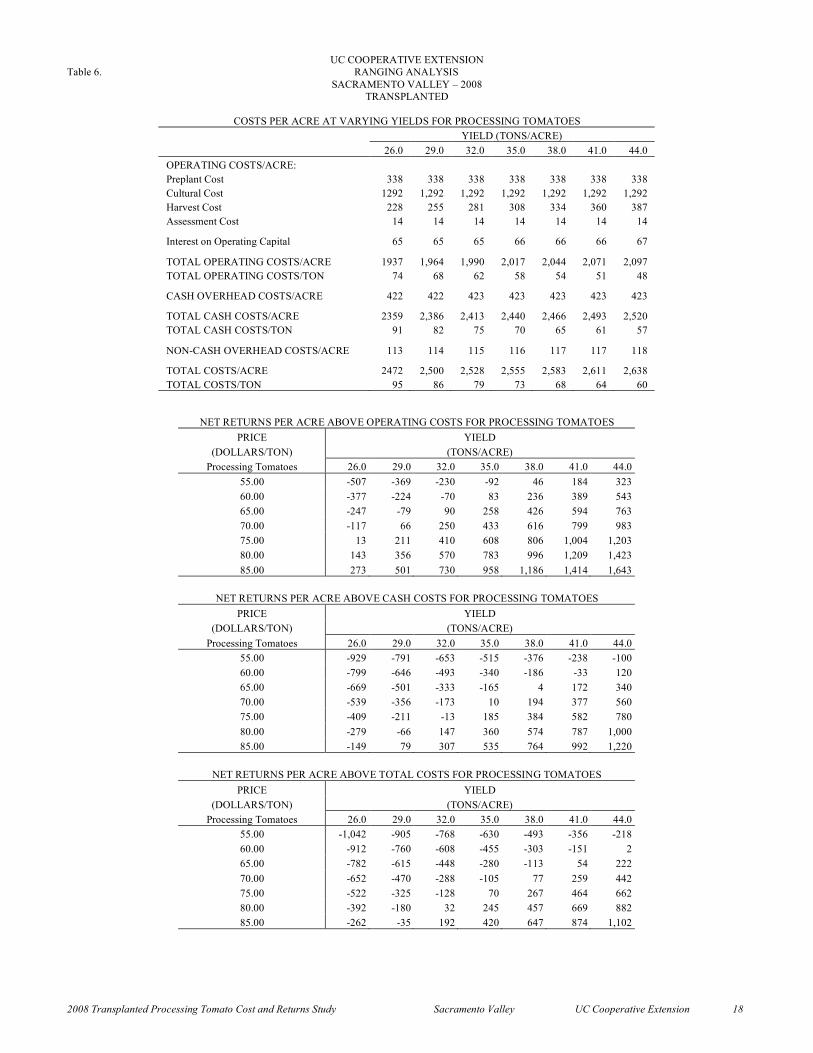
YIELD (TONS/ACRE) 26.0 29.0 32.0 35.0 38.0 41.0 44.0 OPERATING COSTS/ACRE: Preplant Cost 338 338 338 338 338 338 338 Cultural Cost 1292 1,292 1,292 1,292 1,292 1,292 1,292 Harvest Cost 228 255 281 308 334 360 387 Assessment Cost 14 14 14 14 14 14 14
Interest on Operating Capital 65 65 65 66 66 66 67
TOTAL OPERATING COSTS/ACRE 1937 1,964 1,990 2,017 2,044 2,071 2,097 TOTAL OPERATING COSTS/TON 74 68 62 58 54 51 48
CASH OVERHEAD COSTS/ACRE 422 422 423 423 423 423 423
TOTAL CASH COSTS/ACRE 2359 2,386 2,413 2,440 2,466 2,493 2,520 TOTAL CASH COSTS/TON 91 82 75 70 65 61 57
NON-CASH OVERHEAD COSTS/ACRE 113 114 115 116 117 117 118
TOTAL COSTS/ACRE 2472 2,500 2,528 2,555 2,583 2,611 2,638 TOTAL COSTS/TON 95 86 79 73 68 64 60
NET RETURNS PER ACRE ABOVE OPERATING COSTS FOR PROCESSING TOMATOES PRICE YIELD
(DOLLARS/TON) (TONS/ACRE) Processing Tomatoes 26.0 29.0 32.0 35.0 38.0 41.0 44.0
55.00 -507 -369 -230 -92 46 184 323 60.00 -377 -224 -70 83 236 389 543 65.00 -247 -79 90 258 426 594 763 70.00 -117 66 250 433 616 799 983 75.00 13 211 410 608 806 1,004 1,203 80.00 143 356 570 783 996 1,209 1,423 85.00 273 501 730 958 1,186 1,414 1,643
NET RETURNS PER ACRE ABOVE CASH COSTS FOR PROCESSING TOMATOES
PRICE YIELD (DOLLARS/TON) (TONS/ACRE)
Processing Tomatoes 26.0 29.0 32.0 35.0 38.0 41.0 44.0 55.00 -929 -791 -653 -515 -376 -238 -100 60.00 -799 -646 -493 -340 -186 -33 120 65.00 -669 -501 -333 -165 4 172 340 70.00 -539 -356 -173 10 194 377 560 75.00 -409 -211 -13 185 384 582 780 80.00 -279 -66 147 360 574 787 1,000 85.00 -149 79 307 535 764 992 1,220
NET RETURNS PER ACRE ABOVE TOTAL COSTS FOR PROCESSING TOMATOES
PRICE YIELD (DOLLARS/TON) (TONS/ACRE)
Processing Tomatoes 26.0 29.0 32.0 35.0 38.0 41.0 44.0 55.00 -1,042 -905 -768 -630 -493 -356 -218 60.00 -912 -760 -608 -455 -303 -151 2 65.00 -782 -615 -448 -280 -113 54 222 70.00 -652 -470 -288 -105 77 259 442 75.00 -522 -325 -128 70 267 464 662 80.00 -392 -180 32 245 457 669 882 85.00 -262 -35 192 420 647 874 1,102

2008 Transplanted Processing Tomato Cost and Returns Study Sacramento Valley UC Cooperative Extension 19
UC COOPERATIVE EXTENSION Table 7. COSTS AND RETURNS/ BREAKEVEN ANALYSIS
SACRAMENTO VALLEY – 2008 TRANSPLANTED
COSTS AND RETURNS - PER ACRE BASIS 1. Gross 2. Operating 3. Net Returns 4. Cash 5. Net Returns 6. Total 7. Net Returns Returns Costs Above Oper. Costs Above Cash Costs Above Total Crop Costs (1-2) Costs (1-4) Costs (1-6) Processing Tomatoes 2,450 2,017 433 2,440 10 2,555 -105
COSTS AND RETURNS - TOTAL ACREAGE 1. Gross 2. Operating 3. Net Returns 4. Cash 5. Net Returns 6. Total 7. Net Returns Returns Costs Above Oper. Costs Above Cash Costs Above Total Crop Costs (1-2) Costs (1-4) Costs (1-6) Processing Tomatoes 1,543,500 1,270,748 272,752 1,536,994 6,506 1,609,965 -66,465
BREAKEVEN PRICES PER YIELD UNIT -------- Breakeven Price To Cover -------- Base Yield Yield Operating Cash Total CROP (Units/Acre) Units Costs Costs Costs ------------ $ per Yield Unit ------------ Processing Tomatoes 35.0 Ton 57.63 69.70 73.01
BREAKEVEN YIELDS PER ACRE -------- Breakeven Yield To Cover -------- Yield Base Price Operating Cash Total CROP Units ($/Unit) Costs Costs Costs ----------- Yield Units / Acre ----------- Processing Tomatoes Ton 70.00 28.8 34.9 36.5
2008 Transplanted Processing Tomato Cost and Returns Study Sacramento Valley UC Cooperative Extension 20
UC COOPERATIVE EXTENSION Table 8. DETAILS OF OPERATIONS
SACRAMENTO VALLEY – 2008 TRANSPLANTED
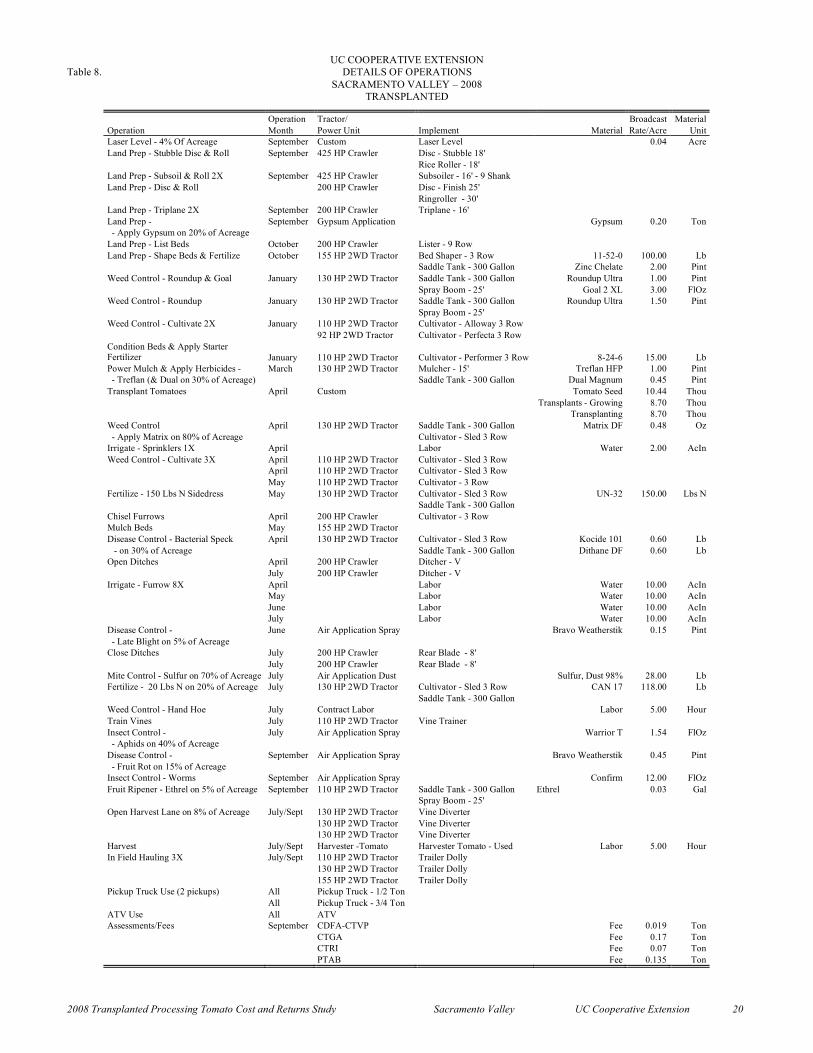
Operation Tractor/ Broadcast Material Operation Month Power Unit Implement Material Rate/Acre Unit Laser Level - 4% Of Acreage September Custom Laser Level 0.04 Acre Land Prep - Stubble Disc & Roll September 425 HP Crawler Disc - Stubble 18' Rice Roller - 18' Land Prep - Subsoil & Roll 2X September 425 HP Crawler Subsoiler - 16' - 9 Shank Land Prep - Disc & Roll 200 HP Crawler Disc - Finish 25' Ringroller - 30' Land Prep - Triplane 2X September 200 HP Crawler Triplane - 16' Land Prep - September Gypsum Application Gypsum 0.20 Ton - Apply Gypsum on 20% of Acreage Land Prep - List Beds October 200 HP Crawler Lister - 9 Row Land Prep - Shape Beds & Fertilize October 155 HP 2WD Tractor Bed Shaper - 3 Row 11-52-0 100.00 Lb Saddle Tank - 300 Gallon Zinc Chelate 2.00 Pint Weed Control - Roundup & Goal January 130 HP 2WD Tractor Saddle Tank - 300 Gallon Roundup Ultra 1.00 Pint Spray Boom - 25' Goal 2 XL 3.00 FlOz Weed Control - Roundup January 130 HP 2WD Tractor Saddle Tank - 300 Gallon Roundup Ultra 1.50 Pint Spray Boom - 25' Weed Control - Cultivate 2X January 110 HP 2WD Tractor Cultivator - Alloway 3 Row 92 HP 2WD Tractor Cultivator - Perfecta 3 Row Condition Beds & Apply Starter Fertilizer January 110 HP 2WD Tractor Cultivator - Performer 3 Row 8-24-6 15.00 Lb Power Mulch & Apply Herbicides - March 130 HP 2WD Tractor Mulcher - 15' Treflan HFP 1.00 Pint - Treflan (& Dual on 30% of Acreage) Saddle Tank - 300 Gallon Dual Magnum 0.45 Pint Transplant Tomatoes April Custom Tomato Seed 10.44 Thou Transplants - Growing 8.70 Thou Transplanting 8.70 Thou Weed Control April 130 HP 2WD Tractor Saddle Tank - 300 Gallon Matrix DF 0.48 Oz - Apply Matrix on 80% of Acreage Cultivator - Sled 3 Row Irrigate - Sprinklers 1X April Labor Water 2.00 AcIn Weed Control - Cultivate 3X April 110 HP 2WD Tractor Cultivator - Sled 3 Row April 110 HP 2WD Tractor Cultivator - Sled 3 Row May 110 HP 2WD Tractor Cultivator - 3 Row Fertilize - 150 Lbs N Sidedress May 130 HP 2WD Tractor Cultivator - Sled 3 Row UN-32 150.00 Lbs N Saddle Tank - 300 Gallon Chisel Furrows April 200 HP Crawler Cultivator - 3 Row Mulch Beds May 155 HP 2WD Tractor Disease Control - Bacterial Speck April 130 HP 2WD Tractor Cultivator - Sled 3 Row Kocide 101 0.60 Lb - on 30% of Acreage Saddle Tank - 300 Gallon Dithane DF 0.60 Lb Open Ditches April 200 HP Crawler Ditcher - V July 200 HP Crawler Ditcher - V Irrigate - Furrow 8X April Labor Water 10.00 AcIn May Labor Water 10.00 AcIn June Labor Water 10.00 AcIn July Labor Water 10.00 AcIn Disease Control - June Air Application Spray Bravo Weatherstik 0.15 Pint - Late Blight on 5% of Acreage Close Ditches July 200 HP Crawler Rear Blade - 8' July 200 HP Crawler Rear Blade - 8' Mite Control - Sulfur on 70% of Acreage July Air Application Dust Sulfur, Dust 98% 28.00 Lb Fertilize - 20 Lbs N on 20% of Acreage July 130 HP 2WD Tractor Cultivator - Sled 3 Row CAN 17 118.00 Lb Saddle Tank - 300 Gallon Weed Control - Hand Hoe July Contract Labor Labor 5.00 Hour Train Vines July 110 HP 2WD Tractor Vine Trainer Insect Control - July Air Application Spray Warrior T 1.54 FlOz - Aphids on 40% of Acreage Disease Control - September Air Application Spray Bravo Weatherstik 0.45 Pint - Fruit Rot on 15% of Acreage Insect Control - Worms September Air Application Spray Confirm 12.00 FlOz Fruit Ripener - Ethrel on 5% of Acreage September 110 HP 2WD Tractor Saddle Tank - 300 Gallon Ethrel 0.03 Gal Spray Boom - 25' Open Harvest Lane on 8% of Acreage July/Sept 130 HP 2WD Tractor Vine Diverter 130 HP 2WD Tractor Vine Diverter 130 HP 2WD Tractor Vine Diverter Harvest July/Sept Harvester -Tomato Harvester Tomato - Used Labor 5.00 Hour In Field Hauling 3X July/Sept 110 HP 2WD Tractor Trailer Dolly 130 HP 2WD Tractor Trailer Dolly 155 HP 2WD Tractor Trailer Dolly Pickup Truck Use (2 pickups) All Pickup Truck - 1/2 Ton All Pickup Truck - 3/4 Ton ATV Use All ATV Assessments/Fees September CDFA-CTVP Fee 0.019 Ton CTGA Fee 0.17 Ton CTRI Fee 0.07 Ton PTAB Fee 0.135 Ton
Related Documents