CHAPTER 6 • GEOGRAPHY REPORT CARD 81 6 Chapter Contents Sample Questions Student Responses Item Maps Sample materials from the 2001 geography assessment Chapter Focus Sample Assessment Questions And Student Responses This chapter presents sample questions from the 2001 NAEP geography assessment. Four sample questions at each grade are provided, including multiple-choice and constructed-response questions. Each sample is classified according to its geography content area, as described in the geography framework. The constructed-response questions are accompanied by actual student responses, reproduced from test booklets, that illustrate work at different rating levels. The constructed-response samples were rated using either a three-point or four-point scoring rubric. Three-point questions were rated as “Complete,” “Partial,” or “Inappropriate.” Four-point questions were rated as “Complete,” “Essential,” “Partial,” or “Inappropriate. ” Sample responses are included for each level except “Inappropriate.” The table accompanying each sample question presents two types of performance data: the overall percentage of students who answered successfully, and the percentage of students who answered successfully within a specific score range on the NAEP geography scale. The score ranges correspond to the three achievement-level intervals—Basic, Proficient, and Advanced—as well as the range below Basic. These percentages give some indication of how difficult the question was for students who performed within each of the achievement-level ranges.

Welcome message from author
This document is posted to help you gain knowledge. Please leave a comment to let me know what you think about it! Share it to your friends and learn new things together.
Transcript

C H A P T E R 6 • G E O G R A P H Y R E P O R T C A R D 81
6Chapter
Contents
SampleQuestions
StudentResponses
Item Maps
Sample materialsfrom the 2001geographyassessment
ChapterFocus
Sample Assessment QuestionsAnd Student Responses
This chapter presents sample questions from the 2001
NAEP geography assessment. Four sample questions at each
grade are provided, including multiple-choice and
constructed-response questions. Each sample is classified
according to its geography content area, as described in the
geography framework. The constructed-response questions
are accompanied by actual student responses, reproduced
from test booklets, that illustrate work at different
rating levels. The constructed-response samples were
rated using either a three-point or four-point scoring
rubric. Three-point questions were rated as
“Complete,” “Partial,” or “Inappropriate.” Four-point
questions were rated as “Complete,” “Essential,”
“Partial,” or “Inappropriate. ” Sample responses are
included for each level except “Inappropriate.”
The table accompanying each sample question
presents two types of performance data: the overall
percentage of students who answered successfully,
and the percentage of students who answered
successfully within a specific score range on the
NAEP geography scale. The score ranges correspond
to the three achievement-level intervals—Basic, Proficient, and
Advanced—as well as the range below Basic. These
percentages give some indication of how difficult the
question was for students who performed within each of the
achievement-level ranges.

82 C H A P T E R 6 • G E O G R A P H Y R E P O R T C A R D
Many additional sample questionsreleased from the 1994 and 2001 NAEPgeography assessments are available forviewing on the NAEP Web Site at http://www.nces.ed.gov/nationsreportcard/itmrls/. The item-viewing feature of theWeb Site includes student performancedata for all questions, detailed scoringguides (rubrics), and sample student re-sponses for the constructed-responsequestions.
Grade 4 Sample AssessmentQuestions and ResultsQuestions in the grade 4 assessment cover awide variety of geographic concepts andskills across the three geography contentareas. A somewhat higher percentage ofquestions is devoted to United Statesgeography than at the two higher gradeswhere increasing emphasis is placed onworld geography.
Many of the questions at all three gradesare based upon visual or textual stimulidesigned to make the assessment moreinteresting and more authentic. Visualstimuli include maps, charts, graphs,diagrams, cartoons, and, as in samplequestion 1, photographs.
The sample questions are also markedon the item maps on pages 110-112. Theitem map location of each question identi-fies the scale score at which that questionwas answered successfully by at least 65percent of the students for constructed-response questions and 74 percent of thestudents for four-option multiple-choicequestions.
C H A P T E R 6 • G E O G R A P H Y R E P O R T C A R D 83
Look at the photograph above. What would help farmers in this area growmore food?
A Cutting down forests
B Making terraces
C Building houses
Irrigating the land
In sample question 1, students are assessed on whether they can recognize a photographicrepresentation of a landscape and associate irrigation with the landscape depicted. Thisquestion is mapped at scale score 216.
Table 6.1 Sample Question 1 Results (Multiple-Choice)
Overall percentage correct and percentages correct within each achievement-level range: 2001
*NAEP geography composite scale range.***Sample size is insufficient to permit a reliable estimate (see appendix A).SOURCE: U.S. Department of Education, Office of Educational Research and Improvement, National Center for EducationStatistics, National Assessment of Educational Progress (NAEP), 2001 Geography Assessment.
Percentage correct withinachievement-level intervals
Overall percentage Below Basic Basic Proficient Advancedcorrect 186 and below* 187–239* 240–275* 276 and above*
70 50 74 84 ***
Grade 4
© Fritz Henle/Photo Researchers, Inc.
Geography Content Area: Environment and Society
Grade 4 Sample Question 1:

84 C H A P T E R 6 • G E O G R A P H Y R E P O R T C A R D
Which two nations are most likely to have a conflict over mineral resources?
A Nation A and Nation B
B Nation A and Nation C
Nation A and Nation D
D Nation C and Nation D
Sample question 2 measures students’ understanding of how geography plays a role inconflict among countries. Students found this question to be quite difficult, with onlyone-third answering correctly. This question appears on the item map at scale score 271.
Table 6.2 Sample Question 2 Results (Multiple-Choice)
Overall percentage correct and percentages correct within each achievement-level range: 2001
*NAEP geography composite scale range.***Sample size is insufficient to permit a reliable estimate (see appendix A).SOURCE: U.S. Department of Education, Office of Educational Research and Improvement, National Center for EducationStatistics, National Assessment of Educational Progress (NAEP), 2001 Geography Assessment.
Percentage correct withinachievement-level intervals
Overall percentage Below Basic Basic Proficient Advancedcorrect 186 and below* 187–239* 240–275* 276 and above*
33 22 28 56 ***
Grade 4
Geography Content Area: Spatial Dynamics and Connections
Grade 4 Sample Question 2:
C H A P T E R 6 • G E O G R A P H Y R E P O R T C A R D 85
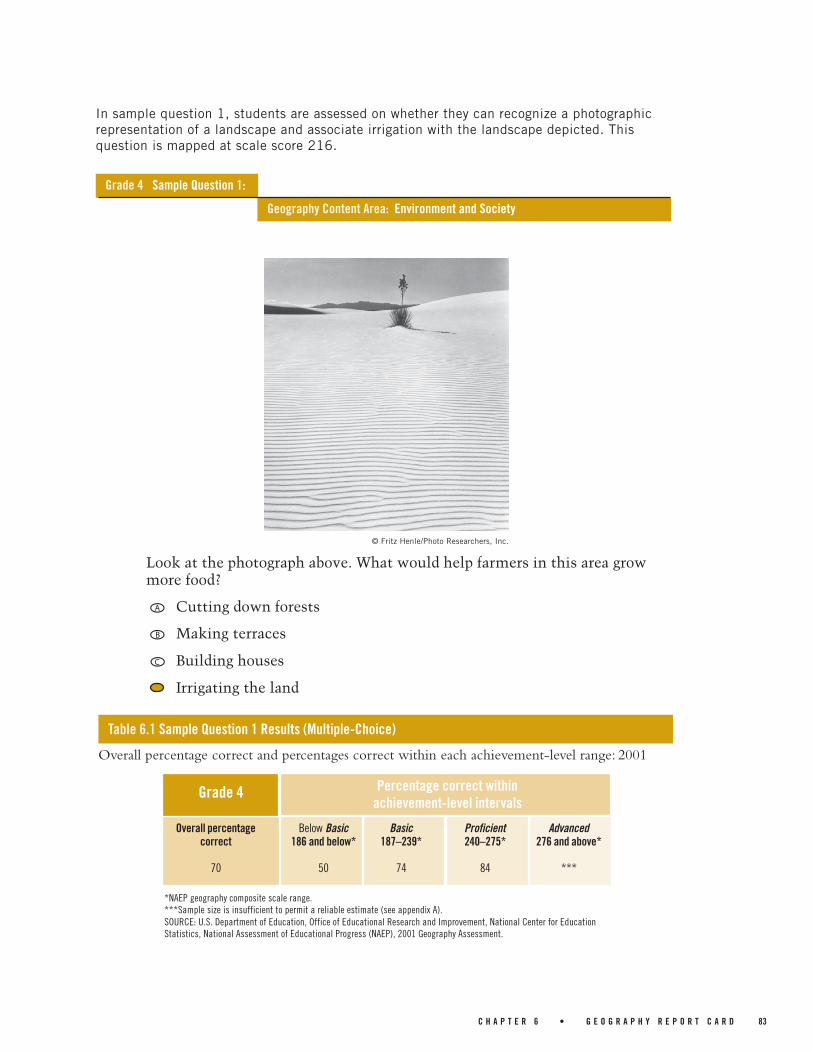
Sample question 3 is one of a number of production tasks included in the NAEP geographyassessment in which students are asked to locate a place on a map or draw a map in their testbooklet. Responses to this question were scored with a three-level rubric as “Complete,” “Par-tial,” or “Inappropriate.” Two-thirds of students could correctly identify where they lived. Thisquestion appears on the item map at scale score 192. (Note that the circled numbers on themap were used in a different question that was also based on this map.)
Write down the name of the state or district where you live.
I live in______________________________________________ .
Directly on the map, draw an “X” on the state or district where you live.
Geography Content Area: Space and Place
Grade 4 Sample Question 3:

86 C H A P T E R 6 • G E O G R A P H Y R E P O R T C A R D
To earn a score of “Complete” on this question, students had to write the name of the stateor district where they live and correctly mark the location on the map.
Sample “Complete” Response:
Write down the name of the state or district where you live.
I live in______________________________________________ .
Directly on the map, draw an “X” on the state or district where you live.
Table 6.3a Sample Question 3 Results (“Complete” Short-Constructed-Response)
Overall percentage “Complete” and percentages “Complete” within each achievement-level range:2001
*NAEP geography composite scale range.***Sample size is insufficient to permit a reliable estimate (see appendix A).SOURCE: U.S. Department of Education, Office of Educational Research and Improvement, National Center for EducationStatistics, National Assessment of Educational Progress (NAEP), 2001 Geography Assessment.
Percentage “Complete” withinachievement-level intervals
Overall percentage Below Basic Basic Proficient Advanced“Complete” 186 and below* 187–239* 240–275* 276 and above*
66 38 71 88 ***
Grade 4

C H A P T E R 6 • G E O G R A P H Y R E P O R T C A R D 87
Write down the name of the state or district where you live.
I live in______________________________________________ .
Directly on the map, draw an “X” on the state or district where you live.
To earn a score of “Partial,” students could indicate their state or district and mark a border-ing state, or they could indicate the city or town in which they live and mark the correct statein which that city lies. In the sample below, the student lives in North Carolina but markedVirginia on the map.
Sample “Partial” Response:
Table 6.3b Sample Question 3 Results (“Partial” Short-Constructed-Response)
Overall percentage “Partial” or better and percentages “Partial” or better within each achievement-level range: 2001
*NAEP geography composite scale range.***Sample size is insufficient to permit a reliable estimate (see appendix A).SOURCE: U.S. Department of Education, Office of Educational Research and Improvement, National Center for EducationStatistics, National Assessment of Educational Progress (NAEP), 2001 Geography Assessment.
Percentage “Partial” or better withinachievement-level intervals
Overall percentage Below Basic Basic Proficient Advanced“Partial” or better 186 and below* 187–239* 240–275* 276 and above*
72 43 78 93 ***
Grade 4

88 C H A P T E R 6 • G E O G R A P H Y R E P O R T C A R D
LITTLE TOWN
– Width: 4.0 miles east to west– Length: 3.0 miles north to south– Main Street runs east to west through the town.– The school is on the northeast side of town.– Phelps Park is on the southwest side of town.– Runt River runs north to south through the town.
On the grid below, each square is one mile wide and one mile long. Draw amap of Little Town on the grid. Draw the town’s borders. Then, use thesymbols in the key below to draw the features listed above.
A more complex production task is seen in sample question 4. Here, students must usewritten descriptions of features of a town to sketch a map on a grid. They must understandscale, distance, and direction, and be able to read and use a map key. Responses werescored with a four-level rubric as “Complete,” “Essential,” “Partial,” or “Inappropriate.” Thequestion was difficult for fourth-graders, with only 28 percent providing an “Essential” orbetter response. The item map scale score point for this question is 295.
N
S
EW
Scale
= 1 mile
KeyS
P
School
Street
Park
River
Geography Content Area: Space and Place
Grade 4 Sample Question 4:
C H A P T E R 6 • G E O G R A P H Y R E P O R T C A R D 89
Responses scored “Complete” correctly located all four features and drew the length andwidth to scale in the correct directions.
Sample “Complete” Response:
N
S
EW
Scale
= 1 mile
KeyS
P
School
Street
Park
River
Overall percentage “Complete” and percentages “Complete” within each achievement-level range:2001
Table 6.4a Sample Question 4 Results (“Complete” Extended-Constructed-Response)
Percentage “Complete” withinachievement-level intervals
Overall percentage Below Basic Basic Proficient Advanced“Complete” 186 and below* 187–239* 240–275* 276 and above*
11 0 6 32 ***
*NAEP geography composite scale range.***Sample size is insufficient to permit a reliable estimate (see appendix A).SOURCE: U.S. Department of Education, Office of Educational Research and Improvement, National Center for EducationStatistics, National Assessment of Educational Progress (NAEP), 2001 Geography Assessment.
Grade 4

90 C H A P T E R 6 • G E O G R A P H Y R E P O R T C A R D
Responses scored “Essential” correctly located four features but not to scale, or correctlylocated three features and had the scale correct.
Sample “Essential” Response:
N
S
EW
Scale
= 1 mile
Key
S
P
School
Street
Park
River
Overall percentage “Essential” or better and percentages “Essential” or better within each achievement-level range: 2001
Table 6.4b Sample Question 4 Results (“Essential” Extended-Constructed-Response)
Percentage “Essential” or better withinachievement-level intervals
Overall percentage Below Basic Basic Proficient Advanced“Essential” or better 186 and below* 187–239* 240–275* 276 and above*
28 1 25 65 ***
*NAEP geography composite scale range.***Sample size is insufficient to permit a reliable estimate (see appendix A).SOURCE: U.S. Department of Education, Office of Educational Research and Improvement, National Center for EducationStatistics, National Assessment of Educational Progress (NAEP), 2001 Geography Assessment.
Grade 4

C H A P T E R 6 • G E O G R A P H Y R E P O R T C A R D 91
N
S
EW
Scale
= 1 mile
KeyS
P
School
Street
Park
River
Overall percentage “Partial” or better and percentages “Partial” or better within each achievement-levelrange: 2001
Table 6.4c Sample Question 4 Results (“Partial” Extended-Constructed-Response)
Percentage “Partial” or better withinachievement-level intervals
Overall percentage Below Basic Basic Proficient Advanced“Partial” or better 186 and below* 187–239* 240–275* 276 and above*
38 4 36 78 ***
*NAEP geography composite scale range.***Sample size is insufficient to permit a reliable estimate (see appendix A).SOURCE: U.S. Department of Education, Office of Educational Research and Improvement, National Center for EducationStatistics, National Assessment of Educational Progress (NAEP), 2001 Geography Assessment.
Grade 4
Responses scored “Partial” located only one or two features and had the scale correct, orlocated three features with an incorrect scale.
Sample “Partial” Response:

92 C H A P T E R 6 • G E O G R A P H Y R E P O R T C A R D
Grade 8 Sample AssessmentQuestions and ResultsThe assessment at grade 8, like that atgrade 4, covers a wide range of geographyskills and concepts. The questions, on
average, look for a deeper understanding ofthe material and require students to grapplewith more sophisticated stimuli, comparemultiple maps, and apply geographicunderstanding to solving problems.

C H A P T E R 6 • G E O G R A P H Y R E P O R T C A R D 93
Table 6.5 Sample Question 5 Results (Multiple-Choice)
Overall percentage correct and percentages correct within each achievement-level range: 2001
*NAEP geography composite scale range.SOURCE: U.S. Department of Education, Office of Educational Research and Improvement, National Center for EducationStatistics, National Assessment of Educational Progress (NAEP), 2001 Geography Assessment.
Percentage correct withinachievement-level intervals
Overall percentage Below Basic Basic Proficient Advancedcorrect 241 and below* 242–281* 282–314* 315 and above*
70 37 74 91 97
Grade 8
Which question could you answer based only on the information in the map?
A At what times do the public trains arrive?
B How much time does it take to go from Forest Hills to Oak Grove?
C How many miles is it from one station to another?
How can one travel from Alewife to the Aquarium by public train?
Geography Content Area: Spatial Dynamics and Connections
Grade 8 Sample Question 5:
In this multiple-choice question students are asked to interpret a kind of map they may neverhave seen to determine exactly what kind of information it provides and doesn’t provide. Itwas a fairly easy task for students. The scale score point for this question on the eighth-gradeitem map is 257.

94 C H A P T E R 6 • G E O G R A P H Y R E P O R T C A R D
Table 6.6 Sample Question 6 Results (Multiple-Choice)
Overall percentage correct and percentages correct within each achievement-level range: 2001
*NAEP geography composite scale range.***Sample size is insufficient to permit a reliable estimate (see appendix A).SOURCE: U.S. Department of Education, Office of Educational Research and Improvement, National Center for EducationStatistics, National Assessment of Educational Progress (NAEP), 2001 Geography Assessment.
Percentage correct withinachievement-level intervals
Overall percentage Below Basic Basic Proficient Advancedcorrect 241 and below* 242–281* 282–314* 315 and above*
50 36 47 64 ***
Grade 8
How do the forces listed below affect the natural environment?
GravityIce
WaterWind
They are major causes of erosion.
B They are important influences on human settlement.
C They are responsible for seismic activity.
D They cause continental drift.
Geography Content Area: Space and Place
Grade 8 Sample Question 6:
Sample question 6 asks about an important aspect of physical geography. One-half of eighth-graders knew that the four forces contribute to erosion. This question maps at scale scorepoint 316.

C H A P T E R 6 • G E O G R A P H Y R E P O R T C A R D 95
Table 6.7 Sample Question 7 Results (Multiple-Choice)
Overall percentage correct and percentages correct within each achievement-level range: 2001
*NAEP geography composite scale range.SOURCE: U.S. Department of Education, Office of Educational Research and Improvement, National Center for EducationStatistics, National Assessment of Educational Progress (NAEP), 2001 Geography Assessment.
Percentage correct withinachievement-level intervals
Overall percentage Below Basic Basic Proficient Advancedcorrect 241 and below* 242–281* 282–314* 315 and above*
74 40 80 93 100
Grade 8
Florida is an example of
A an isthmus
B an island
a peninsula
D a plateau
Geography Content Area: Space and Place
Grade 8 Sample Question 7:
Sample question 7 tests students’ knowledge of landforms as well as their skill with whatgeographers call “mental mapping”—the ability to visualize spatial patterns in one’s mind.Students had to create an image of Florida in their minds before they could identify it as apeninsula. Nearly three-quarters of the students answered correctly. The question maps at ascale score of 256.
96 C H A P T E R 6 • G E O G R A P H Y R E P O R T C A R D
Table 6.8 Sample Question 8 Results (Multiple-Choice)
Overall percentage correct and percentages correct within each achievement-level range: 2001
*NAEP geography composite scale range.SOURCE: U.S. Department of Education, Office of Educational Research and Improvement, National Center for EducationStatistics, National Assessment of Educational Progress (NAEP), 2001 Geography Assessment.
Percentage correct withinachievement-level intervals
Overall percentage Below Basic Basic Proficient Advancedcorrect 241 and below* 242–281* 282–314* 315 and above*
60 40 57 79 96
Grade 8
Geography Content Area: Spatial Dynamics and Connections
Grade 8 Sample Question 8:
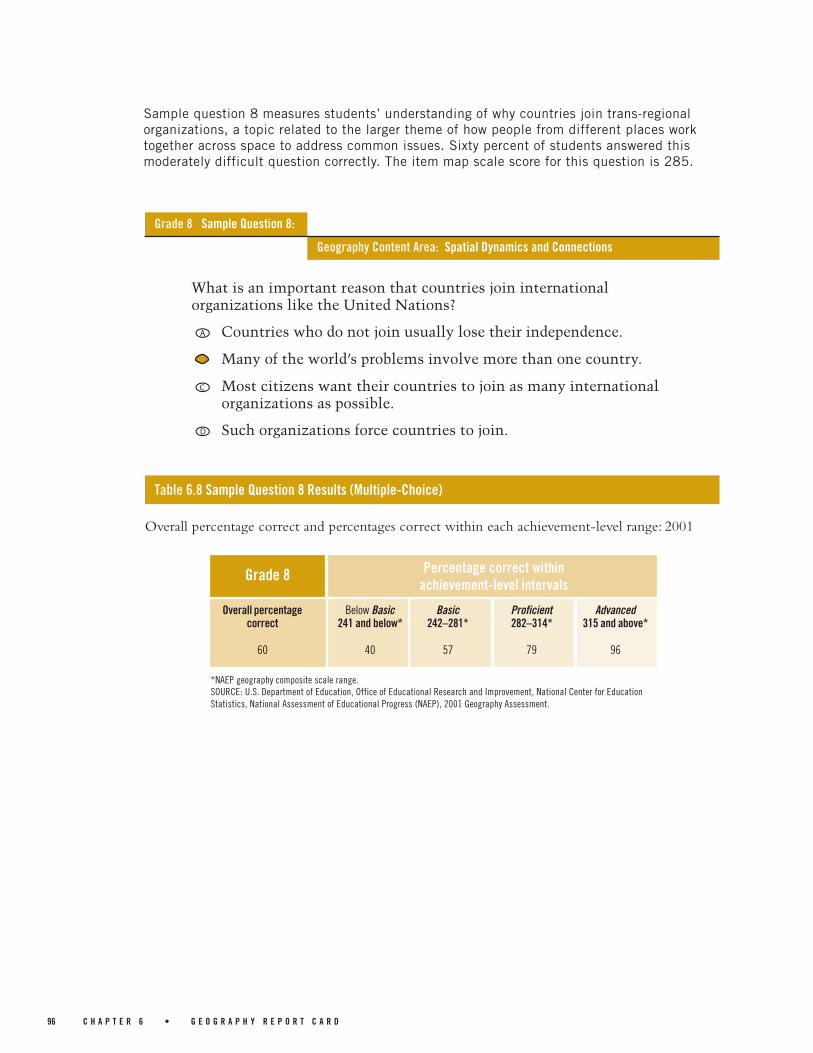
Sample question 8 measures students’ understanding of why countries join trans-regionalorganizations, a topic related to the larger theme of how people from different places worktogether across space to address common issues. Sixty percent of students answered thismoderately difficult question correctly. The item map scale score for this question is 285.
What is an important reason that countries join internationalorganizations like the United Nations?
A Countries who do not join usually lose their independence.
Many of the world’s problems involve more than one country.
C Most citizens want their countries to join as many internationalorganizations as possible.
D Such organizations force countries to join.

C H A P T E R 6 • G E O G R A P H Y R E P O R T C A R D 97
Tropical forests are being destroyed at the rate of at least eleven millionhectares each year, an area the size of Pennsylvania. About half of alltropical forests are already gone.
Discuss two major reasons for this high rate of tropical deforestation.
Geography Content Area: Environment and Society
Grade 8 Sample Question 9:
Sample question 9 is a short-constructed-response question designed to measure students’understanding of the interaction between human beings and the environment. Responseswere scored on a three-level rubric as “Complete,” “Partial,” or “Inappropriate.” The ques-tion was quite difficult for students, with only 22 percent giving a “Complete” response. Onthe item map for eighth grade this question appears as scale score 328.

98 C H A P T E R 6 • G E O G R A P H Y R E P O R T C A R D
Responses scored “Complete” provided two reasons for the high rate of tropical deforesta-tion. Reasons could relate to demand for land and resources or to the lack of regulation thatallows deforestation to occur.
Sample “Complete” Response:
Discuss two major reasons for this high rate of tropical deforestation.
Percentage “Complete” withinachievement-level intervals
Overall percentage Below Basic Basic Proficient Advanced“Complete” 241 and below* 242–281* 282–314* 315 and above*
22 6 18 38 ***
Overall percentage “Complete” and percentages “Complete” within each achievement-level range:2001
Table 6.9a Sample Question 9 Results (“Complete” Short-Constructed-Response)
*NAEP geography composite scale range.***Sample size is insufficient to permit a reliable estimate (see appendix A).SOURCE: U.S. Department of Education, Office of Educational Research and Improvement, National Center for EducationStatistics, National Assessment of Educational Progress (NAEP), 2001 Geography Assessment.
Grade 8

C H A P T E R 6 • G E O G R A P H Y R E P O R T C A R D 99
Responses scored “Partial” provided only one reason for the high rate of tropical deforesta-tion, thereby revealing a more limited knowledge of the subject.
Sample “Partial” Response:
Discuss two major reasons for this high rate of tropical deforestation.
Percentage “Partial” or better withinachievement-level intervals
Overall percentage Below Basic Basic Proficient Advanced“Partial” or better 241 and below* 242–281* 282–314* 315 and above*
60 26 62 84 ***
Overall percentage “Partial” or better and percentages “Partial” or better within each achievement-level range: 2001
Table 6.9b Sample Question 9 Results (“Partial” Short-Constructed-Response)
*NAEP geography composite scale range.***Sample size is insufficient to permit a reliable estimate (see appendix A).SOURCE: U.S. Department of Education, Office of Educational Research and Improvement, National Center for EducationStatistics, National Assessment of Educational Progress (NAEP), 2001 Geography Assessment.
Grade 8

100 C H A P T E R 6 • G E O G R A P H Y R E P O R T C A R D
Overall percentage correct and percentages correct within each achievement-level range: 2001
Table 6.10 Sample Question 10 Results (Multiple-Choice)
*NAEP geography composite scale range.***Sample size is insufficient to permit a reliable estimate (see appendix A).SOURCE: U.S. Department of Education, Office of Educational Research and Improvement, National Center for EducationStatistics, National Assessment of Educational Progress (NAEP), 2001 Geography Assessment.
Percentage correct withinachievement-level intervals
Overall percentage Below Basic Basic Proficient Advancedcorrect 269 and below* 270–304* 305–338* 339 and above*
78 46 86 99 ***
Grade 12
The varying widths of the lines on the map most probably indicate the
A strength of ocean currents
B type of trade
volume of trade
D type of transportation used
Geography Content Area: Space and Place
Grade 12 Sample Question 10:
Grade 12 Sample AssessmentQuestions and ResultsThe grade 12 assessment included higherpercentages of extended-constructed-
response questions and questions devotedto non-U.S. geography than the assessmentsat grades 4 and 8. It also contained the mostcomplex stimuli and challenging concepts.
Sample question 10 is a skills question designed to measure whether students understandthe conventions used in what is known as a flow map. A majority of students (78 percent)successfully answered the question. This question appears on the twelfth-grade item map atscale score 272.

C H A P T E R 6 • G E O G R A P H Y R E P O R T C A R D 101
What religion is practiced by most people who live in India?
A Confucianism
B Buddhism
C Christianity
Hinduism
Overall percentage correct and percentages correct within each achievement-level range: 2001
Table 6.11 Sample Question 11 Results (Multiple-Choice)
*NAEP geography composite scale range.***Sample size is insufficient to permit a reliable estimate (see appendix A).SOURCE: U.S. Department of Education, Office of Educational Research and Improvement, National Center for EducationStatistics, National Assessment of Educational Progress (NAEP), 2001 Geography Assessment.
Percentage correct withinachievement-level intervals
Overall percentage Below Basic Basic Proficient Advancedcorrect 269 and below* 270–304* 305–338* 339 and above*
61 46 62 76 ***
Grade 12
Geography Content Area: Spatial Dynamics and Connections
Grade 12 Sample Question 11:
This straightforward multiple-choice question helps measure students’ knowledge of thedistribution of world religions. Six out of ten students answered correctly. The item map scalescore point for this question is 318.

102 C H A P T E R 6 • G E O G R A P H Y R E P O R T C A R D
Sample question 12 is a map-based, short-constructed-response question dealing with theinteraction between humans and the natural environment. Although some students may havebeen able to answer without referring to the map, others could use it to gain valuable infor-mation about the region. Responses were scored on a three-level rubric as “Complete,”“Partial,” or “Inappropriate.” The question was moderately difficult, with 47 percent ofstudents providing a “Complete” response. This question “maps” at scale score 300 for“Complete.”
Give two reasons why early civilizations flourished in the valley ofthe Tigris and Euphrates rivers.
Geography Content Area: Environment and Society
Grade 12 Sample Question 12:
Eu phra tes
0 600 miN
S
EW
SOUTHWEST ASIA
Egypt
Turkey
SyriaLebanon
JordanIsrael Iraq
SaudiArabia
Iran
PersianGulf
Tigris
Qatar
United Arab
Emirates
Oman
Afg
hani
stan
600 km0
Key
= National Boundaries = Rivers
Kuwait

C H A P T E R 6 • G E O G R A P H Y R E P O R T C A R D 103
Responses scored “Complete” gave two valid reasons why river valleys were important to theearly civilization of Iraq.
Sample “Complete” Response:
Give two reasons why early civilizations flourished in the valley ofthe Tigris and Euphrates rivers.
Percentage “Complete”withinachievement-level intervals
Overall percentage Below Basic Basic Proficient Advanced“Complete” 269 and below* 270–304* 305–338* 339 and above*
47 17 52 70 ***
Overall percentage “Complete” and percentages “Complete” within each achievement-level range:2001
Table 6.12a Sample Question 12 Results (“Complete” Short-Constructed-Response)
*NAEP Geography composite scale range.***Sample size is insufficient to permit a reliable estimate (see appendix A).SOURCE: U.S. Department of Education, Office of Educational Research and Improvement, National Center for EducationStatistics, National Assessment of Educational Progress (NAEP), 2001 Geography Assessment.
Grade 12
104 C H A P T E R 6 • G E O G R A P H Y R E P O R T C A R D
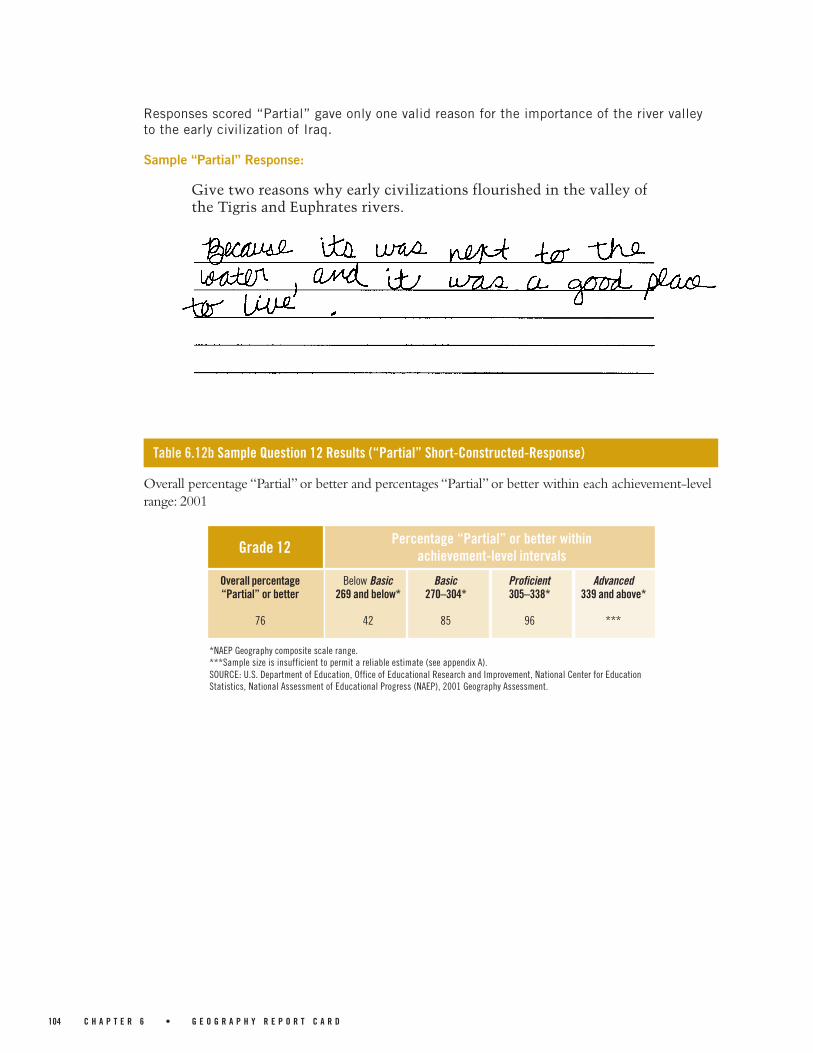
Responses scored “Partial” gave only one valid reason for the importance of the river valleyto the early civilization of Iraq.
Sample “Partial” Response:
Give two reasons why early civilizations flourished in the valley ofthe Tigris and Euphrates rivers.
Percentage “Partial” or better withinachievement-level intervals
Overall percentage Below Basic Basic Proficient Advanced“Partial” or better 269 and below* 270–304* 305–338* 339 and above*
76 42 85 96 ***
Overall percentage “Partial” or better and percentages “Partial” or better within each achievement-levelrange: 2001
Table 6.12b Sample Question 12 Results (“Partial” Short-Constructed-Response)
*NAEP Geography composite scale range.***Sample size is insufficient to permit a reliable estimate (see appendix A).SOURCE: U.S. Department of Education, Office of Educational Research and Improvement, National Center for EducationStatistics, National Assessment of Educational Progress (NAEP), 2001 Geography Assessment.
Grade 12

C H A P T E R 6 • G E O G R A P H Y R E P O R T C A R D 105
Describe the difference in population patterns for people age 60and over in countries 1 and 2. Give one possible explanation for thedifference you have identified.
Geography Content Area: Spatial Dynamics and Connections
Grade 12 Sample Question 13:
Sample question 13 is a short-constructed-response that measures students’ ability to readand understand population pyramids. Responses were scored on a three-point rubric as“Complete,” “Partial,” or “Inappropriate.” Students found this question to be very difficult.Sixteen percent received a score of “Complete.” This question maps at scale score 347 for“Complete.”
Age% ofTotalPop’n
70 + 1.0%60-69 1.6%50-59 2.6%40-49 3.9%30-39 5.6%20-29 7.7%10-19 10.4%0-9 17.0%
Male
COUNTRY 1 Age Distribution
Female
Age% ofTotalPop’n
70 + 1.2%60-691.8%50-592.7%40-494.0%30-395.5%20-297.7%10-1910.4%0-916.9%
Age% ofTotalPop’n
70 + 2.9%60-69 3.7%50-59 4.7%40-49 5.8%30-39 8.2%20-29 9.3%10-19 7.5%0-9 7.3%
Male
COUNTRY 2 Age Distribution
Female
Age% ofTotalPop’n
70 + 4.2%60-694.3%50-594.8%40-495.7%30-398.3%20-299.2%10-197.1%0-97.0%
106 C H A P T E R 6 • G E O G R A P H Y R E P O R T C A R D
Percentage “Complete” withinachievement-level intervals
Overall percentage Below Basic Basic Proficient Advanced“Complete” 269 and below* 270–304* 305–338* 339 and above*
16 2 15 33 ***
Overall percentage “Complete” and percentages “Complete” within each achievement-level range:2001
Table 6.13a Sample Question 13 Results (“Complete” Short-Constructed-Response)
*NAEP geography composite scale range.***Sample size is insufficient to permit a reliable estimate (see appendix A).SOURCE: U.S. Department of Education, Office of Educational Research and Improvement, National Center for EducationStatistics, National Assessment of Educational Progress (NAEP), 2001 Geography Assessment.
Grade 12
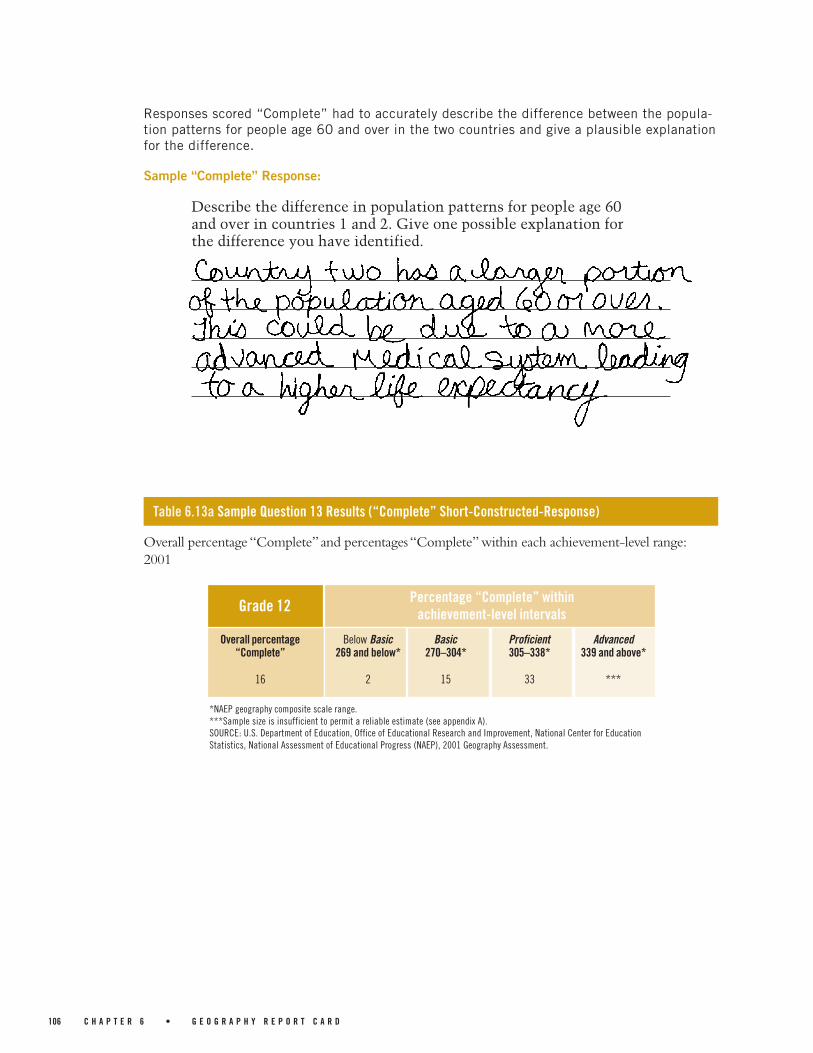
Responses scored “Complete” had to accurately describe the difference between the popula-tion patterns for people age 60 and over in the two countries and give a plausible explanationfor the difference.
Sample “Complete” Response:
Describe the difference in population patterns for people age 60and over in countries 1 and 2. Give one possible explanation forthe difference you have identified.

C H A P T E R 6 • G E O G R A P H Y R E P O R T C A R D 107
Percentage “Partial” or better withinachievement-level intervals
Overall percentage Below Basic Basic Proficient Advanced“Partial” or better 269 and below* 270–304* 305–338* 339 and above*
51 18 57 79 ***
Overall percentage “Partial” or better and percentages “Partial” or better within each achievement-levelrange: 2001
Table 6.13b Sample Question 13 Results (“Partial” Short-Constructed-Response)
*NAEP geography composite scale range.***Sample size is insufficient to permit a reliable estimate (see appendix A).SOURCE: U.S. Department of Education, Office of Educational Research and Improvement, National Center for EducationStatistics, National Assessment of Educational Progress (NAEP), 2001 Geography Assessment.
Grade 12
Responses scored “Partial” either described the difference between the two populationpyramids but did not explain the difference or, as in the following example, incorrectlydescribed the difference as one of absolute numbers rather than percentages of the popula-tion and gave a plausible explanation.
Sample “Partial” Response:
Describe the difference in population patterns for people age 60and over in countries 1 and 2. Give one possible explanation forthe difference you have identified.

108 C H A P T E R 6 • G E O G R A P H Y R E P O R T C A R D
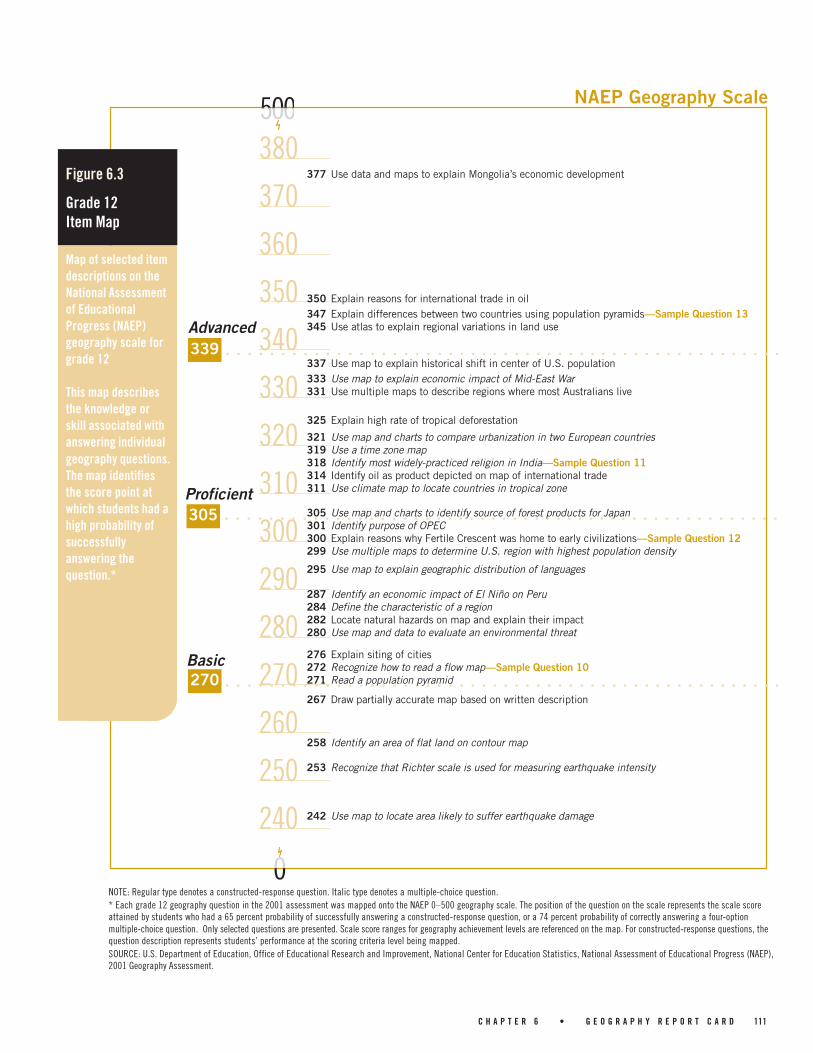
Maps of Selected ItemDescriptions on theNAEP Geography Scale –Grades 4, 8, and 12The geography performance of fourth-,eighth-, and twelfth-graders can be illus-trated by maps that position item descrip-tions along the NAEP geography scalewhere they are likely to be answeredsuccessfully by students.1 The descriptionsused on the item maps focus on the geog-raphy knowledge or skill needed to answerthe question. For multiple-choice ques-tions, the description indicates the knowl-edge or skill demonstrated by selection ofthe correct option; for constructed-re-sponse questions, the description takes intoaccount the knowledge or skill specified bythe different levels of scoring criteria forthat question. The questions described onthe item maps include the 12 samplequestions in the preceding section.
Figures 6.1 through 6.3 are item mapsfor grades 4, 8, and 12, respectively. Theitem map location of each questionidentifies the scale score at which thatquestion was answered successfully by atleast 65 percent of the students forconstructed-response questions and 74percent of the students for four-option,multiple-choice questions. For eachquestion indicated on the item map,students whose average score fell at orabove the scale point had a higherprobability of successfully answering thequestion. Students whose average scorefell below that scale point had a lowerprobability of successfully answering thequestion.
As an example of how to interpret theitem maps, consider the multiple-choicequestion in figure 6.1 that maps at scorepoint 271. This question appeared assample question 2 earlier in the chapter,and was shown to have been a difficultquestion answered correctly by 33 percentof students. Students whose geographyability corresponds to a score of 271 orabove on the scale had at least a 74 percentprobability of answering this questioncorrectly. Students whose ability is repre-sented by a score below 271 had less than a74 percent probability of answering cor-rectly. This does not mean that all of theformer students answered the questioncorrectly or that all of the latter studentsanswered it incorrectly. Rather, the itemmap indicates higher or lower probabilityof answering correctly depending onstudents’ overall geography ability as mea-sured on the NAEP scale.
The three geography achievement levelsare indicated on the item map for eachgrade. It is important to note that, althoughthe same 0-500 geography scale is used ateach grade, the achievement levels aregrade-specific, and each achievement levelbegins at a different score point at eachgrade. Returning to the example of thequestion mapping at score point 271, theitem map is useful in showing how thisdifficult question maps relatively high upon the scale. In terms of achievement levels,one sees that students with a 74 percentprobability of answering the questioncorrectly performed near the upper end ofthe Proficient achievement-level range.
1 Details on the procedures used to develop item maps are provided in appendix A.

C H A P T E R 6 • G E O G R A P H Y R E P O R T C A R D 109
NOTE: Regular type denotes a constructed-response question. Italic type denotes a multiple-choice question.* Each grade 4 geography question in the 2001 assessment was mapped onto the NAEP 0–500 geography scale. The position of the question on the scale represents the scale scoreattained by students who had a 65 percent probability of successfully answering a constructed-response question, or a 74 percent probability of correctly answering a four-optionmultiple-choice question. Only selected questions are presented. Scale score ranges for geography achievement levels are referenced on the map. For constructed-response questions, thequestion description represents students’ performance at the scoring criteria level being mapped.SOURCE: U.S. Department of Education, Office of Educational Research and Improvement, National Center for Education Statistics, National Assessment of Educational Progress (NAEP),2001 Geography Assessment.
NAEP Geography Scale
320310300290280270260250240230220210200190180170160
Figure 6.1
Grade 4Item Map
Map of selected itemdescriptions on theNational Assessmentof EducationalProgress (NAEP)geography scale forgrade 4
This map describesthe knowledge or skillassociated withanswering individualgeography questions.The map identifiesthe score point atwhich students had ahigh probability ofsuccessfullyanswering thequestion.*
○ ○ ○ ○ ○ ○ ○ ○ ○ ○ ○ ○ ○ ○ ○ ○ ○ ○ ○ ○ ○ ○ ○ ○ ○ ○ ○ ○ ○ ○ ○ ○ ○ ○ ○ ○ ○ ○ ○ ○ ○ ○ ○ ○ ○ ○ ○ ○ ○ ○ ○ ○
Proficient240
○ ○ ○ ○ ○ ○ ○ ○ ○ ○ ○ ○ ○ ○ ○ ○ ○ ○ ○ ○ ○ ○ ○ ○ ○ ○ ○ ○ ○ ○ ○ ○ ○ ○ ○ ○ ○ ○ ○ ○ ○ ○ ○ ○ ○ ○ ○ ○ ○ ○ ○ ○ ○
Advanced276
○ ○ ○ ○ ○ ○ ○ ○ ○ ○ ○ ○ ○ ○ ○ ○ ○ ○ ○ ○ ○ ○ ○ ○ ○ ○ ○ ○ ○ ○ ○ ○ ○ ○ ○ ○ ○ ○ ○ ○ ○ ○ ○ ○ ○ ○ ○ ○ ○ ○ ○ ○ ○
Basic187
320 Interpret resource map to determine likely location for large city to develop
295 Draw map based on written description of its features—Sample Question 4
288 Identify mountain range in which Switzerland is located
276 Use multiple maps to locate states where crops grow year round
271 Use map to determine which countries might have a conflict over resources—Sample Question 2269 Use multiple maps to compare conditions for farming in two countries
259 Interpret information given in a transit map
255 Find and draw specified route on a transit system map251 Identify a megalopolis on a population map249 Determine elevation of a region on a physical map
244 Identify world’s largest ocean242 Interpret a specialized map of irrigation
230 Compare climate and land use of two countries based on three maps
225 Locate bordering countries on a political map
221 Identify Mississippi River on map of North America218 Locate place with specified features on physical map218 Use resource map to explain where steel industry would develop216 Recognize desert landscape in a photograph and need for irrigation to grow food
—Sample Question 1207 Identify capital city on a political map
202 Distinguish activities associated with large cities and small towns
195 Recognize features of dry climate in a photograph
192 Identify exact or approximate location of home state on map of United States—Sample Question 3
187 Use map to determine products traded between two countries
182 Identify some land forms on map
175 Recognize type of land use shown in photograph
161 Interpret a simple population pie chart

110 C H A P T E R 6 • G E O G R A P H Y R E P O R T C A R D
NOTE: Regular type denotes a constructed-response question. Italic type denotes a multiple-choice question.* Each grade 8 geography question in the 2001 assessment was mapped onto the NAEP 0–500 geography scale. The position of the question on the scale represents the scale scoreattained by students who had a 65 percent probability of successfully answering a constructed-response question, or a 74 percent probability of correctly answering a four-optionmultiple-choice question. Only selected questions are presented. Scale score ranges for geography achievement levels are referenced on the map. For constructed-response questions, thequestion description represents students’ performance at the scoring criteria level being mapped.SOURCE: U.S. Department of Education, Office of Educational Research and Improvement, National Center for Education Statistics, National Assessment of Educational Progress (NAEP),2001 Geography Assessment.
NAEP Geography Scale
360350340330320310300290280270260250240230220210200
Figure 6.2
Grade 8Item Map
Map of selected itemdescriptions on theNational Assessmentof EducationalProgress (NAEP)geography scale forgrade 8
This map describesthe knowledge or skillassociated withanswering individualgeography questions.The map identifiesthe score point atwhich students had ahigh probability ofsuccessfullyanswering thequestion.*
○ ○ ○ ○ ○ ○ ○ ○ ○ ○ ○ ○ ○ ○ ○ ○ ○ ○ ○ ○ ○ ○ ○ ○ ○ ○ ○ ○ ○ ○ ○ ○ ○ ○ ○ ○ ○ ○ ○ ○ ○ ○ ○ ○ ○ ○ ○ ○ ○ ○ ○ ○ ○
Basic242
○ ○ ○ ○ ○ ○ ○ ○ ○ ○ ○ ○ ○ ○ ○ ○ ○ ○ ○ ○ ○ ○ ○ ○ ○ ○ ○ ○ ○ ○ ○ ○ ○ ○ ○ ○ ○ ○ ○ ○ ○ ○ ○ ○ ○ ○ ○ ○ ○ ○ ○ ○
Proficient282
○ ○ ○ ○ ○ ○ ○ ○ ○ ○ ○ ○ ○ ○ ○ ○ ○ ○ ○ ○ ○ ○ ○ ○ ○ ○ ○ ○ ○ ○ ○ ○ ○ ○ ○ ○ ○ ○ ○ ○ ○ ○ ○ ○ ○ ○ ○ ○ ○ ○ ○ ○ ○
Advanced315
359 Describe and explain differences in population pyramids
348 Use a time zone map
338 Use map to explain international trade in oil
328 Explain two reasons for high rate of tropical deforestation—Sample Question 9
319 Use multiple maps to explain land use in Canada region316 Recognize the natural forces that cause erosion—Sample Question 6314 Use map to explain historical shift in center of U.S. population309 Identify purpose of OPEC309 Understand and compare different views on land ownership303 Interpret resource map to determine likely location for large city to develop301 Use map to help explain two reasons why early civilizations developed in Fertile Crescent
297 Use atlas to find some information about urbanization295 Identify an economic impact of EL Niño on Peru291 Apply concept of interior to locate capital city on political map288 Use map to determine which countries might have a conflict over resources285 Recognize why countries join international organizations—Sample Question 8283 Use a political map and a land use map to locate an African city
278 Compare states using rainfall and growing season maps
271 Explain one reason for high rate of tropical deforestation270 Understand how to read a population pyramid
267 Use map to explain one reason why early civilizations developed in Fertile Crescent
262 Recognize fault line on a map
257 Determine direct or nearly direct route between two points on a transit map—Sample Question 5256 Identify Florida as a peninsula—Sample Question 7
250 Locate Lake Superior on map of North America
240 Identify city closest to earthquake epicenter on map
227 Use map to identify large U.S. trading partner
217 Use resource map to explain where steel industry would develop
207 Locate home state on map
C H A P T E R 6 • G E O G R A P H Y R E P O R T C A R D 111
NOTE: Regular type denotes a constructed-response question. Italic type denotes a multiple-choice question.* Each grade 12 geography question in the 2001 assessment was mapped onto the NAEP 0–500 geography scale. The position of the question on the scale represents the scale scoreattained by students who had a 65 percent probability of successfully answering a constructed-response question, or a 74 percent probability of correctly answering a four-optionmultiple-choice question. Only selected questions are presented. Scale score ranges for geography achievement levels are referenced on the map. For constructed-response questions, thequestion description represents students’ performance at the scoring criteria level being mapped.SOURCE: U.S. Department of Education, Office of Educational Research and Improvement, National Center for Education Statistics, National Assessment of Educational Progress (NAEP),2001 Geography Assessment.
NAEP Geography Scale
380
370
360
350
340
330
320
310
300
290
280
270
260
250
240
Figure 6.3
Grade 12Item Map
Map of selected itemdescriptions on theNational Assessmentof EducationalProgress (NAEP)geography scale forgrade 12
This map describesthe knowledge orskill associated withanswering individualgeography questions.The map identifiesthe score point atwhich students had ahigh probability ofsuccessfullyanswering thequestion.*
○ ○ ○ ○ ○ ○ ○ ○ ○ ○ ○ ○ ○ ○ ○ ○ ○ ○ ○ ○ ○ ○ ○ ○ ○ ○ ○ ○ ○ ○ ○ ○ ○ ○ ○ ○ ○ ○ ○ ○ ○ ○ ○ ○ ○ ○ ○ ○ ○ ○ ○ ○
Advanced339
○ ○ ○ ○ ○ ○ ○ ○ ○ ○ ○ ○ ○ ○ ○ ○ ○ ○ ○ ○ ○ ○ ○ ○ ○ ○ ○ ○ ○ ○ ○ ○ ○ ○ ○ ○ ○ ○ ○ ○ ○ ○ ○ ○ ○ ○ ○ ○ ○ ○ ○ ○
Proficient305
○ ○ ○ ○ ○ ○ ○ ○ ○ ○ ○ ○ ○ ○ ○ ○ ○ ○ ○ ○ ○ ○ ○ ○ ○ ○ ○ ○ ○ ○ ○ ○ ○ ○ ○ ○ ○ ○ ○ ○ ○ ○ ○ ○ ○ ○ ○ ○ ○ ○ ○ ○
Basic270
377 Use data and maps to explain Mongolia’s economic development
350 Explain reasons for international trade in oil347 Explain differences between two countries using population pyramids—Sample Question 13345 Use atlas to explain regional variations in land use
337 Use map to explain historical shift in center of U.S. population333 Use map to explain economic impact of Mid-East War331 Use multiple maps to describe regions where most Australians live
325 Explain high rate of tropical deforestation
321 Use map and charts to compare urbanization in two European countries319 Use a time zone map318 Identify most widely-practiced religion in India—Sample Question 11314 Identify oil as product depicted on map of international trade311 Use climate map to locate countries in tropical zone
305 Use map and charts to identify source of forest products for Japan301 Identify purpose of OPEC300 Explain reasons why Fertile Crescent was home to early civilizations—Sample Question 12299 Use multiple maps to determine U.S. region with highest population density
295 Use map to explain geographic distribution of languages
287 Identify an economic impact of El Niño on Peru284 Define the characteristic of a region282 Locate natural hazards on map and explain their impact280 Use map and data to evaluate an environmental threat
276 Explain siting of cities272 Recognize how to read a flow map—Sample Question 10271 Read a population pyramid
267 Draw partially accurate map based on written description
258 Identify an area of flat land on contour map
253 Recognize that Richter scale is used for measuring earthquake intensity
242 Use map to locate area likely to suffer earthquake damage


A P P E N D I X A • G E O G R A P H Y R E P O R T C A R D 113
AAppendixContents
The Assessment
The Samples
Students withDisabilities (SD)
andLimited EnglishProficient (LEP)
Students
Data Collection
Data Analysis
NAEP ReportingGroups
Cautions inInterpretations
1 National Assessment Governing Board (1994). Geography framework for the 1994 and 2001National Assessment of Educational Progress. Washington, DC: Author.
Technical aspects ofthe NAEP 2001geographyassessment
AppendixFocus
Appendix AOverview of Procedures Used for theNAEP 2001 Geography Assessment
This appendix provides an overview of the NAEP 2001
geography assessment’s primary components—framework,
development, administration, scoring, and analysis. A more
extensive review of the procedures and methods used in the
geography assessment will be included in the forthcoming
NAEP 2001 Technical Report.
The NAEP 2001 Geography AssessmentThe National Assessment Governing Board (NAGB),
created by Congress in 1988, is responsible for
formulating policy for NAEP. The NAGB is
specifically charged with developing assessment
objectives and test specifications through a national
consensus approach. That consensus approach results
in the development of an assessment framework. The
design of the NAEP 2001 geography assessment
followed the guidelines provided in the framework
developed for the 1994 assessment.1
The framework underlying both the NAEP
1994 and 2001 assessments reflects consensus among
educators and researchers about the study of geography. Its
purpose is to present a comprehensive overview of the most
essential outcomes of students’ geography education.
Developing this framework and the specifications that
guided development of the assessment involved the critical

114 A P P E N D I X A • G E O G R A P H Y R E P O R T C A R D
Target and actual percentage distribution of questions by grade and geography content area, grades4, 8, and 12: 1994 and 2001
Table A.1 Distribution of Questions
Space and Place 40 42 48 40 39 40 40 42 38
Environment andSociety 30 28 24 30 30 32 30 30 35
Spatial Dynamicsand Connections 30 31 28 30 32 28 30 29 27
SOURCE: U.S. Department of Education, Office of Educational Research and Improvement, National Center for Education Statistics, National Assessment ofEducational Progress (NAEP), 1994 and 2001 Geography Assessments.
Grade 4 Grade 8 Grade 12
Actual Actual Actual Actual Actual ActualContent Areas Target 1994 2001 Target 1994 2001 Target 1994 2001
input of hundreds of individuals across thecountry, including representatives ofnational education organizations, teachers,parents, policymakers, business leaders, andthe interested general public. This consen-sus process was managed by the Council ofChief State School Officers for NAGB.
The assessment framework specified notonly the particular content areas of geogra-phy to be measured (see chapter 1 for adescription of these dimensions), but alsothe percentage of assessment questions thatshould be devoted to each. The targetpercentage distribution of content areas, asspecified in the framework, along with theactual percentage distributions in the 1994and 2001 assessments, are presented in tableA.1. The targeted content mix of 40percent Space and Place, 30 percent Envi-ronment and Society, and 30 percentSpatial Dynamics and Connections washeld constant across all three grades. Theactual content of the assessment in terms ofpercentage of time spent by students wasgenerally within a few percentage points ofthe targeted distribution in both assessmentyears. Such variation across years in item
classification distribution does not affectthe reporting of trends in student perfor-mance. Trend reporting is based upon theunderlying scale, which uses the commonitems (i.e., those used in both assessmentyears), but maintains its stability even ifsome items are dropped or replaced. More-over, the weighting of subscales in derivingthe composite scale is based on the targetitem classification distribution.
The Assessment DesignEach student who participated in thegeography assessment received a bookletcontaining three or four sections: a set ofgeneral background questions, a set ofsubject-specific background questionsdealing largely with the student’s use oftechnology, and one or two sets, or“blocks,” of cognitive questions assessingknowledge and skills in geography asoutlined in the framework. At grades 8and 12, students were given either two 25-minute blocks or one 50-minute block. Atgrade 4, however, only 25-minute blockswere used. At each grade, one of the 25-minute blocks of questions required the useof an atlas, which was provided.

A P P E N D I X A • G E O G R A P H Y R E P O R T C A R D 115
2 These blocks were distributed across the student booklets in a Balanced Incomplete Block (BIB) design that isdescribed later in this section.
At grade 4, a total of six 25-minuteblocks of cognitive questions were given,while at grades 8 and 12, seven blocks (six25-minute blocks and one 50-minuteblock) were administered.2 Some of theblocks at each grade (three at grade 4, andfour at grades 8 and 12) were carriedforward from the 1994 assessment to the2001 assessment to allow for the measure-ment of changes across time. Each blockconsisted of both multiple-choice andconstructed-response questions. Short-constructed-response questions required afew sentences for an answer, whileextended-constructed-response questionsgenerally required a paragraph or more.Some of the constructed-responsequestions required students to createmaps or graphics. It was expected thatstudents could adequately answer theshort-constructed-response questions inabout two to three minutes and theextended-constructed-response questionsin about five minutes. The 50-minute
Distribution of questions administered by question type, grades 4, 8, and 12: 1994 and 2001
Table A.2 Distribution of Questions by Question Type
Multiple-choice 59 63 84 85 85 86
Short constructed-response 23 21 32 30 25 24
Extended constructed-response 8 7 9 9 13 13
Total 90 91 125 124 123 123
SOURCE: U.S. Department of Education, Office of Educational Research and Improvement, National Center for Education Statistics, National Assessment ofEducational Progress (NAEP), 1994 and 2001 Geography Assessments.
Grade 4 Grade 8 Grade 12
1994 2001 1994 2001 1994 2001
blocks contained questions focusing ona particular theme, and included twoextended-constructed-response questions.Only one 50-minute block was adminis-tered at each of grades 8 and 12.
Table A.2 displays the number of ques-tions by type and by grade level for the1994 and 2001 assessments. Some of thequestions were used at more than onegrade level; thus, the sum of the questionsthat appears at each grade level is greaterthan the total number of unique questions.The total number of questions at eachgrade level varied little from 1994 to 2001,despite the release to the public of severalblocks at each grade level and attendantreplacement with new blocks of questions.It should be noted that any such variationacross years does not affect NAEP’s abilityto report on changes in students’ perfor-mance across years because this reporting isbased on the presence of blocks that werecommon to the assessment in two years.

116 A P P E N D I X A • G E O G R A P H Y R E P O R T C A R D
3 For further details on the booklet design, see the forthcoming NAEP 2001 Technical Report.
The assessment design allowed for maxi-mum coverage of geography content atgrades 4, 8, and 12, while minimizing thetime burden for any one student. This wasaccomplished through the use of matrixsampling of cognitive questions, in whichrepresentative samples of students tookdifferent portions of the entire pool ofassessment questions. The aggregate resultsacross the entire assessment allowed forbroad reporting of the geography perfor-mance of the targeted population. Matrixsampling did not apply to backgroundquestions; each student received all thebackground questions appropriate for hisor her grade.
In addition to matrix sampling, theassessment design utilized a procedure fordistributing test booklets that controlled forposition and context effects. Studentsreceived different blocks of questions intheir booklets according to a procedurecalled “Balanced Incomplete Block (BIB)spiraling.” This procedure assigns blocks ofquestions so that every block appears in thefirst or second position within a booklet anequal number of times. Every block ofquestions is paired with every other block,with the exception of the 50-minutetheme block, which appears on its ownwithout another block of cognitive ques-tions. The spiraling aspect of this proce-dure cycles the booklets for administration,so that typically only a few students in anyassessment session receive the same booklet.
This design allows for some balancing ofthe impact of context and fatigue effects tobe measured and reported, but makesallowance for the difficulties of administer-ing the 50-minute blocks.3
In addition to the student assessmentbooklets, three other instruments provideddata relating to the assessment: a teacherquestionnaire, a school questionnaire, and aStudents with Disabilities and/or LimitedEnglish Proficiency (SD and/or LEP)questionnaire. The teacher questionnairewas administered to the geography or socialstudies teachers of fourth- and eighth-grade students participating in the assess-ment. The questionnaire consisted of threesections and took approximately 20 min-utes to complete. The first section focusedon the teacher’s general background andexperience; the second section on com-puter resources available in the school; andthe third section on classroom informationabout geography/social studies instruction.
The school characteristics and policyquestionnaire was given to the principal orother administrator in each participatingschool and took about 20 minutes tocomplete. The questions asked aboutschool policies, programs, facilities, anddemographic composition and backgroundof the student body.
The SD and/or LEP student question-naire was completed by a school staffmember knowledgeable about those

A P P E N D I X A • G E O G R A P H Y R E P O R T C A R D 117
students who were selected to participatein the assessment and who were identifiedas: 1) having an Individualized EducationProgram (IEP) or equivalent program (forreasons other than being gifted and tal-ented) or 2) being limited English profi-cient (LEP). A questionnaire was com-pleted for each SD and/or LEP studentsampled regardless of whether the studentparticipated in the assessment. Each ques-tionnaire took approximately 3 minutes tocomplete and asked about the student andthe special programs in which he or sheparticipated.
National SampleThe national results presented in this reportare based on nationally representativeprobability samples of fourth-, eighth-, andtwelfth-grade students. The sample waschosen using a multistage design thatinvolved sampling students from selectedschools within selected geographic areasacross the country. The sample design hadthe following stages:
1) selection of geographic areas (a county,group of counties, or metropolitanstatistical area);
2) selection of schools (public andnonpublic) within the selected areas; and
3) selection of students within selectedschools.
4 Additional details regarding the design and structure of the national and state samples will be included in theforthcoming NAEP 2001 Technical Report. In addition, the reader may consult the NAEP 2000 Technical Report for adiscussion of sampling procedures that are mostly common to all NAEP assessments.
Each selected school that participated inthe assessment and each student assessedrepresents a portion of the population ofinterest. Sampling weights are needed tomake valid inferences between the studentsamples and the respective populationsfrom which they were drawn. Samplingweights account for disproportionaterepresentation due to the oversampling ofstudents who attend schools with highconcentrations of Black and/or Hispanicstudents and students who attendnonpublic schools. Among other uses,sampling weights also account for lowersampling rates for very small schools andare used to adjust for school and studentnonresponse.4
Unlike the 1994 national assessment, aspecial feature of the 2001 national assess-ment was the collection of data fromsamples of students where assessmentaccommodations for special-needs studentswere not permitted and from samples ofstudents where accommodations forspecial-needs students were permitted.NAEP inclusion rules were applied, andaccommodations were offered only when astudent had an Individualized EducationProgram (IEP) because of a disability and/or was identified as being a limited Englishproficient student (LEP); all other studentswere asked to participate in the assessmentunder standard conditions.

118 A P P E N D I X A • G E O G R A P H Y R E P O R T C A R D
Table A.3 shows the number of studentsincluded in the national samples for theNAEP 1994 and 2001 geography assess-ments at each grade level. For the 2001assessment, the table includes the numberof students in the sample where accommo-dations were not permitted and the num-ber of students in the sample whereaccommodations were permitted. Thetable shows that the same non-SD and/orLEP students were included in both
National student sample size by type of results, grades 4, 8, and 12: 1994 and 2001
Table A.3 National Student Sample Size
1994 2001Accommodations Accommodations Accommodations
not permitted not permitted permittedsample sample sample
Grade 4Non SD/LEP students assessed 5,045 6,375
SD/LEP students assessedwithout accommodations 462 551 476
SD/LEP students assessedwith accommodations NA NA 368
Total students assessed 5,507 6,926 7,219
Grade 8Non SD/LEP students assessed 6,482 8,227
SD/LEP students assessedwithout accommodations 396 721 675
SD/LEP students assessed with accommodations NA NA 397
Total students assessed 6,878 8,948 9,299
Grade 12Non SD/LEP students assessed 5,944 8,477
SD/LEP students assessedwithout accommodations 290 522 467
SD/LEP students assessedwith accommodations NA NA 188
Total students assessed 6,234 8,999 9,132
SD = Students with Disabilities.LEP = Limited English Proficient students.NA = Not applicable. No accommodations were permitted in this sample.SOURCE: U.S. Department of Education, Office of Educational Research and Improvement, National Center for Education Statistics, National Assessment ofEducational Progress (NAEP), 1994 and 2001 Geography Assessments.
samples in 2001; only the SD and/or LEPstudents differed between the two samples.The 1994 design differed somewhat in thatthe SD and/or LEP students were assessedin standard conditions and accommoda-tions were not permitted.
Table A.4 provides a summary of thenational school and student participationrates for the geography assessment sampleswhere accommodations were not per-mitted and where accommodations were

A P P E N D I X A • G E O G R A P H Y R E P O R T C A R D 119
5 The initial base sampling weights were used in weighting the percentages of participating schools and students. Anattempt was made to preselect (before field processes began) a maximum of two substitute schools for each sampledpublic school (one in-district and one out-of-district) and each sampled Catholic school, and one for each samplednonpublic school (other than Catholic). To minimize bias, a substitute school resembled the original selection asmuch as possible on affiliation, estimated number of grade-eligible students, and minority composition.
National school and student participation rates for public schools, nonpublic schools, and publicand nonpublic schools combined, grades 4, 8, and 12: 2001
Table A.4 Participation Rates
Samples where accommodations Samples where accommodationsWeighted school participation were not permitted were permitted
Student participation Overall participation rate Student participation Overall participation rate
Weighted Total Weighted TotalPercentage Percentage Total percentage number of percentage number of
before after number student students Before After student students Before Aftersubstitution substitution of schools participation assessed substitution substitution participation assessed substitution substitution
Grade 4Public 83 88 276 95 5,895 79 84 95 6,181 79 84
Nonpublic 83 91 89 96 1,031 80 87 96 1,038 80 88Combined 83 88 365 95 6,926 79 84 95 7,219 79 84
Grade 8Public 79 87 259 92 7,728 73 80 92 8,063 72 80
Nonpublic 84 88 110 96 1,232 81 84 96 1,245 80 84Combined 79 87 369 93 8,960 74 81 92 9,308 73 80
Grade 12Public 73 80 311 76 7,977 55 61 76 8,112 55 61
Nonpublic 67 77 63 98 1,022 66 76 91 1,021 61 70Combined 72 80 374 77 8,999 56 62 77 9,133 56 62
SOURCE: U.S. Department of Education, Office of Educational Research and Improvement, National Center for Education Statistics, National Assessment ofEducational Progress (NAEP), 2001 Geography Assessment.
permitted. Participation rates are presentedfor public and nonpublic schools, individu-ally and combined. The first rate is theweighted percentage of schools participat-ing in the assessment before substitution ofdemographically similar schools.5 This rateis based only on the number of schools thatwere initially selected for the assessment.The numerator of this rate is the sum ofthe number of students represented by eachinitially selected school that participated inthe assessment. The denominator is thesum of the number of students representedby each of the initially selected schools thathad eligible students enrolled.
The second school participation rate isthe weighted participation rate after substi-tution. The numerator of this rate is thesum of the number of students representedby each of the participating schools,whether originally selected or selected as asubstitute for a school that chose not toparticipate. The denominator is the sameas that for the weighted participation ratefor the initial sample. Because of thecommon denominators, the weightedparticipation rate after substitution is atleast as great as the weighted participationrate before substitution.

120 A P P E N D I X A • G E O G R A P H Y R E P O R T C A R D
6 As described in the following section, a second sample in the 2001 national assessments was assessed that includedstudents who required and were provided with accommodations.
Also presented in table A.4 are weightedstudent participation rates. The numeratorof this rate is the sum across all studentsassessed (in either an initial session or amakeup session) of the number of studentsthat each represents. The denominator ofthis rate is the sum across all eligiblesampled students in participating schools ofthe number of students that each repre-sents. The overall participation rates takeinto account the weighted percentage ofschool participation before or after substi-tution and the weighted percentage ofstudent participation after makeup sessions.
For the grade 12 national sample, whereschool and student response rates did notmeet NCES standards, an extensive analysiswas conducted that examined, amongother factors, the potential for nonresponsebias at both the school and student level.No evidence of any significant potential foreither school or student nonresponse biaswas found. Results of these analyses, as wellas nonresponse bias analyses for the grade 4and grade 8 national samples, will beincluded in the forthcoming NAEP 2001Technical Report.
Students with Disabilities (SD)and/or Limited English Proficient(LEP) StudentsIt is NAEP’s intent to assess all selectedstudents from the target population.Therefore, every effort is made to ensurethat all selected students who are capable ofparticipating in the assessment are assessed.Some students sampled for participation inNAEP can be excluded from the sampleaccording to carefully defined criteria.
These criteria were revised in 1996 tocommunicate more clearly a presumptionof inclusion except under special circum-stances. According to these criteria, stu-dents with Individualized EducationPrograms (IEPs) were to be included in theNAEP assessment except in the followingcases:
1) The school’s IEP team determined thatthe student could not participate, OR,
2) The student’s cognitive functioning wasso severely impaired that she or he couldnot participate, OR,
3) The student’s IEP required that thestudent had to be tested with an accom-modation or adaptation and that thestudent could not demonstrate his or herknowledge without that accommoda-tion.6
All LEP students receiving academicinstruction in English for three years ormore were to be included in the assess-ment. Those LEP students receivinginstruction in English for fewer than threeyears were to be included unless schoolstaff judged them to be incapable of par-ticipating in the assessment in English.
Participation of SD and/or LEPStudents in the NAEP Samples
Testing all sampled students is the best wayfor NAEP to ensure that the statisticsgenerated by the assessment are as repre-sentative as possible of the performance ofthe entire national population and thepopulations of participating jurisdictions.However, all groups of students includecertain proportions that cannot be tested in

A P P E N D I X A • G E O G R A P H Y R E P O R T C A R D 121
7 Office of Special Education Programs (1997). Nineteenth annual report to Congress on the implementation of theindividuals with disabilities education act. Washington, DC: U. S. Department of Education.
8 Section 504 of the Rehabilitation Act of 1973 is a civil rights law designed to prohibit discrimination on the basis ofdisability in programs and activities, including education, that receive federal financial assistance.
large-scale assessments (such as studentswho have profound mental disabilities), orwho can only be tested through the use of“accommodations” such as extra time, one-on-one administration, or use of magnify-ing equipment.
Some students with disabilities and someLEP students cannot show on a test whatthey know and can do unless they areprovided accommodations. When suchaccommodations are not allowed, studentsrequiring such adjustments are oftenexcluded from large-scale assessments suchas NAEP. This phenomenon has becomemore common in the last decade andgained momentum with the passage of theIndividuals with Disabilities Education Act(IDEA), which led schools and states toidentify increasing proportions of studentsas needing accommodations on assessmentsto best show what they know and can do.7
Furthermore, Section 504 of the Rehabili-tation Act of 1973 requires that, whenstudents with disabilities are tested, schoolsmust provide them with appropriateaccommodations so that the test resultsaccurately reflect students’ achievement.8 Inaddition, as the proportion of limitedEnglish proficient students in the popula-tion has increased, some states have startedoffering accommodations, such as trans-lated versions of assessments or the use ofbilingual dictionaries as part of assessments.
Before 1996, NAEP did not allow anytesting under nonstandard conditions(i.e., accommodations were not permitted).At that time, NAEP samples were able toinclude almost all sampled students in“standard” assessment sessions. However, asthe influence of IDEA grew more wide-spread, the failure to provide accommoda-tions led to increasing levels of exclusion inthe assessment. Such increases posed twothreats to the program: 1) they threatenedthe stability of trend lines (because exclud-ing more students in one year than thenext might lead to apparent rather than realgains), and 2) they made NAEP samplesless than optimally representative of targetpopulations.
NAEP reacted to this challenge byadopting a multipart strategy. It becameclear that, to ensure that NAEP sampleswere as inclusive as possible, the programhad to move toward allowing the sameassessment accommodations that wereafforded students in state and districttesting programs. However, allowingaccommodations represents a change intesting conditions that may affect measure-ment of changes over time. Therefore,beginning with the 1996 national assess-ments and the 1998 state assessments,NAEP has assessed a series of parallelsamples of students. In one set of samples,testing accommodations were not permit-ted; this has allowed NAEP to maintain the

122 A P P E N D I X A • G E O G R A P H Y R E P O R T C A R D
9 The two samples are described as “overlapping” because in 2001 the same group of non-SD and/or LEP studentswere included in both samples.
measurement of achievement trends. Inaddition to the samples where accommo-dations were not permitted, parallel samplesin which accommodations were permittedwere also assessed. By having two overlap-ping samples and two sets of related datapoints, NAEP could meet two core pro-gram goals.9 First, data trends could bemaintained. Second, parallel trend linescould be set in ways that ensure that infuture years the program will be able to usethe most inclusive practices possible andmirror the procedures used by most stateand district assessments. Beginning in 2002,NAEP will use only the more inclusivesamples in which assessment accommoda-tions are permitted.
In geography, national data from 1994and 2001 are reported for the sample inwhich accommodations were not per-mitted. National data for the second sample,in which accommodations were permitted,are reported at all grades for 2001 only.
In order to make it possible to evaluatethe impact of increasing exclusion rates,data on exclusion in both assessment yearsare included in this appendix. Since theexclusion rates may affect average scalescores, readers should consider the magni-tude of exclusion rate changes wheninterpreting score changes.
Percentages of SD and/or LEP studentsfor the national sample where accommo-dations were not permitted are presentedin table A.5. The data in this table includethe percentages of students identified as SDand/or LEP, the percentage of studentsexcluded, and the percentage of assessed SDand/or LEP students. Percentages of thesestudents in the national sample whereaccommodations were permitted arepresented in table A.6. The data in thistable include the percentages of studentsidentified as SD and/or LEP, the percentageof students excluded, the percentage ofassessed SD and/or LEP students, thepercentage assessed without accommodations,and the percentage assessed with accommo-dations.
In the 2001 accommodations-not-permitted national sample, 8 percent ofstudents at grades 4 and 8, and 5 percent ofstudents at grade 12 were excluded fromthe assessment. The comparable percent-ages in the 2001 accommodations-permit-ted national sample were 4 percent atgrades 4 and 8, and 2 percent at grade 12.

A P P E N D I X A • G E O G R A P H Y R E P O R T C A R D 123
Percentage of students identified as SD and/or LEP where accommodations were not permitted,grades 4, 8, and 12: 1994 and 2001
Table A.5 Students Identified as SD and/or LEP Where Accommodations Were Not Permitted
Grade 4SD and/or LEP students
Identified 1,487 14 100 1,051 16 100Excluded 1,025 5 41 500 8 48Assessed 462 8 59 551 8 52
SD students onlyIdentified 974 10 100 611 11 100Excluded 685 4 43 378 6 58Assessed 289 6 57 233 4 42
LEP students onlyIdentified 546 4 100 489 6 100Excluded 368 1 35 157 2 32Assessed 178 3 65 332 4 68
Grade 8SD and/or LEP students
Identified 1,674 10 100 1,379 16 100Excluded 1,278 5 46 658 8 48Assessed 396 5 54 721 8 52
SD students onlyIdentified 1,254 8 100 947 12 100Excluded 979 4 49 546 7 54Assessed 275 4 51 401 6 46
LEP students onlyIdentified 450 2 100 489 4 100Excluded 323 1 38 153 1 31Assessed 127 1 62 336 3 69
Grade 12SD and/or LEP students
Identified 1,238 8 100 1,096 11 100Excluded 948 3 43 574 5 44Assessed 290 4 57 522 6 56
SD students onlyIdentified 967 6 100 772 8 100Excluded 776 3 47 483 4 49Assessed 191 3 53 289 4 51
LEP students onlyIdentified 285 2 100 373 3 100Excluded 184 # 29 121 1 31Assessed 101 1 71 252 2 69
# Percentage is between 0.0 and 0.5.SD = Students with Disabilities. LEP = Limited English Proficient students.NOTE: Within each grade level, the combined SD/LEP portion of the table is not a sum of the separate SD and LEP portions because some students wereidentified as both SD and LEP. Such students would be counted separately in the bottom portions, but counted only once in the top portion.Within each portion of the table, percentages may not sum properly due to rounding. In 1994, the geography assessment was conducted at the same time asthe 1994 U.S. history assessment. The identification and exclusion of special-needs students occurred after they were sampled, but before they could beassigned either a history or geography session. As a consequence, the 1994 sample sizes for identified and excluded students appear larger than would beexpected given the weighted percentages that were calculations based on the geography sample only.SOURCE: U.S. Department of Education, Office of Educational Research and Improvement, National Center for Education Statistics, National Assessment ofEducational Progress (NAEP), 1994 and 2001 Geography Assessments.
1994 2001Weighted Weighted
Number of Weighted percentage of Number of Weighted percentage ofstudents percentage students students percentage studentssampled of all students identified sampled of all students identified

124 A P P E N D I X A • G E O G R A P H Y R E P O R T C A R D
Grade 4SD and/or LEP students Identified 1,137 17 100
Excluded 293 4 24Assessed 844 13 76
Assessed without accommodations 476 6 36Assessed with accommodations 368 7 41
SD students only Identified 641 13 100Excluded 138 3 21Assessed 503 10 79
Assessed without accommodations 172 3 26Assessed with accommodations 331 7 53
LEP students only Identified 576 5 100Excluded 175 2 31Assessed 401 4 69
Assessed without accommodations 309 3 54Assessed with accommodations 92 1 16
Grade 8SD and/or LEP students Identified 1,453 16 100
Excluded 381 4 23Assessed 1,072 12 77
Assessed without accommodations 675 7 43Assessed with accommodations 397 5 34
SD students only Identified 996 12 100Excluded 262 3 22Assessed 734 10 78
Assessed without accommodations 344 4 35Assessed with accommodations 390 5 43
LEP students only Identified 545 4 100Excluded 140 1 27Assessed 405 3 73
Assessed without accommodations 348 3 63Assessed with accommodations 57 # 10
Grade 12SD and/or LEP students Identified 956 10 100
Excluded 301 2 23Assessed 655 8 77
Assessed without accommodations 467 5 50Assessed with accommodations 188 3 27
SD students only Identified 652 8 100Excluded 252 2 26Assessed 400 6 74
Assessed without accommodations 233 3 42Assessed with accommodations 167 3 32
LEP students only Identified 334 2 100Excluded 63 # 17Assessed 271 2 83
Assessed without accommodations 242 2 75Assessed with accommodations 29 # 8
# Percentage is between 0.0 and 0.5.SD = Students with Disabilities. LEP = Limited English Proficient students.NOTE: Within each grade level, the combined SD/LEP portion of the table is not a sum of the separate SD and LEP portions because some students wereidentified as both SD and LEP. Such students would be counted separately in the bottom portions, but counted only once in the top portion.Within each portion of the table, percentages may not sum properly due to rounding.SOURCE: U.S. Department of Education, Office of Educational Research and Improvement, National Center for Education Statistics, National Assessment ofEducational Progress (NAEP), 2001 Geography Assessment.
Number of Weighted percentage Weighted percentagestudents sampled of all students of students identified
Percentage of students identified as SD and/or LEP where accommodations were permitted,grades 4, 8, and 12: 2001
Table A.6 Students Identified as SD and/or LEP Where Accommodations Were Permitted

A P P E N D I X A • G E O G R A P H Y R E P O R T C A R D 125
10 For information on DIF studies of items assessed with accommodations in the 1996 mathematics and scienceassessments, see Mazzeo, J. M., Carlson, J. E., Voelkl, K. E., & Lutkus, A. D. (1999). Increasing the participation of specialneeds students in NAEP; A report on 1996 NAEP research activities. Washington, DC: National Center for EducationStatistics.
Investigating the Effects of ExclusionRates on Assessment Results
As indicated by the data in the previoussection, exclusion rates have tended toincrease across assessment years in thesamples that did not permit accommoda-tions. In considering the effects of exclu-sion rates on assessment results, at least onemajor issue becomes evident. If exclusionrates vary substantially across assessmentyears, then the ability to report trends (i.e.,compare results between years) may beaffected by the fact that the results fromdifferent years are based on differentproportions of the population.
NCES has funded research into ways inwhich excluded students might be in-cluded in the estimation of scores for totalpopulations and has also commissionedstudies of the impact of assessment accom-modations on overall scores. Severalstatistical adjustment approaches for esti-mating full populations (including estimatesfor excluded students) have been proposed,but none has yet been judged ready foroperational use. Regarding the impact ofassessment accommodations on overall
scores, ETS has conducted differential itemfunctioning (DIF) studies of items assessedwith accommodations in the 1996 assess-ment.10 In these studies, ETS researchersfound little evidence that accommodationschanged the functioning of test questions.
Types of Accommodations Permitted
Table A.7 displays the number and thepercentages of SD and/or LEP studentsassessed with the variety of availableaccommodations. It should be noted thatstudents assessed with accommodationstypically received some combination ofaccommodations. The numbers and per-centages presented in the table reflect onlythe primary accommodation provided. Forexample, students assessed in small groups(as compared to standard NAEP sessions ofabout 30 students) usually receivedextended time. In one-on-one administra-tions, students often received assistance inrecording answers and were afforded extratime. Extended time was considered theprimary accommodation only when it wasthe sole accommodation provided.

126 A P P E N D I X A • G E O G R A P H Y R E P O R T C A R D
Percentage of students identified as SD and/or LEP by type of accommodation where accommodationswere permitted, grades 4, 8, and 12: 2001
Table A.7 Students Identified as SD and/or LEP by Type of Accommodation
Grade 4 Grade 8 Grade 12
Weighted Weighted WeightedNumber Weighted percentage Number Weighted percentage Number Weighted percentage
of students percentage of students of students percentage of students of students percentage of studentssampled of all students identified sampled of all students identified sampled of all students identified
SD and/or LEP studentsBilingual dictionary 41 0.38 2.2 6 0.04 0.3 21 0.14 1.4
Large-print book 3 0.02 0.1 3 0.02 0.2 3 0.05 0.5Extended time 40 0.59 3.4 70 0.82 5.1 68 0.86 8.6
Read aloud 15 0.27 1.5 14 0.15 0.9 10 0.13 1.3Small group 230 4.97 28.6 286 4.02 25.1 83 1.43 14.4One-on-one 27 0.50 2.9 6 0.09 0.6 3 0.03 0.4
Scribe/computer 10 0.31 1.8 3 0.08 0.5 0 0.00 0.0Other 2 0.03 0.2 9 0.16 1.0 0 0.00 0.0
SD students onlyBilingual dictionary 5 0.05 0.4 0 0.00 0.0 0 0.00 0.0
Large-print book 3 0.02 0.2 3 0.02 0.2 3 0.05 0.6Extended time 40 0.59 4.7 70 0.82 6.6 68 0.86 11.1
Read aloud 15 0.27 2.1 14 0.15 1.2 10 0.13 1.7Small group 230 4.97 39.3 286 4.02 32.4 83 1.43 18.5One-on-one 27 0.50 3.9 6 0.09 0.7 3 0.03 0.5
Scribe/computer 10 0.31 2.5 3 0.08 0.7 0 0.00 0.0Other 1 0.02 0.2 8 0.15 1.2 0 0.00 0.0
LEP students onlyBilingual dictionary 41 0.38 6.9 6 0.04 1.0 21 0.14 5.7
Large-print book 0 0.00 0.0 0 0.00 0.0 0 0.00 0.0Extended time 20 0.20 3.6 20 0.13 3.0 4 0.02 0.9
Read aloud 5 0.04 0.7 0 0.00 0.0 0 0.00 0.0Small group 21 0.21 3.8 30 0.27 6.1 4 0.04 1.7One-on-one 3 0.03 0.5 0 0.00 0.0 0 0.00 0.0
Scribe/computer 1 0.01 0.2 0 0.00 0.0 0 0.00 0.0Other 1 0.01 0.1 1 0.01 0.3 0 0.00 0.0
SD = Students with Disabilities. LEP = Limited English Proficient students.NOTE: The combined SD/LEP portion of the table is not a sum of the separate SD and LEP portions because some students were identified as both SDand LEP. Such students would be counted separately in the bottom portions, but counted only once in the top portion.SOURCE: U.S. Department of Education, Office of Educational Research and Improvement, National Center for Education Statistics, National Assessment of EducationalProgress (NAEP), 2001 Geography Assessment.

A P P E N D I X A • G E O G R A P H Y R E P O R T C A R D 127
11 These procedures are described more fully in the “Weighting and Variance Estimation” section later in this docu-ment. For additional information about the use of weighting procedures, see the forthcoming NAEP 2001 TechnicalReport. In addition, the reader may consult the NAEP 2000 Technical Report for a discussion of weighting proceduresthat are common to all NAEP assessments.
12 Lord, F. M. (1980). Applications of item response theory to practical testing problems. Hillsdale, NJ: Lawrence ErlbaumAssociates.
Data Collection and ScoringThe 2001 geography assessment wasconducted from January through March2001, with some makeup sessions in earlyApril. As with all NAEP assessments, datacollection for the 2001 assessment wasconducted by a trained field staff. This wasaccomplished by staff from Westat, Inc.
Materials from the 2001 assessment wereshipped to NCS Pearson, where trainedstaff evaluated the responses to the con-structed-response questions using scoringrubrics or guides prepared by ETS. Eachconstructed-response question had a uniquescoring rubric that defined the criteriaused to evaluate students’ responses. Theextended-constructed-response questionswere evaluated with four-level rubrics,and almost all of the short-constructed-response questions were rated according tothree-level rubrics that permitted partialcredit. Other short-constructed-responsequestions were scored as either acceptableor unacceptable.
For the 2001 geography assessment,approximately 303,000 constructedresponses were scored. This numberincludes rescoring to monitor inter-raterreliability. The within-year average per-centage of agreement for the 2001 nationalreliability sample was 95 percent at grade 4,94 percent at grade 8, and 93 percent atgrade 12.
Data Analysis and IRT ScalingSubsequent to the professional scoring, allinformation was transcribed to the NAEPdatabase at ETS. Each processing activitywas conducted with rigorous qualitycontrol. After the assessment informationwas compiled in the database, the data wereweighted according to the populationstructure. The weighting for the nationalsample reflected the probability of selectionfor each student as a result of the samplingdesign, adjusted for nonresponse. Throughpost-stratification, the weighting assuredthat the representation of certain sub-populations corresponded to figures fromthe U.S. Census and the CurrentPopulation Survey.11
Analyses were then conducted to deter-mine the percentages of students who gavevarious responses to each cognitive andbackground question. In determining thesepercentages for the cognitive questions, adistinction was made between missingresponses at the end of a block (i.e., missingresponses subsequent to the last questionthe student answered) and missing responsesprior to the last observed response. Missingresponses before the last observed responsewere considered intentional omissions. Inanalysis, omitted responses to multiple-choice items were scored as fractionallycorrect.12 For constructed-response items,

128 A P P E N D I X A • G E O G R A P H Y R E P O R T C A R D
omitted responses were placed into thelowest score category. Missing responses atthe end of the block were considered “notreached” and treated as if the questions hadnot been presented to the student. Incalculating response percentages for eachquestion, only students classified as havingbeen presented the question were includedin the denominator of the statistic.
It is standard NAEP practice to treat allnonrespondents to the last question in ablock as if they had not reached the ques-tion. For multiple-choice and short-constructed-response questions, this prac-tice produces a reasonable pattern of resultsin that the proportion reaching the lastquestion is not dramatically smaller thanthe proportion reaching the next-to-lastquestion. However, for geography blocksthat ended with extended-constructed-response questions, the standard practicecould result in extremely large drops in theproportion of students attempting some ofthe final questions. Therefore, for blocksending with an extended-constructed-response question, students who answeredthe next-to-last question but did notrespond to the extended-constructed-response question were classified as havingintentionally omitted the last question.
Item Response Theory (IRT) was usedto estimate average geography scale scoresfor the nation and for various subgroups ofinterest within the nation. IRT models theprobability of answering a question in acertain way as a mathematical function ofproficiency or skill. The main purpose of
IRT analysis is to provide a common scaleon which performance can be comparedacross groups such as those defined bycharacteristics, including gender and race/ethnicity.
In producing the geography scales, threedistinct IRT models were used. Multiple-choice questions were scaled using thethree-parameter logistic (3PL) model;short-constructed-response questions ratedas acceptable or unacceptable were scaledusing the two-parameter logistic (2PL)model; and short-constructed-responsequestions rated according to a three-levelrubric, as well as extended-constructed-response questions rated on a four-levelrubric, were scaled using a GeneralizedPartial-Credit (GPC) model.13 Developedby ETS and first used in 1992, the GPCmodel permits the scaling of questionsscored according to multipoint ratingschemes. The model takes full advantage ofthe information available from each of thestudent response categories used for thesemore complex constructed-responsequestions.14
The geography scale is composed ofthree types of questions: multiple-choice,short-constructed-response (scored eitherdichotomously or allowing for partialcredit), and extended-constructed-response(scored according to a partial-credit model).Unfortunately, the question of how muchinformation different question-typescontribute to the geography scale has nosimple answer. The information providedby a given question is determined by the
13 Muraki, E. (1992). A generalized partial credit model: Application of an EM algorithm. Applied PsychologicalMeasurement, (16)2, 159–176.
14 More detailed information regarding the IRT analyses used in NAEP assessments will be provided in the forth-coming NAEP 2001 Technical Report. In addition, the reader may consult the NAEP 2000 Technical Report for adiscussion of analysis procedures that are common to all NAEP assessments.

A P P E N D I X A • G E O G R A P H Y R E P O R T C A R D 129
15 Donoghue, J. R. (1994). An empirical examination of the IRT information of polytomously scored reading itemsunder the generalized partial credit model. Journal of Educational Measurement, (31)4, 295–311.
16 For theoretical and empirical justification of the procedures employed, see Mislevy, R. J. (1988). Randomization-based inferences about latent variables from complex samples. Psychometrika, (56)2, 177–196.
For computational details, see the forthcoming NAEP 2001 Technical Report.
IRT model used to scale the question. It isa function of the item parameters andvaries by level of geography proficiency.15
Thus, the answer to the query “How muchinformation do the different types ofquestions provide?” will differ for eachlevel of geography performance. Whenconsidering the composite geography scale,the answer is even more complicated. Thegeography data are scaled separately by thethree themes (space and place; environmentand society; and, spatial dynamics andconnections), resulting in three separatesubscales at each grade. The compositescale is a weighted combination of thesesubscales. IRT information functions areonly strictly comparable when the itemparameters are estimated together. Becausethe composite scale is based on threeseparate estimation runs, there is no directway to compare the information providedby the questions on the composite scale.
Because of the BIB-spiraling design usedby NAEP, students do not receive enoughquestions about a specific topic to providereliable information about individualperformance. (For more information onBIB-spiraling, see “The Assessment Design”section presented earlier in this appendix.)Traditional test scores for individual stu-dents, even those based on IRT, would leadto misleading estimates of populationcharacteristics, such as subgroup means andpercentages of students at or above a
certain scale-score level. Consequently,NAEP constructs sets of plausible valuesdesigned to represent the distribution ofperformance in the population. A plausiblevalue for an individual is not a scale scorefor that individual, but may be regarded asa representative value from the distributionof potential scale scores for all students inthe population with similar characteristicsand identical patterns of item response.Statistics describing performance on theNAEP geography scale are based on theplausible values. Under the assumptions ofthe scaling models, these population esti-mates will be consistent, in the sense thatthe estimates approach the model-basedpopulation values as the sample sizeincreases, which would not be the case forpopulation estimates obtained by aggre-gating optimal estimates of individualperformance.16
Item Mapping ProceduresThe geography performance of fourth-,eighth-, and twelfth-graders can be illus-trated by “item maps,” which positionquestion or “item” descriptions along theNAEP geography scale at each grade. Eachquestion shown is placed at the point onthe scale where questions are likely to beanswered successfully by students. Thedescriptions used on these item maps focuson the geography knowledge or skillneeded to answer the question. For multiple-choice questions, the description indicates

130 A P P E N D I X A • G E O G R A P H Y R E P O R T C A R D
17 Huynh, H. (1994, October). Some technical aspects of standard setting. Paper presented at the Joint Conference on StandardSetting for Large-Scale Assessment, Washington, DC.
the knowledge or skill demonstrated byselection of the correct option; for con-structed-response questions, the descriptiontakes into account the knowledge or skillspecified by the different levels of scoringcriteria for that question.
To map questions to particular points onthe NAEP geography scale, a responseprobability convention was adopted thatwould divide those who had a higherprobability of success from those who hada lower probability. Establishing a responseprobability convention has an impact onthe mapping of the test questions onto thegeography scale. A lower boundary con-vention maps the geography questions atlower points along the scale, and a higherboundary convention maps the samequestions at higher points on the scale.The underlying distribution of geographyskills in the population does not change,but the choice of a response probabilityconvention does have an impact on theproportion of the student population that isreported as “able to do” the questions onthe geography scales.
There is no obvious choice of a pointalong the probability scale that is clearlysuperior to any other point. If the conven-tion were set with a boundary at 50 per-cent, those above the boundary would bemore likely to get a question right than getit wrong, while those below the boundarywould be more likely to get the questionwrong than right. Although this conven-tion has some intuitive appeal, it wasrejected on the grounds that having a
50/50 chance of getting the question rightshows an insufficient degree of mastery. Ifthe convention were set with a boundary at80 percent, students above the criterionwould have a high probability of successwith a question. However, many studentsbelow this criterion show some level ofgeography ability that would be ignored bysuch a stringent criterion. In particular,those in the range between 50 and 80percent correct would be more likely toget the question right than wrong, yetwould not be in the group described as“able to do” the question.
In a compromise between the 50 per-cent and the 80 percent conventions,NAEP has adopted two related responseprobability conventions for all its subjects:65 percent for constructed-response ques-tions (where guessing is not a factor) and74 percent for multiple-choice questions(to correct for the possibility of answeringcorrectly by guessing). These probabilityconventions were established, in part, basedon an intuitive judgment that they wouldprovide the best picture of students’geography skills.
Some additional support for the dualconventions adopted by NAEP was pro-vided by Huynh.17 He examined the IRTinformation provided by items, accordingto the IRT model used in scaling NAEPquestions. (“Information” is used here in atechnical sense. See the forthcomingNAEP 2001 Technical Report for details.)Following Bock, Huynh decomposed theitem information into that provided by a

A P P E N D I X A • G E O G R A P H Y R E P O R T C A R D 131
18 Bock, R. D. (1972). Estimating item parameters and latent ability when responses are scored in two or more latentcategories. Psychometrika, 37, 29–51.
19 Donoghue, J. R. (1997, March). Item mapping to a weighted composite scale. Paper presented at the annual meeting ofthe American Educational Research Association, Chicago, IL.
correct response [P(q) I(q)] and that pro-vided by an incorrect response [(1– P(q))I(q)].18 Huynh showed that the iteminformation provided by a correct responseto a constructed-response item is maxi-mized at the point along the geographyscale at which the probability of a correctresponse is 0.65 (for multiple-choice items,the information provided by a correctresponse is maximized at the point atwhich the probability of getting the itemcorrect is 0.74). It should be noted, how-ever, that maximizing the item informationI(q), rather than the information providedby a correct response [P(q) I(q)], wouldimply an item mapping criterion closer to50 percent.
Results are presented in terms of thecomposite geography scale. However, thegeography assessment was scaled separatelyfor the three themes in geography at grades4, 8, and 12. The composite scale is aweighted combination of the threesubscales for the three themes in geography.To obtain item map information, a proce-dure developed by Donoghue was used.19
This method models the relationshipbetween the item response function for thesubscale and the subscale structure toderive the relationship between the itemscore and the composite scale (i.e., an itemresponse function for the composite scale).This item response function is then used toderive the probability used in the mapping.
Weighting andVariance EstimationA multistage sampling design was used toselect the students who were assessed.The properties of a sample selectedthrough such a design could be verydifferent from those of a simple randomsample, in which every student in thetarget population has an equal chance ofselection and in which the observationsfrom different sampled students can beconsidered to be statistically independentof one another. Therefore, the propertiesof the sample for the data collection designwere taken into account during the analysisof the assessment data.
One way that the properties of thesample design were addressed was by usingsampling weights to account for the factthat the probabilities of selection were notidentical for all students. All populationand subpopulation characteristics based onthe assessment data were estimated usingsampling weights. These weights includedadjustments for school and studentnonresponse.
Not only must appropriate estimates ofpopulation characteristics be derived, butappropriate measures of the degree ofuncertainty must be obtained for thosestatistics. Two components of uncertaintyare accounted for in the variability ofstatistics based on student ability: 1) theuncertainty due to sampling only a rela-

132 A P P E N D I X A • G E O G R A P H Y R E P O R T C A R D
20 For further details, see Johnson, E. G. & Rust, K. F. (1992). Population inferences and variance estimation for NAEPdata. Journal of Educational Statistics, (17)2, 175–190.
tively small number of students, and 2) theuncertainty due to sampling only a portionof the cognitive domain of interest. Thefirst component accounts for the variabilityassociated with the estimated percentagesof students who had certain backgroundcharacteristics or who answered a certaincognitive question correctly.
Because NAEP uses multistage samplingprocedures, conventional formulas forestimating sampling variability that assumesimple random sampling are inappropriate.NAEP uses a jackknife replication proce-dure to estimate standard errors. Thejackknife standard error provides a reason-able measure of uncertainty for any studentinformation that can be observed withouterror. However, because each studenttypically responds to only a few questionswithin any theme of geography, the scalescore for any single student would beimprecise. In this case, plausible valuesmethodology can be used to describe theperformance of groups and subgroups ofstudents. Multiple plausible values (5) aredrawn for each student in order to estimatethe variance of the posterior scale scoredistribution. This component of variabilityis included in the standard errors of NAEPscale scores.20
Typically, when the standard error isbased on a small number of students orwhen the group of students is enrolled in asmall number of schools, the amount ofuncertainty associated with the estimationof standard errors may be quite large.
Estimates of standard errors subject to alarge degree of uncertainty are followed bythe “!” symbol to indicate that the natureof the sample does not allow accuratedetermination of the variability of thestatistic. In such cases, the standard errors—and any confidence intervals or significancetests involving these standard errors—should be interpreted cautiously. Addi-tional details concerning procedures foridentifying such standard errors are dis-cussed in the forthcoming NAEP 2001Technical Report.
Drawing Inferencesfrom the ResultsThe reported statistics are estimates and aretherefore subject to a measure of uncer-tainty. There are two sources of suchuncertainty. First, NAEP uses a sample ofstudents rather than testing all students.Second, all assessments have some amountof uncertainty related to the fact that theycannot ask all questions that might beasked in a content area. The magnitude ofthis uncertainty is reflected in the standarderror of each of the estimates. When thepercentages or average scale scores ofcertain groups are compared, the standarderror should be taken into account, andobserved similarities or differences shouldnot be relied on solely. Therefore, thecomparisons are based on statistical teststhat consider the standard errors of thosestatistics and the magnitude of the differ-ence among the averages or percentages.
A P P E N D I X A • G E O G R A P H Y R E P O R T C A R D 133
Using confidence intervals based on thestandard errors provides a way to take intoaccount the uncertainty associated withsample estimates and to make inferencesabout the population averages and percent-ages in a manner that reflects that uncer-tainty. An estimated sample average scalescore plus or minus 1.96 standard errorsapproximates a 95 percent confidenceinterval for the corresponding populationquantity. This statement means that onecan conclude with approximately a 95percent level of confidence that the averageperformance of the entire population ofinterest (e.g., all fourth-grade students inpublic and nonpublic schools) is withinplus or minus 1.96 standard errors of thesample average.
As an example, suppose that the averagegeography scale score of the students in aparticular group was 256 with a standarderror of 1.2. An approximate 95 percentconfidence interval for the populationquantity would be as follows:
Average � 1.96 standard errors256 � 1.96 � 1.2
256 � 2.35(253.65, 258.35)
Thus, one can conclude with a 95percent level of confidence that the averagescale score for the entire population ofstudents in that group is between 253.65and 258.35. It should be noted that thisexample, and the examples in the followingsections are illustrative. More preciseestimates carried out to one or moredecimal places are used in the actualanalyses.
Similar confidence intervals can beconstructed for percentages, if the percent-ages are not extremely large or extremelysmall. Extreme percentages should beinterpreted with caution. Adding orsubtracting the standard errors associatedwith extreme percentages could cause theconfidence interval to exceed 100 percentor go below 0 percent, resulting in num-bers that are not meaningful. The forth-coming NAEP 2001 Technical Report willcontain a more complete discussion ofextreme percentages.
Analyzing Group Differences inAverages and PercentagesStatistical tests determine whether theevidence, based on the data from thegroups in the sample, is strong enough toconclude that the averages or percentagesare actually different for those groups inthe population. If the evidence is strong(i.e., the difference is statistically signifi-cant), the report describes the groupaverages or percentages as being different(e.g., one group performed higher than orlower than another group), regardless ofwhether the sample averages or percentagesappear to be approximately the same.
The reader is cautioned to rely on theresults of the statistical tests rather than onthe apparent magnitude of the differencebetween sample averages or percentageswhen determining whether the sampledifferences are likely to represent actualdifferences among the groups in thepopulation.

134 A P P E N D I X A • G E O G R A P H Y R E P O R T C A R D
To determine whether a real differenceexists between the average scale scores (orpercentages of a certain attribute) for twogroups in the population, one needs toobtain an estimate of the degree of uncer-tainty associated with the differencebetween the averages (or percentages) ofthese groups for the sample. This estimateof the degree of uncertainty, called the“standard error of the difference” betweenthe groups, is obtained by taking the squareof each group’s standard error, summingthe squared standard errors, and taking thesquare root of that sum.
Standard Error of the Difference �
SEA-B
� √(SEA
2 � SEB
2)
Similar to how the standard error for anindividual group average or percentage isused, the standard error of the differencecan be used to help determine whetherdifferences among groups in the populationare real. The difference between theaverages or percentages of the two groupsplus or minus two standard errors of thedifference represents an approximate 95percent confidence interval. If the resultinginterval includes zero, there is insufficientevidence to claim a real difference betweenthe groups in the population. If the intervaldoes not contain zero, the differencebetween the groups is statistically signifi-cant (different) at the 0.05 level.
As an example of comparing groups,consider the problem of determiningwhether the average geography scale scoreof group A is higher than that of group B.Suppose that the sample estimates of the
average scale scores and standard errorswere as follows:
The difference between the estimates ofthe average scale scores of groups A and Bis two points (218 � 216). The standarderror of this difference is
√(0.92 � 1.12) � 1.4
Thus, an approximate 95 percent confi-dence interval for this difference is plus orminus two standard errors of the difference
2 � 1.96 � 1.42 � 2.74
(�0.74, 4.74)
The value zero is within the confidenceinterval; therefore, there is insufficientevidence to claim that group A outper-formed group B.
Conducting Multiple TestsThe procedures in the previous section andthe certainty ascribed to intervals (e.g., a 95percent confidence interval) are based onstatistical theory that assumes that only oneconfidence interval or test of statisticalsignificance is being performed. However,many different groups are being compared(i.e., multiple sets of confidence intervalsare being analyzed). In sets of confidenceintervals, statistical theory indicates that the
AverageGroup Scale Score Standard Error
A 218 0.9
B 216 1.1

A P P E N D I X A • G E O G R A P H Y R E P O R T C A R D 135
21 Miller, R. G. (1966). Simultaneous statistical inference. New York: Wiley.22 Benjamini, Y. & Hochberg, Y. (1995). Controlling the false discovery rate: A practical and powerful approach to
multiple testing. Journal of the Royal Statistical Society, Series B, No. 1., pp 289–300.23 Williams, V. S. L., Jones, L. V., & Tukey, J. W. (1999). Controlling error in multiple comparisons with examples from state-to-
state differences in educational achievement. Journal of Educational and Behavioral Statistics, 24(1), 42–69.
certainty associated with the entire set ofintervals is less than that attributable toeach individual comparison from the set.To hold the significance level for the set ofcomparisons at a particular level (e.g., 0.05),adjustments (called “multiple comparisonprocedures”21) must be made to the meth-ods described in the previous section. Onesuch procedure, the False Discovery Rate(FDR) procedure22 was used to control thecertainty level.
Unlike the other multiple comparisonprocedures (e.g., the Bonferroni procedure)that control the familywise error rate(i.e., the probability of making even onefalse rejection in the set of comparisons),the FDR procedure controls the expectedproportion of falsely rejected hypotheses.Furthermore, familywise procedures are
considered conservative for large families ofcomparisons.23 Therefore, the FDR proce-dure is more suitable for multiple compari-sons in NAEP than other procedures. Adetailed description of the FDR procedureappears in the forthcoming NAEP 2001Technical Report.
To illustrate how the FDR procedure isused, consider the comparisons of currentand previous years’ average geography scalescores for the five groups presented in tableA.8. Note that the difference in averagescale scores and the standard error of thedifference are calculated in a way compa-rable with that of the example in theprevious section. The test statistic shown isthe difference in average scale scoresdivided by the standard error of thedifference.
Example of FDR comparisons of average scale scores for different groups of students
Table A.8 FDR Comparisons of Average Scale Scores
Previous year Current year Previous year and current year
StandardAverage Standard Average Standard Difference error of Test Percent
scale score error scale score error in averages difference statistic confidence*
Group 1 224 1.3 226 1.0 2.08 1.62 1.29 20
Group 2 187 1.7 193 1.7 6.31 2.36 2.68 1
Group 3 191 2.6 197 1.7 6.63 3.08 2.15 4
Group 4 229 4.4 232 4.6 3.24 6.35 .51 62
Group 5 201 3.4 196 4.7 –5.51 5.81 –.95 35
* The percent confidence is 2(1–F(x)) where F(x) is the cumulative distribution of the t-distribution with the degrees of freedom adjusted to reflect thecomplexities of the sample design.

136 A P P E N D I X A • G E O G R A P H Y R E P O R T C A R D
24 The level of confidence times the number of comparisons minus one divided by the number of comparisons is0.05�(5�1)/5 � 0.04�100 � 4 percent.
The difference in average scale scoresand its standard error can be used to findan approximate 95 percent confidenceinterval as in the example in the previoussection or they can be used to identify aconfidence percentage. In the example inthe previous section, because an approxi-mate 95 percent confidence interval wasdesired, the number 1.96 was used tomultiply the standard error of the differ-ence to create the approximate confidenceinterval. In the current example, the confi-dence interval for the test statistics isidentified from statistical tables. Instead ofchecking to see if zero is within the 95percent confidence interval about themean, the significance level from thestatistical tables can be directly comparedto 100�95 � 5 percent.
If the comparison of average scale scoresacross two years were made for only one ofthe five groups, there would be a significantdifference between the average scale scoresfor the two years if the significance levelwere less than 5 percent. However, becausewe are interested in the difference inaverage scale scores across the two years forall five of the groups, comparing each ofthe significance levels to 5 percent is notadequate. Groups of students defined byshared characteristics, such as race/ethnicitygroups, are treated as sets or families whenmaking comparisons. However, compari-sons of average scale scores for each pair ofyears were treated separately. So the stepsdescribed in this example would be repli-cated for the comparison of other currentand previous year average scale scores.
To use the FDR procedure to take intoaccount that all comparisons are of interestto us, the percents of confidence in theexample are ordered from largest to small-est: 62, 35, 20, 4, and 1. In the FDR proce-dure, 62 percent confidence for the Group4 comparison would be compared to 5percent, 35 percent for the Group 5comparison would be compared to0.05�(5�1)/5 � 0.04�100 � 4 percent,24
20 percent for the Group 1 comparisonwould be compared to 0.05�(5�2)/5 �0.03�100 � 3 percent, 4 percent for theGroup 3 comparison would be comparedto 0.05�(5�3)/5 � 0.02�100 � 2 percent,and 1 percent for the Group 2 comparison(actually slightly smaller than 1 prior torounding) would be compared to0.05�(5�4)/5 � 0.01�100 � 1 percent.The last of these comparisons is the onlyone for which the percent confidence issmaller than the FDR procedure value.The difference in the current year andprevious years’ average scale scores for theGroup 2 students is significant; for all of theother groups, average scale scores forcurrent and previous year are not signifi-cantly different from one another. Inpractice, a very small number of counter-intuitive results occur when using the FDRprocedures to examine between-yeardifferences in subgroup results by jurisdic-tion. In those cases, results were not in-cluded in this report. NCES is continuingto evaluate the use of FDR and multiple-comparison procedures for future reporting.
A P P E N D I X A • G E O G R A P H Y R E P O R T C A R D 137
25 For the national assessment, a PSU is a selected geographic region (a county, group of counties, or metropolitanstatistical area). Further details about the procedure for determining minimum sample size appear in the NAEP 2000Technical Report and the forthcoming NAEP 2001 Technical Report.
NAEP Reporting GroupsResults are provided for groups of studentsdefined by shared characteristics—regionof the country, gender, race or ethnicity,school’s type of location, eligibility for thefree/reduced-price school lunch program,and type of school. Based on participationrate criteria, results are reported for sub-populations only when sufficient numbersof students and adequate school representa-tion are present. The minimum require-ment is at least 62 students in a particularsubgroup from at least five primary sam-pling units (PSUs).25 However, the data forall students, regardless of whether theirsubgroup was reported separately, wereincluded in computing overall results.
Definitions of the subpopulations arepresented below.
Region
Results in NAEP are reported for fourregions of the nation: Northeast, Southeast,Central, and West. Figure A.1 shows howstates are subdivided into these NAEPregions. All 50 states and the District ofColumbia are listed. Other jurisdictions,including territories and the two Depart-ment of Defense Educational Activitiesjurisdictions are not assigned to any region.
Gender
Results are reported separately for malesand females.
ConnecticutDelawareDistrict of ColumbiaMaineMarylandMassachusettsNew HampshireNew JerseyNew YorkPennsylvaniaRhode IslandVermont
* Virginia
AlabamaArkansasFloridaGeorgiaKentuckyLouisianaMississippiNorth CarolinaSouth CarolinaTennessee
*VirginiaWest Virginia
IllinoisIndianaIowaKansasMichiganMinnesotaMissouriNebraskaNorth DakotaOhioSouth DakotaWisconsin
AlaskaArizonaCaliforniaColoradoHawaiiIdahoMontanaNevadaNew MexicoOklahomaOregonTexasUtahWashingtonWyoming
* The part of Virginia that is included in the Northeast region is the Washington, DC metropolitan area; the remainder of the state is included in the Southeastregion.
Northeast Southeast Central West
Figure A.1
States byRegion
States included in the four NAEP regions: 2001

138 A P P E N D I X A • G E O G R A P H Y R E P O R T C A R D
Race/Ethnicity
The race/ethnicity variable is derived fromtwo questions asked of students and fromschool records, and it is used for race/ethnicity subgroup comparisons. Twoquestions from the set of general studentbackground questions were used to deter-mine race/ethnicity:
If you are Hispanic, what is your Hispanicbackground?❏ I am not Hispanic❏ Mexican, Mexican American, or Chicano❏ Puerto Rican❏ Cuban❏ Other Spanish or Hispanic background
Students who responded to this questionby filling in the second, third, fourth, orfifth oval were considered Hispanic. Forstudents who filled in the first oval, did notrespond to the question, or providedinformation that was illegible or could notbe classified, responses to the followingquestion were examined to determine theirrace/ethnicity.
Which best describes you?❏ White (not Hispanic)❏ Black (not Hispanic)❏ Hispanic (“Hispanic” means someone
who is Mexican, Mexican American,Chicano, Puerto Rican, Cuban, or otherSpanish or Hispanic background)
❏ Asian or Pacific Islander (“Asian orPacific Islander” means someone who isfrom a Chinese, Japanese, Korean,Filipino, Vietnamese, Asian American orsome other Asian or Pacific Islanderbackground.)
❏ American Indian or Alaskan Native(“American Indian or Alaskan Native”means someone who is from one of theAmerican Indian tribes or one of theoriginal people of Alaska.)
❏ Other (specify)
Students’ race/ethnicity was then assignedon the basis of their responses. For studentswho filled in the sixth oval (“Other”),provided illegible information or informa-tion that could not be classified, or did notrespond at all, race/ethnicity was assignedas determined by school records.
Race/ethnicity could not be determinedfor students who did not respond to eitherof the demographic questions and whoseschools did not provide information aboutrace/ethnicity.
Also, some students indicated that theywere from a Hispanic background(e.g., Puerto Rican or Cuban) and that aracial/ethnic category other than Hispanicbest described them. These students wereclassified as Hispanic based on the rulesdescribed above.
Type of Location
Results from the 2001 assessment arereported for students attending schools inthree mutually exclusive location types:central city, urban fringe/large town, andrural/small town:
Central City: This category includes centralcities of all Standard Metropolitan Statisti-cal Areas (SMSA) as defined by the Officeof Management and Budget. Central Cityis a geographical term and is not synony-mous with “inner city.”
Urban Fringe/Large Town: The urban fringecategory includes all densely settled placesand areas within SMSA’s that are classifiedas urban by the Bureau of the Census, butwhich do not qualify as Central City. ALarge Town is defined as a place outside aSMSA with a population greater than orequal to 25,000.

A P P E N D I X A • G E O G R A P H Y R E P O R T C A R D 139
Rural/Small Town: Rural includes all placesand areas with populations of less than2,500 that are classified as rural by theBureau of the Census. A Small Town isdefined as a place outside a SMSA with apopulation of less than 25,000, but greaterthan or equal to 2,500.
Results for each type of location are notcompared across years. This was due tonew methods used by NCES to identifythe type of location assigned to each schoolin the Common Core of Data (CCD).The new methods were put into place byNCES in order to improve the quality ofthe assignments and they take into accountmore information about the exact physicallocation of the school. The variable wasrevised in NAEP beginning with the 2000assessments.
Eligibility for the Free/Reduced-PriceSchool Lunch Program
Based on available school records, studentswere classified as either currently eligiblefor the free/reduced-price school lunchcomponent of the Department of Agri-culture’s National School Lunch Programor not eligible. Eligibility for the programis determined by students’ family incomein relation to the federally establishedpoverty level. Free lunch qualification is setat 130 percent of the poverty level, andreduced-price lunch qualification is set at170 percent of the poverty level. Theclassification applies only to the school yearwhen the assessment was administered(i.e., the 2000–2001 school year) and is not
based on eligibility in previous years. Ifschool records were not available, thestudent was classified as “Information notavailable.” If the school did not participatein the program, all students in that schoolwere classified as “Information notavailable.”
Type of School
Results are reported by the type of schoolthat the student attends—public or non-public. Nonpublic schools include Catholicand other private schools.26 Because theyare funded by federal authorities, not state/local governments, Bureau of Indian Affairs(BIA) schools and Department of DefenseDomestic Dependent Elementary andSecondary Schools (DDESS) are notincluded in either the public or nonpubliccategories; they are included in the overallnational results.
Grade 12 Participation RatesNAEP has been described as a “low-stakes”assessment. That is, students receive noindividual scores, and their NAEP perfor-mance has no effect on their grades, pro-motions, or graduation. There has beencontinued concern that this lack of conse-quences affects participation rates of stu-dents and schools, as well as the motivationof students to perform well on NAEP. Ofparticular concern has been the perfor-mance of twelfth-graders, who typicallyhave lower student participation rates thanfourth- and eighth-graders, and who aremore likely to omit responses compared tothe younger cohorts.
26 Through a pilot study, more detailed breakdowns of nonpublic school results are available on the NAEP Web Site(http://nces.ed.gov/nationsreportcard/geography/results/index.asp).

140 A P P E N D I X A • G E O G R A P H Y R E P O R T C A R D
In NAEP, there has been a consistentpattern of lower participation rates forolder students. In the 2001 NAEP assess-ments, for example, the student partici-pation rates were 95 percent and 93 per-cent at grades 4 and 8, respectively. Atgrade 12, however, the participation ratewas 77 percent. School participation rates(the percentage of sampled schools thatparticipated in the assessment) have alsotypically decreased with grade level. Againciting the 2001 assessments, the schoolparticipation rate was 88 percent for thefourth grade, 87 percent for the eighthgrade, and 80 percent for the twelfth grade.
The effect of participation rates onstudent performance, however, is unclear.Students may choose not to participate inNAEP for many reasons, such as desire toattend regular classes so as not to missimportant instruction or conflict withother school-based activities. Similarly,there are a variety of reasons for whichvarious schools do not participate. Thesampling weights and nonresponse adjust-ments, described earlier in this document,provide an approximate statistical adjust-ment for nonparticipation. However, theeffect of some school and student non-participation may have some undeterminedeffect on results.
More research is needed to delineate thefactors that contribute to nonparticipationand lack of motivation. To that end, NCESis currently investigating how varioustypes of incentives can be effectively usedto increase participation in NAEP. Onereport that examines the impact of mon-etary incentives on student effort andperformance is available on the NCES WebSite at http://nces.ed.gov/pubsearch/.Enter NCES#: 2001024.
Cautions in InterpretationsAs described earlier, the NAEP geographyscale makes it possible to examine relation-ships between students’ performance andvarious background factors measured byNAEP. However, a relationship that existsbetween achievement and another variabledoes not reveal its underlying cause, whichmay be influenced by a number of othervariables. Similarly, the assessments do notcapture the influence of unmeasuredvariables. The results are most useful whenthey are considered in combination withother knowledge about the student popu-lation and the educational system, such astrends in instruction, changes in theschool-age population, and societaldemands and expectations.

A P P E N D I X B • G E O G R A P H Y R E P O R T C A R D 141
Appendix BData Appendix
This appendix contains complete data for all the tables and
figures presented in this report, including average scores,
achievement-level results, and percentages of students. In
addition, standard errors appear in parentheses next to each
scale score and percentage. The comparisons presented in
this report are based on statistical tests that consider the
magnitude of the difference between group averages
or percentages and the standard errors of those
statistics. Because NAEP scores and percentages are
based on samples rather than the entire population(s),
the results are subject to a measure of uncertainty
reflected in the standard errors of the estimates. It can
be said with 95 percent certainty that for each
population of interest, the value for the whole
population is within plus or minus two standard
errors of the estimate for the sample. As with the
figures and tables in the chapters, significant
differences between results of previous assessments
and the 2001 assessment are highlighted.
BAppendixContents
Average Scores
Achievement-Level Results
Percentages ofStudents
Standard Errors
Complete datafor all tablesand figures.
AppendixFocus

142 A P P E N D I X B • G E O G R A P H Y R E P O R T C A R D
Average geography scale scores, grades 4, 8, and 12: 1994 and 2001
Grade 4 Grade 8 Grade 12
1994 206 (1.2) 260 (0.7) 285 (0.7)
2001 209 (1.0) * 262 (0.9) * 285 (0.8)
Standard errors of the estimated scale scores appear in parentheses.* Significantly different from 1994.SOURCE: U.S. Department of Education, Office of Educational Research and Improvement, National Center for Education Statistics, National Assessment ofEducational Progress (NAEP), 1994 and 2001 Geography Assessments.
Table B.1: Data for Figure 2.1 National Scale Score Results
National geography scale score percentiles, grades 4, 8, and 12: 1994 and 2001
Table B.2: Data for Figure 2.2: National Performance Distribution
10th 25th 50th 75th 90th
Grade 4 1994 146 (1.9) 179 (1.5) 211 (1.1) 237 (1.3) 257 (2.0)
2001 158 (1.7) * 185 (1.9) * 212 (1.1) 236 (1.0) 254 (0.9)
Grade 8 1994 213 (1.3) 237 (1.0) 263 (1.1) 285 (0.9) 302 (1.9)
2001 217 (1.0) * 241 (0.9) * 265 (1.1) 286 (0.9) 303 (1.2)
Grade 12 1994 244 (0.9) 265 (1.1) 287 (0.9) 306 (1.0) 321 (1.0)
2001 247 (1.7) 267 (1.2) 287 (0.9) 305 (0.9) 319 (1.0)
Standard errors of the estimated scale scores appear in parentheses.* Significantly different from 1994.SOURCE: U.S. Department of Education, Office of Educational Research and Improvement, National Center for Education Statistics, National Assessment ofEducational Progress (NAEP), 1994 and 2001 Geography Assessments.

A P P E N D I X B • G E O G R A P H Y R E P O R T C A R D 143
Table B.3: Data for Figure 2.3: National Achievement-Level Results
Percentage of students within and at or above geography achievement levels, grades 4, 8, and 12:1994 and 2001
At or above At or above
Below Basic At Basic At Proficient At Advanced Basic Proficient
Grade 4 1994 30 (1.1) 48 (1.0) 19 (1.1) 3 (0.4) 70 (1.1) 22 (1.2)
2001 26 (1.2) * 53 (1.4) * 19 (1.1) 2 (0.3) 74 (1.2) * 21 (1.0)
Grade 8 1994 29 (1.0) 43 (1.1) 24 (0.9) 4 (0.4) 71 (1.0) 28 (1.0)
2001 26 (0.9) * 44 (0.9) 26 (1.1) 4 (0.6) 74 (0.9) * 30 (1.2)
Grade 12 1994 30 (0.9) 43 (1.0) 25 (1.0) 2 (0.5) 70 (0.9) 27 (1.2)
2001 29 (0.9) 47 (0.9) * 23 (1.0) 1 (0.3) 71 (0.9) 25 (1.1)
Standard errors of the estimated percentages appear in parentheses.* Significantly different from 1994.NOTE: Percentages within each geography achievement-level range may not add to 100, or to the exact percentages at or above achievement levels, due to rounding.SOURCE: U.S. Department of Education, Office of Educational Research and Improvement, National Center for Education Statistics, National Assessment ofEducational Progress (NAEP), 1994 and 2001 Geography Assessments.

144 A P P E N D I X B • G E O G R A P H Y R E P O R T C A R D
Table B.5: Data for Figure 3.2 National Scale Score Differences by Gender
Differences in average geography scale scores by gender, grades 4, 8, and 12: 1994 and 2001
Standard errors of the estimated difference in scale scores appear in parentheses.Score differences are calculated based on differences between unrounded average scale scores.SOURCE: U.S. Department of Education, Office of Educational Research and Improvement, National Center for Education Statistics, National Assessment ofEducational Progress (NAEP), 1994 and 2001 Geography Assessments.
Male-Female
Grade 4 1994 5 (2.0)
2001 5 (1.7)
Grade 8 1994 4 (1.2)
2001 4 (1.4)
Grade 12 1994 7 (1.2)
2001 4 (1.2)
Table B.4: Data for Figure 3.1 National Scale Score Results by Gender
Percentage of students and average geography scale scores by gender, grades 4, 8, and 12:1994 and 2001
Male Female
Grade 4 1994 51 (1.0) 49 (1.0)208 (1.4) 203 (1.4)
2001 51 (0.8) 49 (0.8)212 (1.1) 207 (1.2)
Grade 8 1994 51 (0.7) 49 (0.7)262 (0.9) 258 (0.8)
2001 51 (0.6) 49 (0.6)264 (1.0) 260 (1.1)
Grade 12 1994 50 (1.0) 50 (1.0)288 (0.8) 281 (0.9)
2001 48 (0.8) 52 (0.8)287 (0.9) 282 (0.8)
The percentage of students is listed first with the corresponding average scale score presented below.Standard errors of the estimated percentages and scale scores appear in parentheses.NOTE: Percentages may not add to 100 due to rounding.SOURCE: U.S. Department of Education, Office of Educational Research and Improvement, National Center for Education Statistics, National Assessment ofEducational Progress (NAEP), 1994 and 2001 Geography Assessments.
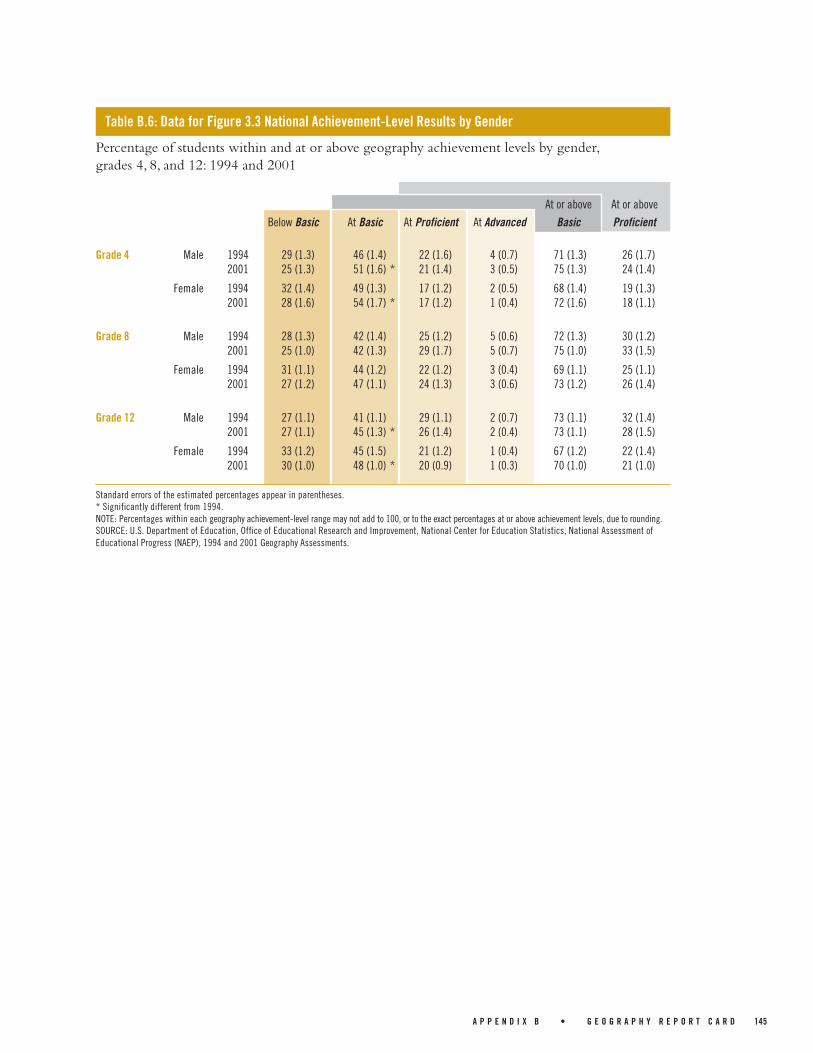
A P P E N D I X B • G E O G R A P H Y R E P O R T C A R D 145
Table B.6: Data for Figure 3.3 National Achievement-Level Results by Gender
Percentage of students within and at or above geography achievement levels by gender,grades 4, 8, and 12: 1994 and 2001
At or above At or above
Below Basic At Basic At Proficient At Advanced Basic Proficient
Grade 4 Male 1994 29 (1.3) 46 (1.4) 22 (1.6) 4 (0.7) 71 (1.3) 26 (1.7)2001 25 (1.3) 51 (1.6) * 21 (1.4) 3 (0.5) 75 (1.3) 24 (1.4)
Female 1994 32 (1.4) 49 (1.3) 17 (1.2) 2 (0.5) 68 (1.4) 19 (1.3)2001 28 (1.6) 54 (1.7) * 17 (1.2) 1 (0.4) 72 (1.6) 18 (1.1)
Grade 8 Male 1994 28 (1.3) 42 (1.4) 25 (1.2) 5 (0.6) 72 (1.3) 30 (1.2)2001 25 (1.0) 42 (1.3) 29 (1.7) 5 (0.7) 75 (1.0) 33 (1.5)
Female 1994 31 (1.1) 44 (1.2) 22 (1.2) 3 (0.4) 69 (1.1) 25 (1.1)2001 27 (1.2) 47 (1.1) 24 (1.3) 3 (0.6) 73 (1.2) 26 (1.4)
Grade 12 Male 1994 27 (1.1) 41 (1.1) 29 (1.1) 2 (0.7) 73 (1.1) 32 (1.4)2001 27 (1.1) 45 (1.3) * 26 (1.4) 2 (0.4) 73 (1.1) 28 (1.5)
Female 1994 33 (1.2) 45 (1.5) 21 (1.2) 1 (0.4) 67 (1.2) 22 (1.4)2001 30 (1.0) 48 (1.0) * 20 (0.9) 1 (0.3) 70 (1.0) 21 (1.0)
Standard errors of the estimated percentages appear in parentheses.* Significantly different from 1994.NOTE: Percentages within each geography achievement-level range may not add to 100, or to the exact percentages at or above achievement levels, due to rounding.SOURCE: U.S. Department of Education, Office of Educational Research and Improvement, National Center for Education Statistics, National Assessment ofEducational Progress (NAEP), 1994 and 2001 Geography Assessments.

146 A P P E N D I X B • G E O G R A P H Y R E P O R T C A R D
Table B.8: Data for Figure 3.5 National Scale Score Differences by Race/Ethnicity
Differences in average geography scale scores by race/ethnicity, grades 4, 8, and 12: 1994 and 2001
White-Black White-Hispanic
Grade 4 1994 50 (2.9) 35 (2.9)
2001 40 (2.0) * 38 (3.0)
Grade 8 1994 40 (1.9) 31 (2.0)
2001 38 (2.0) 33 (2.0)
Grade 12 1994 33 (1.6) 23 (1.7)
2001 32 (1.7) 21 (1.8)
Standard errors of the estimated difference in scale scores appear in parentheses.*Significantly different from 1994.Score differences are calculated based on differences between unrounded average scale scores.SOURCE: U.S. Department of Education, Office of Educational Research and Improvement, National Center for Education Statistics, National Assessment ofEducational Progress (NAEP), 1994 and 2001 Geography Assessments.
Table B.7: Data for Figure 3.4 National Scale Score Results by Race/Ethnicity
Percentage of students and average geography scale scores by race/ethnicity, grades 4, 8, and 12:1994 and 2001
Asian/ AmericanWhite Black Hispanic Pacific Islander Indian
Grade 4 1994 69 (0.2) 15 (0.1) 12 (0.2) 3 (0.2) 1 (0.2)218 (1.5) 168 (2.5) 183 (2.5) 214 (3.8) 193 (3.6)
2001 64 (0.3) 14 (0.2) 16 (0.3) 3 (0.2) 2 (0.2)222 (1.0) 181 (1.8) * 184 (2.8) 212 (2.7) 199 (3.6)
Grade 8 1994 69 (0.2) 15 (0.1) 11 (0.1) 3 (0.4) 2 (0.4)270 (0.8) 229 (1.7) 239 (1.9) 264 (5.2) 248 (3.4) !
2001 66 (0.3) 14 (0.2) 14 (0.2) 4 (0.2) 1 (0.2)273 (1.0) 234 (1.7) 240 (1.7) 266 (2.5) 261 (5.8)
Grade 12 1994 74 (0.3) 12 (0.4) 8 (0.2) 4 (0.2) 1 (0.2)291 (0.8) 258 (1.4) 268 (1.5) 285 (2.7) *** (***)
2001 70 (0.3) 13 (0.3) 12 (0.2) 5 (0.2) 1 (0.2)291 (0.9) 260 (1.4) 270 (1.5) 286 (2.9) 288 (3.6) !
The percentage of students is listed first with the corresponding average scale score presented below.Standard errors of the estimated percentages and scale scores appear in parentheses.* Significantly different from 1994.! The nature of the sample does not allow accurate determination of the variability of the statistic.***(***) Sample size is insufficient to permit a reliable estimate.NOTE: Percentages may not add to 100 due to rounding.SOURCE: U.S. Department of Education, Office of Educational Research and Improvement, National Center for Education Statistics, National Assessment ofEducational Progress (NAEP), 1994 and 2001 Geography Assessments.
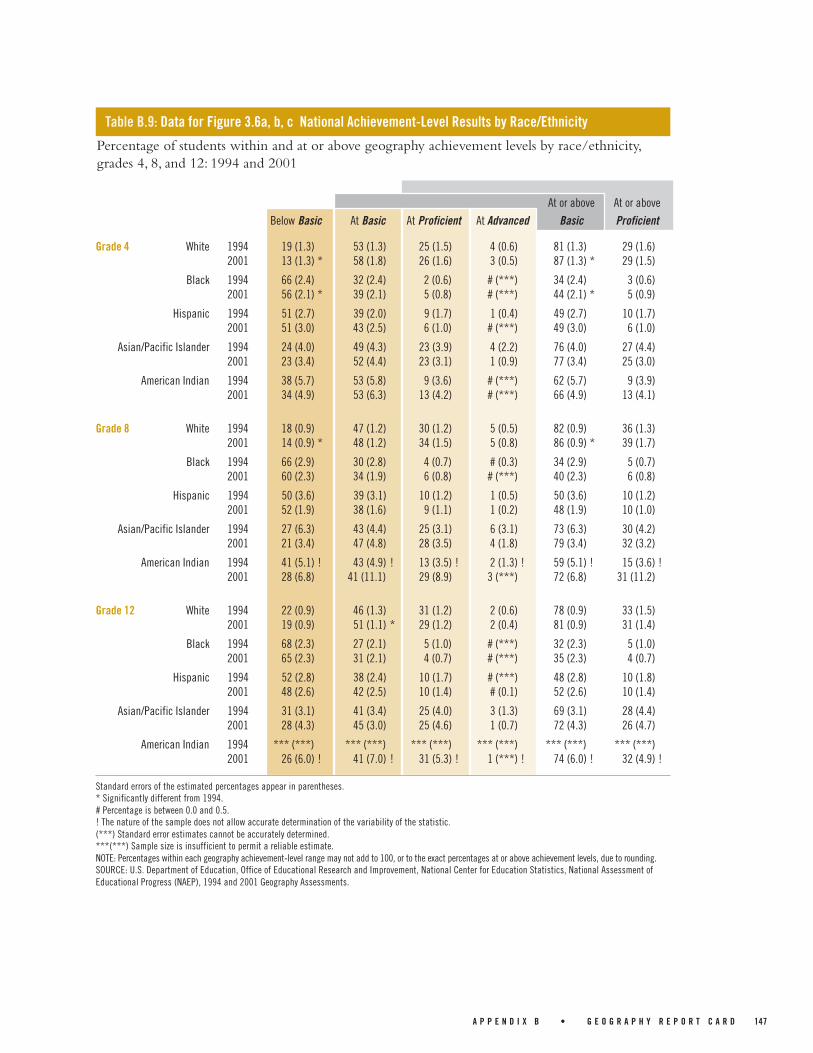
A P P E N D I X B • G E O G R A P H Y R E P O R T C A R D 147
At or above At or above
Below Basic At Basic At Proficient At Advanced Basic Proficient
Table B.9: Data for Figure 3.6a, b, c National Achievement-Level Results by Race/Ethnicity
Percentage of students within and at or above geography achievement levels by race/ethnicity,grades 4, 8, and 12: 1994 and 2001
Grade 4 White 1994 19 (1.3) 53 (1.3) 25 (1.5) 4 (0.6) 81 (1.3) 29 (1.6)2001 13 (1.3) * 58 (1.8) 26 (1.6) 3 (0.5) 87 (1.3) * 29 (1.5)
Black 1994 66 (2.4) 32 (2.4) 2 (0.6) # (***) 34 (2.4) 3 (0.6)2001 56 (2.1) * 39 (2.1) 5 (0.8) # (***) 44 (2.1) * 5 (0.9)
Hispanic 1994 51 (2.7) 39 (2.0) 9 (1.7) 1 (0.4) 49 (2.7) 10 (1.7)2001 51 (3.0) 43 (2.5) 6 (1.0) # (***) 49 (3.0) 6 (1.0)
Asian/Pacific Islander 1994 24 (4.0) 49 (4.3) 23 (3.9) 4 (2.2) 76 (4.0) 27 (4.4)2001 23 (3.4) 52 (4.4) 23 (3.1) 1 (0.9) 77 (3.4) 25 (3.0)
American Indian 1994 38 (5.7) 53 (5.8) 9 (3.6) # (***) 62 (5.7) 9 (3.9)2001 34 (4.9) 53 (6.3) 13 (4.2) # (***) 66 (4.9) 13 (4.1)
Grade 8 White 1994 18 (0.9) 47 (1.2) 30 (1.2) 5 (0.5) 82 (0.9) 36 (1.3)2001 14 (0.9) * 48 (1.2) 34 (1.5) 5 (0.8) 86 (0.9) * 39 (1.7)
Black 1994 66 (2.9) 30 (2.8) 4 (0.7) # (0.3) 34 (2.9) 5 (0.7)2001 60 (2.3) 34 (1.9) 6 (0.8) # (***) 40 (2.3) 6 (0.8)
Hispanic 1994 50 (3.6) 39 (3.1) 10 (1.2) 1 (0.5) 50 (3.6) 10 (1.2)2001 52 (1.9) 38 (1.6) 9 (1.1) 1 (0.2) 48 (1.9) 10 (1.0)
Asian/Pacific Islander 1994 27 (6.3) 43 (4.4) 25 (3.1) 6 (3.1) 73 (6.3) 30 (4.2)2001 21 (3.4) 47 (4.8) 28 (3.5) 4 (1.8) 79 (3.4) 32 (3.2)
American Indian 1994 41 (5.1) ! 43 (4.9) ! 13 (3.5) ! 2 (1.3) ! 59 (5.1) ! 15 (3.6) !2001 28 (6.8) 41 (11.1) 29 (8.9) 3 (***) 72 (6.8) 31 (11.2)
Grade 12 White 1994 22 (0.9) 46 (1.3) 31 (1.2) 2 (0.6) 78 (0.9) 33 (1.5)2001 19 (0.9) 51 (1.1) * 29 (1.2) 2 (0.4) 81 (0.9) 31 (1.4)
Black 1994 68 (2.3) 27 (2.1) 5 (1.0) # (***) 32 (2.3) 5 (1.0)2001 65 (2.3) 31 (2.1) 4 (0.7) # (***) 35 (2.3) 4 (0.7)
Hispanic 1994 52 (2.8) 38 (2.4) 10 (1.7) # (***) 48 (2.8) 10 (1.8)2001 48 (2.6) 42 (2.5) 10 (1.4) # (0.1) 52 (2.6) 10 (1.4)
Asian/Pacific Islander 1994 31 (3.1) 41 (3.4) 25 (4.0) 3 (1.3) 69 (3.1) 28 (4.4)2001 28 (4.3) 45 (3.0) 25 (4.6) 1 (0.7) 72 (4.3) 26 (4.7)
American Indian 1994 *** (***) *** (***) *** (***) *** (***) *** (***) *** (***)2001 26 (6.0) ! 41 (7.0) ! 31 (5.3) ! 1 (***) ! 74 (6.0) ! 32 (4.9) !
Standard errors of the estimated percentages appear in parentheses.* Significantly different from 1994.# Percentage is between 0.0 and 0.5.! The nature of the sample does not allow accurate determination of the variability of the statistic.(***) Standard error estimates cannot be accurately determined.***(***) Sample size is insufficient to permit a reliable estimate.NOTE: Percentages within each geography achievement-level range may not add to 100, or to the exact percentages at or above achievement levels, due to rounding.SOURCE: U.S. Department of Education, Office of Educational Research and Improvement, National Center for Education Statistics, National Assessment ofEducational Progress (NAEP), 1994 and 2001 Geography Assessments.

148 A P P E N D I X B • G E O G R A P H Y R E P O R T C A R D
Table B.10: Data for Figure 3.7 National Scale Score Results by Region of the Country
Percentage of students and average geography scale scores by region of the country,grades 4, 8, and 12: 1994 and 2001
Northeast Southeast Central West
Grade 4 1994 22 (0.8) 23 (1.0) 25 (0.8) 30 (0.7)203 (2.7) 200 (2.5) 215 (3.2) 205 (1.7)
2001 21 (0.8) 24 (1.3) 24 (0.4) 31 (1.3)214 (2.8) * 207 (2.1) 219 (1.8) 200 (2.5)
Grade 8 1994 20 (0.8) 25 (1.0) 24 (0.6) 31 (0.7)266 (1.9) 252 (1.6) 268 (1.6) 255 (1.8)
2001 21 (0.8) 22 (1.0) 25 (0.6) 32 (1.2)266 (2.4) 260 (2.0) * 270 (2.5) 255 (1.5)
Grade 12 1994 21 (0.5) 23 (0.8) 28 (0.7) 29 (0.7)284 (1.6) 278 (1.1) 289 (1.8) 286 (1.9)
2001 20 (0.9) 21 (1.2) 27 (0.6) 31 (1.4)286 (2.8) 281 (1.0) 287 (1.3) 283 (1.3)
The percentage of students is listed first with the corresponding average scale score presented below.Standard errors of the estimated percentages and scale scores appear in parentheses.* Significantly different from 1994.NOTE: Percentages may not add to 100 due to rounding.SOURCE: U.S. Department of Education, Office of Educational Research and Improvement, National Center for Education Statistics, National Assessment ofEducational Progress (NAEP), 1994 and 2001 Geography Assessments.

A P P E N D I X B • G E O G R A P H Y R E P O R T C A R D 149
At or above At or above
Below Basic At Basic At Proficient At Advanced Basic Proficient
Table B.11: Data for Figure 3.8a, b, c National Achievement-Level Results by Region of the Country
Percentage of students within and at or above geography achievement levels by region of thecountry, grades 4, 8, and 12: 1994 and 2001
Grade 4 Northeast 1994 33 (2.7) 45 (2.5) 19 (2.1) 3 (0.8) 67 (2.7) 22 (2.5)2001 22 (3.7) 54 (3.7) 22 (2.1) 3 (0.9) 78 (3.7) 24 (2.2)
Southeast 1994 36 (2.6) 48 (2.2) 14 (1.9) 2 (0.5) 64 (2.6) 17 (2.0)2001 28 (2.5) 54 (2.7) 17 (1.8) 1 (0.6) 72 (2.5) 18 (1.9)
Central 1994 22 (2.6) 49 (2.3) 25 (3.2) 4 (1.3) 78 (2.6) 28 (3.3)2001 18 (1.7) 51 (1.8) 27 (2.3) 3 (0.7) 82 (1.7) 30 (2.5)
West 1994 30 (1.7) 48 (1.9) 19 (2.0) 3 (0.6) 70 (1.7) 21 (1.7)2001 34 (2.7) 52 (2.4) 13 (1.5) 1 (0.3) 66 (2.7) 14 (1.7) *
Grade 8 Northeast 1994 24 (2.2) 43 (1.6) 28 (1.8) 6 (1.0) 76 (2.2) 33 (2.0)2001 22 (2.5) 44 (2.1) 29 (3.2) 4 (1.3) 78 (2.5) 34 (3.3)
Southeast 1994 38 (2.1) 40 (1.8) 19 (1.4) 3 (0.5) 62 (2.1) 21 (1.6)2001 27 (2.4) * 46 (1.7) 24 (1.5) 3 (0.6) 73 (2.4) * 26 (1.6)
Central 1994 20 (1.7) 44 (1.9) 30 (1.9) 6 (0.9) 80 (1.7) 36 (2.1)2001 18 (2.3) 43 (2.4) 32 (3.1) 6 (1.3) 82 (2.3) 38 (3.7)
West 1994 33 (2.4) 45 (1.8) 20 (1.8) 3 (0.7) 67 (2.4) 23 (2.0)2001 34 (1.7) 44 (1.7) 21 (1.6) 2 (0.6) 66 (1.7) 23 (1.7)
Grade 12 Northeast 1994 31 (2.3) 44 (2.1) 23 (1.8) 2 (0.6) 69 (2.3) 25 (2.1)2001 29 (2.3) 46 (2.4) 24 (3.2) 2 (1.1) 71 (2.3) 26 (4.1)
Southeast 1994 40 (1.5) 41 (1.5) 19 (1.4) 1 (0.6) 60 (1.5) 20 (1.3)2001 33 (1.6) * 46 (1.4) 20 (1.2) 1 (0.3) 67 (1.6) * 21 (1.3)
Central 1994 25 (2.1) 43 (2.3) 30 (2.2) 2 (1.0) 75 (2.1) 32 (2.9)2001 24 (1.8) 48 (1.8) 27 (1.8) 1 (0.5) 76 (1.8) 28 (1.9)
West 1994 28 (2.1) 43 (1.6) 27 (2.3) 2 (0.7) 72 (2.1) 29 (2.6)2001 30 (1.9) 47 (1.7) 22 (1.7) 1 (0.4) 70 (1.9) 23 (1.8)
Standard errors of the estimated percentages appear in parentheses.* Significantly different from 1994.NOTE: Percentages within each geography achievement-level range may not add to 100, or to the exact percentages at or above achievement levels, due to rounding.SOURCE: U.S. Department of Education, Office of Educational Research and Improvement, National Center for Education Statistics, National Assessment ofEducational Progress (NAEP), 1994 and 2001 Geography Assessments.

150 A P P E N D I X B • G E O G R A P H Y R E P O R T C A R D
Table B.12: Data for Figure 3.9 National Scale Score Results by Parents’ Education
Percentage of students and average geography scale scores by parents’ highest level of education,grades 8 and 12: 1994 and 2001
Some educationLess than Graduated after Graduated
high school high school high school college Unknown
Grade 8 1994 7 (0.5) 22 (0.9) 19 (0.7) 42 (1.2) 10 (0.5)238 (1.7) 250 (1.2) 265 (1.0) 272 (1.0) 234 (1.5)
2001 6 (0.4) 18 (0.5) 19 (0.6) 48 (1.2) 9 (0.6)241 (1.7) 253 (1.2) 266 (1.0) 274 (0.9) 245 (1.5) *
Grade 12 1994 7 (0.4) 22 (0.8) 25 (0.7) 44 (1.2) 3 (0.2)263 (1.2) 274 (1.1) 286 (1.0) 294 (0.9) 257 (2.8)
2001 7 (0.4) 19 (0.7) 25 (0.7) 46 (1.1) 3 (0.3)269 (1.7) * 276 (0.9) 284 (0.9) 293 (1.1) 257 (2.9)
The percentage of students is listed first with the corresponding average scale score presented below.Standard errors of the estimated percentages and scale scores appear in parentheses.* Significantly different from 1994.NOTE: Percentages may not add to 100 due to rounding.SOURCE: U.S. Department of Education, Office of Educational Research and Improvement, National Center for Education Statistics, National Assessment ofEducational Progress (NAEP), 1994 and 2001 Geography Assessments.

A P P E N D I X B • G E O G R A P H Y R E P O R T C A R D 151
Table B.13: Data for Figure 3.10a, b National Achievement-Level Results by Parents’ Education
Percentage of students within and at or above geography achievement levels by parents’ highestlevel of education, grades 8 and 12: 1994 and 2001
At or above At or above
Below Basic At Basic At Proficient At Advanced Basic Proficient
Standard errors of the estimated percentages appear in parentheses.* Significantly different from 1994.# Percentage is between 0.0 and 0.5.(***) Standard error estimates cannot be accurately determined.NOTE: Percentages within each geography achievement-level range may not add to 100, or to the exact percentages at or above achievement levels, due to rounding.SOURCE: U.S. Department of Education, Office of Educational Research and Improvement, National Center for Education Statistics, National Assessment ofEducational Progress (NAEP), 1994 and 2001 Geography Assessments.
Grade 8Less than high school 1994 53 (3.4) 39 (3.4) 8 (1.4) 1 (***) 47 (3.4) 8 (1.6)
2001 52 (2.6) 41 (3.6) 8 (2.6) # (***) 48 (2.6) 8 (2.6)
Graduated high school 1994 38 (2.0) 47 (2.1) 14 (1.6) 1 (0.6) 62 (2.0) 15 (1.5)2001 34 (2.1) 48 (1.5) 16 (2.1) 1 (0.6) 66 (2.1) 18 (1.9)
Some education after high school 1994 21 (1.3) 50 (2.7) 26 (2.5) 3 (0.8) 79 (1.3) 29 (2.3)2001 20 (1.6) 51 (1.8) 27 (1.7) 2 (0.8) 80 (1.6) 30 (1.8)
Graduated College 1994 18 (1.2) 41 (1.4) 34 (1.3) 7 (0.7) 82 (1.2) 41 (1.4)2001 14 (0.9) 42 (1.5) 37 (1.3) 6 (0.9) 86 (0.9) 43 (1.5)
Unknown 1994 56 (2.9) 35 (3.2) 8 (1.6) 1 (***) 44 (2.9) 8 (1.5)2001 44 (2.6) * 44 (3.1) 11 (1.9) 1 (0.5) 56 (2.6) * 12 (1.9)
Grade 12Less than high school 1994 59 (2.9) 34 (3.5) 7 (2.0) 0 (***) 41 (2.9) 7 (2.0)
2001 52 (3.5) 38 (3.2) 10 (1.5) # (***) 48 (3.5) 10 (1.5)
Graduated high school 1994 44 (2.0) 42 (2.5) 13 (1.6) # (0.3) 56 (2.0) 14 (1.6)2001 38 (2.0) 50 (1.8) * 12 (1.6) # (***) 62 (2.0) 12 (1.6)
Some education after high school 1994 25 (1.5) 51 (1.7) 23 (1.4) 1 (***) 75 (1.5) 24 (1.8)2001 27 (1.2) 52 (1.7) 20 (1.6) 1 (0.3) 73 (1.2) 21 (1.7)
Graduated College 1994 19 (1.1) 41 (1.3) 37 (1.5) 3 (0.8) 81 (1.1) 40 (1.6)2001 18 (1.1) 46 (1.4) * 34 (1.5) 3 (0.6) 82 (1.1) 36 (1.8)
Unknown 1994 64 (4.4) 29 (4.1) 7 (1.6) 0 (***) 36 (4.4) 7 (1.6)2001 67 (4.2) 28 (4.3) 5 (2.0) 0 (***) 33 (4.2) 5 (2.0)

152 A P P E N D I X B • G E O G R A P H Y R E P O R T C A R D
Table B.14: Data for Figure 3.11 National Scale Score Results by Type of School
Percentage of students and average geography scale scores by type of school, grades 4, 8, and 12:1994 and 2001
Public Nonpublic Nonpublic: Catholic Nonpublic: Other
Grade 4 1994 90 (0.8) 10 (0.8) 6 (0.7) 4 (0.5)204 (1.4) 221 (2.2) 222 (2.6) 220 (3.8)
2001 89 (1.2) 11 (1.2) 6 (0.8) 5 (0.9)207 (1.1) 226 (2.2) 230 (1.7) 221 (4.4)
Grade 8 1994 90 (0.8) 10 (0.8) 6 (0.6) 4 (0.6)258 (0.8) 276 (1.3) 276 (1.6) 276 (2.6)
2001 90 (0.9) 10 (0.9) 5 (0.6) 5 (0.7)261 (1.0) * 274 (2.5) 277 (2.0) 271 (4.7)
Grade 12 1994 89 (1.0) 11 (1.0) 6 (0.9) 4 (0.6)283 (0.8) 294 (1.6) 291 (3.0) 298 (2.0)
2001 92 (0.8) 8 (0.8) 4 (0.6) 3 (0.6)284 (0.8) 291 (2.3) 294 (2.0) 287 (4.3)
The percentage of students is listed first with the corresponding average scale score presented below.Standard errors of the estimated percentages and scale scores appear in parentheses.* Significantly different from 1994.NOTE: Percentages may not add to 100 due to rounding.SOURCE: U.S. Department of Education, Office of Educational Research and Improvement, National Center for Education Statistics, National Assessment ofEducational Progress (NAEP), 1994 and 2001 Geography Assessments.
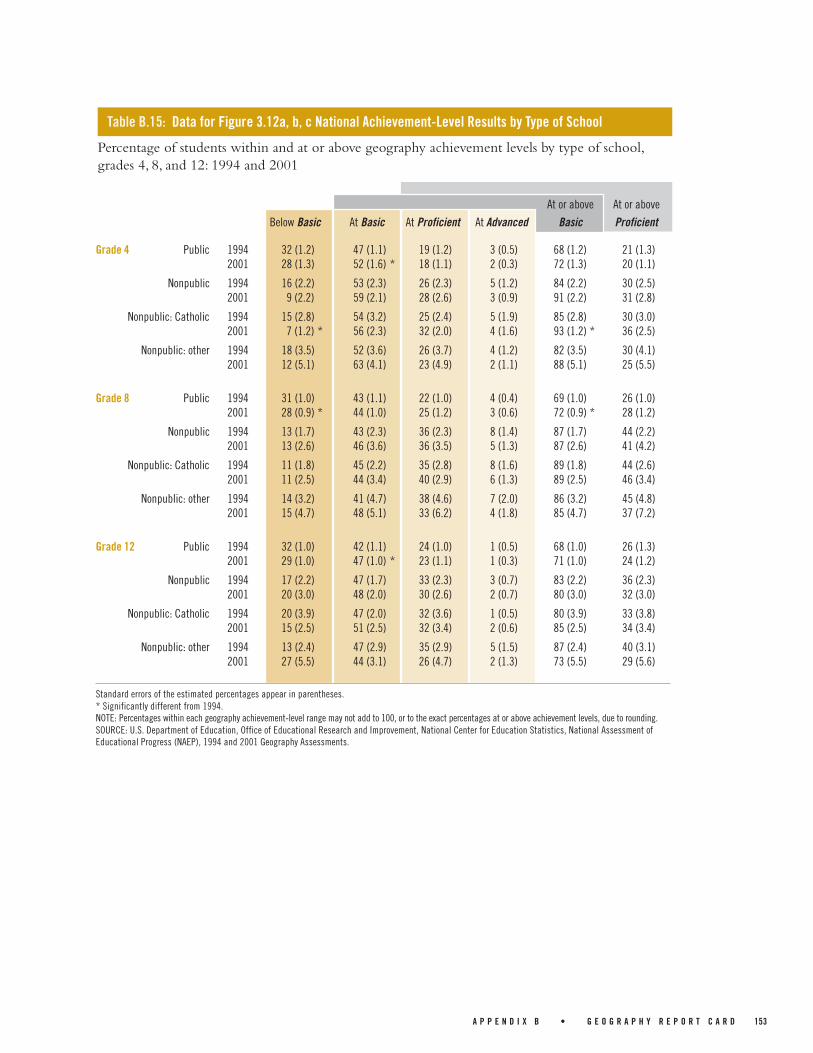
A P P E N D I X B • G E O G R A P H Y R E P O R T C A R D 153
Table B.15: Data for Figure 3.12a, b, c National Achievement-Level Results by Type of School
Percentage of students within and at or above geography achievement levels by type of school,grades 4, 8, and 12: 1994 and 2001
At or above At or above
Below Basic At Basic At Proficient At Advanced Basic Proficient
Standard errors of the estimated percentages appear in parentheses.* Significantly different from 1994.NOTE: Percentages within each geography achievement-level range may not add to 100, or to the exact percentages at or above achievement levels, due to rounding.SOURCE: U.S. Department of Education, Office of Educational Research and Improvement, National Center for Education Statistics, National Assessment ofEducational Progress (NAEP), 1994 and 2001 Geography Assessments.
Grade 4 Public 1994 32 (1.2) 47 (1.1) 19 (1.2) 3 (0.5) 68 (1.2) 21 (1.3)2001 28 (1.3) 52 (1.6) * 18 (1.1) 2 (0.3) 72 (1.3) 20 (1.1)
Nonpublic 1994 16 (2.2) 53 (2.3) 26 (2.3) 5 (1.2) 84 (2.2) 30 (2.5)2001 9 (2.2) 59 (2.1) 28 (2.6) 3 (0.9) 91 (2.2) 31 (2.8)
Nonpublic: Catholic 1994 15 (2.8) 54 (3.2) 25 (2.4) 5 (1.9) 85 (2.8) 30 (3.0)2001 7 (1.2) * 56 (2.3) 32 (2.0) 4 (1.6) 93 (1.2) * 36 (2.5)
Nonpublic: other 1994 18 (3.5) 52 (3.6) 26 (3.7) 4 (1.2) 82 (3.5) 30 (4.1)2001 12 (5.1) 63 (4.1) 23 (4.9) 2 (1.1) 88 (5.1) 25 (5.5)
Grade 8 Public 1994 31 (1.0) 43 (1.1) 22 (1.0) 4 (0.4) 69 (1.0) 26 (1.0)2001 28 (0.9) * 44 (1.0) 25 (1.2) 3 (0.6) 72 (0.9) * 28 (1.2)
Nonpublic 1994 13 (1.7) 43 (2.3) 36 (2.3) 8 (1.4) 87 (1.7) 44 (2.2)2001 13 (2.6) 46 (3.6) 36 (3.5) 5 (1.3) 87 (2.6) 41 (4.2)
Nonpublic: Catholic 1994 11 (1.8) 45 (2.2) 35 (2.8) 8 (1.6) 89 (1.8) 44 (2.6)2001 11 (2.5) 44 (3.4) 40 (2.9) 6 (1.3) 89 (2.5) 46 (3.4)
Nonpublic: other 1994 14 (3.2) 41 (4.7) 38 (4.6) 7 (2.0) 86 (3.2) 45 (4.8)2001 15 (4.7) 48 (5.1) 33 (6.2) 4 (1.8) 85 (4.7) 37 (7.2)
Grade 12 Public 1994 32 (1.0) 42 (1.1) 24 (1.0) 1 (0.5) 68 (1.0) 26 (1.3)2001 29 (1.0) 47 (1.0) * 23 (1.1) 1 (0.3) 71 (1.0) 24 (1.2)
Nonpublic 1994 17 (2.2) 47 (1.7) 33 (2.3) 3 (0.7) 83 (2.2) 36 (2.3)2001 20 (3.0) 48 (2.0) 30 (2.6) 2 (0.7) 80 (3.0) 32 (3.0)
Nonpublic: Catholic 1994 20 (3.9) 47 (2.0) 32 (3.6) 1 (0.5) 80 (3.9) 33 (3.8)2001 15 (2.5) 51 (2.5) 32 (3.4) 2 (0.6) 85 (2.5) 34 (3.4)
Nonpublic: other 1994 13 (2.4) 47 (2.9) 35 (2.9) 5 (1.5) 87 (2.4) 40 (3.1)2001 27 (5.5) 44 (3.1) 26 (4.7) 2 (1.3) 73 (5.5) 29 (5.6)

154 A P P E N D I X B • G E O G R A P H Y R E P O R T C A R D
Table B.17: Data for Figure 3.13 National Achievement-Level Results by Type of Location
Percentage of students within and at or above geography achievement levelsby type of school location, grades 4, 8, and 12: 2001
At or above At or above
Below Basic At Basic At Proficient At Advanced Basic Proficient
Percentage of students and average geography scale scores by type of school location, grades 4, 8,and 12: 2001
Central city Urban fringe/large town Rural/small town
Table B.16: Data for Table 3.1 National Scale Score Results by Type of Location
Grade 4 27 (1.6) 44 (2.9) 29 (2.8)199 (2.3) 212 (2.1) 215 (2.0)
Grade 8 27 (2.0) 45 (2.8) 28 (2.5)255 (2.0) 265 (1.6) 265 (2.0)
Grade 12 26 (2.0) 40 (2.8) 34 (2.5)279 (1.6) 288 (1.6) 284 (1.0)
The percentage of students is listed first with the corresponding average scale score presented below.Standard errors of the estimated percentages and scale scores appear in parentheses.NOTE: Percentages may not add to 100 due to rounding.SOURCE: U.S. Department of Education, Office of Educational Research and Improvement, National Center for Education Statistics, National Assessment ofEducational Progress (NAEP), 2001 Geography Assessment.
Standard errors of the estimated percentages appear in parentheses.NOTE: Percentages within each geography achievement-level range may not add to 100, or to the exact percentages at or above achievement levels, due to rounding.SOURCE: U.S. Department of Education, Office of Educational Research and Improvement, National Center for Education Statistics, National Assessment ofEducational Progress (NAEP), 2001 Geography Assessment.
Grade 4 Central city 38 (2.4) 46 (1.8) 14 (1.6) 2 (0.4) 62 (2.4) 16 (1.8)
Urban fringe/large town 24 (2.1) 53 (1.7) 21 (1.5) 2 (0.6) 76 (2.1) 23 (1.7)
Rural/small town 19 (2.1) 58 (3.0) 21 (2.4) 2 (0.5) 81 (2.1) 23 (2.4)
Grade 8 Central city 36 (2.2) 39 (1.7) 22 (1.8) 3 (0.7) 64 (2.2) 25 (2.1)
Urban fringe/large town 22 (1.7) 45 (1.3) 29 (1.5) 4 (0.9) 78 (1.7) 32 (1.8)
Rural/small town 22 (2.2) 48 (2.0) 27 (2.4) 3 (0.7) 78 (2.2) 30 (2.7)
Grade 12 Central city 37 (2.4) 42 (2.0) 19 (1.8) 1 (0.3) 63 (2.4) 20 (1.9)
Urban fringe/large town 25 (1.6) 45 (1.6) 28 (1.9) 2 (0.6) 75 (1.6) 30 (2.3)
Rural/small town 26 (1.5) 52 (1.5) 21 (1.4) 1 (0.3) 74 (1.5) 22 (1.4)

A P P E N D I X B • G E O G R A P H Y R E P O R T C A R D 155
Table B.19: Data for Figure 3.14 National Achievement-Level Results by Free/Reduced-Price SchoolLunch Program Eligibility
Percentage of students within and at or above geography achievement levels by student eligibilityfor the Free/Reduced-Price School Lunch program, grades 4, 8, and 12: 2001
At or above At or above
Below Basic At Basic At Proficient At Advanced Basic Proficient
Standard errors of the estimated percentages appear in parentheses.# Percentage is between 0.0 and 0.5.(***) Standard error estimates cannot be accurately determined.NOTE: Percentages within each geography achievement-level range may not add to 100, or to the exact percentages at or above achievement levels, due to rounding.SOURCE: U.S. Department of Education, Office of Educational Research and Improvement, National Center for Education Statistics, National Assessment ofEducational Progress (NAEP), 2001 Geography Assessment.
Grade 4 Eligible 49 (2.2) 45 (2.1) 6 (0.9) # (***) 51 (2.2) 6 (0.9)
Not eligible 14 (1.1) 56 (1.6) 27 (1.4) 3 (0.6) 86 (1.1) 29 (1.5)
Info not available 16 (2.5) 57 (2.9) 24 (3.1) 3 (0.8) 84 (2.5) 27 (3.2)
Grade 8 Eligible 50 (1.8) 39 (1.6) 10 (1.1) 1 (0.3) 50 (1.8) 11 (1.2)
Not eligible 17 (0.9) 46 (1.3) 32 (1.5) 5 (0.8) 83 (0.9) 37 (1.7)
Info not available 21 (2.1) 46 (2.5) 29 (2.2) 4 (0.9) 79 (2.1) 33 (2.5)
Grade 12 Eligible 49 (2.3) 40 (1.7) 10 (1.5) # (***) 51 (2.3) 11 (1.6)
Not eligible 25 (1.2) 49 (1.3) 25 (1.4) 1 (0.4) 75 (1.2) 26 (1.6)
Info not available 24 (2.0) 45 (1.6) 29 (2.0) 2 (0.4) 76 (2.0) 31 (2.1)
Table B.18: Data for Table 3.2 National Scale Score Results by Free/Reduced-Price School LunchProgram Eligibility
Percentage of students and average geography scale scores by student eligibility forFree/Reduced-Price School Lunch program, grades 4, 8, and 12: 2001
Eligible Not eligible Info not available
Grade 4 33 (1.4) 48 (2.3) 18 (2.4)186 (1.7) 221 (1.2) 218 (2.5)
Grade 8 25 (1.1) 53 (2.1) 22 (2.3)242 (1.4) 270 (1.1) 266 (1.8)
Grade 12 16 (1.0) 64 (2.2) 21 (2.4)269 (1.6) 287 (1.0) 289 (1.5)
The percentage of students is listed first with the corresponding average scale score presented below.Standard errors of the estimated percentages and scale scores appear in parentheses.NOTE: Percentages may not add to 100 due to rounding.SOURCE: U.S. Department of Education, Office of Educational Research and Improvement, National Center for Education Statistics, National Assessment ofEducational Progress (NAEP), 2001 Geography Assessment.

156 A P P E N D I X B • G E O G R A P H Y R E P O R T C A R D
Percentage of students and average geography scale scores by teachers’ reported undergraduate/graduate major and minor/special emphasis, grades 4 and 8: 2001
Table B.20: Data for Table 4.1 Teachers’ Majors/Minors
Grade 4Geography or Geography Education 7 (1.0) 93 (1.0)
204 (5.2) 210 (1.1)History or History Education 15 (1.5) 85 (1.5)
206 (3.6) 211 (1.1)Social Science or Social Studies Education 20 (1.7) 80 (1.7)
208 (2.6) 210 (1.3)Other Social Science 57 (2.5) 43 (2.5)
210 (1.6) 209 (1.4)Elementary Education 93 (1.0) 7 (1.0)
211 (1.1) 197 (4.3)
Grade 8Geography or Geography Education 28 (2.5) 72 (2.5)
263 (2.1) 263 (1.2)History or History Education 71 (2.7) 29 (2.7)
263 (1.3) 261 (1.9)Social Science or Social Studies Education 55 (3.0) 45 (3.0)
263 (1.3) 262 (1.5)Other Social Science 51 (2.1) 49 (2.1)
261 (1.5) 264 (1.4)The percentage of students is listed first with the corresponding average scale score presented below.Standard errors of the estimated percentages and scale scores appear in parentheses.NOTE: Percentages may not add to 100 due to rounding.SOURCE: U.S. Department of Education, Office of Educational Research and Improvement, National Center for Education Statistics, National Assessment ofEducational Progress (NAEP), 2001 Geography Assessment.
Yes NoDid you have a major, minor, or special emphasis in anyof the following subjects as part of your undergraduateor graduate course work?

A P P E N D I X B • G E O G R A P H Y R E P O R T C A R D 157
Percentage of students and average geography scale scores by teachers’ reports on how well pre-pared they felt they were to teach geography, grades 4 and 8: 1994 and 2001
Table B.21: Data for Table 4.2 Teachers’ Preparedness to Teach Geography
Grade 4Very prepared 23 (2.0) 31 (2.1) *
209 (2.1) 211 (2.1)Adequately prepared 57 (2.0) 53 (2.3)
206 (1.8) 210 (1.3)Somewhat prepared 18 (1.8) 15 (1.5)
207 (2.8) 206 (2.4)Unprepared 2 (0.5) 1 (0.3)
200 (8.9) ! 209 (8.6) !
Grade 8Very prepared 36 (2.9) 44 (2.5)
260 (2.2) 263 (1.4)Adequately prepared 48 (3.6) 43 (2.4)
262 (1.4) 262 (1.3)Somewhat prepared 13 (2.3) 11 (1.7)
265 (2.9) 261 (2.5)Unprepared 2 (***) 2 (0.6)
260 (3.7) ! 264 (8.9) !The percentage of students is listed first with the corresponding average scale score presented below.Standard errors of the estimated percentages and scale scores appear in parentheses.! The nature of the sample does not allow accurate determination of the variability of the statistic.* Significantly different from 1994.(***) Standard error estimates cannot be accurately determined.NOTE: Percentages may not add to 100 due to rounding.SOURCE: U.S. Department of Education, Office of Educational Research and Improvement, National Center for Education Statistics, National Assessment ofEducational Progress (NAEP), 1994 and 2001 Geography Assessments.
Regardless or whether you are currently teaching thetopic, how well prepared do you feel you are to teachgeography at the elementary/middle school level?
1994 2001

158 A P P E N D I X B • G E O G R A P H Y R E P O R T C A R D
Using maps and globesAlmost every day 29 (2.3) 28 (2.3)
210 (2.1) 213 (1.9)Once or twice a week 54 (2.5) 47 (2.2)
208 (1.7) 209 (1.5)Once or twice a month 17 (2.1) 22 (1.7)
199 (3.2) 206 (2.4)Never or hardly ever 1 (0.3) 3 (0.7)
*** (***) 209 (8.9) !
Natural resourcesAlmost every day 9 (1.8) 9 (1.4)
201 (4.1) 217 (4.6)Once or twice a week 38 (2.5) 31 (1.6) *
209 (2.3) 208 (1.9)Once or twice a month 44 (2.5) 46 (1.9)
208 (2.2) 210 (1.7)Never or hardly ever 9 (1.4) 14 (1.4) *
198 (4.8) 208 (3.1)
Foreign countries and culturesAlmost every day 6 (1.2) 3 (0.8)
206 (5.7) 206 (6.3) !Once or twice a week 19 (1.9) 23 (1.7)
203 (2.7) 208 (2.3)Once or twice a month 43 (2.1) 45 (2.7)
208 (2.0) 209 (1.4)Never or hardly ever 32 (2.3) 29 (2.4)
209 (1.9) 212 (2.2)
Environmental issuesAlmost every day 4 (0.9) 7 (1.5)
201 (5.6) ! 212 (3.6) !Once or twice a week 27 (2.1) 21 (1.7)
206 (2.5) 205 (2.6)Once or twice a month 56 (2.0) 56 (2.2)
208 (2.0) 211 (1.4)Never or hardly ever 13 (1.5) 16 (1.9)
208 (3.9) 211 (3.0)
The percentage of students is listed first with the corresponding average scale score presented below.Standard errors of the estimated percentages and scale scores appear in parentheses.! The nature of the sample does not allow accurate determination of the variability of the statistic.* Significantly different from 1994.*** (***) Sample size is insufficient to permit a reliable estimate.NOTE: Percentages may not add to 100 due to rounding.SOURCE: U.S. Department of Education, Office of Educational Research and Improvement, National Center for Education Statistics, National Assessment ofEducational Progress (NAEP), 1994 and 2001 Geography Assessments.
Percentage of students and average geography scale scores by teachers’ reports on frequency ofinstruction of selected skills and topics, grade 4:1994 and 2001
Table B.22: Data for Table 4.3 Frequency of Instruction in Fourth-Grade Geography Skills and Topics
1994 2001How often do you teach the following skills and topics as apart of geography instruction with this class?
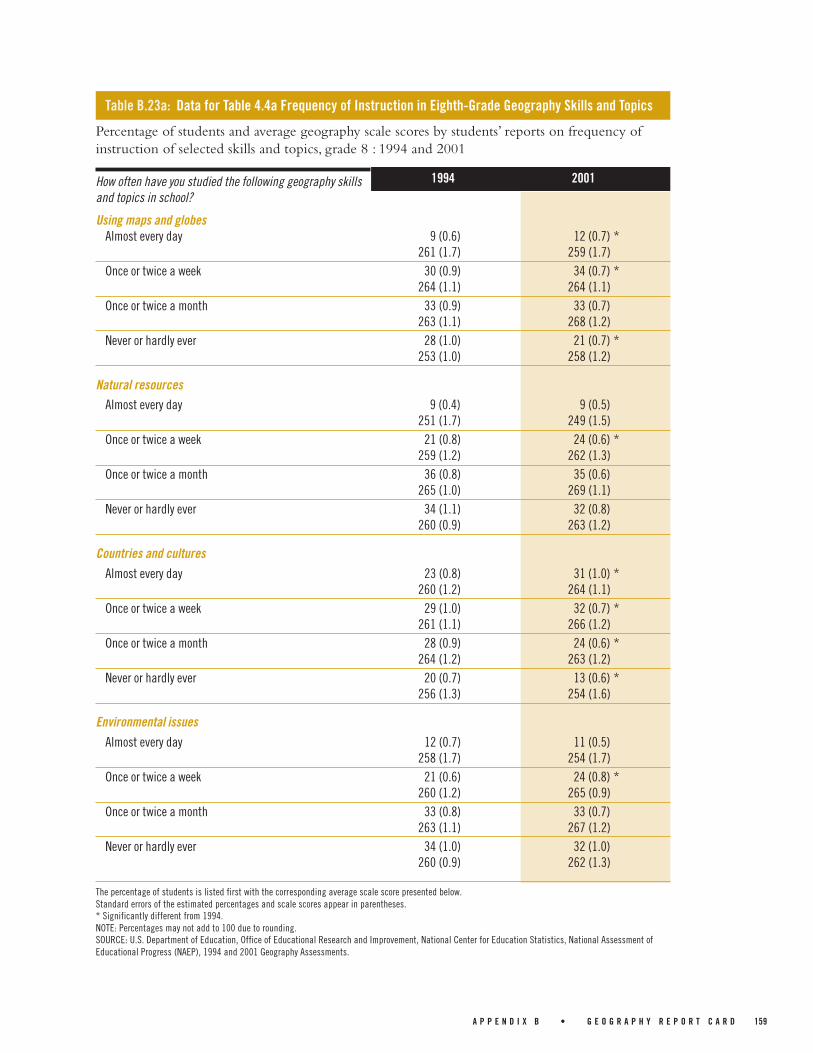
A P P E N D I X B • G E O G R A P H Y R E P O R T C A R D 159
Using maps and globesAlmost every day 9 (0.6) 12 (0.7) *
261 (1.7) 259 (1.7)Once or twice a week 30 (0.9) 34 (0.7) *
264 (1.1) 264 (1.1)Once or twice a month 33 (0.9) 33 (0.7)
263 (1.1) 268 (1.2)Never or hardly ever 28 (1.0) 21 (0.7) *
253 (1.0) 258 (1.2)
Natural resourcesAlmost every day 9 (0.4) 9 (0.5)
251 (1.7) 249 (1.5)Once or twice a week 21 (0.8) 24 (0.6) *
259 (1.2) 262 (1.3)Once or twice a month 36 (0.8) 35 (0.6)
265 (1.0) 269 (1.1)Never or hardly ever 34 (1.1) 32 (0.8)
260 (0.9) 263 (1.2)
Countries and culturesAlmost every day 23 (0.8) 31 (1.0) *
260 (1.2) 264 (1.1)Once or twice a week 29 (1.0) 32 (0.7) *
261 (1.1) 266 (1.2)Once or twice a month 28 (0.9) 24 (0.6) *
264 (1.2) 263 (1.2)Never or hardly ever 20 (0.7) 13 (0.6) *
256 (1.3) 254 (1.6)
Environmental issuesAlmost every day 12 (0.7) 11 (0.5)
258 (1.7) 254 (1.7)Once or twice a week 21 (0.6) 24 (0.8) *
260 (1.2) 265 (0.9)Once or twice a month 33 (0.8) 33 (0.7)
263 (1.1) 267 (1.2)Never or hardly ever 34 (1.0) 32 (1.0)
260 (0.9) 262 (1.3)
Percentage of students and average geography scale scores by students’ reports on frequency ofinstruction of selected skills and topics, grade 8 : 1994 and 2001
Table B.23a: Data for Table 4.4a Frequency of Instruction in Eighth-Grade Geography Skills and Topics
The percentage of students is listed first with the corresponding average scale score presented below.Standard errors of the estimated percentages and scale scores appear in parentheses.* Significantly different from 1994.NOTE: Percentages may not add to 100 due to rounding.SOURCE: U.S. Department of Education, Office of Educational Research and Improvement, National Center for Education Statistics, National Assessment ofEducational Progress (NAEP), 1994 and 2001 Geography Assessments.
1994 2001How often have you studied the following geography skillsand topics in school?

160 A P P E N D I X B • G E O G R A P H Y R E P O R T C A R D
The percentage of students is listed first with the corresponding average scale score presented below.Standard errors of the estimated percentages and scale scores appear in parentheses.* Significantly different from 1994.NOTE: Percentages may not add to 100 due to rounding.SOURCE: U.S. Department of Education, Office of Educational Research and Improvement, National Center for Education Statistics, National Assessment ofEducational Progress (NAEP), 1994 and 2001 Geography Assessments.
Percentage of students and average geography scale scores by students’ reports on frequency ofinstruction of selected skills and topics, grade 12: 1994 and 2001
Table B.23b: Data for Table 4.4b Frequency of Instruction in Twelfth-Grade Geography Skills and Topics
Using maps and globesAlmost every day 7 (0.4) 6 (0.4)
284 (2.0) 277 (1.5)Once or twice a week 22 (0.7) 24 (0.5)
288 (0.9) 285 (1.1)Once or twice a month 31 (0.7) 34 (0.6) *
286 (0.8) 287 (0.9)Never or hardly ever 40 (0.9) 36 (0.8) *
283 (1.1) 284 (1.0)
Natural resourcesAlmost every day 7 (0.4) 7 (0.4)
282 (2.1) 275 (1.7)Once or twice a week 18 (0.6) 22 (0.8) *
286 (1.2) 283 (1.2)Once or twice a month 31 (0.7) 32 (0.7)
288 (1.0) 288 (0.9)Never or hardly ever 45 (0.9) 39 (0.8) *
284 (0.9) 285 (1.0)
Countries and culturesAlmost every day 16 (0.6) 20 (0.5) *
287 (1.3) 286 (0.9)Once or twice a week 26 (0.5) 32 (0.6) *
288 (1.0) 288 (1.0)Once or twice a month 30 (0.7) 29 (0.6)
286 (0.8) 286 (1.2)Never or hardly ever 28 (0.8) 19 (0.5) *
280 (1.0) 277 (1.0)
Environmental issuesAlmost every day 11 (0.5) 11 (0.5)
284 (1.6) 279 (1.3)Once or twice a week 22 (0.7) 26 (0.7) *
288 (1.2) 286 (1.1)Once or twice a month 30 (0.7) 33 (0.6) *
288 (0.9) 289 (1.1)Never or hardly ever 37 (0.8) 30 (0.6) *
282 (0.9) 282 (0.9)
1994 2001How often have you studied the following geography skillsand topics in school?

A P P E N D I X B • G E O G R A P H Y R E P O R T C A R D 161
Percentage of students and average geography scale scores by students’ reports on grades in whichgeography was taken since the 6th grade, grade 8: 1994 and 2001
Table B.24: Data for Table 4.5 Eighth-Grade Frequency of Geography Course Taking
The percentage of students is listed first with the corresponding average scale score presented below.Standard errors of the estimated percentages and scale scores appear in parentheses.* Significantly different from 1994.NOTE: Percentages may not add to 100 due to rounding.SOURCE: U.S. Department of Education, Office of Educational Research and Improvement, National Center for Education Statistics, National Assessment ofEducational Progress (NAEP), 1994 and 2001 Geography Assessments.
Number of grades selectedNone 18 (1.0) 12 (0.7)*
250 (1.6) 255 (1.7)
One 30 (0.7) 20 (0.6)*257 (1.1) 256 (1.5)
Two 14 (0.9) 16 (0.6)269 (1.4) 263 (1.3)
Three 26 (0.9) 43 (1.1)*274 (0.9) 272 (1.1)
Don’t know 13 (0.6) 9 (0.5)243 (1.5) 246 (1.5)
1994 2001Did you take or do you expect to take a geography coursein 6th, 7th, or 8th grade?

162 A P P E N D I X B • G E O G R A P H Y R E P O R T C A R D
Percentage of students and average geography scale scores by students’ reports on grades in whichgeography was taken since 9th grade, grade 12: 1994 and 2001
Table B.25: Data for Table 4.6 Twelfth-Grade Frequency of Geography Course Taking
The percentage of students is listed first with the corresponding average scale score presented below.Standard errors of the estimated percentages and scale scores appear in parentheses.* Significantly different from 1994.NOTE: Percentages may not add to 100 due to rounding.SOURCE: U.S. Department of Education, Office of Educational Research and Improvement, National Center for Education Statistics, National Assessment ofEducational Progress (NAEP), 1994 and 2001 Geography Assessments.
Number of grades selectedNone 31 (1.6) 21 (1.2) *
286 (1.4) 289 (1.3)
One 35 (1.4) 32 (1.4)288 (0.9) 288 (1.2)
Two 16 (0.8) 15 (0.7)286 (1.5) 285 (1.3)
Three 10 (0.6) 18 (0.9)*281 (1.7) 280 (1.1)
Four 5 (0.5) 10 (0.6) *277 (2.5) 281 (1.3)
Don’t know 3 (0.4) 3 (0.3)268 (2.1) 265 (2.6)
Did you take or do you expect to take a geography coursein 9th, 10th, 11th, or 12th grade?
1994 2001

A P P E N D I X B • G E O G R A P H Y R E P O R T C A R D 163
Percentage of students and average geography scale scores by teachers’ reports on computer use forsocial studies instruction, grade 4: 2001
Table B.26a: Data for Table 4.7a Fourth-Grade Computer Use
Grade 4
Use CD-ROM to look up reference worksNot at all 37 (2.5)
205 (2.0)Small extent 47 (2.4)
211 (1.6)Moderate extent 14 (1.8)
216 (2.4)Large extent 2 (0.9)
214 (7.9) !
Retrieve information through the InternetNot at all 34 (2.3)
203 (2.3)Small extent 45 (2.3)
212 (1.6)Moderate extent 17 (2.2)
216 (3.0)Large extent 4 (1.1)
211 (6.3) !
Use exploration/simulation softwareNot at all 54 (2.4)
207 (1.4)Small extent 37 (2.4)
213 (1.7)Moderate extent 8 (1.2)
211 (3.7)Large extent 1 (0.2)
*** (***)
Organize information using spreadsheets/databasesNot at all 89 (1.4)
209 (1.2)Small extent 9 (1.3)
213 (3.7)Moderate extent 1 (0.4)
213 (8.5) !Large extent # (0.2)
*** (***)
2001When students in this class work on social studies, to whatextent do they use computers to do each of the following?
The percentage of students is listed first with the corresponding average scale score presented below.Standard errors of the estimated percentages and scale scores appear in parentheses.# Percentage is between 0.0 and 0.5.! The nature of the sample does not allow accurate determination of the variability of the statistic.*** (***) Sample size is insufficient to permit a reliable estimate.NOTE: Percentages may not add to 100 due to rounding.SOURCE: U.S. Department of Education, Office of Educational Research and Improvement, National Center for Education Statistics, National Assessment ofEducational Progress (NAEP), 2001 Geography Assessment.

164 A P P E N D I X B • G E O G R A P H Y R E P O R T C A R D
Percentage of students and average geography scale scores by teachers’ reports on computer use forsocial studies instruction, grade 8: 2001
Table B.26b: Data for Table 4.7b Eighth-Grade Computer Use
2001When students in this class work on social studies, to whatextent do they use computers to do each of the following?Grade 8
Use CD-ROM to look up reference worksNot at all 31 (2.0)
258 (1.3)Small extent 48 (2.3)
263 (1.4)Moderate extent 17 (2.4)
266 (2.4)Large extent 4 (0.9)
268 (4.7) !
Retrieve information through the InternetNot at all 20 (1.9)
255 (2.0)Small extent 47 (2.4)
261 (1.3)Moderate extent 29 (2.6)
266 (1.9)Large extent 4 (0.8)
273 (3.8)
Use exploration/simulation softwareNot at all 62 (2.2)
261 (1.2)Small extent 32 (2.3)
265 (1.9)Moderate extent 5 (1.1)
259 (3.4) !Large extent 1 (0.4)
257 (11.0) !
Organize information using spreadsheets/databasesNot at all 74 (2.7)
261 (1.2)Small extent 22 (2.7)
266 (2.4)Moderate extent 2 (0.8)
262 (6.2) !Large extent 1 (0.5)
249 (5.5) !
The percentage of students is listed first with the corresponding average scale score presented below.Standard errors of the estimated percentages and scale scores appear in parentheses.! The nature of the sample does not allow accurate determination of the variability of the statistic.NOTE: Percentages may not add to 100 due to rounding.SOURCE: U.S. Department of Education, Office of Educational Research and Improvement, National Center for Education Statistics, National Assessment ofEducational Progress (NAEP), 2001 Geography Assessment.
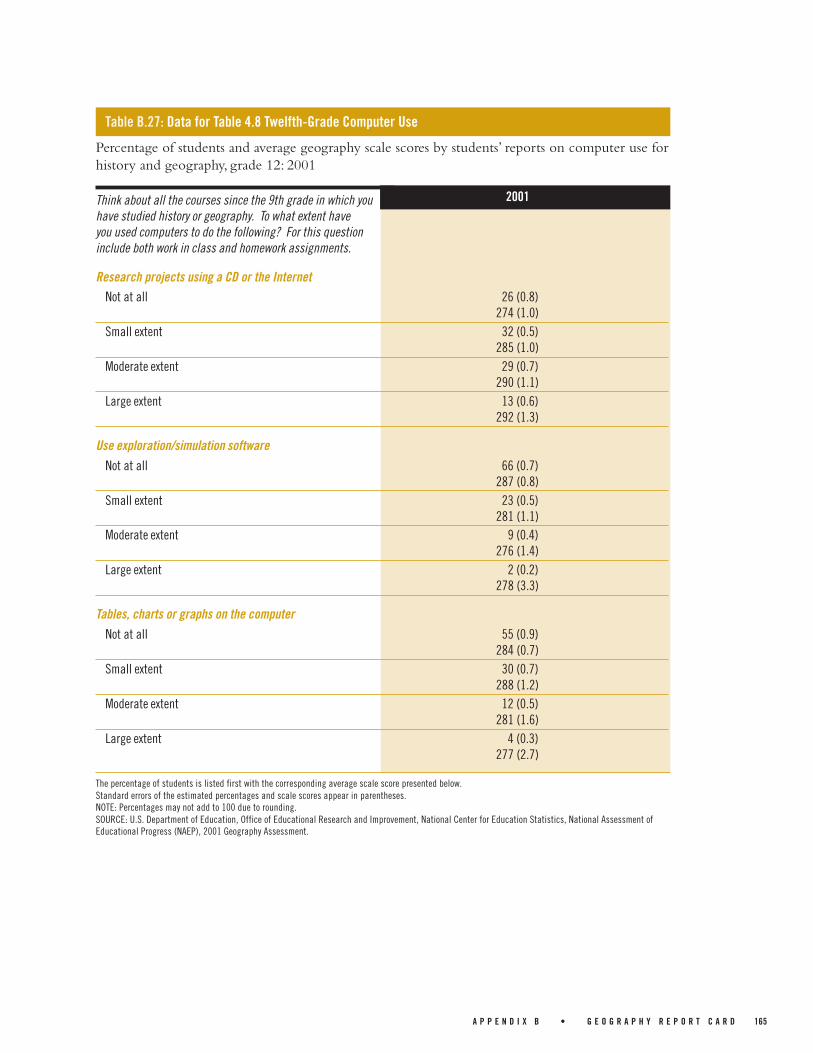
A P P E N D I X B • G E O G R A P H Y R E P O R T C A R D 165
Percentage of students and average geography scale scores by students’ reports on computer use forhistory and geography, grade 12: 2001
Table B.27: Data for Table 4.8 Twelfth-Grade Computer Use
Research projects using a CD or the InternetNot at all 26 (0.8)
274 (1.0)Small extent 32 (0.5)
285 (1.0)Moderate extent 29 (0.7)
290 (1.1)Large extent 13 (0.6)
292 (1.3)
Use exploration/simulation softwareNot at all 66 (0.7)
287 (0.8)Small extent 23 (0.5)
281 (1.1)Moderate extent 9 (0.4)
276 (1.4)Large extent 2 (0.2)
278 (3.3)
Tables, charts or graphs on the computerNot at all 55 (0.9)
284 (0.7)Small extent 30 (0.7)
288 (1.2)Moderate extent 12 (0.5)
281 (1.6)Large extent 4 (0.3)
277 (2.7)
The percentage of students is listed first with the corresponding average scale score presented below.Standard errors of the estimated percentages and scale scores appear in parentheses.NOTE: Percentages may not add to 100 due to rounding.SOURCE: U.S. Department of Education, Office of Educational Research and Improvement, National Center for Education Statistics, National Assessment ofEducational Progress (NAEP), 2001 Geography Assessment.
2001Think about all the courses since the 9th grade in which youhave studied history or geography. To what extent haveyou used computers to do the following? For this questioninclude both work in class and homework assignments.

166 A P P E N D I X B • G E O G R A P H Y R E P O R T C A R D
Percentage of students and average geography scale scores by students’ reports on how much theylike studying geography, grades 8 and 12: 1994 and 2001
Table B.28: Data for Table 4.9 How Much Eighth- and Twelfth-Grade Students Like Geography
Grade 8One of my favorite subjects 19 (0.8) 20 (0.6)
274 (1.2) 275 (1.3)Like other subjects better 67 (0.9) 69 (0.6)
260 (0.7) 263 (1.0)Never studied geography 14 (0.6) 11 (0.5) *
241 (1.9) 247 (1.7)
Grade 12One of my favorite subjects 14 (0.6) 15 (0.6)
297 (1.3) 293 (1.2)Like other subjects better 63 (1.1) 72 (0.8) *
285 (0.8) 285 (0.8)Never studied geography 23 (1.2) 13 (0.8) *
277 (1.3) 278 (1.8)
The percentage of students is listed first with the corresponding average scale score presented below.Standard errors of the estimated percentages and scale scores appear in parentheses.* Significantly different from 1994.NOTE: Percentages may not add to 100 due to rounding.SOURCE: U.S. Department of Education, Office of Educational Research and Improvement, National Center for Education Statistics, National Assessment ofEducational Progress (NAEP), 1994 and 2001 Geography Assessments.
1994 2001How much do you like studying geography?

A P P E N D I X B • G E O G R A P H Y R E P O R T C A R D 167
Table B.29: Data for Table 5.1 Comparison of Two Sets of National Scale Score Results
National average geography scale scores by type of results, grades 4, 8, and 12: 2001
Accommodations not permitted Accommodations permitted
Grade 4 209 (1.0) 208 (0.9)
Grade 8 262 (0.9) 260 (1.0) �
Grade 12 285 (0.8) 284 (0.8)
Standard errors of the estimated scale scores appear in parentheses.� Significantly different from the sample where accommodations were not permitted.SOURCE: U.S. Department of Education, Office of Educational Research and Improvement, National Center for Education Statistics, National Assessment ofEducational Progress (NAEP), 2001 Geography Assessment.
Percentage of students within and at or above geography achievement levels by type of results,grades 4, 8, and 12: 2001
Table B.30: Data for Table 5.2 Comparison of Two Sets of National Achievement-Level Results
At or above At or above
Below Basic At Basic At Proficient At Advanced Basic Proficient
Grade 4Accommodations were not permitted 26 (1.2) 53 (1.4) 19 (1.1) 2 (0.3) 74 (1.2) 21 (1.0)
Accommodations were permitted 27 (1.0) 52 (1.1) 19 (0.9) 2 (0.3) 73 (1.0) 20 (0.9)
Grade 8Accommodations were not permitted 26 (0.9) 44 (0.9) 26 (1.1) 4 (0.6) 74 (0.9) 30 (1.2)
Accommodations were permitted 28 (1.2) � 43 (0.9) 25 (1.0) 4 (0.5) 72 (1.2) � 29 (1.3)
Grade 12Accommodations were not permitted 29 (0.9) 47 (0.9) 23 (1.0) 1 (0.3) 71 (0.9) 25 (1.1)
Accommodations were permitted 29 (1.0) 47 (0.9) 23 (1.0) 1 (0.3) 71 (1.0) 24 (1.2)
Standard errors of the estimated percentages appear in parentheses.� Significantly different from the sample where accommodations were not permitted.NOTE: Percentages within each geography achievement-level range may not add to 100, or to the exact percentages at or above achievement levels, due to rounding.SOURCE: U.S. Department of Education, Office of Educational Research and Improvement, National Center for Education Statistics, National Assessment ofEducational Progress (NAEP), 2001 Geography Assessment.

168 A P P E N D I X B • G E O G R A P H Y R E P O R T C A R D
National average geography scale scores by gender and type of results, grades 4, 8, and 12: 2001
Table B.31: Data for Table 5.3 Comparison of Two Sets of National Scale Score Results by Gender
Male Female
Grade 4Accommodations were not permitted 212 (1.1) 207 (1.2)
Accommodations were permitted 210 (1.0) 206 (1.3)
Grade 8Accommodations were not permitted 264 (1.0) 260 (1.1)
Accommodations were permitted 262 (1.2) � 258 (1.0)
Grade 12Accommodations were not permitted 287 (0.9) 282 (0.8)
Accommodations were permitted 287 (1.0) 281 (0.8)
Standard errors of the estimated scale scores appear in parentheses.� Significantly different from the sample where accommodations were not permitted.SOURCE: U.S. Department of Education, Office of Educational Research and Improvement, National Center for Education Statistics, National Assessment ofEducational Progress (NAEP), 2001 Geography Assessment.
Table B.32: Table 5.4 Comparison of Two Sets of National Achievement-Level Results by Gender
At or above At or above
Below Basic At Basic At Proficient At Advanced Basic Proficient
Percentage of students within and at or above geography achievement levels by gender andtype of results, grades 4, 8, and 12: 2001
Grade 4MaleAccommodations were not permitted 25 (1.3) 51 (1.6) 21 (1.4) 3 (0.5) 75 (1.3) 24 (1.4)
Accommodations were permitted 26 (0.9) 51 (1.3) 21 (1.1) 3 (0.5) 74 (0.9) 23 (1.2)
FemaleAccommodations were not permitted 28 (1.6) 54 (1.7) 17 (1.2) 1 (0.4) 72 (1.6) 18 (1.1)
Accommodations were permitted 29 (1.5) 54 (1.5) 16 (1.3) 1 (0.3) 71 (1.5) 18 (1.3)
Grade 8MaleAccommodations were not permitted 25 (1.0) 42 (1.3) 29 (1.7) 5 (0.7) 75 (1.0) 33 (1.5)
Accommodations were permitted 27 (1.5) 41 (1.0) 27 (1.2) 4 (0.7) 73 (1.5) 32 (1.5)
FemaleAccommodations were not permitted 27 (1.2) 47 (1.1) 24 (1.3) 3 (0.6) 73 (1.2) 26 (1.4)
Accommodations were permitted 29 (1.1) 45 (1.5) 23 (1.4) 3 (0.5) 71 (1.1) 26 (1.5)
Grade 12MaleAccommodations were not permitted 27 (1.1) 45 (1.3) 26 (1.4) 2 (0.4) 73 (1.1) 28 (1.5)
Accommodations were permitted 26 (1.3) 45 (1.4) 26 (1.4) 2 (0.4) 74 (1.3) 28 (1.6)
FemaleAccommodations were not permitted 30 (1.0) 48 (1.0) 20 (0.9) 1 (0.3) 70 (1.0) 21 (1.0)
Accommodations were permitted 32 (1.2) 48 (1.2) 19 (1.2) 1 (0.3) 68 (1.2) 20 (1.2)
Standard errors of the estimated percentages appear in parentheses.NOTE: Percentages within each geography achievement-level range may not add to 100, or to the exact percentages at or above achievement levels, due to rounding.SOURCE: U.S. Department of Education, Office of Educational Research and Improvement, National Center for Education Statistics, National Assessment ofEducational Progress (NAEP), 2001 Geography Assessment.

A P P E N D I X B • G E O G R A P H Y R E P O R T C A R D 169
National average geography scale scores by race/ethnicity and type of results, grades 4, 8, and 12:2001
Table B.33: Data for Table 5.5 Comparison of Two Sets of National Scale Score Results by Race/Ethnicity
Asian/Pacific AmericanWhite Black Hispanic Islander Indian
Grade 4Accommodations were not permitted 222 (1.0) 181 (1.8) 184 (2.8) 212 (2.7) 199 (3.6)
Accommodations were permitted 220 (1.0) 181 (1.9) 185 (2.1) 216 (2.6) 199 (3.4)
Grade 8Accommodations were not permitted 273 (1.0) 234 (1.7) 240 (1.7) 266 (2.5) 261 (5.8)
Accommodations were permitted 271 (1.4) 232 (1.6) 238 (1.8) 267 (2.2) 259 (4.9)
Grade 12Accommodations were not permitted 291 (0.9) 260 (1.4) 270 (1.5) 286 (2.9) 288 (3.6) !
Accommodations were permitted 292 (0.8) 258 (1.5) 269 (1.4) 285 (5.0) 286 (3.5) !
Standard errors of the estimated scale scores appear in parentheses.! The nature of the sample does not allow accurate determination of the variability of the statistic.SOURCE: U.S. Department of Education, Office of Educational Research and Improvement, National Center for Education Statistics, National Assessment ofEducational Progress (NAEP), 2001 Geography Assessment.

170 A P P E N D I X B • G E O G R A P H Y R E P O R T C A R D
Table B.34: Data for Table 5.6 Comparison of Two Sets of National Achievement-Level Results by Race/Ethnicity
Percentage of students within and at or above geography achievement levels by race/ethnicity and typeof results, grades 4, 8, and 12: 2001
At or above At or above
Below Basic At Basic At Proficient At Advanced Basic Proficient
Standard errors of the estimated percentages appear in parentheses.# Percentage is between 0.0 and 0.5.(***) Standard error estimates cannot be accurately determined.! The nature of the sample does not allow accurate determination of the variability of the statistic.NOTE: Percentages within each geography achievement-level range may not add to 100, or to the exact percentages at or above achievement levels, due to rounding.SOURCE: U.S. Department of Education, Office of Educational Research and Improvement, National Center for Education Statistics, National Assessment ofEducational Progress (NAEP), 2001 Geography Assessment.
Grade 4White
Accommodations were not permitted 13 (1.3) 58 (1.8) 26 (1.6) 3 (0.5) 87 (1.3) 29 (1.5)Accommodations were permitted 15 (1.0) 57 (1.4) 25 (1.3) 3 (0.5) 85 (1.0) 28 (1.3)
BlackAccommodations were not permitted 56 (2.1) 39 (2.1) 5 (0.8) # (***) 44 (2.1) 5 (0.9)
Accommodations were permitted 56 (2.7) 40 (2.6) 4 (0.5) # (***) 44 (2.7) 4 (0.6)Hispanic
Accommodations were not permitted 51 (3.0) 43 (2.5) 6 (1.0) # (***) 49 (3.0) 6 (1.0)Accommodations were permitted 49 (2.5) 45 (2.1) 5 (0.9) # (***) 51 (2.5) 6 (0.9)
Asian/Pacific IslanderAccommodations were not permitted 23 (3.4) 52 (4.4) 23 (3.1) 1 (0.9) 77 (3.4) 25 (3.0)
Accommodations were permitted 18 (3.4) 57 (4.0) 24 (3.9) 2 (0.8) 82 (3.4) 25 (3.7)American Indian
Accommodations were not permitted 34 (4.9) 53 (6.3) 13 (4.2) # (***) 66 (4.9) 13 (4.1)Accommodations were permitted 37 (5.7) 51 (5.7) 12 (3.1) # (***) 63 (5.7) 12 (3.3)
Grade 8White
Accommodations were not permitted 14 (0.9) 48 (1.2) 34 (1.5) 5 (0.8) 86 (0.9) 39 (1.7)Accommodations were permitted 16 (1.5) 46 (1.2) 33 (1.5) 5 (0.7) 84 (1.5) 38 (1.9)
BlackAccommodations were not permitted 60 (2.3) 34 (1.9) 6 (0.8) # (***) 40 (2.3) 6 (0.8)
Accommodations were permitted 62 (2.5) 32 (2.2) 6 (0.9) # (***) 38 (2.5) 6 (1.1)Hispanic
Accommodations were not permitted 52 (1.9) 38 (1.6) 9 (1.1) 1 (0.2) 48 (1.9) 10 (1.0)Accommodations were permitted 54 (2.3) 37 (1.9) 9 (0.8) 1 (0.2) 46 (2.3) 9 (0.8)
Asian/Pacific IslanderAccommodations were not permitted 21 (3.4) 47 (4.8) 28 (3.5) 4 (1.8) 79 (3.4) 32 (3.2)
Accommodations were permitted 20 (2.7) 49 (2.9) 28 (3.1) 4 (1.4) 80 (2.7) 32 (3.0)American Indian
Accommodations were not permitted 28 (6.8) 41 (11.1) 29 (8.9) 3 (***) 72 (6.8) 31 (11.2)Accommodations were permitted 30 (5.2) 46 (5.9) 21 (6.0) 3 (***) 70 (5.2) 24 (7.2)
Grade 12White
Accommodations were not permitted 19 (0.9) 51 (1.1) 29 (1.2) 2 (0.4) 81 (0.9) 31 (1.4)Accommodations were permitted 19 (0.9) 51 (1.1) 29 (1.3) 2 (0.4) 81 (0.9) 31 (1.4)
BlackAccommodations were not permitted 65 (2.3) 31 (2.1) 4 (0.7) # (***) 35 (2.3) 4 (0.7)
Accommodations were permitted 67 (2.0) 30 (1.8) 3 (0.9) # (***) 33 (2.0) 3 (0.9)Hispanic
Accommodations were not permitted 48 (2.6) 42 (2.5) 10 (1.4) # (0.1) 52 (2.6) 10 (1.4)Accommodations were permitted 50 (2.4) 42 (2.2) 9 (1.1) # (***) 50 (2.4) 9 (1.1)
Asian/Pacific IslanderAccommodations were not permitted 28 (4.3) 45 (3.0) 25 (4.6) 1 (0.7) 72 (4.3) 26 (4.7)
Accommodations were permitted 29 (6.1) 46 (2.6) 23 (5.0) 1 (0.9) 71 (6.1) 25 (5.6)American Indian
Accommodations were not permitted 26 (6.0) ! 41 (7.0) ! 31 (5.3) ! 1 (***) 74 (6.0) ! 32 (4.9) !Accommodations were permitted 29 (7.6) ! 41 (7.6) ! 29 (6.9) ! 1 (***) 71 (7.6) ! 30 (6.9) !
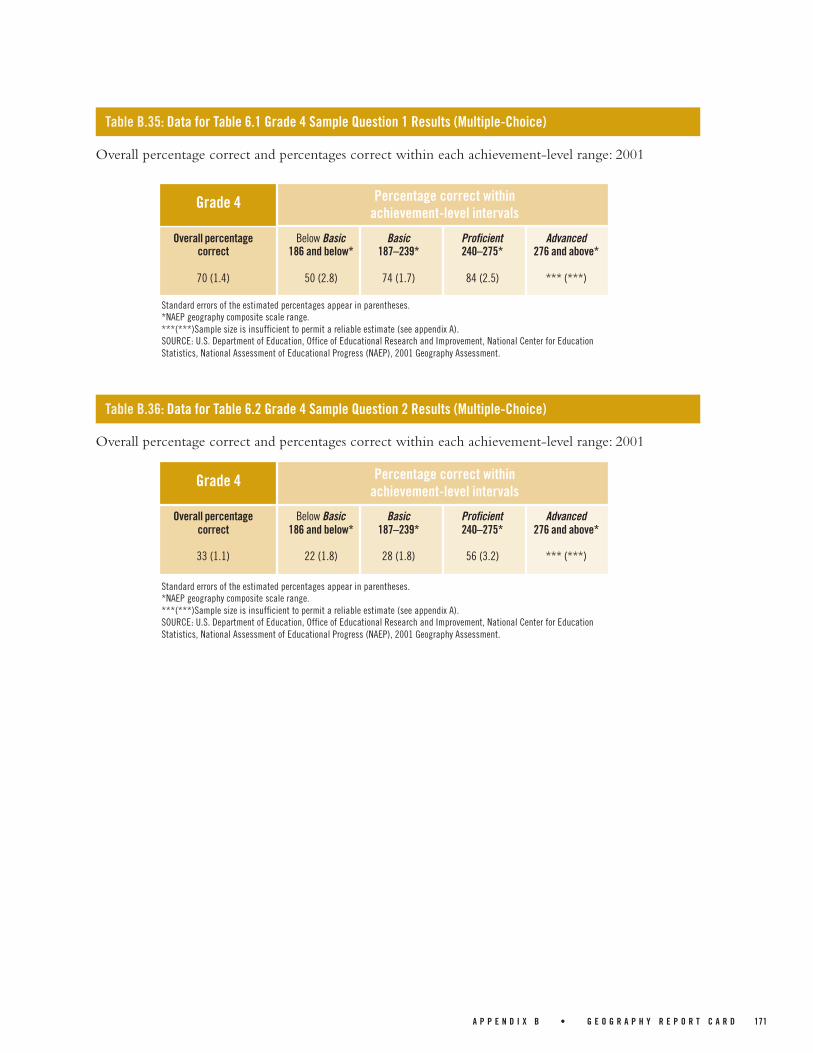
A P P E N D I X B • G E O G R A P H Y R E P O R T C A R D 171
Table B.36: Data for Table 6.2 Grade 4 Sample Question 2 Results (Multiple-Choice)
Table B.35: Data for Table 6.1 Grade 4 Sample Question 1 Results (Multiple-Choice)
Overall percentage correct and percentages correct within each achievement-level range: 2001
Standard errors of the estimated percentages appear in parentheses.*NAEP geography composite scale range.***(***)Sample size is insufficient to permit a reliable estimate (see appendix A).SOURCE: U.S. Department of Education, Office of Educational Research and Improvement, National Center for EducationStatistics, National Assessment of Educational Progress (NAEP), 2001 Geography Assessment.
Percentage correct withinachievement-level intervals
Overall percentage Below Basic Basic Proficient Advancedcorrect 186 and below* 187–239* 240–275* 276 and above*
70 (1.4) 50 (2.8) 74 (1.7) 84 (2.5) *** (***)
Grade 4
Overall percentage correct and percentages correct within each achievement-level range: 2001
Standard errors of the estimated percentages appear in parentheses.*NAEP geography composite scale range.***(***)Sample size is insufficient to permit a reliable estimate (see appendix A).SOURCE: U.S. Department of Education, Office of Educational Research and Improvement, National Center for EducationStatistics, National Assessment of Educational Progress (NAEP), 2001 Geography Assessment.
Percentage correct withinachievement-level intervals
Overall percentage Below Basic Basic Proficient Advancedcorrect 186 and below* 187–239* 240–275* 276 and above*
33 (1.1) 22 (1.8) 28 (1.8) 56 (3.2) *** (***)
Grade 4

172 A P P E N D I X B • G E O G R A P H Y R E P O R T C A R D
Table B.37: Data for Table 6.3a Grade 4 Sample Question 3 Results (“Complete” Short Constructed-Response)
Overall percentage “Complete” and percentages “Complete” within each achievement-level range:2001
Standard errors of the estimated percentages appear in parentheses.*NAEP geography composite scale range.***(***) Sample size is insufficient to permit a reliable estimate (see appendix A).SOURCE: U.S. Department of Education, Office of Educational Research and Improvement, National Center for EducationStatistics, National Assessment of Educational Progress (NAEP), 2001 Geography Assessment.
Percentage “Complete” withinachievement-level intervals
Overall percentage Below Basic Basic Proficient Advanced“Complete” 186 and below* 187–239* 240–275* 276 and above*
66 (1.4) 38 (2.3) 71 (2.0) 88 (2.3) *** (***)
Grade 4
Overall percentage “Partial” or better and percentages “Partial” or better within each achievement-level range: 2001
Standard errors of the estimated percentages appear in parentheses.*NAEP geography composite scale range.*** (***) Sample size is insufficient to permit a reliable estimate (see appendix A).SOURCE: U.S. Department of Education, Office of Educational Research and Improvement, National Center for EducationStatistics, National Assessment of Educational Progress (NAEP), 2001 Geography Assessment.
Percentage “Partial” or better withinachievement-level intervals
Overall percentage Below Basic Basic Proficient Advanced“Partial” or better 186 and below* 187–239* 240–275* 276 and above*
72 (1.4) 43 (2.5) 78 (1.8) 93 (2.3) *** (***)
Grade 4
Table B.38: Data for Table 6.3b Grade 4 Sample Question 3 Results (“Partial” Short Constructed-Response)

A P P E N D I X B • G E O G R A P H Y R E P O R T C A R D 173
Overall percentage “Complete” and percentages “Complete” within each achievement-level range: 2001
Percentage “Complete” withinachievement-level intervals
Overall percentage Below Basic Basic Proficient Advanced“Complete” or better 186 and below* 187–239* 240–275* 276 and above*
11 (0.8) 0 (***) 6 (1.2) 32 (3.4) *** (***)
Standard errors of the estimated percentages appear in parentheses.*NAEP geography composite scale range.*** (***) Sample size is insufficient to permit a reliable estimate (see appendix A).SOURCE: U.S. Department of Education, Office of Educational Research and Improvement, National Center for EducationStatistics, National Assessment of Educational Progress (NAEP), 2001 Geography Assessment.
Grade 4
Table B.39: Data for Table 6.4a Grade 4 Sample Question 4 Results (“Complete” Extended Constructed-Response)
Table B.40: Data for Table 6.4b Grade 4 Sample Question 4 Results (“Essential” Extended Constructed-Response)
Overall percentage “Essential” or better and percentages “Essential” or better within each achievement-level range: 2001
Percentage “Essential” or better withinachievement-level intervals
Overall percentage Below Basic Basic Proficient Advanced“Essential” or better 186 and below* 187–239* 240–275* 276 and above*
28 (1.3) 1 (0.6) 25 (2.1) 65 (3.8) *** (***)
Standard errors of the estimated percentages appear in parentheses.*NAEP geography composite scale range.***(***) Sample size is insufficient to permit a reliable estimate (see appendix A).SOURCE: U.S. Department of Education, Office of Educational Research and Improvement, National Center for EducationStatistics, National Assessment of Educational Progress (NAEP), 2001 Geography Assessment.
Grade 4
Table B.41: Data for Table 6.4c Grade 4 Sample Question 4 Results (“Partial” Extended Constructed-Response)
Overall percentage “Partial” or better and percentages “Partial” or better within each achievement-levelrange: 2001
Percentage “Partial” or better withinachievement-level intervals
Overall percentage Below Basic Basic Proficient Advanced“Partial” or better 186 and below* 187–239* 240–275* 276 and above*
38 (1.3) 4 (1.5) 36 (2.2) 78 (2.5) *** (***)
Standard errors of the estimated percentages appear in parentheses.*NAEP geography composite scale range.*** (***) Sample size is insufficient to permit a reliable estimate (see appendix A).SOURCE: U.S. Department of Education, Office of Educational Research and Improvement, National Center for EducationStatistics, National Assessment of Educational Progress (NAEP), 2001 Geography Assessment.
Grade 4

174 A P P E N D I X B • G E O G R A P H Y R E P O R T C A R D
Table B.42: Data for Table 6.5 Grade 8 Sample Question 5 Results (Multiple-Choice)
Overall percentage correct and percentages correct within each achievement-level range: 2001
Standard errors of the estimated percentages appear in parentheses.*NAEP geography composite scale range.(***) Standard error estimates cannot be accurately determined.SOURCE: U.S. Department of Education, Office of Educational Research and Improvement, National Center for EducationStatistics, National Assessment of Educational Progress (NAEP), 2001 Geography Assessment.
Percentage correct withinachievement-level intervals
Overall percentage Below Basic Basic Proficient Advancedcorrect 241 and below* 242–281* 282–314* 315 and above*
70 (1.2) 37 (2.3) 74 (1.7) 91 (1.5) 97 (***)
Grade 8
Table B.43: Data for Table 6.6 Grade 8 Sample Question 6 Results (Multiple-Choice)
Overall percentage correct and percentages correct within each achievement-level range: 2001
Standard errors of the estimated percentages appear in parentheses.*NAEP geography composite scale range.***(***) Sample size is insufficient to permit a reliable estimate (see appendix A).SOURCE: U.S. Department of Education, Office of Educational Research and Improvement, National Center for EducationStatistics, National Assessment of Educational Progress (NAEP), 2001 Geography Assessment.
Percentage correct withinachievement-level intervals
Overall percentage Below Basic Basic Proficient Advancedcorrect 241 and below* 242–281* 282–314* 315 and above*
50 (1.3) 36 (2.2) 47 (2.3) 64 (3.1) *** (***)
Grade 8

A P P E N D I X B • G E O G R A P H Y R E P O R T C A R D 175
Table B.45: Data for Table 6.8 Grade 8 Sample Question 8 Results (Multiple-Choice)
Overall percentage correct and percentages correct within each achievement-level range: 2001
Standard errors of the estimated percentages appear in parentheses.*NAEP geography composite scale range.SOURCE: U.S. Department of Education, Office of Educational Research and Improvement, National Center for EducationStatistics, National Assessment of Educational Progress (NAEP), 2001 Geography Assessment.
Percentage correct withinachievement-level intervals
Overall percentage Below Basic Basic Proficient Advancedcorrect 241 and below* 242–281* 282–314* 315 and above*
60 (1.4) 40 (2.6) 57 (2.0) 79 (2.7) 96 (1.7)
Grade 8
Table B.44: Data for Table 6.7 Grade 8 Sample Question 7 Results (Multiple-Choice)
Overall percentage correct and percentages correct within each achievement-level range: 2001
Standard errors of the estimated percentages appear in parentheses.*NAEP geography composite scale range.(***) Standard error estimates cannot be accurately determined.SOURCE: U.S. Department of Education, Office of Educational Research and Improvement, National Center for EducationStatistics, National Assessment of Educational Progress (NAEP), 2001 Geography Assessment.
Percentage correct withinachievement-level intervals
Overall percentage Below Basic Basic Proficient Advancedcorrect 241 and below* 242–281* 282–314* 315 and above*
74 (1.4) 40 (2.3) 80 (2.0) 93 (1.9) 100 (***)
Grade 8

176 A P P E N D I X B • G E O G R A P H Y R E P O R T C A R D
Table B.46: Data for Table 6.9a Grade 8 Sample Question 9 Results (“Complete” Short Constructed-Response)
Percentage “Complete” withinachievement-level intervals
Overall percentage Below Basic Basic Proficient Advanced“Complete” 241 and below* 242–281* 282–314* 315 and above*
22 (1.4) 6 (2.1) 18 (1.9) 38 (2.7) *** (***)
Overall percentage “Complete” and percentages “Complete” within each achievement-level range:2001
Standard errors of the estimated percentages appear in parentheses.*NAEP geography composite scale range.***(***) Sample size is insufficient to permit a reliable estimate (see appendix A).SOURCE: U.S. Department of Education, Office of Educational Research and Improvement, National Center for EducationStatistics, National Assessment of Educational Progress (NAEP), 2001 Geography Assessment.
Grade 8
Table B.47: Data for Table 6.9b Grade 8 Sample Question 9 Results (“Partial” Short Constructed-Response)
Percentage “Partial” or better withinachievement-level intervals
Overall percentage Below Basic Basic Proficient Advanced“Partial” or better 241 and below* 242–281* 282–314* 315 and above*
60 (1.3) 26 (2.5) 62 (2.1) 84 (2.3) *** (***)
Overall percentage “Partial” or better and percentages “Partial” or better within each achievement-level range: 2001
Standard errors of the estimated percentages appear in parentheses.*NAEP geography composite scale range.*** (***) Sample size is insufficient to permit a reliable estimate (see appendix A).SOURCE: U.S. Department of Education, Office of Educational Research and Improvement, National Center for EducationStatistics, National Assessment of Educational Progress (NAEP), 2001 Geography Assessment.
Grade 8

A P P E N D I X B • G E O G R A P H Y R E P O R T C A R D 177
Table B.49: Data for Table 6.11 Grade 12 Sample Question 11 Results (Multiple-Choice)
Overall percentage correct and percentages correct within each achievement-level range: 2001
Standard errors of the estimated percentages appear in parentheses.*NAEP geography composite scale range.***(***) Sample size is insufficient to permit a reliable estimate (see appendix A).SOURCE: U.S. Department of Education, Office of Educational Research and Improvement, National Center for EducationStatistics, National Assessment of Educational Progress (NAEP), 2001 Geography Assessment.
Percentage correct withinachievement-level intervals
Overall percentage Below Basic Basic Proficient Advancedcorrect 269 and below* 270–304* 305–338* 339 and above*
61 (1.4) 46 (2.3) 62 (2.2) 76 (3.3) *** (***)
Grade 12
Table B.48: Data for Table 6.10 Grade 12 Sample Question 10 Results (Multiple-Choice)
Overall percentage correct and percentages correct within each achievement-level range: 2001
Standard errors of the estimated percentages appear in parentheses.*NAEP geography composite scale range.(***) Standard error estimates cannot be accurately determined.***(***)Sample size is insufficient to permit a reliable estimate (see appendix A).SOURCE: U.S. Department of Education, Office of Educational Research and Improvement, National Center for EducationStatistics, National Assessment of Educational Progress (NAEP), 2001 Geography Assessment.
Percentage correct withinachievement-level intervals
Overall percentage Below Basic Basic Proficient Advancedcorrect 269 and below* 270–304* 305–338* 339 and above*
78 (1.2) 46 (2.3) 86 (1.6) 99 (***) *** (***)
Grade 12

178 A P P E N D I X B • G E O G R A P H Y R E P O R T C A R D
Table B.50: Data for Table 6.12a Grade 12 Sample Question 12 Results (“Complete” Short Constructed-Response)
Overall percentage “Complete” and percentages “Complete” within each achievement-level range: 2001
Percentage “Complete” withinachievement-level intervals
Overall percentage Below Basic Basic Proficient Advanced“Complete” 269 and below* 270–304* 305–338* 339 and above*
47 (1.3) 17 (1.9) 52 (2.1) 70 (3.2) *** (***)
Standard errors of the estimated percentages appear in parentheses.*NAEP Geography composite scale range.***(***) Sample size is insufficient to permit a reliable estimate (see appendix A).SOURCE: U.S. Department of Education, Office of Educational Research and Improvement, National Center for EducationStatistics, National Assessment of Educational Progress (NAEP), 2001 Geography Assessment.
Grade 12
Percentage “Partial” or better withinachievement-level intervals
Overall percentage Below Basic Basic Proficient Advanced“Partial” or better 269 and below* 270–304* 305–338* 339 and above*
76 (1.2) 42 (2.8) 85 (1.4) 96 (1.4) *** (***)
Overall percentage “Partial” or better and percentages “Partial” or better within each achievement-levelrange: 2001
Standard errors of the estimated percentages appear in parentheses.*NAEP Geography composite scale range.***(***) Sample size is insufficient to permit a reliable estimate (see appendix A).SOURCE: U.S. Department of Education, Office of Educational Research and Improvement, National Center for EducationStatistics, National Assessment of Educational Progress (NAEP), 2001 Geography Assessment.
Grade 12
Table B.51 Data for Table 6.12b Grade 12 Sample Question 12 Results (“Partial” Short Constructed-Response)

A P P E N D I X B • G E O G R A P H Y R E P O R T C A R D 179
Percentage “Complete” withinachievement-level intervals
Overall percentage Below Basic Basic Proficient Advanced“Complete” 269 and below* 270–304* 305–338* 339 and above*
16 (0.9) 2 (0.9) 15 (1.3) 33 (3.0) *** (***)
Overall percentage “Complete” and percentages “Complete” within each achievement-level range:2001
Standard errors of the estimated percentages appear in parentheses.*NAEP geography composite scale range.*** (***) Sample size is insufficient to permit a reliable estimate (see appendix A).SOURCE: U.S. Department of Education, Office of Educational Research and Improvement, National Center for EducationStatistics, National Assessment of Educational Progress (NAEP), 2001 Geography Assessment.
Grade 12
Table B.52: Data for Table 6.13a Grade 12 Sample Question 13 Results (“Complete” Short Constructed-Response)
Percentage “Partial” or better withinachievement-level intervals
Overall percentage Below Basic Basic Proficient Advanced“Partial” or better 269 and below* 270–304* 305–338* 339 and above*
51 (1.7) 18 (2.1) 57 (2.0) 79 (2.7) *** (***)
Overall percentage “Partial” or better and percentages “Partial” or better within each achievement-levelrange: 2001
Standard errors of the estimated percentages appear in parentheses.*NAEP geography composite scale range.*** (***) Sample size is insufficient to permit a reliable estimate (see appendix A).SOURCE: U.S. Department of Education, Office of Educational Research and Improvement, National Center for EducationStatistics, National Assessment of Educational Progress (NAEP), 2001 Geography Assessment.
Grade 12
Table B.53: Data for Table 6.13b Grade 12 Sample Question 13 Results (“Partial” Short Constructed-Response)


A P P E N D I X C • G E O G R A P H Y R E P O R T C A R D 181
Appendix CMembers of theNAEP Geography Standing CommitteeC
Sarah BednarzDepartment of GeographyTexas A&M UniversityCollege Station, TX
Kristi DesaulniersTea Primary SchoolTea, SD
Norman BettisDept. of Curriculum & InstructionIllinois State UniversityNormal, IL
Richard BoehmDepartment of Geography and PlanningSouthwest Texas State UniversitySan Marcos, TX
Leah Bug-TownsendClair E. Gale Jr. High SchoolIdaho Falls, IDPresent affiliation:Idaho/Oregon NASA RepresentativeNASA Ames Research CenterIdaho Falls, ID
Karen ConeyStone Scholastic AcademyChicago, IL
Roger DownsChairman, Department of GeographyThe Pennsylvania State UniversityUniversity Park, PA
Briavel HolcombDepartment of Urban Studies and Community HealthE. J. Bloustein School of PlanningRutgers UniversityNew Brunswick, NJ
Marianne KenneyColorado Department of EducationDenver, COPresent affiliation:McRELAurora, CO
R. Keith LuceroEast High SchoolDenver, CO
James Marran(Retired) New Trier Twp. High SchoolWinnetka, IL
Ines MiyaresDepartment of GeographyHunter CollegeNew York, NY
Barbara PattyArkansas Department of EducationLittle Rock, AR
Tom WissingerHarrington Middle SchoolMt. Laurel, NJ

182 A C K N O W L E D G M E N T S • G E O G R A P H Y R E P O R T C A R D
AcknowledgmentsThis report is the culmination of the effort of many individuals who contributed their considerableknowledge, experience, and creativity to the NAEP 2001 geography assessment. The assessmentwas a collaborative effort among staff from the National Center for Education Statistics (NCES),the National Assessment Governing Board (NAGB), Educational Testing Service (ETS), Westat, andNational Computer Systems (NCS). Most importantly, NAEP is grateful to the students andschool staff who made the assessment possible.
The 2001 NAEP geography assessment was funded through NCES, in the Office of EducationalResearch and Improvement of the U.S. Department of Education. The Deputy Commissioner ofEducation Statistics, Gary W. Phillips, and the NCES staff—Peggy Carr, Arnold Goldstein, CarolJohnson, and Andrew Kolstad—worked closely and collegially with the authors to produce thisreport.
The NAEP project at ETS is directed by Stephen Lazer and John Mazzeo, with assistance fromJohn Barone. Sampling and data collection activities were conducted by Westat under the directionof Rene Slobasky, Nancy Caldwell, Keith Rust, and Dianne Walsh. Printing, distribution, scoring,and processing activities were conducted by NCS under the direction of Brad Thayer, ConnieSmith, and William Buckles.
Test development activities took place at ETS under the direction of Andy Weiss with assistancefrom Barbara Hildebrant and John Kasbarian.
The complex statistical and psychometric activities necessary to report results for the NAEP2001 geography assessment were directed by Catherine Hombo and Matthew Johnson, withassistance from Hui Deng. Frank Jenkins, advised by Matthew Johnson, supervised the analyses thatproduced results for the data for which student accommodations were permitted.
The extensive data processing and computer programming activities underlying the statisticaland psychometric analyses conducted at ETS are under the direction of David Freund, EdwardKulick, Bruce Kaplan, and Steven Isham. Data Analyses presented in this report were managed byScott Davis with assistance from Mei-jang Lin, Christina Tang, Norma Norris, and Alfred Rogers.The complex database work for this assessment was managed by Katherine Pashley with assistancefrom Gerry Kokolis.
The design and production of this report was overseen by Loretta Casalaina. Joseph Kolodey andRick Hasney contributed invaluable design and production expertise to the effort. Wendy Griggcoordinated the documentation and data checking procedures with assistance from Janice Goodis,Andrea Bergen, and Alice Kass. Shari Santapau coordinated the editorial and proofreading proce-dures with assistance from Valerie Mukuna and Julia McGuire. The Web version of this report wascoordinated by Pat O’Reilly with assistance from Rick Hasney.
Many thanks are due to the numerous reviewers, both internal and external to NCES and ETS.The comments and critical feedback of the following reviewers are reflected in the final version ofthis report: Ghedam Bairu, Teresa Calahan, Young Chun, Douglas Cohrane, Mary Crovo, RogerDowns, Steven Gorman, Carol Johnson, Dana Kelly, Andrew Kolstad, Marilyn McMillen, BarbaraPatty, Taslima Rahman, Patrick Rooney and Sharif Shakrani.


United StatesDepartment of EducationED Pubs8242-B Sandy CourtJessup, MD 20794-1398
Official Business OnlyPenalty for Private Use, $300
Postage and Fees PaidU.S. Department of Education
Permit No. G-17
Parcel
Related Documents