APPRAISAL REPORT 70-UNIT PERMANENT SUPPORTIVE HOUSING (PSH) PROJECT Anaheim, California _______________________________________________

Welcome message from author
This document is posted to help you gain knowledge. Please leave a comment to let me know what you think about it! Share it to your friends and learn new things together.
Transcript
APPRAISAL REPORT
70-UNIT PERMANENT SUPPORTIVE HOUSING (PSH) PROJECT
Anaheim, California _______________________________________________
APPRAISAL REPORT
70-UNIT PERMANENT SUPPORTIVE HOUSING (PSH) PROJECT
Anaheim, California ___________________________________________
SUBMITTED TO:
SUBMITTED BY:
TLP * REALTY ADVISORS
30497 Canwood Street, Suite 201Agoura Hills, CA 91301Telephone 818-851-9474
Email: [email protected]: www.TLPRA.com
File No.: 20-224
DATES OF VALUE:
March 1, 2020 - Fee Simple Market Value As IsMay 1, 2021 - Leased Fee PMVCC
November 1, 2021 - Leased Fee PMVSO
DATE OF REPORT:
July 9, 2020
July 9, 2020
RE:
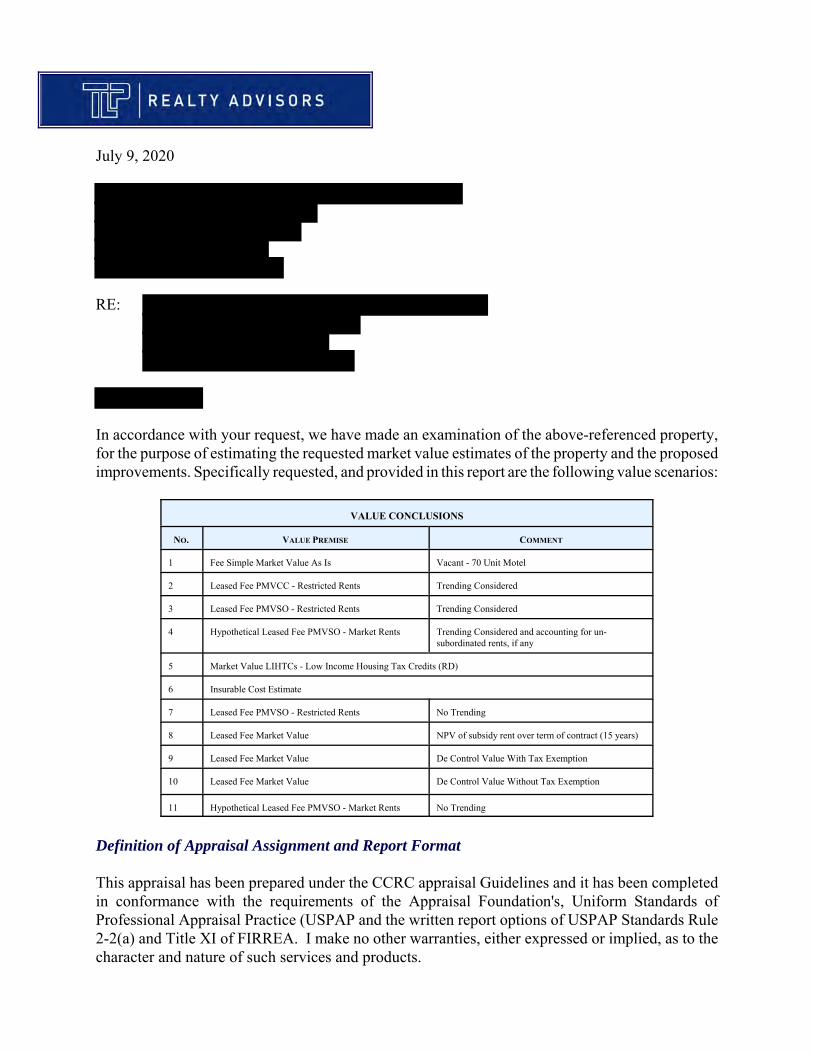
In accordance with your request, we have made an examination of the above-referenced property,for the purpose of estimating the requested market value estimates of the property and the proposedimprovements. Specifically requested, and provided in this report are the following value scenarios:
VALUE CONCLUSIONS
NO. VALUE PREMISE COMMENT
1 Fee Simple Market Value As Is Vacant - 70 Unit Motel
2 Leased Fee PMVCC - Restricted Rents Trending Considered
3 Leased Fee PMVSO - Restricted Rents Trending Considered
4 Hypothetical Leased Fee PMVSO - Market Rents Trending Considered and accounting for un-subordinated rents, if any
5 Market Value LIHTCs - Low Income Housing Tax Credits (RD)
6 Insurable Cost Estimate
7 Leased Fee PMVSO - Restricted Rents No Trending
8 Leased Fee Market Value NPV of subsidy rent over term of contract (15 years)
9 Leased Fee Market Value De Control Value With Tax Exemption
10 Leased Fee Market Value De Control Value Without Tax Exemption
11 Hypothetical Leased Fee PMVSO - Market Rents No Trending
Definition of Appraisal Assignment and Report Format
This appraisal has been prepared under the CCRC appraisal Guidelines and it has been completedin conformance with the requirements of the Appraisal Foundation's, Uniform Standards ofProfessional Appraisal Practice (USPAP and the written report options of USPAP Standards Rule2-2(a) and Title XI of FIRREA. I make no other warranties, either expressed or implied, as to thecharacter and nature of such services and products.
Property Summary
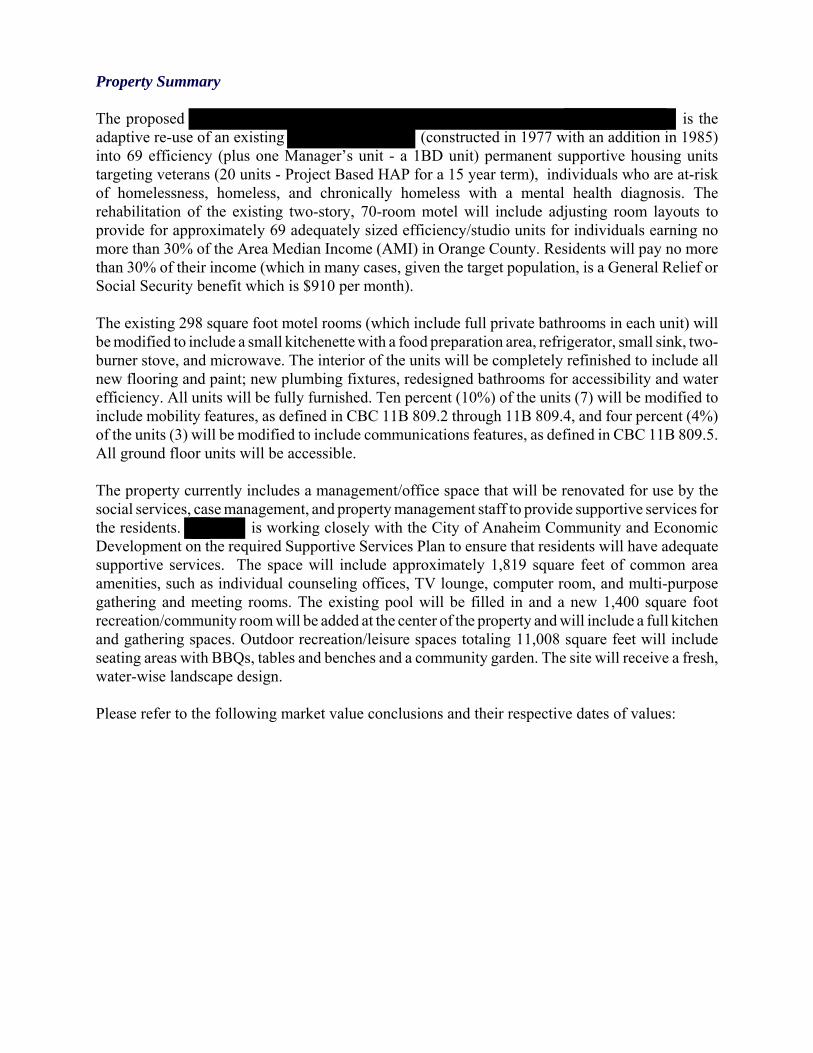
The proposed is theadaptive re-use of an existing (constructed in 1977 with an addition in 1985)into 69 efficiency (plus one Manager’s unit - a 1BD unit) permanent supportive housing unitstargeting veterans (20 units - Project Based HAP for a 15 year term), individuals who are at-riskof homelessness, homeless, and chronically homeless with a mental health diagnosis. Therehabilitation of the existing two-story, 70-room motel will include adjusting room layouts toprovide for approximately 69 adequately sized efficiency/studio units for individuals earning nomore than 30% of the Area Median Income (AMI) in Orange County. Residents will pay no morethan 30% of their income (which in many cases, given the target population, is a General Relief orSocial Security benefit which is $910 per month).
The existing 298 square foot motel rooms (which include full private bathrooms in each unit) willbe modified to include a small kitchenette with a food preparation area, refrigerator, small sink, two-burner stove, and microwave. The interior of the units will be completely refinished to include allnew flooring and paint; new plumbing fixtures, redesigned bathrooms for accessibility and waterefficiency. All units will be fully furnished. Ten percent (10%) of the units (7) will be modified toinclude mobility features, as defined in CBC 11B 809.2 through 11B 809.4, and four percent (4%)of the units (3) will be modified to include communications features, as defined in CBC 11B 809.5.All ground floor units will be accessible.
The property currently includes a management/office space that will be renovated for use by thesocial services, case management, and property management staff to provide supportive services forthe residents. is working closely with the City of Anaheim Community and EconomicDevelopment on the required Supportive Services Plan to ensure that residents will have adequatesupportive services. The space will include approximately 1,819 square feet of common areaamenities, such as individual counseling offices, TV lounge, computer room, and multi-purposegathering and meeting rooms. The existing pool will be filled in and a new 1,400 square footrecreation/community room will be added at the center of the property and will include a full kitchenand gathering spaces. Outdoor recreation/leisure spaces totaling 11,008 square feet will includeseating areas with BBQs, tables and benches and a community garden. The site will receive a fresh,water-wise landscape design.
Please refer to the following market value conclusions and their respective dates of values:
VALUE CONCLUSIONS
NO. VALUE PREMISE COMMENT DATE OF
VALUE
VALUE
CONCLUSION
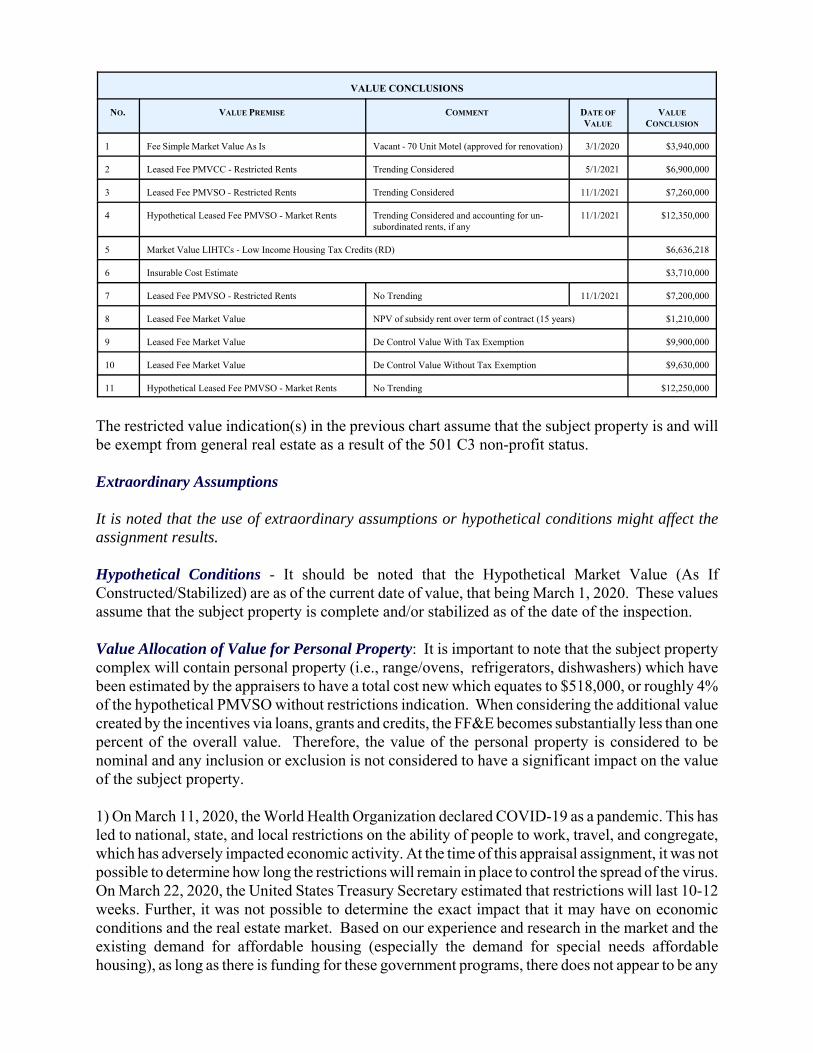
1 Fee Simple Market Value As Is Vacant - 70 Unit Motel (approved for renovation) 3/1/2020 $3,940,000
2 Leased Fee PMVCC - Restricted Rents Trending Considered 5/1/2021 $6,900,000
3 Leased Fee PMVSO - Restricted Rents Trending Considered 11/1/2021 $7,260,000
4 Hypothetical Leased Fee PMVSO - Market Rents Trending Considered and accounting for un-subordinated rents, if any
11/1/2021 $12,350,000
5 Market Value LIHTCs - Low Income Housing Tax Credits (RD) $6,636,218
6 Insurable Cost Estimate $3,710,000
7 Leased Fee PMVSO - Restricted Rents No Trending 11/1/2021 $7,200,000
8 Leased Fee Market Value NPV of subsidy rent over term of contract (15 years) $1,210,000
9 Leased Fee Market Value De Control Value With Tax Exemption $9,900,000
10 Leased Fee Market Value De Control Value Without Tax Exemption $9,630,000
11 Hypothetical Leased Fee PMVSO - Market Rents No Trending $12,250,000
The restricted value indication(s) in the previous chart assume that the subject property is and willbe exempt from general real estate as a result of the 501 C3 non-profit status.
Extraordinary Assumptions
It is noted that the use of extraordinary assumptions or hypothetical conditions might affect theassignment results.
Hypothetical Conditions - It should be noted that the Hypothetical Market Value (As IfConstructed/Stabilized) are as of the current date of value, that being March 1, 2020. These valuesassume that the subject property is complete and/or stabilized as of the date of the inspection.
Value Allocation of Value for Personal Property: It is important to note that the subject propertycomplex will contain personal property (i.e., range/ovens, refrigerators, dishwashers) which havebeen estimated by the appraisers to have a total cost new which equates to $518,000, or roughly 4%of the hypothetical PMVSO without restrictions indication. When considering the additional valuecreated by the incentives via loans, grants and credits, the FF&E becomes substantially less than onepercent of the overall value. Therefore, the value of the personal property is considered to benominal and any inclusion or exclusion is not considered to have a significant impact on the valueof the subject property.
1) On March 11, 2020, the World Health Organization declared COVID-19 as a pandemic. This hasled to national, state, and local restrictions on the ability of people to work, travel, and congregate,which has adversely impacted economic activity. At the time of this appraisal assignment, it was notpossible to determine how long the restrictions will remain in place to control the spread of the virus.On March 22, 2020, the United States Treasury Secretary estimated that restrictions will last 10-12weeks. Further, it was not possible to determine the exact impact that it may have on economicconditions and the real estate market. Based on our experience and research in the market and theexisting demand for affordable housing (especially the demand for special needs affordablehousing), as long as there is funding for these government programs, there does not appear to be any
major negative impact from COVID-19 on the subject property. Any short term impact may berealized in a delay in lease up (due to government slow or shut downs), however, the long termimpact is deemed to be negligible (assuming these programs remain publicly or privately funded).
2) The appraisers were provided with a preliminary title report from First American Title InsuranceCompany dated January 22, 2020 (File No. NCS-876497-A-SA1). It is an extraordinary assumptionof this appraisal report that (other than noted) there are no additional easements, regulatoryagreements, covenants or restrictions which encumber the subject property and would prohibit thesite's highest and best use, other than those outlined in this report.
3) It is an extraordinary assumption of this appraisal report that the unit mix information (and unitsizes) as derived from the architectural plans are accurate.
4) It is an extraordinary assumption of this appraisal report that the construction cost estimates andcosts spent to date (as provided verbally to the appraiser by the developer) are reasonably accurate.
5) The previous restricted value indication(s) assume that the subject property as proposed will beexempt from general real estate taxes as a result of their proposed non-profit ownership status 501C3. The appraisers were not provided with any documentation regarding the subject’s non-profitownership entity. If the ownership entity does not qualify for non-profit status, which wouldpreclude them from paying general real estate taxes, then there would be a considerable impact onthe restricted values scenario(s) (assuming general real estate taxes were incorporated into theoperating expenses).
6) For purposes of determining the Fee Simple As Is Market Value Conclusion, we added the costsspent to date and deducted the demolition costs from the land value as if vacant. We did not includeany of the tenant relocation incentive costs due to the fact that the property was reportedly 100%vacant at the time of sale (Extraordinary Assumption that this is correct and there are no remainingrelocation incentives). It is also an extraordinary assumption that the costs spent to date arereasonably accurate.
7) The subject site is zoned C-G (General Commercial) by the City of Anaheim. It is anextraordinary assumption of this report that all conditions imposed by all appropriate governmentalagencies are implemented by the developer during construction and post construction / lease up.
8) The restricted rental rates utilized in this report were derived from the owner. It is anextraordinary assumption of this appraisal report that the restricted rental rates are accurate and thelien priority placement is accurate.
9) We were not provided with a Phase I Environmental Site Assessment Report. Soil conditionsappear suitable for virtually all types of development. A physical inspection of the site andadjoining land uses did not indicate any adverse soil conditions. It is an extraordinary assumptionof this report that the value of the property is not impacted by any hazardous soil conditions. Weare not experts in this field and we recommend the services of an expert be employed

Your attention is invited to the accompanying report, where is set out the assumptions, limitingconditions, descriptions, factual data, computations, photographs, analysis, and discussions, fromwhich the valuation conclusion was derived.
Respectfully submitted,
TLP REALTY ADVISORS
Trent Pollard * CEO-PresidentState Cert. #AG024705 | Expiration 1/9/2021
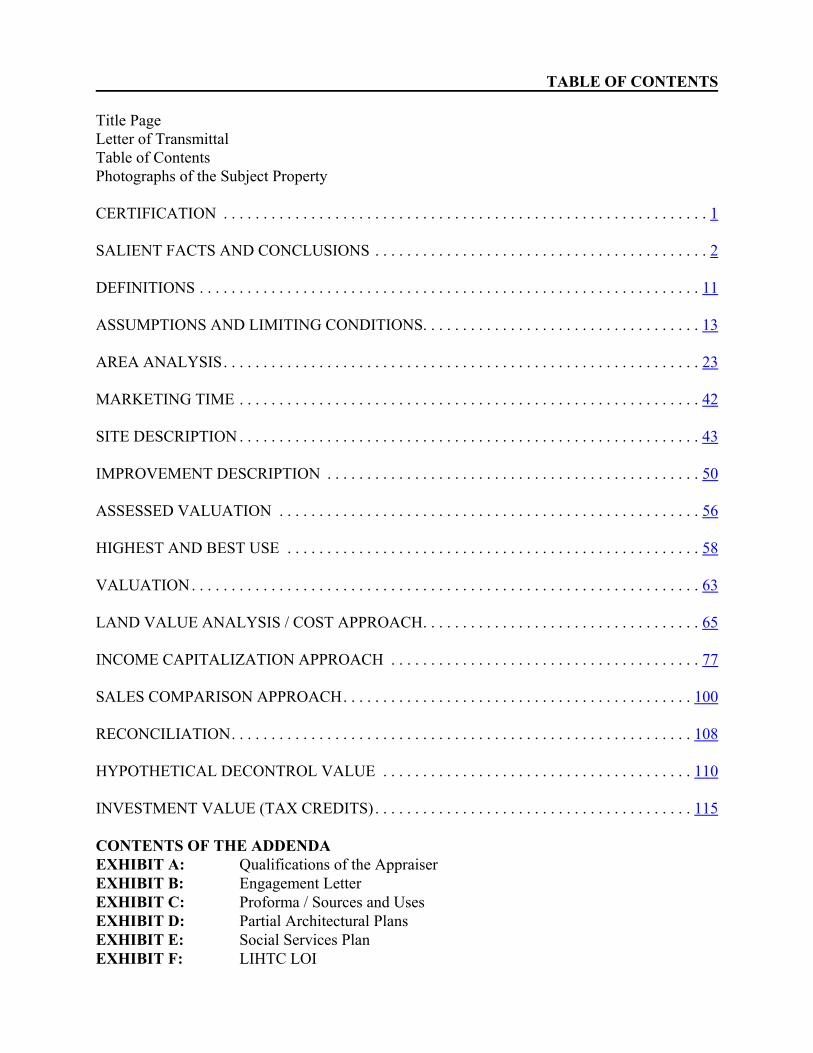
TABLE OF CONTENTS
Title PageLetter of TransmittalTable of ContentsPhotographs of the Subject Property
CERTIFICATION . . . . . . . . . . . . . . . . . . . . . . . . . . . . . . . . . . . . . . . . . . . . . . . . . . . . . . . . . . . . . 1
SALIENT FACTS AND CONCLUSIONS . . . . . . . . . . . . . . . . . . . . . . . . . . . . . . . . . . . . . . . . . . 2
DEFINITIONS . . . . . . . . . . . . . . . . . . . . . . . . . . . . . . . . . . . . . . . . . . . . . . . . . . . . . . . . . . . . . . . 11
ASSUMPTIONS AND LIMITING CONDITIONS. . . . . . . . . . . . . . . . . . . . . . . . . . . . . . . . . . . 13
AREA ANALYSIS. . . . . . . . . . . . . . . . . . . . . . . . . . . . . . . . . . . . . . . . . . . . . . . . . . . . . . . . . . . . 23
MARKETING TIME . . . . . . . . . . . . . . . . . . . . . . . . . . . . . . . . . . . . . . . . . . . . . . . . . . . . . . . . . . 42
SITE DESCRIPTION . . . . . . . . . . . . . . . . . . . . . . . . . . . . . . . . . . . . . . . . . . . . . . . . . . . . . . . . . . 43
IMPROVEMENT DESCRIPTION . . . . . . . . . . . . . . . . . . . . . . . . . . . . . . . . . . . . . . . . . . . . . . . 50
ASSESSED VALUATION . . . . . . . . . . . . . . . . . . . . . . . . . . . . . . . . . . . . . . . . . . . . . . . . . . . . . 56
HIGHEST AND BEST USE . . . . . . . . . . . . . . . . . . . . . . . . . . . . . . . . . . . . . . . . . . . . . . . . . . . . 58
VALUATION. . . . . . . . . . . . . . . . . . . . . . . . . . . . . . . . . . . . . . . . . . . . . . . . . . . . . . . . . . . . . . . . 63
LAND VALUE ANALYSIS / COST APPROACH. . . . . . . . . . . . . . . . . . . . . . . . . . . . . . . . . . . 65
INCOME CAPITALIZATION APPROACH . . . . . . . . . . . . . . . . . . . . . . . . . . . . . . . . . . . . . . . 77
SALES COMPARISON APPROACH. . . . . . . . . . . . . . . . . . . . . . . . . . . . . . . . . . . . . . . . . . . . 100
RECONCILIATION. . . . . . . . . . . . . . . . . . . . . . . . . . . . . . . . . . . . . . . . . . . . . . . . . . . . . . . . . . 108
HYPOTHETICAL DECONTROL VALUE . . . . . . . . . . . . . . . . . . . . . . . . . . . . . . . . . . . . . . . 110
INVESTMENT VALUE (TAX CREDITS) . . . . . . . . . . . . . . . . . . . . . . . . . . . . . . . . . . . . . . . . 115
CONTENTS OF THE ADDENDAEXHIBIT A: Qualifications of the AppraiserEXHIBIT B: Engagement LetterEXHIBIT C: Proforma / Sources and UsesEXHIBIT D: Partial Architectural PlansEXHIBIT E: Social Services PlanEXHIBIT F: LIHTC LOI
SUBJECT PHOTOGRAPHS
View of open parking and building elevationNorthwest view of the subject from West La Palma Avenue
Pool area (vacated)Additional view of open parking and building elevation
Previous reception area Additional view of previous reception area
SUBJECT PHOTOGRAPHS
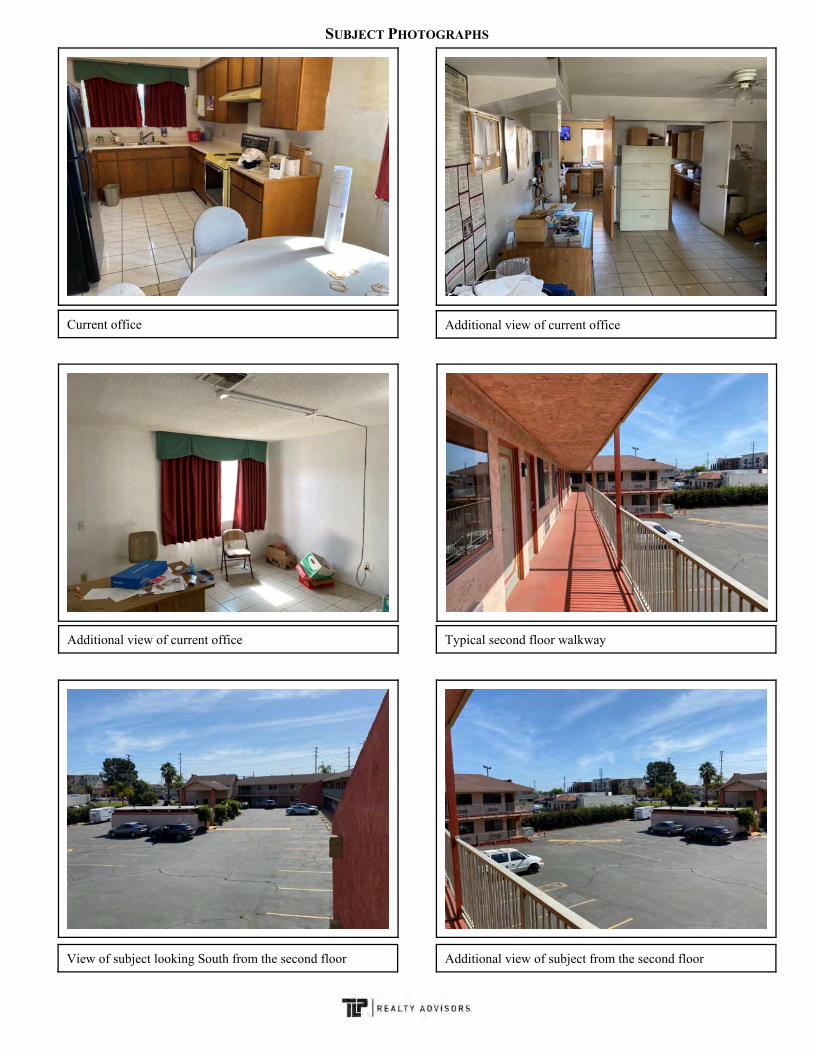
Additional view of current officeCurrent office
Typical second floor walkwayAdditional view of current office
View of subject looking South from the second floor Additional view of subject from the second floor
SUBJECT PHOTOGRAPHS
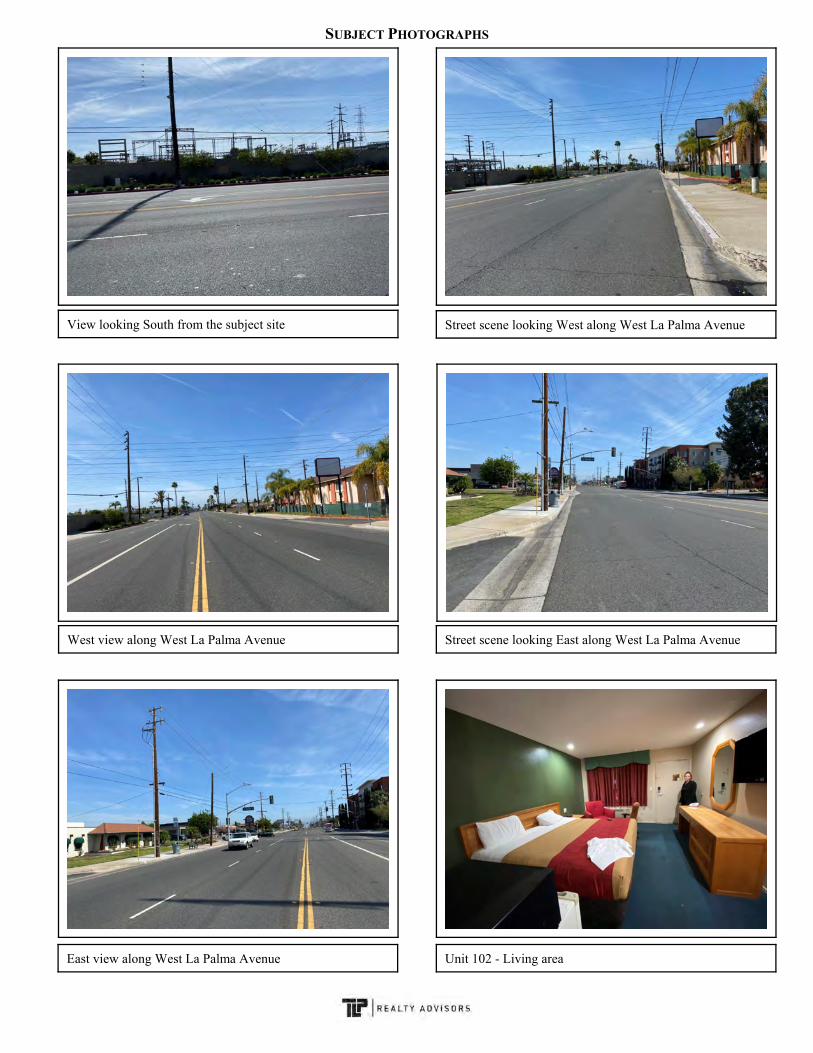
Street scene looking West along West La Palma AvenueView looking South from the subject site
Street scene looking East along West La Palma AvenueWest view along West La Palma Avenue
East view along West La Palma Avenue Unit 102 - Living area
SUBJECT PHOTOGRAPHS
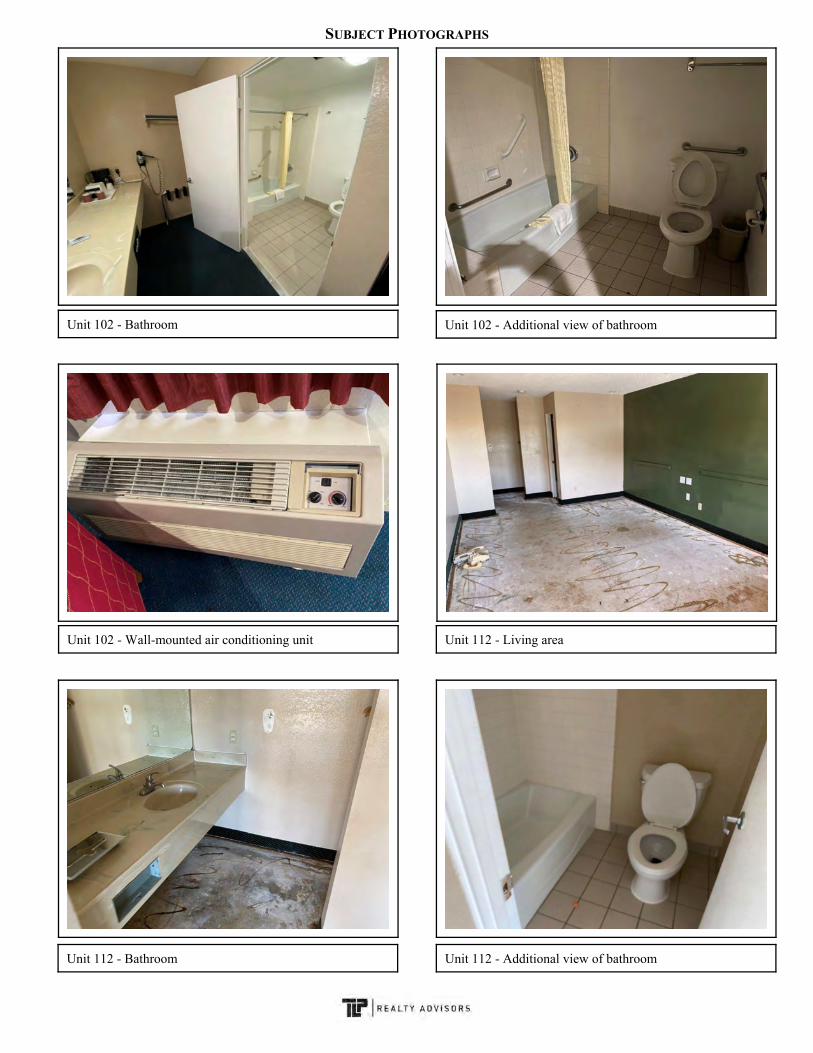
Unit 102 - Additional view of bathroomUnit 102 - Bathroom
Unit 112 - Living areaUnit 102 - Wall-mounted air conditioning unit
Unit 112 - Bathroom Unit 112 - Additional view of bathroom
SUBJECT PHOTOGRAPHS
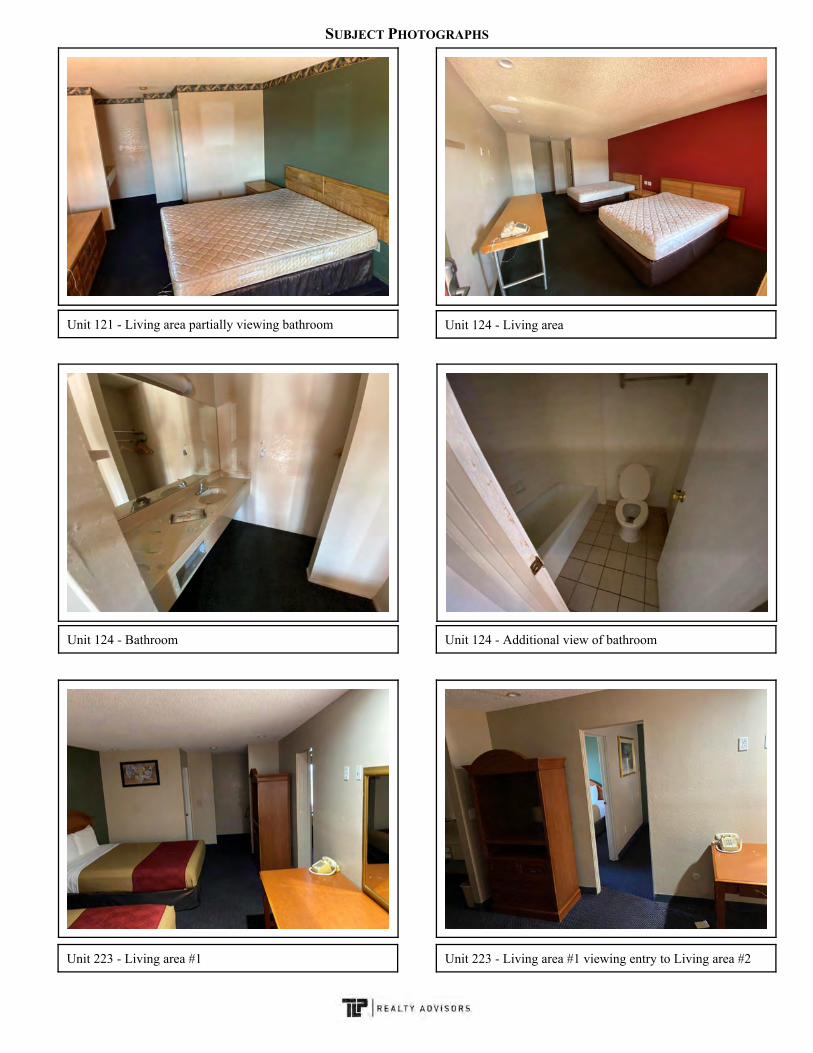
Unit 124 - Living areaUnit 121 - Living area partially viewing bathroom
Unit 124 - Additional view of bathroomUnit 124 - Bathroom
Unit 223 - Living area #1 Unit 223 - Living area #1 viewing entry to Living area #2
SUBJECT PHOTOGRAPHS
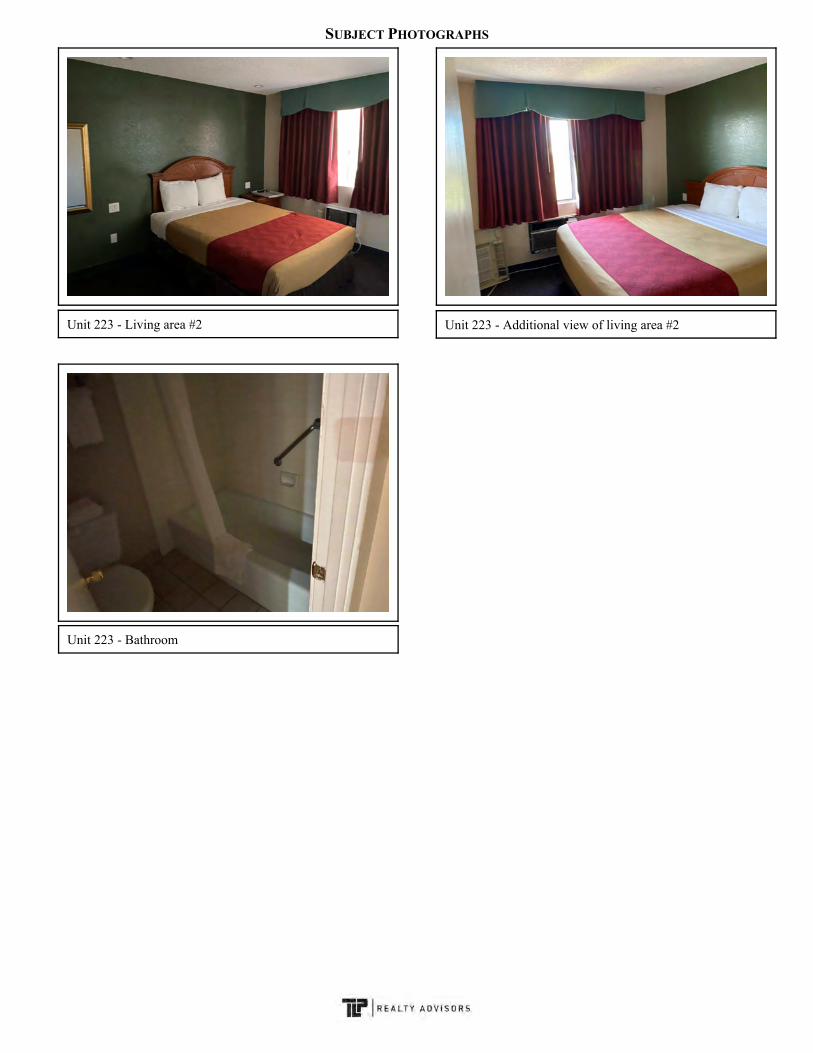
Unit 223 - Additional view of living area #2Unit 223 - Living area #2
Unit 223 - Bathroom
CERTIFICATION
I certify that, to the best of my knowledge and belief:
1) The statements of fact contained in this report are true and correct.
2) The reported analysis, opinions, and conclusions are limited only by the reported assumptions and limitingconditions, and are my personal, impartial, and unbiased professional analyses, opinions, and conclusions.
3) I have no present or prospective interest in the property that is the subject of this report, and I have no personalinterest or bias with respect to the parties involved.
4) I have performed no services, as an appraiser or in any other capacity, regarding the property that is the subject ofthis report within the three-year period immediately preceding the agreement to perform this assignment.
5) I have no bias with respect to the property that is the subject of this report or to the parties involved with thisassignment.
6) My engagement in this assignment was not contingent upon developing or reporting predetermined results.
7) My compensation for completing this assignment is not contingent upon the development or reporting of apredetermined value or direction in value that favors the cause of the client, the amount of the value opinion, theattainment of a stipulated result, or the occurrence of a subsequent event directly related to the intended use of thisappraisal.
8) My analyses, opinions, and conclusions were developed were developed, and this report has been prepared, inconformity with the Uniform Standards of Professional Appraisal Practice (USPAP) and the requirements of theCode of Professional Ethics and the Standards of Professional Practice of the Appraisal Institute.
9) I have made a personal inspection of the property that is the subject of this report.
10) No one provided significant real property appraisal assistance to the person signing this certification.
11) The use of this report is subject to the requirements of the Appraisal Institute relating to review by its dulyauthorized representatives.
12) I have the knowledge and experience to complete this assignment competently and have appraised this property typebefore.
13) The appraiser did not base, either partially or completely, the analysis, or estimate of value on the race, color,religion, sex, handicap, familial status, health or national origin of either the present or prospective owners,occupants, or users of the subject property or of the of the present or prospective owners, occupants or users of theproperties in the vicinity of the subject property.
14) As of the date of this report Trent Pollard (AG024705 - exp 1/9/21) is a California State Certified General RealEstate Appraiser.
15) I have not performed services as an appraiser regarding the property that is the subject of this report within thethree-year period immediately preceding acceptance of this assignment.
Respectfully submitted,TLP * REALTY ADVISORS
Trent Pollard * PresidentState Cert. #AG024705 - Expiration 1/9/2021
1

PREMISES OF THE APPRAISAL
2
SALIENT FACTS AND CONCLUSIONS
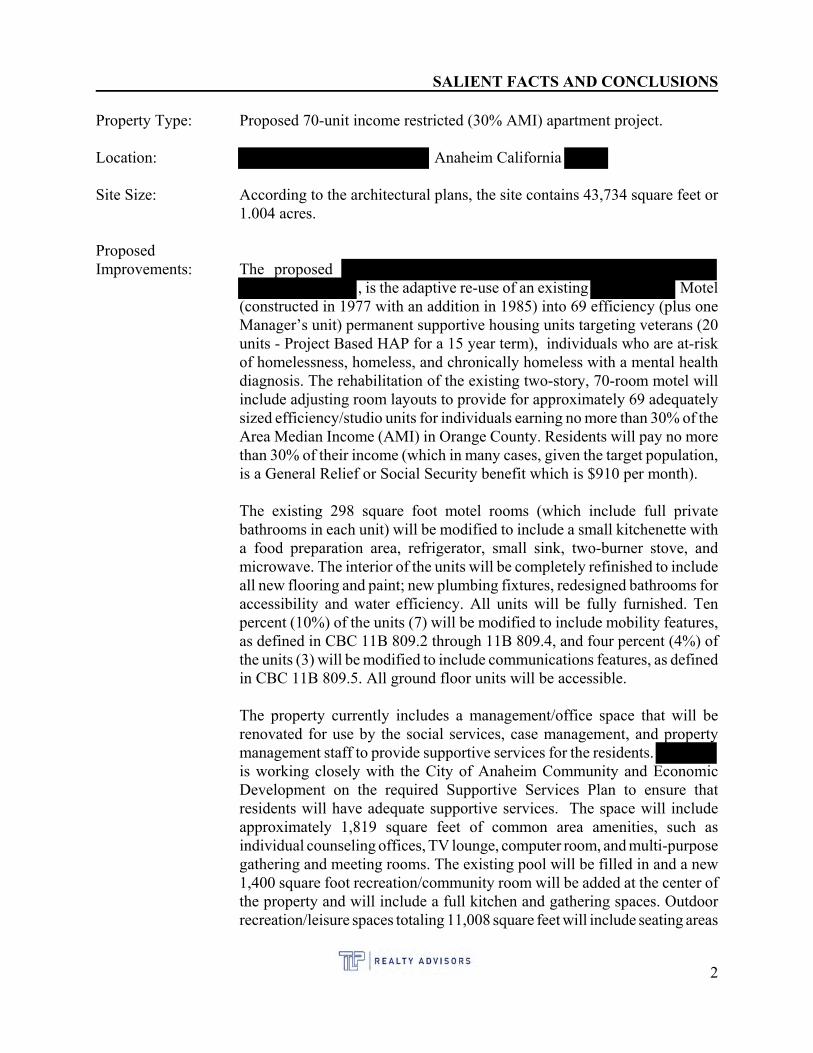
Property Type: Proposed 70-unit income restricted (30% AMI) apartment project.
Location: Anaheim California
Site Size: According to the architectural plans, the site contains 43,734 square feet or1.004 acres.
ProposedImprovements: The proposed
, is the adaptive re-use of an existing Motel(constructed in 1977 with an addition in 1985) into 69 efficiency (plus oneManager’s unit) permanent supportive housing units targeting veterans (20units - Project Based HAP for a 15 year term), individuals who are at-riskof homelessness, homeless, and chronically homeless with a mental healthdiagnosis. The rehabilitation of the existing two-story, 70-room motel willinclude adjusting room layouts to provide for approximately 69 adequatelysized efficiency/studio units for individuals earning no more than 30% of theArea Median Income (AMI) in Orange County. Residents will pay no morethan 30% of their income (which in many cases, given the target population,is a General Relief or Social Security benefit which is $910 per month).
The existing 298 square foot motel rooms (which include full privatebathrooms in each unit) will be modified to include a small kitchenette witha food preparation area, refrigerator, small sink, two-burner stove, andmicrowave. The interior of the units will be completely refinished to includeall new flooring and paint; new plumbing fixtures, redesigned bathrooms foraccessibility and water efficiency. All units will be fully furnished. Tenpercent (10%) of the units (7) will be modified to include mobility features,as defined in CBC 11B 809.2 through 11B 809.4, and four percent (4%) ofthe units (3) will be modified to include communications features, as definedin CBC 11B 809.5. All ground floor units will be accessible.
The property currently includes a management/office space that will berenovated for use by the social services, case management, and propertymanagement staff to provide supportive services for the residents.is working closely with the City of Anaheim Community and EconomicDevelopment on the required Supportive Services Plan to ensure thatresidents will have adequate supportive services. The space will includeapproximately 1,819 square feet of common area amenities, such asindividual counseling offices, TV lounge, computer room, and multi-purposegathering and meeting rooms. The existing pool will be filled in and a new1,400 square foot recreation/community room will be added at the center ofthe property and will include a full kitchen and gathering spaces. Outdoorrecreation/leisure spaces totaling 11,008 square feet will include seating areas
2
SALIENT FACTS AND CONCLUSIONS (CONTINUED)
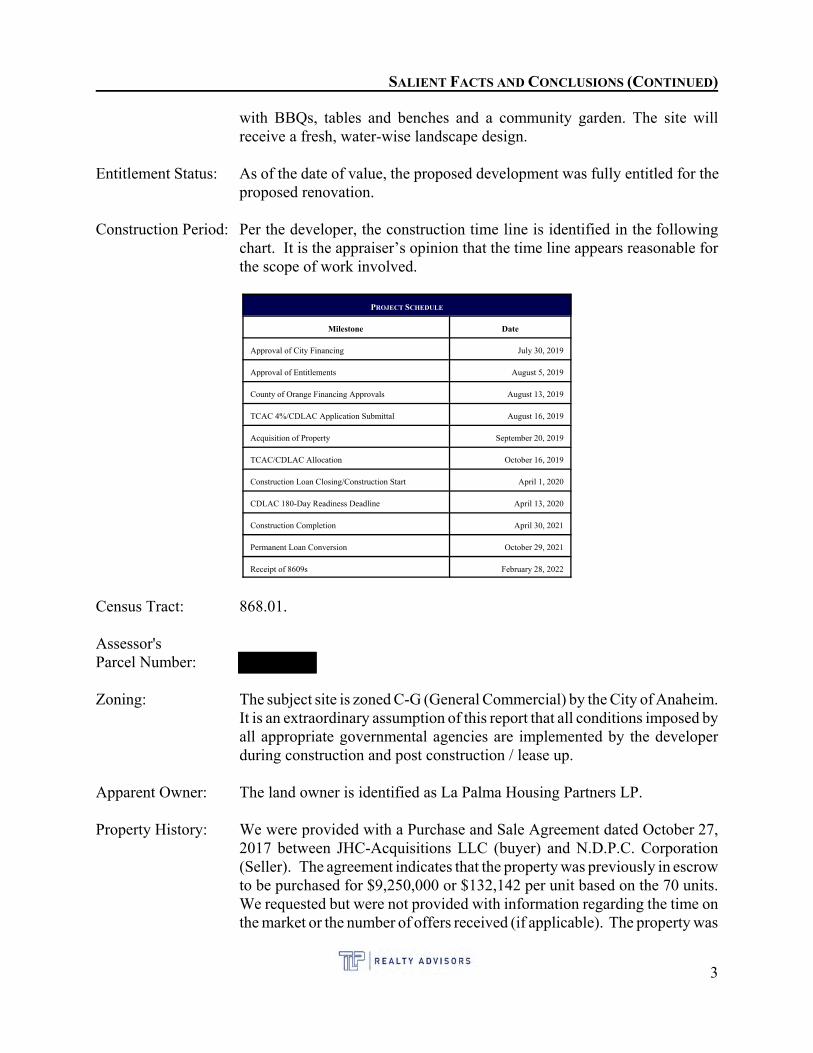
with BBQs, tables and benches and a community garden. The site willreceive a fresh, water-wise landscape design.
Entitlement Status: As of the date of value, the proposed development was fully entitled for theproposed renovation.
Construction Period: Per the developer, the construction time line is identified in the followingchart. It is the appraiser’s opinion that the time line appears reasonable forthe scope of work involved.
PROJECT SCHEDULE
Milestone Date
Approval of City Financing July 30, 2019
Approval of Entitlements August 5, 2019
County of Orange Financing Approvals August 13, 2019
TCAC 4%/CDLAC Application Submittal August 16, 2019
Acquisition of Property September 20, 2019
TCAC/CDLAC Allocation October 16, 2019
Construction Loan Closing/Construction Start April 1, 2020
CDLAC 180-Day Readiness Deadline April 13, 2020
Construction Completion April 30, 2021
Permanent Loan Conversion October 29, 2021
Receipt of 8609s February 28, 2022
Census Tract: 868.01.
Assessor'sParcel Number:
Zoning: The subject site is zoned C-G (General Commercial) by the City of Anaheim. It is an extraordinary assumption of this report that all conditions imposed byall appropriate governmental agencies are implemented by the developerduring construction and post construction / lease up.
Apparent Owner: The land owner is identified as La Palma Housing Partners LP.
Property History: We were provided with a Purchase and Sale Agreement dated October 27,2017 between JHC-Acquisitions LLC (buyer) and N.D.P.C. Corporation(Seller). The agreement indicates that the property was previously in escrowto be purchased for $9,250,000 or $132,142 per unit based on the 70 units. We requested but were not provided with information regarding the time onthe market or the number of offers received (if applicable). The property was
3
SALIENT FACTS AND CONCLUSIONS (CONTINUED)
in escrow for almost two years until closing, when the current ownershipentity (related to JHC-Acquisitions LLC), La Palma Housing Partners LP,acquired title on September 20, 2019 for $9,250,000 via Instrument 362775.
We are not aware of any pending options or listings. The previousinformation related to the present and past ownership of the property isassumed to be correct. We have reviewed public information for verificationpurposes and the above appears to be accurate. However, no warranty isgiven or implied. Besides the 2019 transaction, no additional other transfersin the last three years have occurred.
Reconciliation With2019 Transfer: The property was purchased for $9,250,000 in 2019, or $132,143 per room
based on the 70 room hotel. At the time the property entered into escrow,there were no entitlements for the proposed renovation/conversion into anaffordable housing complex. Based on the difference between the PMVSOwith and without rent restrictions, the value impact to the land equates to -41%. Between 2017 and 2019, the current owner entitled the project for theproposed income restricted renovation/conversion. The 2019 purchase priceis deemed to be at market, however, based on our analysis of encumberedland value plus costs spent to date, it appears as though the developersubstantially over paid for the existing property. However, after analysis andconsideration for the favorable governmental financing (totaling over $25M),the purchase price is essentially deemed to be market oriented. The gapbetween the concluded land value as if encumbered and the 2019 purchaseprice is more than accounted for in the various sources of favorable financingand grants.
Dates of Value(s): The subject property was last inspected on March 1, 2020. The developerhas a projected completion date of May 1, 2021 which appears reasonablegiven the scope of work. We estimated an absorption time of six months formove ins on both the restricted scenario (in line with our discussions withAffirmed) and the market scenario which equates to a PMVSO of November1, 2021.
Date of Report: July 9, 2020.
Rights Appraised: Fee Simple / Leased Fee.
Highest and Best Use: As Vacant: Construct a proposed income restricted affordable housing complex,
however, it would only be feasible with the proposed incentives.As Proposed: Renovate the 70 units to facilitate the income restricted apartment
project with the proposed governmental incentives.
4
SALIENT FACTS AND CONCLUSIONS (CONTINUED)
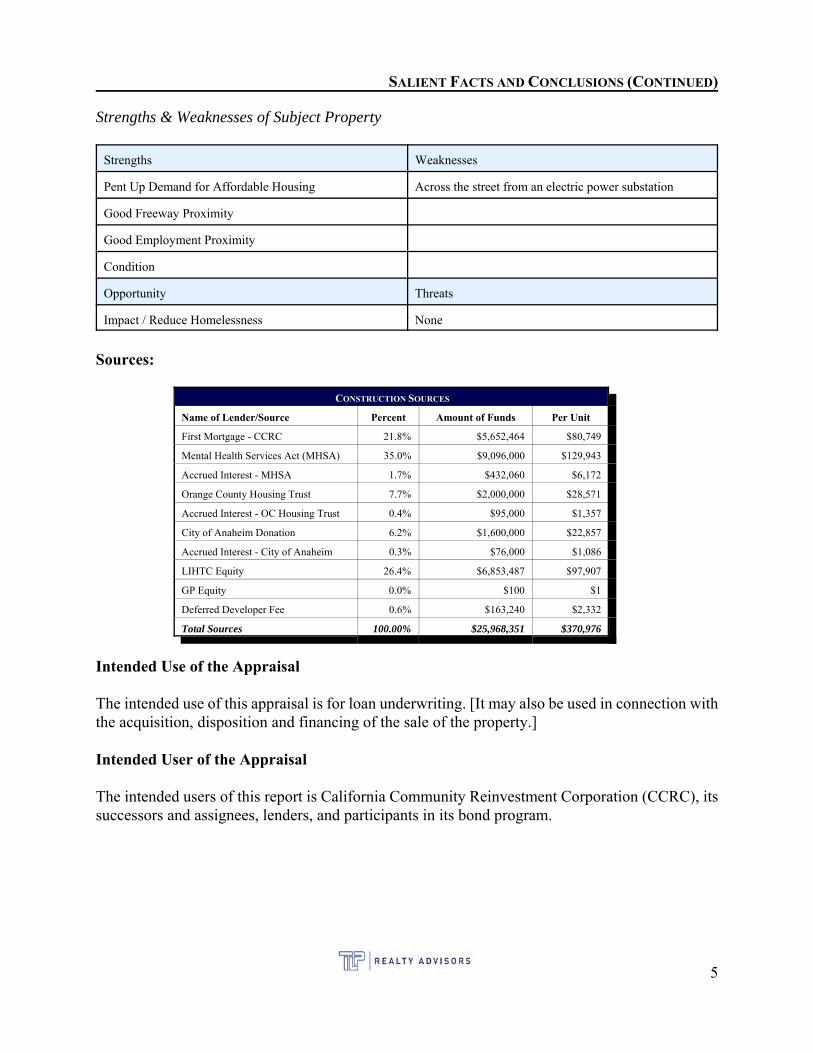
Strengths & Weaknesses of Subject Property
Strengths Weaknesses
Pent Up Demand for Affordable Housing Across the street from an electric power substation
Good Freeway Proximity
Good Employment Proximity
Condition
Opportunity Threats
Impact / Reduce Homelessness None
Sources:
CONSTRUCTION SOURCES
Name of Lender/Source Percent Amount of Funds Per Unit
First Mortgage - CCRC 21.8% $5,652,464 $80,749
Mental Health Services Act (MHSA) 35.0% $9,096,000 $129,943
Accrued Interest - MHSA 1.7% $432,060 $6,172
Orange County Housing Trust 7.7% $2,000,000 $28,571
Accrued Interest - OC Housing Trust 0.4% $95,000 $1,357
City of Anaheim Donation 6.2% $1,600,000 $22,857
Accrued Interest - City of Anaheim 0.3% $76,000 $1,086
LIHTC Equity 26.4% $6,853,487 $97,907
GP Equity 0.0% $100 $1
Deferred Developer Fee 0.6% $163,240 $2,332
Total Sources 100.00% $25,968,351 $370,976
Intended Use of the Appraisal
The intended use of this appraisal is for loan underwriting. [It may also be used in connection withthe acquisition, disposition and financing of the sale of the property.]
Intended User of the Appraisal
The intended users of this report is California Community Reinvestment Corporation (CCRC), itssuccessors and assignees, lenders, and participants in its bond program.
5
SALIENT FACTS AND CONCLUSIONS (CONTINUED)
Reliance Provisions
1. In connection with a proposed extension of credit in the form of (or a proposed investment in) aloan, debt issuance or other financing to be secured, in whole or in part, directly or indirectly, by thereal property ("Property") which is the subject of this report ("Report"), or by pledges of direct orindirect ownership interests in the Property owner, or in the form of preferred equity ownershipinterests in the Property owner (in any such case, the "Financing"), or the proposed issuance of anysecurities secured or otherwise backed, in whole or in part, directly or indirectly by the Property orthe Financing (the "Securities"), this Report, and the informationcontained therein, may be used and relied upon by the addressee(s) of this Report, their affiliates,successors and assigns, and
a. CCRC ("Bank"), as Administrative Agent for the benefit of any lenders, from time to time,party to the Financing; b. any actual or prospective purchaser of, or investor in, the Financing (or any portionthereof or interest therein by way of participation, syndication or otherwise); c. any actual or prospective financing source for any such purchaser or investor;d. any servicer of the Financing or the Securities;e. any trustee of the Financing or the Securities;f. any rating agency actually or prospectively rating the Financing or the Securities;g. any underwriter of, or placement agent for, the Financing or the Securities;h. any institutional provider of any liquidity facility or credit support for the Financing orthe Securities;I. the respective affiliates of each entity referenced in clauses (a)-(g) above;j. the respective officers, directors, employees, agents, advisors and counsel, acting in suchcapacity on behalf of any person or entity referenced in clauses (a)-(I) above; andk. the respective successors and assigns of any person or entity referenced in clauses (a)through (I) above
This Report has no other purpose and should not be relied upon by any other person or entity.
2. This Report and its preparer may be referred to, and this Report may be included in whole or inpart, summarized or quoted (provided any such partial inclusion, summary, or quote is notmisleading), in any term sheet, offering circular, private placement memorandum, registrationstatement, prospectus or prospectus supplement relating to the Financing or the Securities (or anyportion thereof) and the preparer of this Report agrees to cooperate reasonably in answeringquestions by any of the persons or entities referenced in clauses (a)-(j) above during the three (3)year period following the date of this Report.
3. This Report speaks only as of the date of this Report.
4. All the terms, conditions and provisions set forth in this Section entitled "Reliance Provisions",as well as those contained in the Global Limited Agreement and the applicable (Appraisal,Environmental, or Construction) General Requirements, all of which the preparer agreed to whenaccepting the award of the assignment to prepare the Report on the Bank's Application system, shall
6

SALIENT FACTS AND CONCLUSIONS (CONTINUED)
control and supersede any contrary or inconsistent terms, conditions, or provisions otherwise setforth in this Report (collectively "Contrary Terms"), unless an authorized officer of the Bankexpressly agrees in writing to such Contrary Terms and expressly states that such particular ContraryTerms "supersede the terms of the 'Reliance Provisions' set forth in the General Requirements withwhich the preparer of the Report agreed to when accepting the award of the assignment to preparethe Report on the Bank's Application system."
7
SCOPE OF THE APPRAISAL
Introduction
The USPAP Scope of Work Rule states:
For each appraisal and appraisal review assignment, an appraiser must:
< identify the problem to be solved;< determine and perform the scope of work necessary to develop credible assignment results;
and< disclose the scope of work in the report.
An appraiser must properly identify the problem to be solved in order to determine the appropriatescope of work. The appraiser must be prepared to demonstrate that the scope of work is sufficientto produce credible assignment results. An appraiser must gather and analyze information aboutthose assignment elements that are necessary to properly identify the appraisal or appraisal reviewproblem to be solved.
Scope of Work Acceptability
The scope of work must include the research and analyses that are necessary to develop credibleassignment results. The scope of work is acceptable when it meets or exceeds (1) the expectationsof parties who are regularly intended users for similar assignments; and (2) what an appraiser's peers'actions would be in performing the same or a similar assignment.
An appraiser must not allow assignment conditions to limit the scope of work to such a degree thatthe assignment results are not credible in the context of the intended use.
An appraiser must not allow the intended use of an assignment or a client's objectives to cause theassignment results to be biased.
This appraisal has been prepared under the U. S. Bank and CCRC appraisal Guidelines and it hasbeen completed in conformance with the requirements of the Appraisal Foundation's, UniformStandards of Professional Appraisal Practice (USPAP and the written report options of USPAPStandards Rule 2-2(a)) and Title XI of FIRREA. I make no other warranties, either expressed orimplied, as to the character and nature of such services and products. The appraisal report is intendedto be an "appraisal assignment", as defined by the "USPAP" of the Appraisal Foundation; i.e., theintention was that the appraisal service was performed in such a manner that the results of theanalysis, opinions, or conclusions be that of a disinterested third party. The depth of analysis isintended to reflect the complexity of the real estate and nature of the assignment.
In order to conform to the requirement stated above, the appraiser has undertaken the followingappraisal procedures:
8
SCOPE OF THE APPRAISAL (CONTINUED)
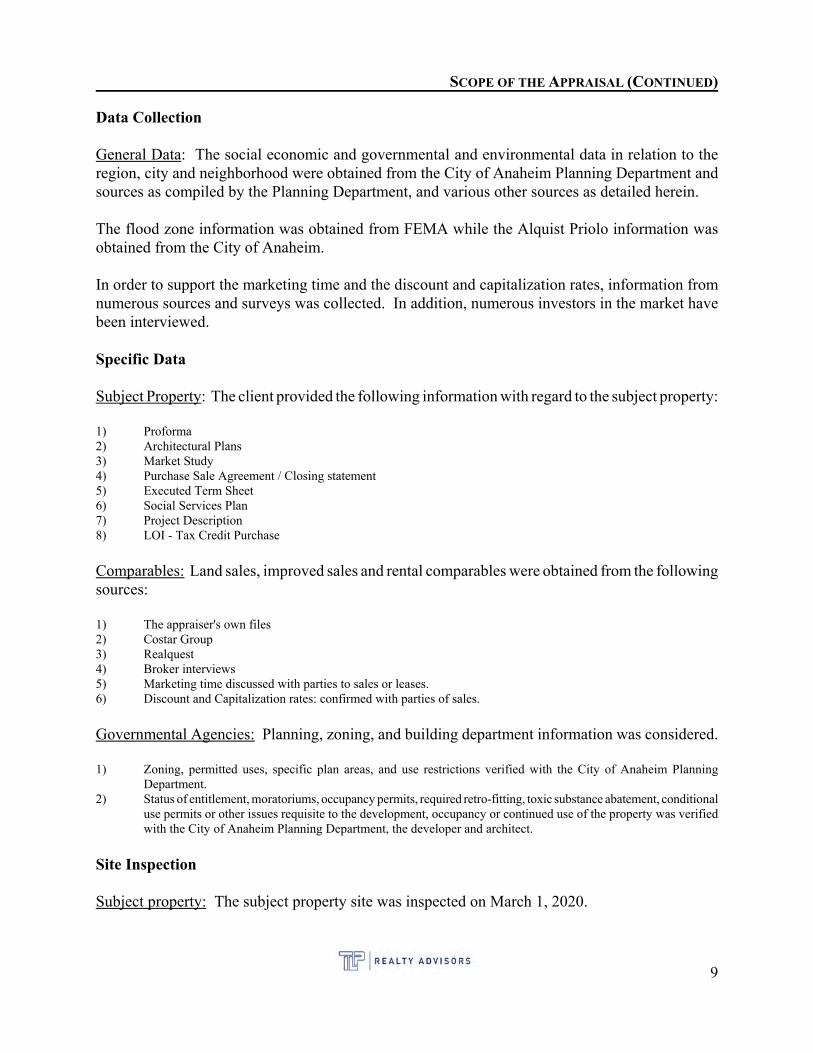
Data Collection
General Data: The social economic and governmental and environmental data in relation to theregion, city and neighborhood were obtained from the City of Anaheim Planning Department andsources as compiled by the Planning Department, and various other sources as detailed herein.
The flood zone information was obtained from FEMA while the Alquist Priolo information wasobtained from the City of Anaheim.
In order to support the marketing time and the discount and capitalization rates, information fromnumerous sources and surveys was collected. In addition, numerous investors in the market havebeen interviewed.
Specific Data
Subject Property: The client provided the following information with regard to the subject property:
1) Proforma2) Architectural Plans3) Market Study4) Purchase Sale Agreement / Closing statement5) Executed Term Sheet6) Social Services Plan7) Project Description8) LOI - Tax Credit Purchase
Comparables: Land sales, improved sales and rental comparables were obtained from the followingsources:
1) The appraiser's own files2) Costar Group3) Realquest4) Broker interviews5) Marketing time discussed with parties to sales or leases.6) Discount and Capitalization rates: confirmed with parties of sales.
Governmental Agencies: Planning, zoning, and building department information was considered.
1) Zoning, permitted uses, specific plan areas, and use restrictions verified with the City of Anaheim PlanningDepartment.
2) Status of entitlement, moratoriums, occupancy permits, required retro-fitting, toxic substance abatement, conditionaluse permits or other issues requisite to the development, occupancy or continued use of the property was verifiedwith the City of Anaheim Planning Department, the developer and architect.
Site Inspection
Subject property: The subject property site was inspected on March 1, 2020.
9
SCOPE OF THE APPRAISAL (CONTINUED)
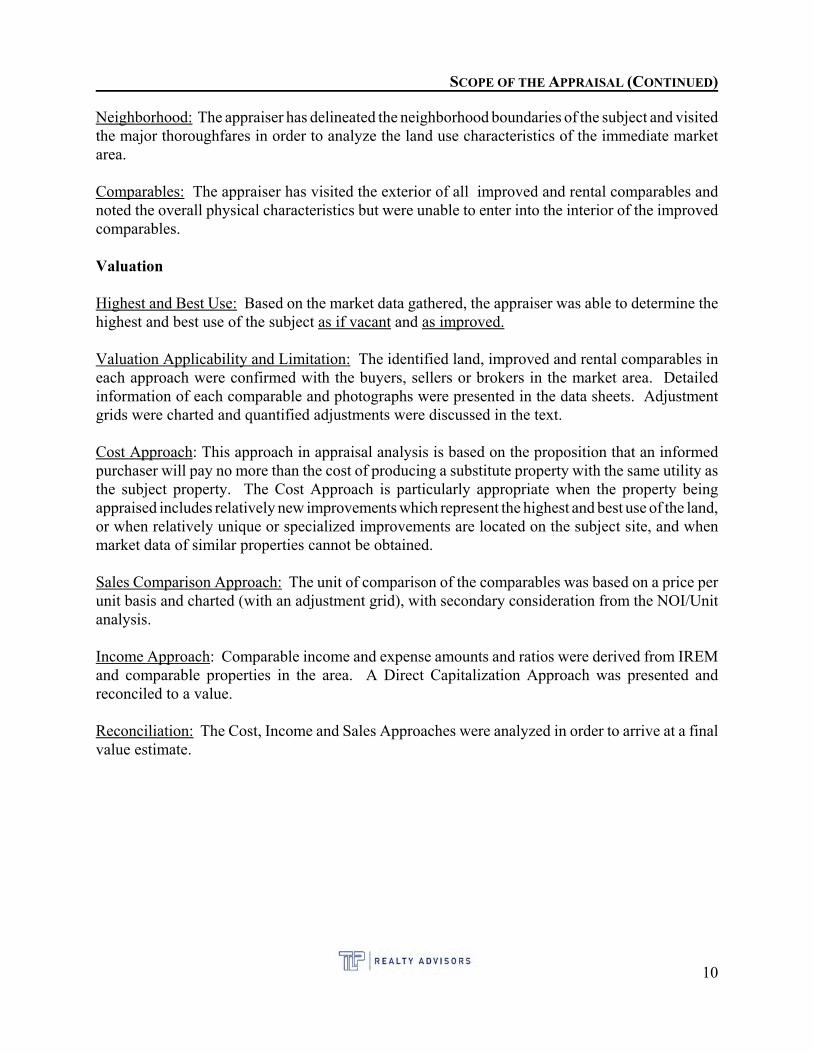
Neighborhood: The appraiser has delineated the neighborhood boundaries of the subject and visitedthe major thoroughfares in order to analyze the land use characteristics of the immediate marketarea.
Comparables: The appraiser has visited the exterior of all improved and rental comparables andnoted the overall physical characteristics but were unable to enter into the interior of the improvedcomparables.
Valuation
Highest and Best Use: Based on the market data gathered, the appraiser was able to determine thehighest and best use of the subject as if vacant and as improved.
Valuation Applicability and Limitation: The identified land, improved and rental comparables ineach approach were confirmed with the buyers, sellers or brokers in the market area. Detailedinformation of each comparable and photographs were presented in the data sheets. Adjustmentgrids were charted and quantified adjustments were discussed in the text.
Cost Approach: This approach in appraisal analysis is based on the proposition that an informedpurchaser will pay no more than the cost of producing a substitute property with the same utility asthe subject property. The Cost Approach is particularly appropriate when the property beingappraised includes relatively new improvements which represent the highest and best use of the land,or when relatively unique or specialized improvements are located on the subject site, and whenmarket data of similar properties cannot be obtained.
Sales Comparison Approach: The unit of comparison of the comparables was based on a price perunit basis and charted (with an adjustment grid), with secondary consideration from the NOI/Unitanalysis.
Income Approach: Comparable income and expense amounts and ratios were derived from IREMand comparable properties in the area. A Direct Capitalization Approach was presented andreconciled to a value.
Reconciliation: The Cost, Income and Sales Approaches were analyzed in order to arrive at a finalvalue estimate.
10
DEFINITIONS
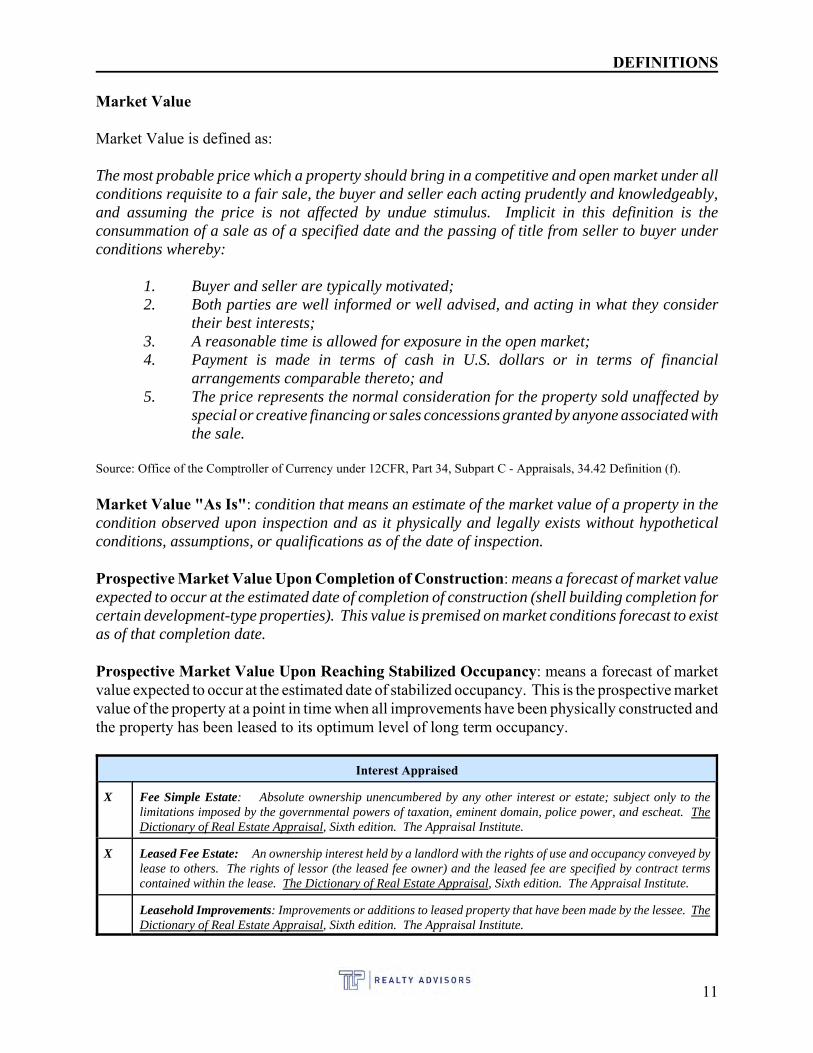
Market Value
Market Value is defined as:
The most probable price which a property should bring in a competitive and open market under allconditions requisite to a fair sale, the buyer and seller each acting prudently and knowledgeably,and assuming the price is not affected by undue stimulus. Implicit in this definition is theconsummation of a sale as of a specified date and the passing of title from seller to buyer underconditions whereby:
1. Buyer and seller are typically motivated;2. Both parties are well informed or well advised, and acting in what they consider
their best interests;3. A reasonable time is allowed for exposure in the open market;4. Payment is made in terms of cash in U.S. dollars or in terms of financial
arrangements comparable thereto; and5. The price represents the normal consideration for the property sold unaffected by
special or creative financing or sales concessions granted by anyone associated withthe sale.
Source: Office of the Comptroller of Currency under 12CFR, Part 34, Subpart C - Appraisals, 34.42 Definition (f).
Market Value "As Is": condition that means an estimate of the market value of a property in thecondition observed upon inspection and as it physically and legally exists without hypotheticalconditions, assumptions, or qualifications as of the date of inspection.
Prospective Market Value Upon Completion of Construction: means a forecast of market valueexpected to occur at the estimated date of completion of construction (shell building completion forcertain development-type properties). This value is premised on market conditions forecast to existas of that completion date.
Prospective Market Value Upon Reaching Stabilized Occupancy: means a forecast of marketvalue expected to occur at the estimated date of stabilized occupancy. This is the prospective marketvalue of the property at a point in time when all improvements have been physically constructed andthe property has been leased to its optimum level of long term occupancy.
Interest Appraised
X Fee Simple Estate: Absolute ownership unencumbered by any other interest or estate; subject only to thelimitations imposed by the governmental powers of taxation, eminent domain, police power, and escheat. TheDictionary of Real Estate Appraisal, Sixth edition. The Appraisal Institute.
X Leased Fee Estate: An ownership interest held by a landlord with the rights of use and occupancy conveyed bylease to others. The rights of lessor (the leased fee owner) and the leased fee are specified by contract termscontained within the lease. The Dictionary of Real Estate Appraisal, Sixth edition. The Appraisal Institute.
Leasehold Improvements: Improvements or additions to leased property that have been made by the lessee. TheDictionary of Real Estate Appraisal, Sixth edition. The Appraisal Institute.
11
DEFINITIONS (CONTINUED)
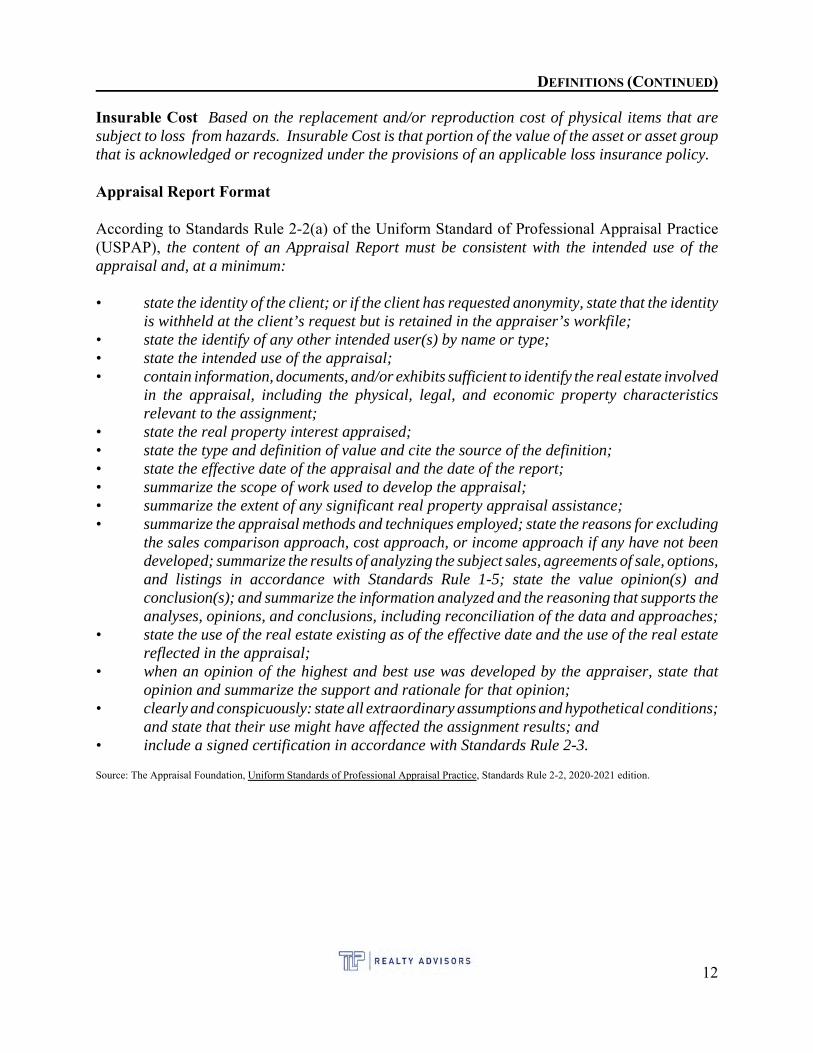
Insurable Cost Based on the replacement and/or reproduction cost of physical items that aresubject to loss from hazards. Insurable Cost is that portion of the value of the asset or asset groupthat is acknowledged or recognized under the provisions of an applicable loss insurance policy.
Appraisal Report Format
According to Standards Rule 2-2(a) of the Uniform Standard of Professional Appraisal Practice(USPAP), the content of an Appraisal Report must be consistent with the intended use of theappraisal and, at a minimum:
• state the identity of the client; or if the client has requested anonymity, state that the identityis withheld at the client’s request but is retained in the appraiser’s workfile;
• state the identify of any other intended user(s) by name or type;• state the intended use of the appraisal;• contain information, documents, and/or exhibits sufficient to identify the real estate involved
in the appraisal, including the physical, legal, and economic property characteristicsrelevant to the assignment;
• state the real property interest appraised;• state the type and definition of value and cite the source of the definition;• state the effective date of the appraisal and the date of the report;• summarize the scope of work used to develop the appraisal;• summarize the extent of any significant real property appraisal assistance;• summarize the appraisal methods and techniques employed; state the reasons for excluding
the sales comparison approach, cost approach, or income approach if any have not beendeveloped; summarize the results of analyzing the subject sales, agreements of sale, options,and listings in accordance with Standards Rule 1-5; state the value opinion(s) andconclusion(s); and summarize the information analyzed and the reasoning that supports theanalyses, opinions, and conclusions, including reconciliation of the data and approaches;
• state the use of the real estate existing as of the effective date and the use of the real estatereflected in the appraisal;
• when an opinion of the highest and best use was developed by the appraiser, state thatopinion and summarize the support and rationale for that opinion;
• clearly and conspicuously: state all extraordinary assumptions and hypothetical conditions;and state that their use might have affected the assignment results; and
• include a signed certification in accordance with Standards Rule 2-3.
Source: The Appraisal Foundation, Uniform Standards of Professional Appraisal Practice, Standards Rule 2-2, 2020-2021 edition.
12
ASSUMPTIONS AND LIMITING CONDITIONS
Introduction
Standards Rule (S.R.2-2) of the Uniform Standards of Professional Appraisal Practice requires theappraiser to state all assumptions, hypothetical conditions, and limiting conditions that affected theanalyses, opinions and conclusions. In compliance with Standards Rule 2-2, and to assist the readerin interpreting the report, such assumptions and limiting conditions as related to the subject are setforth as follows:
The conclusions and opinions expressed in this report apply to the date of value of March 1, 2020. The dollar amount of anyvalue opinion or conclusion rendered or expressed in this report is based upon the purchasing power of the United StatesDollar existing on March 1, 2020.
The appraiser assumes no responsibility for economic, physical or demographic factors which may affect or alter the opinionsin this report if said economic, physical or demographic factors were not present as of the date of the letter of transmittalaccompanying this report. The appraiser is not obligated to predict future political, economic or social trends.
Disclosure of the contents of this appraisal report is governed by the Code of Professional Ethics and the Standards ofProfessional Practice of the Appraisal Institute and the Uniform Standards of Professional Appraisal Practice (USPAP).
In preparing this report, the appraiser was required to rely on information furnished by other individuals or found inpreviously existing records and/or documents. Unless otherwise indicated, such information is presumed to be reliable. However, no warranty, either express or implied, is given by the appraiser for the accuracy of such information and theappraiser assumes no responsibility for information relied upon and later found to have been inaccurate. No responsibilityis assumed for errors or omissions, or for information not disclosed which might otherwise affect the valuation estimate. Theappraiser reserves the right to make such adjustments to the analysis, opinions and conclusions set forth in this report as maybe required by consideration of additional data or more reliable data that may become available.
No opinion as to the title of the subject property is rendered. Data related to ownership and legal description was obtainedfrom public records and is considered reliable. Title is assumed to be marketable and free and clear of all liens,encumbrances, easements and restrictions except those specifically discussed in the report. The property is appraisedassuming it to be under responsible ownership and competent management, and available for its highest and best use.
The appraiser assumes no responsibility for hidden or unapparent conditions of the property, subsoil, ground water orstructures that render the subject property more or less valuable. No responsibility is assumed for arranging for engineering,geologic or environmental studies that may be required to discover such hidden or unapparent conditions.
The appraiser has not been provided any information regarding the presence of any material or substance on or in any portionof the subject property or improvements thereon, which material or substance possesses or may possess toxic, hazardousand/or other harmful and/or dangerous characteristics. Unless otherwise stated in the report, the appraiser did not becomeaware of the presence of any such material or substance during the appraiser's inspection of the subject property; however,the appraiser is not qualified to investigate or test for the presence of such materials or substances. The presence of suchmaterials or substances may adversely affect the value of the subject property. The value estimated in this report is predicatedon the assumption that no such material or substance is present on or in the subject property or in such proximity thereto thatit would cause a loss in value. The appraiser assumes no responsibility for the presence of any such substance or materialon or in the subject property, nor for any expertise or engineering knowledge required to discover the presence of suchsubstance or material. Unless otherwise stated, this report assumes the subject property is in compliance with all federal, stateand local environmental laws, regulations and rules.
Unless otherwise stated, the subject property is appraised assuming it to be in full compliance with all applicable zoning andland use regulations and restrictions.
Unless otherwise stated, the property is appraised assuming that all required licenses, permits, certificates, consents or otherlegislative and/or administrative authority from any local, state or national government or private entity or organization havebeen or can be obtained or renewed for any use on which the value estimate contained in this report is based.
13
ASSUMPTIONS AND LIMITING CONDITIONS (CONTINUED)
No opinion is expressed as to the value of subsurface oil, gas or mineral rights or whether the property is subject to surfaceentry for the exploration or removal of such materials, except as is expressly stated.
Maps, plats and exhibits included in this report are for illustration only to serve as an aid in visualizing matters discussedwithin the report. They should not be considered as surveys or relied upon for any other purpose, nor should they be removedfrom, reproduced or used apart from the report.
No opinion is intended to be expressed for matters which require legal expertise or specialized investigation or knowledgebeyond that customarily employed by real estate appraisers.
The distribution, if any, of the total valuation in this report between land and improvements applies only under the statedprogram of utilization. The separate allocations for land and improvements must not be used in conjunction with any otherappraisal and are invalid if so used.
Possession of this report, or a copy of it, does not carry with it the right of publication. Without the written consent of theappraiser, this report may not be used for any purpose by any person other than the party to whom it is addressed. In anyevent, this report may be used only with proper written qualification and only it its entirety for its stated purpose. Neitherall, nor any part, of the contents of this report (including any conclusions as to value, the identity of the appraisers, or the firmwith which they are connected) shall be disseminated to the public through advertising media, public relations, news media,sales media, or any other public means of communication without prior written consent and approval of the appraiser.
The property which is the subject of this appraisal is within a geographic area prone to earthquakes and other seismicdisturbances. Except as specifically indicated in the report, no seismic or geologic studies have been provided to the appraiserconcerning the geologic and/or seismic condition of the subject property. The appraiser assumes no responsibility for thepossible effect on the subject property of seismic activity and/or earthquakes.
Testimony or attendance in court or at any other hearing is not required by reason or rendering this appraisal, unless sucharrangements are made a reasonable time in advance of said hearing. Further, unless otherwise indicated, separatearrangements shall be made concerning compensation for the appraiser's time to prepare for and attend any such hearing.
No termite, dry rot, wet rot, pest or other infestation report was made available to the appraiser. It is assumed that there isno related damage or infestation, unless otherwise stated.
No consideration has been given in this appraisal as to the value of the property located on the premises considered by theappraiser to be personal property, nor has the appraiser given consideration to the costs of moving or relocating such personalproperty; only the real property has been considered in this appraisal. Additionally, the comparable data was of real propertyonly, and no personal property was considered with any market data.
Competitive institutional financing is assumed to be available.
No engineering survey has been made by the appraiser. Except as specifically stated, data relative to size and area of thesubject property was taken from sources considered reliable and no encroachment of the subject property is considered toexist.
Although the valuation contained in this report is the work product of the appraiser, the appraiser has relied in his conclusionsupon specialized professional studies prepared by FEMA relating to flood information and the County of Anaheim relatingto earthquake information.
Income and expense data related to the property being appraised was provided by the client and the property manager, andis assumed, but not warranted, to be accurate.
The appraisers were provided with a preliminary title report from First American Title Insurance Company dated January22, 2020 (File No. NCS-876497-A-SA1). It is an extraordinary assumption of this appraisal report that (other than noted)there are no additional easements, regulatory agreements, covenants or restrictions which encumber the subject property andwould prohibit the site's highest and best use, other than those outlined in this report.
14

ASSUMPTIONS AND LIMITING CONDITIONS (CONTINUED)
It is assumed that there are no soil conditions which negatively affect the subject property. As no hydrology studies wereavailable for review, it is assumed that any drainage sheet flow through the subject property would be contained, and theproperty under appraisement would not be subject to inundation.
The appraiser recognizes that electromagnetic fields have, in recent years, become a subject of concern which may affectvalue. The appraiser has not been informed of, nor observed or discovered, any electrical utility, facility, installation,structure, easement, or service which tends to create an electromagnetic field in the vicinity of the subject property. For thepurpose of this appraisal it is assumed that the subject property is not in the vicinity of any such potential electromagneticfield.
15

PRESENTATION OF DATA
REGIONAL ANALYSIS
REGIONAL DESCRIPTION
Important in any appraisal is an understanding of the location of a subject property in relation to therest of the community. The following is an economic and demographic overview of the trendsinfluencing the Orange County region as well as some comparisons with the State of California.
State of California Employment - January 2020 (most recent available)
California’s unemployment rate held steadfast at its record low of 3.9% in December as the state’semployers added 12,600 non-farm payroll jobs, according to data released today by the CaliforniaEmployment Development Department (EDD) from two surveys. The job gains in Decembercontribute to a record job expansion in California of 118 months, surpassing the long expansion ofthe 1960s. California has gained 3,422,900 jobs since the current expansion began in February 2010,accounting for more than 15% of the nation’s 22,688,000 job gain over the same time frame.
California’s Labor Market, By the Numbers
• The state’s unemployment remained at 3.9% in December, maintaining a record low in adata series going back to the 1970s. The number of unemployed Californians is the lowestsince 1989, despite large gains in statewide population since.
• The nation’s unemployment rate also remained unchanged in December, holding at 3.5%.• December’s 12,600 non-farm payroll jobs gain was driven by growth in 6 of California’s 11
industry sectors. Professional & Business Services (6,500) posted the biggest jobs gain,fueled mostly by scientific research and development and advertising and related services.Educational & Health Services (5,200) also did well with job gains in dental offices andin-home supportive services leading the way.
• Information, one of November’s top job-gaining sectors, posted December’s biggest jobsloss (-3,900) mainly due to weakness last month in the motion picture and sound recordingsubsector.
Data Trends About Jobs in the Economy
Total Non-Farm Payroll Jobs (Comes from a monthly survey of approximately 80,000 Californiabusinesses that estimates jobs in the economy - seasonally adjusted)
• Month-over – Total non-farm jobs in California’s 11 major industries totaled 17,612,500in December – a net gain of 12,600 jobs from November. This followed a revised gain of24,000 jobs in November.
• Year-over – Total non-farm jobs increased by 310,300 jobs (a 1.8% increase) fromDecember 2018 to December 2019 compared to the U.S. annual gain of 2,108,000 jobs (a1.4% increase).
16
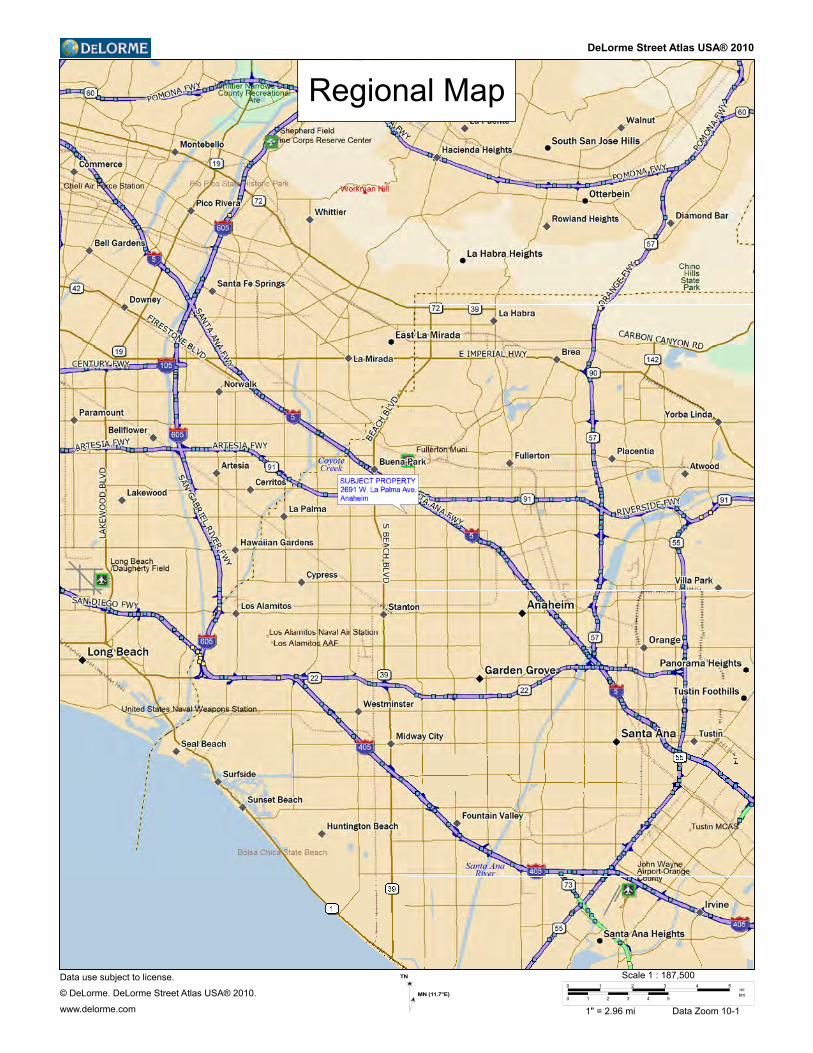
DeLorme Street Atlas USA® 2010
Regional Map
Data use subject to license.
© DeLorme. DeLorme Street Atlas USA® 2010.
www.delorme.com
TN
MN (11.7°E)
0 1 2 3 4 5
0 1 2 3 4 5
mikm
Scale 1 : 187,500
1" = 2.96 mi Data Zoom 10-1
REGIONAL ANALYSIS (CONTINUED)
• Total Farm Jobs – The number of jobs in the agriculture industry increased by 3,100 jobsfrom November to 439,100. The agricultural industry has added 7,800 farm jobs sinceDecember 2018.
Data Trends about Workers in the Economy
Employment and Unemployment in California (Based on monthly federal survey of 5,100 Californiahouseholds which focuses on workers in the economy)
• Employed – The number of Californians holding jobs in December was 18,786,800, anincrease of 56,400 from November and up 81,800 from the employment total in Decemberof last year.
• Unemployed – The number of unemployed Californians was 757,700 in December, adecrease of 4,100 over the month and down by 44,900 compared with December of last year.
Unemployment Insurance Claims (not seasonally adjusted)
In related data that figures into the state’s unemployment rate, there were 327,751 people receivingUnemployment Insurance benefits during the survey week in December compared to 293,595 inNovember and 338,747 people in December 2018. Concurrently, 50,116 people filed new claimsin December which was a month-over increase of 680 people.
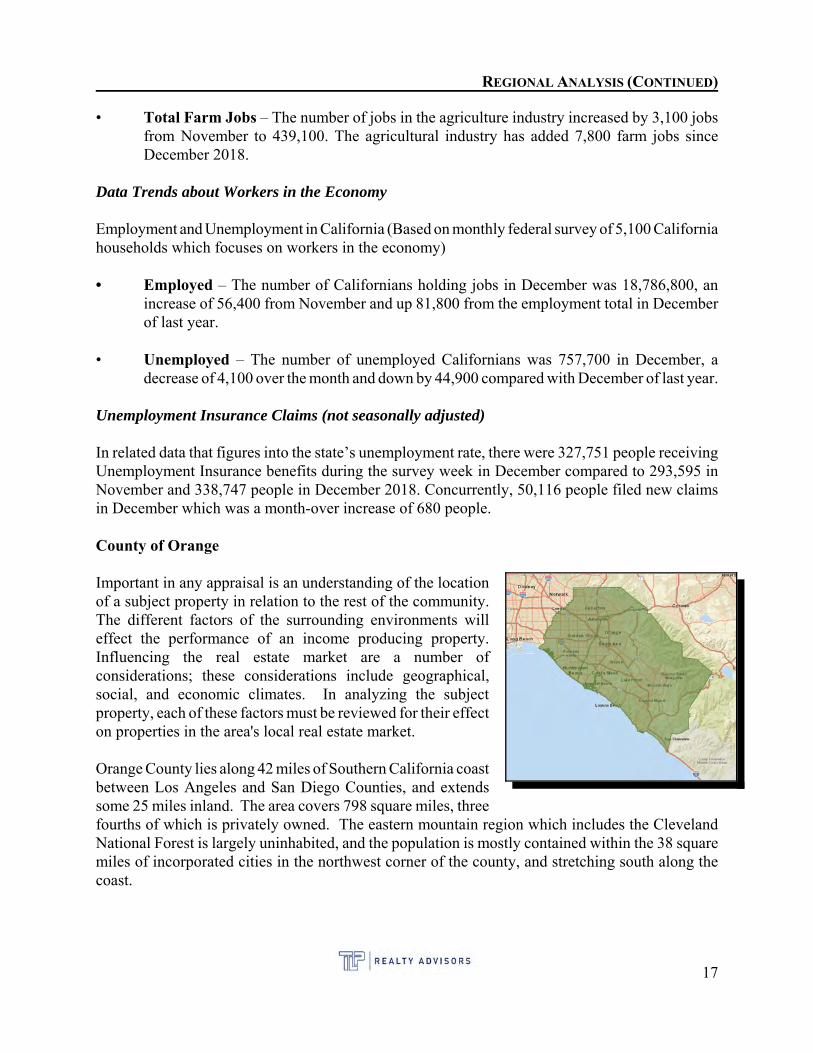
County of Orange
Important in any appraisal is an understanding of the locationof a subject property in relation to the rest of the community.The different factors of the surrounding environments willeffect the performance of an income producing property. Influencing the real estate market are a number ofconsiderations; these considerations include geographical,social, and economic climates. In analyzing the subjectproperty, each of these factors must be reviewed for their effecton properties in the area's local real estate market.
Orange County lies along 42 miles of Southern California coastbetween Los Angeles and San Diego Counties, and extendssome 25 miles inland. The area covers 798 square miles, threefourths of which is privately owned. The eastern mountain region which includes the ClevelandNational Forest is largely uninhabited, and the population is mostly contained within the 38 squaremiles of incorporated cities in the northwest corner of the county, and stretching south along thecoast.
17
REGIONAL ANALYSIS (CONTINUED)
There is a total of 34 individual cities and numerous unincorporated communities. A strategiclocation and quality of life are the primary factors for Orange County's evolution from a rural,agricultural dominated economy, into an urbanized commercial center. Prior to the 1960s, thecounty was considered to be a bedroom community of Los Angeles County. During the 1950s and1960s, improvements in the transportation network and economic growth of the region gave rise tothe sub-urbanization of the area as the second largest county within the Los Angeles Basin. Today,despite the severe economic downturn during the first half of the 1990s, and the filing of bankruptcyin December 1994, Orange County remains one of the most economically vibrant and diversecomponents of the Los Angeles Basin.
Orange County consists of two topographical areas: coastal lowland and foothill/ mountainousareas. The climate in the county resembles that of the Mediterranean, due to similar latitude,prevailing winds and proximity to the ocean. Most urban development is concentrated in thenorthwest and central portions of the county, and generally extends southwest from Los AngelesCounty to the Newport Beach-Irvine area.
The Pacific Ocean is a major tourist attraction and properties in proximity to the coast are in strongdemand. Tourist attractions along the coast include restaurants, hotels, motels and other commercialdevelopments. Major marine facilities along the coast include Huntington Harbor, Newport Bay andDana Point Harbor. In the central portion of Orange County, tourist attractions include Disneylandand Edison Field, home of the Angels baseball team.
Transportation
Orange County is the forefront of new developments in urban transportation in the state. The primeexample is the recently-completed construction of privately financed and operated toll roads toalleviate some of the congestion. These toll roads include the Eastern Transportation Corridorrunning north-south, and the Foothill Transportation Corridor, and the San Joaquin HillsTransportation Corridor, all of which are generally in the Southern section of the County. Eightfreeways extend through the county and provide access to Los Angeles, San Diego, Riverside andSan Bernardino Counties. Several major rail lines serve the county and passenger service in and outof the county is provided by Amtrak.
Air transportation is provided primarily via the John Wayne Airport in Santa Ana, which providespassenger and freight service to most major cities in the continental United States. The John WayneAirport is owned and operated by the County of Orange.
In addition to John Wayne Airport, the county contains several municipal airports. The U.S. MarineCorps Air Station in Tustin and the U.S. Marine Corps El Toro Air Station have both been closedand Measure “W” passed in March 2002 has the land slated for open space and park usage.
Although traffic congestion has become a problem in Orange County, the current trends towardalternative modes of transportation and a comprehensive mass transit system will serve to alleviatethe problem in the future. Nevertheless, traffic concerns will always be an issue as driving has
18
REGIONAL ANALYSIS (CONTINUED)
become the preferred and to most commuters, the only mode of transportation utilized in SouthernCalifornia.
Population
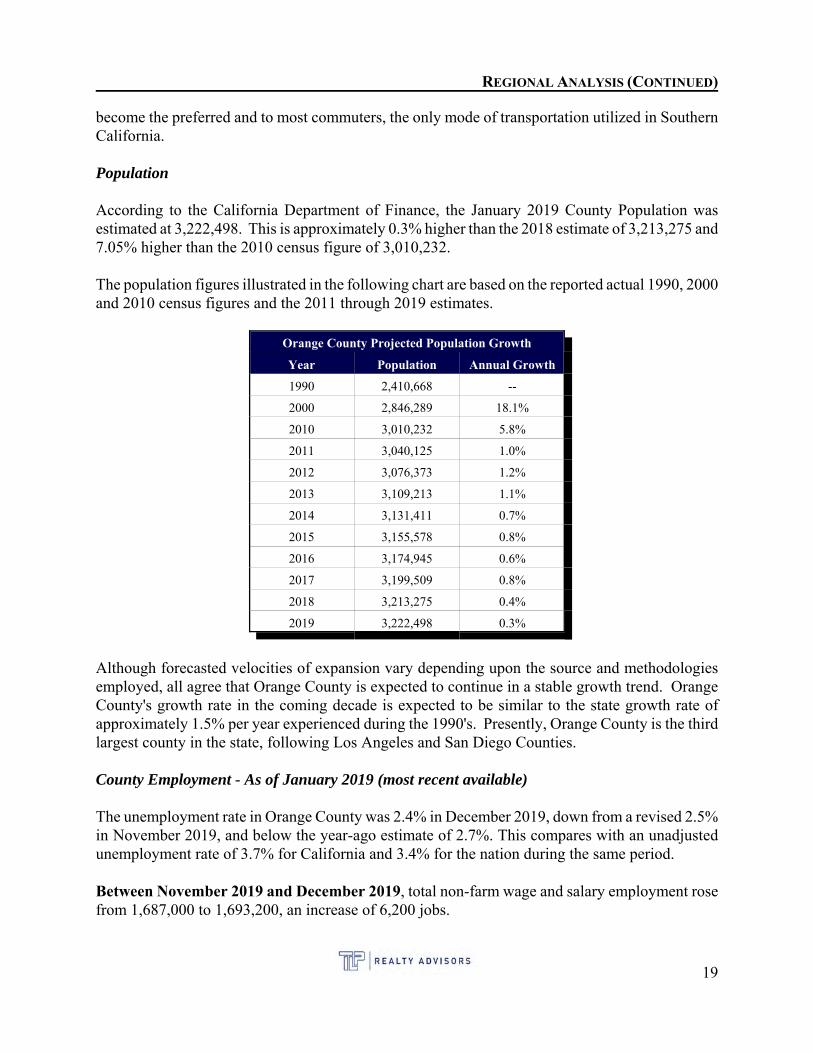
According to the California Department of Finance, the January 2019 County Population wasestimated at 3,222,498. This is approximately 0.3% higher than the 2018 estimate of 3,213,275 and7.05% higher than the 2010 census figure of 3,010,232.
The population figures illustrated in the following chart are based on the reported actual 1990, 2000and 2010 census figures and the 2011 through 2019 estimates.
Orange County Projected Population Growth
Year Population Annual Growth
1990 2,410,668 --
2000 2,846,289 18.1%
2010 3,010,232 5.8%
2011 3,040,125 1.0%
2012 3,076,373 1.2%
2013 3,109,213 1.1%
2014 3,131,411 0.7%
2015 3,155,578 0.8%
2016 3,174,945 0.6%
2017 3,199,509 0.8%
2018 3,213,275 0.4%
2019 3,222,498 0.3%
Although forecasted velocities of expansion vary depending upon the source and methodologiesemployed, all agree that Orange County is expected to continue in a stable growth trend. OrangeCounty's growth rate in the coming decade is expected to be similar to the state growth rate ofapproximately 1.5% per year experienced during the 1990's. Presently, Orange County is the thirdlargest county in the state, following Los Angeles and San Diego Counties.
County Employment - As of January 2019 (most recent available)
The unemployment rate in Orange County was 2.4% in December 2019, down from a revised 2.5%in November 2019, and below the year-ago estimate of 2.7%. This compares with an unadjustedunemployment rate of 3.7% for California and 3.4% for the nation during the same period.
Between November 2019 and December 2019, total non-farm wage and salary employment rosefrom 1,687,000 to 1,693,200, an increase of 6,200 jobs.
19
REGIONAL ANALYSIS (CONTINUED)
• Professional and business services reported the largest increase, adding 4,900 jobs. Nearlyhalf of the gain was reported in administrative and support services (up 2,400 jobs), whichincludes temporary help firms.
• Trade, transportation, and utilities added 1,200 jobs. Retail trade added 900 jobs, andtransportation, warehousing, and utilities gained 600 jobs. These gains were offset by adecline of 300 jobs in wholesale trade. Other sectors with payroll increases were leisure andhospitality (up 1,100 jobs) and manufacturing and financial activities (up 300 jobs each).
• The largest employment loss was in government (down 1,000 jobs) with all the decline inlocal government (down 1,100 jobs). This was offset by an employment increase of 100 jobsin federal government. State government remained unchanged.
Between December 2018 and December 2019, total non-farm wage and salary employmentincreased by 25,400 jobs, or 1.5%.
• Professional and business services led the year-over gain by adding 8,400 jobs. 71% of theincrease was in administrative and support and waste services (up 6,000 jobs). Professional,scientific, and technical services added 2,000 jobs, and management of companies andenterprises increased by 400 jobs.
• Leisure and hospitality increased by 7,700 payroll jobs. Almost 80% of the gain was inaccommodation and food services (up 6,100 jobs), led by advances in food services anddrinking places (up 5,400 jobs).
• Construction added 5,300 jobs over the year with 89% of the increase in specialty tradecontractors (up 4,700 jobs). Heavy and civil engineering construction added 600 jobs, andconstruction of buildings remained unchanged.
• Two sectors reported year-over declines: other services (down 1,200 jobs) andmanufacturing (down 500 jobs). Mining and logging reported no employment change.
Housing
The following table was derived from the California Department of Finance, Demographic ResearchUnit. The figures shown in the following table reflect housing trends for the county and are basedon the 2000 and 2010 actual census figures and the 2011 through 2019 estimated figures.
20
REGIONAL ANALYSIS (CONTINUED)
Housing Trends - Orange County
Detached Attached 2 to 4 5 Plus Mobile Homes Total % Change
2000 614,359 322,675 32,450 969,484 --
2010 533,290 127,225 91,336 260,744 33,523 1,046,118 7.90%
2011 534,217 127,409 91,618 263,392 33,521 1,050,157 0.39%
2012 535,286 127,692 91,834 264,011 33,523 1,052,346 0.21%
2013 536,478 127,952 92,192 266,070 33,530 1,056,222 0.37%
2014 538,844 128,357 92,544 269,816 33,531 1,063,092 0.65%
2015 541,736 128,914 92,796 272,665 33,534 1,069,645 0.62%
2016 544,215 129,380 92,984 276,125 33,494 1,076,198 0.61%
2017 547,092 130,048 93,396 280,434 33,504 1,084,474 0.77%
2018 550,646 130,803 94,015 285,285 33,505 1,094,254 1.68%
2019 554,030 131,446 94,403 290,766 33,519 1,104,164 1.82%
*The figures in the chart reflect the number of housing units for County of Orange from the California Department of Finance,Demographic Research Unit website.
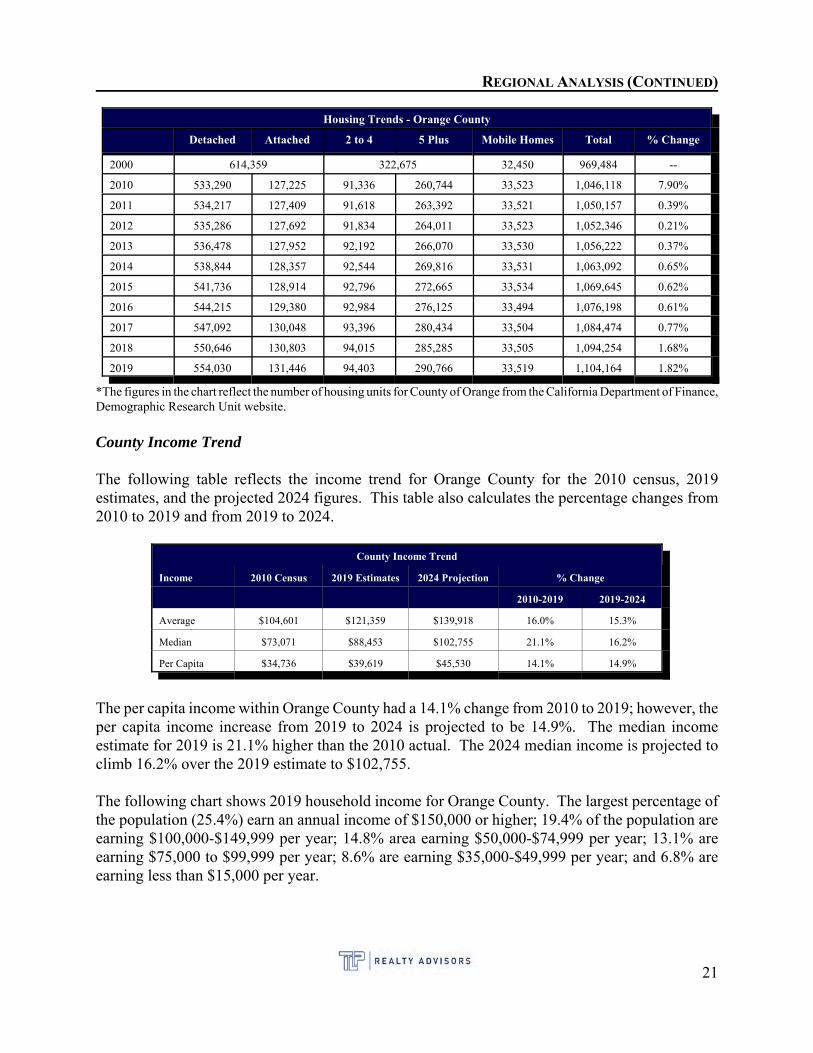
County Income Trend
The following table reflects the income trend for Orange County for the 2010 census, 2019estimates, and the projected 2024 figures. This table also calculates the percentage changes from2010 to 2019 and from 2019 to 2024.
County Income Trend
Income 2010 Census 2019 Estimates 2024 Projection % Change
2010-2019 2019-2024
Average $104,601 $121,359 $139,918 16.0% 15.3%
Median $73,071 $88,453 $102,755 21.1% 16.2%
Per Capita $34,736 $39,619 $45,530 14.1% 14.9%
The per capita income within Orange County had a 14.1% change from 2010 to 2019; however, theper capita income increase from 2019 to 2024 is projected to be 14.9%. The median incomeestimate for 2019 is 21.1% higher than the 2010 actual. The 2024 median income is projected toclimb 16.2% over the 2019 estimate to $102,755.
The following chart shows 2019 household income for Orange County. The largest percentage ofthe population (25.4%) earn an annual income of $150,000 or higher; 19.4% of the population areearning $100,000-$149,999 per year; 14.8% area earning $50,000-$74,999 per year; 13.1% areearning $75,000 to $99,999 per year; 8.6% are earning $35,000-$49,999 per year; and 6.8% areearning less than $15,000 per year.
21
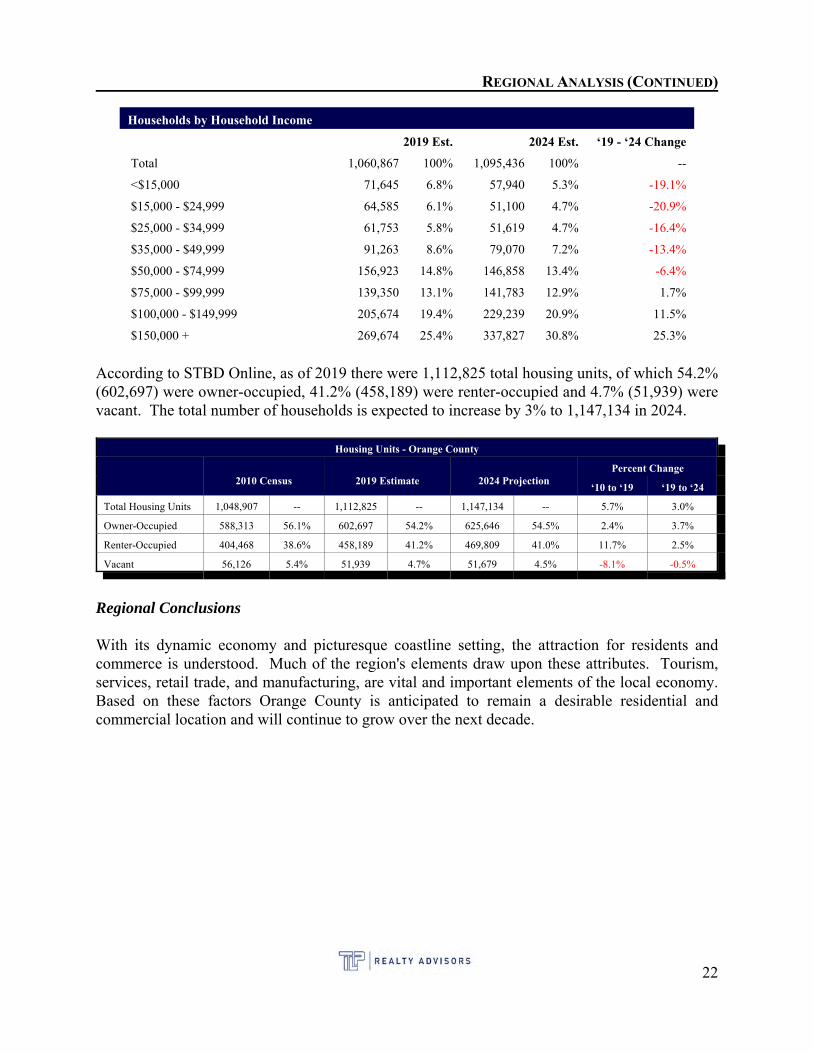
REGIONAL ANALYSIS (CONTINUED)
Households by Household Income
2019 Est. 2024 Est. ‘19 - ‘24 Change
Total 1,060,867 100% 1,095,436 100% --
<$15,000 71,645 6.8% 57,940 5.3% -19.1%
$15,000 - $24,999 64,585 6.1% 51,100 4.7% -20.9%
$25,000 - $34,999 61,753 5.8% 51,619 4.7% -16.4%
$35,000 - $49,999 91,263 8.6% 79,070 7.2% -13.4%
$50,000 - $74,999 156,923 14.8% 146,858 13.4% -6.4%
$75,000 - $99,999 139,350 13.1% 141,783 12.9% 1.7%
$100,000 - $149,999 205,674 19.4% 229,239 20.9% 11.5%
$150,000 + 269,674 25.4% 337,827 30.8% 25.3%
According to STBD Online, as of 2019 there were 1,112,825 total housing units, of which 54.2%(602,697) were owner-occupied, 41.2% (458,189) were renter-occupied and 4.7% (51,939) werevacant. The total number of households is expected to increase by 3% to 1,147,134 in 2024.
Housing Units - Orange County
2010 Census 2019 Estimate 2024 ProjectionPercent Change
‘10 to ‘19 ‘19 to ‘24
Total Housing Units 1,048,907 -- 1,112,825 -- 1,147,134 -- 5.7% 3.0%
Owner-Occupied 588,313 56.1% 602,697 54.2% 625,646 54.5% 2.4% 3.7%
Renter-Occupied 404,468 38.6% 458,189 41.2% 469,809 41.0% 11.7% 2.5%
Vacant 56,126 5.4% 51,939 4.7% 51,679 4.5% -8.1% -0.5%
Regional Conclusions
With its dynamic economy and picturesque coastline setting, the attraction for residents andcommerce is understood. Much of the region's elements draw upon these attributes. Tourism,services, retail trade, and manufacturing, are vital and important elements of the local economy. Based on these factors Orange County is anticipated to remain a desirable residential andcommercial location and will continue to grow over the next decade.
22
AREA ANALYSIS
AREA ANALYSIS
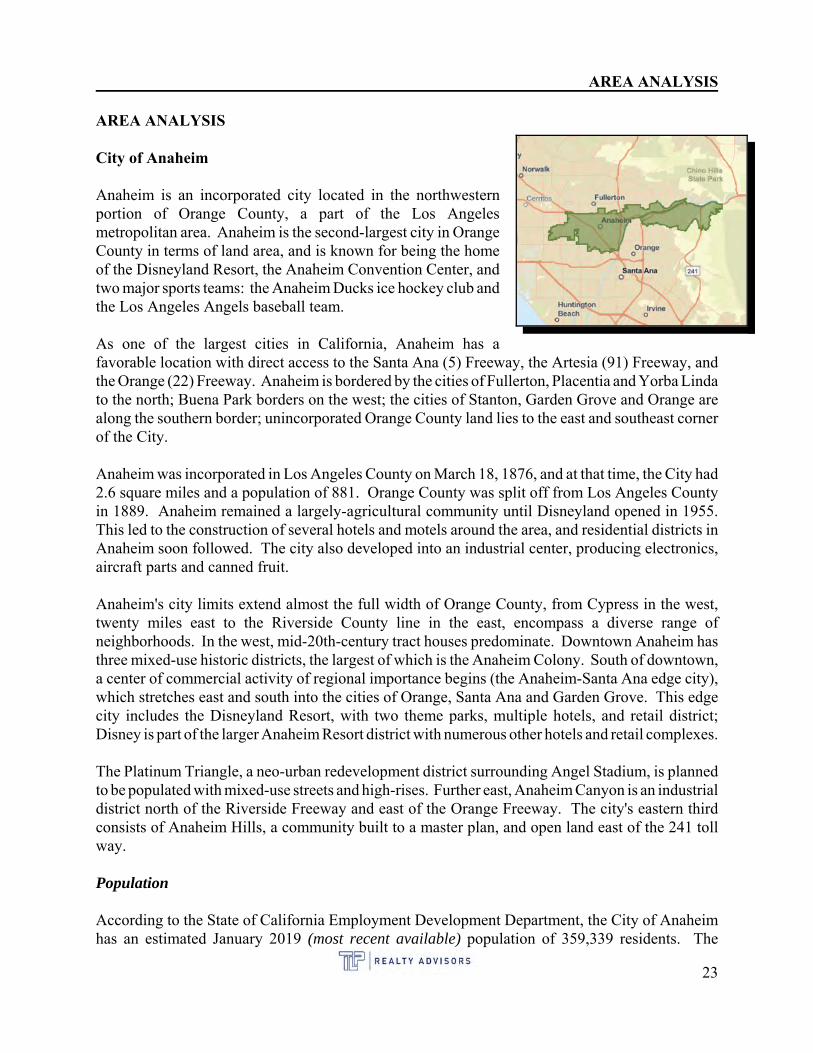
City of Anaheim
Anaheim is an incorporated city located in the northwesternportion of Orange County, a part of the Los Angelesmetropolitan area. Anaheim is the second-largest city in OrangeCounty in terms of land area, and is known for being the homeof the Disneyland Resort, the Anaheim Convention Center, andtwo major sports teams: the Anaheim Ducks ice hockey club andthe Los Angeles Angels baseball team.
As one of the largest cities in California, Anaheim has afavorable location with direct access to the Santa Ana (5) Freeway, the Artesia (91) Freeway, andthe Orange (22) Freeway. Anaheim is bordered by the cities of Fullerton, Placentia and Yorba Lindato the north; Buena Park borders on the west; the cities of Stanton, Garden Grove and Orange arealong the southern border; unincorporated Orange County land lies to the east and southeast cornerof the City.
Anaheim was incorporated in Los Angeles County on March 18, 1876, and at that time, the City had2.6 square miles and a population of 881. Orange County was split off from Los Angeles Countyin 1889. Anaheim remained a largely-agricultural community until Disneyland opened in 1955. This led to the construction of several hotels and motels around the area, and residential districts inAnaheim soon followed. The city also developed into an industrial center, producing electronics,aircraft parts and canned fruit.
Anaheim's city limits extend almost the full width of Orange County, from Cypress in the west,twenty miles east to the Riverside County line in the east, encompass a diverse range ofneighborhoods. In the west, mid-20th-century tract houses predominate. Downtown Anaheim hasthree mixed-use historic districts, the largest of which is the Anaheim Colony. South of downtown,a center of commercial activity of regional importance begins (the Anaheim-Santa Ana edge city),which stretches east and south into the cities of Orange, Santa Ana and Garden Grove. This edgecity includes the Disneyland Resort, with two theme parks, multiple hotels, and retail district;Disney is part of the larger Anaheim Resort district with numerous other hotels and retail complexes.
The Platinum Triangle, a neo-urban redevelopment district surrounding Angel Stadium, is plannedto be populated with mixed-use streets and high-rises. Further east, Anaheim Canyon is an industrialdistrict north of the Riverside Freeway and east of the Orange Freeway. The city's eastern thirdconsists of Anaheim Hills, a community built to a master plan, and open land east of the 241 tollway.
Population
According to the State of California Employment Development Department, the City of Anaheimhas an estimated January 2019 (most recent available) population of 359,339 residents. The
23
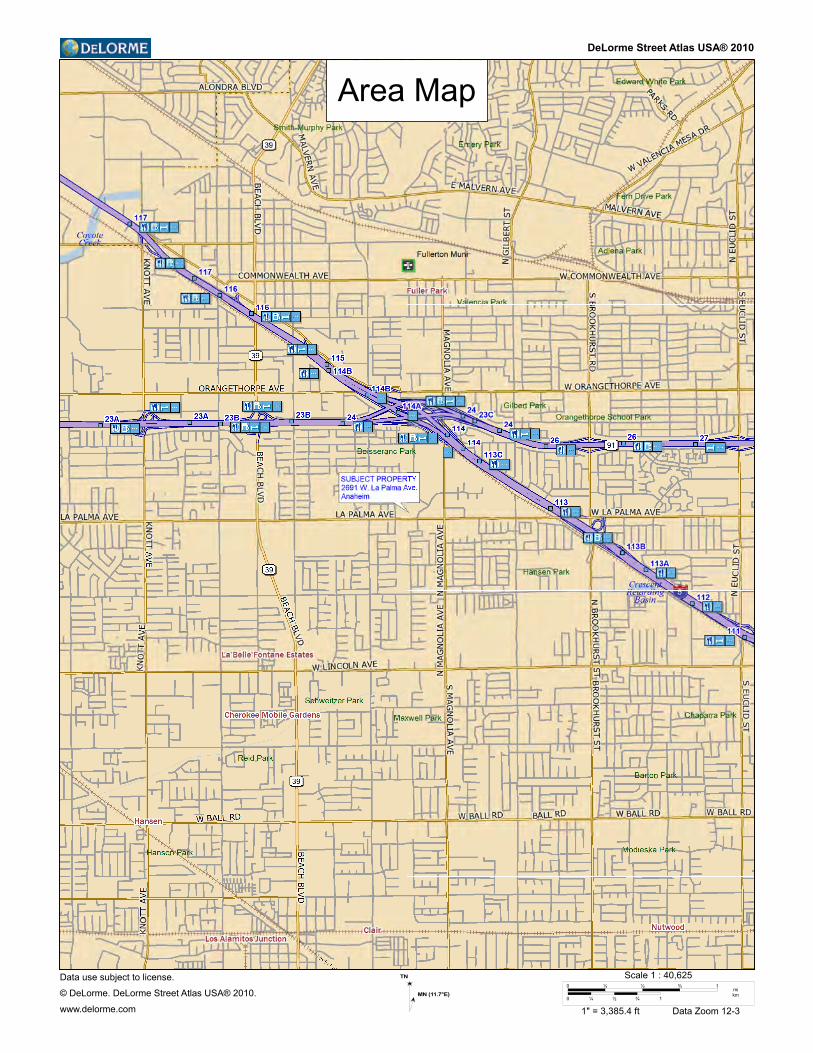
DeLorme Street Atlas USA® 2010
Area Map
Data use subject to license.
© DeLorme. DeLorme Street Atlas USA® 2010.
www.delorme.com
TN
MN (11.7°E)
0 ¼ ½ ¾ 1
0 ¼ ½ ¾ 1
mikm
Scale 1 : 40,625
1" = 3,385.4 ft Data Zoom 12-3
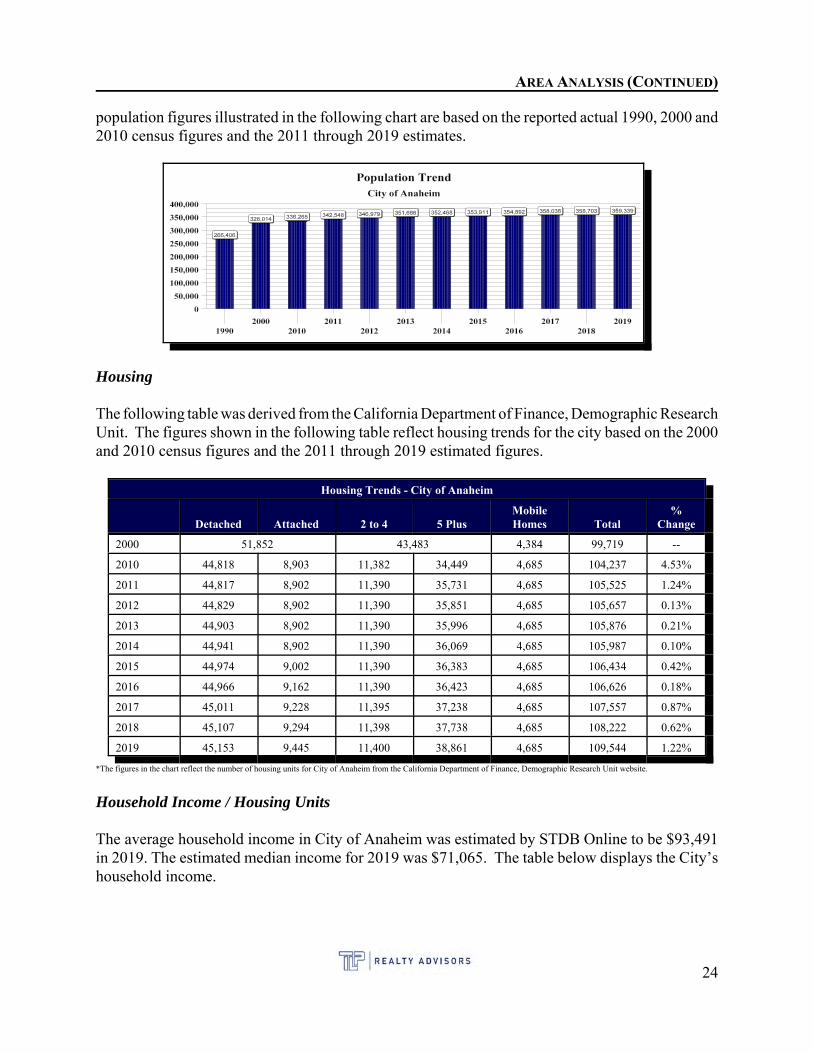
AREA ANALYSIS (CONTINUED)
population figures illustrated in the following chart are based on the reported actual 1990, 2000 and2010 census figures and the 2011 through 2019 estimates.
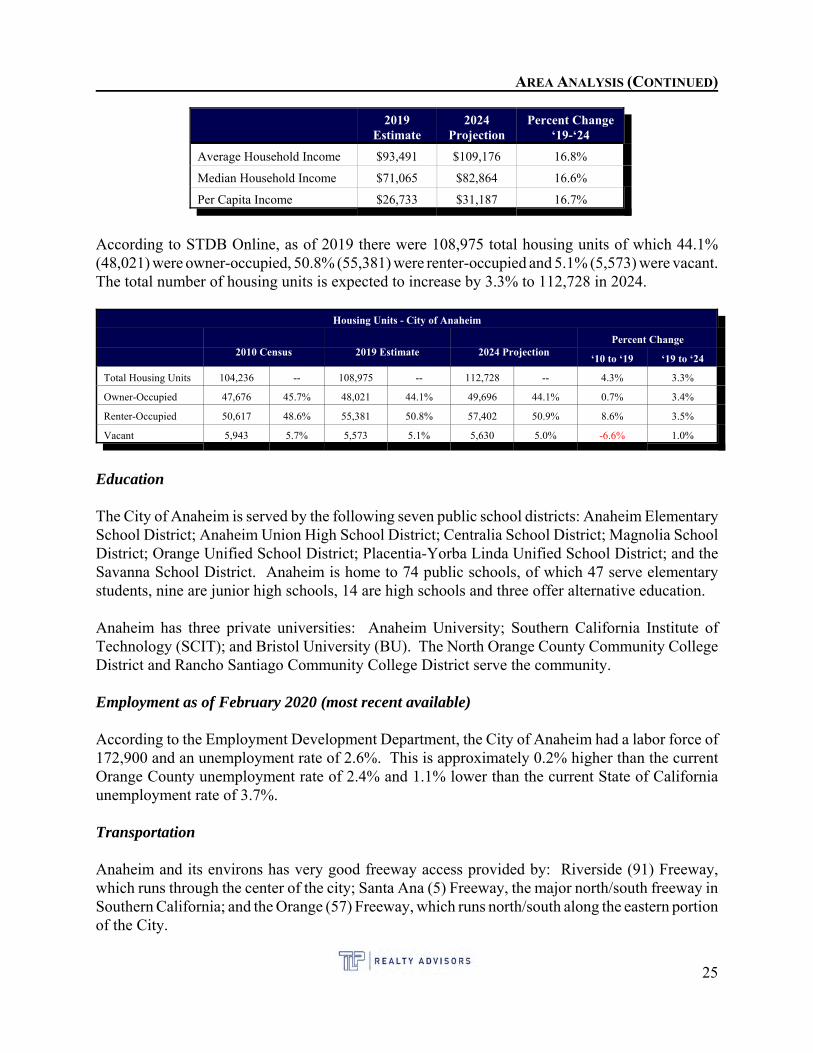
Housing
The following table was derived from the California Department of Finance, Demographic ResearchUnit. The figures shown in the following table reflect housing trends for the city based on the 2000and 2010 census figures and the 2011 through 2019 estimated figures.
Housing Trends - City of Anaheim
Detached Attached 2 to 4 5 PlusMobileHomes Total
%Change
2000 51,852 43,483 4,384 99,719 --
2010 44,818 8,903 11,382 34,449 4,685 104,237 4.53%
2011 44,817 8,902 11,390 35,731 4,685 105,525 1.24%
2012 44,829 8,902 11,390 35,851 4,685 105,657 0.13%
2013 44,903 8,902 11,390 35,996 4,685 105,876 0.21%
2014 44,941 8,902 11,390 36,069 4,685 105,987 0.10%
2015 44,974 9,002 11,390 36,383 4,685 106,434 0.42%
2016 44,966 9,162 11,390 36,423 4,685 106,626 0.18%
2017 45,011 9,228 11,395 37,238 4,685 107,557 0.87%
2018 45,107 9,294 11,398 37,738 4,685 108,222 0.62%
2019 45,153 9,445 11,400 38,861 4,685 109,544 1.22%
*The figures in the chart reflect the number of housing units for City of Anaheim from the California Department of Finance, Demographic Research Unit website.
Household Income / Housing Units
The average household income in City of Anaheim was estimated by STDB Online to be $93,491in 2019. The estimated median income for 2019 was $71,065. The table below displays the City’shousehold income.
24
AREA ANALYSIS (CONTINUED)
2019Estimate
2024Projection
Percent Change‘19-‘24
Average Household Income $93,491 $109,176 16.8%
Median Household Income $71,065 $82,864 16.6%
Per Capita Income $26,733 $31,187 16.7%
According to STDB Online, as of 2019 there were 108,975 total housing units of which 44.1%(48,021) were owner-occupied, 50.8% (55,381) were renter-occupied and 5.1% (5,573) were vacant.The total number of housing units is expected to increase by 3.3% to 112,728 in 2024.
Housing Units - City of Anaheim
2010 Census 2019 Estimate 2024 ProjectionPercent Change
‘10 to ‘19 ‘19 to ‘24
Total Housing Units 104,236 -- 108,975 -- 112,728 -- 4.3% 3.3%
Owner-Occupied 47,676 45.7% 48,021 44.1% 49,696 44.1% 0.7% 3.4%
Renter-Occupied 50,617 48.6% 55,381 50.8% 57,402 50.9% 8.6% 3.5%
Vacant 5,943 5.7% 5,573 5.1% 5,630 5.0% -6.6% 1.0%
Education
The City of Anaheim is served by the following seven public school districts: Anaheim ElementarySchool District; Anaheim Union High School District; Centralia School District; Magnolia SchoolDistrict; Orange Unified School District; Placentia-Yorba Linda Unified School District; and theSavanna School District. Anaheim is home to 74 public schools, of which 47 serve elementarystudents, nine are junior high schools, 14 are high schools and three offer alternative education.
Anaheim has three private universities: Anaheim University; Southern California Institute ofTechnology (SCIT); and Bristol University (BU). The North Orange County Community CollegeDistrict and Rancho Santiago Community College District serve the community.
Employment as of February 2020 (most recent available)
According to the Employment Development Department, the City of Anaheim had a labor force of172,900 and an unemployment rate of 2.6%. This is approximately 0.2% higher than the currentOrange County unemployment rate of 2.4% and 1.1% lower than the current State of Californiaunemployment rate of 3.7%.
Transportation
Anaheim and its environs has very good freeway access provided by: Riverside (91) Freeway,which runs through the center of the city; Santa Ana (5) Freeway, the major north/south freeway inSouthern California; and the Orange (57) Freeway, which runs north/south along the eastern portionof the City.
25
AREA ANALYSIS (CONTINUED)
These major freeways intersect at an interchange situated just east of the City limits. From here, theRiverside Freeway southbound connects to the Costa Mesa Freeway that continues southwest toCosta Mesa and Newport Beach. The Riverside Freeway provides access into Riverside and SanBernardino Counties and west into Los Angeles. The Santa Ana Freeway roughly bisects the City. It extends northwest to Los Angeles and further to Ventura County and central California. To thesouth, it provides access to San Clemente and ultimately to San Diego and the international borderwith Mexico. Also available to the community is the Eastern Transportation corridor, a toll road thatleads from the Riverside Freeway to the major employment centers of Irvine, Tustin and NewportBeach.
All major trucking lines provide one-day service to Los Angeles and overnight delivery to SanDiego and San Francisco.
The Orange County Transit District and Greyhound Bus offer bus transportation both locally andregionally. Amtrak, Santa Fe Railway and the Southern Pacific Transportation Co. provide railservice. Amtrak stations are located within the City.
Anaheim is served by two major railroads, the Union Pacific Railroad and the BNSF Railway. Inaddition, the Anaheim Regional Transportation Intermodal Center (ARCTIC), a major regionaltransit station near Honda Center and Angel Stadium, serves Amtrak, Metrolink, and several busoperators, and the Anaheim Canyon Metrolink station serves Metrolink's IEOC Line.
Anaheim is accessible from several major airports, with Long Beach Airport being approximatelythirty minutes away. Further removed, but easily accessed, are the Los Angeles International, JohnWayne/Orange County, Burbank and Ontario Airports.
Community Data - Immediate Demographics
The following information was derived from STDB Online and pertains to a three-mile ring aroundthe subject property site. Therefore, the ‘area’ referred to in the next section is representative of athree-mile ring (radius) around the site.
Population ~ Within a three-mile radius of the subject property, the current year population is289,227. In 2010, the Census count in the area was 273,022. The rate of change since 2010 was0.63% annually. The five-year projection for the population in the area is 297,345 representing achange of 0.56% annually from 2019 to 2024. Currently, the population is 49.5% male and 50.5%female.
2010 Census 2019 Est. 2024 Proj. ‘10 - ‘19Change
‘19 - ‘24Change
‘19 - ‘24Annual Rate
Population 273,022 289,227 297,345 5.9% 2.8% 0.56%
26
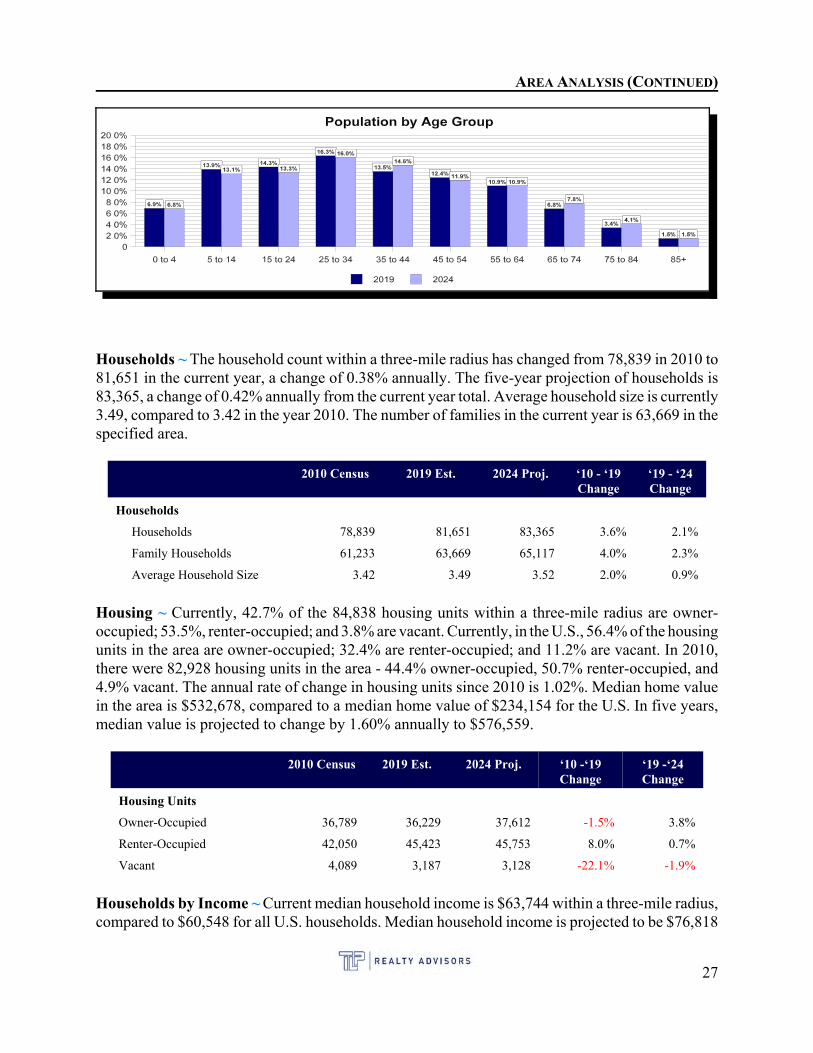
AREA ANALYSIS (CONTINUED)
Households ~ The household count within a three-mile radius has changed from 78,839 in 2010 to81,651 in the current year, a change of 0.38% annually. The five-year projection of households is83,365, a change of 0.42% annually from the current year total. Average household size is currently3.49, compared to 3.42 in the year 2010. The number of families in the current year is 63,669 in thespecified area.
2010 Census 2019 Est. 2024 Proj. ‘10 - ‘19Change
‘19 - ‘24Change
Households
Households 78,839 81,651 83,365 3.6% 2.1%
Family Households 61,233 63,669 65,117 4.0% 2.3%
Average Household Size 3.42 3.49 3.52 2.0% 0.9%
Housing ~ Currently, 42.7% of the 84,838 housing units within a three-mile radius are owner-occupied; 53.5%, renter-occupied; and 3.8% are vacant. Currently, in the U.S., 56.4% of the housingunits in the area are owner-occupied; 32.4% are renter-occupied; and 11.2% are vacant. In 2010,there were 82,928 housing units in the area - 44.4% owner-occupied, 50.7% renter-occupied, and4.9% vacant. The annual rate of change in housing units since 2010 is 1.02%. Median home valuein the area is $532,678, compared to a median home value of $234,154 for the U.S. In five years,median value is projected to change by 1.60% annually to $576,559.
2010 Census 2019 Est. 2024 Proj. ‘10 -‘19Change
‘19 -‘24Change
Housing Units
Owner-Occupied 36,789 36,229 37,612 -1.5% 3.8%
Renter-Occupied 42,050 45,423 45,753 8.0% 0.7%
Vacant 4,089 3,187 3,128 -22.1% -1.9%
Households by Income ~ Current median household income is $63,744 within a three-mile radius,compared to $60,548 for all U.S. households. Median household income is projected to be $76,818
27
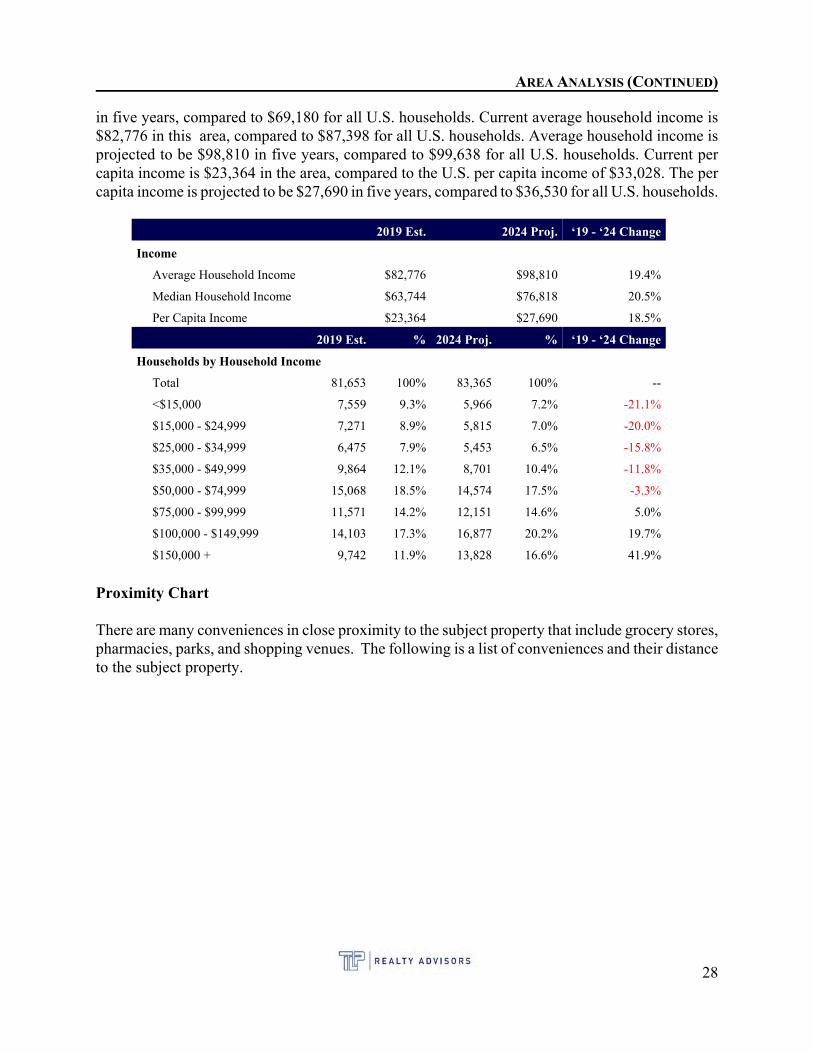
AREA ANALYSIS (CONTINUED)
in five years, compared to $69,180 for all U.S. households. Current average household income is$82,776 in this area, compared to $87,398 for all U.S. households. Average household income isprojected to be $98,810 in five years, compared to $99,638 for all U.S. households. Current percapita income is $23,364 in the area, compared to the U.S. per capita income of $33,028. The percapita income is projected to be $27,690 in five years, compared to $36,530 for all U.S. households.
2019 Est. 2024 Proj. ‘19 - ‘24 Change
Income
Average Household Income $82,776 $98,810 19.4%
Median Household Income $63,744 $76,818 20.5%
Per Capita Income $23,364 $27,690 18.5%
2019 Est. % 2024 Proj. % ‘19 - ‘24 Change
Households by Household Income
Total 81,653 100% 83,365 100% --
<$15,000 7,559 9.3% 5,966 7.2% -21.1%
$15,000 - $24,999 7,271 8.9% 5,815 7.0% -20.0%
$25,000 - $34,999 6,475 7.9% 5,453 6.5% -15.8%
$35,000 - $49,999 9,864 12.1% 8,701 10.4% -11.8%
$50,000 - $74,999 15,068 18.5% 14,574 17.5% -3.3%
$75,000 - $99,999 11,571 14.2% 12,151 14.6% 5.0%
$100,000 - $149,999 14,103 17.3% 16,877 20.2% 19.7%
$150,000 + 9,742 11.9% 13,828 16.6% 41.9%
Proximity Chart
There are many conveniences in close proximity to the subject property that include grocery stores,pharmacies, parks, and shopping venues. The following is a list of conveniences and their distanceto the subject property.
28
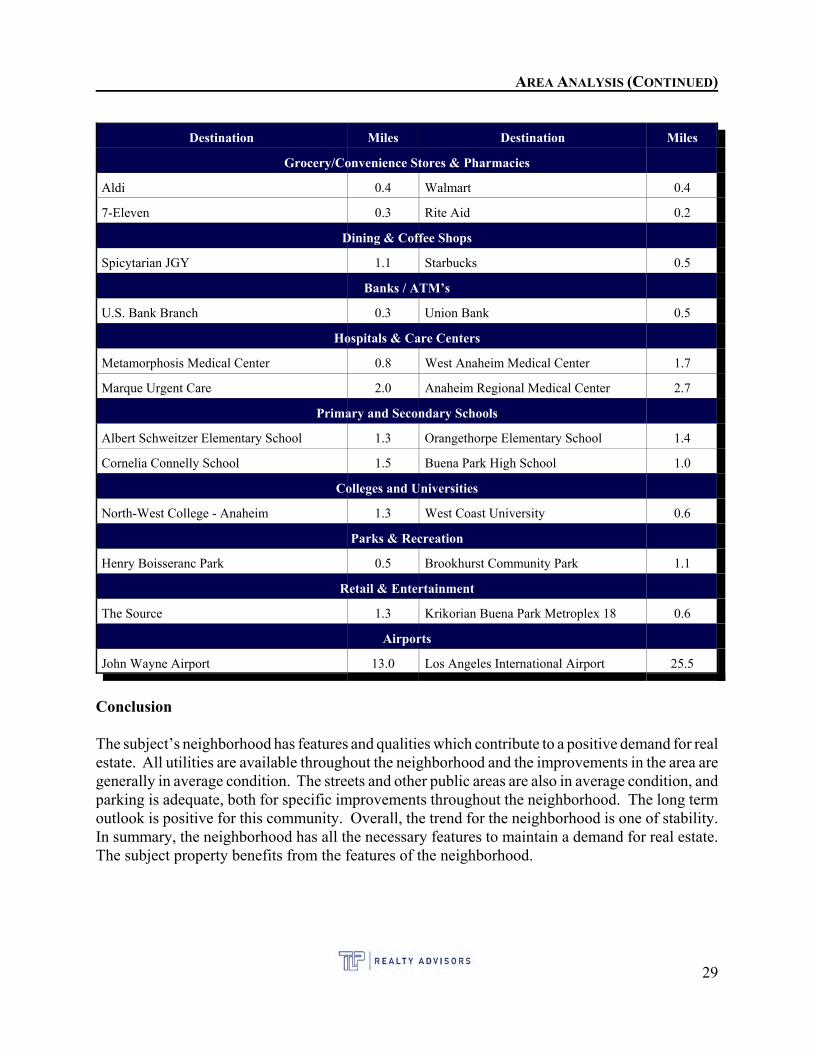
AREA ANALYSIS (CONTINUED)
Destination Miles Destination Miles
Grocery/Convenience Stores & Pharmacies
Aldi 0.4 Walmart 0.4
7-Eleven 0.3 Rite Aid 0.2
Dining & Coffee Shops
Spicytarian JGY 1.1 Starbucks 0.5
Banks / ATM’s
U.S. Bank Branch 0.3 Union Bank 0.5
Hospitals & Care Centers
Metamorphosis Medical Center 0.8 West Anaheim Medical Center 1.7
Marque Urgent Care 2.0 Anaheim Regional Medical Center 2.7
Primary and Secondary Schools
Albert Schweitzer Elementary School 1.3 Orangethorpe Elementary School 1.4
Cornelia Connelly School 1.5 Buena Park High School 1.0
Colleges and Universities
North-West College - Anaheim 1.3 West Coast University 0.6
Parks & Recreation
Henry Boisseranc Park 0.5 Brookhurst Community Park 1.1
Retail & Entertainment
The Source 1.3 Krikorian Buena Park Metroplex 18 0.6
Airports
John Wayne Airport 13.0 Los Angeles International Airport 25.5
Conclusion
The subject’s neighborhood has features and qualities which contribute to a positive demand for realestate. All utilities are available throughout the neighborhood and the improvements in the area aregenerally in average condition. The streets and other public areas are also in average condition, andparking is adequate, both for specific improvements throughout the neighborhood. The long termoutlook is positive for this community. Overall, the trend for the neighborhood is one of stability. In summary, the neighborhood has all the necessary features to maintain a demand for real estate. The subject property benefits from the features of the neighborhood.
29
MARKET ANALYSIS
APARTMENT MARKET
The following market information was derived from CoStar Group, Inc. The first section pertainsto the Orange County macro apartment market and the second section pertains to the subject’ssubmarket and micro apartment market.
The following information pertains to the Orange County apartment market and was derived fromCoStar Group, Inc. as of the First Quarter of 2020.
Apartment Macro Market - Orange County via CoStar Group, Inc.As of the First Quarter of 2020
The large amount of new multifamily inventory, around 11%, that has delivered this cycle in OrangeCounty has almost primarily been high-end luxury end units. Developers often have little choice,as the cost of development has continued to surge, and numerous supply constraints have providedadditional obstacles to new construction.
Rent growth in the county has been below the peak reached in 2016, however annual growth hastended above the historical average in recent quarters. Submarkets that had seen some of the largestinventory growth this cycle finally saw solid rent growth as strong lease-up helped landlords driverent growth in recent quarters. Pricing continues to rise, as investor interest in Orange County hasyet to wane, though inventory turnover has continued to trend down.
Vacancy
Demand drivers in the metro are strong and more diversified compared with the last cycle. Despitethe large amount of inventory delivering in the past few years, vacancies remain around thehistorical average and sit at 5.5%.
The Orange County workforce is highly educated, with a little more than 40% of residents havingat least a bachelor’s degree. This provides a backbone for the multifamily sector, and despite themedian home value dipping in the past year, at $720,000, home ownership remains out of reach formany residents.
Orange County's home ownership rate has steadily fallen over the past decade, from north of 62%to 57%, and newly built homes average nearly $900,000. Less than a quarter of the county'shouseholds earn the requisite income to afford a median-priced home, according to ChapmanUniversity. The California Department of Housing states that residents (owners and renters) ofOrange County on average pay more than 44% of their income toward housing costs.
Population growth is most pronounced in Irvine, the economic heart of the metro. It has beengrowing by more than 2.5% annually the past few years, the highest rate in the county. Additionally,more than two-thirds of residents have a four-year degree. The disproportionate flow of demand intoIrvine is leading to heavy supply additions. Despite the supply continuing to pour into thesubmarket, demand is stable, although vacancies might be difficult to keep in check. Today’s
30
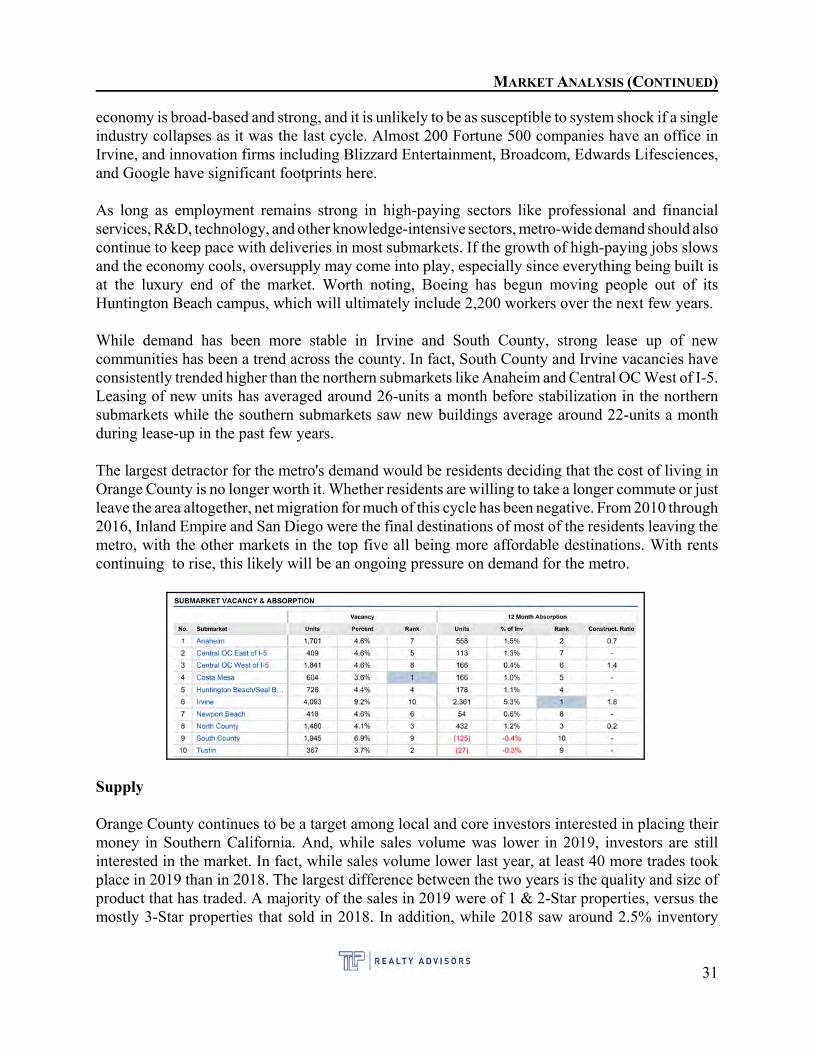
MARKET ANALYSIS (CONTINUED)
economy is broad-based and strong, and it is unlikely to be as susceptible to system shock if a singleindustry collapses as it was the last cycle. Almost 200 Fortune 500 companies have an office inIrvine, and innovation firms including Blizzard Entertainment, Broadcom, Edwards Lifesciences,and Google have significant footprints here.
As long as employment remains strong in high-paying sectors like professional and financialservices, R&D, technology, and other knowledge-intensive sectors, metro-wide demand should alsocontinue to keep pace with deliveries in most submarkets. If the growth of high-paying jobs slowsand the economy cools, oversupply may come into play, especially since everything being built isat the luxury end of the market. Worth noting, Boeing has begun moving people out of itsHuntington Beach campus, which will ultimately include 2,200 workers over the next few years.
While demand has been more stable in Irvine and South County, strong lease up of newcommunities has been a trend across the county. In fact, South County and Irvine vacancies haveconsistently trended higher than the northern submarkets like Anaheim and Central OC West of I-5.Leasing of new units has averaged around 26-units a month before stabilization in the northernsubmarkets while the southern submarkets saw new buildings average around 22-units a monthduring lease-up in the past few years.
The largest detractor for the metro's demand would be residents deciding that the cost of living inOrange County is no longer worth it. Whether residents are willing to take a longer commute or justleave the area altogether, net migration for much of this cycle has been negative. From 2010 through2016, Inland Empire and San Diego were the final destinations of most of the residents leaving themetro, with the other markets in the top five all being more affordable destinations. With rentscontinuing to rise, this likely will be an ongoing pressure on demand for the metro.
Supply
Orange County continues to be a target among local and core investors interested in placing theirmoney in Southern California. And, while sales volume was lower in 2019, investors are stillinterested in the market. In fact, while sales volume lower last year, at least 40 more trades tookplace in 2019 than in 2018. The largest difference between the two years is the quality and size ofproduct that has traded. A majority of the sales in 2019 were of 1 & 2-Star properties, versus themostly 3-Star properties that sold in 2018. In addition, while 2018 saw around 2.5% inventory
31
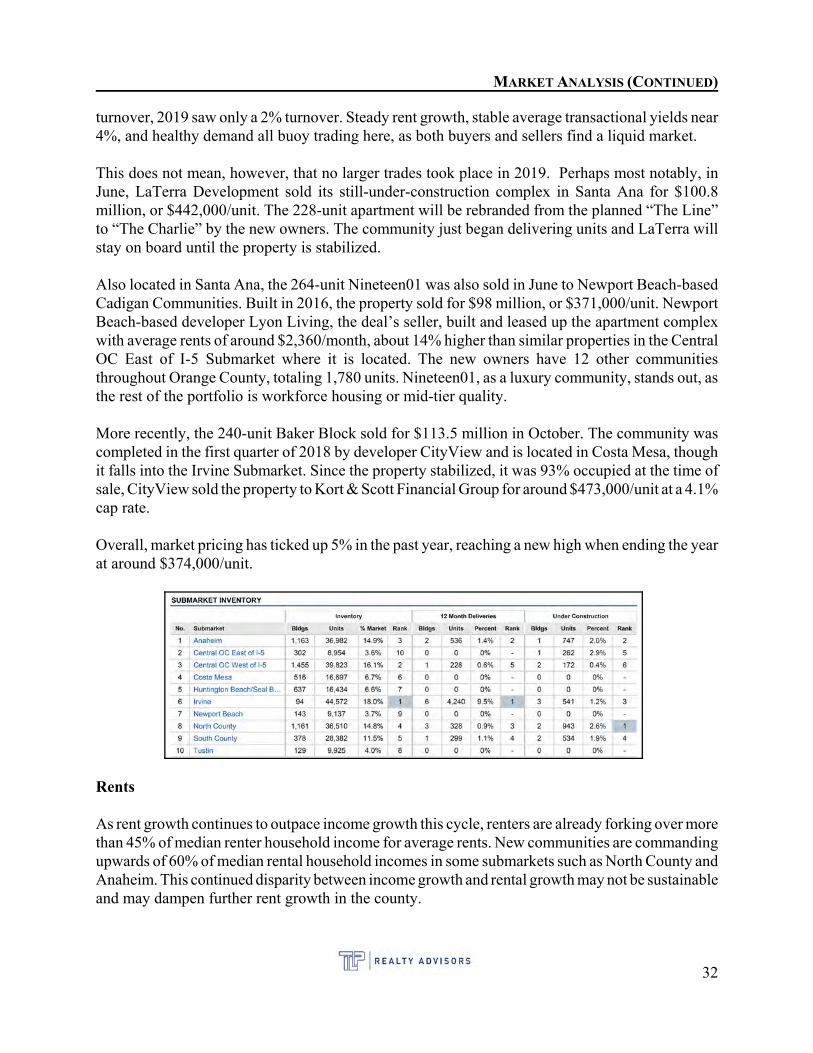
MARKET ANALYSIS (CONTINUED)
turnover, 2019 saw only a 2% turnover. Steady rent growth, stable average transactional yields near 4%, and healthy demand all buoy trading here, as both buyers and sellers find a liquid market.
This does not mean, however, that no larger trades took place in 2019. Perhaps most notably, inJune, LaTerra Development sold its still-under-construction complex in Santa Ana for $100.8million, or $442,000/unit. The 228-unit apartment will be rebranded from the planned “The Line”to “The Charlie” by the new owners. The community just began delivering units and LaTerra willstay on board until the property is stabilized.
Also located in Santa Ana, the 264-unit Nineteen01 was also sold in June to Newport Beach-basedCadigan Communities. Built in 2016, the property sold for $98 million, or $371,000/unit. NewportBeach-based developer Lyon Living, the deal’s seller, built and leased up the apartment complexwith average rents of around $2,360/month, about 14% higher than similar properties in the CentralOC East of I-5 Submarket where it is located. The new owners have 12 other communitiesthroughout Orange County, totaling 1,780 units. Nineteen01, as a luxury community, stands out, asthe rest of the portfolio is workforce housing or mid-tier quality.
More recently, the 240-unit Baker Block sold for $113.5 million in October. The community wascompleted in the first quarter of 2018 by developer CityView and is located in Costa Mesa, thoughit falls into the Irvine Submarket. Since the property stabilized, it was 93% occupied at the time ofsale, CityView sold the property to Kort & Scott Financial Group for around $473,000/unit at a 4.1%cap rate.
Overall, market pricing has ticked up 5% in the past year, reaching a new high when ending the yearat around $374,000/unit.
Rents
As rent growth continues to outpace income growth this cycle, renters are already forking over morethan 45% of median renter household income for average rents. New communities are commandingupwards of 60% of median rental household incomes in some submarkets such as North County andAnaheim. This continued disparity between income growth and rental growth may not be sustainableand may dampen further rent growth in the county.
32
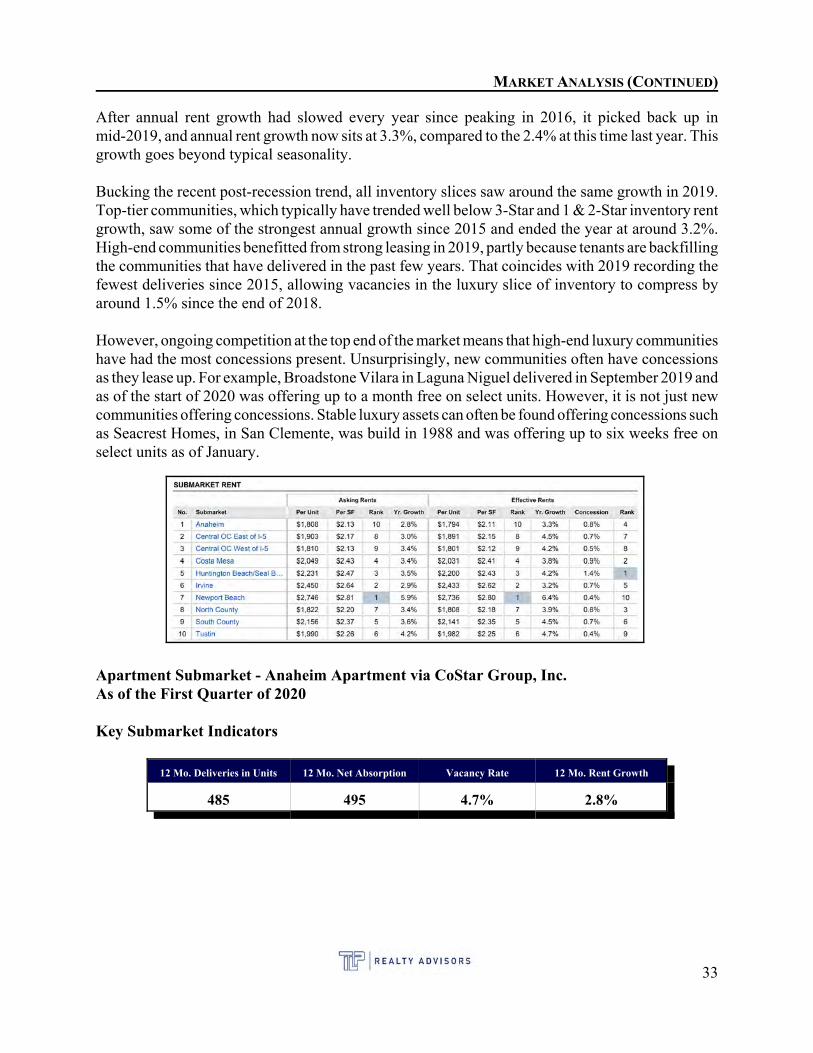
MARKET ANALYSIS (CONTINUED)
After annual rent growth had slowed every year since peaking in 2016, it picked back up inmid-2019, and annual rent growth now sits at 3.3%, compared to the 2.4% at this time last year. Thisgrowth goes beyond typical seasonality.
Bucking the recent post-recession trend, all inventory slices saw around the same growth in 2019.Top-tier communities, which typically have trended well below 3-Star and 1 & 2-Star inventory rentgrowth, saw some of the strongest annual growth since 2015 and ended the year at around 3.2%.High-end communities benefitted from strong leasing in 2019, partly because tenants are backfillingthe communities that have delivered in the past few years. That coincides with 2019 recording thefewest deliveries since 2015, allowing vacancies in the luxury slice of inventory to compress byaround 1.5% since the end of 2018.
However, ongoing competition at the top end of the market means that high-end luxury communitieshave had the most concessions present. Unsurprisingly, new communities often have concessionsas they lease up. For example, Broadstone Vilara in Laguna Niguel delivered in September 2019 andas of the start of 2020 was offering up to a month free on select units. However, it is not just newcommunities offering concessions. Stable luxury assets can often be found offering concessions such as Seacrest Homes, in San Clemente, was build in 1988 and was offering up to six weeks free onselect units as of January.
Apartment Submarket - Anaheim Apartment via CoStar Group, Inc.As of the First Quarter of 2020
Key Submarket Indicators
12 Mo. Deliveries in Units 12 Mo. Net Absorption Vacancy Rate 12 Mo. Rent Growth
485 495 4.7% 2.8%
33
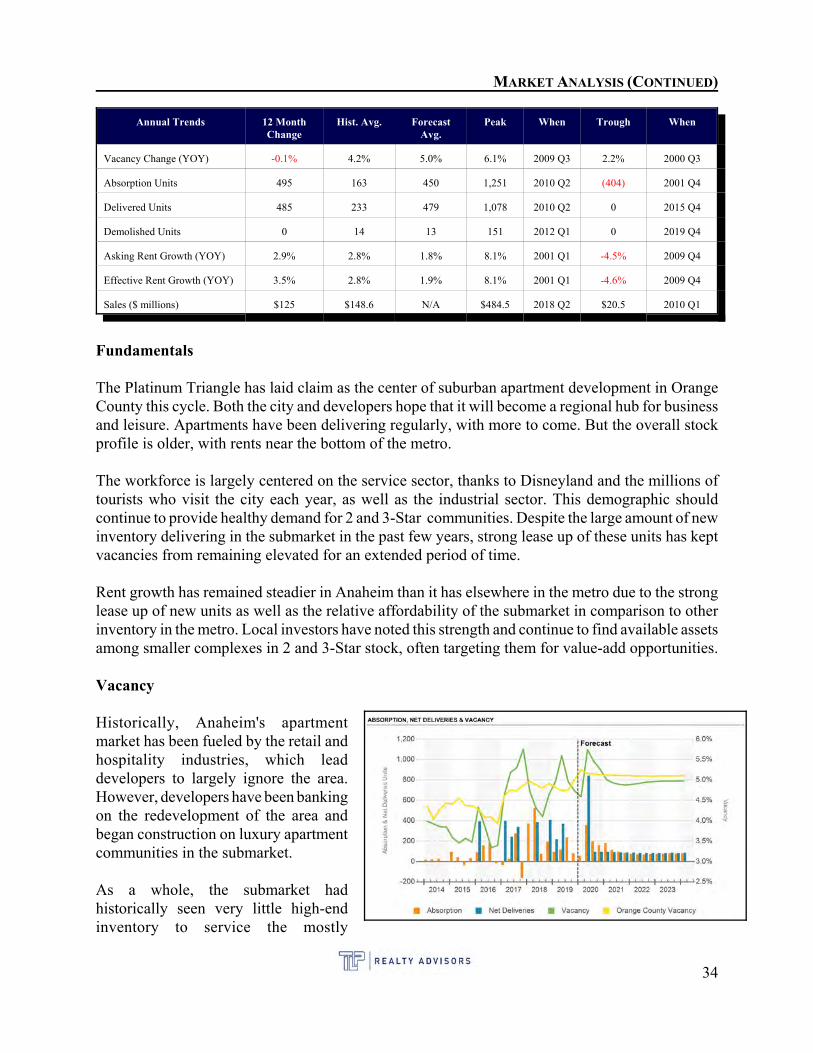
MARKET ANALYSIS (CONTINUED)
Annual Trends 12 MonthChange
Hist. Avg. ForecastAvg.
Peak When Trough When
Vacancy Change (YOY) -0.1% 4.2% 5.0% 6.1% 2009 Q3 2.2% 2000 Q3
Absorption Units 495 163 450 1,251 2010 Q2 (404) 2001 Q4
Delivered Units 485 233 479 1,078 2010 Q2 0 2015 Q4
Demolished Units 0 14 13 151 2012 Q1 0 2019 Q4
Asking Rent Growth (YOY) 2.9% 2.8% 1.8% 8.1% 2001 Q1 -4.5% 2009 Q4
Effective Rent Growth (YOY) 3.5% 2.8% 1.9% 8.1% 2001 Q1 -4.6% 2009 Q4
Sales ($ millions) $125 $148.6 N/A $484.5 2018 Q2 $20.5 2010 Q1
Fundamentals
The Platinum Triangle has laid claim as the center of suburban apartment development in OrangeCounty this cycle. Both the city and developers hope that it will become a regional hub for businessand leisure. Apartments have been delivering regularly, with more to come. But the overall stockprofile is older, with rents near the bottom of the metro.
The workforce is largely centered on the service sector, thanks to Disneyland and the millions oftourists who visit the city each year, as well as the industrial sector. This demographic shouldcontinue to provide healthy demand for 2 and 3-Star communities. Despite the large amount of newinventory delivering in the submarket in the past few years, strong lease up of these units has keptvacancies from remaining elevated for an extended period of time.
Rent growth has remained steadier in Anaheim than it has elsewhere in the metro due to the stronglease up of new units as well as the relative affordability of the submarket in comparison to otherinventory in the metro. Local investors have noted this strength and continue to find available assetsamong smaller complexes in 2 and 3-Star stock, often targeting them for value-add opportunities.
Vacancy
Historically, Anaheim's apartmentmarket has been fueled by the retail andhospitality industries, which leaddevelopers to largely ignore the area.However, developers have been bankingon the redevelopment of the area andbegan construction on luxury apartmentcommunities in the submarket.
As a whole, the submarket hadhistorically seen very little high-endinventory to service the mostly
34
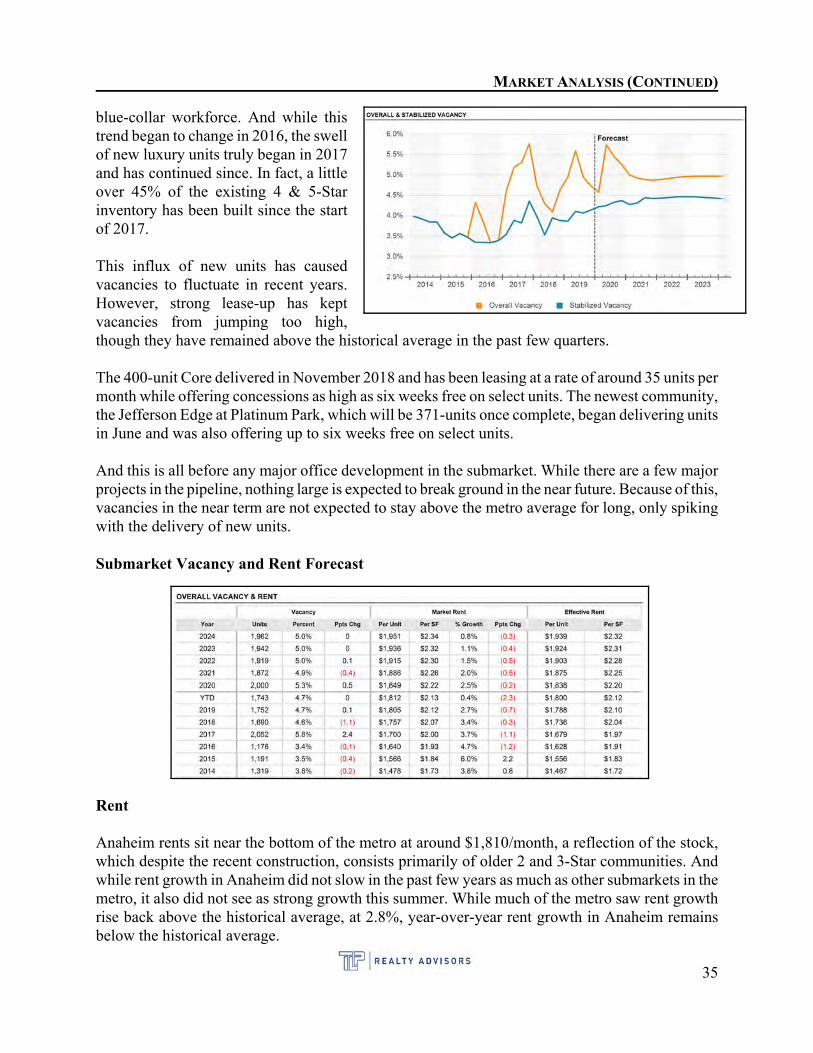
MARKET ANALYSIS (CONTINUED)
blue-collar workforce. And while thistrend began to change in 2016, the swellof new luxury units truly began in 2017and has continued since. In fact, a littleover 45% of the existing 4 & 5-Starinventory has been built since the startof 2017.
This influx of new units has causedvacancies to fluctuate in recent years.However, strong lease-up has keptvacancies from jumping too high,though they have remained above the historical average in the past few quarters.
The 400-unit Core delivered in November 2018 and has been leasing at a rate of around 35 units permonth while offering concessions as high as six weeks free on select units. The newest community,the Jefferson Edge at Platinum Park, which will be 371-units once complete, began delivering unitsin June and was also offering up to six weeks free on select units.
And this is all before any major office development in the submarket. While there are a few majorprojects in the pipeline, nothing large is expected to break ground in the near future. Because of this,vacancies in the near term are not expected to stay above the metro average for long, only spikingwith the delivery of new units.
Submarket Vacancy and Rent Forecast
Rent
Anaheim rents sit near the bottom of the metro at around $1,810/month, a reflection of the stock,which despite the recent construction, consists primarily of older 2 and 3-Star communities. Andwhile rent growth in Anaheim did not slow in the past few years as much as other submarkets in themetro, it also did not see as strong growth this summer. While much of the metro saw rent growthrise back above the historical average, at 2.8%, year-over-year rent growth in Anaheim remainsbelow the historical average.
35
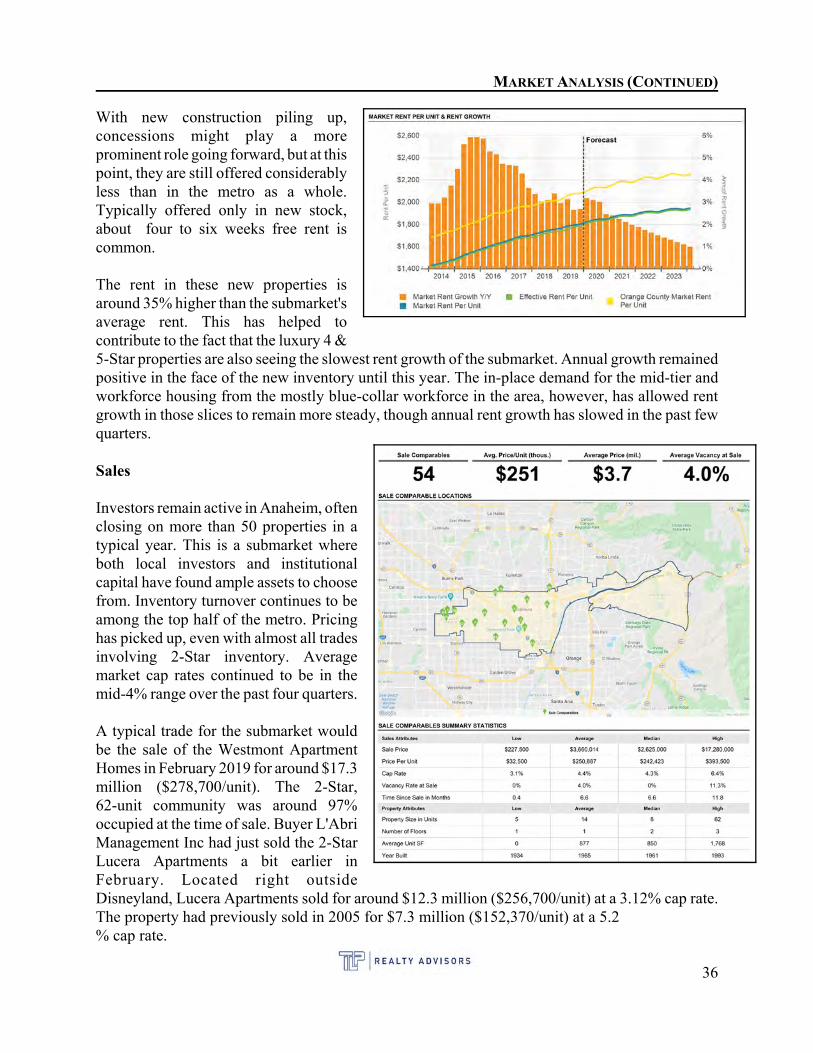
MARKET ANALYSIS (CONTINUED)
With new construction piling up,concessions might play a moreprominent role going forward, but at thispoint, they are still offered considerablyless than in the metro as a whole.Typically offered only in new stock,about four to six weeks free rent iscommon.
The rent in these new properties isaround 35% higher than the submarket'saverage rent. This has helped tocontribute to the fact that the luxury 4 &5-Star properties are also seeing the slowest rent growth of the submarket. Annual growth remainedpositive in the face of the new inventory until this year. The in-place demand for the mid-tier andworkforce housing from the mostly blue-collar workforce in the area, however, has allowed rentgrowth in those slices to remain more steady, though annual rent growth has slowed in the past fewquarters.
Sales
Investors remain active in Anaheim, oftenclosing on more than 50 properties in atypical year. This is a submarket whereboth local investors and institutionalcapital have found ample assets to choosefrom. Inventory turnover continues to beamong the top half of the metro. Pricinghas picked up, even with almost all tradesinvolving 2-Star inventory. Averagemarket cap rates continued to be in themid-4% range over the past four quarters.
A typical trade for the submarket wouldbe the sale of the Westmont ApartmentHomes in February 2019 for around $17.3million ($278,700/unit). The 2-Star,62-unit community was around 97%occupied at the time of sale. Buyer L'AbriManagement Inc had just sold the 2-StarLucera Apartments a bit earlier inFebruary. Located right outsideDisneyland, Lucera Apartments sold for around $12.3 million ($256,700/unit) at a 3.12% cap rate.The property had previously sold in 2005 for $7.3 million ($152,370/unit) at a 5.2% cap rate.
36
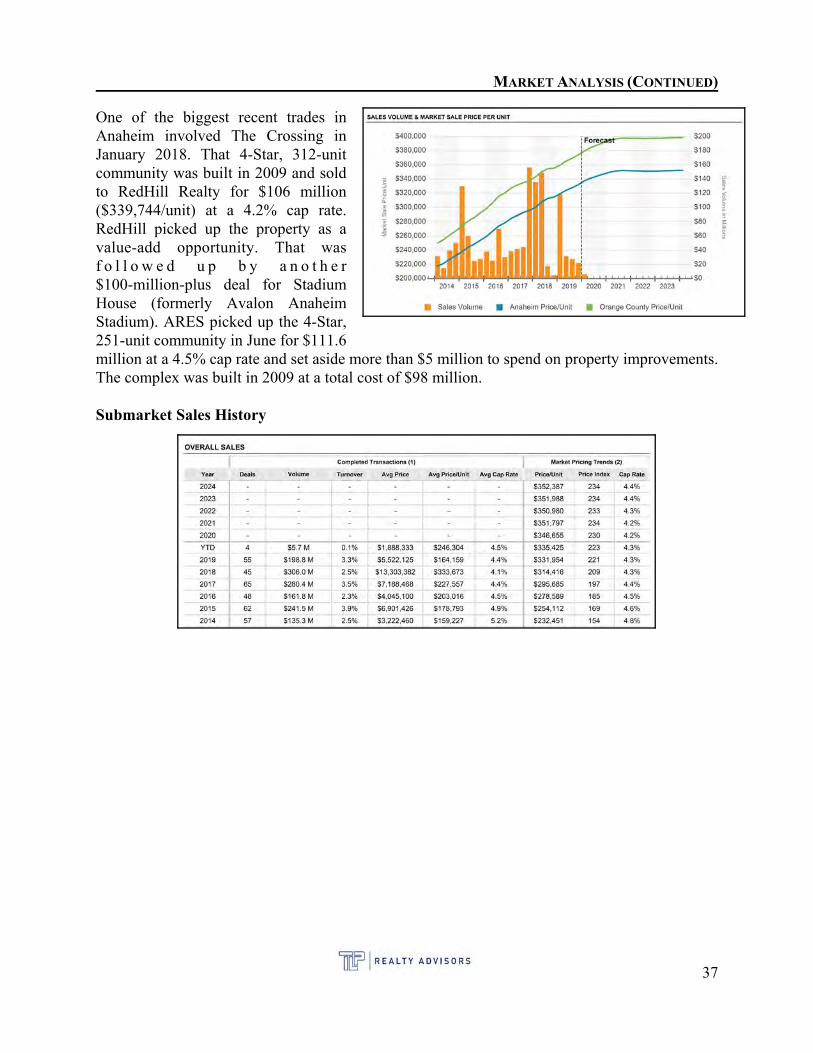
MARKET ANALYSIS (CONTINUED)
One of the biggest recent trades inAnaheim involved The Crossing inJanuary 2018. That 4-Star, 312-unitcommunity was built in 2009 and soldto RedHill Realty for $106 million($339,744/unit) at a 4.2% cap rate.RedHill picked up the property as avalue-add opportunity. That wasf o l l o w e d u p b y a n o t h e r$100-million-plus deal for StadiumHouse (formerly Avalon AnaheimStadium). ARES picked up the 4-Star,251-unit community in June for $111.6million at a 4.5% cap rate and set aside more than $5 million to spend on property improvements.The complex was built in 2009 at a total cost of $98 million.
Submarket Sales History
37
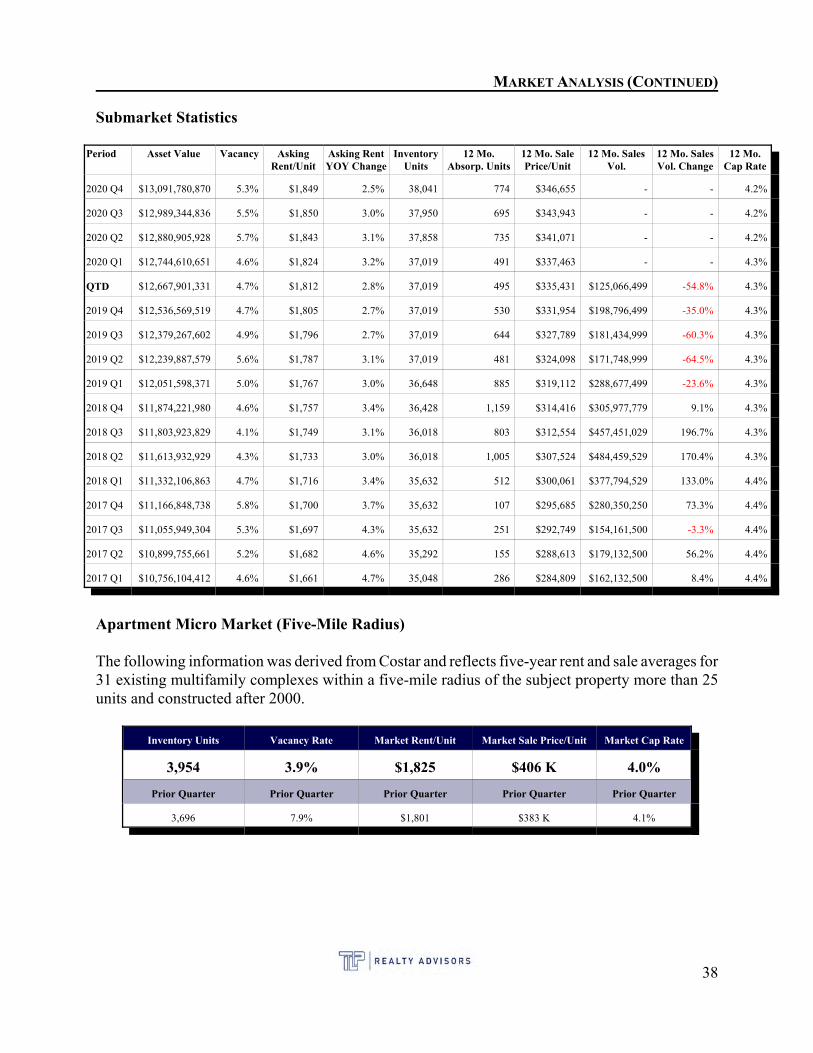
MARKET ANALYSIS (CONTINUED)
Submarket Statistics
Period Asset Value Vacancy AskingRent/Unit
Asking RentYOY Change
InventoryUnits
12 Mo.Absorp. Units
12 Mo. SalePrice/Unit
12 Mo. SalesVol.
12 Mo. SalesVol. Change
12 Mo.Cap Rate
2020 Q4 $13,091,780,870 5.3% $1,849 2.5% 38,041 774 $346,655 - - 4.2%
2020 Q3 $12,989,344,836 5.5% $1,850 3.0% 37,950 695 $343,943 - - 4.2%
2020 Q2 $12,880,905,928 5.7% $1,843 3.1% 37,858 735 $341,071 - - 4.2%
2020 Q1 $12,744,610,651 4.6% $1,824 3.2% 37,019 491 $337,463 - - 4.3%
QTD $12,667,901,331 4.7% $1,812 2.8% 37,019 495 $335,431 $125,066,499 -54.8% 4.3%
2019 Q4 $12,536,569,519 4.7% $1,805 2.7% 37,019 530 $331,954 $198,796,499 -35.0% 4.3%
2019 Q3 $12,379,267,602 4.9% $1,796 2.7% 37,019 644 $327,789 $181,434,999 -60.3% 4.3%
2019 Q2 $12,239,887,579 5.6% $1,787 3.1% 37,019 481 $324,098 $171,748,999 -64.5% 4.3%
2019 Q1 $12,051,598,371 5.0% $1,767 3.0% 36,648 885 $319,112 $288,677,499 -23.6% 4.3%
2018 Q4 $11,874,221,980 4.6% $1,757 3.4% 36,428 1,159 $314,416 $305,977,779 9.1% 4.3%
2018 Q3 $11,803,923,829 4.1% $1,749 3.1% 36,018 803 $312,554 $457,451,029 196.7% 4.3%
2018 Q2 $11,613,932,929 4.3% $1,733 3.0% 36,018 1,005 $307,524 $484,459,529 170.4% 4.3%
2018 Q1 $11,332,106,863 4.7% $1,716 3.4% 35,632 512 $300,061 $377,794,529 133.0% 4.4%
2017 Q4 $11,166,848,738 5.8% $1,700 3.7% 35,632 107 $295,685 $280,350,250 73.3% 4.4%
2017 Q3 $11,055,949,304 5.3% $1,697 4.3% 35,632 251 $292,749 $154,161,500 -3.3% 4.4%
2017 Q2 $10,899,755,661 5.2% $1,682 4.6% 35,292 155 $288,613 $179,132,500 56.2% 4.4%
2017 Q1 $10,756,104,412 4.6% $1,661 4.7% 35,048 286 $284,809 $162,132,500 8.4% 4.4%
Apartment Micro Market (Five-Mile Radius)
The following information was derived from Costar and reflects five-year rent and sale averages for31 existing multifamily complexes within a five-mile radius of the subject property more than 25units and constructed after 2000.
Inventory Units Vacancy Rate Market Rent/Unit Market Sale Price/Unit Market Cap Rate
3,954 3.9% $1,825 $406 K 4.0%
Prior Quarter Prior Quarter Prior Quarter Prior Quarter Prior Quarter
3,696 7.9% $1,801 $383 K 4.1%
38
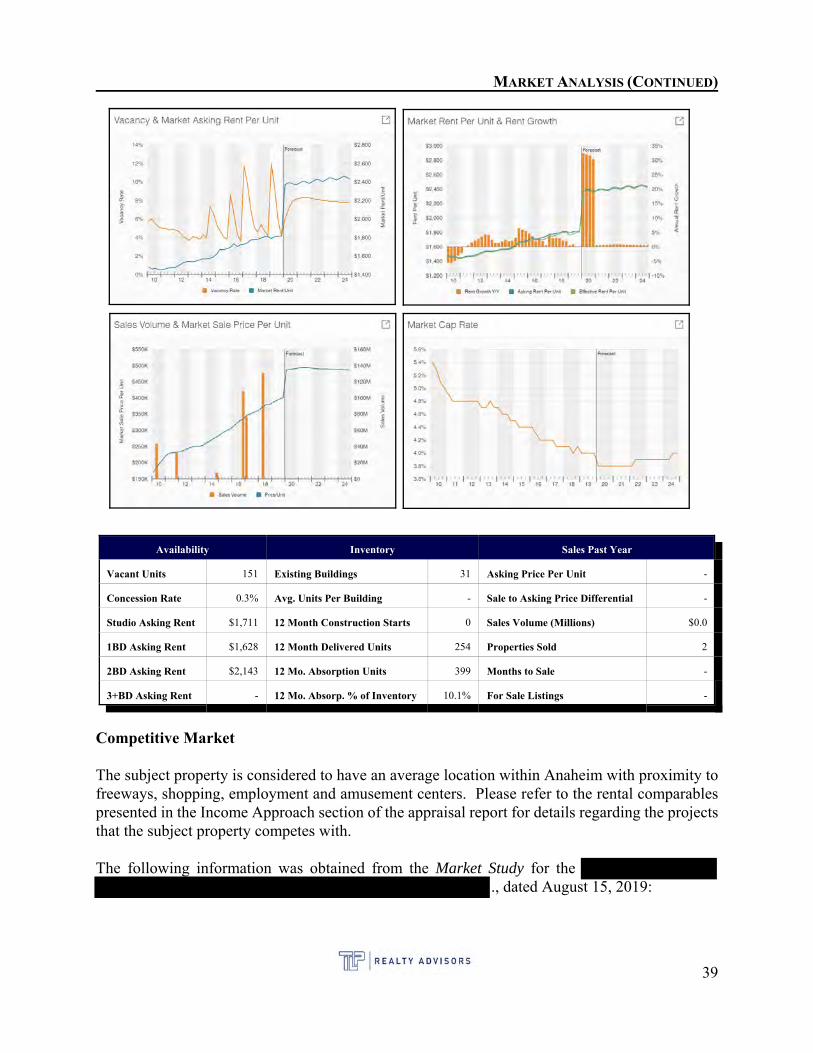
MARKET ANALYSIS (CONTINUED)
Availability Inventory Sales Past Year
Vacant Units 151 Existing Buildings 31 Asking Price Per Unit -
Concession Rate 0.3% Avg. Units Per Building - Sale to Asking Price Differential -
Studio Asking Rent $1,711 12 Month Construction Starts 0 Sales Volume (Millions) $0.0
1BD Asking Rent $1,628 12 Month Delivered Units 254 Properties Sold 2
2BD Asking Rent $2,143 12 Mo. Absorption Units 399 Months to Sale -
3+BD Asking Rent - 12 Mo. Absorp. % of Inventory 10.1% For Sale Listings -
Competitive Market
The subject property is considered to have an average location within Anaheim with proximity tofreeways, shopping, employment and amusement centers. Please refer to the rental comparablespresented in the Income Approach section of the appraisal report for details regarding the projectsthat the subject property competes with.
The following information was obtained from the Market Study for the ., dated August 15, 2019:
39
MARKET ANALYSIS (CONTINUED)
The purpose of this market study is to assess the viability of The Subject will consist of 70 units, including 69 - studio units and one - one
bedroom manager unit. With the exception of the manager unit, all of the Subject’s units willbe restricted at the 30 percent Area Median Income (AMI) level to homeless individuals witha mental health diagnosis; the Subject will also have 20 units reserved for homelessveterans. All of the units except the manager unit will have project-based vouchers that willassist tenants with rent and utility costs. The date of the property inspection was July 31,2019, which is also the effective date.
The estimate of demand will be based on the 2019 point-in time count of homelesshouseholds in Orange County. It should be noted that point-in-time counts are the onlymeasure that captures the scope of people experiencing homelessness who are unsheltered– living on the streets, in cars, in abandoned buildings, and other places not meant forhuman habitation. Point-in-time counts are intended to provide a snapshot of how manypeople are homeless on a given night.
Demand From Existing Homeless Households
We estimated demand based on the 2019 Point-in-Time results for Orange County. Adescription of the steps involved in the estimate of demand is detailed below.
Number of Existing Homeless Households
Total number of homeless households is 6,860 in 2019. Approximately 3,961 households areunsheltered households, accounting for 57.7 percent of the homeless population.
Number of Existing Homeless Mentally Ill Households
The total number of homeless mentally ill households was 984 in 2019. This equates to 24.8percent of the total unsheltered homeless population in the PMA.
Number of Existing Veteran Homeless Households
The total number of unsheltered homeless veteran households was 212 in 2019. This equatesto 5.4 percent of the total unsheltered homeless population in the PMA. Additionally,unsheltered veterans are more willing to move from areas outside of the PMA for manydifferent reasons; therefore, we have utilized a 15 percent leakage factor.
Number of Income Qualified Renter Households
Given that homeless persons are likely to have no incomes, it is reasonable to assume all ofthe households will be income qualified.
40
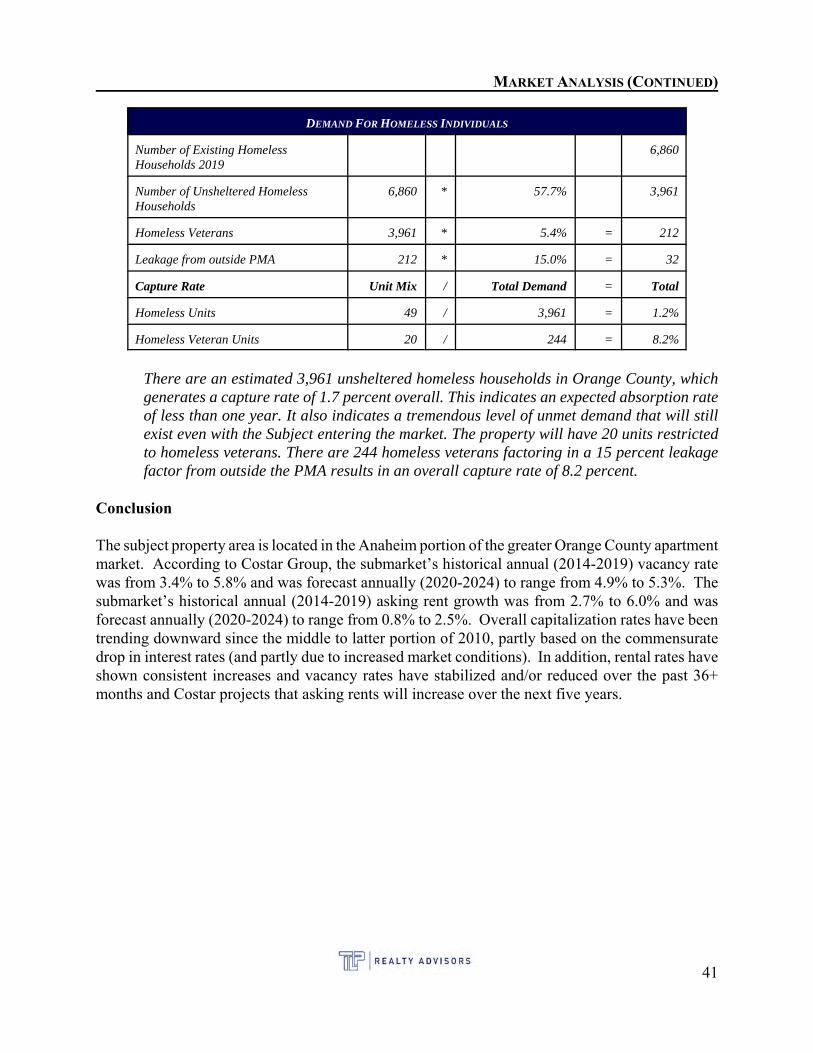
MARKET ANALYSIS (CONTINUED)
DEMAND FOR HOMELESS INDIVIDUALS
Number of Existing HomelessHouseholds 2019
6,860
Number of Unsheltered HomelessHouseholds
6,860 * 57.7% 3,961
Homeless Veterans 3,961 * 5.4% = 212
Leakage from outside PMA 212 * 15.0% = 32
Capture Rate Unit Mix / Total Demand = Total
Homeless Units 49 / 3,961 = 1.2%
Homeless Veteran Units 20 / 244 = 8.2%
There are an estimated 3,961 unsheltered homeless households in Orange County, whichgenerates a capture rate of 1.7 percent overall. This indicates an expected absorption rateof less than one year. It also indicates a tremendous level of unmet demand that will stillexist even with the Subject entering the market. The property will have 20 units restrictedto homeless veterans. There are 244 homeless veterans factoring in a 15 percent leakagefactor from outside the PMA results in an overall capture rate of 8.2 percent.
Conclusion
The subject property area is located in the Anaheim portion of the greater Orange County apartmentmarket. According to Costar Group, the submarket’s historical annual (2014-2019) vacancy ratewas from 3.4% to 5.8% and was forecast annually (2020-2024) to range from 4.9% to 5.3%. Thesubmarket’s historical annual (2014-2019) asking rent growth was from 2.7% to 6.0% and wasforecast annually (2020-2024) to range from 0.8% to 2.5%. Overall capitalization rates have beentrending downward since the middle to latter portion of 2010, partly based on the commensuratedrop in interest rates (and partly due to increased market conditions). In addition, rental rates haveshown consistent increases and vacancy rates have stabilized and/or reduced over the past 36+months and Costar projects that asking rents will increase over the next five years.
41
MARKETING TIME
Our research generally indicated that a selling time required for properties in the Los AngelesCounty market can vary substantially. Though deals are known to be completed followingunsolicited offers - requiring no marketing time - other properties may be exposed to the market forlengthy periods before a sale transaction may be completed.
The marketing time for the subject property has been estimated to be within six months to reflectan appropriate period of time required in order to complete negotiations in today's market.
Based on a review of the PwC Real Estate Investor Survey, the marketing time(s) for the PacificRegion apartment market for the last two quarters are indicated as follows:
PwC Real Estate Investor Survey - Pacific Region
3rd Quarter 2019: Marketing Time - 1.00 to 9.00 months with an average of 3.6 months
4th Quarter 2019: Marketing Time - 1.00 to 9.00 months with an average of 3.6 months
As the presented sales ranged in required selling time, we queried local professionals regarding theiropinions. Owners of properties with very lengthy exposure times were reported to find theirmarketing time reduced when the listing price was reduced to that assimilating a market value.
For example, a property could be on the market for two years while listed at $200,000/Unit, but sellwithin a year if reduced to $100,000/Unit. Lengthy marketing periods have become more commonfor land slated for commercial development. However, parcels that are already developed are oftenconsidered more attractive.
The market value estimated in the body of this report is supported by sales of a comparable unitvalue. Salability is improved when pricing is market-derived. Thus, based upon the indications inthe market on a local level, we feel the appropriate marketing time for the subject would be withinsix months.
It is also necessary to estimate the appropriate "exposure time" which is defined as the estimatedlength of time the property interest being appraised would have been offered on the market priorto the hypothetical consummation of a sale at market value on the effective date of the appraisal;a retrospective estimate based upon an analysis of past events assuming a competitive and openmarket.
Based on a review of the above data, the "exposure time" and "marketing time" for the subjectproperty are estimated to be the same.
42
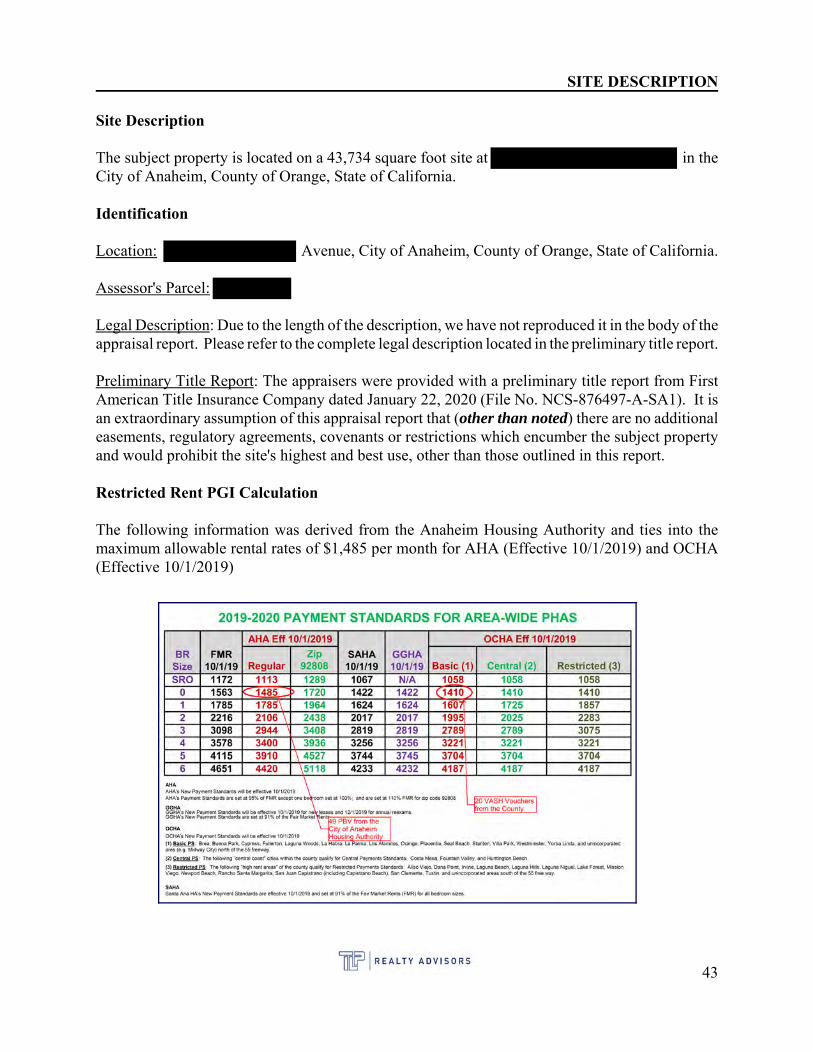
SITE DESCRIPTION
Site Description
The subject property is located on a 43,734 square foot site at in theCity of Anaheim, County of Orange, State of California.
Identification
Location: Avenue, City of Anaheim, County of Orange, State of California.
Assessor's Parcel:
Legal Description: Due to the length of the description, we have not reproduced it in the body of theappraisal report. Please refer to the complete legal description located in the preliminary title report.
Preliminary Title Report: The appraisers were provided with a preliminary title report from FirstAmerican Title Insurance Company dated January 22, 2020 (File No. NCS-876497-A-SA1). It isan extraordinary assumption of this appraisal report that (other than noted) there are no additionaleasements, regulatory agreements, covenants or restrictions which encumber the subject propertyand would prohibit the site's highest and best use, other than those outlined in this report.
Restricted Rent PGI Calculation
The following information was derived from the Anaheim Housing Authority and ties into themaximum allowable rental rates of $1,485 per month for AHA (Effective 10/1/2019) and OCHA(Effective 10/1/2019)
43
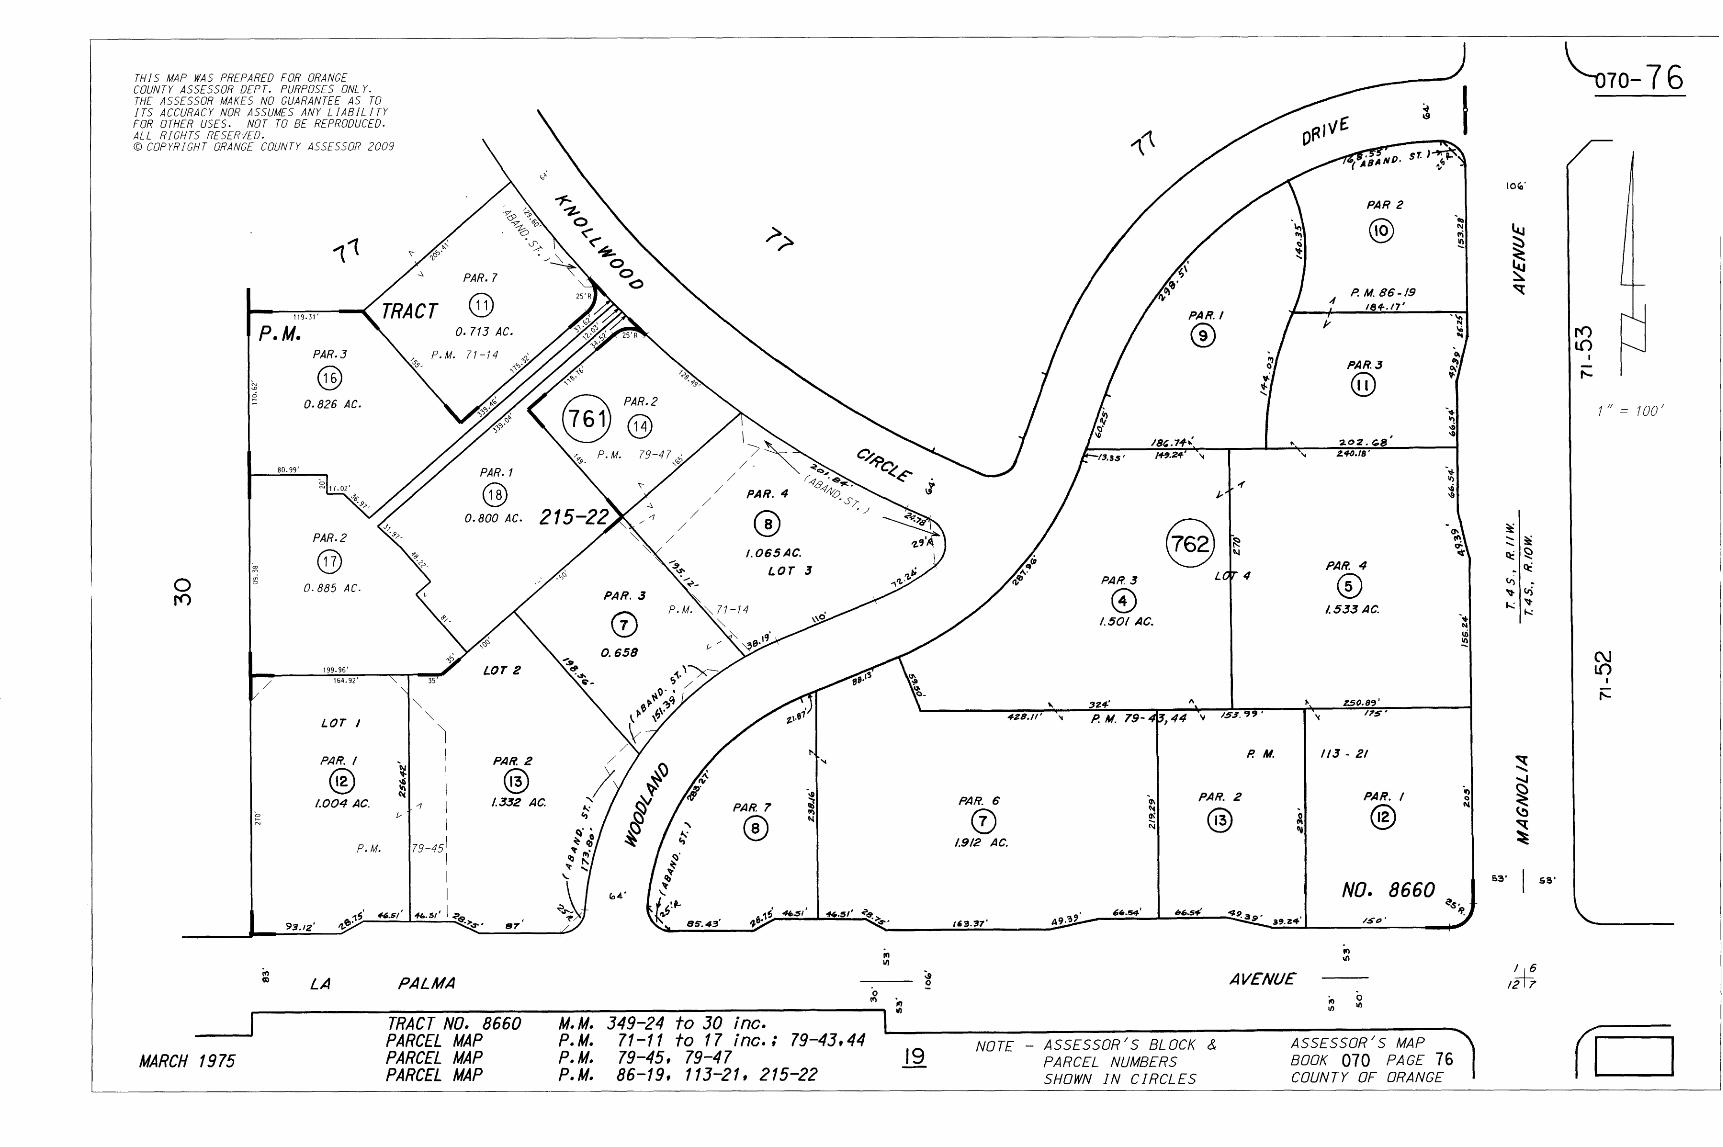
Cory Neathamer
Polygon
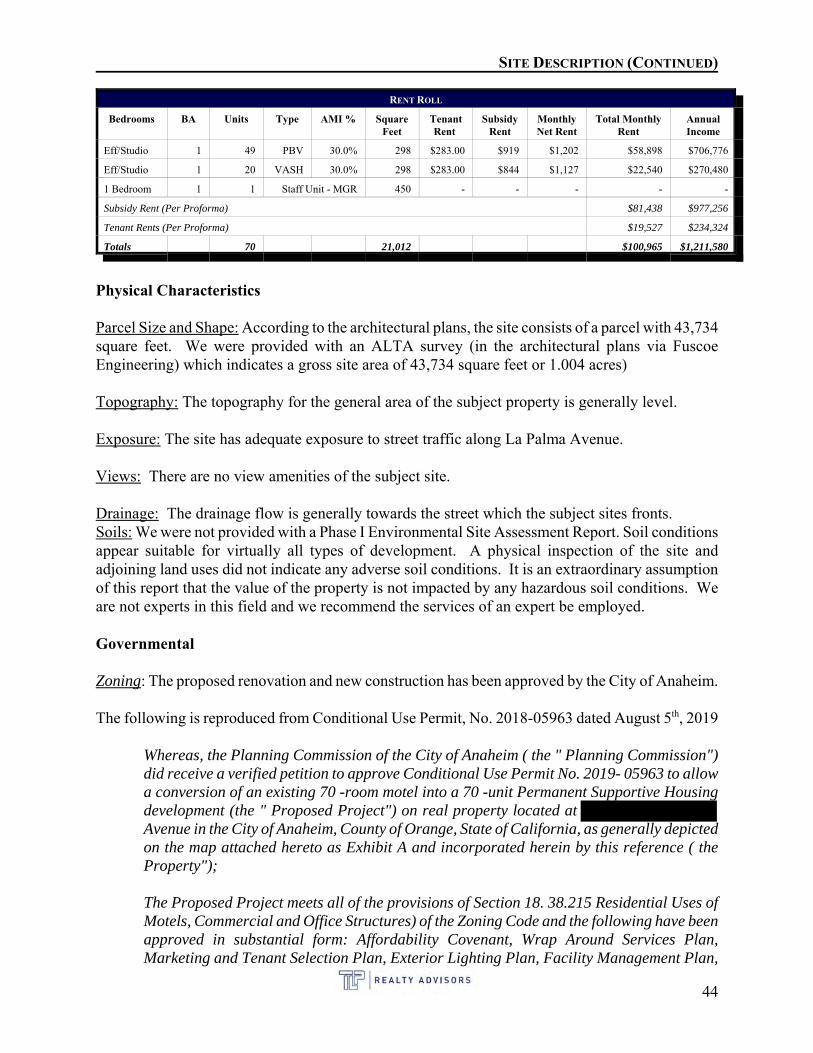
SITE DESCRIPTION (CONTINUED)
RENT ROLL
Bedrooms BA Units Type AMI % SquareFeet
TenantRent
SubsidyRent
MonthlyNet Rent
Total MonthlyRent
AnnualIncome
Eff/Studio 1 49 PBV 30.0% 298 $283.00 $919 $1,202 $58,898 $706,776
Eff/Studio 1 20 VASH 30.0% 298 $283.00 $844 $1,127 $22,540 $270,480
1 Bedroom 1 1 Staff Unit - MGR 450 - - - - -
Subsidy Rent (Per Proforma) $81,438 $977,256
Tenant Rents (Per Proforma) $19,527 $234,324
Totals 70 21,012 $100,965 $1,211,580
Physical Characteristics
Parcel Size and Shape: According to the architectural plans, the site consists of a parcel with 43,734square feet. We were provided with an ALTA survey (in the architectural plans via FuscoeEngineering) which indicates a gross site area of 43,734 square feet or 1.004 acres)
Topography: The topography for the general area of the subject property is generally level.
Exposure: The site has adequate exposure to street traffic along La Palma Avenue.
Views: There are no view amenities of the subject site.
Drainage: The drainage flow is generally towards the street which the subject sites fronts. Soils: We were not provided with a Phase I Environmental Site Assessment Report. Soil conditionsappear suitable for virtually all types of development. A physical inspection of the site andadjoining land uses did not indicate any adverse soil conditions. It is an extraordinary assumptionof this report that the value of the property is not impacted by any hazardous soil conditions. Weare not experts in this field and we recommend the services of an expert be employed.
Governmental
Zoning: The proposed renovation and new construction has been approved by the City of Anaheim.
The following is reproduced from Conditional Use Permit, No. 2018-05963 dated August 5th, 2019
Whereas, the Planning Commission of the City of Anaheim ( the " Planning Commission")did receive a verified petition to approve Conditional Use Permit No. 2019- 05963 to allowa conversion of an existing 70 -room motel into a 70 -unit Permanent Supportive Housingdevelopment (the " Proposed Project") on real property located at Avenue in the City of Anaheim, County of Orange, State of California, as generally depictedon the map attached hereto as Exhibit A and incorporated herein by this reference ( theProperty");
The Proposed Project meets all of the provisions of Section 18. 38.215 Residential Uses ofMotels, Commercial and Office Structures) of the Zoning Code and the following have beenapproved in substantial form: Affordability Covenant, Wrap Around Services Plan,Marketing and Tenant Selection Plan, Exterior Lighting Plan, Facility Management Plan,
44
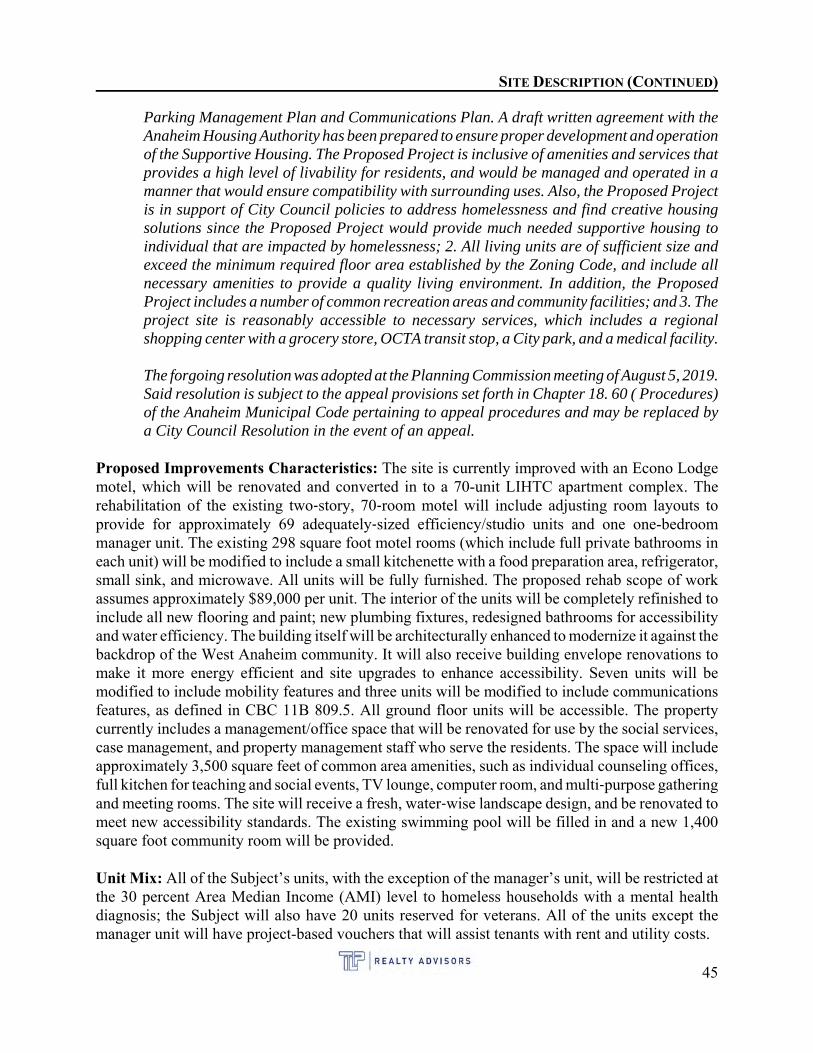
SITE DESCRIPTION (CONTINUED)
Parking Management Plan and Communications Plan. A draft written agreement with theAnaheim Housing Authority has been prepared to ensure proper development and operationof the Supportive Housing. The Proposed Project is inclusive of amenities and services thatprovides a high level of livability for residents, and would be managed and operated in amanner that would ensure compatibility with surrounding uses. Also, the Proposed Projectis in support of City Council policies to address homelessness and find creative housingsolutions since the Proposed Project would provide much needed supportive housing toindividual that are impacted by homelessness; 2. All living units are of sufficient size andexceed the minimum required floor area established by the Zoning Code, and include allnecessary amenities to provide a quality living environment. In addition, the ProposedProject includes a number of common recreation areas and community facilities; and 3. Theproject site is reasonably accessible to necessary services, which includes a regionalshopping center with a grocery store, OCTA transit stop, a City park, and a medical facility.
The forgoing resolution was adopted at the Planning Commission meeting of August 5, 2019.Said resolution is subject to the appeal provisions set forth in Chapter 18. 60 ( Procedures)of the Anaheim Municipal Code pertaining to appeal procedures and may be replaced bya City Council Resolution in the event of an appeal.
Proposed Improvements Characteristics: The site is currently improved with an Econo Lodgemotel, which will be renovated and converted in to a 70-unit LIHTC apartment complex. Therehabilitation of the existing two-story, 70-room motel will include adjusting room layouts toprovide for approximately 69 adequately-sized efficiency/studio units and one one-bedroommanager unit. The existing 298 square foot motel rooms (which include full private bathrooms ineach unit) will be modified to include a small kitchenette with a food preparation area, refrigerator,small sink, and microwave. All units will be fully furnished. The proposed rehab scope of workassumes approximately $89,000 per unit. The interior of the units will be completely refinished toinclude all new flooring and paint; new plumbing fixtures, redesigned bathrooms for accessibilityand water efficiency. The building itself will be architecturally enhanced to modernize it against thebackdrop of the West Anaheim community. It will also receive building envelope renovations tomake it more energy efficient and site upgrades to enhance accessibility. Seven units will bemodified to include mobility features and three units will be modified to include communicationsfeatures, as defined in CBC 11B 809.5. All ground floor units will be accessible. The propertycurrently includes a management/office space that will be renovated for use by the social services,case management, and property management staff who serve the residents. The space will includeapproximately 3,500 square feet of common area amenities, such as individual counseling offices,full kitchen for teaching and social events, TV lounge, computer room, and multi-purpose gatheringand meeting rooms. The site will receive a fresh, water-wise landscape design, and be renovated tomeet new accessibility standards. The existing swimming pool will be filled in and a new 1,400square foot community room will be provided.
Unit Mix: All of the Subject’s units, with the exception of the manager’s unit, will be restricted atthe 30 percent Area Median Income (AMI) level to homeless households with a mental healthdiagnosis; the Subject will also have 20 units reserved for veterans. All of the units except themanager unit will have project-based vouchers that will assist tenants with rent and utility costs.
45
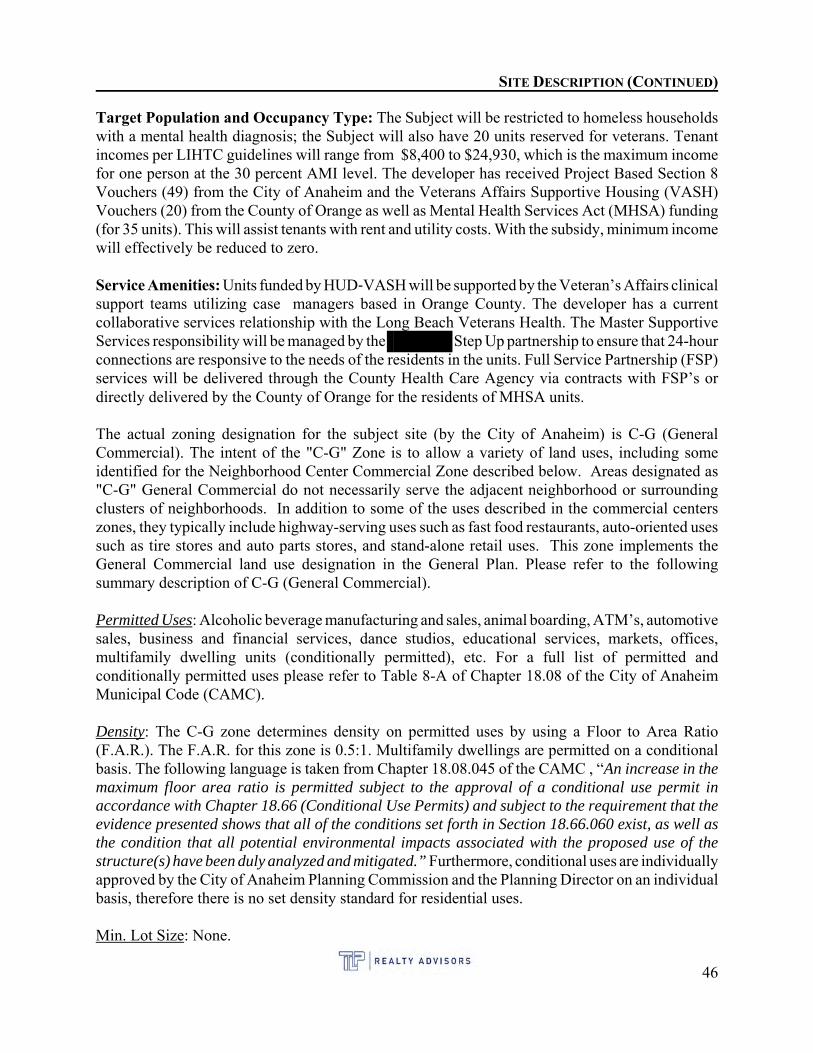
SITE DESCRIPTION (CONTINUED)
Target Population and Occupancy Type: The Subject will be restricted to homeless householdswith a mental health diagnosis; the Subject will also have 20 units reserved for veterans. Tenantincomes per LIHTC guidelines will range from $8,400 to $24,930, which is the maximum incomefor one person at the 30 percent AMI level. The developer has received Project Based Section 8Vouchers (49) from the City of Anaheim and the Veterans Affairs Supportive Housing (VASH)Vouchers (20) from the County of Orange as well as Mental Health Services Act (MHSA) funding(for 35 units). This will assist tenants with rent and utility costs. With the subsidy, minimum incomewill effectively be reduced to zero.
Service Amenities: Units funded by HUD-VASH will be supported by the Veteran’s Affairs clinicalsupport teams utilizing case managers based in Orange County. The developer has a currentcollaborative services relationship with the Long Beach Veterans Health. The Master SupportiveServices responsibility will be managed by the Step Up partnership to ensure that 24-hourconnections are responsive to the needs of the residents in the units. Full Service Partnership (FSP)services will be delivered through the County Health Care Agency via contracts with FSP’s ordirectly delivered by the County of Orange for the residents of MHSA units.
The actual zoning designation for the subject site (by the City of Anaheim) is C-G (GeneralCommercial). The intent of the "C-G" Zone is to allow a variety of land uses, including someidentified for the Neighborhood Center Commercial Zone described below. Areas designated as"C-G" General Commercial do not necessarily serve the adjacent neighborhood or surroundingclusters of neighborhoods. In addition to some of the uses described in the commercial centerszones, they typically include highway-serving uses such as fast food restaurants, auto-oriented usessuch as tire stores and auto parts stores, and stand-alone retail uses. This zone implements theGeneral Commercial land use designation in the General Plan. Please refer to the followingsummary description of C-G (General Commercial).
Permitted Uses: Alcoholic beverage manufacturing and sales, animal boarding, ATM’s, automotivesales, business and financial services, dance studios, educational services, markets, offices,multifamily dwelling units (conditionally permitted), etc. For a full list of permitted andconditionally permitted uses please refer to Table 8-A of Chapter 18.08 of the City of AnaheimMunicipal Code (CAMC).
Density: The C-G zone determines density on permitted uses by using a Floor to Area Ratio(F.A.R.). The F.A.R. for this zone is 0.5:1. Multifamily dwellings are permitted on a conditionalbasis. The following language is taken from Chapter 18.08.045 of the CAMC , “An increase in themaximum floor area ratio is permitted subject to the approval of a conditional use permit inaccordance with Chapter 18.66 (Conditional Use Permits) and subject to the requirement that theevidence presented shows that all of the conditions set forth in Section 18.66.060 exist, as well asthe condition that all potential environmental impacts associated with the proposed use of thestructure(s) have been duly analyzed and mitigated.” Furthermore, conditional uses are individuallyapproved by the City of Anaheim Planning Commission and the Planning Director on an individualbasis, therefore there is no set density standard for residential uses.
Min. Lot Size: None.
46
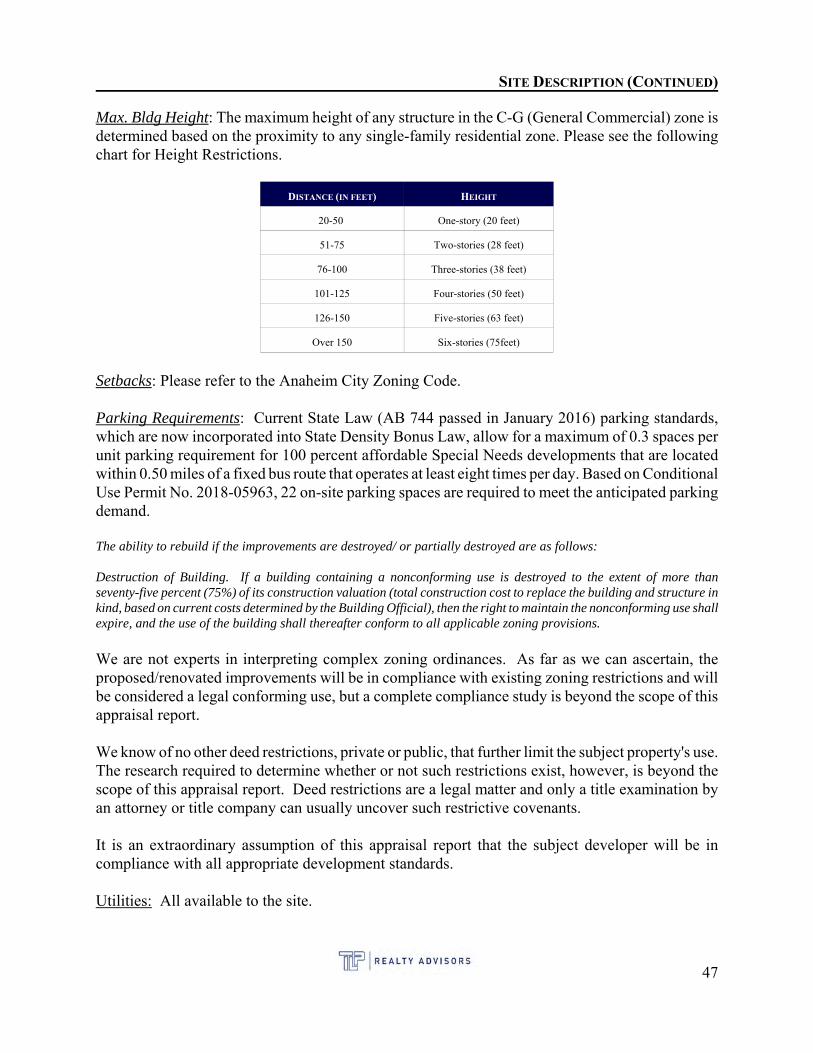
SITE DESCRIPTION (CONTINUED)
Max. Bldg Height: The maximum height of any structure in the C-G (General Commercial) zone isdetermined based on the proximity to any single-family residential zone. Please see the followingchart for Height Restrictions.
DISTANCE (IN FEET) HEIGHT
20-50 One-story (20 feet)
51-75 Two-stories (28 feet)
76-100 Three-stories (38 feet)
101-125 Four-stories (50 feet)
126-150 Five-stories (63 feet)
Over 150 Six-stories (75feet)
Setbacks: Please refer to the Anaheim City Zoning Code.
Parking Requirements: Current State Law (AB 744 passed in January 2016) parking standards,which are now incorporated into State Density Bonus Law, allow for a maximum of 0.3 spaces perunit parking requirement for 100 percent affordable Special Needs developments that are locatedwithin 0.50 miles of a fixed bus route that operates at least eight times per day. Based on ConditionalUse Permit No. 2018-05963, 22 on-site parking spaces are required to meet the anticipated parkingdemand.
The ability to rebuild if the improvements are destroyed/ or partially destroyed are as follows:
Destruction of Building. If a building containing a nonconforming use is destroyed to the extent of more thanseventy-five percent (75%) of its construction valuation (total construction cost to replace the building and structure inkind, based on current costs determined by the Building Official), then the right to maintain the nonconforming use shallexpire, and the use of the building shall thereafter conform to all applicable zoning provisions.
We are not experts in interpreting complex zoning ordinances. As far as we can ascertain, theproposed/renovated improvements will be in compliance with existing zoning restrictions and willbe considered a legal conforming use, but a complete compliance study is beyond the scope of thisappraisal report.
We know of no other deed restrictions, private or public, that further limit the subject property's use. The research required to determine whether or not such restrictions exist, however, is beyond thescope of this appraisal report. Deed restrictions are a legal matter and only a title examination byan attorney or title company can usually uncover such restrictive covenants.
It is an extraordinary assumption of this appraisal report that the subject developer will be incompliance with all appropriate development standards.
Utilities: All available to the site.
47
SITE DESCRIPTION (CONTINUED)
Access and Streets
Freeway(s): The subject property is located roughly 2,700 feet southwest of the Golden StateFreeway and roughly 3,000 feet south of State Highway 91. Overall, freeway access is good.
La Palma Avenue: The subject site has good exposure to street traffic along La Palma Avenue. Thisis a primary residential and commercial oriented street which traverses east and west on the subject’ssouth property line. Parking is available on either side of the street as posted.
Condition Survey
Plottage: None.
Encroachments: There are no apparent encroachments onto the subject site; however, no site surveywas conducted, so no guarantee is given or implied.
Excess Land: None.
Conformity: The subject site does conform with its surroundings.
Functional Utility: The subject site is considered to be functionally adequate.
Nuisance or Hazardous Areas
Flood Zone: Based on information from FEMA, the subject property is located Flood Zone X withinMap Number 06059C10126J with an effective date of December 3, 2009. Flood Zone X is an areathat is determined to be outside the 100- and 500-year flood plains. Flood insurance is available inparticipating communities but is not required by Federal regulations. For reference the definitionof the X zone is as follows:
“Zones B, C and X: These areas have been identified in the community flood insurance study(“FIS”) as an area of moderate or minimal hazard from the principal source of flood in the area. However, buildings in these zones could be flooded by severe, concentrated rainfall coupled withinadequate local drainage systems. Local storm water drainage systems are not nominal consideredin the community’s FIS. The failure of a local drainage system creates area of high flood risk withinthese rate zones. Flood insurance is available in participating communities but is not required byregulation in these zones. (Zone X is used on new and revised maps in place of Zones B and C).”
Alquist-Priolo Study Zone: According to the information provided to the appraiser by the City ofAnaheim, the site is not currently noted as being within an Alquist-Priolo Special Studies Zone andthe site is not shown on an Alquist-Priolo Earthquake Fault Zone Map. According to the StateDivision of Mines & Geology. These maps may not show all faults that have the potential forsurface fault or rupture, either within the special studies zones or outside their boundaries. Noopinion or warranty, expressed or implied, is made herein as to the potential or possibility ofearthquake occurrence or to the existence or nonexistence of any known, unknown, or uncertain
48
SITE DESCRIPTION (CONTINUED)
fault traces or fault zones. It is not uncommon for areas throughout California to be located withinthese zones as evidenced by the January 17, 1994 earthquake.
E.Q. Liquefaction Hazard Area: Based on information from the City of Anaheim Building andSafety Department, the property is identified as being located within a State-defined Seismic HazardZone designated as a Liquefaction Area. Based on information from Flood Data Services (viaAppendix A - Seismic Hazards Mapping Act - Chapter 7.8) 2697.(a) “Cities and counties shallrequire, prior to the approval of a project located in a seismic hazard zone, a geotechnical reportdefining and delineating any seismic hazard. If the city or county finds that no undue hazard of thiskind exists, based on information resulting from studies conducted on sites in the immediate vicinityof the project and of similar soil composition to the project site, the geotechnical report may bewaived. After a report has been approved or a waiver granted, subsequent geotechnical reports shallnot be required, provided that new geologic datum, or data, warranting further investigation is notrecorded. Each city and county shall submit one copy of each approved geotechnical report,including the mitigation measures, if any, that are to be taken, to the State Geologist within 30 daysof its approval of the report.”
It should be noted that the subject property is located adjacent north of an electric substation (seephotographs). This does not pose an issue related to the value, however, we felt it was worthy tonote.
THE READER IS ADVISED THAT THE APPRAISER IS NEITHER QUALIFIED NOR TRAINED TOMAKE GEOLOGIC DETERMINATIONS. NO WARRANTY IS EXPRESSED OR IMPLIED AS TOWHETHER THE SUBJECT PROPERTY IS OR IS NOT LOCATED IN A SPECIAL SEISMIC ZONE. THE CLIENT IS ADVISED TO CONSULT A QUALIFIED PROFESSIONAL IN THIS REGARD. THEAPPRAISER HAS APPRAISED THE SUBJECT SITE ASSUMING IT IS FREE OF ANY GEOLOGICHAZARDS.
Conclusions
The subject site is well located and has access and dimensions required to meet the demands withinthe market. The physical and functional characteristics of the subject site do conform with thesurrounding areas and do meet the desires and standards of typical purchasers in the market.
49
IMPROVEMENT DESCRIPTION
Proposed Improvement Summary
The proposed is theadaptive re-use of an existing Econo Lodge Motel (constructed in 1977 with an addition in 1985)into 69 efficiency (plus one Manager’s unit) permanent supportive housing units targeting veterans(20 units - Project Based HAP for a 15 year term), individuals who are at-risk of homelessness,homeless, and chronically homeless with a mental health diagnosis. The rehabilitation of the existingtwo-story, 70-room motel will include adjusting room layouts to provide for approximately 69adequately sized efficiency/studio units for individuals earning no more than 30% of the AreaMedian Income (AMI) in Orange County. Residents will pay no more than 30% of their income(which in many cases, given the target population, is a General Relief or Social Security benefitwhich is $910 per month).
The existing 298 square foot motel rooms (which include full private bathrooms in each unit) willbe modified to include a small kitchenette with a food preparation area, refrigerator, small sink, two-burner stove, and microwave. The interior of the units will be completely refinished to include allnew flooring and paint; new plumbing fixtures, redesigned bathrooms for accessibility and waterefficiency. All units will be fully furnished. Ten percent (10%) of the units (7) will be modified toinclude mobility features, as defined in CBC 11B 809.2 through 11B 809.4, and four percent (4%)of the units (3) will be modified to include communications features, as defined in CBC 11B 809.5.All ground floor units will be accessible.
The property currently includes a management/office space that will be renovated for use by thesocial services, case management, and property management staff to provide supportive services forthe residents. is working closely with the City of Anaheim Community and EconomicDevelopment on the required Supportive Services Plan to ensure that residents will have adequatesupportive services. The space will include approximately 1,819 square feet of common areaamenities, such as individual counseling offices, TV lounge, computer room, and multi-purposegathering and meeting rooms. The existing pool will be filled in and a new 1,400 square footrecreation/community room will be added at the center of the property and will include a full kitchenand gathering spaces. Outdoor recreation/leisure spaces totaling 11,008 square feet will includeseating areas with BBQs, tables and benches and a community garden. The site will receive a fresh,water-wise landscape design.
Basic Structure
Proposed Use: 70-unit income restricted apartment project (all units will be restricted to 30% AMIplus one - manager’s unit).
Year Built: Proposed.
Construction Type: Class “D” construction type.
50
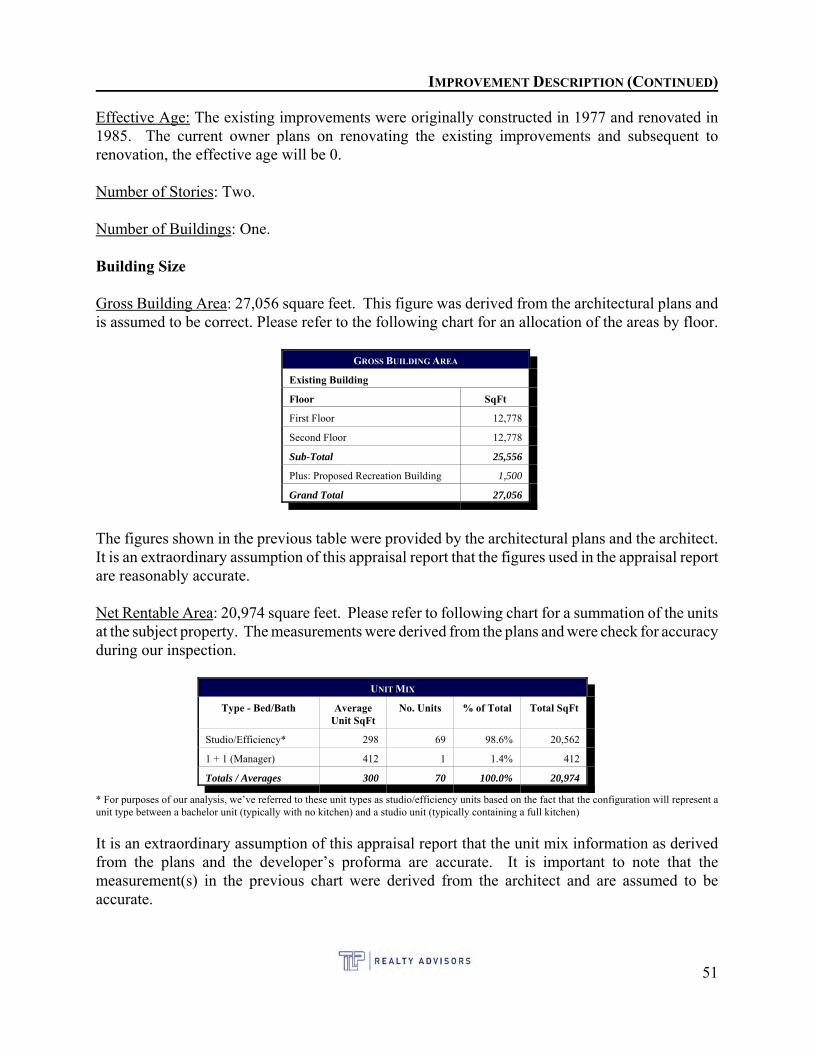
IMPROVEMENT DESCRIPTION (CONTINUED)
Effective Age: The existing improvements were originally constructed in 1977 and renovated in1985. The current owner plans on renovating the existing improvements and subsequent torenovation, the effective age will be 0.
Number of Stories: Two.
Number of Buildings: One.
Building Size
Gross Building Area: 27,056 square feet. This figure was derived from the architectural plans andis assumed to be correct. Please refer to the following chart for an allocation of the areas by floor.
GROSS BUILDING AREA
Existing Building
Floor SqFt
First Floor 12,778
Second Floor 12,778
Sub-Total 25,556
Plus: Proposed Recreation Building 1,500
Grand Total 27,056
The figures shown in the previous table were provided by the architectural plans and the architect. It is an extraordinary assumption of this appraisal report that the figures used in the appraisal reportare reasonably accurate.
Net Rentable Area: 20,974 square feet. Please refer to following chart for a summation of the unitsat the subject property. The measurements were derived from the plans and were check for accuracyduring our inspection.
UNIT MIX
Type - Bed/Bath AverageUnit SqFt
No. Units % of Total Total SqFt
Studio/Efficiency* 298 69 98.6% 20,562
1 + 1 (Manager) 412 1 1.4% 412
Totals / Averages 300 70 100.0% 20,974
* For purposes of our analysis, we’ve referred to these unit types as studio/efficiency units based on the fact that the configuration will represent aunit type between a bachelor unit (typically with no kitchen) and a studio unit (typically containing a full kitchen)
It is an extraordinary assumption of this appraisal report that the unit mix information as derivedfrom the plans and the developer’s proforma are accurate. It is important to note that themeasurement(s) in the previous chart were derived from the architect and are assumed to beaccurate.
51
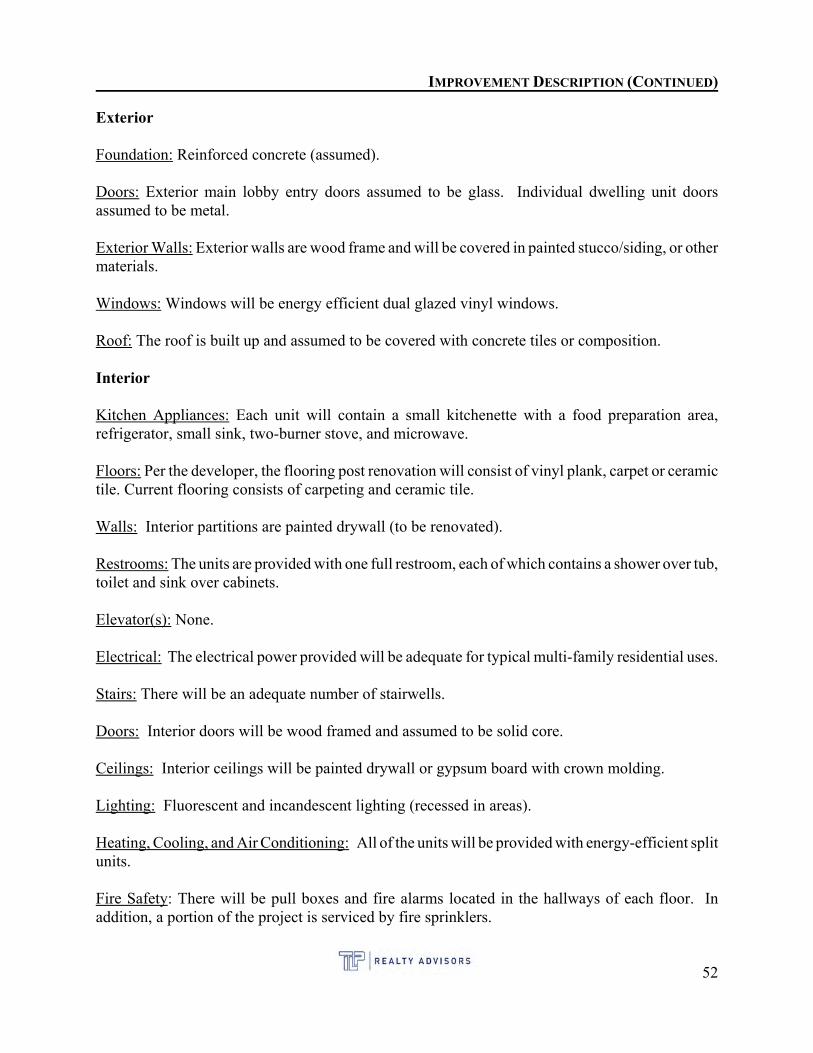
IMPROVEMENT DESCRIPTION (CONTINUED)
Exterior
Foundation: Reinforced concrete (assumed).
Doors: Exterior main lobby entry doors assumed to be glass. Individual dwelling unit doorsassumed to be metal.
Exterior Walls: Exterior walls are wood frame and will be covered in painted stucco/siding, or othermaterials.
Windows: Windows will be energy efficient dual glazed vinyl windows.
Roof: The roof is built up and assumed to be covered with concrete tiles or composition.
Interior
Kitchen Appliances: Each unit will contain a small kitchenette with a food preparation area,refrigerator, small sink, two-burner stove, and microwave.
Floors: Per the developer, the flooring post renovation will consist of vinyl plank, carpet or ceramictile. Current flooring consists of carpeting and ceramic tile.
Walls: Interior partitions are painted drywall (to be renovated).
Restrooms: The units are provided with one full restroom, each of which contains a shower over tub,toilet and sink over cabinets.
Elevator(s): None.
Electrical: The electrical power provided will be adequate for typical multi-family residential uses.
Stairs: There will be an adequate number of stairwells.
Doors: Interior doors will be wood framed and assumed to be solid core.
Ceilings: Interior ceilings will be painted drywall or gypsum board with crown molding.
Lighting: Fluorescent and incandescent lighting (recessed in areas).
Heating, Cooling, and Air Conditioning: All of the units will be provided with energy-efficient splitunits.
Fire Safety: There will be pull boxes and fire alarms located in the hallways of each floor. Inaddition, a portion of the project is serviced by fire sprinklers.
52
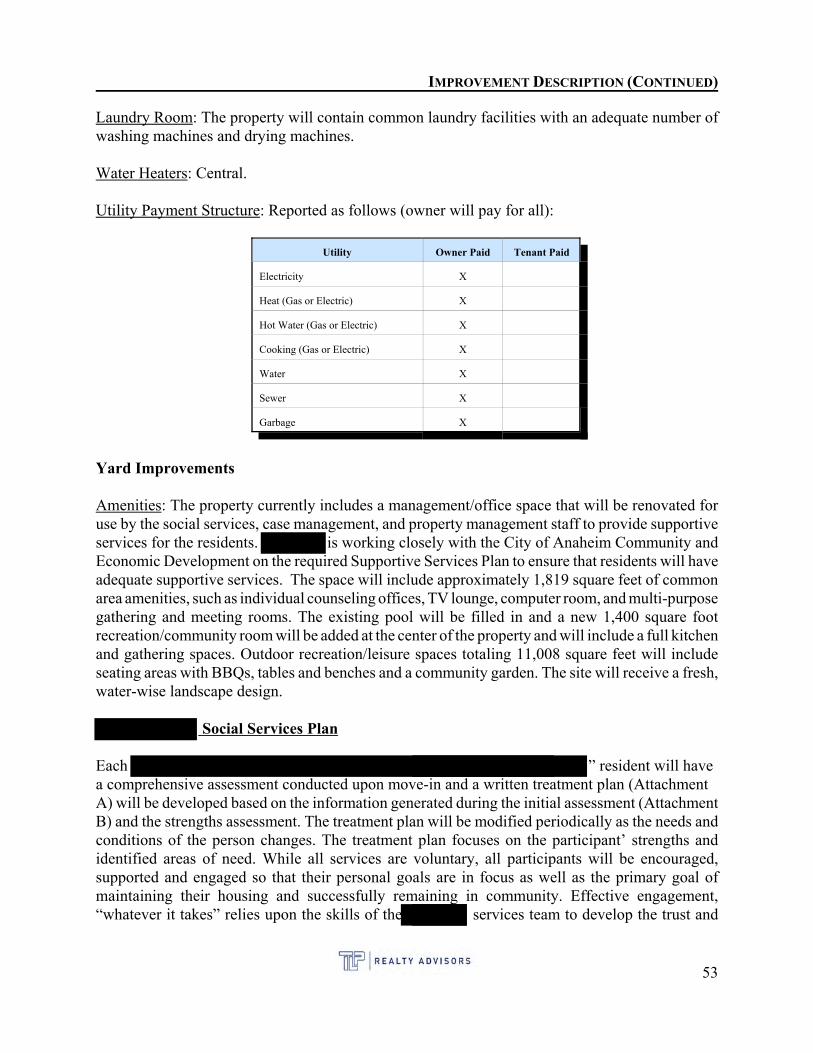
IMPROVEMENT DESCRIPTION (CONTINUED)
Laundry Room: The property will contain common laundry facilities with an adequate number ofwashing machines and drying machines.
Water Heaters: Central.
Utility Payment Structure: Reported as follows (owner will pay for all):
Utility Owner Paid Tenant Paid
Electricity X
Heat (Gas or Electric) X
Hot Water (Gas or Electric) X
Cooking (Gas or Electric) X
Water X
Sewer X
Garbage X
Yard Improvements
Amenities: The property currently includes a management/office space that will be renovated foruse by the social services, case management, and property management staff to provide supportiveservices for the residents. is working closely with the City of Anaheim Community andEconomic Development on the required Supportive Services Plan to ensure that residents will haveadequate supportive services. The space will include approximately 1,819 square feet of commonarea amenities, such as individual counseling offices, TV lounge, computer room, and multi-purposegathering and meeting rooms. The existing pool will be filled in and a new 1,400 square footrecreation/community room will be added at the center of the property and will include a full kitchenand gathering spaces. Outdoor recreation/leisure spaces totaling 11,008 square feet will includeseating areas with BBQs, tables and benches and a community garden. The site will receive a fresh,water-wise landscape design.
Social Services Plan
Each ” resident will havea comprehensive assessment conducted upon move-in and a written treatment plan (AttachmentA) will be developed based on the information generated during the initial assessment (AttachmentB) and the strengths assessment. The treatment plan will be modified periodically as the needs andconditions of the person changes. The treatment plan focuses on the participant’ strengths andidentified areas of need. While all services are voluntary, all participants will be encouraged,supported and engaged so that their personal goals are in focus as well as the primary goal ofmaintaining their housing and successfully remaining in community. Effective engagement,“whatever it takes” relies upon the skills of the services team to develop the trust and
53
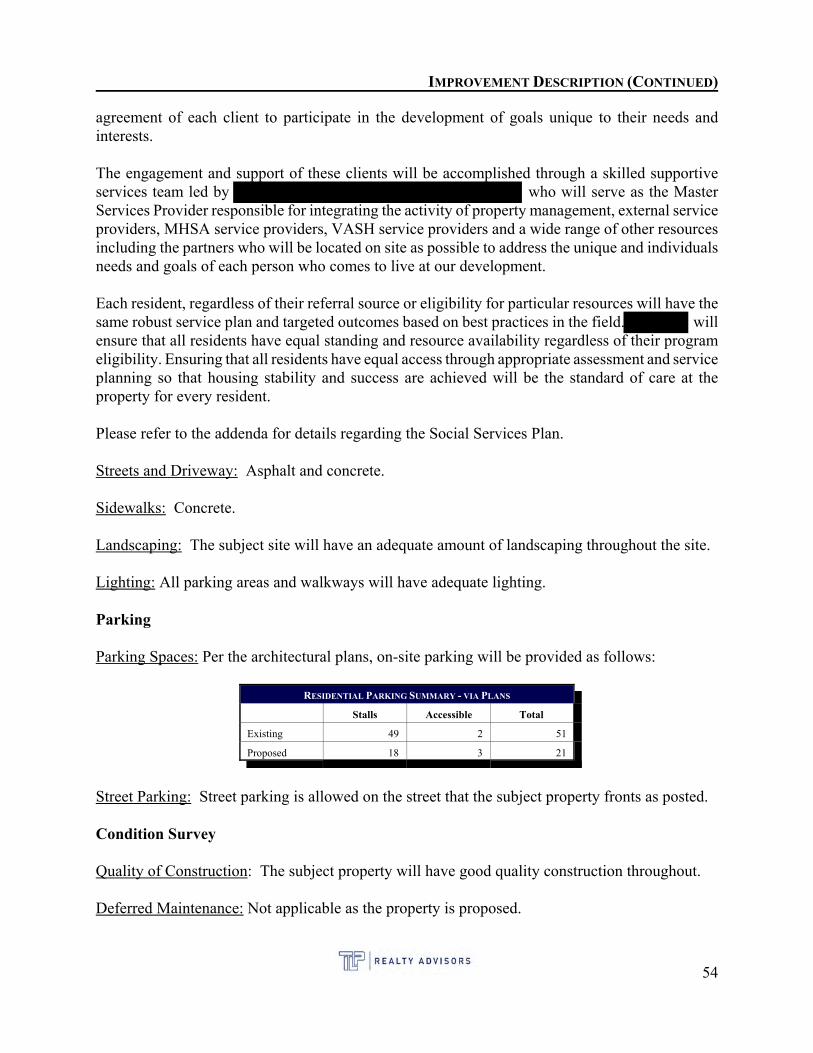
IMPROVEMENT DESCRIPTION (CONTINUED)
agreement of each client to participate in the development of goals unique to their needs andinterests.
The engagement and support of these clients will be accomplished through a skilled supportiveservices team led by who will serve as the MasterServices Provider responsible for integrating the activity of property management, external serviceproviders, MHSA service providers, VASH service providers and a wide range of other resourcesincluding the partners who will be located on site as possible to address the unique and individualsneeds and goals of each person who comes to live at our development.
Each resident, regardless of their referral source or eligibility for particular resources will have thesame robust service plan and targeted outcomes based on best practices in the field. willensure that all residents have equal standing and resource availability regardless of their programeligibility. Ensuring that all residents have equal access through appropriate assessment and serviceplanning so that housing stability and success are achieved will be the standard of care at theproperty for every resident.
Please refer to the addenda for details regarding the Social Services Plan.
Streets and Driveway: Asphalt and concrete.
Sidewalks: Concrete.
Landscaping: The subject site will have an adequate amount of landscaping throughout the site.
Lighting: All parking areas and walkways will have adequate lighting.
Parking
Parking Spaces: Per the architectural plans, on-site parking will be provided as follows:
RESIDENTIAL PARKING SUMMARY - VIA PLANS
Stalls Accessible Total
Existing 49 2 51
Proposed 18 3 21
Street Parking: Street parking is allowed on the street that the subject property fronts as posted.
Condition Survey
Quality of Construction: The subject property will have good quality construction throughout.
Deferred Maintenance: Not applicable as the property is proposed.
54
IMPROVEMENT DESCRIPTION (CONTINUED)
Analysis of Energy Efficiency: Due to the mild climate of the area, special heating and coolinginstallations are not necessary. Water usage within the subject property will be average.
Functional Analysis: The subject property will be functionally useful, but will also suffer fromtypical physical deterioration.
External Influences: The subject improvements do conform to its surroundings, and there are nonegative external influences in proximity.
American Disabilities Act of 1990 (ADA): The Americans With Disabilities Act (ADA) becameeffective January 26, 1992. We have not made, nor are we qualified by training to make, a specificcompliance survey and analysis of this property to determine whether or not the property asproposed is in conformity with the various detailed requirements of the ADA. It is possible that acompliance survey and a detailed analysis of the requirements of the ADA could reveal that theproperty is not in compliance with one or more of the requirements of the Act. If so, this fact couldhave a negative effect upon the value of the property.
Estimated Economic Life: When referencing Section 96, Page 4 of the Marshall Valuation’s costmanual, the subject property will have a total economic life of 50 years subsequent to completionof construction/renovation.
Conclusion: In general, upon completion of construction/renovation the subject property will be ingood condition. In terms of its design and construction, the subject property will meet the demandsof the market. The subject property, as improved, can suitably compete within the marketplace. Noadverse conditions were noted other than those previously stated.
55
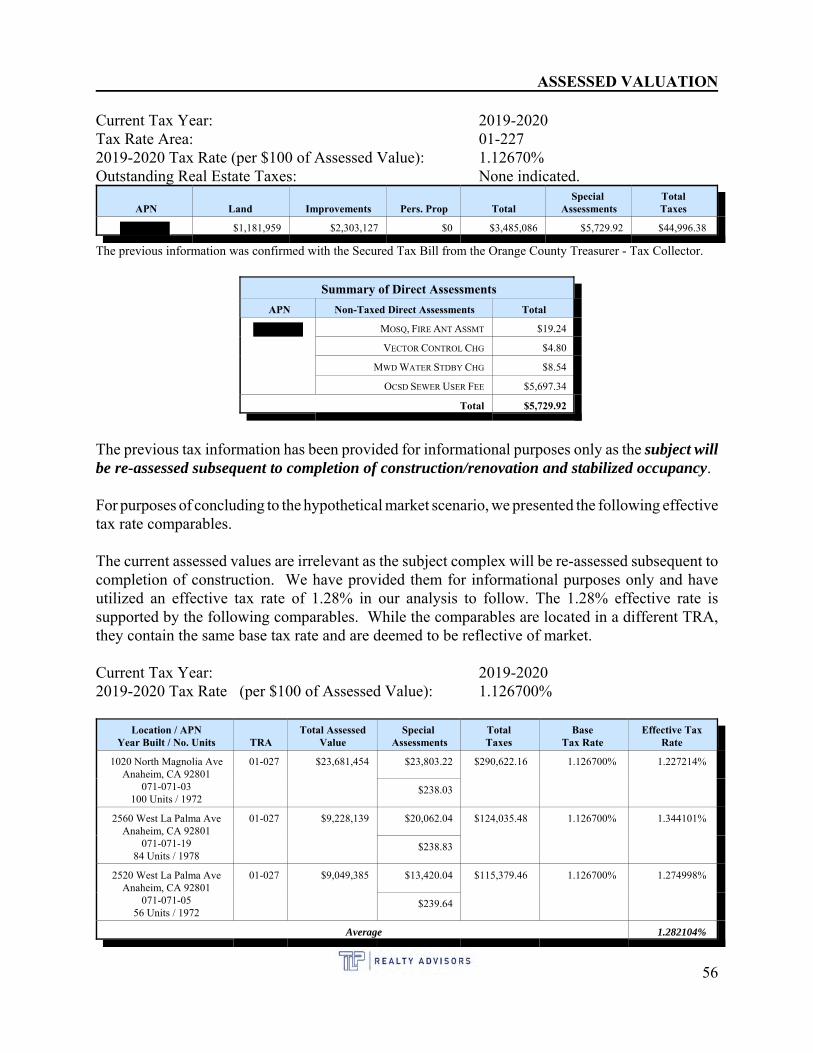
ASSESSED VALUATION
Current Tax Year: 2019-2020Tax Rate Area: 01-2272019-2020 Tax Rate (per $100 of Assessed Value): 1.12670%Outstanding Real Estate Taxes: None indicated.
APN Land Improvements Pers. Prop TotalSpecial
AssessmentsTotalTaxes
$1,181,959 $2,303,127 $0 $3,485,086 $5,729.92 $44,996.38
The previous information was confirmed with the Secured Tax Bill from the Orange County Treasurer - Tax Collector.
Summary of Direct Assessments
APN Non-Taxed Direct Assessments Total
MOSQ, FIRE ANT ASSMT $19.24
VECTOR CONTROL CHG $4.80
MWD WATER STDBY CHG $8.54
OCSD SEWER USER FEE $5,697.34
Total $5,729.92
The previous tax information has been provided for informational purposes only as the subject willbe re-assessed subsequent to completion of construction/renovation and stabilized occupancy.
For purposes of concluding to the hypothetical market scenario, we presented the following effectivetax rate comparables.
The current assessed values are irrelevant as the subject complex will be re-assessed subsequent tocompletion of construction. We have provided them for informational purposes only and haveutilized an effective tax rate of 1.28% in our analysis to follow. The 1.28% effective rate issupported by the following comparables. While the comparables are located in a different TRA,they contain the same base tax rate and are deemed to be reflective of market.
Current Tax Year: 2019-20202019-2020 Tax Rate (per $100 of Assessed Value): 1.126700%
Location / APNYear Built / No. Units TRA
Total AssessedValue
Special Assessments
TotalTaxes
BaseTax Rate
Effective TaxRate
1020 North Magnolia AveAnaheim, CA 92801
071-071-03100 Units / 1972
01-027 $23,681,454 $23,803.22 $290,622.16 1.126700% 1.227214%
$238.03
2560 West La Palma AveAnaheim, CA 92801
071-071-1984 Units / 1978
01-027 $9,228,139 $20,062.04 $124,035.48 1.126700% 1.344101%
$238.83
2520 West La Palma AveAnaheim, CA 92801
071-071-0556 Units / 1972
01-027 $9,049,385 $13,420.04 $115,379.46 1.126700% 1.274998%
$239.64
Average 1.282104%
56
ASSESSED VALUATION (CONTINUED)
For our analysis of the hypothetical market value scenario(s), we utilized the base tax rate of1.1267% which accounts for general real estate taxes, and estimated direct assessments at $10,672. The direct assessments were derived from the proforma and are slightly lower on a per unit basis(comps range from $238 to $239 per unit), however, our figure reflects the subject’s unit types,which according to the Assessor, are likely to be lower on a per unit value as compared to a projectwith one, two or three bedroom units.
In June, 1978, the California voters approved the Proposition 13 Amendment to the California StateConstitution, whereby the maximum annual tax on real property is limited to one percent of marketvalue plus an additional sum to pay for indebtedness on affected property approved by voters priorto the passage of the Proposition. Tax increases under Proposition 13 are limited to two percent peryear. However, since the passage of Proposition 13, developers, cities, counties and other agencieshave created special assessments and community facility districts in order to raise needed funds forvarious types of community infrastructure. These special assessments can only be created for newdevelopment areas and are not subject to the limitations of Proposition 13. Depending on themagnitude of these charges, the special assessments can have a significant impact on value.
Property Tax Calculation:
The California Constitution requires that all property be taxed, unless otherwise exempted under theCalifornia Constitution or United States Constitution. Article XIII-A of the California Constitutionrequires that real property be reappraised only when such property undergoes a change in ownershipor has new construction (per Proposition 13).
The assessment roll, and tax bills, show land values and improvement values. "Improvements"include buildings or anything of a structural nature (such as swimming pools, paving, etc.). Whenyou have an "improvement" value, it doesn't usually mean that you have recently "improved" yourproperty.
New Construction Appraisals
Copies of building permits are sent to the Assessor's Office by the cities and County. New buildings,additions, and other structures require an appraisal. Structural repairs, replacement, or maintenanceare not appraisable in most situations.
The Orange County Tax appraises new construction and add it to the existing improvement assessedvalue. Thereafter, the new assessed value does not change except for the annual two percent trend.The property owner is notified of the new assessment and has the right to appeal the value if he/shedisagrees with it. Based on our discussions with the County of Orange Tax Assessor’s Office,properties are re-assessed by using a cost book (similar to the Marshall Valuation cost analysispresented in the Cost Approach) and that figure is then added to their estimate of land value (internalvaluation). The Assessor’s office indicated that in all likelihood, the assessed value that they willconclude to will be lower than our value indication. This is based on the fact that according to theAssessor’s office, indirect costs and developer’s profit are not considered in the assessment. Thisis supported by the information provided in the Cost Approach section of this appraisal report.
57
HIGHEST AND BEST USE
Introduction
The concept of Highest and Best Use represents the premise upon which a value estimate is basedand is an interpretation of market forces and influences that indicate which use will result in thegreatest economic benefit to the owner.
Highest and Best Use is defined as follows:
The reasonably probable and legal use of vacant land or an improved property, which isphysically possible, appropriately supported, financially feasible, and that results in thehighest value. The Dictionary of Real Estate Appraisal, Sixth edition, Appraisal Institute.
Explanation: This definition applies specifically to the Highest and Best Use of land. It is to berecognized that in cases where a site has existing improvements on it, the Highest and Best Use mayvery well be determined to be different from the existing use. The existing use will continue;however, unless and until land value in its Highest and Best Use exceeds the total value of theproperty in its existing use.
Four considerations are imposed upon a site in the estimation of Highest and Best Use:
1. Possible Use: What uses of the subject site in question are physically possible?2. Legal Use: What uses are permitted by zoning and deed restrictions on the subject site in
question?3. Economic Use: Which possible and permissible uses will produce a net return to the owner
of the subject site? 4. Maximum Profitable Use: Among the feasible uses, which use will produce the highest net
return or the highest present worth?
Both the land as vacant and as improved are studied to determine the highest and best use under eachsituation.
Highest and Best Use - "As Vacant"
Introduction: In analyzing the Highest and Best Use for the subject property, as if vacant, theappraiser estimates the most likely and probable uses of the subject site as though vacant, and thenestimates the most profitable potential use of the subject site.
Physically Possible: Development constraints imposed upon a site include its configuration, size,topography, location and access. The subject property is located in an area where the amenities ofthe area contribute to a demand for real estate. The neighborhood consists of the components thatcontribute to the demand for similar sites.
All necessary utilities are extended -- water, electricity, gas, sewer, and telephone. The utilitycapacity serving the site is assumed to be adequate for most improvements. All street improvementsnecessary for development are in place.
58
HIGHEST AND BEST USE (CONTINUED)
The subject site size of 43,734 square feet is considered within the typical range of other sites in theneighborhood. Topography is generally level and the subject site configuration presents no apparentdevelopment constraints. Based on our discussion of soil conditions and hazardous conditionspresented in the site analysis section of the report there does not appear to be any related factors thatwould impede development of the site.
The physical characteristics of the property allows for adequate flexibility in development. Thereare a variety of possible uses for the sites. Most commercial, residential or industrial developmentis considered to be physically possible. Overall, given the new configuration of the site, multi-family residential uses are considered much more likely than commercial use which would typicallyrequire better accessibility.
Legally Permissible: Allowable uses under the present private and public restrictions are aconsideration in the development of the subject site. While other land uses are permissible for thesubject site, any other residential use would require a new plan approval and it is not known whethera differing development plan would be approved as the City is strongly in favor of the currentproposed development.
Financially Feasible: Given the location of the subject site and given the resulting configuration andsite access the proposed apartment complex development is the most likely use for the site and isthe only use considered for feasibility analysis. No commercial or industrial uses are consideredsince the site would have inadequate access and exposure and would likely face opposition from theCity given the backing of the proposed plan.
The subject will be encumbered by several covenant and regulatory agreements. We requested butwere not provided with any of the draft/final land use covenants, regulatory agreements ordisposition, development agreements. In all cases, our conclusions for the maximum allowablerental rates are based on the developer’s projections (and verified with the government). It is anextraordinary assumption of this appraisal report that the restricted unit mix and maximum allowablerental rates are accurate.
Maximally Productive: There is currently a demand for multi-family residential use in theneighborhood of the subject property. Due to the accessibility offered in this location, and thecharacteristics of the immediate area, a multi-family residential related use would represent the usethat would be the most productive use of the site. It would only be feasible to construct a marketor restricted project with the favorable government incentives which are proposed to be in place.
Conclusion, As Vacant: Based on this discussion, it concluded that the Highest and Best Use of thesubject property as vacant, would be to construct an income restricted apartment complex similarto that which is proposed for the site (i.e., with the proposed governmental incentives).
59
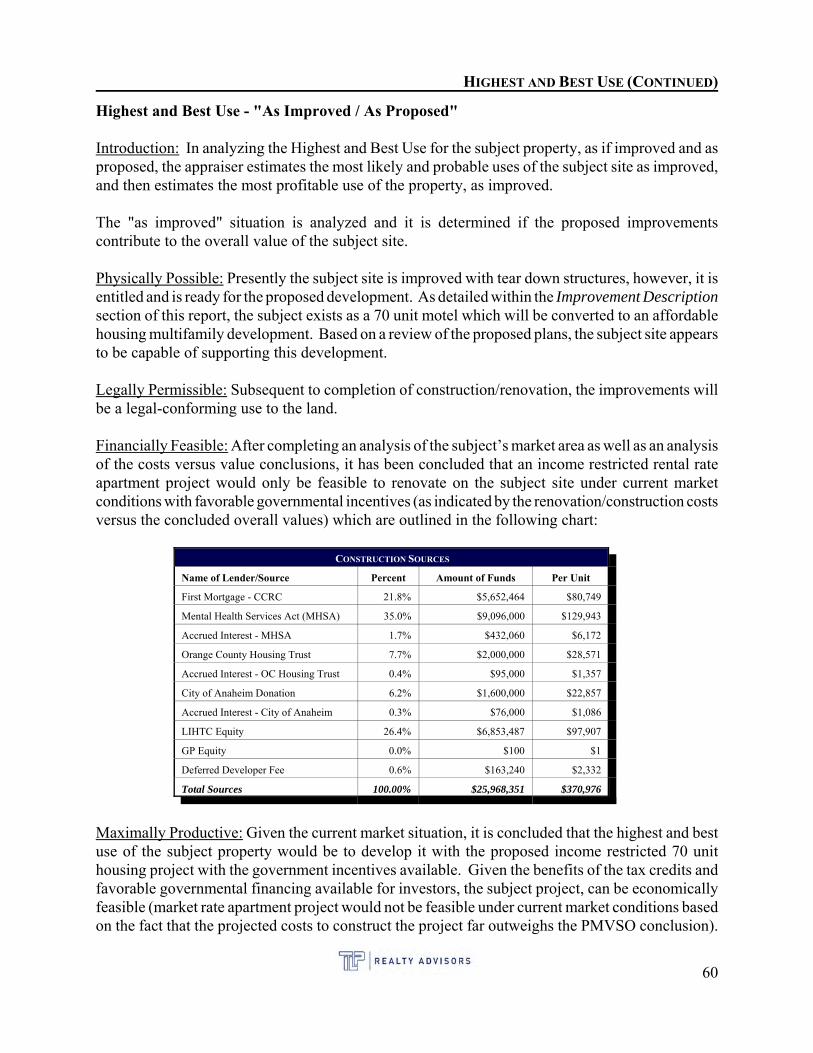
HIGHEST AND BEST USE (CONTINUED)
Highest and Best Use - "As Improved / As Proposed"
Introduction: In analyzing the Highest and Best Use for the subject property, as if improved and asproposed, the appraiser estimates the most likely and probable uses of the subject site as improved,and then estimates the most profitable use of the property, as improved.
The "as improved" situation is analyzed and it is determined if the proposed improvementscontribute to the overall value of the subject site.
Physically Possible: Presently the subject site is improved with tear down structures, however, it isentitled and is ready for the proposed development. As detailed within the Improvement Descriptionsection of this report, the subject exists as a 70 unit motel which will be converted to an affordablehousing multifamily development. Based on a review of the proposed plans, the subject site appearsto be capable of supporting this development.
Legally Permissible: Subsequent to completion of construction/renovation, the improvements willbe a legal-conforming use to the land.
Financially Feasible: After completing an analysis of the subject’s market area as well as an analysisof the costs versus value conclusions, it has been concluded that an income restricted rental rateapartment project would only be feasible to renovate on the subject site under current marketconditions with favorable governmental incentives (as indicated by the renovation/construction costsversus the concluded overall values) which are outlined in the following chart:
CONSTRUCTION SOURCES
Name of Lender/Source Percent Amount of Funds Per Unit
First Mortgage - CCRC 21.8% $5,652,464 $80,749
Mental Health Services Act (MHSA) 35.0% $9,096,000 $129,943
Accrued Interest - MHSA 1.7% $432,060 $6,172
Orange County Housing Trust 7.7% $2,000,000 $28,571
Accrued Interest - OC Housing Trust 0.4% $95,000 $1,357
City of Anaheim Donation 6.2% $1,600,000 $22,857
Accrued Interest - City of Anaheim 0.3% $76,000 $1,086
LIHTC Equity 26.4% $6,853,487 $97,907
GP Equity 0.0% $100 $1
Deferred Developer Fee 0.6% $163,240 $2,332
Total Sources 100.00% $25,968,351 $370,976
Maximally Productive: Given the current market situation, it is concluded that the highest and bestuse of the subject property would be to develop it with the proposed income restricted 70 unithousing project with the government incentives available. Given the benefits of the tax credits andfavorable governmental financing available for investors, the subject project, can be economicallyfeasible (market rate apartment project would not be feasible under current market conditions basedon the fact that the projected costs to construct the project far outweighs the PMVSO conclusion).
60
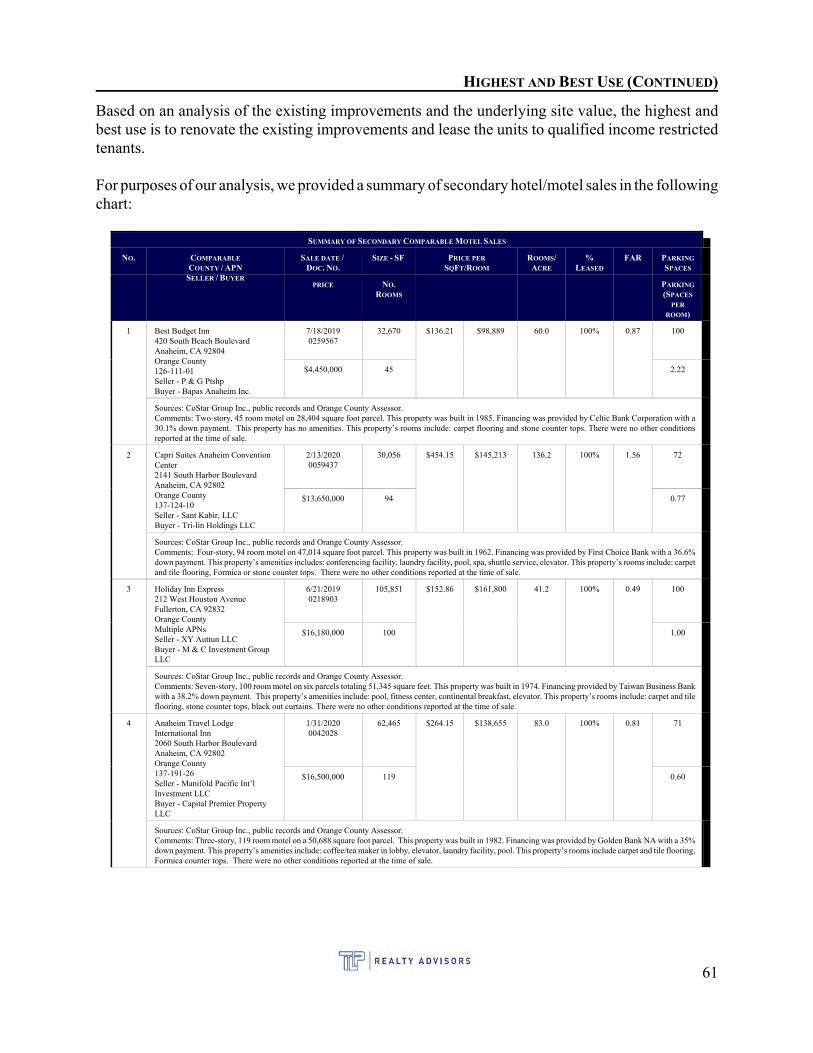
HIGHEST AND BEST USE (CONTINUED)
Based on an analysis of the existing improvements and the underlying site value, the highest andbest use is to renovate the existing improvements and lease the units to qualified income restrictedtenants.
For purposes of our analysis, we provided a summary of secondary hotel/motel sales in the followingchart:
SUMMARY OF SECONDARY COMPARABLE MOTEL SALES
NO. COMPARABLE
COUNTY / APNSELLER / BUYER
SALE DATE / DOC. NO.
SIZE - SF PRICE PER
SQFT/ROOM
ROOMS/ACRE
%LEASED
FAR PARKING
SPACES
PRICE NO.ROOMS
PARKING
(SPACES
PER
ROOM)
1 Best Budget Inn420 South Beach BoulevardAnaheim, CA 92804Orange County126-111-01Seller - P & G PtshpBuyer - Bapas Anaheim Inc.
7/18/20190259567
32,670 $136.21 $98,889 60.0 100% 0.87 100
$4,450,000 45 2.22
Sources: CoStar Group Inc., public records and Orange County Assessor.Comments: Two-story, 45 room motel on 28,404 square foot parcel. This property was built in 1985. Financing was provided by Celtic Bank Corporation with a30.1% down payment. This property has no amenities. This property’s rooms include: carpet flooring and stone counter tops. There were no other conditionsreported at the time of sale.
2 Capri Suites Anaheim ConventionCenter2141 South Harbor BoulevardAnaheim, CA 92802Orange County137-124-10Seller - Sant Kabir, LLCBuyer - Tri-lin Holdings LLC
2/13/20200059437
30,056 $454.15 $145,213 136.2 100% 1.56 72
$13,650,000 94 0.77
Sources: CoStar Group Inc., public records and Orange County Assessor.Comments: Four-story, 94 room motel on 47,014 square foot parcel. This property was built in 1962. Financing was provided by First Choice Bank with a 36.6%down payment. This property’s amenities includes: conferencing facility, laundry facility, pool, spa, shuttle service, elevator. This property’s rooms include: carpetand tile flooring, Formica or stone counter tops. There were no other conditions reported at the time of sale.
3 Holiday Inn Express212 West Houston AvenueFullerton, CA 92832Orange CountyMultiple APNsSeller - XY Auttun LLCBuyer - M & C Investment GroupLLC
6/21/20190218903
105,851 $152.86 $161,800 41.2 100% 0.49 100
$16,180,000 100 1.00
Sources: CoStar Group Inc., public records and Orange County Assessor.Comments: Seven-story, 100 room motel on six parcels totaling 51,345 square feet. This property was built in 1974. Financing provided by Taiwan Business Bankwith a 38.2% down payment. This property’s amenities include: pool, fitness center, continental breakfast, elevator. This property’s rooms include: carpet and tileflooring, stone counter tops, black out curtains. There were no other conditions reported at the time of sale.
4 Anaheim Travel LodgeInternational Inn2060 South Harbor BoulevardAnaheim, CA 92802Orange County137-191-26Seller - Manifold Pacific Int’lInvestment LLCBuyer - Capital Premier PropertyLLC
1/31/20200042028
62,465 $264.15 $138,655 83.0 100% 0.81 71
$16,500,000 119 0.60
Sources: CoStar Group Inc., public records and Orange County Assessor.Comments: Three-story, 119 room motel on a 50,688 square foot parcel. This property was built in 1982. Financing was provided by Golden Bank NA with a 35%down payment. This property’s amenities include: coffee/tea maker in lobby, elevator, laundry facility, pool. This property’s rooms include carpet and tile flooring,Formica counter tops. There were no other conditions reported at the time of sale.
61
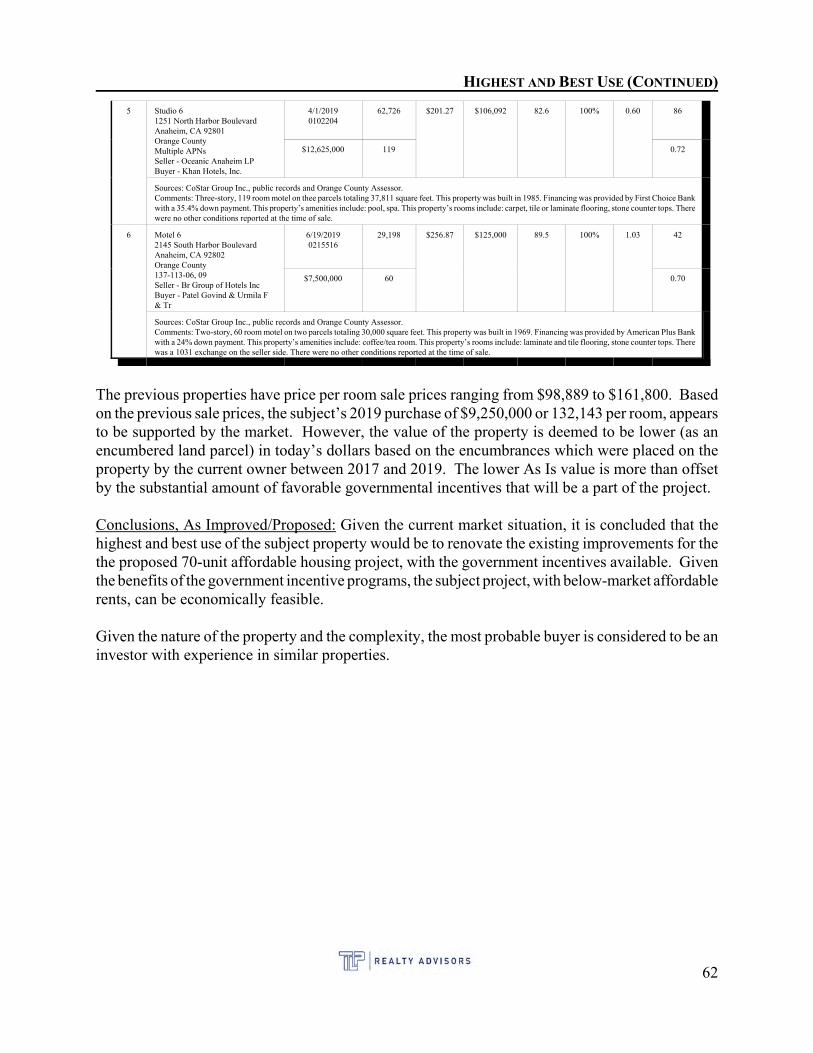
HIGHEST AND BEST USE (CONTINUED)
5 Studio 61251 North Harbor BoulevardAnaheim, CA 92801Orange CountyMultiple APNsSeller - Oceanic Anaheim LPBuyer - Khan Hotels, Inc.
4/1/20190102204
62,726 $201.27 $106,092 82.6 100% 0.60 86
$12,625,000 119 0.72
Sources: CoStar Group Inc., public records and Orange County Assessor.Comments: Three-story, 119 room motel on thee parcels totaling 37,811 square feet. This property was built in 1985. Financing was provided by First Choice Bankwith a 35.4% down payment. This property’s amenities include: pool, spa. This property’s rooms include: carpet, tile or laminate flooring, stone counter tops. Therewere no other conditions reported at the time of sale.
6 Motel 62145 South Harbor BoulevardAnaheim, CA 92802Orange County137-113-06, 09Seller - Br Group of Hotels IncBuyer - Patel Govind & Urmila F& Tr
6/19/20190215516
29,198 $256.87 $125,000 89.5 100% 1.03 42
$7,500,000 60 0.70
Sources: CoStar Group Inc., public records and Orange County Assessor.Comments: Two-story, 60 room motel on two parcels totaling 30,000 square feet. This property was built in 1969. Financing was provided by American Plus Bankwith a 24% down payment. This property’s amenities include: coffee/tea room. This property’s rooms include: laminate and tile flooring, stone counter tops. Therewas a 1031 exchange on the seller side. There were no other conditions reported at the time of sale.
The previous properties have price per room sale prices ranging from $98,889 to $161,800. Basedon the previous sale prices, the subject’s 2019 purchase of $9,250,000 or 132,143 per room, appearsto be supported by the market. However, the value of the property is deemed to be lower (as anencumbered land parcel) in today’s dollars based on the encumbrances which were placed on theproperty by the current owner between 2017 and 2019. The lower As Is value is more than offsetby the substantial amount of favorable governmental incentives that will be a part of the project.
Conclusions, As Improved/Proposed: Given the current market situation, it is concluded that thehighest and best use of the subject property would be to renovate the existing improvements for thethe proposed 70-unit affordable housing project, with the government incentives available. Giventhe benefits of the government incentive programs, the subject project, with below-market affordablerents, can be economically feasible.
Given the nature of the property and the complexity, the most probable buyer is considered to be aninvestor with experience in similar properties.
62

ANALYSIS OF DATA AND CONCLUSIONS
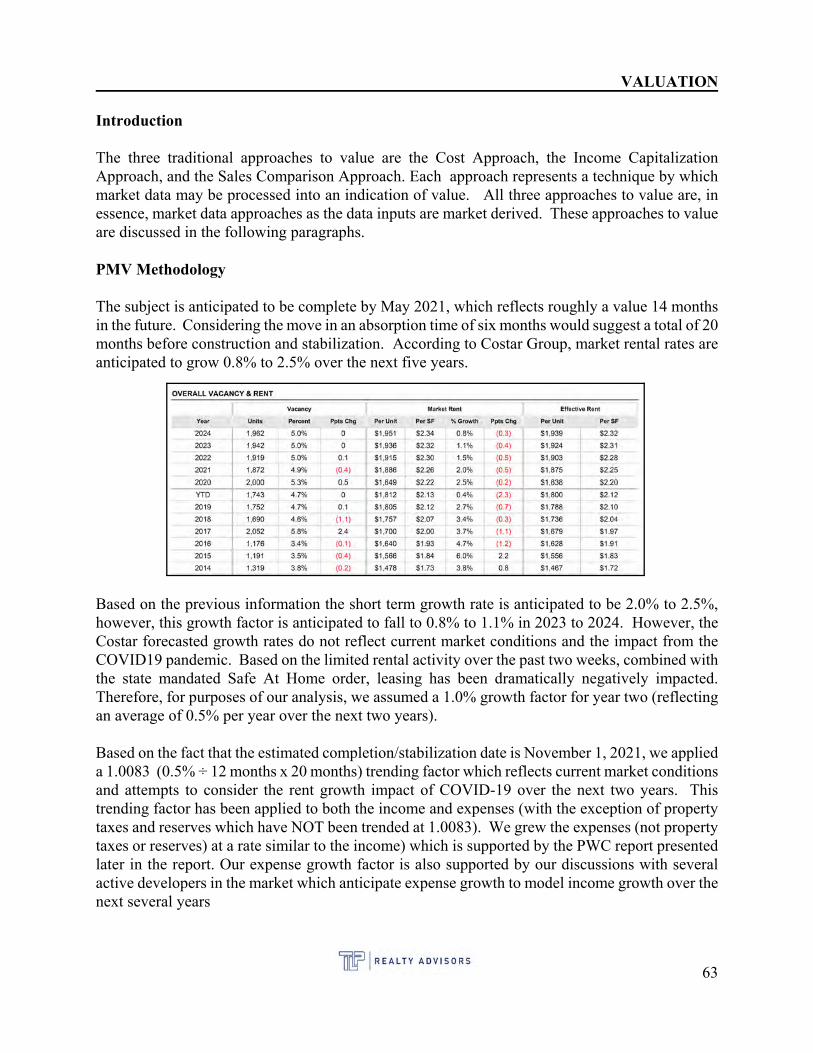
VALUATION
Introduction
The three traditional approaches to value are the Cost Approach, the Income CapitalizationApproach, and the Sales Comparison Approach. Each approach represents a technique by whichmarket data may be processed into an indication of value. All three approaches to value are, inessence, market data approaches as the data inputs are market derived. These approaches to valueare discussed in the following paragraphs.
PMV Methodology
The subject is anticipated to be complete by May 2021, which reflects roughly a value 14 monthsin the future. Considering the move in an absorption time of six months would suggest a total of 20months before construction and stabilization. According to Costar Group, market rental rates areanticipated to grow 0.8% to 2.5% over the next five years.
Based on the previous information the short term growth rate is anticipated to be 2.0% to 2.5%,however, this growth factor is anticipated to fall to 0.8% to 1.1% in 2023 to 2024. However, the Costar forecasted growth rates do not reflect current market conditions and the impact from theCOVID19 pandemic. Based on the limited rental activity over the past two weeks, combined withthe state mandated Safe At Home order, leasing has been dramatically negatively impacted. Therefore, for purposes of our analysis, we assumed a 1.0% growth factor for year two (reflectingan average of 0.5% per year over the next two years).
Based on the fact that the estimated completion/stabilization date is November 1, 2021, we applieda 1.0083 (0.5% ÷ 12 months x 20 months) trending factor which reflects current market conditionsand attempts to consider the rent growth impact of COVID-19 over the next two years. Thistrending factor has been applied to both the income and expenses (with the exception of propertytaxes and reserves which have NOT been trended at 1.0083). We grew the expenses (not propertytaxes or reserves) at a rate similar to the income) which is supported by the PWC report presentedlater in the report. Our expense growth factor is also supported by our discussions with severalactive developers in the market which anticipate expense growth to model income growth over thenext several years
63
VALUATION (CONTINUED)
Cost Approach
This approach in appraisal analysis is based on the proposition that an informed purchaser will payno more than the cost of producing a substitute property with the same utility as the subject property. The Cost Approach is particularly appropriate when the property being appraised includes relativelynew improvements which represent the highest and best use of the land, or when relatively uniqueor specialized improvements are located on the subject site, and when market data of similarproperties cannot be obtained.
Income Capitalization Approach
This technique converts anticipated income to be derived from the ownership of the property intoa value estimate. The Income Approach is widely applied in appraising income-producingproperties. Anticipated future income and/or reversions are discounted to a present value througha capitalization process.
Sales Comparison Approach
The Sales Comparison, or Market Data, Approach is an appraisal procedure in which the marketvalue estimate is predicated upon prices paid in actual market transactions and reflected in currentlistings. This approach involves a process of analyzing sales of similar properties with recent saledates, to derive an indication of the most probable sales price of the property being appraised.
64
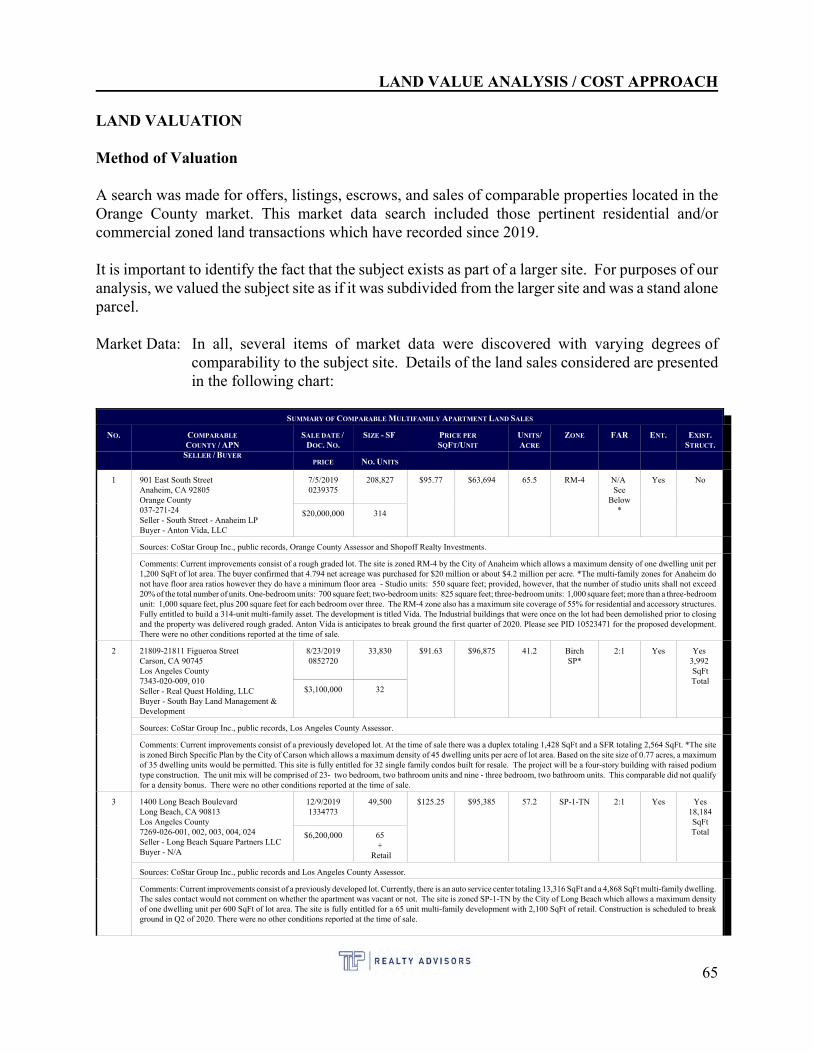
LAND VALUE ANALYSIS / COST APPROACH
LAND VALUATION
Method of Valuation
A search was made for offers, listings, escrows, and sales of comparable properties located in theOrange County market. This market data search included those pertinent residential and/orcommercial zoned land transactions which have recorded since 2019.
It is important to identify the fact that the subject exists as part of a larger site. For purposes of ouranalysis, we valued the subject site as if it was subdivided from the larger site and was a stand aloneparcel.
Market Data: In all, several items of market data were discovered with varying degrees ofcomparability to the subject site. Details of the land sales considered are presentedin the following chart:
SUMMARY OF COMPARABLE MULTIFAMILY APARTMENT LAND SALES
NO. COMPARABLE
COUNTY / APNSELLER / BUYER
SALE DATE / DOC. NO.
SIZE - SF PRICE PER
SQFT/UNIT
UNITS/ACRE
ZONE FAR ENT. EXIST.STRUCT.
PRICE NO. UNITS
1 901 East South StreetAnaheim, CA 92805Orange County037-271-24Seller - South Street - Anaheim LPBuyer - Anton Vida, LLC
7/5/20190239375
208,827 $95.77 $63,694 65.5 RM-4 N/A See
Below*
Yes No
$20,000,000 314
Sources: CoStar Group Inc., public records, Orange County Assessor and Shopoff Realty Investments.
Comments: Current improvements consist of a rough graded lot. The site is zoned RM-4 by the City of Anaheim which allows a maximum density of one dwelling unit per1,200 SqFt of lot area. The buyer confirmed that 4.794 net acreage was purchased for $20 million or about $4.2 million per acre. *The multi-family zones for Anaheim donot have floor area ratios however they do have a minimum floor area - Studio units: 550 square feet; provided, however, that the number of studio units shall not exceed20% of the total number of units. One-bedroom units: 700 square feet; two-bedroom units: 825 square feet; three-bedroom units: 1,000 square feet; more than a three-bedroomunit: 1,000 square feet, plus 200 square feet for each bedroom over three. The RM-4 zone also has a maximum site coverage of 55% for residential and accessory structures.Fully entitled to build a 314-unit multi-family asset. The development is titled Vida. The Industrial buildings that were once on the lot had been demolished prior to closingand the property was delivered rough graded. Anton Vida is anticipates to break ground the first quarter of 2020. Please see PID 10523471 for the proposed development.There were no other conditions reported at the time of sale.
2 21809-21811 Figueroa StreetCarson, CA 90745Los Angeles County7343-020-009, 010Seller - Real Quest Holding, LLCBuyer - South Bay Land Management &Development
8/23/20190852720
33,830 $91.63 $96,875 41.2 BirchSP*
2:1 Yes Yes 3,992 SqFtTotal
$3,100,000 32
Sources: CoStar Group Inc., public records, Los Angeles County Assessor.
Comments: Current improvements consist of a previously developed lot. At the time of sale there was a duplex totaling 1,428 SqFt and a SFR totaling 2,564 SqFt. *The siteis zoned Birch Specific Plan by the City of Carson which allows a maximum density of 45 dwelling units per acre of lot area. Based on the site size of 0.77 acres, a maximumof 35 dwelling units would be permitted. This site is fully entitled for 32 single family condos built for resale. The project will be a four-story building with raised podiumtype construction. The unit mix will be comprised of 23- two bedroom, two bathroom units and nine - three bedroom, two bathroom units. This comparable did not qualifyfor a density bonus. There were no other conditions reported at the time of sale.
3 1400 Long Beach BoulevardLong Beach, CA 90813Los Angeles County7269-026-001, 002, 003, 004, 024Seller - Long Beach Square Partners LLCBuyer - N/A
12/9/20191334773
49,500 $125.25 $95,385 57.2 SP-1-TN 2:1 Yes Yes18,184SqFtTotal$6,200,000 65
+ Retail
Sources: CoStar Group Inc., public records and Los Angeles County Assessor.
Comments: Current improvements consist of a previously developed lot. Currently, there is an auto service center totaling 13,316 SqFt and a 4,868 SqFt multi-family dwelling. The sales contact would not comment on whether the apartment was vacant or not. The site is zoned SP-1-TN by the City of Long Beach which allows a maximum densityof one dwelling unit per 600 SqFt of lot area. The site is fully entitled for a 65 unit multi-family development with 2,100 SqFt of retail. Construction is scheduled to breakground in Q2 of 2020. There were no other conditions reported at the time of sale.
65
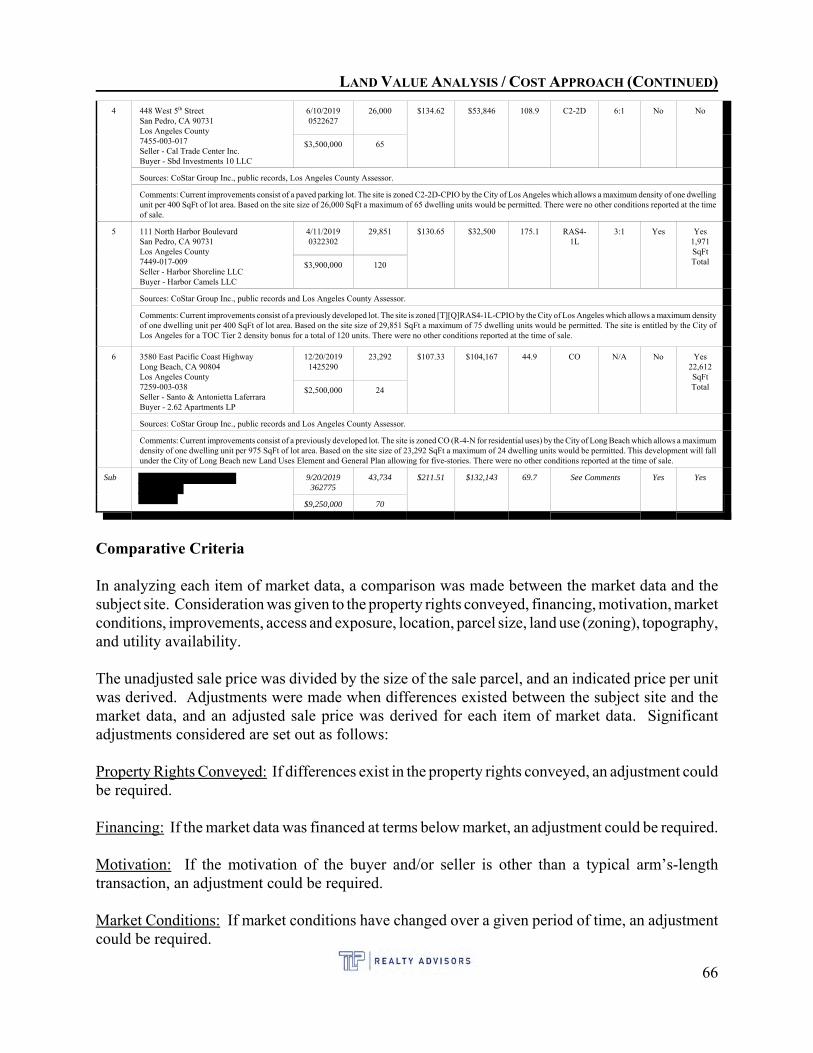
LAND VALUE ANALYSIS / COST APPROACH (CONTINUED)
4 448 West 5th StreetSan Pedro, CA 90731Los Angeles County7455-003-017Seller - Cal Trade Center Inc.Buyer - Sbd Investments 10 LLC
6/10/20190522627
26,000 $134.62 $53,846 108.9 C2-2D 6:1 No No
$3,500,000 65
Sources: CoStar Group Inc., public records, Los Angeles County Assessor.
Comments: Current improvements consist of a paved parking lot. The site is zoned C2-2D-CPIO by the City of Los Angeles which allows a maximum density of one dwellingunit per 400 SqFt of lot area. Based on the site size of 26,000 SqFt a maximum of 65 dwelling units would be permitted. There were no other conditions reported at the timeof sale.
5 111 North Harbor BoulevardSan Pedro, CA 90731Los Angeles County7449-017-009Seller - Harbor Shoreline LLCBuyer - Harbor Camels LLC
4/11/20190322302
29,851 $130.65 $32,500 175.1 RAS4-1L
3:1 Yes Yes1,971SqFtTotal$3,900,000 120
Sources: CoStar Group Inc., public records and Los Angeles County Assessor.
Comments: Current improvements consist of a previously developed lot. The site is zoned [T][Q]RAS4-1L-CPIO by the City of Los Angeles which allows a maximum densityof one dwelling unit per 400 SqFt of lot area. Based on the site size of 29,851 SqFt a maximum of 75 dwelling units would be permitted. The site is entitled by the City ofLos Angeles for a TOC Tier 2 density bonus for a total of 120 units. There were no other conditions reported at the time of sale.
6 3580 East Pacific Coast HighwayLong Beach, CA 90804Los Angeles County7259-003-038Seller - Santo & Antonietta LaferraraBuyer - 2.62 Apartments LP
12/20/20191425290
23,292 $107.33 $104,167 44.9 CO N/A No Yes22,612SqFtTotal$2,500,000 24
Sources: CoStar Group Inc., public records and Los Angeles County Assessor.
Comments: Current improvements consist of a previously developed lot. The site is zoned CO (R-4-N for residential uses) by the City of Long Beach which allows a maximumdensity of one dwelling unit per 975 SqFt of lot area. Based on the site size of 23,292 SqFt a maximum of 24 dwelling units would be permitted. This development will fallunder the City of Long Beach new Land Uses Element and General Plan allowing for five-stories. There were no other conditions reported at the time of sale.
Sub 9/20/2019362775
43,734 $211.51 $132,143 69.7 See Comments Yes Yes
$9,250,000 70
Comparative Criteria
In analyzing each item of market data, a comparison was made between the market data and thesubject site. Consideration was given to the property rights conveyed, financing, motivation, marketconditions, improvements, access and exposure, location, parcel size, land use (zoning), topography,and utility availability.
The unadjusted sale price was divided by the size of the sale parcel, and an indicated price per unitwas derived. Adjustments were made when differences existed between the subject site and themarket data, and an adjusted sale price was derived for each item of market data. Significantadjustments considered are set out as follows:
Property Rights Conveyed: If differences exist in the property rights conveyed, an adjustment couldbe required.
Financing: If the market data was financed at terms below market, an adjustment could be required.
Motivation: If the motivation of the buyer and/or seller is other than a typical arm’s-lengthtransaction, an adjustment could be required.
Market Conditions: If market conditions have changed over a given period of time, an adjustmentcould be required.
66
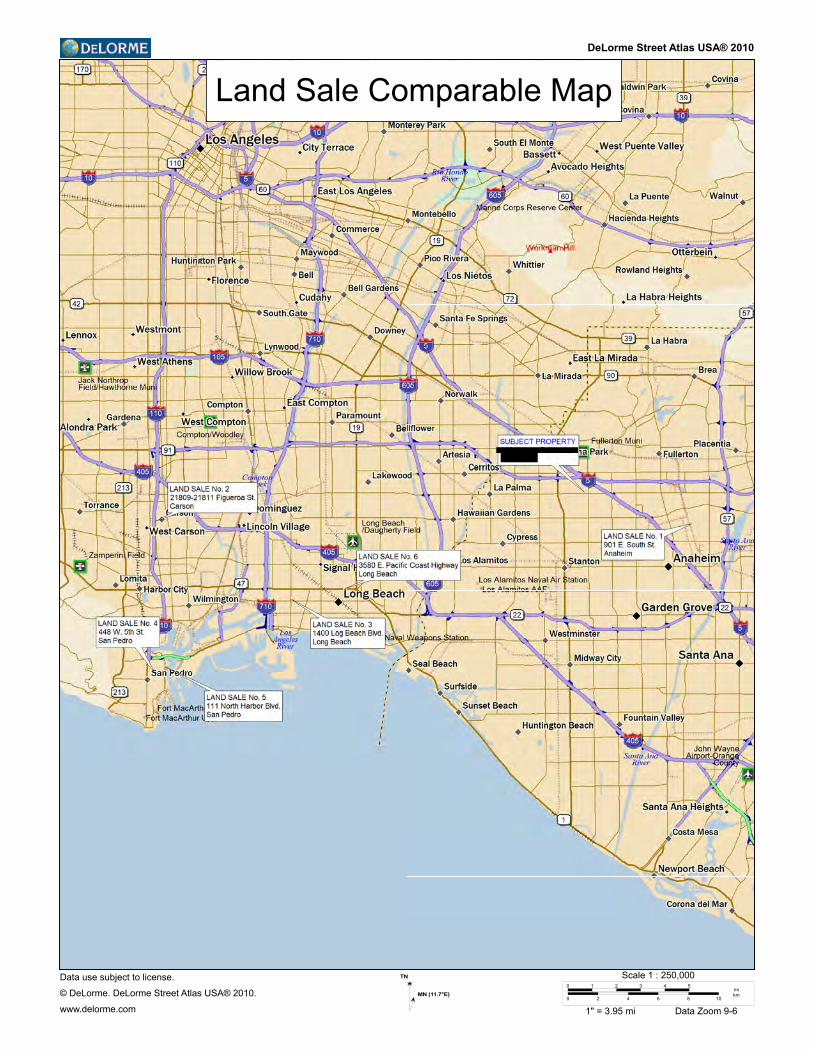
DeLorme Street Atlas USA® 2010
Land Sale Comparable Map
Data use subject to license.
© DeLorme. DeLorme Street Atlas USA® 2010.
www.delorme.com
TN
MN (11.7°E)
0 1 2 3 4 5
0 2 4 6 8 10
mikm
Scale 1 : 250,000
1" = 3.95 mi Data Zoom 9-6
LAND VALUE ANALYSIS / COST APPROACH (CONTINUED)
Location: If the location of the market data is superior or inferior to the subject site, an adjustmentcould be required. This adjustment would also include site specific considerations such as accessand exposure.
Parcel Size: If the market recognizes a different price per square foot for sites, of varying size, anadjustment could be required.
Land Use (Zoning): If the market data differs in land use, an adjustment could be required.
Topography: If the topography of the market data is superior or inferior to the subject site, anadjustment could be required.
Utility Availability: If the utility availability to the market data is superior or inferior to the subjectsite an adjustment could be required.
Condition/Improvements: If the market data suffers from atypical conditions (i.e., toxics) or isimproved, an adjustment to reflect the impact on value, if any, could be required.
Comparison to the Subject Site
Following is a discussion of those items of market data utilized in the valuation of the subject site:
Property Rights: Each of the presented land sales involved arm's-length transactions involving a feesimple position, with no unusual terms of sale noted. Therefore, no adjustments were considerednecessary.
Financing Terms: Each of the comparables were all cash or cash equivalent financing transactionswith no unusual terms of financing included. There were no adjustments necessary for atypicalfinancing for the presented sales.
Conditions of Sale: Adjustments for condition of sale are required when the buyer or seller hadatypical motivations. Examples of transactions which might require a condition of sale adjustmentare eminent domain processing and sales that were not arm's-length. Therefore, no adjustments forproperty rights conveyed, atypical financing or motivation are required for the presented sales.
Date of Sale: The sales presented represent transactions occurring from July 2019 through January2020. As indicated by the information presented in the Market Conditions section of the appraisalreport, the overall multifamily market has shown signs of increased values over the past severalyears. This is based on stable and/or increasing rental rates, coupled with lower interest rates andlower overall capitalization rates. We have applied adjustments to the comparables as warranted.
Location: This category is generally the most significant of adjustments in that it takes into accountitems such as desirability of the overall location, proximity to commercial and residential bases,access and exposure of the site, and general perceptions of desirability.
67
LAND VALUE ANALYSIS / COST APPROACH (CONTINUED)
The lack of directly comparable information limits the reliability of a paired sales analysis for thisadjustment. Therefore, most of the remaining adjustments are considered more qualitative thanquantitative. The overall location is an important adjustment in that it considered numerous itemssuch as general location, proximity to access routes, employment centers, and access and exposureof the site itself.
The subject has average locational characteristics in the City of Anaheim just west of the downtownAnaheim market. The comparables are located in the Cities of Anaheim, Carson, Long Beach andSan Pedro. We have applied adjustments to the comparables which had superior or inferior sitespecific and/or neighborhood locational characteristics.
Site / Project Size: Site size is an area which often is considered for adjustment. Typically, smallerparcels sell for a higher unit value than do larger ones due primarily to the risk associated with theconstruction of larger apartment projects. Therefore, we have applied an adjustment to the largerand/or smaller sized comparables.
Zoning: The presented sales had zoning designations that allowed for either commercial ormultifamily and all were reported to be affected by relatively similar development standards. Wehave considered and applied adjustments to the comparables which offered substantial superior orinferior differences in the overall density.
Entitlements: For purposes of our analysis, we applied a downward $15,000 per unit to the saleprices of the comparables which were entitled at the time of sale. This is based on the fact that wehave given credit to the developer for the costs spent to date in order to arrive at the Market ValueAs Is. These costs reflect the entitlement costs as the subject property is entitled for the proposedrenovation/construction of 70 income restricted dwelling units.
Condition/Improvements: For purposes of our analysis we have assumed that the subject propertyis essentially vacant and ready for development of the proposed improvements (i.e., existingimprovements have been demolished). The appraisers applied a demolition adjustment to thecomparables as warranted based on a figure of $10 per square foot.
Affordability Requirement: The subject property will contain an affordable element in the form ofproviding set-aside units restricted via several agencies. For purposes of this analysis and fordetermining an appropriate value for the land, we assumed that the subject property was unrestrictedand unencumbered. We adjusted the comparables as warranted, however, it is important to identifythe fact that projects with a partial affordable component typically incorporate a density bonus aspart of the development which offsets any below market rents from the affordable units. Forpurposes of our analysis, we compared the values with and without the rent restrictions which rangefrom $12,250,000 (hypothetical) to $7,200,000 (with restrictions), which reflects a 41% downwardadjustment.
Retail Component: The subject will not contain a retail component. One of the comparablescontained a ground floor retail component and therefore, we applied an adjustment to reflect theadditional value associated with the retail component.
68
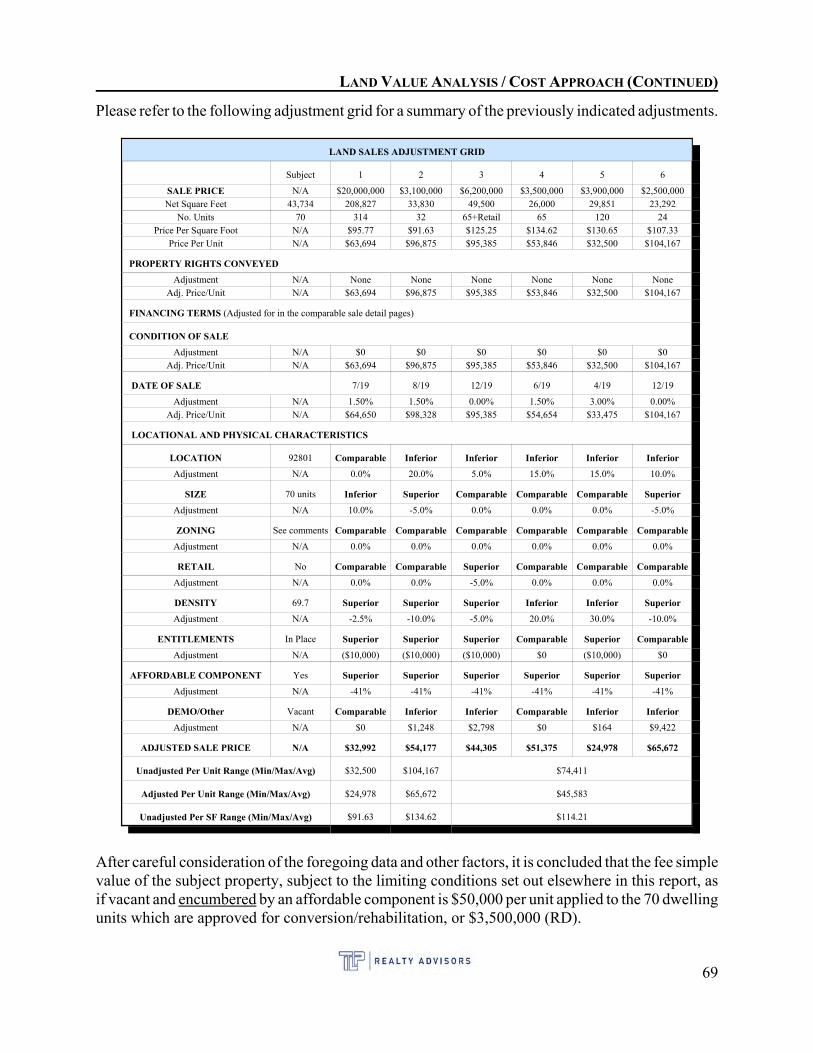
LAND VALUE ANALYSIS / COST APPROACH (CONTINUED)
Please refer to the following adjustment grid for a summary of the previously indicated adjustments.
LAND SALES ADJUSTMENT GRID
Subject 1 2 3 4 5 6
SALE PRICE N/A $20,000,000 $3,100,000 $6,200,000 $3,500,000 $3,900,000 $2,500,000Net Square Feet 43,734 208,827 33,830 49,500 26,000 29,851 23,292
No. Units 70 314 32 65+Retail 65 120 24Price Per Square Foot N/A $95.77 $91.63 $125.25 $134.62 $130.65 $107.33
Price Per Unit N/A $63,694 $96,875 $95,385 $53,846 $32,500 $104,167
PROPERTY RIGHTS CONVEYED
Adjustment N/A None None None None None NoneAdj. Price/Unit N/A $63,694 $96,875 $95,385 $53,846 $32,500 $104,167
FINANCING TERMS (Adjusted for in the comparable sale detail pages)
CONDITION OF SALE
Adjustment N/A $0 $0 $0 $0 $0 $0Adj. Price/Unit N/A $63,694 $96,875 $95,385 $53,846 $32,500 $104,167
DATE OF SALE 7/19 8/19 12/19 6/19 4/19 12/19
Adjustment N/A 1.50% 1.50% 0.00% 1.50% 3.00% 0.00%Adj. Price/Unit N/A $64,650 $98,328 $95,385 $54,654 $33,475 $104,167
LOCATIONAL AND PHYSICAL CHARACTERISTICS
LOCATION 92801 Comparable Inferior Inferior Inferior Inferior Inferior
Adjustment N/A 0.0% 20.0% 5.0% 15.0% 15.0% 10.0%
SIZE 70 units Inferior Superior Comparable Comparable Comparable Superior
Adjustment N/A 10.0% -5.0% 0.0% 0.0% 0.0% -5.0%
ZONING See comments Comparable Comparable Comparable Comparable Comparable Comparable
Adjustment N/A 0.0% 0.0% 0.0% 0.0% 0.0% 0.0%
RETAIL No Comparable Comparable Superior Comparable Comparable Comparable
Adjustment N/A 0.0% 0.0% -5.0% 0.0% 0.0% 0.0%
DENSITY 69.7 Superior Superior Superior Inferior Inferior Superior
Adjustment N/A -2.5% -10.0% -5.0% 20.0% 30.0% -10.0%
ENTITLEMENTS In Place Superior Superior Superior Comparable Superior Comparable
Adjustment N/A ($10,000) ($10,000) ($10,000) $0 ($10,000) $0
AFFORDABLE COMPONENT Yes Superior Superior Superior Superior Superior Superior
Adjustment N/A -41% -41% -41% -41% -41% -41%
DEMO/Other Vacant Comparable Inferior Inferior Comparable Inferior Inferior
Adjustment N/A $0 $1,248 $2,798 $0 $164 $9,422
ADJUSTED SALE PRICE N/A $32,992 $54,177 $44,305 $51,375 $24,978 $65,672
Unadjusted Per Unit Range (Min/Max/Avg) $32,500 $104,167 $74,411
Adjusted Per Unit Range (Min/Max/Avg) $24,978 $65,672 $45,583
Unadjusted Per SF Range (Min/Max/Avg) $91.63 $134.62 $114.21
After careful consideration of the foregoing data and other factors, it is concluded that the fee simplevalue of the subject property, subject to the limiting conditions set out elsewhere in this report, asif vacant and encumbered by an affordable component is $50,000 per unit applied to the 70 dwellingunits which are approved for conversion/rehabilitation, or $3,500,000 (RD).
69
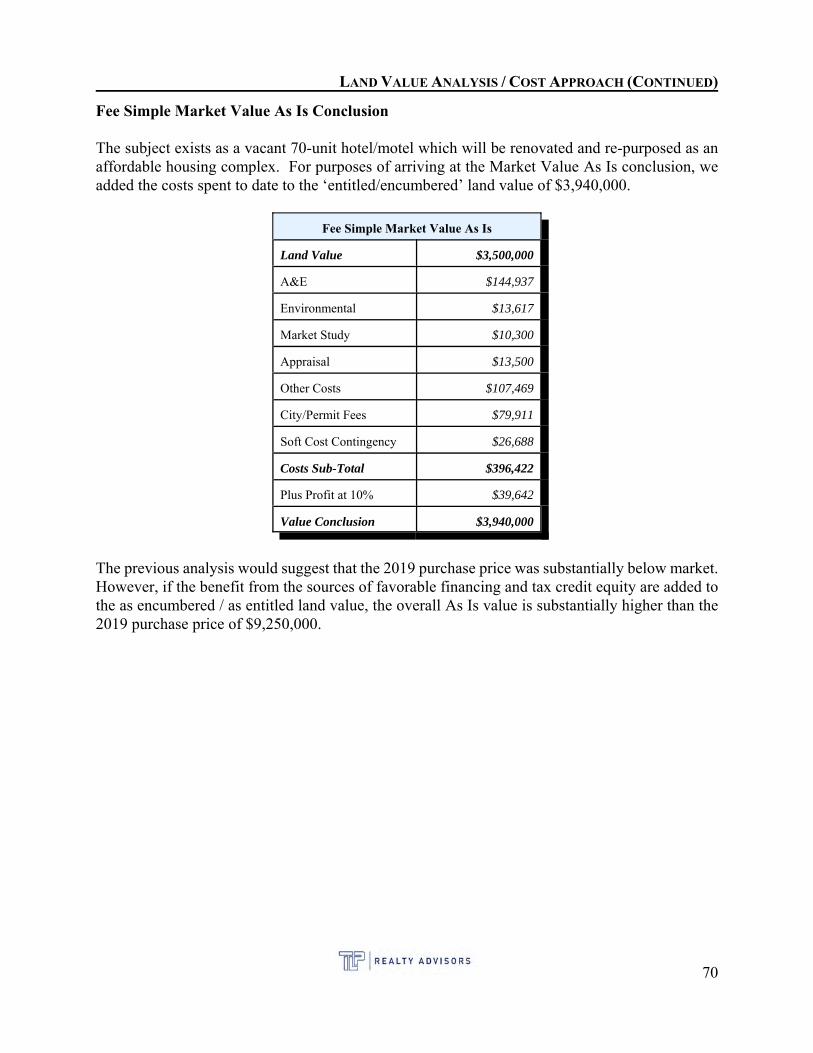
LAND VALUE ANALYSIS / COST APPROACH (CONTINUED)
Fee Simple Market Value As Is Conclusion
The subject exists as a vacant 70-unit hotel/motel which will be renovated and re-purposed as anaffordable housing complex. For purposes of arriving at the Market Value As Is conclusion, weadded the costs spent to date to the ‘entitled/encumbered’ land value of $3,940,000.
Fee Simple Market Value As Is
Land Value $3,500,000
A&E $144,937
Environmental $13,617
Market Study $10,300
Appraisal $13,500
Other Costs $107,469
City/Permit Fees $79,911
Soft Cost Contingency $26,688
Costs Sub-Total $396,422
Plus Profit at 10% $39,642
Value Conclusion $3,940,000
The previous analysis would suggest that the 2019 purchase price was substantially below market.However, if the benefit from the sources of favorable financing and tax credit equity are added tothe as encumbered / as entitled land value, the overall As Is value is substantially higher than the2019 purchase price of $9,250,000.
70
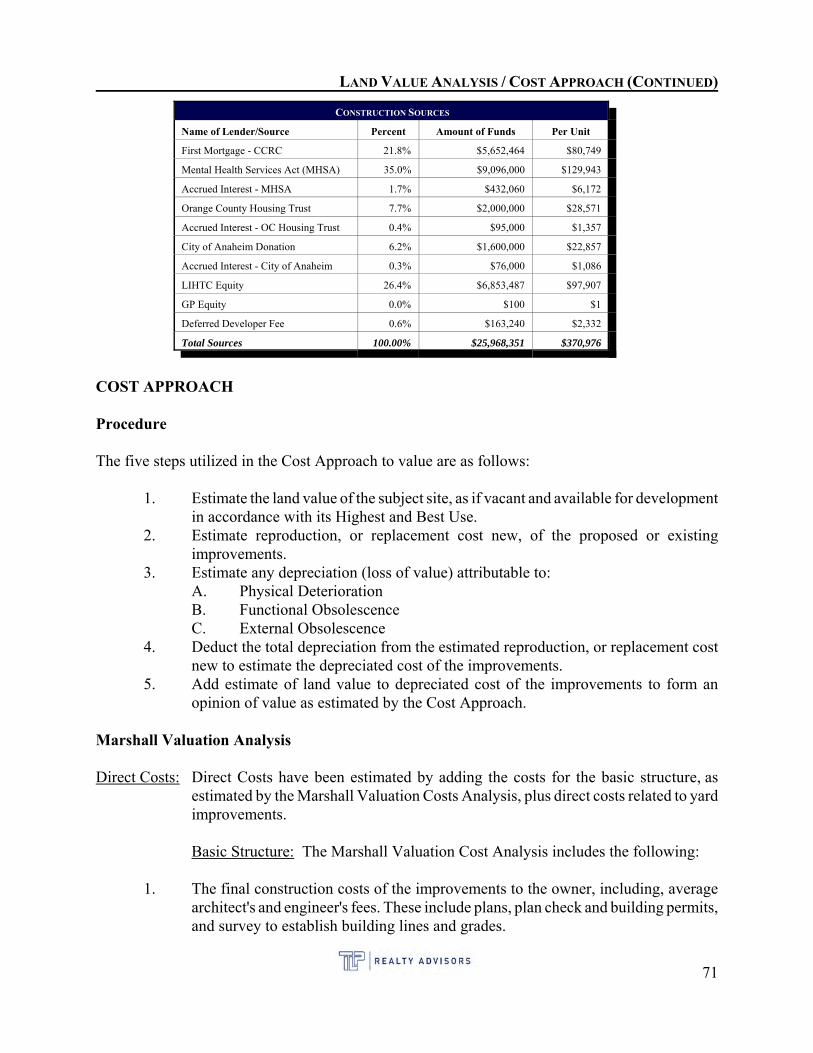
LAND VALUE ANALYSIS / COST APPROACH (CONTINUED)
CONSTRUCTION SOURCES
Name of Lender/Source Percent Amount of Funds Per Unit
First Mortgage - CCRC 21.8% $5,652,464 $80,749
Mental Health Services Act (MHSA) 35.0% $9,096,000 $129,943
Accrued Interest - MHSA 1.7% $432,060 $6,172
Orange County Housing Trust 7.7% $2,000,000 $28,571
Accrued Interest - OC Housing Trust 0.4% $95,000 $1,357
City of Anaheim Donation 6.2% $1,600,000 $22,857
Accrued Interest - City of Anaheim 0.3% $76,000 $1,086
LIHTC Equity 26.4% $6,853,487 $97,907
GP Equity 0.0% $100 $1
Deferred Developer Fee 0.6% $163,240 $2,332
Total Sources 100.00% $25,968,351 $370,976
COST APPROACH
Procedure
The five steps utilized in the Cost Approach to value are as follows:
1. Estimate the land value of the subject site, as if vacant and available for developmentin accordance with its Highest and Best Use.
2. Estimate reproduction, or replacement cost new, of the proposed or existingimprovements.
3. Estimate any depreciation (loss of value) attributable to:A. Physical DeteriorationB. Functional Obsolescence C. External Obsolescence
4. Deduct the total depreciation from the estimated reproduction, or replacement costnew to estimate the depreciated cost of the improvements.
5. Add estimate of land value to depreciated cost of the improvements to form anopinion of value as estimated by the Cost Approach.
Marshall Valuation Analysis
Direct Costs: Direct Costs have been estimated by adding the costs for the basic structure, asestimated by the Marshall Valuation Costs Analysis, plus direct costs related to yardimprovements.
Basic Structure: The Marshall Valuation Cost Analysis includes the following:
1. The final construction costs of the improvements to the owner, including, averagearchitect's and engineer's fees. These include plans, plan check and building permits,and survey to establish building lines and grades.
71
LAND VALUE ANALYSIS / COST APPROACH (CONTINUED)
2. Normal interest on building funds during period of construction and processing feeor service charge is included.
3. Sales taxes on materials.4. Normal site preparation including finish grading and excavation for foundation and
back-fill.5. Utilities from structure to lot line for typical setback.6. Contractor's overhead and profit including job supervision, workmen's compensation,
fire and liability insurance, unemployment insurance, equipment, temporaryfacilities, security, etc.
Paving/Yard Improvements: Paving and yard improvements would typically be computedbased upon the yard area as calculated by the architect and multiplied by yard improvementcosts per Marshall Valuation of approximately $5.00 per square foot.
Indirect Costs: The Marshall Valuation Cost Analysis does not include the following:
1. Costs of buying or assembling land, i.e. escrow fees, legal fees, property taxes, demolition,storm drains, or rough grading, are considered costs of doing business or land improvementcosts.
2. Pilings or hillside foundations are considered an improvement to the land. This also refersto soil compaction and vibration, terracing, etc.
3. Costs of land planning or preliminary concept and layout for large developments inclusiveof developer's overhead and profit are not included, nor is interest or taxes on the land,feasibility studies, environmental impact report (EIR), appraisal or consulting fees, etc.
4. Discounts or bonuses paid for financing are considered a cost of doing business, as are fundsfor operating start up, developmental overhead or fixture and equipment purchases, etc.
5. Off site costs including roads, utilities, park fees, jurisdictional hook-up, tap-in or impactfees and assessments, etc.
6. Furnishings and fixtures, usually not found in the general contract, that are peculiar to adefinite tenant.
7. Marketing costs to create first occupancy including model or advertising expenses, leasingcommissions or temporary operation of property owners associations.
Indirect costs have been estimated as follows:
Real Estate Taxes: Real estate taxes have been estimated at 1.28% (effective) of the landvalue (Effective tax rate) for an estimated construction period of approximately one year1.
Leasing Costs: While leasing commissions for commercial properties are typically quotedon a percentage basis applied to the lease amount, leasing apartment units typically includesthe time and money spent on marketing the property in addition to having an on-site and/oroff-site leasing representative responsible for leasing units. The appraisers have also
1Marshall Valuation estimates are approximately 400 days
72
LAND VALUE ANALYSIS / COST APPROACH (CONTINUED)
considered a deduction for the marketing costs which will be associated with leasing theproperty or $370,000 (see calculation at the end of the appraisal report).
Permanent Loan Fees: Permanent loan fees are based on a 75% loan-to-value ratioutilizing 2 loan points.
Contingency Fees: As noted above, there are numerous additional costs. For the purposesof our analysis we have included a cost of 5% of direct construction costs to account forthese items.
Developer's Profit: Marshall Valuation does not include developer's profit. Based upon discussionswith developers who have completed constructed improvements similar to the subject property, thedeveloper's profit has been estimated as 10% of the direct and indirect costs.
Depreciation: Depreciation is loss in value due to any cause. It is the difference between animprovement's reproduction cost and its present value as of the date of appraisal. Before continuingon about the estimation of accrued depreciation, there are four terms which should be defined.2
Economic Life: The period over which improvements to real estate contribute to propertyvalue.
Remaining Economic Life: The estimated period over which improvements continue tocontribute to property value.
Actual Age: The number of years that have elapsed since an original structure was built.
Effective Age: The age indicated by the condition and utility of a structure.
There are five basic forms of accrued depreciation as listed below, with a brief explanation.
1. Curable Physical Deterioration: Items of deferred maintenance.2. Incurable Physical Deterioration: The amount of physical deterioration that is not
practical or feasible to correct. There are two categories - long lived and short lived. A long lived item has a remaining economic life that is the same as that of thestructure. A short lived item has an economic life that is shorter than that of thestructure.
3. Curable Functional Obsolescence: Functional obsolescence is the adverse effect onvalue resulting from defects in design. To be curable, the cost of replacing theoutmoded aspect must be at least offset by the anticipated increase in value.
4. Incurable Functional Obsolescence: Functional obsolescence is the adverse effecton value resulting from effects. Incurable functional obsolescence is caused by a
2All definitions were obtained from The Appraisal of Real Estate, 14th Edition, Appraisal Institute, 2013
73
LAND VALUE ANALYSIS / COST APPROACH (CONTINUED)
deficiency or superadequacy in design and the cost to cure exceeds the anticipatedincrease in value.
5. External Obsolescence: Loss in value due to causes outside the property andindependent of it.
There are five methods of estimating accrued depreciation. In estimating the accrued depreciationfor the subject property, the appraisers have reviewed the five methods and have determined that thebreakdown method is the most appropriate. This method involves estimating each cause ofdepreciation separately and then arriving at a total figure to deduct from reproduction cost new. Following is the estimate of accrued depreciation.
Accrued Depreciation Estimate
Physical Curable Deterioration: The subject will be new upon completion ofconstruction/renovation.
Physical Incurable Deterioration: As mentioned, physical incurable deterioration involves anestimate of deterioration which is currently not feasible to correct. This pertains to structuralelements of the property. It is typically due to the normal wear and tear of the structure. Incalculating the deterioration, the effective age/life method is typically utilized. In this technique,the subject's deterioration is based upon the proportion of the effective age in relation to theeconomic life. The subject improvements will be new upon completion of construction/renovationand will not be subject to Physical Incurable Deterioration at the time of completion.
Functional Obsolescence Functional Obsolescence is the negative impact on value resulting fromdefects in design. It can also be caused by changes that, over time, have made some aspect of thestructure obsolete by current standards. It can be comprised of either inadequacies orsuperadequacies. Further, we assume the subject is not affected by additional requirements basedupon interpretations of the recently enacted Americans with Disabilities Act (ADA), as replacementcosts have been considered in our cost estimates.
External Obsolescence This type of depreciation consists of impairment of desirability or useful lifearising from factors external to the property, such as economic forces or environmental changeswhich affect supply-demand relationships. The subject is not felt to be suffering from any formsof external obsolescence.
Conclusion
An analysis was completed for the subject improvements utilizing the Marshall Valuation costestimate service. Your attention is invited to the following chart wherein this cost estimate is setout.
74
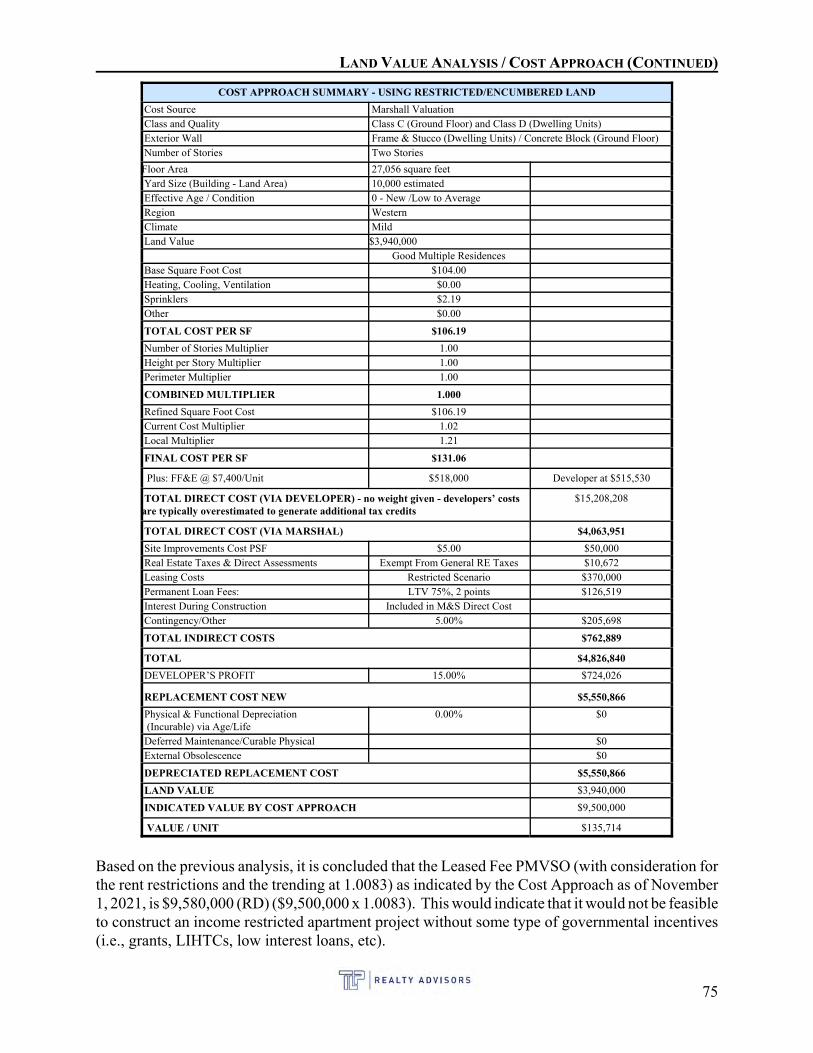
LAND VALUE ANALYSIS / COST APPROACH (CONTINUED)
COST APPROACH SUMMARY - USING RESTRICTED/ENCUMBERED LAND
Cost Source Marshall Valuation Class and Quality Class C (Ground Floor) and Class D (Dwelling Units) Exterior Wall Frame & Stucco (Dwelling Units) / Concrete Block (Ground Floor) Number of Stories Two Stories
Floor Area 27,056 square feet Yard Size (Building - Land Area) 10,000 estimated Effective Age / Condition 0 - New /Low to Average Region Western Climate Mild Land Value $3,940,000
Good Multiple Residences Base Square Foot Cost $104.00 Heating, Cooling, Ventilation $0.00 Sprinklers $2.19 Other $0.00
TOTAL COST PER SF $106.19
Number of Stories Multiplier 1.00 Height per Story Multiplier 1.00 Perimeter Multiplier 1.00
COMBINED MULTIPLIER 1.000
Refined Square Foot Cost $106.19 Current Cost Multiplier 1.02 Local Multiplier 1.21
FINAL COST PER SF $131.06
Plus: FF&E @ $7,400/Unit $518,000 Developer at $515,530
TOTAL DIRECT COST (VIA DEVELOPER) - no weight given - developers’ costsare typically overestimated to generate additional tax credits
$15,208,208
TOTAL DIRECT COST (VIA MARSHAL) $4,063,951
Site Improvements Cost PSF $5.00 $50,000 Real Estate Taxes & Direct Assessments Exempt From General RE Taxes $10,672 Leasing Costs Restricted Scenario $370,000 Permanent Loan Fees: LTV 75%, 2 points $126,519 Interest During Construction Included in M&S Direct Cost Contingency/Other 5.00% $205,698
TOTAL INDIRECT COSTS $762,889
TOTAL $4,826,840
DEVELOPER’S PROFIT 15.00% $724,026
REPLACEMENT COST NEW $5,550,866
Physical & Functional Depreciation (Incurable) via Age/Life
0.00% $0
Deferred Maintenance/Curable Physical $0 External Obsolescence $0
DEPRECIATED REPLACEMENT COST $5,550,866
LAND VALUE $3,940,000
INDICATED VALUE BY COST APPROACH $9,500,000
VALUE / UNIT $135,714
Based on the previous analysis, it is concluded that the Leased Fee PMVSO (with consideration forthe rent restrictions and the trending at 1.0083) as indicated by the Cost Approach as of November1, 2021, is $9,580,000 (RD) ($9,500,000 x 1.0083). This would indicate that it would not be feasibleto construct an income restricted apartment project without some type of governmental incentives(i.e., grants, LIHTCs, low interest loans, etc).
75
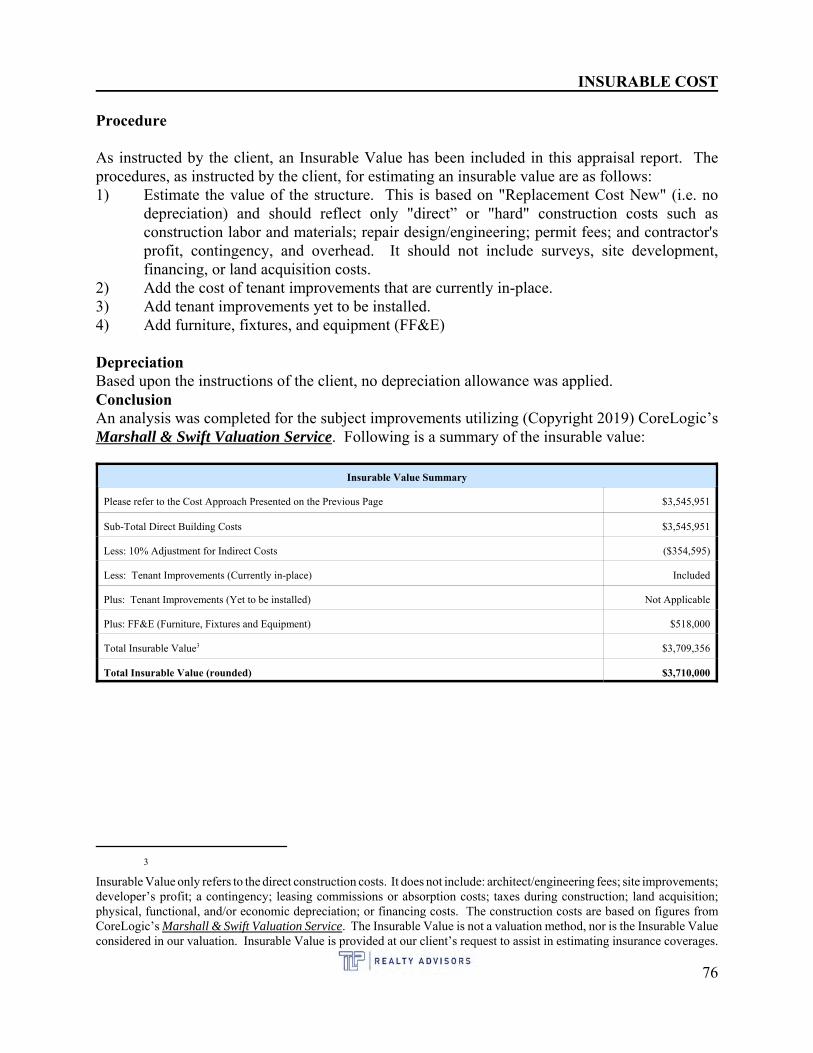
INSURABLE COST
Procedure
As instructed by the client, an Insurable Value has been included in this appraisal report. Theprocedures, as instructed by the client, for estimating an insurable value are as follows:1) Estimate the value of the structure. This is based on "Replacement Cost New" (i.e. no
depreciation) and should reflect only "direct” or "hard" construction costs such asconstruction labor and materials; repair design/engineering; permit fees; and contractor'sprofit, contingency, and overhead. It should not include surveys, site development,financing, or land acquisition costs.
2) Add the cost of tenant improvements that are currently in-place.3) Add tenant improvements yet to be installed.4) Add furniture, fixtures, and equipment (FF&E)
DepreciationBased upon the instructions of the client, no depreciation allowance was applied.ConclusionAn analysis was completed for the subject improvements utilizing (Copyright 2019) CoreLogic’sMarshall & Swift Valuation Service. Following is a summary of the insurable value:
Insurable Value Summary
Please refer to the Cost Approach Presented on the Previous Page $3,545,951
Sub-Total Direct Building Costs $3,545,951
Less: 10% Adjustment for Indirect Costs ($354,595)
Less: Tenant Improvements (Currently in-place) Included
Plus: Tenant Improvements (Yet to be installed) Not Applicable
Plus: FF&E (Furniture, Fixtures and Equipment) $518,000
Total Insurable Value3 $3,709,356
Total Insurable Value (rounded) $3,710,000
3
Insurable Value only refers to the direct construction costs. It does not include: architect/engineering fees; site improvements;developer’s profit; a contingency; leasing commissions or absorption costs; taxes during construction; land acquisition;physical, functional, and/or economic depreciation; or financing costs. The construction costs are based on figures fromCoreLogic’s Marshall & Swift Valuation Service. The Insurable Value is not a valuation method, nor is the Insurable Valueconsidered in our valuation. Insurable Value is provided at our client’s request to assist in estimating insurance coverages.
76
INCOME CAPITALIZATION APPROACH
Procedure
The Income Capitalization Approach is a technique or method wherein the future benefits ofownership are transformed through a discounting process into a present worth or value estimate. When estimating value by this approach, the Appraisers must determine and clearly define futurebenefits and identify today's typical user or investor.
Future benefits are estimated by forecasting the gross earning potential under prevailing andforeseeable market conditions. Appropriate allowances for vacancy and operating expenses (basedon the prevailing and foreseeable market) are then deducted from gross earnings. This process willresult in an estimate of net monetary benefits of ownership, or cash flow, which will then bediscounted to a present worth. There are two commonly used capitalization methods: directcapitalization and yield capitalization (discounted cash flow).
Direct capitalization is used to convert an estimate of a single year's incomeexpectancy into an indication of value in one direct step - either by dividing theincome estimate by an appropriate income rate or by multiplying the incomeestimate by an appropriate factor.4
Yield capitalization is a method used to convert future benefits into present value bydiscounting each future benefit at an appropriate yield rate or by developing anoverall rate that explicitly reflects the investment's income pattern, value change,and yield rate.5
The first step in the valuation process is to determine current market rent levels. Market rent isdefined as the reasonable expectancy if the property were available for renting at the time of itsestimation; the rental warranted to be paid in the open real estate market, based upon current rentalsbeing paid for comparable space, as distinguished from contract rent under an existing lease. Contract rent is payment for the use of a property designated in a lease agreement. Actual, orcontract, rent may differ from market rent.
In determination of the market rent applicable to the property, the appraisers have made a thoroughsearch of the local market. Interviews with leasing agents as well as local real estate professionalsenabled the appraisers to determine the appropriate expenses debited to the landlord and tenant, asthe market is indicating. An analysis of the rent comparables in relation to the subject will indicatean appropriate estimation of market rent for the subject property. Presented in the following pagesis information regarding several non-income restricted multi-family residential projects within thesubject's competitive market. Each are detailed and discussed in estimating the appropriate marketrent applicable to the subject property. This scenario will focus on rent conclusions assuming noaffordability requirements (i.e., 100% market):
4The Appraisal of Real Estate, 14th Edition, Appraisal Institute, Chicago IL, 2013.
5Ibid
77
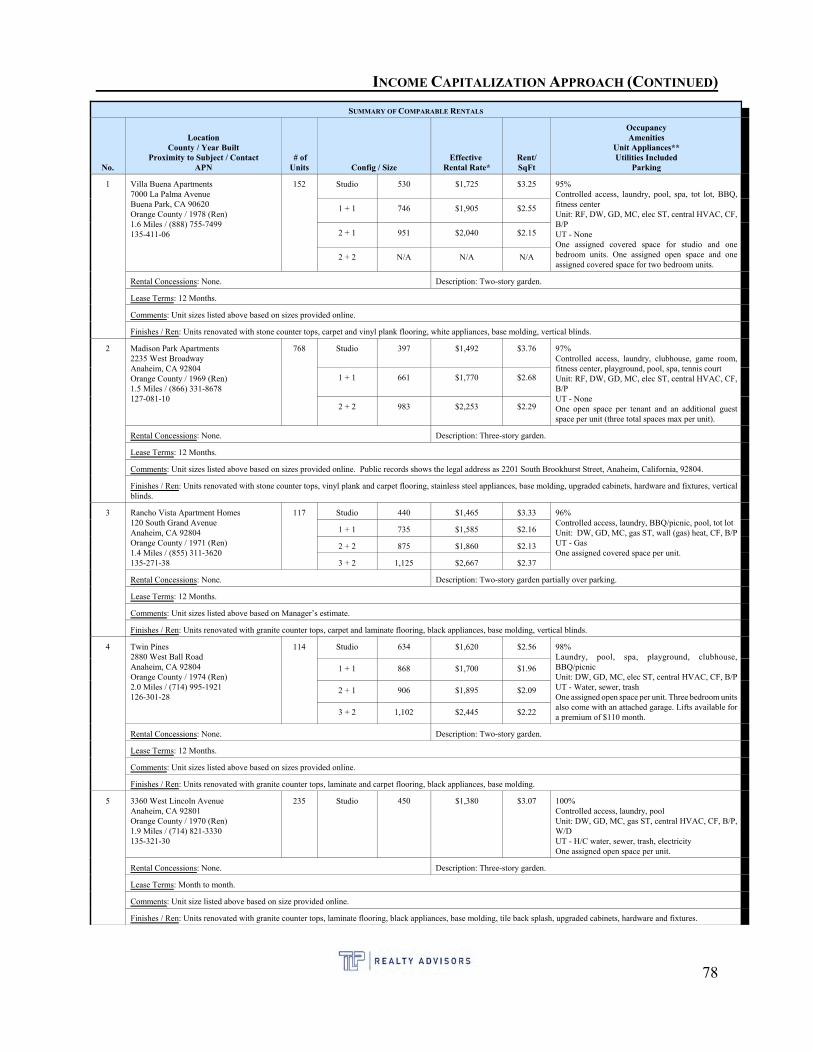
INCOME CAPITALIZATION APPROACH (CONTINUED)
SUMMARY OF COMPARABLE RENTALS
No.
LocationCounty / Year Built
Proximity to Subject / ContactAPN
# ofUnits Config / Size
Effective Rental Rate*
Rent/SqFt
OccupancyAmenities
Unit Appliances**Utilities Included
Parking
1 Villa Buena Apartments7000 La Palma AvenueBuena Park, CA 90620Orange County / 1978 (Ren)1.6 Miles / (888) 755-7499135-411-06
152 Studio 530 $1,725 $3.25 95%Controlled access, laundry, pool, spa, tot lot, BBQ,fitness centerUnit: RF, DW, GD, MC, elec ST, central HVAC, CF,B/PUT - NoneOne assigned covered space for studio and onebedroom units. One assigned open space and oneassigned covered space for two bedroom units.
1 + 1 746 $1,905 $2.55
2 + 1 951 $2,040 $2.15
2 + 2 N/A N/A N/A
Rental Concessions: None. Description: Two-story garden.
Lease Terms: 12 Months.
Comments: Unit sizes listed above based on sizes provided online.
Finishes / Ren: Units renovated with stone counter tops, carpet and vinyl plank flooring, white appliances, base molding, vertical blinds.
2 Madison Park Apartments2235 West BroadwayAnaheim, CA 92804Orange County / 1969 (Ren)1.5 Miles / (866) 331-8678127-081-10
768 Studio 397 $1,492 $3.76 97%Controlled access, laundry, clubhouse, game room,fitness center, playground, pool, spa, tennis courtUnit: RF, DW, GD, MC, elec ST, central HVAC, CF,B/PUT - NoneOne open space per tenant and an additional guestspace per unit (three total spaces max per unit).
1 + 1 661 $1,770 $2.68
2 + 2 983 $2,253 $2.29
Rental Concessions: None. Description: Three-story garden.
Lease Terms: 12 Months.
Comments: Unit sizes listed above based on sizes provided online. Public records shows the legal address as 2201 South Brookhurst Street, Anaheim, California, 92804.
Finishes / Ren: Units renovated with stone counter tops, vinyl plank and carpet flooring, stainless steel appliances, base molding, upgraded cabinets, hardware and fixtures, verticalblinds.
3 Rancho Vista Apartment Homes120 South Grand AvenueAnaheim, CA 92804Orange County / 1971 (Ren)1.4 Miles / (855) 311-3620135-271-38
117 Studio 440 $1,465 $3.33 96%Controlled access, laundry, BBQ/picnic, pool, tot lotUnit: DW, GD, MC, gas ST, wall (gas) heat, CF, B/PUT - GasOne assigned covered space per unit.
1 + 1 735 $1,585 $2.16
2 + 2 875 $1,860 $2.13
3 + 2 1,125 $2,667 $2.37
Rental Concessions: None. Description: Two-story garden partially over parking.
Lease Terms: 12 Months.
Comments: Unit sizes listed above based on Manager’s estimate.
Finishes / Ren: Units renovated with granite counter tops, carpet and laminate flooring, black appliances, base molding, vertical blinds.
4 Twin Pines 2880 West Ball RoadAnaheim, CA 92804Orange County / 1974 (Ren)2.0 Miles / (714) 995-1921126-301-28
114 Studio 634 $1,620 $2.56 98%Laundry, pool, spa, playground, clubhouse,BBQ/picnicUnit: DW, GD, MC, elec ST, central HVAC, CF, B/PUT - Water, sewer, trashOne assigned open space per unit. Three bedroom unitsalso come with an attached garage. Lifts available fora premium of $110 month.
1 + 1 868 $1,700 $1.96
2 + 1 906 $1,895 $2.09
3 + 2 1,102 $2,445 $2.22
Rental Concessions: None. Description: Two-story garden.
Lease Terms: 12 Months.
Comments: Unit sizes listed above based on sizes provided online.
Finishes / Ren: Units renovated with granite counter tops, laminate and carpet flooring, black appliances, base molding.
5 3360 West Lincoln AvenueAnaheim, CA 92801Orange County / 1970 (Ren)1.9 Miles / (714) 821-3330135-321-30
235 Studio 450 $1,380 $3.07 100%Controlled access, laundry, poolUnit: DW, GD, MC, gas ST, central HVAC, CF, B/P,W/DUT - H/C water, sewer, trash, electricityOne assigned open space per unit.
Rental Concessions: None. Description: Three-story garden.
Lease Terms: Month to month.
Comments: Unit size listed above based on size provided online.
Finishes / Ren: Units renovated with granite counter tops, laminate flooring, black appliances, base molding, tile back splash, upgraded cabinets, hardware and fixtures.
78
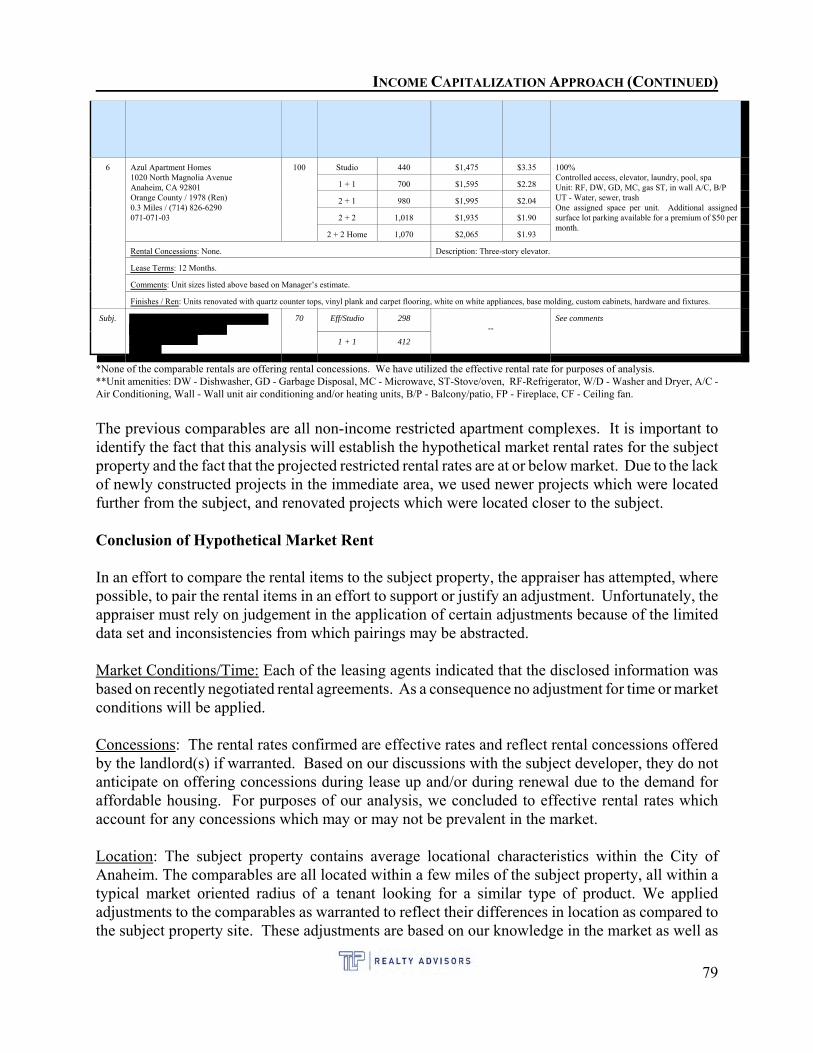
INCOME CAPITALIZATION APPROACH (CONTINUED)
6 Azul Apartment Homes1020 North Magnolia AvenueAnaheim, CA 92801Orange County / 1978 (Ren)0.3 Miles / (714) 826-6290071-071-03
100 Studio 440 $1,475 $3.35 100%Controlled access, elevator, laundry, pool, spaUnit: RF, DW, GD, MC, gas ST, in wall A/C, B/PUT - Water, sewer, trashOne assigned space per unit. Additional assignedsurface lot parking available for a premium of $50 permonth.
1 + 1 700 $1,595 $2.28
2 + 1 980 $1,995 $2.04
2 + 2 1,018 $1,935 $1.90
2 + 2 Home 1,070 $2,065 $1.93
Rental Concessions: None. Description: Three-story elevator.
Lease Terms: 12 Months.
Comments: Unit sizes listed above based on Manager’s estimate.
Finishes / Ren: Units renovated with quartz counter tops, vinyl plank and carpet flooring, white on white appliances, base molding, custom cabinets, hardware and fixtures.
Subj. 70 Eff/Studio 298--
See comments
1 + 1 412
*None of the comparable rentals are offering rental concessions. We have utilized the effective rental rate for purposes of analysis.**Unit amenities: DW - Dishwasher, GD - Garbage Disposal, MC - Microwave, ST-Stove/oven, RF-Refrigerator, W/D - Washer and Dryer, A/C -Air Conditioning, Wall - Wall unit air conditioning and/or heating units, B/P - Balcony/patio, FP - Fireplace, CF - Ceiling fan.
The previous comparables are all non-income restricted apartment complexes. It is important toidentify the fact that this analysis will establish the hypothetical market rental rates for the subjectproperty and the fact that the projected restricted rental rates are at or below market. Due to the lackof newly constructed projects in the immediate area, we used newer projects which were locatedfurther from the subject, and renovated projects which were located closer to the subject.
Conclusion of Hypothetical Market Rent
In an effort to compare the rental items to the subject property, the appraiser has attempted, wherepossible, to pair the rental items in an effort to support or justify an adjustment. Unfortunately, theappraiser must rely on judgement in the application of certain adjustments because of the limiteddata set and inconsistencies from which pairings may be abstracted.
Market Conditions/Time: Each of the leasing agents indicated that the disclosed information wasbased on recently negotiated rental agreements. As a consequence no adjustment for time or marketconditions will be applied.
Concessions: The rental rates confirmed are effective rates and reflect rental concessions offeredby the landlord(s) if warranted. Based on our discussions with the subject developer, they do notanticipate on offering concessions during lease up and/or during renewal due to the demand foraffordable housing. For purposes of our analysis, we concluded to effective rental rates whichaccount for any concessions which may or may not be prevalent in the market.
Location: The subject property contains average locational characteristics within the City ofAnaheim. The comparables are all located within a few miles of the subject property, all within atypical market oriented radius of a tenant looking for a similar type of product. We appliedadjustments to the comparables as warranted to reflect their differences in location as compared tothe subject property site. These adjustments are based on our knowledge in the market as well as
79
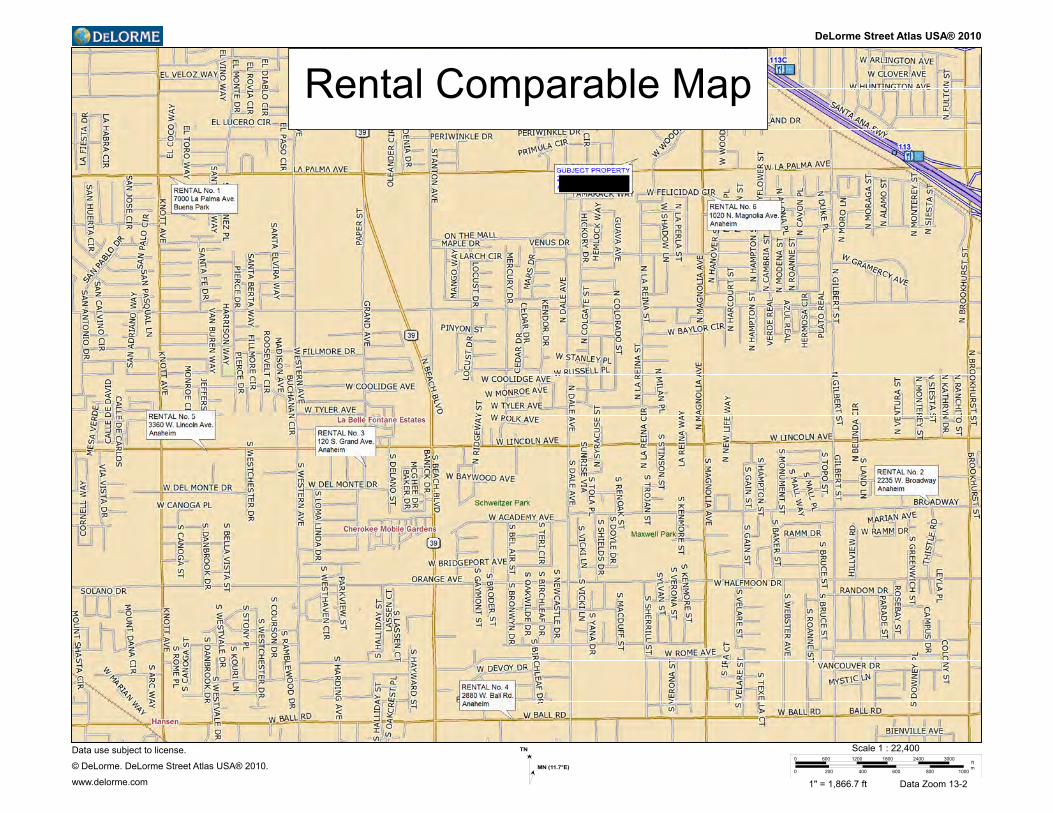
DeLorme Street Atlas USA® 2010
Rental Comparable Map
Data use subject to license.
© DeLorme. DeLorme Street Atlas USA® 2010.
www.delorme.com
TN
MN (11.7°E)
0 600 1200 1800 2400 3000
0 200 400 600 800 1000
ftm
Scale 1 : 22,400
1" = 1,866.7 ft Data Zoom 13-2
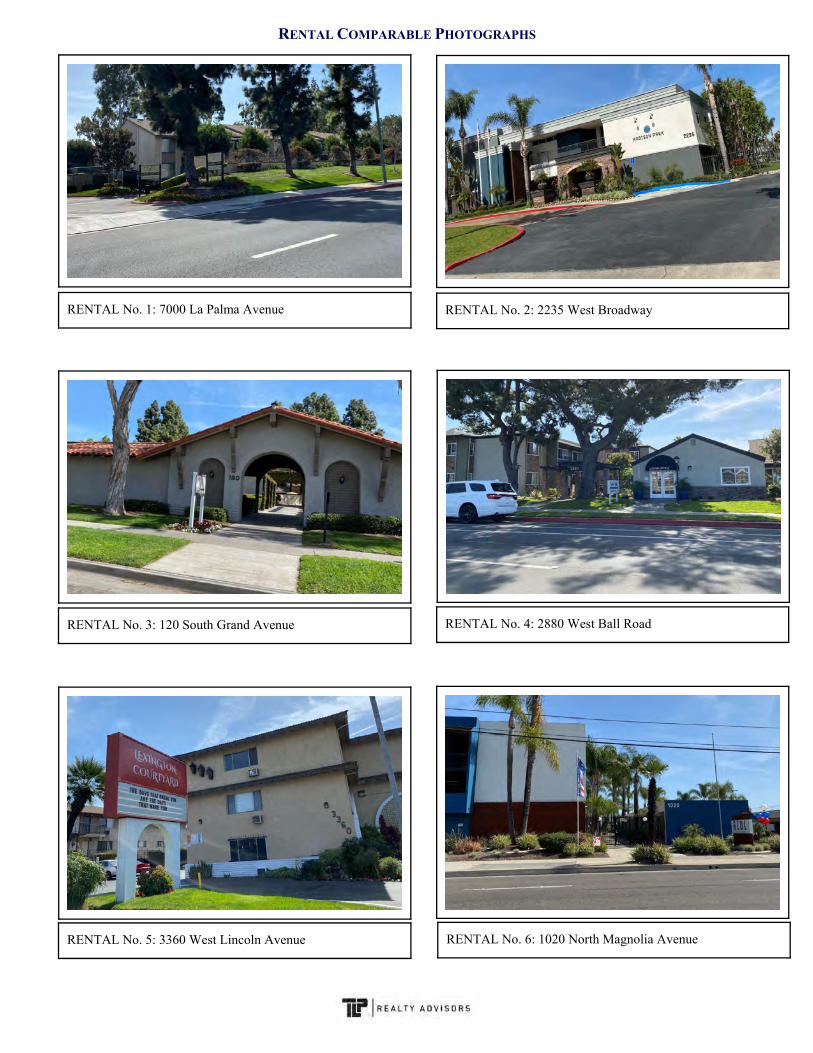
RENTAL COMPARABLE PHOTOGRAPHS
RENTAL No. 1: 7000 La Palma Avenue RENTAL No. 2: 2235 West Broadway
RENTAL No. 4: 2880 West Ball RoadRENTAL No. 3: 120 South Grand Avenue
RENTAL No. 5: 3360 West Lincoln Avenue RENTAL No. 6: 1020 North Magnolia Avenue
INCOME CAPITALIZATION APPROACH (CONTINUED)
rental rate averages for each of the communities surveyed and a per square foot rental ratecomparison.
Quality of Construction: All of the projects surveyed are felt to be of a similar quality ofconstruction and design when compared to the subject improvements. No quality of constructionadjustments are warranted.
Furnishings: The subject units will be rented furnished and will include a bed, mattress, night stand,table and chair. Based on the relatively negligible amount of furnishings, we applied a negligibleupward adjustment for the fact that the subject’s units will contain some furnishings. This wasconsistent with our discussions in the market.
Condition/Age: The subject is proposed construction and is anticipated to be finished by May 2021and will be new upon completion. The comparables were constructed between 1969 and 1989 (somerenovated). We chose these comparables based on their similarities in their age and locationalcharacteristics. Based on our discussions with the on-site managers at each of the rentalcomparables and tempered with the appraisers’ own conclusions, we have applied adjustments tothe comparables to reflect their inferior/superior condition at the time of the rental survey. Theseadjustments reflect the fact that the subject’s proposed improvements will be newer than thecomparables used in our analysis.
Kitchen Appliances: Each unit will contain a small kitchenette with a food preparation area,refrigerator, small sink, two-burner stove, and microwave. We applied an upward $15 per monthadjustment to the rental rates of the comparables which did not offer refrigerators free of charge. This adjustment was consistent with our discussions in the market.
Washers/Dryers: The subject’s units will be provided with a common area laundry facility. Forpurposes of our analysis, we applied a downward $50 per month adjustment to the rental rates of theData No. 6 which offered washer/dryers free of charge. This was consistent with our discussionsin the market which reflected a premium of $25 to $75 per unit per month.
Utility Charges: The project will be master metered for all utilities and therefore, the developer willbe responsible for paying all utilities for the tenants and the common areas. We applied adjustmentsto the comparables to reflect any substantial differences in the form of utility payment structure. Adjustments are based on typical unit usage based on the schedule provided by the HousingAuthority of the City of Anaheim.
Project Amenities: Please refer to the previous comments regarding the subject’s amenity package. The subject’s amenities differ from a conventional project based on the fact that there are moresocial services rather than project amenities such as pools, fitness rooms, etc. Based on our reviewof the market information and discussions with local on-site managers, we have consideredadjustments to those comparables where warranted.
Parking: The subject property will offer limited on-site parking for tenants which will be well belowconventional market standards (based on the projected tenant base). Generally there is less reliance
80
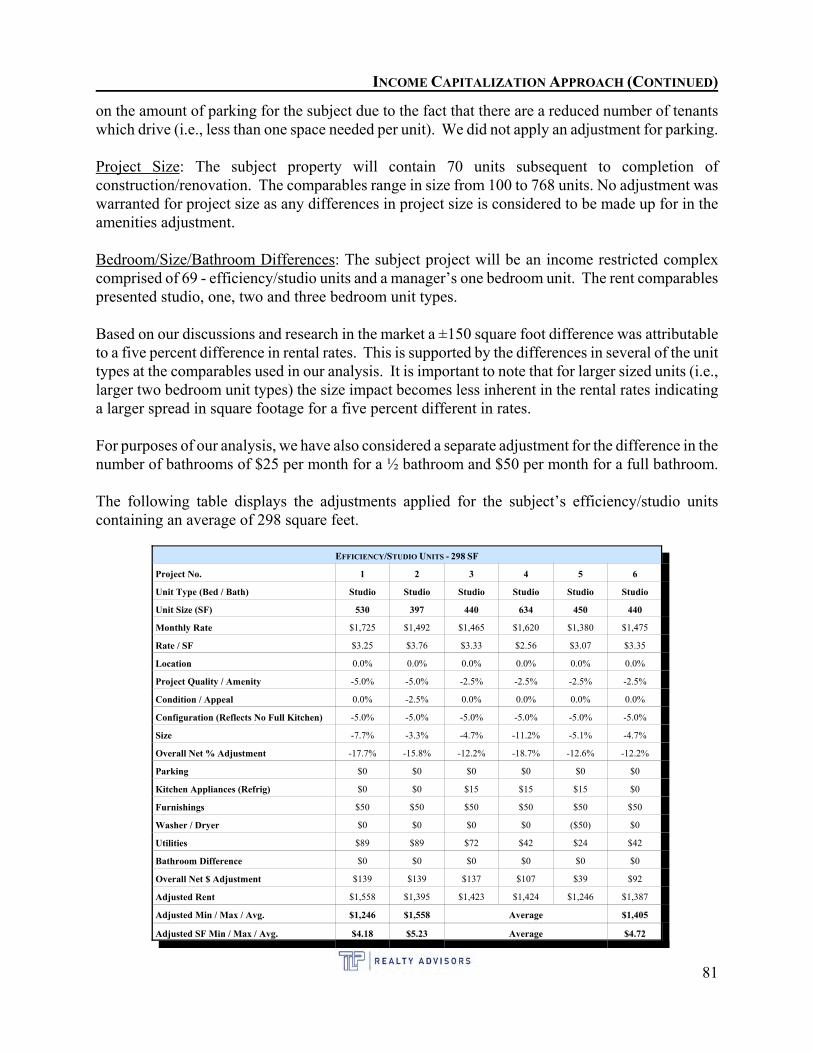
INCOME CAPITALIZATION APPROACH (CONTINUED)
on the amount of parking for the subject due to the fact that there are a reduced number of tenantswhich drive (i.e., less than one space needed per unit). We did not apply an adjustment for parking.
Project Size: The subject property will contain 70 units subsequent to completion ofconstruction/renovation. The comparables range in size from 100 to 768 units. No adjustment waswarranted for project size as any differences in project size is considered to be made up for in theamenities adjustment.
Bedroom/Size/Bathroom Differences: The subject project will be an income restricted complexcomprised of 69 - efficiency/studio units and a manager’s one bedroom unit. The rent comparablespresented studio, one, two and three bedroom unit types.
Based on our discussions and research in the market a ±150 square foot difference was attributableto a five percent difference in rental rates. This is supported by the differences in several of the unittypes at the comparables used in our analysis. It is important to note that for larger sized units (i.e.,larger two bedroom unit types) the size impact becomes less inherent in the rental rates indicatinga larger spread in square footage for a five percent different in rates.
For purposes of our analysis, we have also considered a separate adjustment for the difference in thenumber of bathrooms of $25 per month for a ½ bathroom and $50 per month for a full bathroom.
The following table displays the adjustments applied for the subject’s efficiency/studio unitscontaining an average of 298 square feet.
EFFICIENCY/STUDIO UNITS - 298 SF
Project No. 1 2 3 4 5 6
Unit Type (Bed / Bath) Studio Studio Studio Studio Studio Studio
Unit Size (SF) 530 397 440 634 450 440
Monthly Rate $1,725 $1,492 $1,465 $1,620 $1,380 $1,475
Rate / SF $3.25 $3.76 $3.33 $2.56 $3.07 $3.35
Location 0.0% 0.0% 0.0% 0.0% 0.0% 0.0%
Project Quality / Amenity -5.0% -5.0% -2.5% -2.5% -2.5% -2.5%
Condition / Appeal 0.0% -2.5% 0.0% 0.0% 0.0% 0.0%
Configuration (Reflects No Full Kitchen) -5.0% -5.0% -5.0% -5.0% -5.0% -5.0%
Size -7.7% -3.3% -4.7% -11.2% -5.1% -4.7%
Overall Net % Adjustment -17.7% -15.8% -12.2% -18.7% -12.6% -12.2%
Parking $0 $0 $0 $0 $0 $0
Kitchen Appliances (Refrig) $0 $0 $15 $15 $15 $0
Furnishings $50 $50 $50 $50 $50 $50
Washer / Dryer $0 $0 $0 $0 ($50) $0
Utilities $89 $89 $72 $42 $24 $42
Bathroom Difference $0 $0 $0 $0 $0 $0
Overall Net $ Adjustment $139 $139 $137 $107 $39 $92
Adjusted Rent $1,558 $1,395 $1,423 $1,424 $1,246 $1,387
Adjusted Min / Max / Avg. $1,246 $1,558 Average $1,405
Adjusted SF Min / Max / Avg. $4.18 $5.23 Average $4.72
81
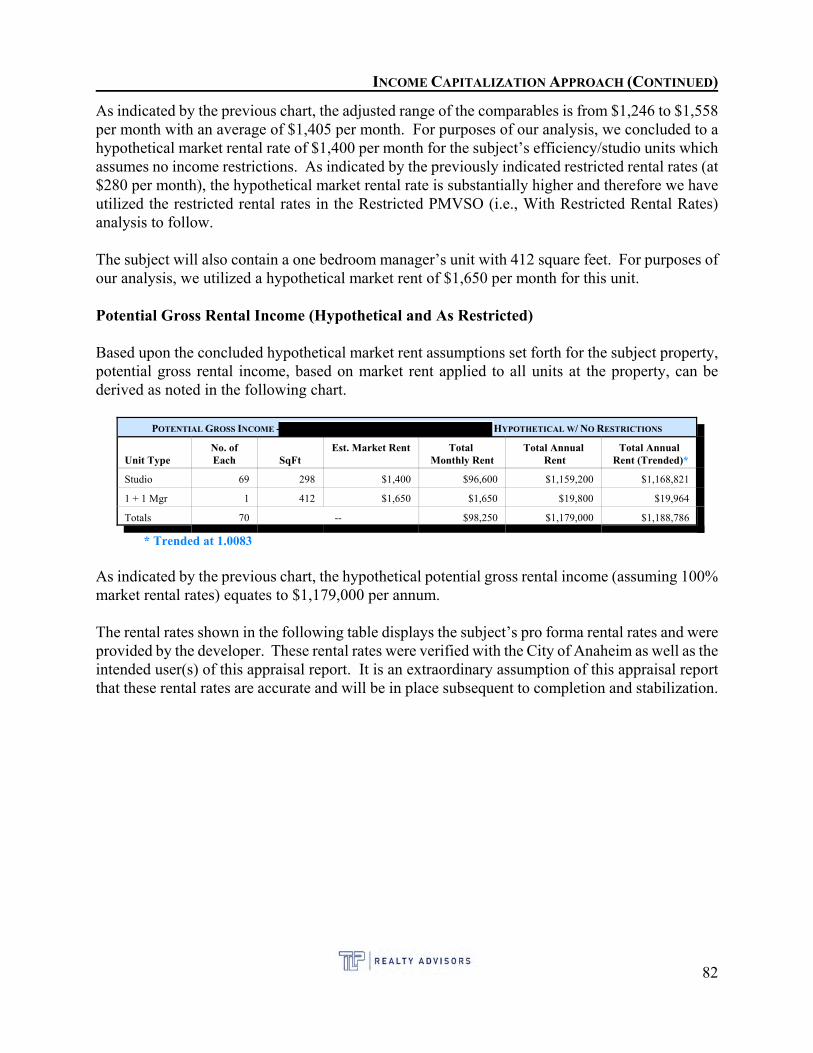
INCOME CAPITALIZATION APPROACH (CONTINUED)
As indicated by the previous chart, the adjusted range of the comparables is from $1,246 to $1,558per month with an average of $1,405 per month. For purposes of our analysis, we concluded to ahypothetical market rental rate of $1,400 per month for the subject’s efficiency/studio units whichassumes no income restrictions. As indicated by the previously indicated restricted rental rates (at$280 per month), the hypothetical market rental rate is substantially higher and therefore we haveutilized the restricted rental rates in the Restricted PMVSO (i.e., With Restricted Rental Rates)analysis to follow.
The subject will also contain a one bedroom manager’s unit with 412 square feet. For purposes ofour analysis, we utilized a hypothetical market rent of $1,650 per month for this unit.
Potential Gross Rental Income (Hypothetical and As Restricted)
Based upon the concluded hypothetical market rent assumptions set forth for the subject property,potential gross rental income, based on market rent applied to all units at the property, can bederived as noted in the following chart.
POTENTIAL GROSS INCOME - HYPOTHETICAL W/ NO RESTRICTIONS
Unit TypeNo. ofEach SqFt
Est. Market Rent Total Monthly Rent
Total Annual Rent
Total Annual Rent (Trended)*
Studio 69 298 $1,400 $96,600 $1,159,200 $1,168,821
1 + 1 Mgr 1 412 $1,650 $1,650 $19,800 $19,964
Totals 70 -- $98,250 $1,179,000 $1,188,786
* Trended at 1.0083
As indicated by the previous chart, the hypothetical potential gross rental income (assuming 100%market rental rates) equates to $1,179,000 per annum.
The rental rates shown in the following table displays the subject’s pro forma rental rates and wereprovided by the developer. These rental rates were verified with the City of Anaheim as well as theintended user(s) of this appraisal report. It is an extraordinary assumption of this appraisal reportthat these rental rates are accurate and will be in place subsequent to completion and stabilization.
82
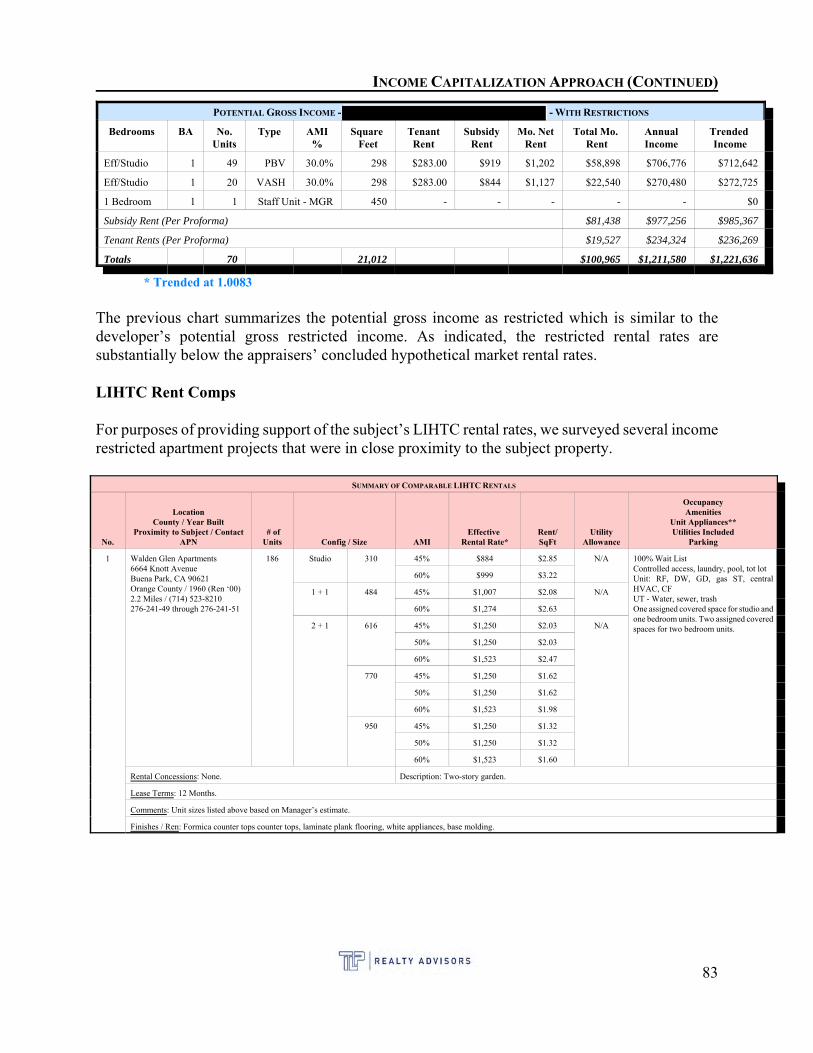
INCOME CAPITALIZATION APPROACH (CONTINUED)
POTENTIAL GROSS INCOME - - WITH RESTRICTIONS
Bedrooms BA No.Units
Type AMI%
Square Feet
Tenant Rent
SubsidyRent
Mo. NetRent
Total Mo. Rent
AnnualIncome
Trended Income
Eff/Studio 1 49 PBV 30.0% 298 $283.00 $919 $1,202 $58,898 $706,776 $712,642
Eff/Studio 1 20 VASH 30.0% 298 $283.00 $844 $1,127 $22,540 $270,480 $272,725
1 Bedroom 1 1 Staff Unit - MGR 450 - - - - - $0
Subsidy Rent (Per Proforma) $81,438 $977,256 $985,367
Tenant Rents (Per Proforma) $19,527 $234,324 $236,269
Totals 70 21,012 $100,965 $1,211,580 $1,221,636
* Trended at 1.0083
The previous chart summarizes the potential gross income as restricted which is similar to thedeveloper’s potential gross restricted income. As indicated, the restricted rental rates aresubstantially below the appraisers’ concluded hypothetical market rental rates.
LIHTC Rent Comps
For purposes of providing support of the subject’s LIHTC rental rates, we surveyed several incomerestricted apartment projects that were in close proximity to the subject property.
SUMMARY OF COMPARABLE LIHTC RENTALS
No.
LocationCounty / Year Built
Proximity to Subject / ContactAPN
# ofUnits Config / Size AMI
Effective Rental Rate*
Rent/SqFt
UtilityAllowance
OccupancyAmenities
Unit Appliances**Utilities Included
Parking
1 Walden Glen Apartments6664 Knott AvenueBuena Park, CA 90621Orange County / 1960 (Ren ‘00)2.2 Miles / (714) 523-8210276-241-49 through 276-241-51
186 Studio 310 45% $884 $2.85 N/A 100% Wait ListControlled access, laundry, pool, tot lotUnit: RF, DW, GD, gas ST, centralHVAC, CFUT - Water, sewer, trashOne assigned covered space for studio andone bedroom units. Two assigned coveredspaces for two bedroom units.
60% $999 $3.22
1 + 1 484 45% $1,007 $2.08 N/A
60% $1,274 $2.63
2 + 1 616 45% $1,250 $2.03 N/A
50% $1,250 $2.03
60% $1,523 $2.47
770 45% $1,250 $1.62
50% $1,250 $1.62
60% $1,523 $1.98
950 45% $1,250 $1.32
50% $1,250 $1.32
60% $1,523 $1.60
Rental Concessions: None. Description: Two-story garden.
Lease Terms: 12 Months.
Comments: Unit sizes listed above based on Manager’s estimate.
Finishes / Ren: Formica counter tops counter tops, laminate plank flooring, white appliances, base molding.
83
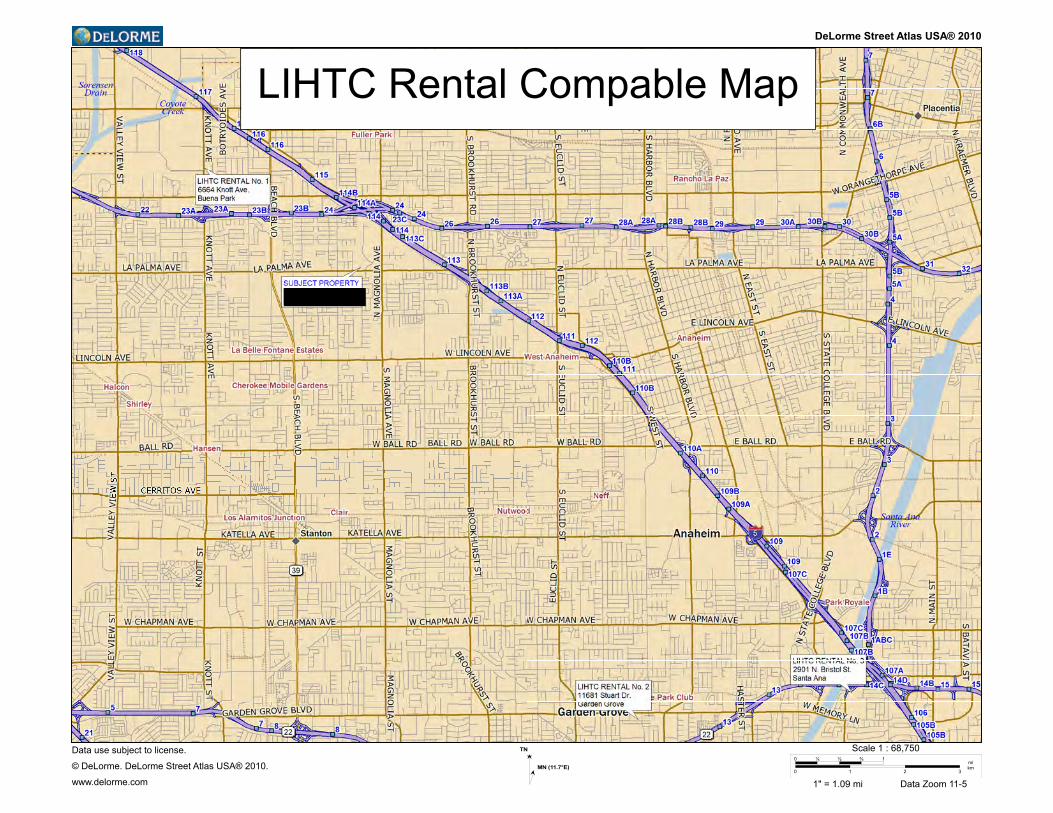
DeLorme Street Atlas USA® 2010
LIHTC Rental Compable Map
Data use subject to license.
© DeLorme. DeLorme Street Atlas USA® 2010.
www.delorme.com
TN
MN (11.7°E)
0 ¼ ½ ¾ 1
0 1 2 3
mikm
Scale 1 : 68,750
1" = 1.09 mi Data Zoom 11-5
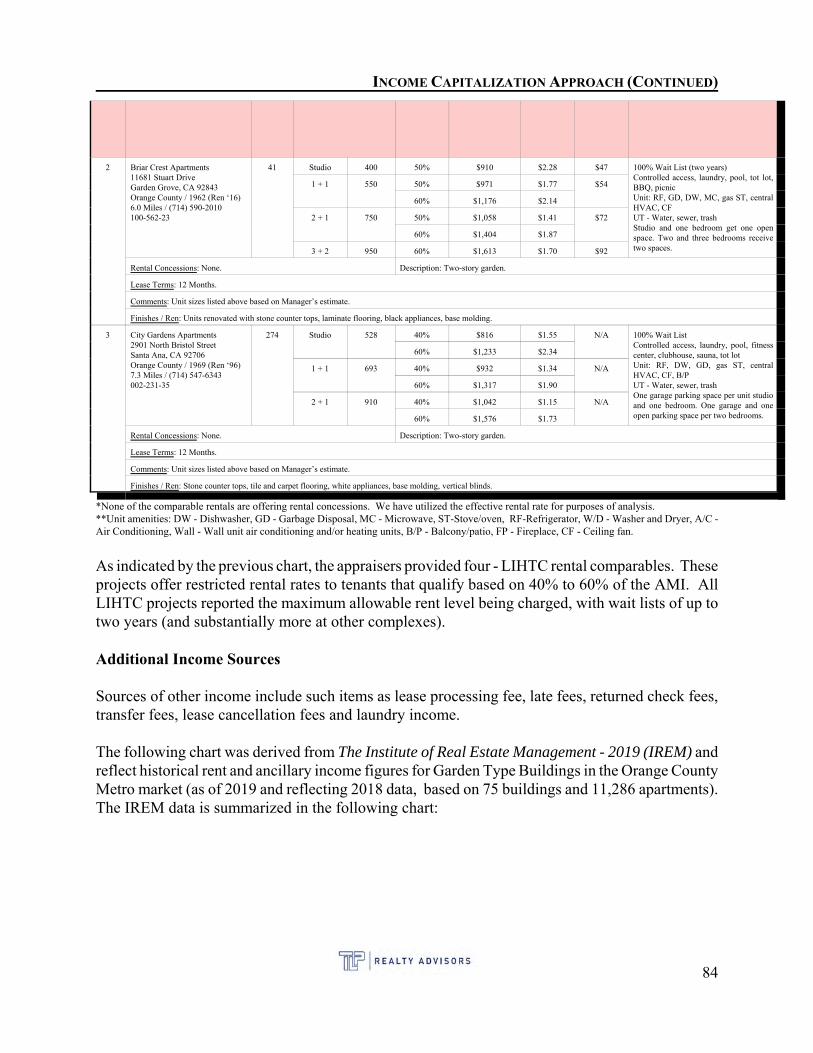
INCOME CAPITALIZATION APPROACH (CONTINUED)
2 Briar Crest Apartments11681 Stuart DriveGarden Grove, CA 92843Orange County / 1962 (Ren ‘16)6.0 Miles / (714) 590-2010100-562-23
41 Studio 400 50% $910 $2.28 $47 100% Wait List (two years)Controlled access, laundry, pool, tot lot,BBQ, picnicUnit: RF, GD, DW, MC, gas ST, centralHVAC, CFUT - Water, sewer, trashStudio and one bedroom get one openspace. Two and three bedrooms receivetwo spaces.
1 + 1 550 50% $971 $1.77 $54
60% $1,176 $2.14
2 + 1 750 50% $1,058 $1.41 $72
60% $1,404 $1.87
3 + 2 950 60% $1,613 $1.70 $92
Rental Concessions: None. Description: Two-story garden.
Lease Terms: 12 Months.
Comments: Unit sizes listed above based on Manager’s estimate.
Finishes / Ren: Units renovated with stone counter tops, laminate flooring, black appliances, base molding.
3 City Gardens Apartments2901 North Bristol StreetSanta Ana, CA 92706Orange County / 1969 (Ren ‘96)7.3 Miles / (714) 547-6343002-231-35
274 Studio 528 40% $816 $1.55 N/A 100% Wait ListControlled access, laundry, pool, fitnesscenter, clubhouse, sauna, tot lotUnit: RF, DW, GD, gas ST, centralHVAC, CF, B/PUT - Water, sewer, trash One garage parking space per unit studioand one bedroom. One garage and oneopen parking space per two bedrooms.
60% $1,233 $2.34
1 + 1 693 40% $932 $1.34 N/A
60% $1,317 $1.90
2 + 1 910 40% $1,042 $1.15 N/A
60% $1,576 $1.73
Rental Concessions: None. Description: Two-story garden.
Lease Terms: 12 Months.
Comments: Unit sizes listed above based on Manager’s estimate.
Finishes / Ren: Stone counter tops, tile and carpet flooring, white appliances, base molding, vertical blinds.
*None of the comparable rentals are offering rental concessions. We have utilized the effective rental rate for purposes of analysis.**Unit amenities: DW - Dishwasher, GD - Garbage Disposal, MC - Microwave, ST-Stove/oven, RF-Refrigerator, W/D - Washer and Dryer, A/C -Air Conditioning, Wall - Wall unit air conditioning and/or heating units, B/P - Balcony/patio, FP - Fireplace, CF - Ceiling fan.
As indicated by the previous chart, the appraisers provided four - LIHTC rental comparables. Theseprojects offer restricted rental rates to tenants that qualify based on 40% to 60% of the AMI. AllLIHTC projects reported the maximum allowable rent level being charged, with wait lists of up totwo years (and substantially more at other complexes).
Additional Income Sources
Sources of other income include such items as lease processing fee, late fees, returned check fees,transfer fees, lease cancellation fees and laundry income.
The following chart was derived from The Institute of Real Estate Management - 2019 (IREM) andreflect historical rent and ancillary income figures for Garden Type Buildings in the Orange CountyMetro market (as of 2019 and reflecting 2018 data, based on 75 buildings and 11,286 apartments). The IREM data is summarized in the following chart:
84
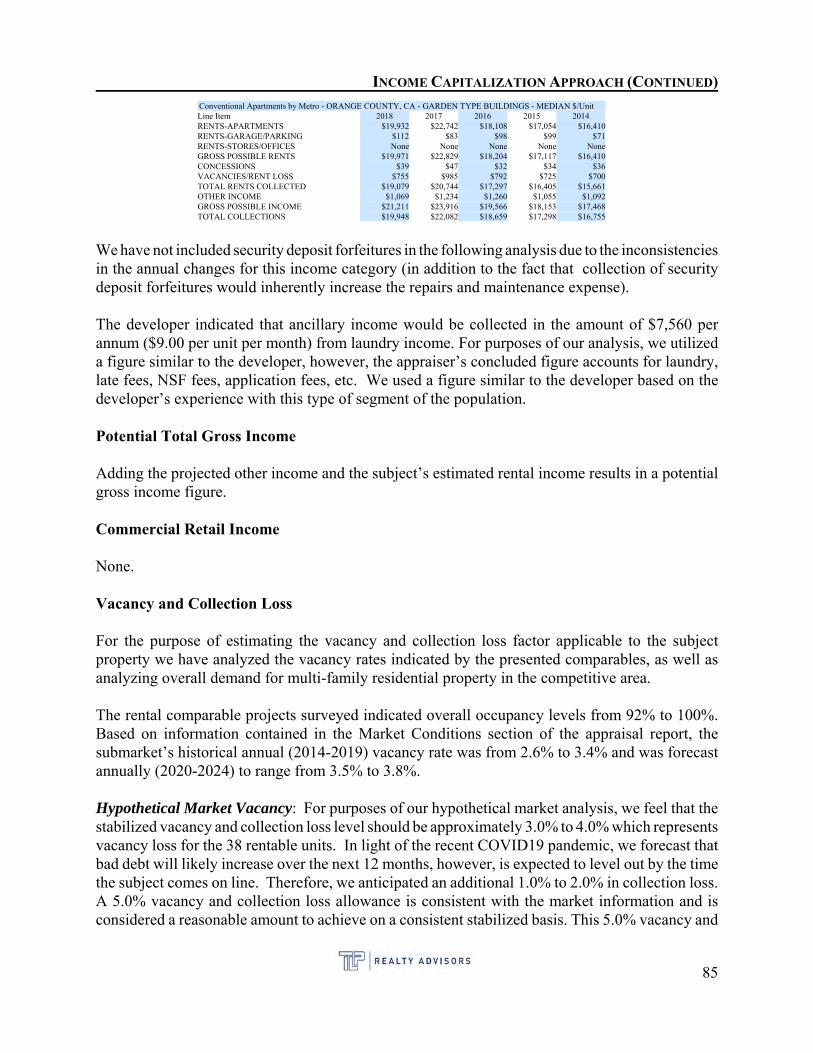
INCOME CAPITALIZATION APPROACH (CONTINUED)Conventional Apartments by Metro - ORANGE COUNTY, CA - GARDEN TYPE BUILDINGS - MEDIAN $/UnitLine Item 2018 2017 2016 2015 2014RENTS-APARTMENTS $19,932 $22,742 $18,108 $17,054 $16,410RENTS-GARAGE/PARKING $112 $83 $98 $99 $71RENTS-STORES/OFFICES None None None None NoneGROSS POSSIBLE RENTS $19,971 $22,829 $18,204 $17,117 $16,410CONCESSIONS $39 $47 $32 $34 $36VACANCIES/RENT LOSS $755 $985 $792 $725 $700TOTAL RENTS COLLECTED $19,079 $20,744 $17,297 $16,405 $15,661OTHER INCOME $1,069 $1,234 $1,260 $1,055 $1,092GROSS POSSIBLE INCOME $21,211 $23,916 $19,566 $18,153 $17,468TOTAL COLLECTIONS $19,948 $22,082 $18,659 $17,298 $16,755
We have not included security deposit forfeitures in the following analysis due to the inconsistenciesin the annual changes for this income category (in addition to the fact that collection of securitydeposit forfeitures would inherently increase the repairs and maintenance expense).
The developer indicated that ancillary income would be collected in the amount of $7,560 perannum ($9.00 per unit per month) from laundry income. For purposes of our analysis, we utilizeda figure similar to the developer, however, the appraiser’s concluded figure accounts for laundry,late fees, NSF fees, application fees, etc. We used a figure similar to the developer based on thedeveloper’s experience with this type of segment of the population.
Potential Total Gross Income
Adding the projected other income and the subject’s estimated rental income results in a potentialgross income figure.
Commercial Retail Income
None.
Vacancy and Collection Loss
For the purpose of estimating the vacancy and collection loss factor applicable to the subjectproperty we have analyzed the vacancy rates indicated by the presented comparables, as well asanalyzing overall demand for multi-family residential property in the competitive area. The rental comparable projects surveyed indicated overall occupancy levels from 92% to 100%. Based on information contained in the Market Conditions section of the appraisal report, thesubmarket’s historical annual (2014-2019) vacancy rate was from 2.6% to 3.4% and was forecastannually (2020-2024) to range from 3.5% to 3.8%.
Hypothetical Market Vacancy: For purposes of our hypothetical market analysis, we feel that thestabilized vacancy and collection loss level should be approximately 3.0% to 4.0% which representsvacancy loss for the 38 rentable units. In light of the recent COVID19 pandemic, we forecast thatbad debt will likely increase over the next 12 months, however, is expected to level out by the timethe subject comes on line. Therefore, we anticipated an additional 1.0% to 2.0% in collection loss. A 5.0% vacancy and collection loss allowance is consistent with the market information and isconsidered a reasonable amount to achieve on a consistent stabilized basis. This 5.0% vacancy and
85
INCOME CAPITALIZATION APPROACH (CONTINUED)
collection loss factor is considered to be the market oriented vacancy rate for the immediate multi-family market.
PSH Vacancy: There are a limited number of Permanent Supportive Housing (PSH) Units in theimmediate area. Based on our surveys in the surrounding areas and our discussions with developers,vacancy in projects serving the homeless population is very low. In terms of supply of PSH in thearea, most rental projects with PSH units reported 90% to 100% occupancy, low turnover andwaiting lists. However, the PSH units incur longer frictional vacancy due to the extensivequalification process. The high demand reported for special needs units is consistent with ourprevious appraisals as there is aa sever shortage of subsidized housing for this population group. IN this case, developers, equity investors and the Supportive Housing Programs have includedstabilized vacancy rates ranging from 5% to 10% in their proforma when analyzing properties forvarious reasons. Accordingly, this is considered representative of how investors are underwritingspecial needs projects. Considering the investor underwritten expectations tempered by theprojected demand and longer tenant qualification process, a projected long term stabilized vacancyrate of 7.0% of potential gross income is considered a reasonable reflection of market participantactions for special needs units. This is also similar to the subject developer’s projection of 7.0%of both tenant and subsidy rental rates (a.k.a. in line with the market).
LIHTC Vacancy: All LIHTC projects reported the maximum allowable rent level being charged,with wait lists of up to two years. Our survey shows that ample demand exists for affordablehousing in the local market, with high demand and waiting lists for most projects. The units inaffordable projects fall far enough below market and are maintained well enough to have acompetitive advantage over market rate projects. The pent-up demand for affordable units issupported by the lack of vacancy and waiting lists maintained by LIHTC projects in the area. Therefore, for purposes of our analysis, we used a 3% vacancy factor when considering the projectas an LIHTC project (no PBV).
Effective Gross Income
Effective gross income is the result of total gross income from all sources, less the vacancy andcollection allowance.
Operating Expenses
We were provided with a summarized expense budget from the developer. For purposes of ouranalysis, we reproduced the developer’s projected expenses and our concluded expenses in thefollowing chart:
86
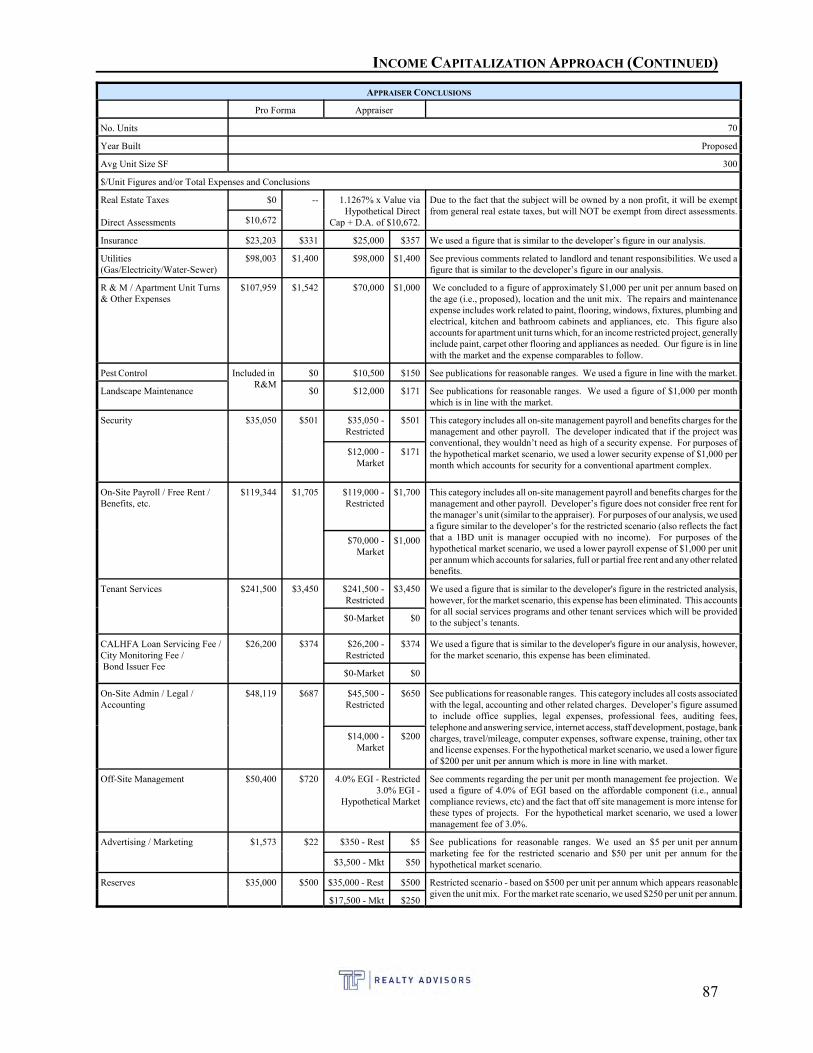
INCOME CAPITALIZATION APPROACH (CONTINUED)
APPRAISER CONCLUSIONS
Pro Forma Appraiser
No. Units 70
Year Built Proposed
Avg Unit Size SF 300
$/Unit Figures and/or Total Expenses and Conclusions
Real Estate Taxes
Direct Assessments
$0 -- 1.1267% x Value viaHypothetical Direct
Cap + D.A. of $10,672.
Due to the fact that the subject will be owned by a non profit, it will be exemptfrom general real estate taxes, but will NOT be exempt from direct assessments.
$10,672
Insurance $23,203 $331 $25,000 $357 We used a figure that is similar to the developer’s figure in our analysis.
Utilities(Gas/Electricity/Water-Sewer)
$98,003 $1,400 $98,000 $1,400 See previous comments related to landlord and tenant responsibilities. We used afigure that is similar to the developer’s figure in our analysis.
R & M / Apartment Unit Turns& Other Expenses
$107,959 $1,542 $70,000 $1,000 We concluded to a figure of approximately $1,000 per unit per annum based onthe age (i.e., proposed), location and the unit mix. The repairs and maintenanceexpense includes work related to paint, flooring, windows, fixtures, plumbing andelectrical, kitchen and bathroom cabinets and appliances, etc. This figure alsoaccounts for apartment unit turns which, for an income restricted project, generallyinclude paint, carpet other flooring and appliances as needed. Our figure is in linewith the market and the expense comparables to follow.
Pest Control Included in R&M
$0 $10,500 $150 See publications for reasonable ranges. We used a figure in line with the market.
Landscape Maintenance $0 $12,000 $171 See publications for reasonable ranges. We used a figure of $1,000 per monthwhich is in line with the market.
Security $35,050 $501 $35,050 -Restricted
$501 This category includes all on-site management payroll and benefits charges for themanagement and other payroll. The developer indicated that if the project wasconventional, they wouldn’t need as high of a security expense. For purposes ofthe hypothetical market scenario, we used a lower security expense of $1,000 permonth which accounts for security for a conventional apartment complex.
$12,000 -Market
$171
On-Site Payroll / Free Rent /Benefits, etc.
$119,344 $1,705 $119,000 -Restricted
$1,700 This category includes all on-site management payroll and benefits charges for themanagement and other payroll. Developer’s figure does not consider free rent forthe manager’s unit (similar to the appraiser). For purposes of our analysis, we useda figure similar to the developer’s for the restricted scenario (also reflects the factthat a 1BD unit is manager occupied with no income). For purposes of thehypothetical market scenario, we used a lower payroll expense of $1,000 per unitper annum which accounts for salaries, full or partial free rent and any other relatedbenefits.
$70,000 -Market
$1,000
Tenant Services $241,500 $3,450 $241,500 -Restricted
$3,450 We used a figure that is similar to the developer's figure in the restricted analysis,however, for the market scenario, this expense has been eliminated. This accountsfor all social services programs and other tenant services which will be providedto the subject’s tenants.$0-Market $0
CALHFA Loan Servicing Fee / City Monitoring Fee / Bond Issuer Fee
$26,200 $374 $26,200 -Restricted
$374 We used a figure that is similar to the developer's figure in our analysis, however,for the market scenario, this expense has been eliminated.
$0-Market $0
On-Site Admin / Legal /Accounting
$48,119 $687 $45,500 -Restricted
$650 See publications for reasonable ranges. This category includes all costs associatedwith the legal, accounting and other related charges. Developer’s figure assumedto include office supplies, legal expenses, professional fees, auditing fees,telephone and answering service, internet access, staff development, postage, bankcharges, travel/mileage, computer expenses, software expense, training, other taxand license expenses. For the hypothetical market scenario, we used a lower figureof $200 per unit per annum which is more in line with market.
$14,000 -Market
$200
Off-Site Management $50,400 $720 4.0% EGI - Restricted3.0% EGI -
Hypothetical Market
See comments regarding the per unit per month management fee projection. Weused a figure of 4.0% of EGI based on the affordable component (i.e., annualcompliance reviews, etc) and the fact that off site management is more intense forthese types of projects. For the hypothetical market scenario, we used a lowermanagement fee of 3.0%.
Advertising / Marketing $1,573 $22 $350 - Rest $5 See publications for reasonable ranges. We used an $5 per unit per annummarketing fee for the restricted scenario and $50 per unit per annum for thehypothetical market scenario.$3,500 - Mkt $50
Reserves $35,000 $500 $35,000 - Rest $500 Restricted scenario - based on $500 per unit per annum which appears reasonablegiven the unit mix. For the market rate scenario, we used $250 per unit per annum.
$17,500 - Mkt $250
87
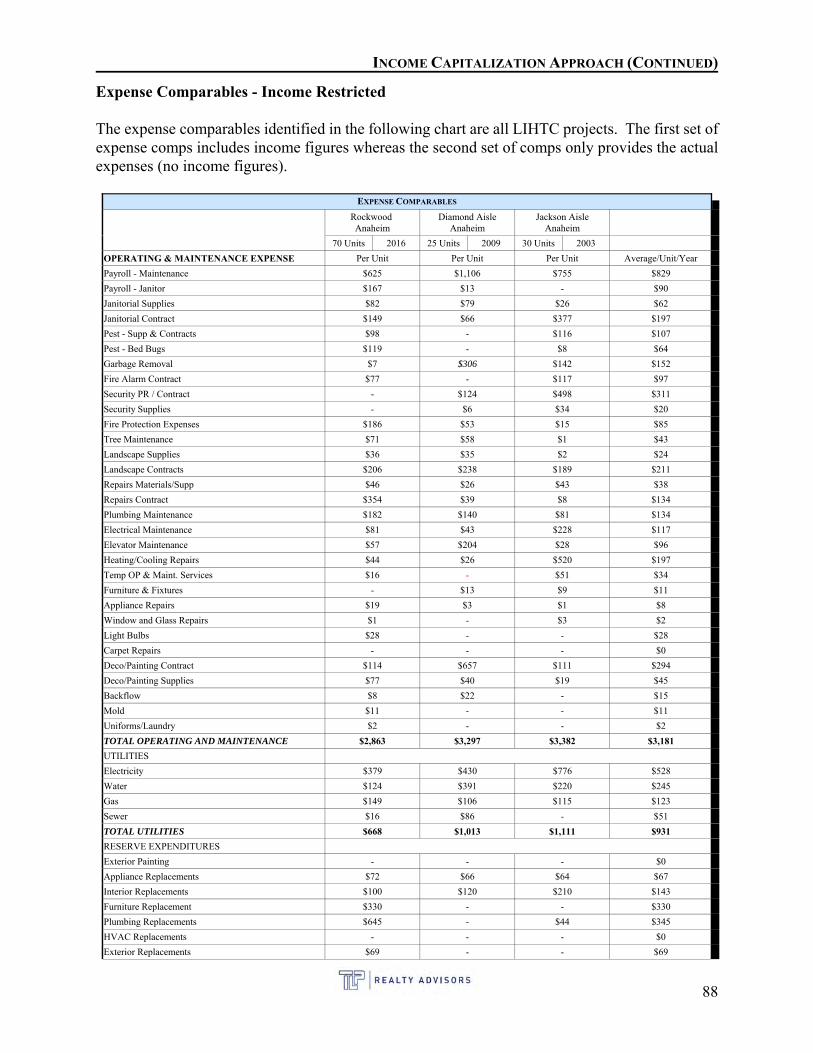
INCOME CAPITALIZATION APPROACH (CONTINUED)
Expense Comparables - Income Restricted
The expense comparables identified in the following chart are all LIHTC projects. The first set ofexpense comps includes income figures whereas the second set of comps only provides the actualexpenses (no income figures).
EXPENSE COMPARABLES
Rockwood Anaheim
Diamond AisleAnaheim
Jackson AisleAnaheim
70 Units 2016 25 Units 2009 30 Units 2003
OPERATING & MAINTENANCE EXPENSE Per Unit Per Unit Per Unit Average/Unit/Year
Payroll - Maintenance $625 $1,106 $755 $829
Payroll - Janitor $167 $13 - $90
Janitorial Supplies $82 $79 $26 $62
Janitorial Contract $149 $66 $377 $197
Pest - Supp & Contracts $98 - $116 $107
Pest - Bed Bugs $119 - $8 $64
Garbage Removal $7 $306 $142 $152
Fire Alarm Contract $77 - $117 $97
Security PR / Contract - $124 $498 $311
Security Supplies - $6 $34 $20
Fire Protection Expenses $186 $53 $15 $85
Tree Maintenance $71 $58 $1 $43
Landscape Supplies $36 $35 $2 $24
Landscape Contracts $206 $238 $189 $211
Repairs Materials/Supp $46 $26 $43 $38
Repairs Contract $354 $39 $8 $134
Plumbing Maintenance $182 $140 $81 $134
Electrical Maintenance $81 $43 $228 $117
Elevator Maintenance $57 $204 $28 $96
Heating/Cooling Repairs $44 $26 $520 $197
Temp OP & Maint. Services $16 - $51 $34
Furniture & Fixtures - $13 $9 $11
Appliance Repairs $19 $3 $1 $8
Window and Glass Repairs $1 - $3 $2
Light Bulbs $28 - - $28
Carpet Repairs - - - $0
Deco/Painting Contract $114 $657 $111 $294
Deco/Painting Supplies $77 $40 $19 $45
Backflow $8 $22 - $15
Mold $11 - - $11
Uniforms/Laundry $2 - - $2
TOTAL OPERATING AND MAINTENANCE $2,863 $3,297 $3,382 $3,181
UTILITIES
Electricity $379 $430 $776 $528
Water $124 $391 $220 $245
Gas $149 $106 $115 $123
Sewer $16 $86 - $51
TOTAL UTILITIES $668 $1,013 $1,111 $931
RESERVE EXPENDITURES
Exterior Painting - - - $0
Appliance Replacements $72 $66 $64 $67
Interior Replacements $100 $120 $210 $143
Furniture Replacement $330 - - $330
Plumbing Replacements $645 - $44 $345
HVAC Replacements - - - $0
Exterior Replacements $69 - - $69
88
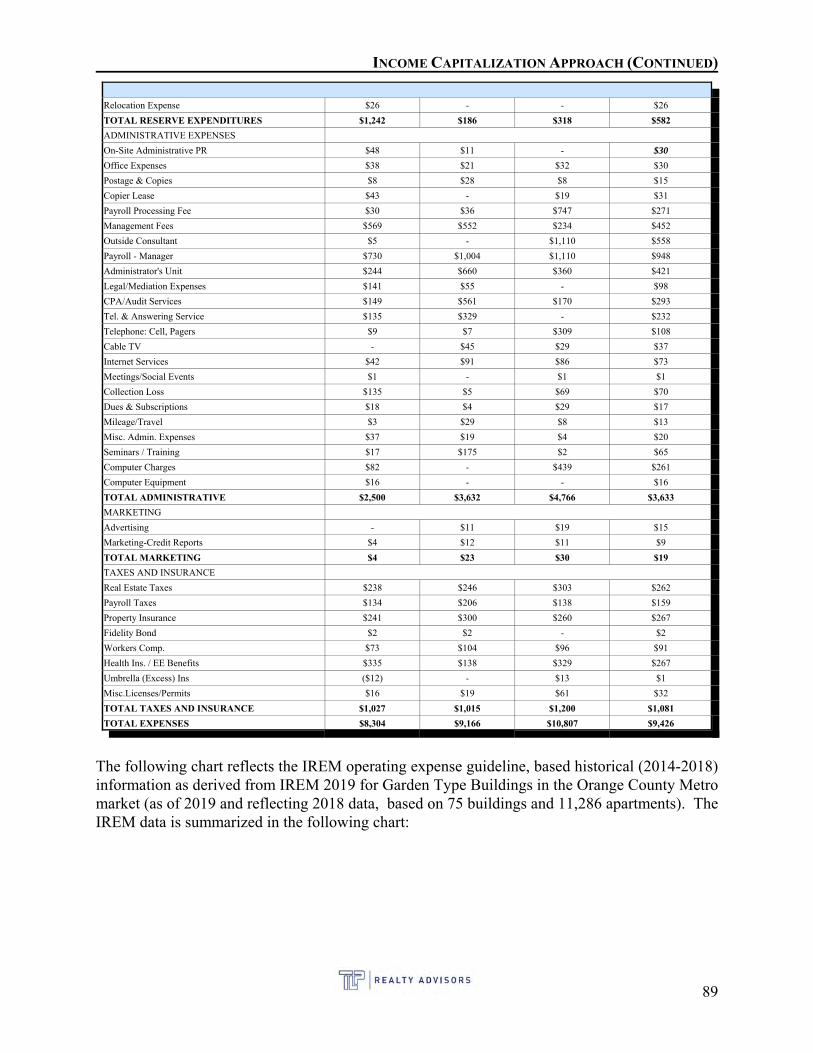
INCOME CAPITALIZATION APPROACH (CONTINUED)
Relocation Expense $26 - - $26
TOTAL RESERVE EXPENDITURES $1,242 $186 $318 $582
ADMINISTRATIVE EXPENSES
On-Site Administrative PR $48 $11 - $30
Office Expenses $38 $21 $32 $30
Postage & Copies $8 $28 $8 $15
Copier Lease $43 - $19 $31
Payroll Processing Fee $30 $36 $747 $271
Management Fees $569 $552 $234 $452
Outside Consultant $5 - $1,110 $558
Payroll - Manager $730 $1,004 $1,110 $948
Administrator's Unit $244 $660 $360 $421
Legal/Mediation Expenses $141 $55 - $98
CPA/Audit Services $149 $561 $170 $293
Tel. & Answering Service $135 $329 - $232
Telephone: Cell, Pagers $9 $7 $309 $108
Cable TV - $45 $29 $37
Internet Services $42 $91 $86 $73
Meetings/Social Events $1 - $1 $1
Collection Loss $135 $5 $69 $70
Dues & Subscriptions $18 $4 $29 $17
Mileage/Travel $3 $29 $8 $13
Misc. Admin. Expenses $37 $19 $4 $20
Seminars / Training $17 $175 $2 $65
Computer Charges $82 - $439 $261
Computer Equipment $16 - - $16
TOTAL ADMINISTRATIVE $2,500 $3,632 $4,766 $3,633
MARKETING
Advertising - $11 $19 $15
Marketing-Credit Reports $4 $12 $11 $9
TOTAL MARKETING $4 $23 $30 $19
TAXES AND INSURANCE
Real Estate Taxes $238 $246 $303 $262
Payroll Taxes $134 $206 $138 $159
Property Insurance $241 $300 $260 $267
Fidelity Bond $2 $2 - $2
Workers Comp. $73 $104 $96 $91
Health Ins. / EE Benefits $335 $138 $329 $267
Umbrella (Excess) Ins ($12) - $13 $1
Misc.Licenses/Permits $16 $19 $61 $32
TOTAL TAXES AND INSURANCE $1,027 $1,015 $1,200 $1,081
TOTAL EXPENSES $8,304 $9,166 $10,807 $9,426
The following chart reflects the IREM operating expense guideline, based historical (2014-2018)information as derived from IREM 2019 for Garden Type Buildings in the Orange County Metromarket (as of 2019 and reflecting 2018 data, based on 75 buildings and 11,286 apartments). TheIREM data is summarized in the following chart:
89
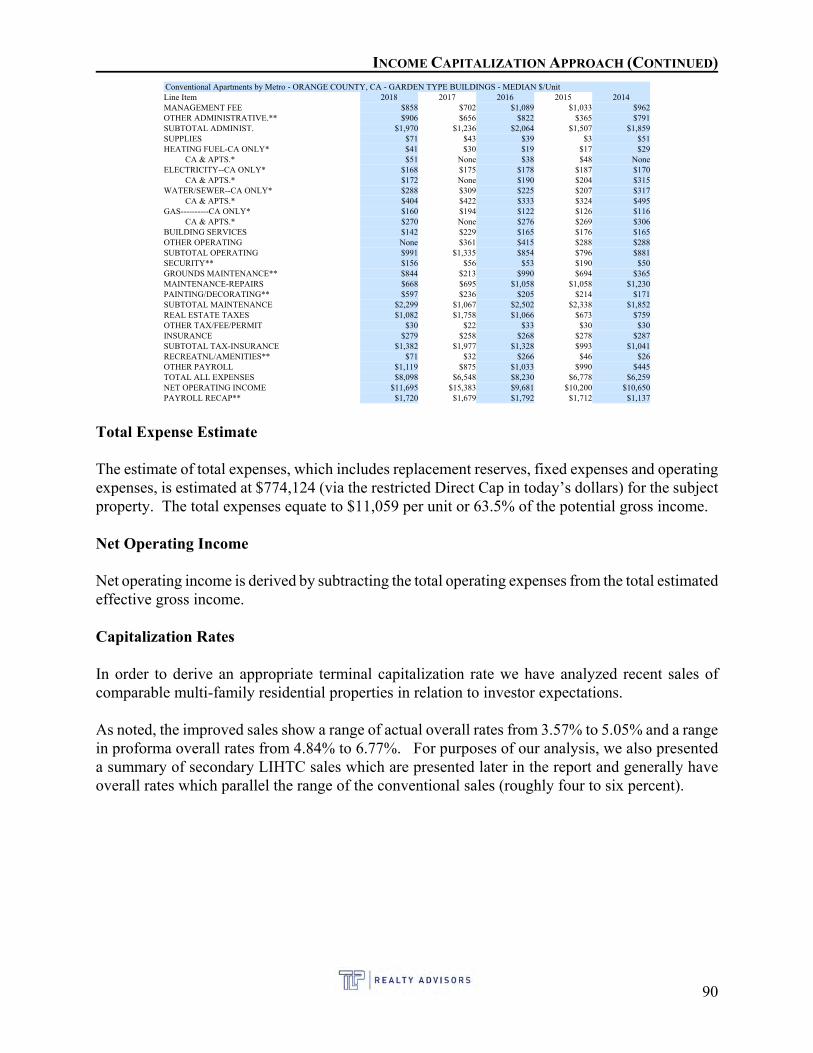
INCOME CAPITALIZATION APPROACH (CONTINUED)Conventional Apartments by Metro - ORANGE COUNTY, CA - GARDEN TYPE BUILDINGS - MEDIAN $/UnitLine Item 2018 2017 2016 2015 2014MANAGEMENT FEE $858 $702 $1,089 $1,033 $962OTHER ADMINISTRATIVE.** $906 $656 $822 $365 $791SUBTOTAL ADMINIST. $1,970 $1,236 $2,064 $1,507 $1,859SUPPLIES $71 $43 $39 $3 $51HEATING FUEL-CA ONLY* $41 $30 $19 $17 $29 CA & APTS.* $51 None $38 $48 NoneELECTRICITY--CA ONLY* $168 $175 $178 $187 $170 CA & APTS.* $172 None $190 $204 $315WATER/SEWER--CA ONLY* $288 $309 $225 $207 $317 CA & APTS.* $404 $422 $333 $324 $495GAS----------CA ONLY* $160 $194 $122 $126 $116 CA & APTS.* $270 None $276 $269 $306BUILDING SERVICES $142 $229 $165 $176 $165OTHER OPERATING None $361 $415 $288 $288SUBTOTAL OPERATING $991 $1,335 $854 $796 $881SECURITY** $156 $56 $53 $190 $50GROUNDS MAINTENANCE** $844 $213 $990 $694 $365MAINTENANCE-REPAIRS $668 $695 $1,058 $1,058 $1,230PAINTING/DECORATING** $597 $236 $205 $214 $171SUBTOTAL MAINTENANCE $2,299 $1,067 $2,502 $2,338 $1,852REAL ESTATE TAXES $1,082 $1,758 $1,066 $673 $759OTHER TAX/FEE/PERMIT $30 $22 $33 $30 $30INSURANCE $279 $258 $268 $278 $287SUBTOTAL TAX-INSURANCE $1,382 $1,977 $1,328 $993 $1,041RECREATNL/AMENITIES** $71 $32 $266 $46 $26OTHER PAYROLL $1,119 $875 $1,033 $990 $445TOTAL ALL EXPENSES $8,098 $6,548 $8,230 $6,778 $6,259NET OPERATING INCOME $11,695 $15,383 $9,681 $10,200 $10,650PAYROLL RECAP** $1,720 $1,679 $1,792 $1,712 $1,137
Total Expense Estimate
The estimate of total expenses, which includes replacement reserves, fixed expenses and operatingexpenses, is estimated at $774,124 (via the restricted Direct Cap in today’s dollars) for the subjectproperty. The total expenses equate to $11,059 per unit or 63.5% of the potential gross income.
Net Operating Income
Net operating income is derived by subtracting the total operating expenses from the total estimatedeffective gross income.
Capitalization Rates
In order to derive an appropriate terminal capitalization rate we have analyzed recent sales ofcomparable multi-family residential properties in relation to investor expectations.
As noted, the improved sales show a range of actual overall rates from 3.57% to 5.05% and a rangein proforma overall rates from 4.84% to 6.77%. For purposes of our analysis, we also presenteda summary of secondary LIHTC sales which are presented later in the report and generally haveoverall rates which parallel the range of the conventional sales (roughly four to six percent).
90
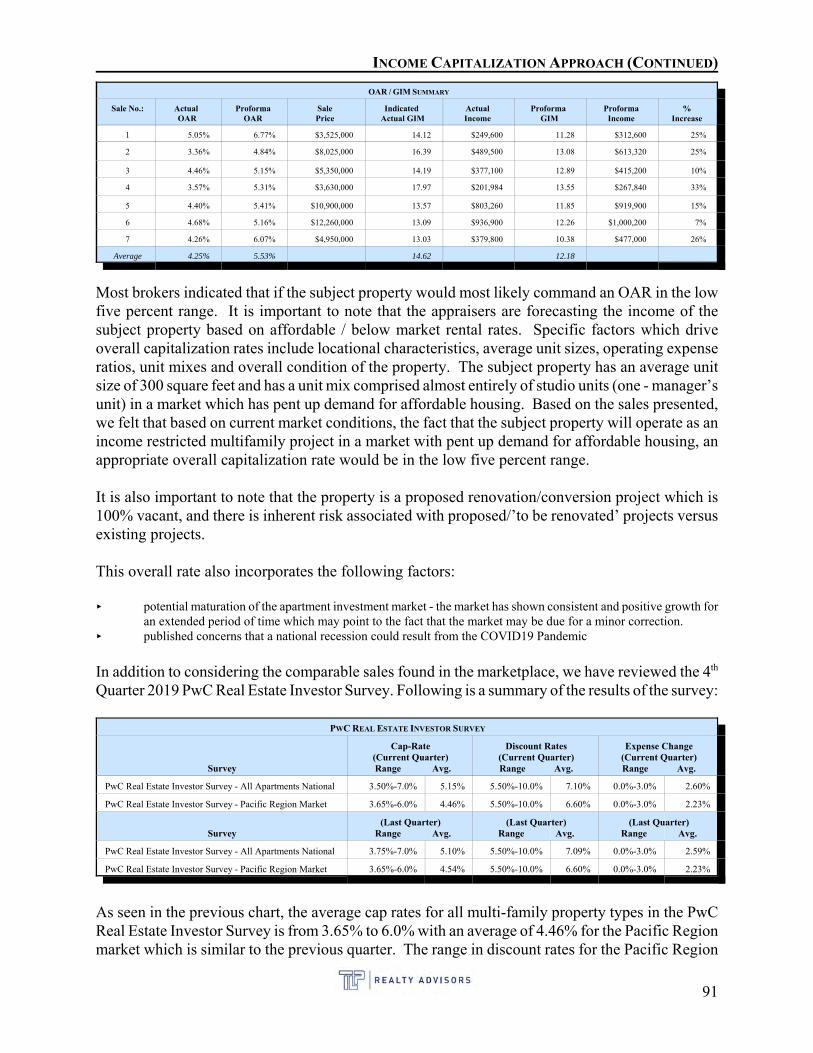
INCOME CAPITALIZATION APPROACH (CONTINUED)
OAR / GIM SUMMARY
Sale No.: Actual OAR
ProformaOAR
SalePrice
Indicated Actual GIM
ActualIncome
Proforma GIM
ProformaIncome
%Increase
1 5.05% 6.77% $3,525,000 14.12 $249,600 11.28 $312,600 25%
2 3.36% 4.84% $8,025,000 16.39 $489,500 13.08 $613,320 25%
3 4.46% 5.15% $5,350,000 14.19 $377,100 12.89 $415,200 10%
4 3.57% 5.31% $3,630,000 17.97 $201,984 13.55 $267,840 33%
5 4.40% 5.41% $10,900,000 13.57 $803,260 11.85 $919,900 15%
6 4.68% 5.16% $12,260,000 13.09 $936,900 12.26 $1,000,200 7%
7 4.26% 6.07% $4,950,000 13.03 $379,800 10.38 $477,000 26%
Average 4.25% 5.53% 14.62 12.18
Most brokers indicated that if the subject property would most likely command an OAR in the lowfive percent range. It is important to note that the appraisers are forecasting the income of thesubject property based on affordable / below market rental rates. Specific factors which driveoverall capitalization rates include locational characteristics, average unit sizes, operating expenseratios, unit mixes and overall condition of the property. The subject property has an average unitsize of 300 square feet and has a unit mix comprised almost entirely of studio units (one - manager’sunit) in a market which has pent up demand for affordable housing. Based on the sales presented,we felt that based on current market conditions, the fact that the subject property will operate as anincome restricted multifamily project in a market with pent up demand for affordable housing, anappropriate overall capitalization rate would be in the low five percent range. It is also important to note that the property is a proposed renovation/conversion project which is100% vacant, and there is inherent risk associated with proposed/’to be renovated’ projects versusexisting projects.
This overall rate also incorporates the following factors:
< potential maturation of the apartment investment market - the market has shown consistent and positive growth foran extended period of time which may point to the fact that the market may be due for a minor correction.
< published concerns that a national recession could result from the COVID19 Pandemic
In addition to considering the comparable sales found in the marketplace, we have reviewed the 4th
Quarter 2019 PwC Real Estate Investor Survey. Following is a summary of the results of the survey:
PWC REAL ESTATE INVESTOR SURVEY
Survey
Cap-Rate(Current Quarter)
Range Avg.
Discount Rates(Current Quarter)Range Avg.
Expense Change(Current Quarter)Range Avg.
PwC Real Estate Investor Survey - All Apartments National 3.50%-7.0% 5.15% 5.50%-10.0% 7.10% 0.0%-3.0% 2.60%
PwC Real Estate Investor Survey - Pacific Region Market 3.65%-6.0% 4.46% 5.50%-10.0% 6.60% 0.0%-3.0% 2.23%
Survey(Last Quarter)
Range Avg.(Last Quarter)
Range Avg.(Last Quarter)
Range Avg.
PwC Real Estate Investor Survey - All Apartments National 3.75%-7.0% 5.10% 5.50%-10.0% 7.09% 0.0%-3.0% 2.59%
PwC Real Estate Investor Survey - Pacific Region Market 3.65%-6.0% 4.54% 5.50%-10.0% 6.60% 0.0%-3.0% 2.23%
As seen in the previous chart, the average cap rates for all multi-family property types in the PwCReal Estate Investor Survey is from 3.65% to 6.0% with an average of 4.46% for the Pacific Regionmarket which is similar to the previous quarter. The range in discount rates for the Pacific Region
91
INCOME CAPITALIZATION APPROACH (CONTINUED)
Market is from 5.50% to 10.0% with an average of 6.60% which is also relatively similar to theprevious quarter. Overall, the published data is felt to provide an adequate range of rates. However,the surveys fail to specify exact areas of investment, which is felt to be better supported by the actualcomparables presented earlier.
After a physical inspection of the subject property and the market data, an overall capitalization rateof 5.0% is considered appropriate for the following reasons:
C This rate is well justified as it is bracketed within the range of capitalization rates for similar properties.C The persons interviewed in the verification process generally stated, that while there are fluctuations in the market
data, this capitalization rate is considered a rate typical to the market, and supported by the market.C The subject property will be (upon completion) a good quality apartment complex.C The subject property has good access and proximity to employment centers and retail facilities.C The subject property is located within an area of excellent demand for the proposed type of affordable housing
facility proposed for the site, as evidenced by the occupancy levels of the rental comparables and our discussionsin the market.
C The subject property represents a proposed/renovation development.
Direct Capitalization‘PMVSO - With Rent Restrictions / No Trending / No Subsidies’
PMVSO: This value scenario was provided in order to model the value assuming the PBV programwas eliminated. For this particular scenario, we have not incorporated trending nor have weconsidered any PBV ‘aka subsidies’ were available. In this case, we relied on the maximumallowable rental rates at 60% AMI (as established by the restrictions via the County/CalFARegulatory Agreements), or $1,246 per month.
92
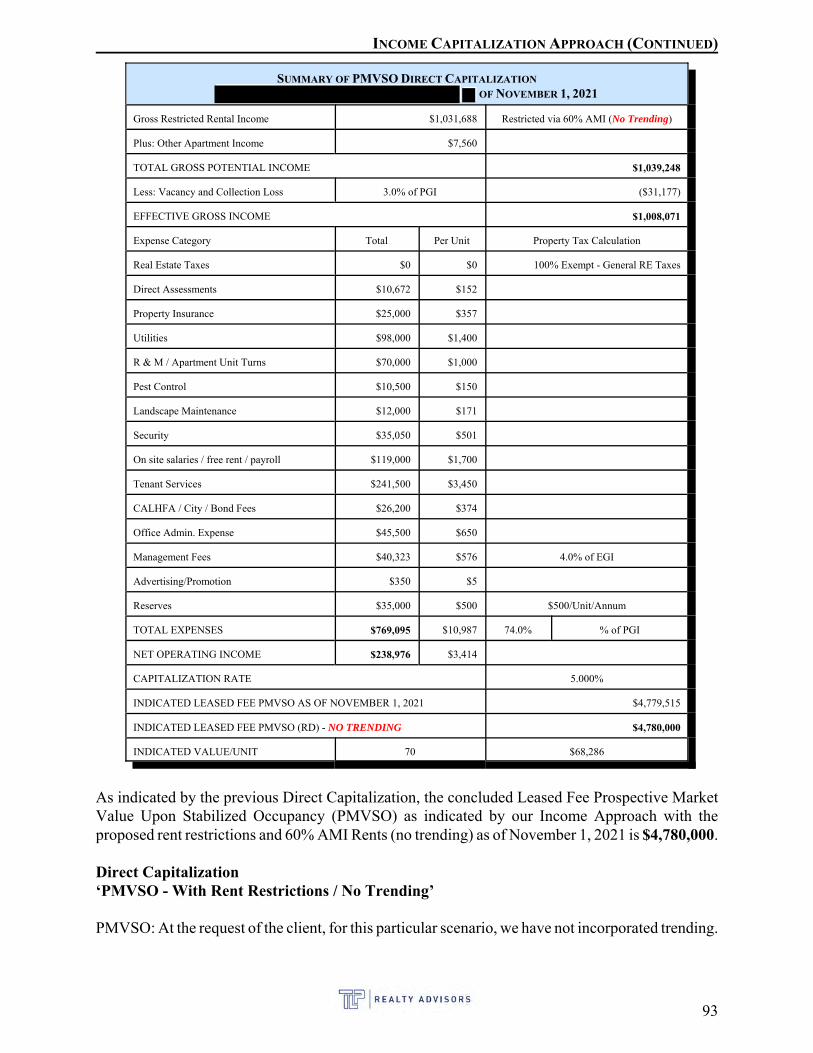
INCOME CAPITALIZATION APPROACH (CONTINUED)
SUMMARY OF PMVSO DIRECT CAPITALIZATION
OF NOVEMBER 1, 2021
Gross Restricted Rental Income $1,031,688 Restricted via 60% AMI (No Trending)
Plus: Other Apartment Income $7,560
TOTAL GROSS POTENTIAL INCOME $1,039,248
Less: Vacancy and Collection Loss 3.0% of PGI ($31,177)
EFFECTIVE GROSS INCOME $1,008,071
Expense Category Total Per Unit Property Tax Calculation
Real Estate Taxes $0 $0 100% Exempt - General RE Taxes
Direct Assessments $10,672 $152
Property Insurance $25,000 $357
Utilities $98,000 $1,400
R & M / Apartment Unit Turns $70,000 $1,000
Pest Control $10,500 $150
Landscape Maintenance $12,000 $171
Security $35,050 $501
On site salaries / free rent / payroll $119,000 $1,700
Tenant Services $241,500 $3,450
CALHFA / City / Bond Fees $26,200 $374
Office Admin. Expense $45,500 $650
Management Fees $40,323 $576 4.0% of EGI
Advertising/Promotion $350 $5
Reserves $35,000 $500 $500/Unit/Annum
TOTAL EXPENSES $769,095 $10,987 74.0% % of PGI
NET OPERATING INCOME $238,976 $3,414
CAPITALIZATION RATE 5.000%
INDICATED LEASED FEE PMVSO AS OF NOVEMBER 1, 2021 $4,779,515
INDICATED LEASED FEE PMVSO (RD) - NO TRENDING $4,780,000
INDICATED VALUE/UNIT 70 $68,286
As indicated by the previous Direct Capitalization, the concluded Leased Fee Prospective MarketValue Upon Stabilized Occupancy (PMVSO) as indicated by our Income Approach with theproposed rent restrictions and 60% AMI Rents (no trending) as of November 1, 2021 is $4,780,000.
Direct Capitalization‘PMVSO - With Rent Restrictions / No Trending’
PMVSO: At the request of the client, for this particular scenario, we have not incorporated trending.
93
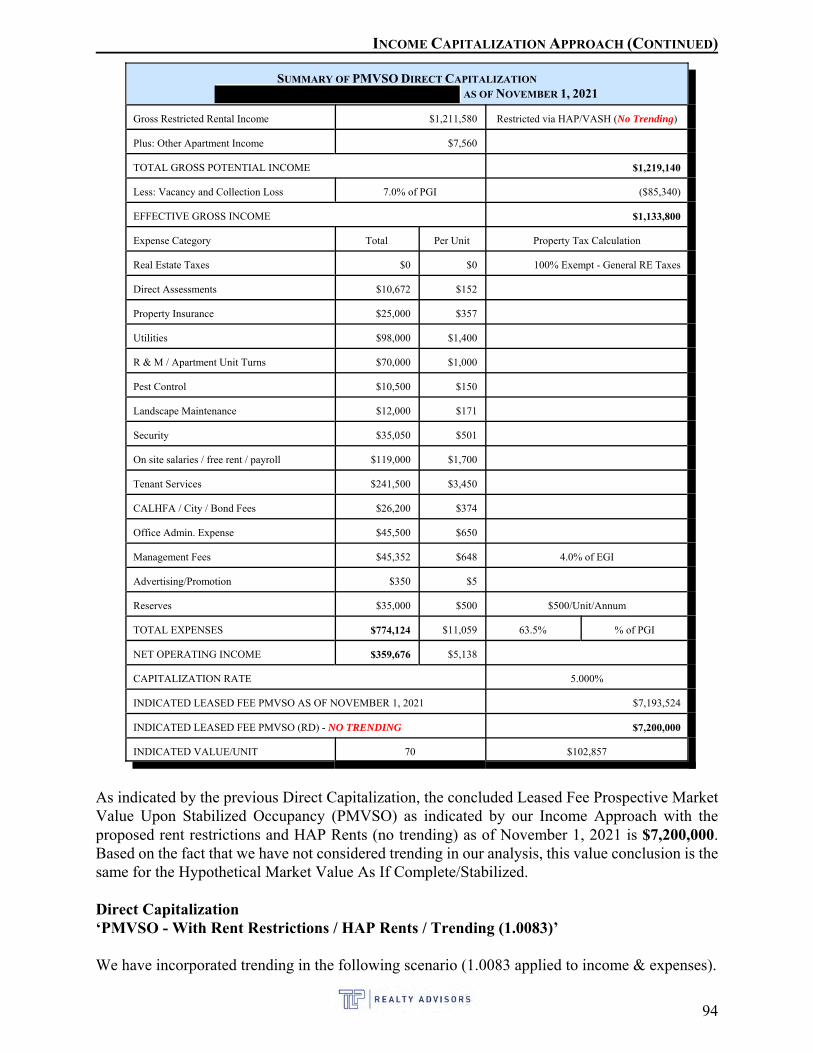
INCOME CAPITALIZATION APPROACH (CONTINUED)
SUMMARY OF PMVSO DIRECT CAPITALIZATION
AS OF NOVEMBER 1, 2021
Gross Restricted Rental Income $1,211,580 Restricted via HAP/VASH (No Trending)
Plus: Other Apartment Income $7,560
TOTAL GROSS POTENTIAL INCOME $1,219,140
Less: Vacancy and Collection Loss 7.0% of PGI ($85,340)
EFFECTIVE GROSS INCOME $1,133,800
Expense Category Total Per Unit Property Tax Calculation
Real Estate Taxes $0 $0 100% Exempt - General RE Taxes
Direct Assessments $10,672 $152
Property Insurance $25,000 $357
Utilities $98,000 $1,400
R & M / Apartment Unit Turns $70,000 $1,000
Pest Control $10,500 $150
Landscape Maintenance $12,000 $171
Security $35,050 $501
On site salaries / free rent / payroll $119,000 $1,700
Tenant Services $241,500 $3,450
CALHFA / City / Bond Fees $26,200 $374
Office Admin. Expense $45,500 $650
Management Fees $45,352 $648 4.0% of EGI
Advertising/Promotion $350 $5
Reserves $35,000 $500 $500/Unit/Annum
TOTAL EXPENSES $774,124 $11,059 63.5% % of PGI
NET OPERATING INCOME $359,676 $5,138
CAPITALIZATION RATE 5.000%
INDICATED LEASED FEE PMVSO AS OF NOVEMBER 1, 2021 $7,193,524
INDICATED LEASED FEE PMVSO (RD) - NO TRENDING $7,200,000
INDICATED VALUE/UNIT 70 $102,857
As indicated by the previous Direct Capitalization, the concluded Leased Fee Prospective MarketValue Upon Stabilized Occupancy (PMVSO) as indicated by our Income Approach with theproposed rent restrictions and HAP Rents (no trending) as of November 1, 2021 is $7,200,000. Based on the fact that we have not considered trending in our analysis, this value conclusion is thesame for the Hypothetical Market Value As If Complete/Stabilized.
Direct Capitalization‘PMVSO - With Rent Restrictions / HAP Rents / Trending (1.0083)’
We have incorporated trending in the following scenario (1.0083 applied to income & expenses).
94
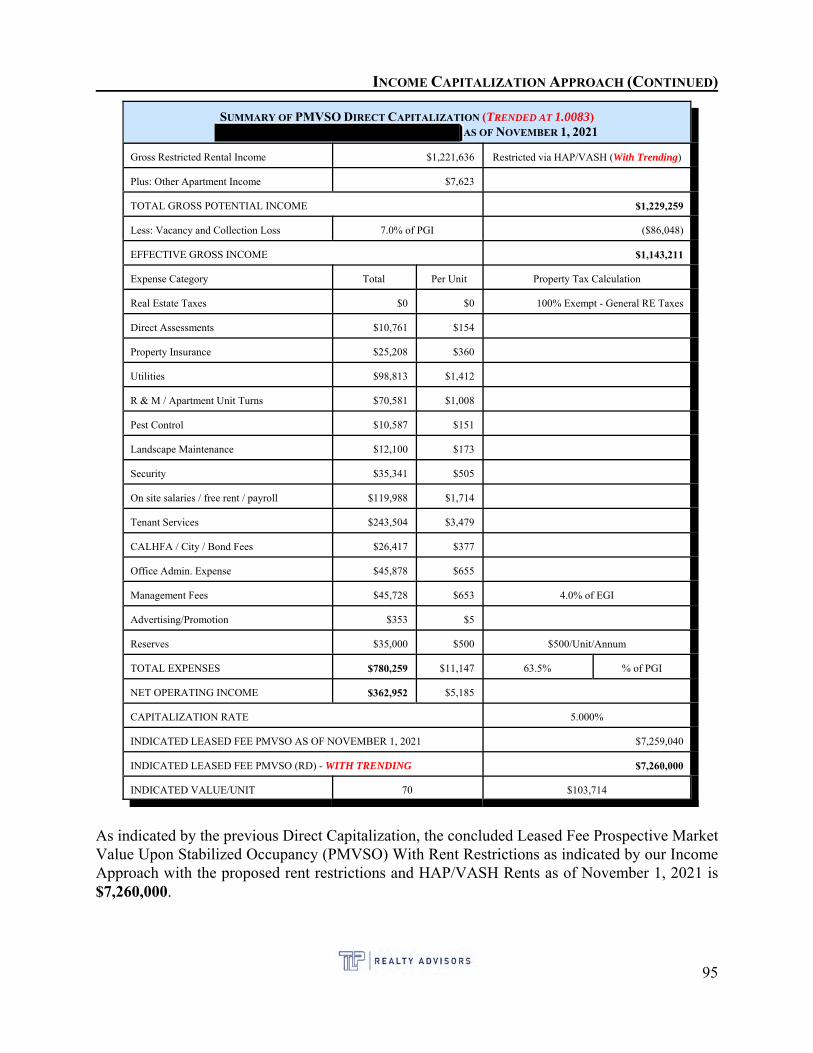
INCOME CAPITALIZATION APPROACH (CONTINUED)
SUMMARY OF PMVSO DIRECT CAPITALIZATION (TRENDED AT 1.0083)AS OF NOVEMBER 1, 2021
Gross Restricted Rental Income $1,221,636 Restricted via HAP/VASH (With Trending)
Plus: Other Apartment Income $7,623
TOTAL GROSS POTENTIAL INCOME $1,229,259
Less: Vacancy and Collection Loss 7.0% of PGI ($86,048)
EFFECTIVE GROSS INCOME $1,143,211
Expense Category Total Per Unit Property Tax Calculation
Real Estate Taxes $0 $0 100% Exempt - General RE Taxes
Direct Assessments $10,761 $154
Property Insurance $25,208 $360
Utilities $98,813 $1,412
R & M / Apartment Unit Turns $70,581 $1,008
Pest Control $10,587 $151
Landscape Maintenance $12,100 $173
Security $35,341 $505
On site salaries / free rent / payroll $119,988 $1,714
Tenant Services $243,504 $3,479
CALHFA / City / Bond Fees $26,417 $377
Office Admin. Expense $45,878 $655
Management Fees $45,728 $653 4.0% of EGI
Advertising/Promotion $353 $5
Reserves $35,000 $500 $500/Unit/Annum
TOTAL EXPENSES $780,259 $11,147 63.5% % of PGI
NET OPERATING INCOME $362,952 $5,185
CAPITALIZATION RATE 5.000%
INDICATED LEASED FEE PMVSO AS OF NOVEMBER 1, 2021 $7,259,040
INDICATED LEASED FEE PMVSO (RD) - WITH TRENDING $7,260,000
INDICATED VALUE/UNIT 70 $103,714
As indicated by the previous Direct Capitalization, the concluded Leased Fee Prospective MarketValue Upon Stabilized Occupancy (PMVSO) With Rent Restrictions as indicated by our IncomeApproach with the proposed rent restrictions and HAP/VASH Rents as of November 1, 2021 is$7,260,000.
95
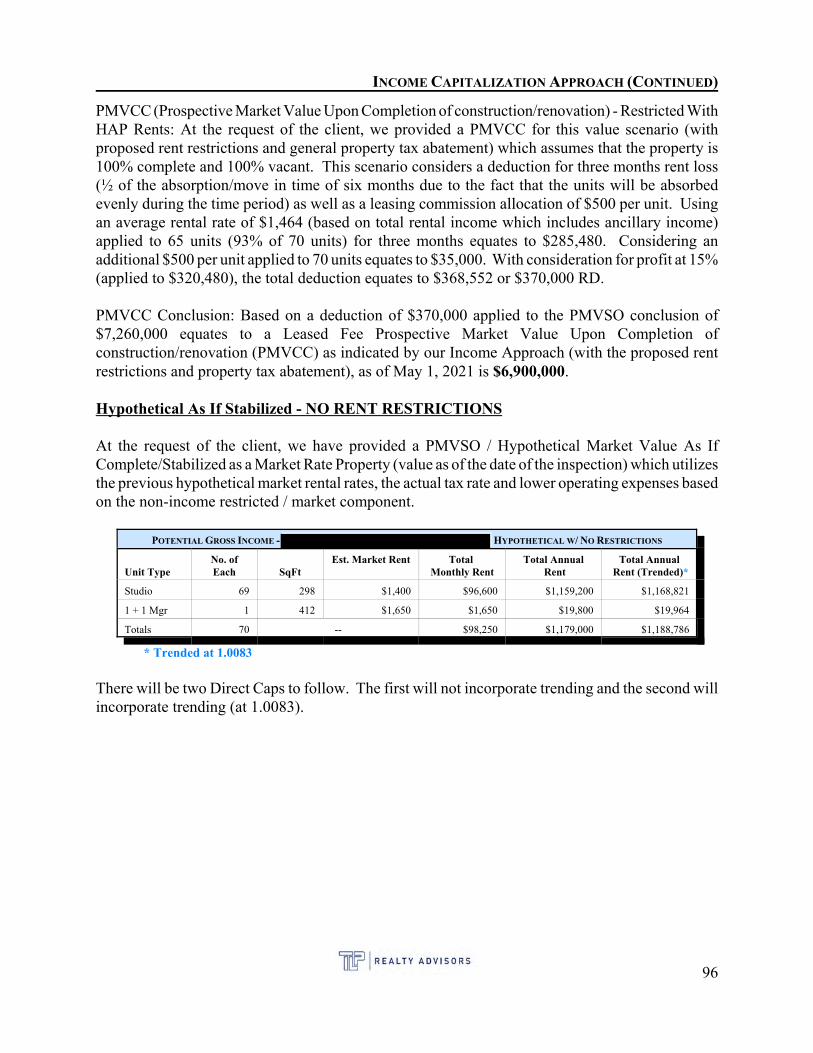
INCOME CAPITALIZATION APPROACH (CONTINUED)
PMVCC (Prospective Market Value Upon Completion of construction/renovation) - Restricted WithHAP Rents: At the request of the client, we provided a PMVCC for this value scenario (withproposed rent restrictions and general property tax abatement) which assumes that the property is100% complete and 100% vacant. This scenario considers a deduction for three months rent loss(½ of the absorption/move in time of six months due to the fact that the units will be absorbedevenly during the time period) as well as a leasing commission allocation of $500 per unit. Usingan average rental rate of $1,464 (based on total rental income which includes ancillary income)applied to 65 units (93% of 70 units) for three months equates to $285,480. Considering anadditional $500 per unit applied to 70 units equates to $35,000. With consideration for profit at 15%(applied to $320,480), the total deduction equates to $368,552 or $370,000 RD.
PMVCC Conclusion: Based on a deduction of $370,000 applied to the PMVSO conclusion of$7,260,000 equates to a Leased Fee Prospective Market Value Upon Completion ofconstruction/renovation (PMVCC) as indicated by our Income Approach (with the proposed rentrestrictions and property tax abatement), as of May 1, 2021 is $6,900,000.
Hypothetical As If Stabilized - NO RENT RESTRICTIONS
At the request of the client, we have provided a PMVSO / Hypothetical Market Value As IfComplete/Stabilized as a Market Rate Property (value as of the date of the inspection) which utilizesthe previous hypothetical market rental rates, the actual tax rate and lower operating expenses basedon the non-income restricted / market component.
POTENTIAL GROSS INCOME - HYPOTHETICAL W/ NO RESTRICTIONS
Unit TypeNo. ofEach SqFt
Est. Market Rent Total Monthly Rent
Total Annual Rent
Total Annual Rent (Trended)*
Studio 69 298 $1,400 $96,600 $1,159,200 $1,168,821
1 + 1 Mgr 1 412 $1,650 $1,650 $19,800 $19,964
Totals 70 -- $98,250 $1,179,000 $1,188,786
* Trended at 1.0083
There will be two Direct Caps to follow. The first will not incorporate trending and the second willincorporate trending (at 1.0083).
96
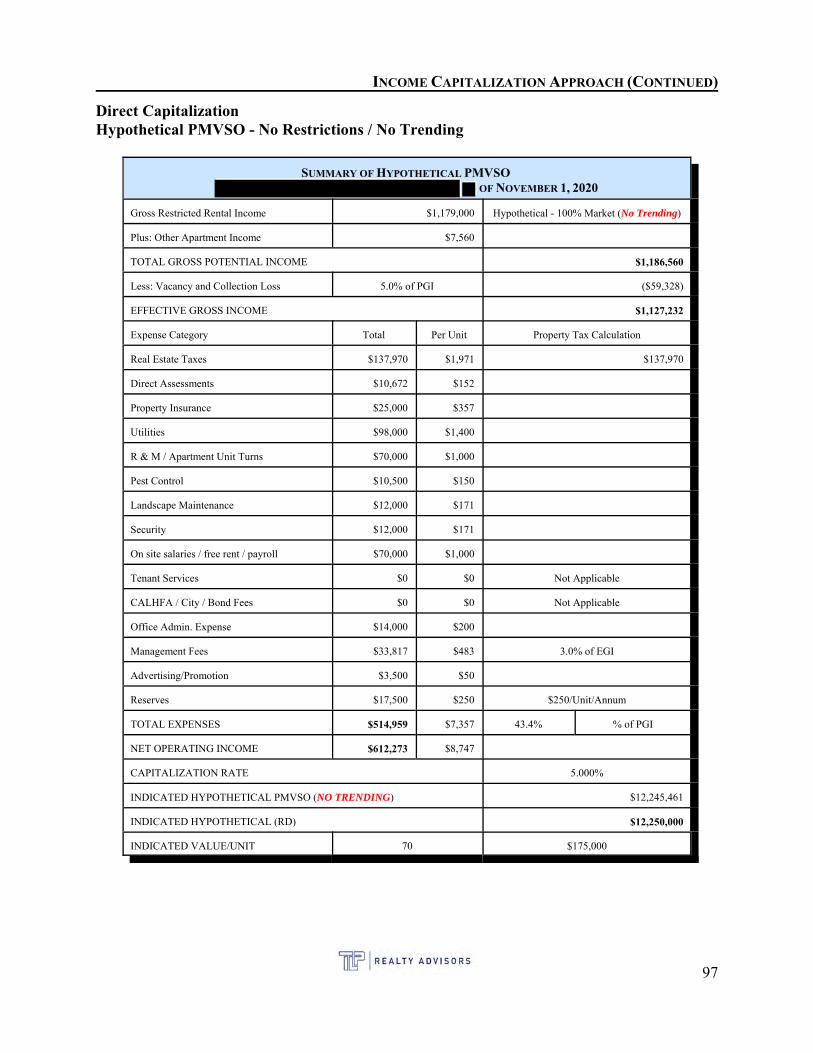
INCOME CAPITALIZATION APPROACH (CONTINUED)
Direct Capitalization Hypothetical PMVSO - No Restrictions / No Trending
SUMMARY OF HYPOTHETICAL PMVSO
OF NOVEMBER 1, 2020
Gross Restricted Rental Income $1,179,000 Hypothetical - 100% Market (No Trending)
Plus: Other Apartment Income $7,560
TOTAL GROSS POTENTIAL INCOME $1,186,560
Less: Vacancy and Collection Loss 5.0% of PGI ($59,328)
EFFECTIVE GROSS INCOME $1,127,232
Expense Category Total Per Unit Property Tax Calculation
Real Estate Taxes $137,970 $1,971 $137,970
Direct Assessments $10,672 $152
Property Insurance $25,000 $357
Utilities $98,000 $1,400
R & M / Apartment Unit Turns $70,000 $1,000
Pest Control $10,500 $150
Landscape Maintenance $12,000 $171
Security $12,000 $171
On site salaries / free rent / payroll $70,000 $1,000
Tenant Services $0 $0 Not Applicable
CALHFA / City / Bond Fees $0 $0 Not Applicable
Office Admin. Expense $14,000 $200
Management Fees $33,817 $483 3.0% of EGI
Advertising/Promotion $3,500 $50
Reserves $17,500 $250 $250/Unit/Annum
TOTAL EXPENSES $514,959 $7,357 43.4% % of PGI
NET OPERATING INCOME $612,273 $8,747
CAPITALIZATION RATE 5.000%
INDICATED HYPOTHETICAL PMVSO (NO TRENDING) $12,245,461
INDICATED HYPOTHETICAL (RD) $12,250,000
INDICATED VALUE/UNIT 70 $175,000
97
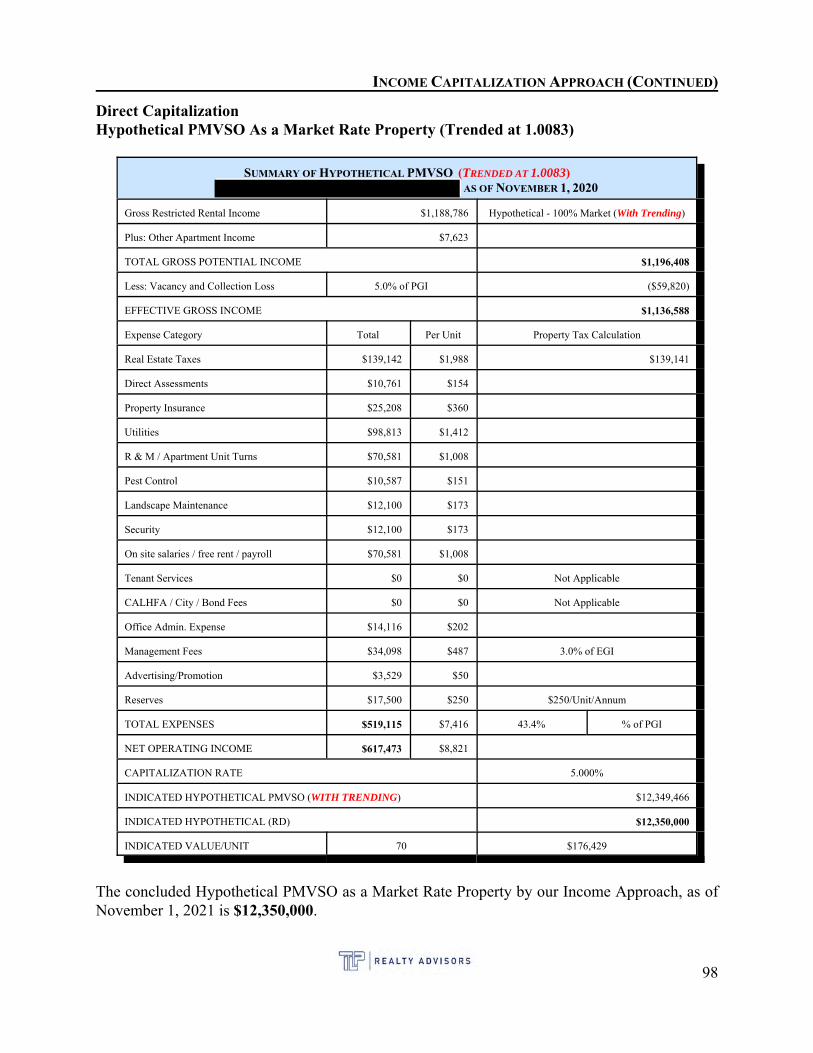
INCOME CAPITALIZATION APPROACH (CONTINUED)
Direct Capitalization Hypothetical PMVSO As a Market Rate Property (Trended at 1.0083)
SUMMARY OF HYPOTHETICAL PMVSO (TRENDED AT 1.0083) AS OF NOVEMBER 1, 2020
Gross Restricted Rental Income $1,188,786 Hypothetical - 100% Market (With Trending)
Plus: Other Apartment Income $7,623
TOTAL GROSS POTENTIAL INCOME $1,196,408
Less: Vacancy and Collection Loss 5.0% of PGI ($59,820)
EFFECTIVE GROSS INCOME $1,136,588
Expense Category Total Per Unit Property Tax Calculation
Real Estate Taxes $139,142 $1,988 $139,141
Direct Assessments $10,761 $154
Property Insurance $25,208 $360
Utilities $98,813 $1,412
R & M / Apartment Unit Turns $70,581 $1,008
Pest Control $10,587 $151
Landscape Maintenance $12,100 $173
Security $12,100 $173
On site salaries / free rent / payroll $70,581 $1,008
Tenant Services $0 $0 Not Applicable
CALHFA / City / Bond Fees $0 $0 Not Applicable
Office Admin. Expense $14,116 $202
Management Fees $34,098 $487 3.0% of EGI
Advertising/Promotion $3,529 $50
Reserves $17,500 $250 $250/Unit/Annum
TOTAL EXPENSES $519,115 $7,416 43.4% % of PGI
NET OPERATING INCOME $617,473 $8,821
CAPITALIZATION RATE 5.000%
INDICATED HYPOTHETICAL PMVSO (WITH TRENDING) $12,349,466
INDICATED HYPOTHETICAL (RD) $12,350,000
INDICATED VALUE/UNIT 70 $176,429
The concluded Hypothetical PMVSO as a Market Rate Property by our Income Approach, as ofNovember 1, 2021 is $12,350,000.
98

INCOME CAPITALIZATION APPROACH (CONTINUED)
Hypothetical Market Value As If Complete as a Market Property: At the request of the client, weprovided this value scenario which assumes that the property is 100% complete and 100% vacant. This scenario considers a deduction for three months rent loss (½ of the absorption/move in time ofsix months due to the fact that the units will be absorbed evenly during the six month time period)as well as a leasing commission allocation of $500 per unit. Using an average rental rate of $1,424(based on total income which includes ancillary income) applied to 66 units (95% of 70 units) forthree months equates to $281,952. Considering an additional $500 per unit applied to 70 unitsequates to $28,000. With consideration for profit at 15% (applied to $309,952), the total deductionequates to $356,444 or $360,000 RD.
Based on a deduction of $360,000 applied to the Hypothetical PMVSO (as a Market Rate Property)conclusion of $12,350,000 equates to a Leased Fee PMVCC as a Market Rate Property, as of March1, 2020 of $12,000,000.
99
SALES COMPARISON APPROACH
Procedure
The five basic steps utilized in the Sales Comparison Approach to value are set out as follows:
1. Research the market to obtain information about transactions, listings, and otherofferings of properties similar to the subject property.
2. Verify the information by considering the following:A. The data obtained is factually accurate.B. The transactions reflect arm's-length market considerations.
3. Determine relevant units of comparison (e.g., acre, SqFt, multiplier), and develop acomparative analysis for each unit.
4. Compare the subject property and comparable sales according to the elements ofcomparison and adjust the sale price of each comparable as appropriate or eliminatethe property as a comparable.
5. Reconcile the multiple value indications that result from the market data into a singlevalue indication.
Scope of Market Data Search
A search was made for offers, listings, escrows and sales of comparable apartment complexes whichhave close proximity to the subject property. Special attention was given to pertinent transactionswhich have recorded in the past year.
Unit of Measurement: Price Per Unit was abstracted from the market data, where appropriate andwere utilized in the Sales Comparison Approach to value. Overall capitalization rates were derivedfrom the market data and utilized in the Income Capitalization Approach to value.
Market Data: In all, several items of market data were discovered which had varying degrees ofcomparability to the subject property. The details of each of these comparables are set out in thefollowing chart.
100
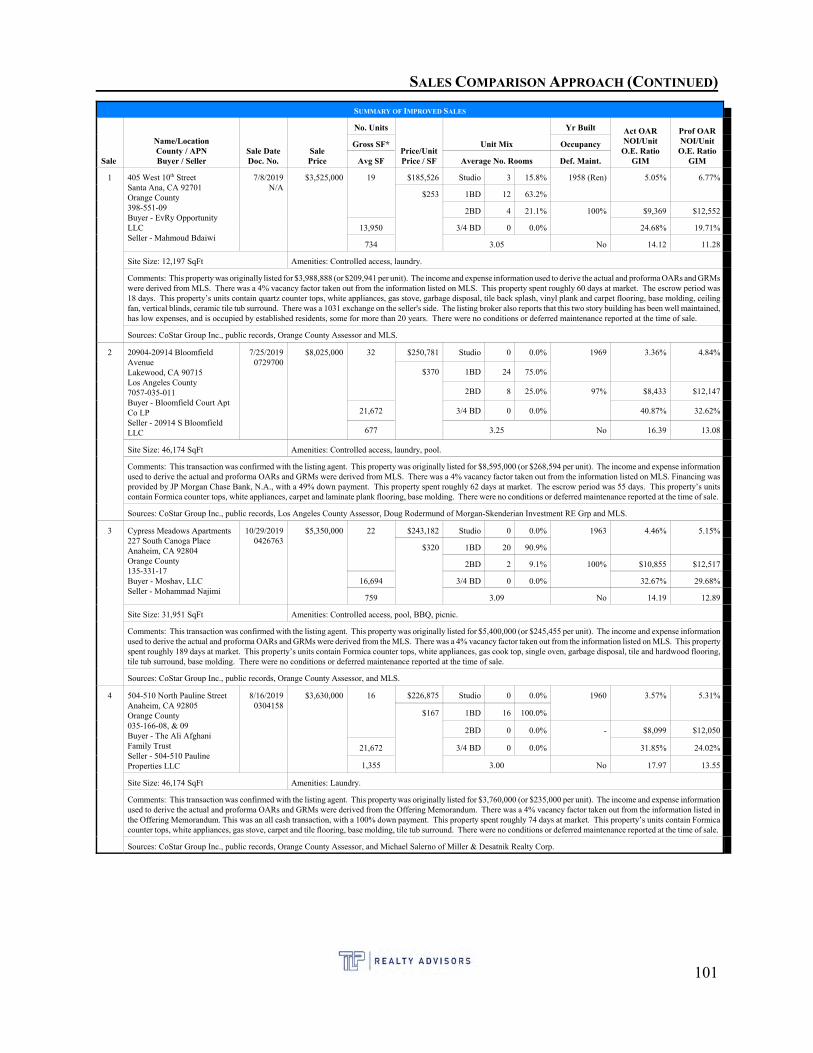
SALES COMPARISON APPROACH (CONTINUED)
SUMMARY OF IMPROVED SALES
Sale
Name/LocationCounty / APNBuyer / Seller
Sale DateDoc. No.
SalePrice
No. Units
Price/UnitPrice / SF
Unit Mix
Yr Built Act OARNOI/UnitO.E. Ratio
GIM
Prof OARNOI/UnitO.E. Ratio
GIM
Gross SF* Occupancy
Avg SF Average No. Rooms Def. Maint.
1 405 West 10th StreetSanta Ana, CA 92701Orange County398-551-09Buyer - EvRy OpportunityLLCSeller - Mahmoud Bdaiwi
7/8/2019N/A
$3,525,000 19 $185,526 Studio 3 15.8% 1958 (Ren) 5.05% 6.77%
$253 1BD 12 63.2%
2BD 4 21.1% 100% $9,369 $12,552
13,950 3/4 BD 0 0.0% 24.68% 19.71%
734 3.05 No 14.12 11.28
Site Size: 12,197 SqFt Amenities: Controlled access, laundry.
Comments: This property was originally listed for $3,988,888 (or $209,941 per unit). The income and expense information used to derive the actual and proforma OARs and GRMswere derived from MLS. There was a 4% vacancy factor taken out from the information listed on MLS. This property spent roughly 60 days at market. The escrow period was18 days. This property’s units contain quartz counter tops, white appliances, gas stove, garbage disposal, tile back splash, vinyl plank and carpet flooring, base molding, ceilingfan, vertical blinds, ceramic tile tub surround. There was a 1031 exchange on the seller's side. The listing broker also reports that this two story building has been well maintained,has low expenses, and is occupied by established residents, some for more than 20 years. There were no conditions or deferred maintenance reported at the time of sale.
Sources: CoStar Group Inc., public records, Orange County Assessor and MLS.
2 20904-20914 BloomfieldAvenueLakewood, CA 90715Los Angeles County7057-035-011Buyer - Bloomfield Court AptCo LPSeller - 20914 S BloomfieldLLC
7/25/20190729700
$8,025,000 32 $250,781 Studio 0 0.0% 1969 3.36% 4.84%
$370 1BD 24 75.0%
2BD 8 25.0% 97% $8,433 $12,147
21,672 3/4 BD 0 0.0% 40.87% 32.62%
677 3.25 No 16.39 13.08
Site Size: 46,174 SqFt Amenities: Controlled access, laundry, pool.
Comments: This transaction was confirmed with the listing agent. This property was originally listed for $8,595,000 (or $268,594 per unit). The income and expense informationused to derive the actual and proforma OARs and GRMs were derived from MLS. There was a 4% vacancy factor taken out from the information listed on MLS. Financing wasprovided by JP Morgan Chase Bank, N.A., with a 49% down payment. This property spent roughly 62 days at market. The escrow period was 55 days. This property’s unitscontain Formica counter tops, white appliances, carpet and laminate plank flooring, base molding. There were no conditions or deferred maintenance reported at the time of sale.
Sources: CoStar Group Inc., public records, Los Angeles County Assessor, Doug Rodermund of Morgan-Skenderian Investment RE Grp and MLS.
3 Cypress Meadows Apartments227 South Canoga PlaceAnaheim, CA 92804Orange County135-331-17Buyer - Moshav, LLCSeller - Mohammad Najimi
10/29/20190426763
$5,350,000 22 $243,182 Studio 0 0.0% 1963 4.46% 5.15%
$320 1BD 20 90.9%
2BD 2 9.1% 100% $10,855 $12,517
16,694 3/4 BD 0 0.0% 32.67% 29.68%
759 3.09 No 14.19 12.89
Site Size: 31,951 SqFt Amenities: Controlled access, pool, BBQ, picnic.
Comments: This transaction was confirmed with the listing agent. This property was originally listed for $5,400,000 (or $245,455 per unit). The income and expense informationused to derive the actual and proforma OARs and GRMs were derived from the MLS. There was a 4% vacancy factor taken out from the information listed on MLS. This propertyspent roughly 189 days at market. This property’s units contain Formica counter tops, white appliances, gas cook top, single oven, garbage disposal, tile and hardwood flooring,tile tub surround, base molding. There were no conditions or deferred maintenance reported at the time of sale.
Sources: CoStar Group Inc., public records, Orange County Assessor, and MLS.
4 504-510 North Pauline StreetAnaheim, CA 92805Orange County035-166-08, & 09Buyer - The Ali AfghaniFamily TrustSeller - 504-510 PaulineProperties LLC
8/16/20190304158
$3,630,000 16 $226,875 Studio 0 0.0% 1960 3.57% 5.31%
$167 1BD 16 100.0%
2BD 0 0.0% - $8,099 $12,050
21,672 3/4 BD 0 0.0% 31.85% 24.02%
1,355 3.00 No 17.97 13.55
Site Size: 46,174 SqFt Amenities: Laundry.
Comments: This transaction was confirmed with the listing agent. This property was originally listed for $3,760,000 (or $235,000 per unit). The income and expense informationused to derive the actual and proforma OARs and GRMs were derived from the Offering Memorandum. There was a 4% vacancy factor taken out from the information listed inthe Offering Memorandum. This was an all cash transaction, with a 100% down payment. This property spent roughly 74 days at market. This property’s units contain Formicacounter tops, white appliances, gas stove, carpet and tile flooring, base molding, tile tub surround. There were no conditions or deferred maintenance reported at the time of sale.
Sources: CoStar Group Inc., public records, Orange County Assessor, and Michael Salerno of Miller & Desatnik Realty Corp.
101
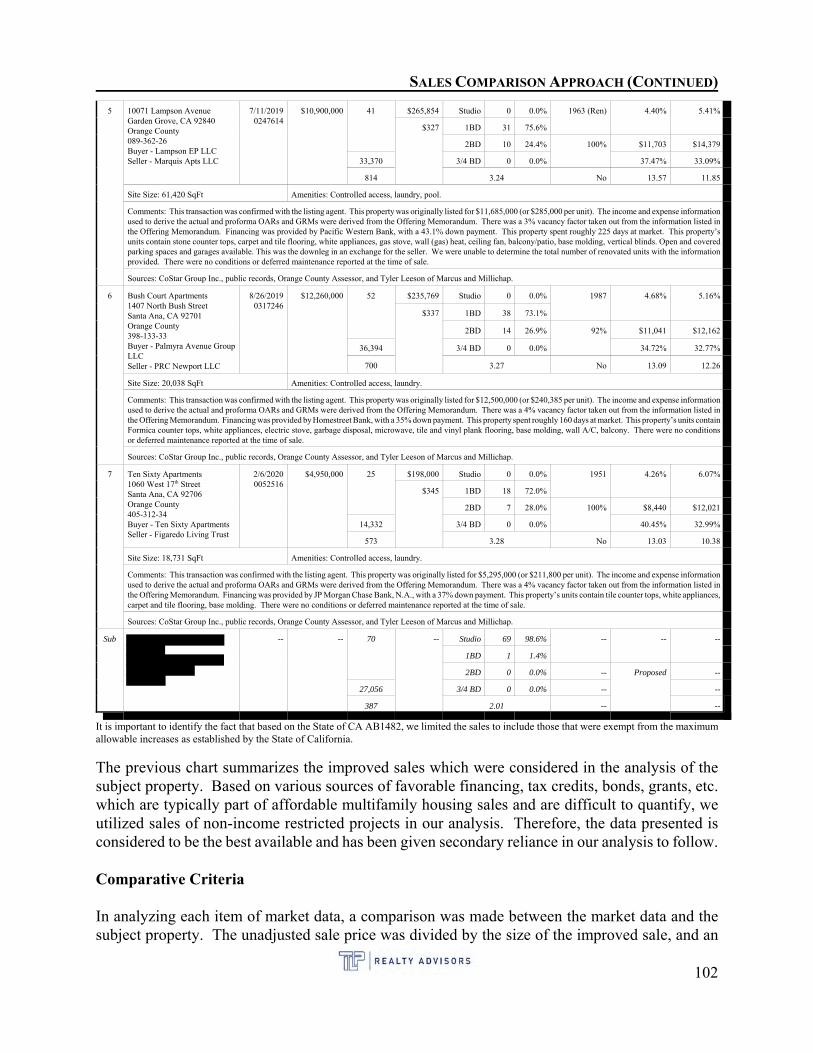
SALES COMPARISON APPROACH (CONTINUED)
5 10071 Lampson AvenueGarden Grove, CA 92840Orange County089-362-26Buyer - Lampson EP LLCSeller - Marquis Apts LLC
7/11/20190247614
$10,900,000 41 $265,854 Studio 0 0.0% 1963 (Ren) 4.40% 5.41%
$327 1BD 31 75.6%
2BD 10 24.4% 100% $11,703 $14,379
33,370 3/4 BD 0 0.0% 37.47% 33.09%
814 3.24 No 13.57 11.85
Site Size: 61,420 SqFt Amenities: Controlled access, laundry, pool.
Comments: This transaction was confirmed with the listing agent. This property was originally listed for $11,685,000 (or $285,000 per unit). The income and expense informationused to derive the actual and proforma OARs and GRMs were derived from the Offering Memorandum. There was a 3% vacancy factor taken out from the information listed inthe Offering Memorandum. Financing was provided by Pacific Western Bank, with a 43.1% down payment. This property spent roughly 225 days at market. This property’sunits contain stone counter tops, carpet and tile flooring, white appliances, gas stove, wall (gas) heat, ceiling fan, balcony/patio, base molding, vertical blinds. Open and coveredparking spaces and garages available. This was the downleg in an exchange for the seller. We were unable to determine the total number of renovated units with the informationprovided. There were no conditions or deferred maintenance reported at the time of sale.
Sources: CoStar Group Inc., public records, Orange County Assessor, and Tyler Leeson of Marcus and Millichap.
6 Bush Court Apartments1407 North Bush StreetSanta Ana, CA 92701Orange County398-133-33Buyer - Palmyra Avenue GroupLLCSeller - PRC Newport LLC
8/26/20190317246
$12,260,000 52 $235,769 Studio 0 0.0% 1987 4.68% 5.16%
$337 1BD 38 73.1%
2BD 14 26.9% 92% $11,041 $12,162
36,394 3/4 BD 0 0.0% 34.72% 32.77%
700 3.27 No 13.09 12.26
Site Size: 20,038 SqFt Amenities: Controlled access, laundry.
Comments: This transaction was confirmed with the listing agent. This property was originally listed for $12,500,000 (or $240,385 per unit). The income and expense informationused to derive the actual and proforma OARs and GRMs were derived from the Offering Memorandum. There was a 4% vacancy factor taken out from the information listed inthe Offering Memorandum. Financing was provided by Homestreet Bank, with a 35% down payment. This property spent roughly 160 days at market. This property’s units containFormica counter tops, white appliances, electric stove, garbage disposal, microwave, tile and vinyl plank flooring, base molding, wall A/C, balcony. There were no conditionsor deferred maintenance reported at the time of sale.
Sources: CoStar Group Inc., public records, Orange County Assessor, and Tyler Leeson of Marcus and Millichap.
7 Ten Sixty Apartments1060 West 17th StreetSanta Ana, CA 92706Orange County405-312-34Buyer - Ten Sixty ApartmentsSeller - Figaredo Living Trust
2/6/20200052516
$4,950,000 25 $198,000 Studio 0 0.0% 1951 4.26% 6.07%
$345 1BD 18 72.0%
2BD 7 28.0% 100% $8,440 $12,021
14,332 3/4 BD 0 0.0% 40.45% 32.99%
573 3.28 No 13.03 10.38
Site Size: 18,731 SqFt Amenities: Controlled access, laundry.
Comments: This transaction was confirmed with the listing agent. This property was originally listed for $5,295,000 (or $211,800 per unit). The income and expense informationused to derive the actual and proforma OARs and GRMs were derived from the Offering Memorandum. There was a 4% vacancy factor taken out from the information listed inthe Offering Memorandum. Financing was provided by JP Morgan Chase Bank, N.A., with a 37% down payment. This property’s units contain tile counter tops, white appliances,carpet and tile flooring, base molding. There were no conditions or deferred maintenance reported at the time of sale.
Sources: CoStar Group Inc., public records, Orange County Assessor, and Tyler Leeson of Marcus and Millichap.
Sub -- -- 70 -- Studio 69 98.6% -- -- --
1BD 1 1.4%
2BD 0 0.0% -- Proposed --
27,056 3/4 BD 0 0.0% -- --
387 2.01 -- --
It is important to identify the fact that based on the State of CA AB1482, we limited the sales to include those that were exempt from the maximumallowable increases as established by the State of California.
The previous chart summarizes the improved sales which were considered in the analysis of thesubject property. Based on various sources of favorable financing, tax credits, bonds, grants, etc.which are typically part of affordable multifamily housing sales and are difficult to quantify, weutilized sales of non-income restricted projects in our analysis. Therefore, the data presented isconsidered to be the best available and has been given secondary reliance in our analysis to follow.
Comparative Criteria
In analyzing each item of market data, a comparison was made between the market data and thesubject property. The unadjusted sale price was divided by the size of the improved sale, and an
102
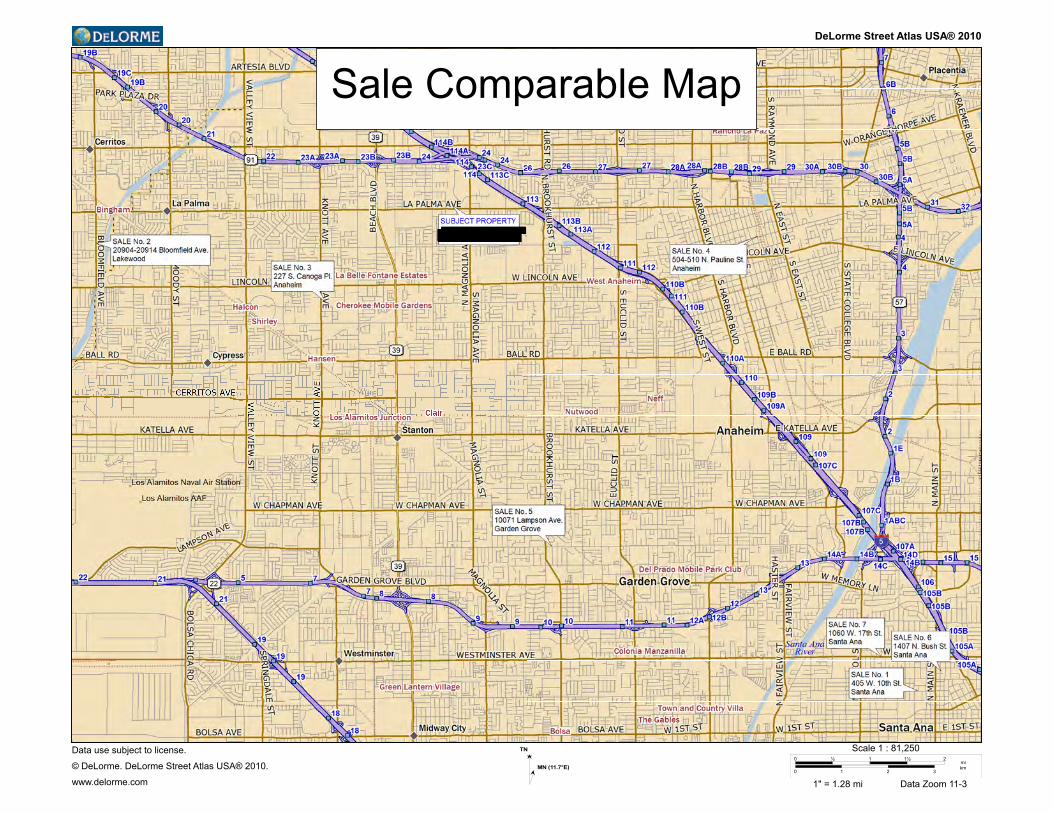
DeLorme Street Atlas USA® 2010
Sale Comparable Map
Data use subject to license.
© DeLorme. DeLorme Street Atlas USA® 2010.
www.delorme.com
TN
MN (11.7°E)
0 ½ 1 1½ 2
0 1 2 3
mikm
Scale 1 : 81,250
1" = 1.28 mi Data Zoom 11-3
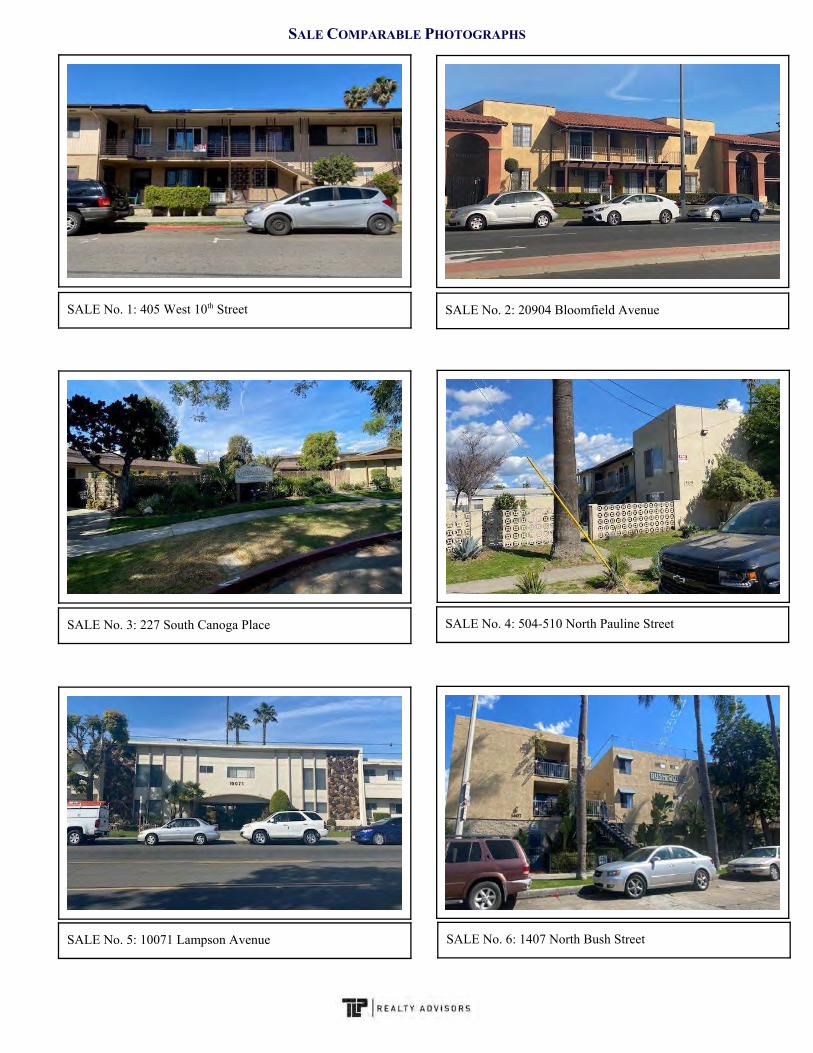
SALE COMPARABLE PHOTOGRAPHS
SALE No. 1: 405 West 10th Street SALE No. 2: 20904 Bloomfield Avenue
SALE No. 4: 504-510 North Pauline StreetSALE No. 3: 227 South Canoga Place
SALE No. 5: 10071 Lampson Avenue SALE No. 6: 1407 North Bush Street
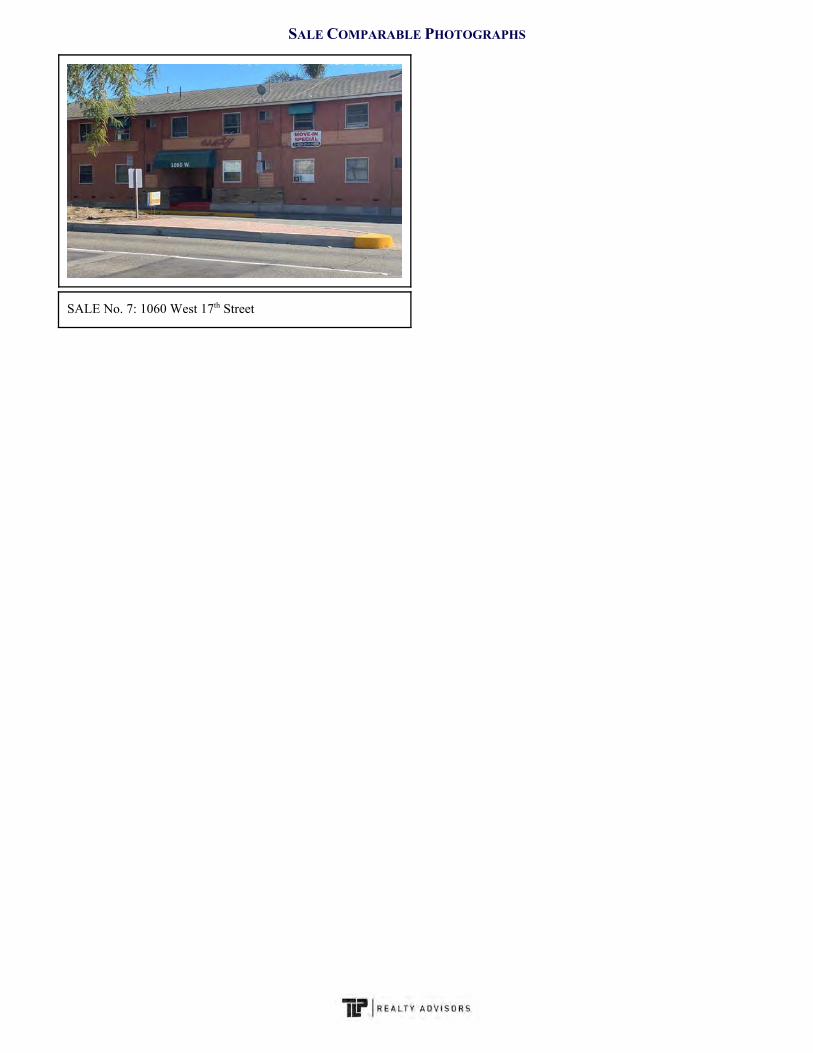
SALE COMPARABLE PHOTOGRAPHS
SALE No. 7: 1060 West 17th Street
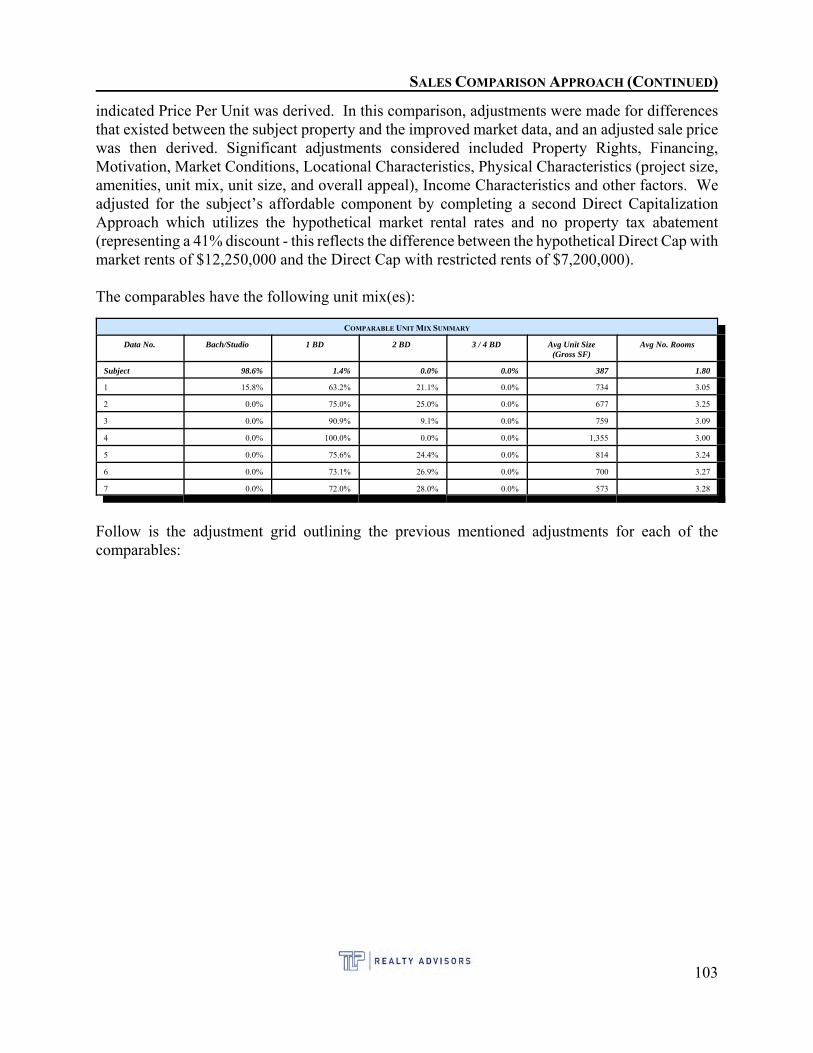
SALES COMPARISON APPROACH (CONTINUED)
indicated Price Per Unit was derived. In this comparison, adjustments were made for differencesthat existed between the subject property and the improved market data, and an adjusted sale pricewas then derived. Significant adjustments considered included Property Rights, Financing,Motivation, Market Conditions, Locational Characteristics, Physical Characteristics (project size,amenities, unit mix, unit size, and overall appeal), Income Characteristics and other factors. Weadjusted for the subject’s affordable component by completing a second Direct CapitalizationApproach which utilizes the hypothetical market rental rates and no property tax abatement(representing a 41% discount - this reflects the difference between the hypothetical Direct Cap withmarket rents of $12,250,000 and the Direct Cap with restricted rents of $7,200,000).
The comparables have the following unit mix(es):
COMPARABLE UNIT MIX SUMMARY
Data No. Bach/Studio 1 BD 2 BD 3 / 4 BD Avg Unit Size(Gross SF)
Avg No. Rooms
Subject 98.6% 1.4% 0.0% 0.0% 387 1.80
1 15.8% 63.2% 21.1% 0.0% 734 3.05
2 0.0% 75.0% 25.0% 0.0% 677 3.25
3 0.0% 90.9% 9.1% 0.0% 759 3.09
4 0.0% 100.0% 0.0% 0.0% 1,355 3.00
5 0.0% 75.6% 24.4% 0.0% 814 3.24
6 0.0% 73.1% 26.9% 0.0% 700 3.27
7 0.0% 72.0% 28.0% 0.0% 573 3.28
Follow is the adjustment grid outlining the previous mentioned adjustments for each of thecomparables:
103
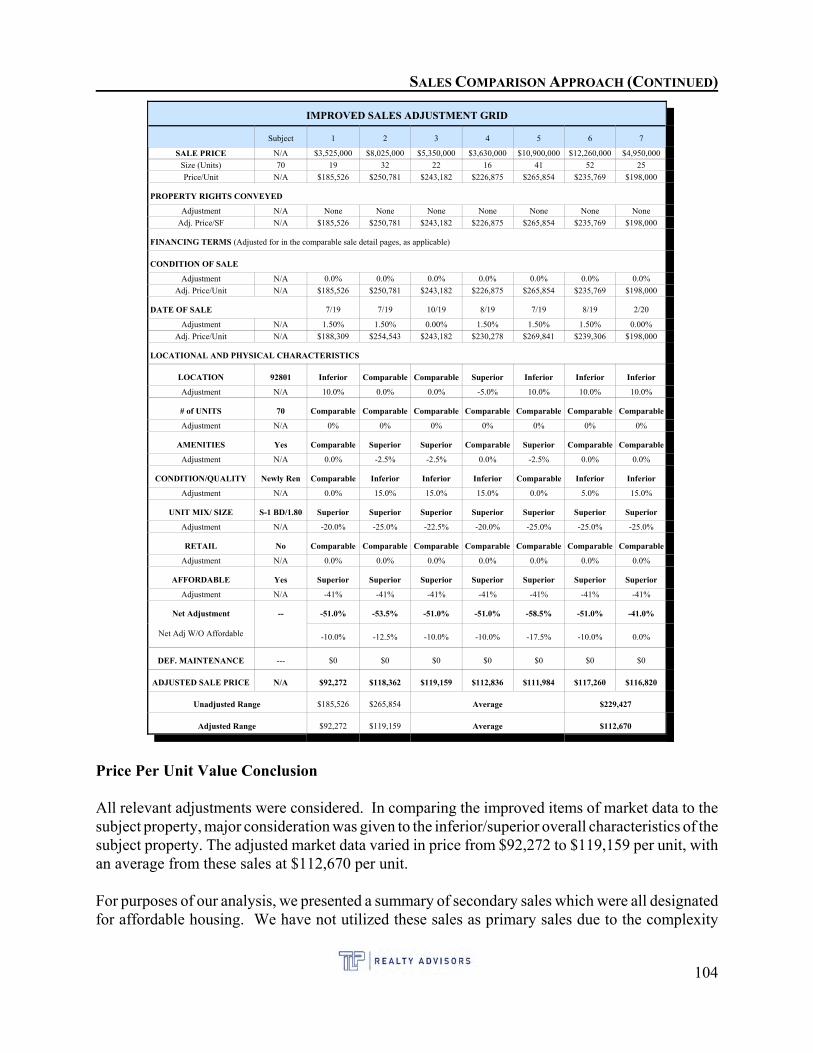
SALES COMPARISON APPROACH (CONTINUED)
IMPROVED SALES ADJUSTMENT GRID
Subject 1 2 3 4 5 6 7
SALE PRICE N/A $3,525,000 $8,025,000 $5,350,000 $3,630,000 $10,900,000 $12,260,000 $4,950,000
Size (Units) 70 19 32 22 16 41 52 25
Price/Unit N/A $185,526 $250,781 $243,182 $226,875 $265,854 $235,769 $198,000
PROPERTY RIGHTS CONVEYED
Adjustment N/A None None None None None None None
Adj. Price/SF N/A $185,526 $250,781 $243,182 $226,875 $265,854 $235,769 $198,000
FINANCING TERMS (Adjusted for in the comparable sale detail pages, as applicable)
CONDITION OF SALE
Adjustment N/A 0.0% 0.0% 0.0% 0.0% 0.0% 0.0% 0.0%
Adj. Price/Unit N/A $185,526 $250,781 $243,182 $226,875 $265,854 $235,769 $198,000
DATE OF SALE 7/19 7/19 10/19 8/19 7/19 8/19 2/20
Adjustment N/A 1.50% 1.50% 0.00% 1.50% 1.50% 1.50% 0.00%
Adj. Price/Unit N/A $188,309 $254,543 $243,182 $230,278 $269,841 $239,306 $198,000
LOCATIONAL AND PHYSICAL CHARACTERISTICS
LOCATION 92801 Inferior Comparable Comparable Superior Inferior Inferior Inferior
Adjustment N/A 10.0% 0.0% 0.0% -5.0% 10.0% 10.0% 10.0%
# of UNITS 70 Comparable Comparable Comparable Comparable Comparable Comparable Comparable
Adjustment N/A 0% 0% 0% 0% 0% 0% 0%
AMENITIES Yes Comparable Superior Superior Comparable Superior Comparable Comparable
Adjustment N/A 0.0% -2.5% -2.5% 0.0% -2.5% 0.0% 0.0%
CONDITION/QUALITY Newly Ren Comparable Inferior Inferior Inferior Comparable Inferior Inferior
Adjustment N/A 0.0% 15.0% 15.0% 15.0% 0.0% 5.0% 15.0%
UNIT MIX/ SIZE S-1 BD/1.80 Superior Superior Superior Superior Superior Superior Superior
Adjustment N/A -20.0% -25.0% -22.5% -20.0% -25.0% -25.0% -25.0%
RETAIL No Comparable Comparable Comparable Comparable Comparable Comparable Comparable
Adjustment N/A 0.0% 0.0% 0.0% 0.0% 0.0% 0.0% 0.0%
AFFORDABLE Yes Superior Superior Superior Superior Superior Superior Superior
Adjustment N/A -41% -41% -41% -41% -41% -41% -41%
Net Adjustment
Net Adj W/O Affordable
-- -51.0% -53.5% -51.0% -51.0% -58.5% -51.0% -41.0%
-10.0% -12.5% -10.0% -10.0% -17.5% -10.0% 0.0%
DEF. MAINTENANCE --- $0 $0 $0 $0 $0 $0 $0
ADJUSTED SALE PRICE N/A $92,272 $118,362 $119,159 $112,836 $111,984 $117,260 $116,820
Unadjusted Range $185,526 $265,854 Average $229,427
Adjusted Range $92,272 $119,159 Average $112,670
Price Per Unit Value Conclusion
All relevant adjustments were considered. In comparing the improved items of market data to thesubject property, major consideration was given to the inferior/superior overall characteristics of thesubject property. The adjusted market data varied in price from $92,272 to $119,159 per unit, withan average from these sales at $112,670 per unit.
For purposes of our analysis, we presented a summary of secondary sales which were all designatedfor affordable housing. We have not utilized these sales as primary sales due to the complexity
104
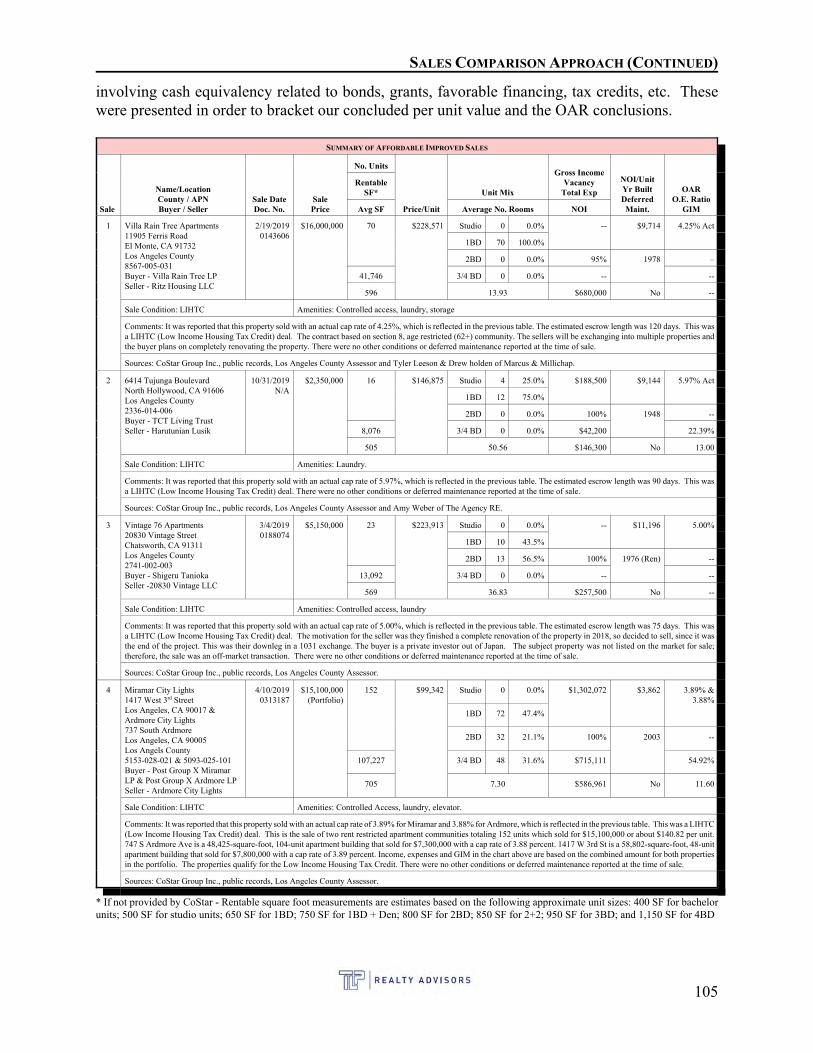
SALES COMPARISON APPROACH (CONTINUED)
involving cash equivalency related to bonds, grants, favorable financing, tax credits, etc. Thesewere presented in order to bracket our concluded per unit value and the OAR conclusions.
SUMMARY OF AFFORDABLE IMPROVED SALES
Sale
Name/LocationCounty / APNBuyer / Seller
Sale DateDoc. No.
SalePrice
No. Units
Price/Unit
Unit Mix
Gross IncomeVacancy
Total Exp
NOI/UnitYr BuiltDeferredMaint.
OARO.E. Ratio
GIM
RentableSF*
Avg SF Average No. Rooms NOI
1 Villa Rain Tree Apartments11905 Ferris RoadEl Monte, CA 91732Los Angeles County8567-005-031Buyer - Villa Rain Tree LPSeller - Ritz Housing LLC
2/19/20190143606
$16,000,000 70 $228,571 Studio 0 0.0% -- $9,714 4.25% Act
1BD 70 100.0%
2BD 0 0.0% 95% 1978 –
41,746 3/4 BD 0 0.0% -- --
596 13.93 $680,000 No --
Sale Condition: LIHTC Amenities: Controlled access, laundry, storage
Comments: It was reported that this property sold with an actual cap rate of 4.25%, which is reflected in the previous table. The estimated escrow length was 120 days. This wasa LIHTC (Low Income Housing Tax Credit) deal. The contract based on section 8, age restricted (62+) community. The sellers will be exchanging into multiple properties andthe buyer plans on completely renovating the property. There were no other conditions or deferred maintenance reported at the time of sale.
Sources: CoStar Group Inc., public records, Los Angeles County Assessor and Tyler Leeson & Drew holden of Marcus & Millichap.
2 6414 Tujunga BoulevardNorth Hollywood, CA 91606Los Angeles County2336-014-006Buyer - TCT Living TrustSeller - Harutunian Lusik
10/31/2019N/A
$2,350,000 16 $146,875 Studio 4 25.0% $188,500 $9,144 5.97% Act
1BD 12 75.0%
2BD 0 0.0% 100% 1948 --
8,076 3/4 BD 0 0.0% $42,200 22.39%
505 50.56 $146,300 No 13.00
Sale Condition: LIHTC Amenities: Laundry.
Comments: It was reported that this property sold with an actual cap rate of 5.97%, which is reflected in the previous table. The estimated escrow length was 90 days. This wasa LIHTC (Low Income Housing Tax Credit) deal. There were no other conditions or deferred maintenance reported at the time of sale.
Sources: CoStar Group Inc., public records, Los Angeles County Assessor and Amy Weber of The Agency RE.
3 Vintage 76 Apartments20830 Vintage StreetChatsworth, CA 91311Los Angeles County2741-002-003Buyer - Shigeru TaniokaSeller -20830 Vintage LLC
3/4/20190188074
$5,150,000 23 $223,913 Studio 0 0.0% -- $11,196 5.00%
1BD 10 43.5%
2BD 13 56.5% 100% 1976 (Ren) --
13,092 3/4 BD 0 0.0% -- --
569 36.83 $257,500 No --
Sale Condition: LIHTC Amenities: Controlled access, laundry
Comments: It was reported that this property sold with an actual cap rate of 5.00%, which is reflected in the previous table. The estimated escrow length was 75 days. This wasa LIHTC (Low Income Housing Tax Credit) deal. The motivation for the seller was they finished a complete renovation of the property in 2018, so decided to sell, since it wasthe end of the project. This was their downleg in a 1031 exchange. The buyer is a private investor out of Japan. The subject property was not listed on the market for sale;therefore, the sale was an off-market transaction. There were no other conditions or deferred maintenance reported at the time of sale.
Sources: CoStar Group Inc., public records, Los Angeles County Assessor.
4 Miramar City Lights1417 West 3rd StreetLos Angeles, CA 90017 &Ardmore City Lights737 South ArdmoreLos Angeles, CA 90005Los Angels County5153-028-021 & 5093-025-101Buyer - Post Group X MiramarLP & Post Group X Ardmore LPSeller - Ardmore City Lights
4/10/20190313187
$15,100,000(Portfolio)
152 $99,342 Studio 0 0.0% $1,302,072 $3,862 3.89% &3.88%
1BD 72 47.4%
2BD 32 21.1% 100% 2003 --
107,227 3/4 BD 48 31.6% $715,111 54.92%
705 7.30 $586,961 No 11.60
Sale Condition: LIHTC Amenities: Controlled Access, laundry, elevator.
Comments: It was reported that this property sold with an actual cap rate of 3.89% for Miramar and 3.88% for Ardmore, which is reflected in the previous table. This was a LIHTC(Low Income Housing Tax Credit) deal. This is the sale of two rent restricted apartment communities totaling 152 units which sold for $15,100,000 or about $140.82 per unit.747 S Ardmore Ave is a 48,425-square-foot, 104-unit apartment building that sold for $7,300,000 with a cap rate of 3.88 percent. 1417 W 3rd St is a 58,802-square-foot, 48-unitapartment building that sold for $7,800,000 with a cap rate of 3.89 percent. Income, expenses and GIM in the chart above are based on the combined amount for both propertiesin the portfolio. The properties qualify for the Low Income Housing Tax Credit. There were no other conditions or deferred maintenance reported at the time of sale.
Sources: CoStar Group Inc., public records, Los Angeles County Assessor.
* If not provided by CoStar - Rentable square foot measurements are estimates based on the following approximate unit sizes: 400 SF for bachelorunits; 500 SF for studio units; 650 SF for 1BD; 750 SF for 1BD + Den; 800 SF for 2BD; 850 SF for 2+2; 950 SF for 3BD; and 1,150 SF for 4BD
105
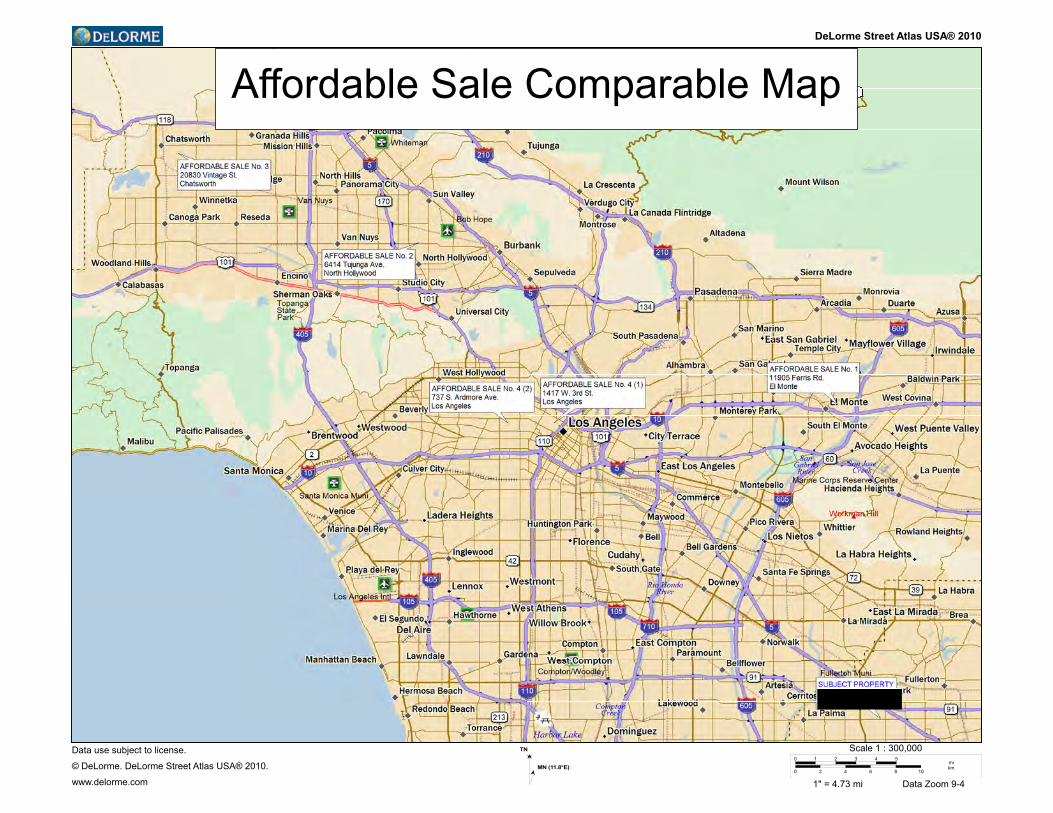
DeLorme Street Atlas USA® 2010
Affordable Sale Comparable Map
Data use subject to license.
© DeLorme. DeLorme Street Atlas USA® 2010.
www.delorme.com
TN
MN (11.8°E)
0 1 2 3 4 5
0 2 4 6 8 10
mikm
Scale 1 : 300,000
1" = 4.73 mi Data Zoom 9-4
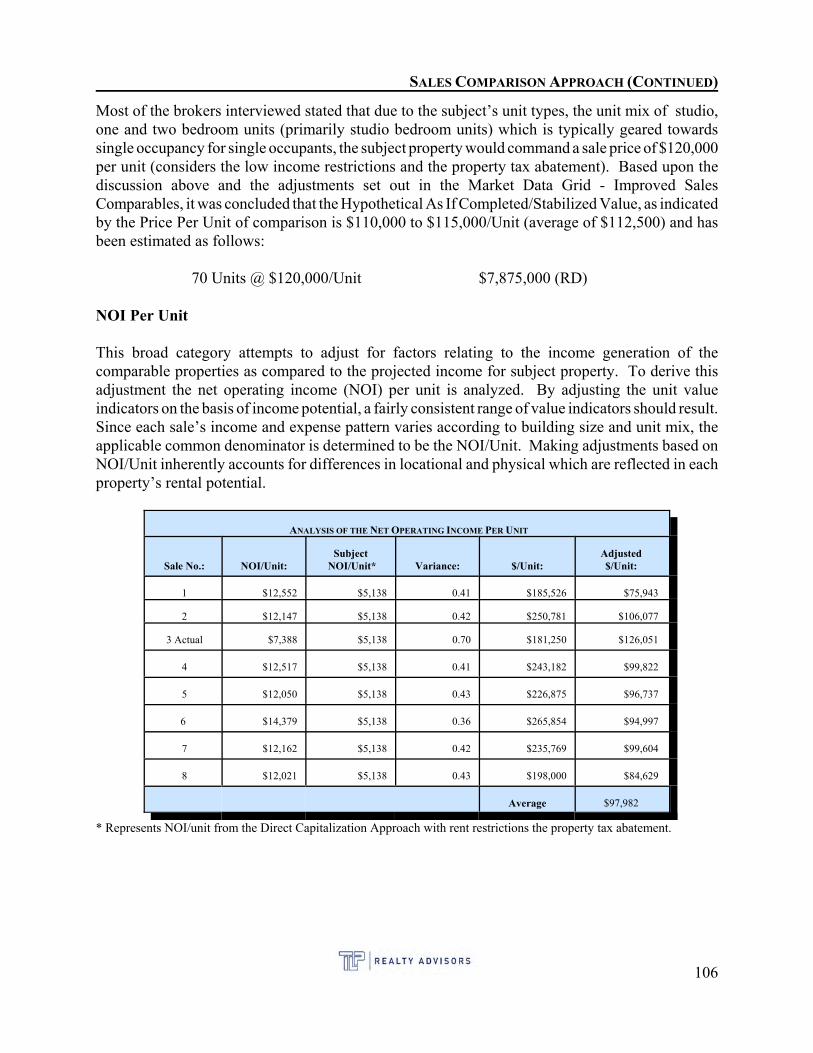
SALES COMPARISON APPROACH (CONTINUED)
Most of the brokers interviewed stated that due to the subject’s unit types, the unit mix of studio,one and two bedroom units (primarily studio bedroom units) which is typically geared towardssingle occupancy for single occupants, the subject property would command a sale price of $120,000per unit (considers the low income restrictions and the property tax abatement). Based upon thediscussion above and the adjustments set out in the Market Data Grid - Improved SalesComparables, it was concluded that the Hypothetical As If Completed/Stabilized Value, as indicatedby the Price Per Unit of comparison is $110,000 to $115,000/Unit (average of $112,500) and hasbeen estimated as follows:
70 Units @ $120,000/Unit $7,875,000 (RD)
NOI Per Unit
This broad category attempts to adjust for factors relating to the income generation of thecomparable properties as compared to the projected income for subject property. To derive thisadjustment the net operating income (NOI) per unit is analyzed. By adjusting the unit valueindicators on the basis of income potential, a fairly consistent range of value indicators should result. Since each sale’s income and expense pattern varies according to building size and unit mix, theapplicable common denominator is determined to be the NOI/Unit. Making adjustments based onNOI/Unit inherently accounts for differences in locational and physical which are reflected in eachproperty’s rental potential.
ANALYSIS OF THE NET OPERATING INCOME PER UNIT
Sale No.: NOI/Unit:Subject
NOI/Unit* Variance: $/Unit:Adjusted$/Unit:
1 $12,552 $5,138 0.41 $185,526 $75,943
2 $12,147 $5,138 0.42 $250,781 $106,077
3 Actual $7,388 $5,138 0.70 $181,250 $126,051
4 $12,517 $5,138 0.41 $243,182 $99,822
5 $12,050 $5,138 0.43 $226,875 $96,737
6 $14,379 $5,138 0.36 $265,854 $94,997
7 $12,162 $5,138 0.42 $235,769 $99,604
8 $12,021 $5,138 0.43 $198,000 $84,629
Average $97,982
* Represents NOI/unit from the Direct Capitalization Approach with rent restrictions the property tax abatement.
106
SALES COMPARISON APPROACH (CONTINUED)
All of the comparables are considered to provide relevant indications of an appropriate price for thesubject based on comparison of income generation. Accordingly, we have utilized a price withconsideration for all of the comparables of $105,000 per unit (considers the low income restrictionsand the property tax abatement). This equates to a value conclusion as follows:
$105,000 x 70 units = $7,350,000 (RD)
Conclusion to Sales Comparison Approach - With Rent Restrictions
Valuation techniques in the Sales Comparison Approach have produced the following valueestimates:
Value by Price/Unit: $7,875,000Value by NOI/Unit: $7,350,000Value Conclusion Before Trending: $7,600,000Trending Factor: 1.0083Leased Fee Value Conclusion: $7,670,000
Considering both techniques, the previous analysis and discussion, the PMVSO with rentrestrictions, as indicated by the Sales Comparison Approach as of November 1, 2021 of $7,670,000.
Indicated Leased Fee PMVSOvia the Sales Comparison Approach w/ Rent Restrictions $7,670,000
107
RECONCILIATION
Reconciliation
The three approaches to value are reconciled into estimate of the PMVSO with rent restrictions.Reconciliation is defined as a step in the valuation process in which an appraiser considersalternative value indications and selects a final value estimate. Based upon this process thereconciliation of the pertinent approaches to value are set out as follows:
Cost Approach: The Cost Approach was utilized as the subject property will represent a newlyconstructed property. The cost of the proposed improvements was estimated utilized figures fromthe Marshall Valuation cost service with reference to the actual project and budgeted costs from thedeveloper. All appropriate forms of depreciation were estimated, namely external obsolescence, anddeducted from the replacement cost new to reach the appropriate prospective market value of thesubject upon reaching stabilized occupancy. As the property would likely be acquired by aninvestor, the Cost Approach would likely be considered in a pricing decision but ultimately moreemphasis would be placed on the income based approaches to value.
Income Capitalization Approach: The Income Capitalization Approach typically provides thestrongest and most valid indication of value for investment type properties. Multi-family residentialproperties are generally income producing, and a typical purchase price is based on the ability of theproperty to produce a net income stream. The capitalization process provides mathematical support,reflects the reasoning of the real estate market, and interprets actions of buyers and sellers of similarproperties in the market.
The rent levels applied to the subject property were within the range of market rents as indicated bythe other comparable rental properties. A proper analysis of the income stream develops a reliableestimate of value. Current market information produced acceptable data, both in the subjectneighborhood and in competing areas. The potential gross income was supported from this rentalsurvey. Expenses were projected based on published expense information and by the budgetedexpenses of the subject property. The expense ratio estimate is typical for similar structures. The netincome was concluded to be supported by the market data.
By the application of the appropriate capitalization rate, the net income was capitalized to form anindication of value.
Sales Comparison Approach: In the Sales Comparison Approach to value, two methods wereconsidered: The Price Per Unit Method and the NOI/Unit Method.
The difficulty in using the Sales Comparison Approach is the lack of truly comparable data,requiring adjustments to the comparable sales to reflect the differences between the subject propertyand each comparable sale property. Paired sales are difficult to obtain in the quantification ofadjustments for property rights conveyed, financing, motivation, market conditions, quality ofimprovements, improvement size, location, access and exposure, parking adequacy, and amenities.
More specifically, difficulties in the Sales Comparison Approach arise in gathering comparablemarket data in terms of a comparable location, expense and income characteristics and overall
108
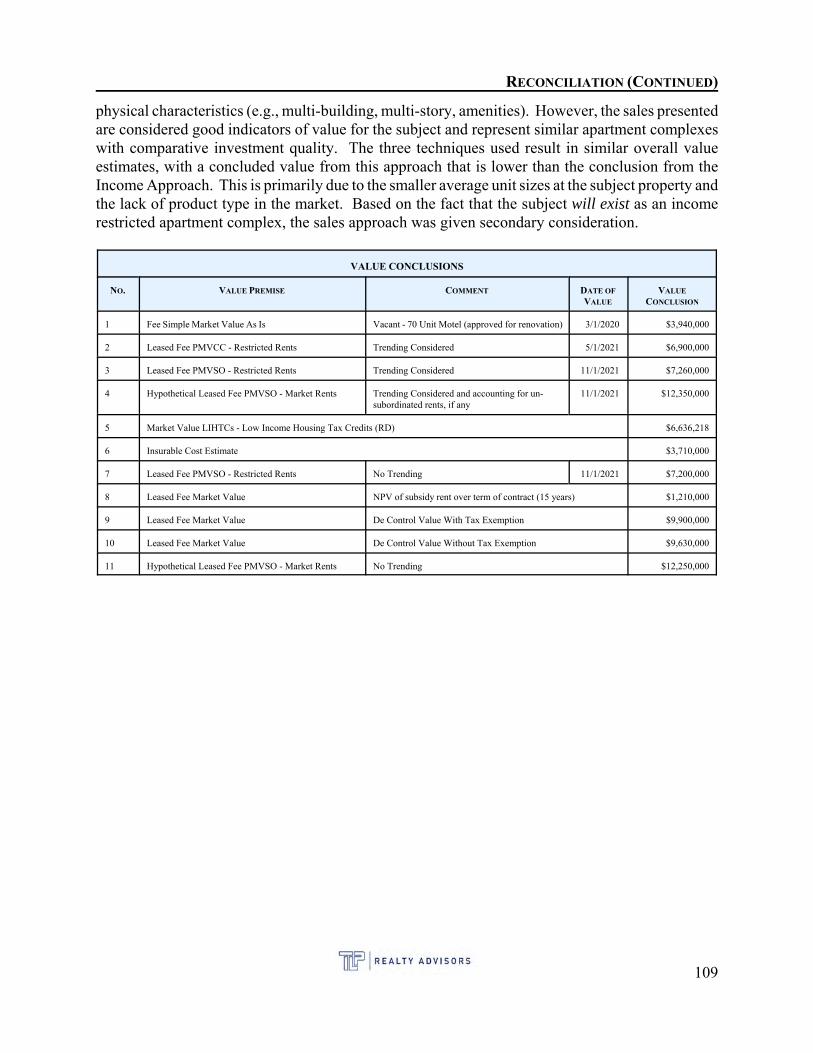
RECONCILIATION (CONTINUED)
physical characteristics (e.g., multi-building, multi-story, amenities). However, the sales presentedare considered good indicators of value for the subject and represent similar apartment complexeswith comparative investment quality. The three techniques used result in similar overall valueestimates, with a concluded value from this approach that is lower than the conclusion from theIncome Approach. This is primarily due to the smaller average unit sizes at the subject property andthe lack of product type in the market. Based on the fact that the subject will exist as an incomerestricted apartment complex, the sales approach was given secondary consideration.
VALUE CONCLUSIONS
NO. VALUE PREMISE COMMENT DATE OF
VALUE
VALUE
CONCLUSION
1 Fee Simple Market Value As Is Vacant - 70 Unit Motel (approved for renovation) 3/1/2020 $3,940,000
2 Leased Fee PMVCC - Restricted Rents Trending Considered 5/1/2021 $6,900,000
3 Leased Fee PMVSO - Restricted Rents Trending Considered 11/1/2021 $7,260,000
4 Hypothetical Leased Fee PMVSO - Market Rents Trending Considered and accounting for un-subordinated rents, if any
11/1/2021 $12,350,000
5 Market Value LIHTCs - Low Income Housing Tax Credits (RD) $6,636,218
6 Insurable Cost Estimate $3,710,000
7 Leased Fee PMVSO - Restricted Rents No Trending 11/1/2021 $7,200,000
8 Leased Fee Market Value NPV of subsidy rent over term of contract (15 years) $1,210,000
9 Leased Fee Market Value De Control Value With Tax Exemption $9,900,000
10 Leased Fee Market Value De Control Value Without Tax Exemption $9,630,000
11 Hypothetical Leased Fee PMVSO - Market Rents No Trending $12,250,000
109
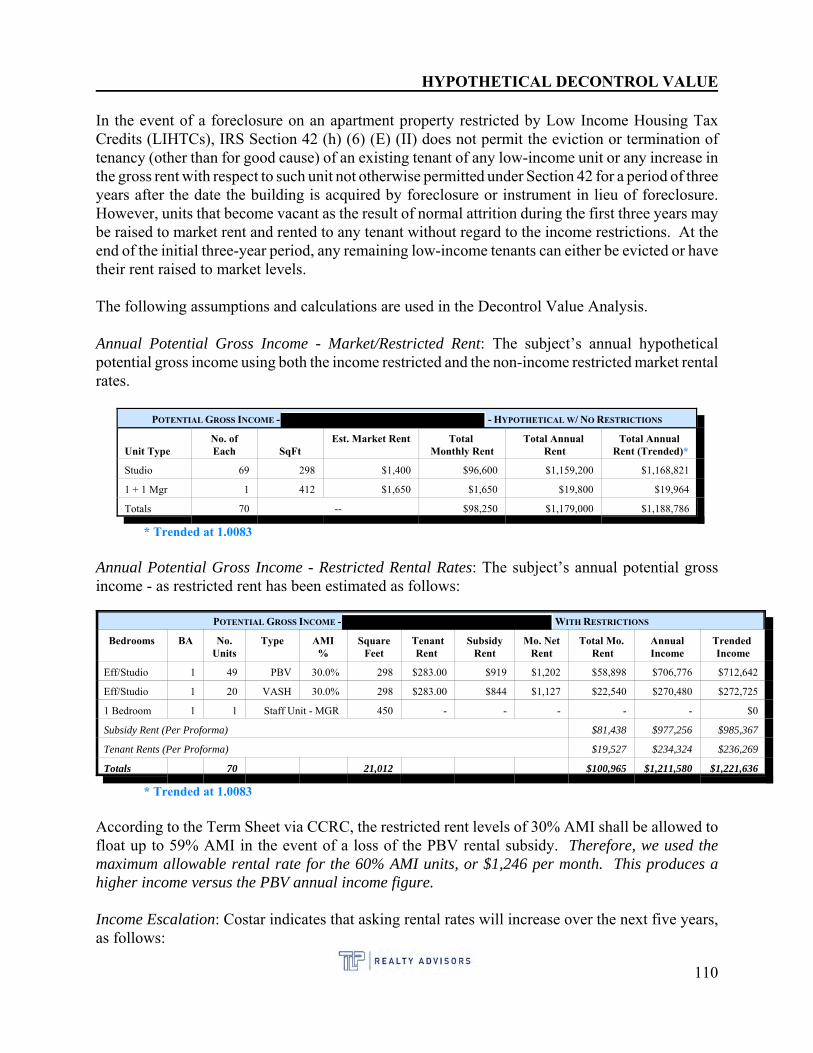
HYPOTHETICAL DECONTROL VALUE
In the event of a foreclosure on an apartment property restricted by Low Income Housing TaxCredits (LIHTCs), IRS Section 42 (h) (6) (E) (II) does not permit the eviction or termination oftenancy (other than for good cause) of an existing tenant of any low-income unit or any increase inthe gross rent with respect to such unit not otherwise permitted under Section 42 for a period of threeyears after the date the building is acquired by foreclosure or instrument in lieu of foreclosure. However, units that become vacant as the result of normal attrition during the first three years maybe raised to market rent and rented to any tenant without regard to the income restrictions. At theend of the initial three-year period, any remaining low-income tenants can either be evicted or havetheir rent raised to market levels.
The following assumptions and calculations are used in the Decontrol Value Analysis.
Annual Potential Gross Income - Market/Restricted Rent: The subject’s annual hypotheticalpotential gross income using both the income restricted and the non-income restricted market rentalrates.
POTENTIAL GROSS INCOME - - HYPOTHETICAL W/ NO RESTRICTIONS
Unit TypeNo. ofEach SqFt
Est. Market Rent Total Monthly Rent
Total Annual Rent
Total Annual Rent (Trended)*
Studio 69 298 $1,400 $96,600 $1,159,200 $1,168,821
1 + 1 Mgr 1 412 $1,650 $1,650 $19,800 $19,964
Totals 70 -- $98,250 $1,179,000 $1,188,786
* Trended at 1.0083
Annual Potential Gross Income - Restricted Rental Rates: The subject’s annual potential grossincome - as restricted rent has been estimated as follows:
POTENTIAL GROSS INCOME - WITH RESTRICTIONS
Bedrooms BA No.Units
Type AMI%
SquareFeet
TenantRent
SubsidyRent
Mo. NetRent
Total Mo. Rent
AnnualIncome
Trended Income
Eff/Studio 1 49 PBV 30.0% 298 $283.00 $919 $1,202 $58,898 $706,776 $712,642
Eff/Studio 1 20 VASH 30.0% 298 $283.00 $844 $1,127 $22,540 $270,480 $272,725
1 Bedroom 1 1 Staff Unit - MGR 450 - - - - - $0
Subsidy Rent (Per Proforma) $81,438 $977,256 $985,367
Tenant Rents (Per Proforma) $19,527 $234,324 $236,269
Totals 70 21,012 $100,965 $1,211,580 $1,221,636
* Trended at 1.0083
According to the Term Sheet via CCRC, the restricted rent levels of 30% AMI shall be allowed tofloat up to 59% AMI in the event of a loss of the PBV rental subsidy. Therefore, we used themaximum allowable rental rate for the 60% AMI units, or $1,246 per month. This produces ahigher income versus the PBV annual income figure.
Income Escalation: Costar indicates that asking rental rates will increase over the next five years,as follows:
110
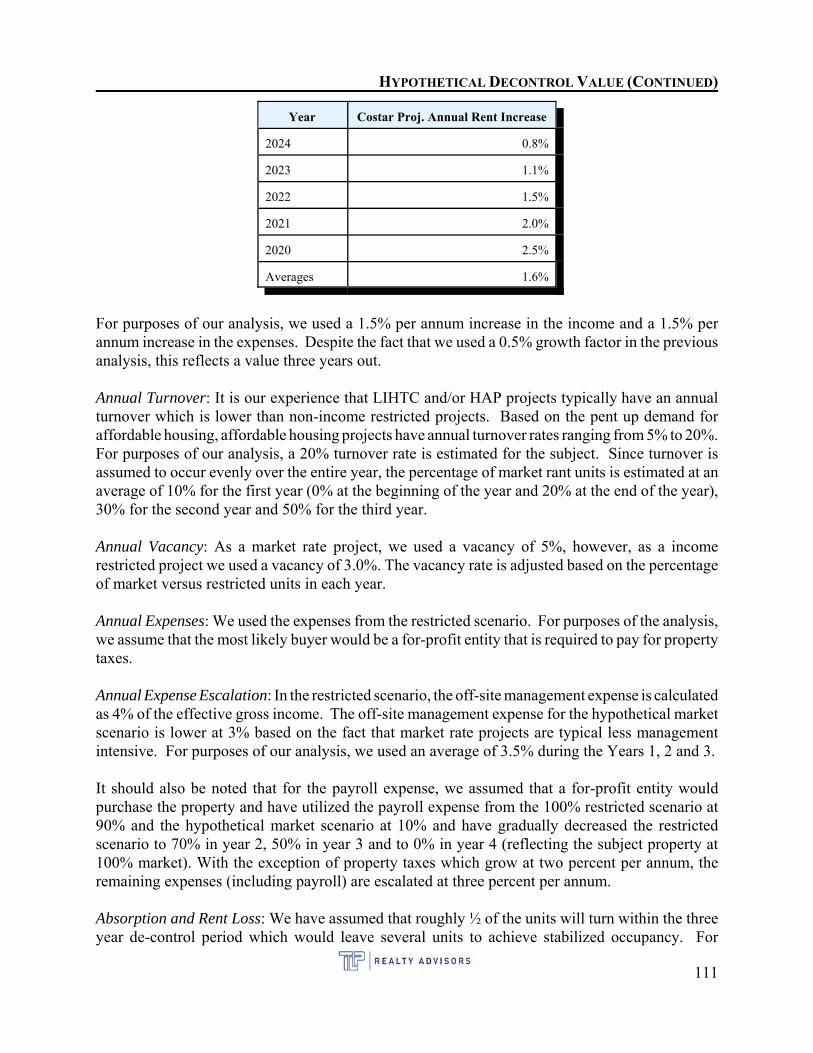
HYPOTHETICAL DECONTROL VALUE (CONTINUED)
Year Costar Proj. Annual Rent Increase
2024 0.8%
2023 1.1%
2022 1.5%
2021 2.0%
2020 2.5%
Averages 1.6%
For purposes of our analysis, we used a 1.5% per annum increase in the income and a 1.5% perannum increase in the expenses. Despite the fact that we used a 0.5% growth factor in the previousanalysis, this reflects a value three years out.
Annual Turnover: It is our experience that LIHTC and/or HAP projects typically have an annualturnover which is lower than non-income restricted projects. Based on the pent up demand foraffordable housing, affordable housing projects have annual turnover rates ranging from 5% to 20%. For purposes of our analysis, a 20% turnover rate is estimated for the subject. Since turnover isassumed to occur evenly over the entire year, the percentage of market rant units is estimated at anaverage of 10% for the first year (0% at the beginning of the year and 20% at the end of the year),30% for the second year and 50% for the third year.
Annual Vacancy: As a market rate project, we used a vacancy of 5%, however, as a incomerestricted project we used a vacancy of 3.0%. The vacancy rate is adjusted based on the percentageof market versus restricted units in each year.
Annual Expenses: We used the expenses from the restricted scenario. For purposes of the analysis,we assume that the most likely buyer would be a for-profit entity that is required to pay for propertytaxes.
Annual Expense Escalation: In the restricted scenario, the off-site management expense is calculatedas 4% of the effective gross income. The off-site management expense for the hypothetical marketscenario is lower at 3% based on the fact that market rate projects are typical less managementintensive. For purposes of our analysis, we used an average of 3.5% during the Years 1, 2 and 3.
It should also be noted that for the payroll expense, we assumed that a for-profit entity wouldpurchase the property and have utilized the payroll expense from the 100% restricted scenario at90% and the hypothetical market scenario at 10% and have gradually decreased the restrictedscenario to 70% in year 2, 50% in year 3 and to 0% in year 4 (reflecting the subject property at100% market). With the exception of property taxes which grow at two percent per annum, theremaining expenses (including payroll) are escalated at three percent per annum.
Absorption and Rent Loss: We have assumed that roughly ½ of the units will turn within the threeyear de-control period which would leave several units to achieve stabilized occupancy. For
111
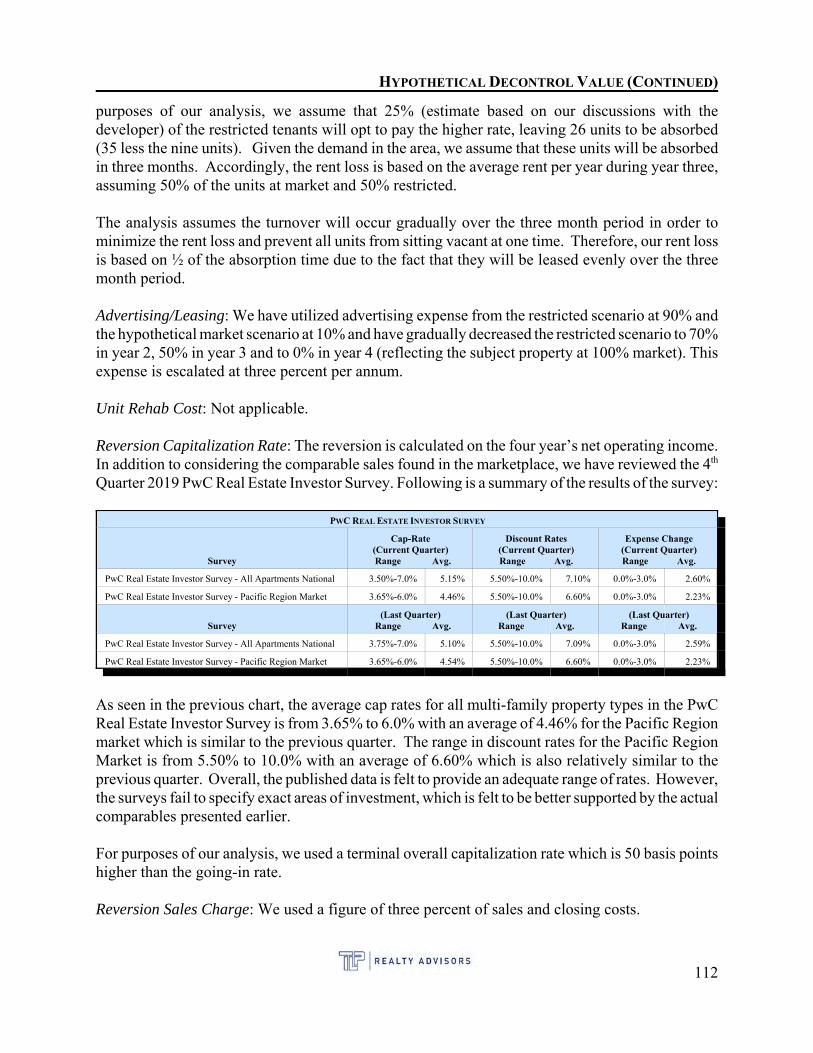
HYPOTHETICAL DECONTROL VALUE (CONTINUED)
purposes of our analysis, we assume that 25% (estimate based on our discussions with thedeveloper) of the restricted tenants will opt to pay the higher rate, leaving 26 units to be absorbed(35 less the nine units). Given the demand in the area, we assume that these units will be absorbedin three months. Accordingly, the rent loss is based on the average rent per year during year three,assuming 50% of the units at market and 50% restricted.
The analysis assumes the turnover will occur gradually over the three month period in order tominimize the rent loss and prevent all units from sitting vacant at one time. Therefore, our rent lossis based on ½ of the absorption time due to the fact that they will be leased evenly over the threemonth period.
Advertising/Leasing: We have utilized advertising expense from the restricted scenario at 90% andthe hypothetical market scenario at 10% and have gradually decreased the restricted scenario to 70%in year 2, 50% in year 3 and to 0% in year 4 (reflecting the subject property at 100% market). Thisexpense is escalated at three percent per annum.
Unit Rehab Cost: Not applicable.
Reversion Capitalization Rate: The reversion is calculated on the four year’s net operating income. In addition to considering the comparable sales found in the marketplace, we have reviewed the 4th
Quarter 2019 PwC Real Estate Investor Survey. Following is a summary of the results of the survey:
PWC REAL ESTATE INVESTOR SURVEY
Survey
Cap-Rate(Current Quarter)
Range Avg.
Discount Rates(Current Quarter)Range Avg.
Expense Change(Current Quarter)Range Avg.
PwC Real Estate Investor Survey - All Apartments National 3.50%-7.0% 5.15% 5.50%-10.0% 7.10% 0.0%-3.0% 2.60%
PwC Real Estate Investor Survey - Pacific Region Market 3.65%-6.0% 4.46% 5.50%-10.0% 6.60% 0.0%-3.0% 2.23%
Survey(Last Quarter)
Range Avg.(Last Quarter)
Range Avg.(Last Quarter)
Range Avg.
PwC Real Estate Investor Survey - All Apartments National 3.75%-7.0% 5.10% 5.50%-10.0% 7.09% 0.0%-3.0% 2.59%
PwC Real Estate Investor Survey - Pacific Region Market 3.65%-6.0% 4.54% 5.50%-10.0% 6.60% 0.0%-3.0% 2.23%
As seen in the previous chart, the average cap rates for all multi-family property types in the PwCReal Estate Investor Survey is from 3.65% to 6.0% with an average of 4.46% for the Pacific Regionmarket which is similar to the previous quarter. The range in discount rates for the Pacific RegionMarket is from 5.50% to 10.0% with an average of 6.60% which is also relatively similar to theprevious quarter. Overall, the published data is felt to provide an adequate range of rates. However,the surveys fail to specify exact areas of investment, which is felt to be better supported by the actualcomparables presented earlier.
For purposes of our analysis, we used a terminal overall capitalization rate which is 50 basis pointshigher than the going-in rate.
Reversion Sales Charge: We used a figure of three percent of sales and closing costs.
112
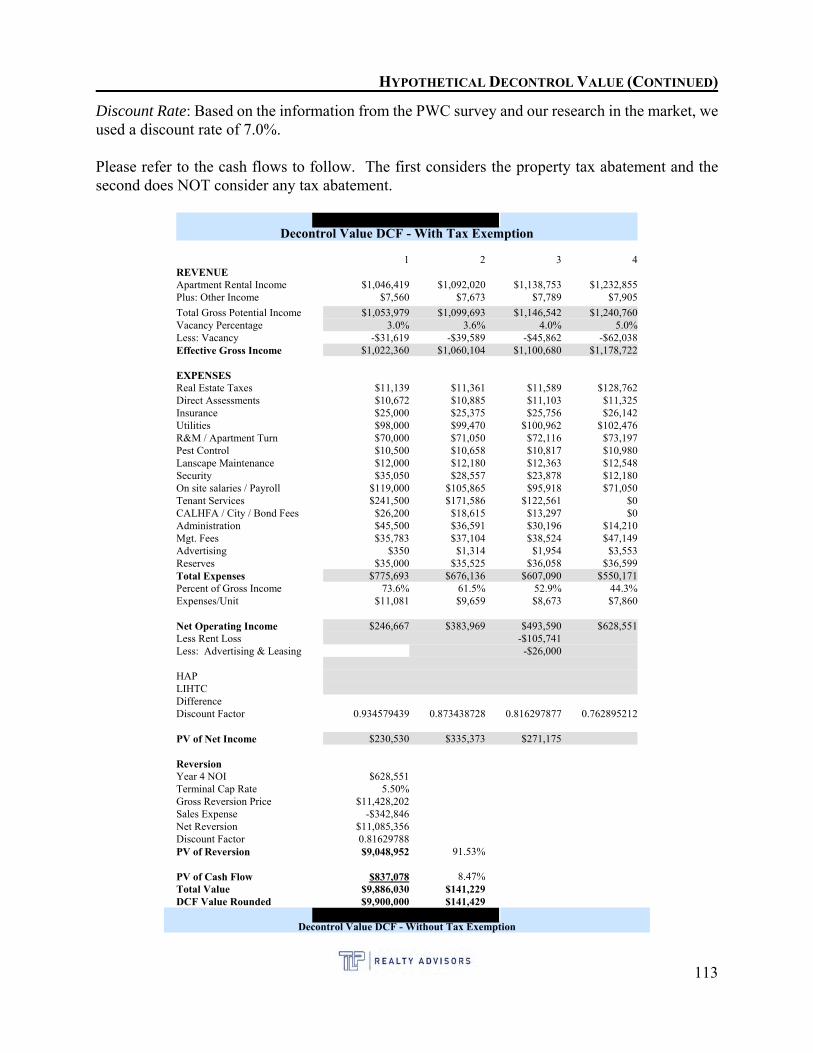
HYPOTHETICAL DECONTROL VALUE (CONTINUED)
Discount Rate: Based on the information from the PWC survey and our research in the market, weused a discount rate of 7.0%.
Please refer to the cash flows to follow. The first considers the property tax abatement and thesecond does NOT consider any tax abatement.
Decontrol Value DCF - With Tax Exemption
1 2 3 4REVENUEApartment Rental Income $1,046,419 $1,092,020 $1,138,753 $1,232,855Plus: Other Income $7,560 $7,673 $7,789 $7,905
Total Gross Potential Income $1,053,979 $1,099,693 $1,146,542 $1,240,760Vacancy Percentage 3.0% 3.6% 4.0% 5.0%Less: Vacancy -$31,619 -$39,589 -$45,862 -$62,038Effective Gross Income $1,022,360 $1,060,104 $1,100,680 $1,178,722
EXPENSESReal Estate Taxes $11,139 $11,361 $11,589 $128,762Direct Assessments $10,672 $10,885 $11,103 $11,325Insurance $25,000 $25,375 $25,756 $26,142Utilities $98,000 $99,470 $100,962 $102,476R&M / Apartment Turn $70,000 $71,050 $72,116 $73,197Pest Control $10,500 $10,658 $10,817 $10,980Lanscape Maintenance $12,000 $12,180 $12,363 $12,548Security $35,050 $28,557 $23,878 $12,180On site salaries / Payroll $119,000 $105,865 $95,918 $71,050Tenant Services $241,500 $171,586 $122,561 $0CALHFA / City / Bond Fees $26,200 $18,615 $13,297 $0Administration $45,500 $36,591 $30,196 $14,210Mgt. Fees $35,783 $37,104 $38,524 $47,149Advertising $350 $1,314 $1,954 $3,553Reserves $35,000 $35,525 $36,058 $36,599Total Expenses $775,693 $676,136 $607,090 $550,171Percent of Gross Income 73.6% 61.5% 52.9% 44.3%Expenses/Unit $11,081 $9,659 $8,673 $7,860
Net Operating Income $246,667 $383,969 $493,590 $628,551Less Rent Loss -$105,741Less: Advertising & Leasing -$26,000
HAPLIHTCDifferenceDiscount Factor 0.934579439 0.873438728 0.816297877 0.762895212
PV of Net Income $230,530 $335,373 $271,175
ReversionYear 4 NOI $628,551Terminal Cap Rate 5.50%Gross Reversion Price $11,428,202Sales Expense -$342,846Net Reversion $11,085,356Discount Factor 0.81629788PV of Reversion $9,048,952 91.53%
PV of Cash Flow $837,078 8.47%Total Value $9,886,030 $141,229DCF Value Rounded $9,900,000 $141,429
Decontrol Value DCF - Without Tax Exemption
113
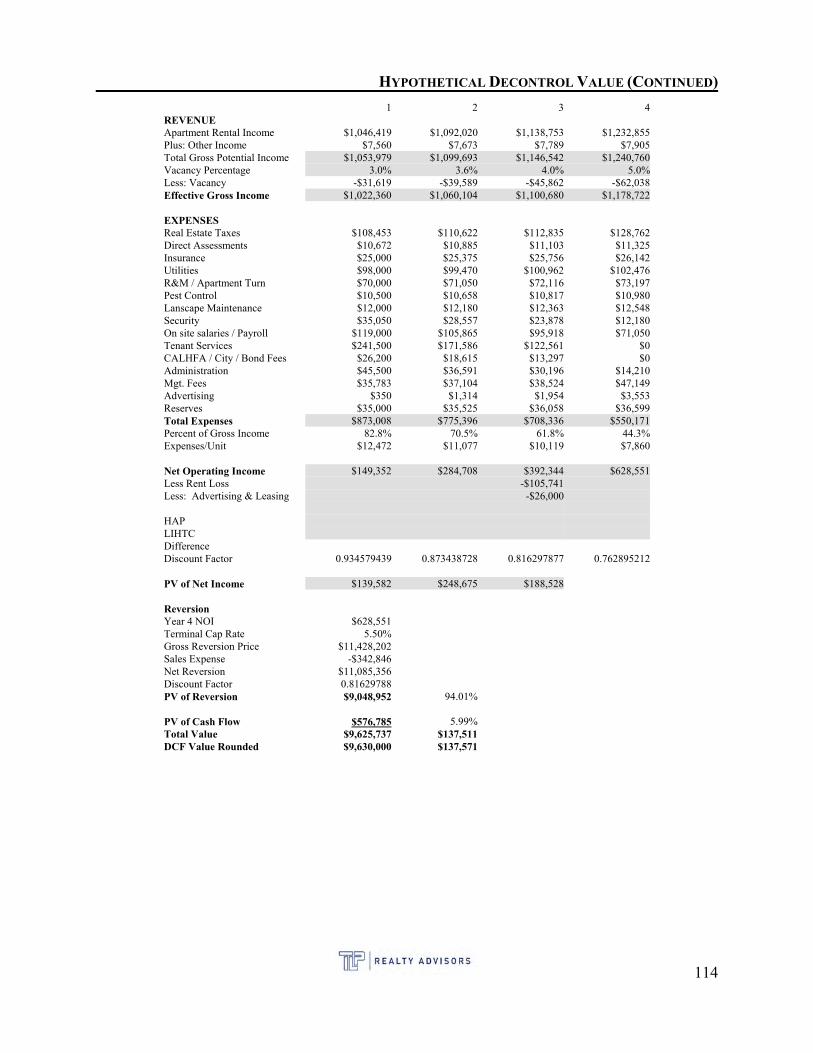
HYPOTHETICAL DECONTROL VALUE (CONTINUED)
1 2 3 4REVENUEApartment Rental Income $1,046,419 $1,092,020 $1,138,753 $1,232,855Plus: Other Income $7,560 $7,673 $7,789 $7,905Total Gross Potential Income $1,053,979 $1,099,693 $1,146,542 $1,240,760Vacancy Percentage 3.0% 3.6% 4.0% 5.0%Less: Vacancy -$31,619 -$39,589 -$45,862 -$62,038Effective Gross Income $1,022,360 $1,060,104 $1,100,680 $1,178,722
EXPENSESReal Estate Taxes $108,453 $110,622 $112,835 $128,762Direct Assessments $10,672 $10,885 $11,103 $11,325Insurance $25,000 $25,375 $25,756 $26,142Utilities $98,000 $99,470 $100,962 $102,476R&M / Apartment Turn $70,000 $71,050 $72,116 $73,197Pest Control $10,500 $10,658 $10,817 $10,980Lanscape Maintenance $12,000 $12,180 $12,363 $12,548Security $35,050 $28,557 $23,878 $12,180On site salaries / Payroll $119,000 $105,865 $95,918 $71,050Tenant Services $241,500 $171,586 $122,561 $0CALHFA / City / Bond Fees $26,200 $18,615 $13,297 $0Administration $45,500 $36,591 $30,196 $14,210Mgt. Fees $35,783 $37,104 $38,524 $47,149Advertising $350 $1,314 $1,954 $3,553Reserves $35,000 $35,525 $36,058 $36,599Total Expenses $873,008 $775,396 $708,336 $550,171Percent of Gross Income 82.8% 70.5% 61.8% 44.3%Expenses/Unit $12,472 $11,077 $10,119 $7,860
Net Operating Income $149,352 $284,708 $392,344 $628,551Less Rent Loss -$105,741Less: Advertising & Leasing -$26,000
HAPLIHTCDifferenceDiscount Factor 0.934579439 0.873438728 0.816297877 0.762895212
PV of Net Income $139,582 $248,675 $188,528
ReversionYear 4 NOI $628,551Terminal Cap Rate 5.50%Gross Reversion Price $11,428,202Sales Expense -$342,846Net Reversion $11,085,356Discount Factor 0.81629788PV of Reversion $9,048,952 94.01%
PV of Cash Flow $576,785 5.99%Total Value $9,625,737 $137,511DCF Value Rounded $9,630,000 $137,571
114
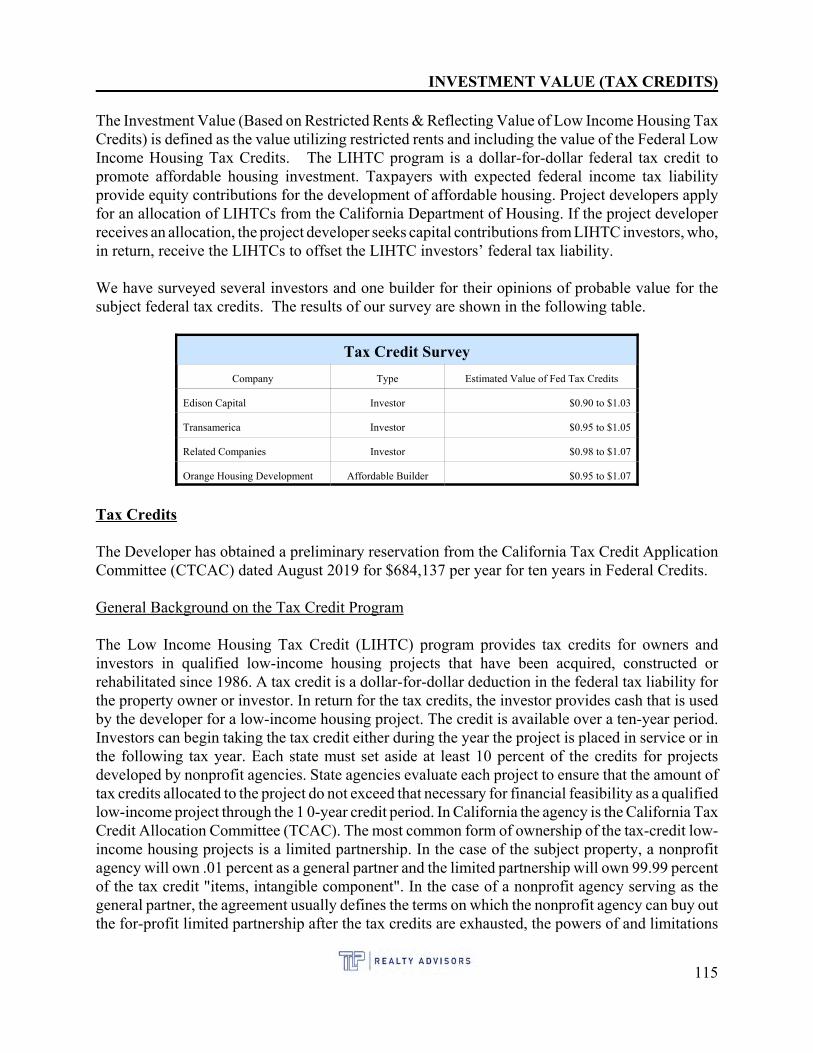
INVESTMENT VALUE (TAX CREDITS)
The Investment Value (Based on Restricted Rents & Reflecting Value of Low Income Housing TaxCredits) is defined as the value utilizing restricted rents and including the value of the Federal LowIncome Housing Tax Credits. The LIHTC program is a dollar-for-dollar federal tax credit topromote affordable housing investment. Taxpayers with expected federal income tax liabilityprovide equity contributions for the development of affordable housing. Project developers applyfor an allocation of LIHTCs from the California Department of Housing. If the project developerreceives an allocation, the project developer seeks capital contributions from LIHTC investors, who,in return, receive the LIHTCs to offset the LIHTC investors’ federal tax liability.
We have surveyed several investors and one builder for their opinions of probable value for thesubject federal tax credits. The results of our survey are shown in the following table.
Tax Credit Survey
Company Type Estimated Value of Fed Tax Credits
Edison Capital Investor $0.90 to $1.03
Transamerica Investor $0.95 to $1.05
Related Companies Investor $0.98 to $1.07
Orange Housing Development Affordable Builder $0.95 to $1.07
Tax Credits
The Developer has obtained a preliminary reservation from the California Tax Credit ApplicationCommittee (CTCAC) dated August 2019 for $684,137 per year for ten years in Federal Credits.
General Background on the Tax Credit Program
The Low Income Housing Tax Credit (LIHTC) program provides tax credits for owners andinvestors in qualified low-income housing projects that have been acquired, constructed orrehabilitated since 1986. A tax credit is a dollar-for-dollar deduction in the federal tax liability forthe property owner or investor. In return for the tax credits, the investor provides cash that is usedby the developer for a low-income housing project. The credit is available over a ten-year period.Investors can begin taking the tax credit either during the year the project is placed in service or inthe following tax year. Each state must set aside at least 10 percent of the credits for projectsdeveloped by nonprofit agencies. State agencies evaluate each project to ensure that the amount oftax credits allocated to the project do not exceed that necessary for financial feasibility as a qualifiedlow-income project through the 1 0-year credit period. In California the agency is the California TaxCredit Allocation Committee (TCAC). The most common form of ownership of the tax-credit low-income housing projects is a limited partnership. In the case of the subject property, a nonprofitagency will own .01 percent as a general partner and the limited partnership will own 99.99 percentof the tax credit "items, intangible component". In the case of a nonprofit agency serving as thegeneral partner, the agreement usually defines the terms on which the nonprofit agency can buy outthe for-profit limited partnership after the tax credits are exhausted, the powers of and limitations
115
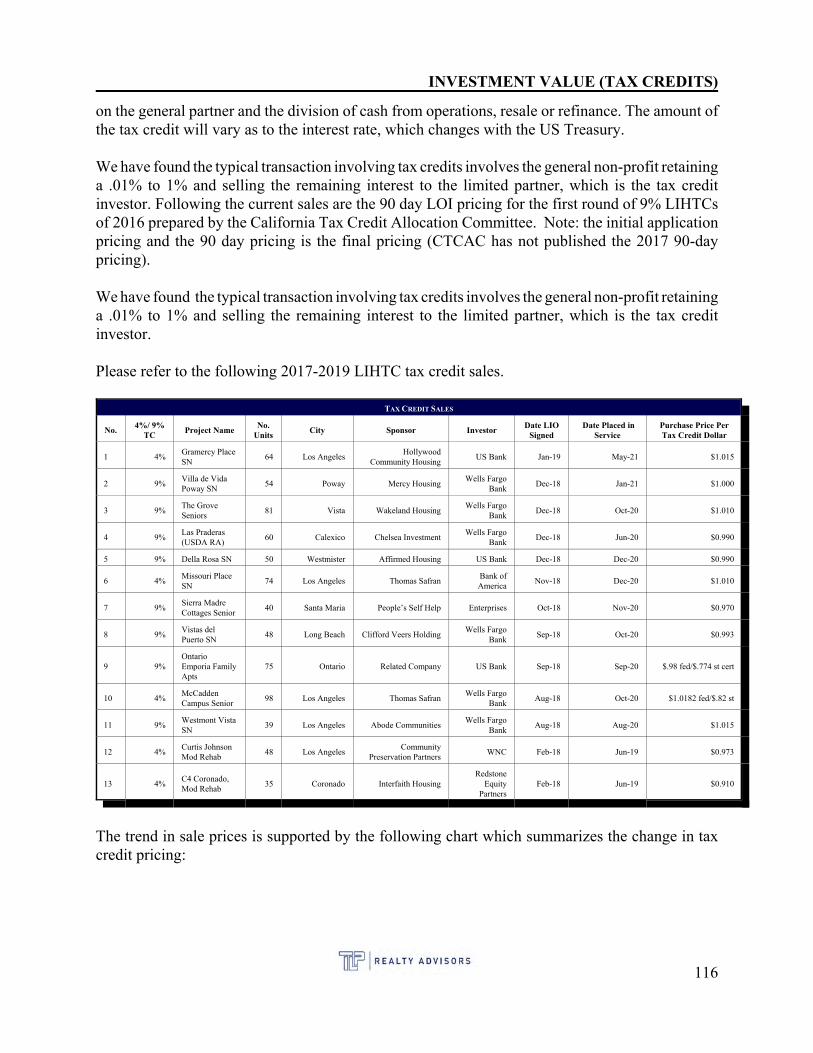
INVESTMENT VALUE (TAX CREDITS)
on the general partner and the division of cash from operations, resale or refinance. The amount ofthe tax credit will vary as to the interest rate, which changes with the US Treasury.
We have found the typical transaction involving tax credits involves the general non-profit retaininga .01% to 1% and selling the remaining interest to the limited partner, which is the tax creditinvestor. Following the current sales are the 90 day LOI pricing for the first round of 9% LIHTCsof 2016 prepared by the California Tax Credit Allocation Committee. Note: the initial applicationpricing and the 90 day pricing is the final pricing (CTCAC has not published the 2017 90-daypricing).
We have found the typical transaction involving tax credits involves the general non-profit retaininga .01% to 1% and selling the remaining interest to the limited partner, which is the tax creditinvestor.
Please refer to the following 2017-2019 LIHTC tax credit sales.
TAX CREDIT SALES
No.4%/ 9%
TCProject Name
No.Units
City Sponsor InvestorDate LIO
Signed Date Placed in
ServicePurchase Price PerTax Credit Dollar
1 4%Gramercy PlaceSN
64 Los AngelesHollywood
Community HousingUS Bank Jan-19 May-21 $1.015
2 9%Villa de VidaPoway SN
54 Poway Mercy HousingWells Fargo
BankDec-18 Jan-21 $1.000
3 9%The GroveSeniors
81 Vista Wakeland HousingWells Fargo
BankDec-18 Oct-20 $1.010
4 9%Las Praderas(USDA RA)
60 Calexico Chelsea InvestmentWells Fargo
BankDec-18 Jun-20 $0.990
5 9% Della Rosa SN 50 Westmister Affirmed Housing US Bank Dec-18 Dec-20 $0.990
6 4%Missouri PlaceSN
74 Los Angeles Thomas SafranBank ofAmerica
Nov-18 Dec-20 $1.010
7 9%Sierra MadreCottages Senior
40 Santa Maria People’s Self Help Enterprises Oct-18 Nov-20 $0.970
8 9%Vistas delPuerto SN
48 Long Beach Clifford Veers HoldingWells Fargo
BankSep-18 Oct-20 $0.993
9 9%OntarioEmporia FamilyApts
75 Ontario Related Company US Bank Sep-18 Sep-20 $.98 fed/$.774 st cert
10 4%McCaddenCampus Senior
98 Los Angeles Thomas SafranWells Fargo
BankAug-18 Oct-20 $1.0182 fed/$.82 st
11 9%Westmont VistaSN
39 Los Angeles Abode CommunitiesWells Fargo
BankAug-18 Aug-20 $1.015
12 4%Curtis JohnsonMod Rehab
48 Los AngelesCommunity
Preservation PartnersWNC Feb-18 Jun-19 $0.973
13 4%C4 Coronado,Mod Rehab
35 Coronado Interfaith HousingRedstone
EquityPartners
Feb-18 Jun-19 $0.910
The trend in sale prices is supported by the following chart which summarizes the change in taxcredit pricing:
116
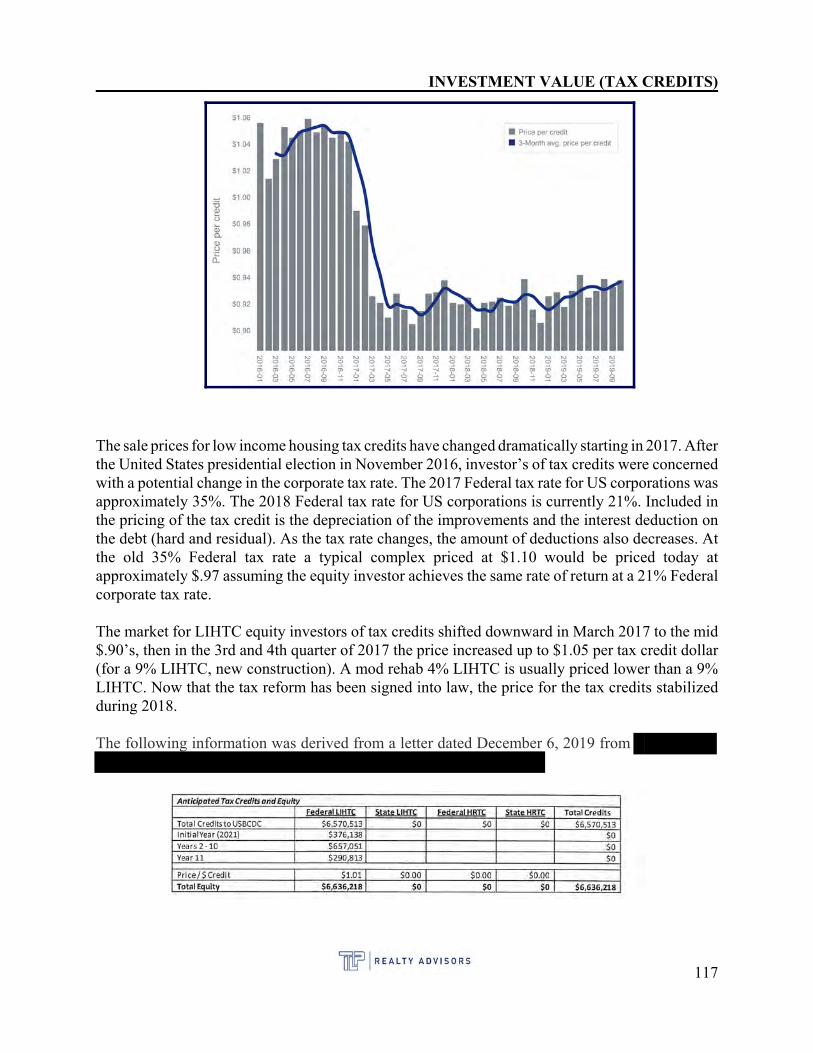
INVESTMENT VALUE (TAX CREDITS)
The sale prices for low income housing tax credits have changed dramatically starting in 2017. Afterthe United States presidential election in November 2016, investor’s of tax credits were concernedwith a potential change in the corporate tax rate. The 2017 Federal tax rate for US corporations wasapproximately 35%. The 2018 Federal tax rate for US corporations is currently 21%. Included inthe pricing of the tax credit is the depreciation of the improvements and the interest deduction onthe debt (hard and residual). As the tax rate changes, the amount of deductions also decreases. Atthe old 35% Federal tax rate a typical complex priced at $1.10 would be priced today atapproximately $.97 assuming the equity investor achieves the same rate of return at a 21% Federalcorporate tax rate.
The market for LIHTC equity investors of tax credits shifted downward in March 2017 to the mid$.90’s, then in the 3rd and 4th quarter of 2017 the price increased up to $1.05 per tax credit dollar(for a 9% LIHTC, new construction). A mod rehab 4% LIHTC is usually priced lower than a 9%LIHTC. Now that the tax reform has been signed into law, the price for the tax credits stabilizedduring 2018.
The following information was derived from a letter dated December 6, 2019 from
117
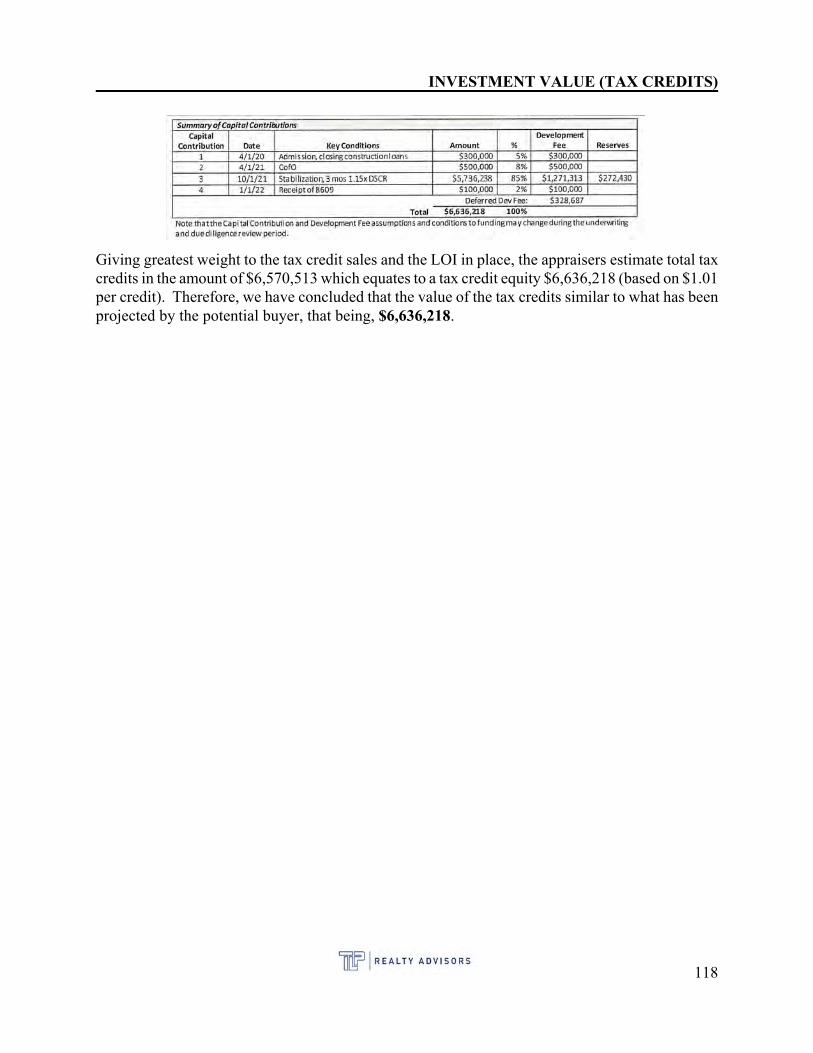
INVESTMENT VALUE (TAX CREDITS)
Giving greatest weight to the tax credit sales and the LOI in place, the appraisers estimate total taxcredits in the amount of $6,570,513 which equates to a tax credit equity $6,636,218 (based on $1.01per credit). Therefore, we have concluded that the value of the tax credits similar to what has beenprojected by the potential buyer, that being, $6,636,218.
118
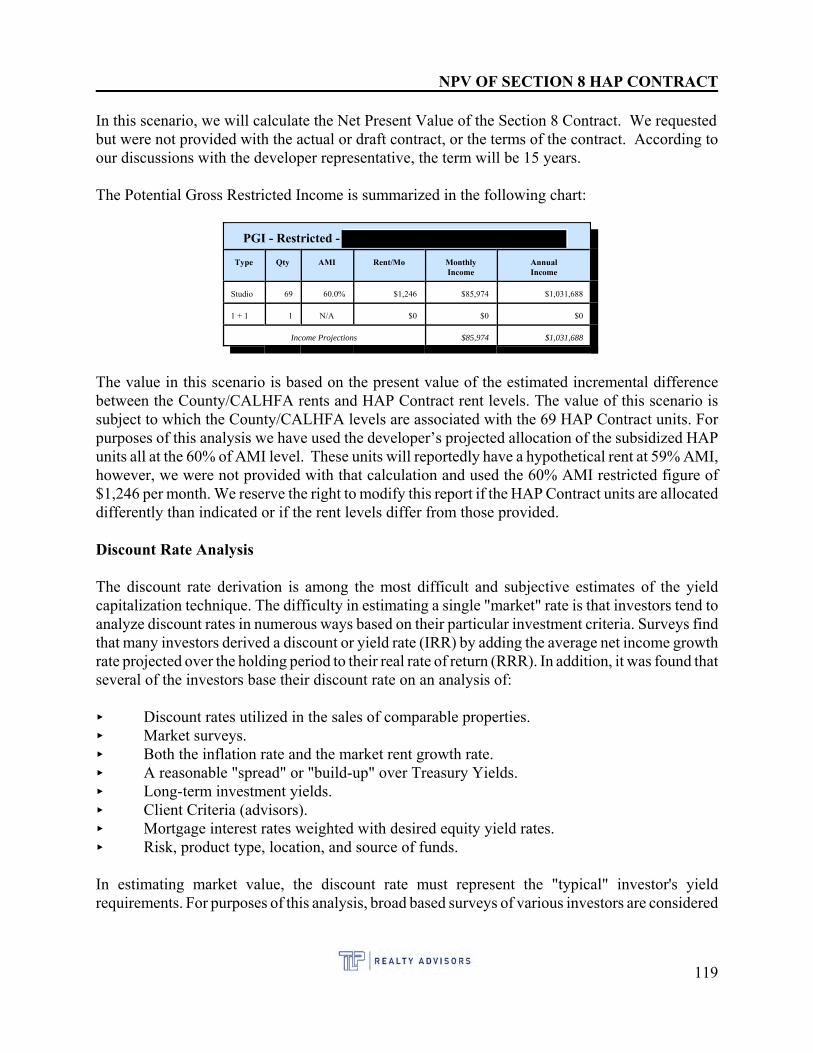
NPV OF SECTION 8 HAP CONTRACT
In this scenario, we will calculate the Net Present Value of the Section 8 Contract. We requestedbut were not provided with the actual or draft contract, or the terms of the contract. According toour discussions with the developer representative, the term will be 15 years.
The Potential Gross Restricted Income is summarized in the following chart:
PGI - Restricted -
Type Qty AMI Rent/Mo MonthlyIncome
AnnualIncome
Studio 69 60.0% $1,246 $85,974 $1,031,688
1 + 1 1 N/A $0 $0 $0
Income Projections $85,974 $1,031,688
The value in this scenario is based on the present value of the estimated incremental differencebetween the County/CALHFA rents and HAP Contract rent levels. The value of this scenario issubject to which the County/CALHFA levels are associated with the 69 HAP Contract units. Forpurposes of this analysis we have used the developer’s projected allocation of the subsidized HAPunits all at the 60% of AMI level. These units will reportedly have a hypothetical rent at 59% AMI,however, we were not provided with that calculation and used the 60% AMI restricted figure of$1,246 per month. We reserve the right to modify this report if the HAP Contract units are allocateddifferently than indicated or if the rent levels differ from those provided.
Discount Rate Analysis
The discount rate derivation is among the most difficult and subjective estimates of the yieldcapitalization technique. The difficulty in estimating a single "market" rate is that investors tend toanalyze discount rates in numerous ways based on their particular investment criteria. Surveys findthat many investors derived a discount or yield rate (IRR) by adding the average net income growthrate projected over the holding period to their real rate of return (RRR). In addition, it was found thatseveral of the investors base their discount rate on an analysis of:
< Discount rates utilized in the sales of comparable properties.< Market surveys.< Both the inflation rate and the market rent growth rate.< A reasonable "spread" or "build-up" over Treasury Yields.< Long-term investment yields.< Client Criteria (advisors).< Mortgage interest rates weighted with desired equity yield rates.< Risk, product type, location, and source of funds.
In estimating market value, the discount rate must represent the "typical" investor's yieldrequirements. For purposes of this analysis, broad based surveys of various investors are considered
119
NPV OF SECTION 8 HAP CONTRACT (CONTINUED)
to provide the most reliable indication of yield requirements for the subject property. The discountrate selection is based on the PwC Real Estate Investor Survey completed in the 4th Quarter 2019.
This national survey represents a wide range of properties and investors. In applying the survey tothe subject, the particular strength of the subject's income stream must be considered. In this case,the income stream is based on the initial HAP Contract term of 15 years, resulting in more un-certainties in the future projections of income compared to a shorter term. The primary risk in thisScenario is not receiving sufficient appropriations from HUD to cover the subsidy. Based on ourprimary interviews with market participants there appears to be support from both political partiesin the federal government for the Section 8 program, suggesting long term funding for the programis perceived as very stable. Based on these factors, a discount rate of 7.00% towards the low end ofthe range appears reasonable.
Annual Potential Gross Income – LIHTC Rent
The value in this scenario is based on the present value of the estimated incremental differencebetween the County/CALHFA levels and HAP Contract rent levels. The value of this scenario issubject to which County/CALHFA rent levels are associated with the HAP Contract units. Forpurposes of this analysis we have used the developer’s projected allocation of the subsidized HAPunits all at the 60% of AMI level.
Income Escalation
The subject’s restricted rental income increase is estimated at 1.0% per year for both income streamsbased on long term anticipated increase in AMI and payment standard adjustments.
Discount Rate Analysis
The discount rate derivation is among the most difficult and subjective estimates of the yieldcapitalization technique. The difficulty in estimating a single "market" rate is that investors tend toanalyze discount rates in numerous ways based on their particular investment criteria. Surveys findthat many investors derived a discount or yield rate (IRR) by adding the average net income growthrate projected over the holding period to their real rate of return (RRR). In addition, it was found thatseveral of the investors base their discount rate on an analysis of:
• Discount rates utilized in the sales of comparable properties.• Market surveys.• Both the inflation rate and the market rent growth rate.• A reasonable "spread" or "build-up" over Treasury Yields.• Long-term investment yields.• Client Criteria (advisors).• Mortgage interest rates weighted with desired equity yield rates.• Risk, product type, location, and source of funds.
In estimating market value, the discount rate must represent the "typical" investor's yieldrequirements. For purposes of this analysis, broad based surveys of various investors are consideredto provide the most reliable indication of yield requirements for the subject property. The discount
120
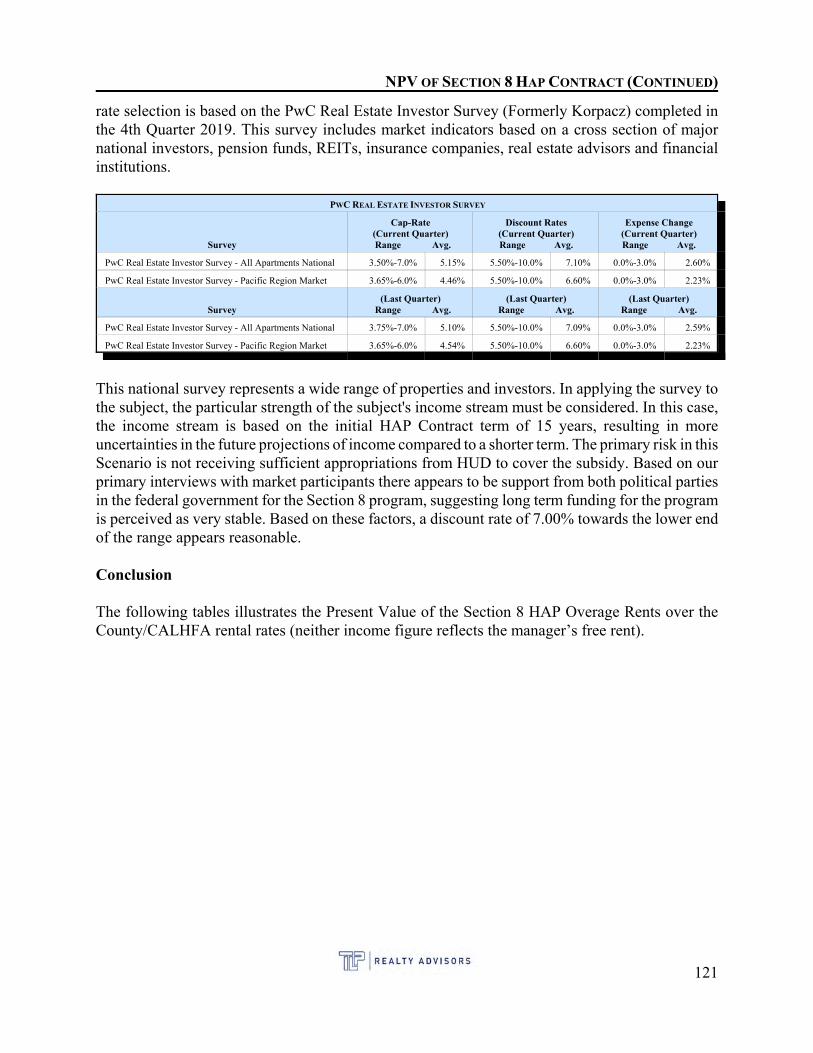
NPV OF SECTION 8 HAP CONTRACT (CONTINUED)
rate selection is based on the PwC Real Estate Investor Survey (Formerly Korpacz) completed inthe 4th Quarter 2019. This survey includes market indicators based on a cross section of majornational investors, pension funds, REITs, insurance companies, real estate advisors and financialinstitutions.
PWC REAL ESTATE INVESTOR SURVEY
Survey
Cap-Rate(Current Quarter)
Range Avg.
Discount Rates(Current Quarter)Range Avg.
Expense Change(Current Quarter)Range Avg.
PwC Real Estate Investor Survey - All Apartments National 3.50%-7.0% 5.15% 5.50%-10.0% 7.10% 0.0%-3.0% 2.60%
PwC Real Estate Investor Survey - Pacific Region Market 3.65%-6.0% 4.46% 5.50%-10.0% 6.60% 0.0%-3.0% 2.23%
Survey(Last Quarter)
Range Avg.(Last Quarter)
Range Avg.(Last Quarter)
Range Avg.
PwC Real Estate Investor Survey - All Apartments National 3.75%-7.0% 5.10% 5.50%-10.0% 7.09% 0.0%-3.0% 2.59%
PwC Real Estate Investor Survey - Pacific Region Market 3.65%-6.0% 4.54% 5.50%-10.0% 6.60% 0.0%-3.0% 2.23%
This national survey represents a wide range of properties and investors. In applying the survey tothe subject, the particular strength of the subject's income stream must be considered. In this case,the income stream is based on the initial HAP Contract term of 15 years, resulting in moreuncertainties in the future projections of income compared to a shorter term. The primary risk in thisScenario is not receiving sufficient appropriations from HUD to cover the subsidy. Based on ourprimary interviews with market participants there appears to be support from both political partiesin the federal government for the Section 8 program, suggesting long term funding for the programis perceived as very stable. Based on these factors, a discount rate of 7.00% towards the lower endof the range appears reasonable.
Conclusion
The following tables illustrates the Present Value of the Section 8 HAP Overage Rents over theCounty/CALHFA rental rates (neither income figure reflects the manager’s free rent).
121
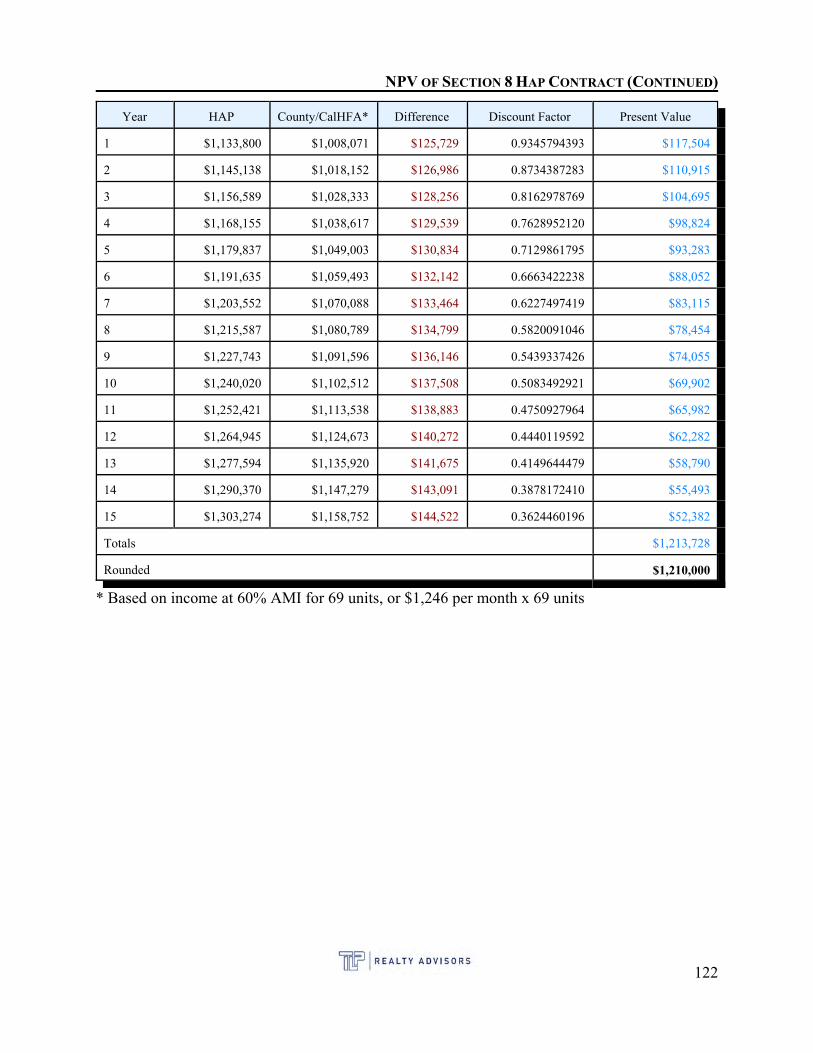
NPV OF SECTION 8 HAP CONTRACT (CONTINUED)
Year HAP County/CalHFA* Difference Discount Factor Present Value
1 $1,133,800 $1,008,071 $125,729 0.9345794393 $117,504
2 $1,145,138 $1,018,152 $126,986 0.8734387283 $110,915
3 $1,156,589 $1,028,333 $128,256 0.8162978769 $104,695
4 $1,168,155 $1,038,617 $129,539 0.7628952120 $98,824
5 $1,179,837 $1,049,003 $130,834 0.7129861795 $93,283
6 $1,191,635 $1,059,493 $132,142 0.6663422238 $88,052
7 $1,203,552 $1,070,088 $133,464 0.6227497419 $83,115
8 $1,215,587 $1,080,789 $134,799 0.5820091046 $78,454
9 $1,227,743 $1,091,596 $136,146 0.5439337426 $74,055
10 $1,240,020 $1,102,512 $137,508 0.5083492921 $69,902
11 $1,252,421 $1,113,538 $138,883 0.4750927964 $65,982
12 $1,264,945 $1,124,673 $140,272 0.4440119592 $62,282
13 $1,277,594 $1,135,920 $141,675 0.4149644479 $58,790
14 $1,290,370 $1,147,279 $143,091 0.3878172410 $55,493
15 $1,303,274 $1,158,752 $144,522 0.3624460196 $52,382
Totals $1,213,728
Rounded $1,210,000
* Based on income at 60% AMI for 69 units, or $1,246 per month x 69 units
122

ADDENDA

EXHIBIT A

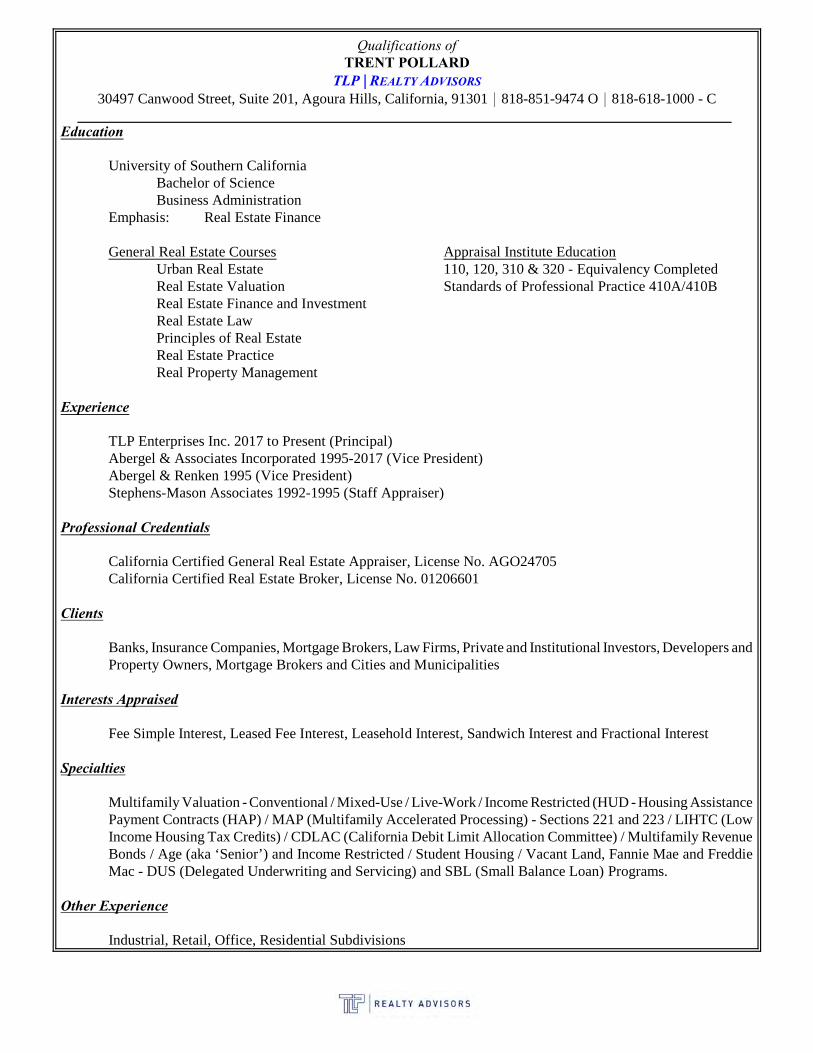
Qualifications ofTRENT POLLARD
TLP | REALTY ADVISORS
30497 Canwood Street, Suite 201, Agoura Hills, California, 91301 * 818-851-9474 O * 818-618-1000 - C
Education
University of Southern CaliforniaBachelor of ScienceBusiness Administration
Emphasis: Real Estate Finance
General Real Estate Courses Appraisal Institute EducationUrban Real Estate 110, 120, 310 & 320 - Equivalency CompletedReal Estate Valuation Standards of Professional Practice 410A/410BReal Estate Finance and InvestmentReal Estate LawPrinciples of Real EstateReal Estate PracticeReal Property Management
Experience
TLP Enterprises Inc. 2017 to Present (Principal)Abergel & Associates Incorporated 1995-2017 (Vice President)Abergel & Renken 1995 (Vice President)Stephens-Mason Associates 1992-1995 (Staff Appraiser)
Professional Credentials
California Certified General Real Estate Appraiser, License No. AGO24705California Certified Real Estate Broker, License No. 01206601
Clients
Banks, Insurance Companies, Mortgage Brokers, Law Firms, Private and Institutional Investors, Developers andProperty Owners, Mortgage Brokers and Cities and Municipalities
Interests Appraised
Fee Simple Interest, Leased Fee Interest, Leasehold Interest, Sandwich Interest and Fractional Interest
Specialties
Multifamily Valuation - Conventional / Mixed-Use / Live-Work / Income Restricted (HUD - Housing AssistancePayment Contracts (HAP) / MAP (Multifamily Accelerated Processing) - Sections 221 and 223 / LIHTC (LowIncome Housing Tax Credits) / CDLAC (California Debit Limit Allocation Committee) / Multifamily RevenueBonds / Age (aka ‘Senior’) and Income Restricted / Student Housing / Vacant Land, Fannie Mae and FreddieMac - DUS (Delegated Underwriting and Servicing) and SBL (Small Balance Loan) Programs.
Other Experience
Industrial, Retail, Office, Residential Subdivisions

EXHIBIT B


EXHIBIT C


EXHIBIT D


EXHIBIT E


EXHIBIT F


Related Documents