Optimization of an industrial L-lysine producing Corynebacterium glutamicum strain Industrial Ph.D. Thesis Kjeld Raunkjær Kjeldsen Center for Microbial Biotechnology Department of Systems Biology Technical University of Denmark and Agro&Ferm A/S 2008

Welcome message from author
This document is posted to help you gain knowledge. Please leave a comment to let me know what you think about it! Share it to your friends and learn new things together.
Transcript
7/18/2019 Samlet PhD 20090416 U-Forside Appendix.pdf
http://slidepdf.com/reader/full/samlet-phd-20090416-u-forside-appendixpdf 1/187
Optimization of an industrial L-lysine
producing Corynebacterium glutamicum strain
Industrial Ph.D. Thesis
Kjeld Raunkjær Kjeldsen
Center for Microbial Biotechnology
Department of Systems Biology
Technical University of Denmark
and
Agro&Ferm A/S
2008

7/18/2019 Samlet PhD 20090416 U-Forside Appendix.pdf
http://slidepdf.com/reader/full/samlet-phd-20090416-u-forside-appendixpdf 2/187
7/18/2019 Samlet PhD 20090416 U-Forside Appendix.pdf
http://slidepdf.com/reader/full/samlet-phd-20090416-u-forside-appendixpdf 3/187
Preface
This research work was carried out at Center for Microbial Biotechnology, the Technical Universityof Denmark and at Agro&Ferm A/S, during June 2005-June-2008 under the supervision ofProfessor Jens Nielsen. The project was an Industrial PhD project.
I would like to express my thanks to Jens Nielsen for guiding me through the PhD study, and formany fruitful discussions and brilliant ideas. Without his convincing and engaged supervision I amsure this project would not have been the same.
I would like to express my thanks to my colleagues at CMB. It has been a pleasure to be part of theCMB family, and I have had the opportunity to work with many of you. I would like to thank AnaOliveira and Michael Rørdam Andersen for helping at the construction of the genome-scale model.
I would like to thank Anni Jensen, Anna Lantz and Jette Tykjær for assistance at metabolic fluxestimations.
I would also like to thank my colleagues at Agro&Ferm A/S. Many of you have assisted this work by sample taking and other experimental work. I would like to express a special thank to CEO,Vagn Hundebøll for giving me the opportunity to do a PhD project. And I would like to thankManager of R&D, Henrik Pedersen for many fruitful discussions about this project and future
perspectives.
Last but not least I would like to thank my friends and my family for support and encouragementthroughout this Ph.D. study. They were behind me throughout and I thank them sincerely.
Kjeld Raunkjær KjeldsenJune 2008

7/18/2019 Samlet PhD 20090416 U-Forside Appendix.pdf
http://slidepdf.com/reader/full/samlet-phd-20090416-u-forside-appendixpdf 4/187
7/18/2019 Samlet PhD 20090416 U-Forside Appendix.pdf
http://slidepdf.com/reader/full/samlet-phd-20090416-u-forside-appendixpdf 5/187
7
Content
Preface.................................................................................................................................................5 Content................................................................................................................................................7 Summary.............................................................................................................................................9 Dansk Sammenfatning.....................................................................................................................11 1. Introduction..................................................................................................................................13
Corynebacterium – A working horse in amino acid production....................................................14Industrial L-lysine production........................................................................................................14The lysine synthetic pathway in C. glutamicum............................................................................15Maximal lysine yield for C. glutamicum .......................................................................................16Production strain development ......................................................................................................18Outline and background for PhD thesis .........................................................................................18References......................................................................................................................................18
2. Flux balance analysis and metabolic engineering .....................................................................21 Stoichiometri and structure of biochemical reaction networks......................................................21Flux balance analysis .....................................................................................................................23Reconstruction of the metabolic network ......................................................................................25Metabolic flux analysis ..................................................................................................................27Current status for metabolic engineering activities in C. glutamicum...........................................29References......................................................................................................................................38
3. Microbiology and biochemistry of Corynebacterium glutamicum ...........................................47 Microbiology of Corynebacterium glutamicum ............................................................................47
The Corynebacterium glutamicum genome...................................................................................48Biochemistry of C. glutamicum .....................................................................................................48References......................................................................................................................................75
4. In Silico Genome-Scale Reconstruction and Validation of the Corynebacterium glutamicum
Metabolic Network...........................................................................................................................89 Abstract ..........................................................................................................................................90Introduction....................................................................................................................................90Materials and Methods...................................................................................................................91Results & Discussion .....................................................................................................................94Conclusions..................................................................................................................................108Acknowledgments........................................................................................................................109
References....................................................................................................................................1095. Comparative analysis of eight metabolic engineering strategies implemented in an L-lysine
producing Corynebacterium glutamicum production strain.......................................................115 Abstract ........................................................................................................................................116Introduction..................................................................................................................................116Materials and methods .................................................................................................................118Results and discussion .................................................................................................................122Acknowledgments........................................................................................................................128References....................................................................................................................................128
6. Metabolic network analysis of Corynebacterium glutamicum during L-lysine production in
CSL based complex medium using13
C-labeled glucose.............................................................131
Abstract ........................................................................................................................................132
7/18/2019 Samlet PhD 20090416 U-Forside Appendix.pdf
http://slidepdf.com/reader/full/samlet-phd-20090416-u-forside-appendixpdf 6/187
8
Introduction..................................................................................................................................132Materials and Methods.................................................................................................................133Results..........................................................................................................................................139Conclusion ...................................................................................................................................147
References....................................................................................................................................148Conclusion and discussion.............................................................................................................151
Reconstruction and analysis of C. glutamicum metabolic network.............................................151Comparison of various metabolic engineering strategies in a high producing C. glutamicum strain......................................................................................................................................................152In vivo flux estimations under industrial relevant conditions......................................................152Industrial relevance of project......................................................................................................153
Apendix I………………………………………………………………………………………….154
Apendix II…………………………………………………………………………………………178
7/18/2019 Samlet PhD 20090416 U-Forside Appendix.pdf
http://slidepdf.com/reader/full/samlet-phd-20090416-u-forside-appendixpdf 7/187
Summary ________________________________________________________________________________
9
Summary
Optimization of lysine production in an industrial relevant lysine producing Corynebacterium
glutamicum strain was done using a combination of mathematically modelling, metabolicengineering and metabolic flux estimation.
A mathematical model of the metabolic network of C. glutamicum based on genomic information,and based on the wealth of biochemical information which is available for this organism due to itslong history as a commercial relevant organism was constructed and validated against earlier
published data. The model comprising 446 reactions and 411 metabolites was extensively validatedagainst earlier published data. The model was used to analyze the metabolic network during lysine
production, and based on this a number of biochemical hypotheses were suggested to improve
lysine production in C. glutamicum. The first prediction made by the model was that a high ATP production under high lysine production resulted in a limitation in lysine production. This was thecase at high lysine yield (>55%) and low growth. Secondly, the model predicted a limitation inlysine production when the succinylase branch of the lysine synthetic pathway was preferred overthe dehydrogenase branch. The result was a decrease in maximal theoretical lysine yield from 0.75mmol lysine ⋅ (mmol glucose)-1 to 0.57 mmol lysine ⋅ (mmol glucose)-1 due to a relatively higheractivity of the TCA cycle because of the involvement of the TCA intermediate Succinyl-CoA. Thehigher TCA cycle activity was suboptimal for lysine production because of a loss of carbon due toCO2 –production. Thirdly, the model predicted a correlation between a high pentose phosphate
pathway flux and high lysine production. The fourth prediction made from the analysis of the in
silico model was that there is a correlation between increasing anaplerotic net flux and increasinglysine production.
Various metabolic engineering strategies were tested in a high producing C. glutamicum strainBased on the findings in the metabolic network reconstruction and based on results reported inliterature three parts of the metabolism were selected for metabolic engineering. As predicted by thein silico model the pentose phosphate pathway is a target as it may lead to an increase in the
NADPH formation. The two NADPH generating enzymes glucose-6-phosphate dehydrogenase( zwf ) and 6-phosphogluconate dehydrogenase ( gnd ) were up-regulated, and both modifications wereseen to have a positive effect on lysine yield of 5% and 6%, respectively, indicating that NADPHwas in fact limiting under high lysine producing conditions. The enzyme pyruvate carboxylase was
also selected for up-regulations to increase the anaplerotic net flux, which is believed to be beneficial for lysine production based on findings in literature and predictions by the in silico model. This modification resulted in a decrease in lysine production and did not fit the initialexpectations. Five enzymes in the lysine synthetic pathway were selected for up-regulation based onresults found in literature. The enzymes were aspartate kinase (lysC ), dihydrodipicolate syntase(dapA), succinylaminoketopimelate transaminase (dapC ), diaminopimelate epimerase (dapF ) andlysine permerase (lysE ). Only the strain with an up-regulated aspartate kinase activity showed asignificant effect on the overall lysine yield, and this effect was negative. In this study it was seenthat although metabolic engineering strategies had earlier shown to be beneficial for lysine
production in C. glutamicum strains, many of these strategies could not be transferred directly to ahigh producing industrial strain.

7/18/2019 Samlet PhD 20090416 U-Forside Appendix.pdf
http://slidepdf.com/reader/full/samlet-phd-20090416-u-forside-appendixpdf 8/187
Summary ________________________________________________________________________________
10
Finally, estimations of in vivo fluxes under growth and lysine production in complex medium andduring batch and fed-batch fermentation were conducted. For the industrial strain, C. glutamicum KK-11, a higher flux through the pentose phosphate pathway was seen compared to earlier
published data. In addition to flux estimations during balanced growth present in the batch phase of
the fermentation the method was employed on samples from the fed-batch phase of thefermentation. These results were used to identify metabolic changes when the physiological state ofthe cells was changed. The tendencies identified employing this method was an increase in the
pentose phosphate pathway flux, a decrease in the TCA flux, and an increase in the anaplerotic netflux. Another C. glutamicum strain, ATCC 21253, earlier used in flux estimation studies were alsoincluded in the flux estimation study. This strain was found to have lower pentose phosphate
pathway flux compared to the industrial strain. And during the change from batch to fed-batchfermentation the tendencies were different than what was seen for the industrial strain. The pentose
phosphate pathway flux was increased as seen for the industrial strain, but the TCA flux wasincreased and the anaplerotic net flux decreased.
7/18/2019 Samlet PhD 20090416 U-Forside Appendix.pdf
http://slidepdf.com/reader/full/samlet-phd-20090416-u-forside-appendixpdf 9/187
Dansk sammenfatning ________________________________________________________________________________
11
Dansk Sammenfatning
Optimering af lysin produktion i en industriel relevant Corynebacterium glutamicum stamme blevudført ved at anvende en kombination af matematisk modellering, ”metabolic engineering” ogestimering af intracellulære metaboliske fluxe.
En matematisk model af det metaboliske netværk i C. glutamicum blev lavet baseret på tilgængeligeinformation fra genomet for denne organisme, samt ved at anvende den imponerende mængde aftilgængelig biologisk og biokemisk information. Modellen blev valideret mod tidligere publicerededata. Modellen består af 446 reaktioner samt 411 metabolitter. Modellen blev anvendt til atanalysere det metaboliske netværk for C. glutamicum under forskellige vækst- og lysin
producerende betingelser, og baseret på dette blev en række biologiske hypoteser til at øge
lysindannelsen i denne organisme foreslået. Den første hypotese gik ud på at der under storlysinproduktion og lav vækst blev dannet et overskud af ATP, og at dette overskud fører til enreduktion i lysinproduktionen. Modellen forudså at dette var et problem når lysinudbyttet er over55%. Den anden forudsigelse lavet ved brug af modellen var at der er en begrænsning ilysinsyntese-vejen når succinylase-vejen blev foretrukket frem for dehydrogenase-vejen. Resultatetvar ifølge modellen at det teoretiske maksimale udbytte faldt fra 75% til 57% på grund af en højereaktivitet af TCA cyklus for at producere succinyl-CoA, som indgår som led i lysindannelsen nårsyccinyl-vejen bliver brugt. En højere TCA cyklus aktivitet er suboptimal for lysinsyntese fordi dermistes kulstof til CO2 –produktion. Modellen forudså desuden en sammenhæng mellem en højereflux gennem pentose fosfat-vejen og en højere lysinproduktion. Dette var ifølge modellen ogsåtilfældet for et højre anaplerotisk netfluks.
Forskellige ”metabolic engineering” strategier til forøgelse af lysin udbyttet i en højt producerendeC. glutamicum stamme blev testet. Baseret til dels på simulerings resultater fra den metaboliskematematiske model og resultater fra den videnskabelige litteratur tre dele af metabolismen blevudvalgt til metabolic engineering. Den matematiske model forudså at en forøget flux gennem
pentose fosfat-vejen ville øge lysineudbyttet, angiveligt fordi NADPH vil blive begrænsende vedhøje lysinudbytter. De to NADPH genererende enzymer glucose-6-phosphate dehydrogenase ( zwf )of 6-phosphogluconate dehydrogenase ( gnd ) blev udvalgt til opregulering. Begge modifikationergav et positivt resultat med henholdsvis 5% og 6% bedre udbytter, hvilket indikerede at NADPHvar begrænsende for lysinproduktionen i denne stamme. Enzymet pyruvate decarboxylase ( pyc)
blev ligeledes udvalgt til opregulering fordi en øget anaplerotic netflux har vist sig at være
korreleret med øget lysinproduktion, både baseret på resultater fra litteraturen og den matematiskemodels forudsigelser. Resultaterne var dog ikke som forventet, idet effekten var negativ. Femreaktioner i lysinsyntese-vejen blev overudtrykt. Disse blev valgt baseret på tidligere resultaterrapporteret i litteraturen. De fem reaktioner var aspartate kinase (lysC ), dihydrodipicolate syntase(dapA), succinylaminoketopimelate transaminase (dapC ), diaminopimelate epimerase (dapF ) oglysine permerase (lysE ). Kun stammen med en overudtrykt aspartate kinase viste en effekt, ogdenne effekt var negativ på lysinudbyttet. I dette studie blev det set at selvom nogle ”metabolicengineering” strategier har vist sig at have positiv effekt i nogle stammer kan dette ikke altidoverføres direkte til en industriel stamme.
Estimering af in vivo fluxe under vækst og lysinproduktion i komplekst medium og under både batch og fed-batch fermentering blev udført. For den industrielle stamme, C. glutamicum KK-11,

7/18/2019 Samlet PhD 20090416 U-Forside Appendix.pdf
http://slidepdf.com/reader/full/samlet-phd-20090416-u-forside-appendixpdf 10/187
Dansk sammenfatning ________________________________________________________________________________
12
blev der set en betydeligt højere flux gennem pentose phosphat-vejen end der normalt ses for C.
glutamicum stammer. Foruden flux estimering under balanceret vækst der ses under deneksponentielle vækstfase, blev der ligeledes lavet flux estimering for prøver udtaget under fed-batchfasen. Disse resultater blev brugt til at identificere flux ændringer som følge af den fysiologiske
ændring der skete i cellerne som et resultat af at kulturen gik fra batch til fed-batch fermentering.Resultaterne viste at fluxen gennem pentose fosfat-vejen blev forøget, mens fluxen gennem TCAcyklus gik ned og den anaplerotiske netflux gik op. En anden C. glutamicum stamme, ATCC 21253,
blev ligeledes analyseret med denne metode. Denne stamme, der producerer lysin, men i mindregrad end den industrielle stamme, viste andre tendenser end den industrielle stamme. Fluxengennem pentose fosfat-vejen gik op i fed-batch fasen, som det var tilfældet for den indusriellestamme, mens TCA cyklus fluxen gik op og den anaplerotiske net flux gik ned hvilket var modsathvad der var set for den industrielle stamme.
7/18/2019 Samlet PhD 20090416 U-Forside Appendix.pdf
http://slidepdf.com/reader/full/samlet-phd-20090416-u-forside-appendixpdf 11/187
Introduction ________________________________________________________________________________
13
Chapter 1
1. Introduction
Bacteria belonging to the genus Corynebacterium are due to their ability to produce and secrete anumber of industrially important amino acids and nucleotides used in industrial production
processes, in particular for large scale production of the amino acids glutamate and lysine.
Lysine is produced in an aerobic fermentation process using the bacterium Corynebacterium
glutamicum or Escherichia coli. Lysine is an essential amino acid for animals, and since the contentof lysine often is suboptimal in corn, barley and wheat, the feedstuffs traditionally used as the majoringredients for animal feed, this amino acid often becomes limiting for feed efficiency.
Supplementing lysine in concentrations between 0.5% and 1% to the feed leads to an optimized protein utilization of the feed which improves the growth of especially pigs and poultry with up to20%. In addition to the economical benefit from the increased productivity, less nitrogen is releasedto the environment, which is an issue that has received a lot of attention in recent years.
As lysine-production costs have been lowered due to a continuous optimization of the process, thelysine price has followed this development and the demand has increased leading to an annual
production of 1,100,000 tones lysine,HCl annually (Feedinfo.com). Since the demand for whitemeat from pigs and poultry is increasing in a combination with environmental issues, a furtherincrease in lysine demand of about 8% per year is expected (Feedinfo.com). In spite of increasedlysine demands worldwide, further development of the lysine production process, including straindevelopment is essential to be competitive in the lysine production-business.
A biotechnological production process like lysine production with C. glutamicum, employ selfreproducing living organisms, which serves as living cell factories for the conversion of chemicalsinvolving a complex network of enzymes, substrates and products inside and outside the cell. Thedevelopment and optimization of production strains by random mutagenesis followed by extensivescreening programs to find and isolate superior mutants have been shown to be a successfulstrategy. However, with the rapid development of methods for metabolic engineering this hasopened new possibilities for strain improvements by targeted genetic modifications. Today,experimental protocols for almost any genetic manipulation in C. glutamicum are available. The
challenge is not how to apply the genetic manipulations - but where to apply them.The major challenge in this respect is that living organisms are complex systems with thousands ofreactions and multiple variables interacting with each other. Using traditional reductionisticapproaches focusing on the generation of information about individual cellular components is oftennot enough when such complex networks needs to be analyzed. A more holistic approach needs to
be applied focusing on the system rather than the individual reactions.
With the developments in genomics there has been an increased focus on the behavior of complete biological systems, which has led to the development of systems biology. Biological data fromdifferent levels of the metabolism, i.e. genome, fluxome, transcriptome, metabolome, proteome and
interactome are integrated in order to analyze an organism. To cope with the large amount of data
7/18/2019 Samlet PhD 20090416 U-Forside Appendix.pdf
http://slidepdf.com/reader/full/samlet-phd-20090416-u-forside-appendixpdf 12/187
Chapter 1 ________________________________________________________________________________
14
generated the development of mathematical models describing the biological systems has played amajor role in systems biology. With the large sequencing-effort that has been conducted recently,whole genomes are now made available, including the C. glutamicum genome. This information can
be used to make mathematical models which can serve as platforms for whole cell models able to
predict cellular phenotypes.Within the field of metabolic engineering the prediction power of mathematical models can be usedto find and select targets for metabolic engineering strategies.
Corynebacterium – A working horse in amino acid production
The production of amino acids is in terms of quantity the third most important within white biotechnology, only surpassed by ethanol- and antibiotics production (Leuchtenberger et al., 2005).The two most important amino acids in this respect are L-glutamate and L-lysine with a markedvalue exceeding $1.5 billion annually (Demain and Adrio, 2008), both of which is produced byvarious species of the genera Corynebacterium and Brevibacterium. In addition to lysine andglutamate Corynebacterium has also been used as a platform for the production of other aminoacids such as L-threonine (Shiio, 1990; Kase and Nakayama, 1974; Shiio et al., 1991), L-methionine (Nakayama et al., 1973; Kase and Nakayama, 1975), L-serine (Eggeling, 2007), L-histidine (Araki et al., 1974), L-valine (Ruklisha et al., 2007), L-tryptophan (Ikeda, 2006), L-
phenylalanine and L-tyrosine (Ikeda and Katsumata, 1992), L-leucine (Pátek, 2007) and L-isoleucine (Guillout et al., 2002).
Industrial L-lysine production
The first steps towards industrial production of lysine were done in Japan in the 1950s when KyowaHakko Co., Ltd., Tokyo started a research program aiming at finding a microorganim able to
produce glutamate. One of the results from this was the isolation of a microorganism Micrococcus
glutamicus, later renamed to C. glutamicum, which was able to produce glutamate (Kinoshita et al.,1957; Udaka, 1960). During the following mutagenesis and screening program lysine producingmutants were discovered (Kinoshita et al., 1958), and the foundation for lysine production wasmade. Within a few years the first large scale lysine production facility was in use.Since then lysine fermentation processes have been developed for the very large scale as thedemand for a cost effective production has increased as product-prices have decreased. Todaylysine production involves fermentation in very large fermentation tanks, often exceeding hundreds
of cubic meters, which makes it challenging to obtain homogeneity in the fermenter and to maintainsufficient mass-transfer rates. Normally traditional stirred-tank reactors are used since they allowfor a high specific power intake, which makes it possible to obtain high oxygen transfer rates (Kelleet al., 2005). The fermentation process consists of multiple steps with several propagation steps toobtain sufficient biomass for the main fermentation process. The number of propagation steps canvary, but usually 1:10 steps between each propagation step is applied (Hermann, 2003). To optimizelysine yield and productivity the process is normally run as a fed-batch or repeated fed-batch
process. Attempts have been made to develop a continuous process (Hirao et al., 1989). However,due to numerous practical aspects such as sterility and strain stability in industrial scale, continuous
production is generally not applied (Kelle et al., 2005).
7/18/2019 Samlet PhD 20090416 U-Forside Appendix.pdf
http://slidepdf.com/reader/full/samlet-phd-20090416-u-forside-appendixpdf 13/187
Introduction ________________________________________________________________________________
15
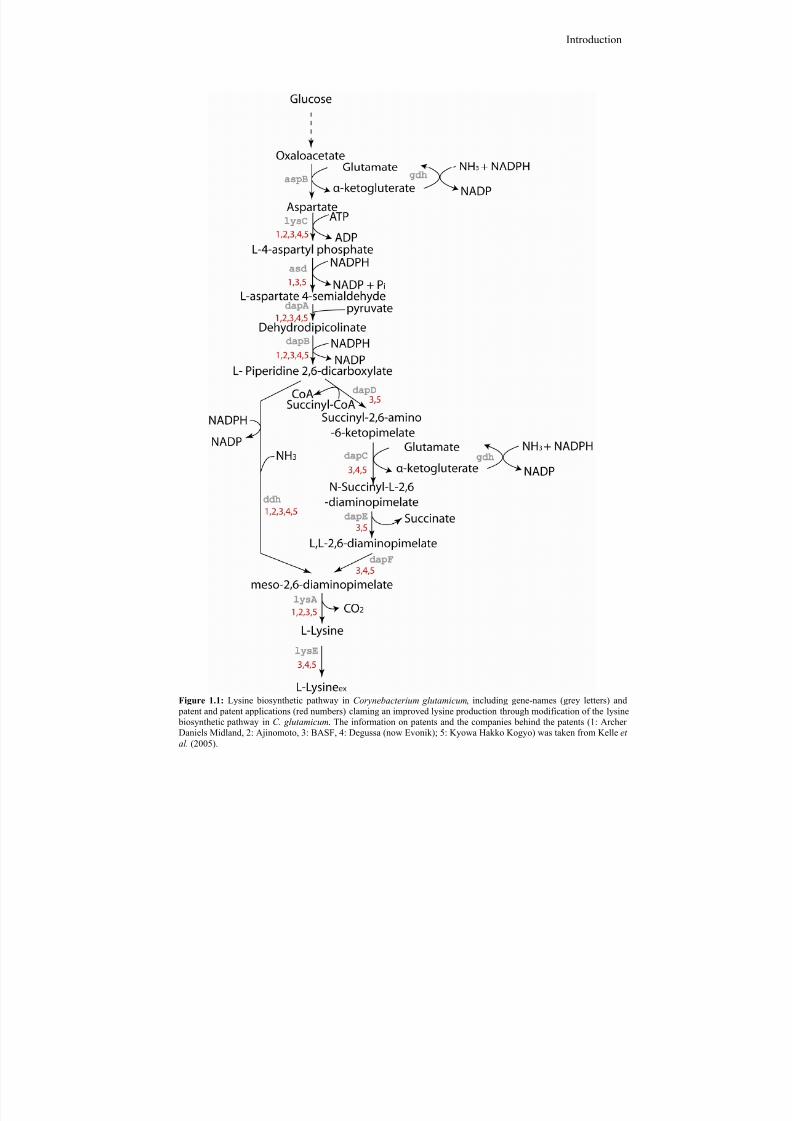
Figure 1.1: Lysine biosynthetic pathway in Corynebacterium glutamicum, including gene-names (grey letters) and patent and patent applications (red numbers) claming an improved lysine production through modification of the lysine biosynthetic pathway in C. glutamicum. The information on patents and the companies behind the patents (1: ArcherDaniels Midland, 2: Ajinomoto, 3: BASF, 4: Degussa (now Evonik); 5: Kyowa Hakko Kogyo) was taken from Kelle et
al. (2005).
7/18/2019 Samlet PhD 20090416 U-Forside Appendix.pdf
http://slidepdf.com/reader/full/samlet-phd-20090416-u-forside-appendixpdf 14/187
Chapter 1 ________________________________________________________________________________
16
The lysine synthetic pathway in C. glutamicum
An overview of the lysine synthetic pathway in C. glutamicum can be seen in figure 1.1. Lysine is produced in seven or ten steps from its precursor oxaloacetate, depending on which route is used.
The first step in the lysine synthetic pathway is the conversion of oxaloacetate to aspartate byadding an amino-group from glutamate, catalyzed by the aspB-gene-product. Aspartate is
phosphorylated to L-4-aspartyl phosphate by the reaction catalyzed by the lysC -gene-product,which is further converted to L-aspartate 4-semialdehyde via asd . L-4-aspartyl phosphate is furtherconverted to dehydrodipicolinate by dapA. In the next step L-piperidine 2,6-dicarboxylate is made
by dapB. At the level of L-piperidine 2,6-dicarboxylate there are two possibilities for the conversionto meso-2,6-diaminopimelate, the last step before lysine. Either the direct reaction adding thesecond amino-group in one single step is used (ddh), known as the dehydrogenase variant, or foursuccessive reactions, named the succinyl variant, is used. The succinylase variant involves thedapD-, dapC -, dapE- and dapF -gene-products, and using this variant the TCA intermediatesuccinyl-Coa is involved. The final step is the decarboxylation of meso-2,6-diaminopimelate tolysine (lysA), which finally is exported out of the cell by lysine permerase (lysE ).
Due to the commercial importance of lysine production in C. glutamicum, the lysine synthetic pathway has received a lot of attention, which has led to an impressive list of patents and patentapplications (Figure 1.1).
Maximal lysine yield for C. glutamicum
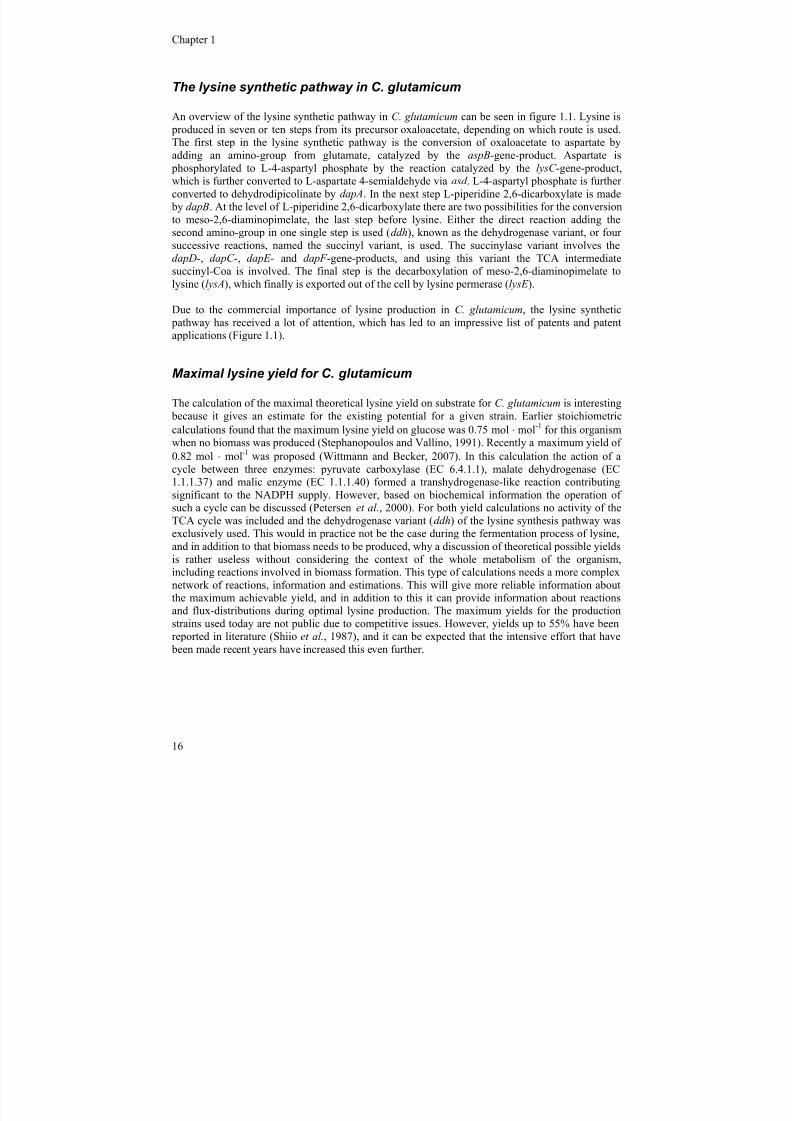
The calculation of the maximal theoretical lysine yield on substrate for C. glutamicum is interesting
because it gives an estimate for the existing potential for a given strain. Earlier stoichiometriccalculations found that the maximum lysine yield on glucose was 0.75 mol ⋅ mol-1 for this organismwhen no biomass was produced (Stephanopoulos and Vallino, 1991). Recently a maximum yield of0.82 mol ⋅ mol-1 was proposed (Wittmann and Becker, 2007). In this calculation the action of acycle between three enzymes: pyruvate carboxylase (EC 6.4.1.1), malate dehydrogenase (EC1.1.1.37) and malic enzyme (EC 1.1.1.40) formed a transhydrogenase-like reaction contributingsignificant to the NADPH supply. However, based on biochemical information the operation ofsuch a cycle can be discussed (Petersen et al., 2000). For both yield calculations no activity of theTCA cycle was included and the dehydrogenase variant (ddh) of the lysine synthesis pathway wasexclusively used. This would in practice not be the case during the fermentation process of lysine,and in addition to that biomass needs to be produced, why a discussion of theoretical possible yieldsis rather useless without considering the context of the whole metabolism of the organism,including reactions involved in biomass formation. This type of calculations needs a more complexnetwork of reactions, information and estimations. This will give more reliable information aboutthe maximum achievable yield, and in addition to this it can provide information about reactionsand flux-distributions during optimal lysine production. The maximum yields for the productionstrains used today are not public due to competitive issues. However, yields up to 55% have beenreported in literature (Shiio et al., 1987), and it can be expected that the intensive effort that have
been made recent years have increased this even further.
7/18/2019 Samlet PhD 20090416 U-Forside Appendix.pdf
http://slidepdf.com/reader/full/samlet-phd-20090416-u-forside-appendixpdf 15/187
Introduction ________________________________________________________________________________
17
Figure 1.2: Metabolic flux distribution in Corynebacterium glutamicum with maximal theoretical lysine yield onglucose. All fluxes are given as relative molar fluxes to the glucose uptake in mol ⋅ (mol)-1 × 100. Upper values:Stephanopoulos and Vallino (1991); lower values: Wittmann and Becker (2007). Abbreviations: GLCex:extracellular glucose; G6P: glucose-6-phosphate; F6P: fructose-6-phosphate; P5P: pentose-5-phosphate; E4P:erythose-4-phosphate; S7P: sedoheptulose-7-phosphate; G3P: glyceraldehyde phosphate; PEP: phosphoenolpyruvate; PYR: pyruvate; Ac-CoA: acetyl CoA; ICIT: isocitrate; AKG: α-ketogluterate; SUCC:succinate; OA: oxaloacetate; PIPER26DC: L-piperidine 2,6-dicarboxylate; MDAPIM: meso-2,6-diaminopimelate.
7/18/2019 Samlet PhD 20090416 U-Forside Appendix.pdf
http://slidepdf.com/reader/full/samlet-phd-20090416-u-forside-appendixpdf 16/187
Chapter 1 ________________________________________________________________________________
18
Production strain development
Lysine producing strains of C. glutamicum have continuously been improved since the developmentof the first large scale process for the production of this compound. Classical mutagenesis followed
by screening has been proven very successful in this respect, and recently more rational approachesusing recombinant DNA technologies, in some cases in combination with systems biology, have
been applied with success. This later part later will be reviewed more in detail in chapter 2.
Outline and background for PhD thesis
This thesis is based on work performed during an industrial PhD project. The project has beencarried out in a collaboration between the lysine producer Agro&Ferm A/S and Center forMicrobial Biotechnology (CMB), BioSys, DTU. The aim of the project was to improve lysine
production in a C. glutamicum production strain.
This thesis is divided into chapters where the first chapters introduce the subject and methods usedand the following describes the work performed during this PhD study.
Chapter 1 gives an introduction to the thesis, and gives and introduction to C. glutamicum andcommercial lysine production. Chapter 2 introduces the methods used in this work. Flux balanceanalysis, genome scale modeling, flux analysis and metabolic engineering in C. glutamicum are
presented. Chapter 3 is a review on the biochemistry of C. glutamicum, and this chapter is makingthe basis for the reconstruction of the metabolic network of C. glutamicum presented in chapter 4.
The chapters 4-6 are manuscripts presenting the scientific work of this thesis. Chapter 4 (manuscriptA) presents the reconstruction and validation of the C. glutamicum metabolic network. Chapter 5(Manuscript B) presents a comparison of several different metabolic engineering strategiesimplemented in a C. glutamicum production strain for improving lysine production and evaluationof the different strategies applied. In chapter 6 (Manuscript C) flux analysis in complex media ontwo C. glutamicum production strains is presented.
Finally chapter 7 summarizes the work and comments on future perspectives for improving lysine production in C. glutamicum.
References
Araki,K., Kato,F., Aral,Y., and Nakayama,K. (1974) Histidine production by auxotrophic histidineanalog-resistant mutants of Corynebacterium glutamicum. Agricultural and Biological Chemistry38, 837.
Demain,A.L. and Adrio,J.L. (2008) Contributions of microorganisms to industrial biology.Molecular Biotechnology 38, 41-55.
7/18/2019 Samlet PhD 20090416 U-Forside Appendix.pdf
http://slidepdf.com/reader/full/samlet-phd-20090416-u-forside-appendixpdf 17/187
Introduction ________________________________________________________________________________
19
Eggeling,L. (2007) L-Serine and Glycine. In Amino Acid Biosynthesis - Pathway, Regulation andMetabolic Engineering (Edited by Wendisch,V.F.) pp. 259-272. Springer-Verlag, Berlin-Heidelberg.
Guillout,S., Rodal,A.A., Lessard,P.A., and Sinskey,A.J. (2002) Methods for producing L-isoleucine. USA patent [US 6451564 B1].
Hermann,T. (2003) Industrial production of amino acids by coryneform bacteria. Journal ofBiotechnology 104, 155-172.
Hirao,T., Nakano,T., Azuma,T., Sugimoto,M., and Nakanishi,T. (1989) L-Lysine production incontinuous culture of an L-lysine hyperproducing mutant of Corynebacterium glutamicum. AppliedMicrobiology and Biotechnology 32, 269-273.
Ikeda,M. (2006) Towards bacterial strains overproducing L-tryptophan and other aromatics by
metabolic engineering. Applied Microbiology and Biotechnology 69, 615-626.
Ikeda,M. and Katsumata,R. (1992) Metabolic engineering to produce tyrosine or phenylalanine in atryptophan producing Corynebacterium glutamicum strain. Applied and EnvironmentalMicrobiology 58, 781-785.
Kase,H. and Nakayama,K. (1974) Studies on L-threonine fermentation. 4. Mechanism of L-threonine and L-lysine production by analog-resistant mutants of Corynebacterium glutamicum.Agricultural and Biological Chemistry 38, 993-1000.
Kase,H. and Nakayama,K. (1975) Fermentation production of L-methionine and regulation of L-methionine biosynthesis in Corynebacterium glutamicum. 3 L-methionine production by mehionineanalog-resistant mutants of Corynebacterium glutamicum. Agricultural and Biological Chemistry39, 153-160.
Kelle,R., Hermann,T., and Bathe,B. (2005) L-Lysine production. In Handbook of Corynebacterium
glutamicum (Edited by Eggeling,L. and Bott,M.) pp. 465-488. CRC Press, Boca Raton.
Kinoshita,S., Nakayama,K., and Kitada,S. (1958) Method of producing L-lysine by fermentation.USA Patent [2979439].
Kinoshita,S., Udaka,S., and Shimono,M. (1957) Studies on the amino acid fermentation. Part I.Production of L-glutamic acid by various microorganisms. The Journal of General and AppliedMicrobiology 3, 193-205.
Leuchtenberger,W., Huthmacher,K., and Drauz,K. (2005) Biotechnological production of aminoacids and derivatives: current status and prospects. Applied Microbiology and Biotechnology 69, 1-8.
Nakayama,K., Sagamira,I., and Araki,K. (1973) Process for producing L-methionine. USA Patent[3729381].
7/18/2019 Samlet PhD 20090416 U-Forside Appendix.pdf
http://slidepdf.com/reader/full/samlet-phd-20090416-u-forside-appendixpdf 18/187
Chapter 1 ________________________________________________________________________________
20
Pátek,M. (2007) Branched-Chain Amino Acids. In Amino Acid Biosynthesis - Pathways,Regulation and Metabolic Engineering (Edited by Wendisch,V.F.) pp. 128-162. Springer-Verlag,Berlin-Heidelberg.
Petersen,S., de Graff,A.A., Eggeling,L., Mollney,M., Wiechert,W., and Sahn,H. (2000) In vivoquantification of parallel and bidirectional fluxes in the anaplerosis of Corynebacterium
glutamicum. Journal of Biological Chemistry. 275, 35932-35941.
Ruklisha,M., Paegle,L., and Denina,I. (2007) L-Valine biosynthesis during batch and fed-batchcultivations of Corynebacterium glutamicum: Relationship between changes n bacterial growth rateand intracellular metabolism. Process Biochemistry 42, 634-640.
Shiio,I. (1990) Threonine production by dihydrodipicolinate syntase-defective mutants of Brevibacterium flavum. Biotechnology Advances 8, 97-103.
Shiio,I., Toride,Y., Yokota,A., Sugimoto,S., and Kawamura,K. (1991) Process for the productionof L-threonine by fermentation. USA Patent [5077207].
Shiio,I., Yokota,A., and Sugimoto,M. (1987) Effect of pyruvate kinase deficiency on L-lysine productivities of mutants with feed-back resistant aspartokinase. Agricultural and BiologicalChemistry 51, 2485-2493.
Stephanopoulos,G. and Vallino,J.J. (1991) Network rigidity and metabolic engineering inmetabolite overproduction. Science 252, 1675-1681.
Udaka,S. (1960) Screening method for microorganisms accumulating metabolites and its use in theisolation of Micrococcus glutamis. Journal of Bacteriology 79, 754-755.
Wittmann,C. and Becker,J. (2007) The L-lysine story: From metabolic pathways to industrial production. In Amino Acid Biosynthesis - Pathway, Regulation and Metabolic Engineering (Edited by Wendisch,V.F.) pp. 39-70. Springer-Verlag, Berlin.
7/18/2019 Samlet PhD 20090416 U-Forside Appendix.pdf
http://slidepdf.com/reader/full/samlet-phd-20090416-u-forside-appendixpdf 19/187
Flux balance analysis and metabolic engineering ________________________________________________________________________________
21
Chapter 2
2. Flux balance analysis and metabolic engineering
Biological systems are complex, and knowledge about pathways, regulation and metaboliccapability of the system is essential in order to design efficient cell factories. It is often necessary toanalyze the system as a whole. This may be approached by using mathematical modeling as a tool.By modeling the metabolic network using information available about the whole biological systemas a context, it is possible to design an improved metabolic network, i.e. by suggesting changes inthe genotype (Covert et al., 2001b; Palsson, 2000). Recent developments in genome sequencing andannotation, and an increasing amount of biological information in public databases have madereconstruction of metabolic networks relatively straightforward (Price et al., 2003; Åkesson et al.,2004).
Stoichiometri and structure of biochemical reaction networks
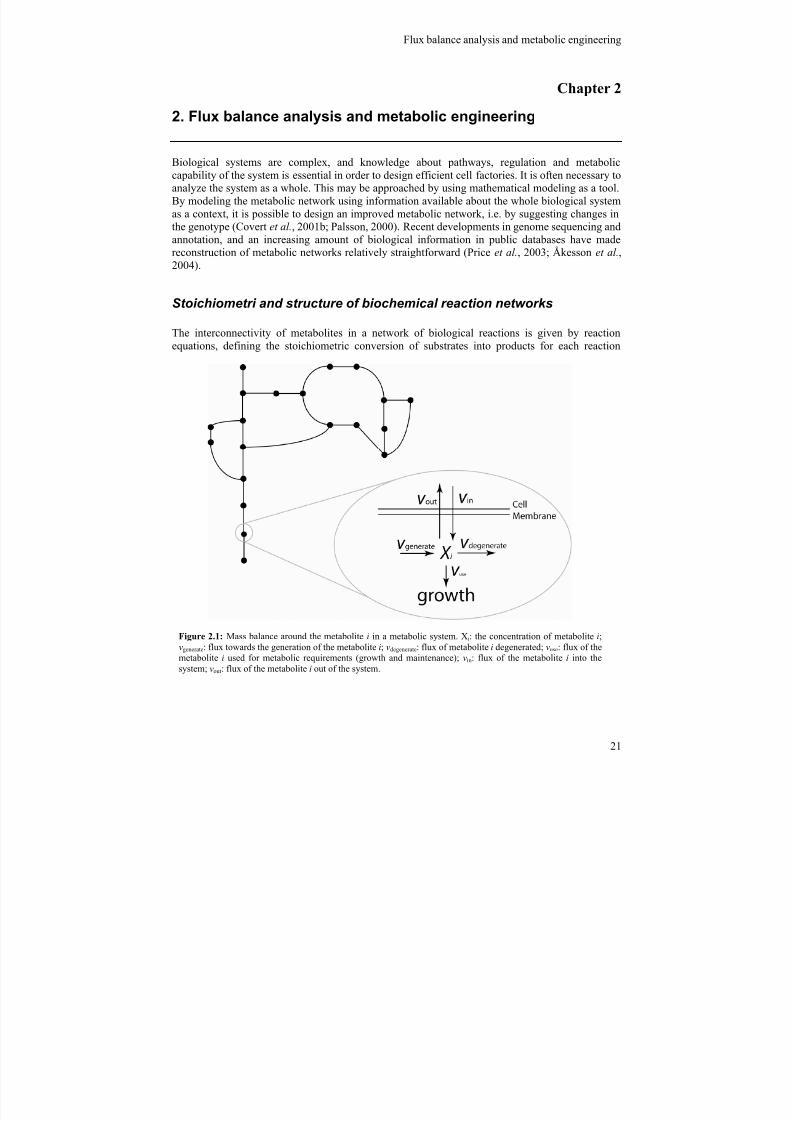
The interconnectivity of metabolites in a network of biological reactions is given by reactionequations, defining the stoichiometric conversion of substrates into products for each reaction
Figure 2.1: Mass balance around the metabolite i in a metabolic system. Xi: the concentration of metabolite i;vgenerate: flux towards the generation of the metabolite i; vdegenerate: flux of metabolite i degenerated; vuse: flux of themetabolite i used for metabolic requirements (growth and maintenance); vin: flux of the metabolite i into thesystem; vout: flux of the metabolite i out of the system.
7/18/2019 Samlet PhD 20090416 U-Forside Appendix.pdf
http://slidepdf.com/reader/full/samlet-phd-20090416-u-forside-appendixpdf 20/187
Chapter 2 ________________________________________________________________________________
22
(Schilling et al., 1999). Reactions are enzymatic reactions converting a substrate into a product, ortransport reactions moving metabolites between different parts of the system, intracellular,extracellular or between different compartments. The result of active reactions in the biologicalsystem is fluxes serving to dissipate or generate metabolites. Following the law of conservation of
mass, a balance describing the reaction rate of a particular metabolite through a particular reactioncan be written:
(eq. 2.1) met met met X r
dt
dX μ −=
where the difference between the rate of production and consumption of a particular metabolite isequivalent to the changes in concentration of that particular metabolite over time. In eq. (2.1) X met isthe concentration vector for the intracellular metabolite, and r met is a vector containing the net ratesof formation of the intracellular metabolite for each single reaction of the network. The last term onthe right hand side accounts for dilution due to biomass growth. In figure 2.1 equation (2.1) isillustrated showing the mass balance around the metabolite i in a metabolic system. The consumingfluxes of metabolite i is divided into the flux towards metabolic requirements (Vuse), the fluxtowards export from the cell (Vout), and the flux towards the degeneration reactions (Vdegeneration).Two fluxes are serving to increase the concentration of Xi: import from outside the cell (Vin) andreactions serving to generate the metabolite (Vgenerate). At steady state the concentrations of allmetabolites are constant, and the reaction rate of the specific fluxes generating a metabolite must beequivalent to the reaction rate of the fluxes that consumes the metabolite. Since time constantsassociated with growth are much larger than those associated with kinetic reactions, it is reasonableto place the metabolic system in a pseudo-steady state (Stephanopoulos et al., 1998), which allowus to neglect metabolite accumulation leading to:
(eq. 2.2) met met X r −=0
Because metabolite concentrations generally are low compared to netflux rates of metabolites thelast term, corresponding to the dilution due to growth, can generally be neglected (Stephanopouloset al., 1998). In this case it is possible to reduce the system to a homogeneous linear equation,which in matrix notation is written as:
(eq. 2.3) vS r met ⋅==0
The stoichiometric matrix S is an m x n matrix where m is the number of metabolites and n is thenumber of reactions or fluxes taking place within the metabolic network. The vector v refers to thereaction rate of each individual reaction or flux in the metabolic network. Metabolic models usuallyalso include constraints, which will lead to the definition of a solution space in which the solution tothe network equation must lie (Price et al., 2003). Constraints in a model are dealt with byintroducing constraint equations to the metabolic network, which can assign a direction of a givenreaction (reversibility or irreversibility) according to known thermodynamic constraints. Theseequations are typically of the form α i ≤ vi ≤ β i, where α i and β i are the feasible lower and upperlimit of the reaction rate vi, respectively. In practice the upper and lower limits are set to arbitrarilyhigh values when a reaction is reversible without any regulation, whereas α i is set to zero when areaction is irreversible. Constrain reactions can also be used to set a maximum flux through a givenreaction based on biochemical information.
7/18/2019 Samlet PhD 20090416 U-Forside Appendix.pdf
http://slidepdf.com/reader/full/samlet-phd-20090416-u-forside-appendixpdf 21/187
Flux balance analysis and metabolic engineering ________________________________________________________________________________
23
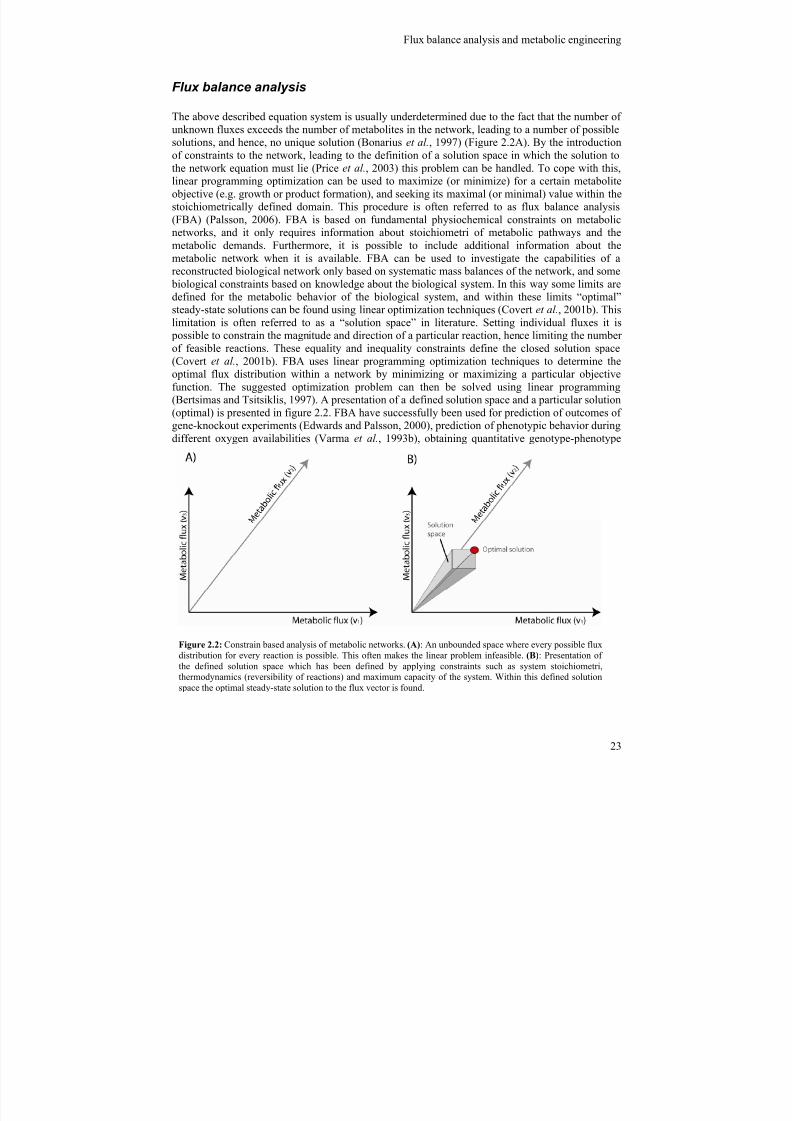
Flux balance analysis
The above described equation system is usually underdetermined due to the fact that the number ofunknown fluxes exceeds the number of metabolites in the network, leading to a number of possible
solutions, and hence, no unique solution (Bonarius et al., 1997) (Figure 2.2A). By the introductionof constraints to the network, leading to the definition of a solution space in which the solution tothe network equation must lie (Price et al., 2003) this problem can be handled. To cope with this,linear programming optimization can be used to maximize (or minimize) for a certain metaboliteobjective (e.g. growth or product formation), and seeking its maximal (or minimal) value within thestoichiometrically defined domain. This procedure is often referred to as flux balance analysis(FBA) (Palsson, 2006). FBA is based on fundamental physiochemical constraints on metabolicnetworks, and it only requires information about stoichiometri of metabolic pathways and themetabolic demands. Furthermore, it is possible to include additional information about themetabolic network when it is available. FBA can be used to investigate the capabilities of areconstructed biological network only based on systematic mass balances of the network, and some
biological constraints based on knowledge about the biological system. In this way some limits aredefined for the metabolic behavior of the biological system, and within these limits “optimal”steady-state solutions can be found using linear optimization techniques (Covert et al., 2001b). Thislimitation is often referred to as a “solution space” in literature. Setting individual fluxes it is
possible to constrain the magnitude and direction of a particular reaction, hence limiting the numberof feasible reactions. These equality and inequality constraints define the closed solution space(Covert et al., 2001b). FBA uses linear programming optimization techniques to determine theoptimal flux distribution within a network by minimizing or maximizing a particular objectivefunction. The suggested optimization problem can then be solved using linear programming(Bertsimas and Tsitsiklis, 1997). A presentation of a defined solution space and a particular solution
(optimal) is presented in figure 2.2. FBA have successfully been used for prediction of outcomes ofgene-knockout experiments (Edwards and Palsson, 2000), prediction of phenotypic behavior duringdifferent oxygen availabilities (Varma et al., 1993b), obtaining quantitative genotype-phenotype
Figure 2.2: Constrain based analysis of metabolic networks. (A): An unbounded space where every possible fluxdistribution for every reaction is possible. This often makes the linear problem infeasible. (B): Presentation ofthe defined solution space which has been defined by applying constraints such as system stoichiometri,thermodynamics (reversibility of reactions) and maximum capacity of the system. Within this defined solutionspace the optimal steady-state solution to the flux vector is found.
7/18/2019 Samlet PhD 20090416 U-Forside Appendix.pdf
http://slidepdf.com/reader/full/samlet-phd-20090416-u-forside-appendixpdf 22/187
Chapter 2 ________________________________________________________________________________
24
relationship (Edwards et al., 2001) and predicting gene targets for enhancing production of biological compounds (Burgard et al., 2003). FBA can also be used to predict maximal growth ratesor maximal production of a given metabolite in terms of yield on substrate.
Applications of flux balance analysis
FBA have been widely applied as a tool in analyzing the metabolic capabilities of metabolicnetworks – in particular for organisms relevant for industrial production of biochemicals. Some ofthe work reported so far in this respect has been the evaluation of metabolic networks for the
production of anaerobic fermentation products (Papoutsakis, 1984; Papoutsakis and Meyer, 1985);the metabolic capabilities of Escherichia coli (Varma et al., 1993a; Förberg et al., 1988); themetabolic network of C. glutamicum for the potential and limitations in amino acid production(Hollander, 1994; Vallino and Stephanopoulos, 1993; Vallino and Stephanopoulos, 1994a; Vallinoand Stephanopoulos, 1994b); and the metabolic capacity of Bacillus subtilis for the production of
purine nucleotides, riboflavin, and folic acid (Sauer et al., 1998).
Recently the availability of annotated genome sequences has enabled the reconstruction of genome-scale metabolic networks (Covert et al., 2001a). Genomes of a large number of organisms have uptill today been sequenced and annotated, and more will come within the neatest future. To date(April, 2008) 619 bacterial and 82 eukaryote genomes have been completed and 1753 bacterial and914 eukaryotic genome projects are ongoing (www.genomesonline.org). In addition most of thissequence data is made available in public databases making it relatively straightforward to extractgenome information from many organisms. This information can be used to make stoichiometricmodels of biological networks. Genome-scale metabolic models have already been constructed for a
number of micro-organisms such as Saccharomyces cerevisiae (Förster et al., 2003), Escherichiacoli (Reed et al., 2003), Lactococcus lactis (Oliviera et al., 2005), Staphylococcus aurerus (Heinemann et al., 2005), Streptomyces coelicolor (Borodina et al., 2005), Helicobacter pylori
(Schilling et al., 2002), Haemophilus influenzae (Schilling and Palsson, 2000), Methanosarcina
barkeri (Feist et al., 2006) and Lactobacillus plantarum (Teusink et al., 2006).
To improve the prediction power of the FBA models the stoichiometric genome-scale model can becombined with additional biological knowledge. This can be accomplished by incorporation of datafrom high-throughput techniques such as transcriptomics (Covert et al., 2004; Åkesson et al., 2004)or fluxomics (Herrgård et al., 2006), and combining this with the constrain-based method (Price et
al., 2003). It is also possible to incorporate regulatory constraints, representing temporary flux
constraints mediated by specific environmental conditions, rather than physiochemical constraints.This approach has been applied by Covert and co-workers (Covert et al., 2001b). Covert et al.(2001b) introduced transcriptional regulatory events as time-dependent constrains, which led to anadditional constraining of the metabolic network, and consequently made it possible to predictdynamic flux profiles for microbial growth. Using the same methods the steady-state solution spaceof a FBA model could be reduced (Covert and Palsson, 2003). Recent results on integration of geneexpression data into a S. cerevisiae genome-scale model showed a significant improvement in
prediction power during batch fermentations (Åkesson et al., 2004), leading to the conclusion thatthis approach looks promising for improving FBA models. However, it needs to be emphasized thatthis approach also has some disadvantages as discussed by Åkesson et al. (2004), i.e. the fact thatgene expression and metabolic fluxes does not always correlate (Yang et al., 2002).

7/18/2019 Samlet PhD 20090416 U-Forside Appendix.pdf
http://slidepdf.com/reader/full/samlet-phd-20090416-u-forside-appendixpdf 23/187
Flux balance analysis and metabolic engineering ________________________________________________________________________________
25
The incorporation of experimentally determined flux values into FBA models has also been appliedfor improving the prediction power of the models. Herrgård et al . (2006) used this approach, andwas able to improve the performance of an E. coli FBA model.
The considerable interest in the redirection of metabolic fluxes to improve or develop productionstrains for industrial production of biochemicals, has led to the development of metabolicengineering (Bailey, 1991). Today, experimental protocols for almost any genetic manipulation in awide variety of industrial relevant organisms are available. The challenge is therefore not how toapply genetic manipulations - but where to apply them. Besides from a convenient overview of theorganism and its capabilities, stoichiometric models in a combination with FBA can be used in thisrespect. The prediction of phenotypic behavior during different environmental and geneticconditions has been presented (Edwards and Palsson, 2000; Edwards et al., 2001; Oliviera et al.,2005), and this can directly be used to test biological hypotheses (Patil et al., 2004), andconsequently predict metabolic engineering strategies as in the case of improving bioethanol-
production in S. cerevisiae (Bro et al., 2006).
Reconstruction of the metabolic network
The first step of the reconstruction of a metabolic network is in principle, to make a list of reactions present in the organism. This is done by gathering information about the organism from thesequenced genome, relevant literature from biochemical textbooks and scientific papers, and finally
by searching reaction databases (Figure 2.3). The backbone in reconstruction of a metabolicnetwork is the annotated genome. Normally, the reconstruction of a given metabolic network beginswith a thorough examination of the genome(Covert et al., 2001a). The first step in this examination
is the annotation where all open reading frames (ORFs) are identified from the sequence of thegenome, and these ORFs are searched against databases using special designed algorithms forcomparing DNA-sequences as i.e. BLAST (McGinnis and Madden, 2004) or FASTA (Shpaer et al.,1996). Using these databases one is able to extract and utilize information about already identifiedORFs from other organisms. Based on this search and comparison, the function and presence of alarge number of ORFs can be identified. Depending on which organism is object to the constructionthere is a number of options for helpful internet-resources, which can be used. Some organismshave organism-specific databases (i.e. E. coli and yeast) whereas others are included in moregeneral databases, like KEGG (Kanehisa et al., 2006) or BioCyc (Karp et al., 2005). Finally, thereare some general databases like MetaCyc (Caspi et al., 2006) making an overview over all
biological pathways, which can be used to find “missing links” in the biological network. From
these databases valuable information can be found about an organism, and user friendly interfaceshave made it relatively straightforward to get a quick overview. To complement the databaseresources, available literature is used to confirm the individual reactions or the network.When all reactions and transport mechanisms have been identified the second step of thereconstruction is to make a dynamic mass balance for the metabolites in the metabolic network. Themass balance is defined in terms of flux through each reaction and the stoichiometri of that reaction.The result is a set of differential equations, which can be simplified to Eq. 2.3 as shown earlier inthis chapter.

7/18/2019 Samlet PhD 20090416 U-Forside Appendix.pdf
http://slidepdf.com/reader/full/samlet-phd-20090416-u-forside-appendixpdf 24/187
Chapter 2 ________________________________________________________________________________
26
The third step is to define the solution space (Figure 2.2) wherein the optimal solution must lie. Thisis done by reviewing literature. Here relevant biochemical books, organism specific books andrecent papers can be used. Some constraints that are typically used is physiochemical data (i.e.reversibility of each individual reaction), or information about the maximum capacity of givenreactions. Another important part of a metabolic network, which is used for constraining the model,is the composition of the macromolecules of the organism. This part of the reconstruction work can
be quite difficult because it often is necessary to collect information from many different resources,and these resources are not always comparable due to different environmental conditions (media,substrate, oxygen availability, pH, fermentation strategy etc.). And in some cases it is not possibleto find quantitative data for some components.
When the metabolic network has been created some validation needs to be done. Either by
comparing simulations with published experimental data, or by designing and carrying out own
Figure 2.3: Construction of the metabolic network. Based on information from the annotated genome, relevantliterature from biochemical textbooks and scientific papers and metabolic pathway and reaction databases it is possible to construct a metabolic network representing the overall set of metabolic reactions occurring in the cell.
7/18/2019 Samlet PhD 20090416 U-Forside Appendix.pdf
http://slidepdf.com/reader/full/samlet-phd-20090416-u-forside-appendixpdf 25/187
Flux balance analysis and metabolic engineering ________________________________________________________________________________
27
experiments. From published data and own experimental work some constraints can be set in orderto fit the metabolic model to the real behavior of the organism, i.e. when pathways or enzymes are
preferred compared to others or if futile cycles is present in the organism.
Metabolic flux analysis
The identification and quantification of metabolic reactions in an organism is a central element inmetabolic engineering (Bailey, 1991; Stephanopoulos, 1999). The determination and study ofmetabolic fluxes in vivo has been termed metabolic flux analysis (Stephanopoulos, 1999), and thegreat scientific interest within this field has led to the development of a number of methods, whichcan be applied for metabolic flux analysis. One of the major challenges in flux analysis is the factthat the total number of fluxes exceeds the number of fluxes that can be measured. In some casesfor small metabolic models it is, however, possible to measure sufficient fluxes to estimate all theother fluxes, and among measurable fluxes are typically the glucose uptake rate or productformation (Christensen and Nielsen, 1999b). This approach is often referred to as metabolite
balancing. From a given bioreaction network stoichiometri, intracellular fluxes are reconstructed soas to satisfy the measured rates of extracellular metabolite accumulation or depletion(Stephanopoulos, 1999). No reaction kinetics needs to be taken into account, and the metabolicfluxes can be estimated using linear algebraic equations. Some examples where this approach has
been applied for the estimation of fluxes is in C. glutamicum during growth and lysine production(Vallino and Stephanopoulos, 1993; Vallino and Stephanopoulos, 1994a; Vallino andStephanopoulos, 1994b), in Penicillum chrysogenum for antibiotic production (Jørgenen et al.,1995), and in the industrial important yeast S. cerevisiae (Nissen et al., 1997). However, if the
biological network contains more than one pathway leading to the same metabolite, this method can
not be applied to discriminate between the different pathways. Using isotopic labeled substrates (i.e.13C-labelled glucose) this challenge can be handled (Christensen and Nielsen, 1999a). Thismethodology named isotopic balancing utilizes the asymmetry which often is present at splits
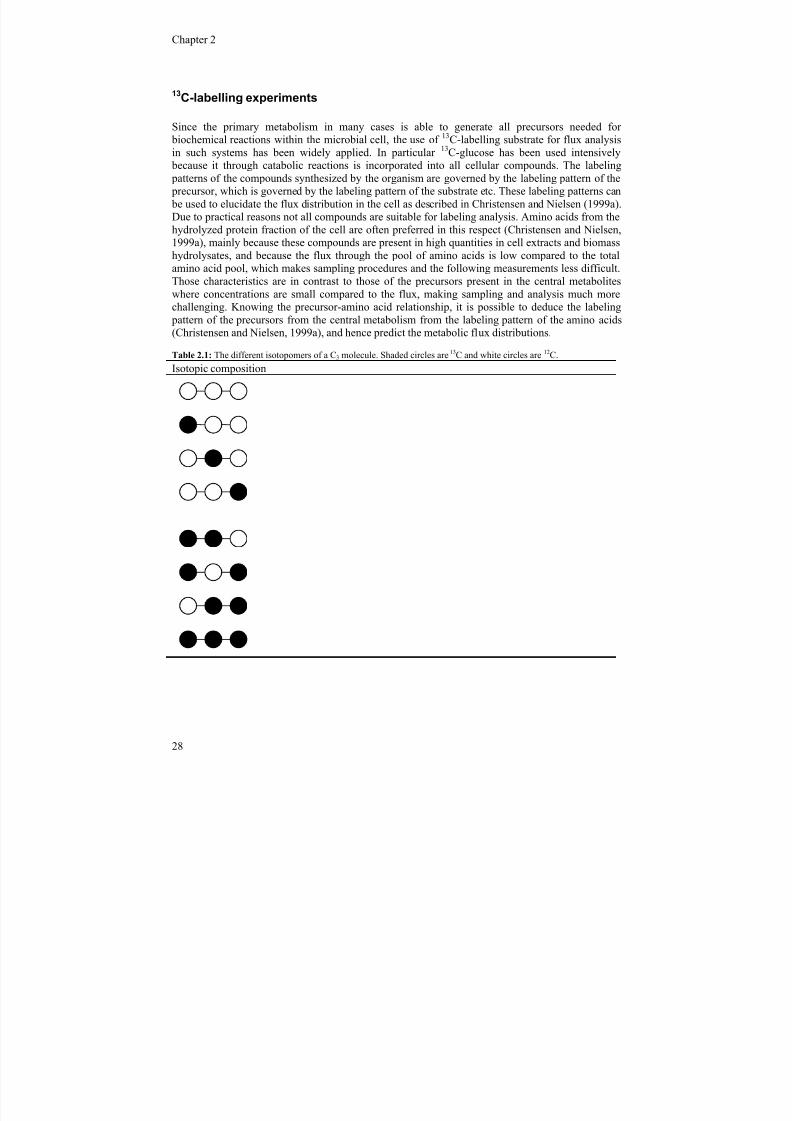
between different pathways leading to the same end-product. When substrates labeled with i.e. 13Cat specific carbon locations is used, the ratio between the labeling states of metabolites can be usedto determine the flux of the competing pathways (Stephanopoulos et al., 1998). The number ofdifferent labeling states depends on the number of C-atoms present in the given metabolite. Ametabolite with n carbon-atoms has 2n possible labeling states. As an example a C-3 moleculewould have eight different labeling states (Table 2.1). The different combinations of labeling statesare called isotope isomers or isotopomers.
Metabolite balancing is limited to the estimation of absolute fluxes, i.e. the absolute carbon enteringa metabolite pool also has to leave the pool, whereas isotope balancing enables estimation ofrelative fluxes. Combining the two methods it is possible to estimate all fluxes within the system(Christensen and Nielsen, 1999b), as it have been illustrated in studies of C. glutamicum (Marx et
al., 1996) and P. chrysogenum (Christensen and Nielsen, 2000).
7/18/2019 Samlet PhD 20090416 U-Forside Appendix.pdf
http://slidepdf.com/reader/full/samlet-phd-20090416-u-forside-appendixpdf 26/187
Chapter 2 ________________________________________________________________________________
28
13C-labelling experiments
Since the primary metabolism in many cases is able to generate all precursors needed for
biochemical reactions within the microbial cell, the use of 13C-labelling substrate for flux analysisin such systems has been widely applied. In particular 13C-glucose has been used intensively
because it through catabolic reactions is incorporated into all cellular compounds. The labeling patterns of the compounds synthesized by the organism are governed by the labeling pattern of the precursor, which is governed by the labeling pattern of the substrate etc. These labeling patterns can be used to elucidate the flux distribution in the cell as described in Christensen and Nielsen (1999a).Due to practical reasons not all compounds are suitable for labeling analysis. Amino acids from thehydrolyzed protein fraction of the cell are often preferred in this respect (Christensen and Nielsen,1999a), mainly because these compounds are present in high quantities in cell extracts and biomasshydrolysates, and because the flux through the pool of amino acids is low compared to the totalamino acid pool, which makes sampling procedures and the following measurements less difficult.Those characteristics are in contrast to those of the precursors present in the central metaboliteswhere concentrations are small compared to the flux, making sampling and analysis much morechallenging. Knowing the precursor-amino acid relationship, it is possible to deduce the labeling
pattern of the precursors from the central metabolism from the labeling pattern of the amino acids(Christensen and Nielsen, 1999a), and hence predict the metabolic flux distributions.
Table 2.1: The different isotopomers of a C3 molecule. Shaded circles are 13C and white circles are 12C.
Isotopic composition
7/18/2019 Samlet PhD 20090416 U-Forside Appendix.pdf
http://slidepdf.com/reader/full/samlet-phd-20090416-u-forside-appendixpdf 27/187
Flux balance analysis and metabolic engineering ________________________________________________________________________________
29
Reciprocal labeling
As mentioned above labeling experiments based on specific labeled substrates are very powerful forelucidating and analyzing flux distributions of biological networks. However, an important feature
that can not be addressed by the methods mentioned above is the uptake and conversion of othercarbon sources than the labeled substrate. In some experiments it may be necessary to addunlabelled co-substrates to the medium, i.e. if the behavior of an organism in complex media needsto be studied, or if the strain has certain auxotrophies. And if one wants to study the uptake,degradation and conversion of these compounds, alternative methods need to be applied. Reciprocallabeling can be used for this purpose as discussed by Christensen (2001). The idea in reciprocallabeling is that instead of using labeled substrate with only one 13C (i.e. [1-13C]glucose), substratelabeled in all positions is used (i.e. [U-13C6]glucose). A high 13C-background is generated, and thisway the contribution from the non-labeled substrate can be elucidated from the 12C-labeling, hencemaking it possible to determine the role of the non-labeled co-substrate (Christensen, 2001).
Current status for metabolic engineering activities in C. glutamicum
Since the development and prevalence of metabolic engineering for improving product yields and productivity, C. glutamicum has undergone a large number of metabolic engineering strategies, ofwhich the major milestones will be reviewed here. The metabolic engineering efforts have beenfocusing on various parts of the metabolism, of which the more important can be overviewed infigure 2.3.
Metabolic engineering of reactions within the lysine pathway
The lysine synthetic pathway of C. glutamicum has been the main focus of many metabolicengineering strategies presented so far. Many of these studies have focused on optimizing the fluxthrough this pathway by altering enzymes or enzyme activities of this pathway. A reaction and genewhich have received a lot of attention in this respect is the aspartate kinase (lysC ) due to itsimportance in the regulation of flux towards lysine-, methionine- and threonine- biosynthesis. In thewild type strain this reaction is feed back inhibited by lysine and threonine, making this reaction akey step in regulation of the biosynthesis of lysine (Kelle et al., 2005). In most C. glutamicum strains overproducing lysine at a production scale the lysC -gene is known to have mutations causingfeed back resistance. The best described mutations in this respect is T311I (Ohnishi et al., 2002),and S301Y and S301F (Lu and Liao, 1997). The effect of the feedback resistant lysC -gene wasshown in a study where the wild type lysC -gene was replaced by a mutated gene in a wild type
background leading to lysine accumulation, which was not seen for the wild type strain (Cremer et
al., 1991; Eggeling et al., 1998). Furthermore, an increase in lysine production was observed whenthe mutated lysC -gene was over-expressed in the lysine producing strain C. glutamicum DG 52-5,(Cremer et al., 1991; Eggeling et al., 1998). These results showed the importance of this reaction inlysine production. However, no effect was seen when the same strategy was applied in a high levellysine producing strain C. glutamicum MH20-22B (Eggeling et al., 1998). A possible explanationfor this disagreement between the results is that C. glutamicum DG 52-5 is a low-level producerwhereas C. glutamicum MH20-22B is a high level producer (Eggeling et al., 1998), and it can be
expected that some of the limitations present in MH20-22B are not present in DG 52-5.

7/18/2019 Samlet PhD 20090416 U-Forside Appendix.pdf
http://slidepdf.com/reader/full/samlet-phd-20090416-u-forside-appendixpdf 28/187
Chapter 2 ________________________________________________________________________________
30
Figure 2.4: Overview of important targets for metabolic engineering for optimizing C. glutamicum for lysine production. Dashed lines represent multiple reactions. For abbreviations see text.

7/18/2019 Samlet PhD 20090416 U-Forside Appendix.pdf
http://slidepdf.com/reader/full/samlet-phd-20090416-u-forside-appendixpdf 29/187
Flux balance analysis and metabolic engineering ________________________________________________________________________________
31
Another gene in the lysine synthetic pathway which has been identified to be involved in lysine productivity is dihydrodipicolinate syntase (dapA). Over-expression of this gene led to productionof lysine in a wild type strain (Cremer et al., 1991). In addition an increase in lysine production wasseen when the same strategy was applied on DG 52-5 (Cremer et al., 1991; Eggeling et al., 1998)
and MH20-22B (Eggeling et al., 1998). In another lysine producer, C. glutamicum ATCC 21253,up-regulation of lysC showed positive lysine production whereas dapA showed no effect (Hua et al.,2000). The simultaneous up-regulation of dapA and lysC resulted in further increase in lysine
production, compared to the situation where the genes were up-regulated individually (Eggeling et
al., 1998).
This strategy was not applied in the study of Hua et al . (2000). In addition to lysC and dapA bothEggeling et al . (1998) and Cremer et al . (1991) up-regulated the genes asd (aspartosemialdehydedehydrogenase), dapB (dihydrodipicolinate), ddh (diamonopimelate dehydrogenase), lysA
(diaminopimelate decarboxylase) without effect, and for ddh a negative effect on lysineaccumulation was seen in the study of Eggeling et al. (1998).
The succinyl branch of the lysine pathway has also been investigated in order to find bottlenecks.Over-expression of dapF or dapC in a lysine producer (C. glutamicum DSM5715) increased lysineaccumulation (Hartmann et al., 2003), whereas it have been shown that disruption of dapE had noeffect on lysine production in C. glutamicum ATCC 21253 (Shaw-Reid et al., 1999).The efflux of lysine from the cytosol of the bacterium is done by the transport protein lysine
permerase ( LysE )(Bellmann et al., 2001; Vrljic et al., 1996). This exporter is tightly controlled inthe wild type strain, making this an obvious candidate for optimization of lysine production. Vrljicet al. (1996) improved the efflux of lysine in the wild type strain (ATCC 13032) five fold by over-expressing lysE , identifying this as a key reaction in optimization of lysine producers.
Metabolic engineering of NADPH metabolism
In C. glutamicum the co-factor NADPH has been object to a lot of attention due to its role in lysinesynthesis where four moles of NADPH is consumed for the synthesis of one molecule of lysine(Marx et al., 1997). A detailed insight into the NADPH metabolism has been made through 13Cmetabolic flux analysis, which has been conducted under various physiological conditions (Beckeret al., 2005; Becker et al., 2007; Dominguez et al., 1998; Kiefer et al., 2004; Marx et al., 1996;Marx et al., 1997; Marx et al., 1999; Petersen et al., 2000; Petersen et al., 2001; Sonntag et al.,1995; Wendisch et al., 2000; Wittmann and Heinzle, 2001; Wittmann and Heinzle, 2002; Wittmann
et al., 2004). These results have demonstrated that the NADPH supply and consumption are fairlyflexible (Marx et al., 1997; Marx et al., 1999), and it varies depending on the carbon source used(Dominguez et al., 1998; Kiefer et al., 2004; Wendisch et al., 2000; Wittmann et al., 2004), the
physiological state of the cells (Marx et al., 1997), and the genetic background of the cells includingintroduction of genetic modifications (Becker et al., 2005; Becker et al., 2007; Marx et al., 1999;Petersen et al., 2001; Wittmann and Heinzle, 2002). In many cases an apparent NADPH excesshave been reported (Dominguez et al., 1998; Marx et al., 1996; Sonntag et al., 1995; Wittmann andHeinzle, 2001; Wittmann and Heinzle, 2002; Wittmann et al., 2004). The presence of additional notyet identified NADPH consuming reactions not included in the models used for estimating themetabolic fluxes have been proposed as an explanation for this apparent NADPH excess in themetabolic flux analysis experiments (Wittmann et al., 2004). In addition to this it needs to be taken
into account that when the data mentioned above is extrapolated to industrial lysine producers
7/18/2019 Samlet PhD 20090416 U-Forside Appendix.pdf
http://slidepdf.com/reader/full/samlet-phd-20090416-u-forside-appendixpdf 30/187
Chapter 2 ________________________________________________________________________________
32
where lysine yields are significantly higher than what is reported here, it can be expected that NADPH is in fact limiting during maximal lysine production.
In C. glutamicum NADPH can be generated by four different reactions: glucose-6-phosphate
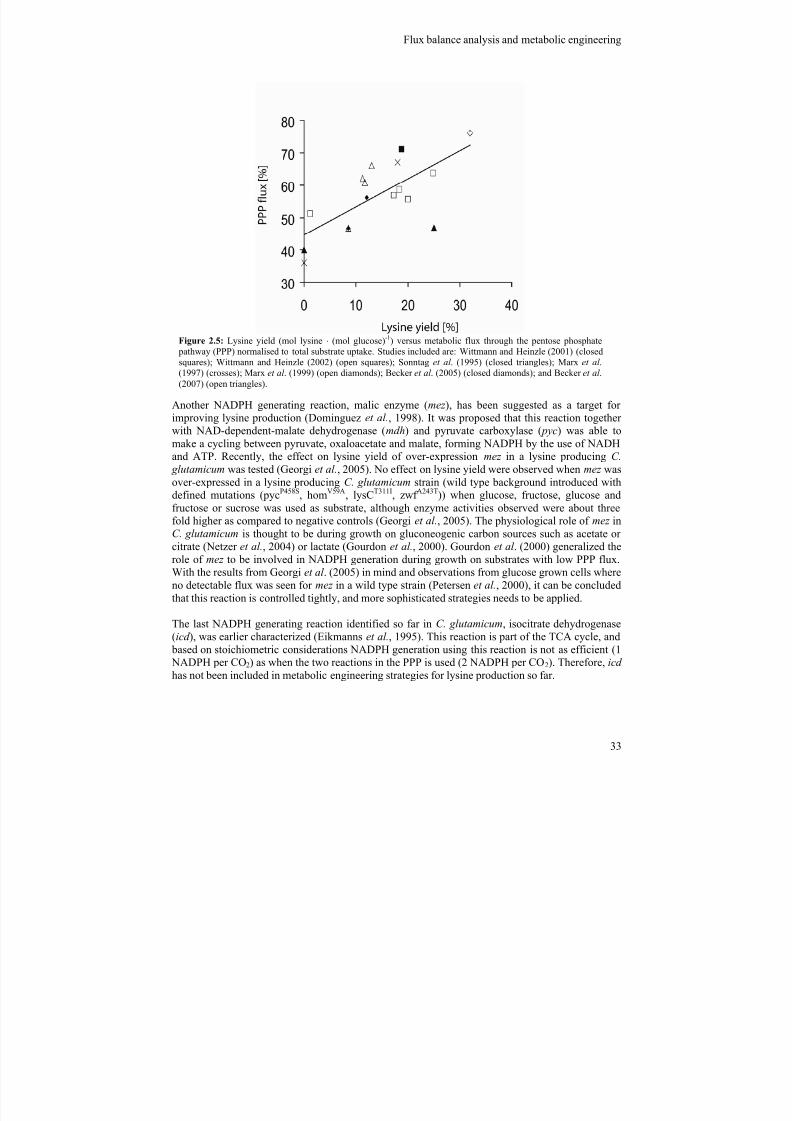
dehydrogenase ( zwf ); 6-phosphogluconate dehydrogenase ( gnd ); isocitrate dehydrogenase (icd ); andmalic enzyme (mez ). Carbon flux analysis revealed the critical importance of the PPP during lysinesynthesis (Figure 2.5), why the two NADPH-generating enzymes present within the PPP, zwf and
gnd , have received a lot of attention. Enzyme studies demonstrated that both enzymes are stronglyinhibited by NADPH (Moritz et al., 2000), which may explain why no successful studies on over-expression of the wild type variants of these genes have been reported so far. However, feed-backinsensitive variants of both the zwf -gene-product (Becker et al., 2007) and the gnd -gene-product(Ohnishi et al., 2005) have been identified, and individual over-expression of these gene-products inlysine producing C. glutamicum strains have resulted in increased lysine production (Becker et al.,2007; Ohnishi et al., 2005). Another strategy to increase the flux through the PPP is by removingthe competing reaction to glucose-6-phosphate, glucose-6-phospoglucose isomerase ( pgi), was
proposed (Dunican et al., 2001) and further studies showed an increased PPP flux and consequentlyan increased lysine yield (Marx et al., 2003). Based on flux analysis studies the deregulation ofanother gene-target , fructose 1,6-bisphosphatase ( fdp), was proposed for increasing the PPP flux(Kiefer et al., 2004; Wittmann et al., 2004). Over-expression of this gene in a lysine producing C.
glutamicum strain (wild type background introduced with a lysCT311I mutation) led to an increasedlysine yield on glucose, fructose and sucrose (Becker et al., 2005). In another study over-expressionof fdp in a C. glutamicum strain (wild type background introduced with defined mutations (pycP458S,homV59A, lysCT311I, zwf A243T)) led to improved lysine yields when glucose and fructose mixtures, orsucrose was used as carbon source, while no effect was seen on the modification when glucose orfructose was used (Georgi et al., 2005). By metabolic flux analysis Becker et al. (2005) was able toidentify a 19% increase in the PPP flux in the strain with an over-expressed fdp-reaction indicatingthat the increased lysine yield was in fact due to an increase in NADPH supply.
7/18/2019 Samlet PhD 20090416 U-Forside Appendix.pdf
http://slidepdf.com/reader/full/samlet-phd-20090416-u-forside-appendixpdf 31/187
Flux balance analysis and metabolic engineering ________________________________________________________________________________
33
Another NADPH generating reaction, malic enzyme (mez ), has been suggested as a target for
improving lysine production (Dominguez et al., 1998). It was proposed that this reaction togetherwith NAD-dependent-malate dehydrogenase (mdh) and pyruvate carboxylase ( pyc) was able tomake a cycling between pyruvate, oxaloacetate and malate, forming NADPH by the use of NADHand ATP. Recently, the effect on lysine yield of over-expression mez in a lysine producing C.
glutamicum was tested (Georgi et al., 2005). No effect on lysine yield were observed when mez wasover-expressed in a lysine producing C. glutamicum strain (wild type background introduced withdefined mutations (pycP458S, homV59A, lysCT311I, zwf A243T)) when glucose, fructose, glucose andfructose or sucrose was used as substrate, although enzyme activities observed were about threefold higher as compared to negative controls (Georgi et al., 2005). The physiological role of mez inC. glutamicum is thought to be during growth on gluconeogenic carbon sources such as acetate orcitrate (Netzer et al., 2004) or lactate (Gourdon et al., 2000). Gourdon et al . (2000) generalized therole of mez to be involved in NADPH generation during growth on substrates with low PPP flux.With the results from Georgi et al . (2005) in mind and observations from glucose grown cells whereno detectable flux was seen for mez in a wild type strain (Petersen et al., 2000), it can be concludedthat this reaction is controlled tightly, and more sophisticated strategies needs to be applied.
The last NADPH generating reaction identified so far in C. glutamicum, isocitrate dehydrogenase(icd ), was earlier characterized (Eikmanns et al., 1995). This reaction is part of the TCA cycle, and
based on stoichiometric considerations NADPH generation using this reaction is not as efficient (1 NADPH per CO2) as when the two reactions in the PPP is used (2 NADPH per CO2). Therefore, icd has not been included in metabolic engineering strategies for lysine production so far.
Figure 2.5: Lysine yield (mol lysine ⋅ (mol glucose)-1) versus metabolic flux through the pentose phosphate pathway (PPP) normalised to total substrate uptake. Studies included are: Wittmann and Heinzle (2001) (closedsquares); Wittmann and Heinzle (2002) (open squares); Sonntag et al . (1995) (closed triangles); Marx et al .(1997) (crosses); Marx et al . (1999) (open diamonds); Becker et al . (2005) (closed diamonds); and Becker et al .(2007) (open triangles).
7/18/2019 Samlet PhD 20090416 U-Forside Appendix.pdf
http://slidepdf.com/reader/full/samlet-phd-20090416-u-forside-appendixpdf 32/187
Chapter 2 ________________________________________________________________________________
34
An alternative strategy to optimize NADPH metabolism for lysine production was evaluated in astudy by Marx et al . (1999). The background for this strategy is the fact that two of the four
NADPH-molecules consumed for the biosynthesis of one molecule of lysine are associated with theincorporation of amine to α-ketoglutarate forming glutamate. This reaction is catalyzed by the
NADPH-dependent glutamate dehydrogenase ( gnd ) in C. glutamicum. Marx et al . (1999)substituted this gene with a gene coding for the NADH-dependent glutamate dehydrogenase, whichessentially decreased the demand for NADPH for biomass- and lysine-production. However, theresponse of this genetic modification was not increased lysine production. In stead a decrease inlysine yield was seen, whereas biomass- and CO2 yields increased significantly. The study of Marxet al . (1999) demonstrated that the cells adjust fluxes to the reduced NADPH demand, and in thiscase the potentially available increase in NADPH did not result in increased lysine production.
From the work done so far on NADPH metabolism in C. glutamicum it can be concluded that lysine production most likely is limited by NADPH supply when lysine production is high, and the PPP isthe major pathway for NADPH supply in this organism.
Metabolic engineering of the anaplerotic reactions
In C. glutamicum there are a number of potential reactions involved in the supply of oxaloacetate,which is the direct precursor for lysine. 13C-flux analysis has revealed the importance of thesereactions, since a correlation between lysine yield and the anaplerotic netflux is seen (Figure 2.6). Inorder to increase the anaplerotic flux various strategies have been suggested and tested. Thecarboxylation of phosphoenolpyruvate catalyzed by phosphoenolpyruvate carboxylase ( ppc), was
proposed as a promising target for metabolic engineering based on carbon flux simulations
(Stephanopoulos and Vallino, 1991; Vallino and Stephanopoulos, 1993). When this gene was over-expressed or inactivated in the lysine producing C. glutamicum strains MH20-22H, no effect wasseen on lysine production (Gubler et al., 1994; Peters-Wendisch et al., 1993; Eggeling et al., 1998).In another strain, C. glutamicum DG 52-5, a positive effect was observed on over-expressing ppc (Cremer et al., 1991; Eggeling et al., 1998).
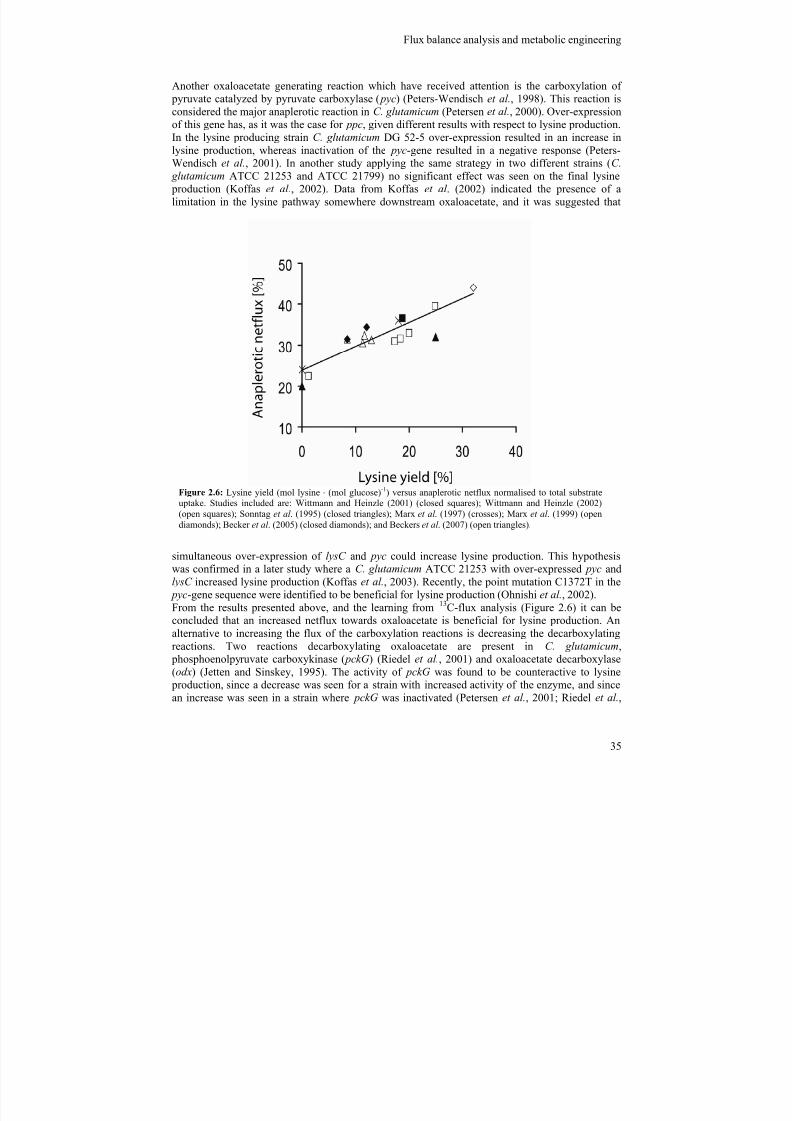
7/18/2019 Samlet PhD 20090416 U-Forside Appendix.pdf
http://slidepdf.com/reader/full/samlet-phd-20090416-u-forside-appendixpdf 33/187
Flux balance analysis and metabolic engineering ________________________________________________________________________________
35
Another oxaloacetate generating reaction which have received attention is the carboxylation of pyruvate catalyzed by pyruvate carboxylase ( pyc) (Peters-Wendisch et al., 1998). This reaction isconsidered the major anaplerotic reaction in C. glutamicum (Petersen et al., 2000). Over-expressionof this gene has, as it was the case for ppc, given different results with respect to lysine production.
In the lysine producing strain C. glutamicum DG 52-5 over-expression resulted in an increase inlysine production, whereas inactivation of the pyc-gene resulted in a negative response (Peters-Wendisch et al., 2001). In another study applying the same strategy in two different strains (C.
glutamicum ATCC 21253 and ATCC 21799) no significant effect was seen on the final lysine production (Koffas et al., 2002). Data from Koffas et al . (2002) indicated the presence of alimitation in the lysine pathway somewhere downstream oxaloacetate, and it was suggested that
simultaneous over-expression of lysC and pyc could increase lysine production. This hypothesiswas confirmed in a later study where a C. glutamicum ATCC 21253 with over-expressed pyc andlysC increased lysine production (Koffas et al., 2003). Recently, the point mutation C1372T in the
pyc-gene sequence were identified to be beneficial for lysine production (Ohnishi et al., 2002).From the results presented above, and the learning from 13C-flux analysis (Figure 2.6) it can beconcluded that an increased netflux towards oxaloacetate is beneficial for lysine production. Analternative to increasing the flux of the carboxylation reactions is decreasing the decarboxylatingreactions. Two reactions decarboxylating oxaloacetate are present in C. glutamicum,
phosphoenolpyruvate carboxykinase ( pckG) (Riedel et al., 2001) and oxaloacetate decarboxylase(odx) (Jetten and Sinskey, 1995). The activity of pckG was found to be counteractive to lysine
production, since a decrease was seen for a strain with increased activity of the enzyme, and sincean increase was seen in a strain where pckG was inactivated (Petersen et al., 2001; Riedel et al.,
Figure 2.6: Lysine yield (mol lysine ⋅ (mol glucose)-1) versus anaplerotic netflux normalised to total substrateuptake. Studies included are: Wittmann and Heinzle (2001) (closed squares); Wittmann and Heinzle (2002)(open squares); Sonntag et al . (1995) (closed triangles); Marx et al . (1997) (crosses); Marx et al . (1999) (opendiamonds); Becker et al . (2005) (closed diamonds); and Beckers et al . (2007) (open triangles).

7/18/2019 Samlet PhD 20090416 U-Forside Appendix.pdf
http://slidepdf.com/reader/full/samlet-phd-20090416-u-forside-appendixpdf 34/187
Chapter 2 ________________________________________________________________________________
36
2001). The role for the second decarboxylation reaction, odx, has not yet been thoroughlyinvestigated with respect to lysine production. However, based on 13C-flux analysis, the flux fromoxaloacetate to pyruvate, and therefore also odx activity, is insignificant under normal conditions(Petersen et al., 2000; Petersen et al., 2001), why the expected effect of an inactivation would be
limited or absent.
The last reaction involved in anaplerotic fluxes in C. glutamicum is mez , which have been discussedearlier.
Utilization of alternative substrates
The major part of the variable costs in lysine production is the carbon source (Seibold et al., 2006).Most work on developing production strains has therefore been focusing on improving productyields. However, another strategy which has been persued is designing C. glutamicum strains ableto utilize cheap raw materials.
C. glutamicum is unable to metabolize lactose and galactose, and is therefore unable to utilize dairy based waste-products, such as whey. By inserting the lactose operon (lacYZ ) from E. coli containinglactose permerase and β-galactosidase a non lysine producing C. glutamicum was able to grow onlactose as the only carbon source (Brabetz et al., 1991). However, in the study of Brabetz et al .(1991) the galactose part of the disaccharide was not utilised, and an accumulation of thiscompound was observed in the fermentation broth. In a later study galactose accumulation wasabolished by making a double mutant containing both the lactose operon from Lactobacillus delbrueckii susp. bulgarisus and the galactose operon ( galMKTE ) from a Lactococcus lactis subsp.
cremoris MG13063 coding for the enzymes responsible for galactose catabolism in this organism(aldose-1-epimerase, galactokinase, UDP-glucose-1-P-uridylyltransferase, UDP-galactose-4-epimerase) (Barret et al., 2004). Barret et al . (2004) used this strategy on a lysine producing C.
glutamicum strain which was able to produce lysine on a whey based medium. Despite theincreased catabolic flexibility of the mutants, slower growth rates and strain instability wasobserved.
Another substrate which has received some attention as a potential substrate for lysine production isstarch. Starch hydrolysates from corn, wheat or cassava are today one of the major substrates forlysine production (Seibold et al., 2006). However, for practical and economical reasons it would be
beneficial if C. glutamicum could directly metabolize soluble starch (Seibold et al., 2006). By
introducing the amyE gene from Streptomyces griseus into a lysine producing C. glutamicum Seibold et al . (2006) was able to construct a mutant excreting α-amylase, and able to grow and
produce lysine on a starch based medium.
With the recent developments in utilizing lignocellulosic biomass from agricultural waste in bioprocesses, a palette of interesting alternative substrates has emerged. These substrates are oftencomplex and contain a wide variety of different carbon sources (Aristidou and Penttilä, 2000), manyof which are not utilizable for C. glutamicum. The composition of lignicellulosic biomass variesdepending on the biomass source, but in general the carbohydrate fraction typically consists of 40%glucose (Aristidou and Penttilä, 2000). However, the pentose fraction is rather significant, the twomajor fractions being xylose (5-20%) and arabinose (1-5%) (Aristidou and Penttilä, 2000). C.
glutamicum is unable to utilize both pentoses. Introducing two E. coli genes xylA and xylB, a C.
7/18/2019 Samlet PhD 20090416 U-Forside Appendix.pdf
http://slidepdf.com/reader/full/samlet-phd-20090416-u-forside-appendixpdf 35/187
Flux balance analysis and metabolic engineering ________________________________________________________________________________
37
glutamicum strain was able to utilize xylose (Kawaguchi et al., 2006). Later, the same strategy wasused on arabinose, where the E. coli genes araA, araB and araD with success was introduced into aC. glutamicum strain making it able to utilize this carbohydrate (Kawaguchi et al., 2008). In bothcases the strains used were not lysine producing strains why the application for this still needs to be
proven.
Although the examples mentioned above are very good starting points, further metabolicengineering efforts and process optimization needs to be done to enable efficient and sustainable
production of lysine on alternative substrates.
Systems biology in improving metabolic engineering in C. glutamicum
Systems biology can be used for the elucidations of cell function and physiology through integrateduse of genomic and physiological data. The use of systems biology for improving metabolicengineering strategies is not a new concept and some of the early examples using flux balanceanalysis (FBA) for predicting metabolic engineering strategies have already been mentioned earlierin this chapter (Vallino and Stephanopoulos, 1993; Stephanopoulos and Vallino, 1991). With thesequencing and annotation of the whole genome of the wild type strain C. glutamicum ATCC 13032(Ikeda and Nakagawa, 2003; Kalinowski et al., 2003), the development in systems biology has beenintensified. Transciptome analysis using DNA microarrays has been developed (Wendisch, 2003)and provided valuable insights into gene expression under various conditions in C. glutamicum.Also protocols for proteome analysis have been developed (Hermann et al., 2001), and results fromthis have given some insight into C. glutamicum microbiology. However, the method which hascontributed the most to understanding C. glutamicum metabolism is metabolic flux analysis by 13C
based methods (Becker et al., 2005; Becker et al., 2007; Dominguez et al., 1998; Kiefer et al.,2004; Marx et al., 1996; Marx et al., 1997; Marx et al., 1999; Petersen et al., 2000; Petersen et al.,2001; Sonntag et al., 1995; Wendisch et al., 2000; Wittmann and Heinzle, 2001; Wittmann andHeinzle, 2002; Wittmann et al., 2004). Development of methods for parallel integration of high-throughput genomic and physiological data sets has facilitated the application of a holistic approachallowing links between different parts of cell physiology, such as transcriptome and fluxome to beelucidated (Krömer et al., 2004). It is expected that such systematic approaches can be used to
predict metabolic engineering strategies for designing optimized C. glutamicum strains for lysine production, as it has been seen for bioethanol production in S. cerevisieae (Bro et al., 2006).
With the developments in C. glutamicum genomics a new methodology has been developed named
“genome breeding”(Ohnishi et al., 2003; Ohnishi et al., 2002). In this approach a “minimalmutation strain” is created by carrying our comparative genomic analysis between a high level producing mutant and the wild type strain to identify those mutations beneficial for production ofthe desired bioproduct. Those mutations are then transferred to a wild type background. This way a
production strain is made without unnecessary and counter-productive mutations normally obtained by random mutagenesis. Using this methodology a high producing strain was generated (Ohnishi et
al., 2002), and one important feature in this new strain was that it was able to grow and producelysine at higher temperatures (40°C) when compared to the production strain (30°C) obtained byclassical mutagenesis (Ohnishi et al., 2003).
7/18/2019 Samlet PhD 20090416 U-Forside Appendix.pdf
http://slidepdf.com/reader/full/samlet-phd-20090416-u-forside-appendixpdf 36/187
Chapter 2 ________________________________________________________________________________
38
References
Åkesson,M., Förster,J., and Nielsen,J. (2004) Integration of gene expression data into genome-scalemetabolic models. Metabolic Engineering 6, 285-293.
Aristidou,A.A. and Penttilä,M. (2000) Metabolic engineering applications for renewable resourceutilization. Current Opinion in Biotechnology 11, 187-198.
Bailey,J.E. (1991) Towards a science of metabolic engineering. Science 252, 1668-1675.
Barret,E., Stanton,C., Zelder,O., Fitzgerald,G., and Ross,R.P. (2004) Heterologous expression oflactose- and galactose-utilizing pathways from lactic acid bacteria in Corynebacterium glutamicum
from production of lysine in whey. Applied and Environmental Microbiology 70, 2861-2866.
Becker,J., Klopprogge,C., Herold,A., Zelder,O., Bolten,C.J., and Wittmann,C. (2007) Metabolicflux engineering of L-lysine production in Corynebacterium glutamicum - over expression andmodification of G6P dehydrogenase. Journal of Biotechnology 132, 99-109.
Becker,J., Klopprogge,C., Zelder,O., Heinzle,E., and Wittmann,C. (2005) Amplified expression offructose 1,6.bisphosphate in Corynebacterium glutamicum increases in vivo flux through the
pentose phosphate pathway and lysine production on different carbon sources. Applied andEnvironmental Microbiology 71, 8587-8596.
Bellmann,A., Vrljic,M., Patek,M., Sahm,H., and Krämer,R. (2001) Expression control andspecificity of the basic amino acid exporter LysE of Corynebacterium glutamicum. Microbiology
147, 1765-1774.
Bertsimas,D. and Tsitsiklis,J.N. (1997) Introduction to Linear Optimization. Athena Scientific,Belmont.
Bonarius,H.P.J., Schmid,G., and Tramper,J. (1997) Flux analysis of underdetermined metabolicnetworks: the quest for the missing constraints. Trends in Biotechnology 15, 308-314.
Borodina,I., Krabben,P., and Nielsen,J. (2005) Genome-scale analysis of Streptomyces coelicolor
A3(2) metabolism. Genome Research 15, 820-829.
Brabetz,W., Liebl,W., and Schleifer,K.H. (1991) Studies on the utilization of lactose byCorynebacterium glutamicum, bearing the lactose operon of Escherichia coli. Archives ofMicrobiology 155, 607-612.
Bro,C., Regenberg,B., Förster,J., and Nielsen,J. (2006) In silico aided metabolic engineering ofSaccharomyces cerevisae for improved bioethanol production. Metabolic Engineering 8, 102-111.
Burgard,A.P., Pharkya,P., and Maranas,C.D. (2003) OptKnock: A bilevel programming frameworkfor identifying gene knockout strategies for microbial strain optimization. Biotechnology andBioengineering 84, 647-657.
7/18/2019 Samlet PhD 20090416 U-Forside Appendix.pdf
http://slidepdf.com/reader/full/samlet-phd-20090416-u-forside-appendixpdf 37/187
Flux balance analysis and metabolic engineering ________________________________________________________________________________
39
Caspi,R., Foerster,H., Fulcher,C.A., Hopkinson,R., Ingraham,J., Kaipa,P., Krummenacker,M.,Paley,S., Pick,J., Rhee,S.Y., Tissier,C., Zhang,P., and Karp,P.D. (2006) MetaCyc: a multiorganismdatabase of metabolic pathways and enzymes. Nucleic Acids Research 34, 511-516.
Christensen,B. (2001) Metabolic Network Analysis: Principles, Methodologies and Applications.PhD-Thesis: BioCentrum-DTU, Technical University of Denmark, Lyngby.
Christensen,B. and Nielsen,J. (1999a) Isotopomer analysis using GC-MS. Metabolic Engineering 1,282-290.
Christensen,B. and Nielsen,J. (1999b) Metabolic network analysis. Advances in BiochemicalEngineering 66, 209-231.
Christensen,B. and Nielsen,J. (2000) Metabolic network analysis of Penicillum chrysogenum using13C-labelled glucose. Biotechnology and Bioengineering 68, 652-659.
Covert,M.W., Knight,E.M., Reed,J.L., Herrgard,M.J., and Palsson,B.O. (2004) Integrated high-throughput and computational data elucidates bacterial networks. Nature 429, 92-96.
Covert,M.W. and Palsson,B.O. (2003) Constraints-based models: regulation of gene expressionreduces the steady-state solution space. Journal of Theoretical Biology 221, 309-325.
Covert,M.W., Schilling,C.H., Famili,I., Edwards,J.S., Goryanin,I.I., Selkov,E., and Palsson,B.O.(2001a) Metabolic modeling of microbial strains in silico. TRENDS in Biochemical Science 26,179-186.
Covert,M.W., Schilling,C.H., and Palsson,B.O. (2001b) Regulation of gene expression in flux balance models of metabolism. Journal of Theoretical Biology 213, 73-88.
Cremer,J., Eggeling,L., and Sahm,H. (1991) Control of the lysine biosynthesis sequence inCorynebacterium glutamicum as analysed by overexpression of the individual corresponding genes.Applied and Environmental Microbiology 57, 1746-1752.
Dominguez,H., Rollin,C., Guyonvarch,A., Guerquin-Kern,J.L., Cocaign-Bousquet,M., andLindley,N.D. (1998) Carbon-flux distribution in the central metabolic pathways ofCorynebacterium glutamicum during growth on fructose. European Journal of Biochemistry 254,
96-102.
Dunican,L.K., McCormack,A., Stapelton,C., Burke,K., O'Donohue,M., Marx,A., and Möckel,B.(2001) Cloning and uses of a novel nucleotide sequence coding for a glucose-6-phosphateisomerase ( pgi) from bacteria. European Patent [EP 1087015].
Edwards,J.S., Ibarra,R.U., and Palsson,B.Ø. (2001) In silico predictions of Escherichia coli metabolic capabilities are consistent with experimental data. Nature Biotechnology 19, 125-130.
Edwards,J.S. and Palsson,B.Ø. (2000) The Escherichia coli MG1655 in silico metabolic genotype:Its definition, characteristics, and capabilities. PNAS 97, 5528-5533.
7/18/2019 Samlet PhD 20090416 U-Forside Appendix.pdf
http://slidepdf.com/reader/full/samlet-phd-20090416-u-forside-appendixpdf 38/187
Chapter 2 ________________________________________________________________________________
40
Eggeling,L., Oberle,S., and Sahm,H. (1998) Improved L-lysine yield with Corynebacterium
glutamicum: use of dapA resulting in increased flux combined with growth limitation. AppliedMicrobiology and Biotechnology 49, 24-30.
Eikmanns,B.J., Rittmann,D., and Sahm,H. (1995) Cloning, sequence analysis, expression, andinactivation of the Corynebacterium glutamicum icd gene encoding isocitrate dehydrogenase and
biochemical characterization of the enzyme. Journal of Bacteriology 177, 774-782.
Feist,A.M., Scholten,J.C.M., Palsson,B.O., Brockman,F.J., and Ideker,T. (2006) Modellingmethanogenesis with a genome-scale metabolic reconstruction of Methanosarcina barkeri.Molecular Systems Biology 2, 1-14.
Förberg,C., Eliaeson,T., and Häggström,L. (1988) Correlation of theoretical and experimentalyields of phenylalanine from non-growing cells of a rec Escherichia coli strain. Journal ofBiotechnology 7, 319-332.
Förster,J., Famili,I., Fu,P., Palsson,B.Ø., and Nielsen,J. (2003) Genome-scale reconstruction of theSaccharomyces cerevisiae metabolic network. Genome Research 13, 244-253.
Georgi,T., Rittmann,D., and Wendisch,V.F. (2005) Lysine and glutamate production byCorynebacterium glutamicum on glucose, fructose and sucrose: Roles of malic enzyme andfructose-1,6-bisphosphatase. Metabolic Engineering 7, 291-301.
Gourdon,P., Baucher,M.F., Lindley,N.D., and Guyonvarch,A. (2000) Cloning of the malic enzymegene from Corynebacterium glutamicum and role of the enzyme in lactate metabolism. Applied andEnvironmental Microbiology 66, 2981-2987.
Gubler,M.E., Park,S.M., Jetten,M.S., and Stephanopoulos,G. (1994) Effects of phosphoenolpyruvate carboxylase deficiency on metabolism and lysine production inCorynebacterium glutamicum. Applied Microbiology and Biotechnology 40, 857-863.
Hartmann,M., Tauch,A., Eggeling,L., Bathe,B., Mockel,B., Puhler,A., and Kalinowski,J. (2003)Identification and characterization of the last two unknown genes, dapC and dapF , in thesuccinylase branch of the -lysine biosynthesis of Corynebacterium glutamicum. Journal ofBiotechnology 104, 199-211.
Heinemann,M., Kümmel,A., Ruinatscha,R., and Panke,S. (2005) In silico genome-scalereconstruction and validation of the Staphylococcus aureus metabolic network. Biotechnology andBioengineering 92, 850-864.
Hermann,T., Pfefferle,W., Baumann,C., Busker,E., Schaffer,S., Bott,M., Sahm,H., Dusch,N.,Kalinowski,J., Pühler,A., Bendt,A.K., Krämer,R., and Burkovski,A. (2001) Proteome analysis ofCorynebacterium glutamicum. Electrophoresis 22, 1712-1723.
Herrgård,M.J., Fong,S.S., and Palsson,B.O. (2006) Identification of Genome-scale metabolicnetwork models using experimentally measured flux profiles. PLoS Computationel Biology 2, 676-686.
7/18/2019 Samlet PhD 20090416 U-Forside Appendix.pdf
http://slidepdf.com/reader/full/samlet-phd-20090416-u-forside-appendixpdf 39/187
Flux balance analysis and metabolic engineering ________________________________________________________________________________
41
Hollander,J.A. (1994) Potential metabolic limitations in lysine production by Corynebacterium
glutamiucm as revealed by metabolic network analysis. Applied Microbiology and Biotechnology42, 508-515.
Hua,Q., Yang,C., and Shimizu,K. (2000) Metabolic control analysis for lysine synthesis usingCorynebacterium glutamicum and experimental verification. Journal of Bioscience andBioengineering 90, 184-192.
Ikeda,M. and Nakagawa,S. (2003) The Corynebacterium glutamicum genome: features and impactson biotechnological processes. Applied Microbiology and Biotechnology 62, 99-109.
Jetten,M.S.M. and Sinskey,A.J. (1995) Purification and properties of oxaloacetate decarboxylasefrom Corynebacterium glutamicum. Antonie van Leeuwenhoek 67, 221-227.
Jørgenen,H.S., Nielsen,J., Villadsen,J., and Møllgaard,H. (1995) Metabolic flux distributions in
Penicillium chrysogenum during fed-batch cultivations. Biotechnology and Bioengineering 46, 117-131.
Kalinowski,J., Bathe,B., Bartels,D., Bischoff,N., Bott,M., Burkovski,A., Dusch,N., Eggeling,L.,Eikmanns,B.J., and Gaigalat,L. (2003) The complete Corynebacterium glutamicum ATCC 13032genome sequence and its impact on the production of -aspartate-derived amino acids and vitamins.Journal of Biotechnology 104, 5-25.
Kanehisa,M., Goto,S., Hattori,M., Aoki-Kinoshita,K.F., Itoh,M., Kawashima,S., Katayama,T.,Araki,M., and Hirakawa,M. (2006) From genomics to chemical genomics: new developments inKEGG. Nucleic Acids Research 34, 354-357.
Karp,P.D., Ouzounis,C.A., Moore-Kochlacs,C., Goldovsky,L., Kaipa,P., Ahrén,D., Tsoka,S.,Darzentas,N., Kunin,V., and López-Bigas,N. (2005) Expansion of the BioCyc collection of
pathway/genome databases to 160 genomes. Nucleic Acids Research 33, 6083-6089.
Kawaguchi,H., Sasaki,M., Vertes,A.A., Inui,M., and Yukawa,H. (2008) Engineering of an L-arabinose metabolic pathway in Corynebacterium glutamicum. Applied Microbiology andBiotechnology 77, 1053-1062.
Kawaguchi,H., Vertes,A.A., Okino,S., Inui,M., and Yukawa,H. (2006) Engineering of a xylose
metabolic pathway in Corynebacterium glutamicum. Applied and Environmental Microbiology 72,3418-3428.
Kelle,R., Hermann,T., and Bathe,B. (2005) L-Lysine production. In Handbook of Corynebacteriumglutamicum (Edited by Eggeling,L. and Bott,M.) pp. 465-488. CRC Press, Boca Raton.
Kiefer,P., Heinzle,E., Zelder,O., and Wittmann,C. (2004) Comparative metabolic flux analysis oflysine-producing Corynebacterium glutamicum cultured on glucose or fructose. Applied andEnvironmental Microbiology 70, 229-239.
7/18/2019 Samlet PhD 20090416 U-Forside Appendix.pdf
http://slidepdf.com/reader/full/samlet-phd-20090416-u-forside-appendixpdf 40/187
Chapter 2 ________________________________________________________________________________
42
Koffas,M.A.G., Jung,G.Y., Aon,J.C., and Stephanopoulos,G. (2002) Effect of pyruvate carboxylaseoverexpression on the physiology of Corynebacterium glutamicum. Applied and EnvironmentalMicrobiology 68, 5422-5428.
Koffas,M.A.G., Jung,G.Y., and Stephanopoulos,G. (2003) Engineering metabolism and productformation in Corynebacterium glutamicum by coordinated gene overexpression. MetabolicEngineering 5, 32-41.
Krömer,J.O., Sorgenfrei,O., Klopprogge,K., Heinzle,E., and Wittmann,C. (2004) In-depth profilingof lysine-producing Corynebacterium glutamicum by combined analysis of the transcriptome,metabolome, and fluxome. Journal of Bacteriology 186, 1769-1784.
Lu,J.-H. and Liao,C.-C. (1997) Site-directed mutagenesis of the aspartikinase gene lysC and itscharacterization in Brevibacterium flavum. Letters in Applied Microbiology 24, 211-213.
Marx,A., de Graaf,A.A., Wiechert,W., Eggeling,L., and Sahm,H. (1996) Determination of thefluxes in the central metabolism of Corynebacterium glutamicum by nuclear magnetic resonancespectroscopy combined with metabolite balancing. Biotechnology and Bioengineering 49, 111-129.
Marx,A., Eikmanns,B.J., Sahm,H., de Graaf,A.A., and Eggeling,L. (1999) Response of the centralmetabolism in Corynebacterium glutamicum to the use of an NADH-Dependent glutamatedehydrogenase. Metabolic Engineering 1, 35-48.
Marx,A., Hans,S., Möckel,B., Bathe,B., and de Graaf,A.A. (2003) Metabolic phenotype of phosphoglucose isomerase mutants of Corynebacterium glutamicum. Journal of Biotechnology 104,185-197.
Marx,A., Striegel,K., de Graaf,A.A., Sahm,H., and Eggeling,L. (1997) Response of the centralmetabolism of Corynebacterium glutamicum to different flux burdens. Biotechnology andBioengineering 56, 168-180.
McGinnis,S. and Madden,T.L. (2004) BLAST: at the core of a powerful and diverse set of sequenceanalysis tools. Nucleic Acids Research 32, 20-25.
Moritz,B., Striegel,K., de Graff,A.A., and Sahm,H. (2000) Kinetic properties of the glucose-6- phosphate and 6-phosphogluconate dehydrogenases from Corynebacterium glutamicum and their
application for predicting pentose phosphate pathway flux in vivo. European Journal ofBiochemistry 267, 3442-3452.
Netzer,R., Krause,M., Rittmann,D., Peters-Wendisch,P., Eggeling,I., Wendisch,V.F., and Sahm,H.(2004) Roles of pyruvate kinase and malic enzyme in Corynebacterium glutamicum for growth oncarbon source requiring gluconeogenesis. Archives of Microbiology 182, 354-363.
Nissen,T.L., Schulze,U., Nielsen,J., and Villadsen,J. (1997) Flux distributions in anaerobic,glucose-limited continuous cultures of Saccharomyces cerevisiae. Microbiology 143, 203-218.
7/18/2019 Samlet PhD 20090416 U-Forside Appendix.pdf
http://slidepdf.com/reader/full/samlet-phd-20090416-u-forside-appendixpdf 41/187
Flux balance analysis and metabolic engineering ________________________________________________________________________________
43
Ohnishi,J., Hayashi,M., Mitsuhashi,S., and Ikeda,M. (2003) Efficient 40°C fermentation of L-lysine by a new Corynebacterium glutamicum mutant developed by genome breeding. AppliedMicrobiology and Biotechnology 62, 69-75.
Ohnishi,J., Kakahira,R., Mitsuhashi,S., Kakita,S., and Ikeda,M. (2005) A novel gnd mutationleading to increased L-lysine production in Corynebacterium glutamicum. FEMS MicrobiologyLetters 242, 265-274.
Ohnishi,J., Mitsuhashi,S., Hayashi,M., Ando,S., Yokoi,H., and Ikeda,M. (2002) A novel methologyemploying Corynebacterium glutamicum genome information to generate a new L-lysine-producingmutant. Applied Microbiology and Biotechnology 58, 217-223.
Oliveira,A.P., Nielsen,J., and Förster,J. (2005) Modelling Lactococcus lactis using a genome-scaleflux model. BMC Microbiology 5, 39.
Palsson,B.O. (2000) The challenges of in silico biology. Nature Biotechnology 18, 1147-1150.
Palsson,B.O. (2006) Systems Biology - Properties of Reconstructed Networks. CambridgeUniversity Press, New York, USA
Papoutsakis,E.T. (1984) Equations and calculations for fermentations of butyric acid bacteria.Biotechnology and Bioengineering 26, 174-184.
Papoutsakis,E.T. and Meyer,C.L. (1985) Equations and calculations of product yield and preferred pathways for butanediol and mixed-acid fermentations. Biotechnology and Bioengineering 27, 50-66.
Patil,K.R., Åkesson,M., and Nielsen,J. (2004) Use of genome-scale microbial models for metabolicengineering. Current Opinion in Biotechnology 15, 64-69.
Peters-Wendisch,P., Eikmanns,B.J., Thierbach,G., Bachmann,B., and Sahm,H. (1993)Phosphoenolpyruvate carboxylase in Corynebacterium glutamicum is dispensable for growth andlysine production. FEMS Microbiology Letters 112, 269-274.
Peters-Wendisch,P.G., Kreutzer,C., Kalinowski,J., Patek,M., Sahm,H., and Eikmanns,B.J. (1998)Pyruvate carboxylase from Corynebacterium glutamicum: characterization, expression and
inactivation of the pyc gene. Microbiology 144, 915-927.
Peters-Wendisch,P.G., Schiel,B., Wendisch,V.F., Katsoulidis,E., Mockel,B., Sahm,H., andEikmanns,B.J. (2001) Pyruvate carboxylase is a major bottleneck for glutamate and lysine
production by Corynebacterium glutamicum. Journal of Molecular Microbiology andBiotechnology 3, 295-300.
Petersen,S., de Graff,A.A., Eggeling,L., Mollney,M., Wiechert,W., and Sahn,H. (2000) In vivo quantification of parallel and bidirectional fluxes in the anaplerosis of Corynebacterium
glutamicum. Journal of Biological Chemistry. 275, 35932-35941.
7/18/2019 Samlet PhD 20090416 U-Forside Appendix.pdf
http://slidepdf.com/reader/full/samlet-phd-20090416-u-forside-appendixpdf 42/187
Chapter 2 ________________________________________________________________________________
44
Petersen,S., Mack,C., de Graaf,A.A., Riedel,C., Eikmanns,B.J., and Sahm,H. (2001) Metabolicconsequences of altered phosphoenolpyruvate carboxykinase activity in Corynebacterium
glutamicum reveal anaplerotic regulation mechanisms in vivo. Metabolic Engineering 3, 344-361.
Price,N.D., Papin,J.A., Schilling,C.H., and Palsson,B.Ø. (2003) Genome-scale microbial in silico models: the constrain-based approach. Trends in Biotechnology 21, 162-169.
Reed,J.R., Vo,T.D., Schilling,C.H., and Palsson,B.Ø. (2003) An expanded genome-scale model of Escherichia coli K-12 (iJR904 GSM/GPR). Genome Research 4.
Riedel,C., Rittmann,D., Dangel,P., Möckel,B., Sahn,H., and Eikmanns,B.J. (2001) Characterization,expression, and inactivation of the phosphoenolpyruvate carboxykinase gene fromCorynebacterium glutamicum and significance of the enzyme for growth and amino acid
production. Journal of Molecular Microbiology and Biotechnology 3, 573-583.
Sauer,U., Cameron,D.C., and Bailey,J.E. (1998) Metabolic capacity of Bacillus subtilis for the production of purine nucleotides, riboflavin, and folic acid. Biotechnology and Bioengineering 59,227-238.
Schilling,C.H., Covert,M.W., Famili,I., Church,G.M., Edwards,J.S., and Palsson,B.Ø. (2002)Genome-scale metabolic model of Helicobacter pylori 26695. Journal of Bacteriology 184, 4582-4593.
Schilling,C.H. and Palsson,B.O. (2000) Assessment of the metabolic capabilities of Haemophilus
influenzae Rd through a genome-scale pathway analysis. Journal of Theoretical Biology 203, 249-283.
Schilling,C.H., Schuster,S., Palsson,B.O., and Heinrich,R. (1999) Metabolic pathway analysis: basic concepts and scientific applications in the post-genomic era. Biotechnology Progress 15, 296-303.
Seibold,G., Auchter,M., Berens,S., Kalinowski,J., and Eikmanns,B.J. (2006) Utilization of solublestarch by a recombinant Corynebacterium glutamicum strain: Growth and lysine production.Journal of Biotechnology 124, 381-391.
Shaw-Reid,C.A., McCormick,M.M., Sinskey,A.J., and Stephanopoulos. (1999) Flux through the
tetrahydrodipicolinate succinylase pathway is dispensable for L-lysine production inCorynebacterium glutamicum. Applied Microbiology and Biotechnology 51, 325-333.
Shpaer,E.G., Robinson,M., Yee,D., Candlin,J.D., Mines,R., and Hunkapiller,T. (1996) Sensitivityand selectivity in protein similarity searches: A comparison of Smith-Waterman in hardware toBLAST and FASTA. Genomics 38, 179-191.
Sonntag,K., Schwinde,J.W., de Graaf,A.A., Marx,A., Eikmanns,B.J., Wiechert,W., and Sahm,H.(1995) 13C NMR studies of the fluxes in the central metabolism of Corynebacterium glutamicum during growth and overproduction of amino acids in batch cultures. Applied Microbiology andBiotechnology 44, 489-495.
7/18/2019 Samlet PhD 20090416 U-Forside Appendix.pdf
http://slidepdf.com/reader/full/samlet-phd-20090416-u-forside-appendixpdf 43/187
Flux balance analysis and metabolic engineering ________________________________________________________________________________
45
Stephanopoulos,G. (1999) Metabolic fluxes and metabolic engineering. Metabolic Engineering 1,1-11.
Stephanopoulos,G. and Vallino,J.J. (1991) Network rigidity and metabolic engineering in
metabolite overproduction. Science 252, 1675-1681.
Stephanopoulos,G.N., Aristidou,A.A., and Nielsen,J. (1998) Metabolic Engineering - Principles andMethodologies. Academic Press, San Diego, USA.
Teusink,B., Wiersma,A., Molenaar,D., Francke,C., de Vos,W.M., Siezen,R.J., and Smid,E.J. (2006)Analysis of growth of Lactobacillus plantarum WCFS1 on a complex medium using a genome-scale model. Journal of Biological Chemistry 281, 40041-40048.
Vallino,J.J. and Stephanopoulos,G. (1993) Metabolic flux distribution in Corynebacterium
glutamicum during growth and lysine overproduction. Bioprocess Engineering 41, 633-646.
Vallino,J.J. and Stephanopoulos,G. (1994a) Carbon flux distributions at the glucose 6-phosphate branch point in Corynebacterium glutamicum during lysine overproduction. BiotechnologyProgress 10, 327-334.
Vallino,J.J. and Stephanopoulos,G. (1994b) Carbon flux distribution at the pyruvate branch point inCorynebacterium glutamicum during lysine overproduction. Biotechnology Progress 10, 320-326.
Varma,A., Boesch,B.W., and Palsson,B.O. (1993a) Biochemical production capabilities of Escherichia coli. Biotechnology and Bioengineering 42, 59-73.
Varma,A., Boesch,B.W., and Palsson,B.O. (1993b) Stoichiometric interpretation of Escherichia
coli glucose catabolism under various oxygenation rates. Applied and Environmental Microbiology59, 2465-2473.
Vrljic,M., Sahm,H., and Eggeling,L. (1996) A new type of transporter with a new type of cellularfunction: l-lysine export from Corynebacterium glutamicum. Molecular Microbiology 22, 815-826.
Wendisch,V.F. (2003) Genome-wide expression analysis in Corynebacterium glutamicum usingDNA microarrays. Journal of Biotechnology 104, 273-285.
Wendisch,V.F., de Graaf,A.A., Sahm,H., and Eikmanns,B.J. (2000) Quantitative determination ofmetabolic fluxes during co-utilization of two carbon sources: Comparative analyses withCorynebacterium glutamicum during growth on acetate and/or glucose. Journal of Bacteriology182, 3088-3096.
Wittmann,C. and Heinzle,E. (2001) Application of MALDI-TOF MS to lysine-producingCorynebacterium glutamicum: A novel approach for metabolic flux analysis. European Journal ofBiochemistry 268, 2441-2455.
Wittmann,C. and Heinzle,E. (2002) Genealogy profiling through strain improvement by usingmetabolic network analysis: metabolic flux genealogy of several generations of lysine-producing
Corynebacteria. Appled and Environmental Microbiology 68, 5843-5859.

7/18/2019 Samlet PhD 20090416 U-Forside Appendix.pdf
http://slidepdf.com/reader/full/samlet-phd-20090416-u-forside-appendixpdf 44/187
Chapter 2 ________________________________________________________________________________
46
Wittmann,C., Kiefer,P., and Zelder,O. (2004) Metabolic fluxes in Corynebacterium glutamicum during lysine production with sucrose as carbon source. Applied and Environmental Microbiology70, 7277-7287.
Yang,C., Hua,Q., and Shimizu,K. (2002) Integration of the information from gene expression andmetabolic fluxes for the analysis of the regulatory mechanisms in Synechocystis. AppliedMicrobiology and Biotechnology 58, 813-822.
7/18/2019 Samlet PhD 20090416 U-Forside Appendix.pdf
http://slidepdf.com/reader/full/samlet-phd-20090416-u-forside-appendixpdf 45/187
Microbiology and biochemistry of Corynebacterium glutamiucum ________________________________________________________________________________
47
Chapter 3
3. Microbiology and biochemistry of Corynebacterium
glutamicum
In this chapter a short introduction to the microbiology of Corynebacterium glutamicum is given,followed by a review of biochemistry of C. glutamicum. The review is used as the basis for the laterreconstruction of the C. glutamicum metabolic network which is presented in chapter 4.Abbreviations used in this chapter are also used for the model reconstruction.
Microbiology of Corynebacterium glutamicum
C. glutamicum is a gram-positive, non-sporulating, non-motile, ellipsoidal bacteria (Abe et al.,1967). It is aerobic and catalase-positive (Liebl, 2005) and most strains form pale yellow colonies,
but some cream-white variants are also known to occur (Abe et al., 1967). The type strainCorynebacterium glutamicum ATCC 13032 (alternative designations: DSM 20300, IMET 10482,and NCIB 10025) was originally isolated from sewage. Other strains have been isolated from soils,soils contaminated with bird faeces, sewage and manure (Liebl, 2005). C. glutamicum is able toutilize various carbon sources i.e. sugars such as glucose and fructose (Dominguez et al., 1997) andsucrose (Dominguez and Lindley, 1996), and organic acids such as acetate (Gerstmeier et al.,2003), lactate and pyruvate (Cocaign-Bousquet et al., 1993) and gluconate (Lee et al., 1998). Inaddition to this it is able to co-metabolize substrates of which some examples have been reported in
literature i.e. lactate and acetate, glucose and pyruvate, glucose and lactate (Cocaign-Bousquet etal., 1993), and acetate and glucose (Wendisch et al., 2000). Cocaign-Bousquet et al ., (1993) foundsimultaneous consumption kinetics during co-metabolism of sugars and organic acids. This lack ofdiauxic growth patterns is quite rarely reported in literature.
C. glutamicum is able to take up and utilize the inorganic nitrogen sources ammonia and ammonium(Burkovski, 2003a). In addition to that some organic sources can be used as nitrogen donors i.e.urea (Siewe et al., 1998), glutamine (Siewe et al., 1995), glutamate (Kronemeyer et al., 1995) andserine (Netzer et al., 2004). It is generally known that other amino acids such as alanine, aspargine,and threonine also can be used. The C. glutamicum parent strain is prototrophic for all amino acidsand vitamins, except for biotin (Liebl, 2005). Some amino acid production strains derived by strainimprovement programs have obtained some amino acid auxotropies such as threonine, methionine,leucine and isoleucine, and in some cases also vitamin auxotrophies such as thiamine and 4-amino
benzoic acid have been reported (Abe et al., 1967).
C. glutamicum grow well in complex media such as brain heart infusion broth (Difco), LB5G broth(0.5% yeast extract, 1% tryptone, 0.5% glucose and 0.5% NaCl; pH 7.2-7.4)) (Vallino andStephanopoulos, 1993); Corynebacterium medium: (1% casein peptone, 0.5% yeast extract, 0.5%glucose and 0.5% NaCl; pH 7.2-7.4) (Deutze Sammling von Microorganismen und ZellkulturenGmbH (DSMZ)) or similar tryptone, peptone, yeast extract based medium. Also less expensivecomponents can be used for complex media preparations such as corn steep liquor (CSL) or
soybean meal hydrolysate. Those types of complex raw materials are normally used on industry
7/18/2019 Samlet PhD 20090416 U-Forside Appendix.pdf
http://slidepdf.com/reader/full/samlet-phd-20090416-u-forside-appendixpdf 46/187
Chapter 3 ________________________________________________________________________________
48
scale fermentations. Defined media have also been developed for this organism (Marx et al., 1996;Moritz et al., 2000; Petersen et al., 2000; Vallino and Stephanopoulos, 1993). This type of media isused in experiments where complex compounds can compromise the results, i.e. in flux analysis.
The C. glutamicum ATCC 13032 parent strain have been reported to grow well at 40°C (Ohnishi etal., 2003), whereas optimal temperatures for amino acid producing strains typically have beenreported between 25 and 37°C (Abe et al., 1967). Traditionally cultivation temperature for lysinefermentations is 30-34°C (Hermann, 2003). Optimum pH is in the range of 7.2-7.4 (DSMZ). C.
glutamicum has a high demand for oxygen and an efficient oxygen supply is important for efficientgrowth and lysine production.
The Corynebacterium glutamicum genome
The genome of C. glutamicum ATCC 13032 have been sequenced by at least three independentresearch groups of which two are now available via open databases (Ikeda and Nakagawa, 2003;Kalinowski et al., 2003). Recently another strain, C. glutamicum R (Inui et al., 2004), wassequenced, published and made available in public databases (Yukawa et al., 2007). In addition tothis, genome sequence projects have been conducted for closely related organisms such asCorynebacterium efficiens YS-314 (Nishio et al., 2003), Corynebacterium jeikeium K411 (Tauch et
al., 2005) and Corynebacterium diphtheriae NCTC 13129 (Ceredeño-Tárraga et al., 2003). Basedon this intensive genome analysis it could be concluded that the size of the C. glutamicum genomeis 3.3 kb and the following annotations have revealed about 3000 ORFs. The G+C content is 54%of the C. glutamicum genome.
Biochemistry of C. glutamicum
Substrate uptake and utilization
C. glutamicum is able to utilize a variety of sugars, sugar alcohols and organic acids as carbonsources, either as a single substrate or during co-metabolism. The sugars fructose, glucose andsucrose are all mainly taken up by specific PTS systems (Moon et al., 2005), which phosphorylatesthese sugars to either glucose-6-phosphate or fructose-6-phosphate by the conversion of
phosphoenolpyruvate to pyruvate. In the case of sucrose only the glucose part is phosphorylated
using this system (Dominguez et al., 1997). Phosphorylation of fructose is only possible using thePTS-system, why internal fructose is transported out of the cell by a unknown transport-mechanism,followed by transport and phosphorylation using the PTS-system (Dominguez et al., 1997;Dominguez and Lindley, 1996). The presence of an mannose specific PTS-system have also beensuggested and confirmed by complementation in E. coli (Lee et al., 1993). However, the
physiological role of this system in C. glutamicum is complex since it has been found to also beinvolved in fructose transport (Kiefer et al., 2004), and glucose transport during osmotic stress(Gourdon et al., 2003). Growth of C. glutamicum in the presence of mannose as the only carbonsource is lower than for growth on glucose (Parche et al., 2001). Parche et al . (2001) also testedmaltose as a carbon source and found growth similar to glucose grown cells. The presence of analternative glucose uptake system has been identified, and in addition to this a glucose kinase ( glk )is present in the organism (Park et al., 2000), making an alternative to the PTS-system for glucose
7/18/2019 Samlet PhD 20090416 U-Forside Appendix.pdf
http://slidepdf.com/reader/full/samlet-phd-20090416-u-forside-appendixpdf 47/187
Microbiology and biochemistry of Corynebacterium glutamiucum ________________________________________________________________________________
49
utilization. A number of organic acids have been investigated as substrate for C. glutamicum.Lactate can be used as a single carbon source or in co-metabolism with other substrates (Cocaign-Bousquet and Lindley, 1995). Both D- and the L-lactate can be utilized, and lactate enters themetabolism via lactate dehydrogenase converting lactate to pyruvate (Bott and Niebisch, 2003).
Acetate can be used as a single carbon source or in co-metabolism with other carbon sources(Wendisch et al., 2000), and enters the TCA cycle as Acetyl-CoA after the combined activities ofacetate kinase (ackA) and phosphotransacetylase ( pta) (Reinscheid et al., 1999). Propionate can beused as a single carbon source or in a combination with other carbon sources (Claes et al., 2002),and enters the metabolism forming pyruvate and succcinate by reaction with oxaloacetate. Pyruvatemetabolism is involved in the respiratory energy metabolism (Bott and Niebisch, 2003). It can beused as a single carbon source or in co-metabolism (Cocaign-Bousquet et al., 1993). The organicacid gluconate enters the organism by the use of a gluconate permerase. Subsequently it is
phosphorylated by gluconate kinase ( gntK ) forming 6-phosphogluconate, which is an intermediatein the pentose phosphate pathway (Lee et al., 1998; Frunzke et al., 2008). Recently citrate have
been evaluated as a substrate for C. glutamicum, and it was seen that this substrate could be utilized
either as the only carbon source or simultaneous with glucose (Polen et al., 2007).
Nitrogen metabolism
Nitrogen uptake and the regulation of nitrogen metabolism have been investigated and reviewedintensively in C. glutamicum (Burkovski, 2003a; Burkovski, 2003b). The organism is able to utilizeinorganic nitrogen as ammonium or ammonia, or as organic nitrogen in the presence of urea oramino acids. Ammonia or ammonium can be taken op either by diffusion when concentrations arehigh or by active uptake systems when concentrations are lower (Meier-Wagner et al., 2001; Siewe
et al., 1996). This is also the case for urea (Siewe et al., 1998). Some amino acids can also serve asnitrogen donors for C. glutamicum. L-glutamine (Siewe et al., 1995), L-glutamate (Kronemeyer et
al., 1995) and L-serine (Netzer et al., 2004) have been studied in this respect, and in addition tothese L-alanine, L-aspargine and L-threonine are generally accepted to serve as potential nitrogensources for C. glutamicum, although no systematic studies have been conducted so far. The majorroute of ammonium assimilation at high concentrations in C. glutamicum is through glutamatedehydrogenase ( gdh: EC 1.4.1.4) (Eq. 3.1). At lower ammonium concentrations (≤0.1 mM) the highaffinity system GS/GOGAT is used instead involving two sequential reactions catalysed byglutamine syntase ( glnA: EC 6.3.1.2), Eq. 3.2, and glutamate syntase ( gltBD: EC 1.4.1.13), Eq. 3.3,(Jakoby et al., 1997). The difference between the net result of the GS/GOGAT and gnd is theconsumption of one mole of ATP, making this system less energy efficient. During relevant
fermentation conditions ammonium concentrations are always high (≥ 0.5 mM), which makes gdhmost significant for ammonium assimilation during amino acid production.
Eq. 3.1 ( gdh): α-ketogluterate + NADPH + NH4+→ glutamate + NADP+
Eq. 3.2 ( glnA): glutamate + ATP + NH4+→ glutamine + ADP + Pi
Eq. 3.3 ( gltBD): glutamine + α-ketogluterate + NADPH → 2 glutamate + NADP+
When inside the cell urea is hydrolysed by the enzyme urease (ureA: EC 3.5.1.5) (Siewe et al.,1998) yielding two molecules of ammonia and one molecule of carbon dioxide. Ammonia is further
assimilated into glutamate or glutamine as described above.
7/18/2019 Samlet PhD 20090416 U-Forside Appendix.pdf
http://slidepdf.com/reader/full/samlet-phd-20090416-u-forside-appendixpdf 48/187
Chapter 3 ________________________________________________________________________________
50
Phosphorous metabolism
In bacterial cells phosphorous occurs in inorganic form, mostly orthophosphate (Pi), pyrophosphate(PPi) or polyphosphates (polyPi), and in organic form mostly as a component in a number of
biomass components, the most important being RNA and DNA. In addition phosphorous plays acentral role in energy metabolism since biochemical energy obtained by the oxidation of substratesis used to form ATP from ADP and Pi. The most important source of phosphorous for C.
glutamicum is phosphate (PO43+). The presence of three different systems ( pitA, nptA, and pst ) for
the uptake of inorganic phosphorous have been proposed in C. glutamicum based on the annotatedgenome (Ishige et al., 2003).The pitA-system is a low affinity transporter with a high capacity usingthe proton motive force, and is preferably used when phosphorous concentrations are high. ThenptA-system is a Na+-dependent symporter transport system. The last system is an ABC-type ATP-driven high affinity transport system, probably used during conditions where phosphorousconcentrations are low since this system is strongly upregulated during phosphorous starvationconditions (Ishige et al., 2003).
Sulfur metabolism
Sulfur is used as a constituent of a large number of biomass components, methionine and cysteine being the most dominant. The main source of sulfur for micro-organisms in nature and infermentations is the inorganic compound sulfate (SO4
2-), which will be the main focus here. Sulfateenters the cell via an ATP-dependent transport-system, and is reduced to the bio-available sulfide
(H2S) via a sequence of steps (Lee, 2005). These steps involves an activation to adenosine-5’- phosphosulphate (APS) followed by a reduction to sulfite (SO32-), and a further reduction step to
sulfide. An alternative pathway which has been proposed due to its presence in other bacteria is the phosphorylation of APS to 3’-phosphoadenosine 5’phosphosulphate (PAPS), which is reduced tosulfite. However, the presence or this pathway has not yet been confirmed, and the apparent lack ofthe gene encoding the enzyme catalyzing the first reaction in the annotated genome indicates thatonly the first pathway is in fact present in C. glutamicum (Lee, 2005). An alternative to theassimilation of inorganic sulfur is the degradation of sulfur containing amino acids. Cysteine can bedegraded to pyruvate, H2S, and NH3 by cysteine desulfhydrase (aecD) (Rossol and Pühler, 2003).Methionine degradation is not well investigated. Based on genome data it is likely that it is a threestep pathway forming α-ketobutyrate, methanethiol, and NH3. Another variant involves an
additional step yielding α-keto-γ-thiobutyrate and glutamate from methionine and α-ketobutyrate.However, no biological evidence has yet been presented for these pathways.
Central Carbon Metabolism
The Glycolysis
After sugars has been taken up and phosphorylated they enter the glycolytic pathway or the pentose phosphate pathway (see later in this chapter) (Figure 3.1). The point for the metabolic flux towardseither glycolysis or pentose phosphate pathway is at the metabolite glucose-6-phosphate, whichearlier have been identified as a branch point for central metabolism in C. glutamicum (Vallino and
7/18/2019 Samlet PhD 20090416 U-Forside Appendix.pdf
http://slidepdf.com/reader/full/samlet-phd-20090416-u-forside-appendixpdf 49/187
Microbiology and biochemistry of Corynebacterium glutamiucum ________________________________________________________________________________
51
Stephanopoulos, 1994). The first step in glycolysis is catalysed by the enzyme glucose-6-phosphateisomerase ( pgi) catalysing the reversible reaction between glucose-6-phosphate and fructose-6-
phosphate (Marx et al., 2003). Fructose-6-phosphate is further converted to fructose-1,6- bisphosphate via 6-phosphofructokinase ( pfkA) (Sugimoto and Shiio, 1989b). During
gluconegenesis the enzyme fructose-1,6-bisphosphatase ( fbp) is essential catalysing the reversereaction of pfkA (Rittmann et al., 2003). The further conversion of fructose-1,6-bisphosphate iscatalysed by glyceraldehydes-3-phosphate dehydrogenase ( fda) forming dihydroxyacetone
phosphate and glycaldehyde 3-phosphate (von der Osten et al., 1989). The generateddihydroxyacetone phosphate is converted to glycaldehyde 3-phosphate by triosephosphateisomerase (tpiA), and glycaldehyde 3-phosphate is further converted to 1,3-biphosphoglycerate byglycaldehyde 3-phosphate dehydrogenase ( gapA) using NAD+ as a co-enzyme (Eikmanns, 1992;Omumasaba et al., 2004). The presence of an NADPH dependent glycaldehyde 3-phosphatedehydrogenase ( gapB) have also been confirmed and investigated (Omumasaba et al., 2004).Omumasaba et al . (2004) investigated the role of both enzymes and found that gapA was essentialfor growth on glucose, whereas the deletion of gapB did not have any effect. During growth on
organic acids (lactate, acetate and pyruvate) growth was seen for both Δ gapA- and Δ gapB-mutants,although a more abundant negative effect was observed for the Δ gapB-mutant. These resultsindicate that gapA is reversible, and strictly used during growth on glucose, whereas gapB only isactive during gluconeogenic growth, where this pathway is more effective than gapA. The nextreaction is the reversible reaction converting 1,3-biphosphoglycerate to 3-phosphoglycerate coupledto phosphorylation of ADP to ATP, catalysed by 3-phosphoglycerate kinase ( pgk ) (Eikmanns,1992). Based on the annotated genome 3-phosphoglycerate is converted to 2-phosphoglycerate by
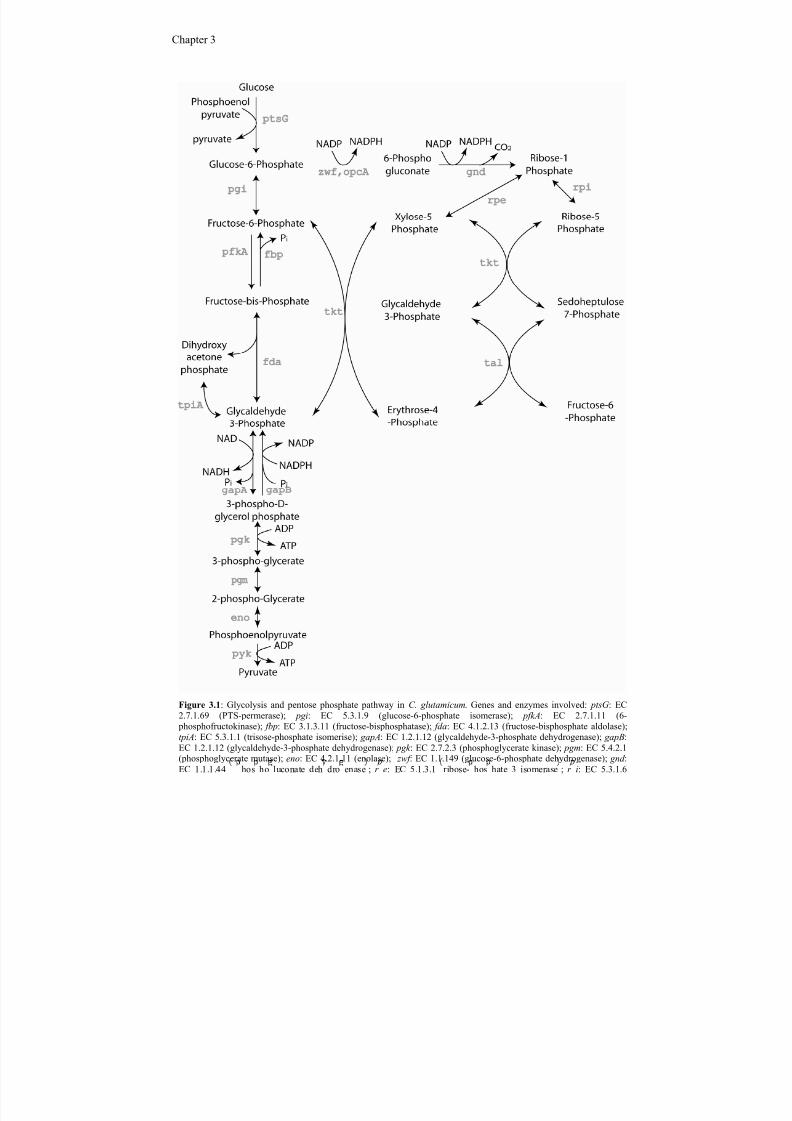
7/18/2019 Samlet PhD 20090416 U-Forside Appendix.pdf
http://slidepdf.com/reader/full/samlet-phd-20090416-u-forside-appendixpdf 50/187
Chapter 3 ________________________________________________________________________________
52
Figure 3.1: Glycolysis and pentose phosphate pathway in C. glutamicum. Genes and enzymes involved: ptsG: EC2.7.1.69 (PTS-permerase); pgi: EC 5.3.1.9 (glucose-6-phosphate isomerase); pfkA: EC 2.7.1.11 (6- phosphofructokinase); fbp: EC 3.1.3.11 (fructose-bisphosphatase); fda: EC 4.1.2.13 (fructose-bisphosphate aldolase);tpiA: EC 5.3.1.1 (trisose-phosphate isomerise); gapA: EC 1.2.1.12 (glycaldehyde-3-phosphate dehydrogenase); gapB:EC 1.2.1.12 (glycaldehyde-3-phosphate dehydrogenase); pgk : EC 2.7.2.3 (phosphoglycerate kinase); pgm: EC 5.4.2.1(phosphoglycerate mutase); eno: EC 4.2.1.11 (enolase); zwf : EC 1.1.149 (glucose-6-phosphate dehydrogenase); gnd :EC 1.1.1.44 hos ho luconate deh dro enase ; r e: EC 5.1.3.1 ribose- hos hate 3 isomerase ; r i: EC 5.3.1.6
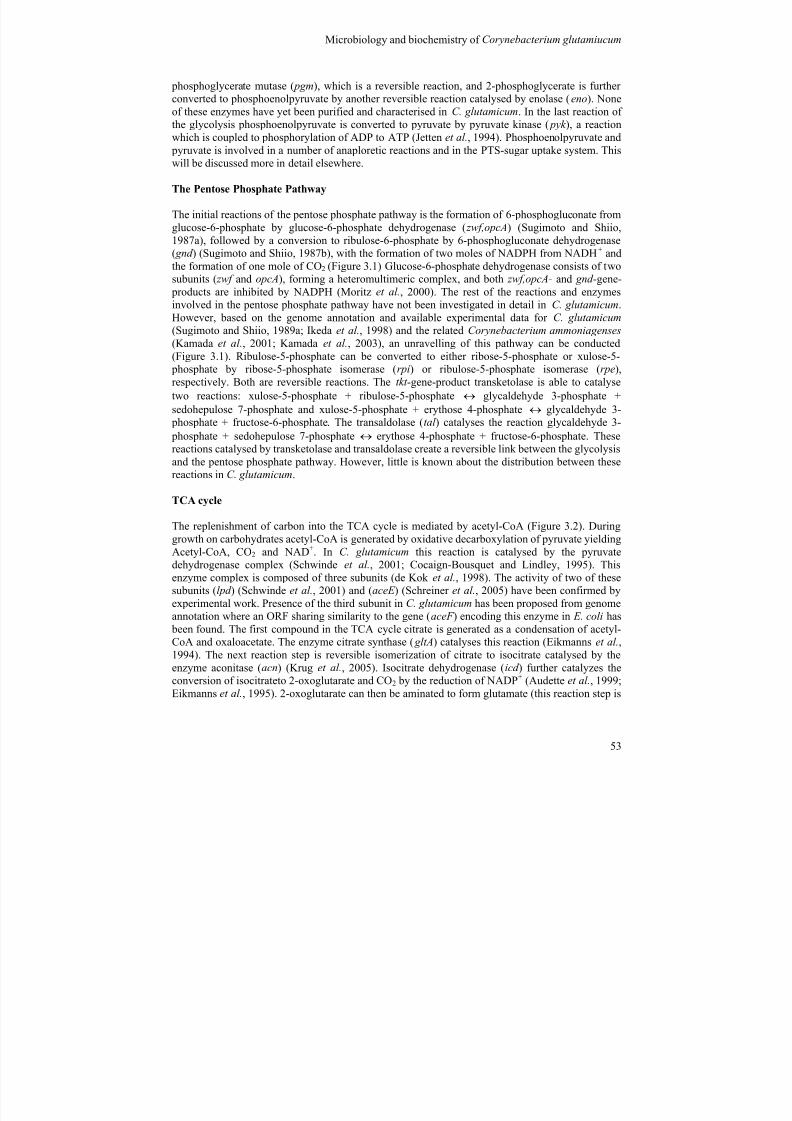
7/18/2019 Samlet PhD 20090416 U-Forside Appendix.pdf
http://slidepdf.com/reader/full/samlet-phd-20090416-u-forside-appendixpdf 51/187
Microbiology and biochemistry of Corynebacterium glutamiucum ________________________________________________________________________________
53
phosphoglycerate mutase ( pgm), which is a reversible reaction, and 2-phosphoglycerate is furtherconverted to phosphoenolpyruvate by another reversible reaction catalysed by enolase (eno). Noneof these enzymes have yet been purified and characterised in C. glutamicum. In the last reaction ofthe glycolysis phosphoenolpyruvate is converted to pyruvate by pyruvate kinase ( pyk ), a reaction
which is coupled to phosphorylation of ADP to ATP (Jetten et al., 1994). Phosphoenolpyruvate and pyruvate is involved in a number of anaploretic reactions and in the PTS-sugar uptake system. Thiswill be discussed more in detail elsewhere.
The Pentose Phosphate Pathway
The initial reactions of the pentose phosphate pathway is the formation of 6-phosphogluconate fromglucose-6-phosphate by glucose-6-phosphate dehydrogenase ( zwf,opcA) (Sugimoto and Shiio,1987a), followed by a conversion to ribulose-6-phosphate by 6-phosphogluconate dehydrogenase( gnd ) (Sugimoto and Shiio, 1987b), with the formation of two moles of NADPH from NADH + andthe formation of one mole of CO2 (Figure 3.1) Glucose-6-phosphate dehydrogenase consists of two
subunits ( zwf and opcA), forming a heteromultimeric complex, and both zwf,opcA- and gnd -gene- products are inhibited by NADPH (Moritz et al., 2000). The rest of the reactions and enzymesinvolved in the pentose phosphate pathway have not been investigated in detail in C. glutamicum.However, based on the genome annotation and available experimental data for C. glutamicum (Sugimoto and Shiio, 1989a; Ikeda et al., 1998) and the related Corynebacterium ammoniagenses (Kamada et al., 2001; Kamada et al., 2003), an unravelling of this pathway can be conducted(Figure 3.1). Ribulose-5-phosphate can be converted to either ribose-5-phosphate or xulose-5-
phosphate by ribose-5-phosphate isomerase (rpi) or ribulose-5-phosphate isomerase (rpe),respectively. Both are reversible reactions. The tkt -gene-product transketolase is able to catalysetwo reactions: xulose-5-phosphate + ribulose-5-phosphate ↔ glycaldehyde 3-phosphate +sedohepulose 7-phosphate and xulose-5-phosphate + erythose 4-phosphate ↔ glycaldehyde 3-
phosphate + fructose-6-phosphate. The transaldolase (tal ) catalyses the reaction glycaldehyde 3- phosphate + sedohepulose 7-phosphate ↔ erythose 4-phosphate + fructose-6-phosphate. Thesereactions catalysed by transketolase and transaldolase create a reversible link between the glycolysisand the pentose phosphate pathway. However, little is known about the distribution between thesereactions in C. glutamicum.
TCA cycle
The replenishment of carbon into the TCA cycle is mediated by acetyl-CoA (Figure 3.2). Duringgrowth on carbohydrates acetyl-CoA is generated by oxidative decarboxylation of pyruvate yielding
Acetyl-CoA, CO2 and NAD+
. In C. glutamicum this reaction is catalysed by the pyruvatedehydrogenase complex (Schwinde et al., 2001; Cocaign-Bousquet and Lindley, 1995). Thisenzyme complex is composed of three subunits (de Kok et al., 1998). The activity of two of thesesubunits (lpd ) (Schwinde et al., 2001) and (aceE ) (Schreiner et al., 2005) have been confirmed byexperimental work. Presence of the third subunit in C. glutamicum has been proposed from genomeannotation where an ORF sharing similarity to the gene (aceF ) encoding this enzyme in E. coli has
been found. The first compound in the TCA cycle citrate is generated as a condensation of acetyl-CoA and oxaloacetate. The enzyme citrate synthase ( gltA) catalyses this reaction (Eikmanns et al.,1994). The next reaction step is reversible isomerization of citrate to isocitrate catalysed by theenzyme aconitase (acn) (Krug et al., 2005). Isocitrate dehydrogenase (icd ) further catalyzes theconversion of isocitrateto 2-oxoglutarate and CO2 by the reduction of NADP+ (Audette et al., 1999;
Eikmanns et al., 1995). 2-oxoglutarate can then be aminated to form glutamate (this reaction step is
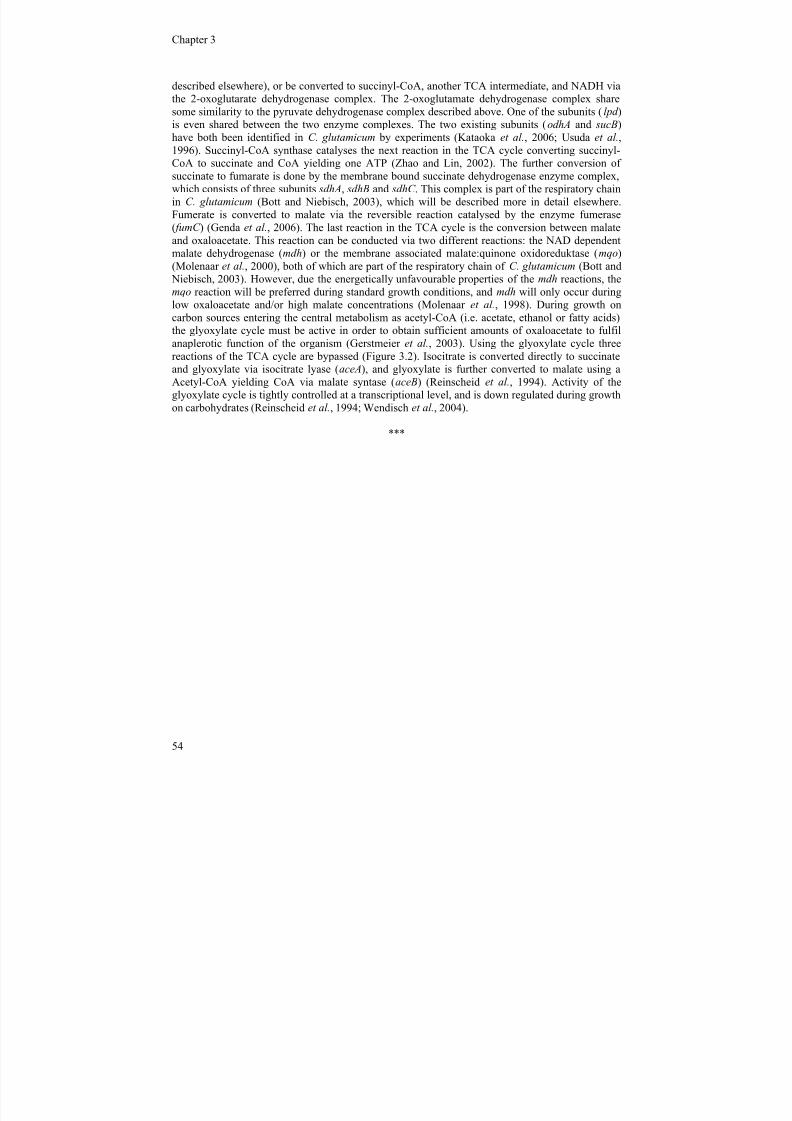
7/18/2019 Samlet PhD 20090416 U-Forside Appendix.pdf
http://slidepdf.com/reader/full/samlet-phd-20090416-u-forside-appendixpdf 52/187
Chapter 3 ________________________________________________________________________________
54
described elsewhere), or be converted to succinyl-CoA, another TCA intermediate, and NADH viathe 2-oxoglutarate dehydrogenase complex. The 2-oxoglutamate dehydrogenase complex sharesome similarity to the pyruvate dehydrogenase complex described above. One of the subunits (lpd )is even shared between the two enzyme complexes. The two existing subunits (odhA and sucB)
have both been identified in C. glutamicum by experiments (Kataoka et al., 2006; Usuda et al.,1996). Succinyl-CoA synthase catalyses the next reaction in the TCA cycle converting succinyl-CoA to succinate and CoA yielding one ATP (Zhao and Lin, 2002). The further conversion ofsuccinate to fumarate is done by the membrane bound succinate dehydrogenase enzyme complex,which consists of three subunits sdhA, sdhB and sdhC . This complex is part of the respiratory chainin C. glutamicum (Bott and Niebisch, 2003), which will be described more in detail elsewhere.Fumerate is converted to malate via the reversible reaction catalysed by the enzyme fumerase( fumC ) (Genda et al., 2006). The last reaction in the TCA cycle is the conversion between malateand oxaloacetate. This reaction can be conducted via two different reactions: the NAD dependentmalate dehydrogenase (mdh) or the membrane associated malate:quinone oxidoreduktase (mqo)(Molenaar et al., 2000), both of which are part of the respiratory chain of C. glutamicum (Bott and
Niebisch, 2003). However, due the energetically unfavourable properties of the mdh reactions, themqo reaction will be preferred during standard growth conditions, and mdh will only occur duringlow oxaloacetate and/or high malate concentrations (Molenaar et al., 1998). During growth oncarbon sources entering the central metabolism as acetyl-CoA (i.e. acetate, ethanol or fatty acids)the glyoxylate cycle must be active in order to obtain sufficient amounts of oxaloacetate to fulfilanaplerotic function of the organism (Gerstmeier et al., 2003). Using the glyoxylate cycle threereactions of the TCA cycle are bypassed (Figure 3.2). Isocitrate is converted directly to succinateand glyoxylate via isocitrate lyase (aceA), and glyoxylate is further converted to malate using aAcetyl-CoA yielding CoA via malate syntase (aceB) (Reinscheid et al., 1994). Activity of theglyoxylate cycle is tightly controlled at a transcriptional level, and is down regulated during growthon carbohydrates (Reinscheid et al., 1994; Wendisch et al., 2004).
***
7/18/2019 Samlet PhD 20090416 U-Forside Appendix.pdf
http://slidepdf.com/reader/full/samlet-phd-20090416-u-forside-appendixpdf 53/187
Microbiology and biochemistry of Corynebacterium glutamiucum ________________________________________________________________________________
55
Figure 3.2: TCA cycle and anaploretic reactions in C. glutamicum. Genes and enzymes involved: pckG: EC 4.1.1.32(phosphoenolpyruvate carboxykinase (GTP)); ppc: EC 4.1.1.31 ( phosphoenolpyruvate carboxylase); pps: EC 2.7.9.2(phosphoenolpyruvate syntase); pyk : 2.7.1.40 (pyruvate kinase); pyc: EC 6.4.1.1 (pyruvate carboxylase); odX : EC4.1.1.3 (oxaloacetate decarboxylase); aceE : EC 1.2.4.1 (pyruvate dehydrogenase); aceF : EC 2.3.1.12; gltA: 2.3.3.1(citrate syntase); acn: EC 4.2.1.3 (aconitate hydratase); icd : EC 1.1.1.42 (isocitrate dehydrogenase); odhA: EC 1.2.4.2(oxoglutarate dehydrogenase); sucB: EC 2.3.1.61; sucD: EC 6.2.1.5 (succinate-CoA ligase); sdhCAB: EC 1.3.5.1(succinate dehydrogenase); fumC : EC4.2.1.2 (fumerate hydratase); mdh: EC 1.1.1.37 (malate dehydrogenase); mqo: EC1.1.99.16 (malate dehydrogenase); aceA: 4.1.3.1 (isocitrate lyase); aceB: EC 2.3.3.9 (formerly EC 4.1.3.2) (malatesyntase); mez : EC 1.1.140 (malic enzyme).
7/18/2019 Samlet PhD 20090416 U-Forside Appendix.pdf
http://slidepdf.com/reader/full/samlet-phd-20090416-u-forside-appendixpdf 54/187
Chapter 3 ________________________________________________________________________________
56
Anaplerotic reactions around the phosphoenolpyruvate-pyruvate-oxaloacetate node
The phosphoenolpyruvate-pyruvate-oxaloacetate node has been given a lot of attention due to itscentral position in the metabolism directing carbon towards the TCA-cycle. C. glutamicum possess
a number of enzymes and reactions around this node (Figure 3.2). Two C3-carboxylating enzymes: pyruvate carboxylase ( pyc) (Peters-Wendisch et al., 1998) and phosphoenolpyruvate carboxylase( ppc) (Eikmanns et al., 1989); three C4-decarboxylating enzymes malic enzyme (mez ) (Gourdon et
al., 2000), oxaloacetate decarboxylase (Odx) (Jetten and Sinskey, 1995); phosphoenolpyruvatecarboxykinase ( pckG) (Jetten and Sinskey, 1993); and the ATP-yielding pyruvate kinase ( pyk )(Jetten et al., 1994) are present. However, the level of activity of these enzymes, and consequentlythe flux-distributions, are highly dependent on the substrate(s) utilized by the organism (Petersen et
al., 2000; Peters-Wendisch et al., 1998; Gourdon et al., 2000; Dominguez et al., 1998). Based onthe annotated genome another two enzymes are present at this node: Phosphoenolpyruvate syntase( pps; EC 2.7.9.2) and malate dehydrogenase (mdh2; EC 1.1.1.82). However, the presence of theseenzymes in C. glutamicum has until today not been shown experimentally. During growth on
carbohydrates pyc and ppc are essential as anaplerotic enzymes (Peters-Wendisch et al., 1998), andthose are also the dominating pathways during growth and lysine synthesis on carbohydrates, with
pyc being the most significant (90%) (Petersen et al., 2000; Park et al., 1997). Although the role ofmez , Odx and pckG have been excluded during anaploreis (Peters-Wendisch et al., 1998), someactivity of these enzymes are still seen during utilization of carbohydrates (Petersen et al., 2001;Petersen et al., 2000; Gourdon et al., 2000; Jetten and Sinskey, 1995), why the significance of theseenzymes can not be neglected. However, based on data from Petersen et al. (2000) the only C4-decarboxylating reaction contributing with a significant flux is pckG. The consequence of this fluxis a GTP consuming futile cycle in which pyruvate is converted to oxaloacetate (via pyc),oxaloacetate is converted to phosphoenolpyruvate (via pckG) and phosphoenolpyruvate is converted
back to pyruvate (via pyk ). Petersen et al . (2000) suggested that this cycling between the C4- andC3-pool serves as a fine tuning within the central metabolism to balance anaplerosis withcatabolism, and to be able to make rapid responses to alterations in the environment.
***
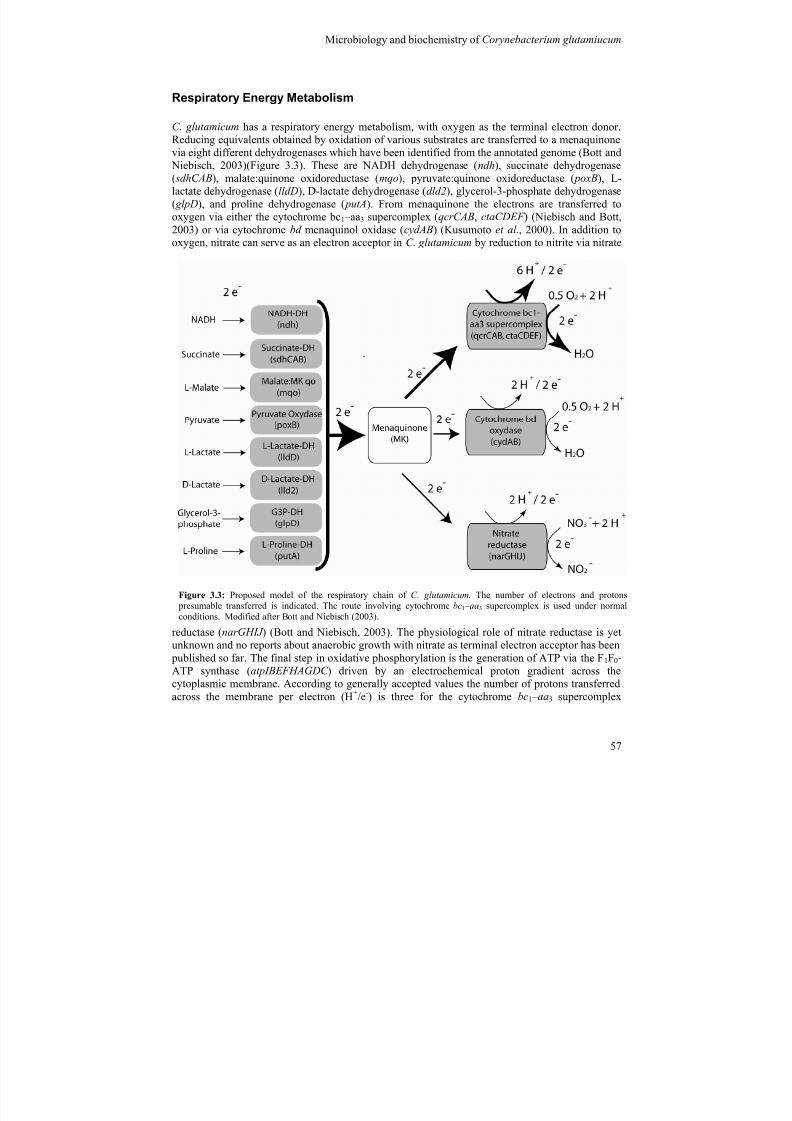
7/18/2019 Samlet PhD 20090416 U-Forside Appendix.pdf
http://slidepdf.com/reader/full/samlet-phd-20090416-u-forside-appendixpdf 55/187
Microbiology and biochemistry of Corynebacterium glutamiucum ________________________________________________________________________________
57
Respiratory Energy Metabolism
C. glutamicum has a respiratory energy metabolism, with oxygen as the terminal electron donor.
Reducing equivalents obtained by oxidation of various substrates are transferred to a menaquinonevia eight different dehydrogenases which have been identified from the annotated genome (Bott and
Niebisch, 2003)(Figure 3.3). These are NADH dehydrogenase (ndh), succinate dehydrogenase( sdhCAB), malate:quinone oxidoreductase (mqo), pyruvate:quinone oxidoreductase ( poxB), L-lactate dehydrogenase (lldD), D-lactate dehydrogenase (dld2), glycerol-3-phosphate dehydrogenase( glpD), and proline dehydrogenase ( putA). From menaquinone the electrons are transferred tooxygen via either the cytochrome bc1 –aa3 supercomplex (qcrCAB, ctaCDEF ) (Niebisch and Bott,2003) or via cytochrome bd menaquinol oxidase (cydAB) (Kusumoto et al., 2000). In addition tooxygen, nitrate can serve as an electron acceptor in C. glutamicum by reduction to nitrite via nitrate
reductase (narGHIJ ) (Bott and Niebisch, 2003). The physiological role of nitrate reductase is yetunknown and no reports about anaerobic growth with nitrate as terminal electron acceptor has been
published so far. The final step in oxidative phosphorylation is the generation of ATP via the F1F0-ATP synthase (atpIBEFHAGDC ) driven by an electrochemical proton gradient across thecytoplasmic membrane. According to generally accepted values the number of protons transferred
across the membrane per electron (H+/e-) is three for the cytochrome bc1 – aa3 supercomplex
Figure 3.3: Proposed model of the respiratory chain of C. glutamicum. The number of electrons and protons presumable transferred is indicated. The route involving cytochrome bc1 – aa3 supercomplex is used under normalconditions. Modified after Bott and Niebisch (2003).
7/18/2019 Samlet PhD 20090416 U-Forside Appendix.pdf
http://slidepdf.com/reader/full/samlet-phd-20090416-u-forside-appendixpdf 56/187
Chapter 3 ________________________________________________________________________________
58
(Nicholls and Ferguson, 1992), and one for cytochrome bd menaquinol oxidase (Stryer, 1995a).Production of one molecule of ATP by the F1F0-ATP synthase requires transport of three to four
protons, consequently leading to a maximum P/O-value of 1.5-2 when the cytochrome bc1 – aa3 supercomplex is used for electron transfer and 0.5-2/3 when cytochrome bd menaquinol oxidase is
used (Bott and Niebisch, 2003).Under normal conditions the more efficient cytochrome bc1 – aa3 supercomplex is used, and mutants lacking this complex have been shown to have severe growthdefects (Niebisch and Bott, 2001; Niebisch and Bott, 2003).
Biomass components
Amino acid biosynthesis
The wild-type strain of C. glutamicum ATCC 13032 is prototrophic with respect to all amino acids.In many cases the synthesis of the individual amino acids has been investigated quite thoroughly inC. glutamicum, and not surprisingly the lysine and glutamate synthesis pathways are among themost well characterised pathways in this organism.
Glutamate family (glutamate, glutamine, arginine and proline)
The major route of ammonia assimilation in C. glutamicum is the incorporation ofammonia/ammonium to glutamate or glutamine through either glutamate dehydrogenase ( gdh) orthrough the GS/GOGAT system, both of which have been presented in the “nitrogen metabolism”-
part of this chapter. From glutamate proline is synthesized from glutamate via three gene-productsλ -glytamylkinase ( proB), λ -glytamyl phosphate reductase ( proA) and Δ1-pyrroline-5-carboxylate
reductase ( proC ) (Ankri et al., 1996; Serebrijski et al., 1995)(Figure 3.4). In addition L-glutamate5-semialdehyde is converted to (S)-1-Pyrroline-5-carboxylate via a non-enzymatic reaction. proB and proC are essential for growth, whereas Δ proA mutants are able to grow slowly, suggesting analternative to the proA pathway (Ankri et al., 1996). Ankari et al. (1996) suggested that the asd -gene present in the lysine synthetic pathway was involved in this bypass. In addition to being a
biomass component, proline is also used as a compatible solute during osmotic stress, resulting inan accumulation of intracellular proline under such conditions (Guillouet and Engasser, 1995).
The arginine synthetic pathway has not been investigated as thoroughly as it is the case for mostother amino acid pathways in Corynebacterium, in spite of the fact that strains of Corynebacterium have been and still are used for production of L-arginine (Utagawa, 2004; Lu, 2006). Arginine is
synthesised from glutamate and Acetyl-CoA in a series of reactions where eight genes are involved:argR; argB; argC; argD; argJ ; argF ; argG; argH (Utagawa, 2004). The proposed arginine pathwayin C. glutamicum is summarised in figure 3.5. The gene-product from argB (N-acetylglucokinase) isinhibited by arginine making this enzyme the control point of this pathway (Utagawa, 2004).
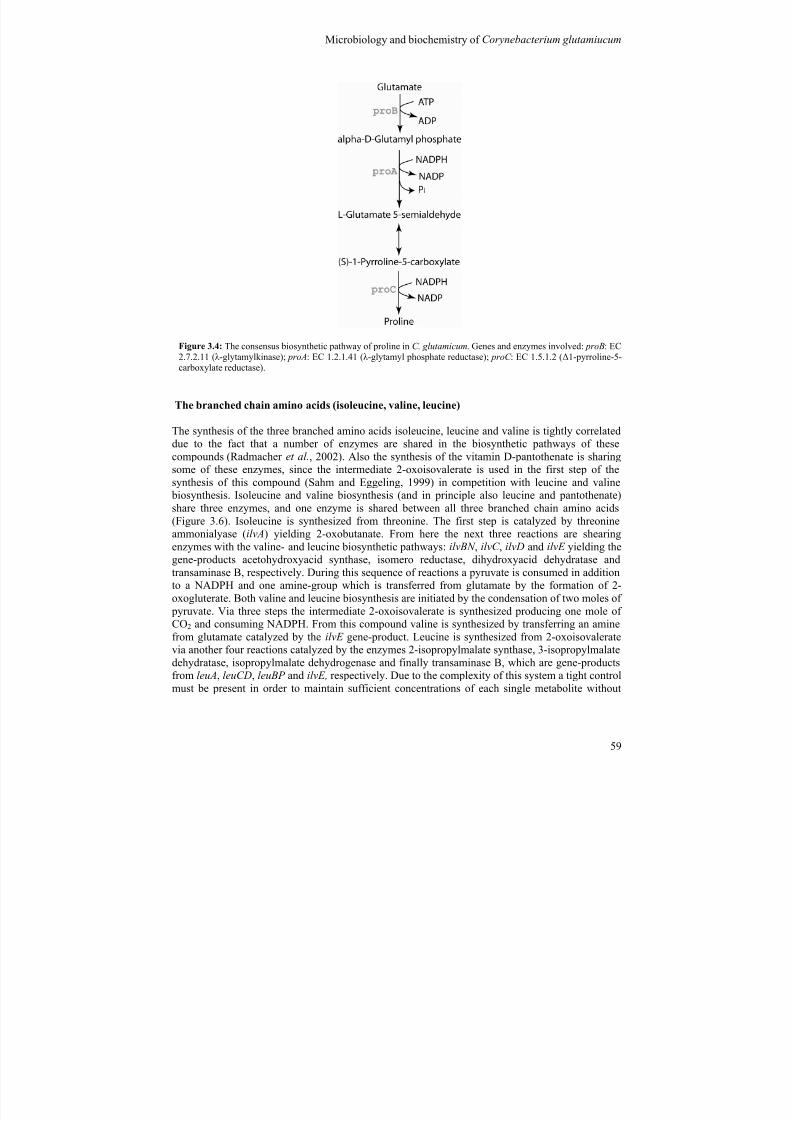
7/18/2019 Samlet PhD 20090416 U-Forside Appendix.pdf
http://slidepdf.com/reader/full/samlet-phd-20090416-u-forside-appendixpdf 57/187
Microbiology and biochemistry of Corynebacterium glutamiucum ________________________________________________________________________________
59
The branched chain amino acids (isoleucine, valine, leucine)
The synthesis of the three branched amino acids isoleucine, leucine and valine is tightly correlateddue to the fact that a number of enzymes are shared in the biosynthetic pathways of thesecompounds (Radmacher et al., 2002). Also the synthesis of the vitamin D-pantothenate is sharingsome of these enzymes, since the intermediate 2-oxoisovalerate is used in the first step of thesynthesis of this compound (Sahm and Eggeling, 1999) in competition with leucine and valine
biosynthesis. Isoleucine and valine biosynthesis (and in principle also leucine and pantothenate)share three enzymes, and one enzyme is shared between all three branched chain amino acids(Figure 3.6). Isoleucine is synthesized from threonine. The first step is catalyzed by threonineammonialyase (ilvA) yielding 2-oxobutanate. From here the next three reactions are shearingenzymes with the valine- and leucine biosynthetic pathways: ilvBN , ilvC , ilvD and ilvE yielding thegene-products acetohydroxyacid synthase, isomero reductase, dihydroxyacid dehydratase andtransaminase B, respectively. During this sequence of reactions a pyruvate is consumed in additionto a NADPH and one amine-group which is transferred from glutamate by the formation of 2-oxogluterate. Both valine and leucine biosynthesis are initiated by the condensation of two moles of
pyruvate. Via three steps the intermediate 2-oxoisovalerate is synthesized producing one mole ofCO2 and consuming NADPH. From this compound valine is synthesized by transferring an aminefrom glutamate catalyzed by the ilvE gene-product. Leucine is synthesized from 2-oxoisovaleratevia another four reactions catalyzed by the enzymes 2-isopropylmalate synthase, 3-isopropylmalatedehydratase, isopropylmalate dehydrogenase and finally transaminase B, which are gene-productsfrom leuA, leuCD, leuBP and ilvE, respectively. Due to the complexity of this system a tight control
must be present in order to maintain sufficient concentrations of each single metabolite without
Figure 3.4: The consensus biosynthetic pathway of proline in C. glutamicum. Genes and enzymes involved: proB: EC2.7.2.11 (λ -glytamylkinase); proA: EC 1.2.1.41 (λ -glytamyl phosphate reductase); proC : EC 1.5.1.2 (Δ1-pyrroline-5-carboxylate reductase).

7/18/2019 Samlet PhD 20090416 U-Forside Appendix.pdf
http://slidepdf.com/reader/full/samlet-phd-20090416-u-forside-appendixpdf 58/187
Chapter 3 ________________________________________________________________________________
60
overproducing others. Isoleucine synthesis is controlled at the first reaction step (ilvA) by feedbackinhibition by isoleucine, whereas valine has the opposite effect. Using this mechanism the organismis able to balance the isoleucine and valine biosynthesis by restricting the synthesis of 2-oxobutanoate when isoleucine is in excess and by promoting 2-oxobutanoate synthesis when valine
is in excess (Möckel et al., 1992). The activity of the gene-product of ilvBN is increased by 2-oxobutanoate, which is due to a higher transcription of this gene (Keilhauer et al., 1993). Valine onthe other hand decreases the activity of the ilvBN gene-product (Eggeling et al., 1987). As 2-oxoisovalerate is precursor for leucine, valine and panthenoate there is a tight regulation of enzymesat this point. Leucine is a strong feed-back inhibitor of the leuA (Patek et al., 1994) and leuB (Pateket al., 1998) gene-products, which catalyses the first and the third reaction in the leucine synthesis
pathway.
***
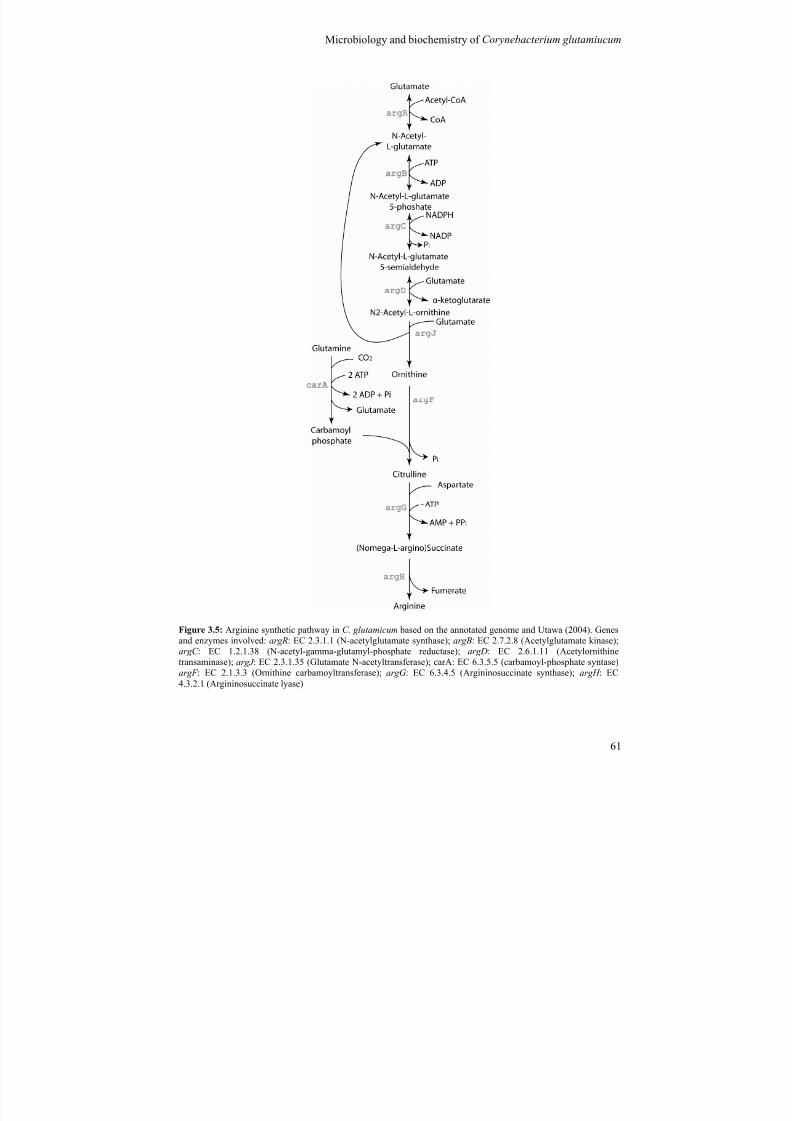
7/18/2019 Samlet PhD 20090416 U-Forside Appendix.pdf
http://slidepdf.com/reader/full/samlet-phd-20090416-u-forside-appendixpdf 59/187
Microbiology and biochemistry of Corynebacterium glutamiucum ________________________________________________________________________________
61
Figure 3.5: Arginine synthetic pathway in C. glutamicum based on the annotated genome and Utawa (2004). Genesand enzymes involved: argR: EC 2.3.1.1 (N-acetylglutamate synthase); argB: EC 2.7.2.8 (Acetylglutamate kinase);argC : EC 1.2.1.38 (N-acetyl-gamma-glutamyl-phosphate reductase); argD: EC 2.6.1.11 (Acetylornithinetransaminase); argJ : EC 2.3.1.35 (Glutamate N-acetyltransferase); carA: EC 6.3.5.5 (carbamoyl-phosphate syntase)argF : EC 2.1.3.3 (Ornithine carbamoyltransferase); argG: EC 6.3.4.5 (Argininosuccinate synthase); argH : EC4.3.2.1 (Argininosuccinate lyase)
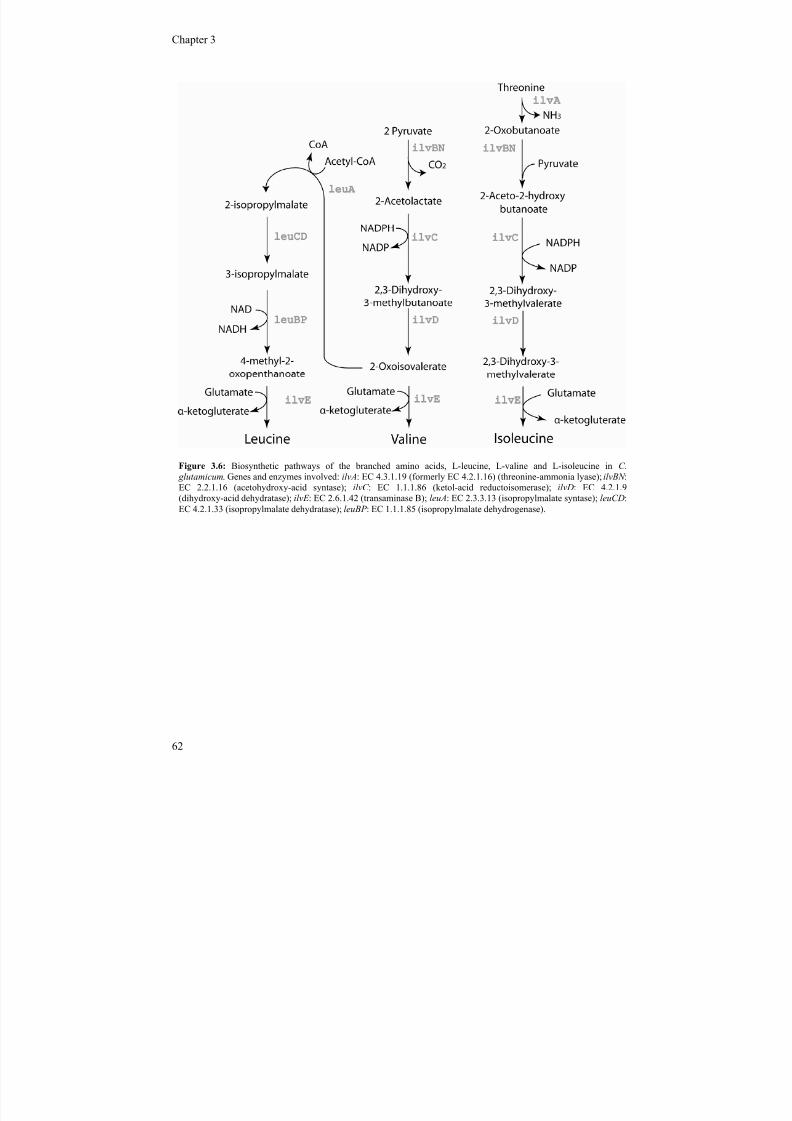
7/18/2019 Samlet PhD 20090416 U-Forside Appendix.pdf
http://slidepdf.com/reader/full/samlet-phd-20090416-u-forside-appendixpdf 60/187
Chapter 3 ________________________________________________________________________________
62
Figure 3.6: Biosynthetic pathways of the branched amino acids, L-leucine, L-valine and L-isoleucine in C. glutamicum. Genes and enzymes involved: ilvA: EC 4.3.1.19 (formerly EC 4.2.1.16) (threonine-ammonia lyase); ilvBN :EC 2.2.1.16 (acetohydroxy-acid syntase); ilvC : EC 1.1.1.86 (ketol-acid reductoisomerase); ilvD: EC 4.2.1.9(dihydroxy-acid dehydratase); ilvE : EC 2.6.1.42 (transaminase B); leuA: EC 2.3.3.13 (isopropylmalate syntase); leuCD:EC 4.2.1.33 (isopropylmalate dehydratase); leuBP : EC 1.1.1.85 (isopropylmalate dehydrogenase).
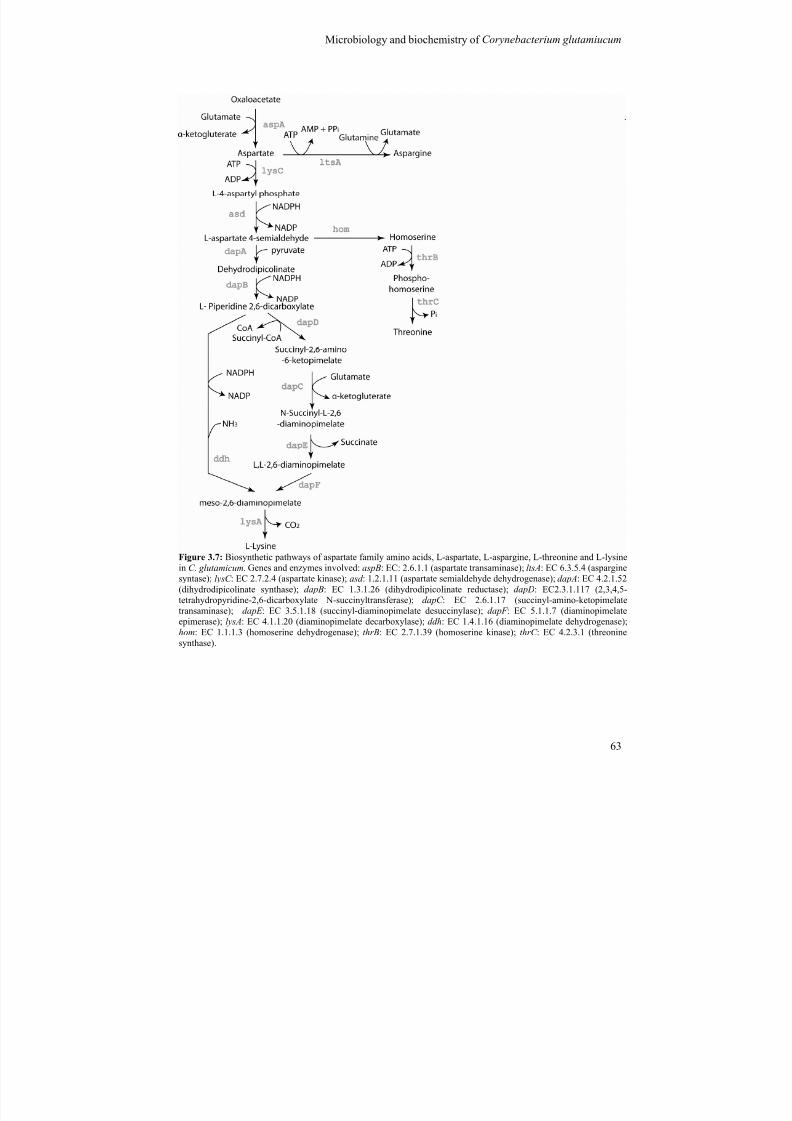
7/18/2019 Samlet PhD 20090416 U-Forside Appendix.pdf
http://slidepdf.com/reader/full/samlet-phd-20090416-u-forside-appendixpdf 61/187
Microbiology and biochemistry of Corynebacterium glutamiucum ________________________________________________________________________________
63
Figure 3.7: Biosynthetic pathways of aspartate family amino acids, L-aspartate, L-aspargine, L-threonine and L-lysinein C. glutamicum. Genes and enzymes involved: aspB: EC: 2.6.1.1 (aspartate transaminase); ltsA: EC 6.3.5.4 (asparginesyntase); lysC : EC 2.7.2.4 (aspartate kinase); asd : 1.2.1.11 (aspartate semialdehyde dehydrogenase); dapA: EC 4.2.1.52(dihydrodipicolinate synthase); dapB: EC 1.3.1.26 (dihydrodipicolinate reductase); dapD: EC2.3.1.117 (2,3,4,5-tetrahydropyridine-2,6-dicarboxylate N-succinyltransferase); dapC : EC 2.6.1.17 (succinyl-amino-ketopimelatetransaminase); dapE : EC 3.5.1.18 (succinyl-diaminopimelate desuccinylase); dapF : EC 5.1.1.7 (diaminopimelateepimerase); lysA: EC 4.1.1.20 (diaminopimelate decarboxylase); ddh: EC 1.4.1.16 (diaminopimelate dehydrogenase);hom: EC 1.1.1.3 (homoserine dehydrogenase); thrB: EC 2.7.1.39 (homoserine kinase); thrC : EC 4.2.3.1 (threoninesynthase).
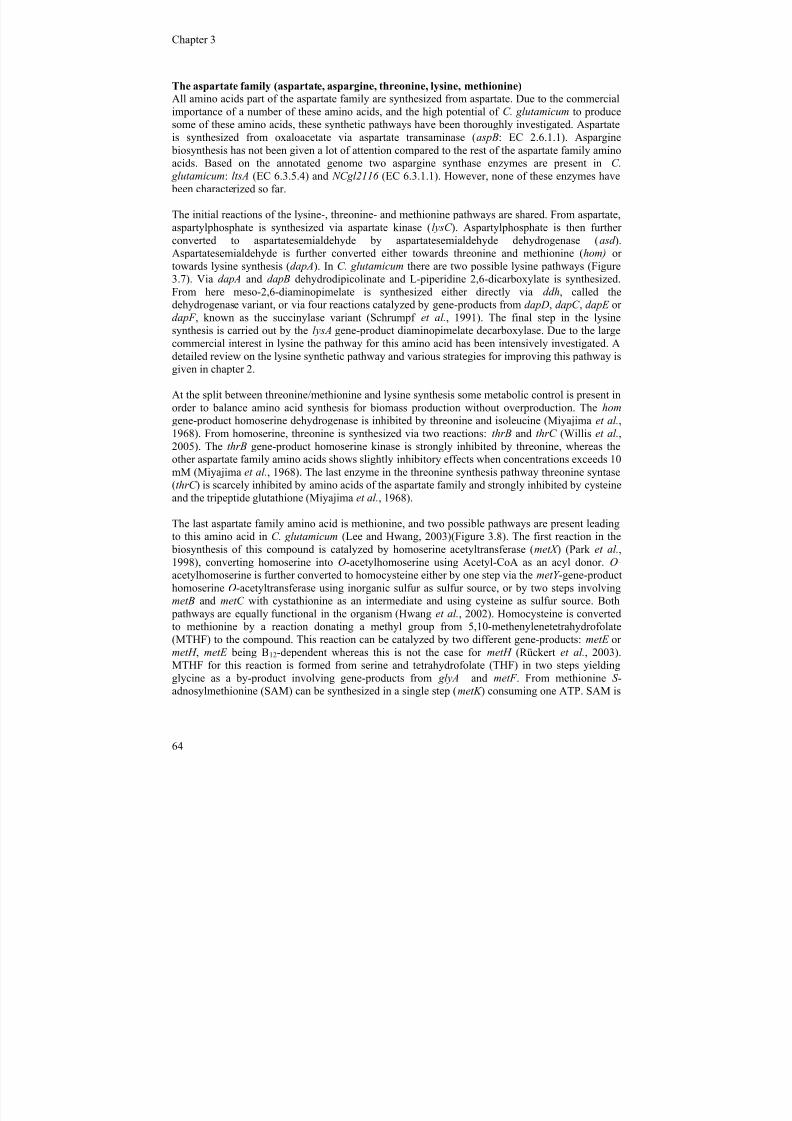
7/18/2019 Samlet PhD 20090416 U-Forside Appendix.pdf
http://slidepdf.com/reader/full/samlet-phd-20090416-u-forside-appendixpdf 62/187
Chapter 3 ________________________________________________________________________________
64
The aspartate family (aspartate, aspargine, threonine, lysine, methionine)
All amino acids part of the aspartate family are synthesized from aspartate. Due to the commercialimportance of a number of these amino acids, and the high potential of C. glutamicum to producesome of these amino acids, these synthetic pathways have been thoroughly investigated. Aspartate
is synthesized from oxaloacetate via aspartate transaminase (aspB: EC 2.6.1.1). Aspargine biosynthesis has not been given a lot of attention compared to the rest of the aspartate family aminoacids. Based on the annotated genome two aspargine synthase enzymes are present in C.
glutamicum: ltsA (EC 6.3.5.4) and NCgl2116 (EC 6.3.1.1). However, none of these enzymes have been characterized so far.
The initial reactions of the lysine-, threonine- and methionine pathways are shared. From aspartate,aspartylphosphate is synthesized via aspartate kinase (lysC ). Aspartylphosphate is then furtherconverted to aspartatesemialdehyde by aspartatesemialdehyde dehydrogenase (asd ).Aspartatesemialdehyde is further converted either towards threonine and methionine (hom) ortowards lysine synthesis (dapA). In C. glutamicum there are two possible lysine pathways (Figure
3.7). Via dapA and dapB dehydrodipicolinate and L-piperidine 2,6-dicarboxylate is synthesized.From here meso-2,6-diaminopimelate is synthesized either directly via ddh, called thedehydrogenase variant, or via four reactions catalyzed by gene-products from dapD, dapC , dapE ordapF , known as the succinylase variant (Schrumpf et al., 1991). The final step in the lysinesynthesis is carried out by the lysA gene-product diaminopimelate decarboxylase. Due to the largecommercial interest in lysine the pathway for this amino acid has been intensively investigated. Adetailed review on the lysine synthetic pathway and various strategies for improving this pathway isgiven in chapter 2.
At the split between threonine/methionine and lysine synthesis some metabolic control is present inorder to balance amino acid synthesis for biomass production without overproduction. The hom gene-product homoserine dehydrogenase is inhibited by threonine and isoleucine (Miyajima et al.,1968). From homoserine, threonine is synthesized via two reactions: thrB and thrC (Willis et al.,2005). The thrB gene-product homoserine kinase is strongly inhibited by threonine, whereas theother aspartate family amino acids shows slightly inhibitory effects when concentrations exceeds 10mM (Miyajima et al., 1968). The last enzyme in the threonine synthesis pathway threonine syntase(thrC ) is scarcely inhibited by amino acids of the aspartate family and strongly inhibited by cysteineand the tripeptide glutathione (Miyajima et al., 1968).
The last aspartate family amino acid is methionine, and two possible pathways are present leadingto this amino acid in C. glutamicum (Lee and Hwang, 2003)(Figure 3.8). The first reaction in the
biosynthesis of this compound is catalyzed by homoserine acetyltransferase (metX ) (Park et al.,1998), converting homoserine into O-acetylhomoserine using Acetyl-CoA as an acyl donor. O-acetylhomoserine is further converted to homocysteine either by one step via the metY -gene-producthomoserine O-acetyltransferase using inorganic sulfur as sulfur source, or by two steps involvingmetB and metC with cystathionine as an intermediate and using cysteine as sulfur source. Both
pathways are equally functional in the organism (Hwang et al., 2002). Homocysteine is convertedto methionine by a reaction donating a methyl group from 5,10-methenylenetetrahydrofolate(MTHF) to the compound. This reaction can be catalyzed by two different gene-products: metE ormetH , metE being B12-dependent whereas this is not the case for metH (Rückert et al., 2003).MTHF for this reaction is formed from serine and tetrahydrofolate (THF) in two steps yieldingglycine as a by-product involving gene-products from glyA and metF . From methionine S -
adnosylmethionine (SAM) can be synthesized in a single step (metK ) consuming one ATP. SAM is
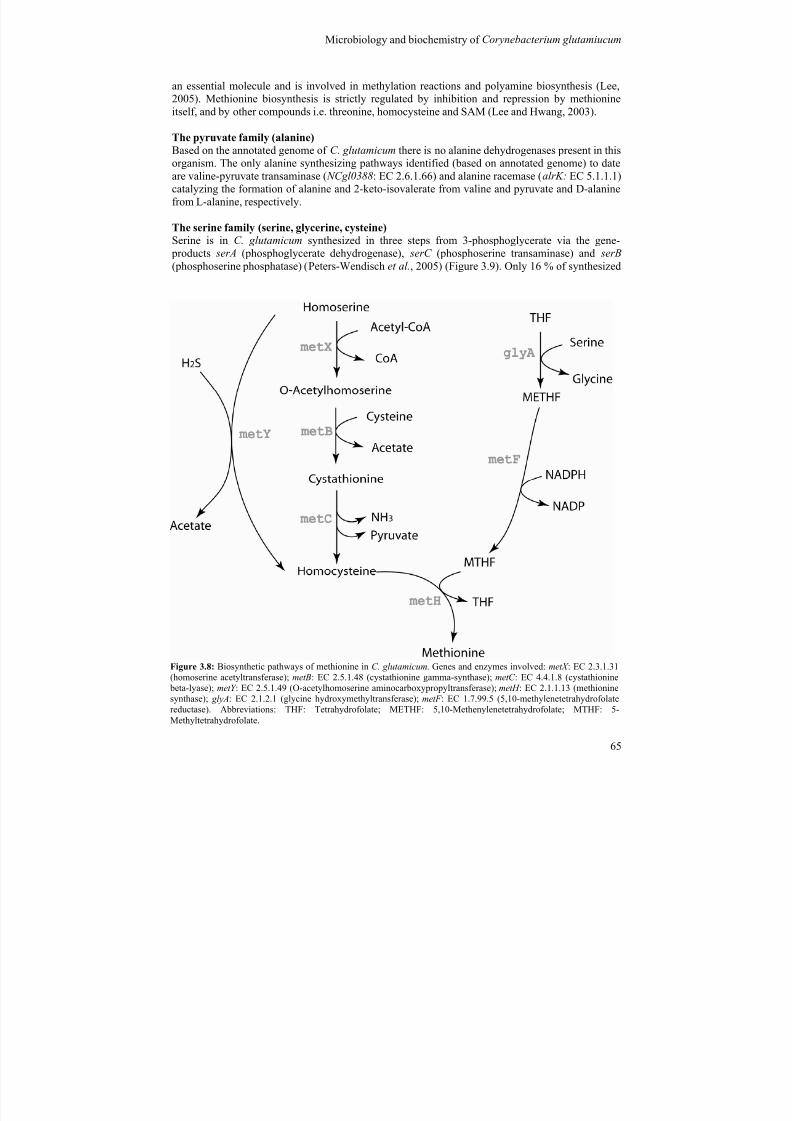
7/18/2019 Samlet PhD 20090416 U-Forside Appendix.pdf
http://slidepdf.com/reader/full/samlet-phd-20090416-u-forside-appendixpdf 63/187
Microbiology and biochemistry of Corynebacterium glutamiucum ________________________________________________________________________________
65
an essential molecule and is involved in methylation reactions and polyamine biosynthesis (Lee,2005). Methionine biosynthesis is strictly regulated by inhibition and repression by methionineitself, and by other compounds i.e. threonine, homocysteine and SAM (Lee and Hwang, 2003).
The pyruvate family (alanine)Based on the annotated genome of C. glutamicum there is no alanine dehydrogenases present in thisorganism. The only alanine synthesizing pathways identified (based on annotated genome) to dateare valine-pyruvate transaminase ( NCgl0388: EC 2.6.1.66) and alanine racemase (alrK: EC 5.1.1.1)catalyzing the formation of alanine and 2-keto-isovalerate from valine and pyruvate and D-alaninefrom L-alanine, respectively.
The serine family (serine, glycerine, cysteine)
Serine is in C. glutamicum synthesized in three steps from 3-phosphoglycerate via the gene- products serA (phosphoglycerate dehydrogenase), serC (phosphoserine transaminase) and serB (phosphoserine phosphatase) (Peters-Wendisch et al., 2005) (Figure 3.9). Only 16 % of synthesized
Figure 3.8: Biosynthetic pathways of methionine in C. glutamicum. Genes and enzymes involved: metX : EC 2.3.1.31(homoserine acetyltransferase); metB: EC 2.5.1.48 (cystathionine gamma-synthase); metC : EC 4.4.1.8 (cystathionine beta-lyase); metY : EC 2.5.1.49 (O-acetylhomoserine aminocarboxypropyltransferase); metH : EC 2.1.1.13 (methioninesynthase); glyA: EC 2.1.2.1 (glycine hydroxymethyltransferase); metF : EC 1.7.99.5 (5,10-methylenetetrahydrofolatereductase). Abbreviations: THF: Tetrahydrofolate; METHF: 5,10-Methenylenetetrahydrofolate; MTHF: 5-Methyltetrahydrofolate.
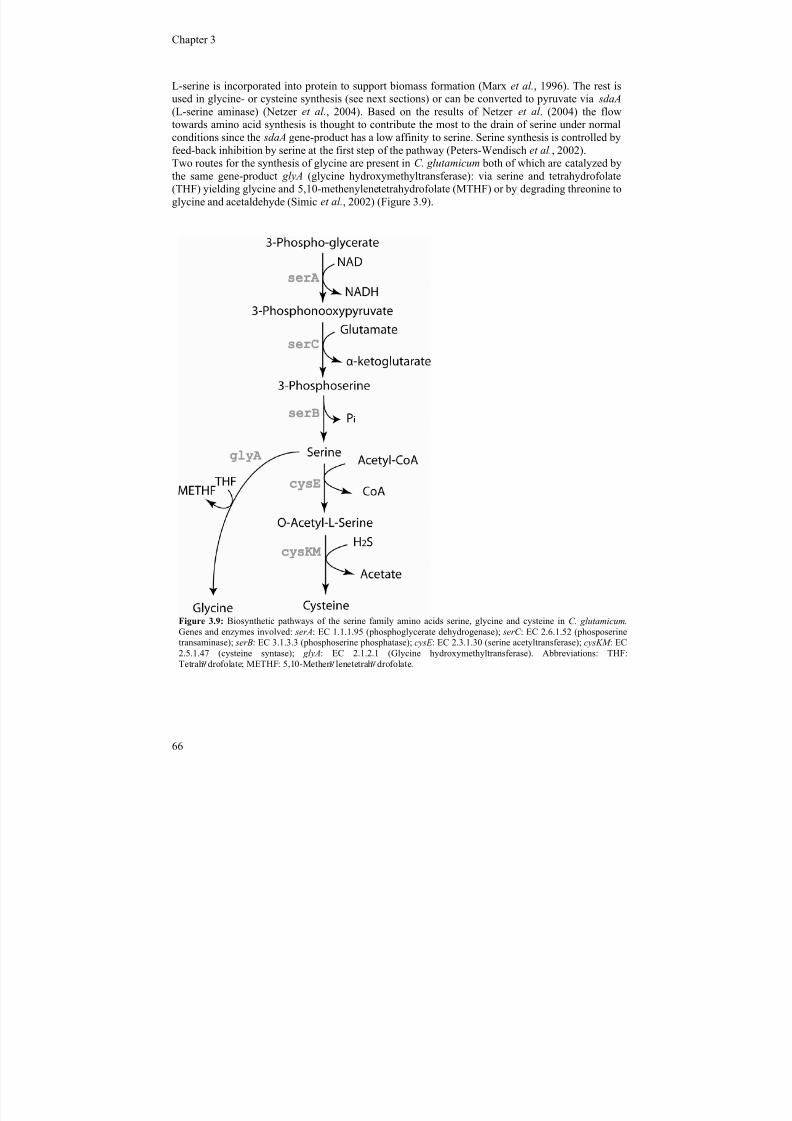
7/18/2019 Samlet PhD 20090416 U-Forside Appendix.pdf
http://slidepdf.com/reader/full/samlet-phd-20090416-u-forside-appendixpdf 64/187
Chapter 3 ________________________________________________________________________________
66
L-serine is incorporated into protein to support biomass formation (Marx et al., 1996). The rest isused in glycine- or cysteine synthesis (see next sections) or can be converted to pyruvate via sdaA (L-serine aminase) (Netzer et al., 2004). Based on the results of Netzer et al . (2004) the flowtowards amino acid synthesis is thought to contribute the most to the drain of serine under normal
conditions since the sdaA gene-product has a low affinity to serine. Serine synthesis is controlled byfeed-back inhibition by serine at the first step of the pathway (Peters-Wendisch et al., 2002).Two routes for the synthesis of glycine are present in C. glutamicum both of which are catalyzed bythe same gene-product glyA (glycine hydroxymethyltransferase): via serine and tetrahydrofolate(THF) yielding glycine and 5,10-methenylenetetrahydrofolate (MTHF) or by degrading threonine toglycine and acetaldehyde (Simic et al., 2002) (Figure 3.9).
Figure 3.9: Biosynthetic pathways of the serine family amino acids serine, glycine and cysteine in C. glutamicum.Genes and enzymes involved: serA: EC 1.1.1.95 (phosphoglycerate dehydrogenase); serC : EC 2.6.1.52 (phosposerinetransaminase); serB: EC 3.1.3.3 (phosphoserine phosphatase); cysE : EC 2.3.1.30 (serine acetyltransferase); cysKM : EC2.5.1.47 (cysteine syntase); glyA: EC 2.1.2.1 (Glycine hydroxymethyltransferase). Abbreviations: THF:Tetrah drofolate; METHF: 5,10-Methen lenetetrah drofolate.
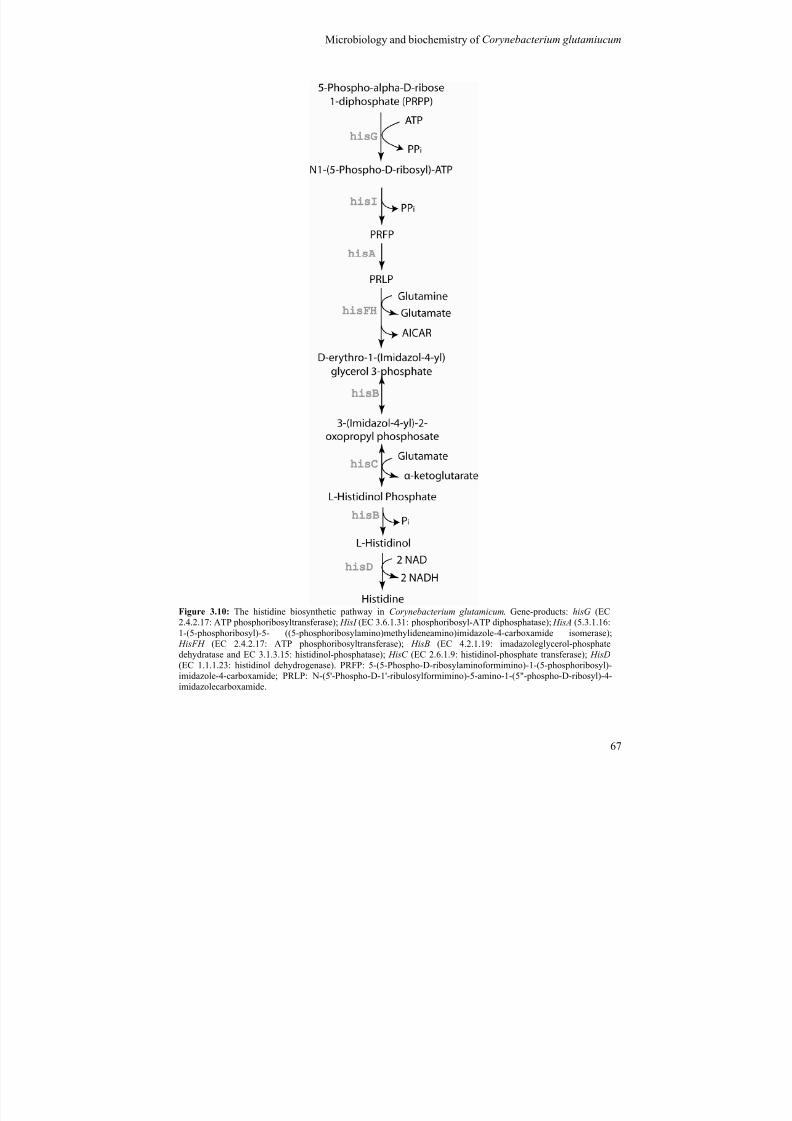
7/18/2019 Samlet PhD 20090416 U-Forside Appendix.pdf
http://slidepdf.com/reader/full/samlet-phd-20090416-u-forside-appendixpdf 65/187
Microbiology and biochemistry of Corynebacterium glutamiucum ________________________________________________________________________________
67
Figure 3.10: The histidine biosynthetic pathway in Corynebacterium glutamicum. Gene-products: hisG (EC2.4.2.17: ATP phosphoribosyltransferase); HisI (EC 3.6.1.31: phosphoribosyl-ATP diphosphatase); HisA (5.3.1.16:1-(5-phosphoribosyl)-5- ((5-phosphoribosylamino)methylideneamino)imidazole-4-carboxamide isomerase); HisFH (EC 2.4.2.17: ATP phosphoribosyltransferase); HisB (EC 4.2.1.19: imadazoleglycerol-phosphatedehydratase and EC 3.1.3.15: histidinol-phosphatase); HisC (EC 2.6.1.9: histidinol-phosphate transferase); HisD (EC 1.1.1.23: histidinol dehydrogenase). PRFP: 5-(5-Phospho-D-ribosylaminoformimino)-1-(5-phosphoribosyl)-imidazole-4-carboxamide; PRLP: N-(5'-Phospho-D-1'-ribulosylformimino)-5-amino-1-(5"-phospho-D-ribosyl)-4-imidazolecarboxamide.
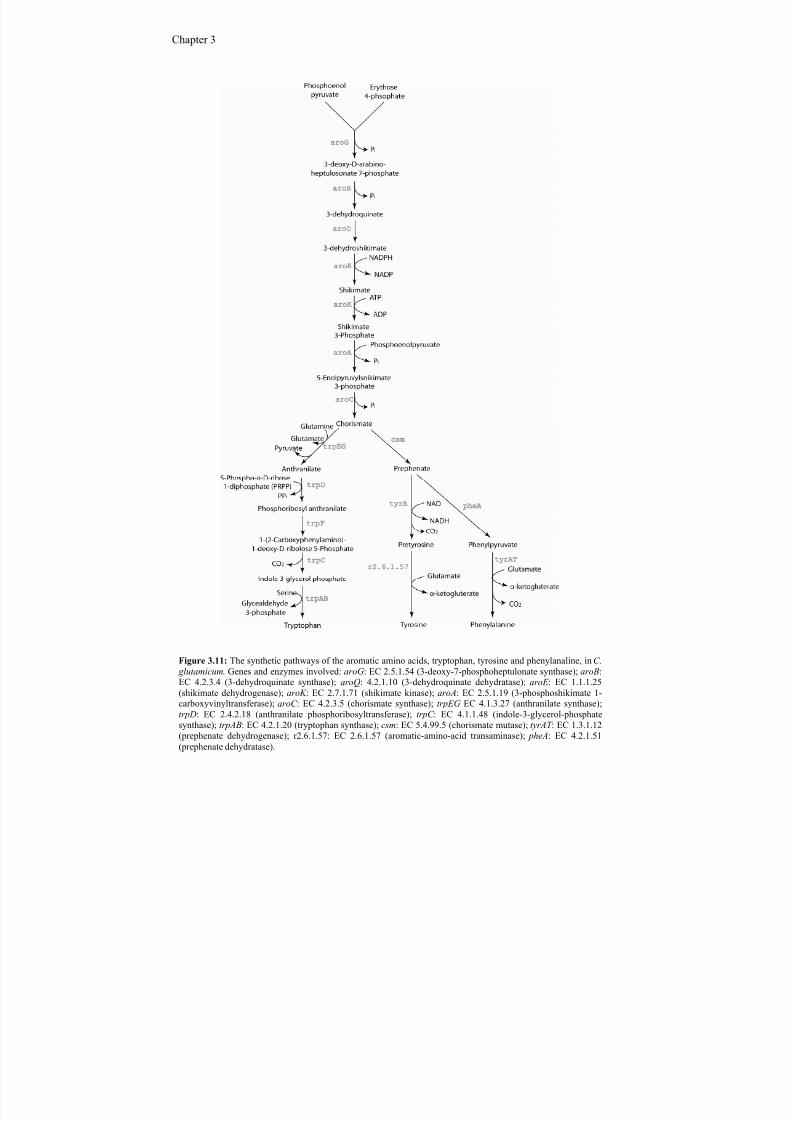
7/18/2019 Samlet PhD 20090416 U-Forside Appendix.pdf
http://slidepdf.com/reader/full/samlet-phd-20090416-u-forside-appendixpdf 66/187
Chapter 3 ________________________________________________________________________________
68
Figure 3.11: The synthetic pathways of the aromatic amino acids, tryptophan, tyrosine and phenylanaline, in C. glutamicum. Genes and enzymes involved: aroG: EC 2.5.1.54 (3-deoxy-7-phosphoheptulonate synthase); aroB:EC 4.2.3.4 (3-dehydroquinate synthase); aroQ: 4.2.1.10 (3-dehydroquinate dehydratase); aroE : EC 1.1.1.25
(shikimate dehydrogenase); aroK : EC 2.7.1.71 (shikimate kinase); aroA: EC 2.5.1.19 (3-phosphoshikimate 1-carboxyvinyltransferase); aroC : EC 4.2.3.5 (chorismate synthase); trpEG EC 4.1.3.27 (anthranilate synthase);trpD: EC 2.4.2.18 (anthranilate phosphoribosyltransferase); trpC : EC 4.1.1.48 (indole-3-glycerol-phosphatesynthase); trpAB: EC 4.2.1.20 (tryptophan synthase); csm: EC 5.4.99.5 (chorismate mutase); tyrAT : EC 1.3.1.12(prephenate dehydrogenase); r2.6.1.57: EC 2.6.1.57 (aromatic-amino-acid transaminase); pheA: EC 4.2.1.51(prephenate dehydratase).
7/18/2019 Samlet PhD 20090416 U-Forside Appendix.pdf
http://slidepdf.com/reader/full/samlet-phd-20090416-u-forside-appendixpdf 67/187
Microbiology and biochemistry of Corynebacterium glutamiucum ________________________________________________________________________________
69
Cysteine is synthesized in two steps (Figure 3.9). In the first step O-acetylserine is synthesized fromserine using acetyl-CoA as an acetyl donor by the cysE gene-product serine acetyltransferase (Wadaet al., 2002). O-acetyltransferase is converted to cysteine by the incorporation of sulphide (H2S) viaCysK (Wada et al., 2004). It is also speculated that thiosulphate can be used as sulfur source using
the cysM gene-product (O-acetylserine sulfhydrylase B) and an additional protein not yet identifiedto form cysteine (Lee, 2005). Cysteine can be degraded to pyruvate, NH3 and H2S by cysteinedesulfhydrase (aecD) (Wada et al., 2002).
Histidine
Histidine biosynthesis in C. glutamicum has not yet been fully elucidated. However, based onannotated genomic data and some experimental data it seems clear that the histidine pathway in thisorganism does not differentiate from most other prokaryotic organisms. In this respect the histidine
pathway in C. glutamicum consists of 10 enzymatic reactions catalyzed by 8 different gene-productsrequiring phosphor-ribosyl-pyrophosphate (PRPP) and ATP (Jung et al., 1998; Alifano et al., 1996;Mormann et al., 2006). The eight genes and gene-products involved in histidine synthesis are hisA,
hisB, hisC , hisD, hisF , hisG, hisH and hisI , where the hisI , hisB and hisD gene-products areisoenzymes each catalysing two reactions within the pathway (Alifano et al., 1996). The hisF andhisH gene-products form an enzyme-complex (Jung et al., 1998). From figure 3.10 an overview ofthe reaction pathway and gene-products of histidine synthesis can be seen.
The aromatic family (Tryptophan, tyrosine and phenylalanine)
The biosynthesis of all the aromatic amino acids begins with the formation of the precursorchorismate. Chorismate is synthesized in seven enzymatic steps beginning with the condensation of
phosphoenolpyruvate and erythose 4-phosphate. This reaction step is catalyzed by feedbacksensitive 3-deoxy-D-arabino-heptulosonate 7-phosphate synthase (aroG) yielding 3-deoxy-D-arabino-heptulosonate 7-phosphate. This enzyme is slightly inhibited by tyrosine and phenylalaninewhen these amino acids are singly present, while the enzyme is strongly synergistically inhibitedwhen both amino acids are present (Shiio et al., 1974). From 3-deoxy-D-arabino-heptulosonate 7-
phosphate chorismate is synthesised from six enzymatic reactions none of which have been reportedto be subject to any kind of regulation. The reactions are catalyzed by AroB, AroQ, AroE, AroK,
AroA and AroC (Figure 3.11). Chorismate can be converted to either anthranilate (precursor fortryptophan) or prephenate (precursor for tyrosine and phenylalanine) by the enzymes anthranilatesynthase (trpEG) and chorismate mutase (csm), respectively. Both pathways are subject to control
by inhibiting the end-products. In the tryptophan synthetic pathway anthranilate is furthersynthesized to phosphoribosyl anthranilate via TrpD, which is feedback inhibited by tryptophan(O'Gara and Dunican, 1995). The next two steps are known to form a multifunctional protein
consisting of TrpF and TrpC forming indole 3-glycerolphosphate via 1-(2-carboxyphenylamino)-1-deoxy-D-ribulose 5-phosphate. In the last step tryptophan is formed by the TrpAB enzyme complex.In addition to the enzymatic inhibition mentioned above negative transcriptional control of allenzymes in the tryptophan branch has been reported at high tryptophan concentrations (Sugimotoand Shiio, 1977). Tyrosine is synthesized from prephenate via pretyrosine by two enzymaticreactions: TyrA and pretyrosine dehydrogenase (Fazel and Jensen, 1979b). Phenylalanine issynthesized from prephenate via phenylpyruvate. Prephenate dehydratase ( pheA) catalyze the firststep of this pathway (Follettie and Sinskey, 1986), whereas the last step is catalyzed by tyrosineaminotransferase (tyrAT ) (Fazel and Jensen, 1979a).
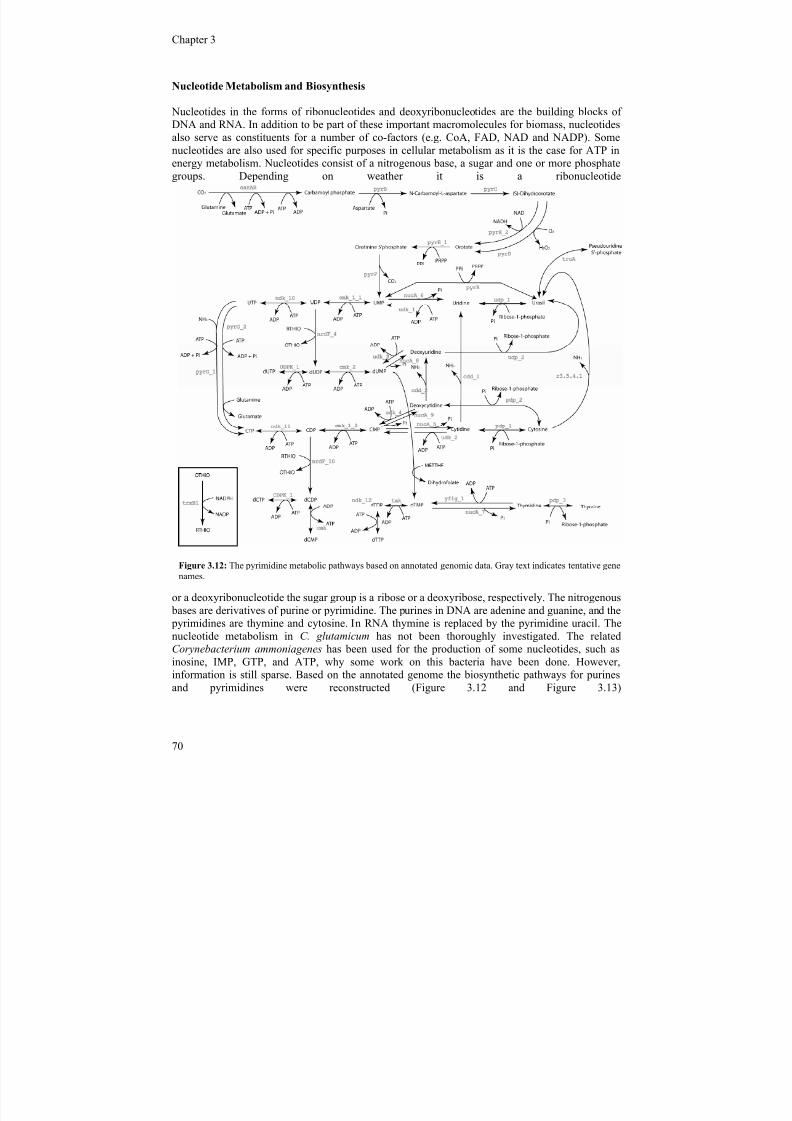
7/18/2019 Samlet PhD 20090416 U-Forside Appendix.pdf
http://slidepdf.com/reader/full/samlet-phd-20090416-u-forside-appendixpdf 68/187
Chapter 3 ________________________________________________________________________________
70
Nucleotide Metabolism and Biosynthesis
Nucleotides in the forms of ribonucleotides and deoxyribonucleotides are the building blocks ofDNA and RNA. In addition to be part of these important macromolecules for biomass, nucleotides
also serve as constituents for a number of co-factors (e.g. CoA, FAD, NAD and NADP). Somenucleotides are also used for specific purposes in cellular metabolism as it is the case for ATP inenergy metabolism. Nucleotides consist of a nitrogenous base, a sugar and one or more phosphategroups. Depending on weather it is a ribonucleotide
or a deoxyribonucleotide the sugar group is a ribose or a deoxyribose, respectively. The nitrogenous bases are derivatives of purine or pyrimidine. The purines in DNA are adenine and guanine, and the pyrimidines are thymine and cytosine. In RNA thymine is replaced by the pyrimidine uracil. Thenucleotide metabolism in C. glutamicum has not been thoroughly investigated. The relatedCorynebacterium ammoniagenes has been used for the production of some nucleotides, such asinosine, IMP, GTP, and ATP, why some work on this bacteria have been done. However,information is still sparse. Based on the annotated genome the biosynthetic pathways for purines
and pyrimidines were reconstructed (Figure 3.12 and Figure 3.13)
Figure 3.12: The pyrimidine metabolic pathways based on annotated genomic data. Gray text indicates tentative genenames.
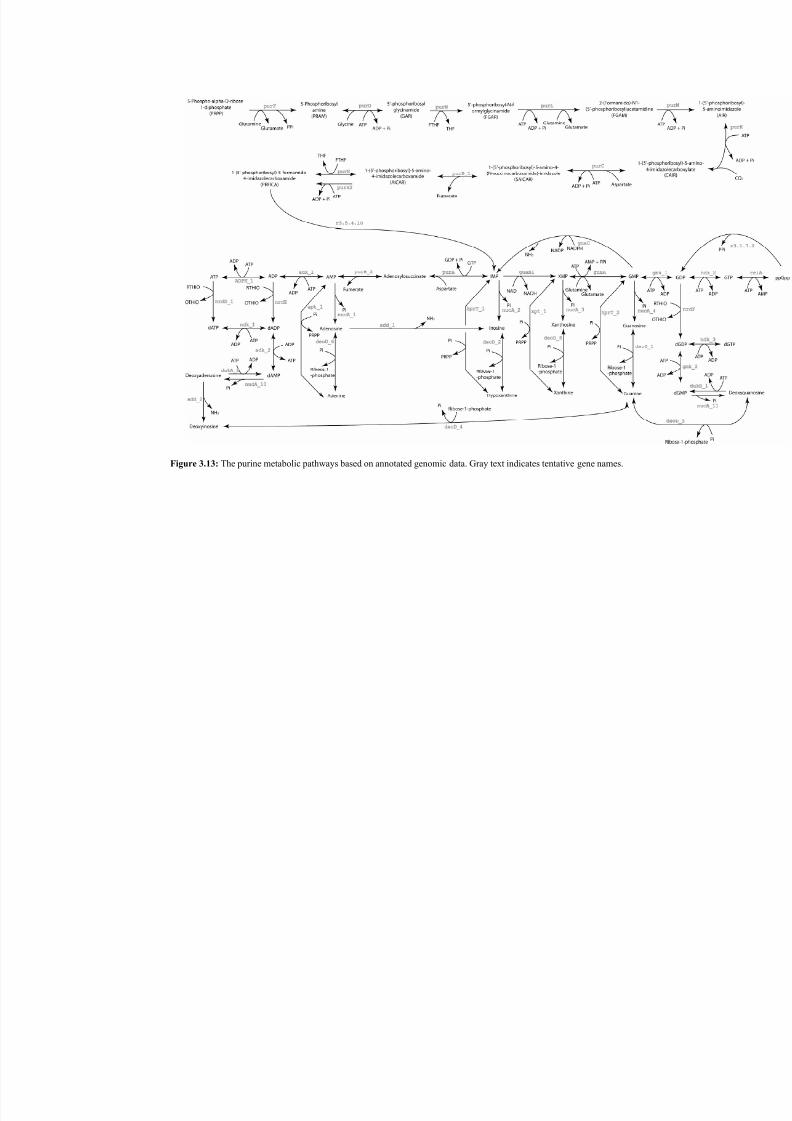
7/18/2019 Samlet PhD 20090416 U-Forside Appendix.pdf
http://slidepdf.com/reader/full/samlet-phd-20090416-u-forside-appendixpdf 69/187
Figure 3.13: The purine metabolic pathways based on annotated genomic data. Gray text indicates tentative gene names.
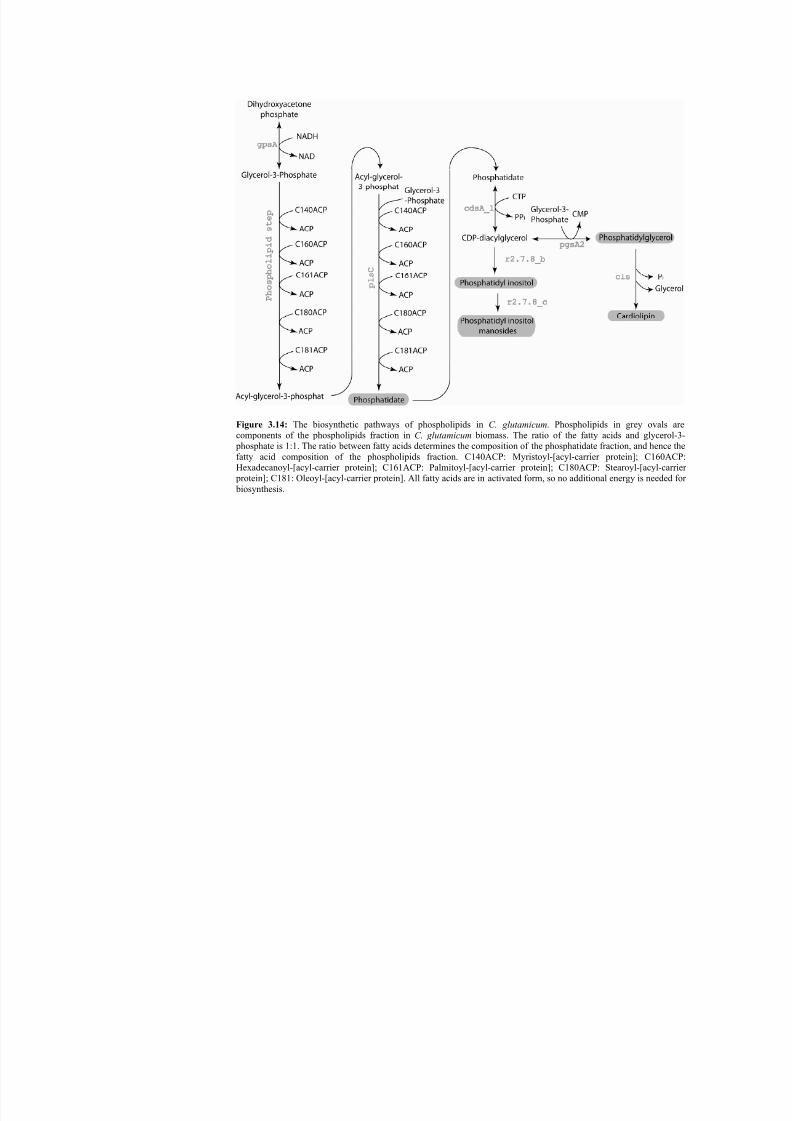
7/18/2019 Samlet PhD 20090416 U-Forside Appendix.pdf
http://slidepdf.com/reader/full/samlet-phd-20090416-u-forside-appendixpdf 70/187
Figure 3.14: The biosynthetic pathways of phospholipids in C. glutamicum. Phospholipids in grey ovals acomponents of the phospholipids fraction in C. glutamicum biomass. The ratio of the fatty acids and glycerol phosphate is 1:1. The ratio between fatty acids determines the composition of the phosphatidate fraction, and hence tfatty acid composition of the phospholipids fraction. C140ACP: Myristoyl-[acyl-carrier protein]; C160ACHexadecanoyl-[acyl-carrier protein]; C161ACP: Palmitoyl-[acyl-carrier protein]; C180ACP: Stearoyl-[acyl-carr protein]; C181: Oleoyl-[acyl-carrier protein]. All fatty acids are in activated form, so no additional energy is needed f biosynthesis.
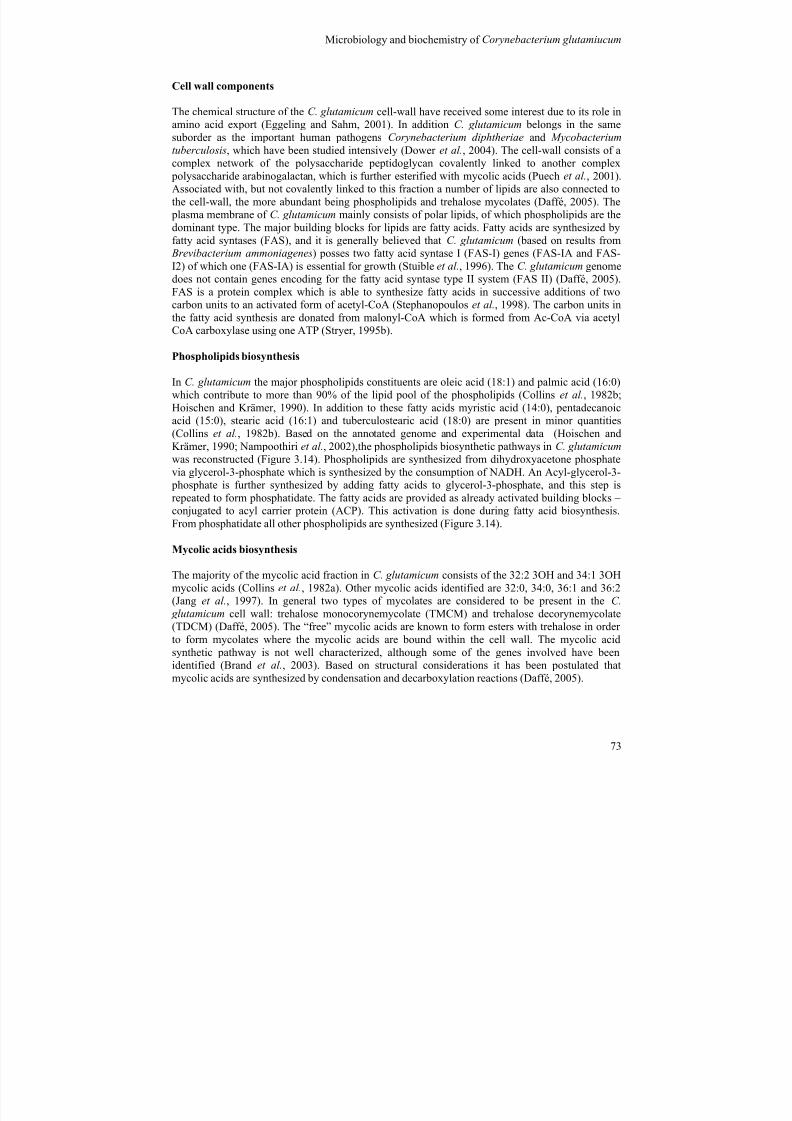
7/18/2019 Samlet PhD 20090416 U-Forside Appendix.pdf
http://slidepdf.com/reader/full/samlet-phd-20090416-u-forside-appendixpdf 71/187
Microbiology and biochemistry of Corynebacterium glutamiucum ________________________________________________________________________________
73
Cell wall components
The chemical structure of the C. glutamicum cell-wall have received some interest due to its role inamino acid export (Eggeling and Sahm, 2001). In addition C. glutamicum belongs in the same
suborder as the important human pathogens Corynebacterium diphtheriae and Mycobacteriumtuberculosis, which have been studied intensively (Dower et al., 2004). The cell-wall consists of acomplex network of the polysaccharide peptidoglycan covalently linked to another complex
polysaccharide arabinogalactan, which is further esterified with mycolic acids (Puech et al., 2001).Associated with, but not covalently linked to this fraction a number of lipids are also connected tothe cell-wall, the more abundant being phospholipids and trehalose mycolates (Daffé, 2005). The
plasma membrane of C. glutamicum mainly consists of polar lipids, of which phospholipids are thedominant type. The major building blocks for lipids are fatty acids. Fatty acids are synthesized byfatty acid syntases (FAS), and it is generally believed that C. glutamicum (based on results from
Brevibacterium ammoniagenes) posses two fatty acid syntase I (FAS-I) genes (FAS-IA and FAS-I2) of which one (FAS-IA) is essential for growth (Stuible et al., 1996). The C. glutamicum genome
does not contain genes encoding for the fatty acid syntase type II system (FAS II) (Daffé, 2005).FAS is a protein complex which is able to synthesize fatty acids in successive additions of twocarbon units to an activated form of acetyl-CoA (Stephanopoulos et al., 1998). The carbon units inthe fatty acid synthesis are donated from malonyl-CoA which is formed from Ac-CoA via acetylCoA carboxylase using one ATP (Stryer, 1995b).
Phospholipids biosynthesis
In C. glutamicum the major phospholipids constituents are oleic acid (18:1) and palmic acid (16:0)which contribute to more than 90% of the lipid pool of the phospholipids (Collins et al., 1982b;Hoischen and Krämer, 1990). In addition to these fatty acids myristic acid (14:0), pentadecanoicacid (15:0), stearic acid (16:1) and tuberculostearic acid (18:0) are present in minor quantities(Collins et al., 1982b). Based on the annotated genome and experimental data (Hoischen andKrämer, 1990; Nampoothiri et al., 2002),the phospholipids biosynthetic pathways in C. glutamicum was reconstructed (Figure 3.14). Phospholipids are synthesized from dihydroxyacetone phosphatevia glycerol-3-phosphate which is synthesized by the consumption of NADH. An Acyl-glycerol-3-
phosphate is further synthesized by adding fatty acids to glycerol-3-phosphate, and this step isrepeated to form phosphatidate. The fatty acids are provided as already activated building blocks –conjugated to acyl carrier protein (ACP). This activation is done during fatty acid biosynthesis.From phosphatidate all other phospholipids are synthesized (Figure 3.14).
Mycolic acids biosynthesis
The majority of the mycolic acid fraction in C. glutamicum consists of the 32:2 3OH and 34:1 3OHmycolic acids (Collins et al., 1982a). Other mycolic acids identified are 32:0, 34:0, 36:1 and 36:2(Jang et al., 1997). In general two types of mycolates are considered to be present in the C.
glutamicum cell wall: trehalose monocorynemycolate (TMCM) and trehalose decorynemycolate(TDCM) (Daffé, 2005). The “free” mycolic acids are known to form esters with trehalose in orderto form mycolates where the mycolic acids are bound within the cell wall. The mycolic acidsynthetic pathway is not well characterized, although some of the genes involved have beenidentified (Brand et al., 2003). Based on structural considerations it has been postulated thatmycolic acids are synthesized by condensation and decarboxylation reactions (Daffé, 2005).
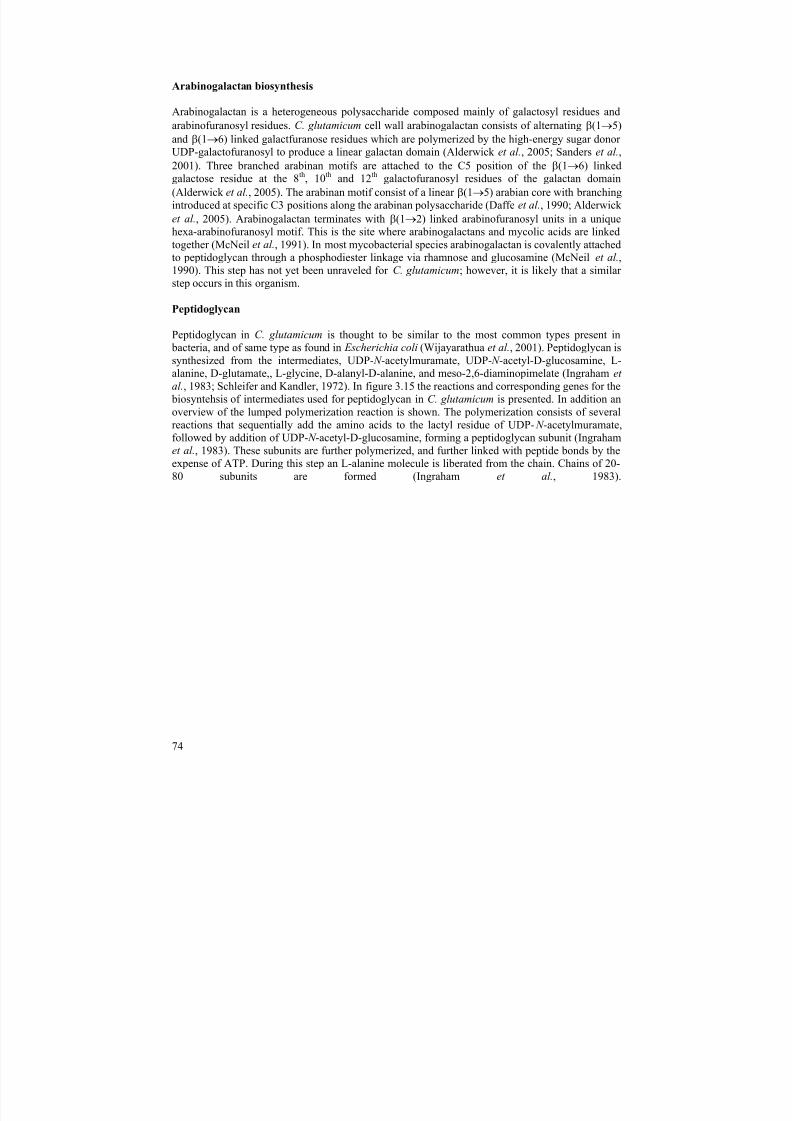
7/18/2019 Samlet PhD 20090416 U-Forside Appendix.pdf
http://slidepdf.com/reader/full/samlet-phd-20090416-u-forside-appendixpdf 72/187
74
Arabinogalactan biosynthesis
Arabinogalactan is a heterogeneous polysaccharide composed mainly of galactosyl residues andarabinofuranosyl residues. C. glutamicum cell wall arabinogalactan consists of alternating β(1→5)
and β(1→6) linked galactfuranose residues which are polymerized by the high-energy sugar donorUDP-galactofuranosyl to produce a linear galactan domain (Alderwick et al., 2005; Sanders et al.,2001). Three branched arabinan motifs are attached to the C5 position of the β(1→6) linkedgalactose residue at the 8th, 10th and 12th galactofuranosyl residues of the galactan domain(Alderwick et al., 2005). The arabinan motif consist of a linear β(1→5) arabian core with branchingintroduced at specific C3 positions along the arabinan polysaccharide (Daffe et al., 1990; Alderwicket al., 2005). Arabinogalactan terminates with β(1→2) linked arabinofuranosyl units in a uniquehexa-arabinofuranosyl motif. This is the site where arabinogalactans and mycolic acids are linkedtogether (McNeil et al., 1991). In most mycobacterial species arabinogalactan is covalently attachedto peptidoglycan through a phosphodiester linkage via rhamnose and glucosamine (McNeil et al.,1990). This step has not yet been unraveled for C. glutamicum; however, it is likely that a similarstep occurs in this organism.
Peptidoglycan
Peptidoglycan in C. glutamicum is thought to be similar to the most common types present in bacteria, and of same type as found in Escherichia coli (Wijayarathua et al., 2001). Peptidoglycan issynthesized from the intermediates, UDP- N -acetylmuramate, UDP- N -acetyl-D-glucosamine, L-alanine, D-glutamate,, L-glycine, D-alanyl-D-alanine, and meso-2,6-diaminopimelate (Ingraham et
al., 1983; Schleifer and Kandler, 1972). In figure 3.15 the reactions and corresponding genes for the biosyntehsis of intermediates used for peptidoglycan in C. glutamicum is presented. In addition an
overview of the lumped polymerization reaction is shown. The polymerization consists of severalreactions that sequentially add the amino acids to the lactyl residue of UDP- N -acetylmuramate,followed by addition of UDP- N -acetyl-D-glucosamine, forming a peptidoglycan subunit (Ingrahamet al., 1983). These subunits are further polymerized, and further linked with peptide bonds by theexpense of ATP. During this step an L-alanine molecule is liberated from the chain. Chains of 20-80 subunits are formed (Ingraham et al., 1983).
7/18/2019 Samlet PhD 20090416 U-Forside Appendix.pdf
http://slidepdf.com/reader/full/samlet-phd-20090416-u-forside-appendixpdf 73/187
Microbiology and biochemistry of Corynebacterium glutamiucum ________________________________________________________________________________
75
References
Abe,S., Takayama,K., and Kinoshita,S. (1967) Taxonomical studies on glutamic acid producing bacteria. Journal of General and Applied Microbiology 13, 279-301.
Alderwick,L.J., Radmacher,E., Seidel,M., Gande,R., Hitchen,P.G., Morris,H.R., Dell,A., Sahm,H.,Eggeling,L., and Besra,G.S. (2005) Deletion of Cg-emb in Corynebacterianeae leads to a novel
Figure 3.15: The synthetic pathways of intermediates- and the proposed polymerization of peptidoglycan in C.
glutamicum. Compounds in grey ovals are intermediates which are used for the polymerization of peptidoglycan. Grey
arrows indicate polymerization reactions.
7/18/2019 Samlet PhD 20090416 U-Forside Appendix.pdf
http://slidepdf.com/reader/full/samlet-phd-20090416-u-forside-appendixpdf 74/187
76
truncated cell wall arabinogalactan, whereas inactivation of Cg-ubiA results in an arabinan-deficientmutant with a cell wall galactan core. Journal of Biological Chemistry 280, 32362-32371.
Alifano,P., Fani,R., Lió,P., Lazcano,A., Bazzicalupo,M., Carlomagno,M.S., and Bruni,C.B. (1996)
Histidine biosynthetic pathway and genes: Structure, regulation, and evolution. MicrobiologicalReviews 60, 44-69.
Ankri,S., Serebrijski,I., Reyes,O., and Leblon,G. (1996) Mutations in the Corynebacterium
glutamicum proline biosynthetic pathway: a natural bypass of the proA step. Journal ofBacteriology 178, 4412-4419.
Audette,G.F., Quail,J.W., Hayakawa,K., Bai,C., Chen,R., and Delbaere,L.J.T. (1999)Crystallization and preliminary X-ray diffraction studies of monomeric isocitrate dehydrogenasefrom Corynebacterium glutamicum. Acta Crystallographica Section D 55, 1584-1585.
Bott,M. and Niebisch,A. (2003) The respiratory chain of Corynebacterium glutamicum. Journal ofBiotechnology 104, 129-153.
Brand,S., Niehaus,K., Pühler,A., and Kalinowski,J. (2003) Identification and functional analysis ofsix mycolyltransferase genes of Corynebacterium glutamicum ATCC 13032: the genes cop1, cmt1,and cmt2 can replace each other in the synthesis of trehalose dicorynomycolate, a component of themycolic acid layer of the cell envelope. Archives of Microbiology 180, 33-44.
Burkovski,A. (2003a) Ammonium assimilation and nitrogen control in Corynebacterium
glutamicum and its relatives: an example for new regulatory mechanisms in actinomycetes. FEMSMicrobiology Reviews 27, 617-628.
Burkovski,A. (2003b) I do it my way: regulation of ammonium uptake and ammonium assimilationin Corynebacterium glutamicum. Archives of Microbiology 179, 83-88.
Ceredeño-Tárraga,A.M., Efstratiou,A., Dover,L.G., Holden,M.T.G., Pallen,M., Bentley,S.D.,Besra,G.S., Churcher,C., James,K.D., De Zoysa,A., Chillingworth,T., Cronin,A., Dowd,L.,Feltwell,T., Hamlin,N., Holroyd,S., Jagels,K., Moule,S., Quail,M.A., Rabbinowitsch,E.,Rutherford,K.M., Thomsen,N.R., Unwin,L., Whitehead,S., Barrell,B.G., and Parkhill,J. (2003) Thecomplete genome sequence and analysis of Corynebacterium diphtheriae NCTC13129. NucleicAcids Research 31, 6516-6523.
Claes,W.A., Puhler,A., and Kalinowski,J. (2002) Identification of two prpDBC gene clusters inCorynebacterium glutamicum and their involvement in propionate degradation via the 2-methylcitrate cycle. Journal of Bacteriology 184, 2728-2739.
Cocaign-Bousquet,M. and Lindley,N.D. (1995) Pyruvate overflow and carbon flux within thecentral metabolic pathways of Corynebacterium glutamicum during growth on lactate. Enzyme andMicrobial Technology 17, 260-267.
Cocaign-Bousquet,M., Monnet,C., and Lindley,N.D. (1993) Batch kinetics of Corynebacterium
glutamicum during growth on various carbon substrate mixtures to localise metabolic bottlenecks.
Applied Microbiology and Biotechnology 40, 526-530.
7/18/2019 Samlet PhD 20090416 U-Forside Appendix.pdf
http://slidepdf.com/reader/full/samlet-phd-20090416-u-forside-appendixpdf 75/187
Microbiology and biochemistry of Corynebacterium glutamiucum ________________________________________________________________________________
77
Collins,M.D., Doodfellow,M., and Minnikin,D.E. (1982a) A survey of the structures of mycolicacids in Corynebacterium glutamicum and related taxa. Journal of General Microbiology 128, 129-149.
Collins,M.D., Goodfellow,M., and Minnikin,D.E. (1982b) Fatty acid composition of some mycolicacid-containing coryneform bacteria. Journal of General Microbiology 128, 2503-2509.
Daffé,M. (2005) The Cell Envelope of Corynebacteria. In Handbook of Corynebacterium
glutamicum (Edited by Eggeling,L. and Bott,M.) pp. 121-148. CRC Press, Boca Raton.
Daffe,M., Brennan,P.J., and McNeil,M.R. (1990) Predominant structural features of the cell wallarabinogalactan of Mycobacterium tuberculosis as revealed through characterization ofoligoglycosyl alditol fragments by gas chromatography/mass spectrometry and by 1H and 13C
NMR analyses. Journal of Biological Chemistry 265, 6744-6749.
de Kok,A., Hengeveld,A.F., Martin,A., and Westphal,A.H. (1998) The pyruvate dehydrogenasemulti-enzyme complex from Gram-negative bacteria. Biochimica et Biophysica Acta - ProteinStructure and Molecular Enzymology 1385, 353-366.
Dominguez,H., Cocaign-Bousquet,M., and Lindley,N.D. (1997) Simultaneous consumption ofglucose and fructose from sugar mixtures during batch growth of Corynebacterium glutamicum.Applied Microbiology and Biotechnology 47, 600-603.
Dominguez,H. and Lindley,N.D. (1996) Complete sucrose metabolism requires fructose phosphotransferase activity in Corynebacterium glutamicum to ensure phosphorylation of liberatedfructose. Applied and Environmental Microbiology 62, 3878-3880.
Dominguez,H., Rollin,C., Guyonvarch,A., Guerquin-Kern,J.L., Cocaign-Bousquet,M., andLindley,N.D. (1998) Carbon-flux distribution in the central metabolic pathways ofCorynebacterium glutamicum during growth on fructose. European Journal of Biochemistry 254,96-102.
Dower,L.G., Ceredeño-Tárraga,A.M., Pallen,M.J., Parkhill,J., and Besra,G.S. (2004) Comparativecell wall core biosynthesis in the mycolated pathogens, Mycobacterium tuberculosis andCorynebacterium diphtheriae. FEMS Microbiology Reviews 28, 225-250.
Eggeling,I., Cordes,C., Eggeling,L., and Sahm,H. (1987) Regulation of acetohydroxy acid synthasein Corynebacterium glutamicum during fermentation of alfa-ketobutyrate to L-isoleucine. AppliedMicrobiology and Biotechnology 25, 346-351.
Eggeling,L. and Sahm,H. (2001) The cell wall barrier of Corynebacterium glutamicum and aminoacid efflux. Journal of Bioscience and Bioengineering 92, 201-213.
Eikmanns,B.J. (1992) Identification, sequence analysis, and expression of a Corynebacterium
glutamicum gene cluster encoding the three glycolytic enzymes glyceraldehyde-3-phosphatedehydrogenase, 3-phosphoglycerate kinase, and triosephosphate isomerase. Journal of Bacteriology174, 6076-6086.
7/18/2019 Samlet PhD 20090416 U-Forside Appendix.pdf
http://slidepdf.com/reader/full/samlet-phd-20090416-u-forside-appendixpdf 76/187
78
Eikmanns,B.J., Follettie,M.T., Griot,M.U., and Sinskey,A.J. (1989) The phosphoenolpyruvatecarboxylase gene of Corynebacterium glutamicum: Molecular cloning, nucleotide sequence, andexpression. Molecular and General Genetics MGG 218, 330-339.
Eikmanns,B.J., Rittmann,D., and Sahm,H. (1995) Cloning, sequence analysis, expression, andinactivation of the Corynebacterium glutamicum icd gene encoding isocitrate dehydrogenase and
biochemical characterization of the enzyme. Journal of Bacteriology 177, 774-782.
Eikmanns,B.J., Thum-Schmitz,N., Eggeling,L., Ludtke,K.U., and Sahm,H. (1994) Nucleotidesequence, expression and transcriptional analysis of the Corynebacterium glutamicum gltA geneencoding citrate synthase. Microbiology 140, 1817-1828.
Fazel,A.M. and Jensen,R.A. (1979a) Aromatic aminotransferases in coryneform bacteria. Journal ofBacteriology 140, 580-587.
Fazel,A.M. and Jensen,R.A. (1979b) Obligatory biosynthesis of L-tyrosine via the pretyrosine branchlet in coryneform bacteria. Journal of Bacteriology 138, 805-815.
Follettie,M.T. and Sinskey,A.J. (1986) Molecular cloning and nucleotide sequence of theCorynebacterium glutamicum pheA gene. Journal of Bacteriology 167, 695-702.
Frunzke,J., Engels,V., Hasenbein,S., Gätgens,C., and Bott,M. (2008) Coordinated regulation ofgluconate catabolism and glucose uptake in Corynebacterium glutamicum by two functionallyequivalent transcriptional regulators, GntR1 and GntR2. Molecular Microbiology 67, 305-322.
Genda,T., Watabe,S., and Ozaki,H. (2006) Purification and characterization of fumarase fromCorynebacterium glutamicum. Bioscience Biotechnology and Biochemistry 70, 1102-1109.
Gerstmeier,R., Wendisch,V.F., Schnicke,S., Ruan,H., Farwic,M., Reinscheid,D., and Eikmanns,B.J.(2003) Acetate metabolism and the regulation in Corynebacterium glutamicum. Journal ofBiotechnology 104, 99-122.
Gourdon,P., Baucher,M.F., Lindley,N.D., and Guyonvarch,A. (2000) Cloning of the malic enzymegene from Corynebacterium glutamicum and role of the enzyme in lactate metabolism. Applied andEnvironmental Microbiology 66, 2981-2987.
Gourdon,P., Raherimandimby,M., Dominguez,H., Cocaign-Bousquet,M., and Lindley,N.D. (2003)Osmotic stress, glucose transport capacity and consequences for glutamate overproduction inCorynebacterium glutamicum. Journal of Biotechnology 104, 77-85.
Guillouet,S. and Engasser,J.M. (1995) Sodium and proline accumulation in Corynebacterium
glutamicum as a response to an osmotic saline upshock. Applied Microbiology and Biotechnology43, 315-320.
Hermann,T. (2003) Industrial production of amino acids by coryneform bacteria. Journal ofBiotechnology 104, 155-172.
7/18/2019 Samlet PhD 20090416 U-Forside Appendix.pdf
http://slidepdf.com/reader/full/samlet-phd-20090416-u-forside-appendixpdf 77/187
Microbiology and biochemistry of Corynebacterium glutamiucum ________________________________________________________________________________
79
Hoischen,C. and Krämer,R. (1990) Membrane alteration is necessary but not sufficient for effectiveglutamate secretion in Corynebacterium glutamicum. Journal of Bacteriology 172, 3409-3416.
Hwang,B.-J., Yeom,H.-J., Kim,Y., and Lee,H.-S. (2002) Corynebacterium glutamicum utilizes both
transsulfuration and direct sulfhydrylation pathways for methionine biosynthesis. Journal ofBacteriology 184, 1277-1286.
Ikeda,M., Okamoto,K., and Katsumata,R. (1998) A transketolase mutant of Corynebacterium
glutamicum. Applied Microbiology and Biotechnology 50, 375-378.
Ikeda,M. and Nakagawa,S. (2003) The Corynebacterium glutamicum genome: features and impactson biotechnological processes. Applied Microbiology and Biotechnology 62, 99-109.
Ingraham,J.L., Maaløe,O., and Niedhardt,F.C. (1983) Growth of the Bacterial Cell. SinauerAssociates, Inc., Sunderland, Massachusetts.
Inui,M., Murakami,S., Okino,S., Kawaguchi,H., Vertés,A.A., and Yukawa,H. (2004) Metabolicanalysis of Corynebacterium glutamicum during lactate and succinate productions under oxygendeprivation conditions. Journal of Molecular Microbiology and Biotechnology 7, 182-196.
Ishige,T., Krause,M., Bott,M., Wendisch,V.F., and Sahn,H. (2003) The phosphate starvationstimulon of Corynebacterium glutamicum determined by DNA microarray analyses. Journal ofBacteriology 185, 4519-4529.
Jakoby,M., Tesch,M., Sahn,H., Krämer,R., and Burkovski,A. (1997) Isolation of theCorynebacterium glutamicum glnA gene encoding glutamine synthase I. FEMS MicrobiologyLetters 154, 81-88.
Jang,K.H., Pierotti,D., Kemp,G.W., Best,G.R., and Britz,M.L. (1997) Mycolic acid composition ofCorynebacterium glutamicum and its cell surface mutants: effects of growth with glycine andisonicotinic acid hydrazide. Microbiology UK 143, 3209-3221.
Jetten,M.S., Gubler,M.E., Lee,S.H., and Sinskey,A.J. (1994) Structural and functional analysis of pyruvate kinase from Corynebacterium glutamicum. Applied and Environmental Microbiology 60,2501-2507.
Jetten,M.S.M. and Sinskey,A.J. (1993) Characterization of phosphoenolpyruvate carboxykinasefrom Corynebacterium glutamicum. FEMS Microbiology Letters 111, 183-188.
Jetten,M.S.M. and Sinskey,A.J. (1995) Purification and properties of oxaloacetate decarboxylasefrom Corynebacterium glutamicum. Antonie van Leeuwenhoek 67, 221-227.
Jung,S.-I., Han,M.-S., Kwon,J.-H., Cheon,C.-I., Min,K.-H., and Lee,M.-S. (1998) Cloning of thehistidine biosynthetic genes of Corynebacterium glutamicum: Organization and sequencing analysisof the hisA, impA and hisF gene cluster. Biochemical and Biophysical Research Communications247, 741-745.
7/18/2019 Samlet PhD 20090416 U-Forside Appendix.pdf
http://slidepdf.com/reader/full/samlet-phd-20090416-u-forside-appendixpdf 78/187
80
Kalinowski,J., Bathe,B., Bartels,D., Bischoff,N., Bott,M., Burkovski,A., Dusch,N., Eggeling,L.,Eikmanns,B.J., and Gaigalat,L. (2003) The complete Corynebacterium glutamicum ATCC 13032genome sequence and its impact on the production of aspartate-derived amino acids and vitamins.Journal of Biotechnology 104, 5-25.
Kamada,N., Yasuhara,A., and Ikeda,M. (2003) Significance of the non-oxidative route of the pentose phosphate pathway for supplying carbon to the purine-nucleotide pathway inCorynebacterium ammoniagenes. Journal of Industrial Microbiology & Biotechnology 30, 129-132.
Kamada,N., Yasuhara,A., Takano,Y., Nakano,T., and Ikeda,M. (2001) Effect of transketolasemodifications on carbon flow to the purine-nucleotide pathway in Corynebacterium ammoniagenes.Applied Microbiology and Biotechnology 56, 710-717.
Kataoka,M., Hashimoto,K.I., Yoshida,M., Nakamatsu,T., Horinouchi,S., and Kawasaki,H. (2006)Gene expression of Corynebacterium glutamicum in response to the conditions inducing glutamate
overproduction. Letters in Applied Microbiology 42, 471-476.
Keilhauer,C., Eggeling,L., and Sahm,H. (1993) Isoleucine synthesis in Corynebacterium
glutamicum: molecular analysis of the ilvB-ilvN-ilvC operon. Journal of Bacteriology 175, 5595-5603.
Kiefer,P., Heinzle,E., Zelder,O., and Wittmann,C. (2004) Comparative metabolic flux analysis oflysine-producing Corynebacterium glutamicum cultured on glucose or fructose. Applied andEnvironmental Microbiology 70, 229-239.
Kronemeyer,W., Peekhaus,N., Kramer,R., Sahm,H., and Eggeling,L. (1995) Structure of the gluABCD cluster encoding the glutamate uptake system of Corynebacterium glutamicum. Journalof.Bacteriology 177, 1152-1158.
Krug,A., Wendisch,V.F., and Bott,M. (2005) Identification of AcnR, a TetR-type repressor of theaconitase gene acn in Corynebacterium glutamicum. Journal of Biological Chemistry 280, 585-595.
Kusumoto,K., Sakiyama,M., Sakamoto,J., Noguchi,S., and Sone,N. (2000) Menaquinol oxidaseactivity and primary structure of cytochrome bd from the amino-acid fermenting bacteriumCorynebacterium glutamicum. Archives of Microbiology 173, 390-397.
Lee,H.-S. (2005) Sulfur Metabolism and Its Regulation. In Handbook of Corynebacterium glutamicum (Edited by Eggeling,L. and Bott,M.) pp. 351-376. CRC Press, Boca Raton.
Lee,H.-S. and Hwang,B.-J. (2003) Methionine biosynthesis and its regulation in Corynebacterium
glutamicum: parallel pathways of transsulfuration and direct sulfhydration. Applied Microbiologyand Biotechnology 62, 459-467.
Lee,H.-W., Pan,J.-G., and Lebeault,J.-M. (1998) Enhanced L-lysine production in threonine-limitedcontinuous culture of Corynebacterium glutamicum by using gluconate as a secondary carbonsource with glucose. Applied Microbiology and Biotechnology 49, 9-15.
7/18/2019 Samlet PhD 20090416 U-Forside Appendix.pdf
http://slidepdf.com/reader/full/samlet-phd-20090416-u-forside-appendixpdf 79/187
Microbiology and biochemistry of Corynebacterium glutamiucum ________________________________________________________________________________
81
Lee,J.K., Sung,M.H., Yoon,K.H., Yu,J.H., and Oh,T.K. (1993) Cloning and expression of the geneencoding mannose enzyme II of the Corynebacterium glutamicum phosphoenolpyruvate-dependent
phosphotransferase system in Escherichia coli. Journal of Microbiology and Biotechnology 3, 1-5.
Liebl,W. (2005) Corynebacterium Taxonomy. In Handbook of Corynebacterium glutamicum (Edited by Eggeling,L. and Bott,M.) pp. 9-34. CRC Press, Boca Raton.
Lu,C.-D. (2006) Pathways and regulation of bacterial arginine metabolism and perspectives forobtaining arginine overproducing strains. Applied Microbiology and Biotechnology 70, 261-272.
Marx,A., de Graaf,A.A., Wiechert,W., Eggeling,L., and Sahm,H. (1996) Determination of thefluxes in the central metabolism of Corynebacterium glutamicum by nuclear magnetic resonancespectroscopy combined with metabolite balancing. Biotechnology and Bioengineering 49, 111-129.
Marx,A., Hans,S., Möckel,B., Bathe,B., and de Graaf,A.A. (2003) Metabolic phenotype of
phosphoglucose isomerase mutants of Corynebacterium glutamicum. Journal of Biotechnology 104,185-197.
McNeil,M., Daffe,M., and Brennan,P.J. (1990) Evidence for the nature of the link between thearabinogalactan and peptidoglycan of mycobacterial cell walls. Journal of Biological Chemistry265, 18200-18206.
McNeil,M., Daffe,M., and Brennan,P.J. (1991) Location of the mycolyl ester substituents in the cellwalls of mycobacteria. Journal of Biological Chemistry 226, 13217-13223.
Meier-Wagner,J., Nolden,L., Jakoby,M., Siewe,R., Krämer,R., and Burkovski,A. (2001)Multiplicity of ammonium uptake systems in Corynebacterium glutamicum: role of Amt and AmtB.Microbiology 147, 135-143.
Miyajima,R., Otsuka,S.-I., and Shiio,I. (1968) Regulation of aspartate family amino acid biosynthesis in Brevibacterium flavum. Journal of Biochemistry 63, 139-148.
Möckel,B., Eggeling,L., and Sahm,H. (1992) Functional and structural analysis of threoninedehydratase from Corynebacerium glutamicum. Journal of Bacteriology 174, 8065-8072.
Molenaar,D., van der Rest,M.E., Drysch,A., and Yucel,R. (2000) Functions of the membrane-
associated and cytoplasmic malate dehydrogenases in the citric acid cycle of Corynebacterium glutamicum. Journal of Bacteriology. 182, 6884-6891.
Molenaar,D., van der Rest,M.E., and Petrovic,S. (1998) Biochemical and genetic characterization ofthe membrane-associated malate dehydrogenase (acceptor) from Corynebacterium glutamicum.European Journal of Biochemistry 254, 395-403.
Moon,M.W., Kim,H.J., Oh,T.K., Shin,C.S., Lee,J.S., Kim,S.J., and Lee,J.K. (2005) Analysis ofenzyme II gene mutants for sugar transport and heterologous expression of fructokinase gene inCorynebacterium glutamicum ATCC 13032. FEMS Microbiology Letters 244, 259-266.
7/18/2019 Samlet PhD 20090416 U-Forside Appendix.pdf
http://slidepdf.com/reader/full/samlet-phd-20090416-u-forside-appendixpdf 80/187
82
Moritz,B., Striegel,K., de Graff,A.A., and Sahm,H. (2000) Kinetic properties of the glucose-6- phosphate and 6-phosphogluconate dehydrogenases from Corynebacterium glutamicum and theirapplication for predicting pentose phosphate pathway flux in vivo. European Journal ofBiochemistry 267, 3442-3452.
Mormann,S., Lömker,A., Rückert,C., Gaigalat,L., Tauch,A., Pühler,A., and Kalinowski,J. (2006)Random mutagenesis in Corynebacterium glutamicum ATCC 13032 using an IS6100-basedtransposon vector identified the last unknown gene in the histidine pathway. BMS Genomics 7, 205.
Nampoothiri,K.M., Hoischen,C., Bathe,B., Möckel,B., Pfefferle,W., Krumbach,K., Sahm,H., andEggeling,L. (2002) Expression of genes of lipid synthesis and altered lipid composition modulatesL-glutamate efflux of Corynebacterium glutamicum. Applied Microbiology and Biotechnology 58,89-96.
Netzer,R., Peters-Wendisch,P., Eggeling,L., and Sahm,H. (2004) Cometabolism of a Nongrowth
Substrate: L-Serine Utilization by Corynebacterium glutamicum. Applied and EnvironmentalMicrobiology 70, 7148-7155.
Nicholls,D.G. and Ferguson,S.J. (1992) Bioenergetics. Academic Press, London.
Niebisch,A. and Bott,M. (2001) Molecular analysis of the cytochrome bc1-aa3 branch of theCorynebacterium glutamicum respiratory chain containing an unusual diheme cytochrome c1.Archives of Microbiology 175, 282-294.
Niebisch,A. and Bott,M. (2003) Purification of a cytochrome bc1-aa3 supercomplex with quinoloxidase activity from Corynebacterium glutamicum. IDENTIFICATION OF A FOURTHSUBUNIT OF CYTOCHROME aa3 OXIDASE AND MUTATIONAL ANALYSIS OF DIHEMECYTOCHROME c1. Journal of Biological Chemistry 278, 4339-4346.
Nishio,Y., Nakamura,Y., Kawarabayasi,Y., Usada,Y., Kimura,E., Sugimoto,S., Matsui,K.,Yamagishi,A., Kikuchi,H., Ikeo,K., and Gojobori,T. (2003) Comparative complete genomesequence analysis of the amino acid replacements responsible for the thermostability ofCorynebacterium efficiens. Genome Research 13, 1572-1579.
O'Gara,J.P. and Dunican,L.K. (1995) Mutations in the trpD gene of Corynebacterium glutamicum confer 5- methyltryptophan resistance by encoding a feedback-resistant anthranilate
phosphoribosyltransferase. Appl.Environ.Microbiol. 61, 4477-4479.
Ohnishi,J., Hayashi,M., Mitsuhashi,S., and Ikeda,M. (2003) Efficient 40°C fermentation by a newCorynebacterium glutamicum mutant developed by genome breeding . Applied Microbiology andBiotechnology 62, 69-75.
Omumasaba,C.A., Okai,N., Inui,M., and Yukawa,H. (2004) Corynebacterium glutamicum glycaldehyde-3-phosphate dehydrogenase isoforms with opposite, ATP-dependent regulations.Journal of Molecular Microbiology and Biotechnology 8, 91-103.
7/18/2019 Samlet PhD 20090416 U-Forside Appendix.pdf
http://slidepdf.com/reader/full/samlet-phd-20090416-u-forside-appendixpdf 81/187
Microbiology and biochemistry of Corynebacterium glutamiucum ________________________________________________________________________________
83
Parche,S., Burkovski,A., Sprenger,G.A., Weil,B., Krämer,R., and Titgemeyer,F. (2001)Corynebacterium glutamicum: a dissection of the PTS. Journal of Molecular Microbiology andBiotechnology 3, 423-428.
Park,S.M., Shaw-Reid,C., Sinskey,A.J., and Stephanopoulos,G. (1997) Elucidation of anaplerotic pathways in Corynebacterium glutamicum via 13C-NMR spectroscopy and GC-MS. AppliedMicrobiology and Biotechnology 47, 430-440.
Park,S.Y., Kim,H.K., Yoo,S.-K., Oh,T.K., and Lee,J.K. (2000) Characterization of glk , a genecoding for glucose kinase of Corynebacterium glutamicum. FEMS Microbiology Letters 188, 209-215.
Park,S.-D., Lee,J.-Y., Kim,Y., Kim,J.-H., and Lee,H.-S. (1998) Isolation and analysis of metA, a biosynthetic gene encoding homoserine acetyltransferase in Corynebacterium glutamicum.Molecules and Cells 8, 286-294.
Patek,M., Hochmannová,J., Jelínková,M., Nesvera,J., and Eggeling,L. (1998) Analysis of the leuB gene from Corynebacterium glutamicum. Applied Microbiology and Biotechnology 50, 42-47.
Patek,M., Krumbach,K., Eggeling,L., and Sahm,H. (1994) Leucine synthesis in Corynebacterium
glutamicum: enzyme activities, structure of leuA, and effect of leuA inactivation on lysine synthesis.Applied and Environmental Microbiology 60, 133-140.
Peters-Wendisch,P., Stoltz,M., Etterich,H., Kennerknecht,N., Sahn,H., and Eggeling,L. (2005)Metabolic engineering of Corynebacterium glutamicum for L-serine production. Applied andEnvironmental Microbiology 71, 7139-7144.
Peters-Wendisch,P.G., Kreutzer,C., Kalinowski,J., Patek,M., Sahm,H., and Eikmanns,B.J. (1998)Pyruvate carboxylase from Corynebacterium glutamicum: characterization, expression andinactivation of the pyc gene. Microbiology 144, 915-927.
Peters-Wendisch,P.G., Netzer,R., Eggeling,L., and Sahm,H. (2002) 3-Phosphoglyceratedehydrogenase from Corynebacterium glutamicum: the C-terminal domain is not essential foractivity but is required for inhibition by L-serine. Applied Microbiology and Biotechnology 60,437-441.
Petersen,S., de Graff,A.A., Eggeling,L., Mollney,M., Wiechert,W., and Sahn,H. (2000) In vivo quantification of parallel and bidirectional fluxes in the anaplerosis of Corynebacterium
glutamicum. Journal of Biological Chemistry 275, 35932-35941.
Petersen,S., Mack,C., de Graaf,A.A., Riedel,C., Eikmanns,B.J., and Sahm,H. (2001) Metabolicconsequences of altered phosphoenolpyruvate carboxykinase activity in Corynebacterium
glutamicum reveal anaplerotic regulation mechanisms in vivo. Metabolic Engineering 3, 344-361.
Polen,T., Schluesener,D., Poetsch,A., Bott,M., and Wendisch,V.F. (2007) Characterization ofcitrate utilization in Corynebacterium glutamicum by transcriptome and proteome analysis. FEMSMicrobiology Letters 273, 109-119.
7/18/2019 Samlet PhD 20090416 U-Forside Appendix.pdf
http://slidepdf.com/reader/full/samlet-phd-20090416-u-forside-appendixpdf 82/187
84
Puech,V., Chami,M., Lemassu,A., Laneelle,M.A., Schiffler,B., Gounon,P., Bayan,N., Benz,R., andDaffe,M. (2001) Structure of the cell envelope of corynebacteria: importance of the non-covalently
bound lipids in the formation of the cell wall permeability barrier and fracture plane. Microbiology147, 1365-1382.
Radmacher,E., Vaitsikova,A., Burger,U., Krumbach,K., Sahm,H., and Eggeling,L. (2002) Linkingcentral metabolism with increased pathway flux: L-Valine accumulation by Corynebacterium
glutamicum. Applied and Environmental Microbiology 68, 2246-2250.
Reinscheid,D.J., Eikmanns,B.J., and Sahm,H. (1994) Characterization of the isocitrate lyase genefrom Corynebacterium glutamicum and biochemical analysis of the enzyme. Journal ofBacteriology 176, 3474-3483.
Reinscheid,D.J., Schnicke,S., Rittmann,D., Zahnow,U., Sahm,H., and Eikmanns,B.J. (1999)Cloning, sequence analysis, expression and inactivation of the Corynebacterium glutamicum pta-
ack operon encoding phosphotransacetylase and acetate kinase. Microbiology 145, 503-513.
Rittmann,D., Schaffer,S., Wendisch,V.F., and Sahn,H. (2003) Fructose-1,6-bisphosphatase fromCorynebacterium glutamicum: expression and deletion of the fbp gene and biochemicalcharacterization of the enzyme. Archives of Microbiology 180, 285-292.
Rossol,I. and Pühler,A. (2003) The Corynebacterium glutamicum aecD gene encodes a C-S lyasewith a,b-elimination activity that degrades aminoethylcysteine. Journal of Bacteriology 174, 2968-2977.
Rückert,C., Pühler,A., and Kalinowski,J. (2003) Genome-wide analysis of the L-methionine biosynthetic pathway in Corynebacterium glutamicum by targeted gene deletion and homologouscomplementation. Journal of Biotechnology 104, 213-228.
Sahm,H. and Eggeling,L. (1999) D-pantothenate synthesis in Corynebacterium glutamicum and useof panBC and genes encoding L-valine synthesis for D-pantothenate overproduction. Applied andEnvironmental Microbiology 65, 1973-1979.
Sanders,D.A.R., Staines,A.G., McMahon,S.A., McNeil,M.R., Whitfield,C., and Naismith,J.H.(2001) UDP-galactopyranose mutase has a novel structure and mechanism. Nature StructuralBiology 8, 858-863.
Schleifer,K.H. and Kandler,O. (1972) Peptidoglycan types of bacterial cell walls and theirtaxonomic implications. Bacteriological Reviews 36, 407-477.
Schreiner,M.E., Fiur,D., Holátko,J., Párèk,M., and Eikmanns,B.J. (2005) E1 Enzyme of the pyruvate dehydrogenase complex in Corynebacterium glutamicum: Molecular analysis of the geneand phylogenic aspects. Journal of Bacteriology 187, 6005-6018.
Schrumpf,B., Schwarzer,A., Kalinowski,J., Pühler,A., Eggeling,L., and Sahn,H. (1991) Afunctionally split pathway for lysine synthesis in Corynebacterium glutamicum. Journal ofBacteriology 173, 4510-4516.
7/18/2019 Samlet PhD 20090416 U-Forside Appendix.pdf
http://slidepdf.com/reader/full/samlet-phd-20090416-u-forside-appendixpdf 83/187
Microbiology and biochemistry of Corynebacterium glutamiucum ________________________________________________________________________________
85
Schwinde,J.W., Hertz,P.F., Sahm,H., Eikmanns,B.J., and Guyonvarch,A. (2001) Lipoamidedehydrogenase from Corynebacterium glutamicum: molecular and physiological analysis of the lpd gene and characterization of the enzyme. Microbiology 147, 2223-2231.
Serebrijski,I., Wojcik,F., Reyes,O., and Leblon,G. (1995) Multicopy suppression by asd gene andosmotic stress-dependent complementation by heterologous proA in proA mutants. Journal ofBacteriology 177, 7255-7260.
Shiio,I., Sugimoto,S., and Miyajima,R. (1974) Regulation of 3-deoxy-D-arabino-heptulosonate-7- phosphate synthase in Brevibacterium flavum. The Journal of Biochemistry 75, 987-997.
Siewe,R., Weil,B., Burkovski,A., Eggeling,L., Krämer,R., and Jahns,T. (1998) Urea uptake andurease activity in Corynebacterium glutamicum. Archives of Microbiology 169, 411-416.
Siewe,R., Weil,B., Burkovski,A., Eikmanns,B.J., Eikmanns,M., and Krämer,R. (1996) Functional
and genetic characterization of the (methyl)ammonium uptake carrier of Corynebacterium glutamicum. The Journal of Biological Chemistry 271, 5398-5403.
Siewe,R., Weil,B., and Krämer,R. (1995) Glutamine uptake by a sodium-dependent secondarytransport system in Corynebacterium glutamicum. Archives of Microbiology 164, 98-103.
Simic,P., Willuhn,J., Sahn,H., and Eggeling,L. (2002) Identification of glyA (encoding serinehydroxymethyltransferase) and its use together with the exporter ThrE to increase L-threonineaccumulation by Corynebacterium glutamicum. Applied and Environmental Microbiology 68,3321-3327.
Stephanopoulos,G.N., Aristidou,A.A., and Nielsen,J. (1998) Metabolic Engineering - Principles andMethodologies. Academic Press, San Diego, USA.
Stryer,L. (1995a) Biochemistry. W. H. Freeman and Company, New York.
Stryer,L. (1995b) Fatty Acid Metabolism. In Biochemistry (Edited by Stryer,L.) pp. 601-628. W. H.Freeman and Company, New York.
Stuible,H.-P., Wagner,C., Andreou,I., Huter,G., Haselmann,J., and Schweizer,E. (1996)Identification and functional differentiation of two type I fatty acid synthases in Brevibacterium
ammoniagenes. Journal of Bacteriology 178, 4787-4793.
Sugimoto,M. and Shiio,I. (1987a) Regulation of glucose-6-phosphate dehydrogenase in Brevibacterium flavum. Agricultural and Biological Chemistry 51, 101-108.
Sugimoto,S. and Shiio,I. (1987b) Regulation of 6-phosphogluconate dehydrogenase inBrevibacterium flavum. Agricultural and Biological Chemistry 51, 1257-1263.
Sugimoto,M. and Shiio,I. (1989a) Regulation of enzymes for erythose 4-phosphate synthesis in Brevibacterium flavum. Agricultural and Biological Chemistry 53, 2081-2087.
7/18/2019 Samlet PhD 20090416 U-Forside Appendix.pdf
http://slidepdf.com/reader/full/samlet-phd-20090416-u-forside-appendixpdf 84/187
86
Sugimoto,S. and Shiio,I. (1989b) Fructose metabolism and regulation of 1-phosphofructokinase and6-phosphofructokinase in Brevibacterium flavum. Agricultural and Biological Chemistry 53, 1261-1268.
Sugimoto,S.-I. and Shiio,I. (1977) Enzymes of the tryptophan synthetic pathway in Brevibacterium flavum. The Journal of Biochemistry 81, 823-833.
Tauch,A., Kaiser,O., Hain,T., Goesmann,A., Weisshaar,B., Albersmeier,A., Bekel,T., Bischoff,N.,Brune,I., Chakraborty,T., Kalinowski,J., Meyer,F., Rupp,O., Schneiker,S., Viehoever,P., andPühler,A. (2005) Complete genome sequence and analysis of the multiresistant nosocomial
pathogen Corynebacterium jeikeium K411, a lipid-requiring bacterium of the human skin flora.Journal of Bacteriology 187, 4671-4682.
Usuda,Y., Tujimoto,N., Abe,C., Asakura,Y., Kimura,E., Kawahara,Y., Kurahashi,O., and Matsui,H.(1996) Molecular cloning of the Corynebacterium glutamicum (' Brevibacterium lactofermentum'
AJ12036) odhA gene encoding a novel type of 2-oxoglutarate dehydrogenase. Microbiology-Uk142, 3347-3354.
Utagawa,T. (2004) Production of arginine by fermentation. The Journal of Nutrition 134, 2854S-2857S.
Vallino,J.J. and Stephanopoulos,G. (1993) Metabolic flux distribution in Corynebacterium
glutamicum during growth and lysine overproduction. Biotechnology and Bioengineering 41, 633-646.
Vallino,J.J. and Stephanopoulos,G. (1994) Carbon flux distributions at the glucose 6-phosphate branch point in Corynebacterium glutamicum during lysine overproduction. BiotechnologyProgress 10, 327-334.
von der Osten,C.H., Barbas,C.H., Wong,C.F., and Sinskey,A.J. (1989) Molecular cloning,nucleotide sequence and fine-structural analysis of the Corynebacterium glutamicum fda gene:structural comparison of C. glutamicum fructose-1,6-biphosphate aldolase to class I and class IIaldolases. Molecular Microbiology 3, 1625-1637.
Wada,M., Awano,N., Haisa,K., Takagi,H., and Nakamori,S. (2002) Purification, characterizationand identification of cysteine desulfhydrase of Corynebacterium glutamicum, and its relationship to
cysteine production. FEMS Microbiology Letters 217, 103-107.
Wada,M., Awano,N., Yamazawa,H., Takagi,H., and Nakamori,S. (2004) Purification andcharacterization of O-acetylserine sulfhydrylase of Corynebacterium glutamicum. BioscienceBiotechnology and Biochemistry 68, 1581-1583.
Wendisch,V.F., de Graaf,A.A., Sahm,H., and Eikmanns,B.J. (2000) Quantitative determination ofmetabolic fluxes during coutilization of two carbon sources: Comparative analyses withCorynebacterium glutamicum during growth on acetate and/or glucose. Journal of Bacteriology182, 3088-3096.

7/18/2019 Samlet PhD 20090416 U-Forside Appendix.pdf
http://slidepdf.com/reader/full/samlet-phd-20090416-u-forside-appendixpdf 85/187
Microbiology and biochemistry of Corynebacterium glutamiucum ________________________________________________________________________________
87
Wendisch,V.F., Spies,M., Reinscheid,D., Schnicke,S., Sahn,H., and Eikmanns,B.J. (2004)Regulation of acetate metabolism in Corynebacterium glutamicum: transcriptional control of theisocitrate lyase and malate synthase genes. Archives of Microbiology 168, 262-269.
Wijayarathua,C.D., Wachi,M., and Nagai,K. (2001) Isolation of ftsI and murE genes involved in peptidoglycan synthesis from Corynebacterium glutamicum. Applied Microbiology andBiotechnology 55, 466-470.
Willis,L.B., Lessard,P.A., and Sinskey,A.J. (2005) Synthesis of L-Threonine and Branched-ChainAmino Acids. In Handbook of Corynebacterium Glutamicum (Edited by Eggeling,L. and Bott,M.)
pp. 511-531. CRC Press, Boca Raton.
Yukawa,H., Omumasaba,A., Nonaka,H., Kós,P., Okai,N., Suzuki,N., Suda,M., Tsuge,Y.,Watanabe,J., Ikeda,Y., Vertes,A.A., and Inui,M. (2007) Comparative analysis of theCorynebacterium glutamicum group and complete genome sequence of strain R. Microbiology 153,
1042-1058.
Zhao,Y. and Lin,Y.-H. (2002) Distribution of ATP and reducing equivalents in Corynebacterium
glutamicum during amino acid resolution. Process Biochemistry 37, 1455-1461.

7/18/2019 Samlet PhD 20090416 U-Forside Appendix.pdf
http://slidepdf.com/reader/full/samlet-phd-20090416-u-forside-appendixpdf 86/187
88
7/18/2019 Samlet PhD 20090416 U-Forside Appendix.pdf
http://slidepdf.com/reader/full/samlet-phd-20090416-u-forside-appendixpdf 87/187
In silico Genome-Scale Reconstruction and Validation of the….. ________________________________________________________________________________
89
Chapter 4
4. In Silico Genome-Scale Reconstruction and Validation of the
Corynebacterium glutamicum Metabolic Network(Paper A)
Kjeld Raunkjær Kjeldsen1,2, Jens Nielsen2,3
1Center for Microbial Biotechnology, DTU Biosys, Technical University of Denmark, DK-2800Lyngby, Denmark; 2Agro&Ferm A/S, Limfjordsvej 4, DK-6715 Esbjerg N, Denmark.3
Corresponding author; telephone: (+45) 45252696; Fax: (+45) 45884148; E-mail: [email protected]
This manuscript have been accepted for publication in “Biotechnology and Bioengineering”
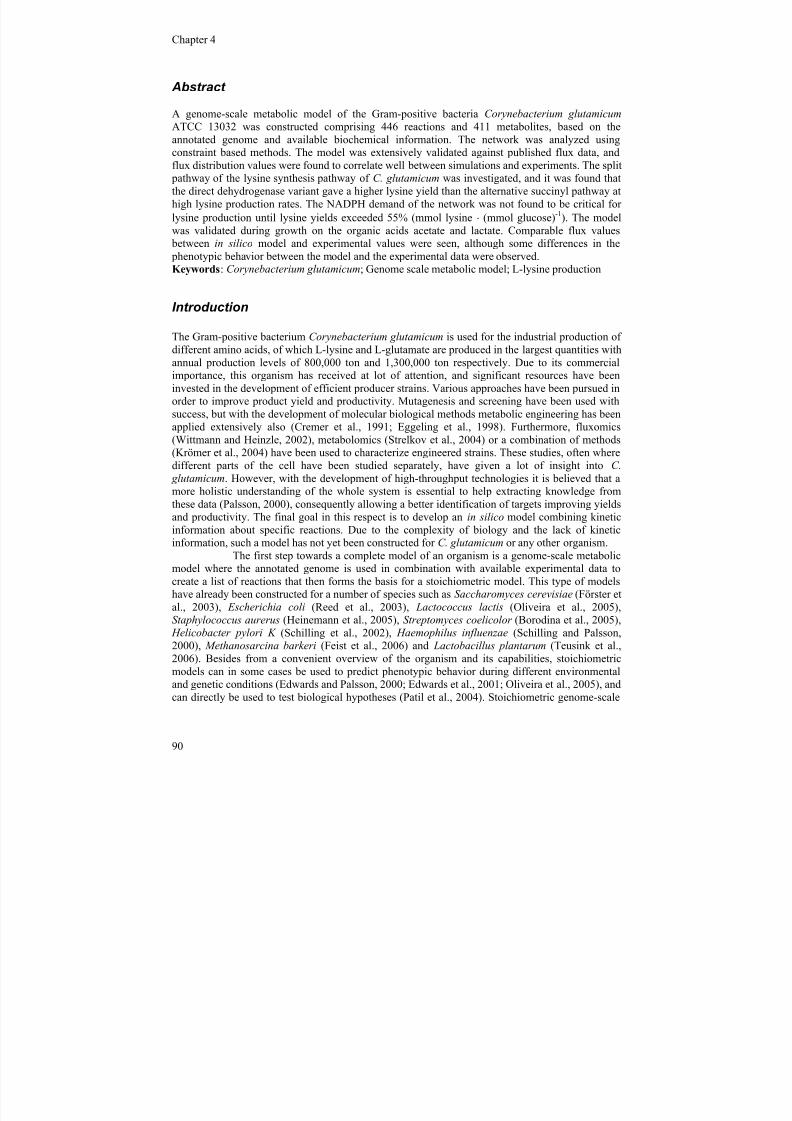
7/18/2019 Samlet PhD 20090416 U-Forside Appendix.pdf
http://slidepdf.com/reader/full/samlet-phd-20090416-u-forside-appendixpdf 88/187
Chapter 4 ________________________________________________________________________________
90
Abstract
A genome-scale metabolic model of the Gram-positive bacteria Corynebacterium glutamicum ATCC 13032 was constructed comprising 446 reactions and 411 metabolites, based on the
annotated genome and available biochemical information. The network was analyzed usingconstraint based methods. The model was extensively validated against published flux data, andflux distribution values were found to correlate well between simulations and experiments. The split
pathway of the lysine synthesis pathway of C. glutamicum was investigated, and it was found thatthe direct dehydrogenase variant gave a higher lysine yield than the alternative succinyl pathway athigh lysine production rates. The NADPH demand of the network was not found to be critical forlysine production until lysine yields exceeded 55% (mmol lysine ⋅ (mmol glucose)-1). The modelwas validated during growth on the organic acids acetate and lactate. Comparable flux values
between in silico model and experimental values were seen, although some differences in the phenotypic behavior between the model and the experimental data were observed.Keywords: Corynebacterium glutamicum; Genome scale metabolic model; L-lysine production
Introduction
The Gram-positive bacterium Corynebacterium glutamicum is used for the industrial production ofdifferent amino acids, of which L-lysine and L-glutamate are produced in the largest quantities withannual production levels of 800,000 ton and 1,300,000 ton respectively. Due to its commercialimportance, this organism has received at lot of attention, and significant resources have beeninvested in the development of efficient producer strains. Various approaches have been pursued inorder to improve product yield and productivity. Mutagenesis and screening have been used with
success, but with the development of molecular biological methods metabolic engineering has beenapplied extensively also (Cremer et al., 1991; Eggeling et al., 1998). Furthermore, fluxomics(Wittmann and Heinzle, 2002), metabolomics (Strelkov et al., 2004) or a combination of methods(Krömer et al., 2004) have been used to characterize engineered strains. These studies, often wheredifferent parts of the cell have been studied separately, have given a lot of insight into C.
glutamicum. However, with the development of high-throughput technologies it is believed that amore holistic understanding of the whole system is essential to help extracting knowledge fromthese data (Palsson, 2000), consequently allowing a better identification of targets improving yieldsand productivity. The final goal in this respect is to develop an in silico model combining kineticinformation about specific reactions. Due to the complexity of biology and the lack of kineticinformation, such a model has not yet been constructed for C. glutamicum or any other organism.
The first step towards a complete model of an organism is a genome-scale metabolicmodel where the annotated genome is used in combination with available experimental data tocreate a list of reactions that then forms the basis for a stoichiometric model. This type of modelshave already been constructed for a number of species such as Saccharomyces cerevisiae (Förster etal., 2003), Escherichia coli (Reed et al., 2003), Lactococcus lactis (Oliveira et al., 2005),Staphylococcus aurerus (Heinemann et al., 2005), Streptomyces coelicolor (Borodina et al., 2005),
Helicobacter pylori K (Schilling et al., 2002), Haemophilus influenzae (Schilling and Palsson,2000), Methanosarcina barkeri (Feist et al., 2006) and Lactobacillus plantarum (Teusink et al.,2006). Besides from a convenient overview of the organism and its capabilities, stoichiometricmodels can in some cases be used to predict phenotypic behavior during different environmentaland genetic conditions (Edwards and Palsson, 2000; Edwards et al., 2001; Oliveira et al., 2005), andcan directly be used to test biological hypotheses (Patil et al., 2004). Stoichiometric genome-scale
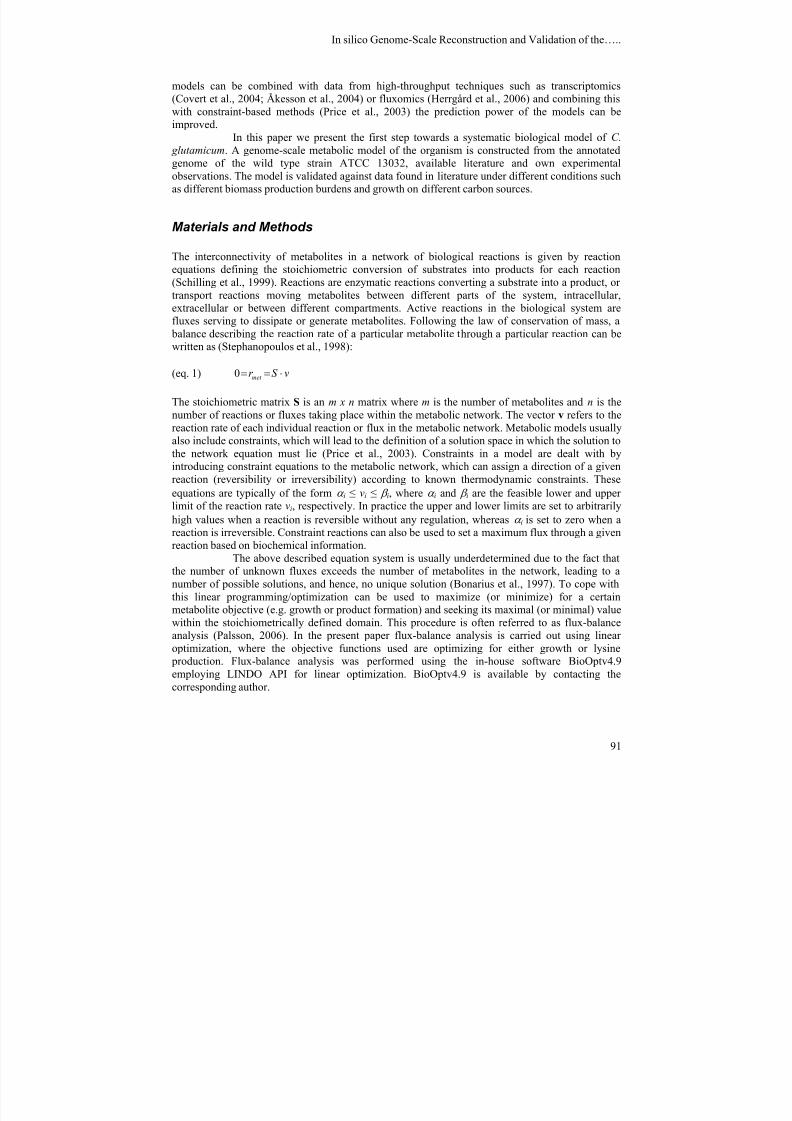
7/18/2019 Samlet PhD 20090416 U-Forside Appendix.pdf
http://slidepdf.com/reader/full/samlet-phd-20090416-u-forside-appendixpdf 89/187
In silico Genome-Scale Reconstruction and Validation of the….. ________________________________________________________________________________
91
models can be combined with data from high-throughput techniques such as transcriptomics(Covert et al., 2004; Åkesson et al., 2004) or fluxomics (Herrgård et al., 2006) and combining thiswith constraint-based methods (Price et al., 2003) the prediction power of the models can beimproved.
In this paper we present the first step towards a systematic biological model of C. glutamicum. A genome-scale metabolic model of the organism is constructed from the annotatedgenome of the wild type strain ATCC 13032, available literature and own experimentalobservations. The model is validated against data found in literature under different conditions suchas different biomass production burdens and growth on different carbon sources.
Materials and Methods
The interconnectivity of metabolites in a network of biological reactions is given by reactionequations defining the stoichiometric conversion of substrates into products for each reaction(Schilling et al., 1999). Reactions are enzymatic reactions converting a substrate into a product, ortransport reactions moving metabolites between different parts of the system, intracellular,extracellular or between different compartments. Active reactions in the biological system arefluxes serving to dissipate or generate metabolites. Following the law of conservation of mass, a
balance describing the reaction rate of a particular metabolite through a particular reaction can bewritten as (Stephanopoulos et al., 1998):
(eq. 1) vS r met ⋅==0
The stoichiometric matrix S is an m x n matrix where m is the number of metabolites and n is the
number of reactions or fluxes taking place within the metabolic network. The vector v refers to thereaction rate of each individual reaction or flux in the metabolic network. Metabolic models usuallyalso include constraints, which will lead to the definition of a solution space in which the solution tothe network equation must lie (Price et al., 2003). Constraints in a model are dealt with byintroducing constraint equations to the metabolic network, which can assign a direction of a givenreaction (reversibility or irreversibility) according to known thermodynamic constraints. Theseequations are typically of the form α i ≤ vi ≤ β i, where α i and β i are the feasible lower and upperlimit of the reaction rate vi, respectively. In practice the upper and lower limits are set to arbitrarilyhigh values when a reaction is reversible without any regulation, whereas α i is set to zero when areaction is irreversible. Constraint reactions can also be used to set a maximum flux through a givenreaction based on biochemical information.
The above described equation system is usually underdetermined due to the fact thatthe number of unknown fluxes exceeds the number of metabolites in the network, leading to anumber of possible solutions, and hence, no unique solution (Bonarius et al., 1997). To cope withthis linear programming/optimization can be used to maximize (or minimize) for a certainmetabolite objective (e.g. growth or product formation) and seeking its maximal (or minimal) valuewithin the stoichiometrically defined domain. This procedure is often referred to as flux-balanceanalysis (Palsson, 2006). In the present paper flux-balance analysis is carried out using linearoptimization, where the objective functions used are optimizing for either growth or lysine
production. Flux-balance analysis was performed using the in-house software BioOptv4.9employing LINDO API for linear optimization. BioOptv4.9 is available by contacting thecorresponding author.
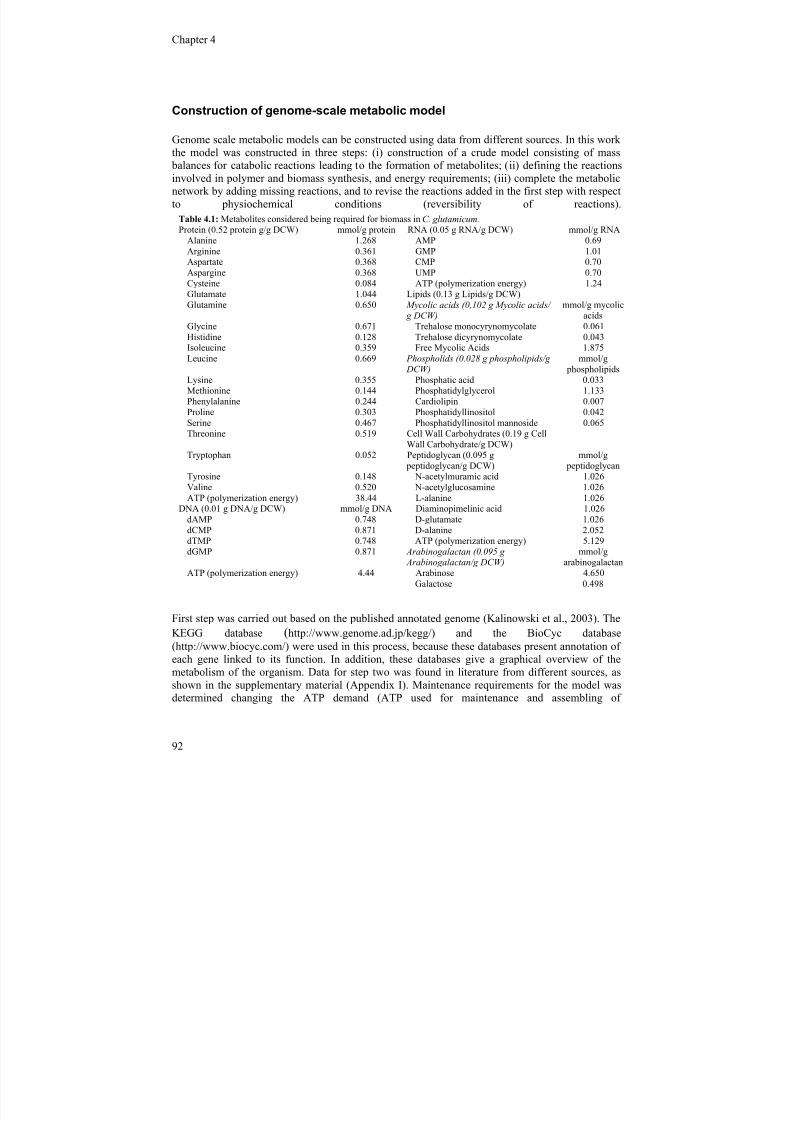
7/18/2019 Samlet PhD 20090416 U-Forside Appendix.pdf
http://slidepdf.com/reader/full/samlet-phd-20090416-u-forside-appendixpdf 90/187
Chapter 4 ________________________________________________________________________________
92
Construction of genome-scale metabolic model
Genome scale metabolic models can be constructed using data from different sources. In this workthe model was constructed in three steps: (i) construction of a crude model consisting of mass
balances for catabolic reactions leading to the formation of metabolites; (ii) defining the reactionsinvolved in polymer and biomass synthesis, and energy requirements; (iii) complete the metabolicnetwork by adding missing reactions, and to revise the reactions added in the first step with respectto physiochemical conditions (reversibility of reactions).
First step was carried out based on the published annotated genome (Kalinowski et al., 2003). TheKEGG database (http://www.genome.ad.jp/kegg/) and the BioCyc database(http://www.biocyc.com/) were used in this process, because these databases present annotation ofeach gene linked to its function. In addition, these databases give a graphical overview of themetabolism of the organism. Data for step two was found in literature from different sources, asshown in the supplementary material (Appendix I). Maintenance requirements for the model wasdetermined changing the ATP demand (ATP used for maintenance and assembling of
Table 4.1: Metabolites considered being required for biomass in C. glutamicum. Protein (0.52 protein g/g DCW) mmol/g protein RNA (0.05 g RNA/g DCW) mmol/g RNA
Alanine 1.268 AMP 0.69Arginine 0.361 GMP 1.01Aspartate 0.368 CMP 0.70
Aspargine 0.368 UMP 0.70Cysteine 0.084 ATP (polymerization energy) 1.24Glutamate 1.044 Lipids (0.13 g Lipids/g DCW)Glutamine 0.650 Mycolic acids (0,102 g Mycolic acids/
g DCW)
mmol/g mycolicacids
Glycine 0.671 Trehalose monocyrynomycolate 0.061Histidine 0.128 Trehalose dicyrynomycolate 0.043Isoleucine 0.359 Free Mycolic Acids 1.875Leucine 0.669 Phospholids (0.028 g phospholipids/g
DCW)mmol/g
phospholipidsLysine 0.355 Phosphatic acid 0.033Methionine 0.144 Phosphatidylglycerol 1.133Phenylalanine 0.244 Cardiolipin 0.007
Proline 0.303 Phosphatidyllinositol 0.042Serine 0.467 Phosphatidyllinositol mannoside 0.065Threonine 0.519 Cell Wall Carbohydrates (0.19 g Cell
Wall Carbohydrate/g DCW)Tryptophan 0.052 Peptidoglycan (0.095 g
peptidoglycan/g DCW)mmol/g
peptidoglycanTyrosine 0.148 N-acetylmuramic acid 1.026Valine 0.520 N-acetylglucosamine 1.026ATP (polymerization energy) 38.44 L-alanine 1.026
DNA (0.01 g DNA/g DCW) mmol/g DNA Diaminopimelinic acid 1.026dAMP 0.748 D-glutamate 1.026dCMP 0.871 D-alanine 2.052dTMP 0.748 ATP (polymerization energy) 5.129
dGMP 0.871 Arabinogalactan (0.095 g Arabinogalactan/g DCW) mmol/garabinogalactan
ATP (polymerization energy) 4.44 Arabinose 4.650Galactose 0.498
7/18/2019 Samlet PhD 20090416 U-Forside Appendix.pdf
http://slidepdf.com/reader/full/samlet-phd-20090416-u-forside-appendixpdf 91/187
In silico Genome-Scale Reconstruction and Validation of the….. ________________________________________________________________________________
93
macromolecules) for maximal biomass yield on substrate (Ysx) fitted experimental values. The thirdstep was done by reviewing biochemical literature for C. glutamicum or by using own unpublishedobservations.The complete model including a list of references used for the re-construction is available as
supplementary files (Appendix I).
Biomass synthesis equations
For genome scale metabolic models the equations defining the biomass synthesis in a genome-scalemodel are important. The biomass-equation consists of reactions converting single molecules intomacromolecules, which are building blocks of the biomass. For each macromolecule an equationwas formulated based on literature, and energy consumption associated with the assemblingreactions was also included (see supplementary material – Appendix I). The representative averaged
biomass composition of a C. glutamicum strain can be seen in table 4.1. Since no data on energyrequirements for polymerization of macromolecules in C. glutamicum could be found, these valueswere approximated using values for E. coli (Ingraham et al., 1983). The macromoleculecomponents were lumped in a final biomass assembly reaction based on their weight fraction of the
biomass. In our model we included protein, DNA, RNA and cell-wall components asmacromolecules. The macromolecular composition of biomass was taken from Cocaign-Bousquetet al., (1996) whereas composition of each macromolecule was taken from different references (seesupplementary material – Appendix II). This same biomass composition was used for all oursimulations.
Macromolecular composition
Data for the amino acid composition of the protein fraction in C. glutamicum was taken fromCocaign-Bousquet et al., (1996). The composition of the DNA was calculated based on G+C-content of the genomic sequence of C. glutamicum ATCC 13032 (Kalinowski et al., 2003). It wasassumed that RNA consisted of 5% mRNA, 75% rRNA and 20% tRNA (molar). The nucleotidecomposition of mRNA was taken as for genomic DNA. The nucleotide composition of rRNA wascalculated from the sequences of 16S, 23S and 5S ribosomal RNA units. And finally tRNAcomposition was found from sequences of leucine and glycine transporting RNAs. Sequences weredownloaded from GenBank (http://www.ncbi.nlm.nih.gov).
The chemical structure of the C. glutamicum cell-wall has been intensively studied and consists of a
complex network of the polysaccharide peptidoglycan covalently linked to another complex polysaccharide arabinogalactan, which is further esterified with mycolic acids (Puerch et al., 2001).Associated with, but not covalently linked to this fraction a number of lipids are also connected tothe cell-wall, the more abundant being phospholipids and trehalose mycolates (Daffé, 2005). Forsimplification the cell-wall components mentioned above have been divided into individual lumpedreactions which are part of the biomass equation based on their fraction.The plasma membrane of C. glutamicum mainly consists of polar lipids, of which phospholipids arethe dominant type. In C. glutamicum the major phospholipids constituents are oleic acid (18:1) and
palmic acid (16:0), which contribute to more than 90% of the lipid pool of the phospholipids(Collins et al., 1982b; Hoischen and Krämer, 1990). In addition to these fatty acids, myristic acid(14:0), pentadecanoic acid (15:0), stearic acid (16:1) and tuberculostearic acid (18:0) are present in
7/18/2019 Samlet PhD 20090416 U-Forside Appendix.pdf
http://slidepdf.com/reader/full/samlet-phd-20090416-u-forside-appendixpdf 92/187
Chapter 4 ________________________________________________________________________________
94
minor quantities (Collins et al., 1982b). Based on the published data of C. glutamicum a lumpedreaction with molar ratios of each individual phospholipid was made.
The stoichiometric equation formation of peptidoglycan was described by a lumped reaction. The
molar composition was estimated based on data from different sources (Daffé, 2005; Keedie andCure, 1978). Also the arabinogalactan fraction was described by a lumped reaction due to itscomplexity. Data used was taken from (Puerch et al., 2001).The mycolic acid synthetic pathway is not well characterized, although some of the genes involvedhave been identified (Brand et al., 2003). Based on structural considerations it has been postulatedthat mycolic acids are synthesised by a condensation and decarboxylation reactions (Daffé, 2005).The “free” mycolic acids are known to form esters with trehalose in order to form mycolates werethe mycolic acids are bound within the cell wall. The majority of the mycolic acid fraction consistsof the 32:2 3OH and 34:1 3OH mycolic acids (Collins et al., 1982a). Other mycylic acids identifiedare 32:0, 34:0, 36:1 and 36:2 (Jang et al., 1997). In general two types of mycolates are considered to
be present in the C. glutamicum cell wall: trehalose monocorynemycolate (TMCM) and trehalose
decorynemycolate (TDCM) (Daffé, 2005), both of which was included in the model. Data fromDaffé (2005) was used to make a lumped reaction for the mycolic acid fraction of the cell.
Energy requirements for growth and maintenance
In addition to the stoichiometry of each individual macromolecule and the overall biomassassembling reaction, the stoichiometry of the growth and non-growth associated energy connectedto biomass is important in a metabolic model. In our model we used the value of 29.2 mmol ATP ·(g biomass)-1 for growth associated ATP demand as estimated by Cocaign-Bousquet et al. (1996)
based on experimentally determined macromolecule composition of C. glutamicum and knownanabolic pathways. ATP demand for growth associated maintenance reactions was found by fittingthe biomass yield to experimental value of 0.61 g biomass· (g glucose)-1 found by Cocaign-Bousquet et al. (1996). ATP requirements for growth were kept constant for biomass synthesis forall simulations, as generally done in flux-balance analysis simulations.
Simulation methods
As mentioned above, linear optimizations were conducted using the BioOptv4.9 software. Split points in the network solutions were checked to see if the results were unique, or if other optima
were possible. Results presented in this paper were unique, unless else is mentioned. The NADPHgenerating reaction catalyzed by malic enzyme (EC 1.1.1.40) and the reaction decarboxylatingoxaloacetate catalysed by oxaloacetate decarboxylase (EC 4.1.1.13) were constrained to zero whenglucose was used as carbon source based on biochemical evidence (Petersen et al., 2000).
Results & Discussion
Reconstruction of the Corynebacterium glutamicum metabolic network:
We constructed a genome scale model of the C. glutamicum metabolic network (for statistics seetable 4.2). The constructed metabolic network consisted of 446 reactions, all of which were unique(iso-enzymes were removed), which represent 15% of the protein encoding genes identified in C.
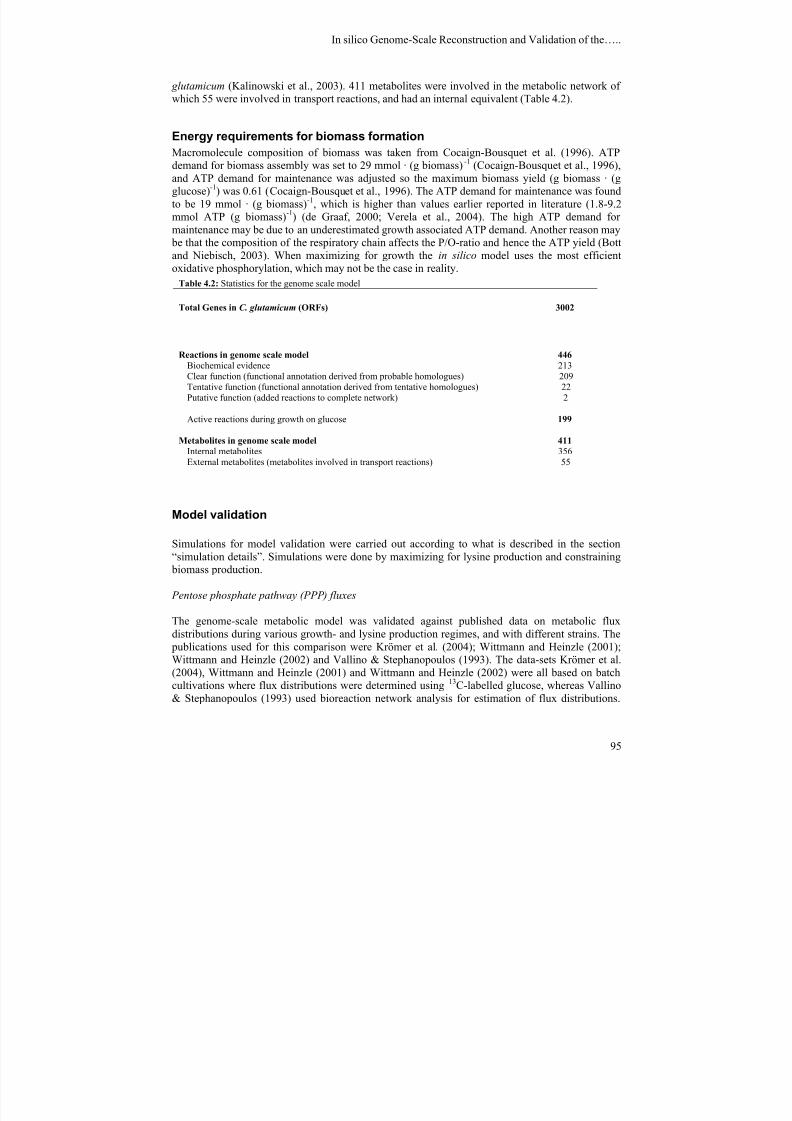
7/18/2019 Samlet PhD 20090416 U-Forside Appendix.pdf
http://slidepdf.com/reader/full/samlet-phd-20090416-u-forside-appendixpdf 93/187
In silico Genome-Scale Reconstruction and Validation of the….. ________________________________________________________________________________
95
glutamicum (Kalinowski et al., 2003). 411 metabolites were involved in the metabolic network ofwhich 55 were involved in transport reactions, and had an internal equivalent (Table 4.2).
Energy requirements for biomass formationMacromolecule composition of biomass was taken from Cocaign-Bousquet et al. (1996). ATPdemand for biomass assembly was set to 29 mmol · (g biomass) -1 (Cocaign-Bousquet et al., 1996),and ATP demand for maintenance was adjusted so the maximum biomass yield (g biomass · (gglucose)-1) was 0.61 (Cocaign-Bousquet et al., 1996). The ATP demand for maintenance was foundto be 19 mmol · (g biomass)-1, which is higher than values earlier reported in literature (1.8-9.2mmol ATP (g biomass)-1) (de Graaf, 2000; Verela et al., 2004). The high ATP demand formaintenance may be due to an underestimated growth associated ATP demand. Another reason may
be that the composition of the respiratory chain affects the P/O-ratio and hence the ATP yield (Bottand Niebisch, 2003). When maximizing for growth the in silico model uses the most efficientoxidative phosphorylation, which may not be the case in reality.
Model validation
Simulations for model validation were carried out according to what is described in the section
“simulation details”. Simulations were done by maximizing for lysine production and constraining biomass production.
Pentose phosphate pathway (PPP) fluxes
The genome-scale metabolic model was validated against published data on metabolic fluxdistributions during various growth- and lysine production regimes, and with different strains. The
publications used for this comparison were Krömer et al. (2004); Wittmann and Heinzle (2001);Wittmann and Heinzle (2002) and Vallino & Stephanopoulos (1993). The data-sets Krömer et al.(2004), Wittmann and Heinzle (2001) and Wittmann and Heinzle (2002) were all based on batchcultivations where flux distributions were determined using 13C-labelled glucose, whereas Vallino& Stephanopoulos (1993) used bioreaction network analysis for estimation of flux distributions.
Table 4.2: Statistics for the genome scale model
Total Genes in C. glutamicum (ORFs) 3002
Reactions in genome scale model 446
Biochemical evidence 213Clear function (functional annotation derived from probable homologues) 209Tentative function (functional annotation derived from tentative homologues) 22Putative function (added reactions to complete network) 2
Active reactions during growth on glucose 199
Metabolites in genome scale model 411 Internal metabolites 356External metabolites (metabolites involved in transport reactions) 55
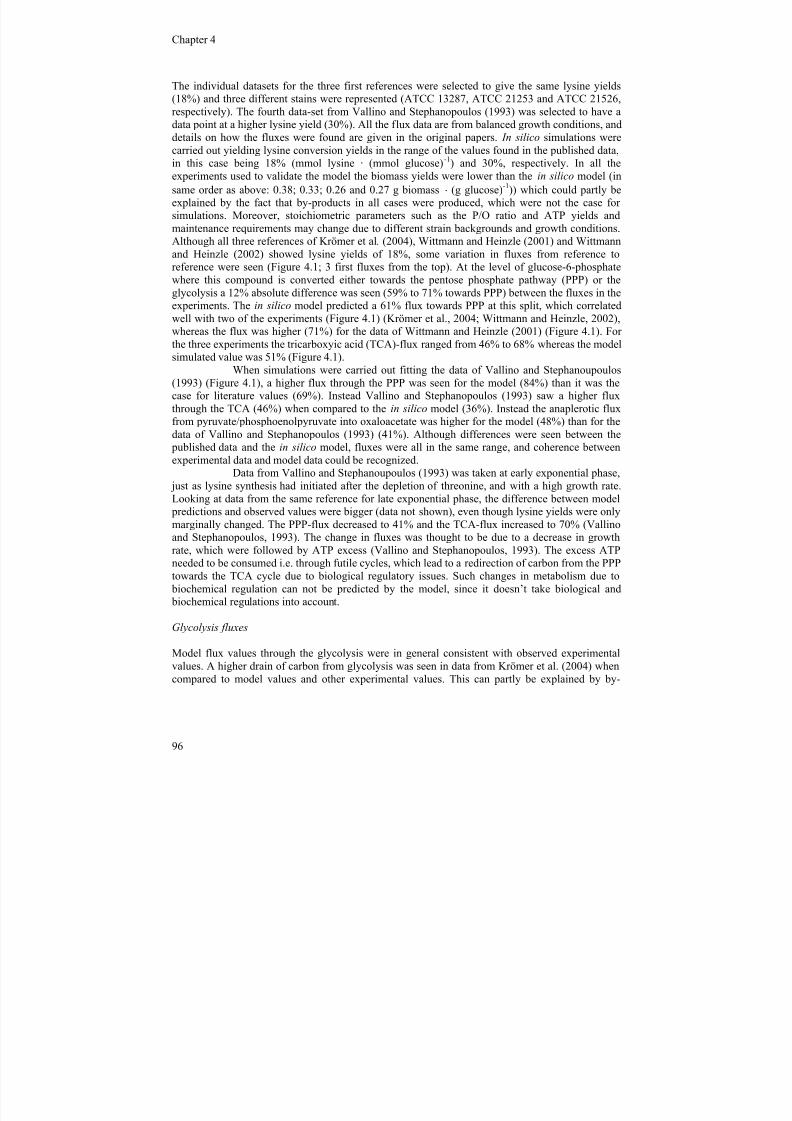
7/18/2019 Samlet PhD 20090416 U-Forside Appendix.pdf
http://slidepdf.com/reader/full/samlet-phd-20090416-u-forside-appendixpdf 94/187
Chapter 4 ________________________________________________________________________________
96
The individual datasets for the three first references were selected to give the same lysine yields(18%) and three different stains were represented (ATCC 13287, ATCC 21253 and ATCC 21526,respectively). The fourth data-set from Vallino and Stephanopoulos (1993) was selected to have adata point at a higher lysine yield (30%). All the flux data are from balanced growth conditions, and
details on how the fluxes were found are given in the original papers. In silico simulations werecarried out yielding lysine conversion yields in the range of the values found in the published data,in this case being 18% (mmol lysine · (mmol glucose)-1) and 30%, respectively. In all theexperiments used to validate the model the biomass yields were lower than the in silico model (insame order as above: 0.38; 0.33; 0.26 and 0.27 g biomass ⋅ (g glucose)-1)) which could partly beexplained by the fact that by-products in all cases were produced, which were not the case forsimulations. Moreover, stoichiometric parameters such as the P/O ratio and ATP yields andmaintenance requirements may change due to different strain backgrounds and growth conditions.Although all three references of Krömer et al. (2004), Wittmann and Heinzle (2001) and Wittmannand Heinzle (2002) showed lysine yields of 18%, some variation in fluxes from reference toreference were seen (Figure 4.1; 3 first fluxes from the top). At the level of glucose-6-phosphate
where this compound is converted either towards the pentose phosphate pathway (PPP) or theglycolysis a 12% absolute difference was seen (59% to 71% towards PPP) between the fluxes in theexperiments. The in silico model predicted a 61% flux towards PPP at this split, which correlatedwell with two of the experiments (Figure 4.1) (Krömer et al., 2004; Wittmann and Heinzle, 2002),whereas the flux was higher (71%) for the data of Wittmann and Heinzle (2001) (Figure 4.1). Forthe three experiments the tricarboxyic acid (TCA)-flux ranged from 46% to 68% whereas the modelsimulated value was 51% (Figure 4.1).
When simulations were carried out fitting the data of Vallino and Stephanoupoulos(1993) (Figure 4.1), a higher flux through the PPP was seen for the model (84%) than it was thecase for literature values (69%). Instead Vallino and Stephanopoulos (1993) saw a higher fluxthrough the TCA (46%) when compared to the in silico model (36%). Instead the anaplerotic fluxfrom pyruvate/phosphoenolpyruvate into oxaloacetate was higher for the model (48%) than for thedata of Vallino and Stephanopoulos (1993) (41%). Although differences were seen between the
published data and the in silico model, fluxes were all in the same range, and coherence betweenexperimental data and model data could be recognized.
Data from Vallino and Stephanoupoulos (1993) was taken at early exponential phase, just as lysine synthesis had initiated after the depletion of threonine, and with a high growth rate.Looking at data from the same reference for late exponential phase, the difference between model
predictions and observed values were bigger (data not shown), even though lysine yields were onlymarginally changed. The PPP-flux decreased to 41% and the TCA-flux increased to 70% (Vallinoand Stephanopoulos, 1993). The change in fluxes was thought to be due to a decrease in growth
rate, which were followed by ATP excess (Vallino and Stephanopoulos, 1993). The excess ATPneeded to be consumed i.e. through futile cycles, which lead to a redirection of carbon from the PPPtowards the TCA cycle due to biological regulatory issues. Such changes in metabolism due to
biochemical regulation can not be predicted by the model, since it doesn’t take biological and biochemical regulations into account.
Glycolysis fluxes
Model flux values through the glycolysis were in general consistent with observed experimentalvalues. A higher drain of carbon from glycolysis was seen in data from Krömer et al. (2004) whencompared to model values and other experimental values. This can partly be explained by by-
7/18/2019 Samlet PhD 20090416 U-Forside Appendix.pdf
http://slidepdf.com/reader/full/samlet-phd-20090416-u-forside-appendixpdf 95/187
In silico Genome-Scale Reconstruction and Validation of the….. ________________________________________________________________________________
97
product formation, where significant amounts of extra-cellular glycerol and dehydroxyacetone phosphate were observed (Krömer et al., 2004).
Relationship between PPP- and TCA-fluxes during lysine production
It is known that the relationship between the TCA and the PPP is important for lysine productionsince a high reaction rate of the PPP is necessary to support NADPH generation when lysinesynthesis is high. A tendency for this correlation can be seen from experimental data from literaturewhen TCA- and PPP-fluxes at different lysine yields are compared (Figure 4.3; symbols), acorrelation which have also been suggested by Kelle et al. (2005). Such a correlation is also
predicted by the model (Figure 4.3; lines). In general the TCA-flux was higher for the experimentalvalues when compared to the model, and the PPP-fluxes for the experimental data presented herewere in most cases lower than values for the corresponding in silico simulations. The reason for thegenerally lower TCA-fluxes for the in silico model when compared to experimental data was thehigher anaplerotic netflux, which from a stoichiometric point of view is optimal for lysine
production. The in silico model will per definition chose this pathway which may not be the case inreality, where biological regulation will affect the operation of the biological network.
A bend of both the TCA-flux and the PPP-flux curves were seen for the in silico fluxdata when lysine yield exceeded 55% (Figure 4.3). At this point a flattening of the curves wasobserved (the TCA-flux decreased at a lower rate and the PPP-flux increased at a lower rate). Thismetabolic change is discussed further in the next section. Some of the differences in fluxdistributions between the experiments mentioned above can probably be explained by differentstrain backgrounds, and different cultivation conditions.
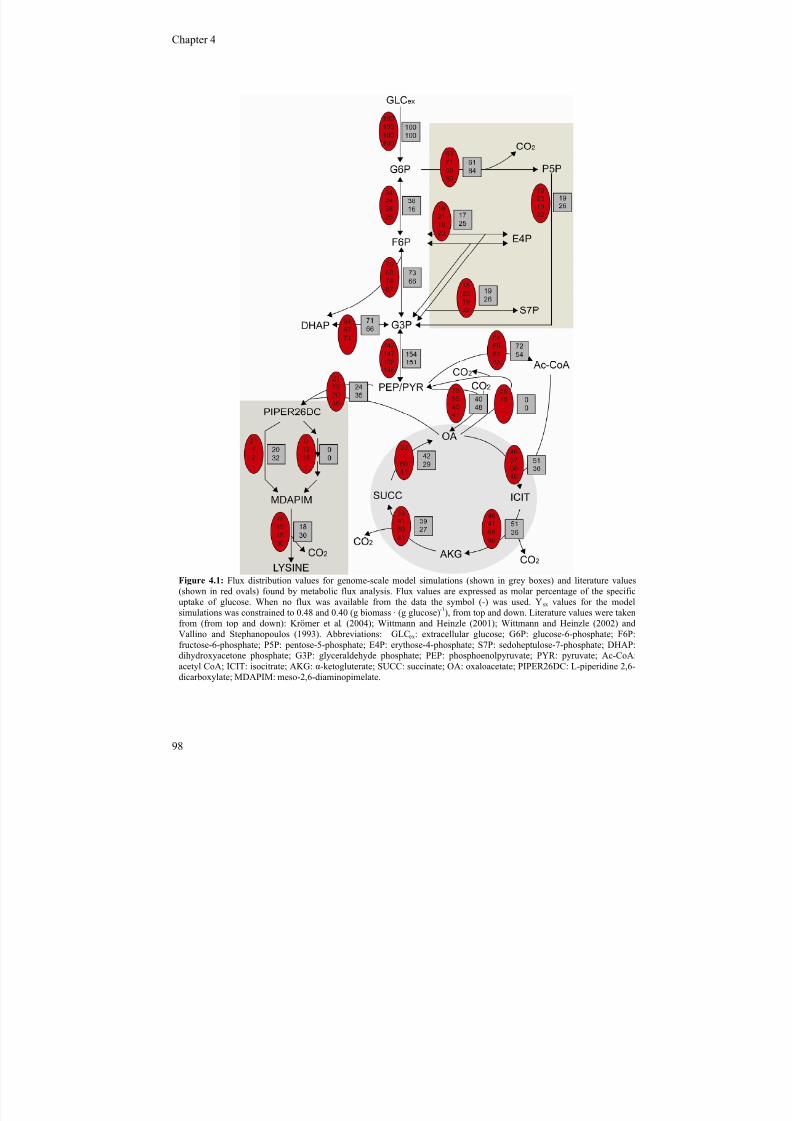
7/18/2019 Samlet PhD 20090416 U-Forside Appendix.pdf
http://slidepdf.com/reader/full/samlet-phd-20090416-u-forside-appendixpdf 96/187
Chapter 4 ________________________________________________________________________________
98
Figure 4.1: Flux distribution values for genome-scale model simulations (shown in grey boxes) and literature values(shown in red ovals) found by metabolic flux analysis. Flux values are expressed as molar percentage of the specificuptake of glucose. When no flux was available from the data the symbol (-) was used. Y sx values for the modelsimulations was constrained to 0.48 and 0.40 (g biomass · (g glucose)-1), from top and down. Literature values were takenfrom (from top and down): Krömer et al. (2004); Wittmann and Heinzle (2001); Wittmann and Heinzle (2002) andVallino and Stephanopoulos (1993). Abbreviations: GLCex: extracellular glucose; G6P: glucose-6-phosphate; F6P:fructose-6-phosphate; P5P: pentose-5-phosphate; E4P: erythose-4-phosphate; S7P: sedoheptulose-7-phosphate; DHAP:dihydroxyacetone phosphate; G3P: glyceraldehyde phosphate; PEP: phosphoenolpyruvate; PYR: pyruvate; Ac-CoA:acetyl CoA; ICIT: isocitrate; AKG: α-ketogluterate; SUCC: succinate; OA: oxaloacetate; PIPER26DC: L-piperidine 2,6-dicarboxylate; MDAPIM: meso-2,6-diaminopimelate.
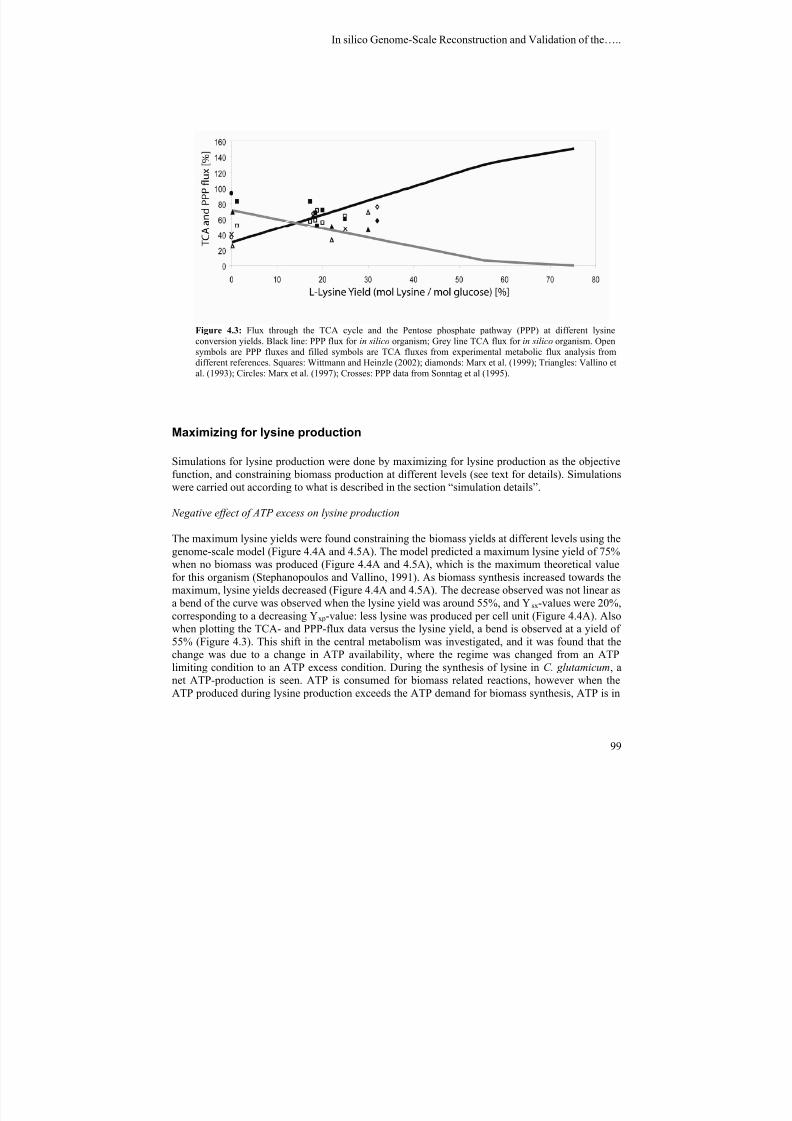
7/18/2019 Samlet PhD 20090416 U-Forside Appendix.pdf
http://slidepdf.com/reader/full/samlet-phd-20090416-u-forside-appendixpdf 97/187
In silico Genome-Scale Reconstruction and Validation of the….. ________________________________________________________________________________
99
Maximizing for lysine production
Simulations for lysine production were done by maximizing for lysine production as the objectivefunction, and constraining biomass production at different levels (see text for details). Simulationswere carried out according to what is described in the section “simulation details”.
Negative effect of ATP excess on lysine production
The maximum lysine yields were found constraining the biomass yields at different levels using the
genome-scale model (Figure 4.4A and 4.5A). The model predicted a maximum lysine yield of 75%when no biomass was produced (Figure 4.4A and 4.5A), which is the maximum theoretical valuefor this organism (Stephanopoulos and Vallino, 1991). As biomass synthesis increased towards themaximum, lysine yields decreased (Figure 4.4A and 4.5A). The decrease observed was not linear asa bend of the curve was observed when the lysine yield was around 55%, and Ysx-values were 20%,corresponding to a decreasing Yxp-value: less lysine was produced per cell unit (Figure 4.4A). Alsowhen plotting the TCA- and PPP-flux data versus the lysine yield, a bend is observed at a yield of55% (Figure 4.3). This shift in the central metabolism was investigated, and it was found that thechange was due to a change in ATP availability, where the regime was changed from an ATPlimiting condition to an ATP excess condition. During the synthesis of lysine in C. glutamicum, anet ATP-production is seen. ATP is consumed for biomass related reactions, however when the
ATP produced during lysine production exceeds the ATP demand for biomass synthesis, ATP is in
Figure 4.3: Flux through the TCA cycle and the Pentose phosphate pathway (PPP) at different lysineconversion yields. Black line: PPP flux for in silico organism; Grey line TCA flux for in silico organism. Opensymbols are PPP fluxes and filled symbols are TCA fluxes from experimental metabolic flux analysis fromdifferent references. Squares: Wittmann and Heinzle (2002); diamonds: Marx et al. (1999); Triangles: Vallino etal. (1993); Circles: Marx et al. (1997); Crosses: PPP data from Sonntag et al (1995).

7/18/2019 Samlet PhD 20090416 U-Forside Appendix.pdf
http://slidepdf.com/reader/full/samlet-phd-20090416-u-forside-appendixpdf 98/187
Chapter 4 ________________________________________________________________________________
100
excess. The way the model copes with this, is to burn ATP in a number of futile cycles, of which anexample can be recognized in figure 4.5A, bottom flux, where a futile cycle between the C 3-pool(pyruvate) and the C4-pool (oxaloacetate) can be recognized with the net reaction of ATP → AMP+ Pi + Pi. This change from ATP limitation to ATP excess changes the regime and hence can
explain the changes observed in figure 4.5A and figure 4.3.
Split in the lysine synthetic pathway and its effect on lysine yield
In the lysine synthesis pathway of C. glutamicum two pathways are possible. Either the directdehydrogenase variant (ddh), or the succinylase variant which involves four reactions (Schrumpf etal., 1991). When using the genome-scale model for maximizing for lysine production the
dehydrogenase variant is always preferred. This is due to the fact that the succinylase variantconsumes the intermediate succinyl-CoA, which is an intermediate of the TCA cycle, requiring thisto be active during lysine synthesis, which is not the case when the dehydrogenase variant is used.The exclusive use of the dehydrogenase variant is however far from reality based on experimentaldata, which shows that both variants most often are used at different ratios. Experiments haveshown that the ratio between the two variants varies between a ratio higher than 2:3 for thesuccinylase variant with values ranging from 67-68% (Sonntag et al., 1993) to 72-89% (Wittmannand Heinzle, 2002), and with the dehydrogenase variant being the dominant pathway with values of63% (Wittmann and Heinzle, 2001) using this pathway. The flux ratio between the two variants waseven shown to change through a fermentation starting with a 72% flux through the dehydrogenasevariant, decreasing to around zero at the end of the fermentation (Sonntag et al., 1993). This
difference in the ratio of these two pathways was also seen for the experiments selected for the
Figure 4.4: Simulation results for in silico model when maximizing for lysine production and constraining biomass production. Results presented as lysine yield (Ysp) as a function of the biomass yield (Ysx) both expressed as percentage. A) In silico model with dehydrogenase branch 100%. B) In silico model with dehydrogenase branchconstrained to zero.
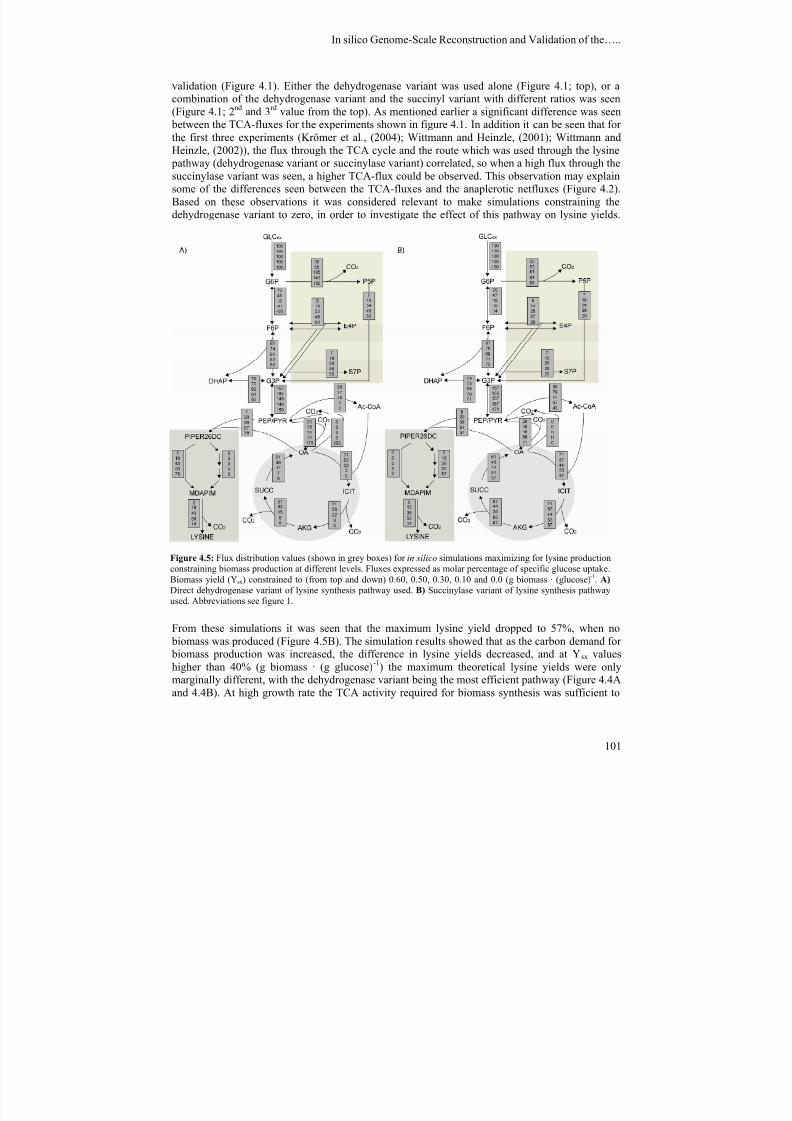
7/18/2019 Samlet PhD 20090416 U-Forside Appendix.pdf
http://slidepdf.com/reader/full/samlet-phd-20090416-u-forside-appendixpdf 99/187
In silico Genome-Scale Reconstruction and Validation of the….. ________________________________________________________________________________
101
Figure 4.5: Flux distribution values (shown in grey boxes) for in silico simulations maximizing for lysine productionconstraining biomass production at different levels. Fluxes expressed as molar percentage of specific glucose uptake.Biomass yield (Ysx) constrained to (from top and down) 0.60, 0.50, 0.30, 0.10 and 0.0 (g biomass · (glucose)-1. A) Direct dehydrogenase variant of lysine synthesis pathway used. B) Succinylase variant of lysine synthesis pathwayused. Abbreviations see figure 1.
validation (Figure 4.1). Either the dehydrogenase variant was used alone (Figure 4.1; top), or acombination of the dehydrogenase variant and the succinyl variant with different ratios was seen(Figure 4.1; 2nd and 3rd value from the top). As mentioned earlier a significant difference was seen
between the TCA-fluxes for the experiments shown in figure 4.1. In addition it can be seen that for
the first three experiments (Krömer et al., (2004); Wittmann and Heinzle, (2001); Wittmann andHeinzle, (2002)), the flux through the TCA cycle and the route which was used through the lysine
pathway (dehydrogenase variant or succinylase variant) correlated, so when a high flux through thesuccinylase variant was seen, a higher TCA-flux could be observed. This observation may explainsome of the differences seen between the TCA-fluxes and the anaplerotic netfluxes (Figure 4.2).Based on these observations it was considered relevant to make simulations constraining thedehydrogenase variant to zero, in order to investigate the effect of this pathway on lysine yields.
From these simulations it was seen that the maximum lysine yield dropped to 57%, when no biomass was produced (Figure 4.5B). The simulation results showed that as the carbon demand for biomass production was increased, the difference in lysine yields decreased, and at Ysx valueshigher than 40% (g biomass · (g glucose)-1) the maximum theoretical lysine yields were onlymarginally different, with the dehydrogenase variant being the most efficient pathway (Figure 4.4A
and 4.4B). At high growth rate the TCA activity required for biomass synthesis was sufficient to
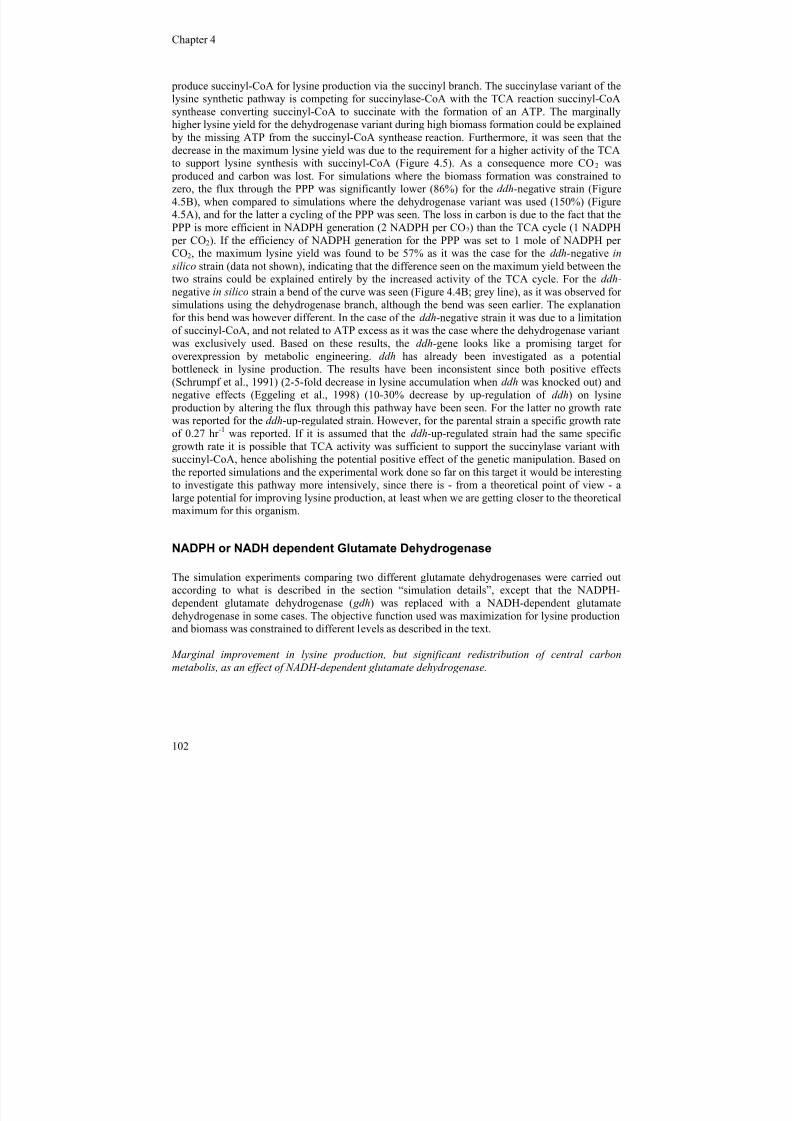
7/18/2019 Samlet PhD 20090416 U-Forside Appendix.pdf
http://slidepdf.com/reader/full/samlet-phd-20090416-u-forside-appendixpdf 100/187
Chapter 4 ________________________________________________________________________________
102
produce succinyl-CoA for lysine production via the succinyl branch. The succinylase variant of thelysine synthetic pathway is competing for succinylase-CoA with the TCA reaction succinyl-CoAsynthease converting succinyl-CoA to succinate with the formation of an ATP. The marginallyhigher lysine yield for the dehydrogenase variant during high biomass formation could be explained
by the missing ATP from the succinyl-CoA synthease reaction. Furthermore, it was seen that thedecrease in the maximum lysine yield was due to the requirement for a higher activity of the TCAto support lysine synthesis with succinyl-CoA (Figure 4.5). As a consequence more CO2 was
produced and carbon was lost. For simulations where the biomass formation was constrained tozero, the flux through the PPP was significantly lower (86%) for the ddh-negative strain (Figure4.5B), when compared to simulations where the dehydrogenase variant was used (150%) (Figure4.5A), and for the latter a cycling of the PPP was seen. The loss in carbon is due to the fact that thePPP is more efficient in NADPH generation (2 NADPH per CO2) than the TCA cycle (1 NADPH
per CO2). If the efficiency of NADPH generation for the PPP was set to 1 mole of NADPH perCO2, the maximum lysine yield was found to be 57% as it was the case for the ddh-negative in
silico strain (data not shown), indicating that the difference seen on the maximum yield between the
two strains could be explained entirely by the increased activity of the TCA cycle. For the ddh-negative in silico strain a bend of the curve was seen (Figure 4.4B; grey line), as it was observed forsimulations using the dehydrogenase branch, although the bend was seen earlier. The explanationfor this bend was however different. In the case of the ddh-negative strain it was due to a limitationof succinyl-CoA, and not related to ATP excess as it was the case where the dehydrogenase variantwas exclusively used. Based on these results, the ddh-gene looks like a promising target foroverexpression by metabolic engineering. ddh has already been investigated as a potential
bottleneck in lysine production. The results have been inconsistent since both positive effects(Schrumpf et al., 1991) (2-5-fold decrease in lysine accumulation when ddh was knocked out) andnegative effects (Eggeling et al., 1998) (10-30% decrease by up-regulation of ddh) on lysine
production by altering the flux through this pathway have been seen. For the latter no growth ratewas reported for the ddh-up-regulated strain. However, for the parental strain a specific growth rateof 0.27 hr -1 was reported. If it is assumed that the ddh-up-regulated strain had the same specificgrowth rate it is possible that TCA activity was sufficient to support the succinylase variant withsuccinyl-CoA, hence abolishing the potential positive effect of the genetic manipulation. Based onthe reported simulations and the experimental work done so far on this target it would be interestingto investigate this pathway more intensively, since there is - from a theoretical point of view - alarge potential for improving lysine production, at least when we are getting closer to the theoreticalmaximum for this organism.
NADPH or NADH dependent Glutamate Dehydrogenase
The simulation experiments comparing two different glutamate dehydrogenases were carried outaccording to what is described in the section “simulation details”, except that the NADPH-dependent glutamate dehydrogenase ( gdh) was replaced with a NADH-dependent glutamatedehydrogenase in some cases. The objective function used was maximization for lysine productionand biomass was constrained to different levels as described in the text.
Marginal improvement in lysine production, but significant redistribution of central carbon
metabolis, as an effect of NADH-dependent glutamate dehydrogenase.
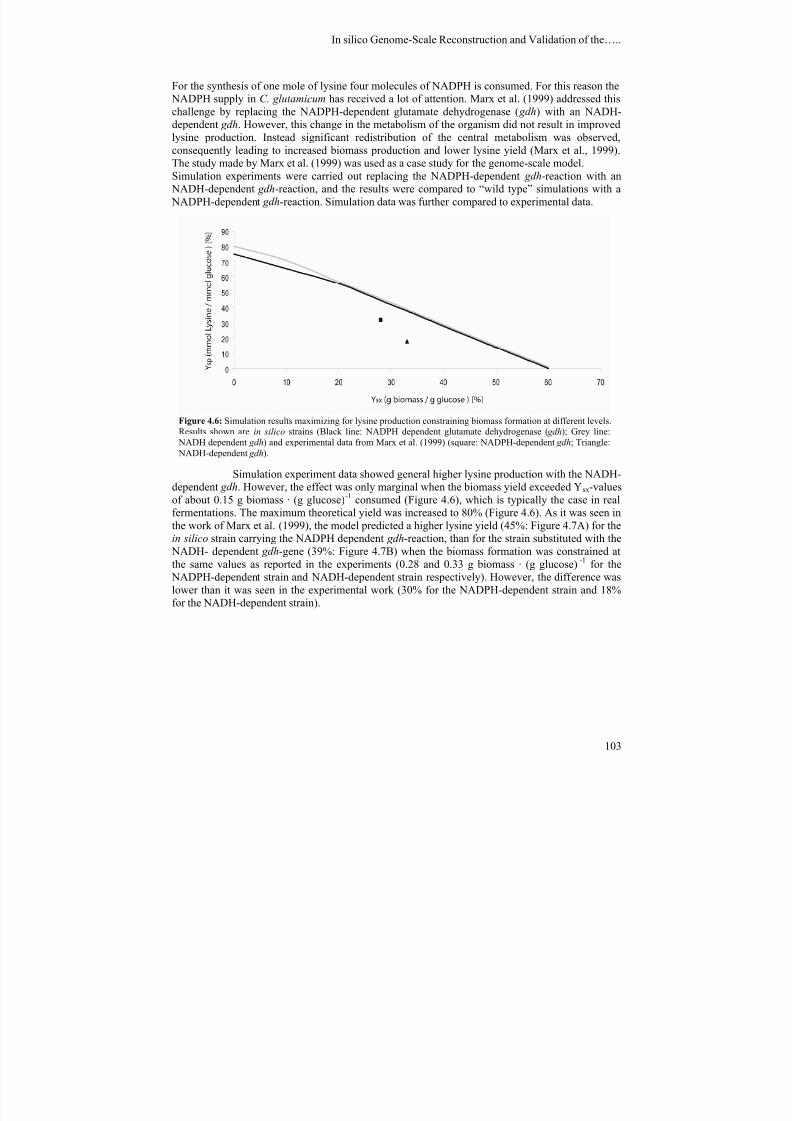
7/18/2019 Samlet PhD 20090416 U-Forside Appendix.pdf
http://slidepdf.com/reader/full/samlet-phd-20090416-u-forside-appendixpdf 101/187
In silico Genome-Scale Reconstruction and Validation of the….. ________________________________________________________________________________
103
For the synthesis of one mole of lysine four molecules of NADPH is consumed. For this reason the NADPH supply in C. glutamicum has received a lot of attention. Marx et al. (1999) addressed thischallenge by replacing the NADPH-dependent glutamate dehydrogenase ( gdh) with an NADH-dependent gdh. However, this change in the metabolism of the organism did not result in improved
lysine production. Instead significant redistribution of the central metabolism was observed,consequently leading to increased biomass production and lower lysine yield (Marx et al., 1999).The study made by Marx et al. (1999) was used as a case study for the genome-scale model.Simulation experiments were carried out replacing the NADPH-dependent gdh-reaction with an
NADH-dependent gdh-reaction, and the results were compared to “wild type” simulations with a NADPH-dependent gdh-reaction. Simulation data was further compared to experimental data.
Simulation experiment data showed general higher lysine production with the NADH-dependent gdh. However, the effect was only marginal when the biomass yield exceeded Ysx-valuesof about 0.15 g biomass · (g glucose)-1 consumed (Figure 4.6), which is typically the case in realfermentations. The maximum theoretical yield was increased to 80% (Figure 4.6). As it was seen inthe work of Marx et al. (1999), the model predicted a higher lysine yield (45%: Figure 4.7A) for thein silico strain carrying the NADPH dependent gdh-reaction, than for the strain substituted with the
NADH- dependent gdh-gene (39%: Figure 4.7B) when the biomass formation was constrained atthe same values as reported in the experiments (0.28 and 0.33 g biomass · (g glucose) -1 for the NADPH-dependent strain and NADH-dependent strain respectively). However, the difference waslower than it was seen in the experimental work (30% for the NADPH-dependent strain and 18%for the NADH-dependent strain).
Figure 4.6: Simulation results maximizing for lysine production constraining biomass formation at different levels.Results shown are in silico strains (Black line: NADPH dependent glutamate dehydrogenase ( gdh); Grey line: NADH dependent gdh) and experimental data from Marx et al. (1999) (square: NADPH-dependent gdh; Triangle: NADH-dependent gdh).
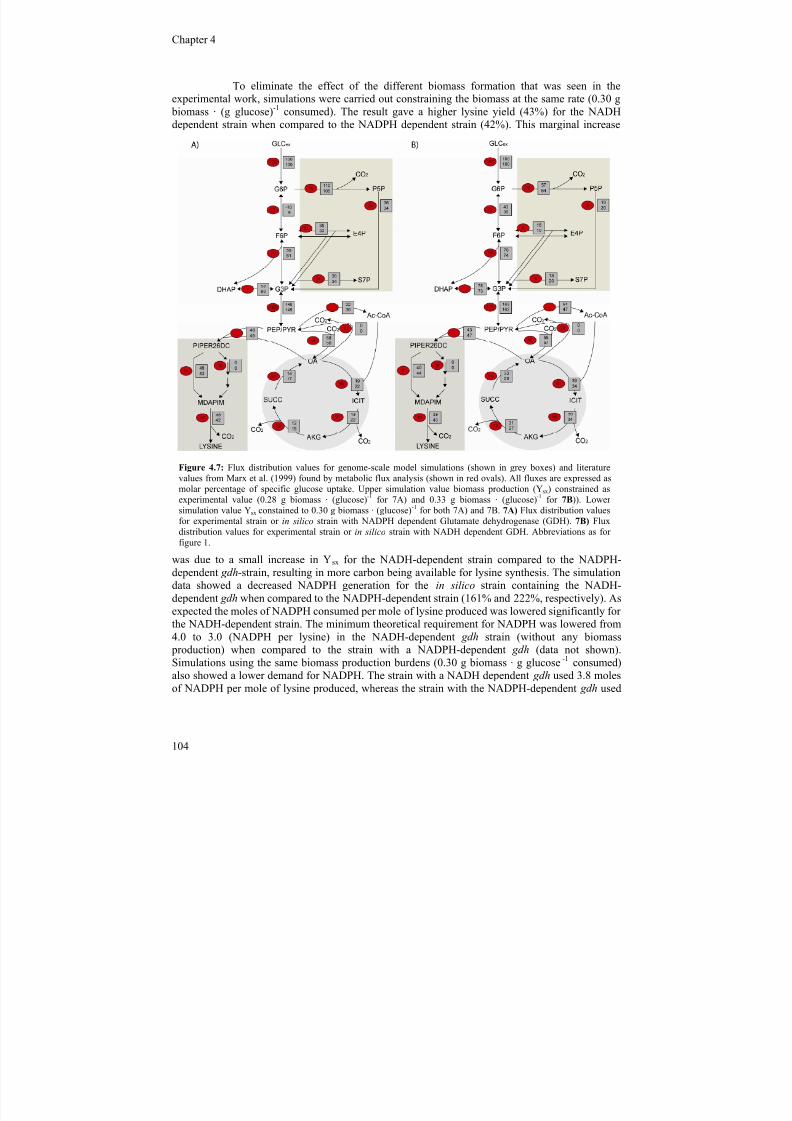
7/18/2019 Samlet PhD 20090416 U-Forside Appendix.pdf
http://slidepdf.com/reader/full/samlet-phd-20090416-u-forside-appendixpdf 102/187
Chapter 4 ________________________________________________________________________________
104
To eliminate the effect of the different biomass formation that was seen in theexperimental work, simulations were carried out constraining the biomass at the same rate (0.30 g
biomass · (g glucose)-1 consumed). The result gave a higher lysine yield (43%) for the NADHdependent strain when compared to the NADPH dependent strain (42%). This marginal increase
was due to a small increase in Ysx for the NADH-dependent strain compared to the NADPH-dependent gdh-strain, resulting in more carbon being available for lysine synthesis. The simulationdata showed a decreased NADPH generation for the in silico strain containing the NADH-dependent gdh when compared to the NADPH-dependent strain (161% and 222%, respectively). Asexpected the moles of NADPH consumed per mole of lysine produced was lowered significantly forthe NADH-dependent strain. The minimum theoretical requirement for NADPH was lowered from4.0 to 3.0 (NADPH per lysine) in the NADH-dependent gdh strain (without any biomass
production) when compared to the strain with a NADPH-dependent gdh (data not shown).Simulations using the same biomass production burdens (0.30 g biomass · g glucose -1 consumed)also showed a lower demand for NADPH. The strain with a NADH dependent gdh used 3.8 moles
of NADPH per mole of lysine produced, whereas the strain with the NADPH-dependent gdh used
Figure 4.7: Flux distribution values for genome-scale model simulations (shown in grey boxes) and literaturevalues from Marx et al. (1999) found by metabolic flux analysis (shown in red ovals). All fluxes are expressed asmolar percentage of specific glucose uptake. Upper simulation value biomass production (Y sx) constrained asexperimental value (0.28 g biomass · (glucose)-1 for 7A) and 0.33 g biomass · (glucose)-1 for 7B)). Lowersimulation value Ysx constained to 0.30 g biomass · (glucose)-1 for both 7A) and 7B. 7A) Flux distribution valuesfor experimental strain or in silico strain with NADPH dependent Glutamate dehydrogenase (GDH). 7B) Fluxdistribution values for experimental strain or in silico strain with NADH dependent GDH. Abbreviations as forfigure 1.
7/18/2019 Samlet PhD 20090416 U-Forside Appendix.pdf
http://slidepdf.com/reader/full/samlet-phd-20090416-u-forside-appendixpdf 103/187
In silico Genome-Scale Reconstruction and Validation of the….. ________________________________________________________________________________
105
5.6 moles of NADPH per mole of lysine. The experimental data from Marx et al. (1999) showed ahigher NADPH demand per mole of lysine produced (7.7 moles per lysine and 6.6 moles per lysinefor the NADH-dependent strain and NADPH-dependent strain, respectively). These higher valueswere due to the relatively low lysine yields as compared to simulations, and the lower NADPH
demand for the NADPH-dependent strain can be explained by the lower flux of metabolites towards biomass formation as compared to the NADH-dependent strain.
In conclusion a significant redistribution of the central metabolism of the in silico
organism is observed as an effect of the substitution of the NADPH-dependent gnd with a NADH-dependent gnd . Although the model is unable to predict the precise change in phenotypic behavior(Increased growth and absolute change in carbon flux distributions), the simulation results aresurprisingly consistent with the results of Marx et al. (1999). In addition the model predicts a higherlysine production with the NADH-dependent gdh strain. However, the improvement is onlymarginal when the biomass yield exceeds 15% of glucose consumption and an improvement onlysine yield is only seen when this is already high (Ysp> 55%) (Figure 4.6). That NADPH is notlimiting on lysine production, and that the central carbon metabolism is able to adjust to NADPH
requirements of the cell is now generally accepted based on experimental studies on the regulationof the PPP (Moritz et al., 2000; Vallino and Stephanopoulos, 1994). It would however be interestingto see if this is also the case when lysine yields approaches the theoretical maximum, and somerecent results have in fact indicated that this is the case, as it was seen by Becker et al. (2005) wheregenetic manipulations leading to an increased PPP-flux resulted in increased lysine production.
Growth of C. glutamicum on lactate and acetate
Simulations for growth on lactate and acetic acid were conducted by maximizing for growth as the
objective function. Simulations were carried out according to what is described in the section“simulation details”, except no constraints were made on the two reactions catalyzed by malicenzyme and oxaloacetate decarboxylase. In some cases constraints were made on individualreactions, which are described in the text.
C. glutamicum is able to grow on various substrates including a number of organicacids such as lactate (Cocaign-Bousquet and Lindley, 1995) and acetate (Wendisch et al., 2000).Simulations were carried out using acetate and lactate as carbon source, and the results werecompared to results found in literature.
Lactate as carbon source
Simulations maximizing for growth was carried out when lactate was used as a carbon source(Figure 4.8). As expected the in silico organism could utilize lactate as a carbon source. Themaximum biomass yield on substrate was 0.54 g biomass · (g lactate)-1, which was lower than whenglucose was used as a substrate (0.61 g biomass · (g glucose)-1). The difference was due to the lowerefficiency in ATP- and NADPH synthesis, when the gluconogenetic pathways were included in themodel. Experimental data for a carbon limited chemostat showed a biomass yield of 0.36 g biomass· (g lactate)-1 (D = 0.17 hr -1) whereas the yield increased as dilution rate was increased (Cocaign-Bousquet and Lindley, 1995). It needs to be emphasized that in the biomass yield calculations made
by Cocaign-Bousquet and Lindley (1995) the pyruvate produced as a byproduct was subtractedfrom the substrate carbon, so the biomass yield on lactate including pyruvate production in realitywas lower. For a dilution rate of 0.28 hr -1 the biomass yield was 0.42 g biomass · (g lactate)-1 (0.3 g
biomass · (g lactate)-1 when pyruvate production was taken into account). At this dilution rate the
7/18/2019 Samlet PhD 20090416 U-Forside Appendix.pdf
http://slidepdf.com/reader/full/samlet-phd-20090416-u-forside-appendixpdf 104/187
Chapter 4 ________________________________________________________________________________
106
chemostat was not carbon limited, and an overflow of pyruvate was seen resulting in excretion ofthis compound. At the organisms maximum growth rate (μ = 0.35 hr -1) a biomass yield of 0.61 g
biomass · (g lactate)-1 (0.4 g biomass · (g lactate)-1 when pyruvate production was included) wasseen, and the efflux of pyruvate was further increased. When comparing experimental data with
simulation data, it was seen that the model data (Figure 4.8; grey boxes) was comparable to the datafor the carbon-limited chemostat with μ = 0.17 hr -1 (Figure 4.8; red ovals 1st flux from the top),whereas for data for the maximum growth rate (μ = 0.35 hr -1), fluxes around phosphoenolpyruvate,
pyruvate, oxaloacetate and malate were significantly different (Figure 4.8; red ovals 2nd flux fromtop). In addition to this an efflux of pyruvate (21% of lactate uptake), and a reduced flux throughthe TCA was observed (Cocaign-Bousquet and Lindley, 1995). Looking more into details of theexperimental data at high growth rates, and hence high substrate uptake rates, growth rate
Figure 4.8: Metabolic flux distribution of C. glutamicum growing on lactate and maximizing for growth. Allfluxes are expressed as molar percentage of the specific uptake rate of lactate. Numbers in red ovals are taken fromCocaign-Bousquet and Lindsley (1995). Upper flux μ = 0.17 hr -1; lower flux μ = 0.35 hr -1. Numbers in grey boxesare results from simulations with in silico organism. LACex: extracellular lactate; PYR ex: extracellular pyruvate.Other abbreviations see figure 1.
7/18/2019 Samlet PhD 20090416 U-Forside Appendix.pdf
http://slidepdf.com/reader/full/samlet-phd-20090416-u-forside-appendixpdf 105/187
In silico Genome-Scale Reconstruction and Validation of the….. ________________________________________________________________________________
107
limitations within the central metabolism were observed (Cocaign-Bousquet and Lindley, 1995).During these conditions some enzymes became rate limiting, and the organism found alternative
pathways which could not be predicted by the model.One major difference between the model and the experimental data was the operation
of an alternative NADPH supply by a cyclic operation of pyruvate carboxylase, coupled to areversed flux through malate dehydrogenase, converting oxaloacetate to malate, and then back to
pyruvate using malic enzyme. The net result of this cycling was the generation of a NADPH usingan ATP and a NADH. This behavior was not predicted by the in silico model. However, when
simulations were carried out constraining the flow of pyruvate limiting the flow towards Ac-CoA asit was seen in the data of Cocaign-Bousquet and Lindley (1995), the same flux patterns could berecognized (data not shown). The maximum biomass yield was decreased to 0.52 g biomass · (glactate)-1 under these conditions. The model could not predict the behavior observed in the
Figure 4.9: Metabolic flux distribution of C. glutamicum growing on acetate and maximizing for growth. All fluxes areexpressed as molar percentage of the specific uptake rate of acetate. Numbers in red ovals are taken from Wendisch et al.(2000). Numbers in grey boxes are results from model simulations. ACex: extracellular acetate. Other abbreviations seefigure 1.
7/18/2019 Samlet PhD 20090416 U-Forside Appendix.pdf
http://slidepdf.com/reader/full/samlet-phd-20090416-u-forside-appendixpdf 106/187
Chapter 4 ________________________________________________________________________________
108
experiment, because this flux distribution is not the most stoichiometrically efficient for the in silico organism. However, in silico model predictions were close to the results obtained in the work ofCocaign-Bousquet and Lindley (1995) when no rate limitations were seen.
Acetate as carbon source
Maximization for growth was simulated during growth on either acetate as single carbon source(Figure 4.9), or during simultaneous acetate and glucose consumption (data not shown). Themaximum biomass yield on acetate (0.48 g biomass · (g acetate) -1) was found to be lower than onglucose (0.61 g biomass · (g glucose)-1), and the glyoxylate shunt was observed to be active. Bothobservations were consistent with experimental data (Wendisch et al., 2000), although biomassyields for the experimental data was lower being 0.24 g biomass · (g acetate)-1 and 0.34 g biomass ·(g glucose)-1 for acetate and glucose respectively.
It was observed that no growth was possible for the in silico organism when theglyoxylate shunt was shut down (data not shown), which was also observed by Wendisch et al.
(2000). During optimal growth the model predicted a flux through the glyoxylate cyclecorresponding to 25% of the substrate uptake (Figure 4.9). This flux was 18% for the experimentaldata of Wendisch et al. (2000). Further investigation of the glyoxylate shunt branch point showed,that when the carbon flux through the glyoxylate shunt was constrained to 18% of the acetateuptake, the biomass yield was lowered to 0.35 g biomass · (g acetate) -1 (data not shown). When thecarbon flux through the glyoxylate shunt was increased by constraining this flux, a decrease in the
biomass yield was seen (data not shown), indicating that the carbon flux predicted by the model istruly a maximum for the in silico organism.
The model predicted that the flux through the PPP was entirely omitted, and NADPHneeded for biomass was solely generated by the isocitrate dehydrogenase reaction, whereas the dataof Wendisch et al. (2000) showed a low flux (4%) through the PPP. When PPP-flux wasconstrained to 4% simultaneously with the glyoxylate shunt constrain above, the biomass yieldfurther decreased to 0.33 g biomass · (g acetate)-1. The TCA-flux was higher for the experimentaldata as it was the case for the model.
Simulations for co-metabolism of acetate and glucose were carried out (data notshown). Wendisch et al. (2000) found that the glyoxylate cycle was active during co-metabolism ofthese two substrates, which was a surprise since this was not seen for E. coli cells grown under thesame conditions (Walsh and Koshland, 1985), and since this pathway is not essential when glucoseis present. The model predicted the same behavior when substrate uptake was constrained at thesame levels (data not shown). However, when the glyoxylate cycle was removed from the modelthe growth yield of the organism was not altered (data not shown), which in practice means that
from a stoichiometric point of view it is insignificant which route is used under the givenconditions. The preferred use of the glyoxylate route in Wendisch et al. (2000) is probably due toacetate specific induction, which earlier has been seen for C. glutamicum during these conditions(Gerstmeier et al., 2003). Anaplerotic fluxes were higher for the experimental data than for themodel, and a significant cycling between C3 and C4 was seen (Figure 4.9) resulting in ananaplerotic netflux of 54% towards the pyruvate/phosphoenolpyruvate pool which was higher thanfor the model (17%) (Figure 4.9).
Conclusions
7/18/2019 Samlet PhD 20090416 U-Forside Appendix.pdf
http://slidepdf.com/reader/full/samlet-phd-20090416-u-forside-appendixpdf 107/187
In silico Genome-Scale Reconstruction and Validation of the….. ________________________________________________________________________________
109
A validated metabolic network of C. glutamicum ATCC 13032 was constructed, and by using flux- balance analysis the in silico model was able to predict metabolic fluxes during lysine productionand growth under various conditions, which were consistent with experimental values. This workalso showed that genome scale metabolic model simulations needs to be combined with data from
other sources, i.e. flux data or transciptomic data, in order to improve the prediction power of themodel. The model was able to predict potential targets for metabolic engineering for improvinglysine production in C. glutamicum, and hence serves as a useful tool for future directing ofmetabolic engineering strategies resulting in improved lysine production. The model also serves asan extensive compendium on C. glutamicum metabolism, and it is our hope that by combining themodel with datasets from high throughput experimental techniques such as transcriptomics,fluxomics and metabolomics, the prediction power of the model can be further improved.
Acknowledgments
Ana Paula Oliveira is acknowledged for help and guidance during model construction and forintroducing the Biooptv4.9 software.
References
Åkesson M, Förster J, Nielsen J. 2004. Integration of gene expression data into genome-scalemetabolic models. Metabolic Engineering 6:285-293.
Becker J, Klopprogge C, Zelder O, Heinzle E, Wittmann C. 2005. Amplified expression of fructose1,6-bisphosphatase in Corynebacterium glutamicum increases in vivo flux through the pentose
phosphate pathway and lysine production on different carbon sources. Applied and EnvironmentalMicrobiology 71:8587-8596.
Bonarius HPJ, Schmid G, Tramper J. 1997. Flux analysis of underdetermined metabolic networks:the quest for the missing constraints. Trends in Biotechnology 15:308-314.
Borodina I, Krabben P, Nielsen J. 2005. Genome-scale analysis of Streptomyces coelicolor A3(2)metabolism. Genome Research 15:820-829.
Bott M, Niebisch A. 2003. The respiratory chain of Corynebacterium glutamicum. Journal ofBiotechnology 104:129-153.
Brand S, Niehaus K, Pühler A, Kalinowski J. 2003. Identification and functional analysis of sixmycolyltransferase genes of Corynebacterium glutamicum ATCC 13032: the genes cop1, cmt1, andcmt2 can replace each other in the synthesis of trehalose dicorynomycolate, a component of themycolic acid layer of the cell envelope. Archives of Microbiology 180:33-44.
Cocaign-Bousquet M, Guyonvarch A, Lindley ND. 1996. Growth rate-dependent modulation ofcarbon flux through central metabolism and the kinetic consequences for glucose-limited chemostatcultures of Corynebacterium glutamicum. Applied and Environmental Microbiology 62:429-436.
7/18/2019 Samlet PhD 20090416 U-Forside Appendix.pdf
http://slidepdf.com/reader/full/samlet-phd-20090416-u-forside-appendixpdf 108/187
Chapter 4 ________________________________________________________________________________
110
Cocaign-Bousquet M, Lindley ND. 1995. Pyruvate overflow and carbon flux within the centralmetabolic pathways of Corynebacterium glutamicum during growth on lactate. Enzyme andMicrobial Technology 17:260-267.
Collins MD, Doodfellow M, Minnikin DE. 1982a. A survey of the structures of mycolic acids inCorynebacterium glutamicum and related taxa. Journal of General Microbiology 128:129-149.
Collins MD, Goodfellow M, Minnikin DE. 1982b. Fatty acid composition of some mycolic acid-containing coryneform bacteria. Journal of General Microbiology 128:2503-2509.
Covert MW, Knight EM, Reed JL, Herrgard MJ, Palsson BØ. 2004. Integrated high-throughput andcomputational data elucidates bacterial networks. Nature 429:92-96.
Cremer J, Eggeling L, Sahm H. 1991. Control of the lysine biosynthesis sequence inCorynebacterium glutamicum as analysed by overexpression of the individual corresponding genes.
Applied and Environmental Microbiology. 57:1746-1752.
Daffé M. 2005. The Cell Envelope of Corynebacteria. In: Eggeling L, Bott M, editors. Handbook ofCorynebacterium glutamicum. Boca Raton: CRC Press. p 121-148.
de Graaf AA. 2000. Metabolic flux analysis of Corynebacterium glutamicum. In: Schügerl K,Bellgard KH, editors. Bioreaction Engineering: modelling and control. Berlin: Springer Verlag. p506-555.
Edwards JS, Ibarra RU, Palsson BØ. 2001. In silico predictions of Escherichia coli metaboliccapabilities are consistent with experimental data. Nature Biotechnology 19:125-130.
Edwards JS, Palsson BØ. 2000. The Escherichia coli MG1655 in silico metabolic genotype: Itsdefinition, characteristics, and capabilities. PNAS 97:5528-5533.
Eggeling L, Oberle S, Sahm H. 1998. Improved L-lysine yield with Corynebacterium glutamicum:use of dapA resulting in increased flux combined with growth limitation. Applied Microbiology andBiotechnology 49:24-30.
Feist AM, Scholten JCM, Palsson BØ, Brockman FJ, Ideker T. 2006. Modelling methanogenesiswith a genome-scale metabolic reconstruction of Methanosarcina barkeri. Molecular Systems
Biology 2:1-14.
Förster J, Famili I, Fu P, Palsson BØ, Nielsen J. 2003. Genome-scale reconstruction of theSaccharomyces cerevisiae metabolic network. Genome Research 13:244-253.
Gerstmeier R, Wendisch VF, Schnicke S, Ruan H, Farwic M, Reinscheid D, Eikmanns BJ. 2003.Acetate metabolism and the regulation in Corynebacterium glutamicum. Journal of Biotechnology104:99-122.
Heinemann M, Kümmel A, Ruinatscha R, Panke S. 2005. In silico genome-scale reconstruction andvalidation of the Staphylococcus aureus metabolic network. Biotechnology and Bioengineering 92:
850-864.
7/18/2019 Samlet PhD 20090416 U-Forside Appendix.pdf
http://slidepdf.com/reader/full/samlet-phd-20090416-u-forside-appendixpdf 109/187
In silico Genome-Scale Reconstruction and Validation of the….. ________________________________________________________________________________
111
Herrgård MJ, Fong SS, and Palsson BØ. 2006. Identification of Genome-scale metabolic networkmodels using experimentally measured flux profiles. PLoS Computationel Biology 2:676-686.
Hoischen C, Krämer R. 1990. Membrane alteration is necessary but not sufficient for effectiveglutamate secretion in Corynebacterium glutamicum. Journal of Bacteriology 172:3409-3416.
Ingraham JL, Maaløe O, Niedhardt FC. 1983. Growth of the Bacterial Cell. Sunderland,Massachusetts: Sinauer Associates, Inc. 435 p.
Jang KH, Pierotti D, Kemp GW, Best GR, Britz ML. 1997. Mycolic acid composition ofCorynebacterium glutamicum and its cell surface mutants: effects of growth with gycine andisonicotinic acid hydrazide. Microbiology UK 143:3209-3221.
Kalinowski J, Bathe B, Bartels D, Bischoff N, Bott M, Burkovski A, Dusch N, Eggeling L,
Eikmanns BJ, Gaigalat L. 2003. The complete Corynebacterium glutamicum ATCC 13032 genomesequence and its impact on the production of -aspartate-derived amino acids and vitamins. Journalof Biotechnology 104:5-25.
Keddie RM, Cure GL. 1978. Cell-wall Compsition of Coryneform Bacteria. In: Bousfield IJ, CalleyAG, editors. Coryneform Bacteria. London: Academic Press. p 47-84.
Kelle R, Hermann T, Bathe B. 2005. L-Lysine Production. In: Eggeling L, Bott, M, editors.Handbook of Corynebacterium glutamicum. Boca Raton: CRC Press. p 465-488.
Krömer JO, Sorgenfrei O, Klopprogge K, Heinzle E, Wittmann C. 2004. In-depth profiling oflysine-producing Corynebacterium glutamicum by combined analysis of the transcriptome,metabolome, and fluxome. Journal of bacteriology 186:1769-1784.
Marx A, de Graaf AA, Wiechert W, Eggeling L, Sahm H. 1996. Determination of the fluxes in thecentral metabolism of Corynebacterium glutamicum by nuclear magnetic resonance spectroscopycombined with metabolite balancing. Biotechnology and Bioengineering 49:111-129.
Marx A, Striegel K, de Graaf AA, Sahm H, Eggeling L. 1997. Response of the central metabolismof Corynebacterium glutamicum to different flux burdens. Biotechnology and Bioengineering56:168-180.
Marx A, Eikmanns BJ, Sahm H, de Graaf AA, Eggeling L. 1999. Response of the centralmetabolism in Corynebacterium glutamicum to the use of an NADH-dependent glutamatedehydrogenase. Metabolic Engineering 1:35-48.
Moritz B, Striegel K, de Graff AA, Sahm H. 2000. Kinetic properties of the glucose-6-phosphateand 6-phosphogluconate dehydrogenases from Corynebacterium glutamicum and their applicationfor predicting pentose phosphate pathway flux in vivo. European Journal of Biochemistry267:3442-3452.
Oliveira AP, Nielsen J. Förster J. 2005. Modelling Lactococcus lactis using a genome-scale flux
model. BMC Microbiology 5:39.
7/18/2019 Samlet PhD 20090416 U-Forside Appendix.pdf
http://slidepdf.com/reader/full/samlet-phd-20090416-u-forside-appendixpdf 110/187
Chapter 4 ________________________________________________________________________________
112
Palsson BØ. 2000. The challenges of in silico biology. Nature Biotechnology 18:1147-1150.
Palsson BØ. 2006 Systems Biology: Properties of Reconstructed Networks. New York: Cambrigde
University Press. 322 p.
Patil KR, Åkesson M, Nielsen J. (2004). Use of genome-scale microbial models for metabolicengineering. Current Opinion in Biotechnology 15:64-69.
Petersen S, de Graff AA, Eggeling L, Mollney M, Wiechert W, Sahn H. 2000. In vivo quantificationof parallel and bidirectional fluxes in the anaplerosis of Corynebacterium glutamicum. Journal ofBiological Chemistry 275:35932-35941.
Price ND, Papin JA, Schilling CH, Palsson BØ. 2003. Genome-scale microbial in silico models: theconstrain-based approach. Trends in Biotechnology 21:162-169.
Puech V, Chami M, Lemassu A, Laneelle MA, Schiffler B, Gounon P, Bayan N, Benz R, Daffé M.2001. Structure of the cell envelope of corynebacteria: importance of the non-covalently boundlipids in the formation of the cell wall permeability barrier and fracture plane. Microbiology147:1365-1382.
Reed JR, Vo TD, Schilling CH, Palsson BØ. 2003. An expanded genome-scale model of Escherichia coli K-12 (iJR904 GSM/GPR). Genome Research 4:R54.
Schilling CH, Covert MW, Famili I, Church GM, Edwards JS, Palsson BØ. 2002. Genome-scalemetabolic model of Helicobacter pylori 26695. Journal of Bacteriology 184:4582-4593.
Schilling CH, Palsson,BØ. 2000. Assessment of the metabolic capabilities of Haemophilus
influenzae Rd through a genome-scale pathway analysis. Journal of Theoretical Biology 203:249-283.
Schilling CH, Schuster S, Palsson BØ, Heinrich R. 1999. Metabolic pathway analysis: basicconcepts and scientific applications in the post-genomic era. Biotechnology Progress 15:296-303.
Schrumpf B, Schwarzer A, Kalinowski J, Pühler A, Eggeling L, Sahn H. 1991. A functionally split pathway for lysine synthesis in Corynebacterium glutamicum. Journal of Bacteriology 173:4510-
4516.
Sonntag K, Eggeling L, de Graaf AA, and Sahm H. 1993. Flux partitioning in the split pathway oflysine synthesis in Corynebacterium glutamicum. Quantification by 13C- and 1H-NMRspectroscopy. European Journal of Biochemistry 213:1325-1331.
Sonntag K, Schwinde JW, de Graaf AA, Marx A, Eikmanns BJ, Wiechert W, Sahm H. 1995. 13C NMR studies of the fluxes in the central metabolism of Corynebacterium glutamicum duringgrowth and overproduction of amino acids in batch cultures. Applied Microbiology andBiotechnology 44:489-495.
7/18/2019 Samlet PhD 20090416 U-Forside Appendix.pdf
http://slidepdf.com/reader/full/samlet-phd-20090416-u-forside-appendixpdf 111/187
In silico Genome-Scale Reconstruction and Validation of the….. ________________________________________________________________________________
113
Stephanopoulos G, Vallino JJ. 1991. Network rigidity and metabolic engineering in metaboliteoverproduction. Science 252:1675-1681.
Stephanopoulos G, Aristidou AA, Nielsen J. 1998. Metabolic Engineering - Principles and
Methodologies. California, San Diego: Academic Press. 725 p.
Strelkov S, Elstermann M, Schomburg D. 2004. Comprehensive analysis of metabolites inCorynebacterium glutamicum by gas chromatography/mass spectromety. Journal of BiologicalChemistry 385:853-861.
Teusink B, Wiersma A, Molenaar D, Francke C, de Vos WM, Siezen RJ, Smid EJ. 2006. Analysisof growth of Lactobacillus plantarum WCFS1 on a complex medium using a genome-scale model.Journal of Biological Chemistry 281:40041-40048.
Vallino JJ, Stephanopoulos G. 1993. Metabolic flux distribution in Corynebacterium glutamicum
during growth and lysine overproduction. Biotechnology and Bioengineering 41:633-646.
Vallino JJ, Stephanopoulos G. 1994. Carbon flux distributions at the glucose 6-phosphate branch point in Corynebacterium glutamicum during lysine overproduction. Biotechnology Progress10:327-334.
Varela CA, Baez ME, Agosin E. 2004. Osmotic stress response: Quantification of cell maintenanceand metabolic fluxes in a lysine-overproducing strain of Corynebacterium glutamicum. Applied andEnvironmental Microbiology 70:4222-4229.
Walsh K, Koshland DE. 1985. Branch point control by the phosphorylation state of isocitratedehydrogenase. Journal of Biological Chemistry 260:8430-8437.
Wendisch VF, de Graaf AA, Sahm H, Eikmanns BJ. 2000. Quantitative determination of metabolicfluxes during co-utilization of two carbon sources: comparative analyses with Corynebacterium
glutamicum during growth on acetate and/or glucose. Journal of Bacteriology 182:3088-3096.
Wittmann C, Heinzle E. 2001. Application of MALDI-TOF MS to lysine-producingCorynebacterium glutamicum: A novel approach for metabolic flux analysis. European Journal ofBiochemistry 268:2441-2455.
Wittmann C, Heinzle E. 2002. Genealogy profiling through strain improvement by using metabolicnetwork analysis: metabolic flux genealogy of several generations of lysine-producingCorynebacteria. Applied and Environmental Microbiology 68:5843-5859.

7/18/2019 Samlet PhD 20090416 U-Forside Appendix.pdf
http://slidepdf.com/reader/full/samlet-phd-20090416-u-forside-appendixpdf 112/187
Chapter 4 ________________________________________________________________________________
114

7/18/2019 Samlet PhD 20090416 U-Forside Appendix.pdf
http://slidepdf.com/reader/full/samlet-phd-20090416-u-forside-appendixpdf 113/187
Comparative analysis of eight metabolic engineering strategies…. ________________________________________________________________________________
115
Chapter 5
5. Comparative analysis of eight metabolic engineering
strategies implemented in an L-lysine producingCorynebacterium glutamicum production strain
(Paper B)
Kjeld Raunkjær Kjeldsen1,2, Jens Nielsen2,3,4
1Center for Microbial Biotechnology, DTU Biosys, Technical University of Denmark, DK-2800
Lyngby, Denmark;2
Agro&Ferm A/S, Limfjordsvej 4, DK-6715 Esbjerg N, Denmark.3 Current address: Department of Chemical and Biological Engineering, Chalmers University ofTechnology, SE-412 95 Gothenburg, Sweden4 Corresponding author; telephone: (+45) 45252696; Fax: (+45) 45884148; E-mail:[email protected]
This manuscript have been submitted for publication in “Metabolic Engineering”

7/18/2019 Samlet PhD 20090416 U-Forside Appendix.pdf
http://slidepdf.com/reader/full/samlet-phd-20090416-u-forside-appendixpdf 114/187
Chapter 5 ________________________________________________________________________________
116
Abstract
Eight different metabolic engineering strategies were evaluated for their ability toimprove the production of lysine in an industrially relevant Corynebacterium glutamicum
production strain. The eight stains constructed for this work were evaluated in fed-batchfermentations under conditions simulating industrial scale fermentation. Over-expression of the two
NADPH generating genes present in the pentose phosphate pathway, zwf and gnd , both resulted inincreased lysine yields of 5% and 6%, respectively, indicating that the co-factor NADPH waslimiting for lysine synthesis in this stain. Over-expression of the genes lysC and pyc both showednegative effects on overall lysine yield with yields of 83% and 89% of the control strain,respectively. No significant effects on overall lysine yields were seen for over-expression of fourgenes located in the lysine synthesis pathway, dapA, dapC , dapF and lysE.
Keywords: Corynebacterium glutamicum; lysine; central carbon metabolism; fed-batch
fermentation
Introduction
Corynebacterium glutamicum is a gram-positive bacterium widely used in the production of amino acids. The amino acid produced in the largest quantity by this bacterium is L-lysine of which the annual production today is about 1,100,000 ton L-lysine,HCl with an expectedincrease in demand of 10% per year. For many years production strains have been improved bymany rounds of undirected mutagenesis followed by screening for increased productivity and yield.However, since the arise of readily available genetic manipulation tools and the publication of thegenome of the C. glutamicum ATCC 13032 type strain (Ikeda and Nakagawa, 2003; Kalinowski etal., 2003) considerable efforts have been made to use metabolic engineering in improving lysine
yields and productivity. A number of succesful examples of metabolic engineering have been presented (Cremer et al., 1990; Cremer et al., 1991; Eggeling et al., 1998; Hartmann et al., 2003;Koffas et al., 2002; Koffas et al, 2003). Due to large commercial interest in lysine and the use of C.
glutamicum as a model organism for studying the central metabolism in actinomycetes thisorganism has been intensively investigated. This has led to a quite unique accumulation ofexperimental information and a list of potential bottlenecks towards the synthesis of lysine.However, strains used in metabolic engineering studies have in many cases been strains withrelatively low lysine production compared to commercial production strains. In this study weinvestigate various previously reported metabolic engineering strategies on the commerciallyrelevant production strain C. glutamicum KK-11, and evaluated the effect of these strategies underrelevant production conditions.
Based on earlier findings eight different genes were selected for metabolicengineering. In all cases the genes were up-regulated. The targets for metabolic engineering wereselected so different parts of the metabolism were engineered (Figure 5.1). Our primary focus wasto study the effect of engineering the central carbon metabolism and the first committed steptowards lysine production, but we also included metabolic engineering targets in the lysine
pathway. It is known that C. glutamicum has a high demand for NADPH for the overproduction oflysine (Moritz et al., 2000; Marx et al., 1999) and a relationship between a high flux through the
NADPH generating pentose phosphate pathway (PPP) and a high lysine production has beenidentified (Kiefer et al., 2004; Wittmann and Heinzle, 2002). Based on this the two genes, gnd and
zwf , responsible for the NADPH generating reactions in this pathway were selected for up-regulation. Pyruvate carboxylase ( pyc) has been found to be the main anaplerotic pathway for lysine
biosynthesis (Park et al., 1997; Peters-Wendisch et al., 1998; Petersen et al., 2000), and increasing
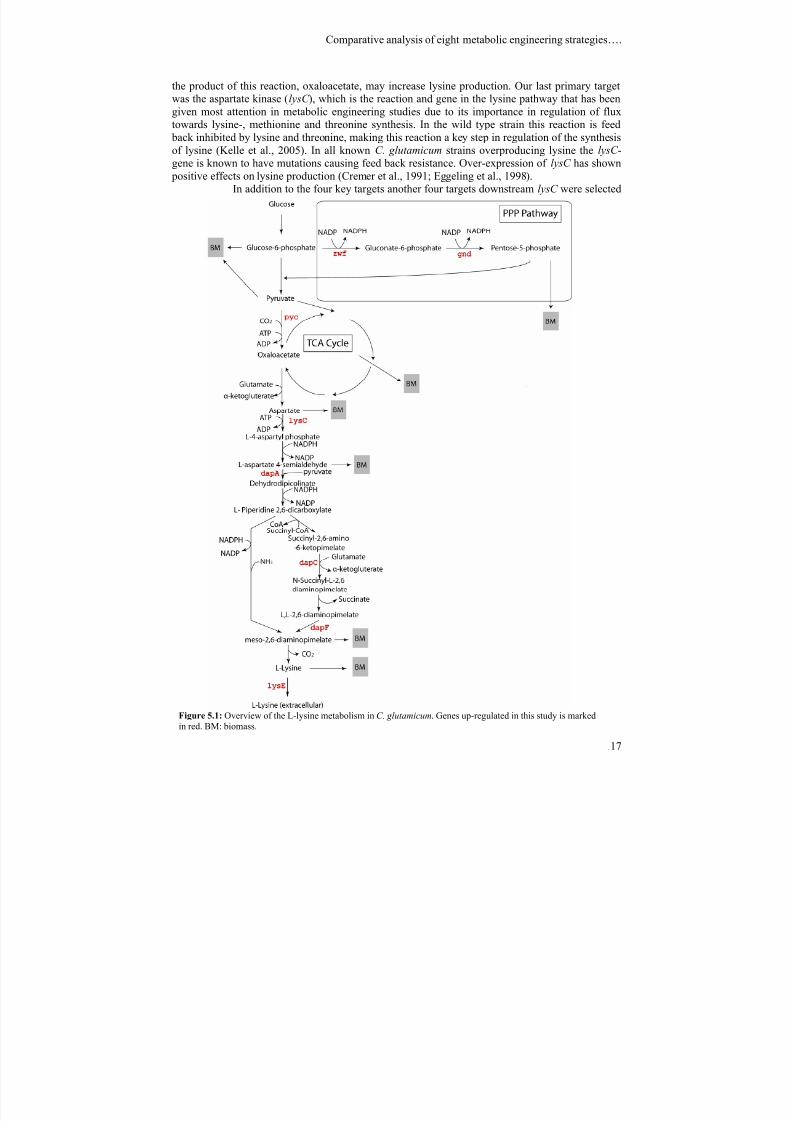
7/18/2019 Samlet PhD 20090416 U-Forside Appendix.pdf
http://slidepdf.com/reader/full/samlet-phd-20090416-u-forside-appendixpdf 115/187
Comparative analysis of eight metabolic engineering strategies…. ________________________________________________________________________________
117
the product of this reaction, oxaloacetate, may increase lysine production. Our last primary targetwas the aspartate kinase (lysC ), which is the reaction and gene in the lysine pathway that has beengiven most attention in metabolic engineering studies due to its importance in regulation of fluxtowards lysine-, methionine and threonine synthesis. In the wild type strain this reaction is feed
back inhibited by lysine and threonine, making this reaction a key step in regulation of the synthesisof lysine (Kelle et al., 2005). In all known C. glutamicum strains overproducing lysine the lysC -gene is known to have mutations causing feed back resistance. Over-expression of lysC has shown
positive effects on lysine production (Cremer et al., 1991; Eggeling et al., 1998).In addition to the four key targets another four targets downstream lysC were selected
Figure 5.1: Overview of the L-lysine metabolism in C. glutamicum. Genes up-regulated in this study is markedin red. BM: biomass.
7/18/2019 Samlet PhD 20090416 U-Forside Appendix.pdf
http://slidepdf.com/reader/full/samlet-phd-20090416-u-forside-appendixpdf 116/187
Chapter 5 ________________________________________________________________________________
118
for metabolic engineering. Dihydrodipicolate synthase (dapA) is another enzyme in the lysinesynthetic pathway which has received attention due to its presence at the split between lysine andhomoserine. Up-regulation of this gene has in some cases led to an increase in lysine production(Cremer et al., 1991; Eggeling et al., 1998). Succinyl-amino-ketopimelate transaminase (dapC ) and
diaminopimelate epimerase (dapF ), two reactions part of the succinylase branch of the lysine pathway, have both been shown as rate limiting in the synthesis of lysine since up-regulation ofeach of these genes gave a positive effect on lysine production (Hartmann et al., 2003). The effluxof lysine from the cytosol of the bacterium is carried out by the transport protein lysine permerase( LysE ) (Vrljic et al., 1996). This exporter is tightly controlled in the wild type strain making this anobvious candidate for optimization of lysine production.
Materials and methods
Bacterial strains and plasmids
The lysine producing strain used in this study was the industrial strain C. glutamicum KK-11. Thisstrain is derived from multiple rounds of mutagenesis and screening from the C. glutamicum wild-type strain ATCC 13032. KK-11 is prototrophic for all amino acids. Electrocompetent C.
glutamicum KK-11 cells were produced following the method of Eggeling and Reyes (2005).Electro competent Escherichia coli DB10B and chemically competent Mach1™-T1R E. coli cells(Invitrogen) were used for initial molecular work. The E.coli – C. glutamicum shuttle vector pEC-XK99E (Tauch et al., 2003) was used for over-expression of individual genes.
Medium
All chemicals used were purchased from either Sigma-Aldrich or VWR International. Forcultivation of E. coli Luria-Bertani (LB) medium (Bertani, 1951) was prepared and added 5 g/Lglucose after sterilization. Solid plates were prepared adding 1.5% agar before sterilization. Whenneeded, kanamycin was added after cooling of the sterilized medium. Medium for pre-cultures of C.
glutamicum was prepared with brain heart infusion (BHI) broth, and 5 g/L glucose. Glucose andBHI broth were sterilized separately (121°C for 15 minutes) and aseptically poured together whencooled. When needed kanamycin and Isopropyl β-D-1-thiogalactopyranoside (IPTG) were added bysterile filtration. Solid plates were prepared by adding 1.5% agar to the BHI broth beforesterilization. Fermentation medium (FM-1) for fed-batch lysine fermentations was preparedcontaining (pr kg of medium): 4.36 g corn steep liquor (CSL) (dry weight), 40 g glucose, 2.5 g(NH4)2SO4, 15.7 g H3PO4, 0.60 g citric acid, 0.90 g KH2PO4, 1.20 g K 2HPO4, 0.63 g MgSO4, 1.13 g
Na2HPO4, 20 mg FeSO4·7 H2O, 20 mg ZnSO4·H2O, 2.20 mg CuSO4·5 H2O. Medium was sterilizedat 121°C for 30 minutes. After sterilization and cooling to 30°C vitamins (4.6 mg thiamine, 1.3 mg
biotin, 11.3 mg calciumpantothenate and 5.7 mg nicotinic acid), 25 mg kanamycin and 0.23 g IPTGwas added by sterile filtration. Feed medium (FM-2) was prepared containing (pr kg of medium):400 g glucose, 4.5 g citric acid, 28.3 g KH2PO4, 4.0 g MgSO4, 4.67 g Na2HPO4, 60 g (NH4)2SO4,100 mg FeSO4·7 H2O, 10 mg ZnSO4·H2O, 10 mg CuSO4·5 H2O, 10 mg NiCl2·6 H2O 18.3 mgCoCl2, 10 mg (NH4)6Mo7O24·4 H2O, 10 mg MnSO4·H2O. Glucose was sterilized separately (121°Cfor 30 minutes) and the rest was sterilized together (121°C for 30 minutes). After cooling the two
parts were aseptically poured together and vitamins (4.6 mg thiamine, 1.3 mg biotin, 11.3 mgcalciumpantothenate and 5.7 mg nicotinic acid), 25 mg kanamycin and 0.23 g IPTG was added bysterile filtration. Shake flask medium (SFM-1) for enzymatic assays was prepared contained (pr kg
of medium): 18 g glucose, 2.5 g CSL (dry weight), 0.45 g H3PO4, 0.61 g citric acid, 1.2 g KH2PO4,
7/18/2019 Samlet PhD 20090416 U-Forside Appendix.pdf
http://slidepdf.com/reader/full/samlet-phd-20090416-u-forside-appendixpdf 117/187
Comparative analysis of eight metabolic engineering strategies…. ________________________________________________________________________________
119
1.0 g K 2SO4, 0.7 g MgSO4, 1.2 g Na2HPO4, 92.4 g MOPS sodium salt, 23.8 mg FeSO4·7 H2O, 15.9mg ZnSO4·H2O, 2.3 mg CuSO4·5 H2O. After serilization (121°C for 15 minutes) 10 g (NH4)2SO4,4.87 mg thiamine, 11.9 mg calciumpantothenate, 6.0 mg nicotinic acid, 1.3 mg biotin, 0.23 g IPTGand 25 mg kanamycin was added by sterile filtration.
Table 5.1: Strains constructed for this work
Strain Host Plasmid Inserted gene Over-expressed Enzyme
KK11-control KK11 pEC-XK99E - -KK11-zwf KK11 pEC-XK99E zwf Glucose-6-phosphate dehydrogenaseKK11-gnd KK11 pEC-XK99E gnd 6-phosphogluconate dehydrogenaseKK11-pyc KK11 pEC-XK99E pyc Pyruvate carboxylaseKK11-lysC KK11 pEC-XK99E lysC Aspartate kinaseKK11-dapA KK11 pEC-XK99E dapA Dihydrodipicolate synthaseKK11-dapC KK11 pEC-XK99E dapC Succinyl-amino-ketopimelate
transaminaseKK11-dapF KK11 pEC-XK99E dapF Diaminopimelate epimeraseKK11-lysE KK11 pEC-XK99E lysE Lysine permerase
Construction of plasmids and C. glutamicum strains
Standard protocols were used for the construction and analysis of plasmid DNA. Purification ofchromosomal DNA from C. glutamicum was performed by the following method: 5 mL ofovernight culture (BHI broth) was harvested by centrifugation. Supernatant was carefully removedand discharged using a pipette. Pellet was washed dissolving the pellet in TE-buffer (pH 7.6)followed by centrifugation (13,000 g). Supernatant was carefully removed. Pellet was dissolved in 1ml TE-buffer (pH 7.6) containing 15 mg/mL lysozyme followed by incubation for 180 minutes at37°C. 3 ml TE-buffer (pH 8.2) containing 400 mM NaCl, 220 μL 10% SDS and 3 mg proteinase Kwas added, and tubes were incubated for 300 minutes at 50°C. After ended incubation 1 mLsaturated NaCl solution (approximately 6 M) was added. Solution was vortexed for 2 minutes
before it was centrifuged for 15 minutes at 13,000 g. Supernatant was carefully transferred to aclean Eppendorf tube and DNA was precipitated adding 0.5 mL 3 M sodium acetate (pH 5.2) and16.5 mL 96% ethanol, incubated at -20°C for 30 minutes followed by 30 minutes of centrifugationat maximum speed. Supernatant was carefully removed and discarded pellet was air-dried before it
was dissolved in 200 μL TE-buffer (pH 7.6). For each of the 8 genes selected for this study (Table5.1) a PCR was carried out containing: 1x High Fidelity PCR Buffer (Invitrogen), 10 mM dNTP, 2mM MgSO4, 0.2 μM of each primer (Table 5.2), 1 μL chromosomal DNA from C. glutamicum KK-11, 1 unit Platinum® Taq High Fidelity polymerase (invitrogen), autoclaved distilled water to 50μL. PCR was carried out using the following conditions: 95°C 2 min; 95°C 30 s, 64°C 30 s, 68°C 4minutes for 5 cycles; 95°C 30 s, 60°C 30 s, 68°C 4 min for 5 cycles; 95°C 30 s, 56°C 30 s, 68°C 4min for 10 cycles; 95°C 30 s, 52°C 30 s, 68°C 4 min for 10 cycles; 68°C 10 min. The blunt endPCR products were added T-overhangs adding one unit of Taq polymerase (Invitrogen) directly intothe PCR-tube and incubating for 10 minutes at 72°C. PCR fragments were ligated into a TOPO® vector using TOPO pCR ®2.1-TOPO® Kit (Invitrogen) and the vector was introduced intochemically competent Mach1™-T1R E. coli cells (Invitrogen). Two independent positive colonies
were selected and grown in LB medium and plasmid DNA was purified using JETstar (Genomed).

7/18/2019 Samlet PhD 20090416 U-Forside Appendix.pdf
http://slidepdf.com/reader/full/samlet-phd-20090416-u-forside-appendixpdf 118/187
Chapter 5 ________________________________________________________________________________
120
Plasmid DNA was shipped to sequencing (MWG Biotech, Germany). That no mutations hadoccurred during PCR was confirmed by analyzing two independent clones. PCR fragments were cutout and purified using the GFX PCR DNA and Gel Band Purification kit (Amersham Biosciences)and ligated into the plasmid pEC-XK99E using T4 DNA ligase (Invitrogen). Transformation was
carried out using 15 μL electro competent E. coli DB10B (Invitrogen) which was transferred to anicecold 0.2 mm cuvette. 10 μL pEC-XK99E ligation-mix was added to the cells and the mix wasincubated at ice for 5 minutes before electroporation (25 μF, 200Ω, 2500V). Immediately afterelectroporation the cuvette was placed on ice and 0.5 mL LB medium was added. Cells wereincubated at 37°C for 60 minutes before cells were plated on LB plates with 50 mg/L kanamycinand incubated over night at 37°C. Presence of gene-products in plasmids was confirmed by PCRusing the following method: Cell material from a colony was transferred to a PCR tube before areaction mix was added containing 1 x PCR buffer, 2.5 mM MgCl2, 0.2 mM dNTP, 0.5 μM of each
primer, 2.5 U Taq Polymerase (Invitrogen) and autoclaved water to a final volume of 100 μl. PCRwas carried out using the following conditions: 94°C 5 min; 94°C 30 s, 55°C 30 s, 72°C 30 s for 25cycles; 72°C 10 min for 1 cycle. Plasmid DNA purification was conducted on transformants
incubated over night (37°C, 200 rpm) in LB medium with 50 mg/L kanamycin. GFX Micro PlasmidPrep Kit (GE Healthcare) was used for the purification. The purified plasmids were introduced to C.
glutamicum using the following method. 150 μL elektrocompetent C. glutamicum (Eggeling andReyes, 2005) was added 10 μL purified pEC-XK99E from E. coli and the protocol from Eggelingand Ryes (2005) was followed. After electroporation cells were plated on BHI agar containing 91g/L sorbitol and 15 mg/L kanamycin. Plates were incubated at 30 °C until visible colonies wereseen. Presence of gene-products in the vector was confirmed by PCR as described earlier.
Table 5.2: Primer sequences designed for amplification of genes from strain KK11, and added nucleotides at the 5’-endfor convenient restriction sites. Underlined nucleotides are introduced restriction sites.
Primer Sequence
EcoRI-lysC -F 5’-gaattcgtggccctggtcgtacagaaat -3’SmaI-lysC -R 3’-cccgggttagcgtccggtgcctgcataa-5’EcoRI-dapC -F 5’-gaattcatgacctctcgcaccccgcttg-3’SmaI-dapC -R 3’-cccgggttagctcaggcgagaaacaaag-5’EcoRI-dapA-F 5’-gaattcatgagcacaggtttaacagcta-3’SmaI-dapA-R 3’-cccgggttatagaactccagcttttttc-5’EcoRI- gnd -F 5’-gaattcatgccgtcaagtacgatcaata-3’SmaI- gnd -R 3’-cccgggttaagcttcaacctcggagcgg-5’EcoRI-lysE -F 5’-gaattcatggaaatcttcattacaggtc-3’SmaI-lysE -R 3’-cccgggctaacccatcaacatcagtttg-5’
MfeI-dapF -F 5’-caattggtgaatttgaccatcccctttg-3’SmaI-dapF -R 3’-cccgggttagatctgcacctcaccgagt-5’MfeI- zwf -F 5’-caattggtgagcacaaacacgaccccct-3’SmaI- zwf -R 3’-cccgggttatggcctgcgccaggtgtga-5’MfeI- pyc-F 5’-caattggtgtcgactcacacatcttcaa-3’EcoRV- pyc-R 3’-gatatcttaggaaacgacgacgatcaag-5’
L-Lysine production in 7 L fermentor

7/18/2019 Samlet PhD 20090416 U-Forside Appendix.pdf
http://slidepdf.com/reader/full/samlet-phd-20090416-u-forside-appendixpdf 119/187
Comparative analysis of eight metabolic engineering strategies…. ________________________________________________________________________________
121
Fermentations were carried out with 2.0 kg medium as initial amount; the temperature was kept at30°C. During the batch phase agitation was controlled at 800 rpm. The Fed-batch phase wasinitiated when all glucose in the batch medium was consumed. Agitation and aeration wascontrolled so dissolved oxygen was kept > 20% throughout the whole fermentation. pH was
controlled at 7.0 by NH4OH (25%) addition. The sugar feeding rate was kept constant and theglucose concentrations never exceeded 5 g/kg. Weight of the fermenter, sugar feed and NH4OHwere monitored online.
Sampling and sample processing
Medium samples were periodically taken for measurement of sugar, lysine and optical density.Samples were taken with intervals ranging from 4-6 hours. Sample amount was 20-30 g. Lysine,glucose and biomass removed from the bioreactor was taken into account in the yield calculations.Biomass concentration was determined by measuring OD620 assuming OD620 ⋅ 3.9-1 g biomass (drycell weight) · kg-1. Culture samples were centrifuged and separated in supernatant and biomass
samples and stored at -20°C until further analysis.
Glucose
The glucose concentrations in the supernatant were measured by HPLC. Separation of sugars wasachieved using a CarboPac PA 1 column 4 × 50 mm (Dionex Corporation, USA) as precolumnfollowed by a CarboPac PA 1 column 40 × 250 mm (Dionex , USA) with 160 mM NaOH as mobile
phase. Detection and quantification was performed with an amperometric impulse-detector(Electrochemical detector ED 50 Dionex, Germany).
Lysine
Samples for amino acid analysis were first processed by extraction of 1 g supernatant in 10 mL 0.1M HCl for 5 minutes while stirred by a magnetic stirrer. The sample was then added 5 mL 5-sulfosalicylic acid (6% w/v) and stirred for another 5 minutes before centrifugation at 4000 g in 10minutes. An appropriate amount of the supernatant was transferred to a container where pH wasadjusted to 2.20 ± 0.02 with 1 M NaOH. The sample was transferred to a 25 mL volumetric flaskwhich was filled using sodium citrate loading buffer (0.20 M, pH 2.20) (Biochrom Ltd., CambrigdeScience Park, England). The sample was filtrated through a 0.22-μm pore size filter, diluted ifnecessary and loaded on a Biochrom 30 (Biochrom, Ltd., Cambrigde Science Park, England).Amino acids were separated using a pH gradient on a Oxidised Hydrolysate Column (Biochrom,
Ltd., Cambrigde Science Park, England) and detection was carried out by a postcolumn derivatizedwith ninhydrin reagent followed by measuring absorbance at 440 (proline) or 570 nm (all otheramino acids).
Enzyme assays
The activity of the enzymes glucose-6-phosphate dehydrogenase, 6-phosphogluconatedehydrogenase, pyruvate carboxylase and aspartate kinase was determined on cell extracts ofhomogenized cells. Cells were grown in 100 mL medium (SFM-1) in a 500 mL baffled shake-flask(30°C, 200 rpm) and harvested at the late exponential phase (~OD620 = 20) by centrifugation. Cellswere washed twice with Tris-HCl buffer (pH and concentration depending on the assay). Cells wereresuspended in 5 mL Tris-HCl buffer and transferred to a DT-20 Ultra Turrax tube, and the sample
was homogenized on an IKA Ultra Turrax Tube Drive (IKA-Werke, Staufen, Germany) for 5
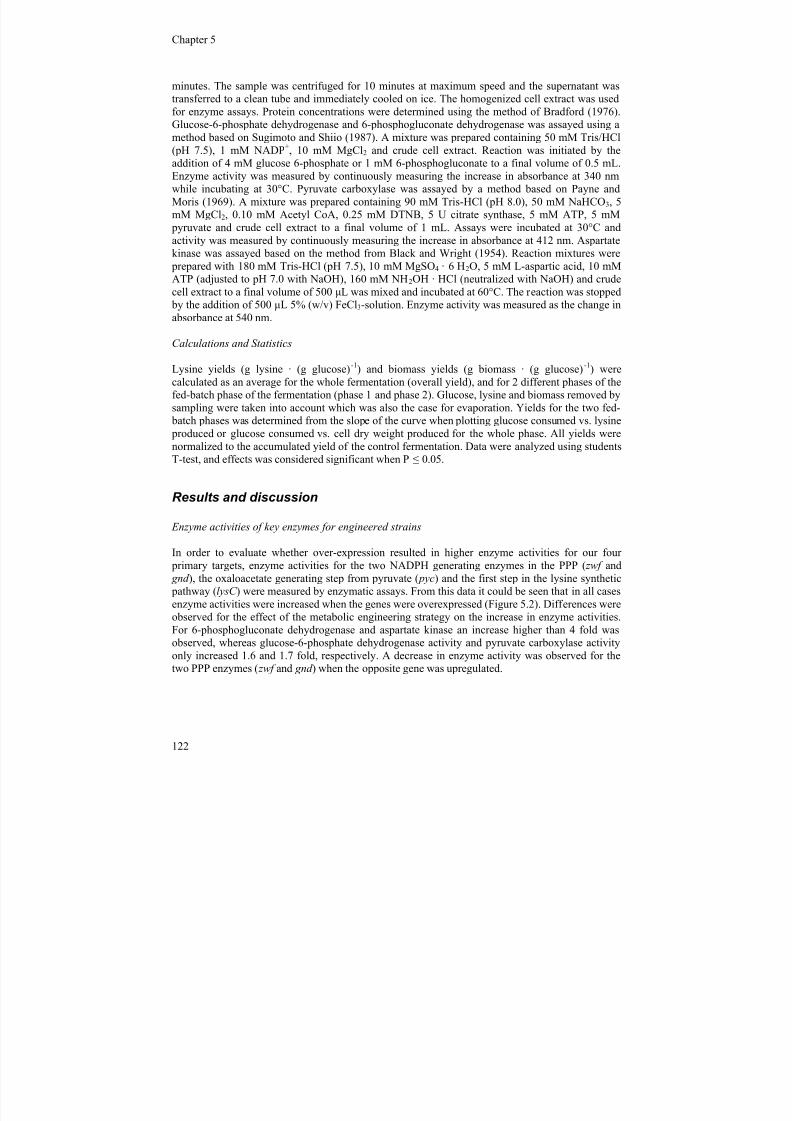
7/18/2019 Samlet PhD 20090416 U-Forside Appendix.pdf
http://slidepdf.com/reader/full/samlet-phd-20090416-u-forside-appendixpdf 120/187
Chapter 5 ________________________________________________________________________________
122
minutes. The sample was centrifuged for 10 minutes at maximum speed and the supernatant wastransferred to a clean tube and immediately cooled on ice. The homogenized cell extract was usedfor enzyme assays. Protein concentrations were determined using the method of Bradford (1976).Glucose-6-phosphate dehydrogenase and 6-phosphogluconate dehydrogenase was assayed using a
method based on Sugimoto and Shiio (1987). A mixture was prepared containing 50 mM Tris/HCl(pH 7.5), 1 mM NADP+, 10 mM MgCl2 and crude cell extract. Reaction was initiated by theaddition of 4 mM glucose 6-phosphate or 1 mM 6-phosphogluconate to a final volume of 0.5 mL.Enzyme activity was measured by continuously measuring the increase in absorbance at 340 nmwhile incubating at 30°C. Pyruvate carboxylase was assayed by a method based on Payne andMoris (1969). A mixture was prepared containing 90 mM Tris-HCl (pH 8.0), 50 mM NaHCO3, 5mM MgCl2, 0.10 mM Acetyl CoA, 0.25 mM DTNB, 5 U citrate synthase, 5 mM ATP, 5 mM
pyruvate and crude cell extract to a final volume of 1 mL. Assays were incubated at 30°C andactivity was measured by continuously measuring the increase in absorbance at 412 nm. Aspartatekinase was assayed based on the method from Black and Wright (1954). Reaction mixtures were
prepared with 180 mM Tris-HCl (pH 7.5), 10 mM MgSO4 · 6 H2O, 5 mM L-aspartic acid, 10 mM
ATP (adjusted to pH 7.0 with NaOH), 160 mM NH2OH · HCl (neutralized with NaOH) and crudecell extract to a final volume of 500 μL was mixed and incubated at 60°C. The reaction was stopped
by the addition of 500 μL 5% (w/v) FeCl3-solution. Enzyme activity was measured as the change inabsorbance at 540 nm.
Calculations and Statistics
Lysine yields (g lysine · (g glucose)-1) and biomass yields (g biomass · (g glucose)-1) werecalculated as an average for the whole fermentation (overall yield), and for 2 different phases of thefed-batch phase of the fermentation (phase 1 and phase 2). Glucose, lysine and biomass removed bysampling were taken into account which was also the case for evaporation. Yields for the two fed-
batch phases was determined from the slope of the curve when plotting glucose consumed vs. lysine produced or glucose consumed vs. cell dry weight produced for the whole phase. All yields werenormalized to the accumulated yield of the control fermentation. Data were analyzed using studentsT-test, and effects was considered significant when P ≤ 0.05.
Results and discussion
Enzyme activities of key enzymes for engineered strains
In order to evaluate whether over-expression resulted in higher enzyme activities for our four primary targets, enzyme activities for the two NADPH generating enzymes in the PPP ( zwf and gnd ), the oxaloacetate generating step from pyruvate ( pyc) and the first step in the lysine synthetic pathway (lysC ) were measured by enzymatic assays. From this data it could be seen that in all casesenzyme activities were increased when the genes were overexpressed (Figure 5.2). Differences wereobserved for the effect of the metabolic engineering strategy on the increase in enzyme activities.For 6-phosphogluconate dehydrogenase and aspartate kinase an increase higher than 4 fold wasobserved, whereas glucose-6-phosphate dehydrogenase activity and pyruvate carboxylase activityonly increased 1.6 and 1.7 fold, respectively. A decrease in enzyme activity was observed for thetwo PPP enzymes ( zwf and gnd ) when the opposite gene was upregulated.
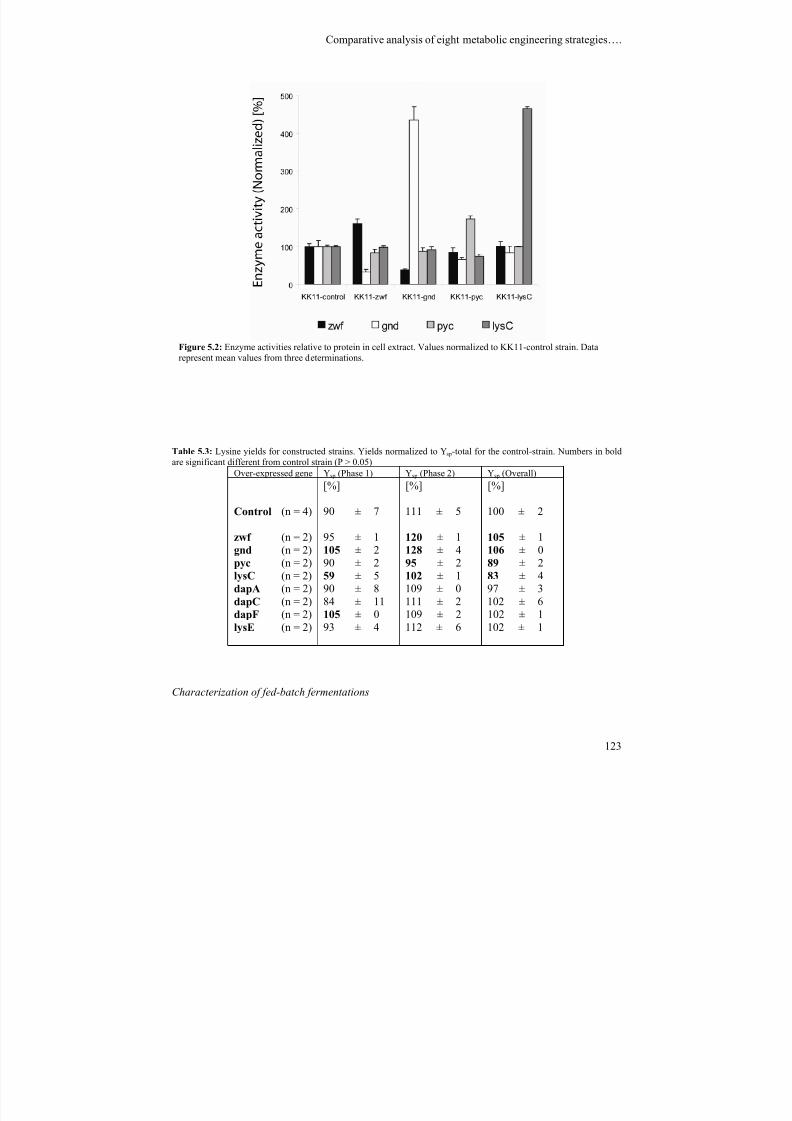
7/18/2019 Samlet PhD 20090416 U-Forside Appendix.pdf
http://slidepdf.com/reader/full/samlet-phd-20090416-u-forside-appendixpdf 121/187
Comparative analysis of eight metabolic engineering strategies…. ________________________________________________________________________________
123
Table 5.3: Lysine yields for constructed strains. Yields normalized to Ysp-total for the control-strain. Numbers in boldare significant different from control strain (P > 0.05)
Over-expressed gene Ysp (Phase 1) Ysp (Phase 2) Ysp (Overall)
[%] [%] [%]
Control (n = 4) 90 ± 7 111 ± 5 100 ± 2
zwf (n = 2) 95 ± 1 120 ± 1 105 ± 1
gnd (n = 2) 105 ± 2 128 ± 4 106 ± 0pyc (n = 2) 90 ± 2 95 ± 2 89 ± 2lysC (n = 2) 59 ± 5 102 ± 1 83 ± 4dapA (n = 2) 90 ± 8 109 ± 0 97 ± 3dapC (n = 2) 84 ± 11 111 ± 2 102 ± 6dapF (n = 2) 105 ± 0 109 ± 2 102 ± 1lysE (n = 2) 93 ± 4 112 ± 6 102 ± 1
Characterization of fed-batch fermentations
Figure 5.2: Enzyme activities relative to protein in cell extract. Values normalized to KK11-control strain. Datarepresent mean values from three determinations.
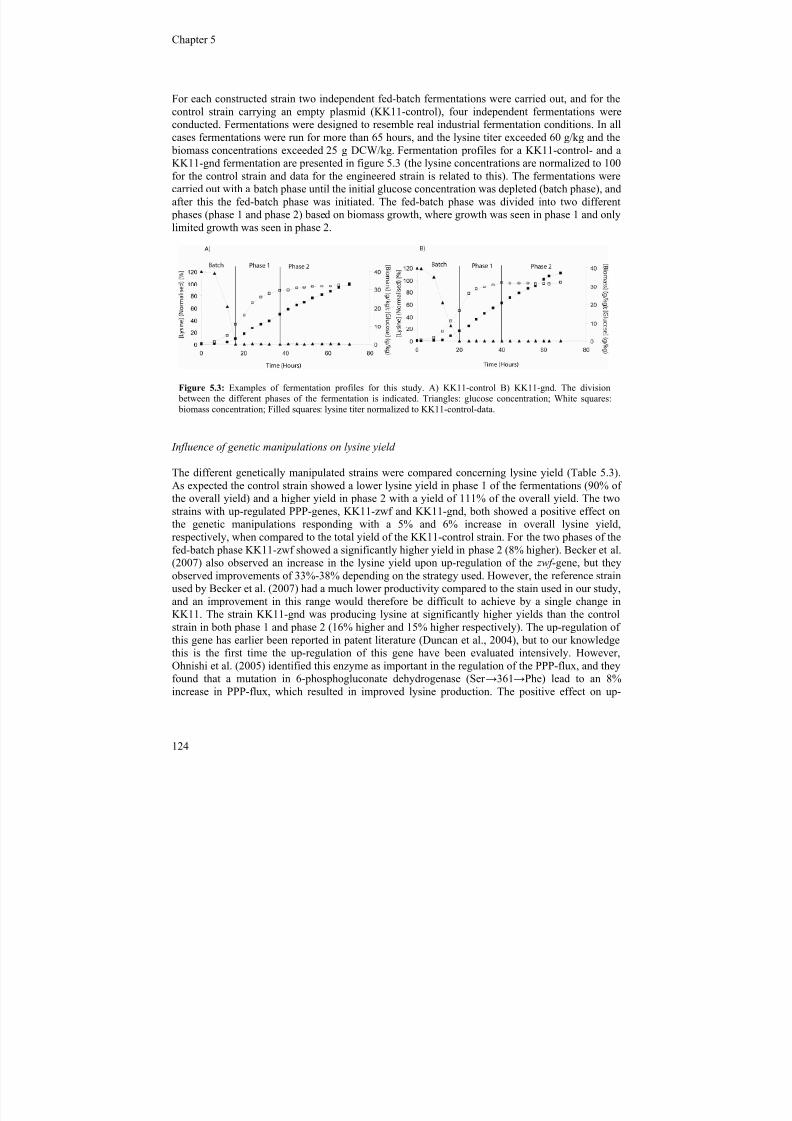
7/18/2019 Samlet PhD 20090416 U-Forside Appendix.pdf
http://slidepdf.com/reader/full/samlet-phd-20090416-u-forside-appendixpdf 122/187
Chapter 5 ________________________________________________________________________________
124
For each constructed strain two independent fed-batch fermentations were carried out, and for thecontrol strain carrying an empty plasmid (KK11-control), four independent fermentations wereconducted. Fermentations were designed to resemble real industrial fermentation conditions. In all
cases fermentations were run for more than 65 hours, and the lysine titer exceeded 60 g/kg and the biomass concentrations exceeded 25 g DCW/kg. Fermentation profiles for a KK11-control- and aKK11-gnd fermentation are presented in figure 5.3 (the lysine concentrations are normalized to 100for the control strain and data for the engineered strain is related to this). The fermentations werecarried out with a batch phase until the initial glucose concentration was depleted (batch phase), andafter this the fed-batch phase was initiated. The fed-batch phase was divided into two different
phases (phase 1 and phase 2) based on biomass growth, where growth was seen in phase 1 and onlylimited growth was seen in phase 2.
Influence of genetic manipulations on lysine yield
The different genetically manipulated strains were compared concerning lysine yield (Table 5.3).As expected the control strain showed a lower lysine yield in phase 1 of the fermentations (90% ofthe overall yield) and a higher yield in phase 2 with a yield of 111% of the overall yield. The twostrains with up-regulated PPP-genes, KK11-zwf and KK11-gnd, both showed a positive effect onthe genetic manipulations responding with a 5% and 6% increase in overall lysine yield,respectively, when compared to the total yield of the KK11-control strain. For the two phases of the
fed-batch phase KK11-zwf showed a significantly higher yield in phase 2 (8% higher). Becker et al.(2007) also observed an increase in the lysine yield upon up-regulation of the zwf -gene, but theyobserved improvements of 33%-38% depending on the strategy used. However, the reference strainused by Becker et al. (2007) had a much lower productivity compared to the stain used in our study,and an improvement in this range would therefore be difficult to achieve by a single change inKK11. The strain KK11-gnd was producing lysine at significantly higher yields than the controlstrain in both phase 1 and phase 2 (16% higher and 15% higher respectively). The up-regulation ofthis gene has earlier been reported in patent literature (Duncan et al., 2004), but to our knowledgethis is the first time the up-regulation of this gene have been evaluated intensively. However,Ohnishi et al. (2005) identified this enzyme as important in the regulation of the PPP-flux, and theyfound that a mutation in 6-phosphogluconate dehydrogenase (Ser →361→Phe) lead to an 8%
increase in PPP-flux, which resulted in improved lysine production. The positive effect on up-
Figure 5.3: Examples of fermentation profiles for this study. A) KK11-control B) KK11-gnd. The division between the different phases of the fermentation is indicated. Triangles: glucose concentration; White squares: biomass concentration; Filled squares: lysine titer normalized to KK11-control-data.
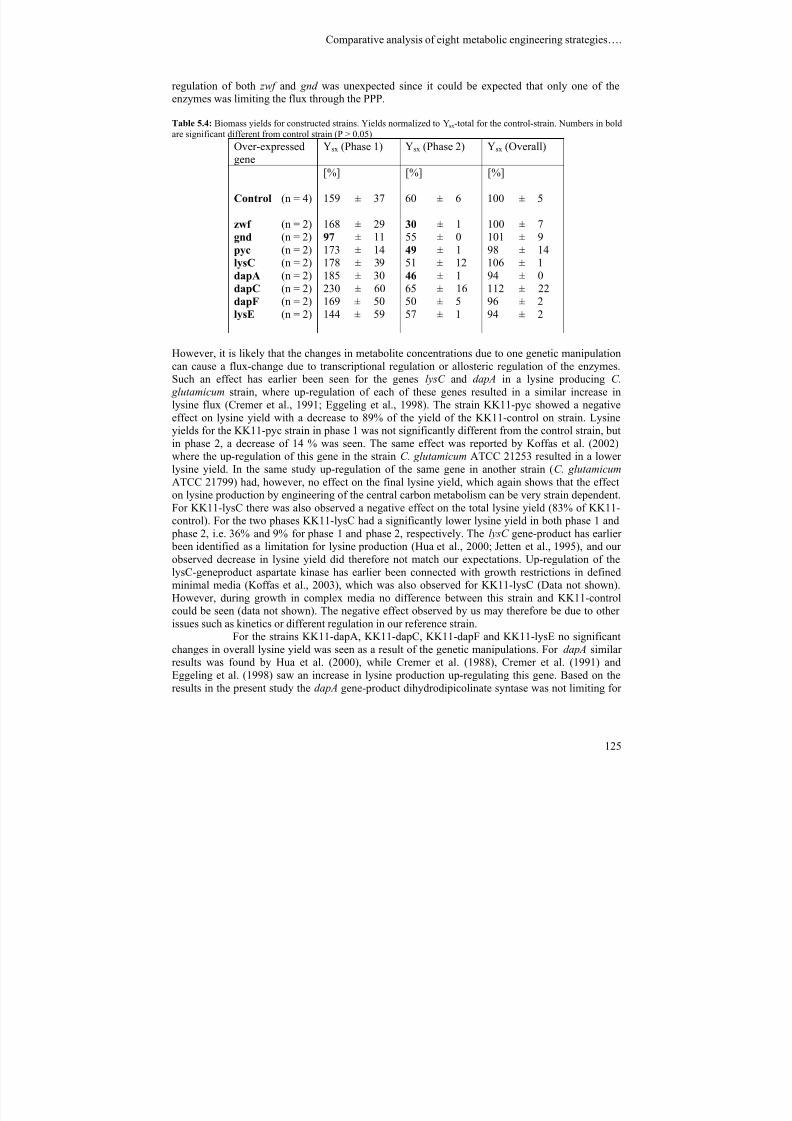
7/18/2019 Samlet PhD 20090416 U-Forside Appendix.pdf
http://slidepdf.com/reader/full/samlet-phd-20090416-u-forside-appendixpdf 123/187
Comparative analysis of eight metabolic engineering strategies…. ________________________________________________________________________________
125
regulation of both zwf and gnd was unexpected since it could be expected that only one of theenzymes was limiting the flux through the PPP.
Table 5.4: Biomass yields for constructed strains. Yields normalized to Ysx-total for the control-strain. Numbers in bold
are significant different from control strain (P > 0.05)Over-expressedgene
Ysx (Phase 1) Ysx (Phase 2) Ysx (Overall)
[%] [%] [%]
Control (n = 4) 159 ± 37 60 ± 6 100 ± 5
zwf (n = 2) 168 ± 29 30 ± 1 100 ± 7gnd (n = 2) 97 ± 11 55 ± 0 101 ± 9pyc (n = 2) 173 ± 14 49 ± 1 98 ± 14lysC (n = 2) 178 ± 39 51 ± 12 106 ± 1
dapA (n = 2) 185 ± 30 46 ± 1 94 ± 0dapC (n = 2) 230 ± 60 65 ± 16 112 ± 22dapF (n = 2) 169 ± 50 50 ± 5 96 ± 2lysE (n = 2) 144 ± 59 57 ± 1 94 ± 2
However, it is likely that the changes in metabolite concentrations due to one genetic manipulationcan cause a flux-change due to transcriptional regulation or allosteric regulation of the enzymes.Such an effect has earlier been seen for the genes lysC and dapA in a lysine producing C.
glutamicum strain, where up-regulation of each of these genes resulted in a similar increase inlysine flux (Cremer et al., 1991; Eggeling et al., 1998). The strain KK11-pyc showed a negative
effect on lysine yield with a decrease to 89% of the yield of the KK11-control on strain. Lysineyields for the KK11-pyc strain in phase 1 was not significantly different from the control strain, butin phase 2, a decrease of 14 % was seen. The same effect was reported by Koffas et al. (2002)where the up-regulation of this gene in the strain C. glutamicum ATCC 21253 resulted in a lowerlysine yield. In the same study up-regulation of the same gene in another strain (C. glutamicum ATCC 21799) had, however, no effect on the final lysine yield, which again shows that the effecton lysine production by engineering of the central carbon metabolism can be very strain dependent.For KK11-lysC there was also observed a negative effect on the total lysine yield (83% of KK11-control). For the two phases KK11-lysC had a significantly lower lysine yield in both phase 1 and
phase 2, i.e. 36% and 9% for phase 1 and phase 2, respectively. The lysC gene-product has earlier been identified as a limitation for lysine production (Hua et al., 2000; Jetten et al., 1995), and ourobserved decrease in lysine yield did therefore not match our expectations. Up-regulation of thelysC-geneproduct aspartate kinase has earlier been connected with growth restrictions in definedminimal media (Koffas et al., 2003), which was also observed for KK11-lysC (Data not shown).However, during growth in complex media no difference between this strain and KK11-controlcould be seen (data not shown). The negative effect observed by us may therefore be due to otherissues such as kinetics or different regulation in our reference strain.
For the strains KK11-dapA, KK11-dapC, KK11-dapF and KK11-lysE no significantchanges in overall lysine yield was seen as a result of the genetic manipulations. For dapA similarresults was found by Hua et al. (2000), while Cremer et al. (1988), Cremer et al. (1991) andEggeling et al. (1998) saw an increase in lysine production up-regulating this gene. Based on the
results in the present study the dapA gene-product dihydrodipicolinate syntase was not limiting for
7/18/2019 Samlet PhD 20090416 U-Forside Appendix.pdf
http://slidepdf.com/reader/full/samlet-phd-20090416-u-forside-appendixpdf 124/187
Chapter 5 ________________________________________________________________________________
126
lysine production in KK11. KK11-dapF showed an increase in lysine yield in phase 1 of 16%, whileno positive effect was seen for phase 2. The positive effect in phase 1 could be confirmed by thedata of Hartmann et al. (2003). Here a positive effect of up-regulation of dapF in a shake-flaskexperiment was seen (13% higher lysine titer). That no effect was seen in phase 2 can be connected
to the lower biomass production in this part of the fermentation (Ysx = 169 for phase 1 and 50 for phase 2). When the carbon flux towards growth is decreased drain from the TCA cycle necessary tosupport biomass is lowered. During this phase it can be expected that the TCA flux is lowered, asseen for simulations with an in silico model of C. glutamicum (Kjeldsen & Nielsen, 2008), and theavailability of succinyl-CoA, an intermediate in both the TCA cycle and in the succinylase branchof the lysine synthesis pathway, is decreased. In this case another reaction in the lysine pathway
becomes limiting and the effect of overexpression of dapF is abolished. For the dapC geneHartmann et al. (2003) saw a positive effect on lysine production on up-regulation of this gene in alysine producing strain. Such an effect was not seen in KK11 on up-regulation of dapC , which isalso part of the succinylase branch suggesting that this step is not limiting in the succinylase branchin KK11. No effect was seen on lysine yields on up-regulating lysE indicating that the lysine export
capacity of KK11 is sufficient under the conditions in this study.
Influence of genetic manipulations on biomass yield
The biomass yield for KK11-control showed a higher yield for phase 1 (159%) than for phase 2(60%) when compared to the biomass yield for the whole fermentation (Table 5.4). This was ageneral observation for all the strains except for KK11-gnd, for which the biomass yield in phase 1and the total biomass yield were similar. For the biomass yield for the whole fermentation nosignificant differences were seen between the strains in which enzymes had been up-regulated andthe reference strain KK11-control. For the two phases of the fermentation a lower biomass yieldwas seen for KK11-gnd in phase 1 (39% lower than KK11-control). In phase 2 the biomass yieldsof the strains KK11-zwf, KK11-pyc and KK11-dapA were significant lower than the KK11-controlstrain (59%, 18% and 23% lower, respectively). The low biomass yield in phase 1 for strain KK11-gnd could indicate a higher flux towards PPP, limiting growth due to a lower TCA flux. This sameeffect was not seen in phase 1 when zwf was up-regulated, but instead it was observed in phase 2where the biomass yield was lower compared to KK11-control. A similar effect was observed byBecker et al. (2007) when zwf was up-regulated. An up-regulation of dapA has earlier been seen todecrease the flux towards biomass due to a decreased flux towards threonine and methionine(Eggeling et al., 1998). A decrease in biomass yield in the later phase of the fermentation could berecognized in the present study when dapA was up-regulated. This decrease was not followed by ansignificant increase in lysine yield. An increased level of the pyc gene-product pyruvate carboxylase
has in some cases shown higher biomass levels (Koffas et al., 2002; Koffas et al., 2003). This wasnot the case when pyc was up-regulated in KK11-control. Instead a decrease was seen in the later phase of the fermentation. No effect on biomass yield was seen for KK11-lysE.
Correlation between biomass yield and lysine yield
A clear correlation between the biomass yield and the lysine yield was seen for the data of all thefermentations (Figure 5.4). It could be recognized that the biomass yield was decreasing when thelysine yield was increasing, which indicates that carbon was redirected from biomass synthesis tolysine production. A similar correlation was predicted by simulations of a genome scale metabolicmodel (Kjeldsen and Nielsen, 2008), and interestingly the slope of the linear regression of the data
of the present work is almost the same as that predicted by the genome scale model simulations.
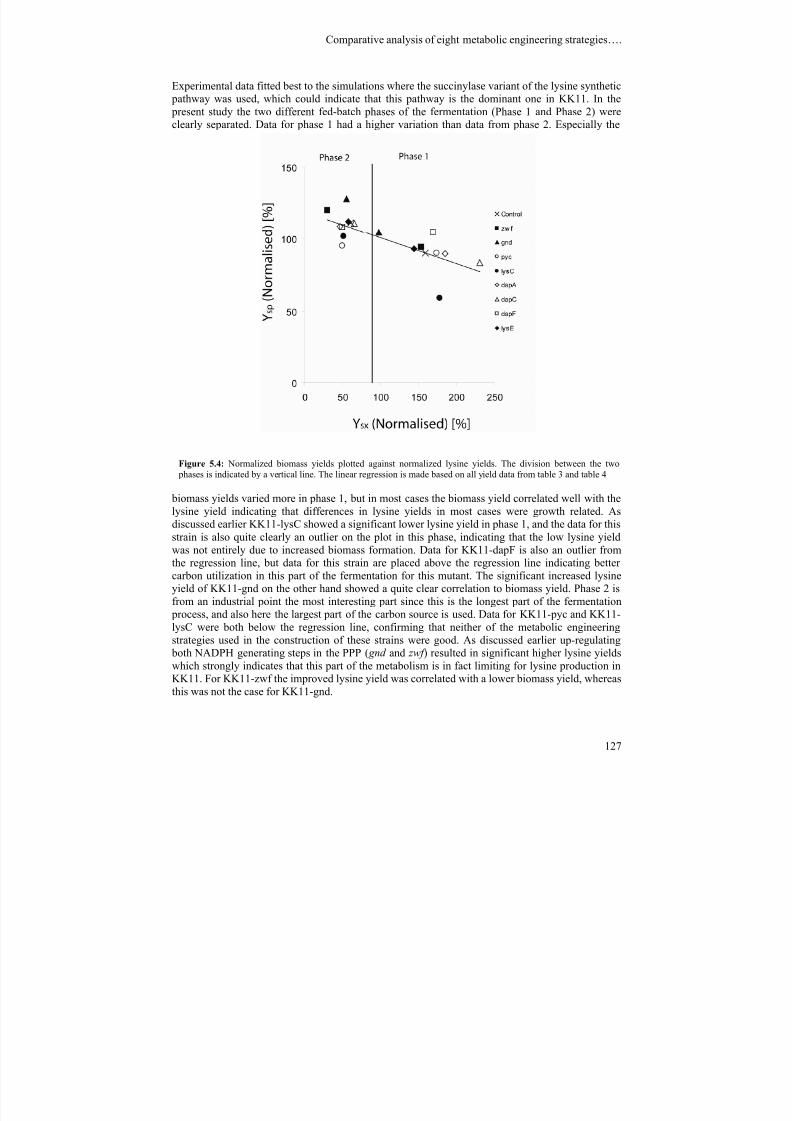
7/18/2019 Samlet PhD 20090416 U-Forside Appendix.pdf
http://slidepdf.com/reader/full/samlet-phd-20090416-u-forside-appendixpdf 125/187
Comparative analysis of eight metabolic engineering strategies…. ________________________________________________________________________________
127
Experimental data fitted best to the simulations where the succinylase variant of the lysine synthetic pathway was used, which could indicate that this pathway is the dominant one in KK11. In the present study the two different fed-batch phases of the fermentation (Phase 1 and Phase 2) wereclearly separated. Data for phase 1 had a higher variation than data from phase 2. Especially the
biomass yields varied more in phase 1, but in most cases the biomass yield correlated well with thelysine yield indicating that differences in lysine yields in most cases were growth related. Asdiscussed earlier KK11-lysC showed a significant lower lysine yield in phase 1, and the data for thisstrain is also quite clearly an outlier on the plot in this phase, indicating that the low lysine yield
was not entirely due to increased biomass formation. Data for KK11-dapF is also an outlier fromthe regression line, but data for this strain are placed above the regression line indicating bettercarbon utilization in this part of the fermentation for this mutant. The significant increased lysineyield of KK11-gnd on the other hand showed a quite clear correlation to biomass yield. Phase 2 isfrom an industrial point the most interesting part since this is the longest part of the fermentation
process, and also here the largest part of the carbon source is used. Data for KK11-pyc and KK11-lysC were both below the regression line, confirming that neither of the metabolic engineeringstrategies used in the construction of these strains were good. As discussed earlier up-regulating
both NADPH generating steps in the PPP ( gnd and zwf ) resulted in significant higher lysine yieldswhich strongly indicates that this part of the metabolism is in fact limiting for lysine production inKK11. For KK11-zwf the improved lysine yield was correlated with a lower biomass yield, whereas
this was not the case for KK11-gnd.
Figure 5.4: Normalized biomass yields plotted against normalized lysine yields. The division between the two phases is indicated by a vertical line. The linear regression is made based on all yield data from table 3 and table 4
7/18/2019 Samlet PhD 20090416 U-Forside Appendix.pdf
http://slidepdf.com/reader/full/samlet-phd-20090416-u-forside-appendixpdf 126/187
Chapter 5 ________________________________________________________________________________
128
In conclusion we find that even though metabolic engineering strategies are reportedto be successful for improving lysine production, many of these strategies can not be transferreddirectly to industrial strains. However, through comparative analysis of several different strategiesour results points to that supply of the co-factor NADPH may in fact be a limitation for high-
producing strains, which probably mainly are derived based on mutations in the lysine pathway.
Acknowledgments
The authors thank PhD Flemming Jørgensen and PhD Peter Ravn (Bioneer A/S) for contributing tothe metabolic engineering work. We also want to thank PhD Henrik Pedersen (AgroFerm A/S) forhis contribution to the work.
References
Bertani,G., 1951. Studies on lysogenesis - I. The mode of phage liberation by lysogenic Escherichiacoli. J. Bacteriol. 62, 293-300.
Becker,J., Klopprogge,C., Herold,A., Zelder,O., Bolten,C.J., Wittmann,C., 2007. Metabolic fluxengineering of L-lysine production in Corynebacterium glutamicum - over expression andmodification of G6P dehydrogenase. J. Biotechnol. 132, 99-109.
Black,S. and Wright,N.G., 1954. β-Aspartate kinase and β-aspartylphosphate. J.Biol.Chem. 213,27-38.
Bradford, M. M., 1976. A rapid and sensitive method for the quantification of microgram quantities
of protein utilizing the principle of protein-dye binding. Anal. Biochem. 72, 245-248.
Cremer,J., Treptow,C., and Eggeling,L., 1988. Regulation of enzymes of lysine biosynthesis inCorynebacterium glutamicum. J. Gen. Microbiol. 134, 3221-3229.
Cremer,J., Eggeling,L., Sahm,H. 1990. Cloning the dapA dapB cluster of the lysine-secreting bacterium Corynebacterium glutamicum. Mol. Genet. Genomics. (Historical Archive) 220, 478-480.
Cremer,J., Eggeling,L., Sahm,H., 1991. Control of the lysine biosynthesis sequence inCorynebacterium glutamicum as analysed by overexpression of the individual corresponding genes.
Appl. Environ. Microbiol. 57, 1746-1752.
Duncan,L.K., McCormack,A., Stapleton,C., Burke,K., Mockel,B., 2004. Process for the preparationof L-amino acids using a gene encoding 6-phosphogluconate dehydrogenase. US Patent Application0063181 A1.
Eggeling,L. and Reyes,O., 2005. Experiments. In: Eggeling,L., Bott,M. (Ed.), Handbook ofCorynebacterium glutamicum. CRC Press, Boca Raton, pp. 535-562.
Eggeling,L., Oberle,S., Sahm,H., 1998. Improved L-lysine yield with Corynebacterium
glutamicum: use of dapA resulting in increased flux combined with growth limitation. Appl.Microbiol. Biotechnol. 49, 24-30.
7/18/2019 Samlet PhD 20090416 U-Forside Appendix.pdf
http://slidepdf.com/reader/full/samlet-phd-20090416-u-forside-appendixpdf 127/187
Comparative analysis of eight metabolic engineering strategies…. ________________________________________________________________________________
129
Hartmann,M., Tauch,A., Eggeling,L., Bathe,B., Mockel,B., Puhler,A., Kalinowski,J., 2003.Identification and characterization of the last two unknown genes, dapC and dapF , in thesuccinylase branch of the -lysine biosynthesis of Corynebacterium glutamicum. J. Biotechnol. 104,
199-211.
Hua,Q., Yang,C., Shimizu,K., 2000. Metabolic control analysis for lysine synthesis usingCorynebacterium glutamicum and experimental verification. J. Biosci. Bioeng. 90, 184-192.
Jetten,M.S.M., Follettie,M.T., Sinskey,A.J., 1995. Effect of different levels of aspartokinase on thelysine production by Corynebacterium glutamicum. Appl. Microbiol.Biotechnol. 43, 76-82.
Kalinowski,J., Bathe,B., Bartels,D., Bischoff,N., Bott,M., Burkovski,A., Dusch,N., Eggeling,L.,Eikmanns,B.J., Gaigalat,L., 2003. The complete Corynebacterium glutamicum ATCC 13032genome sequence and its impact on the production of aspartate-derived amino acids and vitamins. J.
Biotechnol. 104, 5-25.
Ikeda,M. and Nakagawa,S., 2003. The Corynebacterium glutamicum genome: features and impactson biotechnological processes. Appl. Microbiol. Biotechnol. 62, 99-109.
Kelle,R., Hermann,T., Bathe,B., 2005. L-Lysine production. In: Eggeling,L., Bott,M. (Ed.),Handbook of Corynebacterium glutamicum. CRC Press, Boca Raton, pp. 465-488.
Kiefer,P., Heinzle,E., Zelder,O., Wittmann,C., 2004. Comparative metabolic flux analysis of lysine- producing Corynebacterium glutamicum cultured on glucose or fructose. Appl. Environ. Microbiol.
70, 229-239.
Kjeldsen,K.R. and Nielsen,J., 2008. In silico genome-scale reconstruction and validation of theCorynebacterium glutamicum metabolic network. Biotechnol. Bioeng. In Press.
Koffas,M.A.G., Jung,G.Y., Aon,J.C., Stephanopoulos,G., 2002. Effect of pyruvate carboxylaseoverexpression on the physiology of Corynebacterium glutamicum. Appl. Environ. Microbiol. 68,5422-5428.
Koffas,M.A.G., Jung,G.Y., Stephanopoulos,G., 2003. Engineering metabolism and productformation in Corynebacterium glutamicum by coordinated gene overexpression. Metab. Eng. 5, 32-41.
Marx,A., Eikmanns,B.J., Sahm,H., de Graaf,A.A., Eggeling,L., 1999. Response of the centralmetabolism in Corynebacterium glutamicum to the use of an NADH-dependent glutamatedehydrogenase. Metab. Eng. 1, 35-48.
Moritz,B., Striegel,K., de Graff,A.A., Sahm,H., 2000. Kinetic properties of the glucose-6-phosphateand 6-phosphogluconate dehydrogenases from Corynebacterium glutamicum and their applicationfor predicting pentose phosphate pathway flux in vivo. Eur. J. Biochem. 267, 3442-3452.
7/18/2019 Samlet PhD 20090416 U-Forside Appendix.pdf
http://slidepdf.com/reader/full/samlet-phd-20090416-u-forside-appendixpdf 128/187
Chapter 5 ________________________________________________________________________________
130
Ohnishi,J., Kakahira,R., Mitsuhashi,S., Kakita,S., and Ikeda,M., 2005. A novel gnd mutationleading to increased L-lysine production in Corynebacterium glutamicum. FEMS Microbiol. Lett.242, 265-274.
Park,S.M., Shaw-Reid,C., Sinskey,A.J., Stephanopoulos,G., 1997. Elucidation of anaplerotic pathways in Corynebacterium glutamicum via 13C-NMR spectroscopy and GC-MS. Appl.Microbiol. Biotechnol. 47, 430-440.
Payne,J. and Morris,J.G., 1969. Pyruvate carboxylase in Rhodopseudomonas spheroides. J. Gen.Microbiol. 59, 97-101.
Peters-Wendisch,P.G., Kreutzer,C., Kalinowski,J., Patek,M., Sahm,H., Eikmanns,B.J., 1998.Pyruvate carboxylase from Corynebacterium glutamicum: characterization, expression andinactivation of the pyc gene. Microbiology 144, 915-927.
Petersen,S., de Graff,A.A., Eggeling,L., Mollney,M., Wiechert,W., Sahn,H., 2000. In vivoquantification of parallel and bidirectional fluxes in the anaplerosis of Corynebacterium
glutamicum. J. Biol. Chem. 275, 35932-35941.
Sugimoto,S., Shiio,I., 1987. Regulation of 6-phosphogluconate dehydrogenase in Brevibacterium
flavum. Agric. Biol. Chem. 51, 1257-1263.
Tauch,A., Pühler,A., Kalinowski,J., Thierbach,G., 2003. Plasmids in Corynebacterium glutamicum and their molecular classification by comparative genomics. J. Biotechnol. 104, 27-40.
Vrljic,M., Sahm,H., Eggeling,L., 1996. A new type of transporter with a new type of cellularfunction: L-lysine export from Corynebacterium glutamicum. Mol. Microbiol. 22, 815-826.
Wittmann,C., Heinzle,E., 2002. Genealogy profiling through strain improvement by usingmetabolic network analysis: metabolic flux genealogy of several generations of lysine-producingCorynebacteria. Appl. Environ. Microbiol. 68, 5843-5859.
7/18/2019 Samlet PhD 20090416 U-Forside Appendix.pdf
http://slidepdf.com/reader/full/samlet-phd-20090416-u-forside-appendixpdf 129/187
Metabolic network analysis of Corynebacterium glutamicum… ________________________________________________________________________________
131
Chapter 6
6. Metabolic network analysis of Corynebacterium glutamicum
during L-lysine production in CSL based complex mediumusing13
C-labeled glucose
Paper C
Kjeld Kjeldsen1,2, Anna Lantz1, Jette Thykaer 1, Henrik Pedersen2 and Jens Nielsen1,3,4
1Center for Microbial Biotechnology, DTU Biosys, Technical University of Denmark, DK-2800Lyngby, Denmark2Agro&Ferm A/S, Limfjordsvej 4, DK-6715 Esbjerg N, Denmark.3 Current address: Department of Chemical and Biological Engineering, Chalmers University ofTechnology, SE-412 95 Gothenburg, Sweden4 Corresponding author; telephone: (+45) 45252696; Fax: (+45) 45884148; E-mail:[email protected]
7/18/2019 Samlet PhD 20090416 U-Forside Appendix.pdf
http://slidepdf.com/reader/full/samlet-phd-20090416-u-forside-appendixpdf 130/187
Chapter 6 ________________________________________________________________________________
132
Abstract
Two L-lysine producing strains of Corynebacterium glutamicum, a high producing strain KK-11and a low producing strain ATCC 21253, were compared during growth and lysine productionduring fed-batch fermentaions using a complex medium. Using [U-13C6]glucose the uptake of ninedifferent amino acids present in the complex medium was estimated during batch fermentation.Alanine, isoleucine, leucine, phenylanaline, proline, threonine and valine were taken up by bothstrains, although the ratio between de novo synthesis and uptake was different for the two strains.Glycine and serine were not taken up by any of the strains. Estimations of flux distributions in the
batch- and fed-batch phase were carried out using [1-13C]glucose. A comparison of the two strainswas made both in the batch phase and in the fed-batch phase of the fermentations. In the batch
phase the pentose phosphate pathway and the anaplerotic netflux was higher in the high producing
strain, whereas the TCA flux was lower. Finally, a significant ATP-consuming futile cycleinvolving anaplerotic reactions was identified in the low producing strain. The data from the production phase of the fed-batch fermentation showed an increased flux through the pentose phosphate pathway for both strains.
Introduction
Amino acid production by the gram positive bacteria Corynebacterium glutamicum is one of themajor processes in industrial biotechnology. The amino acid produced in the largest quantity by this
bacterium is L-lysine of which the annual production today is about 1,100,000 ton L-lysine,HCl
with an expected increase in demand of 8% per year. Optimization of cultivation strategies and producer strains has led to increased yields and productivities. Much of this improvement has beenachieved by random mutagenesis strategies followed by intensive screening programs. Recent yearsmore direct methods have been applied using metabolic engineering. In order to improve the
performance of a production organism by metabolic engineering a detailed knowledge ofintracellular fluxes in the central metabolism may be useful for predicting strategies for directmodifications of the organism by genetic engineering. Metabolic network analysis combiningmetabolite balancing and 13C-labeling patterns (Christensen and Nielsen, 1999b) can be used as atool in this respect.Throughout the last decade the metabolic network of C. glutamicum has been thoroughlyinvestigated using methods based on 13C-labeled substrates (Kiefer et al., 2004; Krömer et al.,
2004; Marx et al., 1996; Petersen et al., 2000; Wittmann and Heinzle, 2002). This has led to aunique knowledge about the central metabolism of this organism under various conditions.In commercial production of lysine a complex medium containing various carbon sources such ascorn steep liquor (CSL), is normally used, and the metabolic fluxes in this type of media may bedifferent from the fluxes in a defined minimal medium. However, conducting metabolic networkanalysis using 13C-labeled substrate in complex media is challenging since uptake of non-labeledsubstrate influences both the metabolite balancing and the labeling patterns of the biomasscomponents. Therefore sophisticated methods need to be used in order to deal with thesechallenges. Amino acids from the macromolecular pool of the biomass protein are often chosen foranalysis in metabolic network analysis using 13C-labeled substrates (Christensen and Nielsen,1999a; Christiansen et al., 2002; Marx et al., 1996). The labeling patterns of the amino acids reflectthe labeling of the intermediates in the central carbon metabolism and thereby the fluxes of the
7/18/2019 Samlet PhD 20090416 U-Forside Appendix.pdf
http://slidepdf.com/reader/full/samlet-phd-20090416-u-forside-appendixpdf 131/187
Metabolic network analysis of Corynebacterium glutamicum… ________________________________________________________________________________
133
metabolic network. In order to make an accurate metabolic network analysis it is therefore requiredto know the precise amino acid uptake to be able to take the contribution of unmarked carbon intoaccount when the flux model is made.Labeling patterns of amino acids have been determined from continuous cultures in steady state
(Christensen and Nielsen, 2000; Marx et al., 1996) or in the exponential growth phase of batchcultures (Pedersen et al., 2000), which also represents a physiological steady state. However, sincethe batch phase of commercial lysine production only represents a part of the fermentation, it is ofgreat interest to be able to determine the metabolic fluxes in the fed-batch phase following the batch
phase. However, when a metabolic shift occurs during a batch or fed-batch fermentation thelabeling patterns of the amino acids do not reflect the in vivo fluxes at a given time. However, theygive an integral value of the metabolic fluxes, which allow us to identify fluxes affected by the
physiological change based on the tendencies seen in the labeling patterns of the biomass. This can be used to elucidate metabolic changes in the central metabolism during non balanced growth.In this study metabolic network analysis on two lysine producing C. glutamicum strains grown incomplex media containing CSL was conducted. Amino acid uptake was determined in a parallel
study where 32%[ U-13C6]glucose was used as carbon source.
Materials and Methods
Strains
Two L-lysine producing strains of Corynebacterium glutamicum was used in this study. Bothstrains were obtained by sequential random mutagenesis by UV radiation and by the use ofchemical mutagens. The strain ATCC 21253 was obtained from the American Type Culture
Collection (Manassas, Va.), whereas the strain KK-11 was kindly donated by Agro&Ferm A/S.
Propagation
A frozen culture of C. glutamicum was used to inoculate agar plates containing (per litre distilledwater): 37 g brain heart broth (Merck), 15 g agar, 5 g glucose. The plates were inoculated for 36 hrat 30 °C, and a single colony was used to inoculate a 500 mL baffled Erlenmeyer flask containing100 mL media containing (per kg distilled water): 5 g glucose, 2.4 g corn step liquor (49% DW),5.2 g H3PO4 (85 % (wt/wt)), 0.075 g Na2-EDTA, 1.2 g KH2PO4, 1 g K 2SO4, 0.7 g MgSO4, 1.2 g
NaHPO4, 92.4 g 3-morpholinopropanesulforic acid (MOPS) sodium salt, 0.15 g threonine, 0.10 gleucine, 0.04 g methionine, 12.4 mg FeSO4 · 7 H2O, 8.26 mg ZnSO4 · H2O, 1.21 mg CuSO4 · 5 H2Oand 26 mg citric acid. After sterilization (121 °C, 20 minutes) and vitamins and ammonium sulphate
was added by sterile filtration so the concentration was (per kg distilled water): 4.87 mg thiamine,HCl, 11.92 mg calcium pantothenate, 6.03 mg nicotinic acid, 1.32 mg D-biotin and 10 g (NH4)2SO4.Cultures were inoculated and incubated in a rotary shaker at 30 °C and 250 rpm for 48 hours beforethey were used to make freeze stocks by mixing 667 μL 50 % (w/v) glycerol with 1000 μL cultureand transferred to a -80 °C freezer where they were stored until used as inoculum for the tracerexperiment.
Batch medium
A batch medium was prepared containing (per kg distilled water): 2.4 g corn step liquor (49% DW),5.2 g H3PO4 (85 % (m/m)), 0.075 g Na2-EDTA, 1.2 g KH2PO4, 1 g K 2SO4, 0.7 g MgSO4 , 1.2 g
NaHPO4, 0.15 g threonine, 0.10 g leucine, 0.04 g methionine, 12.4 mg FeSO4 · 7 H2O, 8.26 mg
ZnSO4 · H2O, 1.21 mg CuSO4 · 5 H2O and 26 mg citric acid, 4.87 mg thiamine, HCl, 11.92 mg
7/18/2019 Samlet PhD 20090416 U-Forside Appendix.pdf
http://slidepdf.com/reader/full/samlet-phd-20090416-u-forside-appendixpdf 132/187
Chapter 6 ________________________________________________________________________________
134
calcium pantothenate and 6.03 mg nicotinic acid. The vitamins were sterile filtrated into themedium together with (NH4)2SO4 and glucose after the rest of the components had been sterilized(121 °C, 20 minutes) and the medium had been cooled to 30 °C. For batch cultivations the initialglucose concentrations were 17 g · L-1 and (NH4)2SO4 concentrations were 10 g · L-1. The glucose
used was either 99% [1-13
C] (Omicron Biochemicals, Inc.) or a mixture of 32% [U-13
C6] (Isotech,Inc.) and 68% naturally labeled glucose. For fed-batch operations a feed-medium was preparedcontaining (per kg distilled water): 17 g glucose 99% [1-13C] and 10 g (NH4)2SO4. The twocomponents was sterilized separately and mixed after cooling.
Bioreactors and cultivation conditions
The cultivations were carried out in a small scale bioreactor with a working volume of 250 mldesigned and made in house. Cultivations were carried out at 30 °C and pH was kept constant at 7.0using 5 % (v/v) NH4OH. Bioreactor was aerated with 2 VVM and agitated with 700 rpm to ensureaerobic conditions. Feed medium, NH4OH and fermenter were all placed on balances and thechanges in weight was monitored online.
Biomass measurements
Dry cell weight (DCW) content of the medium was determined by OD620 measurements followed by a calculation using a preciously determined OD620:DCW-ratio. The OD620:DCW-ratio wasobtained in fermentations identical to the fermentations used for 13C flux analysis. At specified time
points samples taken and OD620 was measured. In addition samples were centrifuged and washedtwice with distilled water followed by drying at 105 °C until constant weight. A OD620:DCW-ratiowas determined using data from 6 independent fermentations.
Sampling procedure
Samples were immediately put on ice and centrifuged. Pellet and a supernatant were separated, andthe supernatant was filtrated through a 0.22-μm pore size filter before both parts were stored at -20°C until further analysis.
Amino acids analysis
Samples for amino acid analysis were first processed by extraction of 1 g sample in 10 mL 0.1 MHCl for 5 minutes while stirred by a magnetic stirrer. The sample was then added 5 mL 5-sulfosalicylic acid (6% w/v) and stirred for another 5 minutes before centrifugation at 4000 g in 10minutes. An appropriate amount of the supernatant was transferred to a container where pH wasadjusted to 2.20 ± 0.02 with 1 M NAOH. The sample was transferred to a 25 mL volumetric flaskwhich was filled using sodium citrate loading buffer (0.20 M, pH 2.20) (Biochrom Ltd., Cambrigde
Science Park, England). The sample was filtrated through a 0.22-μm pore size filter, diluted ifnecessary and loaded on a Biochrom 30 (Biochrom, Ltd., Cambrigde Science Park, England).Amino acids were separated using a pH gradient on a Oxidised Hydrolysate Column (Biochrom,Ltd., Cambrigde Science Park, England) and detection was carried out by a postcolumn derivatizedwith ninhydrin reagent followed by measuring absorbance at 440 (proline) or 570 nm (all otheramino acids).
Glucose measurement
Separation of sugars was achieved using a CarboPac PA 1 column 4 × 50 mm (Dionex Corporation,USA) as precolumn followed by a CarboPac PA 1 column 40 × 250 mm (Dionex , USA) with 160mM NaOH as mobile phase. Detection and quantification was performed with an amperometric
impulse-detector (Electrochemical detector ED 50 Dionex, Germany).
7/18/2019 Samlet PhD 20090416 U-Forside Appendix.pdf
http://slidepdf.com/reader/full/samlet-phd-20090416-u-forside-appendixpdf 133/187
Metabolic network analysis of Corynebacterium glutamicum… ________________________________________________________________________________
135
Organic acids measurement
The concentration of organic acids in the supernatant was determined by HPLC. A Dionex ICS-1000 ion chromatography system with a IonPac ICE-AS6 (250 × 9 mm) column (Dionex, USA)
together with an anionic micromembrane suppressor AMMS ICE (Dionex, USA) were used fordetection of organic acids. The eluent used was 0.4 mM heptaflurobutyric acid and 12 mMtetrabutylamonium hydroxide was used as reagent. The operation conditions used were as follows:sample volume 20 μL; system backpressure 800 psi; background conductance 14~16 μS; effluentflow rate 1 mL/min and reactant flow rate 1 mL/min. Samples were measured for the presence oflactate, acetate, malate and succinate.
Analysis of the 13C-labeling patterns
The labeling patterns of the amino acids incorporated into the biomass were analyzed by GC-MS,and the labeling patterns of the central metabolites were subsequently deduced from the knowledgeof the biochemical relationship between precursors and amino acids (Christensen and Nielsen,
1999a; Marx et al., 1996). The biomass used for analysis was harvested by centrifugation andwashed twice with 50 mM Na2HPO4 buffer containing 0.9% (w/w) NaCl, pH adjusted to 7.0 withHCl. Approximately 15 mg biomass (dry) was hydrolyzed using 600 μL 6 M HCl at 105°C for 16 h.After hydrolyzation the sample was centrifuged and the supernatant was transferred into vials anddried at 105°C. The dried sample was dissolved in 1 mL dH2O, and the sample was extracted bysolid phase extraction adding the entire sample to a Dowex cation exchange column containing 100mg dowex exchange resin (50W x 8 – 400) dissolved in 50% (w/w) glycerol. The sample wasslowly allowed to pass through the resin allowing the resin to dry out. After this the resin waswashed with 1 mL 50% ethanol followed by 200 μL 1 M NaOH. The sample was extracted byadding 1 mL extract solution (33.3% ethanol (v/v), 6.7% pyridine and 60% (v/v) of a solutioncontaining 1% NaOH (wt/v) in saline (0.9% NaCl (wt/v)). The amino acid extract was divided intotwo and used for derivatization by ethylchloroformate or ( N,N )-dimethylformamide dimethylacetal.
Ethylchloroformate (ECF) derivatization
The amino acid extract was added 50 μL ECF. After the formation of carbon dioxide had ceased thederivatives was extracted adding 200 μL propyl acetate and mixing followed by adding 50 μL 1 MHCl. The oraganic phase was collected for GC-MS analysis.
(N,N)-dimethylformamide dimethylacetal (DMFDMA) derivatization
The amino acid extract was added 200 μL 1 M HCl and dried at 105°C. The dried sample wasadded 200 μL DMFDMA and 200 μL acetonnitril and vortexed. The samples was derivatized at
100°C for 20 min, and the sample was transferred to -20°C for 10 min. Sample was used for GC-MS analysis.
GC-MS parameters
GC-MS analysis was done on an Agilent (palo Alto, CA, USA) HP 6890 gas chromatographcoupled to a HP 5973 quadruple mass selective detector in positive electron impact ionization (EI+)using an electron energy of 70 eV. The GC was equipped with a 4.0 mm i.d. Siltek goosenecksplitless deactivated liner (Restek, Bellefonte, PA, USA), and a Supelco (Bellefonte, PA, US) SLB-5 MS column, 15 m, 0.25 mm i.d., 0.25 µm film. Helium of a purity of 99.999% was used as carriergas at a constant linear gas velocity 35 cm/ s. Transfer line temperature was 280ºC, quadrupletemperature 150ºC and MS source 200ºC. The GC-MS system was controlled from Agilent MSD
Chemstation v. D.01.02.16.
7/18/2019 Samlet PhD 20090416 U-Forside Appendix.pdf
http://slidepdf.com/reader/full/samlet-phd-20090416-u-forside-appendixpdf 134/187
Chapter 6 ________________________________________________________________________________
136
For ECF derivatives the following method was used: The oven temperature was initially held at75°C for one min. Hereafter the temperature was raised with a gradient of 40°C min -1 until 165°C.Then 4°C until 190°C and 40°C upto 240°C. At the end, temperature was increased to 260°C with a
gradient of 4°C min-1
and held constant for 4 minutes. The flow through the column was heldconstant at 1.3 mL He min-1. Temperature of the inlet, 200°C. Interface temperature,280°C.Quadrupole temperature, 105°C.
DMFDMA derivatives was measured using the following method: The oven temperature wasinitially held at 60°C for one min. Hereafter the temperature was raised with a gradient of 20°Cmin-1 until 130°C. Then 4°C until 150°C and 40°C upto 260°C and held constant for 4.25 minutes.The flow through the column was held constant at 1 mL He min -1. Temperature of the inlet, 230°C.Interface temperature, 270°C.Quadrupole temperature, 105°C.For all the above methods, samples of 1 µL were injected in the splitless (30 sec, split 1:20) mode at200ºC using hot needle.
In the mass spectrometer, the derivatives were ionized and subsequently fragmented, and the massdistribution of each individual fragment was measured (Christensen and Nielsen, 1999a). From theabundance of the measured peaks in the mass spectrum, the summed fractional labelling (SFL) ofeach fragment was calculated using (eq. 1), where mi is the abundance of the (m+i)-massisotopomer and n is the total number of carbon atoms in the fragment. The calculated SFL wascorrected for the occurrence of naturally labeling from other atoms (Wittmann and Heinzle, 1999).
%100
0
0 ⋅⋅
=∑∑
=
=
n
j j
n
i i
m
miSFL (1)
The calculated SFLs were used to analyze the metabolic network.
Amino acid uptake
The amino acid uptake from the complex medium was measured using the concept of reciprocallabeling (Christensen, 2001). Here the 32%[U-13C6]glucose and 68% naturally labeled glucose wasused as substrate. The fraction of amino acids taken up from the complex medium could becalculated from eq. 2.
%10011.175.32
75.32(%) ⋅
−
−= n
SFL
Uptake (2)
7/18/2019 Samlet PhD 20090416 U-Forside Appendix.pdf
http://slidepdf.com/reader/full/samlet-phd-20090416-u-forside-appendixpdf 135/187
Metabolic network analysis of Corynebacterium glutamicum… ________________________________________________________________________________
137
Here n is the number of carbon atoms in the fragment measured. The labeling from naturallylabeled sugar is 1.11%, so the labeling of a carbon atom completely synthesized de novo fromglucose is 32.75%.
Table 6.1: Medium and yield coefficients for cultivations in this studyStrain Phase Substrate μ (h-1) Ysp (g g-1) Ysx (g g-1)ATCC 21253 Batch [1-13C]glucose 0.51 0 0.51ATCC 21253 Fed-Batch [1-13C]glucose 0 0.24 0.04ATCC 21253 Batch [U-13C6]glucose 0.50 0 0.50KK-11 Batch [1-13C]glucose 0.28 0.21 0.31KK-11 Fed-Batch [1-13C]glucose 0.03 0.37 0.21KK-11 Batch [U-13C6]glucose 0.28 0.21 0.31
Estimation of metabolic fluxes
The flux distribution of the metabolic network was estimated from metabolite and 13C balancing
(Christensen and Nielsen, 1999a; Marx et al., 1996). The inputs to the model included biomassyield (see table 6.1), lysine yield (see table 6.1), biomass composition (Wittmann and de Graaf,2005), and the labeling patterns of amino acids not taken up from the medium (see table 6.2). Thecomplete metabolic network is given in figure 6.1.
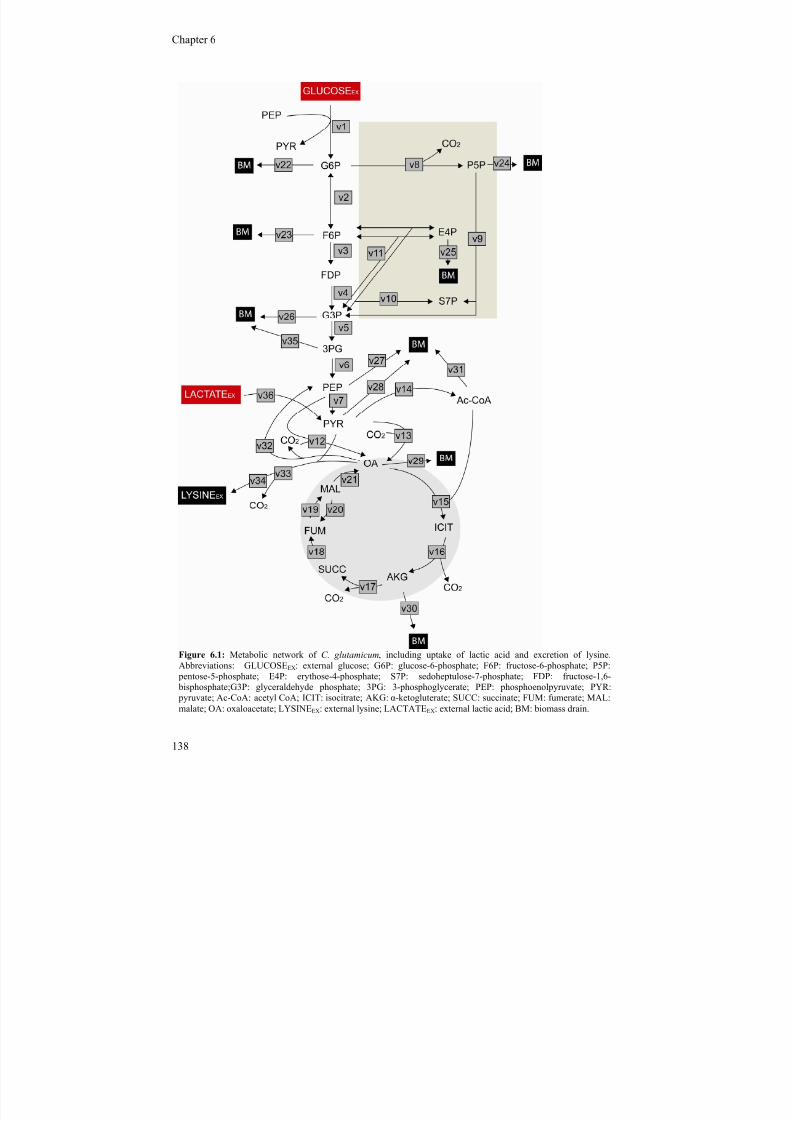
7/18/2019 Samlet PhD 20090416 U-Forside Appendix.pdf
http://slidepdf.com/reader/full/samlet-phd-20090416-u-forside-appendixpdf 136/187
Chapter 6 ________________________________________________________________________________
138
Figure 6.1: Metabolic network of C. glutamicum, including uptake of lactic acid and excretion of lysine.Abbreviations: GLUCOSEEX: external glucose; G6P: glucose-6-phosphate; F6P: fructose-6-phosphate; P5P: pentose-5-phosphate; E4P: erythose-4-phosphate; S7P: sedoheptulose-7-phosphate; FDP: fructose-1,6- bisphosphate;G3P: glyceraldehyde phosphate; 3PG: 3-phosphoglycerate; PEP: phosphoenolpyruvate; PYR: pyruvate; Ac-CoA: acetyl CoA; ICIT: isocitrate; AKG: α-ketogluterate; SUCC: succinate; FUM: fumerate; MAL:malate; OA: oxaloacetate; LYSINEEX: external lysine; LACTATEEX: external lactic acid; BM: biomass drain.
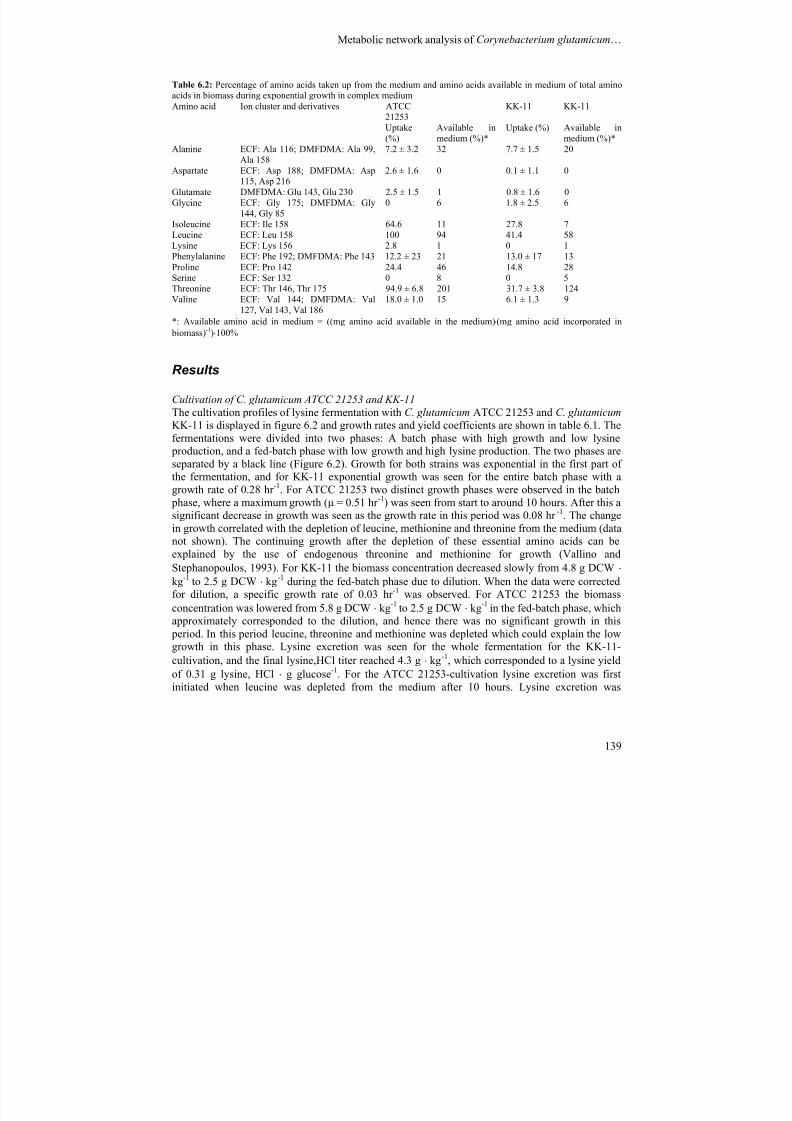
7/18/2019 Samlet PhD 20090416 U-Forside Appendix.pdf
http://slidepdf.com/reader/full/samlet-phd-20090416-u-forside-appendixpdf 137/187
Metabolic network analysis of Corynebacterium glutamicum… ________________________________________________________________________________
139
Table 6.2: Percentage of amino acids taken up from the medium and amino acids available in medium of total aminoacids in biomass during exponential growth in complex mediumAmino acid Ion cluster and derivatives ATCC
21253KK-11 KK-11
Uptake
(%)
Available in
medium (%)*
Uptake (%) Available in
medium (%)*Alanine ECF: Ala 116; DMFDMA: Ala 99,
Ala 1587.2 ± 3.2 32 7.7 ± 1.5 20
Aspartate ECF: Asp 188; DMFDMA: Asp115, Asp 216
2.6 ± 1.6 0 0.1 ± 1.1 0
Glutamate DMFDMA: Glu 143, Glu 230 2.5 ± 1.5 1 0.8 ± 1.6 0Glycine ECF: Gly 175; DMFDMA: Gly
144, Gly 850 6 1.8 ± 2.5 6
Isoleucine ECF: Ile 158 64.6 11 27.8 7Leucine ECF: Leu 158 100 94 41.4 58Lysine ECF: Lys 156 2.8 1 0 1Phenylalanine ECF: Phe 192; DMFDMA: Phe 143 12.2 ± 23 21 13.0 ± 17 13Proline ECF: Pro 142 24.4 46 14.8 28
Serine ECF: Ser 132 0 8 0 5Threonine ECF: Thr 146, Thr 175 94.9 ± 6.8 201 31.7 ± 3.8 124Valine ECF: Val 144; DMFDMA: Val
127, Val 143, Val 18618.0 ± 1.0 15 6.1 ± 1.3 9
*: Available amino acid in medium = ((mg amino acid available in the medium)⋅(mg amino acid incorporated in biomass)-1)⋅100%
Results
Cultivation of C. glutamicum ATCC 21253 and KK-11
The cultivation profiles of lysine fermentation with C. glutamicum ATCC 21253 and C. glutamicum KK-11 is displayed in figure 6.2 and growth rates and yield coefficients are shown in table 6.1. Thefermentations were divided into two phases: A batch phase with high growth and low lysine
production, and a fed-batch phase with low growth and high lysine production. The two phases areseparated by a black line (Figure 6.2). Growth for both strains was exponential in the first part ofthe fermentation, and for KK-11 exponential growth was seen for the entire batch phase with agrowth rate of 0.28 hr -1. For ATCC 21253 two distinct growth phases were observed in the batch
phase, where a maximum growth (μ = 0.51 hr -1) was seen from start to around 10 hours. After this asignificant decrease in growth was seen as the growth rate in this period was 0.08 hr -1. The changein growth correlated with the depletion of leucine, methionine and threonine from the medium (datanot shown). The continuing growth after the depletion of these essential amino acids can be
explained by the use of endogenous threonine and methionine for growth (Vallino andStephanopoulos, 1993). For KK-11 the biomass concentration decreased slowly from 4.8 g DCW ⋅ kg-1 to 2.5 g DCW ⋅ kg-1 during the fed-batch phase due to dilution. When the data were correctedfor dilution, a specific growth rate of 0.03 hr -1 was observed. For ATCC 21253 the biomassconcentration was lowered from 5.8 g DCW ⋅ kg-1 to 2.5 g DCW ⋅ kg-1 in the fed-batch phase, whichapproximately corresponded to the dilution, and hence there was no significant growth in this
period. In this period leucine, threonine and methionine was depleted which could explain the lowgrowth in this phase. Lysine excretion was seen for the whole fermentation for the KK-11-cultivation, and the final lysine,HCl titer reached 4.3 g ⋅ kg-1, which corresponded to a lysine yieldof 0.31 g lysine, HCl ⋅ g glucose-1. For the ATCC 21253-cultivation lysine excretion was firstinitiated when leucine was depleted from the medium after 10 hours. Lysine excretion was
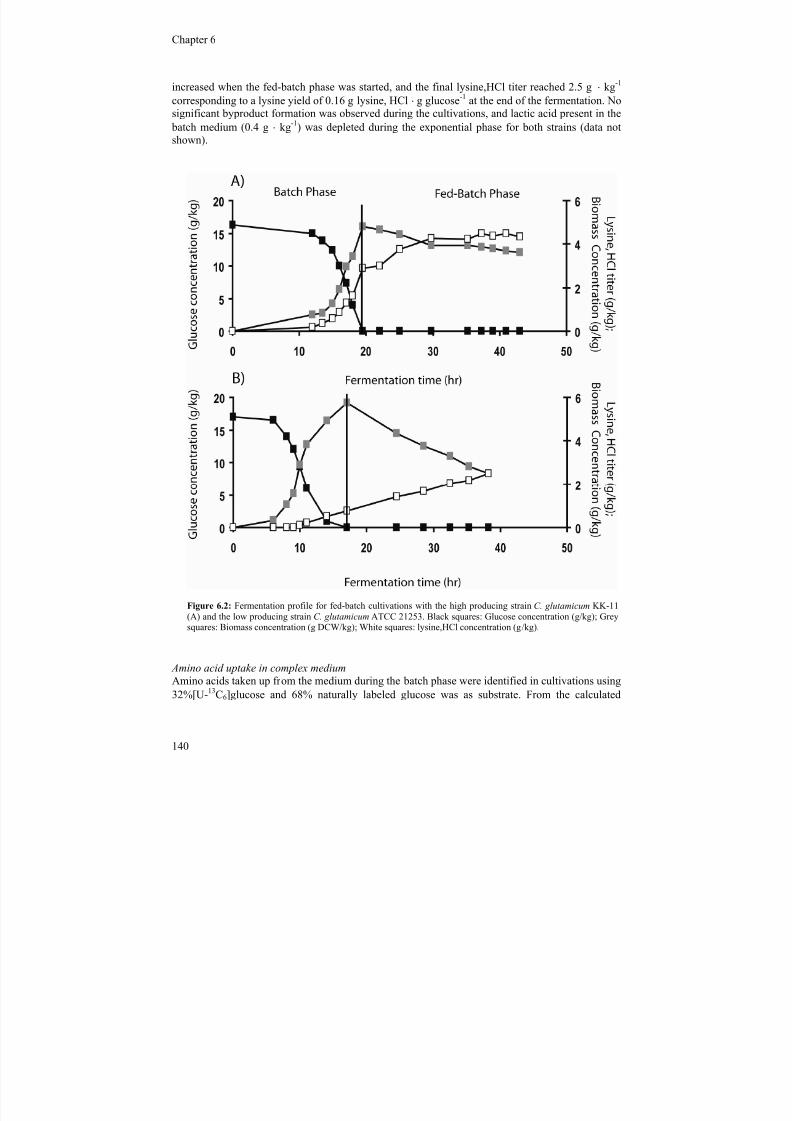
7/18/2019 Samlet PhD 20090416 U-Forside Appendix.pdf
http://slidepdf.com/reader/full/samlet-phd-20090416-u-forside-appendixpdf 138/187
Chapter 6 ________________________________________________________________________________
140
increased when the fed-batch phase was started, and the final lysine,HCl titer reached 2.5 g ⋅ kg-1 corresponding to a lysine yield of 0.16 g lysine, HCl ⋅ g glucose-1 at the end of the fermentation. Nosignificant byproduct formation was observed during the cultivations, and lactic acid present in the
batch medium (0.4 g ⋅ kg-1) was depleted during the exponential phase for both strains (data not
shown).
Amino acid uptake in complex medium
Amino acids taken up from the medium during the batch phase were identified in cultivations using
32%[U-13C6]glucose and 68% naturally labeled glucose was as substrate. From the calculated
Figure 6.2: Fermentation profile for fed-batch cultivations with the high producing strain C. glutamicum KK-11(A) and the low producing strain C. glutamicum ATCC 21253. Black squares: Glucose concentration (g/kg); Greysquares: Biomass concentration (g DCW/kg); White squares: lysine,HCl concentration (g/kg).

7/18/2019 Samlet PhD 20090416 U-Forside Appendix.pdf
http://slidepdf.com/reader/full/samlet-phd-20090416-u-forside-appendixpdf 139/187
Metabolic network analysis of Corynebacterium glutamicum… ________________________________________________________________________________
141
labeling patterns (eq. 1) the uptake of twelve amino acids could be calculated using eq. 2, and theresults are shown in table 6.2. To account for the differences in availability of the different aminoacids it was calculated how much of each individual amino acid was taken up normalized to theavailability of the amino acid (Table 6.2).Most amino acids present in significant amounts were
taken up by both strains although it was seen that the different amino acids were taken up atdifferent ratios. The three amino acids aspartate, lysine and glutamate were not taken up by any ofthe strains. This was expected since these amino acids were not present in significant amounts in themedium (Table 6.2). Glycine and serine were both present in small amounts in the medium, but nouptake of these amino acids was seen. The uptake of valine and phenylalanine corresponded withthe available amino acids in the medium for both stains, indicating that these amino acids were fullyutilized. For the two amino acids alanine and proline, only part of the proteinoic amino acid pooloriginated from the complex medium, 20% and 35% of alanine and 52% and 53% of prolineoriginated from the medium for ATCC 21253 and KK-11, respectively. One possible explanationcould be that both amino acids can serve as nitrogen donors for C. glutamicum (Burkovski, 2005)i.e. the amino acids can be metabolized via a transaminase reactions yielding ammonia and pyruvate
or α-ketogluterate. If this was the case we would expect to see changes in the labeling patterns of pyruvate and α-ketogluterate due to the contribution of unmarked carbon from the breakdown products. Such changes could not be recognized from the data since glutamate (originated from α-ketogluterate) and lysine (originated from pyruvate) were completely synthesized from 13C-glucose.For ATCC 21253 all proteinoic leucine and threonine was taken up from the medium, which wasexpected since these amino acids are essential for this strain. For the same strain isoleucine uptakewas 587% of the available isoleucine in the medium. This very high uptake of isoleucine in thisstrain could be explained by the fact that isoleucine in C. glutamicum is synthesized from threonine
by the incorporation of a pyruvate molecule (Möckel et al., 1992). This way most proteinoicisoleucine originated from unlabelled threonine and labeled pyruvate originating from the 13C-
labeled glucose. The high producing strain KK-11 partly synthesized (68%) and partly took up(32%) threonine, although this amino acid was present in high amounts in the medium. This wasalso the case for leucine and isoleucine where 41% of the leucine pool of the biomass was taken upfrom the medium. For isoleucine a significant amount originated from unlabeled threonine, howeverthe majority of the proteinoic isoleucine was synthesized de novo from glucose.
Table 6.3: Summed fractional labelling of biomass components in batch culture of ATCC 21253 and KK-11 grown on[1-13C]glucose in CSL based complex medium.
ATCC 21253 KK-11Ion Cluster Precursor Measured SFL Estimated SFL Measured SFL Estimated SFLLysine 156 OAA2,3,4;
PYR 2,3 83.4 85.5 73.6 74.7
Aspartate 188 OAA2,3,4 51.3 52.7 45.3 48.7Aspartate 216 OAA1,2,3,4 58.7 61.7 55.3 56.0Aspartate 115 OAA2 11.1 10.9 11.5 11.2Glycine 144 G3P1,2 4.4 4.7 4.4 4.4Glycine 175 G3P2 5.3 4.7 - -Glycine 85 G3P2 - - 1.8 1.7Serine 132 G3P2,3 34.5 34.3 28.4 27.9Glutamate 230 AKG1,2,3,4,5 85.1 85.5 76.6 74.7Glutamate 143 AKG1,2 42 41.8 40.2 37
Flux distribution during exponential growth in complex medium

7/18/2019 Samlet PhD 20090416 U-Forside Appendix.pdf
http://slidepdf.com/reader/full/samlet-phd-20090416-u-forside-appendixpdf 140/187
Chapter 6 ________________________________________________________________________________
142
The metabolic network applied contains the glycolysis, the pentose phosphate pathway and theTCA cycle. The anaploresis is represented by pyruvate carboxylase, phosphoenolpyruvatecarboxylase and phosphoenolpyruvate carboxykinase. In addition to these anaplerotic reactionsmalic enzyme and oxaloacetate decarbyxylase have also been reported in C. glutamicum, however
based on biochemical evidence the activity of these reactions during growth on glucose are low orabsent (Petersen et al., 2000) why these reactions were not included in the network. The metabolicflux distributions in the batch phase of fermentations using 99% [1-C13]glucose in complex mediumwere estimated from SFLs of fragments of aspartate, glutamate, lysine, serine and glycine (Table6.3). These amino acids were not taken up in significant amounts by any of the strains used in thisstudy, and therefore they were synthesized de novo from the labeled glucose. The lactic acidcontribution from the CSL was also included in the model. Lactic acid is entering the centralmetabolism of C. glutamicum as pyruvate, and an irreversible flux from lactic acid to pyruvate wastherefore included into the model taking the contribution of unlabelled pyruvate into account. Thatall SFLs were based on samples in isotopic steady state was ensured by analyzing three independentsamples in the exponential phase. For all SFL-data used for the flux estimation deviations were
found to be lower than 0.5% (absolute)(data not shown) indicating the presence of an isotopicsteady state. The estimated flux distributions are given in figure 6.3. All fluxes are given relative to100 mol of glucose taken up. The standard deviation for the SFLs was set to 0.05 in the model, andmost estimations were within the range of this standard deviation. The estimated SFLs from theglycine ioncluster were in some cases not within the standard deviation. These values were low whyan experimental error can not be excluded. The sensitivity of these values were tested and it wasconcluded that flux distributions only were changed marginally (1-2% absolute) when the SFLswere changed ±10% (Data not shown). Estimated and measured SFLs for the glutamate 143 andaspartate 188 ion clusters were also found to differ for KK-11 cultivations. Sensitivity test showedthat ±10% (relative) of these fragments did not change the flux distributions significantly (data notshown).
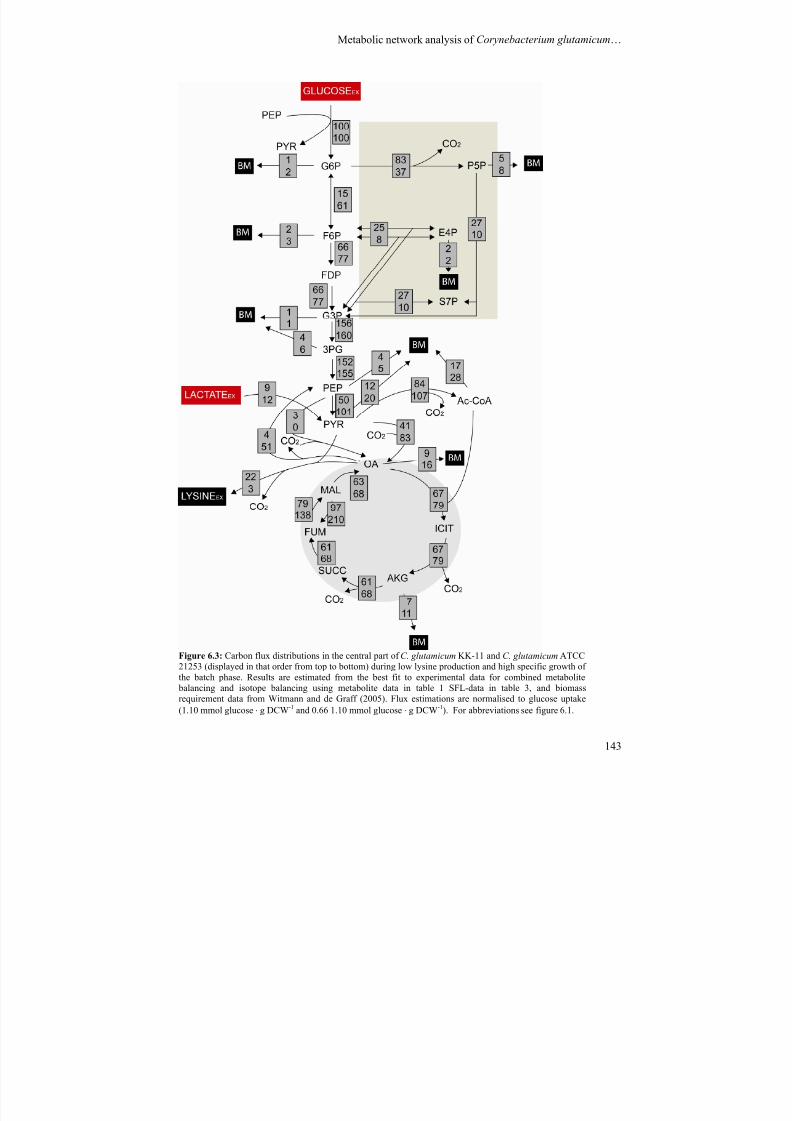
7/18/2019 Samlet PhD 20090416 U-Forside Appendix.pdf
http://slidepdf.com/reader/full/samlet-phd-20090416-u-forside-appendixpdf 141/187
Metabolic network analysis of Corynebacterium glutamicum… ________________________________________________________________________________
143
Figure 6.3: Carbon flux distributions in the central part of C. glutamicum KK-11 and C. glutamicum ATCC21253 (displayed in that order from top to bottom) during low lysine production and high specific growth ofthe batch phase. Results are estimated from the best fit to experimental data for combined metabolite balancing and isotope balancing using metabolite data in table 1 SFL-data in table 3, and biomassrequirement data from Witmann and de Graff (2005). Flux estimations are normalised to glucose uptake(1.10 mmol glucose ⋅ g DCW-1 and 0.66 1.10 mmol glucose ⋅ g DCW-1). For abbreviations see figure 6.1.
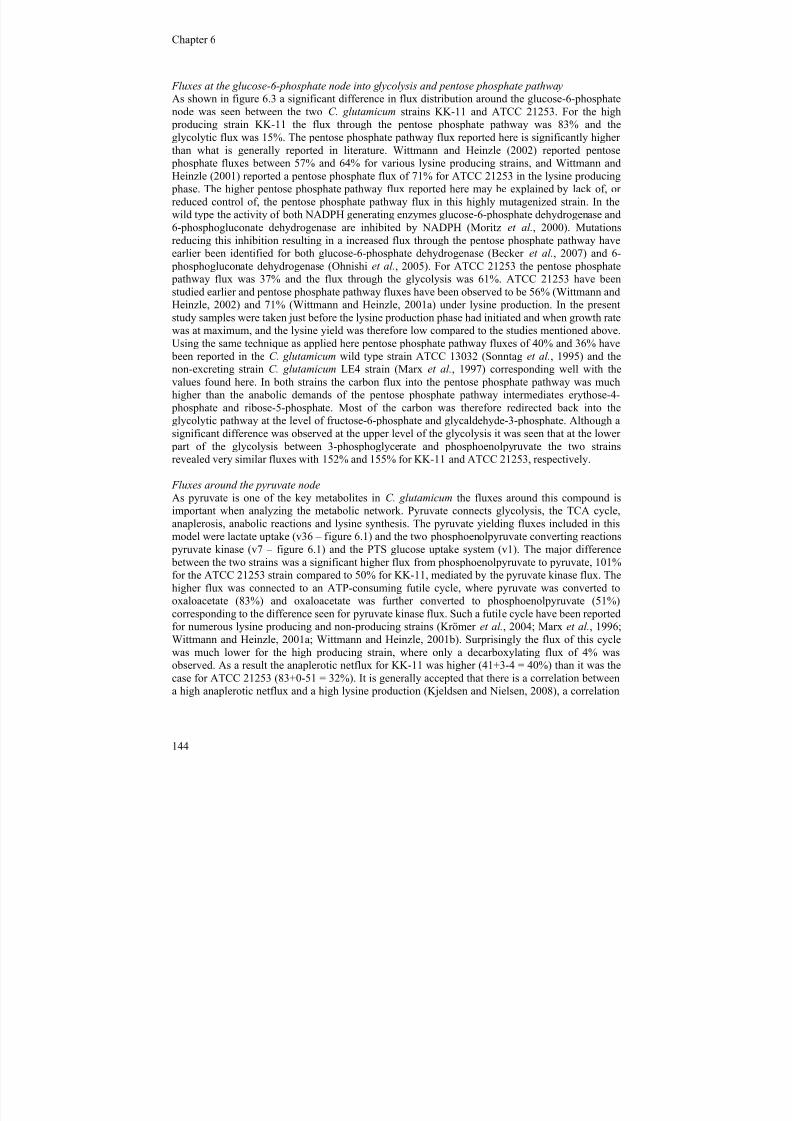
7/18/2019 Samlet PhD 20090416 U-Forside Appendix.pdf
http://slidepdf.com/reader/full/samlet-phd-20090416-u-forside-appendixpdf 142/187
Chapter 6 ________________________________________________________________________________
144
Fluxes at the glucose-6-phosphate node into glycolysis and pentose phosphate pathway
As shown in figure 6.3 a significant difference in flux distribution around the glucose-6-phosphatenode was seen between the two C. glutamicum strains KK-11 and ATCC 21253. For the high
producing strain KK-11 the flux through the pentose phosphate pathway was 83% and the
glycolytic flux was 15%. The pentose phosphate pathway flux reported here is significantly higherthan what is generally reported in literature. Wittmann and Heinzle (2002) reported pentose
phosphate fluxes between 57% and 64% for various lysine producing strains, and Wittmann andHeinzle (2001) reported a pentose phosphate flux of 71% for ATCC 21253 in the lysine producing
phase. The higher pentose phosphate pathway flux reported here may be explained by lack of, orreduced control of, the pentose phosphate pathway flux in this highly mutagenized strain. In thewild type the activity of both NADPH generating enzymes glucose-6-phosphate dehydrogenase and6-phosphogluconate dehydrogenase are inhibited by NADPH (Moritz et al., 2000). Mutationsreducing this inhibition resulting in a increased flux through the pentose phosphate pathway haveearlier been identified for both glucose-6-phosphate dehydrogenase (Becker et al., 2007) and 6-
phosphogluconate dehydrogenase (Ohnishi et al., 2005). For ATCC 21253 the pentose phosphate
pathway flux was 37% and the flux through the glycolysis was 61%. ATCC 21253 have beenstudied earlier and pentose phosphate pathway fluxes have been observed to be 56% (Wittmann andHeinzle, 2002) and 71% (Wittmann and Heinzle, 2001a) under lysine production. In the presentstudy samples were taken just before the lysine production phase had initiated and when growth ratewas at maximum, and the lysine yield was therefore low compared to the studies mentioned above.Using the same technique as applied here pentose phosphate pathway fluxes of 40% and 36% have
been reported in the C. glutamicum wild type strain ATCC 13032 (Sonntag et al., 1995) and thenon-excreting strain C. glutamicum LE4 strain (Marx et al., 1997) corresponding well with thevalues found here. In both strains the carbon flux into the pentose phosphate pathway was muchhigher than the anabolic demands of the pentose phosphate pathway intermediates erythose-4-
phosphate and ribose-5-phosphate. Most of the carbon was therefore redirected back into theglycolytic pathway at the level of fructose-6-phosphate and glycaldehyde-3-phosphate. Although asignificant difference was observed at the upper level of the glycolysis it was seen that at the lower
part of the glycolysis between 3-phosphoglycerate and phosphoenolpyruvate the two strainsrevealed very similar fluxes with 152% and 155% for KK-11 and ATCC 21253, respectively.
Fluxes around the pyruvate node
As pyruvate is one of the key metabolites in C. glutamicum the fluxes around this compound isimportant when analyzing the metabolic network. Pyruvate connects glycolysis, the TCA cycle,anaplerosis, anabolic reactions and lysine synthesis. The pyruvate yielding fluxes included in thismodel were lactate uptake (v36 – figure 6.1) and the two phosphoenolpyruvate converting reactions
pyruvate kinase (v7 – figure 6.1) and the PTS glucose uptake system (v1). The major difference between the two strains was a significant higher flux from phosphoenolpyruvate to pyruvate, 101%for the ATCC 21253 strain compared to 50% for KK-11, mediated by the pyruvate kinase flux. Thehigher flux was connected to an ATP-consuming futile cycle, where pyruvate was converted tooxaloacetate (83%) and oxaloacetate was further converted to phosphoenolpyruvate (51%)corresponding to the difference seen for pyruvate kinase flux. Such a futile cycle have been reportedfor numerous lysine producing and non-producing strains (Krömer et al., 2004; Marx et al., 1996;Wittmann and Heinzle, 2001a; Wittmann and Heinzle, 2001b). Surprisingly the flux of this cyclewas much lower for the high producing strain, where only a decarboxylating flux of 4% wasobserved. As a result the anaplerotic netflux for KK-11 was higher (41+3-4 = 40%) than it was thecase for ATCC 21253 (83+0-51 = 32%). It is generally accepted that there is a correlation between
a high anaplerotic netflux and a high lysine production (Kjeldsen and Nielsen, 2008), a correlation
7/18/2019 Samlet PhD 20090416 U-Forside Appendix.pdf
http://slidepdf.com/reader/full/samlet-phd-20090416-u-forside-appendixpdf 143/187
Metabolic network analysis of Corynebacterium glutamicum… ________________________________________________________________________________
145
which is also seen when these two strains are compared. For both strains the major carboxylatingreaction was pyruvate carboxylase (v13 – figure 6.1) contributing to more than 90% of thecarboxylation for KK-11 and 100% for ATCC 21253. This is in agreement with earlier findings forthis organism (Petersen et al., 2000).
TCA cycle
The low producing strain ATCC 21253 exhibited a flux of 79% entering the TCA cycle, whereasthe high producing strain KK-11 showed a significant lower value of 67% (figure 6.3). The reducedgrowth for the high producing strain KK-11 compared to the low producing strain is reflected in thelower TCA flux, thus adapting to the lower anabolic- and ATP-demand. Instead a higheroxaloacetate demand for lysine synthesis mediated a higher anaplerotic netflux.
NADPH balancing
From the obtained information on the metabolic flux distribution a balance for NADPH formationand consumption can be set up. As previously shown there are three major NADPH generating
reactions in C. glutamicum during cultivation on glucose: glucose-6-phosphate dehydrogenase(Sugimoto and Shiio, 1987a), 6-phosphogluconate dehydrogenase (Sugimoto and Shiio, 1987b) andisocitrate dehydrogenase (Eikmanns et al., 1995). This leads to a NADPH formation of 83 + 83 +67 = 233% for the high producing strain KK-11, and 37 + 37 + 79 = 153% for the low producingstain ATCC 21253. NADPH is required for growth and for lysine production. With a demand of16.429 mmol NADPH ⋅ (g biomass)-1 (Wittmann and de Graaf, 2005) and biomass yields of 54.3 g ⋅ (mol glucose)-1 and 90.5 g ⋅ (mol glucose)-1 for KK-11 and ATCC 21253, respectively and with ademand of four NADPH for one molecule of lysine the NADPH demand for KK-11 is 176% andfor ATCC 21253 it is 156%. This leads to a NADPH excess of 57% for the high producing strainKK-11. Similar findings have been reported in other lysine producing strains (Krömer et al., 2004;Wittmann and Heinzle, 2001a; Wittmann and Heinzle, 2002). For ATCC 21253 the NADPH
balance almost closed with a deficit of only 3%.
Flux estimation during fed-batch fermentation
The labeling patterns of the proteinoic amino acids of the biomass are used for flux estimations.Since the labeling patters of the protein pool changes relatively slowly compared to physiologicalresponses of the cells, an error occurs when making flux estimations on non-steady state cultureswith non-constant physiological behavior. However, the labeling patterns of the proteinoic aminoacids formed after a metabolic shift due to changes in physiological behavior will be reflected in thelabeling patterns of the combined pools of “old” and “new” protein. Using the generally appliedmethod for flux estimations as used earlier for the batch cultivations, samples taken at different
parts of the fed-batch phase were analyzed. As samples taken in the fed-batch phase are not steadystate samples, the in vivo fluxes estimated do not represent the real fluxes, but they do point totrends in changes in the metabolism. Flux estimations using this strategy have earlier been termed“integrated fluxes” (Jonsbu et al., 2001).
Integrated fluxes through the central carbon metabolism
Three integrated fluxes related to central carbon metabolism were analyzed to see the effect of thechange from high specific growth and low lysine production to low specific growth and high lysine
production as seen in table 6.1. The fluxes evaluated were the pentose phosphate pathway, theanaplerotic netflux, and the flux through the TCA cycle (Figure 6.4A and Figure 6.4B). For thefluxes presented here a smooth development in the fluxes was generally observed indicating that the
metabolic changes due to the physiological change were constant. For the high producing strain
7/18/2019 Samlet PhD 20090416 U-Forside Appendix.pdf
http://slidepdf.com/reader/full/samlet-phd-20090416-u-forside-appendixpdf 144/187
Chapter 6 ________________________________________________________________________________
146
KK-11 a 1.1-fold increase in the pentose phosphate pathway flux was seen so the integrated fluxwas 91% at the last part of the fed-batch phase (Figure 6.2A). For the low producing strain ATCC21253, a 1.4 increase in the pentose phosphate pathway flux was seen as a consequence of the
physiological change of the culture so an integrated flux of 51% was seen at the end of the fed-
batch phase (Figure 6.4B). The TCA cycle flux for KK-11 was decreased 1.2-fold so the flux at theend of the fed-batch phase was 72%, and the anaplerotic netflux increased 1.1-fold. For ATCC21253 the TCA flux increased 1.2 fold and the anaplerotic netflux decreased 1.3 fold. The increasein the pentose phosphate pathway flux as a consequence of the change in physiological state of theculture seen for both strains was thought to be a consequence of the decreased growth rate loweringthe requirement for ATP and precursors for biomass synthesis. Earlier work on profiling lysinefermentations has shown results which are inconsistent with our findings. Batch-cultures of ATCC21253 was analyzed throughout a fermentation by metabolite balancing (Vallino andStephanopoulos, 1993), and fluxes were found to fluctuate throughout the fermentation, so the
pentose phosphate pathway flux increased from 25% when no lysine was produced to 69% whenthe lysine production phase had just initiated and then dropped to 40% at the later lysine production
phase. In another study batch cultures of C. glutamicum ATCC 13237 was analyzed by metabolite balancing and isotopomer modeling throughout a lysine fermentation (Krömer et al., 2004). Theyfound that the pentose phosphate pathway flux decreased from 72% to 52% when the fermentationchanged from high growth and no lysine production to low specific growth and lysine production.Further, they found that the TCA cycle flux decreased from 70% to 53%, and from 69% to 46% and
Figure 6.4: Integrated fluxes through the central carbon metabolism of two C. glutamicum strains. A) C. glutamicum KK-11. B) C. glutamicum ATCC 21253. Squares: Pentose phosphate pathway flux; Triangles: TCAflux; Diamonds: Anaplerotic netflux.
7/18/2019 Samlet PhD 20090416 U-Forside Appendix.pdf
http://slidepdf.com/reader/full/samlet-phd-20090416-u-forside-appendixpdf 145/187
Metabolic network analysis of Corynebacterium glutamicum… ________________________________________________________________________________
147
back to 70% in the study of Vallino and Stephanopoulos (1993). The major differences between thedata of Krömer et al. (2004) and Vallino and Stephanopoulos (1993) and the data presented in this
paper are the different fermentation strategies applied, and the use of complex medium. In this paper carbon limited fed-batch is applied to avoid the production of byproducts often seen under
batch cultivations, which is expected to change the in vivo flux distribution. In addition to this theuse of complex medium is likely to affect the metabolic fluxes. Both factors may explain thedifferences seen between earlier published data and the data in this paper. Another explanation forthe inconsistence between data presented here and earlier findings could be that the data presentedhere are integrated fluxes, and is therefore an average of the whole fermentation and not a snapshotof the present in vivo fluxes at a given time as seen for the data of Vallino and Stephanopoulos(1993) and Krömer et al. (2004). When comparing the two strains KK-11 and ATCC 21253 thedevelopment in the TCA flux and anaplerotic netflux were found to be different. For KK-11 thedevelopment was expected since an increase in lysine production is generally known to decreaseTCA cycle flux and increase the anaplerotic netflux (Kjeldsen and Nielsen, 2008). However, forATCC 21253 this was not the case under these conditions. Previously a rigid regulation of the
carbon flux at the oxaloacetate node in a lysine producing ATCC 21253 strain in continuous culturewas observed, demanding a higher TCA flux under conditions where oxaloacetate demand wasincreased (Kiss and Stephanopoulos, 1991). The oxaloacetate demand was in fact increased 1.1-foldthrough for the cultivations in this study. Later work on batch cultures of ATCC 21253 and relatedstrains did not show a rigid oxaloacetate node (Wittmann and Heinzle, 2002). However, as pointedout by Wittmann and Heinzle (2002) the metabolic regulation in C. glutamicum might be differentunder the conditions of reduced growth in batch cultures compared to that of continuous culture.And this may also be the case when compared to data from fed-batch cultures. When evaluating thesignificant differences between the integrated fluxes of the two strains compared in this study, itneeds to be taken into account that it seems possible that different mutations affecting metabolicregulation have been introduced to the two strains during random mutagenesis.
Conclusion
Two strains of C. glutamicum, a low producing strain ATCC 21253 and a high producing strainKK-11, were evaluated under batch and fed-batch lysine production in complex medium. The fluxdistribution values found for the low producing strain were in some cases inconsistent with whathave been reported earlier for this strain in batch cultivations in defined medium. This emphasizesthe importance of developing methods for in vivo flux estimation to be able to understand industrial
processes. We were able to identify changes in the central metabolism as a result of the change in physiological state mediated by the change from batch to fed-batch fermentation, changing the
culture from high growth-low lysine excretion to low growth-high lysine excretion. Methods for invivo flux estimations in unbalanced systems such as fed-batch or repeated fed-batch systems areneeded in order to fully understand these systems. The method presented here can be used toidentify tendencies in such systems. The results presented here for an industrial production strainillustrates that significant differences can be seen between industrial production strains and low
producing strains.
7/18/2019 Samlet PhD 20090416 U-Forside Appendix.pdf
http://slidepdf.com/reader/full/samlet-phd-20090416-u-forside-appendixpdf 146/187
Chapter 6 ________________________________________________________________________________
148
References
Becker,J., Klopprogge,C., Herold,A., Zelder,O., Bolten,C.J., and Wittmann,C. (2007) Metabolic
flux engineering of L-lysine production in Corynebacterium glutamicum - over expression andmodification of G6P dehydrogenase. Journal of Biotechnology 132, 99-109.
Burkovski,A. (2005) Nitrogen Metabolim and Its Regulation. In Handbook of Corynebacterium
glutamicum (Edited by Eggeling,L. and Bott,M.) pp. 333-350. CRC Press, Boca Raton.
Christensen,B. (2001) Metabolic Network Analysis: Principles, Methodologies and Applications.PhD-Thesis - BioCentrum-DTU, Technical University of Denmark, Lyngby.
Christensen,B. and Nielsen,J. (1999a) Isotopomer analysis using GC-MS. Metabolic Engineering 1,282-290.
Christensen,B. and Nielsen,J. (1999b) Metabolic network analysis. A powerfull tool in metabolicengineering. Advances in Biochemical Engineering 66, 209-231.
Christensen,B. and Nielsen,J. (2000) Metabolic network analysis of Penicillum chrysogenum using13C-labelled glucose. Biotechnology and Bioengineering 68, 652-659.
Christiansen,T., Christiansen,B., and Nielsen,J. (2002) Metabolic network analysis of Bacillus
clausii on minimal and semirich medium using 13C-labeled glucose. Metabolic Engineering 4, 159-169.
Eikmanns,B.J., Rittmann,D., and Sahm,H. (1995) Cloning, sequence analysis, expression, andinactivation of the Corynebacterium glutamicum icd gene encoding isocitrate dehydrogenase and
biochemical characterization of the enzyme. Journal of Bacteriology 177, 774-782.
Jonsbu,E., Christensen,B., and Nielsen,J. (2001) Changes of in vivo fluxes through centralmetabolic pathways during production of nystatin by Streptomyces noursei in batch culture.Applied Microbiology and Biotechnology 56, 93-100.
Kiefer,P., Heinzle,E., Zelder,O., and Wittmann,C. (2004) Comparative metabolic flux analysis oflysine-producing Corynebacterium glutamicum cultured on glucose or fructose. Applied and
Environmental Microbiology 70, 229-239.
Kiss,R.D. and Stephanopoulos,G. (1991) Metabolic characterization of a L-lysine producing strain by continuous culture. Biotechnology and Bioengineering 39, 565-574.
Kjeldsen,K.R. and Nielsen,J. (2008) In silico genome-scale reconstruction and validation of theCorynebacterium glutamicum metabolic network. Biotechnology and Bioengineering In Press.
Krömer,J.O., Sorgenfrei,O., Klopprogge,K., Heinzle,E., and Wittmann,C. (2004) In-depth profilingof lysine-producing Corynebacterium glutamicum by combined analysis of the transcriptome,metabolome, and fluxome. Journal of Bacteriology 186, 1769-1784.
7/18/2019 Samlet PhD 20090416 U-Forside Appendix.pdf
http://slidepdf.com/reader/full/samlet-phd-20090416-u-forside-appendixpdf 147/187
Metabolic network analysis of Corynebacterium glutamicum… ________________________________________________________________________________
149
Marx,A., de Graaf,A.A., Wiechert,W., Eggeling,L., and Sahm,H. (1996) Determination of thefluxes in the central metabolism of Corynebacterium glutamicum by nuclear magnetic resonancespectroscopy combined with metabolite balancing. Biotechnology and Bioengineering 49, 111-129.Marx,A., Striegel,K., de Graaf,A.A., Sahm,H., and Eggeling,L. (1997) Response of the central
metabolism of Corynebacterium glutamicum to different flux burdens. Biotechnology andBioengineering 56, 168-180.
Möckel,B., Eggeling,L., and Sahm,H. (1992) Functional and structural analysis of threoninedehydratase from Corynebacerium glutamicum. Journal of Bacteriology 174, 8065-8072.
Moritz,B., Striegel,K., de Graff,A.A., and Sahm,H. (2000) Kinetic properties of the glucose-6- phosphate and 6-phosphogluconate dehydrogenases from Corynebacterium glutamicum and theirapplication for predicting pentose phosphate pathway flux in vivo. European Journal ofBiochemistry 267, 3442-3452.
Ohnishi,J., Kakahira,R., Mitsuhashi,S., Kakita,S., and Ikeda,M. (2005) A novel gnd mutationleading to increased L-lysine production in Corynebacterium glutamicum. FEMS MicrobiologyLetters 242, 265-274.
Pedersen,H., Christensen,B., Hjort,C., and Nielsen,J. (2000) Construction and characterization of anoxalic acid non-producing strain of Aspergillus niger . Metabolic Engineering 2, 34-41.
Petersen,S., de Graff,A.A., Eggeling,L., Mollney,M., Wiechert,W., and Sahn,H. (2000) In vivo
quantification of parallel and bidirectional fluxes in the anaplerosis of Corynebacterium
glutamicum. Journal of Biological Chemestry 275, 35932-35941.
Sonntag,K., Schwinde,J.W., de Graaf,A.A., Marx,A., Eikmanns,B.J., Wiechert,W., and Sahm,H.(1995) 13C NMR studies of the fluxes in the central metabolism of Corynebacterium glutamicum during growth and overproduction of aminoacids in batch cultures. Applied Microbiology andBiotechnology 44, 489-495.
Sugimoto,M. and Shiio,I. (1987a) Regulation of glucose-6-phosphate dehydrogenase in Brevibacterium flavum. Agricultural and Biological Chemistry 51, 101-108.
Sugimoto,S. and Shiio,I. (1987b) Regulation of 6-phosphogluconate dehydrogenase in Brevibacterium flavum. Agricultural and Biological Chemistry 51, 1257-1263.
Vallino,J.J. and Stephanopoulos,G. (1993) Metabolic flux distribution in Corynebacterium
glutamicum during growth and lysine overproduction. Biotechnology and Bioengineering 41, 633-646.
Wittmann,C. and de Graaf,A.A. (2005) Metabolic flux analysis in Corynebacterium glutamicum. InHandbook of Corynebacterium glutamicum (Edited by Eggeling,L. and Bott,M.) pp. 277-304. CRCPress, Boca Raton.
Wittmann,C. and Heinzle,E. (1999) Mass spectrometry for metabolic flux analysis. Biotechnologyand Bioengineering 62, 739-750.

7/18/2019 Samlet PhD 20090416 U-Forside Appendix.pdf
http://slidepdf.com/reader/full/samlet-phd-20090416-u-forside-appendixpdf 148/187
Chapter 6 ________________________________________________________________________________
150
Wittmann,C. and Heinzle,E. (2001a) Application of MALDI-TOF MS to lysine-producingCorynebacterium glutamicum: A novel approach for metabolic flux analysis. European Journal ofBiochemestry 268, 2441-2455.Wittmann,C. and Heinzle,E. (2001b) Modeling and experimental design for metabolic flux analysis
of lysine-producing Corynebacteria by mass spectrometry. Metabolic Engineering 3, 173-191.
Wittmann,C. and Heinzle,E. (2002) Genealogy profiling through strain improvement by usingmetabolic network analysis: metabolic flux genealogy of several generations of lysine-producingCorynebacteria. Applied and Environmental Microbiology 68, 5843-5859.
7/18/2019 Samlet PhD 20090416 U-Forside Appendix.pdf
http://slidepdf.com/reader/full/samlet-phd-20090416-u-forside-appendixpdf 149/187
Conclusion and discussion ________________________________________________________________________________
151
Chapter 7
Conclusion and discussion
In the present PhD project various strategies have been applied in order to pursue the overall goal ofimproving an industrial L-lysine producing Corynebacterium glutamicum strain. The experimental
part of the project can be divided into three separate parts all of which are described below.
Reconstruction and analysis of C. glutamicum metabolic network
A mathematical model of the metabolic network of C. glutamicum based on genomic information,and based on the wealth of biochemical information which is available for this organism due to its
long history as a commercial relevant organism was constructed and validated against earlier published data. The in silico model constructed in this study is described in detail in chapter 4, andwas made based on the annotated genome of the wild type strain of C. glutamicum (ATCC 13032)and published biochemical information on C. glutamicum. The model was validated against datafrom a series of well recognized scientific papers, and the model predictions were found to fit wellwith experimental data. The model was used to analyze the metabolic network during lysine
production, and based on this a number of biological hypotheses were suggested to improve lysine production in C. glutamicum. The first prediction made by the model was that a high ATP production under high lysine production resulted in a limitation in lysine production. This was thecase at high lysine yield (>55%) and low growth. When ATP was in excess under these conditionsthe model had to handle this excess energy burning up excess ATP in futile cycles suboptimal for
lysine synthesis. Secondly, the model predicted a limitation in lysine production when thesuccinylase branch of the lysine synthetic pathway was preferred over the dehydrogenase branch.The result was a decrease in maximal theoretical lysine yield from 0.75 mmol lysine ⋅ (mmolglucose)-1 to 0.57 mmol lysine ⋅ (mmol glucose)-1 due to a relatively higher activity of the TCAcycle because of the involvement of the TCA intermediate Succinyl-CoA. The higher TCA cycleactivity was suboptimal for lysine production because of a loss of carbon due to CO2 –production.Thirdly, the model predicted a correlation between a high pentose phosphate pathway flux and highlysine production. This correlated well with earlier published data, and increasing the flux throughthe pentose phosphate pathway by metabolic engineering was chosen as a metabolic engineeringstrategy. The fourth prediction made from the analysis of the in silico model was the correlation
between increasing anaplerotic netflux and increasing lysine production. This correlation could also be confirmed from a large number of scientific papers, why this strategy also was chosen formetabolic engineering.
The in silico model constructed and presented in this thesis is made from data from various sources based on data from different strains including both lysine producing and non-producing strains. Toimprove the prediction power of the model and to fit the predictions to a specific strain (i.e. a highlymutagenized production strain) the model needs to be adjusted and improved with data from thespecific strain. The data in this respect could be in vivo flux data or transkriptomic data made under
production relevant conditions. It is believed that by implementing this type of data from the high producing strain used in this study the prediction power will be improved, when the metabolic
network is analyzed and when biological hypotheses are tested in silico. In this study in vivo flux
7/18/2019 Samlet PhD 20090416 U-Forside Appendix.pdf
http://slidepdf.com/reader/full/samlet-phd-20090416-u-forside-appendixpdf 150/187
Chapter 7 ________________________________________________________________________________
152
estimations on the high producing strain was conducted, but, these data were not implemented inthe model presented in this thesis as they were first obtained at the end of the PhD study.
Comparison of various metabolic engineering strategies in a high producing C. glutamicum strain
Various metabolic engineering strategies were tested in a high producing C. glutamicum strain asdescribed in chapter 5. Based on the findings in the metabolic network reconstruction and based onresults reported in literature three parts of the metabolism were selected for metabolic engineering.As predicted by the in silico model the pentose phosphate pathway was selected to increase the
NADPH formation. The two NADPH generating enzymes glucose-6-phosphate dehydrogenase( zwf ) and 6-phosphogluconate dehydrogenase ( gnd ) was up-regulated, and both modifications wereseen to have a positive effect on lysine yield of 5% and 6%, respectively, indicating that NADPHwas in fact limiting under high lysine producing conditions. The enzyme pyruvate carboxylase ( pyc)
was also selected for up-regulations to increase the anaplerotic netflux which is believed to be beneficial for lysine production based on findings in literature and predictions by the in silico model. This modification resulted in a decrease in lysine production and did not fit our initialexpectations. Five enzymes in the lysine synthetic pathway were selected for up-regulation based onresults found in literature. The enzymes were aspartate kinase (lysC ), dihydrodipicolate syntase(dapA), succinylaminoketopimelate transaminase (dapC ), diaminopimelate epimerase (dapF ) andlysine permerase (lysE ). Only the strain with an up-regulated aspartate kinase activity showed asignificant effect on the overall lysine yield, and this effect was negative. In this study it was seenthat although metabolic engineering strategies had earlier been shown to be beneficial for lysine
production in C. glutamicum strains, many of these strategies could not be transferred directly to ahigh producing industrial strain.
In vivo flux estimations under industrial relevant conditions
Estimations of in vivo fluxes under growth and lysine production in complex medium and during batch and fed-batch fermentation were conducted. These results are presented in detail in chapter 6.For the industrial strain, C. glutamicum KK-11, a higher flux through the pentose phosphate
pathway was seen compared to earlier published data. This high flux may be explained by the factthat this highly mutagenized strain can be expected to have mutations not present in low producingstrains. In addition to this the role of the complex medium components can affect metabolic fluxes.In addition to flux estimations during balanced growth present in the batch phase of thefermentation, the method was employed on samples from the fed-batch phase of the fermentation.
These results were used to identify metabolic changes when the physiological state of the cells waschanged. The tendencies identified employing this method was an increase in the pentose phosphate
pathway flux, a decrease in the TCA flux, and a increase in the anaplerotic net flux. Another C.
glutamicum strain, ATCC 21253, earlier used in flux estimation studies was also included in theflux estimation study. This strain was found to have lower pentose phosphate pathway fluxescompared with the industrial strain. And during the change from batch to fed-batch fermentation thetendencies were different than what was seen for the industrial strain. The pentose phosphate
pathway flux was increased as seen for the industrial strain, but TCA flux was increased andanaplerotic netflux decreased. These differences are discussed more in detail in chapter 6.
The idea of making metabolic flux estimations under production relevant conditions is quiteappealing seen from an industrial point of view, because this will give a true picture of what is
7/18/2019 Samlet PhD 20090416 U-Forside Appendix.pdf
http://slidepdf.com/reader/full/samlet-phd-20090416-u-forside-appendixpdf 151/187
Conclusion and discussion ________________________________________________________________________________
153
going on in the industry scale fermentation. On the other hand it is not trivial at all to get reliableflux estimation results due to a number of practical challenges. First of all industrial fermentationsare typically carried out in complex medium containing complex components such as corn steepliquor, molasses, protein hydrolysates etc. Many of these components will affect the results of the
measurements making the basis of the flux estimation, and this needs to be taken into account. Inthe present study some of these challenges were met by excluding data which were affected by thecomplex components. However, this limits the number of inputs to the flux model which may affectthe accuracy of the flux estimations. Another problem is the fact that flux balance estimations aremade during balanced growth which is seen during exponential growth. However, for an industrialscale lysine production process the exponential growth phase is only a small part of thefermentation, and measurements in this phase does not represent the production phase which is themost interesting part from an industrial point of view. In this study the effects of the physiologicalchanges made when the fermentation was changed from batch to fed-batch was analyzed by lookingat the integrated fluxes which gave a clear indication on these changes based on the tendencies seenin the development in flux distributions. This approach of course has some limitations since the
results reflect an average of the “old” biomass produced before the physiological change and the“new” biomass. The results can therefore not be used to identify the absolute fluxes at a given time-
point. Even though there have recently been developed concepts and methods for flux quantificationduring dynamic growth conditions through measurements of labeling patterns in intracellularmetabolites, this is still quite complex due to the turn over of both protein and transaminase reactioninvolving amino acids and keto-acids.
The in vivo flux distribution estimations found for the industrial production strain can be used toimprove the C. glutamicum in silico metabolic model presented in this study to fit the industrial
production strain used in this study.
Industrial relevance of project
In this industrial PhD-project a number of industrial relevant problems have been addressed. Themain purpose of the project was to improve a C. glutamicum industrial production strain. To pursuethis goal the above mentioned methods were applied. Each of these methods has earlier beenapplied on C. glutamicum or other organism. In this study the three methods has been unified toform a strategy for strain improvement (Figure 7.1). Using the constructed in silico metabolic model
biological hypotheses can be tested and predictions can be used to propose metabolic engineeringstrategies. These strategies can be tested using metabolic engineering followed by an evaluation ofthe effects on lysine production of the metabolic engineering strategies making fermentations,
simulating production scale fermentation conditions. In addition to this the development of amethod for estimating in vivo metabolic fluxes under production-like conditions gives a directmeasure for the effect of the introduced modification on the metabolic flux distribution, and theseresults can be used to improve the in silico model. As seen in figure 7.1 all three parts are connectedand it is the idea that by continuing this process the metabolic model will be improved, the
predictions will be improved and at the end an improved production strain will be the result.
Another challenge which has been addressed is the use of complex medium, which is generallyapplied in industry scale fermentations. As mentioned above a number of problems can beidentified using complex based medium. In this study metabolic flux estimations were conducted incomplex medium, and this represents a major new contribution to the field of flux analysis of lysine
producing strains.
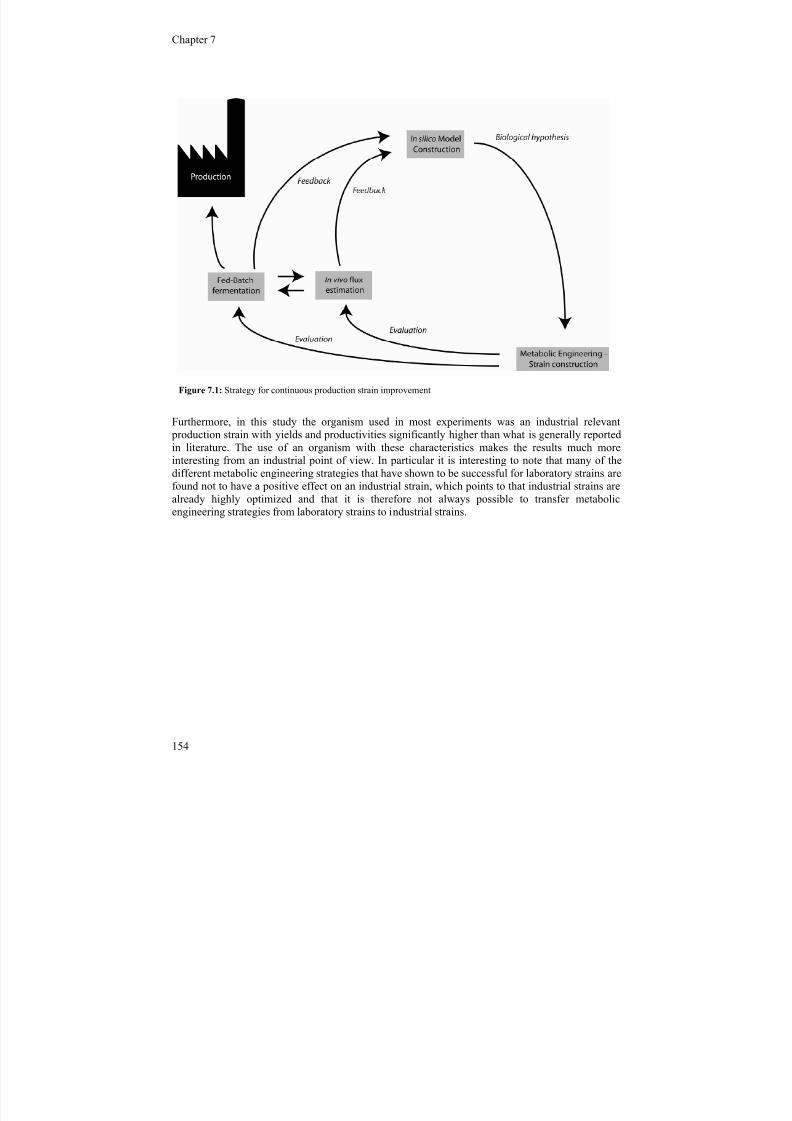
7/18/2019 Samlet PhD 20090416 U-Forside Appendix.pdf
http://slidepdf.com/reader/full/samlet-phd-20090416-u-forside-appendixpdf 152/187
Chapter 7 ________________________________________________________________________________
154
Furthermore, in this study the organism used in most experiments was an industrial relevant production strain with yields and productivities significantly higher than what is generally reportedin literature. The use of an organism with these characteristics makes the results much moreinteresting from an industrial point of view. In particular it is interesting to note that many of thedifferent metabolic engineering strategies that have shown to be successful for laboratory strains arefound not to have a positive effect on an industrial strain, which points to that industrial strains arealready highly optimized and that it is therefore not always possible to transfer metabolicengineering strategies from laboratory strains to industrial strains.
Figure 7.1: Strategy for continuous production strain improvement

7/18/2019 Samlet PhD 20090416 U-Forside Appendix.pdf
http://slidepdf.com/reader/full/samlet-phd-20090416-u-forside-appendixpdf 153/187
Appendix I
Reaction list for genome-scale
reconstruction of Corynebacterium
glutamicum metabolic network
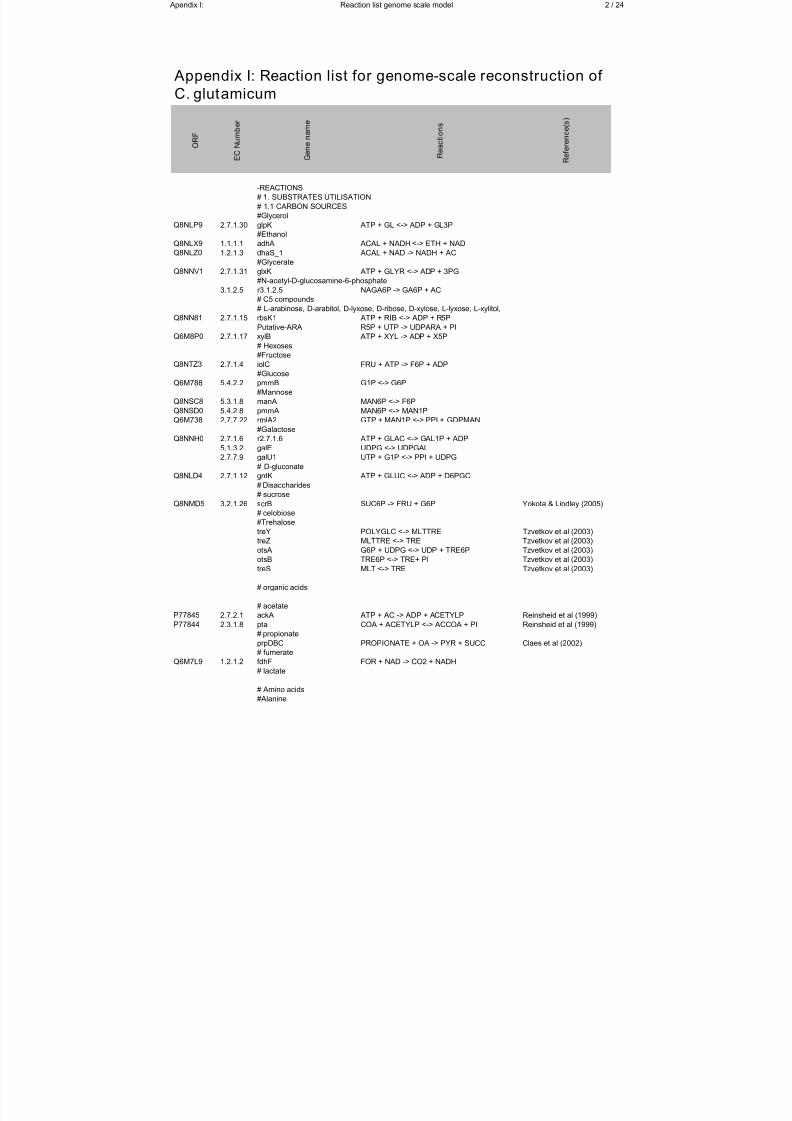
7/18/2019 Samlet PhD 20090416 U-Forside Appendix.pdf
http://slidepdf.com/reader/full/samlet-phd-20090416-u-forside-appendixpdf 154/187
Apendix I: Reaction list genome scale model 2 / 24
O R F
E C
N u m b e r
G e n e n
a m e
R e a c t i o n s
R e f e r e n
c e ( s )
-REACTIONS
# 1. SUBSTRATES UTILISATION
# 1.1 CARBON SOURCES
#Glycerol
Q8NLP9 2.7.1.30 glpK ATP + GL <-> ADP + GL3P
#Ethanol
Q8NLX9 1.1.1.1 adhA ACAL + NADH <-> ETH + NAD
Q8NLZ0 1.2.1.3 dhaS_1 ACAL + NAD -> NADH + AC
#Glycerate
Q8NNV1 2.7.1.31 glxK ATP + GLYR <-> ADP + 3PG
#N-acetyl-D-glucosamine-6-phosphate
3.1.2.5 r3.1.2.5 NAGA6P -> GA6P + AC
# C5 compounds
# L-arabinose, D-arabitol, D-lyxose, D-ribose, D-xylose, L-lyxose, L-xylitol,
Q8NN81 2.7.1.15 rbsK1 ATP + RIB <-> ADP + R5P
Putative-ARA R5P + UTP -> UDPARA + PI
Q6M8P0 2.7.1.17 xylB ATP + XYL -> ADP + X5P
# Hexoses
#Fructose
Q8NTZ3 2.7.1.4 iolC FRU + ATP -> F6P + ADP
#Glucose
Q6M788 5.4.2.2 pmmB G1P <-> G6P
#Mannose
Q8NSC8 5.3.1.8 manA MAN6P <-> F6P
Q8NSD0 5.4.2.8 pmmA MAN6P <-> MAN1P
Q6M738 2.7.7.22 rmlA2 GTP + MAN1P <-> PPI + GDPMAN
#Galactose
Q8NNH0 2.7.1.6 r2.7.1.6 ATP + GLAC <-> GAL1P + ADP
5.1.3.2 galE UDPG <-> UDPGAL
2.7.7.9 galU1 UTP + G1P <-> PPI + UDPG
# D-gluconate
Q8NLD4 2.7.1.12 gntK ATP + GLUC <-> ADP + D6PGC
# Disaccharides
# sucrose
Q8NMD5 3.2.1.26 scrB SUC6P -> FRU + G6P Yokota & Lindley (2005)
# celobiose
#Trehalose
treY POLYGLC <-> MLTTRE Tzvetkov et al (2003)
treZ MLTTRE <-> TRE Tzvetkov et al (2003)
otsA G6P + UDPG <-> UDP + TRE6P Tzvetkov et al (2003)
otsB TRE6P <-> TRE+ PI Tzvetkov et al (2003)
treS MLT <-> TRE Tzvetkov et al (2003)
# organic acids
# acetate
P77845 2.7.2.1 ackA ATP + AC -> ADP + ACETYLP Reinsheid et al (1999)
P77844 2.3.1.8 pta COA + ACETYLP <-> ACCOA + PI Reinsheid et al (1999)
# propionate
prpDBC PROPIONATE + OA -> PYR + SUCC Claes et al (2002)
# fumerate
Q6M7L9 1.2.1.2 fdhF FOR + NAD -> CO2 + NADH
# lactate
# Amino acids#Alanine
Appendix I: Reaction list for genome-scale reconstruction of
C. glutamicum
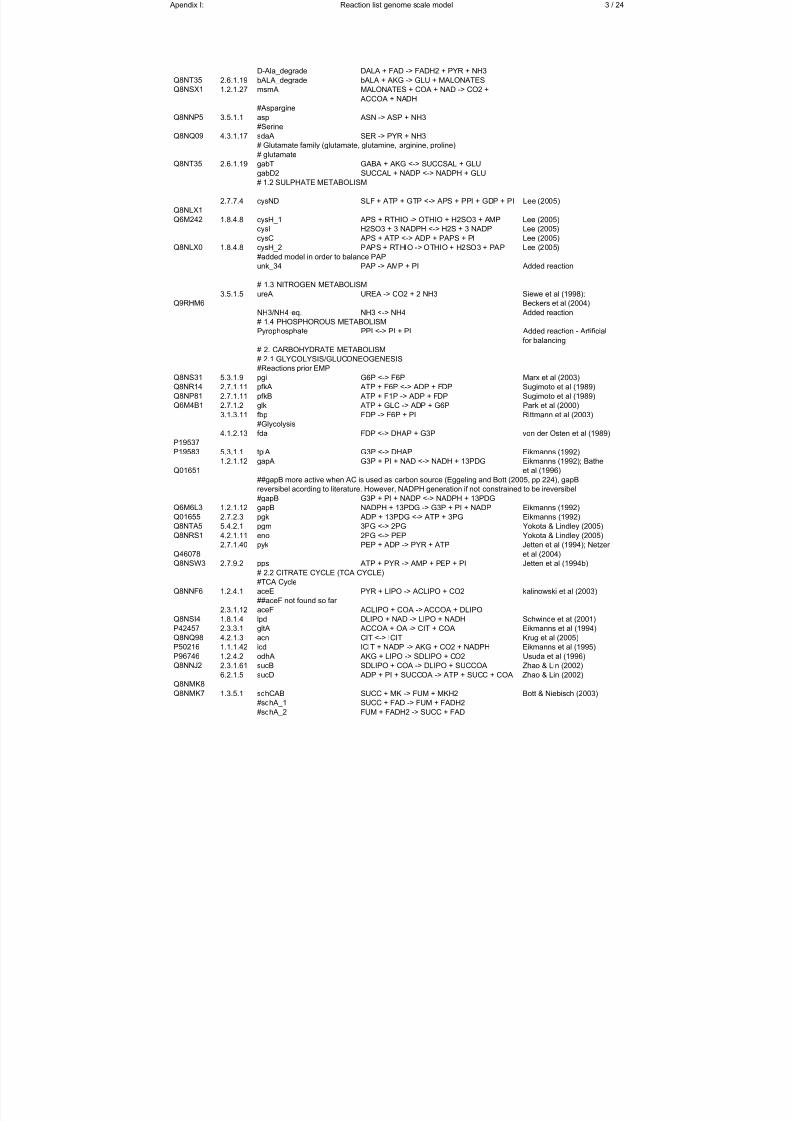
7/18/2019 Samlet PhD 20090416 U-Forside Appendix.pdf
http://slidepdf.com/reader/full/samlet-phd-20090416-u-forside-appendixpdf 155/187
Apendix I: Reaction list genome scale model 3 / 24
D-Ala_degrade DALA + FAD -> FADH2 + PYR + NH3
Q8NT35 2.6.1.19 bALA_degrade bALA + AKG -> GLU + MALONATES
Q8NSX1 1.2.1.27 msmA
#Aspargine
Q8NNP5 3.5.1.1 asp ASN -> ASP + NH3
#Serine
Q8NQ09 4.3.1.17 sdaA SER -> PYR + NH3 # Glutamate family (glutamate, glutamine, arginine, proline)
# glutamate
Q8NT35 2.6.1.19 gabT GABA + AKG <-> SUCCSAL + GLU
gabD2 SUCCAL + NADP <-> NADPH + GLU
# 1.2 SULPHATE METABOLISM
Q8NLX1
2.7.7.4 cysND SLF + ATP + GTP <-> APS + PPI + GDP + PI Lee (2005)
Q6M242 1.8.4.8 cysH_1 APS + RTHIO -> OTHIO + H2SO3 + AMP Lee (2005)
cysI H2SO3 + 3 NADPH <-> H2S + 3 NADP Lee (2005)
cysC APS + ATP <-> ADP + PAPS + PI Lee (2005)
Q8NLX0 1.8.4.8 cysH_2 PAPS + RTHIO -> OTHIO + H2SO3 + PAP Lee (2005)
#added model in order to balance PAP
unk_34 PAP -> AMP + PI Added reaction
# 1.3 NITROGEN METABOLISM
Q9RHM6
3.5.1.5 ureA UREA -> CO2 + 2 NH3 Siewe et al (1998);
Beckers et al (2004)
NH3/NH4-eq. NH3 <-> NH4 Added reaction
# 1.4 PHOSPHOROUS METABOLISM
Pyrophosphate PPI <-> PI + PI Added reaction - Artificial
for balancing
# 2. CARBOHYDRATE METABOLISM
# 2.1 GLYCOLYSIS/GLUCONEOGENESIS
#Reactions prior EMP
Q8NS31 5.3.1.9 pgi G6P <-> F6P Marx et al (2003)
Q8NR14 2.7.1.11 pfkA ATP + F6P <-> ADP + FDP Sugimoto et al (1989)
Q8NP81 2.7.1.11 pfkB ATP + F1P -> ADP + FDP Sugimoto et al (1989)
Q6M4B1 2.7.1.2 glk ATP + GLC -> ADP + G6P Park et al (2000)
3.1.3.11 fbp FDP -> F6P + PI Rittmann et al (2003) #Glycolysis
P19537
4.1.2.13 fda FDP <-> DHAP + G3P von der Osten et al (1989)
P19583 5.3.1.1 tpiA G3P <-> DHAP Eikmanns (1992)
Q01651
1.2.1.12 gapA G3P + PI + NAD <-> NADH + 13PDG Eikmanns (1992); Bathe
et al (1996)
#gapB G3P + PI + NADP <-> NADPH + 13PDG
Q6M6L3 1.2.1.12 gapB NADPH + 13PDG -> G3P + PI + NADP Eikmanns (1992)
Q01655 2.7.2.3 pgk ADP + 13PDG <-> ATP + 3PG Eikmanns (1992)
Q8NTA5 5.4.2.1 pgm 3PG <-> 2PG Yokota & Lindley (2005)
Q8NRS1 4.2.1.11 eno 2PG <-> PEP Yokota & Lindley (2005)
Q46078
2.7.1.40 pyk PEP + ADP -> PYR + ATP Jetten et al (1994); Netzer
et al (2004)Q8NSW3 2.7.9.2 pps ATP + PYR -> AMP + PEP + PI Jetten et al (1994b)
# 2.2 CITRATE CYCLE (TCA CYCLE)
#TCA Cycle
Q8NNF6 1.2.4.1 aceE PYR + LIPO -> ACLIPO + CO2 kalinowski et al (2003)
##aceF not found so far
2.3.1.12 aceF ACLIPO + COA -> ACCOA + DLIPO
Q8NSI4 1.8.1.4 lpd DLIPO + NAD -> LIPO + NADH Schwinde et at (2001)
P42457 2.3.3.1 gltA ACCOA + OA -> CIT + COA Eikmanns et al (1994)
Q8NQ98 4.2.1.3 acn CIT <-> ICIT Krug et al (2005)
P50216 1.1.1.42 icd ICIT + NADP -> AKG + CO2 + NADPH Eikmanns et al (1995)
P96746 1.2.4.2 odhA AKG + LIPO -> SDLIPO + CO2 Usuda et al (1996)
Q8NNJ2 2.3.1.61 sucB SDLIPO + COA -> DLIPO + SUCCOA Zhao & Lin (2002)
Q8NMK8
6.2.1.5 sucD ADP + PI + SUCCOA -> ATP + SUCC + COA Zhao & Lin (2002)
Q8NMK7 1.3.5.1 sdhCAB SUCC + MK -> FUM + MKH2 Bott & Niebisch (2003) #sdhA_1 SUCC + FAD -> FUM + FADH2
#sdhA_2 FUM + FADH2 -> SUCC + FAD
MALONATES + COA + NAD -> CO2 +
ACCOA + NADH
##gapB more active when AC is used as carbon source (Eggeling and Bott (2005, pp 224), gapB
reversibel acording to literature. However, NADPH generation if not constrained to be ireversibel
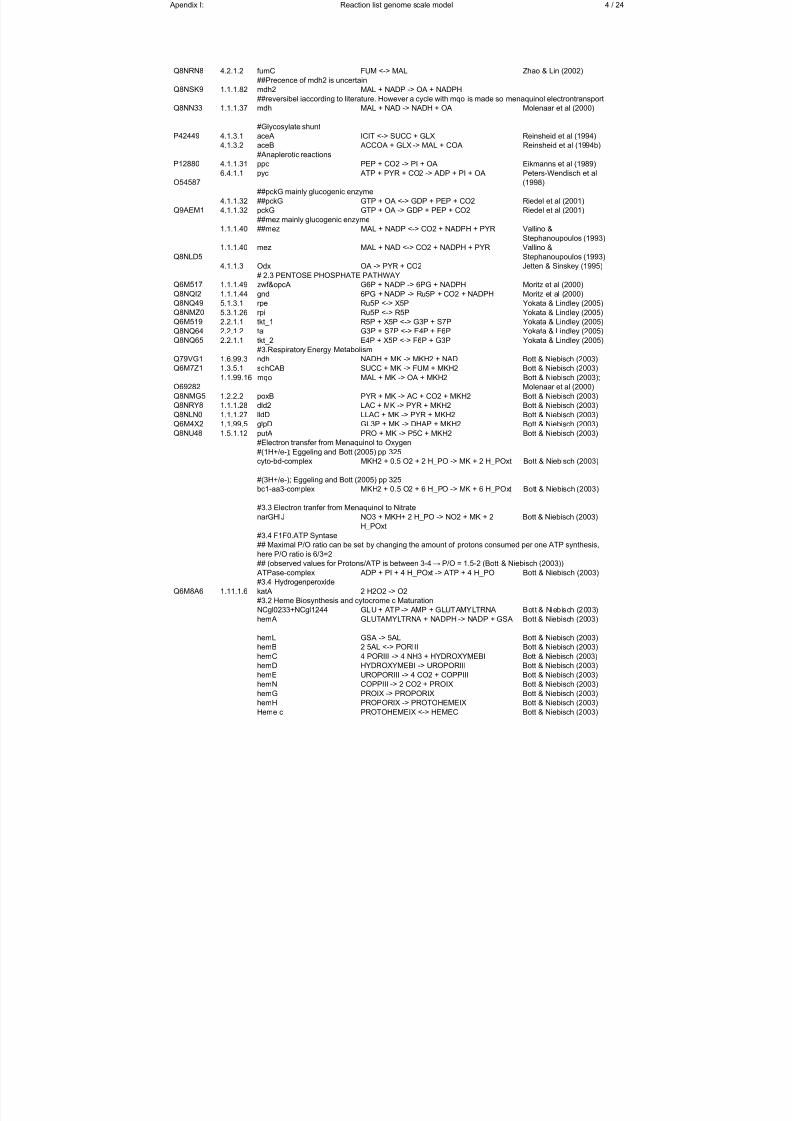
7/18/2019 Samlet PhD 20090416 U-Forside Appendix.pdf
http://slidepdf.com/reader/full/samlet-phd-20090416-u-forside-appendixpdf 156/187
Apendix I: Reaction list genome scale model 4 / 24
Q8NRN8 4.2.1.2 fumC FUM <-> MAL Zhao & Lin (2002)
##Precence of mdh2 is uncertain
Q8NSK9 1.1.1.82 mdh2 MAL + NADP -> OA + NADPH
Q8NN33 1.1.1.37 mdh MAL + NAD -> NADH + OA Molenaar et al (2000)
#Glycosylate shunt
P42449 4.1.3.1 aceA ICIT <-> SUCC + GLX Reinsheid et al (1994)4.1.3.2 aceB ACCOA + GLX -> MAL + COA Reinsheid et al (1994b)
#Anaplerotic reactions
P12880 4.1.1.31 ppc PEP + CO2 -> PI + OA Eikmanns et al (1989)
O54587
6.4.1.1 pyc ATP + PYR + CO2 -> ADP + PI + OA Peters-Wendisch et al
(1998)
##pckG mainly glucogenic enzyme
4.1.1.32 ##pckG GTP + OA <-> GDP + PEP + CO2 Riedel et al (2001)
Q9AEM1 4.1.1.32 pckG GTP + OA -> GDP + PEP + CO2 Riedel et al (2001)
##mez mainly glucogenic enzyme
1.1.1.40 ##mez MAL + NADP <-> CO2 + NADPH + PYR Vallino &
Stephanoupoulos (1993)
Q8NLD5
1.1.1.40 mez MAL + NAD <-> CO2 + NADPH + PYR Vallino &
Stephanoupoulos (1993)
4.1.1.3 Odx OA -> PYR + CO2 Jetten & Sinskey (1995)
# 2.3 PENTOSE PHOSPHATE PATHWAYQ6M517 1.1.1.49 zwf&opcA G6P + NADP -> 6PG + NADPH Moritz et al (2000)
Q8NQI2 1.1.1.44 gnd 6PG + NADP -> Ru5P + CO2 + NADPH Moritz et al (2000)
Q8NQ49 5.1.3.1 rpe Ru5P <-> X5P Yokata & Lindley (2005)
Q8NMZ0 5.3.1.26 rpi Ru5P <-> R5P Yokata & Lindley (2005)
Q6M519 2.2.1.1 tkt_1 R5P + X5P <-> G3P + S7P Yokata & Lindley (2005)
Q8NQ64 2.2.1.2 tal G3P + S7P <-> E4P + F6P Yokata & Lindley (2005)
Q8NQ65 2.2.1.1 tkt_2 E4P + X5P <-> F6P + G3P Yokata & Lindley (2005)
#3.Respiratory Energy Metabolism
Q79VG1 1.6.99.3 ndh NADH + MK -> MKH2 + NAD Bott & Niebisch (2003)
Q6M7Z1 1.3.5.1 sdhCAB SUCC + MK -> FUM + MKH2 Bott & Niebisch (2003)
O69282
1.1.99.16 mqo MAL + MK -> OA + MKH2 Bott & Niebisch (2003);
Molenaar et al (2000)
Q8NMG5 1.2.2.2 poxB PYR + MK -> AC + CO2 + MKH2 Bott & Niebisch (2003)
Q8NRY8 1.1.1.28 dld2 LAC + MK -> PYR + MKH2 Bott & Niebisch (2003)
Q8NLN0 1.1.1.27 lldD LLAC + MK -> PYR + MKH2 Bott & Niebisch (2003)Q6M4X2 1.1.99.5 glpD GL3P + MK -> DHAP + MKH2 Bott & Niebisch (2003)
Q8NU48 1.5.1.12 putA PRO + MK -> P5C + MKH2 Bott & Niebisch (2003)
#Electron transfer from Menaquinol to Oxygen
#(1H+/e-); Eggeling and Bott (2005) pp 325
cyto-bd-complex MKH2 + 0.5 O2 + 2 H_PO -> MK + 2 H_POxt Bott & Niebisch (2003)
#(3H+/e-); Eggeling and Bott (2005) pp 325
bc1-aa3-complex MKH2 + 0.5 O2 + 6 H_PO -> MK + 6 H_POxt Bott & Niebisch (2003)
#3.3 Electron tranfer from Menaquinol to Nitrate
narGHIJ NO3 + MKH+ 2 H_PO -> NO2 + MK + 2
H_POxt
Bott & Niebisch (2003)
#3.4 F1F0.ATP Syntase
## (observed values for Protons/ATP is between 3-4→ P/O = 1.5-2 (Bott & Niebisch (2003))
ATPase-complex ADP + PI + 4 H_POxt -> ATP + 4 H_PO Bott & Niebisch (2003)
#3.4 Hydrogenperoxide
Q6M8A6 1.11.1.6 katA 2 H2O2 -> O2
#3.2 Heme Biosynthesis and cytocrome c Maturation
NCgl0233+NCgl1244 GLU + ATP -> AMP + GLUTAMYLTRNA Bott & Niebisch (2003)
hemA GLUTAMYLTRNA + NADPH -> NADP + GSA Bott & Niebisch (2003)
hemL GSA -> 5AL Bott & Niebisch (2003)
hemB 2 5AL <-> PORIII Bott & Niebisch (2003)
hemC 4 PORIII -> 4 NH3 + HYDROXYMEBI Bott & Niebisch (2003)
hemD HYDROXYMEBI -> UROPORIII Bott & Niebisch (2003)
hemE UROPORIII -> 4 CO2 + COPPIII Bott & Niebisch (2003)
hemN COPPIII -> 2 CO2 + PROIX Bott & Niebisch (2003)
hemG PROIX -> PROPORIX Bott & Niebisch (2003) hemH PROPORIX -> PROTOHEMEIX Bott & Niebisch (2003)
Heme c PROTOHEMEIX <-> HEMEC Bott & Niebisch (2003)
## Maximal P/O ratio can be set by changing the amount of protons consumed per one ATP synthesis,
here P/O ratio is 6/3=2
##reversibel iaccording to literature. However a cycle with mqo is made so menaquinol electrontransport
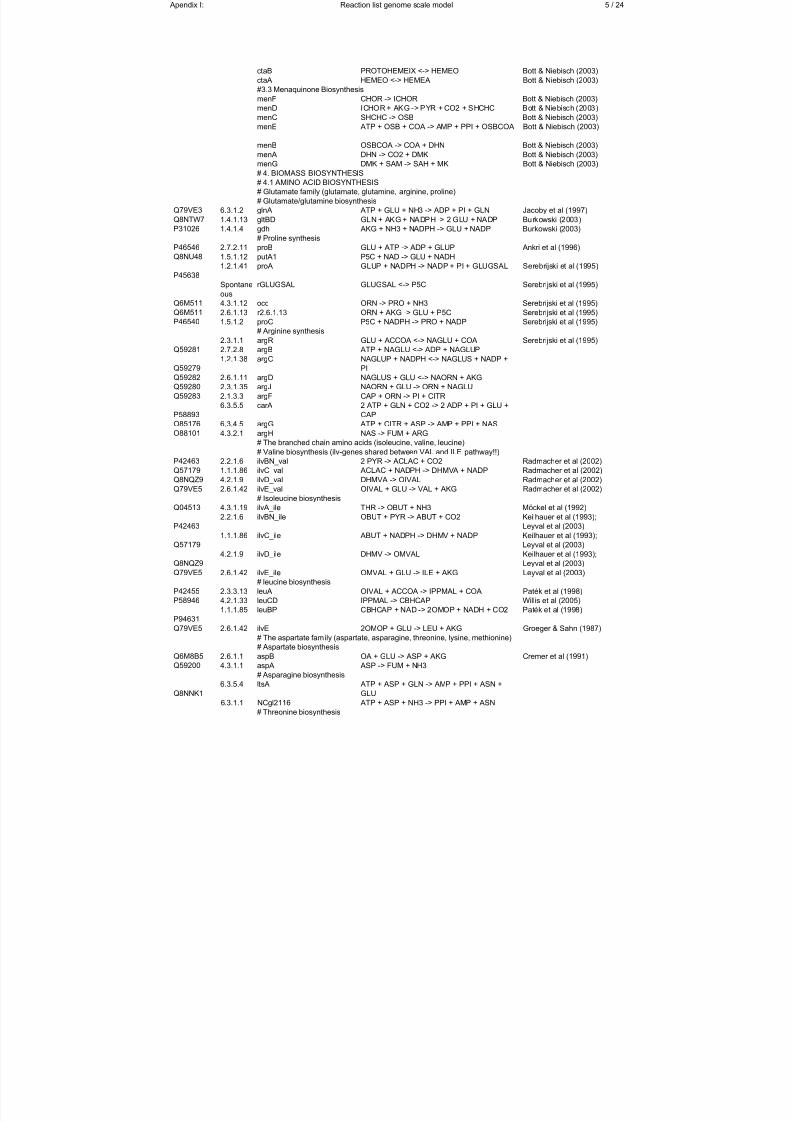
7/18/2019 Samlet PhD 20090416 U-Forside Appendix.pdf
http://slidepdf.com/reader/full/samlet-phd-20090416-u-forside-appendixpdf 157/187
Apendix I: Reaction list genome scale model 5 / 24
ctaB PROTOHEMEIX <-> HEMEO Bott & Niebisch (2003)
ctaA HEMEO <-> HEMEA Bott & Niebisch (2003)
#3.3 Menaquinone Biosynthesis
menF CHOR -> ICHOR Bott & Niebisch (2003)
menD ICHOR + AKG -> PYR + CO2 + SHCHC Bott & Niebisch (2003)
menC SHCHC -> OSB Bott & Niebisch (2003)
menE ATP + OSB + COA -> AMP + PPI + OSBCOA Bott & Niebisch (2003)
menB OSBCOA -> COA + DHN Bott & Niebisch (2003)
menA DHN -> CO2 + DMK Bott & Niebisch (2003)
menG DMK + SAM -> SAH + MK Bott & Niebisch (2003)
# 4. BIOMASS BIOSYNTHESIS
# 4.1 AMINO ACID BIOSYNTHESIS
# Glutamate family (glutamate, glutamine, arginine, proline)
# Glutamate/glutamine biosynthesis
Q79VE3 6.3.1.2 glnA ATP + GLU + NH3 -> ADP + PI + GLN Jacoby et al (1997)
Q8NTW7 1.4.1.13 gltBD GLN + AKG + NADPH -> 2 GLU + NADP Burkowski (2003)
P31026 1.4.1.4 gdh AKG + NH3 + NADPH -> GLU + NADP Burkowski (2003)
# Proline synthesis
P46546 2.7.2.11 proB GLU + ATP -> ADP + GLUP Ankri et al (1996)
Q8NU48 1.5.1.12 putA1 P5C + NAD -> GLU + NADH
P45638
1.2.1.41 proA GLUP + NADPH -> NADP + PI + GLUGSAL Serebrijski et al (1995)
Spontane
ous
rGLUGSAL GLUGSAL <-> P5C Serebrijski et al (1995)
Q6M511 4.3.1.12 ocd ORN -> PRO + NH3 Serebrijski et al (1995)
Q6M511 2.6.1.13 r2.6.1.13 ORN + AKG -> GLU + P5C Serebrijski et al (1995)
P46540 1.5.1.2 proC P5C + NADPH -> PRO + NADP Serebrijski et al (1995)
# Arginine synthesis
2.3.1.1 argR GLU + ACCOA <-> NAGLU + COA Serebrijski et al (1995)
Q59281 2.7.2.8 argB ATP + NAGLU <-> ADP + NAGLUP
Q59279
1.2.1.38 argC NAGLUP + NADPH <-> NAGLUS + NADP +
PI
Q59282 2.6.1.11 argD NAGLUS + GLU <-> NAORN + AKG
Q59280 2.3.1.35 argJ NAORN + GLU -> ORN + NAGLU
Q59283 2.1.3.3 argF CAP + ORN -> PI + CITR
P58893
6.3.5.5 carA 2 ATP + GLN + CO2 -> 2 ADP + PI + GLU +
CAPO85176 6.3.4.5 argG ATP + CITR + ASP -> AMP + PPI + NAS
O88101 4.3.2.1 argH NAS -> FUM + ARG
# The branched chain amino acids (isoleucine, valine, leucine)
# Valine biosynthesis (ilv-genes shared between VAL and ILE pathway!!)
P42463 2.2.1.6 ilvBN_val 2 PYR -> ACLAC + CO2 Radmacher et al (2002)
Q57179 1.1.1.86 ilvC_val ACLAC + NADPH -> DHMVA + NADP Radmacher et al (2002)
Q8NQZ9 4.2.1.9 ilvD_val DHMVA -> OIVAL Radmacher et al (2002)
Q79VE5 2.6.1.42 ilvE_val OIVAL + GLU -> VAL + AKG Radmacher et al (2002)
# Isoleucine biosynthesis
Q04513 4.3.1.19 ilvA_ile THR -> OBUT + NH3 Möckel et al (1992)
P42463
2.2.1.6 ilvBN_ile OBUT + PYR -> ABUT + CO2 Keilhauer et al (1993);
Leyval et al (2003)
Q57179
1.1.1.86 ilvC_ile ABUT + NADPH -> DHMV + NADP Keilhauer et al (1993);
Leyval et al (2003)
Q8NQZ94.2.1.9 ilvD_ile DHMV -> OMVAL Keilhauer et al (1993);
Leyval et al (2003)
Q79VE5 2.6.1.42 ilvE_ile OMVAL + GLU -> ILE + AKG Leyval et al (2003)
# leucine biosynthesis
P42455 2.3.3.13 leuA OIVAL + ACCOA -> IPPMAL + COA Paték et al (1998)
P58946 4.2.1.33 leuCD IPPMAL -> CBHCAP Willis et al (2005)
P94631
1.1.1.85 leuBP CBHCAP + NAD -> 2OMOP + NADH + CO2 Paték et al (1998)
Q79VE5 2.6.1.42 ilvE 2OMOP + GLU -> LEU + AKG Groeger & Sahn (1987)
# The aspartate family (aspartate, asparagine, threonine, lysine, methionine)
# Aspartate biosynthesis
Q6M8B5 2.6.1.1 aspB OA + GLU -> ASP + AKG Cremer et al (1991)
Q59200 4.3.1.1 aspA ASP -> FUM + NH3
# Asparagine biosynthesis
Q8NNK1
6.3.5.4 ltsA ATP + ASP + GLN -> AMP + PPI + ASN +
GLU 6.3.1.1 NCgl2116 ATP + ASP + NH3 -> PPI + AMP + ASN
# Threonine biosynthesis
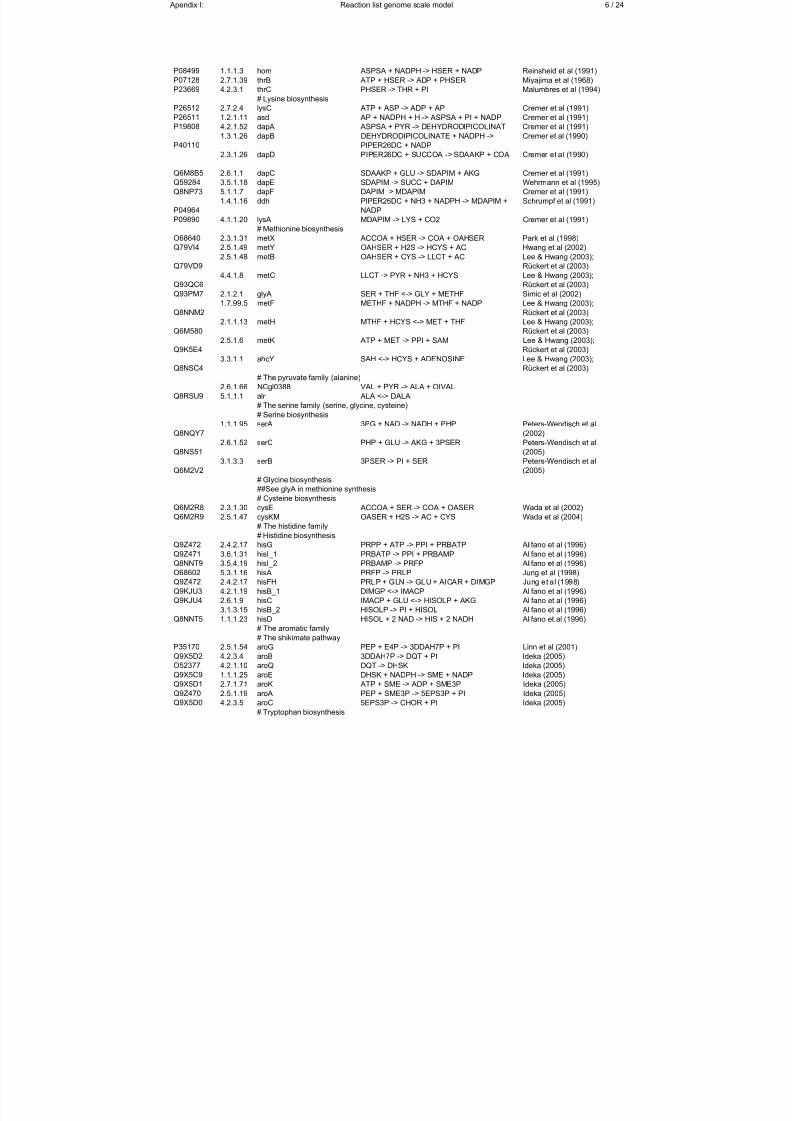
7/18/2019 Samlet PhD 20090416 U-Forside Appendix.pdf
http://slidepdf.com/reader/full/samlet-phd-20090416-u-forside-appendixpdf 158/187
Apendix I: Reaction list genome scale model 6 / 24
P08499 1.1.1.3 hom ASPSA + NADPH -> HSER + NADP Reinsheid et al (1991)
P07128 2.7.1.39 thrB ATP + HSER -> ADP + PHSER Miyajima et al (1968)
P23669 4.2.3.1 thrC PHSER -> THR + PI Malumbres et al (1994)
# Lysine biosynthesis
P26512 2.7.2.4 lysC ATP + ASP -> ADP + AP Cremer et al (1991)
P26511 1.2.1.11 asd AP + NADPH + H -> ASPSA + PI + NADP Cremer et al (1991)
P19808 4.2.1.52 dapA ASPSA + PYR -> DEHYDRODIPICOLINAT Cremer et al (1991)
P401101.3.1.26 dapB DEHYDRODIPICOLINATE + NADPH ->
PIPER26DC + NADPCremer et al (1990)
2.3.1.26 dapD PIPER26DC + SUCCOA -> SDAAKP + COA Cremer et al (1990)
Q6M8B5 2.6.1.1 dapC SDAAKP + GLU -> SDAPIM + AKG Cremer et al (1991)
Q59284 3.5.1.18 dapE SDAPIM -> SUCC + DAPIM Wehrmann et al (1995)
Q8NP73 5.1.1.7 dapF DAPIM -> MDAPIM Cremer et al (1991)
P04964
1.4.1.16 ddh PIPER26DC + NH3 + NADPH -> MDAPIM +
NADP
Schrumpf et al (1991)
P09890 4.1.1.20 lysA MDAPIM -> LYS + CO2 Cremer et al (1991)
# Methionine biosynthesis
O68640 2.3.1.31 metX ACCOA + HSER -> COA + OAHSER Park et al (1998)
Q79VI4 2.5.1.49 metY OAHSER + H2S -> HCYS + AC Hwang et al (2002)
Q79VD9
2.5.1.48 metB OAHSER + CYS -> LLCT + AC Lee & Hwang (2003);
Rückert et al (2003)
Q93QC64.4.1.8 metC LLCT -> PYR + NH3 + HCYS Lee & Hwang (2003);
Rückert et al (2003)
Q93PM7 2.1.2.1 glyA SER + THF <-> GLY + METHF Simic et al (2002)
Q8NNM2
1.7.99.5 metF METHF + NADPH -> MTHF + NADP Lee & Hwang (2003);
Rückert et al (2003)
Q6M580
2.1.1.13 metH MTHF + HCYS <-> MET + THF Lee & Hwang (2003);
Rückert et al (2003)
Q9K5E4
2.5.1.6 metK ATP + MET -> PPI + SAM Lee & Hwang (2003);
Rückert et al (2003)
Q8NSC4
3.3.1.1 ahcY SAH <-> HCYS + ADENOSINE Lee & Hwang (2003);
Rückert et al (2003)
# The pyruvate family (alanine)
2.6.1.66 NCgl0388 VAL + PYR -> ALA + OIVAL
Q8RSU9 5.1.1.1 alr ALA <-> DALA
# The serine family (serine, glycine, cysteine)
# Serine biosynthesis
Q8NQY7
1.1.1.95 serA 3PG + NAD -> NADH + PHP Peters-Wendisch et al
(2002)
Q8NS51
2.6.1.52 serC PHP + GLU -> AKG + 3PSER Peters-Wendisch et al
(2005)
Q6M2V2
3.1.3.3 serB 3PSER -> PI + SER Peters-Wendisch et al
(2005)
# Glycine biosynthesis
##See glyA in methionine synthesis
# Cysteine biosynthesis
Q6M2R8 2.3.1.30 cysE ACCOA + SER -> COA + OASER Wada et al (2002)
Q6M2R9 2.5.1.47 cysKM OASER + H2S -> AC + CYS Wada et al (2004)
# The histidine family
# Histidine biosynthesis
Q9Z472 2.4.2.17 hisG PRPP + ATP -> PPI + PRBATP Alifano et al (1996)
Q9Z471 3.6.1.31 hisI_1 PRBATP -> PPI + PRBAMP Alifano et al (1996)Q8NNT9 3.5.4.19 hisI_2 PRBAMP -> PRFP Alifano et al (1996)
O68602 5.3.1.16 hisA PRFP -> PRLP Jung et al (1998)
Q9Z472 2.4.2.17 hisFH PRLP + GLN -> GLU + AICAR + DIMGP Jung et al (1998)
Q9KJU3 4.2.1.19 hisB_1 DIMGP <-> IMACP Alifano et al (1996)
Q9KJU4 2.6.1.9 hisC IMACP + GLU <-> HISOLP + AKG Alifano et al (1996)
3.1.3.15 hisB_2 HISOLP -> PI + HISOL Alifano et al (1996)
Q8NNT5 1.1.1.23 hisD HISOL + 2 NAD -> HIS + 2 NADH Alifano et al (1996)
# The aromatic family
# The shikimate pathway
P35170 2.5.1.54 aroG PEP + E4P -> 3DDAH7P + PI Linn et al (2001)
Q9X5D2 4.2.3.4 aroB 3DDAH7P -> DQT + PI Ideka (2005)
O52377 4.2.1.10 aroQ DQT -> DHSK Ideka (2005)
Q9X5C9 1.1.1.25 aroE DHSK + NADPH -> SME + NADP Ideka (2005)
Q9X5D1 2.7.1.71 aroK ATP + SME -> ADP + SME3P Ideka (2005)
Q9Z470 2.5.1.19 aroA PEP + SME3P -> 5EPS3P + PI Ideka (2005)Q9X5D0 4.2.3.5 aroC 5EPS3P -> CHOR + PI Ideka (2005)
# Tryptophan biosynthesis
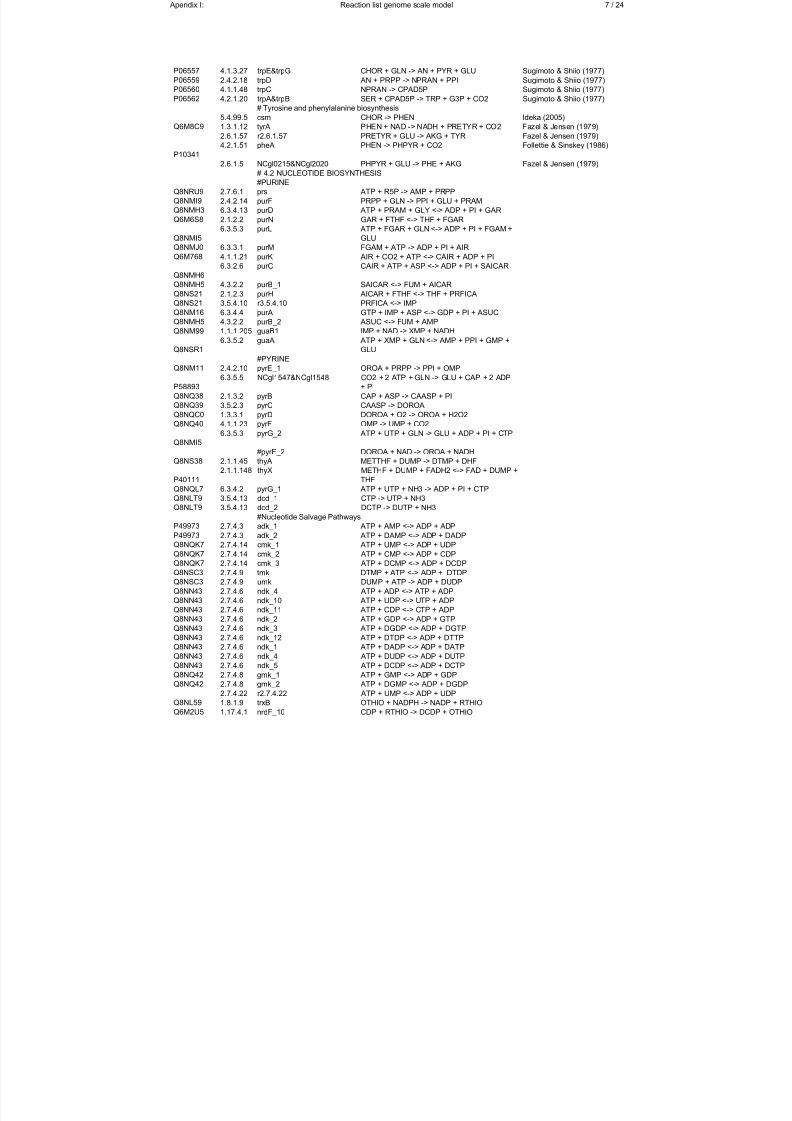
7/18/2019 Samlet PhD 20090416 U-Forside Appendix.pdf
http://slidepdf.com/reader/full/samlet-phd-20090416-u-forside-appendixpdf 159/187
Apendix I: Reaction list genome scale model 7 / 24
P06557 4.1.3.27 trpE&trpG CHOR + GLN -> AN + PYR + GLU Sugimoto & Shiio (1977)
P06559 2.4.2.18 trpD AN + PRPP -> NPRAN + PPI Sugimoto & Shiio (1977)
P06560 4.1.1.48 trpC NPRAN -> CPAD5P Sugimoto & Shiio (1977)
P06562 4.2.1.20 trpA&trpB SER + CPAD5P -> TRP + G3P + CO2 Sugimoto & Shiio (1977)
# Tyrosine and phenylalanine biosynthesis
5.4.99.5 csm CHOR -> PHEN Ideka (2005)
Q6M8C9 1.3.1.12 tyrA PHEN + NAD -> NADH + PRETYR + CO2 Fazel & Jensen (1979)
2.6.1.57 r2.6.1.57 PRETYR + GLU -> AKG + TYR Fazel & Jensen (1979)
P10341
4.2.1.51 pheA PHEN -> PHPYR + CO2 Follettie & Sinskey (1986)
2.6.1.5 NCgl0215&NCgl2020 PHPYR + GLU -> PHE + AKG Fazel & Jensen (1979)
# 4.2 NUCLEOTIDE BIOSYNTHESIS
#PURINE
Q8NRU9 2.7.6.1 prs ATP + R5P -> AMP + PRPP
Q8NMI9 2.4.2.14 purF PRPP + GLN -> PPI + GLU + PRAM
Q8NMH3 6.3.4.13 purD ATP + PRAM + GLY <-> ADP + PI + GAR
Q6M6S8 2.1.2.2 purN GAR + FTHF <-> THF + FGAR
Q8NMI5
6.3.5.3 purL ATP + FGAR + GLN <-> ADP + PI + FGAM +
GLU
Q8NMJ0 6.3.3.1 purM FGAM + ATP -> ADP + PI + AIR
Q6M768 4.1.1.21 purK AIR + CO2 + ATP <-> CAIR + ADP + PI
Q8NMH6
6.3.2.6 purC CAIR + ATP + ASP <-> ADP + PI + SAICAR
Q8NMH5 4.3.2.2 purB_1 SAICAR <-> FUM + AICAR
Q8NS21 2.1.2.3 purH AICAR + FTHF <-> THF + PRFICA
Q8NS21 3.5.4.10 r3.5.4.10 PRFICA <-> IMP
Q8NM16 6.3.4.4 purA GTP + IMP + ASP <-> GDP + PI + ASUC
Q8NMH5 4.3.2.2 purB_2 ASUC <-> FUM + AMP
Q8NM99 1.1.1.205 guaB1 IMP + NAD -> XMP + NADH
Q8NSR1
6.3.5.2 guaA ATP + XMP + GLN <-> AMP + PPI + GMP +
GLU
#PYRINE
Q8NM11 2.4.2.10 pyrE_1 OROA + PRPP -> PPI + OMP
P58893
6.3.5.5 NCgl1547&NCgl1548 CO2 + 2 ATP + GLN -> GLU + CAP + 2 ADP
+ PI
Q8NQ38 2.1.3.2 pyrB CAP + ASP -> CAASP + PI
Q8NQ39 3.5.2.3 pyrC CAASP -> DOROA
Q8NQC0 1.3.3.1 pyrD DOROA + O2 -> OROA + H2O2Q8NQ40 4.1.1.23 pyrF OMP -> UMP + CO2
Q8NMI5
6.3.5.3 pyrG_2 ATP + UTP + GLN -> GLU + ADP + PI + CTP
#pyrE_2 DOROA + NAD -> OROA + NADH
Q8NS38 2.1.1.45 thyA METTHF + DUMP -> DTMP + DHF
P40111
2.1.1.148 thyX METHF + DUMP + FADH2 <-> FAD + DUMP +
THF
Q8NQL7 6.3.4.2 pyrG_1 ATP + UTP + NH3 -> ADP + PI + CTP
Q8NLT9 3.5.4.13 dcd_1 CTP -> UTP + NH3
Q8NLT9 3.5.4.13 dcd_2 DCTP -> DUTP + NH3
#Nucleotide Salvage Pathways
P49973 2.7.4.3 adk_1 ATP + AMP <-> ADP + ADP
P49973 2.7.4.3 adk_2 ATP + DAMP <-> ADP + DADP
Q8NQK7 2.7.4.14 cmk_1 ATP + UMP <-> ADP + UDP
Q8NQK7 2.7.4.14 cmk_2 ATP + CMP <-> ADP + CDPQ8NQK7 2.7.4.14 cmk_3 ATP + DCMP <-> ADP + DCDP
Q8NSC3 2.7.4.9 tmk DTMP + ATP <-> ADP + DTDP
Q8NSC3 2.7.4.9 umk DUMP + ATP -> ADP + DUDP
Q8NN43 2.7.4.6 ndk_4 ATP + ADP <-> ATP + ADP
Q8NN43 2.7.4.6 ndk_10 ATP + UDP <-> UTP + ADP
Q8NN43 2.7.4.6 ndk_11 ATP + CDP <-> CTP + ADP
Q8NN43 2.7.4.6 ndk_2 ATP + GDP <-> ADP + GTP
Q8NN43 2.7.4.6 ndk_3 ATP + DGDP <-> ADP + DGTP
Q8NN43 2.7.4.6 ndk_12 ATP + DTDP <-> ADP + DTTP
Q8NN43 2.7.4.6 ndk_1 ATP + DADP <-> ADP + DATP
Q8NN43 2.7.4.6 ndk_4 ATP + DUDP <-> ADP + DUTP
Q8NN43 2.7.4.6 ndk_5 ATP + DCDP <-> ADP + DCTP
Q8NQ42 2.7.4.8 gmk_1 ATP + GMP <-> ADP + GDP
Q8NQ42 2.7.4.8 gmk_2 ATP + DGMP <-> ADP + DGDP
2.7.4.22 r2.7.4.22 ATP + UMP <-> ADP + UDPQ8NL59 1.8.1.9 trxB OTHIO + NADPH -> NADP + RTHIO
Q6M2U5 1.17.4.1 nrdF_10 CDP + RTHIO -> DCDP + OTHIO
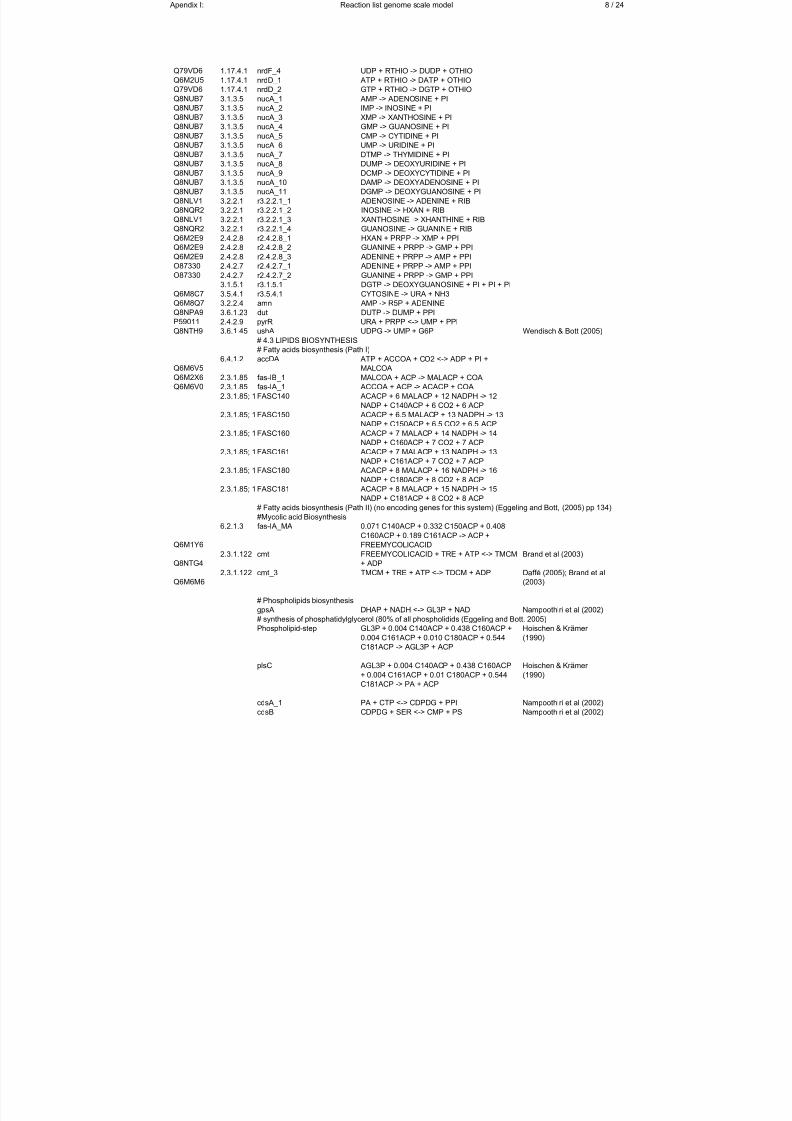
7/18/2019 Samlet PhD 20090416 U-Forside Appendix.pdf
http://slidepdf.com/reader/full/samlet-phd-20090416-u-forside-appendixpdf 160/187
Apendix I: Reaction list genome scale model 8 / 24
Q79VD6 1.17.4.1 nrdF_4 UDP + RTHIO -> DUDP + OTHIO
Q6M2U5 1.17.4.1 nrdD_1 ATP + RTHIO -> DATP + OTHIO
Q79VD6 1.17.4.1 nrdD_2 GTP + RTHIO -> DGTP + OTHIO
Q8NUB7 3.1.3.5 nucA_1 AMP -> ADENOSINE + PI
Q8NUB7 3.1.3.5 nucA_2 IMP -> INOSINE + PI
Q8NUB7 3.1.3.5 nucA_3 XMP -> XANTHOSINE + PI
Q8NUB7 3.1.3.5 nucA_4 GMP -> GUANOSINE + PI
Q8NUB7 3.1.3.5 nucA_5 CMP -> CYTIDINE + PIQ8NUB7 3.1.3.5 nucA_6 UMP -> URIDINE + PI
Q8NUB7 3.1.3.5 nucA_7 DTMP -> THYMIDINE + PI
Q8NUB7 3.1.3.5 nucA_8 DUMP -> DEOXYURIDINE + PI
Q8NUB7 3.1.3.5 nucA_9 DCMP -> DEOXYCYTIDINE + PI
Q8NUB7 3.1.3.5 nucA_10 DAMP -> DEOXYADENOSINE + PI
Q8NUB7 3.1.3.5 nucA_11 DGMP -> DEOXYGUANOSINE + PI
Q8NLV1 3.2.2.1 r3.2.2.1_1 ADENOSINE -> ADENINE + RIB
Q8NQR2 3.2.2.1 r3.2.2.1_2 INOSINE -> HXAN + RIB
Q8NLV1 3.2.2.1 r3.2.2.1_3 XANTHOSINE -> XHANTHINE + RIB
Q8NQR2 3.2.2.1 r3.2.2.1_4 GUANOSINE -> GUANINE + RIB
Q6M2E9 2.4.2.8 r2.4.2.8_1 HXAN + PRPP -> XMP + PPI
Q6M2E9 2.4.2.8 r2.4.2.8_2 GUANINE + PRPP -> GMP + PPI
Q6M2E9 2.4.2.8 r2.4.2.8_3 ADENINE + PRPP -> AMP + PPI
O87330 2.4.2.7 r2.4.2.7_1 ADENINE + PRPP -> AMP + PPI
O87330 2.4.2.7 r2.4.2.7_2 GUANINE + PRPP -> GMP + PPI3.1.5.1 r3.1.5.1 DGTP -> DEOXYGUANOSINE + PI + PI + PI
Q6M8C7 3.5.4.1 r3.5.4.1 CYTOSINE -> URA + NH3
Q6M8Q7 3.2.2.4 amn AMP -> R5P + ADENINE
Q8NPA9 3.6.1.23 dut DUTP -> DUMP + PPI
P59011 2.4.2.9 pyrR URA + PRPP <-> UMP + PPI
Q8NTH9 3.6.1.45 ushA UDPG -> UMP + G6P Wendisch & Bott (2005)
# 4.3 LIPIDS BIOSYNTHESIS
# Fatty acids biosynthesis (Path I)
Q6M6V5
6.4.1.2 accDA ATP + ACCOA + CO2 <-> ADP + PI +
MALCOA
Q6M2X6 2.3.1.85 fas-IB_1 MALCOA + ACP -> MALACP + COA
Q6M6V0 2.3.1.85 fas-IA_1 ACCOA + ACP -> ACACP + COA
2.3.1.85; 1 FASC140 ACACP + 6 MALACP + 12 NADPH -> 12
NADP + C140ACP + 6 CO2 + 6 ACP
2.3.1.85; 1 FASC150 ACACP + 6.5 MALACP + 13 NADPH -> 13NADP + C150ACP + 6.5 CO2 + 6.5 ACP
2.3.1.85; 1 FASC160 ACACP + 7 MALACP + 14 NADPH -> 14
NADP + C160ACP + 7 CO2 + 7 ACP
2.3.1.85; 1 FASC161 ACACP + 7 MALACP + 13 NADPH -> 13
NADP + C161ACP + 7 CO2 + 7 ACP
2.3.1.85; 1 FASC180 ACACP + 8 MALACP + 16 NADPH -> 16
NADP + C180ACP + 8 CO2 + 8 ACP
2.3.1.85; 1 FASC181 ACACP + 8 MALACP + 15 NADPH -> 15
NADP + C181ACP + 8 CO2 + 8 ACP
# Fatty acids biosynthesis (Path II) (no encoding genes for this system) (Eggeling and Bott, (2005) pp 134)
#Mycolic acid Biosynthesis
Q6M1Y6
6.2.1.3 fas-IA_MA 0.071 C140ACP + 0.332 C150ACP + 0.408
C160ACP + 0.189 C161ACP -> ACP +
FREEMYCOLICACID
Q8NTG42.3.1.122 cmt FREEMYCOLICACID + TRE + ATP <-> TMCM
+ ADPBrand et al (2003)
Q6M6M6
2.3.1.122 cmt_3 TMCM + TRE + ATP <-> TDCM + ADP Daffé (2005); Brand et al
(2003)
# Phospholipids biosynthesis
gpsA DHAP + NADH <-> GL3P + NAD Nampoothiri et al (2002)
# synthesis of phosphatidylglycerol (80% of all phospholidids (Eggeling and Bott. 2005)
Phospholipid-step GL3P + 0.004 C140ACP + 0.438 C160ACP +
0.004 C161ACP + 0.010 C180ACP + 0.544
C181ACP -> AGL3P + ACP
Hoischen & Krämer
(1990)
plsC AGL3P + 0.004 C140ACP + 0.438 C160ACP
+ 0.004 C161ACP + 0.01 C180ACP + 0.544
C181ACP -> PA + ACP
Hoischen & Krämer
(1990)
cdsA_1 PA + CTP <-> CDPDG + PPI Nampoothiri et al (2002)
cdsB CDPDG + SER <-> CMP + PS Nampoothiri et al (2002)
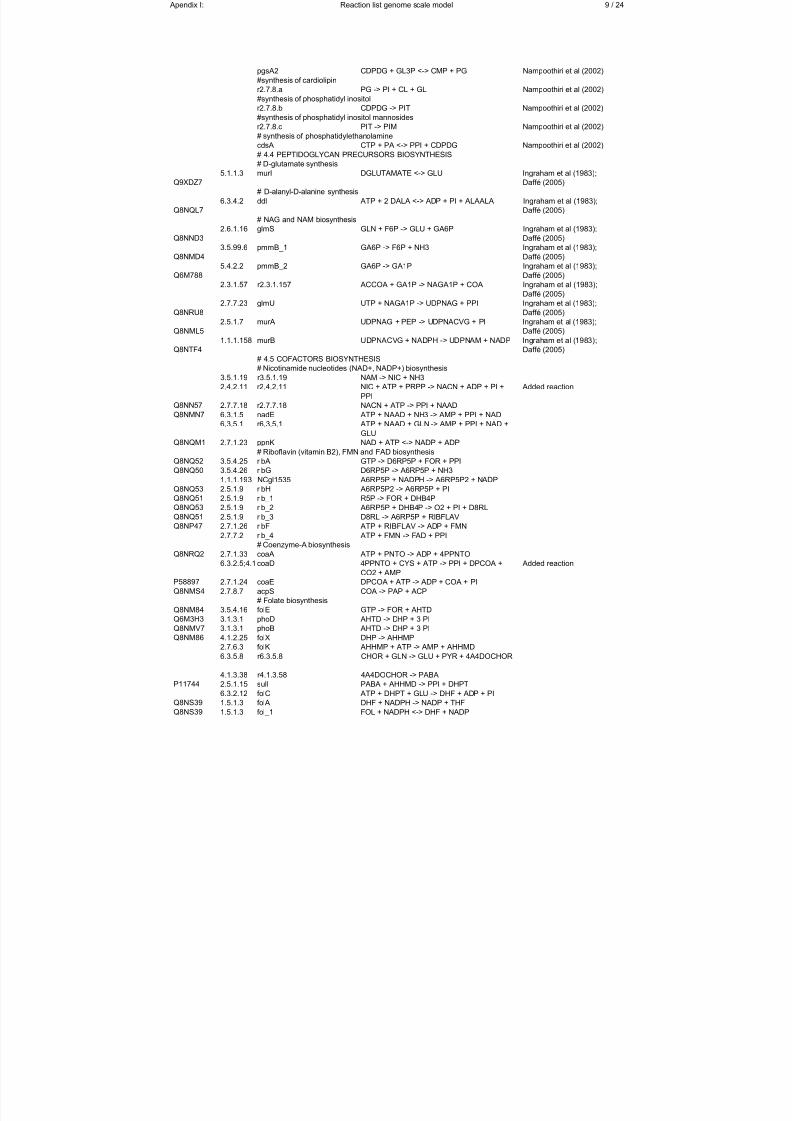
7/18/2019 Samlet PhD 20090416 U-Forside Appendix.pdf
http://slidepdf.com/reader/full/samlet-phd-20090416-u-forside-appendixpdf 161/187
Apendix I: Reaction list genome scale model 9 / 24
pgsA2 CDPDG + GL3P <-> CMP + PG Nampoothiri et al (2002)
#synthesis of cardiolipin
r2.7.8.a PG -> PI + CL + GL Nampoothiri et al (2002)
#synthesis of phosphatidyl inositol
r2.7.8.b CDPDG -> PIT Nampoothiri et al (2002)
#synthesis of phosphatidyl inositol mannosides
r2.7.8.c PIT -> PIM Nampoothiri et al (2002)
# synthesis of phosphatidylethanolamine cdsA CTP + PA <-> PPI + CDPDG Nampoothiri et al (2002)
# 4.4 PEPTIDOGLYCAN PRECURSORS BIOSYNTHESIS
# D-glutamate synthesis
Q9XDZ7
5.1.1.3 murI DGLUTAMATE <-> GLU Ingraham et al (1983);
Daffé (2005)
# D-alanyl-D-alanine synthesis
Q8NQL7
6.3.4.2 ddl ATP + 2 DALA <-> ADP + PI + ALAALA Ingraham et al (1983);
Daffé (2005)
# NAG and NAM biosynthesis
Q8NND3
2.6.1.16 glmS GLN + F6P -> GLU + GA6P Ingraham et al (1983);
Daffé (2005)
Q8NMD4
3.5.99.6 pmmB_1 GA6P -> F6P + NH3 Ingraham et al (1983);
Daffé (2005)
Q6M788
5.4.2.2 pmmB_2 GA6P -> GA1P Ingraham et al (1983);
Daffé (2005)2.3.1.57 r2.3.1.157 ACCOA + GA1P -> NAGA1P + COA Ingraham et al (1983);
Daffé (2005)
Q8NRU8
2.7.7.23 glmU UTP + NAGA1P -> UDPNAG + PPI Ingraham et al (1983);
Daffé (2005)
Q8NML5
2.5.1.7 murA UDPNAG + PEP -> UDPNACVG + PI Ingraham et al (1983);
Daffé (2005)
Q8NTF4
1.1.1.158 murB UDPNACVG + NADPH -> UDPNAM + NADP Ingraham et al (1983);
Daffé (2005)
# 4.5 COFACTORS BIOSYNTHESIS
# Nicotinamide nucleotides (NAD+, NADP+) biosynthesis
3.5.1.19 r3.5.1.19 NAM -> NIC + NH3
2.4.2.11 r2.4.2.11 NIC + ATP + PRPP -> NACN + ADP + PI +
PPI
Added reaction
Q8NN57 2.7.7.18 r2.7.7.18 NACN + ATP -> PPI + NAAD
Q8NMN7 6.3.1.5 nadE ATP + NAAD + NH3 -> AMP + PPI + NAD6.3.5.1 r6.3.5.1 ATP + NAAD + GLN -> AMP + PPI + NAD +
GLU
Q8NQM1 2.7.1.23 ppnK NAD + ATP <-> NADP + ADP
# Riboflavin (vitamin B2), FMN and FAD biosynthesis
Q8NQ52 3.5.4.25 ribA GTP -> D6RP5P + FOR + PPI
Q8NQ50 3.5.4.26 ribG D6RP5P -> A6RP5P + NH3
1.1.1.193 NCgl1535 A6RP5P + NADPH -> A6RP5P2 + NADP
Q8NQ53 2.5.1.9 ribH A6RP5P2 -> A6RP5P + PI
Q8NQ51 2.5.1.9 rib_1 R5P -> FOR + DHB4P
Q8NQ53 2.5.1.9 rib_2 A6RP5P + DHB4P -> O2 + PI + D8RL
Q8NQ51 2.5.1.9 rib_3 D8RL -> A6RP5P + RIBFLAV
Q8NP47 2.7.1.26 ribF ATP + RIBFLAV -> ADP + FMN
2.7.7.2 rib_4 ATP + FMN -> FAD + PPI
# Coenzyme-A biosynthesis
Q8NRQ2 2.7.1.33 coaA ATP + PNTO -> ADP + 4PPNTO6.3.2.5;4.1 coaD 4PPNTO + CYS + ATP -> PPI + DPCOA +
CO2 + AMP
Added reaction
P58897 2.7.1.24 coaE DPCOA + ATP -> ADP + COA + PI
Q8NMS4 2.7.8.7 acpS COA -> PAP + ACP
# Folate biosynthesis
Q8NM84 3.5.4.16 folE GTP -> FOR + AHTD
Q6M3H3 3.1.3.1 phoD AHTD -> DHP + 3 PI
Q8NMV7 3.1.3.1 phoB AHTD -> DHP + 3 PI
Q8NM86 4.1.2.25 folX DHP -> AHHMP
2.7.6.3 folK AHHMP + ATP -> AMP + AHHMD
6.3.5.8 r6.3.5.8 CHOR + GLN -> GLU + PYR + 4A4DOCHOR
4.1.3.38 r4.1.3.58 4A4DOCHOR -> PABA
P11744 2.5.1.15 sulI PABA + AHHMD -> PPI + DHPT
6.3.2.12 folC ATP + DHPT + GLU -> DHF + ADP + PIQ8NS39 1.5.1.3 folA DHF + NADPH -> NADP + THF
Q8NS39 1.5.1.3 fol_1 FOL + NADPH <-> DHF + NADP
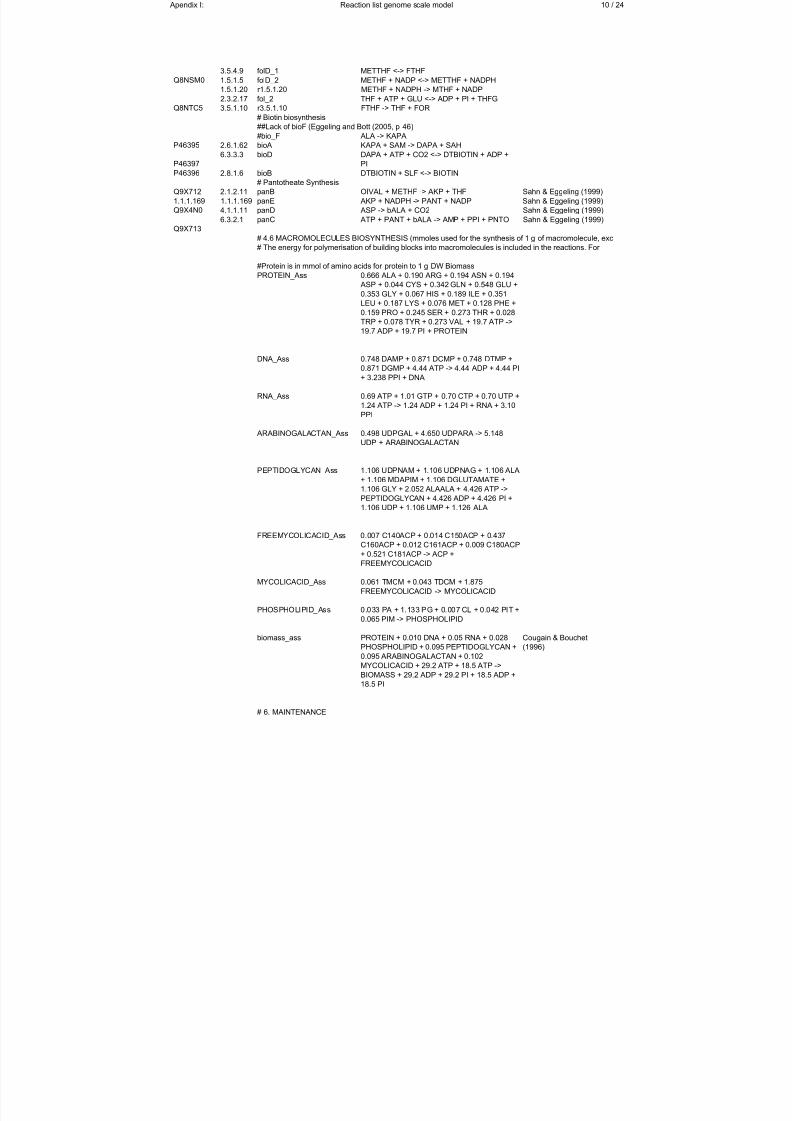
7/18/2019 Samlet PhD 20090416 U-Forside Appendix.pdf
http://slidepdf.com/reader/full/samlet-phd-20090416-u-forside-appendixpdf 162/187
Apendix I: Reaction list genome scale model 10 / 24
3.5.4.9 folD_1 METTHF <-> FTHF
Q8NSM0 1.5.1.5 folD_2 METHF + NADP <-> METTHF + NADPH
1.5.1.20 r1.5.1.20 METHF + NADPH -> MTHF + NADP
2.3.2.17 fol_2 THF + ATP + GLU <-> ADP + PI + THFG
Q8NTC5 3.5.1.10 r3.5.1.10 FTHF -> THF + FOR
# Biotin biosynthesis
##Lack of bioF (Eggeling and Bott (2005, p 46)
#bio_F ALA -> KAPAP46395 2.6.1.62 bioA KAPA + SAM -> DAPA + SAH
P46397
6.3.3.3 bioD DAPA + ATP + CO2 <-> DTBIOTIN + ADP +
PI
P46396 2.8.1.6 bioB DTBIOTIN + SLF <-> BIOTIN
# Pantotheate Synthesis
Q9X712 2.1.2.11 panB OIVAL + METHF -> AKP + THF Sahn & Eggeling (1999)
1.1.1.169 1.1.1.169 panE AKP + NADPH -> PANT + NADP Sahn & Eggeling (1999)
Q9X4N0 4.1.1.11 panD ASP -> bALA + CO2 Sahn & Eggeling (1999)
Q9X713
6.3.2.1 panC ATP + PANT + bALA -> AMP + PPI + PNTO Sahn & Eggeling (1999)
#Protein is in mmol of amino acids for protein to 1 g DW Biomass
PROTEIN_Ass 0.666 ALA + 0.190 ARG + 0.194 ASN + 0.194 ASP + 0.044 CYS + 0.342 GLN + 0.548 GLU +
0.353 GLY + 0.067 HIS + 0.189 ILE + 0.351
LEU + 0.187 LYS + 0.076 MET + 0.128 PHE +
0.159 PRO + 0.245 SER + 0.273 THR + 0.028
TRP + 0.078 TYR + 0.273 VAL + 19.7 ATP ->
19.7 ADP + 19.7 PI + PROTEIN
DNA_Ass
RNA_Ass
ARABINOGALACTAN_Ass
PEPTIDOGLYCAN_Ass 1.106 UDPNAM + 1.106 UDPNAG + 1.106 ALA
+ 1.106 MDAPIM + 1.106 DGLUTAMATE +
1.106 GLY + 2.052 ALAALA + 4.426 ATP ->
PEPTIDOGLYCAN + 4.426 ADP + 4.426 PI +
1.106 UDP + 1.106 UMP + 1.126 ALA
FREEMYCOLICACID_Ass 0.007 C140ACP + 0.014 C150ACP + 0.437
C160ACP + 0.012 C161ACP + 0.009 C180ACP
+ 0.521 C181ACP -> ACP +FREEMYCOLICACID
MYCOLICACID_Ass 0.061 TMCM + 0.043 TDCM + 1.875
FREEMYCOLICACID -> MYCOLICACID
PHOSPHOLIPID_Ass 0.033 PA + 1.133 PG + 0.007 CL + 0.042 PIT +
0.065 PIM -> PHOSPHOLIPID
biomass_ass PROTEIN + 0.010 DNA + 0.05 RNA + 0.028
PHOSPHOLIPID + 0.095 PEPTIDOGLYCAN +
0.095 ARABINOGALACTAN + 0.102
MYCOLICACID + 29.2 ATP + 18.5 ATP ->
BIOMASS + 29.2 ADP + 29.2 PI + 18.5 ADP +
18.5 PI
Cougain & Bouchet
(1996)
# 6. MAINTENANCE
# 4.6 MACROMOLECULES BIOSYNTHESIS (mmoles used for the synthesis of 1 g of macromolecule, exc
0.69 ATP + 1.01 GTP + 0.70 CTP + 0.70 UTP +
1.24 ATP -> 1.24 ADP + 1.24 PI + RNA + 3.10
PPI
0.498 UDPGAL + 4.650 UDPARA -> 5.148
UDP + ARABINOGALACTAN
# The energy for polymerisation of building blocks into macromolecules is included in the reactions. For
0.748 DAMP + 0.871 DCMP + 0.748 DTMP +
0.871 DGMP + 4.44 ATP -> 4.44 ADP + 4.44 PI
+ 3.238 PPI + DNA
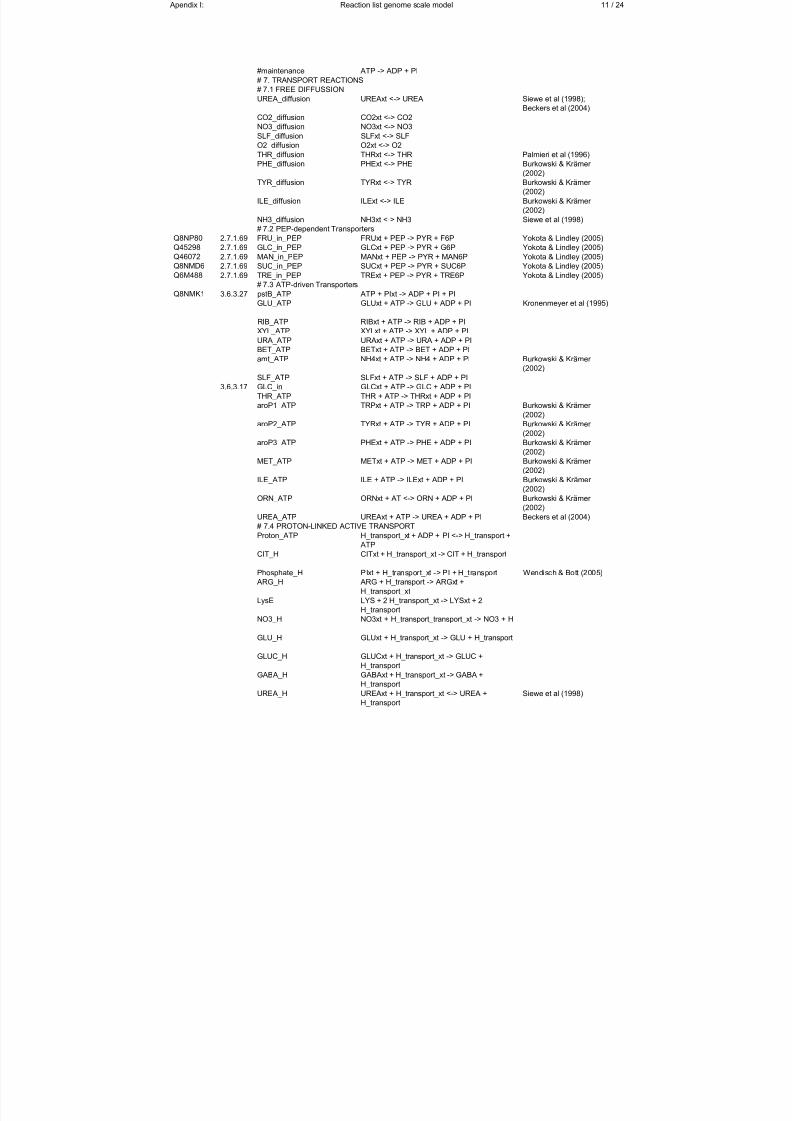
7/18/2019 Samlet PhD 20090416 U-Forside Appendix.pdf
http://slidepdf.com/reader/full/samlet-phd-20090416-u-forside-appendixpdf 163/187
Apendix I: Reaction list genome scale model 11 / 24
#maintenance ATP -> ADP + PI
# 7. TRANSPORT REACTIONS
# 7.1 FREE DIFFUSSION
UREA_diffusion UREAxt <-> UREA Siewe et al (1998);
Beckers et al (2004)
CO2_diffusion CO2xt <-> CO2
NO3_diffusion NO3xt <-> NO3
SLF_diffusion SLFxt <-> SLFO2_diffusion O2xt <-> O2
THR_diffusion THRxt <-> THR Palmieri et al (1996)
PHE_diffusion PHExt <-> PHE Burkowski & Krämer
(2002)
TYR_diffusion TYRxt <-> TYR Burkowski & Krämer
(2002)
ILE_diffusion ILExt <-> ILE Burkowski & Krämer
(2002)
NH3_diffusion NH3xt <-> NH3 Siewe et al (1998)
# 7.2 PEP-dependent Transporters
Q8NP80 2.7.1.69 FRU_in_PEP FRUxt + PEP -> PYR + F6P Yokota & Lindley (2005)
Q45298 2.7.1.69 GLC_in_PEP GLCxt + PEP -> PYR + G6P Yokota & Lindley (2005)
Q46072 2.7.1.69 MAN_in_PEP MANxt + PEP -> PYR + MAN6P Yokota & Lindley (2005)
Q8NMD6 2.7.1.69 SUC_in_PEP SUCxt + PEP -> PYR + SUC6P Yokota & Lindley (2005)
Q6M488 2.7.1.69 TRE_in_PEP TRExt + PEP -> PYR + TRE6P Yokota & Lindley (2005) # 7.3 ATP-driven Transporters
Q8NMK1 3.6.3.27 pstB_ATP ATP + PIxt -> ADP + PI + PI
GLU_ATP GLUxt + ATP -> GLU + ADP + PI Kronenmeyer et al (1995)
RIB_ATP RIBxt + ATP -> RIB + ADP + PI
XYL_ATP XYLxt + ATP -> XYL + ADP + PI
URA_ATP URAxt + ATP -> URA + ADP + PI
BET_ATP BETxt + ATP -> BET + ADP + PI
amt_ATP NH4xt + ATP -> NH4 + ADP + PI Burkowski & Krämer
(2002)
SLF_ATP SLFxt + ATP -> SLF + ADP + PI
3.6.3.17 GLC_in GLCxt + ATP -> GLC + ADP + PI
THR_ATP THR + ATP -> THRxt + ADP + PI
aroP1_ATP TRPxt + ATP -> TRP + ADP + PI Burkowski & Krämer
(2002)aroP2_ATP TYRxt + ATP -> TYR + ADP + PI Burkowski & Krämer
(2002)
aroP3_ATP PHExt + ATP -> PHE + ADP + PI Burkowski & Krämer
(2002)
MET_ATP METxt + ATP -> MET + ADP + PI Burkowski & Krämer
(2002)
ILE_ATP ILE + ATP -> ILExt + ADP + PI Burkowski & Krämer
(2002)
ORN_ATP ORNxt + AT <-> ORN + ADP + PI Burkowski & Krämer
(2002)
UREA_ATP UREAxt + ATP -> UREA + ADP + PI Beckers et al (2004)
# 7.4 PROTON-LINKED ACTIVE TRANSPORT
Proton_ATP H_transport_xt + ADP + PI <-> H_transport +
ATP
CIT_H CITxt + H_transport_xt -> CIT + H_transport
Phosphate_H PIxt + H_transport_xt -> PI + H_transport Wendisch & Bott (2005)
ARG_H ARG + H_transport -> ARGxt +
H_transport_xt
LysE LYS + 2 H_transport_xt -> LYSxt + 2
H_transport
NO3_H NO3xt + H_transport_transport_xt -> NO3 + H
GLU_H GLUxt + H_transport_xt -> GLU + H_transport
GLUC_H GLUCxt + H_transport_xt -> GLUC +
H_transport
GABA_H GABAxt + H_transport_xt -> GABA +
H_transport
UREA_H UREAxt + H_transport_xt <-> UREA +H_transport
Siewe et al (1998)
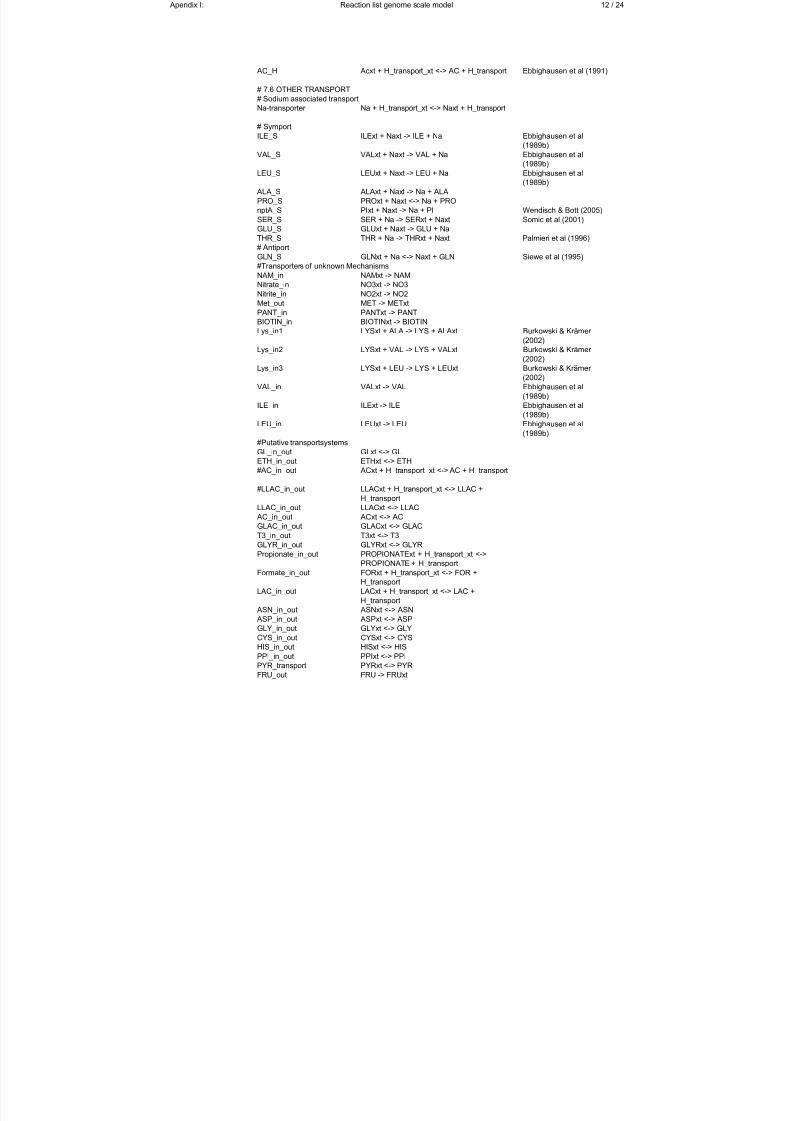
7/18/2019 Samlet PhD 20090416 U-Forside Appendix.pdf
http://slidepdf.com/reader/full/samlet-phd-20090416-u-forside-appendixpdf 164/187
Apendix I: Reaction list genome scale model 12 / 24
AC_H Acxt + H_transport_xt <-> AC + H_transport Ebbighausen et al (1991)
# 7.6 OTHER TRANSPORT
# Sodium associated transport
Na-transporter Na + H_transport_xt <-> Naxt + H_transport
# Symport
ILE_S ILExt + Naxt -> ILE + Na Ebbighausen et al(1989b)
VAL_S VALxt + Naxt -> VAL + Na Ebbighausen et al
(1989b)
LEU_S LEUxt + Naxt -> LEU + Na Ebbighausen et al
(1989b)
ALA_S ALAxt + Naxt -> Na + ALA
PRO_S PROxt + Naxt <-> Na + PRO
nptA_S PIxt + Naxt -> Na + PI Wendisch & Bott (2005)
SER_S SER + Na -> SERxt + Naxt Somic et al (2001)
GLU_S GLUxt + Naxt -> GLU + Na
THR_S THR + Na -> THRxt + Naxt Palmieri et al (1996)
# Antiport
GLN_S GLNxt + Na <-> Naxt + GLN Siewe et al (1995)
#Transporters of unknown Mechanisms
NAM_in NAMxt -> NAMNitrate_in NO3xt -> NO3
Nitrite_in NO2xt -> NO2
Met_out MET -> METxt
PANT_in PANTxt -> PANT
BIOTIN_in BIOTINxt -> BIOTIN
Lys_in1 LYSxt + ALA -> LYS + ALAxt Burkowski & Krämer
(2002)
Lys_in2 LYSxt + VAL -> LYS + VALxt Burkowski & Krämer
(2002)
Lys_in3 LYSxt + LEU -> LYS + LEUxt Burkowski & Krämer
(2002)
VAL_in VALxt -> VAL Ebbighausen et al
(1989b)
ILE_in ILExt -> ILE Ebbighausen et al
(1989b)LEU_in LEUxt -> LEU Ebbighausen et al
(1989b)
#Putative transportsystems
GL_in_out GLxt <-> GL
ETH_in_out ETHxt <-> ETH
#AC_in_out ACxt + H_transport_xt <-> AC + H_transport
#LLAC_in_out LLACxt + H_transport_xt <-> LLAC +
H_transport
LLAC_in_out LLACxt <-> LLAC
AC_in_out ACxt <-> AC
GLAC_in_out GLACxt <-> GLAC
T3_in_out T3xt <-> T3
GLYR_in_out GLYRxt <-> GLYR
Propionate_in_out PROPIONATExt + H_transport_xt <->PROPIONATE + H_transport
Formate_in_out FORxt + H_transport_xt <-> FOR +
H_transport
LAC_in_out LACxt + H_transport_xt <-> LAC +
H_transport
ASN_in_out ASNxt <-> ASN
ASP_in_out ASPxt <-> ASP
GLY_in_out GLYxt <-> GLY
CYS_in_out CYSxt <-> CYS
HIS_in_out HISxt <-> HIS
PPI_in_out PPIxt <-> PPI
PYR_transport PYRxt <-> PYR
FRU_out FRU -> FRUxt
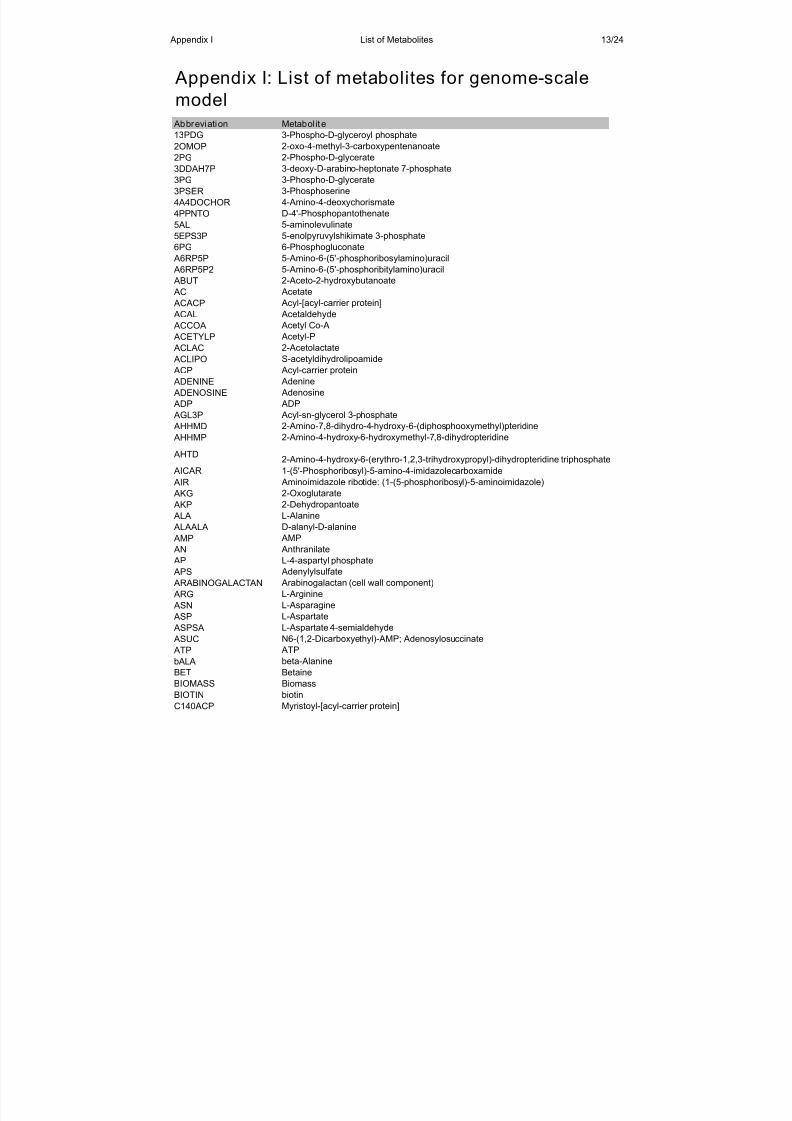
7/18/2019 Samlet PhD 20090416 U-Forside Appendix.pdf
http://slidepdf.com/reader/full/samlet-phd-20090416-u-forside-appendixpdf 165/187
Appendix I List of Metabolites 13/24
Abbreviation Metabol ite
13PDG 3-Phospho-D-glyceroyl phosphate2OMOP 2-oxo-4-methyl-3-carboxypentenanoate
2PG 2-Phospho-D-glycerate
3DDAH7P 3-deoxy-D-arabino-heptonate 7-phosphate
3PG 3-Phospho-D-glycerate
3PSER 3-Phosphoserine
4A4DOCHOR 4-Amino-4-deoxychorismate
4PPNTO D-4'-Phosphopantothenate
5AL 5-aminolevulinate
5EPS3P 5-enolpyruvylshikimate 3-phosphate
6PG 6-Phosphogluconate
A6RP5P 5-Amino-6-(5'-phosphoribosylamino)uracil
A6RP5P2 5-Amino-6-(5'-phosphoribitylamino)uracil
ABUT 2-Aceto-2-hydroxybutanoate
AC Acetate
ACACP Acyl-[acyl-carrier protein]
ACAL Acetaldehyde
ACCOA Acetyl Co-A
ACETYLP Acetyl-P
ACLAC 2-Acetolactate
ACLIPO S-acetyldihydrolipoamide
ACP Acyl-carrier protein
ADENINE Adenine
ADENOSINE Adenosine
ADP ADP
AGL3P Acyl-sn-glycerol 3-phosphate AHHMD 2-Amino-7,8-dihydro-4-hydroxy-6-(diphosphooxymethyl)pteridine
AHHMP 2-Amino-4-hydroxy-6-hydroxymethyl-7,8-dihydropteridine
AHTD2-Amino-4-hydroxy-6-(erythro-1,2,3-trihydroxypropyl)-dihydropteridine triphosphate
AICAR 1-(5'-Phosphoribosyl)-5-amino-4-imidazolecarboxamide
AIR Aminoimidazole ribotide: (1-(5-phosphoribosyl)-5-aminoimidazole)
AKG 2-Oxoglutarate
AKP 2-Dehydropantoate
ALA L-Alanine
ALAALA D-alanyl-D-alanine
AMP AMP
AN Anthranilate
AP L-4-aspartyl phosphate
APS Adenylylsulfate
ARABINOGALACTAN Arabinogalactan (cell wall component)
ARG L-Arginine
ASN L-Asparagine
ASP L-Aspartate
ASPSA L-Aspartate 4-semialdehyde
ASUC N6-(1,2-Dicarboxyethyl)-AMP; Adenosylosuccinate
ATP ATP
bALA beta-Alanine
BET Betaine
BIOMASS Biomass
BIOTIN biotinC140ACP Myristoyl-[acyl-carrier protein]
Appendix I: List of metabolites for genome-scale
model
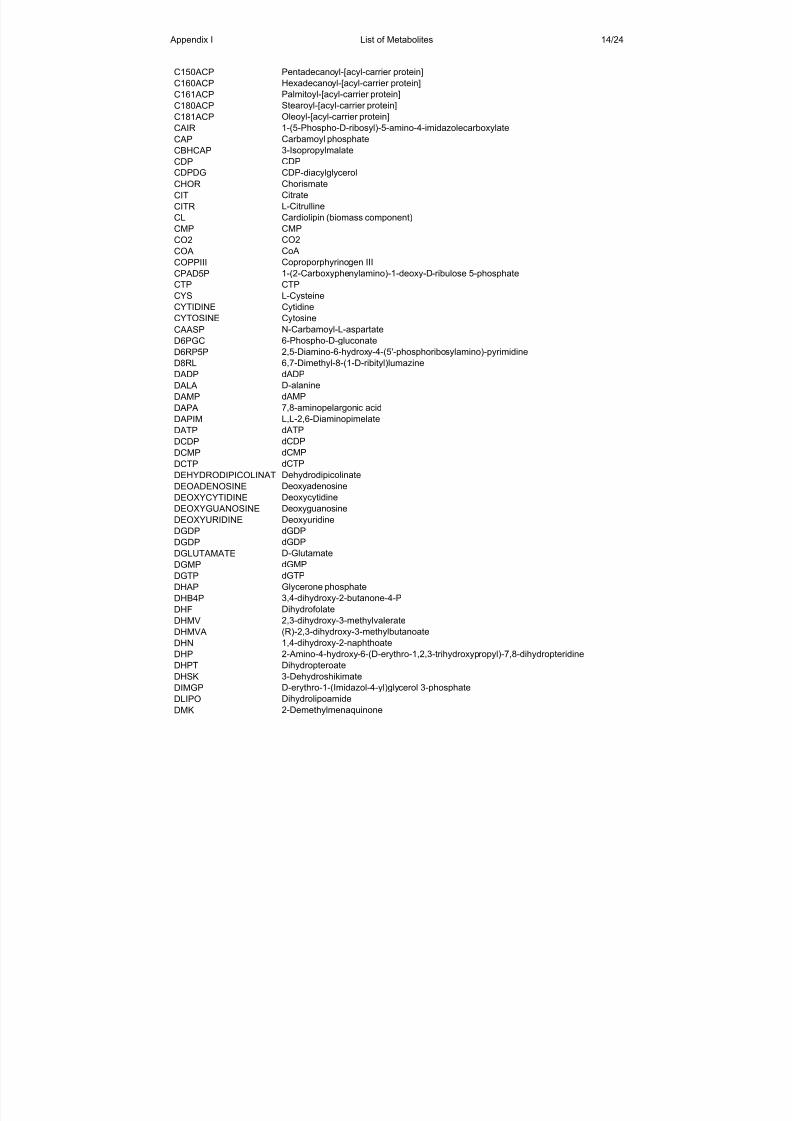
7/18/2019 Samlet PhD 20090416 U-Forside Appendix.pdf
http://slidepdf.com/reader/full/samlet-phd-20090416-u-forside-appendixpdf 166/187
Appendix I List of Metabolites 14/24
C150ACP Pentadecanoyl-[acyl-carrier protein]
C160ACP Hexadecanoyl-[acyl-carrier protein]
C161ACP Palmitoyl-[acyl-carrier protein]
C180ACP Stearoyl-[acyl-carrier protein]
C181ACP Oleoyl-[acyl-carrier protein]
CAIR 1-(5-Phospho-D-ribosyl)-5-amino-4-imidazolecarboxylate
CAP Carbamoyl phosphateCBHCAP 3-Isopropylmalate
CDP CDP
CDPDG CDP-diacylglycerol
CHOR Chorismate
CIT Citrate
CITR L-Citrulline
CL Cardiolipin (biomass component)
CMP CMP
CO2 CO2
COA CoA
COPPIII Coproporphyrinogen III
CPAD5P 1-(2-Carboxyphenylamino)-1-deoxy-D-ribulose 5-phosphateCTP CTP
CYS L-Cysteine
CYTIDINE Cytidine
CYTOSINE Cytosine
CAASP N-Carbamoyl-L-aspartate
D6PGC 6-Phospho-D-gluconate
D6RP5P 2,5-Diamino-6-hydroxy-4-(5'-phosphoribosylamino)-pyrimidine
D8RL 6,7-Dimethyl-8-(1-D-ribityl)lumazine
DADP dADP
DALA D-alanine
DAMP dAMP
DAPA 7,8-aminopelargonic acid
DAPIM L,L-2,6-Diaminopimelate
DATP dATP
DCDP dCDP
DCMP dCMP
DCTP dCTP
DEHYDRODIPICOLINAT Dehydrodipicolinate
DEOADENOSINE Deoxyadenosine
DEOXYCYTIDINE Deoxycytidine
DEOXYGUANOSINE Deoxyguanosine
DEOXYURIDINE Deoxyuridine
DGDP dGDP
DGDP dGDP
DGLUTAMATE D-GlutamateDGMP dGMP
DGTP dGTP
DHAP Glycerone phosphate
DHB4P 3,4-dihydroxy-2-butanone-4-P
DHF Dihydrofolate
DHMV 2,3-dihydroxy-3-methylvalerate
DHMVA (R)-2,3-dihydroxy-3-methylbutanoate
DHN 1,4-dihydroxy-2-naphthoate
DHP 2-Amino-4-hydroxy-6-(D-erythro-1,2,3-trihydroxypropyl)-7,8-dihydropteridine
DHPT Dihydropteroate
DHSK 3-Dehydroshikimate
DIMGP D-erythro-1-(Imidazol-4-yl)glycerol 3-phosphate
DLIPO Dihydrolipoamide
DMK 2-Demethylmenaquinone
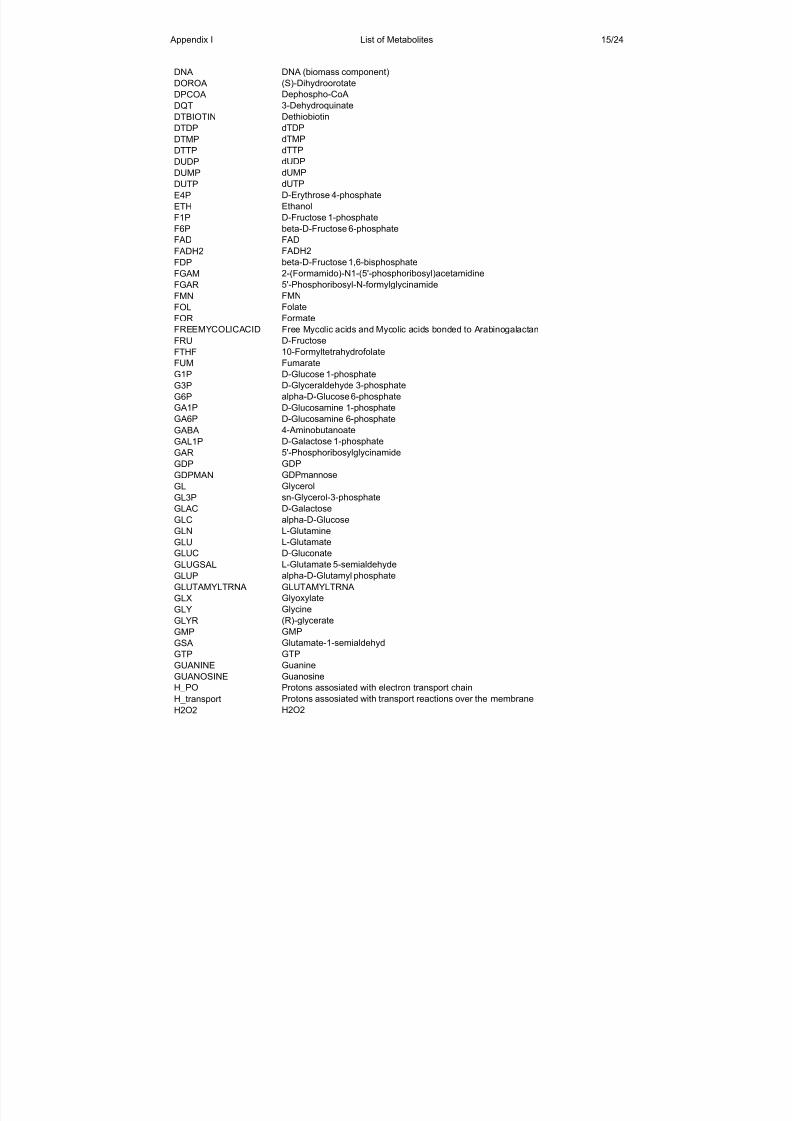
7/18/2019 Samlet PhD 20090416 U-Forside Appendix.pdf
http://slidepdf.com/reader/full/samlet-phd-20090416-u-forside-appendixpdf 167/187
Appendix I List of Metabolites 15/24
DNA DNA (biomass component)
DOROA (S)-Dihydroorotate
DPCOA Dephospho-CoA
DQT 3-Dehydroquinate
DTBIOTIN Dethiobiotin
DTDP dTDP
DTMP dTMPDTTP dTTP
DUDP dUDP
DUMP dUMP
DUTP dUTP
E4P D-Erythrose 4-phosphate
ETH Ethanol
F1P D-Fructose 1-phosphate
F6P beta-D-Fructose 6-phosphate
FAD FAD
FADH2 FADH2
FDP beta-D-Fructose 1,6-bisphosphate
FGAM 2-(Formamido)-N1-(5'-phosphoribosyl)acetamidineFGAR 5'-Phosphoribosyl-N-formylglycinamide
FMN FMN
FOL Folate
FOR Formate
FREEMYCOLICACID Free Mycolic acids and Mycolic acids bonded to Arabinogalactan
FRU D-Fructose
FTHF 10-Formyltetrahydrofolate
FUM Fumarate
G1P D-Glucose 1-phosphate
G3P D-Glyceraldehyde 3-phosphate
G6P alpha-D-Glucose 6-phosphate
GA1P D-Glucosamine 1-phosphate
GA6P D-Glucosamine 6-phosphate
GABA 4-Aminobutanoate
GAL1P D-Galactose 1-phosphate
GAR 5'-Phosphoribosylglycinamide
GDP GDP
GDPMAN GDPmannose
GL Glycerol
GL3P sn-Glycerol-3-phosphate
GLAC D-Galactose
GLC alpha-D-Glucose
GLN L-Glutamine
GLU L-Glutamate
GLUC D-GluconateGLUGSAL L-Glutamate 5-semialdehyde
GLUP alpha-D-Glutamyl phosphate
GLUTAMYLTRNA GLUTAMYLTRNA
GLX Glyoxylate
GLY Glycine
GLYR (R)-glycerate
GMP GMP
GSA Glutamate-1-semialdehyd
GTP GTP
GUANINE Guanine
GUANOSINE Guanosine
H_PO Protons assosiated with electron transport chain
H_transport Protons assosiated with transport reactions over the membrane
H2O2 H2O2
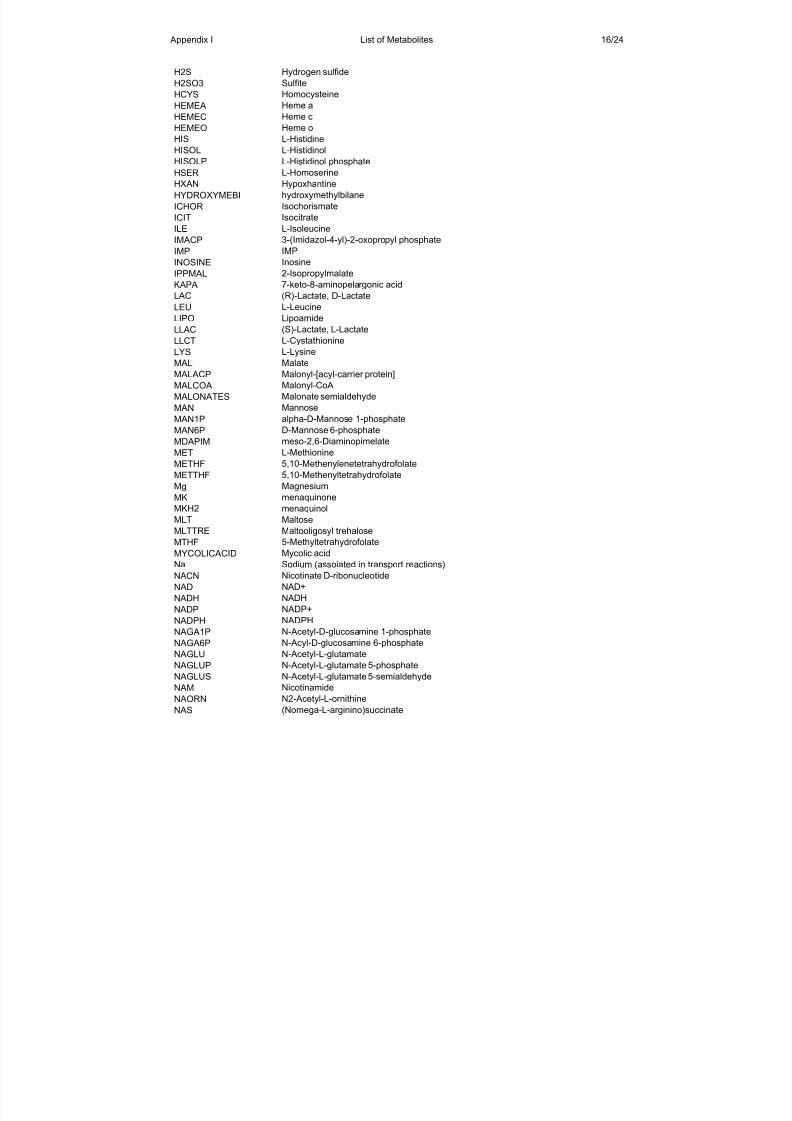
7/18/2019 Samlet PhD 20090416 U-Forside Appendix.pdf
http://slidepdf.com/reader/full/samlet-phd-20090416-u-forside-appendixpdf 168/187
Appendix I List of Metabolites 16/24
H2S Hydrogen sulfide
H2SO3 Sulfite
HCYS Homocysteine
HEMEA Heme a
HEMEC Heme c
HEMEO Heme o
HIS L-HistidineHISOL L-Histidinol
HISOLP L-Histidinol phosphate
HSER L-Homoserine
HXAN Hypoxhantine
HYDROXYMEBI hydroxymethylbilane
ICHOR Isochorismate
ICIT Isocitrate
ILE L-Isoleucine
IMACP 3-(Imidazol-4-yl)-2-oxopropyl phosphate
IMP IMP
INOSINE Inosine
IPPMAL 2-IsopropylmalateKAPA 7-keto-8-aminopelargonic acid
LAC (R)-Lactate, D-Lactate
LEU L-Leucine
LIPO Lipoamide
LLAC (S)-Lactate, L-Lactate
LLCT L-Cystathionine
LYS L-Lysine
MAL Malate
MALACP Malonyl-[acyl-carrier protein]
MALCOA Malonyl-CoA
MALONATES Malonate semialdehyde
MAN Mannose
MAN1P alpha-D-Mannose 1-phosphate
MAN6P D-Mannose 6-phosphate
MDAPIM meso-2,6-Diaminopimelate
MET L-Methionine
METHF 5,10-Methenylenetetrahydrofolate
METTHF 5,10-Methenyltetrahydrofolate
Mg Magnesium
MK menaquinone
MKH2 menaquinol
MLT Maltose
MLTTRE Maltooligosyl trehalose
MTHF 5-Methyltetrahydrofolate
MYCOLICACID Mycolic acidNa Sodium (assoiated in transport reactions)
NACN Nicotinate D-ribonucleotide
NAD NAD+
NADH NADH
NADP NADP+
NADPH NADPH
NAGA1P N-Acetyl-D-glucosamine 1-phosphate
NAGA6P N-Acyl-D-glucosamine 6-phosphate
NAGLU N-Acetyl-L-glutamate
NAGLUP N-Acetyl-L-glutamate 5-phosphate
NAGLUS N-Acetyl-L-glutamate 5-semialdehyde
NAM Nicotinamide
NAORN N2-Acetyl-L-ornithine
NAS (Nomega-L-arginino)succinate
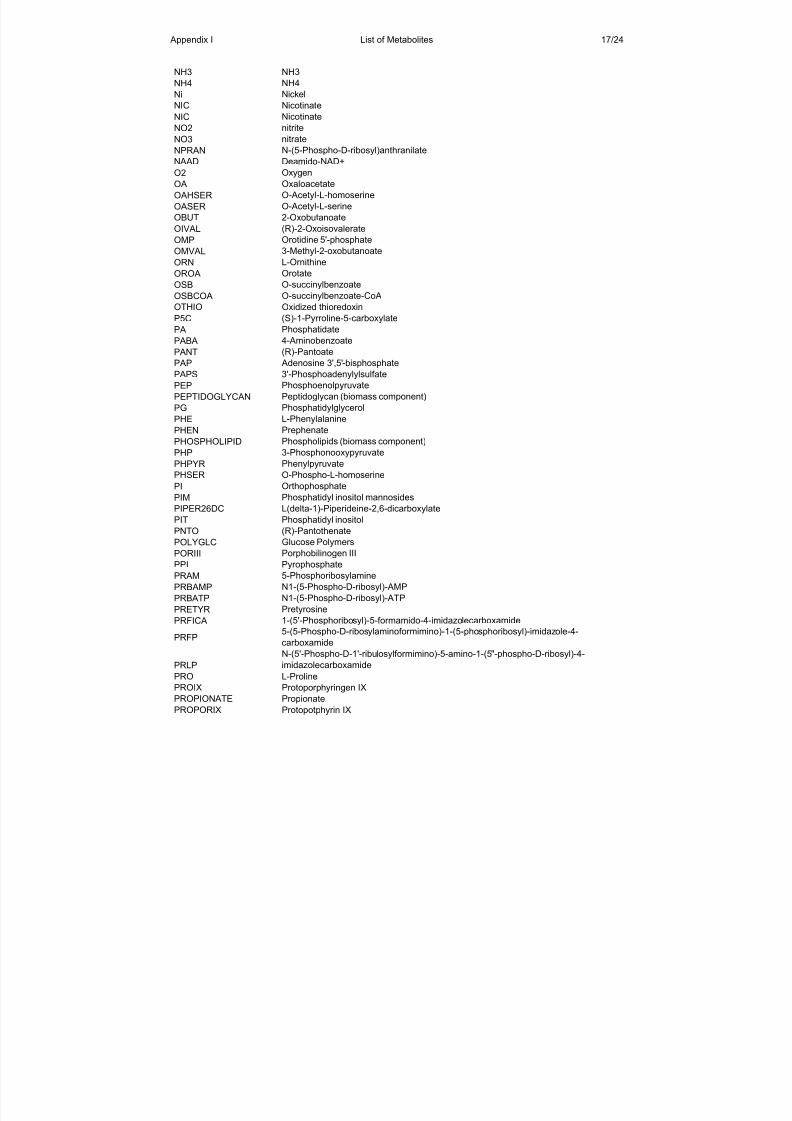
7/18/2019 Samlet PhD 20090416 U-Forside Appendix.pdf
http://slidepdf.com/reader/full/samlet-phd-20090416-u-forside-appendixpdf 169/187
Appendix I List of Metabolites 17/24
NH3 NH3
NH4 NH4
Ni Nickel
NIC Nicotinate
NIC Nicotinate
NO2 nitrite
NO3 nitrateNPRAN N-(5-Phospho-D-ribosyl)anthranilate
NAAD Deamido-NAD+
O2 Oxygen
OA Oxaloacetate
OAHSER O-Acetyl-L-homoserine
OASER O-Acetyl-L-serine
OBUT 2-Oxobutanoate
OIVAL (R)-2-Oxoisovalerate
OMP Orotidine 5'-phosphate
OMVAL 3-Methyl-2-oxobutanoate
ORN L-Ornithine
OROA OrotateOSB O-succinylbenzoate
OSBCOA O-succinylbenzoate-CoA
OTHIO Oxidized thioredoxin
P5C (S)-1-Pyrroline-5-carboxylate
PA Phosphatidate
PABA 4-Aminobenzoate
PANT (R)-Pantoate
PAP Adenosine 3',5'-bisphosphate
PAPS 3'-Phosphoadenylylsulfate
PEP Phosphoenolpyruvate
PEPTIDOGLYCAN Peptidoglycan (biomass component)
PG Phosphatidylglycerol
PHE L-Phenylalanine
PHEN Prephenate
PHOSPHOLIPID Phospholipids (biomass component)
PHP 3-Phosphonooxypyruvate
PHPYR Phenylpyruvate
PHSER O-Phospho-L-homoserine
PI Orthophosphate
PIM Phosphatidyl inositol mannosides
PIPER26DC L(delta-1)-Piperideine-2,6-dicarboxylate
PIT Phosphatidyl inositol
PNTO (R)-Pantothenate
POLYGLC Glucose Polymers
PORIII Porphobilinogen IIIPPI Pyrophosphate
PRAM 5-Phosphoribosylamine
PRBAMP N1-(5-Phospho-D-ribosyl)-AMP
PRBATP N1-(5-Phospho-D-ribosyl)-ATP
PRETYR Pretyrosine
PRFICA 1-(5'-Phosphoribosyl)-5-formamido-4-imidazolecarboxamide
PRFP5-(5-Phospho-D-ribosylaminoformimino)-1-(5-phosphoribosyl)-imidazole-4-
carboxamide
PRLP
N-(5'-Phospho-D-1'-ribulosylformimino)-5-amino-1-(5"-phospho-D-ribosyl)-4-
imidazolecarboxamide
PRO L-Proline
PROIX Protoporphyringen IX
PROPIONATE Propionate
PROPORIX Protopotphyrin IX
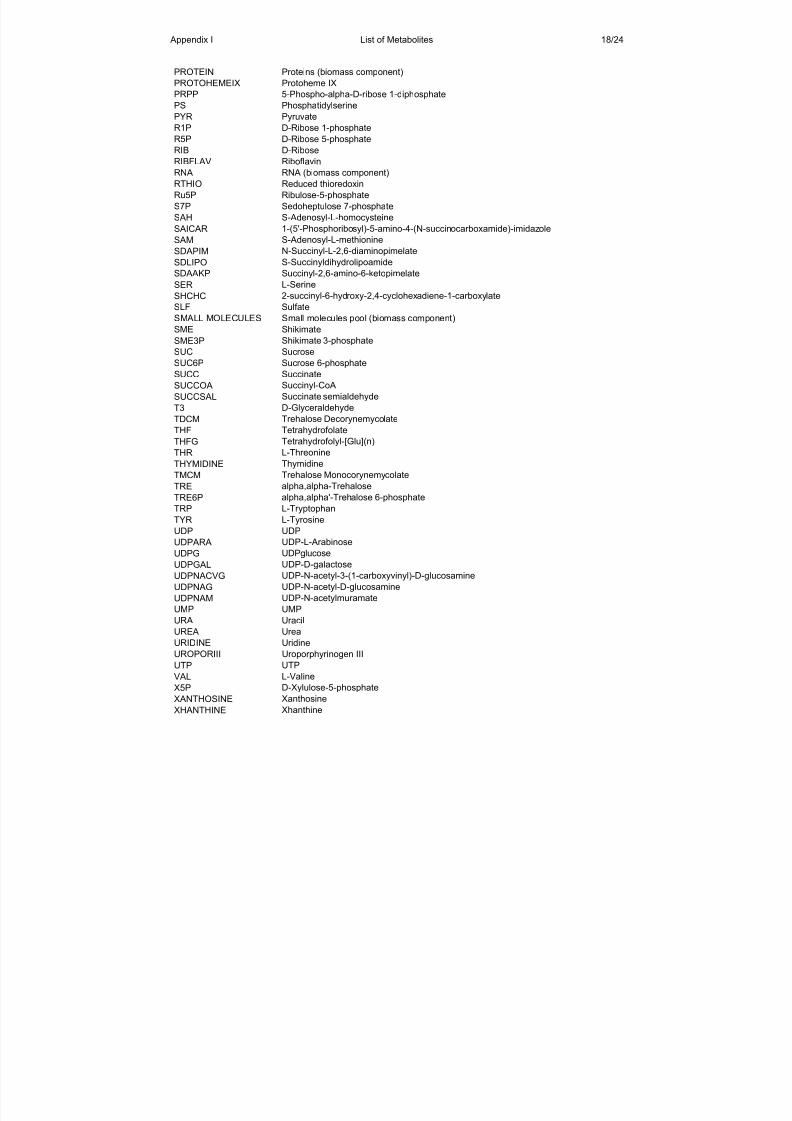
7/18/2019 Samlet PhD 20090416 U-Forside Appendix.pdf
http://slidepdf.com/reader/full/samlet-phd-20090416-u-forside-appendixpdf 170/187
Appendix I List of Metabolites 18/24
PROTEIN Proteins (biomass component)
PROTOHEMEIX Protoheme IX
PRPP 5-Phospho-alpha-D-ribose 1-diphosphate
PS Phosphatidylserine
PYR Pyruvate
R1P D-Ribose 1-phosphate
R5P D-Ribose 5-phosphateRIB D-Ribose
RIBFLAV Riboflavin
RNA RNA (biomass component)
RTHIO Reduced thioredoxin
Ru5P Ribulose-5-phosphate
S7P Sedoheptulose 7-phosphate
SAH S-Adenosyl-L-homocysteine
SAICAR 1-(5'-Phosphoribosyl)-5-amino-4-(N-succinocarboxamide)-imidazole
SAM S-Adenosyl-L-methionine
SDAPIM N-Succinyl-L-2,6-diaminopimelate
SDLIPO S-Succinyldihydrolipoamide
SDAAKP Succinyl-2,6-amino-6-ketopimelateSER L-Serine
SHCHC 2-succinyl-6-hydroxy-2,4-cyclohexadiene-1-carboxylate
SLF Sulfate
SMALL MOLECULES Small molecules pool (biomass component)
SME Shikimate
SME3P Shikimate 3-phosphate
SUC Sucrose
SUC6P Sucrose 6-phosphate
SUCC Succinate
SUCCOA Succinyl-CoA
SUCCSAL Succinate semialdehyde
T3 D-Glyceraldehyde
TDCM Trehalose Decorynemycolate
THF Tetrahydrofolate
THFG Tetrahydrofolyl-[Glu](n)
THR L-Threonine
THYMIDINE Thymidine
TMCM Trehalose Monocorynemycolate
TRE alpha,alpha-Trehalose
TRE6P alpha,alpha'-Trehalose 6-phosphate
TRP L-Tryptophan
TYR L-Tyrosine
UDP UDP
UDPARA UDP-L-Arabinose
UDPG UDPglucoseUDPGAL UDP-D-galactose
UDPNACVG UDP-N-acetyl-3-(1-carboxyvinyl)-D-glucosamine
UDPNAG UDP-N-acetyl-D-glucosamine
UDPNAM UDP-N-acetylmuramate
UMP UMP
URA Uracil
UREA Urea
URIDINE Uridine
UROPORIII Uroporphyrinogen III
UTP UTP
VAL L-Valine
X5P D-Xylulose-5-phosphate
XANTHOSINE Xanthosine
XHANTHINE Xhanthine

7/18/2019 Samlet PhD 20090416 U-Forside Appendix.pdf
http://slidepdf.com/reader/full/samlet-phd-20090416-u-forside-appendixpdf 171/187
Appendix I List of Metabolites 19/24
XMP Xanthosine 5'-phosphate
XYL D-Xylose
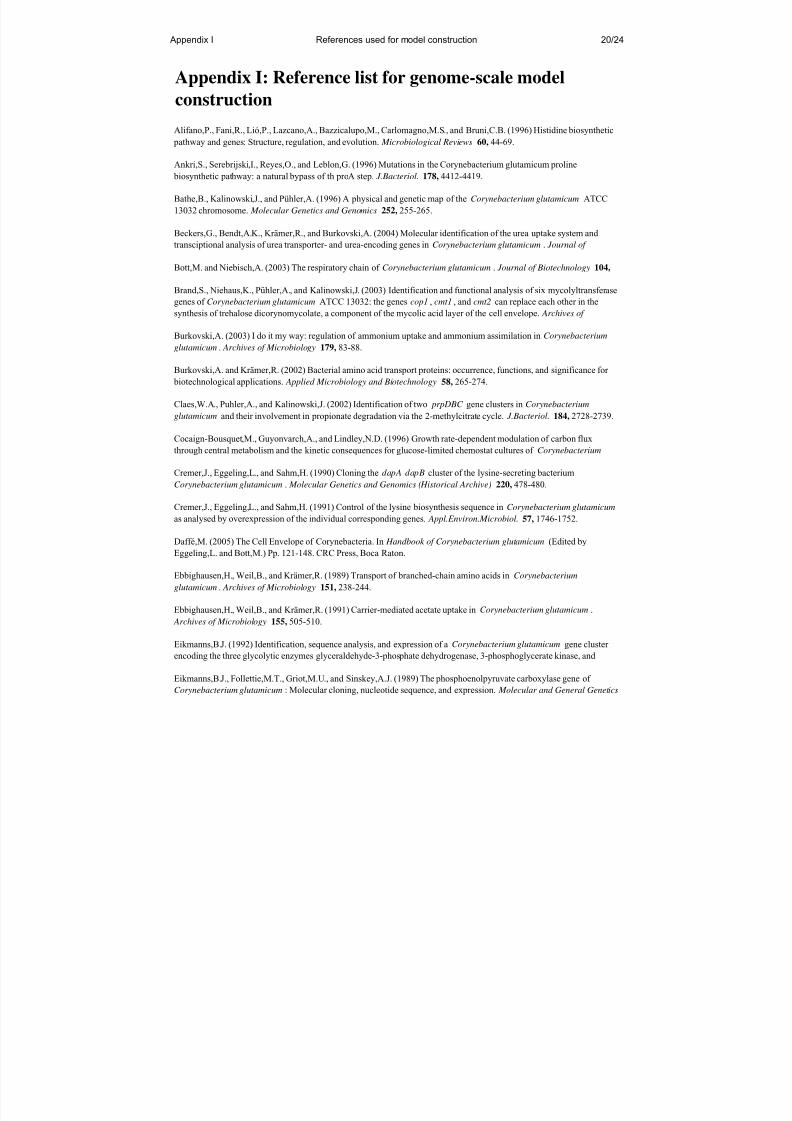
7/18/2019 Samlet PhD 20090416 U-Forside Appendix.pdf
http://slidepdf.com/reader/full/samlet-phd-20090416-u-forside-appendixpdf 172/187
Appendix I References used for model construction 20/24
Appendix I: Reference list for genome-scale model
construction
Alifano,P., Fani,R., Lió,P., Lazcano,A., Bazzicalupo,M., Carlomagno,M.S., and Bruni,C.B. (1996) Histidine biosynthetic
pathway and genes: Structure, regulation, and evolution. Microbiological Reviews 60, 44-69.
Ankri,S., Serebrijski,I., Reyes,O., and Leblon,G. (1996) Mutations in the Corynebacterium glutamicum proline
biosynthetic pathway: a natural bypass of th proA step. J.Bacteriol. 178, 4412-4419.
Bathe,B., Kalinowski,J., and Pühler,A. (1996) A physical and genetic map of the Corynebacterium glutamicum ATCC
13032 chromosome. Molecular Genetics and Genomics 252, 255-265.
Beckers,G., Bendt,A.K., Krämer,R., and Burkovski,A. (2004) Molecular identification of the urea uptake system and
transciptional analysis of urea transporter- and urea-encoding genes in Corynebacterium glutamicum . Journal of
Bott,M. and Niebisch,A. (2003) The respiratory chain of Corynebacterium glutamicum . Journal of Biotechnology 104,
Brand,S., Niehaus,K., Pühler,A., and Kalinowski,J. (2003) Identification and functional analysis of six mycolyltransferase
genes of Corynebacterium glutamicum ATCC 13032: the genes cop1 , cmt1 , and cmt2 can replace each other in the
synthesis of trehalose dicorynomycolate, a component of the mycolic acid layer of the cell envelope. Archives of
Burkovski,A. (2003) I do it my way: regulation of ammonium uptake and ammonium assimilation in Corynebacterium
glutamicum . Archives of Microbiology 179, 83-88.
Burkovski,A. and Krämer,R. (2002) Bacterial amino acid transport proteins: occurrence, functions, and significance for
biotechnological applications. Applied Microbiology and Biotechnology 58, 265-274.
Claes,W.A., Puhler,A., and Kalinowski,J. (2002) Identification of two prpDBC gene clusters in Corynebacterium
glutamicum and their involvement in propionate degradation via the 2-methylcitrate cycle. J.Bacteriol. 184, 2728-2739.
Cocaign-Bousquet,M., Guyonvarch,A., and Lindley,N.D. (1996) Growth rate-dependent modulation of carbon flux
through central metabolism and the kinetic consequences for glucose-limited chemostat cultures of Corynebacterium
Cremer,J., Eggeling,L., and Sahm,H. (1990) Cloning the dapA dapB cluster of the lysine-secreting bacterium
Corynebacterium glutamicum . Molecular Genetics and Genomics (Historical Archive) 220, 478-480.
Cremer,J., Eggeling,L., and Sahm,H. (1991) Control of the lysine biosynthesis sequence in Corynebacterium glutamicum
as analysed by overexpression of the individual corresponding genes. Appl.Environ.Microbiol. 57, 1746-1752.
Daffé,M. (2005) The Cell Envelope of Corynebacteria. In Handbook of Corynebacterium glutamicum (Edited by
Eggeling,L. and Bott,M.) Pp. 121-148. CRC Press, Boca Raton.
Ebbighausen,H., Weil,B., and Krämer,R. (1989) Transport of branched-chain amino acids in Corynebacterium
glutamicum . Archives of Microbiology 151, 238-244.
Ebbighausen,H., Weil,B., and Krämer,R. (1991) Carrier-mediated acetate uptake in Corynebacterium glutamicum .
Archives of Microbiology 155, 505-510.
Eikmanns,B.J. (1992) Identification, sequence analysis, and expression of a Corynebacterium glutamicum gene cluster
encoding the three glycolytic enzymes glyceraldehyde-3-phosphate dehydrogenase, 3-phosphoglycerate kinase, and
Eikmanns,B.J., Follettie,M.T., Griot,M.U., and Sinskey,A.J. (1989) The phosphoenolpyruvate carboxylase gene of
Corynebacterium glutamicum : Molecular cloning, nucleotide sequence, and expression. Molecular and General Genetics
7/18/2019 Samlet PhD 20090416 U-Forside Appendix.pdf
http://slidepdf.com/reader/full/samlet-phd-20090416-u-forside-appendixpdf 173/187
Appendix I References used for model construction 21/24
Eikmanns,B.J., Rittmann,D., and Sahm,H. (1995) Cloning, sequence analysis, expression, and inactivation of the
Corynebacterium glutamicum icd gene encoding isocitrate dehydrogenase and biochemical characterization of the
Eikmanns,B.J., Thum-Schmitz,N., Eggeling,L., Ludtke,K.U., and Sahm,H. (1994) Nucleotide sequence, expression and
transcriptional analysis of the Corynebacterium glutamicum gltA gene encoding citrate synthase. Microbiology 140, 1817
Fazel,A.M. and Jensen,R.A. (1979a) Aromatic aminotransferases in coryneform bacteria. Journal of Bacteriology 140,
Fazel,A.M. and Jensen,R.A. (1979b) Obligatory biosynthesis of L-tyrosine via the pretyrosine branchlet in coryneform
bacteria. Journal of Bacteriology 138, 805-815.
Follettie,M.T. and Sinskey,A.J. (1986) Molecular cloning and nucleotide sequence of the Corynebacterium glutamicum
pheA gene. Journal of Bacteriology 167, 695-702.
Groeger,U. and Sahn,H. (1987) Microbial production of L-leucine from alpha-ketoisocaproate by Corynebacterium
glutamicum . Appl.Environ.Microbiol. 25, 352-356.
Hoischen,C. and Krämer,R. (1990) Membrane alteration is necessary but not sufficient for effective glutamate secretion in
Corynebacterium glutamicum . Journal of Bacteriology 172, 3409-3416.
Hwang,B.-J., Yeom,H.-J., Kim,Y., and Lee,H.-S. (2002) Corynebacterium glutamicum utilizes both transsulfuration and
direct sulfhydrylation pathways for methionine biosynthesis. Journal of Bacteriology 184, 1277-1286.
Ikeda,M. (2005) L-Tryptophan Production. In Handbook of Corynebacterium glutamicum (Edited by Eggeling,L. and
Bott,M.) Pp. 489-510. CRC Press, Boca Raton.
Ingraham,J.L., Maaløe,O., and Niedhardt,F.C. (1983) Growth of the Bacterial Cell . Sinauer Associates, Inc., Sunderland,
Jakoby,M., Tesch,M., Sahn,H., Krämer,R., and Burkowski,A. (1997) Isolation of the Corynebacterium glutamicum glnA
gene encoding glutamine syntase I. FEMS Microbiology Letters 154, 81-88.
Jetten,M.S., Gubler,M.E., Lee,S.H., and Sinskey,A.J. (1994a) Structural and functional analysis of pyruvate kinase from
Corynebacterium glutamicum. Appl.Environ.Microbiol. 60, 2501-2507.
Jetten,M.S.M. and Anthony,J.S. (1995) Purification and properties of oxaloacetate decarboxylase from Corynebacterium
glutamicum . Antonie van Leeuwenhoek 67, 221-227.
Jetten,M.S.M., Pitoc,G.A., Follettie,M.T., and Sinskey,A.J. (1994b) Regulation of phospho(enol)-pyruvate- and
oxaloacetate-converting enzymes in <i>Corynebacterium glutamicum</i>. Applied Microbiology and Biotechnology 41,
Jung,S.-I., Han,M.-S., Kwon,J.-H., Cheon,C.-I., Min,K.-H., and Lee,M.-S. (1998) Cloning of the histidine biosynthetic
genes of Corynebacterium glutamicum : Orgenization and sequencing analysis of the hisA, impA and hisF gene cluster.
Biochemical and Biophysical Research Communications 247, 741-745.
Kalinowski,J., Bathe,B., Bartels,D., Bischoff,N., Bott,M., Burkovski,A., Dusch,N., Eggeling,L., Eikmanns,B.J., and
Gaigalat,L. (2003) The complete Corynebacterium glutamicum ATCC 13032 genome sequence and its impact on the
production of -aspartate-derived amino acids and vitamins. Journal of Biotechnology 104, 5-25.
Keilhauer,C., Eggeling,L., and Sahm,H. (1993) Isoleucine synthesis in Corynebacterium glutamicum: molecular analysis
of the ilvB-ilvN-ilvC operon. J.Bacteriol. 175, 5595-5603.
Kronemeyer,W., Peekhaus,N., Kramer,R., Sahm,H., and Eggeling,L. (1995) Structure of the gluABCD cluster encoding
the glutamate uptake system of Corynebacterium glutamicum. J.Bacteriol. 177, 1152-1158.
Krug,A., Wendisch,V.F., and Bott,M. (2005) Identification of AcnR, a TetR-type repressor of the aconitase gene acn inCorynebacterium glutamicum . J.Biol.Chem. 280, 585-595.
7/18/2019 Samlet PhD 20090416 U-Forside Appendix.pdf
http://slidepdf.com/reader/full/samlet-phd-20090416-u-forside-appendixpdf 174/187
Appendix I References used for model construction 22/24
Lee,H.-S. (2005) Sulfur Metabolism and Its Regulation. In Handbook of Corynebacterium glutamicum (Edited by
Eggeling,L. and Bott,M.) Pp. 351-376. CRC Press, Boca Raton.
Lee,H.-S. and Hwang,B.-J. (2003) Methionine biosynthesis and its regulation in Corynebacterium glutamicum : parallel
pathways of transsulfuration and direct sulfhydration. Applied Microbiology and Biotechnology 62, 459-467.
Leyval,D., Uy,D., Delaunay,S., Goergen,J.L., and Engasser,J.M. (2003) Characterisation of the enzyme activities involvedin the valine biosynthetic pathway in a valine-producing strain of Corynebacterium glutamicum . Journal of
Lin,L.L., Liao,H.F., Chien,H.R., and Hsu,W.H. (2001) Identification of essential cysteine residues in 3-Deoxy-d-Arabino-
Heptulosonate-7-Phosphate Synthase from Corynebacterium glutamicum . Current Microbiology 42, 426-431.
Malumbres,M., Mateos,L.M., Lumbreras,M.A., Guerrero,C., and Martin,J.F. (1994) Analysis and expression of the thrC
gene of Brevibacterium lactofermentum and characterization of the encoded threonine synthase. Appl.Environ.Microbiol.
Marx,A., Hans,S., Möckel,B., Bathe,B., and de Graaf,A.A. (2003) Metabolic phenotype of phosphoglucose isomerase
mutants of Corynebacterium glutamicum . Journal of Biotechnology 104, 185-197.
Miyajima,R., Otsuka,S.-I., and Shiio,I. (1968) Regulation of aspartate family amino acid biosynthesis in Brevibacterium flavum . 1. Inhibition by amino acids of the enzymes in threonine biosynthesis. Journal of Biochemistry 63, 139-148.
Möckel,B., Eggeling,L., and Sahm,H. (1992) Functional and structural analysis of threonine dehydratase from
Corynebacerium glutamicum . Journal of Bacteriology 174, 8065-8072.
Molenaar,D., van der Rest,M.E., Drysch,A., and Yucel,R. (2000) Functions of the membrane-associated and cytoplasmic
malate dehydrogenases in the citric acid cycle of Corynebacterium glutamicum . J.Bacteriol. 182, 6884-6891.
Moritz,B., Striegel,K., de Graff,A.A., and Sahm,H. (2000) Kinetic properties of the glucose-6-phosphate and 6-
phosphogluconate dehydrogenases from Corynebacterium glutamicum and their application for predicting pentose
phosphate pathway flux in vivo . European Journal of Biochemistry 267, 3442-3452.
Nampoothiri,K.M., Hoischen,C., Bathe,B., Möckel,B., Pfefferle,W., Krumbach,K., Sahm,H., and Eggeling,L. (2002)
Expression of genes of lipid synthesis and altered lipid composition modulates L-glutamate efflux of Corynebacterium
Netzer,R., Peters-Wendisch,P., Eggeling,L., and Sahm,H. (2004) Cometabolism of a Nongrowth Substrate: L-Serine
Utilization by Corynebacterium glutamicum . Appl.Environ.Microbiol. 70, 7148-7155.
Palmieri,L., Berns,D., Krämer,R., and Eikmanns,M. (1996) Threonine diffusion and threonine transport in
Corynebacterium glutamicum and their role in threoninge production. Archives of Microbiology 165, 48-54.
Park,S.Y., Kim,H.K., Yoo,S.-K., Oh,T.K., and Lee,J.K. (2000) Characterization of glk , a gene coding for glucose kinase
of Corynebacterium glutamicum . FEMS Microbiology Letters 188, 209-215.
Park,S.-D., Lee,J.-Y., Kim,Y., Kim,J.-H., and Lee,H.-S. (1998) Isolation and analysis of metA, a biosynthetic gene
encoding homoserine acetyltransferase in Corynebacterium glutamicum . Molecules and Cells 8, 286-294.
Pátèk,M., Hochmannová,J., Jelínková,M., Nesvera,J., and Eggeling,L. (1998) Analysis of the leuB gene from
Corynebacterium glutamicum . Applied Microbiology and Biotechnology 50, 42-47.
Peters-Wendisch,P., Stoltz,M., Etterich,H., Kennerknecht,N., Sahn,H., and Eggeling,L. (2005) Metabolic Engineering of
Corynebacterium glutamicum for L-serine production. Appl.Environ.Microbiol. 71, 7139-7144.
Peters-Wendisch,P.G., Kreutzer,C., Kalinowski,J., Patek,M., Sahm,H., and Eikmanns,B.J. (1998) Pyruvate carboxylase
from Corynebacterium glutamicum : characterization, expression and inactivation of the pyc gene. Microbiology 144,
Peters-Wendisch,P.G., Netzer,R., Eggeling,L., and Sahm,H. (2002) 3-Phosphoglycerate dehydrogenase from
Corynebacterium glutamicum : the C-terminal domain is not essential for activity but is required for inhibition by L-
7/18/2019 Samlet PhD 20090416 U-Forside Appendix.pdf
http://slidepdf.com/reader/full/samlet-phd-20090416-u-forside-appendixpdf 175/187
Appendix I References used for model construction 23/24
Radmacher,E., Vaitsikova,A., Burger,U., Krumbach,K., Sahm,H., and Eggeling,L. (2002) Linking Central Metabolism
with Increased Pathway Flux: L-Valine Accumulation by Corynebacterium glutamicum . Appl.Environ.Microbiol. 68,
Reinscheid,D., Eikmanns,B.J., and Sahn,H. (1994a) Malate synthase from Corynebacterium glutamicum: sequence
analysis of the gene and biochemical characterization of the enzyme. Microbiology 140, 3099-3108.
Reinscheid,D.J., Eikmanns,B.J., and Sahm,H. (1994b) Characterization of the isocitrate lyase gene from Corynebacterium
glutamicum and biochemical analysis of the enzyme. J.Bacteriol. 176, 3474-3483.
Reinscheid,D.J., Eikmanns,B.J., and Sahn,H. (1991) Analysis of a Corynebacterium glutamicum hom gene coding for a
feed-back reistant homoserine dehydrogenase. Journal of Bacteriology 173, 3228-3230.
Reinscheid,D.J., Schnicke,S., Rittmann,D., Zahnow,U., Sahm,H., and Eikmanns,B.J. (1999) Cloning, sequence analysis,
expression and inactivation of the Corynebacterium glutamicum pta-ack operon encoding phosphotransacetylase and
Riedel,C., Rittmann,D., Dangel,P., Möckel,B., Sahn,H., and Eikmanns,B.J. (2001) Characterization, expression, and
inactivation of the phosphoenolpyruvate carboxykinase gene from Corynebacterium glutamicum and significance of the
enzyme for growth and amino acid production. Journal of Molecular Microbiology and Biotechnology 3, 573-583.
Rittmann,D., Schaffer,S., Wendisch,V.F., and Sahn,H. (2003) Fructose-1,6-bisphosphatase from Corynebacterium
glutamicum : expression and deletion of the fbp gene and biochemical characterization of the enzyme. Archives of
Rückert,C., Pühler,A., and Kalinowski,J. (2003) Genome-wide analysis of the L-methionine biosynthetic pathway in
Corynebacterium glutamicum by targeted gene deletion and homologous complementation. Journal of Biotechnology
Sahm,H. and Eggeling,L. (1999) D-pantothenate synthesis in Corynebacterium glutamicum and use of panBC and genes
encoding L-valine synthesis for D-pantothenate overproduction. Appl.Environ.Microbiol. 65, 1973-1979.
Schrumpf,B., Schwarzer,A., Kalinowski,J., Pühler,A., Eggeling,L., and Sahn,H. (1991) A functionally split pathway for
lysine synthesis in Corynebacterium glutamicum . Journal of Bacteriology 173, 4510-4516.
Schwinde,J.W., Hertz,P.F., Sahm,H., Eikmanns,B.J., and Guyonvarch,A. (2001) Lipoamide dehydrogenase from
Corynebacterium glutamicum : molecular and physiological analysis of the lpd gene and characterization of the enzyme.
Serebrijski,I., Wojcik,F., Reyes,O., and Leblon,G. (1995) Multicopy suppression by asd gene and osmotic stress-
dependent complementation by heterologous proA in proA mutants. J.Bacteriol. 177, 7255-7260.
Siewe,R., Weil,B., Burkovski,A., Eggeling,L., Krämer,R., and Jahns,T. (1998) Urea uptake and urease activity in
Corynebacterium glutamicum . Archives of Microbiology 169, 411-416.
Siewe,R., Weil,B., and Krämer,R. (1995) Glutamine uptake by a sodium-dependent secondary transport system in
Corynebacterium glutamicum . Archives of Microbiology 164, 98-103.
Simic,P., Sahm,H., and Eggeling,L. (2001) L-threonine export: use of peptides to identify a new translocator from
Corynebacterium glutamicum . Journal of Bacteriology 183, 5317-5324.
Simic,P., Willuhn,J., Sahn,H., and Eggeling,L. (2002) Identification of glyA (encoding serine hydroxymethyltransferase)
and its use together with the exporter ThrE to increase L-threonine accumulation by Corynebacterium glutamicum .
Sugimoto,S. and Shiio,I. (1989) Fructose metabolism and regulation of 1-phosphofructokinase and 6-phosphofructokinase
in Brevibacterium flavum . Agricultural and Biological Chemistry 53, 1261-1268.
Sugimoto,S.-I. and Shiio,I. (1977) Enzymes of the tryptophan synthetic pathway in Brevibacterium flavum . The Journal
Tzvetkov,M., Klopprogge,C., Zelder,O., and Liebl,W. (2003) Genetic dissection of trehalose biosynthesis in
Corynebacterium glutamicum : inactivation of trehalose production leads to impaired growth and an altered cell wall lipid
7/18/2019 Samlet PhD 20090416 U-Forside Appendix.pdf
http://slidepdf.com/reader/full/samlet-phd-20090416-u-forside-appendixpdf 176/187
Appendix I References used for model construction 24/24
Usuda,Y., Tujimoto,N., Abe,C., Asakura,Y., Kimura,E., Kawahara,Y., Kurahashi,O., and Matsui,H. (1996) Molecular
cloning of the Corynebacterium glutamicum ('Brevibacterium lactofermentum' AJ12036) odhA gene encoding a novel
type of 2-oxoglutarate dehydrogenase. Microbiology-Uk 142, 3347-3354.
Vallino,J.J. and Stephanopoulos,G. (1993) Metabolic flux distribution in Corynebacterium glutamicum during growth
and lysine overproduction. Biotechnology and Bioengineering 41, 633-646.
von der Osten,C.H., Barbas,C.H., Wong,C.F., and Sinskey,A.J. (1989) Molecular cloning, nucleotide sequence and fine-
structural analysis of the Corynebacterium glutamicum fda gene: structural comparison of C. glutamicum fructose-1,6-
biphosphate aldolase to class I and class II aldolases. Molecular Microbiology 3, 1625-1637.
Wada,M., Awano,N., Haisa,K., Takagi,H., and Nakamori,S. (2002) Purification, characterization and identification of
cysteine desulfhydrase of Corynebacterium glutamicum , and its relationship to cysteine production. FEMS Microbiology
Wada,M., Awano,N., Yamazawa,H., Takagi,H., and Nakamori,S. (2004) Purification and characterization of O -
acetylserine sulfhydrylase of Corynebacterium glutamicum . Bioscience Biotechnology and Biochemistry 68, 1581-1583.
Wehrmann,A., Morakkabati,S., Kramer,R., Sahm,H., and Eggeling,L. (1995) Functional analysis of sequences adjacent todapE of Corynebacterium glutamicum reveals the presence of aroP, which encodes the aromatic amino acid transporter.
Willis,L.B., Lessard,P.A., and Sinskey,A.J. (2005) Synthesis of L-Threonine and Branched-Chain Amino Acids. In
Handbook of Corynebacterium Glutamicum (Edited by Eggeling,L. and Bott,M.) Pp. 511-531. CRC Press, Boca Raton.
Yokota,A. and Lindley,N.D. (2005) Central Metabolism: Sugar Uptake and Conversion. In Handbook of
Corynebacterium glutamicum (Edited by Eggeling,L. and Bott,M.) Pp. 215-240. CRC Press, Boca Raton.
Zhao,Y. and Lin,Y.H. (2002) Flux distribution and partitioning in Corynebacterium glutamicum grown at different
specific growth rates. Process Biochemistry 37, 775-785.

7/18/2019 Samlet PhD 20090416 U-Forside Appendix.pdf
http://slidepdf.com/reader/full/samlet-phd-20090416-u-forside-appendixpdf 177/187
Appendix II
Biomass compostition of
Corynebacterium glutamicum used for
genome-scale reconstruction
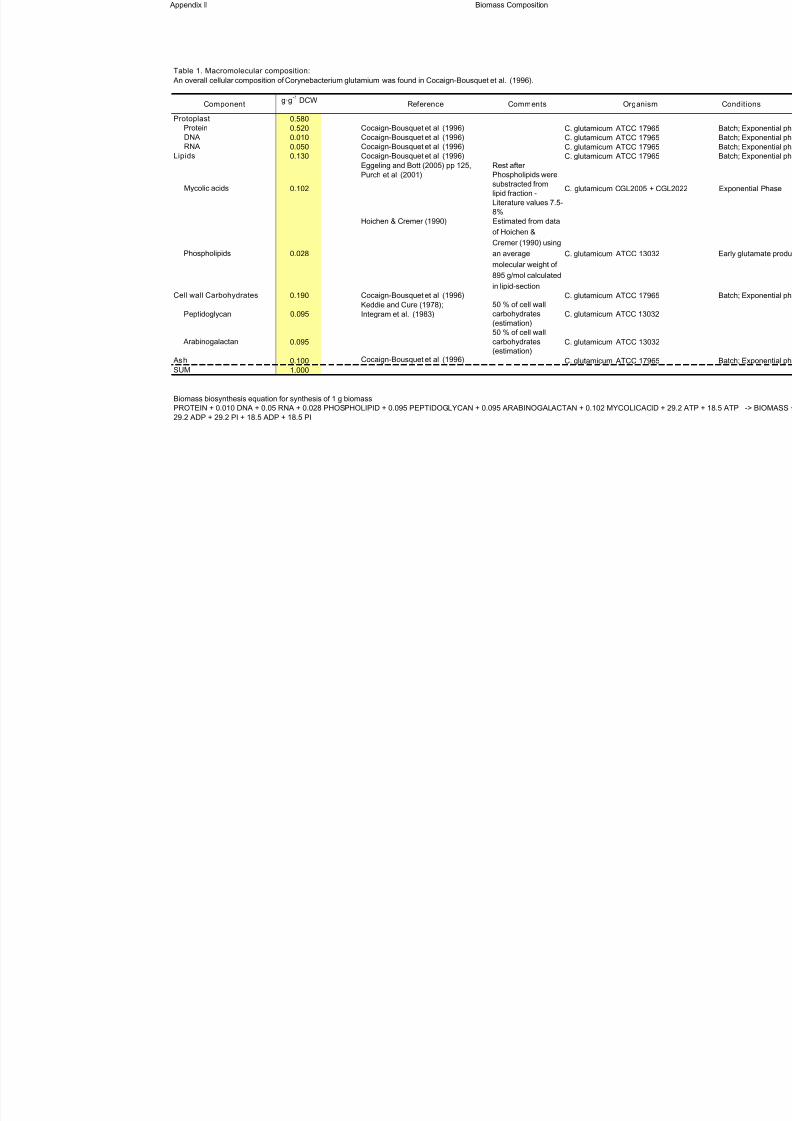
7/18/2019 Samlet PhD 20090416 U-Forside Appendix.pdf
http://slidepdf.com/reader/full/samlet-phd-20090416-u-forside-appendixpdf 178/187
Appendix II Biomass Composition
Table 1. Macromolecular composition:
g·g-1
DCW
0.580
0.520 Cocaign-Bousquet et al (1996) C. glutamicum ATCC 17965
0.010 Cocaign-Bousquet et al (1996) C. glutamicum ATCC 179650.050 Cocaign-Bousquet et al (1996) C. glutamicum ATCC 17965
0.130 Cocaign-Bousquet et al (1996) C. glutamicum ATCC 17965
0.102
Eggeling and Bott (2005) pp 125,
Purch et al (2001)
Rest after
Phospholipids were
substracted from
lipid fraction -
Literature values 7.5-
8%
C. glutamicum CGL2005 + CGL2
0.028
Hoichen & Cremer (1990) Estimated from data
of Hoichen &
Cremer (1990) using
an average
molecular weight of
895 g/mol calculatedin lipid-section
C. glutamicum ATCC 13032
0.190 Cocaign-Bousquet et al (1996) C. glutamicum ATCC 17965
Peptidoglycan 0.095
Keddie and Cure (1978);
Integram et al. (1983)
50 % of cell wall
carbohydrates
(estimation)
C. glutamicum ATCC 13032
0.095
50 % of cell wall
carbohydrates
(estimation)
C. glutamicum ATCC 13032
0.100 Cocaign-Bousquet et al (1996) C. glutamicum ATCC 17965
1.000
Protoplast
Component
Cell wall Carbohydrates
Arabinogalactan
Protein
DNA RNA
Lipids
An overall cellular composition of Corynebacterium glutamium was found in Cocaign-Bousquet et al. (1996).
Biomass biosynthesis equation for synthesis of 1 g biomass:
PROTEIN + 0.010 DNA + 0.05 RNA + 0.028 PHOSPHOLIPID + 0.095 PEPTIDOGLYCAN + 0.095 ARABINOGALACTAN + 0.102 MYCOLICACID + 29
29.2 ADP + 29.2 PI + 18.5 ADP + 18.5 PI
Phospholipids
Reference Comments Organism
Mycolic acids
Ash
SUM
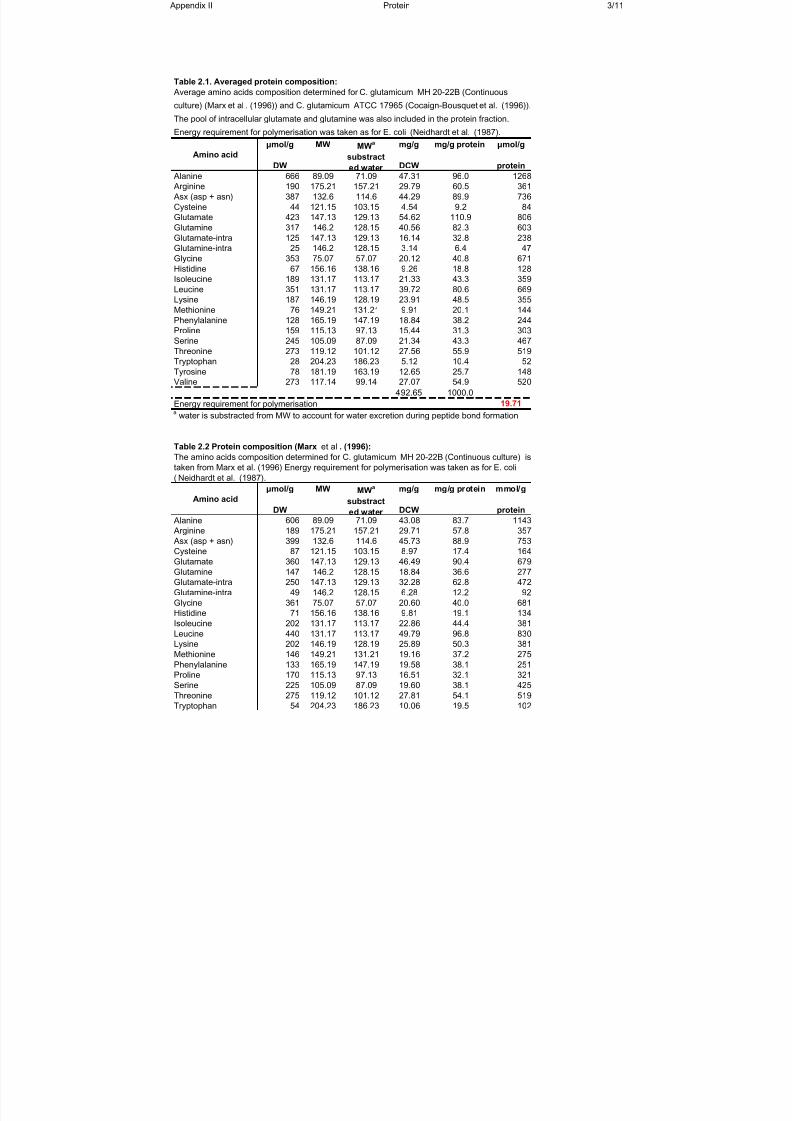
7/18/2019 Samlet PhD 20090416 U-Forside Appendix.pdf
http://slidepdf.com/reader/full/samlet-phd-20090416-u-forside-appendixpdf 179/187
Appendix II Protein 3/11
Table 2.1. Averaged protein composition:
μmol/g
DW
MW MWa
substract
ed water
mg/g
DCW
mg/g protein μmol/g
protein
666 89.09 71.09 47.31 96.0 1268
190 175.21 157.21 29.79 60.5 361
387 132.6 114.6 44.29 89.9 736
44 121.15 103.15 4.54 9.2 84
423 147.13 129.13 54.62 110.9 806
317 146.2 128.15 40.56 82.3 603
125 147.13 129.13 16.14 32.8 238
25 146.2 128.15 3.14 6.4 47
353 75.07 57.07 20.12 40.8 671
67 156.16 138.16 9.26 18.8 128
189 131.17 113.17 21.33 43.3 359351 131.17 113.17 39.72 80.6 669
187 146.19 128.19 23.91 48.5 355
76 149.21 131.21 9.91 20.1 144
128 165.19 147.19 18.84 38.2 244
159 115.13 97.13 15.44 31.3 303
245 105.09 87.09 21.34 43.3 467
273 119.12 101.12 27.56 55.9 519
28 204.23 186.23 5.12 10.4 52
78 181.19 163.19 12.65 25.7 148
273 117.14 99.14 27.07 54.9 520
492.65 1000.0
19.71a
water is substracted from MW to account for water excretion during peptide bond formation
Table 2.2 Protein composition (Marx et al . (1996):
μmol/g
DW
MW MWa
substract
ed water
mg/g
DCW
mg/g protein mmol/g
protein
606 89.09 71.09 43.08 83.7 1143
189 175.21 157.21 29.71 57.8 357
399 132.6 114.6 45.73 88.9 753
87 121.15 103.15 8.97 17.4 164360 147.13 129.13 46.49 90.4 679
147 146.2 128.15 18.84 36.6 277
250 147.13 129.13 32.28 62.8 472
49 146.2 128.15 6.28 12.2 92
361 75.07 57.07 20.60 40.0 681
71 156.16 138.16 9.81 19.1 134
202 131.17 113.17 22.86 44.4 381
440 131.17 113.17 49.79 96.8 830
202 146.19 128.19 25.89 50.3 381
146 149.21 131.21 19.16 37.2 275
133 165.19 147.19 19.58 38.1 251
170 115.13 97.13 16.51 32.1 321
225 105.09 87.09 19.60 38.1 425
275 119.12 101.12 27.81 54.1 51954 204.23 186.23 10.06 19.5 102
Threonine
Tyrosine
Valine
Energy requirement for polymerisation
Glycine
Histidine
Isoleucine
Tryptophan
Leucine
Lysine
Methionine
Phenylalanine
Proline
Serine
Tryptophan
Phenylalanine
Proline
Serine
Threonine
Isoleucine
Leucine
Lysine
Methionine
Glutamate-intra
Glutamine-intra
Glycine
Histidine
Asx (asp + asn)
CysteineGlutamate
Glutamine
Asx (asp + asn)
Amino acid
Alanine
Arginine
The amino acids composition determined for C. glutamicum MH 20-22B (Continuous culture) is
taken from Marx et al. (1996) Energy requirement for polymerisation was taken as for E. coli
( Neidhardt et al. (1987).
Cysteine
Glutamate
Glutamine
Glutamate-intra
Glutamine-intra
Average amino acids composition determined for C. glutamicum MH 20-22B (Continuous
culture) (Marx et al . (1996)) and C. glutamicum ATCC 17965 (Cocaign-Bousquet et al. (1996)).
The pool of intracellular glutamate and glutamine was also included in the protein fraction.
Energy requirement for polymerisation was taken as for E. coli (Neidhardt et al. (1987).
Amino acid
Alanine
Arginine
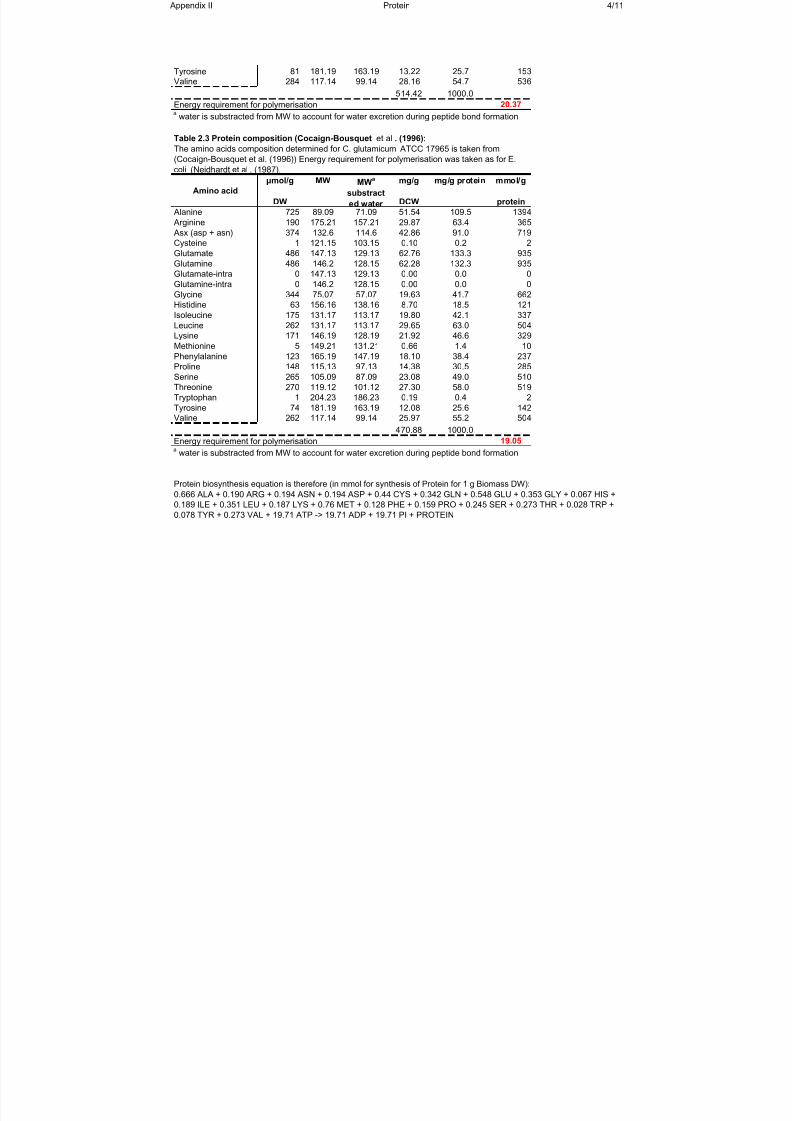
7/18/2019 Samlet PhD 20090416 U-Forside Appendix.pdf
http://slidepdf.com/reader/full/samlet-phd-20090416-u-forside-appendixpdf 180/187
Appendix II Protein 4/11
81 181.19 163.19 13.22 25.7 153
284 117.14 99.14 28.16 54.7 536
514.42 1000.0
20.37a water is substracted from MW to account for water excretion during peptide bond formation
Table 2.3 Protein composition (Cocaign-Bousquet et al . (1996):
μmol/g
DW
MW MWa
substract
ed water
mg/g
DCW
mg/g protein mmol/g
protein
725 89.09 71.09 51.54 109.5 1394
190 175.21 157.21 29.87 63.4 365
374 132.6 114.6 42.86 91.0 719
1 121.15 103.15 0.10 0.2 2
486 147.13 129.13 62.76 133.3 935
486 146.2 128.15 62.28 132.3 935
0 147.13 129.13 0.00 0.0 00 146.2 128.15 0.00 0.0 0
344 75.07 57.07 19.63 41.7 662
63 156.16 138.16 8.70 18.5 121
175 131.17 113.17 19.80 42.1 337
262 131.17 113.17 29.65 63.0 504
171 146.19 128.19 21.92 46.6 329
5 149.21 131.21 0.66 1.4 10
123 165.19 147.19 18.10 38.4 237
148 115.13 97.13 14.38 30.5 285
265 105.09 87.09 23.08 49.0 510
270 119.12 101.12 27.30 58.0 519
1 204.23 186.23 0.19 0.4 2
74 181.19 163.19 12.08 25.6 142
262 117.14 99.14 25.97 55.2 504
470.88 1000.0
19.05a water is substracted from MW to account for water excretion during peptide bond formation
Protein biosynthesis equation is therefore (in mmol for synthesis of Protein for 1 g Biomass DW):
0.666 ALA + 0.190 ARG + 0.194 ASN + 0.194 ASP + 0.44 CYS + 0.342 GLN + 0.548 GLU + 0.353 GLY + 0.067 HIS +
0.189 ILE + 0.351 LEU + 0.187 LYS + 0.76 MET + 0.128 PHE + 0.159 PRO + 0.245 SER + 0.273 THR + 0.028 TRP +
0.078 TYR + 0.273 VAL + 19.71 ATP -> 19.71 ADP + 19.71 PI + PROTEIN
Methionine
Phenylalanine
Proline
Serine
Energy requirement for polymerisation
Threonine
Tryptophan
Tyrosine
Valine
Amino acid
Alanine
Arginine
Asx (asp + asn)
Isoleucine
Cysteine
Glutamate
Glutamine
Glutamate-intra
Leucine
Lysine
TyrosineValine
Energy requirement for polymerisation
The amino acids composition determined for C. glutamicum ATCC 17965 is taken from
(Cocaign-Bousquet et al. (1996)) Energy requirement for polymerisation was taken as for E.
coli (Neidhardt et al . (1987).
Glutamine-intra
Glycine
Histidine

7/18/2019 Samlet PhD 20090416 U-Forside Appendix.pdf
http://slidepdf.com/reader/full/samlet-phd-20090416-u-forside-appendixpdf 181/187
Appendix II DNA 5/11
Table 3. DNA composition:
0.231 313.2 0.748
0.269 289.2 0.871
0.231 304.2 0.748
0.269 329.2 0.871
4.44
DNA biosynthesis equation is therefore (in mmol for synthesis of 1 g DNA):
0.748 DAMP + 0.871 DCMP + 0.748 DTMP + 0.871 DGMP + 4.44 ATP -> 4.44 ADP +
4.44 PI + 3.238 PPI + DNA
dGMP
Energy requirement for polymerisation (ATP):a the molecular weight is the weight of the nucleotide monophosphate substracted 1 water,
which is lost during esterification
The composition of DNA was calculated from the genomic sequence of C. glutamium
ATCC 13032, Biedefeld. Energy requirement for polymerisation of triphosphates was from
Neidhardt et al ., (1987).
dAMP
dCMP
dTMP
Nucleotide
mol/mol DNA MWa, g/mol mmol/g
DNA

7/18/2019 Samlet PhD 20090416 U-Forside Appendix.pdf
http://slidepdf.com/reader/full/samlet-phd-20090416-u-forside-appendixpdf 182/187
Appendix II RNA
Table 4. RNA composition:
mRNA rRNA tRNA
5% 75% 20%
0.231 0.227 0.197 329.2 0.221 0.69 0.221
0.269 0.334 0.314 345.2 0.327 1.01 0.327
0.231 0.211 0.272 305.2 0.224 0.70 0.224
0.269 0.227 0.217 306.2 0.227 0.70 0.227 3.10
1.24 1.000 1.00a the molecular weight is the weight of the nucleotide monophosphate substracted 1 water, which is lost during esterificatio
Energy requirement for polymerisation (ATP):
RNA biosynthesis equation is therefore (in mmol for synthesis of 1 g RNA):
0.69 ATP + 1.01 GTP + 0.70 CTP + 0.70 UTP + 1.24 ATP -> 1.24 ADP + 1.24 PI + RNA + 3.10 PPI
AMP
GMP
CMP
UMP
It was assumed that RNA consisted of 5% mRNA, 75% rRNA and 20% tRNA (molar). The nucleotide composition of
mRNA was taken as for genomic DNA. The nucleotide composition of rRNA was calculated from the sequences of
16S, 23S and 5S ribosomal RNA units. tRNA composition was found from sequences of tRNAs. All the sequences
were obtained from GenBank (http://www.ncbi.nlm.nih.gov). Energy requirement for polymerisation of triphosphates
was from Neidhardt et al. , (1987).
Nucleotide
mol/mol RNA MWa,
g/mol
mol/mol
RNA
mmol/g RNA
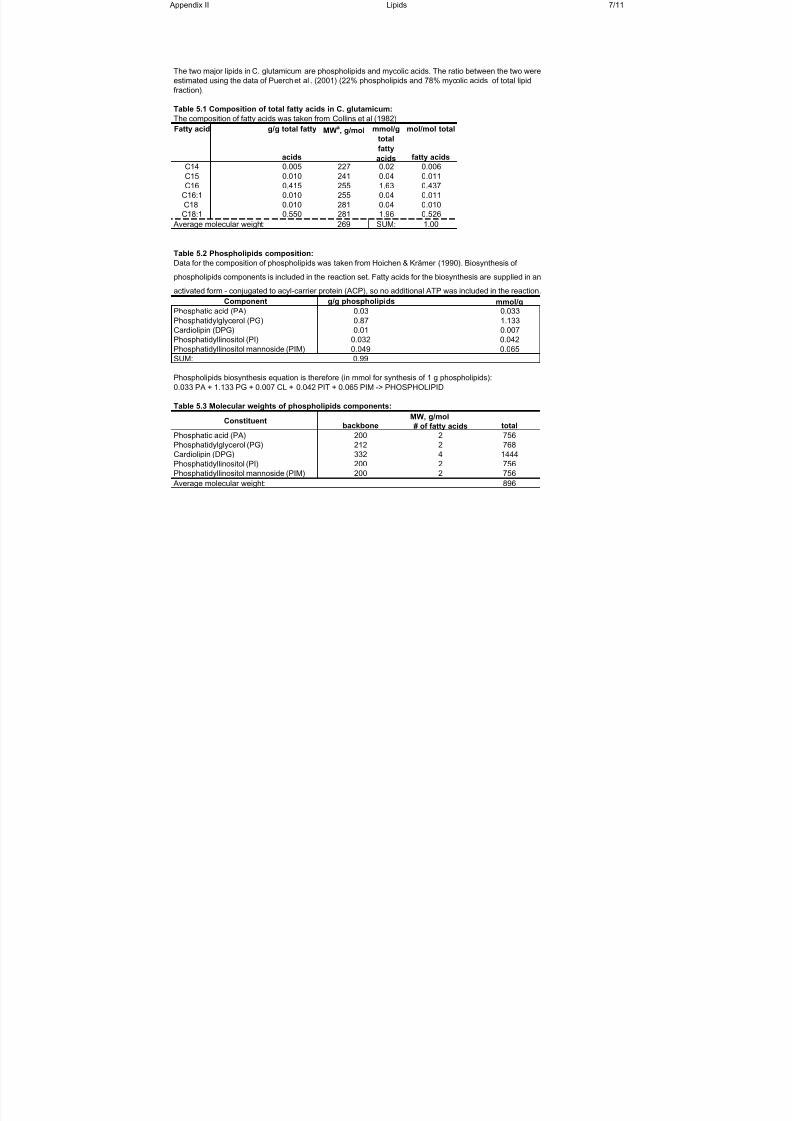
7/18/2019 Samlet PhD 20090416 U-Forside Appendix.pdf
http://slidepdf.com/reader/full/samlet-phd-20090416-u-forside-appendixpdf 183/187
Appendix II Lipids 7/11
Table 5.1 Composition of total fatty acids in C. glutamicum:
Fatty acid g/g total fatty
acids
MWa, g/mol mmol/g
totalfatty
acids
mol/mol total
fatty acids
C14 0.005 227 0.02 0.006
C15 0.010 241 0.04 0.011
C16 0.415 255 1.63 0.437
C16:1 0.010 255 0.04 0.011
C18 0.010 281 0.04 0.010
C18:1 0.550 281 1.96 0.526
269 SUM: 1.00
Table 5.2 Phospholipids composition:
Phosphatidyllinositol (PI)
Phosphatidyllinositol mannoside (PIM)
SUM:
Table 5.3 Molecular weights of phospholipids components:
Phosphatidyllinositol (PI)
Phosphatidyllinositol mannoside (PIM)
Average molecular weight:
332
200
200
The two major lipids in C. glutamicum are phospholipids and mycolic acids. The ratio between the two were
estimated using the data of Puerch et al . (2001) (22% phospholipids and 78% mycolic acids of total lipid
fraction).
Data for the composition of phospholipids was taken from Hoichen & Krämer (1990). Biosynthesis of
phospholipids components is included in the reaction set. Fatty acids for the biosynthesis are supplied in an
activated form - conjugated to acyl-carrier protein (ACP), so no additional ATP was included in the reaction.
MW, g/molbackbone # of fatty acids total
756
The composition of fatty acids was taken from Collins et al (1982)
Average molecular weight:
768
1444
756
756
896
2Phosphatic acid (PA)
Phosphatidylglycerol (PG)
Cardiolipin (DPG)
2
4
2
2
200
212
Phospholipids biosynthesis equation is therefore (in mmol for synthesis of 1 g phospholipids):
0.033 PA + 1.133 PG + 0.007 CL + 0.042 PIT + 0.065 PIM -> PHOSPHOLIPID
0.99
Constituent
0.032 0.042
0.049 0.065
Phosphatidylglycerol (PG) 0.87 1.133
Cardiolipin (DPG) 0.01 0.007
mmol/g
Phosphatic acid (PA) 0.03 0.033
Component g/g phospholipids
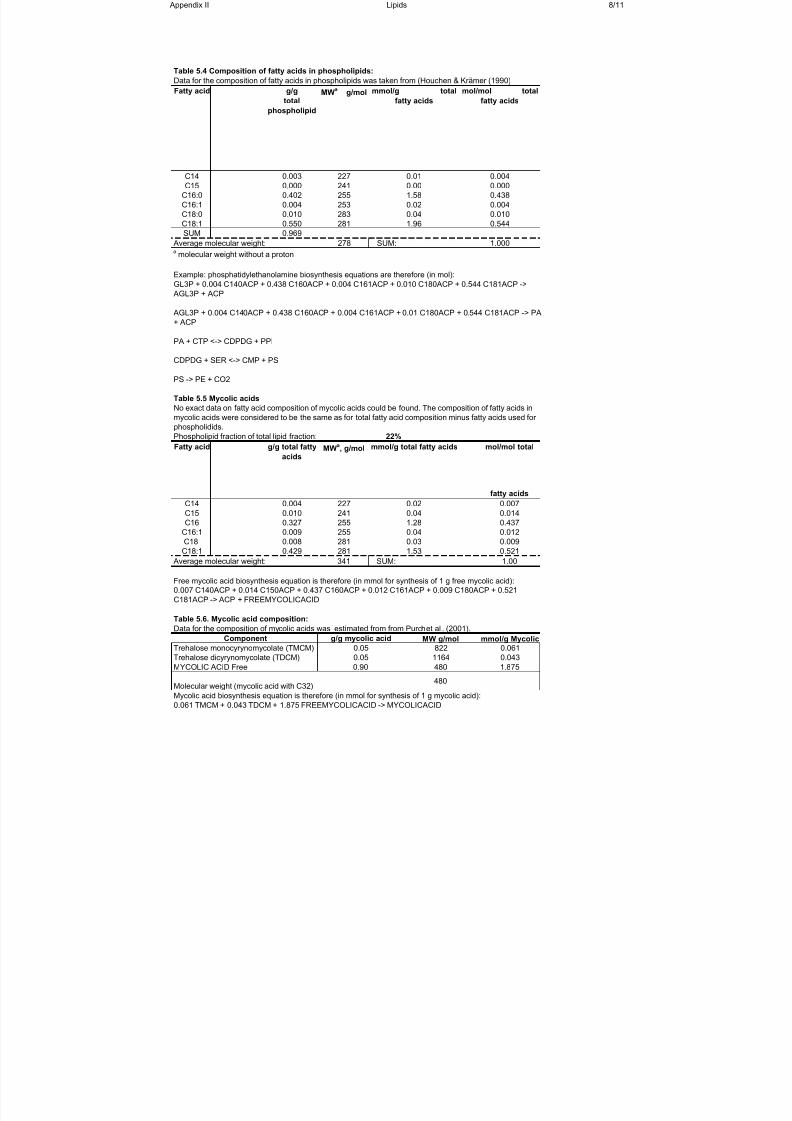
7/18/2019 Samlet PhD 20090416 U-Forside Appendix.pdf
http://slidepdf.com/reader/full/samlet-phd-20090416-u-forside-appendixpdf 184/187
Appendix II Lipids 8/11
Table 5.4 Composition of fatty acids in phospholipids:
Fatty acid g/g
total
phospholipid
MWa g/mol
C14 0.003 227
C15 0.000 241
C16:0 0.402 255
C16:1 0.004 253
C18:0 0.010 283
C18:1 0.550 281
SUM 0.969
Average molecular weight: 278 SUM:a molecular weight without a proton
22%
Fatty acid g/g total fatty
acidsMW
a, g/mol
C14 0.004 227
C15 0.010 241
C16 0.327 255
C16:1 0.009 255
C18 0.008 281
C18:1 0.429 281341 SUM:
Table 5.6. Mycolic acid composition:
0.04
0.03
1.53
0.007 C140ACP + 0.014 C150ACP + 0.437 C160ACP + 0.012 C161ACP + 0.009 C180ACP + 0.521
C181ACP -> ACP + FREEMYCOLICACID
Free mycolic acid biosynthesis equation is therefore (in mmol for synthesis of 1 g free mycolic acid):
0.5211.00
mmol/g total fatty acids
0.02
0.04
1.28
0.010
0.544
1.000
mmol/g total
fatty acids
0.01
0.00
1.58
0.02
0.04
1.96
0.004
0.000
0.438
0.004
mol/mol total
fatty acids
Mycolic acid biosynthesis equation is therefore (in mmol for synthesis of 1 g mycolic acid):
0.061 TMCM + 0.043 TDCM + 1.875 FREEMYCOLICACID -> MYCOLICACID
No exact data on fatty acid composition of mycolic acids could be found. The composition of fatty acids in
mycolic acids were considered to be the same as for total fatty acid composition minus fatty acids used forphospholidids.
MYCOLIC ACID Free 0.90 480 1.875
Trehalose dicyrynomycolate (TDCM) 0.05 1164 0.043
Trehalose monocyrynomycolate (TMCM) 0.05 822 0.061
Component g/g mycolic acid MW g/mol mmol/g Mycolic
Table 5.5 Mycolic acids
Average molecular weight:
Data for the composition of mycolic acids was estimated from from Purchet al . (2001).
mol/mol total
fatty acids
0.007
0.014
0.437
0.012
0.009
Phospholipid fraction of total lipid fraction:
CDPDG + SER <-> CMP + PS
PS -> PE + CO2
Example: phosphatidylethanolamine biosynthesis equations are therefore (in mol):
PA + CTP <-> CDPDG + PPI
GL3P + 0.004 C140ACP + 0.438 C160ACP + 0.004 C161ACP + 0.010 C180ACP + 0.544 C181ACP ->
AGL3P + ACP
AGL3P + 0.004 C140ACP + 0.438 C160ACP + 0.004 C161ACP + 0.01 C180ACP + 0.544 C181ACP -> PA
+ ACP
Data for the composition of fatty acids in phospholipids was taken from (Houchen & Krämer (1990)
Molecular weight (mycolic acid with C32)480
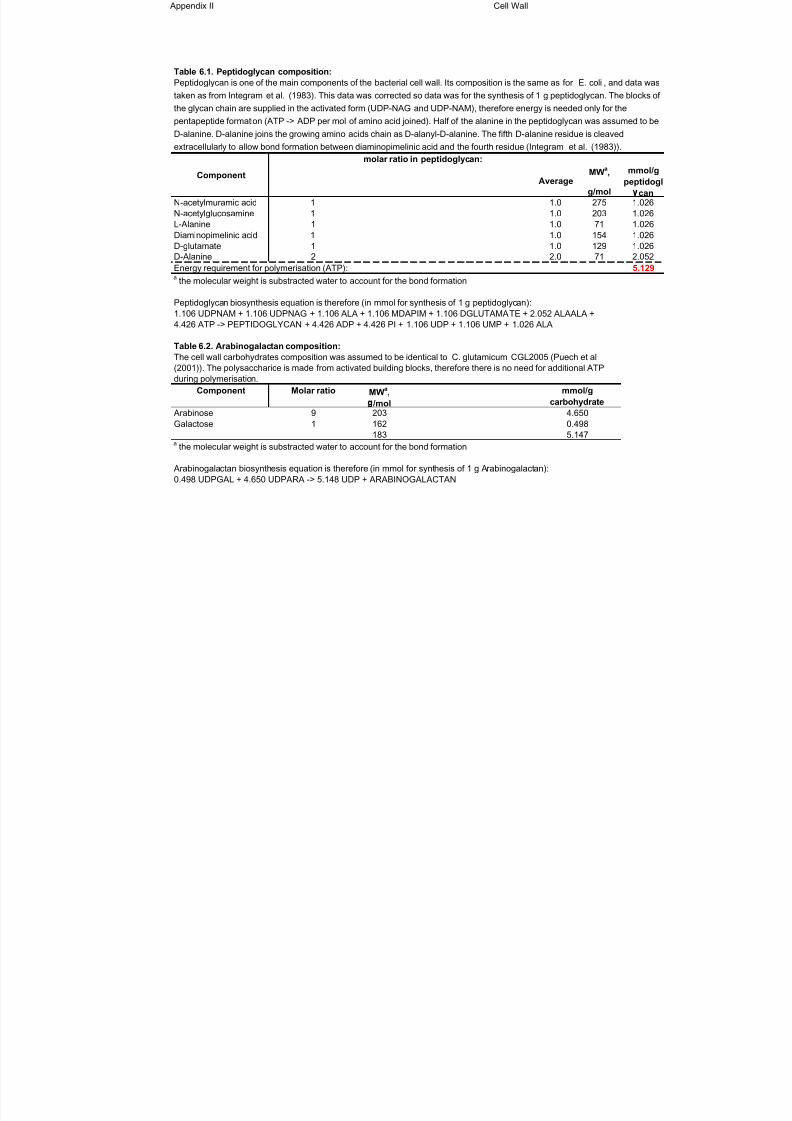
7/18/2019 Samlet PhD 20090416 U-Forside Appendix.pdf
http://slidepdf.com/reader/full/samlet-phd-20090416-u-forside-appendixpdf 185/187
Appendix II Cell Wall
Table 6.1. Peptidoglycan composition:
AverageMW
a,
g/mol
mmol/g
peptidogl
can1.0 275 1.026
1.0 203 1.026
1.0 71 1.026
1.0 154 1.026
1.0 129 1.026
2.0 71 2.052
5.129a the molecular weight is substracted water to account for the bond formation
Table 6.2. Arabinogalactan composition:
MWa,
/mol
203162
183a the molecular weight is substracted water to account for the bond formation
Peptidoglycan is one of the main components of the bacterial cell wall. Its composition is the same as forE. coli , and data was
taken as from Integram et al. (1983). This data was corrected so data was for the synthesis of 1 g peptidoglycan. The blocks of
the glycan chain are supplied in the activated form (UDP-NAG and UDP-NAM), therefore energy is needed only for the
pentapeptide formation (ATP -> ADP per mol of amino acid joined). Half of the alanine in the peptidoglycan was assumed to be
D-alanine. D-alanine joins the growing amino acids chain as D-alanyl-D-alanine. The fifth D-alanine residue is cleavedextracellularly to allow bond formation between diaminopimelinic acid and the fourth residue (Integramet al. (1983)).
Component
molar ratio in peptidoglycan:
N-acetylmuramic acid 1
N-acetylglucosamine 1
L-Alanine 1
Diaminopimelinic acid 1
D-glutamate 1
D-Alanine 2
4.6500.498
Energy requirement for polymerisation (ATP):
Peptidoglycan biosynthesis equation is therefore (in mmol for synthesis of 1 g peptidoglycan):
1.106 UDPNAM + 1.106 UDPNAG + 1.106 ALA + 1.106 MDAPIM + 1.106 DGLUTAMATE + 2.052 ALAALA +
4.426 ATP -> PEPTIDOGLYCAN + 4.426 ADP + 4.426 PI + 1.106 UDP + 1.106 UMP + 1.026 ALA
The cell wall carbohydrates composition was assumed to be identical to C. glutamicum CGL2005 (Puech et al
(2001)). The polysaccharide is made from activated building blocks, therefore there is no need for additional ATP
during polymerisation.
5.147
Arabinogalactan biosynthesis equation is therefore (in mmol for synthesis of 1 g Arabinogalactan):
0.498 UDPGAL + 4.650 UDPARA -> 5.148 UDP + ARABINOGALACTAN
Molar ratio
91
Component
ArabinoseGalactose
mmol/g
carbohydrate
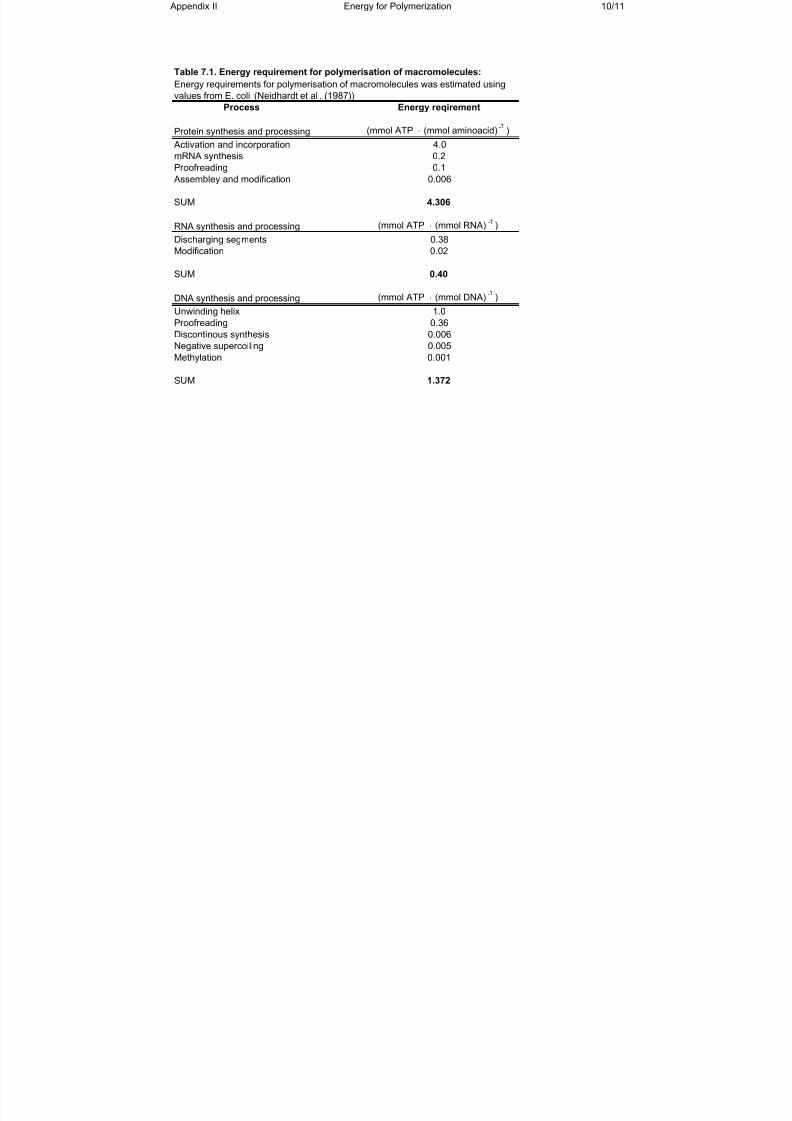
7/18/2019 Samlet PhD 20090416 U-Forside Appendix.pdf
http://slidepdf.com/reader/full/samlet-phd-20090416-u-forside-appendixpdf 186/187
Appendix II Energy for Polymerization 10/11
Table 7.1. Energy requirement for polymerisation of macromolecules:
Process Energy reqirement
Protein synthesis and processing (mmol ATP ⋅ (mmol aminoacid)-
)
Activation and incorporation 4.0
mRNA synthesis 0.2
Proofreading 0.1
Assembley and modification 0.006
SUM 4.306
RNA synthesis and processing (mmol ATP ⋅ (mmol RNA)-1
)
Discharging segments 0.38
Modification 0.02
SUM 0.40
DNA synthesis and processing (mmol ATP ⋅ (mmol DNA)-
)
Unwinding helix 1.0
Proofreading 0.36
Discontinous synthesis 0.006
Negative supercoiling 0.005
Methylation 0.001
SUM 1.372
Energy requirements for polymerisation of macromolecules was estimated using
values from E. coli (Neidhardt et al . (1987))
7/18/2019 Samlet PhD 20090416 U-Forside Appendix.pdf
http://slidepdf.com/reader/full/samlet-phd-20090416-u-forside-appendixpdf 187/187
Appendix II References 11/11
Appendix II: References
Cocaign-Bousquet M, Guyonvarch A, Lindley ND. Growth rate-dependent modulation of carbon flux through central
metabolism and the kinetic consequences for glucose-limited chemostat cultures of Corynebacterium glutamicum .
Collins MD, Goodfellow M, Minnikin DE. Fatty acid composition of some mycolic acid-containing coryneform
bacteria. Journal of General Microbiology 1982;128:p 2503-2509.
Daffé M. The Cell Envelope of Corynebacteria, In: Eggeling L, Bott M editors. Handbook of Corynebacterium
glutamicum . Boca Raton: CRC Press; 2005, p 121-148.
Hoischen C, Krämer R. Membrane alteration is necessary but not sufficient for effective glutamate secretion in
Corynebacterium glutamicum . Journal of Bacteriology 1990;172:p 3409-3416.
Ingraham JL, Maaløe O, Niedhardt FC. Growth of the Bacterial Cell. Sunderland, Massachusetts: Sinauer Associates,
Inc.; 1983.
Keddie RM, Cure GL. Cell-wall Compsition of Coryneform Bacteria, In: Bousfield IJ, Calley AG editors. Coryneform
Bacteria. London: Academic Press; 1978, p 47-84.
Marx A, de Graaf AA, Wiechert W, Eggeling L, Sahm H. Determination of the fluxes in the central metabolism of
Related Documents


![Utvikling samlet[1]](https://static.cupdf.com/doc/110x72/5464d63cb4af9f443f8b48b8/utvikling-samlet1.jpg)


