Max Nathan Same difference? Minority ethnic inventors, diversity and innovation in the UK Article (Published version) (Refereed) Original citation: Nathan, Max (2014) Same difference? Minority ethnic inventors, diversity and innovation in the UK. Journal of Economic Geography, 15 (1). pp. 129-168. ISSN 1468-2702 DOI: 10.1093/jeg/lbu006 © 2014 The Author CC BY 4.0 This version available at: http://eprints.lse.ac.uk/57946/ Available in LSE Research Online: July 2015 LSE has developed LSE Research Online so that users may access research output of the School. Copyright © and Moral Rights for the papers on this site are retained by the individual authors and/or other copyright owners. You may freely distribute the URL (http://eprints.lse.ac.uk) of the LSE Research Online website.

Welcome message from author
This document is posted to help you gain knowledge. Please leave a comment to let me know what you think about it! Share it to your friends and learn new things together.
Transcript
Max Nathan
Same difference Minority ethnic inventors diversity and innovation in the UK Article (Published version) (Refereed)
Original citation Nathan Max (2014) Same difference Minority ethnic inventors diversity and innovation in the UK Journal of Economic Geography 15 (1) pp 129-168 ISSN 1468-2702 DOI 101093jeglbu006 copy 2014 The Author CC BY 40 This version available at httpeprintslseacuk57946 Available in LSE Research Online July 2015
LSE has developed LSE Research Online so that users may access research output of the School Copyright copy and Moral Rights for the papers on this site are retained by the individual authors andor other copyright owners You may freely distribute the URL (httpeprintslseacuk) of the LSE Research Online website
Same difference Minority ethnic inventorsdiversity and innovation in the UKMax Nathany
Spatial Economics Research Centre London School of Economics Houghton St London WC2A 2AE UKNational Institute of Economic and Social Research 2 Dean Trench St London SW1P 3HEyCorresponding author Max Nathan Spatial Economics Research Centre London School of EconomicsHoughton St London WC2A 2AE UK email5manathanlseacuk4
AbstractMinority ethnic inventors play important roles in US innovation especially in high-techregions such as Silicon Valley Do lsquoethnicityndashinnovationrsquo channels exist elsewhereEthnicity could influence innovation via production complementarities from diverseinventor communities co-ethnic network externalities or individual lsquostarsrsquo I explore theseissues using new UK patents microdata and a novel name-classification system UKminority ethnic inventors are spatially concentrated as in the USA but have differentcharacteristics reflecting UK-specific geography and history I find that the diversity ofinventor communities helps raise individual patenting with suggestive influence of EastAsian-origin stars Majority inventors may benefit from multiplier effects
Keywords Innovation cultural diversity minority ethnic inventors patents citiesJEL classifications J15 O31 R11
Date submitted 18 February 2012 Date accepted 4 February 2014
1 Introduction
At first glance ethnicity diversity and innovation do not seem closely linked Howeverin recent years there has been growing research and policy interest in the role ofminority ethnic inventors (Saxenian 2006 Legrain 2006 Leadbeater 2008 Hanson2012 Wadhwa 2012) This largely stems from recent experience in the USA where theimpact of these groups is striking Since the 1980s minority communities particularlythose of SouthEast Asian origin have played increasingly important roles in USscience and technology sectors (Stephan and Levin 2001 Chellaraj et al 2008 Stuenet al 2012) Stephan and Levin for example find that minority ethnic scientists areover-represented among the 250 most-cited authors authors of highly cited patents andindividuals elected to the US National Academies of Sciences or Engineering Minorityinventors are spatially concentrated at city-region level (Kerr 2008b) in high-tech USclusters such as Silicon Valley so-called lsquoethnic entrepreneursrsquo help connect South Bayfirms to global markets and are responsible for 52 of the Bay Arearsquos start-ups(Saxenian 2006) Research also suggests positive links between diverse populations andUS regional patenting (Peri 2007 Hunt and Gauthier-Loiselle 2010) and betweendiasporic communities and knowledge diffusion both across American cities andinternationally (Kerr 2008a 2009)
By contrast very little is known about the role of minority ethnic inventors inEuropean countries This matters because innovation is an established driver of
The Author (2014) Published by Oxford University PressThis is an Open Access article distributed under the terms of the Creative Commons Attribution License (httpcreativecommonsorglicensesby40)which permits unrestricted reuse distribution and reproduction in any medium provided the original work is properly cited
Journal of Economic Geography 15 (2015) pp 129ndash168 doi101093jeglbu006Advance Access Published on 10 May 2014
at London School of E
conomics and Political Science on July 23 2015
httpjoegoxfordjournalsorgD
ownloaded from
long-term economic growth and European policymakers are actively seeking toupgrade national innovation systems (McCann and Ortega-Arguiles 2013) It alsomatters because many European countries have become more ethnically diverse inrecent years and immigrationintegration policy design is a major focus of debate(Putnam 2007 Caldwell 2009 Syrett and Sepulveda 2011)
This article explores whether the UK innovation system has benefited from minorityethnic inventors and the diversity they introduce I ask does the cultural diversity ofinventor groups influence patenting rates lsquoDiversity effectsrsquo are especially under-explored in the literature and are the focus of the article I also look at possible effectsof minority ethnic status co-ethnic group membership and the role of urban location
The UK case is particularly interesting to explore Census data show that the non-white population in England and Wales grew from 59 to 14 of the populationbetween 1991 and 2011 between 2001 and 2011 the non-lsquoWhite Britishrsquo share rose from127 to 195 Immigration has been an important driver with a number of newcommunities forming since the mid-1990s the migrant population share rose from 9to 13 during 2001ndash2011 (Office of National Statistics 2012) These patterns arehighly urbanized with London now a lsquomajority minorityrsquo city for the first time in itshistory Such deep shifts have proved politically controversial especially the role ofimmigration the current UK Government has introduced a cap on non-EuropeanUnion (EU) migrants and set up tight entry criteria for skilled arrivals from thesecountries1
As with migrants and minorities in the wider population minority ethnic inventorshave become an important feature of the UKrsquos inventor population Figure 1 shows thepopulation shares for minority ethnic inventors against shares for migrants andminority ethnic groups in the wider working-age population Minority ethnic inventorsrsquopopulation shares are higher and rising faster than either of the lsquobasersquo working-agegroups by 2004 they comprised 127 of the inventor population against 93 formigrant workers and 68 for minority workers
Changing demography might affect innovation in three ways These effects areambiguous in sign and channels may operate as substitutes or complements Firstcultural diversity may improve ideas generation in groups of inventors if the benefits ofa larger set of ideas or perspectives outweigh trust or communication difficultiesbetween those groups (Alesina and Ferrara 2005 Page 2007 Berliant and Fujita2008) Second co-ethnic group membership can improve information flow and lowertransaction costs accelerating within-group ideas generation and transmission(Docquier and Rapoport 2012) However group size may constrain knowledgespillovers Third demographic shifts may introduce highly skilled lsquostarsrsquo who make asubstantial difference to knowledge generation or who are more willing to introducedisruptive ideas (Borjas 1987 Zucker and Darby 2007 Duleep et al 2012) hereminority ethnic status needs to be disentangled from other endowments and contextualfactors All three channels may also be more pronounced in urban areas through theclustering of minority groups agglomeration economies or both
1 The UKrsquos Points Based System is organized in five Tiers For Tier 1 lsquoexceptional talentrsquo places are limitedto 1000 per year of which 700 can be scientists in most cases candidates for an lsquoentrepreneurrsquo place needat least pound200000 of backing lsquoinvestorsrsquo need to demonstrate they can invest at least pound1m Forpostgraduate researchers post-study leave to stay in the UK has been cut from 3 years to 3 months In20112012 Tier 2 allows for 27000 places restricted to a tightly defined set of lsquoshortage occupationsrsquo
130 Nathan
at London School of E
conomics and Political Science on July 23 2015
httpjoegoxfordjournalsorgD
ownloaded from
To explore I construct a new 12-year panel of European Patent Office (EPO) patentsmicrodata for the UK I use the novel ONOMAP name-classification system to identifyminority ethnic inventors building on pioneering US work by Agrawal et al (2008) andKerr (2008b 2010a) Descriptive analysis suggests that UK minority inventors have keydifferences from their American counterparts reflecting the UKrsquos distinctive geog-raphy colonial and recent migration history Although minority inventors are spatiallyclustered as in the States they are differently distributed from wider minoritypopulations many high-patenting areas do not have diverse inventor communities
To explore effects on patenting I deploy a two-stage identification strategy buildingon Oaxaca and Geisler (2003) and Combes et al (2008) In the first stage I estimate aknowledge production function linking counts of inventorsrsquo patenting activity to groupdiversity controls and individual fixed effects In the second stage I decompose fixedeffect estimates on minority ethnic status co-ethnic group membership and otherindividual-level observables
I find significant positive effects of inventor group diversity on individual patentingactivity worth about 0025 patents per inventor This result survives multiplerobustness checks and tests for positive selection by mobile inventors A back-of-the-envelope calculation suggests that increasing inventor diversity by around one standarddeviation in a city such as Bristol could be worth around 40 extra patents in total I alsofind suggestive evidence of positive contributions from minority ethnic high-patentingindividuals particularly East Asian-origin stars once human capital is controlled forExtensions imply some amplifying role of urban location and population densityDistributional tests indicate some multiplier lsquoeffectsrsquo from minority to majorityinventors although these latter should be read as partial correlations not causal links
The article makes several contributions to the field It is one of very few studiesexploring multiple ethnicityndashinnovation channels at individual group and area level as
Figure 1 Growth in UK minority ethnic inventor population versus working-age migrant andminority ethnic populations 1993ndash2004
Source KITES-PATSTATOffice of National Statistics Labour Force Survey
Note LFS data sample the working-age population so will differ from Census estimates
Minority ethnic inventors diversity and innovation 131
at London School of E
conomics and Political Science on July 23 2015
httpjoegoxfordjournalsorgD
ownloaded from
far as I am aware this is the first research of its kind in Europe It also adds to thegrowing empirical literature on immigration ethnicity and innovation and to theemerging field of inventor-level analysis (OECD 2009)
The article is structured as follows Section 2 sets out key concepts theory andevidence Section 3 introduces the data and identification strategy Section 4 providesdescriptive analysis Section 5 outlines the identification and estimation strategySections 6 and 7 give results extensions and robustness checks Section 8 concludes
2 Definitions framework evidence
21 Key terms
lsquoInnovationrsquo lsquoethnicityrsquo and lsquominority ethnicrsquo all need careful definition Innovationdivides into invention adoption and diffusion phases (Fagerberg 2005) Patenting isprimarily an indicator of invention (OECD 2009) I look at shifts in individualpatenting rates hence lsquoinventor activityrsquo
Ethnic identity is a multifaceted notion with objective subjective and dynamicelements (Aspinall 2009) Robust quantitative measures of ethnicity therefore dependon stable least-worst proxies particularly as self-ascribed ethnicity information is notavailable from raw patents data (Ottaviano et al 2007) I use inventor nameinformation and the ONOMAP name-classification system developed by Mateos et al(2007 2011) to provide measures of inventor ethnicity then use fractionalization indicesto proxy inventor group diversity
Ethnicity measures are based on (i) 12 geographical origin zones where this origin istaken as a proxy for lsquorootsrsquo and (ii) nine lsquomacro-ethnicrsquo categories similar to those usedby the UK Office of National Statistics (ONS)2 lsquoMinority ethnicrsquo inventors areclassified respectively as (i) those of likely non-UK roots and (ii) non-white inventorsGeographical origin data contain more detail and are less focused on visibleappearance so are my preferred measure (as Table 2 shows under the ONS systemlsquootherrsquo is the second-largest ethnic category in the UK inventor population) In bothcases lsquominority ethnicrsquo combines UK and non-UK born groups as my data cannotseparately distinguish migrant inventors
22 Literature review
Conventional theories of innovation have relatively little to say about ethnicity ordiversity For example Schumpeter (1962) focuses on the individual lsquoentrepreneurialfunctionrsquo as a source of ideas lsquoinnovation systemsrsquo approaches highlight networks offirms and public institutions (Freeman 1987) spatial approaches focus on theclustering of innovative activity due to agglomeration-related externalities particularlylocal knowledge spillovers (Jaffe et al 1993 Audretsch and Feldman 1996)Endogenous growth theories help us to bridge demography and innovation AsRomer (1990) sets out shifts in the technology frontier help determine economic
2 Geographic origin zones are Africa Americas British Isles Central Asia Central Europe East AsiaEastern Europe Middle East Northern Europe South Asia Southern Europe and Rest of the worldONS groups are White Black Caribbean Black African Indian Pakistani Bangladeshi Chinese andOther
132 Nathan
at London School of E
conomics and Political Science on July 23 2015
httpjoegoxfordjournalsorgD
ownloaded from
development while human capital stocks and knowledge spillovers influence techno-logical progress However access to knowledge is likely to be uneven across locationssectors and social groups (Agrawal et al 2008) Individual or group characteristicsmight then influence ideas generation and diffusion
The existing literature identifies three potential ethnicityndashinnovation channels Firstthe diversity of economic agents may influence innovative activity by acting as aproduction complementarity (Page 2007 Berliant and Fujita 2008 2009) Specificallyindividuals may benefit from group-level lsquocognitive diversityrsquo if this brings a richer mixof ideas and perspectives which in turn helps members problem-solve and generateideas Ethnic or cultural mix may be a good proxy for cognitive diversity (Hong andPage 2001 2004) Such effects will be most likely observed in lsquoknowledge-intensiversquoenvironments (Fujita and Weber 2003) Conversely group-level cultural diversity maylead to lower trust and poor communication between individualsmdashfor example becauseof language barriers misunderstandings or discriminatory attitudes Co-operation (andthus spillovers) will be limited leading to fewer lower-quality solutions (Alesina andFerrara 2005)
Co-ethnicity may also offer advantages Specifically co-ethnic social networksmdashsuchas diasporas or transnational communitiesmdashmay provide externalities (Agrawal et al2008 Docquier and Rapoport 2012) Social networks offer their members higher socialcapital and trust lowering transaction costs and risk and helping ideas flow within thegroup (Rodrıguez-Pose and Storper 2006 Kaiser et al 2011) In a closed settingminority networks may be constrained by a small set of within-group possible matches(Zenou 2011) In an open setting such as under globalization co-ethnic networks canbe much larger and thus more influential Again in complex andor research-intensiveeconomic activities diasporic communities may perform valuable roles both co-ordinating trans-national activity and facilitating information flows (Kapur andMcHale 2005 Saxenian and Sabel 2008)
A third view is that individual characteristics matter especially if minority ethnicinventors are migrants From an economic perspective migration decisions reflectexpected returns potential migrants balance out gains from migration and costs ofmoving abroad (Borjas 1987) This implies that some migrants are lsquopre-selectedrsquo on thebasis of skill and entrepreneurialism (Wadhwa et al 2007) Minority ethnic inventorswho are migrants may also be more willing to invest in host country-relevant humancapital as they face lower opportunity costs than natives (Duleep et al 2012) Migrantminority status may thus positively predict patenting over and above other humancapital attributes and regardless of diasporic ties or group composition Here thechallenge is to distinguish ethnicity from other human capital endowments
In theory each of these channels has an ambiguous effect on innovation andchannels may operate as substitutes or complements (for example group-level diversityeffects may co-exist with individual lsquostarsrsquo) The empirical literature is still sparse butavailable evidence largely suggests net positive effects Diversity channels remain theleast-thoroughly explored beyond a management literature testing small-samplecorrelations between team mix and business performance (see Page (2007) for areview) A few robust studies link ethnic diversity and innovation at group or workforcelevel Some find correlations or causal links between team composition and product orprocess innovation (Ostergaard et al 2011 Ozgen et al 2011 Parrotta et al 2013Nathan and Lee 2013) Others find no such connections (Mare et al 2011) A coupleof area-level studies also identifies links between skilled migrant diversity and
Minority ethnic inventors diversity and innovation 133
at London School of E
conomics and Political Science on July 23 2015
httpjoegoxfordjournalsorgD
ownloaded from
innovation for example Ozgen et al (2012) for EU regions and Gagliardi (2011) forthe UK3
Co-ethnicity channels are better covered (see Docquier and Rapoport (2012) for arecent review of this literature) Several qualitative case studies trace links betweenspecific US-based diasporas and lsquohomersquo countries such as India China Taiwan Irelandand Israel (Kapur and McHale 2005 Saxenian 2006 Saxenian and Sabel 2008) Arange of quantitative studies identify links between co-ethnic communities andindustrial performance in home countries (Kerr 2008a) trade and FDI flows (Rauchand Trindade 2002 Rauch and Casella 2003 Kugler and Rapoport 2007 Javorciket al 2011) and US multinational activity (Foley and Kerr 2013) By contrast Agrawalet al (2008) find that physical location is up to four times more important forknowledge diffusion than co-ethnic connections
A few recent studies test for individual-level lsquostarrsquo effects In the US Stephan and Levin(2001) Chellaraj et al (2008) and Wadhwa et al (2008) highlight the contributions ofIndo and Chinese-American scientists to US science particularly foreign graduatestudents Kerr and Lincoln (2010) identify positive effects of US skilled migrant visas topatenting by ethnic Indian and Chinese inventors Stuen et al (2012) identify causal linksbetween foreign PHDpresence and subsequent highly cited publications However Hunt(2011) and Hunt and Gauthier-Loiselle (2010) find that individual lsquomigrant effectsrsquo arelargely or wholly explained by education and industry hiring patterns
This brief review highlights three empirical gaps First as mentioned diversityndashinnovation channels are under-explored Second the vast bulk of the literature isfocused on the USA with only a handful of European studies exploring ethnicityndashinnovation connections I am only aware of two area-level studies on diversity andpatenting outcomes Ozgen et al (2012) and Niebuhr (2010) and no analysis at theindividual or group level where channels are most likely sited Third the interactionbetween individual group and area factors is poorly covered Innovative activity andminority communities tend to be concentrated in urban locations Urban areas mayamplify ethnicityndashinnovation channels for example via localized knowledge spilloversalternately minority inventor communities may be physically isolated limiting theopportunity for interaction (Jacobs 1969 Zenou 2009) I am aware of only tworelevant empirical studies Hunt and Gauthier-Loiselle (2010) find suggestive evidenceof positive amplifying effects for US metros Kerr (2010b) tracks breakthroughinventions across US cities with co-ethnic networks aiding diffusion
3 Data
I have three main data sources Patents information comes from the European PatentOffice (EPO) Raw patent data cannot typically be used at inventor level because ofcommonmisspelled names or changes of address I use the KITES-PATSTAT cleaneddataset which allows robust identification of individual UK-resident inventors (seeAppendix A for details of the cleaning process) The raw data cover the period 1978ndash2007 dated by priority year and contain geocoded information on 141267 uniqueBritish-resident inventors and 123030 patents with at least one British-resident
3 Other firm-level studies test links between workforce diversity and productivity these include Mare andFabling (2011) Hoogendoorn et al (2013) Malchow-Moslashller et al (2011) and Trax et al (2012)
134 Nathan
at London School of E
conomics and Political Science on July 23 2015
httpjoegoxfordjournalsorgD
ownloaded from
inventor4 Ethnicity information is then derived from inventor names using theONOMAP name-classification system (see below and Appendix B) Finally I combinethis individual-level information with data on area-level characteristics assembled fromthe UK Labour Force Survey (Office of National Statistics 2013)
31 Working with patents data
I make several changes to the raw data First following Hall et al (2001) I truncate thedataset by 3 years to end in 20045 Second I group patent observations in 4-yearlsquoyeargroupsrsquo Invention is a process not an event and inventors typically work on aninvention for some time before filing a patent Following Menon (2009) I use the meancitation lag of EPO patents to proxy the invention process6 Third the main regressionsuse unweighted patent counts area-level analysis uses weighted patents to avoiddouble-counting (OECD 2009) Fourth patents also have variable coverage acrossindustries (with a well-known bias towards manufacturing) and are sensitive to policyshocks (OECD 2009 Li and Pai 2010)7 I use technology field dummies and area-levelindustry shares to control for structural biases in patenting activity Finally I restrictthe sample to 1993ndash2004 This allows me to fit precise area-level controls from the LFSand to use pre-1993 inventor data to construct individual-level controls based onlsquohistoricrsquo activity (see Section 7)
32 Identifying ethnic inventors
I use the ONOMAP name-classification system (Mateos et al 2007 2011) to generateethnicity information for individual inventors building on similar approaches in USstudies by Kerr (2008b 2010a) and Agrawal et al (2008) ONOMAP is developed froma very large names database extracted from Electoral Registers and telephonedirectories covering 500000 forenames and a million surnames across 28 countriesIt classifies individuals according to most likely lsquoculturalndashethnicndashlinguisticrsquo (CEL)characteristics identified from forenames surnames and forenamendashsurname combin-ations Essentially ONOMAP exploits structural similarities and differences betweenname families which reflect underlying cultural ethnic and linguistic featuresmdashforexample lsquoJohn Smithrsquo is more likely to be ethnically British than French It alsoexploits the fact that lsquodistinctive naming practices in cultural and ethnic groups arepersistent even long after immigration to different social contextsrsquo (Mateos et al 2011p e22943) Full details of ONOMAP are in Appendix B
ONOMAP has the advantage of providing objective information at several levels ofdetail and across several dimensions of identity It is also able to deal with Anglicisation ofnames and names with multiple origins Individual-level validation exercises suggest that
4 lsquoPriority datesrsquo represent the first date the patent application was filed anywhere in the world The OECDrecommends using priority years as the closest to the actual time of invention (OECD 2009) The fulldataset has 160929 unique UK-resident inventors 19492 observations lack postcode information
5 There is typically a lag between applying for a patent and its being granted This means that in a panel ofpatents missing values appear in final periods
6 If patent B cites patent A the lsquocitation lagrsquo between the two is the time period between the filing of A andthe filing of B the lag offers a rough way to capture the relevant external conditions affecting patentingThe mean citation lag for EPO patents is 4 years (OECD 2009) so I group patents into 4-year periods
7 Patents data also have some inherent limitations not all inventions are patented and patents may notrecord everyone involved in an invention
Minority ethnic inventors diversity and innovation 135
at London School of E
conomics and Political Science on July 23 2015
httpjoegoxfordjournalsorgD
ownloaded from
ONOMAP matches almost all names and gives55 measurement error (Lakha et al2011) For the KITES-PATSTAT data ONOMAPmatches over 99 of inventor namesand provides classification at various levels after discussions with the ONOMAP team theinventor data were classified into 68 CEL lsquosubgroupsrsquo as well as two simpler typologiesbased on 12 geographical origin zones and nine lsquomacro-ethnicrsquo groups based on the Officeof National Statistics (ONS) 1991 Census classification The descriptive analysis uses allthree classifications (see Section 4) However as many CEL subgroups are small theregression analysis uses the less detailed groupings to minimize measurement error fromsmall cells and to allow easy matching with information from area-level controls
4 Descriptive analysis
Tables 1ndash5 provide some initial descriptive analysis Table 1 breaks down inventors byCEL subgroup showing the 30 largest groups We can see that although English
Table 1 Inventors by 30 biggest CEL subgroups 1993ndash2004
CEL subgroup Frequency Cumulative
English 48101 6871 6871
Celtic 5799 828 7699
Scottish 3641 52 8219
Irish 2034 291 851
Welsh 1452 207 8717
Indian Hindi 751 107 8825
German 731 104 8929
Italian 600 086 9015
French 572 082 9096
Chinese 560 08 9176
Polish 529 076 9252
Muslim 483 069 9321
European 387 055 9376
Greek 340 049 9425
Hong Kongese 335 048 9473
Pakistani 326 047 9519
Sikh 299 043 9562
Spanish 244 035 9597
Vietnamese 244 035 9632
Jewish 205 029 9661
Japanese 205 029 969
Portuguese 197 028 9718
East Asian and Pacific 159 023 9741
Danish 138 02 9761
Sri Lankan 133 019 978
Dutch 115 016 9796
South Asian 114 016 9812
Swedish 109 016 9828
Turkish 108 015 9843
Pakistani Kashmir 78 011 9855
Russian 78 011 9866
Total 70007 NA 100
Source KITES-PATSTATONOMAP
136 Nathan
at London School of E
conomics and Political Science on July 23 2015
httpjoegoxfordjournalsorgD
ownloaded from
Welsh Scottish and Celtic8 inventors make up the bulk of the sample other inventor
groups divide fairly evenly into geographically proximate communities (eg Irish plus a
series of European groups) groups reflecting the UKrsquos colonial history in South and
East Asia (eg Indian Hindi Sikh Pakistani Hong Kong Chinese) and some largely
recent migrant communities (eg Polish Vietnamese)Table 2 recuts the sample by geographical origin zones and by ONS macro-ethnic
groups Geographical origin zones (top panel) allow me to preserve some of the detail
from the full CEL classification including several areas of Europe as well as South and
East Asia As highlighted earlier ONS ethnic groups (bottom panel) are much less
flexible with lsquootherrsquo the next largest inventor group after lsquowhitersquoTable 3 sets out some differences in patenting activity between minority ethnic and
majority inventor groups Minority ethnic inventors on average patent slightly less
than majority inventors (051 patents per yeargroup versus 054) As a whole minority
inventors are also less likely to be lsquomultiplersquo and lsquostarrsquo inventors (who patent 2ndash4 times
Table 2 Inventors by geographical origin and ONS ethnic groups 1993ndash2004
Frequency Cumulative
Probable geographic area of origin
British Isles 61025 8717 8717
South Asia 1841 263 898
Central Europe 1804 258 9238
East Asia 1539 22 9457
Southern Europe 1442 206 9663
Eastern Europe 801 114 9778
Middle East 638 091 9869
Northern Europe 374 053 9922
Rest of World 337 048 997
Africa 177 025 9988
Central Asia
Americas 100
Total 70077 100
Probable ethnic group 1991 Census categories
White 65744 9391 9391
Any other ethnic group 1323 189 958
Indian 1262 18 976
Chinese 1046 149 991
Pakistani 404 058 9967
Black-African 163 023 9991
Bangladeshi
Black-Caribbean 100
Total 70077 100
Source KITES-PATSTATONOMAP
Notes Ethnic groups typology taken from 1991 Census to allow comparability with pre- and post-2001
area conditions Some frequencies are suppressed to avoid disclosure and are marked by lsquorsquo
8 lsquoCelticrsquo denotes names common to Scottish Welsh and Irish CEL types
Minority ethnic inventors diversity and innovation 137
at London School of E
conomics and Political Science on July 23 2015
httpjoegoxfordjournalsorgD
ownloaded from
per period and at least five times per period respectively) However minority multiple
and star inventors patent significantly more than their majority counterparts (for stars
4616 versus 4358 patents respectively) All of these differences are statistically
significant as measured by t-tests and rank-sum tests I return to this in Section 7 with
more formal decomposition of individual characteristicsMinority and majority ethnic inventors also differ in the type of patenting they are
most likely to do Table 4 decomposes minority and majority patenting by the groupsrsquo
most common Observatoire des Sciences and des Techniques (OST30) technology fields
(so that for example 012 of minority inventors most often patent in biotechnology
(OST field 15) against 0072 of majority inventors) Chi-square tests confirm that the
two distributions are independent The two groups are fairly close together across most
technology fields but minority inventors are more concentrated in information
technology semi-conductors pharmaceutical and cosmetics and agriculture and food
productsNext I use postcode information to locate inventors in UK Travel to Work Areas
(TTWAs) which are designed to cover self-contained labour markets TTWAs are a
good approximation of a local functional economy and superior to administrative units
such as local authority districts (Robson et al 2006)9 I then fit a simple urbanrural
typology of TTWAs developed in Gibbons et al (2011) allowing me to explore the
Table 3 Comparing patenting activity by majority and minority ethnic inventors 1993ndash2004
Observations () multiple inventors star inventors
All inventors 70007 (100) 910 259
Of which
Majority inventors 61025 (872) 925 267
Minority inventors 8982 (128) 810 202
Different NA
Patent counts Patents by multiples Patents by stars
All inventors 0536 1917 4384
Of which
Majority inventors 0539 1909 4358
Minority inventors 0510 1975 4616
Different
Source KITES-PATSTATONOMAP
Notes Multiple inventors patent 2ndash4 times in at least one 4-year period Star inventors patent at least five
times in at least one 4-year period lsquoPatentingrsquo is unweighted patenting activity per inventor per 4-year
period Differences between populations from t-tests and rank-sum tests
Significant at 10 5 and 1
9 Formally 75 of those living in a given TTWA also work in the TTWA and vice versa Matching isdone by postcode sector which minimizes observations lost through incomplete or mistyped postcodeinformation (matching on full postcodes drops around 12 of observations matching on postcode sectordrops 577) I exclude inventors resident in Northern Ireland
138 Nathan
at London School of E
conomics and Political Science on July 23 2015
httpjoegoxfordjournalsorgD
ownloaded from
potential effects of urban environments lsquoprimary urbanrsquo TTWAs are defined as those
containing an urban core of at least 125000 peopleTable 5 presents location quotients (LQs) for the 35 TTWAs with the largest shares of
minority ethnic inventors by geographical origin plus comparator LQs for the wider
minority ethnic population (the latter defined by ONS ethnic groups)10 The table
confirms that minority ethnic inventors are spatially clustered with a long tail of TTWAs
with LQs under 1 High-ranking TTWAs for minority ethnic inventors are predominantly
Table 4 Comparing patenting for minority ethnic and majority inventors 1993ndash2004
Modal OST30 field share of patenting by
Majority Minority ethnic All
Biotechnologies 739 1203 799
Telecommunications 704 1009 743
Information technology 605 918 646
Organic chemistry 10 894 986
Pharmaceuticalscosmetics 706 883 729
Controlmeasureanalysis tools 912 84 903
Medical engineering 491 44 484
Optics 28 421 298
Basic chemistry 42 361 412
Audiovisual technology 294 337 299
Semi-conductors 113 305 138
Electrical engineering 368 284 357
Handlingprinting 413 223 388
Consumer goods 388 216 366
Macromolecular chemistry 188 201 19
Mechanical engineering 286 2 275
Civil engineering 318 172 299
Materials processing 216 153 208
Enginespumpsturbines 202 139 194
Materialsmetallurgy 147 135 145
Transport technology 312 131 288
Mechanical elements 233 12 219
Agricultural and food products 141 111 137
Surface technology 114 099 112
Machine tools 121 057 113
Agricultural and food apparatuses 088 043 082
Thermal processes 063 034 059
Environmental technology 058 033 055
Nuclear technology 049 032 047
Space technologyweapons 032 008 028
Total 100 100 100
Source KITES-PATSTAT
Notes OST30 reclassification of IPC technology fields
10 Location quotients compare the local area share of a group i with the national share FormallyLQiafrac14 (piapa)(pip) where piapa is the local population share of i in area a and pi p is irsquos nationalpopulation share An LQ of above 1 indicates concentration scores below 1 indicate dispersion
Minority ethnic inventors diversity and innovation 139
at London School of E
conomics and Political Science on July 23 2015
httpjoegoxfordjournalsorgD
ownloaded from
lsquoprimary urbanrsquo although a number of less dense and rural areas also feature
predominantly university towns (St Andrews Lancaster Inverness Carlisle Bangor) or
areas adjoining TTWAs with universities (Honiton and Axminster adjoining Exeter)11
Table 5 Minority ethnic inventor LQs 1993ndash2004 Top 35 TTWAs
LQ (minority
population)
LQ (minority
inventors)
TTWA name TTWA type
1332 4009 Crawley Primary urban
1137 3552 Southampton Primary urban
8663 3219 London Primary urban
0267 2779 Bangor Caernarfon and Llangefni Welsh rural
1482 2599 Oxford Primary urban
0621 2499 Dundee Primary urban
1006 2417 Swindon Primary urban
1163 2374 Cambridge Primary urban
0197 2254 St Andrews and Cupar N Scotland rural
0829 2130 Colchester Primary urban
0155 2124 Inverness and Dingwall N Scotland rural
0183 2111 Carlisle N England rural
1380 2050 Guildford and Aldershot Primary urban
0698 2033 Edinburgh Primary urban
1276 2009 Glasgow Primary urban
6453 1931 Birmingham Primary urban
3055 1850 Bedford Primary urban
1114 1821 Lancaster and Morecambe N England rural
0427 1817 Livingston and Bathgate N Scotland rural
7268 1793 Bradford Primary urban
1676 1773 Cardiff Primary urban
0990 1765 Canterbury Rest England rural
0483 1743 Aberdeen Primary urban
0349 1741 Norwich Primary urban
0400 1730 Wirral and Ellesmere Port Primary urban
0386 1726 Lanarkshire Primary urban
4056 1708 Wycombe and Slough Primary urban
5239 1678 Leicester Primary urban
0986 1678 Liverpool Primary urban
0719 1671 Eastbourne Rest England rural
0825 1662 Newbury SW England rural
0205 1659 St Austell SW England rural
3117 1635 Leeds Primary urban
1209 1626 Brighton Primary urban
2068 1619 Reading and Bracknell Primary urban
Source KITES-PATSTATONOMAPONS
Notes TTWAs use 2001 boundaries lsquoPrimary urbanrsquo TTWAs contain an urban core with at least 125000
people lsquoruralrsquo TTWAs may contain smaller urban settlements Cells with fewer than 10 inventors
suppressed Population LQs from ONS minority ethnic groups in working-age population not CEL data
11 Many inventors will work in professionaltechnical occupations which are characterized by longer-than-average commuting distances Building lsquocommuting zonesrsquo on the basis of these workersrsquo commutingpatterns substantially reduces the total number of zones suggesting that commuting across conventionalTTWAs is not uncommon (Robson et al 2006)
140 Nathan
at London School of E
conomics and Political Science on July 23 2015
httpjoegoxfordjournalsorgD
ownloaded from
Overall minority ethnic inventors follow the same urbanized spatial distribution aswider minority populations but they are less concentrated in the largest and mostdiverse cities (such as London Birmingham and Manchester) and more concentrated insecond-tier cities and university towns (such as Oxford Cambridge Southampton andGuildford) the corresponding pairwise correlation of minority inventors to minoritypopulation LQs is 0348 Note that wider populations are not identified using CELdata so these comparisons should be used with care
Table 6 gives weighted counts for the 35 TTWAs with the highest patenting activityto minimize double counting I weight each patent by the number of inventors involved
Table 6 Weighted patent counts by TTWA 1993ndash2004 Top 35 areas
Weighted patent count TTWA name TTWA type
161333 London Primary urban
102122 Cambridge Primary urban
61747 Oxford Primary urban
53329 Harlow and Bishoprsquos Stortford Rest England rural
50708 Manchester Primary urban
49612 Guildford and Aldershot Primary urban
45690 Bristol Primary urban
42477 Southampton Primary urban
41435 Crawley Primary urban
37059 Reading and Bracknell Primary urban
36680 Ipswich Primary urban
34494 Wycombe and Slough Primary urban
34417 Swindon Primary urban
30309 Birmingham Primary urban
26575 Newcastle and Durham Primary urban
25454 Stevenage Primary urban
25423 Nottingham Primary urban
25237 Leicester Primary urban
23558 Wirral and Ellesmere Port Primary urban
21011 Worcester and Malvern Primary urban
20602 Edinburgh Primary urban
20380 Leeds Primary urban
16767 Coventry Primary urban
16736 Luton and Watford Primary urban
16646 Warwick and Stratford-upon-Avon Rest England rural
15164 Aberdeen Primary urban
15124 Portsmouth Primary urban
14998 Bedford Primary urban
14775 Margate Ramsgate and Sandwich Rest England rural
14487 Derby Primary urban
14320 Warrington and Wigan Primary urban
14231 Glasgow Primary urban
13942 Cardiff Primary urban
13846 Maidstone amp North Kent Primary urban
13511 Hull Primary urban
Source KITES-PATSTATONOMAPONS
Notes TTWAs use 2001 boundaries Primary urban TTWAs defined as Table 4 Weighted patents stocks
averaged 1993ndash2004 Weighting by inventorspatent and based on inventor address not applicant address
Minority ethnic inventors diversity and innovation 141
at London School of E
conomics and Political Science on July 23 2015
httpjoegoxfordjournalsorgD
ownloaded from
The results follow the familiar geography of UK innovative activity A number of thesehigh-patenting areas also have large minority ethnic inventor shares and diverseinventor groups (for example London Southampton Crawley Oxford andCambridge) However another group of high-patenting TTWAs have rather morehomogenous inventor and general populations (for example Bristol Manchester andReading) The pairwise correlation between minority inventor LQ and weighted patentstocks is 0560
Four broad lessons emerge from the descriptives First the UKrsquos population ofminority ethnic inventors appears substantially different from that of the USA whereminority ethnic inventor communities are dominated by South and East Asian groups(Kerr 2008b 2010a) By contrast the UK has a number of European groups SouthAsian and East Asian inventors drawn in large part from former colonies plus recentmigrant communities Second minority inventors are under-represented in the uppertail of multiple and star inventors but those who are present patent significantly morethan their lsquomajority ethnicrsquo counterparts There are also some differences in patentingfields with minority inventors more likely to focus on semi-conductors and IT (as in theUSA) as well as chemistry and foodagriculture fields (distinctive) Third as in theUSA minority ethnic inventors are spatially concentrated but the link to widerpopulation diversity is relatively weak Fourth although minority ethnic inventorpresence is positively correlated with high patent stocks not all high-patenting locationshave large minority inventor shares or diverse inventor communities
5 Econometric analysis
For the regression analysis I build a panel of UK-resident inventorsrsquo patenting activitybetween 1993 and 2004 inclusive The sample includes all and only those inventors whopatent at least once during this period Each inventor-yeargroup-area cell records howmany times an inventor patents in each 4-year phase The basic panel covers 70007inventors across three lsquoyeargroupsrsquo giving 210021 observations in the raw sample Cellcounts vary from 0 to 36 with a mean of 053 (see Table 6) Note that inventors are onlyobserved when patenting Blanking all cells where the inventor is not activemdashthe mostconservative responsemdashwould radically reduce sample size as most inventors patentonly once (and would miss instances where inventors were constrained from patentingfor some reason) I thus zero all cells when no inventor activity is recorded and testlsquoblankingrsquo in robustness checks
51 Identification strategy
This panel setting allows me to explore how changes in inventor group ethnic diversitymight affect individual patenting activity and to look at possible roles of minorityethnic status and co-ethnic group membership To reliably identify group-levellsquodiversity effectsrsquo I need to control for individual ethnicity and unobserved individualcharacteristics as well as wider influencing factors (such as area-level demographic andeconomic conditions technology field and time trends) Individual fixed effects are themost robust way to control for individual-level unobservables However as minorityethnic status and ethnic group membership are time-invariant they drop out of anysubsequent fixed effects regression I therefore develop a two-stage identificationstrategy drawing on Oaxaca and Geisler (2003) and Combes et al (2008)
142 Nathan
at London School of E
conomics and Political Science on July 23 2015
httpjoegoxfordjournalsorgD
ownloaded from
The first stage focuses on diversity The estimating model is a modified knowledgeproduction function regressing counts of individual patenting activity on inventorgroup diversity plus area-level controls technology field-time effects and individualfixed effects Group diversity effects on individual patenting activity should then reflecta combination of (i) externalities of ethnic diversity (ii) changes in TTWA compositionor (iii) inventors moving between TTWAs The first of these is my variable of interestand the second is captured in the area-level controls vector Movers are a potentialomitted variable if between-TTWA movement is a strong feature of the dataparticularly if inventors select into high-innovation clusters To deal with this I identifythe set of moving inventors in the panel (see Appendix A) In the main regressionsmovers are constrained to one location I then run a series of separate checks exploringoverall patterns of movement and testing the extent to which changes in area patentcounts are explained by in-movers versus other factors (see Section 6)
For the second stage of the analysis I retrieve estimates of the individual fixed effectthen regress this on individualsrsquo observable characteristics12 Here the variable of interestis minority ethnic status or co-ethnic group membership and controls cover individualpatenting intensity and scope as well as historical patenting activity (see Section 7)
52 Empirical strategy
The first stage model is set out below For inventor i in area j and yeargroup t Iestimate
PCOUNTijt frac14 athorn bDIVjt thorn VCTRLSjtcthorn ICTRLSjdthorn Ii thorn TFYGpt thorn ei eth51THORN
where PCOUNTijt is a count of the number of times an inventor engages in patentingduring a given 4-year period (patenting activity) the variable of interest is DIVjt thediversity of active inventors in a given TTWA and time period and Ii is the individualfixed effect As movers are constrained to a single location all area-invariantinformation is absorbed in the individual fixed effect13 The model thus effectivelyfits inventor-area fixed effects
PCOUNTijt frac14 athorn bDIVjt thorn VCTRLSjtcthorn ICTRLSjdthorn Iia thorn TFYGpt thorn ei eth52THORN
For group a in area j in year t DIVjt is given by
DIVjt frac14 1X
aSHAREajt
2 eth53THORN
where SHAREajt is arsquos share of the relevant population (here all active inventors in agiven area) The Index measures the probability that two individuals in an area comefrom different geographical origin or ethnic groups Similar measures are used widely inthe development literature as well as some area-level studies (Easterley and Levine1997 Alesina and Ferrara 2005 Ottaviano and Peri 2005 2006)
12 My preferred estimator is a negative binomial fixed effects estimator which should permit me to fit time-invariant individual-level regressors in the stage 1 model in practice identification is very unstable andso the two-stage process is preferred
13 In a linear estimator with both sets of fixed effects area dummies drop out The conditional fixed effectsnegative binomial estimator does allow time-invariant regressors but adding in a large number of right-hand side dummies to a model with only three time periods is likely to create an lsquoincidental parametersproblemrsquo (Heckman 1981) which in turn leads to inconsistent estimates
Minority ethnic inventors diversity and innovation 143
at London School of E
conomics and Political Science on July 23 2015
httpjoegoxfordjournalsorgD
ownloaded from
To deal with sectoral and industry patenting shocks the model includes technology
field-by-yeargroup fixed effects (TFYGpt) where p indexes shares of patenting in one
of the 30 OST-defined technology fields VCTRLSjt and ICTRLSj are vectors of
respectively time-varying and time-invariant TTWA-level controls covering key spatial
economic and demographic characteristics affecting relationships between DIV and
innovation all controls are for the same 1993ndash2004 period as the patent data I use
aggregated ONS population and LFS client file microdata to build these14
Patenting and population diversity are spatially concentrated reflecting benefits from
agglomeration that may persist over time (Simmie et al 2008) Diversity effects on
patenting might then simply reflect agglomeration and path-dependence ICTRLSj
includes a dummy for urban TTWAs and 1981ndash1984 area weighted patents to control
for historic lsquoknowledge stocksrsquo (robustness checks explore different lags) VCTRLSjt
includes the log of population density to explore wider agglomeration effects plus a
series of other variables Inventor demographic characteristics may be entirely
explained by area demographic characteristics for example places with more diverse
populations may produce more diverse inventor groups I control for this by using area-
level fractionalization indices of ONS macro-ethnic groups (and cross-check using
migrant population shares) Third human capital stocks are closely correlated with
innovative activity (Romer 1990) and may account for apparent ethnicity effects on
patenting To deal with this I fit areasrsquo share of science technology engineering and
maths (STEM) degree-holders in the local working-age populationI fit further controls for precision Patenting is known to be higher in lsquoknowledge-
intensiversquo high-tech and manufacturing sectors so I include measures of the share of
workers employed in lsquoknowledge-intensiversquo manufacturing following Brinkley (2008)15
Patenting may also be lower in areas with a lot of entry-level jobs so I include the
share of workers in entry-level occupations as a control Summary statistics are given in
Table 7My panel exhibits excess zeroes (632) and slight over-dispersion (the variance of
PCOUNT 1129 is over twice the mean 0529) As the assumptions of the standard
Poisson model are not met I fit the model as a conditional fixed effects negative
binomial (Hausman et al 1984)16
14 I aggregate individual-level data to local authority-level averages and then aggregate these to TTWA-level means using postcode shares Local Authority Districts (LADs) are not congruent with TTWAboundaries so straightforward aggregation is not possible Using the November 2008 National PostcodeSector Database (NSPD) I calculate the number of postcodes in each 2001 TTWA and in each of itsconstituent LADs For each TTWA I then calculate constituent LADsrsquo lsquopostcode sharesrsquo Shares sum toone and are used as weights to construct TTWA-level averages Example suppose a TTWA consists ofparts of three LADs The TTWA has 100 postcodes 60 of which are in LADa 30 in LADb and 10 inLADc relevant LAD weights are 06 03 and 01 respectively The TTWA-level average of X is given byXTTWAfrac14 06(X)athorn 03(X)bthorn 01(X)c
15 This adjusts OECD definitions for the UK context The final list of three-digit SIC sectors includesmedium and high-tech manufacturing (pharmaceuticals aerospace computers and office machineryelectronic communications software other chemicals non-electrical machinery motors and transportequipment)
16 Hausman tests strongly suggest that the conditional fixed effects estimator is preferred to random effects(chi2frac14 73421 Pfrac14 0000) Given the large sample size a conditional fixed effects estimator is preferred toan unconditional estimator with individual-level dummies
144 Nathan
at London School of E
conomics and Political Science on July 23 2015
httpjoegoxfordjournalsorgD
ownloaded from
6 Main results
The main results for the first stage model are given in Table 8 The dependent
variable is the count of patenting activity or unweighted patent counts (results for
weighted patents are almost identical) The left hand panel shows results for DIV
measured with geographic origin zones my preferred specification the right hand
Table 7 Summary statistics
Variable N Mean SD Min Max
Inventor patent count4-year period 210010 0536 1074 0 36
Inventor patents 2ndash4 timesYG 210010 0091 0288 0 1
Inventor patents at least 5 timesYG 210010 0026 0159 0 1
Inventor patents pre-1993 210010 005 0218 0 1
Inventor mean patent count pre-1993 210010 0028 0174 0 9429
Inventor is TTWA mover same YG 210010 0013 0115 0 1
Inventor moves across TTWAs 210010 0025 0157 0 1
Inventor patents across OST30 fields 210010 0096 0294 0 1
Minority ethnic inventor (geography) 210010 0128 0334 0 1
Minority ethnic inventor (ONS ethnic) 210010 0061 0239 0 1
Inventor UK origin 210010 0872 0334 0 1
Inventor Central Europe origin 210010 0026 0158 0 1
Inventor East Asian origin 210010 0022 0147 0 1
Inventor Eastern Europe origin 210010 0011 0106 0 1
Inventor South Asian origin 210010 0026 016 0 1
Inventor Southern Europe origin 210010 0021 0142 0 1
Inventor Rest of world origin 210010 0022 0147 0 1
Frac Index geographic origin groups 210010 0215 0112 0 0571
Inventor White ethnicity 210010 0939 0239 0 1
Inventor Black Caribbean ethnicity 210010 0000 0007 0 1
Inventor Black African ethnicity 210010 0002 0048 0 1
Inventor Indian ethnicity 210010 0018 0133 0 1
Inventor Pakistani ethnicity 210010 0006 0076 0 1
Inventor Bangladeshi ethnicity 210010 0001 003 0 1
Inventor Chinese ethnicity 210010 0015 0121 0 1
Inventor Other ethnic group 210010 0019 0136 0 1
Frac Index ONS ethnic groups 210010 0108 0062 0 056
TTWA Frac Index geo groups 210010 0159 0117 0017 0526
Graduates 210010 0237 0051 009 0358
Graduates with STEM degrees 210010 0121 0031 0035 0186
Graduates with PhDs 210010 0008 0007 0 0031
Employed high-tech manufacturing 210010 0029 0014 0 0189
Employed medium-tech manuf 210010 0045 0022 0006 0154
In entry-level occupations 210010 034 0048 0251 0521
Unemployed at least 12 months 210010 0015 0011 0 0052
Log(population density) 210010 6469 0976 206 8359
Log(TTWA wpatents 1981ndash1984) 210010 4028 1439 1386 6543
Source KITES-PATSTATONS
Note Statistics for estimation sample For reasons of space country of origin dummies are shown for UK-
origin and the six largest minority ethnic groups
Minority ethnic inventors diversity and innovation 145
at London School of E
conomics and Political Science on July 23 2015
httpjoegoxfordjournalsorgD
ownloaded from
panel repeats the regression using the simpler Index built with ONS macro-ethnicgroups In each case column 1 shows a bivariate regression for the main variables ofinterest only column 2 adds individual fixed effects and column 3 adds controlsCoefficients are presented as marginal effects at the mean Column 1 indicates asignificant log alpha term confirming over-dispersion Controls are generally of theexpected size and sign Bootstrapped cluster-robust standard errors are fitted in allcases
For geographic origin zones estimates of DIV in the bivariate regression are smalland close to zero (column 1) Including individual fixed effects increases the effect ofDIV which is now significant at 1 (column 2) As expected model fit is alsosubstantially better Once controls are added model fit improves further the marginaleffect of DIV is 0248 significant at 1 A 10-point increase in the FractionalizationIndexmdashincreasing inventor diversity in Bristol to that in Oxford for examplemdashwouldthen raise each Bristol inventorrsquos patenting activity by just under 0025 patents in agiven 4-year period A back-of-the-envelope calculation of the aggregate effect across
Table 8 First stage regression individual patent counts and inventor group diversity
Inventor patent counts Geo origin zones ONS groups
(1) (2) (3) (1) (2) (3)
Frac Index of inventors 0075 0221 0248 0111 0312 0337
(0100) (0020) (0023) (0165) (0011) (0014)
Frac Index of TTWA pop 0028 0061
(0058) (0054)
STEM degrees TTWA 0323 0308
(0106) (0106)
Log of TTWA population density 0015 0010
(0007) (0007)
Employed in hi-tech mf (OECD) 0237 0107
(0164) (0149)
Employed in medium-tech mf
(OECD)
0106 0075
(0110) (0115)
Workers in entry-level occupations 0053 0090
(0036) (0042)
Log of area weighted patent stocks
(1981ndash1984)
0024 0023
(0006) (0007)
Urban TTWA 0051 0047
(0015) (0015)
ln(alpha) 1016 1010
(0048) (0046)
Individual fixed effect N Y Y N Y Y
Controls N N Y N N Y
Observations 210008 210008 210008 210008 210008 210008
Log-likelihood 206721358 91887733 91829454 206723863 91913822 91861933
Chi-squared 167855 21597972 169380 10830210
Source KITES-PATSTATONS
Notes Constant not shown Model (1) uses yeargroup dummies Models (2) and (3) use OST30 technology
fieldyeargroup dummies Bootstrapped standards errors are clustered on TTWAs Results are marginal
effects at the mean
Significant at 10 5 and 1
146 Nathan
at London School of E
conomics and Political Science on July 23 2015
httpjoegoxfordjournalsorgD
ownloaded from
the arearsquos 1628 inventors is then 404 unweighted patents17 For DIV measured by ONSgroups the pattern of results is similar but marginal effects of DIV are rather bigger at0337 (also significant at 1) Interestingly coefficients of wider population diversityare small and close to zero in the preferred specification small and positive significantin the ONS models The urban area dummy is negative but population density has apositive link to patenting activity I explore these urban and density connections furtherin the next section
To put the main result into perspective note that effects of DIV are rather smallerthan for human capital and technology field-time dummies For example the marginaleffect of area-level science engineering technology and maths degree-holders is 0323significant at 1 That implies that a 10 rise in STEM graduates in Bristol is linkedto 0032 extra patents per inventor (or over 65 unweighted patents at the area levelalmost a third larger than the diversity result) This chimes with the existing empiricalliterature which suggests that lsquodiversity effectsrsquo are relatively small where they exist
As a basic crosscheck I compare the negative binomial estimates with linear fixedeffects regressions Angrist and Pischke (2009) argue that once raw coefficients areconverted into marginal effects non-linear modelling offers little over standard linearregression OLS regressions give results with a similar sign and significance but withmarginal effects around twice as large Results are given in Appendix C Table C1
61 Robustness checks
I conduct a number of robustness checks Results are summarized in Table 9 I first fitsome basic specification checks against the main result (column 1) Some of the inventorgeographical origin groups are small so the Fractionalization Index may be affected bymeasurement error Column 2 refits the Index as seven categories aggregating the sixsmallest groups into a single lsquootherrsquo category Marginal effects of DIV are identicalthough the model fit changes slightly I also run a falsification test on ONOMAP Irandomly assign ethnicity with lsquofakersquo categories following the same underlyingstructure as the ONOMAP classification and build a fake Fractionalization Index ifthis gives the same results as the ONOMAP Index it suggests that ONOMAP is nobetter than random assignment Results are shown in column 3 fake DIV is 0050rather than 0248 significant at 5 rather than 1 and with reduced model fitInventor diversity effects might also collapse to simple size effects not least becauseFractionalization Indices tend to be highly correlated with group population shares (thepairwise correlation here is 0779) Column 4 fits the share of minority ethnic inventorscolumn 5 fits the Fractionalization Index and share together In both cases marginaleffects of minority ethnic inventor shares are negative whereas those of DIV staypositive
Next I check for omitted variables Column 6 refits the Equation (51) with area-by-technology field-by-yeargroup dummies which capture localized industrysector trendsEffects of DIV shrink to 0231 but remain positive significant Column 7 fits the modelwithout inventors from Londonmdasha city with high levels of cultural diversity column 8
17 The average weighted patent count per inventor is 0235 versus 0535 for unweighted patents Again aback of the envelope calculation suggests approximate aggregate weighted patent effect of (02350535)404frac14 177 weighted patents
Minority ethnic inventors diversity and innovation 147
at London School of E
conomics and Political Science on July 23 2015
httpjoegoxfordjournalsorgD
ownloaded from
Table
9
Individualpatentcounts
andinventorgroupdiversityrobustnesschecks
Individualpatentcounts
(1)
(2)
(3)
(4)
(5)
(6)
(7)
(8)
(9)
(10)
(11)
(12)
FracIndex
ofinventors
(geo
origin
groups)
0248
0293
0231
0268
0250
0366
0020
0812
0248
(0023)
(0025)
(0023)
(0014)
(0022)
(0025)
(0033)
(0098)
(0022)
FracIndex
ofinventors
(x7geo
origin
groups)
0248
(0023)
FakeFracIndex
of
inventors
(x12rando-
mized
groups)
0050
(0025)
Minority
ethnic
inventors
06541018
(0066)
(0081)
UrbanTTWA
dummy
0055005500460029
0033
0001
008300770003
011500630058
(0018)
(0018)
(0018)
(0017)
(0017)
(0019)
(0013)
(0019)
(0014)
(0026)
(0018)
(0009)
FracIndex
ofin-
ventorsurbanTTWA
0285
(0023)
STEM
degreesTTWA
0323
0321
0306
0349
041114290052
1318
0313
0187
0306
(0106)
(0106)
(0106)
(0107)
(0103)
(0055)
(0092)
(0059)
(0106)
(0106)
(0137)
PHDs
TTWA
2872
(0210)
LogofTTWA
population
density
0015
0015
0011
0007
0009
0009
0020
00320006
0019
0029
0016
(0007)
(0007)
(0007)
(0007)
(0007)
(0008)
(0006)
(0006)
(0007)
(0007)
(0007)
(0009)
FracIndex
ofin-
ventorslogofTTWA
popdensity
0259
(0067)
Logofareaweightedstock
ofpatents
(1989ndash1992)
0025
(0004)
Controls
YY
YY
YY
YY
YY
YY
Observations
210008
210008
210008
210008
210008
210008
188786
210008
210008
210008
210008
210008
Log-likelihood
918294549183010791940012919110299175880191853839827183889179624192174193917992469181270693888356
Source
KIT
ES-PATSTATO
NS
Notes
Controls
asin
Table
7Bootstrapped
standard
errors
inparenthesesclustered
onTTWAs
Resultsare
marginaleffectsatthemean
Significantat10
5
and1
148 Nathan
at London School of E
conomics and Political Science on July 23 2015
httpjoegoxfordjournalsorgD
ownloaded from
fits the area share of PHD-holders as an alternative area-level human capital control
Removing London raises the effect of DIV to 0268 switching to PHDs also raises
estimates of DIV to 0250 Both are significant at 1 Column 9 adds the share of
lsquostarsrsquo in the TTWA inventor population where stars are defined as inventors patenting
at least five times during a given period This raises the marginal effect of DIV from
0248 to 0366 and is still significant at 118
I then test for urban amplifying effects Minority ethnic inventors are spatially
concentrated in urban locations as discussed in Section 2 agglomeration economies
might generate some of the diversity result Columns 10 and 11 test for amplifying
effects of urban and high-density areas respectively fitting interactions of the
Fractionalization Index with the urban TTWA dummy and with logged population
density In the first case the effect of DIV alone falls to zero but the joint effect of
urban DIV is 0285 significant at 1 Effects of urban status remain negative as
before In the second case estimates of DIV grow substantially to 0812 whereas the
joint effect of DIV and population density is negative at 0259 Population density
marginal effects are 0029 larger than in the main regressions All are significant at 1
Together this suggests an amplifying effect of urban areas which disappears in the
biggest and most dense cities This may partly reflect the spatial distribution of minority
ethnic inventors who are most densely clustered in second tier cities and university
towns rather than the largest urban cores Note also that removing London-based
inventors raises marginal effects of inventor diversity which is compatible with these
resultsFinally I check for appropriate historical settings If the historic patent stocks term
in the main model is mis-specified path-dependence will not be adequately controlled
for Column 12 shows results for the most conservative specification (when the lag is
dropped to the 4-year period before the sample) Effects of DIV barely change and
results for other lags also show no changeI also conduct three further structural tests First my results might be particular to
the choice of time period in which the UK experienced substantial rises in net
migration and minority ethnic populations (Graph 1) To test this I run a reduced-form
model on the full set of inventors active between 1981 and 2004 and on the sub-group
active between 1981 and 1992 Results (Appendix C Table C2) show positive significant
effects of DIV in the long sample in the earlier period DIV is non-significant and close
to zero National demographic changes then help explain my resultsNext I reconstruct my sample by blanking all inventor-yeargroup cells when an
inventor is not patenting This is a more conservative way of treating inactive inventors
and will deal with any measurement error introduced by zeroing My choice of
estimator means that blanking out non-activity has the effect of restricting the sample
to inventors who patent more than once I compare estimates for multiple inventors
across two different samples one with zeroed and one with missing observations for
non-activity Reduced-form results show that estimates for the two sub-samples are
identical (Appendix C Table C3) This strongly suggests that sample construction has
no effect on my main findings
18 I exclude inventors who are themselves stars so as to capture any effect of the presence of stars aroundthat inventor I also run tests for the sum of stars the sum of multiple inventors (inventing more thanonce) and the share of multiple inventors none of which change my main result
Minority ethnic inventors diversity and innovation 149
at London School of E
conomics and Political Science on July 23 2015
httpjoegoxfordjournalsorgD
ownloaded from
Finally I transform the model into a wholly area-level specification this losesindividual fixed effects but allows for an alternative estimation of aggregate effectsI collapse the panel to area level and estimate
Yjt frac14 athorn bDIVjt thorn VCTRLScjt thornAj thornYG TFpt thorn ejt eth64THORN
where Y is the total count of unweighted patents for area j in yeargroup t A is the area-level fixed effect and all other terms are defined as in Equation (52) The two modelsare not identical and we should expect estimates of b to differ Equation (64)
substitutes area fixed effects for individual-area fixed effects and this loses importantvariation as the main results suggest that individual characteristics help drivepatenting Sample construction is also different in the individual panel DIV iseffectively lsquoweightedrsquo across inventor populations in each area whereas the area-levelpanel cleans this out (means of DIV differ quite a lot at 0213 for the individual paneland 0109 for the area panel)
I estimate Equation (64) in OLS with Poisson results included for comparison (asshares of zeroes are low and meanndashvariance assumptions are met) Results are shown inAppendix C Table C4 In the OLS model the beta of DIV is 33548 which implies thata 01 shift in area DIV is linked to 335 extra patents in that area This compares to a(rough) aggregate effect of 404 patents from the individual-level model This suggeststhat (i) my main result holds in an area-level specification (ii) this specification missesout salient individual-level factors and (iii) sample construction issues may also be inplay Area-level results should also be treated as associations unobserved area-levelfactors might affect aggregate patenting (but not individual inventors) For all thesereasons my main individual-level results are preferred
62 Moving inventors
If inventors select into high-innovation clusters that help them become moreproductive this might create upwards bias on coefficients of DIV or in extremisexplain the result entirely To explore this issue I use information from the KITES-PATSTAT cleaning process to identify inventors who move between TTWAs (seeAppendix A) The group of movers comprises 1781 individuals (around 25 of thesample) of who 963 (133) move within the same yeargroup I then run a series ofchecks on the influence of movers First I re-assign movers from their first to theirsecond locations and re-run model (Equation 52) with almost no change to coefficientsof DIV (see Appendix C Table C5) Next I manually examine mover origin anddestination points Specifically I look for whether moves are between contiguous
TTWAs or across greater distances Contiguous moves especially from an urban to arural TTWA might suggest lifecycle-related relocation for example a new familymoving from a city to a less dense area Moves across greater distances might suggestjob-related motives I find that over 90 of moves are between contiguous TTWAs (forexample CambridgendashHuntingdon ReadingndashNewbury Middlesborough and StocktonndashHartlepoolndashBishop Auckland)
Finally I construct an area-level panel and regress the change in area-level weightedpatent counts on the change in movers to a given TTWA For TTWA j I estimate
WPATENTSj frac14 athorn bMOVERSj thornVCTRLScj thorn ej eth65THORN
150 Nathan
at London School of E
conomics and Political Science on July 23 2015
httpjoegoxfordjournalsorgD
ownloaded from
where
WPATENTSj frac14 ethWPATENTSj 2004 WPATENTSj 1993THORN=WPATENTSj 1993 eth66THORN
And WMOVERSj is assembled similarly VCTRLS contains the same set of area-level variables from model (52) with time-varying variables expressed as percentagechanges This horse-race setting allows me to test the relative contribution of movers tooverall patenting A large and significant value of b compared with c would suggest thatpositive selection is an issue at the area level (although these are associations not causaleffects) Results are given in Table 10 I find small positive significant coefficients ofmovers on changes in area patenting (0082 significant at 5) but these are dwarfed bychanges in other area-level characteristics (such as STEM degrees and high-techmanufacturing) that are fitted as controls in the main model For instance a 10 rise inmoving inventors is linked to a 08 rise in total patenting a similar increase in STEMdegrees is associated with an 119 rise This also suggests that impacts of movers atthe area level on individual inventorsrsquo outcomes are likely to be minimal
7 Extensions
71 Minority ethnic status and co-ethnic group membership
The second stage analysis explores roles of minority ethnic status and co-ethnic groupmembership in individualsrsquo patenting activity in more detail To do this I retrieveestimates of the individual fixed effects from Equation (52) and regress these on
Table 10 Testing for the role of moving inventors in the first stage model
Change in total weighted patents 1993ndash2004 (1) (2) (3) (4)
Change in moving inventors 0056 0050 0082 0082
(0028) (0026) (0037) (0038)
Change TTWA Fractionalization Index 0521 0355 0361
(0335) (0255) (0256)
Change TTWA STEM degrees 0893 1202 1192
(0726) (0754) (0756)
Change TTWA high-tech manufacturing 0848 0564 0552
(0793) (0894) (0891)
Change TTWA medium-tech manufacturing 0169 0573 0574
(0505) (0366) (0370)
Change TTWA population density 10445 12189
(16729) (15488)
Change TTWA entry-level occupations 1130 0454 0713
(1088) (1180) (1201)
OST30 technology field effects N N Y Y
Observations 206 202 198 198
F-statistic 3989 1707 2824 2753
R2 0003 0096 0318 0317
Source KITES-PATSTATONS
Notes Standard errors are in parentheses are heteroskedasticity and autocorrelation-robust and clustered
on TTWAs
Significant at 10 5 and 1
Minority ethnic inventors diversity and innovation 151
at London School of E
conomics and Political Science on July 23 2015
httpjoegoxfordjournalsorgD
ownloaded from
observable individual characteristics The fixed effects are capturing all time-invariantindividual factors which may include ethnicity elements (see Section 22) I therefore
aim to separate coefficients of minority ethnic status group membership and other
salient individual-level factors (such as human capital and previous experience) Theseresults are associations not causal links Note that because I do not observe how
individual fixed effects are scaled I am unable to interpret point estimates in relation tothe dependent variable19 However I am able to discuss the sign and significance of the
independent variables as well as their sizes relative to each otherSpecifically I estimate the following cross-sectional model for inventor i
IHATi frac14 athorn ETHbi thorn cMULTIPLEi thorn dSTARi thorn PREi thorn ePRECOUNTi thorn ui eth77THORN
where IHATi is the estimated fixed effect and ETHi is either a dummy for minority
ethnic status or a vector of co-ethnic group dummies In the latter case I take UK
origin as the reference category and estimate coefficients of the five largest minorityethnic groups aggregating the six smaller groups into a lsquorest of the worldrsquo category
Control variables are dummies for inventors who patent between two and four times ina given yeargroup (MULTIPLEi) over five times (STARi) plus two controls which use
historic patenting activity to approximate human capital characteristics (Note that asIHAT is derived from a patent counts regression results using MULTIPLE and STAR
have to be interpreted with caution) Historic patenting controls draw on a widely used
approach developed by Blundell et al (1995) who argue that agentsrsquo capacity toinnovate is largely explained by their cumulatively generated knowledge at the point in
which they enter a sample With long enough time-series data pre-sample activity thusapproximates agent-level human capital Following this logic I fit a dummy for
whether inventors patented in the pre-1993 period (PREi) and for those that didPRECOUNTi is the mean of historic patenting activity As before summary statistics
are given in Table 7 (top panel)
I estimate the model in OLS using bootstrapped standard errors to deal withheteroskedasticity arising from first stage sampling error20 Results are set out in Table 11
Feasible Generalised Least Squares (FGLS) regressions give almost identical coefficients(see Appendix C Table C6) Coefficients of minority ethnic status are negative and
significant at 1 in all specifications by contrast pre-sample patenting activity has a
positive link also significant at 1 (with a significant lsquopenaltyrsquo for those not patenting pre-sample) Multiple and lsquostarrsquo inventors also show positive coefficients significant at 1
Estimates of minority status are substantially smaller than these latter two variablesColumns 2 through 4 fit interactions of minority ethnic status with multiple and star
inventor status The latter finds positive joint coefficients which are net positive and 10
significant (columns 3 and 4) This is in line with the earlier descriptive analysis andsuggests that individual-level links between minority ethnic status and patenting exist at
least for higher-patenting inventors even after human capital is controlled forTable 12 explores further for the five largest co-ethnic groups plus a rest of the world
group Coefficients should be interpreted as associations and as relative to UK origin
the reference category Co-ethnic group membership coefficients are negative significant
19 Results are also robust to using fixed effects derived from the OLS regressions20 A BreuschndashPagan test on the basic OLS regression gives a Chi2 statistic of 6398 (Pfrac14 0000) suggesting
that heteroskedasticity is present
152 Nathan
at London School of E
conomics and Political Science on July 23 2015
httpjoegoxfordjournalsorgD
ownloaded from
as before joint effects of most co-ethnic group stars are positive and are 10significant for East Asian-origin stars Cross-checking using ONS ethnic groups finds astronger result for Chinese star inventors (1639 significant at 5) There is somevariation in coefficient size between co-ethnic groups suggestive of differing diasporaresources and capacity
I then run a series of robustness tests I first check for omitted variablesfitting dummies for moving inventors and for inventors patenting across at least twoOST30 fields (a measure of lsquogeneralistsrsquo that captures intellectual range) I also fit thecount of within-sample patenting alongside historic patent counts Results showminimal change compared with my main findings Next I run a falsification test onmain results with fake ethnic group dummies generated by random assignmentCoefficients of lsquofakersquo minority ethnic and co-ethnic group variables are generallynon-significant and model fit is substantially worse Results are shown in Appendix CTables C6 and C7
72 Distributional analysis
Finally I briefly explore potential impacts of minority ethnic inventors on majoritygroups This might involve physical outflows in which UK-origin inventors leave anarea after minority groups arrive (Borjas 1994) or lsquoresource crowd-outrsquo in whichminority ethnic inventors displace majority inventors from jobs or (say) lab space(Borjas and Doran 2012) Analysis of moving inventors suggests that they haveminimal impact on the main results However resource crowd-out could co-exist with
Table 11 Second stage regressions decomposing fixed effect estimates from first stage
Inventor fixed effects (estimated) (1) (2) (3) (4)
Minority ethnic inventor (geo groups) 0199 0201 0206 0209
(0010) (0011) (0010) (0011)
Inventor patents 2ndash4 times (multiple) 1097 1095 1097 1093
(0019) (0019) (0019) (0019)
Minority ethnic multiple inventor 0022 0040
(0064) (0062)
Inventor patents at least 5 times (star) 3695 3695 3664 3663
(0059) (0059) (0061) (0061)
Minority ethnic star inventor 0320 0325
(0192) (0191)
Average patenting pre-1993 0199 0199 0202 0202
(0076) (0076) (0076) (0076)
Dummy inventor patents pre-1993 0113 0113 0113 0113
(0044) (0044) (0044) (0044)
Constant 0170 0169 0169 0168
(0004) (0004) (0004) (0004)
Observations 70007 70007 70007 70007
R2 0253 0253 0253 0253
Source KITES-PATSTATONS
Notes Robust standard errors in parentheses bootstrapped 50 repetitions
Significant at 10 5 and 1
Minority ethnic inventors diversity and innovation 153
at London School of E
conomics and Political Science on July 23 2015
httpjoegoxfordjournalsorgD
ownloaded from
externalities at the inventor group level At the extreme lsquominority ethnicrsquo patents mightwholly explain increases in area-level patent counts Conversely there might bemultiplier effects from minority ethnic inventors to majority group inventors leading tocrowd-in (Hunt and Gauthier-Loiselle 2010)
To explore I draw on work by Card (2010) and Faggio and Overman (2014) I definelsquominorityrsquo patents as those with at least one minority ethnic inventor all other patentsare lsquomajorityrsquo patents I assemble a panel of TTWA-level weighted patent counts for1993ndash2004 and regress the percentage change in majority patents on that in minoritypatents with both expressed as a share of all patenting in the base year Specifically forTTWA j I estimate
ethethMPj 04 MPj 93THORN=TPj 93THORN frac14 athorn bethethEPj 04 EPj 93THORN=TPj 93THORN thorn CTRLScjtbase thorn ej eth78THORN
Table 12 Second stage regressions co-ethnic groups
Inventor fixed effects (estimated) (1) (2)
Inventor South Asian origin 0314 0310
(0021) (0020)
Star South Asian 0219
(0277)
Inventor Central Europe origin 0112 0117
(0019) (0021)
Star Central European 0256
(0485)
Inventor East Asian origin 0142 0157
(0027) (0025)
Star East Asian 1053
(0576)
Inventor Southern Europe origin 0175 0183
(0030) (0030)
Star Southern European 0359
(0408)
Inventor Eastern Europe origin 0112 0127
(0029) (0029)
Star Eastern European 0559
(0575)
Inventor rest of world origin 0289 0298
(0027) (0025)
Star Rest of world 0380
(0546)
Inventor patents at least 5 times (star) 3695 3663
(0060) (0061)
Controls Y Y
Observations 70007 70007
R2 0254 0254
Source KITES-PATSTATONS
Notes Constant not shown Controls as in Table 10 plus multiple inventor dummy All models use
bootstrapped standard errors 50 repetitions
Significant at 10 5 and 1
154 Nathan
at London School of E
conomics and Political Science on July 23 2015
httpjoegoxfordjournalsorgD
ownloaded from
where MP refers to majority patents EP refers to minority ethnic patents and CTRLS
is a vector of area-level controls for the base period 1993 including the previous stockof weighted patents The coefficient b expresses the relationship between majority andminority patenting If b is 0 a 1-unit change in minority patenting has no consequencesfor majority patenting simply adding 1 to total patenting Estimates above 0 indicatemultiplier effects of size b resulting in a more-than-proportionate increases in totalpatenting Conversely estimates below 0 indicate crowding-out
Results are given in Appendix C Table C8 It is important to emphasize that theseshould be interpreted as partial correlations not as causal links Unobserved factorssuch as area-level shocks may influence both sides of the equationmdashand running theregression in reverse also indicates some connections from majority to minority patentsIn fully specified form results from Equation (78) give b at around 19 significant at1 This suggests that each additional minority patent is linked to just almost twoadditional majority patents implying a multiplier lsquoeffectrsquo However the confidentialinterval is between 092 and 222 so the connection is not observed with muchprecision and omitted variables are also likely to be in play Coefficients should thus beinterpreted with caution21
8 Conclusions
In recent years there has been growing interest in the links between minority ethniccommunities diversity and innovation The contribution of minority ethnic inventors andlsquoethnic entrepreneursrsquo to US innovation is substantial suggesting that Europeancountriesrsquo innovation systems could also benefit from these groupsrsquo presence and activity
This article looks at the role of minority ethnic inventors on innovative activity in theUK using a new 12-year panel of patents microdata and a powerful name-classificationsystem I uncover some distinctive features of the UK inventor community and exploredifferent potential lsquoethnicityndashinnovationrsquo channelsmdashindividual selection externalitiesfrom diasporic groups and from the cultural diversity of inventor communities as well aslsquoamplifyingrsquo roles of urban environments The research is one of very few studies toexplore these links and as far as I am aware is the first of its kind outside the USA
The descriptive analysis suggests that the UKrsquos minority ethnic inventor communityhas a few important commonalities with the USAmdashwith large South and East Asian-origin groups plus groups of multiple and star inventors who patent significantly morethan majority counterparts Minority inventors patent most often in semi-conductorsIT pharmaceutical and agriculturefood fields these modal shares are somewhat higherthan majority inventorsrsquo I also find differences UK inventor demographics reflectproximity to Continental Europe colonial history and recent immigration trendsMinority ethnic inventors are spatially clustered as in the USA but seem to follow adifferent distribution from wider minority populations Not all high-patenting regionshave diverse inventor communities
Regressions find a small positive effect of inventor group diversity on individualpatenting activity which is not driven by inventor mobility or the crowding-out ofmajority inventors (rather I find suggestive evidence of crowding-in from minority tomajority patenting) This suggests that learning externalities exist for diverse inventor
21 I experiment with lags of minority ethnic patents as an instrument but none pass first-stage tests
Minority ethnic inventors diversity and innovation 155
at London School of E
conomics and Political Science on July 23 2015
httpjoegoxfordjournalsorgD
ownloaded from
groups over and above simple sizeco-location effects Tests also suggest an amplifying
role of urban location but this dies away in the densest environments where minority
inventors are less clustered than the wider populationDo inventor characteristics such as human capital or co-ethnic group membership
help explain the diversity result Some tentative positive associations emerge for
minority ethnic and East Asian-origin stars especially those of Chinese ethnicity (the
latter both relatively large groups in the UK inventor community) This suggests the
existence of network externalities within (some) diasporic groups which may operate as
a complement to the across-group effect I speculate that stars might also generate
substantive knowledge spillovers as well as having a motivating effect on those around
them minority stars patent significantly more than their majority counterparts
Certainly larger shares of star inventors in an area increase the diversity effect
suggesting that these channels operate as complementsOverall the results suggest that minority ethnic inventors are a net positive for
patenting in the UK and imply that policymakers should aim to increase both the skills
and the mix of the countryrsquos research communities They also highlight some distinctive
features of the UK innovation system In the USA minority ethnic inventor
communities have been historically shaped by Cold War science which attracted very
large numbers of skilled workers into a small number of high-tech locations (Saxenian
2006) By contrast until recently lsquocallsrsquo for migrant workers in the UK have focused on
less skilled occupations and on Commonwealth countries especially in Africa and
SouthEast Asia (Somerville 2007) Results may also reflect culturally distinctive US
attitudes to entrepreneurship as evidenced by sociological studies of Jewish and Afro-
Caribbean migrant communities in New York and London (Gordon et al 2007) and
by the complex interplay between class skills resources and attitudes that influence
real-world entrepreneurial behaviour (Clark and Drinkwater 2010) The rigidities of
some European labour markets could also explain UK inventor demographics as
young researchers seek new opportunities in more open environments22
There are two important caveats to the results First diversity and diaspora effects
are relatively smallmdashhuman capital and technology effects are more important
determinants of inventorsrsquo productivity This is intuitive and echoes much of the
existing literature Second working with inventor data presents a number of
measurement challenges most seriously my data only allow a fuzzy identification of
ethnic inventors and diasporic groupsThis leaves a number of areas for future research We need to better understand what
is driving these resultsmdashnot least the scale(s) at which the diversity effect is operating
(teams departments communities of interest) Understanding the quality and influence
of minority patenting (for example through citations data) is also a priority Better
individual-level data would allow the identification of migrants as well as revealing
other salient characteristics (such as age gender qualifications experience) linking
inventor information to academic or professional curricula vitae (CVs) would be one
way to achieve this Research could also explore the detailed roles of minority inventors
in the technology fields where they are most active and in specific locations where they
are clustered Finally the analysis should be extended to other European countries
22 Thanks to a referee for this last point
156 Nathan
at London School of E
conomics and Political Science on July 23 2015
httpjoegoxfordjournalsorgD
ownloaded from
Acknowledgements
Thanks to Gianluca Tarasconi and Francesco Lissoni at Universita BocconiAPE-INV forKITES-PATSTAT patent data to Pablo Mateos at UCL for ONOMAP coding and to the ONSSecure Data Service for LFS datasets Thanks for advice and support to Alex Bryson MariaCarvalho Riccardo Crescenzi Giulia Faggio Ben Gidley Ian Gordon Simona Iammarino BillKerr Carlo Menon Henry Overman Rebecca Riley Rosa Sanchis-Guarner Carlos Vargas-Silva and Vivek Wadhwa Seminar participants at IZA EUROLIO COMPAS SERC theUrban Economics Association and the Regional Studies Association all provided helpfulcomments on previous versions as did three anonymous referees This work includes analysisbased on data from the Labour Force Survey produced by the Office for National Statistics(ONS) and supplied by the Secure Data Service at the UK Data Archive The data are Crowncopyright and reproduced with the permission of the controller of HMSO and Queenrsquos Printer forScotland The use of the ONS statistical data in this work does not imply the endorsement of theONS or the Secure Data Service at the UK Data Archive in relation to the interpretation oranalysis of the data This work uses research datasets that may not exactly reproduce NationalStatistics aggregates All the outputs have been granted final clearance by the staff of the SDS-UKDA I am grateful to the ESRC and the Department of Communities and Local Governmentfor research support The views in this paper are my own and do not necessarily represent thoseof the Department or the ESRC Any remaining errors and omissions are my own
Funding
This paper draws on PHD research funded by the UK Economic and Social Research Council(ESRC) and the Department of Communities and Local Government (DCLG) I am grateful tothe ESRC and the DCLG for this support The views in this paper are my own and do notnecessarily represent those of the Department or the ESRC
References
Abramovsky L Griffith R Macartney G Miller H (2008) The Location of InnovativeActivity in Europe IFS Working Papers WP0810 London Institute for Fiscal Studies
Agrawal A Cockburn I McHale J (2006) Gone but not forgotten knowledge flows labormobility and enduring social relationships Journal of Economic Geography 6 571ndash591
Agrawal A Kapur D McHale J (2008) How do spatial and social proximity influenceknowledge flows Evidence from patent data Journal of Urban Economics 64 258ndash269
Alesina A Ferrara E L (2005) Ethnic diversity and economic performance Journal ofEconomic Literature 43 762ndash800
Angrist J Pischke J-S (2009) Mostly Harmless Econometrics Princeton Princeton UniversityPress
Aspinall P (2009) The future of ethnicity classifications Journal of Ethnic and Migration Studies35 1417ndash1435
Audretsch D Feldman M (1996) RampD spillovers and the geography of innovation andproduction American Economic Review 86 630ndash640
Berliant M Fujita M (2008) Knowledge creation as a square dance on the Hilbert cubeInternational Economic Review 49 1251ndash1295
Berliant M Fujita M (2009) Dynamics of knowledge creation and transfer the two personcase International Journal of Economic Theory 5 155ndash179
Blundell R Griffith R Van Reenen J (1995) Dynamic count data models of technologicalinnovation The Economic Journal 105 333ndash344
Borjas G (1987) Self-selection and the earnings of immigrants American Economic Review 77531ndash553
Borjas G (1994) The economics of immigration Journal of Economic Literature 32 1667ndash1717Borjas G Doran K (2012) The collapse of the Soviet Union and the productivity of Americanmathematicians Quarterly Journal of Economics 127 1143ndash1203
Minority ethnic inventors diversity and innovation 157
at London School of E
conomics and Political Science on July 23 2015
httpjoegoxfordjournalsorgD
ownloaded from
Brinkley I (2008) The Knowledge Economy How Knowledge Is Reshaping the Economic Life ofNations London The Work Foundation
Caldwell C (2009) Reflections on the Revolution in Europe Immigration Islam and the WestLondon Allen Lane
Card D (2010) How immigration affects US cities In R P Inman (ed) Making Cities WorkProspects and Policies for Urban America pp 158ndash200 Princeton Princeton University Press
Chellaraj G Maskus K Mattoo A (2008) The contribution of international graduate studentsto US innovation Review of International Economics 16 444ndash462
Clark K Drinkwater S (2010) Recent trends in minority ethnic entrepreneurship in BritainInternational Small Business Journal 28 136ndash146
Combes P-P Duranton G Gobillon L (2008) Spatial wage disparities sorting mattersJournal of Urban Economics 63 723ndash742
Docquier F Rapoport H (2012) Globalization brain drain and development Journal ofEconomic Literature 50 681ndash730
Duleep H O Jaeger D Regets M (2012) How Immigration May Affect US NativeEntrepreneurship Theoretical Building Blocks and Preliminary Results IZA Discussion Paper6677 Bonn IZA
Easterley W Levine R (1997) Africarsquos growth tragedy policies and ethnic divisions QuarterlyJournal of Economics 112 1203ndash1250
Fagerberg J (2005) Innovation a guide to the literature In J Fagerberg D Mowery R Nelson(eds) The Oxford Handbook of Innovation pp 1ndash27 Oxford OUP
Faggio G Overman H (2014) The effect of public sector employment on local labour marketsJournal of Urban Economics 79 91ndash107
Foley C F Kerr W R (2013) Ethnic innovation and US multinational firm activityManagement Science 59 1529ndash1544
Freeman C (1987) Technology Policy and Economic Policy Lessons from Japan London PinterFujita M Weber S (2003) Strategic Immigration Policies and Welfare in HeterogenousCountries Institute of Economic Research Working Papers Kyoto Kyoto University
Gagliardi L (2011) Does Skilled Migration Foster Innovative Performance Evidence from BritishLocal Areas SERC Discussion Paper DP0097 London SERC
Gibbons S Overman H G Resende G (2011) Real Earnings Disparities in Britain SERCDiscussion Paper DP0065 London SERC
Gordon I Whitehead C Travers T (2007) The Impact of Recent Immigration on the LondonEconomy London City of London Corporation
Hall B Jaffe A Trajtenberg M (2001) The NBER Patent Citations Data File LessonsInsights and Methodological Tools Cambridge MA NBER
Hanks P Tucker D K (2000) A diagnostic database of American personal names Names AJournal of Onomastics 48 59ndash69
Hanson G H (2012) Immigration productivity and competitiveness in American industryPaper Presented at American Enterprise Institute Conference Competing for Talent The UnitedStates and High-Skilled Immigration Washington DC 31 January
Hausman J A Hall B H Griliches Z (1984) Econometric models for count data with anapplication to the patents-RampD relationship Econometrica 52 909ndash938
Heckman J (1981) The incidental parameters problem and the problem of initial condition inestimating a discrete time-discrete data stochastic process In C F Manski D L McFadden(eds) Structural Analysis of Discrete Data and Econometric Applications pp 179ndash197Cambridge MA MIT Press
Hong L Page S (2001) Problem solving by heterogeneous agents Journal of Economic Theory97 123ndash163
Hong L Page S (2004) Groups of diverse problem solvers can outperform groups of high-ability problem solvers Proceedings of the National Academy of Sciences of the United States ofAmerica 101 16385ndash16389
Hoogendoorn S Oosterbeek H van Praag M (2013) The impact of gender diversity on theperformance of business teams evidence from a field experiment Management Science 591514ndash1528
Hunt J (2011) Which immigrants are most innovative and entrepreneurial Distinctions by entryvisa Journal of Labor Economics 29 417ndash457
158 Nathan
at London School of E
conomics and Political Science on July 23 2015
httpjoegoxfordjournalsorgD
ownloaded from
Hunt J Gauthier-Loiselle M (2010) How much does immigration boost innovation AmericanEconomic Journal Macroeconomics 2 31ndash56
Jacobs J (1969) The Economy of Cities London VintageJaffe A B Trajtenberg M Henderson R (1993) Geographic localization of know-ledge spillovers as evidenced by patent citations The Quarterly Journal of Economics 108577ndash598
Javorcik B S Ozden C Spatareanu M Neagu C (2011) Migrant networks and foreigndirect investment Journal of Development Economics 94 231ndash241
Kaiser U Kongsted H C Roslashnde T (2011) Labor Mobility Social Network Effects andInnovative Activity IZA Discussion Paper 5654 Bonn IZA
Kapur D McHale J (2005) Sojourns and software internationally mobile human capital andhigh tech industry development in India Ireland and Israel In A Arora A Gambardella (eds)From Underdogs to Tigers The Rise and Growth of the Software Industry in Brazil China IndiaIreland and Israel pp 236ndash274 Oxford OUP
Kerr W (2008a) Ethnic scientific communities and international technology diffusion Review ofEconomics and Statistics 90 518ndash537
Kerr W (2008b) The Agglomeration of US Ethnic Inventors HBS Working Paper 09-003Boston MA Harvard Business School
Kerr W (2009) Breakthrough Innovations and Migrating Clusters of Innovation NBER WorkingPaper 15443 Cambridge MA NBER
Kerr W (2010a) The agglomeration of US ethnic inventors In E Glaeser (ed) AgglomerationEconomics pp 237ndash276 Chicago University of Chicago Press
Kerr W Lincoln W (2010) The Supply Side of Innovation H-1b Visa Reforms and US EthnicInvention NBER Working Paper 15768 Cambridge MA NBER
Kerr W R (2010b) Breakthrough inventions and migrating clusters of innovation Journal ofUrban Economics 67 46ndash60
Kugler M Rapoport H (2007) International labor and capital flows complements orsubstitutes Economics Letters 94 155ndash162
Lakha F Gorman D Mateos P (2011) Name analysis to classify populations by ethnicity inpublic health validation of Onomap in Scotland Public Health 125 688ndash696
Leadbeater C (2008) The Difference Dividend Why Immigration is Vital to Innovation NESTAProvocation London NESTA
Legrain P (2006) Immigrants Your Country Needs Them London Little BrownLi X Pai Y (2010) The changing geography of innovation activities what do patent indicatorsimply In X Fu L Soete (eds) The Rise of Technological Power in the South pp 69ndash88Basingstoke Palgrave MacMillan
Lissoni F Tarasconi G Sanditov B (2006) The KEINS Database on Academic InventorsMethodology and Contents CESPRI Working Paper 181 Milan Universitarsquo Bocconi
Malchow-Moslashller N Munch J R Skaksen J R (2011) Do Foreign Experts Increase theProductivity of Domestic Firms IZA Discussion Paper 6001 Bonn IZA
Mare D C Fabling R (2011) Productivity and Local Workforce Composition Motu WorkingPaper 11-10 Wellington NZ Motu Economic and Public Policy Research
Mare D C Fabling R Stillman S (2011) Immigration and Innovation IZA Discussion Paper5686 Bonn IZA
Mateos P (2007) A review of name-based ethnicity classification methods and their potential inpopulation studies Population Space and Place 13 243ndash263
Mateos P Longley P OrsquoSullivan D (2011) Ethnicity and population structure in personalnaming networks PLoS One 6 e22943
Mateos P Webber R Longley P (2007) The Cultural Ethnic and Linguistic Classificationof Populations and Neighbourhoods Using Personal Names CASA Working PaperLondon UCL
McCann P Ortega-Arguiles R (2013) Modern regional innovation policy Cambridge Journalof Regions Economy and Society 6 187ndash216
Menon C (2009) Stars and Comets An Exploration of the Patent Universe SERC DP0037London LSE
Nathan M Lee N (2013) Cultural diversity innovation and entrepreneurship firm-levelevidence from London Economic Geography 89 367ndash394
Minority ethnic inventors diversity and innovation 159
at London School of E
conomics and Political Science on July 23 2015
httpjoegoxfordjournalsorgD
ownloaded from
Niebuhr A (2010) Migration and innovation does cultural diversity matter for regional RampDactivity Papers in Regional Science 89 563ndash585
Oaxaca R L Geisler I (2003) Fixed effects models with time invariant variables a theoreticalnote Economics Letters 80 373ndash377
OECD (2009) OECD Patent Statistics Manual Paris OECDOffice of National Statistics (2012) Ethnicity and National Identity in England and Wales 2011Newport ONS
Office of National Statistics (2013) Labour Force Survey 1993ndash2011 SN 6727 Secure DataService Access [computer file] Colchester UK Data Archive
Ostergaard C R Timmermans B Kristinsson K (2011) Does a different view createsomething new The effect of employee diversity on innovation Research Policy 40 500ndash509
Ottaviano G Bellini E Maglietta A (2007) Diversity and the Creative Capacity of Cities andRegions SUSDIV Paper 22007 Bologna FEEM
Ottaviano G Peri G (2005) Cities and cultures Journal of Urban Economics 58 304ndash337Ottaviano G Peri G (2006) The economic value of cultural diversity evidence from US citiesJournal of Economic Geography 6 9ndash44
Ozgen C Nijkamp P Poot J (2011) The Impact of Cultural Diversity on Innovation Evidencefrom Dutch Firm-Level Data IZA Discussion Paper 6000 Bonn IZA
Ozgen C Nijkamp P Poot J (2012) Immigration and innovation in European regionsIn P Nijkamp J Poot M Sahin (eds) Migration Impact Assessment New HorizonsCheltenham Edward Elgar
Page S (2007) The Difference How the Power of Diversity Creates Better Groups Firms Schoolsand Societies Princeton Princeton University Press
Parrotta P Pozzoli D Pytlikova M (2013) The nexus between labor diversity and firmrsquosinnovation Journal of Population Economics 27 303ndash364
Peri G (2007) Higher education innovation and growth In G Brunello P Garibaldi E Wasmer(eds) Education and Training in Europe pp 56ndash70 Oxford Oxford University Press
Petersen J Longley P Gibin M Mateos P Atkinson P (2011) Names-based classificationof accident and emergency department users Health amp Place 17 1162ndash1169
Putnam R (2007) E pluribus unum diversity and community in the twenty-first centuryScandinavian Political Studies 30 137ndash174
Rauch J E Casella A (2003) Overcoming informational barriers to international resourceallocation prices and ties The Economic Journal 113 21ndash42
Rauch J E Trindade V (2002) Ethnic Chinese networks in international trade Review ofEconomics and Statistics 84 116ndash130
Robson B Barr R Lymperopoulou K Rees J Coombes M (2006) A Framework for City-Regions Working Paper 1 Mapping City-Regions London Office of the Deputy PrimeMinister
Rodrıguez-Pose A Storper M (2006) Better rules or stronger communities On the socialfoundations of institutional change and its economic effects Economic Geography 82 1ndash25
Romer P (1990) Endogenous technological change Journal of Political Economy 98 71ndash102Saxenian A (2006) The New Argonauts Regional Advantage in a Global Economy CambridgeMA Harvard University Press
Saxenian A Sabel C (2008) Venture capital in the lsquoperipheryrsquo the new argonauts global searchand local institution-building Economic Geography 84 379ndash394
Schumpeter J (1962) The Theory of Economic Development Berlin SpringerSimmie J Carpenter J Chadwick A Martin R (2008)History Matters Path Dependence andInnovation in British City-Regions London NESTA
Somerville W (2007) Immigration under New Labour Bristol Policy PressStephan P Levin S (2001) Exceptional contributions to US science by the foreign-born andforeign-educated Population Research and Policy Review 20 59ndash79
Stuen E T Mobarak A M Maskus K E (2012) Skilled immigration and innovation evidencefrom enrolment fluctuations in US doctoral programmes The Economic Journal 122 1143ndash1176
Syrett S Sepulveda L (2011) Realising the diversity dividend population diversity and urbaneconomic development Environment and Planning A 43 487ndash504
Trajtenberg M Schiff G Melamed R (2006) The lsquoNames Gamersquo Harnessing Inventorsrsquo PatentData for Economic Research NBER Working Papers 12479 Cambridge MA NBER
160 Nathan
at London School of E
conomics and Political Science on July 23 2015
httpjoegoxfordjournalsorgD
ownloaded from
Trax M Brunow S Suedekum J (2012) Cultural Diversity and Plant-Level Productivity IZADiscussion Paper 6845 Bonn IZA
Wadhwa V (2012) The Immigrant Exodus Why America Is Losing the Global Race to CaptureEntrepreneurial Talent Philadelphia Wharton
Wadhwa V Saxenian A Rissing B Gereffi G (2007) Americarsquos New ImmigrantEntrepreneurs Durham NC Duke UniversityiSchool UC Berkeley
Wadhwa V Saxenian A Rissing B A Gereffi G (2008) Skilled immigration and economicgrowth Applied Research in Economic Development 5 6ndash14
Zenou Y (2009) Urban Labor Economics Cambridge Cambridge University PressZenou Y (2011) Spatial versus Social Mismatch The Strength of Weak Ties IZA DiscussionPapers 5507 Bonn Institute for the Study of Labor (IZA)
Zucker L G Darby M R (2007) Star Scientists Innovation and Regional and NationalImmigration National Bureau of Economic Research Working Paper 13547 Cambridge MANBER
Appendix
A The KITES-PATSTAT database
Raw patent data cannot typically be used at inventor level because of commonmisspelled names changes of address or duplication (Trajtenberg et al 2006) Thedataset of inventors used in this article is taken from the KITES-PATSTAT databasedeveloped by the KITES centre at Bocconi University under the APE-INV initiative23
The original patents data come from the EPO PATSTAT system and are cleaned bythe KITES team to allow robust identification of individual inventors
The KITES cleaning procedure has three stages (Lissoni et al 2006) First inventorname and address fields are cleaned and standardized and a unique CODINV code isapplied to all inventors with the same names surnames and address Second lsquosimilarityscoresrsquo are assigned for pairs of inventors with the same name and surname but differentaddresses Scores are higher for pairs whose dyads are located in the same cityprovinceregion who patent in the same technological fields (this is measured separately at 4- 6-10- and 12-digit level with corresponding weights) who share the same applicantorganization who share co-inventors or who are in lsquosmall worldrsquo networks with thirdparties andwho cite each other Scores are lower for pairs whose dyads patent 20 ormoreyears apart or who share common surnames (assessed by name frequency analysis foreach country) Third a threshold for similarity scores is generated for each country overwhich inventor pairs are considered the same person and given the same identifier
This cleaning procedure deals with the lsquowho is whorsquo problem and indirectly allowsme to identify moving inventorsmdashthe lsquowho is wherersquo problemmdashmuch more preciselythan some previous studies such as Agrawal et al (2006) Comparing the original andcleaned CODINV codes allows me to see cases where inventors with different addresseshave been subsequently coded as the same individual but at different addresses I definethese as cases of moving inventors This group turns out to comprise 1781 individuals(245 of my sample) Within this group I also identify a set of smaller inventors whoappear in two different TTWAs in same yeargroup This is a group of 963 individuals(133 of my sample)
23 See httpdbkitesunibocconiit
Minority ethnic inventors diversity and innovation 161
at London School of E
conomics and Political Science on July 23 2015
httpjoegoxfordjournalsorgD
ownloaded from
B ONOMAP and minority ethnic inventors
lsquoEthnicityrsquo is not straightforward to frame or measure (see main text) The lsquogold standardrsquoscenario is when there is a rich and flexible typology and where individuals can self-ascribe for example in a Census (Aspinall 2009) In many cases such as health or patentsdata this is not available and name-based approaches have emerged as a powerfulalternative (see Mateos (2007) for a review of this literature) The intuition behind name-based approaches is that naming relates to cultural ethnic linguistic features ofindividuals families and communities Mateos et al (2011) point out that lsquonamingpractices are far from random instead reflecting social norms and cultural customs Theyexist in all human groups and follow distinct geographical and ethno-culturalpatterns distinctive naming practices in cultural and ethnic groups are persistent evenlong after immigration to different social contextsrsquo (p e22943) Working with a databaseof 18 million names from over 17 countries the authors show the persistence of namingnetworks in migrant and minority communities in lsquohostrsquo and new lsquohomersquo environments(Mateos et al 2011) Note that this last feature of lsquonaming networksrsquo makes name-basedsystems suitable for identifying minority ethnic inventors in particular
B1 The ONOMAP system
One of the limitations in early name-based classification systems was a restricted numberof names (Mateos 2007) The ONOMAP system built at University College Londonhas designed to deal with this problem24 ONOMAP uses a reference population of500000 forenames and a million surnames derived from electoral register or telephonedirectory name frequency data for 28 countries Names are then classified into groupsexploiting name-network clustering between surname and forename pairings Techniquesused include forenamendashsurname triage spatio-temporal analysis geo-demographicanalysis text mining lsquoname-to-ethnicityrsquo analysis from population registers internationalname frequency and genealogy resources and individual name research for hard cases(see Mateos et al (2007) for details) The final classification comprises 185 lsquoculturalndashethnicndashlinguisticrsquo (CEL) groups building on frameworks developed by Hanks and Tucker(2000) At its finest level this gives 185 CEL lsquotypesrsquo given the frequency distribution ofthese types in the inventor data inventors were eventually classified at a higher levelbased on 68 CEL lsquosubgroupsrsquo ONOMAP also provides detail on CEL componentcriteria including 12 geographical origin groups and nine lsquomacro-ethnicrsquo groups thatderive from the UK Office of National Statistics 1991 Census classification
ONOMAP is used to classify inventor names via an algorithm that uses surnameforename and surnamendashforename combinations In most cases both elements of apersonrsquos name share the same CEL type in other cases there will be multiple possibilities(such as the authorrsquos own name) in which case the system assigns the most likely typebased on the underlying name networks in the reference population In a few cases namesare unclassified (in the case of the KITES-PATSTAT dataset this is under 1 ofinventors) ONOMAP has also been extensively tested with individual-level datasetswhere ethnicity is known Petersen et al (2011) analyse over 107000 patients for aLondon hospital ONOMAP matches over 95 of names Lakha et al (2011) test birthregistration pupil census and health data for 260748 individuals ONOMAP matches
24 See httpwwwonomaporg
162 Nathan
at London School of E
conomics and Political Science on July 23 2015
httpjoegoxfordjournalsorgD
ownloaded from
over 99 of names and gives55 measurement error For this article I also subjectONOMAP to a falsification test where ethnicity is assigned at random In both casesONOMAP performs better than random assignment (see Section 7)
B2 Potential limitations of ONOMAP
There are two potential limitations of ONOMAP relevant to research on inventordemographics First the system is unable to distinguish migrants from second-plusgeneration communities This article thus focuses on the larger group of minority ethnicinventors A second limitation stems from international languages such as Spanish andEnglish where similar names may be found across several communities and countriesThis could be a source of measurement error In practice ONOMAP explicitly modelsSpanish Mexican Filipino Latin American and other Spanish-language names it alsodistinguishes English mainland Cornwall and Channel Islands Scottish and WelshBlack Caribbean American and British British South African American Indian andlsquoAmerican Otherrsquo groups Australasian names are not separately classified but in the2011 Census Australasians make up just 24 of the wider migrant population inEngland and Wales (versus 33 from NorthSouth America and 363 fromContinental Europe) This suggests any remaining misclassification is residual noiserather than a structural problem in the data
C Additional results
Table C1 First stage estimator tests individual patent counts and inventor group diversity
Geo origin zones ONS ethnic groups
(1) (2) (3) (1) (2) (3)
Negative binomial
Frac Index of inventors 0075 0221 0248 0111 0312 0337
(0100) (0020) (0023) (0165) (0011) (0014)
Individual fixed effect N Y Y N Y Y
Controls N N Y N N Y
Log-likelihood 206721358 91887733 91829454 206723863 91913822 91861933
OLS
Frac Index of inventors 0089 0644 0623 0122 0814 0758
(0115) (0272) (0282) (0181) (0424) (0423)
Individual fixed effects N Y Y N Y Y
Controls N N Y N N Y
F-statistic 68238 89492 49994 69024 46575 46575
R2 0012 0018 0018 0012 0018 0018
Source KITES-PATSTATONS
Notes 210008 observations Negative binomial coefficients are marginal effects on the mean In each panel
column (1) uses yeargroup dummies columns (2) and (3) use technology fieldyeargroup dummies and
individual fixed effects Column (3) controls include Fractional Index of TTWA population STEM degree
holders in TTWA log of TTWA population density high-tech manufacturing in TTWA medium-tech
manufacturing in TTWA workers in entry-level occupations log of area weighted patent stock 1981ndash1984
urban TTWA dummy Bootstrapped standard errors are in parentheses and are clustered on TTWAs
Significant at 10 5 and 1
Minority ethnic inventors diversity and innovation 163
at London School of E
conomics and Political Science on July 23 2015
httpjoegoxfordjournalsorgD
ownloaded from
Table C2 First stage regressions choice of time period test reduced form model
Individual patent counts (1) (2) (3) (4)
Frac Index of inventors by geographical origin 0623 0644 0237 0022
(0282) (0048) (0019) (0022)
Controls Y Y Y Y
Observations 210008 210008 587805 293266
R2 0018 0018 0038 0016
Source KITES-PATSTATONS
Notes Model is estimated in OLS Column (1) fits the full regression Columns (2)ndash(4) fit reduced form
model with individualarea fixed effects and technology-fieldyear fixed effects as detailed controls are not
available pre-1993 Column (2) fits inventors active 1993ndash2004 column (3) fits inventors active 1981ndash2004
column (4) fits inventors active 1981ndash1992 only Standard errors are in parentheses are heteroskedasticity
and autocorrelation-robust and clustered on TTWAs
Significant at 10 5 and 1
Table C3 First stage regressions sample construction test reduced form model
Individual patent counts (1) (2) (3)
All Multiple Blanks
Frac Index of inventors by geographical origin 0623 0210 0210
(0282) (0185) (0185)
Controls Y Y Y
Observations 210008 19118 19118
R2 0018 0004 0004
Source KITES-PATSTATONS
Notes Model is estimated in OLS Columns (1) and (2) use a sample where inventorareatime cells are
marked as zero when inventors are not patenting column (2) restricts this sample to inventors who patent
more than once Column (3) uses a sample of multiple inventors where non-active cells are marked as
missing rather than zero All models use technology fieldyeargroup dummies and individual fixed effects
Controls as per Table C1 Standard errors are in parentheses are heteroskedasticity and autocorrelation-
robust and clustered on TTWAs
Significant at 10 5 and 1
164 Nathan
at London School of E
conomics and Political Science on July 23 2015
httpjoegoxfordjournalsorgD
ownloaded from
Table C4 Area-level alternative specification for the first stage model
Aggregate patent counts OLS Poisson
Unweighted Weighted Unweighted Weighted
Frac Index of inventors (geo origin) 335481 124173 88630 38920
(158083) (63563) (39646) (20364)
Controls Y Y Y Y
Observations 532 532 532 532
Log-likelihood 3269429 2712868 3485019 2173729
R2 0936 0952
Source KITES-PATSTATONS
Notes Dependent variables are various unweighted and weighted area-level patent counts Poisson
coefficients are marginal effects at the mean All models use technology fieldyeargroup dummies and area
(TTWA) fixed effects Controls as per Table C1 Standard errors are in parentheses are heteroskedasticity
and autocorrelation-robust and clustered on TTWAs
Significant at 10 5 and 1
Table C5 Moving inventors test reassigning primary location for moving inventors
Individual patent counts Location 1 Location 2
Frac Index of inventors by geographical origin 0248 0262
(0023) (0015)
Controls Y Y
Observations 210008 210008
Log-likelihood 91829454 91772246
Source KITES-PATSTATONS
Notes All models use technology fieldyeargroup dummies and individual fixed effects Controls as per
Table C1 Bootstrapped standard errors in parentheses Coefficients are marginal effects at the mean
Significant at 10 5 and 1
Minority ethnic inventors diversity and innovation 165
at London School of E
conomics and Political Science on July 23 2015
httpjoegoxfordjournalsorgD
ownloaded from
Table C6 Second stage regressions robustness tests on fixed effects decomposition
Estimated individual fixed effect (1) (2) (3) (4) (5) (6)
Minority ethnic inventor 0199 0194 0196 0200 0198
(0011) (0011) (0010) (0010) (0010)
Moving inventor same yeargroup 0512
(0036)
Moving inventor 0044
(0025)
Inventor patents in 1 technology field 0213
(0015)
Fake minority ethnic 0016
(0010)
Controls Y Y Y Y Y Y
Observations 70007 70007 70007 70007 70007 70007
R2 0253 0343 0256 0253 0256 0249
Source KITES-PATSTATONS
Notes Column (1) fits the main regression as per Table 10 in the article Column (2) uses an FGLS
estimator instead of bootstrapped OLS Columns (3) and (4) introduce additional controls for moving
inventors Column (5) includes a control for lsquogeneralistsrsquo (patenting across at least one technology fields)
Column (6) uses lsquofakersquo (randomly assigned) minority ethnic status For all models controls include multiple
inventor dummy star dummy inventor average patent count pre-1993 and dummy for inventor activity
pre-1993 All models use robust standard errors bootstrapped 50 repetitions Constant not shown
Significant at 10 5 and 1
166 Nathan
at London School of E
conomics and Political Science on July 23 2015
httpjoegoxfordjournalsorgD
ownloaded from
Table C7 Second stage regressions falsification test
Estimated individual fixed effect (1) (2)
Inventor Central European origin 0112
(0019)
Inventor East Asian origin 0142
(0027)
Inventor East European origin 0112
(0029)
Inventor rest of world origin 0289
(0027)
Inventor South Asian origin 0314
(0021)
Inventor South European origin 0175
(0030)
Fake origin group 2 dummy 0047
(0020)
Fake origin group 3 dummy 0022
(0022)
Fake origin group 4 dummy 0017
(0023)
Fake origin group 5 dummy 0021
(0022)
Fake origin group 6 dummy 0022
(0030)
Fake origin group 7 dummy 0016
(0026)
Controls Y Y
Observations 70007 70007
R2 0254 0249
Source KITES-PATSTATONS
Notes Column (1) fits the main regression column (2) fits randomly assigned categories Controls as in
Table C6 All models use robust standard errors bootstrapped 50 repetitions
Significant at 10 5 and 1
Minority ethnic inventors diversity and innovation 167
at London School of E
conomics and Political Science on July 23 2015
httpjoegoxfordjournalsorgD
ownloaded from
Table C8 Distributional analysis Resource crowd-out-in
Change in majority weighted patents
1993ndash2004
(1) (2) (3) (4) (5)
Change in minority ethnic weighted
patents 1993ndash2004
1645 1576 1907 1988 1908
(0341) (0330) (0104) (0073) (0088)
TTWA population Frac Index 1993 0943 1046 1431 1085
(1594) (1761) (1621) (1396)
TTWA share of STEM graduates 1993 4492 2398 4295 2057
(3951) (3021) (3090) (2993)
TTWA high-tech manufacturing 1993 4203 7638 5771 0037
(4202) (4735) (4660) (3842)
TTWA medium-tech manufacturing 1993 4475 3114 3927 1041
(4009) (4301) (3991) (3422)
Log(TTWA population density 1993) 0204 0041 0128 0112
(0170) (0130) (0108) (0099)
Urban TTWA 0070 0466 0163 0494
(0226) (0211) (0228) (0194)
Log(area patent stocks 1989ndash1992) 0327
(0104)
Log(area patent stocks 1981ndash1984) 0026
(0077)
OST30 technology field dummies N N Y Y Y
Observations 203 203 201 196 176
R2 0391 0427 0712 0768 0798
Source KITES-PATSTATONS
Notes Column (1) fits the variable of interest column (2) adds controls column (3) adds technology field
dummies Constant not shown Heteroskedasticity and autocorrelation-robust standards errors are
clustered on TTWAs
Significant at 10 5 1
168 Nathan
at London School of E
conomics and Political Science on July 23 2015
httpjoegoxfordjournalsorgD
ownloaded from
- Same difference_published_cover
- Same difference_published_author
-
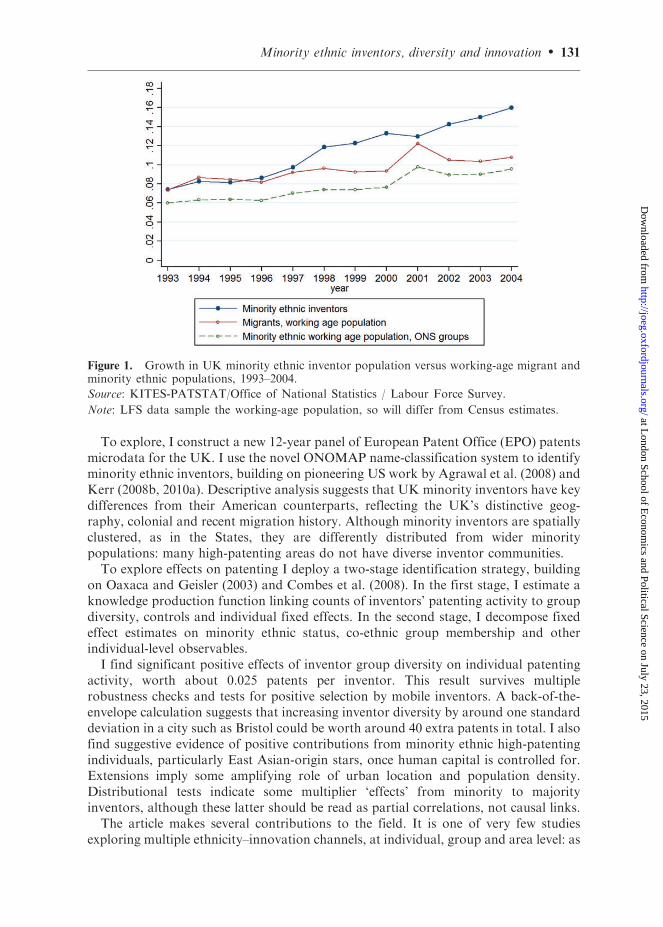
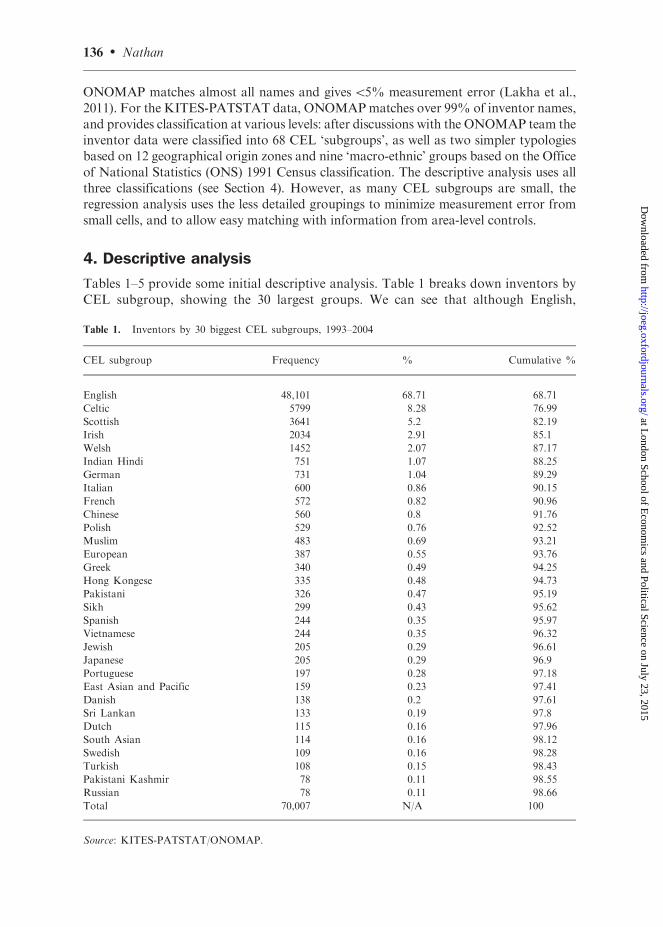
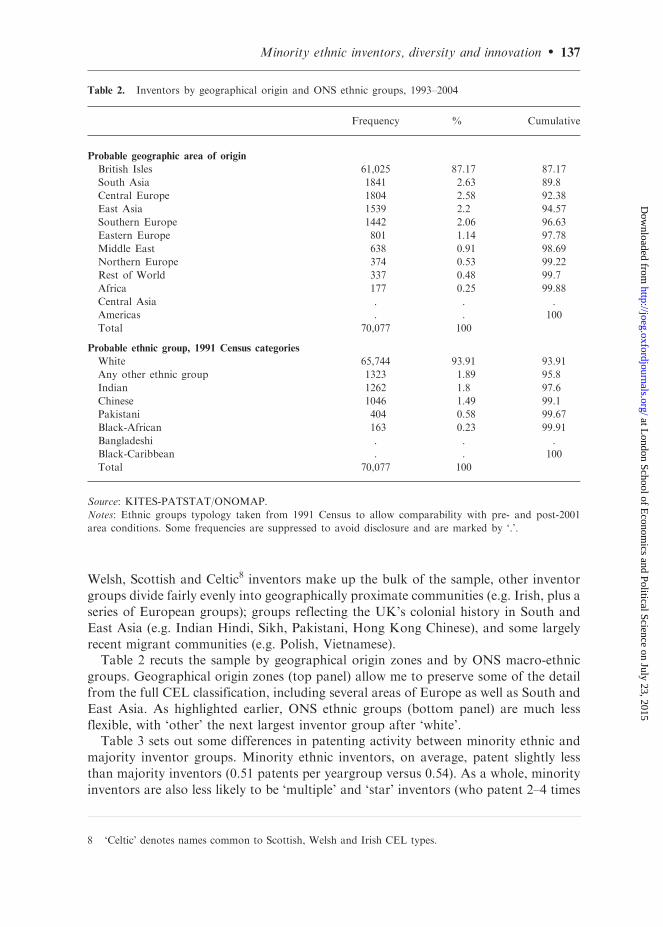
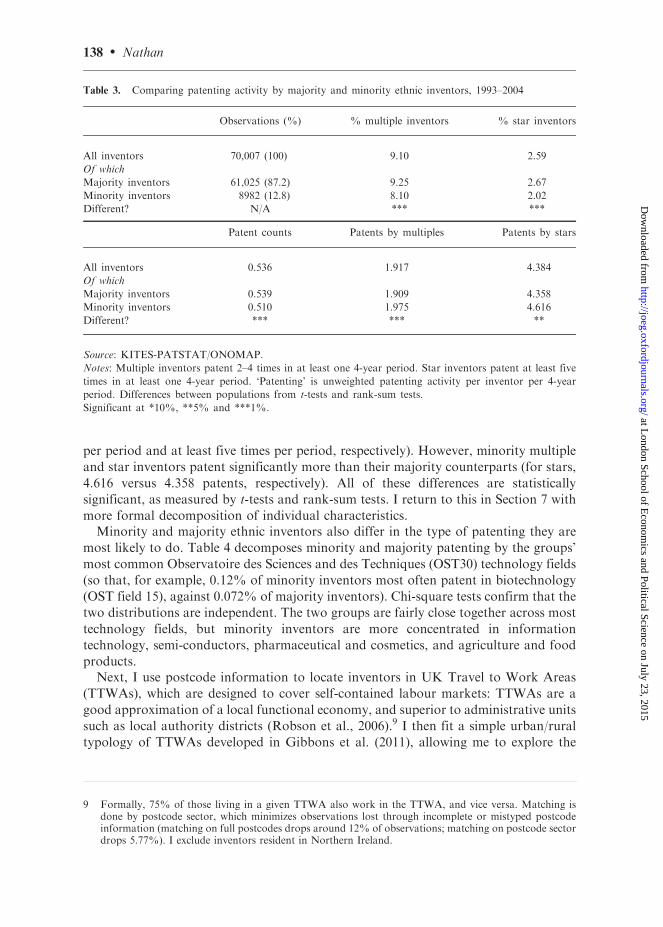
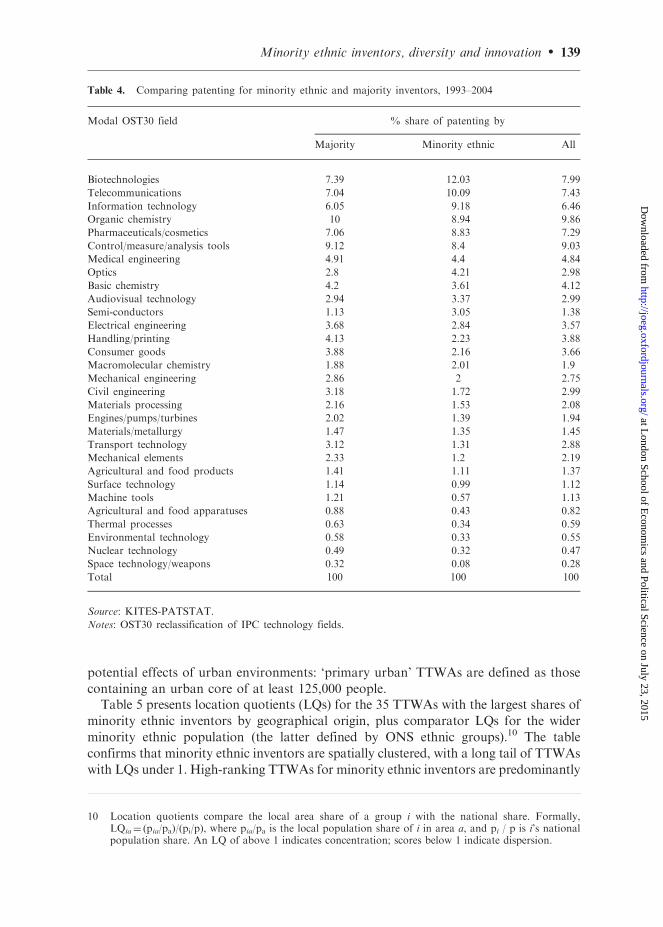
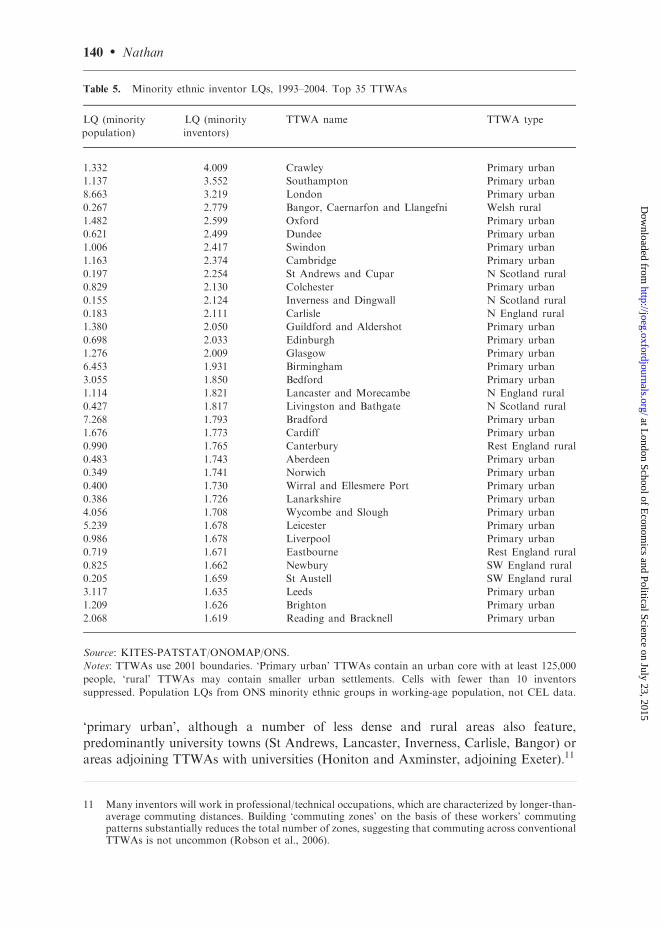
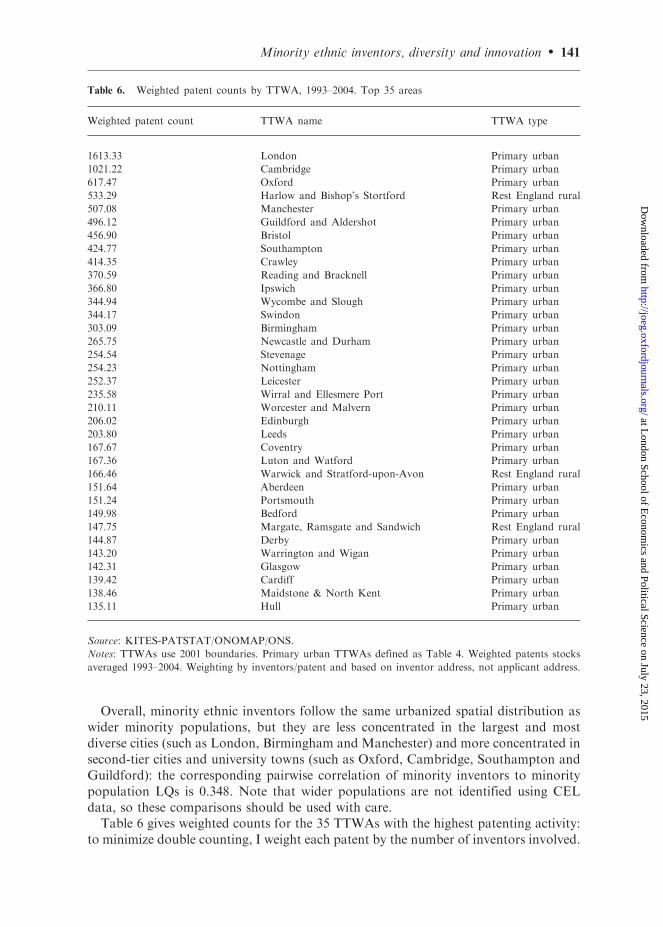
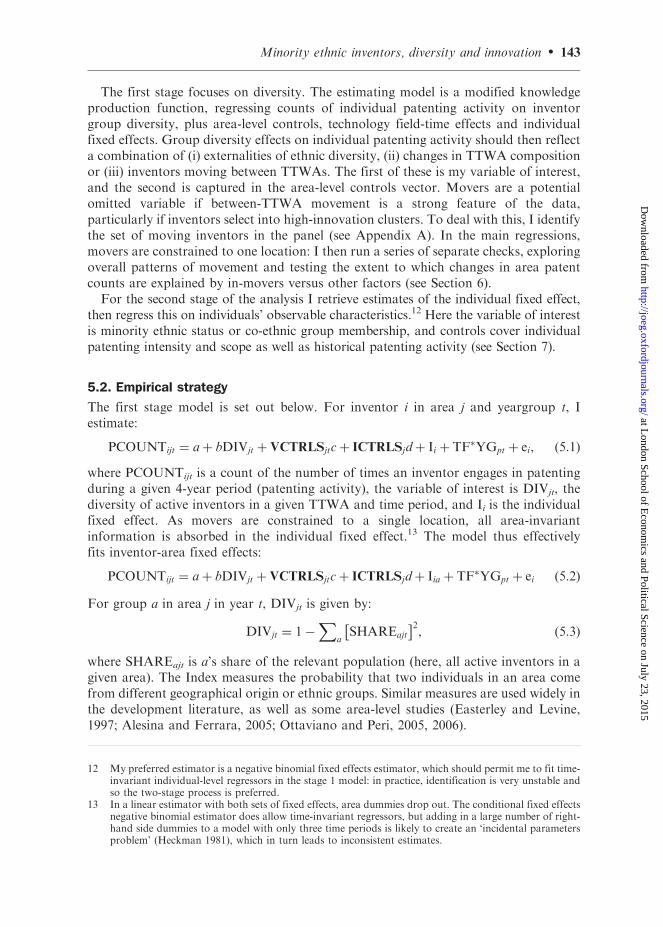
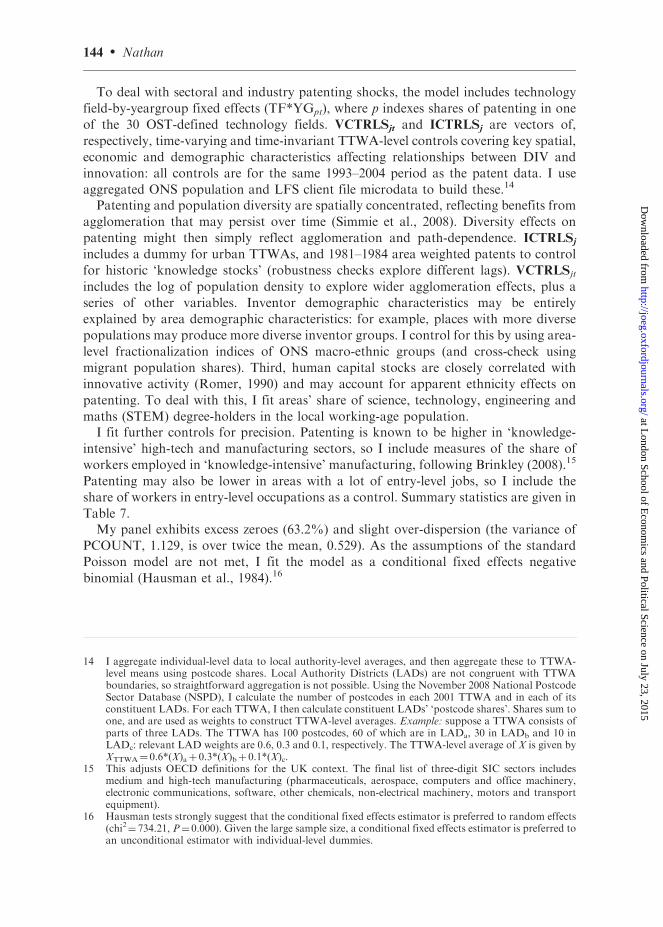
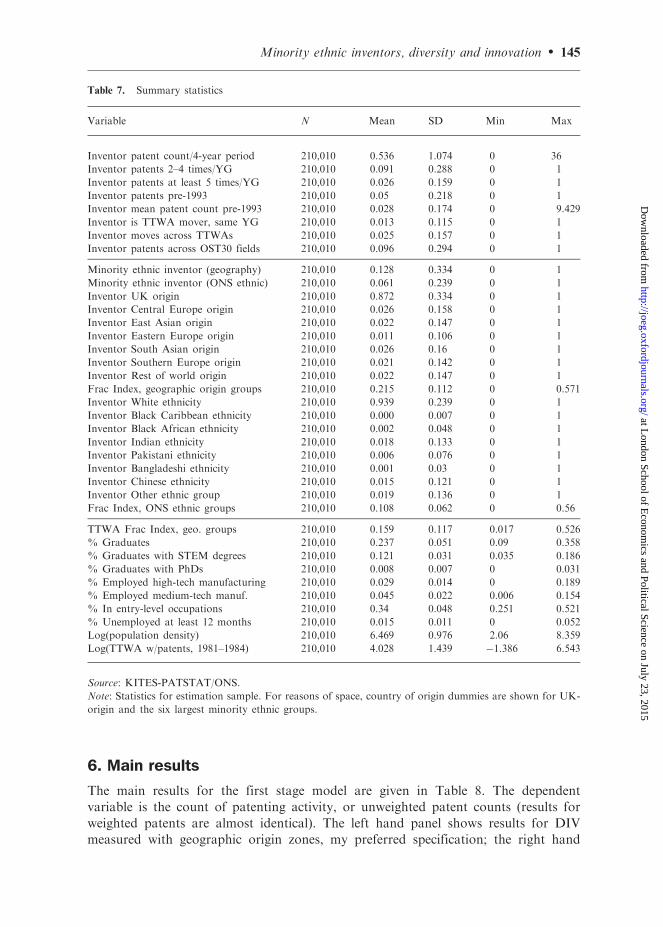
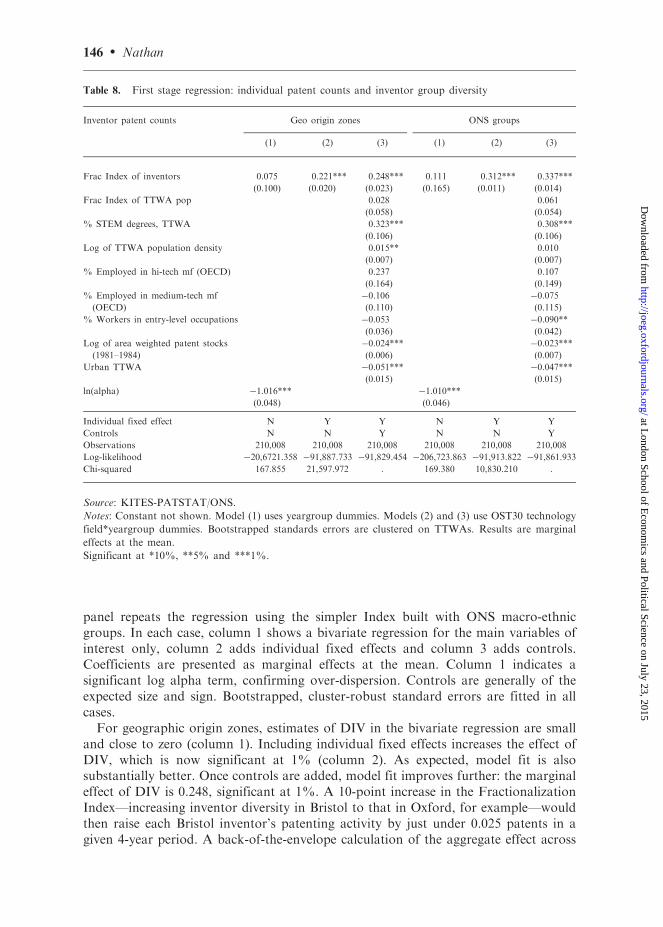
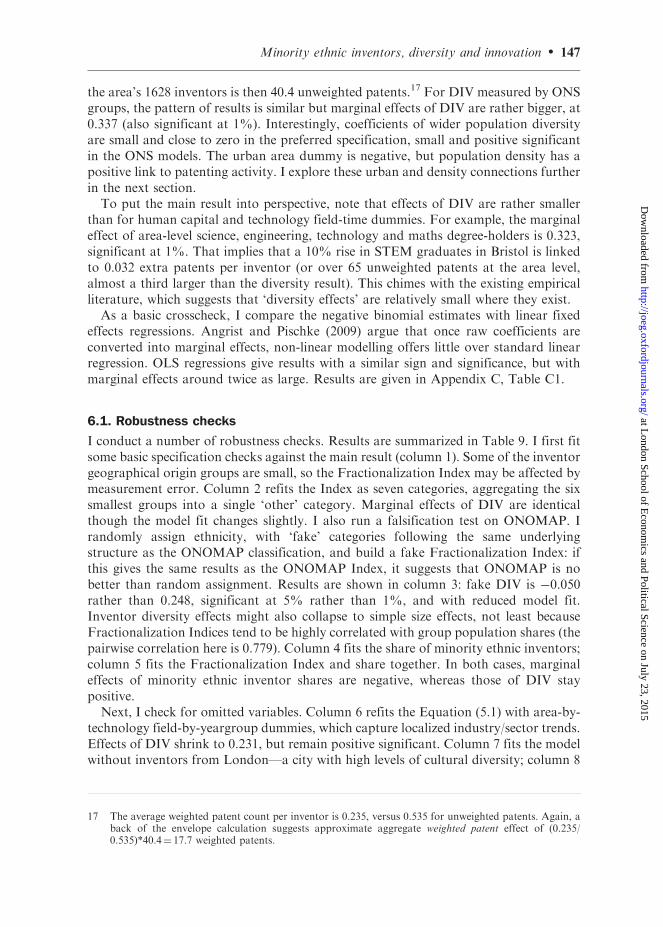
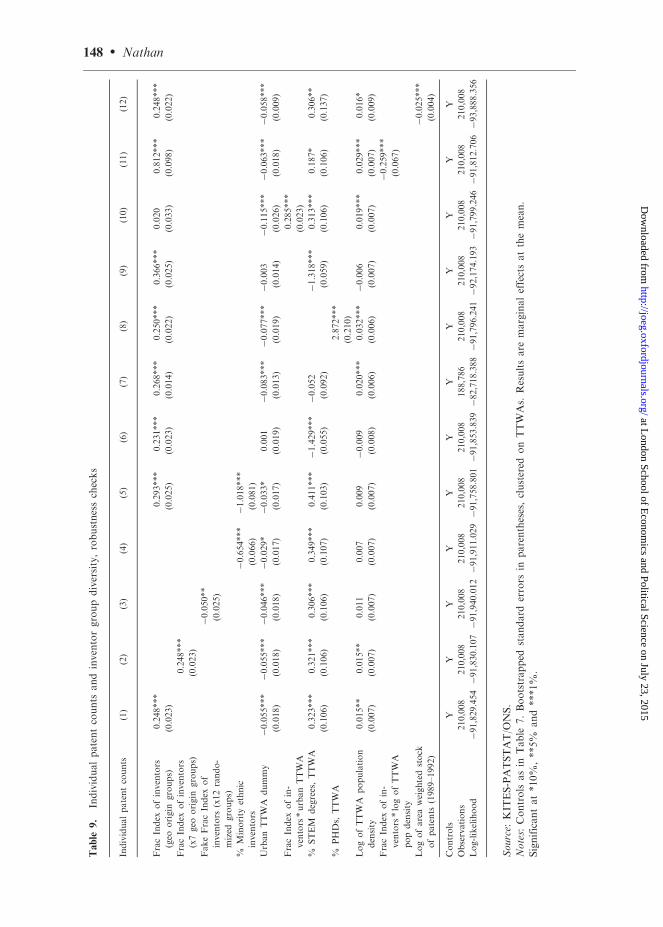
Table
9
Individualpatentcounts
andinventorgroupdiversityrobustnesschecks
Individualpatentcounts
(1)
(2)
(3)
(4)
(5)
(6)
(7)
(8)
(9)
(10)
(11)
(12)
FracIndex
ofinventors
(geo
origin
groups)
0248
0293
0231
0268
0250
0366
0020
0812
0248
(0023)
(0025)
(0023)
(0014)
(0022)
(0025)
(0033)
(0098)
(0022)
FracIndex
ofinventors
(x7geo
origin
groups)
0248
(0023)
FakeFracIndex
of
inventors
(x12rando-
mized
groups)
0050
(0025)
Minority
ethnic
inventors
06541018
(0066)
(0081)
UrbanTTWA
dummy
0055005500460029
0033
0001
008300770003
011500630058
(0018)
(0018)
(0018)
(0017)
(0017)
(0019)
(0013)
(0019)
(0014)
(0026)
(0018)
(0009)
FracIndex
ofin-
ventorsurbanTTWA
0285
(0023)
STEM
degreesTTWA
0323
0321
0306
0349
041114290052
1318
0313
0187
0306
(0106)
(0106)
(0106)
(0107)
(0103)
(0055)
(0092)
(0059)
(0106)
(0106)
(0137)
PHDs
TTWA
2872
(0210)
LogofTTWA
population
density
0015
0015
0011
0007
0009
0009
0020
00320006
0019
0029
0016
(0007)
(0007)
(0007)
(0007)
(0007)
(0008)
(0006)
(0006)
(0007)
(0007)
(0007)
(0009)
FracIndex
ofin-
ventorslogofTTWA
popdensity
0259
(0067)
Logofareaweightedstock
ofpatents
(1989ndash1992)
0025
(0004)
Controls
YY
YY
YY
YY
YY
YY
Observations
210008
210008
210008
210008
210008
210008
188786
210008
210008
210008
210008
210008
Log-likelihood
918294549183010791940012919110299175880191853839827183889179624192174193917992469181270693888356
Source
KIT
ES-PATSTATO
NS
Notes
Controls
asin
Table
7Bootstrapped
standard
errors
inparenthesesclustered
onTTWAs
Resultsare
marginaleffectsatthemean
Significantat10
5
and1
148 Nathan
at London School of E
conomics and Political Science on July 23 2015
httpjoegoxfordjournalsorgD
ownloaded from
fits the area share of PHD-holders as an alternative area-level human capital control
Removing London raises the effect of DIV to 0268 switching to PHDs also raises
estimates of DIV to 0250 Both are significant at 1 Column 9 adds the share of
lsquostarsrsquo in the TTWA inventor population where stars are defined as inventors patenting
at least five times during a given period This raises the marginal effect of DIV from
0248 to 0366 and is still significant at 118
I then test for urban amplifying effects Minority ethnic inventors are spatially
concentrated in urban locations as discussed in Section 2 agglomeration economies
might generate some of the diversity result Columns 10 and 11 test for amplifying
effects of urban and high-density areas respectively fitting interactions of the
Fractionalization Index with the urban TTWA dummy and with logged population
density In the first case the effect of DIV alone falls to zero but the joint effect of
urban DIV is 0285 significant at 1 Effects of urban status remain negative as
before In the second case estimates of DIV grow substantially to 0812 whereas the
joint effect of DIV and population density is negative at 0259 Population density
marginal effects are 0029 larger than in the main regressions All are significant at 1
Together this suggests an amplifying effect of urban areas which disappears in the
biggest and most dense cities This may partly reflect the spatial distribution of minority
ethnic inventors who are most densely clustered in second tier cities and university
towns rather than the largest urban cores Note also that removing London-based
inventors raises marginal effects of inventor diversity which is compatible with these
resultsFinally I check for appropriate historical settings If the historic patent stocks term
in the main model is mis-specified path-dependence will not be adequately controlled
for Column 12 shows results for the most conservative specification (when the lag is
dropped to the 4-year period before the sample) Effects of DIV barely change and
results for other lags also show no changeI also conduct three further structural tests First my results might be particular to
the choice of time period in which the UK experienced substantial rises in net
migration and minority ethnic populations (Graph 1) To test this I run a reduced-form
model on the full set of inventors active between 1981 and 2004 and on the sub-group
active between 1981 and 1992 Results (Appendix C Table C2) show positive significant
effects of DIV in the long sample in the earlier period DIV is non-significant and close
to zero National demographic changes then help explain my resultsNext I reconstruct my sample by blanking all inventor-yeargroup cells when an
inventor is not patenting This is a more conservative way of treating inactive inventors
and will deal with any measurement error introduced by zeroing My choice of
estimator means that blanking out non-activity has the effect of restricting the sample
to inventors who patent more than once I compare estimates for multiple inventors
across two different samples one with zeroed and one with missing observations for
non-activity Reduced-form results show that estimates for the two sub-samples are
identical (Appendix C Table C3) This strongly suggests that sample construction has
no effect on my main findings
18 I exclude inventors who are themselves stars so as to capture any effect of the presence of stars aroundthat inventor I also run tests for the sum of stars the sum of multiple inventors (inventing more thanonce) and the share of multiple inventors none of which change my main result
Minority ethnic inventors diversity and innovation 149
at London School of E
conomics and Political Science on July 23 2015
httpjoegoxfordjournalsorgD
ownloaded from
Finally I transform the model into a wholly area-level specification this losesindividual fixed effects but allows for an alternative estimation of aggregate effectsI collapse the panel to area level and estimate
Yjt frac14 athorn bDIVjt thorn VCTRLScjt thornAj thornYG TFpt thorn ejt eth64THORN
where Y is the total count of unweighted patents for area j in yeargroup t A is the area-level fixed effect and all other terms are defined as in Equation (52) The two modelsare not identical and we should expect estimates of b to differ Equation (64)
substitutes area fixed effects for individual-area fixed effects and this loses importantvariation as the main results suggest that individual characteristics help drivepatenting Sample construction is also different in the individual panel DIV iseffectively lsquoweightedrsquo across inventor populations in each area whereas the area-levelpanel cleans this out (means of DIV differ quite a lot at 0213 for the individual paneland 0109 for the area panel)
I estimate Equation (64) in OLS with Poisson results included for comparison (asshares of zeroes are low and meanndashvariance assumptions are met) Results are shown inAppendix C Table C4 In the OLS model the beta of DIV is 33548 which implies thata 01 shift in area DIV is linked to 335 extra patents in that area This compares to a(rough) aggregate effect of 404 patents from the individual-level model This suggeststhat (i) my main result holds in an area-level specification (ii) this specification missesout salient individual-level factors and (iii) sample construction issues may also be inplay Area-level results should also be treated as associations unobserved area-levelfactors might affect aggregate patenting (but not individual inventors) For all thesereasons my main individual-level results are preferred
62 Moving inventors
If inventors select into high-innovation clusters that help them become moreproductive this might create upwards bias on coefficients of DIV or in extremisexplain the result entirely To explore this issue I use information from the KITES-PATSTAT cleaning process to identify inventors who move between TTWAs (seeAppendix A) The group of movers comprises 1781 individuals (around 25 of thesample) of who 963 (133) move within the same yeargroup I then run a series ofchecks on the influence of movers First I re-assign movers from their first to theirsecond locations and re-run model (Equation 52) with almost no change to coefficientsof DIV (see Appendix C Table C5) Next I manually examine mover origin anddestination points Specifically I look for whether moves are between contiguous
TTWAs or across greater distances Contiguous moves especially from an urban to arural TTWA might suggest lifecycle-related relocation for example a new familymoving from a city to a less dense area Moves across greater distances might suggestjob-related motives I find that over 90 of moves are between contiguous TTWAs (forexample CambridgendashHuntingdon ReadingndashNewbury Middlesborough and StocktonndashHartlepoolndashBishop Auckland)
Finally I construct an area-level panel and regress the change in area-level weightedpatent counts on the change in movers to a given TTWA For TTWA j I estimate
WPATENTSj frac14 athorn bMOVERSj thornVCTRLScj thorn ej eth65THORN
150 Nathan
at London School of E
conomics and Political Science on July 23 2015
httpjoegoxfordjournalsorgD
ownloaded from
where
WPATENTSj frac14 ethWPATENTSj 2004 WPATENTSj 1993THORN=WPATENTSj 1993 eth66THORN
And WMOVERSj is assembled similarly VCTRLS contains the same set of area-level variables from model (52) with time-varying variables expressed as percentagechanges This horse-race setting allows me to test the relative contribution of movers tooverall patenting A large and significant value of b compared with c would suggest thatpositive selection is an issue at the area level (although these are associations not causaleffects) Results are given in Table 10 I find small positive significant coefficients ofmovers on changes in area patenting (0082 significant at 5) but these are dwarfed bychanges in other area-level characteristics (such as STEM degrees and high-techmanufacturing) that are fitted as controls in the main model For instance a 10 rise inmoving inventors is linked to a 08 rise in total patenting a similar increase in STEMdegrees is associated with an 119 rise This also suggests that impacts of movers atthe area level on individual inventorsrsquo outcomes are likely to be minimal
7 Extensions
71 Minority ethnic status and co-ethnic group membership
The second stage analysis explores roles of minority ethnic status and co-ethnic groupmembership in individualsrsquo patenting activity in more detail To do this I retrieveestimates of the individual fixed effects from Equation (52) and regress these on
Table 10 Testing for the role of moving inventors in the first stage model
Change in total weighted patents 1993ndash2004 (1) (2) (3) (4)
Change in moving inventors 0056 0050 0082 0082
(0028) (0026) (0037) (0038)
Change TTWA Fractionalization Index 0521 0355 0361
(0335) (0255) (0256)
Change TTWA STEM degrees 0893 1202 1192
(0726) (0754) (0756)
Change TTWA high-tech manufacturing 0848 0564 0552
(0793) (0894) (0891)
Change TTWA medium-tech manufacturing 0169 0573 0574
(0505) (0366) (0370)
Change TTWA population density 10445 12189
(16729) (15488)
Change TTWA entry-level occupations 1130 0454 0713
(1088) (1180) (1201)
OST30 technology field effects N N Y Y
Observations 206 202 198 198
F-statistic 3989 1707 2824 2753
R2 0003 0096 0318 0317
Source KITES-PATSTATONS
Notes Standard errors are in parentheses are heteroskedasticity and autocorrelation-robust and clustered
on TTWAs
Significant at 10 5 and 1
Minority ethnic inventors diversity and innovation 151
at London School of E
conomics and Political Science on July 23 2015
httpjoegoxfordjournalsorgD
ownloaded from
observable individual characteristics The fixed effects are capturing all time-invariantindividual factors which may include ethnicity elements (see Section 22) I therefore
aim to separate coefficients of minority ethnic status group membership and other
salient individual-level factors (such as human capital and previous experience) Theseresults are associations not causal links Note that because I do not observe how
individual fixed effects are scaled I am unable to interpret point estimates in relation tothe dependent variable19 However I am able to discuss the sign and significance of the
independent variables as well as their sizes relative to each otherSpecifically I estimate the following cross-sectional model for inventor i
IHATi frac14 athorn ETHbi thorn cMULTIPLEi thorn dSTARi thorn PREi thorn ePRECOUNTi thorn ui eth77THORN
where IHATi is the estimated fixed effect and ETHi is either a dummy for minority
ethnic status or a vector of co-ethnic group dummies In the latter case I take UK
origin as the reference category and estimate coefficients of the five largest minorityethnic groups aggregating the six smaller groups into a lsquorest of the worldrsquo category
Control variables are dummies for inventors who patent between two and four times ina given yeargroup (MULTIPLEi) over five times (STARi) plus two controls which use
historic patenting activity to approximate human capital characteristics (Note that asIHAT is derived from a patent counts regression results using MULTIPLE and STAR
have to be interpreted with caution) Historic patenting controls draw on a widely used
approach developed by Blundell et al (1995) who argue that agentsrsquo capacity toinnovate is largely explained by their cumulatively generated knowledge at the point in
which they enter a sample With long enough time-series data pre-sample activity thusapproximates agent-level human capital Following this logic I fit a dummy for
whether inventors patented in the pre-1993 period (PREi) and for those that didPRECOUNTi is the mean of historic patenting activity As before summary statistics
are given in Table 7 (top panel)
I estimate the model in OLS using bootstrapped standard errors to deal withheteroskedasticity arising from first stage sampling error20 Results are set out in Table 11
Feasible Generalised Least Squares (FGLS) regressions give almost identical coefficients(see Appendix C Table C6) Coefficients of minority ethnic status are negative and
significant at 1 in all specifications by contrast pre-sample patenting activity has a
positive link also significant at 1 (with a significant lsquopenaltyrsquo for those not patenting pre-sample) Multiple and lsquostarrsquo inventors also show positive coefficients significant at 1
Estimates of minority status are substantially smaller than these latter two variablesColumns 2 through 4 fit interactions of minority ethnic status with multiple and star
inventor status The latter finds positive joint coefficients which are net positive and 10
significant (columns 3 and 4) This is in line with the earlier descriptive analysis andsuggests that individual-level links between minority ethnic status and patenting exist at
least for higher-patenting inventors even after human capital is controlled forTable 12 explores further for the five largest co-ethnic groups plus a rest of the world
group Coefficients should be interpreted as associations and as relative to UK origin
the reference category Co-ethnic group membership coefficients are negative significant
19 Results are also robust to using fixed effects derived from the OLS regressions20 A BreuschndashPagan test on the basic OLS regression gives a Chi2 statistic of 6398 (Pfrac14 0000) suggesting
that heteroskedasticity is present
152 Nathan
at London School of E
conomics and Political Science on July 23 2015
httpjoegoxfordjournalsorgD
ownloaded from
as before joint effects of most co-ethnic group stars are positive and are 10significant for East Asian-origin stars Cross-checking using ONS ethnic groups finds astronger result for Chinese star inventors (1639 significant at 5) There is somevariation in coefficient size between co-ethnic groups suggestive of differing diasporaresources and capacity
I then run a series of robustness tests I first check for omitted variablesfitting dummies for moving inventors and for inventors patenting across at least twoOST30 fields (a measure of lsquogeneralistsrsquo that captures intellectual range) I also fit thecount of within-sample patenting alongside historic patent counts Results showminimal change compared with my main findings Next I run a falsification test onmain results with fake ethnic group dummies generated by random assignmentCoefficients of lsquofakersquo minority ethnic and co-ethnic group variables are generallynon-significant and model fit is substantially worse Results are shown in Appendix CTables C6 and C7
72 Distributional analysis
Finally I briefly explore potential impacts of minority ethnic inventors on majoritygroups This might involve physical outflows in which UK-origin inventors leave anarea after minority groups arrive (Borjas 1994) or lsquoresource crowd-outrsquo in whichminority ethnic inventors displace majority inventors from jobs or (say) lab space(Borjas and Doran 2012) Analysis of moving inventors suggests that they haveminimal impact on the main results However resource crowd-out could co-exist with
Table 11 Second stage regressions decomposing fixed effect estimates from first stage
Inventor fixed effects (estimated) (1) (2) (3) (4)
Minority ethnic inventor (geo groups) 0199 0201 0206 0209
(0010) (0011) (0010) (0011)
Inventor patents 2ndash4 times (multiple) 1097 1095 1097 1093
(0019) (0019) (0019) (0019)
Minority ethnic multiple inventor 0022 0040
(0064) (0062)
Inventor patents at least 5 times (star) 3695 3695 3664 3663
(0059) (0059) (0061) (0061)
Minority ethnic star inventor 0320 0325
(0192) (0191)
Average patenting pre-1993 0199 0199 0202 0202
(0076) (0076) (0076) (0076)
Dummy inventor patents pre-1993 0113 0113 0113 0113
(0044) (0044) (0044) (0044)
Constant 0170 0169 0169 0168
(0004) (0004) (0004) (0004)
Observations 70007 70007 70007 70007
R2 0253 0253 0253 0253
Source KITES-PATSTATONS
Notes Robust standard errors in parentheses bootstrapped 50 repetitions
Significant at 10 5 and 1
Minority ethnic inventors diversity and innovation 153
at London School of E
conomics and Political Science on July 23 2015
httpjoegoxfordjournalsorgD
ownloaded from
externalities at the inventor group level At the extreme lsquominority ethnicrsquo patents mightwholly explain increases in area-level patent counts Conversely there might bemultiplier effects from minority ethnic inventors to majority group inventors leading tocrowd-in (Hunt and Gauthier-Loiselle 2010)
To explore I draw on work by Card (2010) and Faggio and Overman (2014) I definelsquominorityrsquo patents as those with at least one minority ethnic inventor all other patentsare lsquomajorityrsquo patents I assemble a panel of TTWA-level weighted patent counts for1993ndash2004 and regress the percentage change in majority patents on that in minoritypatents with both expressed as a share of all patenting in the base year Specifically forTTWA j I estimate
ethethMPj 04 MPj 93THORN=TPj 93THORN frac14 athorn bethethEPj 04 EPj 93THORN=TPj 93THORN thorn CTRLScjtbase thorn ej eth78THORN
Table 12 Second stage regressions co-ethnic groups
Inventor fixed effects (estimated) (1) (2)
Inventor South Asian origin 0314 0310
(0021) (0020)
Star South Asian 0219
(0277)
Inventor Central Europe origin 0112 0117
(0019) (0021)
Star Central European 0256
(0485)
Inventor East Asian origin 0142 0157
(0027) (0025)
Star East Asian 1053
(0576)
Inventor Southern Europe origin 0175 0183
(0030) (0030)
Star Southern European 0359
(0408)
Inventor Eastern Europe origin 0112 0127
(0029) (0029)
Star Eastern European 0559
(0575)
Inventor rest of world origin 0289 0298
(0027) (0025)
Star Rest of world 0380
(0546)
Inventor patents at least 5 times (star) 3695 3663
(0060) (0061)
Controls Y Y
Observations 70007 70007
R2 0254 0254
Source KITES-PATSTATONS
Notes Constant not shown Controls as in Table 10 plus multiple inventor dummy All models use
bootstrapped standard errors 50 repetitions
Significant at 10 5 and 1
154 Nathan
at London School of E
conomics and Political Science on July 23 2015
httpjoegoxfordjournalsorgD
ownloaded from
where MP refers to majority patents EP refers to minority ethnic patents and CTRLS
is a vector of area-level controls for the base period 1993 including the previous stockof weighted patents The coefficient b expresses the relationship between majority andminority patenting If b is 0 a 1-unit change in minority patenting has no consequencesfor majority patenting simply adding 1 to total patenting Estimates above 0 indicatemultiplier effects of size b resulting in a more-than-proportionate increases in totalpatenting Conversely estimates below 0 indicate crowding-out
Results are given in Appendix C Table C8 It is important to emphasize that theseshould be interpreted as partial correlations not as causal links Unobserved factorssuch as area-level shocks may influence both sides of the equationmdashand running theregression in reverse also indicates some connections from majority to minority patentsIn fully specified form results from Equation (78) give b at around 19 significant at1 This suggests that each additional minority patent is linked to just almost twoadditional majority patents implying a multiplier lsquoeffectrsquo However the confidentialinterval is between 092 and 222 so the connection is not observed with muchprecision and omitted variables are also likely to be in play Coefficients should thus beinterpreted with caution21
8 Conclusions
In recent years there has been growing interest in the links between minority ethniccommunities diversity and innovation The contribution of minority ethnic inventors andlsquoethnic entrepreneursrsquo to US innovation is substantial suggesting that Europeancountriesrsquo innovation systems could also benefit from these groupsrsquo presence and activity
This article looks at the role of minority ethnic inventors on innovative activity in theUK using a new 12-year panel of patents microdata and a powerful name-classificationsystem I uncover some distinctive features of the UK inventor community and exploredifferent potential lsquoethnicityndashinnovationrsquo channelsmdashindividual selection externalitiesfrom diasporic groups and from the cultural diversity of inventor communities as well aslsquoamplifyingrsquo roles of urban environments The research is one of very few studies toexplore these links and as far as I am aware is the first of its kind outside the USA
The descriptive analysis suggests that the UKrsquos minority ethnic inventor communityhas a few important commonalities with the USAmdashwith large South and East Asian-origin groups plus groups of multiple and star inventors who patent significantly morethan majority counterparts Minority inventors patent most often in semi-conductorsIT pharmaceutical and agriculturefood fields these modal shares are somewhat higherthan majority inventorsrsquo I also find differences UK inventor demographics reflectproximity to Continental Europe colonial history and recent immigration trendsMinority ethnic inventors are spatially clustered as in the USA but seem to follow adifferent distribution from wider minority populations Not all high-patenting regionshave diverse inventor communities
Regressions find a small positive effect of inventor group diversity on individualpatenting activity which is not driven by inventor mobility or the crowding-out ofmajority inventors (rather I find suggestive evidence of crowding-in from minority tomajority patenting) This suggests that learning externalities exist for diverse inventor
21 I experiment with lags of minority ethnic patents as an instrument but none pass first-stage tests
Minority ethnic inventors diversity and innovation 155
at London School of E
conomics and Political Science on July 23 2015
httpjoegoxfordjournalsorgD
ownloaded from
groups over and above simple sizeco-location effects Tests also suggest an amplifying
role of urban location but this dies away in the densest environments where minority
inventors are less clustered than the wider populationDo inventor characteristics such as human capital or co-ethnic group membership
help explain the diversity result Some tentative positive associations emerge for
minority ethnic and East Asian-origin stars especially those of Chinese ethnicity (the
latter both relatively large groups in the UK inventor community) This suggests the
existence of network externalities within (some) diasporic groups which may operate as
a complement to the across-group effect I speculate that stars might also generate
substantive knowledge spillovers as well as having a motivating effect on those around
them minority stars patent significantly more than their majority counterparts
Certainly larger shares of star inventors in an area increase the diversity effect
suggesting that these channels operate as complementsOverall the results suggest that minority ethnic inventors are a net positive for
patenting in the UK and imply that policymakers should aim to increase both the skills
and the mix of the countryrsquos research communities They also highlight some distinctive
features of the UK innovation system In the USA minority ethnic inventor
communities have been historically shaped by Cold War science which attracted very
large numbers of skilled workers into a small number of high-tech locations (Saxenian
2006) By contrast until recently lsquocallsrsquo for migrant workers in the UK have focused on
less skilled occupations and on Commonwealth countries especially in Africa and
SouthEast Asia (Somerville 2007) Results may also reflect culturally distinctive US
attitudes to entrepreneurship as evidenced by sociological studies of Jewish and Afro-
Caribbean migrant communities in New York and London (Gordon et al 2007) and
by the complex interplay between class skills resources and attitudes that influence
real-world entrepreneurial behaviour (Clark and Drinkwater 2010) The rigidities of
some European labour markets could also explain UK inventor demographics as
young researchers seek new opportunities in more open environments22
There are two important caveats to the results First diversity and diaspora effects
are relatively smallmdashhuman capital and technology effects are more important
determinants of inventorsrsquo productivity This is intuitive and echoes much of the
existing literature Second working with inventor data presents a number of
measurement challenges most seriously my data only allow a fuzzy identification of
ethnic inventors and diasporic groupsThis leaves a number of areas for future research We need to better understand what
is driving these resultsmdashnot least the scale(s) at which the diversity effect is operating
(teams departments communities of interest) Understanding the quality and influence
of minority patenting (for example through citations data) is also a priority Better
individual-level data would allow the identification of migrants as well as revealing
other salient characteristics (such as age gender qualifications experience) linking
inventor information to academic or professional curricula vitae (CVs) would be one
way to achieve this Research could also explore the detailed roles of minority inventors
in the technology fields where they are most active and in specific locations where they
are clustered Finally the analysis should be extended to other European countries
22 Thanks to a referee for this last point
156 Nathan
at London School of E
conomics and Political Science on July 23 2015
httpjoegoxfordjournalsorgD
ownloaded from
Acknowledgements
Thanks to Gianluca Tarasconi and Francesco Lissoni at Universita BocconiAPE-INV forKITES-PATSTAT patent data to Pablo Mateos at UCL for ONOMAP coding and to the ONSSecure Data Service for LFS datasets Thanks for advice and support to Alex Bryson MariaCarvalho Riccardo Crescenzi Giulia Faggio Ben Gidley Ian Gordon Simona Iammarino BillKerr Carlo Menon Henry Overman Rebecca Riley Rosa Sanchis-Guarner Carlos Vargas-Silva and Vivek Wadhwa Seminar participants at IZA EUROLIO COMPAS SERC theUrban Economics Association and the Regional Studies Association all provided helpfulcomments on previous versions as did three anonymous referees This work includes analysisbased on data from the Labour Force Survey produced by the Office for National Statistics(ONS) and supplied by the Secure Data Service at the UK Data Archive The data are Crowncopyright and reproduced with the permission of the controller of HMSO and Queenrsquos Printer forScotland The use of the ONS statistical data in this work does not imply the endorsement of theONS or the Secure Data Service at the UK Data Archive in relation to the interpretation oranalysis of the data This work uses research datasets that may not exactly reproduce NationalStatistics aggregates All the outputs have been granted final clearance by the staff of the SDS-UKDA I am grateful to the ESRC and the Department of Communities and Local Governmentfor research support The views in this paper are my own and do not necessarily represent thoseof the Department or the ESRC Any remaining errors and omissions are my own
Funding
This paper draws on PHD research funded by the UK Economic and Social Research Council(ESRC) and the Department of Communities and Local Government (DCLG) I am grateful tothe ESRC and the DCLG for this support The views in this paper are my own and do notnecessarily represent those of the Department or the ESRC
References
Abramovsky L Griffith R Macartney G Miller H (2008) The Location of InnovativeActivity in Europe IFS Working Papers WP0810 London Institute for Fiscal Studies
Agrawal A Cockburn I McHale J (2006) Gone but not forgotten knowledge flows labormobility and enduring social relationships Journal of Economic Geography 6 571ndash591
Agrawal A Kapur D McHale J (2008) How do spatial and social proximity influenceknowledge flows Evidence from patent data Journal of Urban Economics 64 258ndash269
Alesina A Ferrara E L (2005) Ethnic diversity and economic performance Journal ofEconomic Literature 43 762ndash800
Angrist J Pischke J-S (2009) Mostly Harmless Econometrics Princeton Princeton UniversityPress
Aspinall P (2009) The future of ethnicity classifications Journal of Ethnic and Migration Studies35 1417ndash1435
Audretsch D Feldman M (1996) RampD spillovers and the geography of innovation andproduction American Economic Review 86 630ndash640
Berliant M Fujita M (2008) Knowledge creation as a square dance on the Hilbert cubeInternational Economic Review 49 1251ndash1295
Berliant M Fujita M (2009) Dynamics of knowledge creation and transfer the two personcase International Journal of Economic Theory 5 155ndash179
Blundell R Griffith R Van Reenen J (1995) Dynamic count data models of technologicalinnovation The Economic Journal 105 333ndash344
Borjas G (1987) Self-selection and the earnings of immigrants American Economic Review 77531ndash553
Borjas G (1994) The economics of immigration Journal of Economic Literature 32 1667ndash1717Borjas G Doran K (2012) The collapse of the Soviet Union and the productivity of Americanmathematicians Quarterly Journal of Economics 127 1143ndash1203
Minority ethnic inventors diversity and innovation 157
at London School of E
conomics and Political Science on July 23 2015
httpjoegoxfordjournalsorgD
ownloaded from
Brinkley I (2008) The Knowledge Economy How Knowledge Is Reshaping the Economic Life ofNations London The Work Foundation
Caldwell C (2009) Reflections on the Revolution in Europe Immigration Islam and the WestLondon Allen Lane
Card D (2010) How immigration affects US cities In R P Inman (ed) Making Cities WorkProspects and Policies for Urban America pp 158ndash200 Princeton Princeton University Press
Chellaraj G Maskus K Mattoo A (2008) The contribution of international graduate studentsto US innovation Review of International Economics 16 444ndash462
Clark K Drinkwater S (2010) Recent trends in minority ethnic entrepreneurship in BritainInternational Small Business Journal 28 136ndash146
Combes P-P Duranton G Gobillon L (2008) Spatial wage disparities sorting mattersJournal of Urban Economics 63 723ndash742
Docquier F Rapoport H (2012) Globalization brain drain and development Journal ofEconomic Literature 50 681ndash730
Duleep H O Jaeger D Regets M (2012) How Immigration May Affect US NativeEntrepreneurship Theoretical Building Blocks and Preliminary Results IZA Discussion Paper6677 Bonn IZA
Easterley W Levine R (1997) Africarsquos growth tragedy policies and ethnic divisions QuarterlyJournal of Economics 112 1203ndash1250
Fagerberg J (2005) Innovation a guide to the literature In J Fagerberg D Mowery R Nelson(eds) The Oxford Handbook of Innovation pp 1ndash27 Oxford OUP
Faggio G Overman H (2014) The effect of public sector employment on local labour marketsJournal of Urban Economics 79 91ndash107
Foley C F Kerr W R (2013) Ethnic innovation and US multinational firm activityManagement Science 59 1529ndash1544
Freeman C (1987) Technology Policy and Economic Policy Lessons from Japan London PinterFujita M Weber S (2003) Strategic Immigration Policies and Welfare in HeterogenousCountries Institute of Economic Research Working Papers Kyoto Kyoto University
Gagliardi L (2011) Does Skilled Migration Foster Innovative Performance Evidence from BritishLocal Areas SERC Discussion Paper DP0097 London SERC
Gibbons S Overman H G Resende G (2011) Real Earnings Disparities in Britain SERCDiscussion Paper DP0065 London SERC
Gordon I Whitehead C Travers T (2007) The Impact of Recent Immigration on the LondonEconomy London City of London Corporation
Hall B Jaffe A Trajtenberg M (2001) The NBER Patent Citations Data File LessonsInsights and Methodological Tools Cambridge MA NBER
Hanks P Tucker D K (2000) A diagnostic database of American personal names Names AJournal of Onomastics 48 59ndash69
Hanson G H (2012) Immigration productivity and competitiveness in American industryPaper Presented at American Enterprise Institute Conference Competing for Talent The UnitedStates and High-Skilled Immigration Washington DC 31 January
Hausman J A Hall B H Griliches Z (1984) Econometric models for count data with anapplication to the patents-RampD relationship Econometrica 52 909ndash938
Heckman J (1981) The incidental parameters problem and the problem of initial condition inestimating a discrete time-discrete data stochastic process In C F Manski D L McFadden(eds) Structural Analysis of Discrete Data and Econometric Applications pp 179ndash197Cambridge MA MIT Press
Hong L Page S (2001) Problem solving by heterogeneous agents Journal of Economic Theory97 123ndash163
Hong L Page S (2004) Groups of diverse problem solvers can outperform groups of high-ability problem solvers Proceedings of the National Academy of Sciences of the United States ofAmerica 101 16385ndash16389
Hoogendoorn S Oosterbeek H van Praag M (2013) The impact of gender diversity on theperformance of business teams evidence from a field experiment Management Science 591514ndash1528
Hunt J (2011) Which immigrants are most innovative and entrepreneurial Distinctions by entryvisa Journal of Labor Economics 29 417ndash457
158 Nathan
at London School of E
conomics and Political Science on July 23 2015
httpjoegoxfordjournalsorgD
ownloaded from
Hunt J Gauthier-Loiselle M (2010) How much does immigration boost innovation AmericanEconomic Journal Macroeconomics 2 31ndash56
Jacobs J (1969) The Economy of Cities London VintageJaffe A B Trajtenberg M Henderson R (1993) Geographic localization of know-ledge spillovers as evidenced by patent citations The Quarterly Journal of Economics 108577ndash598
Javorcik B S Ozden C Spatareanu M Neagu C (2011) Migrant networks and foreigndirect investment Journal of Development Economics 94 231ndash241
Kaiser U Kongsted H C Roslashnde T (2011) Labor Mobility Social Network Effects andInnovative Activity IZA Discussion Paper 5654 Bonn IZA
Kapur D McHale J (2005) Sojourns and software internationally mobile human capital andhigh tech industry development in India Ireland and Israel In A Arora A Gambardella (eds)From Underdogs to Tigers The Rise and Growth of the Software Industry in Brazil China IndiaIreland and Israel pp 236ndash274 Oxford OUP
Kerr W (2008a) Ethnic scientific communities and international technology diffusion Review ofEconomics and Statistics 90 518ndash537
Kerr W (2008b) The Agglomeration of US Ethnic Inventors HBS Working Paper 09-003Boston MA Harvard Business School
Kerr W (2009) Breakthrough Innovations and Migrating Clusters of Innovation NBER WorkingPaper 15443 Cambridge MA NBER
Kerr W (2010a) The agglomeration of US ethnic inventors In E Glaeser (ed) AgglomerationEconomics pp 237ndash276 Chicago University of Chicago Press
Kerr W Lincoln W (2010) The Supply Side of Innovation H-1b Visa Reforms and US EthnicInvention NBER Working Paper 15768 Cambridge MA NBER
Kerr W R (2010b) Breakthrough inventions and migrating clusters of innovation Journal ofUrban Economics 67 46ndash60
Kugler M Rapoport H (2007) International labor and capital flows complements orsubstitutes Economics Letters 94 155ndash162
Lakha F Gorman D Mateos P (2011) Name analysis to classify populations by ethnicity inpublic health validation of Onomap in Scotland Public Health 125 688ndash696
Leadbeater C (2008) The Difference Dividend Why Immigration is Vital to Innovation NESTAProvocation London NESTA
Legrain P (2006) Immigrants Your Country Needs Them London Little BrownLi X Pai Y (2010) The changing geography of innovation activities what do patent indicatorsimply In X Fu L Soete (eds) The Rise of Technological Power in the South pp 69ndash88Basingstoke Palgrave MacMillan
Lissoni F Tarasconi G Sanditov B (2006) The KEINS Database on Academic InventorsMethodology and Contents CESPRI Working Paper 181 Milan Universitarsquo Bocconi
Malchow-Moslashller N Munch J R Skaksen J R (2011) Do Foreign Experts Increase theProductivity of Domestic Firms IZA Discussion Paper 6001 Bonn IZA
Mare D C Fabling R (2011) Productivity and Local Workforce Composition Motu WorkingPaper 11-10 Wellington NZ Motu Economic and Public Policy Research
Mare D C Fabling R Stillman S (2011) Immigration and Innovation IZA Discussion Paper5686 Bonn IZA
Mateos P (2007) A review of name-based ethnicity classification methods and their potential inpopulation studies Population Space and Place 13 243ndash263
Mateos P Longley P OrsquoSullivan D (2011) Ethnicity and population structure in personalnaming networks PLoS One 6 e22943
Mateos P Webber R Longley P (2007) The Cultural Ethnic and Linguistic Classificationof Populations and Neighbourhoods Using Personal Names CASA Working PaperLondon UCL
McCann P Ortega-Arguiles R (2013) Modern regional innovation policy Cambridge Journalof Regions Economy and Society 6 187ndash216
Menon C (2009) Stars and Comets An Exploration of the Patent Universe SERC DP0037London LSE
Nathan M Lee N (2013) Cultural diversity innovation and entrepreneurship firm-levelevidence from London Economic Geography 89 367ndash394
Minority ethnic inventors diversity and innovation 159
at London School of E
conomics and Political Science on July 23 2015
httpjoegoxfordjournalsorgD
ownloaded from
Niebuhr A (2010) Migration and innovation does cultural diversity matter for regional RampDactivity Papers in Regional Science 89 563ndash585
Oaxaca R L Geisler I (2003) Fixed effects models with time invariant variables a theoreticalnote Economics Letters 80 373ndash377
OECD (2009) OECD Patent Statistics Manual Paris OECDOffice of National Statistics (2012) Ethnicity and National Identity in England and Wales 2011Newport ONS
Office of National Statistics (2013) Labour Force Survey 1993ndash2011 SN 6727 Secure DataService Access [computer file] Colchester UK Data Archive
Ostergaard C R Timmermans B Kristinsson K (2011) Does a different view createsomething new The effect of employee diversity on innovation Research Policy 40 500ndash509
Ottaviano G Bellini E Maglietta A (2007) Diversity and the Creative Capacity of Cities andRegions SUSDIV Paper 22007 Bologna FEEM
Ottaviano G Peri G (2005) Cities and cultures Journal of Urban Economics 58 304ndash337Ottaviano G Peri G (2006) The economic value of cultural diversity evidence from US citiesJournal of Economic Geography 6 9ndash44
Ozgen C Nijkamp P Poot J (2011) The Impact of Cultural Diversity on Innovation Evidencefrom Dutch Firm-Level Data IZA Discussion Paper 6000 Bonn IZA
Ozgen C Nijkamp P Poot J (2012) Immigration and innovation in European regionsIn P Nijkamp J Poot M Sahin (eds) Migration Impact Assessment New HorizonsCheltenham Edward Elgar
Page S (2007) The Difference How the Power of Diversity Creates Better Groups Firms Schoolsand Societies Princeton Princeton University Press
Parrotta P Pozzoli D Pytlikova M (2013) The nexus between labor diversity and firmrsquosinnovation Journal of Population Economics 27 303ndash364
Peri G (2007) Higher education innovation and growth In G Brunello P Garibaldi E Wasmer(eds) Education and Training in Europe pp 56ndash70 Oxford Oxford University Press
Petersen J Longley P Gibin M Mateos P Atkinson P (2011) Names-based classificationof accident and emergency department users Health amp Place 17 1162ndash1169
Putnam R (2007) E pluribus unum diversity and community in the twenty-first centuryScandinavian Political Studies 30 137ndash174
Rauch J E Casella A (2003) Overcoming informational barriers to international resourceallocation prices and ties The Economic Journal 113 21ndash42
Rauch J E Trindade V (2002) Ethnic Chinese networks in international trade Review ofEconomics and Statistics 84 116ndash130
Robson B Barr R Lymperopoulou K Rees J Coombes M (2006) A Framework for City-Regions Working Paper 1 Mapping City-Regions London Office of the Deputy PrimeMinister
Rodrıguez-Pose A Storper M (2006) Better rules or stronger communities On the socialfoundations of institutional change and its economic effects Economic Geography 82 1ndash25
Romer P (1990) Endogenous technological change Journal of Political Economy 98 71ndash102Saxenian A (2006) The New Argonauts Regional Advantage in a Global Economy CambridgeMA Harvard University Press
Saxenian A Sabel C (2008) Venture capital in the lsquoperipheryrsquo the new argonauts global searchand local institution-building Economic Geography 84 379ndash394
Schumpeter J (1962) The Theory of Economic Development Berlin SpringerSimmie J Carpenter J Chadwick A Martin R (2008)History Matters Path Dependence andInnovation in British City-Regions London NESTA
Somerville W (2007) Immigration under New Labour Bristol Policy PressStephan P Levin S (2001) Exceptional contributions to US science by the foreign-born andforeign-educated Population Research and Policy Review 20 59ndash79
Stuen E T Mobarak A M Maskus K E (2012) Skilled immigration and innovation evidencefrom enrolment fluctuations in US doctoral programmes The Economic Journal 122 1143ndash1176
Syrett S Sepulveda L (2011) Realising the diversity dividend population diversity and urbaneconomic development Environment and Planning A 43 487ndash504
Trajtenberg M Schiff G Melamed R (2006) The lsquoNames Gamersquo Harnessing Inventorsrsquo PatentData for Economic Research NBER Working Papers 12479 Cambridge MA NBER
160 Nathan
at London School of E
conomics and Political Science on July 23 2015
httpjoegoxfordjournalsorgD
ownloaded from
Trax M Brunow S Suedekum J (2012) Cultural Diversity and Plant-Level Productivity IZADiscussion Paper 6845 Bonn IZA
Wadhwa V (2012) The Immigrant Exodus Why America Is Losing the Global Race to CaptureEntrepreneurial Talent Philadelphia Wharton
Wadhwa V Saxenian A Rissing B Gereffi G (2007) Americarsquos New ImmigrantEntrepreneurs Durham NC Duke UniversityiSchool UC Berkeley
Wadhwa V Saxenian A Rissing B A Gereffi G (2008) Skilled immigration and economicgrowth Applied Research in Economic Development 5 6ndash14
Zenou Y (2009) Urban Labor Economics Cambridge Cambridge University PressZenou Y (2011) Spatial versus Social Mismatch The Strength of Weak Ties IZA DiscussionPapers 5507 Bonn Institute for the Study of Labor (IZA)
Zucker L G Darby M R (2007) Star Scientists Innovation and Regional and NationalImmigration National Bureau of Economic Research Working Paper 13547 Cambridge MANBER
Appendix
A The KITES-PATSTAT database
Raw patent data cannot typically be used at inventor level because of commonmisspelled names changes of address or duplication (Trajtenberg et al 2006) Thedataset of inventors used in this article is taken from the KITES-PATSTAT databasedeveloped by the KITES centre at Bocconi University under the APE-INV initiative23
The original patents data come from the EPO PATSTAT system and are cleaned bythe KITES team to allow robust identification of individual inventors
The KITES cleaning procedure has three stages (Lissoni et al 2006) First inventorname and address fields are cleaned and standardized and a unique CODINV code isapplied to all inventors with the same names surnames and address Second lsquosimilarityscoresrsquo are assigned for pairs of inventors with the same name and surname but differentaddresses Scores are higher for pairs whose dyads are located in the same cityprovinceregion who patent in the same technological fields (this is measured separately at 4- 6-10- and 12-digit level with corresponding weights) who share the same applicantorganization who share co-inventors or who are in lsquosmall worldrsquo networks with thirdparties andwho cite each other Scores are lower for pairs whose dyads patent 20 ormoreyears apart or who share common surnames (assessed by name frequency analysis foreach country) Third a threshold for similarity scores is generated for each country overwhich inventor pairs are considered the same person and given the same identifier
This cleaning procedure deals with the lsquowho is whorsquo problem and indirectly allowsme to identify moving inventorsmdashthe lsquowho is wherersquo problemmdashmuch more preciselythan some previous studies such as Agrawal et al (2006) Comparing the original andcleaned CODINV codes allows me to see cases where inventors with different addresseshave been subsequently coded as the same individual but at different addresses I definethese as cases of moving inventors This group turns out to comprise 1781 individuals(245 of my sample) Within this group I also identify a set of smaller inventors whoappear in two different TTWAs in same yeargroup This is a group of 963 individuals(133 of my sample)
23 See httpdbkitesunibocconiit
Minority ethnic inventors diversity and innovation 161
at London School of E
conomics and Political Science on July 23 2015
httpjoegoxfordjournalsorgD
ownloaded from
B ONOMAP and minority ethnic inventors
lsquoEthnicityrsquo is not straightforward to frame or measure (see main text) The lsquogold standardrsquoscenario is when there is a rich and flexible typology and where individuals can self-ascribe for example in a Census (Aspinall 2009) In many cases such as health or patentsdata this is not available and name-based approaches have emerged as a powerfulalternative (see Mateos (2007) for a review of this literature) The intuition behind name-based approaches is that naming relates to cultural ethnic linguistic features ofindividuals families and communities Mateos et al (2011) point out that lsquonamingpractices are far from random instead reflecting social norms and cultural customs Theyexist in all human groups and follow distinct geographical and ethno-culturalpatterns distinctive naming practices in cultural and ethnic groups are persistent evenlong after immigration to different social contextsrsquo (p e22943) Working with a databaseof 18 million names from over 17 countries the authors show the persistence of namingnetworks in migrant and minority communities in lsquohostrsquo and new lsquohomersquo environments(Mateos et al 2011) Note that this last feature of lsquonaming networksrsquo makes name-basedsystems suitable for identifying minority ethnic inventors in particular
B1 The ONOMAP system
One of the limitations in early name-based classification systems was a restricted numberof names (Mateos 2007) The ONOMAP system built at University College Londonhas designed to deal with this problem24 ONOMAP uses a reference population of500000 forenames and a million surnames derived from electoral register or telephonedirectory name frequency data for 28 countries Names are then classified into groupsexploiting name-network clustering between surname and forename pairings Techniquesused include forenamendashsurname triage spatio-temporal analysis geo-demographicanalysis text mining lsquoname-to-ethnicityrsquo analysis from population registers internationalname frequency and genealogy resources and individual name research for hard cases(see Mateos et al (2007) for details) The final classification comprises 185 lsquoculturalndashethnicndashlinguisticrsquo (CEL) groups building on frameworks developed by Hanks and Tucker(2000) At its finest level this gives 185 CEL lsquotypesrsquo given the frequency distribution ofthese types in the inventor data inventors were eventually classified at a higher levelbased on 68 CEL lsquosubgroupsrsquo ONOMAP also provides detail on CEL componentcriteria including 12 geographical origin groups and nine lsquomacro-ethnicrsquo groups thatderive from the UK Office of National Statistics 1991 Census classification
ONOMAP is used to classify inventor names via an algorithm that uses surnameforename and surnamendashforename combinations In most cases both elements of apersonrsquos name share the same CEL type in other cases there will be multiple possibilities(such as the authorrsquos own name) in which case the system assigns the most likely typebased on the underlying name networks in the reference population In a few cases namesare unclassified (in the case of the KITES-PATSTAT dataset this is under 1 ofinventors) ONOMAP has also been extensively tested with individual-level datasetswhere ethnicity is known Petersen et al (2011) analyse over 107000 patients for aLondon hospital ONOMAP matches over 95 of names Lakha et al (2011) test birthregistration pupil census and health data for 260748 individuals ONOMAP matches
24 See httpwwwonomaporg
162 Nathan
at London School of E
conomics and Political Science on July 23 2015
httpjoegoxfordjournalsorgD
ownloaded from
over 99 of names and gives55 measurement error For this article I also subjectONOMAP to a falsification test where ethnicity is assigned at random In both casesONOMAP performs better than random assignment (see Section 7)
B2 Potential limitations of ONOMAP
There are two potential limitations of ONOMAP relevant to research on inventordemographics First the system is unable to distinguish migrants from second-plusgeneration communities This article thus focuses on the larger group of minority ethnicinventors A second limitation stems from international languages such as Spanish andEnglish where similar names may be found across several communities and countriesThis could be a source of measurement error In practice ONOMAP explicitly modelsSpanish Mexican Filipino Latin American and other Spanish-language names it alsodistinguishes English mainland Cornwall and Channel Islands Scottish and WelshBlack Caribbean American and British British South African American Indian andlsquoAmerican Otherrsquo groups Australasian names are not separately classified but in the2011 Census Australasians make up just 24 of the wider migrant population inEngland and Wales (versus 33 from NorthSouth America and 363 fromContinental Europe) This suggests any remaining misclassification is residual noiserather than a structural problem in the data
C Additional results
Table C1 First stage estimator tests individual patent counts and inventor group diversity
Geo origin zones ONS ethnic groups
(1) (2) (3) (1) (2) (3)
Negative binomial
Frac Index of inventors 0075 0221 0248 0111 0312 0337
(0100) (0020) (0023) (0165) (0011) (0014)
Individual fixed effect N Y Y N Y Y
Controls N N Y N N Y
Log-likelihood 206721358 91887733 91829454 206723863 91913822 91861933
OLS
Frac Index of inventors 0089 0644 0623 0122 0814 0758
(0115) (0272) (0282) (0181) (0424) (0423)
Individual fixed effects N Y Y N Y Y
Controls N N Y N N Y
F-statistic 68238 89492 49994 69024 46575 46575
R2 0012 0018 0018 0012 0018 0018
Source KITES-PATSTATONS
Notes 210008 observations Negative binomial coefficients are marginal effects on the mean In each panel
column (1) uses yeargroup dummies columns (2) and (3) use technology fieldyeargroup dummies and
individual fixed effects Column (3) controls include Fractional Index of TTWA population STEM degree
holders in TTWA log of TTWA population density high-tech manufacturing in TTWA medium-tech
manufacturing in TTWA workers in entry-level occupations log of area weighted patent stock 1981ndash1984
urban TTWA dummy Bootstrapped standard errors are in parentheses and are clustered on TTWAs
Significant at 10 5 and 1
Minority ethnic inventors diversity and innovation 163
at London School of E
conomics and Political Science on July 23 2015
httpjoegoxfordjournalsorgD
ownloaded from
Table C2 First stage regressions choice of time period test reduced form model
Individual patent counts (1) (2) (3) (4)
Frac Index of inventors by geographical origin 0623 0644 0237 0022
(0282) (0048) (0019) (0022)
Controls Y Y Y Y
Observations 210008 210008 587805 293266
R2 0018 0018 0038 0016
Source KITES-PATSTATONS
Notes Model is estimated in OLS Column (1) fits the full regression Columns (2)ndash(4) fit reduced form
model with individualarea fixed effects and technology-fieldyear fixed effects as detailed controls are not
available pre-1993 Column (2) fits inventors active 1993ndash2004 column (3) fits inventors active 1981ndash2004
column (4) fits inventors active 1981ndash1992 only Standard errors are in parentheses are heteroskedasticity
and autocorrelation-robust and clustered on TTWAs
Significant at 10 5 and 1
Table C3 First stage regressions sample construction test reduced form model
Individual patent counts (1) (2) (3)
All Multiple Blanks
Frac Index of inventors by geographical origin 0623 0210 0210
(0282) (0185) (0185)
Controls Y Y Y
Observations 210008 19118 19118
R2 0018 0004 0004
Source KITES-PATSTATONS
Notes Model is estimated in OLS Columns (1) and (2) use a sample where inventorareatime cells are
marked as zero when inventors are not patenting column (2) restricts this sample to inventors who patent
more than once Column (3) uses a sample of multiple inventors where non-active cells are marked as
missing rather than zero All models use technology fieldyeargroup dummies and individual fixed effects
Controls as per Table C1 Standard errors are in parentheses are heteroskedasticity and autocorrelation-
robust and clustered on TTWAs
Significant at 10 5 and 1
164 Nathan
at London School of E
conomics and Political Science on July 23 2015
httpjoegoxfordjournalsorgD
ownloaded from
Table C4 Area-level alternative specification for the first stage model
Aggregate patent counts OLS Poisson
Unweighted Weighted Unweighted Weighted
Frac Index of inventors (geo origin) 335481 124173 88630 38920
(158083) (63563) (39646) (20364)
Controls Y Y Y Y
Observations 532 532 532 532
Log-likelihood 3269429 2712868 3485019 2173729
R2 0936 0952
Source KITES-PATSTATONS
Notes Dependent variables are various unweighted and weighted area-level patent counts Poisson
coefficients are marginal effects at the mean All models use technology fieldyeargroup dummies and area
(TTWA) fixed effects Controls as per Table C1 Standard errors are in parentheses are heteroskedasticity
and autocorrelation-robust and clustered on TTWAs
Significant at 10 5 and 1
Table C5 Moving inventors test reassigning primary location for moving inventors
Individual patent counts Location 1 Location 2
Frac Index of inventors by geographical origin 0248 0262
(0023) (0015)
Controls Y Y
Observations 210008 210008
Log-likelihood 91829454 91772246
Source KITES-PATSTATONS
Notes All models use technology fieldyeargroup dummies and individual fixed effects Controls as per
Table C1 Bootstrapped standard errors in parentheses Coefficients are marginal effects at the mean
Significant at 10 5 and 1
Minority ethnic inventors diversity and innovation 165
at London School of E
conomics and Political Science on July 23 2015
httpjoegoxfordjournalsorgD
ownloaded from
Table C6 Second stage regressions robustness tests on fixed effects decomposition
Estimated individual fixed effect (1) (2) (3) (4) (5) (6)
Minority ethnic inventor 0199 0194 0196 0200 0198
(0011) (0011) (0010) (0010) (0010)
Moving inventor same yeargroup 0512
(0036)
Moving inventor 0044
(0025)
Inventor patents in 1 technology field 0213
(0015)
Fake minority ethnic 0016
(0010)
Controls Y Y Y Y Y Y
Observations 70007 70007 70007 70007 70007 70007
R2 0253 0343 0256 0253 0256 0249
Source KITES-PATSTATONS
Notes Column (1) fits the main regression as per Table 10 in the article Column (2) uses an FGLS
estimator instead of bootstrapped OLS Columns (3) and (4) introduce additional controls for moving
inventors Column (5) includes a control for lsquogeneralistsrsquo (patenting across at least one technology fields)
Column (6) uses lsquofakersquo (randomly assigned) minority ethnic status For all models controls include multiple
inventor dummy star dummy inventor average patent count pre-1993 and dummy for inventor activity
pre-1993 All models use robust standard errors bootstrapped 50 repetitions Constant not shown
Significant at 10 5 and 1
166 Nathan
at London School of E
conomics and Political Science on July 23 2015
httpjoegoxfordjournalsorgD
ownloaded from
Table C7 Second stage regressions falsification test
Estimated individual fixed effect (1) (2)
Inventor Central European origin 0112
(0019)
Inventor East Asian origin 0142
(0027)
Inventor East European origin 0112
(0029)
Inventor rest of world origin 0289
(0027)
Inventor South Asian origin 0314
(0021)
Inventor South European origin 0175
(0030)
Fake origin group 2 dummy 0047
(0020)
Fake origin group 3 dummy 0022
(0022)
Fake origin group 4 dummy 0017
(0023)
Fake origin group 5 dummy 0021
(0022)
Fake origin group 6 dummy 0022
(0030)
Fake origin group 7 dummy 0016
(0026)
Controls Y Y
Observations 70007 70007
R2 0254 0249
Source KITES-PATSTATONS
Notes Column (1) fits the main regression column (2) fits randomly assigned categories Controls as in
Table C6 All models use robust standard errors bootstrapped 50 repetitions
Significant at 10 5 and 1
Minority ethnic inventors diversity and innovation 167
at London School of E
conomics and Political Science on July 23 2015
httpjoegoxfordjournalsorgD
ownloaded from
Table C8 Distributional analysis Resource crowd-out-in
Change in majority weighted patents
1993ndash2004
(1) (2) (3) (4) (5)
Change in minority ethnic weighted
patents 1993ndash2004
1645 1576 1907 1988 1908
(0341) (0330) (0104) (0073) (0088)
TTWA population Frac Index 1993 0943 1046 1431 1085
(1594) (1761) (1621) (1396)
TTWA share of STEM graduates 1993 4492 2398 4295 2057
(3951) (3021) (3090) (2993)
TTWA high-tech manufacturing 1993 4203 7638 5771 0037
(4202) (4735) (4660) (3842)
TTWA medium-tech manufacturing 1993 4475 3114 3927 1041
(4009) (4301) (3991) (3422)
Log(TTWA population density 1993) 0204 0041 0128 0112
(0170) (0130) (0108) (0099)
Urban TTWA 0070 0466 0163 0494
(0226) (0211) (0228) (0194)
Log(area patent stocks 1989ndash1992) 0327
(0104)
Log(area patent stocks 1981ndash1984) 0026
(0077)
OST30 technology field dummies N N Y Y Y
Observations 203 203 201 196 176
R2 0391 0427 0712 0768 0798
Source KITES-PATSTATONS
Notes Column (1) fits the variable of interest column (2) adds controls column (3) adds technology field
dummies Constant not shown Heteroskedasticity and autocorrelation-robust standards errors are
clustered on TTWAs
Significant at 10 5 1
168 Nathan
at London School of E
conomics and Political Science on July 23 2015
httpjoegoxfordjournalsorgD
ownloaded from
- Same difference_published_cover
- Same difference_published_author
-
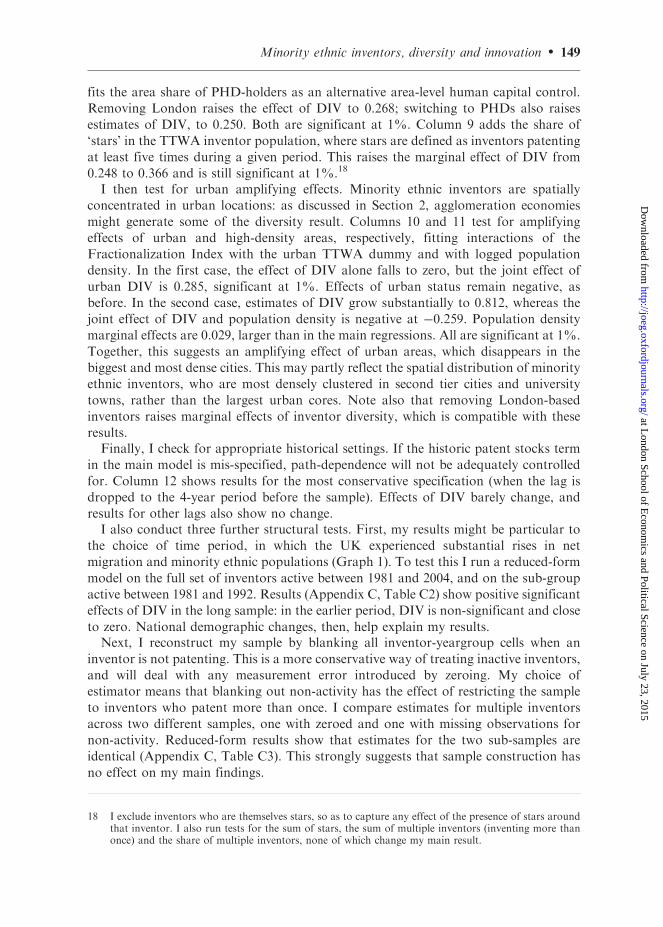
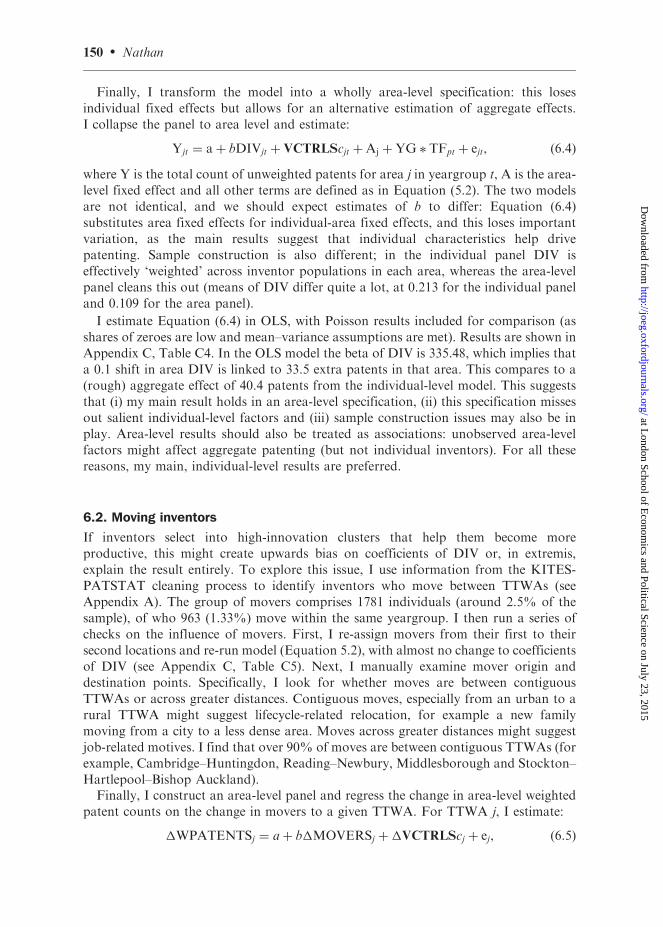
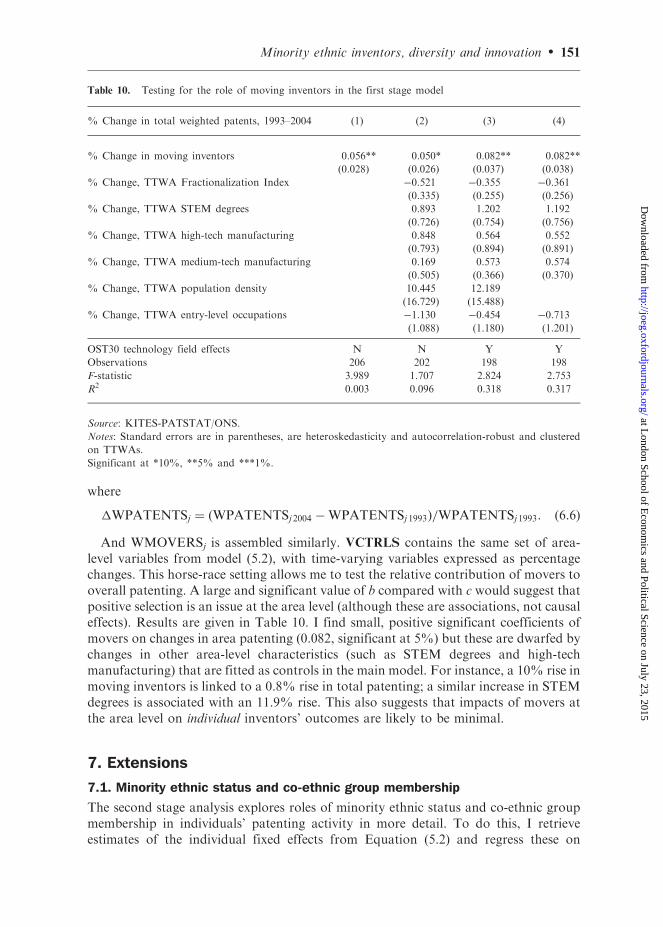
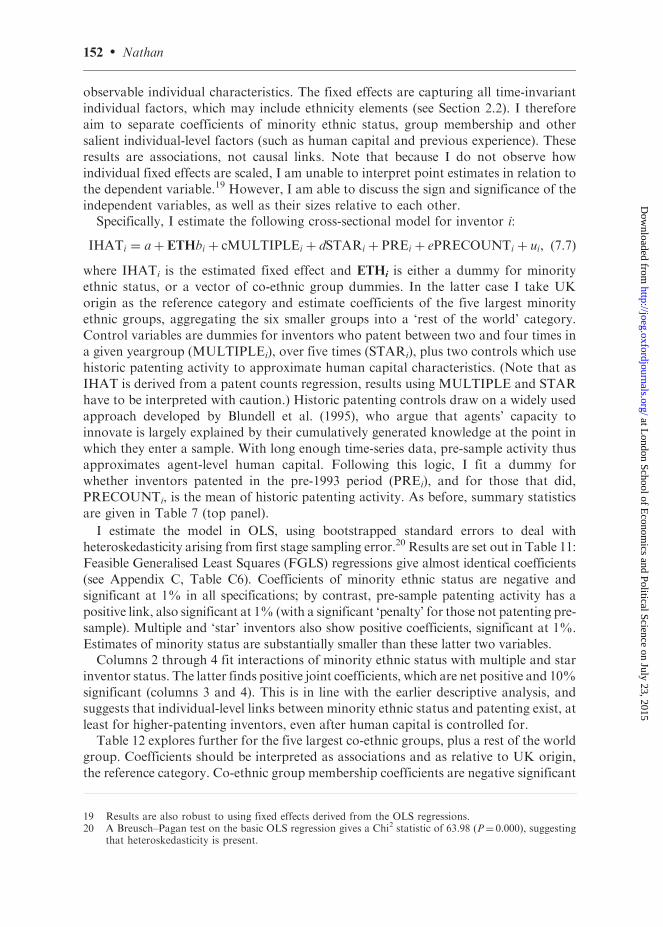
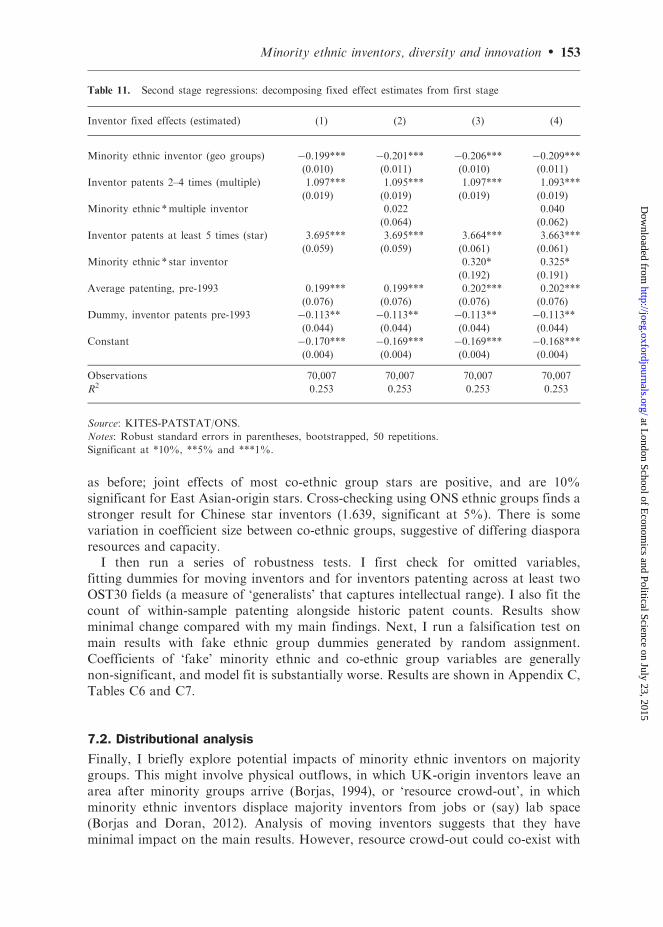
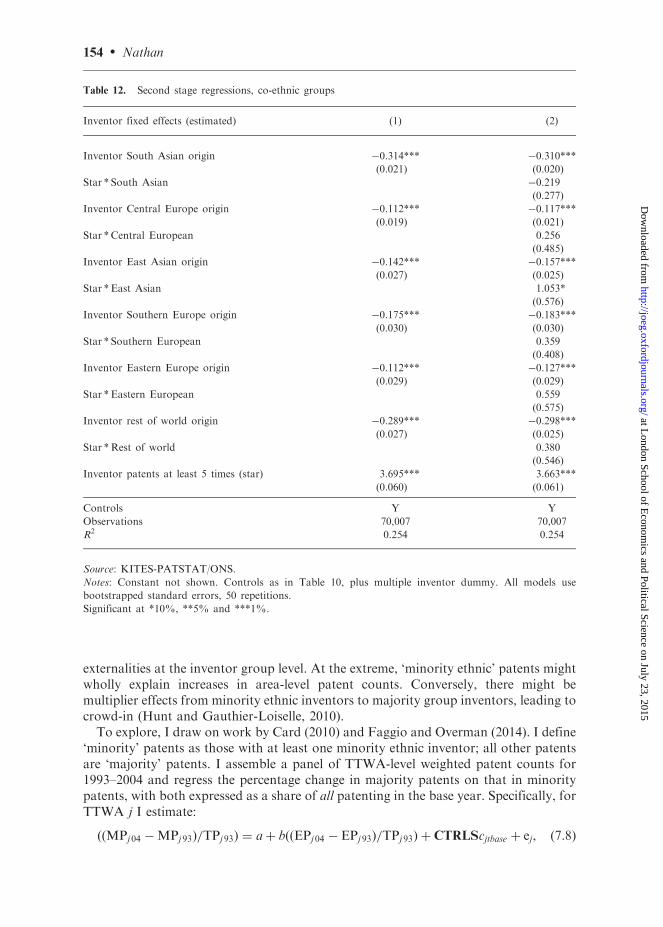
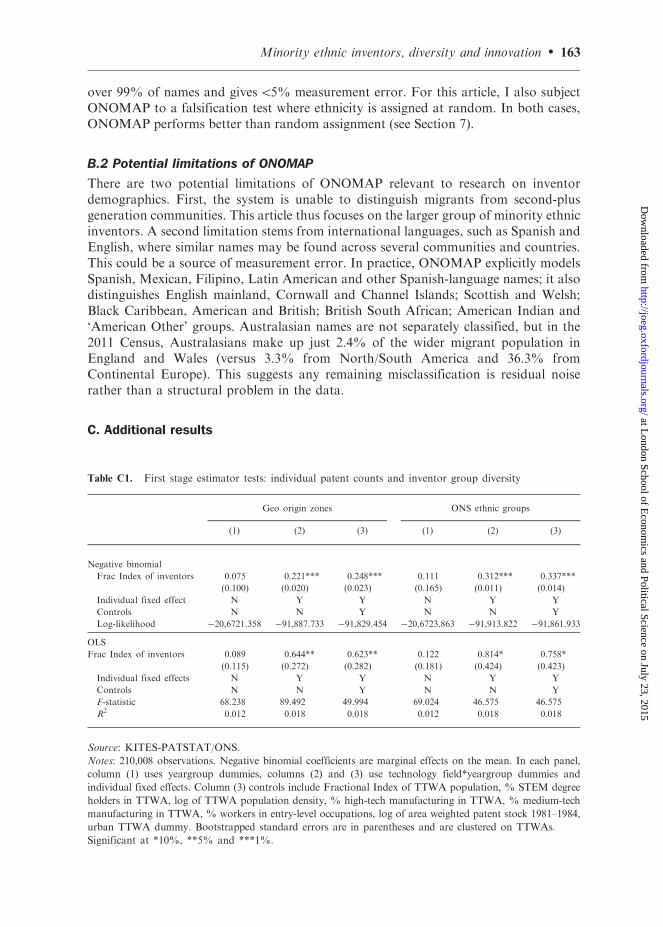
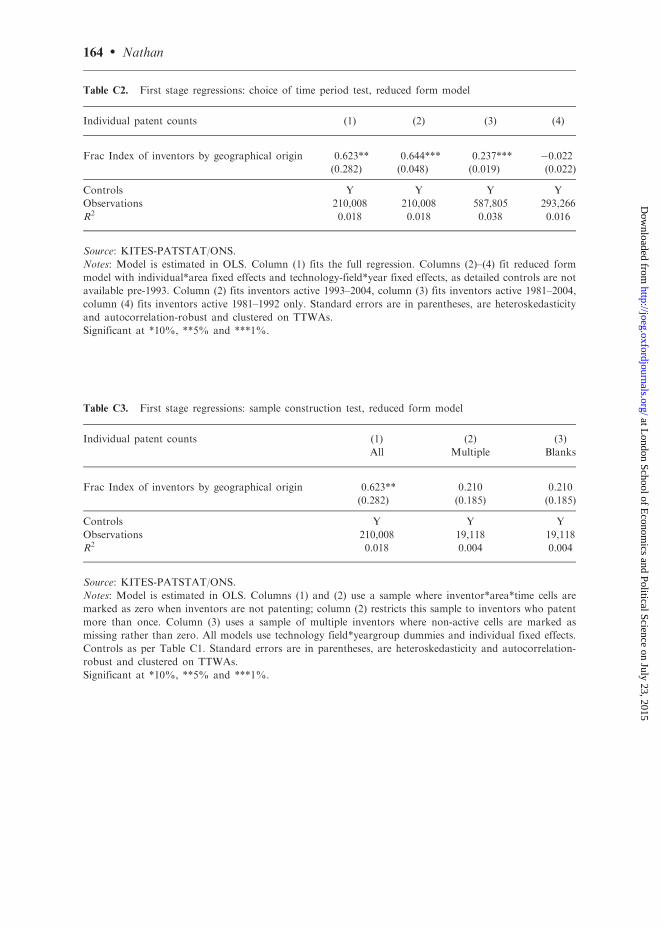
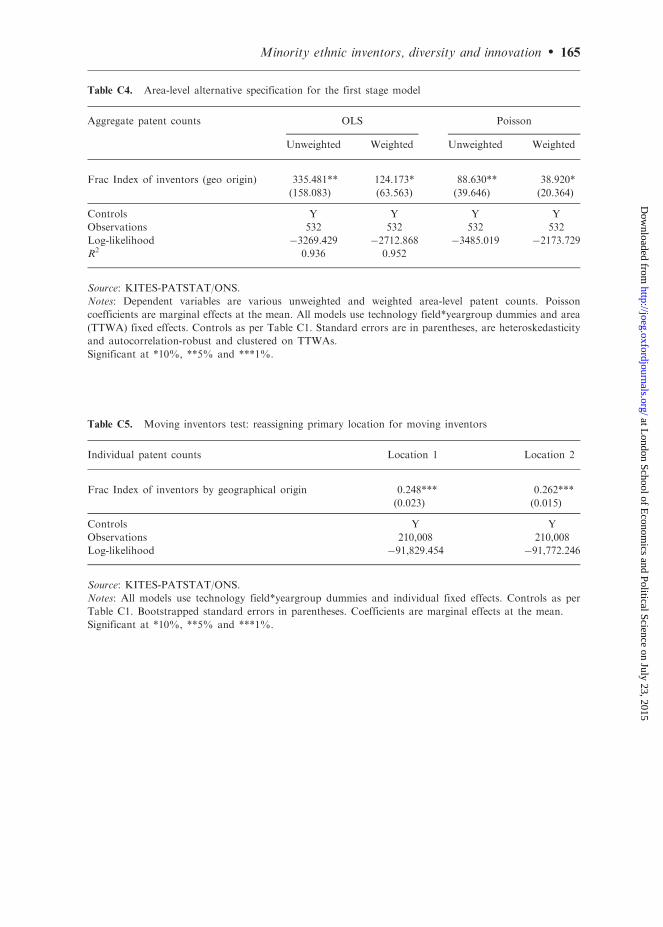
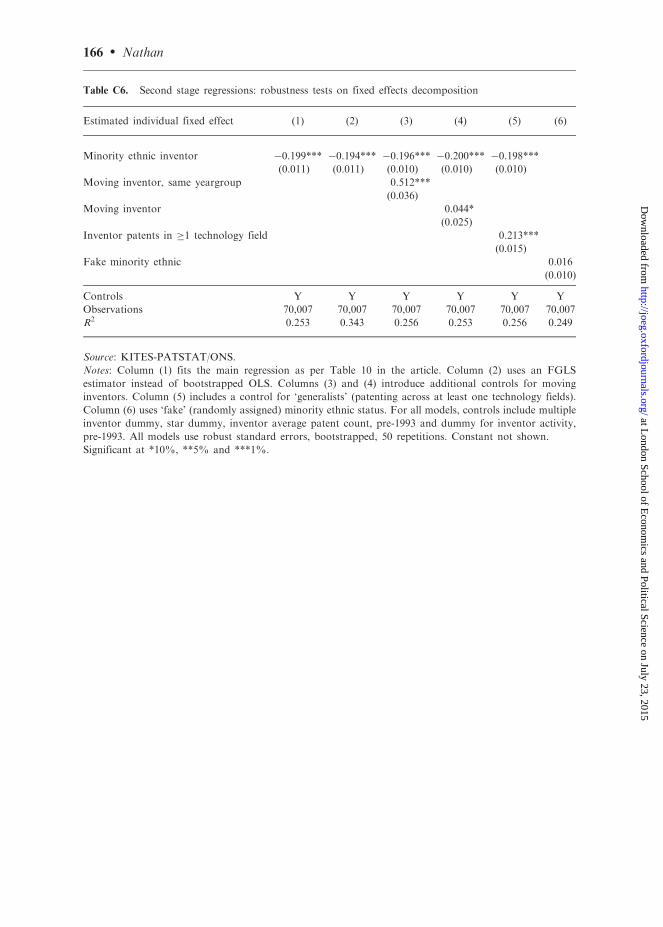
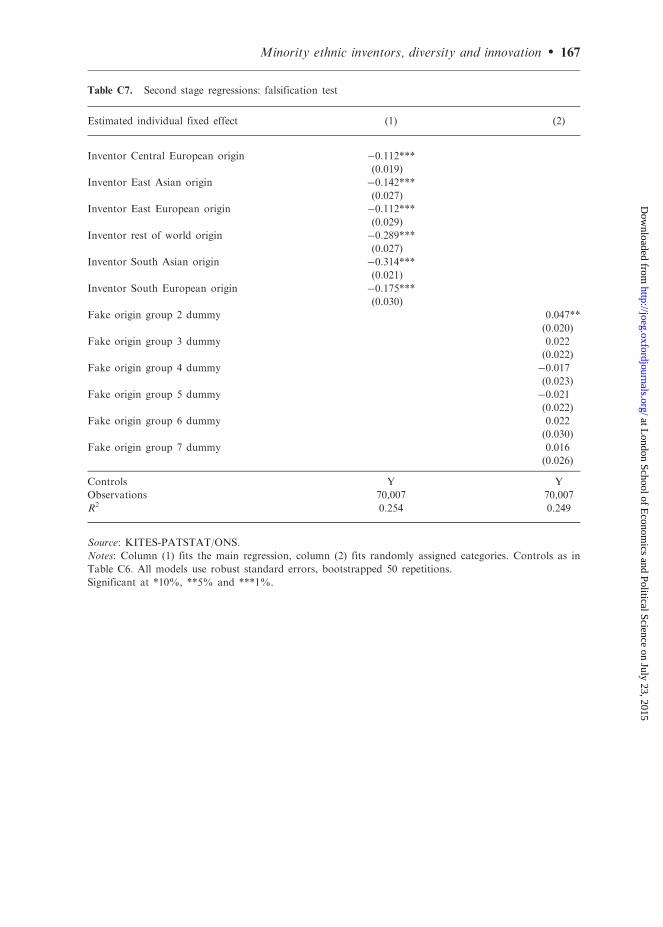
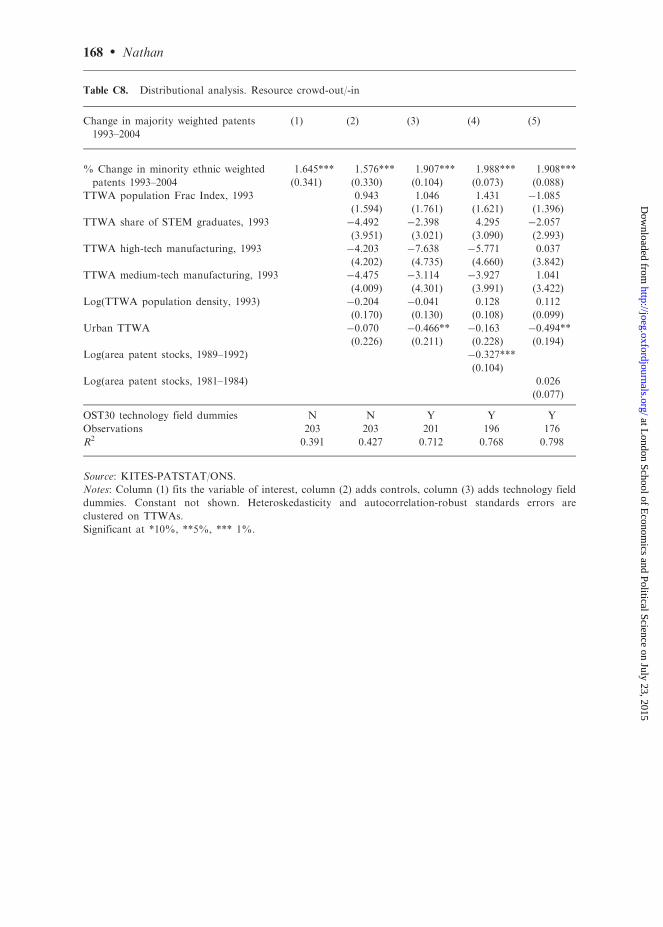
Related Documents