Review Paper Saltwater wedge variation in a non-anthropogenic coastal karst aquifer influenced by a strong tidal range (Burren, Ireland) Marie Perriquet a,b,⇑ , Véronique Leonardi a,1 , Tiernan Henry b,2 , Hervé Jourde a,3 a Université Montpellier 2, HydroSciences Montpellier, Case MSE, Place Eugène Bataillon, 34095 Montpellier Cedex 5, France b Earth and Ocean Sciences, School of Natural Sciences, National University of Ireland, Galway, University Road, Galway, Ireland article info Article history: Received 28 August 2014 Accepted 2 October 2014 Available online 16 October 2014 This manuscript was handled by Peter K. Kitanidis, Editor-in-Chief, with the assistance of Barbara Mahler, Associate Editor Keywords: Karst Coastal aquifer Saltwater wedge Tidal influence Burren (Ireland) Hydraulic gradient summary Spatial and temporal changes in saltwater wedges in coastal karst aquifers are still poorly understood, largely due to complex mixing processes in these heterogeneous environments, but also due to anthro- pogenic forcing such as pumping, which commonly affect natural variations in wedges. The purpose of this study was first to characterize the hydrodynamic functioning of a karst aquifer in an oceanic temper- ate climate with little anthropogenic pressure but strongly influenced by a high tidal range and second, to evaluate the extent and movements of a saltwater wedge influenced by both the tide and the natural recharge of the aquifer. Variations in specific conductivity combined with water chemistry results from six boreholes and two lakes located in the Bell Harbour catchment (western Ireland) enabled us to assess the extent of the intrusion of the saltwater wedge into the aquifer as a function of both karst recharge and tidal movements at high/low and neap/spring tidal cycles. The marked spatial disparity of the saltwater wedge was analysed as a function of both the hydrodynamic and the structural properties of the karst aquifer. Results showed that the extent of the saltwater wedge depended not only on the intrinsic prop- erties of the aquifer but also on the relative influence of the recharge and the tide on groundwater levels, which have opposite effects. Recharge in the Burren area throughout the year is large enough to prevent saltwater intruding more than about one kilometre from the shore. A strong tidal amplitude seems to be the motor of sudden saltwater intrusion observed in the aquifer near the shore while the position of the groundwater level seems to influence the intensity of the salinity increase. Competition between recharge and the tide thus controls the seawater inputs, hence explaining temporal and spatial changes in the saltwater wedge in this coastal karst aquifer. Ó 2014 Elsevier B.V. All rights reserved. Contents 1. Introduction ........................................................................................................ 2351 2. Study area .......................................................................................................... 2352 2.1. Location and climatic conditions .................................................................................. 2352 2.2. Geology ...................................................................................................... 2353 2.3. Hydrogeology.................................................................................................. 2353 2.4. Recent hydrogeological results .................................................................................... 2354 2.5. Field sampling and data available ................................................................................. 2354 3. Assessment of karst hydrodynamic properties ............................................................................. 2355 3.1. Hydrodynamic response to recharge events ......................................................................... 2355 3.2. Hydrodynamic response to tidal variations .......................................................................... 2356 http://dx.doi.org/10.1016/j.jhydrol.2014.10.006 0022-1694/Ó 2014 Elsevier B.V. All rights reserved. ⇑ Corresponding author at: Université Montpellier 2, HydroSciences Montpellier, Case MSE, Place Eugène Bataillon, 34095 Montpellier Cedex 5, France. Tel.: +33 7 61 22 26 30. E-mail addresses: [email protected] (M. Perriquet), [email protected] (V. Leonardi), [email protected] (T. Henry), herve.jourde@ univ-montp2.fr (H. Jourde). 1 Tel.: +33 4 67 14 32 45. 2 Tel.: +353 91 495 096. 3 Tel.: +33 4 67 14 90 80. Journal of Hydrology 519 (2014) 2350–2365 Contents lists available at ScienceDirect Journal of Hydrology journal homepage: www.elsevier.com/locate/jhydrol

Welcome message from author
This document is posted to help you gain knowledge. Please leave a comment to let me know what you think about it! Share it to your friends and learn new things together.
Transcript
Journal of Hydrology 519 (2014) 2350–2365
Contents lists available at ScienceDirect
Journal of Hydrology
journal homepage: www.elsevier .com/locate / jhydrol
Review Paper
Saltwater wedge variation in a non-anthropogenic coastal karst aquiferinfluenced by a strong tidal range (Burren, Ireland)
http://dx.doi.org/10.1016/j.jhydrol.2014.10.0060022-1694/� 2014 Elsevier B.V. All rights reserved.
⇑ Corresponding author at: Université Montpellier 2, HydroSciences Montpellier, Case MSE, Place Eugène Bataillon, 34095 Montpellier Cedex 5, France. Tel.: +33 730.
E-mail addresses: [email protected] (M. Perriquet), [email protected] (V. Leonardi), [email protected] (T. Henry), herveuniv-montp2.fr (H. Jourde).
1 Tel.: +33 4 67 14 32 45.2 Tel.: +353 91 495 096.3 Tel.: +33 4 67 14 90 80.
Marie Perriquet a,b,⇑, Véronique Leonardi a,1, Tiernan Henry b,2, Hervé Jourde a,3
a Université Montpellier 2, HydroSciences Montpellier, Case MSE, Place Eugène Bataillon, 34095 Montpellier Cedex 5, Franceb Earth and Ocean Sciences, School of Natural Sciences, National University of Ireland, Galway, University Road, Galway, Ireland
a r t i c l e i n f o s u m m a r y
Article history:Received 28 August 2014Accepted 2 October 2014Available online 16 October 2014This manuscript was handled by Peter K.Kitanidis, Editor-in-Chief, with theassistance of Barbara Mahler, AssociateEditor
Keywords:KarstCoastal aquiferSaltwater wedgeTidal influenceBurren (Ireland)Hydraulic gradient
Spatial and temporal changes in saltwater wedges in coastal karst aquifers are still poorly understood,largely due to complex mixing processes in these heterogeneous environments, but also due to anthro-pogenic forcing such as pumping, which commonly affect natural variations in wedges. The purpose ofthis study was first to characterize the hydrodynamic functioning of a karst aquifer in an oceanic temper-ate climate with little anthropogenic pressure but strongly influenced by a high tidal range and second, toevaluate the extent and movements of a saltwater wedge influenced by both the tide and the naturalrecharge of the aquifer. Variations in specific conductivity combined with water chemistry results fromsix boreholes and two lakes located in the Bell Harbour catchment (western Ireland) enabled us to assessthe extent of the intrusion of the saltwater wedge into the aquifer as a function of both karst recharge andtidal movements at high/low and neap/spring tidal cycles. The marked spatial disparity of the saltwaterwedge was analysed as a function of both the hydrodynamic and the structural properties of the karstaquifer. Results showed that the extent of the saltwater wedge depended not only on the intrinsic prop-erties of the aquifer but also on the relative influence of the recharge and the tide on groundwater levels,which have opposite effects. Recharge in the Burren area throughout the year is large enough to preventsaltwater intruding more than about one kilometre from the shore. A strong tidal amplitude seems to bethe motor of sudden saltwater intrusion observed in the aquifer near the shore while the position of thegroundwater level seems to influence the intensity of the salinity increase. Competition betweenrecharge and the tide thus controls the seawater inputs, hence explaining temporal and spatial changesin the saltwater wedge in this coastal karst aquifer.
� 2014 Elsevier B.V. All rights reserved.
Contents
1. Introduction . . . . . . . . . . . . . . . . . . . . . . . . . . . . . . . . . . . . . . . . . . . . . . . . . . . . . . . . . . . . . . . . . . . . . . . . . . . . . . . . . . . . . . . . . . . . . . . . . . . . . . . . 23512. Study area. . . . . . . . . . . . . . . . . . . . . . . . . . . . . . . . . . . . . . . . . . . . . . . . . . . . . . . . . . . . . . . . . . . . . . . . . . . . . . . . . . . . . . . . . . . . . . . . . . . . . . . . . . 2352
2.1. Location and climatic conditions . . . . . . . . . . . . . . . . . . . . . . . . . . . . . . . . . . . . . . . . . . . . . . . . . . . . . . . . . . . . . . . . . . . . . . . . . . . . . . . . . . 23522.2. Geology . . . . . . . . . . . . . . . . . . . . . . . . . . . . . . . . . . . . . . . . . . . . . . . . . . . . . . . . . . . . . . . . . . . . . . . . . . . . . . . . . . . . . . . . . . . . . . . . . . . . . . 23532.3. Hydrogeology. . . . . . . . . . . . . . . . . . . . . . . . . . . . . . . . . . . . . . . . . . . . . . . . . . . . . . . . . . . . . . . . . . . . . . . . . . . . . . . . . . . . . . . . . . . . . . . . . . 23532.4. Recent hydrogeological results . . . . . . . . . . . . . . . . . . . . . . . . . . . . . . . . . . . . . . . . . . . . . . . . . . . . . . . . . . . . . . . . . . . . . . . . . . . . . . . . . . . . 23542.5. Field sampling and data available . . . . . . . . . . . . . . . . . . . . . . . . . . . . . . . . . . . . . . . . . . . . . . . . . . . . . . . . . . . . . . . . . . . . . . . . . . . . . . . . . 2354
3. Assessment of karst hydrodynamic properties. . . . . . . . . . . . . . . . . . . . . . . . . . . . . . . . . . . . . . . . . . . . . . . . . . . . . . . . . . . . . . . . . . . . . . . . . . . . . 2355
3.1. Hydrodynamic response to recharge events . . . . . . . . . . . . . . . . . . . . . . . . . . . . . . . . . . . . . . . . . . . . . . . . . . . . . . . . . . . . . . . . . . . . . . . . . 23553.2. Hydrodynamic response to tidal variations . . . . . . . . . . . . . . . . . . . . . . . . . . . . . . . . . . . . . . . . . . . . . . . . . . . . . . . . . . . . . . . . . . . . . . . . . . 235661 22 26
.jourde@
Nomenclature
d delay factorf tidal efficiency factorHT high tidei hydraulic gradientimin lowest hydraulic gradient observed during a low/high
tidal cycleiampl hydraulic gradient difference between high and low tideIPCC Intergovernmental Panel on Climate ChangeLT low tide
MSL mean sea levelNT neap tideP period of influence of a recharge eventS slope of a recession curveSpC specific conductivitySST strong spring tideST spring tideWL water level
M. Perriquet et al. / Journal of Hydrology 519 (2014) 2350–2365 2351
3.3. Results . . . . . . . . . . . . . . . . . . . . . . . . . . . . . . . . . . . . . . . . . . . . . . . . . . . . . . . . . . . . . . . . . . . . . . . . . . . . . . . . . . . . . . . . . . . . . . . . . . . . . . . 23563.4. Discussion: Consequences in terms of intrinsic functioning of the karst aquifer . . . . . . . . . . . . . . . . . . . . . . . . . . . . . . . . . . . . . . . . . . . . 2357
4. Spatial and temporal variability of the saltwater wedge. . . . . . . . . . . . . . . . . . . . . . . . . . . . . . . . . . . . . . . . . . . . . . . . . . . . . . . . . . . . . . . . . . . . . 2358
4.1. Spatial extent of the saltwater wedge . . . . . . . . . . . . . . . . . . . . . . . . . . . . . . . . . . . . . . . . . . . . . . . . . . . . . . . . . . . . . . . . . . . . . . . . . . . . . . 23584.2. Temporal variability of the extent of the saltwater wedge . . . . . . . . . . . . . . . . . . . . . . . . . . . . . . . . . . . . . . . . . . . . . . . . . . . . . . . . . . . . . 23604.2.1. Temporal variation in saltwater wedge at high/low and neap/spring tidal scales . . . . . . . . . . . . . . . . . . . . . . . . . . . . . . . . . . . . 23604.2.2. Conditions for larger intrusion of the saltwater wedge into the karst aquifer . . . . . . . . . . . . . . . . . . . . . . . . . . . . . . . . . . . . . . . 2361
4.3. Discussion on the temporal saltwater wedge variations . . . . . . . . . . . . . . . . . . . . . . . . . . . . . . . . . . . . . . . . . . . . . . . . . . . . . . . . . . . . . . . 2363
5. Conclusion . . . . . . . . . . . . . . . . . . . . . . . . . . . . . . . . . . . . . . . . . . . . . . . . . . . . . . . . . . . . . . . . . . . . . . . . . . . . . . . . . . . . . . . . . . . . . . . . . . . . . . . . . 2364Acknowledgments . . . . . . . . . . . . . . . . . . . . . . . . . . . . . . . . . . . . . . . . . . . . . . . . . . . . . . . . . . . . . . . . . . . . . . . . . . . . . . . . . . . . . . . . . . . . . . . . . . . 2365References . . . . . . . . . . . . . . . . . . . . . . . . . . . . . . . . . . . . . . . . . . . . . . . . . . . . . . . . . . . . . . . . . . . . . . . . . . . . . . . . . . . . . . . . . . . . . . . . . . . . . . . . . 2365
1. Introduction
Understanding the interaction between freshwater and seawa-ter in coastal karst aquifers is critical for current and future watermanagement, especially in the context of various EU Directives(Water Framework Directive, Floods Directive, Marine StrategyFramework Directive) and given the potential impacts of changingweather patterns and sea levels (Ferguson and Gleeson, 2012). Thenatural equilibrium between seawater and freshwater is stillpoorly understood, largely due to the complex mixing processesin these heterogeneous environments (Dörfliger and Willwer,2005). The presence of karst conduits that allow discharge of fresh-water and ingress of sea water make it difficult to predict spatialand temporal changes in the saltwater wedge (Bakalowicz, 2005).In these aquifers, the extent of the saltwater wedge thus dependson the flow path network, resulting in irregular patterns of saltwa-ter intrusion into the aquifer (Arfib et al., 2002). Previous work onsaltwater wedges in karst aquifers show the effect of areas of highhydraulic conductivity on the distribution of the mixing zone(Moore et al., 1992; Stringfield and LeGrand, 1971). The morphol-ogy and geometry of conduits have been shown to be first ordercontrols on groundwater temperature and specific conductivity(SpC) gradients in the aquifer (Beddows et al., 2007). Knowledgeof the spatial variations in the hydrodynamic properties of theaquifer is therefore required to understand the extent of the salt-water wedge. Hydraulic diffusivities can be estimated throughgroundwater responses to tides. Jacob (1950) and Ferris andBranch (1952) provided analytical solutions to assess hydraulic dif-fusivity from changes in groundwater levels, while considering aone-dimensional (1D), homogeneous, isotropic, confined, andsemi-infinite aquifer with a sharp boundary condition subject tooscillating forcing. In this study, analyses of water table fluctua-tions in boreholes highlighted three types of hydrodynamicresponse that were confirmed with the Jacob–Ferris method.
Previous studies showed that saltwater intrusion is driven by thehydraulic gradient, which in turn, is controlled by the difference inhydraulic heads between the sea and the aquifer (Arfib et al.,
2002; Blavoux et al., 2004; Bonacci and Roje-Bonacci, 1997;Cooper, 1959; Henry, 1959; Herzberg, 1901; Hubbert, 1940). Thehydraulic gradient depends on (i) tidal fluctuations, (ii) naturalrecharge of the aquifer and (iii) spatial heterogeneities of its hydro-dynamic properties. Tidal fluctuations may be a major factor indetermining variations in boundary conditions. For example,Beddows et al. (2007) showed that variation in pressure heads dri-ven by the tide can increase the rate of mixing. Martin et al.(2012) quantified the exchanges between the matrix and conduitsas a function of tidal amplitude. However to date, no study hasexplained the spatial and temporal changes in the saltwater wedgein a karst aquifer taking into account both water chemistry (majorcation/anion analysis) and tidal influence (at high/low tide andneap/spring tide scales) on variations in SpC in an aquifer with verylow anthropogenic forcing. Natural recharge of the aquifer may alsobe a major factor driving variations in inland hydraulic heads: theextension of the saltwater wedge over time could depend on theequilibrium between groundwater recharge and the influence oftides that modify the boundary conditions. While a lot of publishedstudies (Arfib et al., 2002; Bayari et al., 2010; Fleury et al., 2007;Maramathas et al., 2003; Tulipano, 2005) focus on coastal karstaquifers in arid to semi-arid areas such as the Mediterranean region,this study focuses on the Bell Harbour karst catchment, which ischaracterised by a strong tidal range, a consistently high rechargethroughout the year, and a low population density in a rural agricul-tural setting. Because of the low water demand in the Burren area,this zone is very well suited to study the saltwater intrusion mech-anisms in a close to natural context (little anthropogenic forcing).The Intergovernmental Panel on Climate Change (IPCC) forecast glo-bal sea level rise of up to 1 m by 2100, and this will directly affect thehydrogeological behaviour of the karst aquifer. These changes areexamined at the light of the presented results.
The aim of this study was to test the hypothesis that rechargeand the tide control spatial and temporal changes in the saltwaterintrusion. To this end, the intrinsic properties of the karst aquifer(hydrodynamic properties, structure) were characterised, and thenan attempt was made to link these properties and spatial and tem-
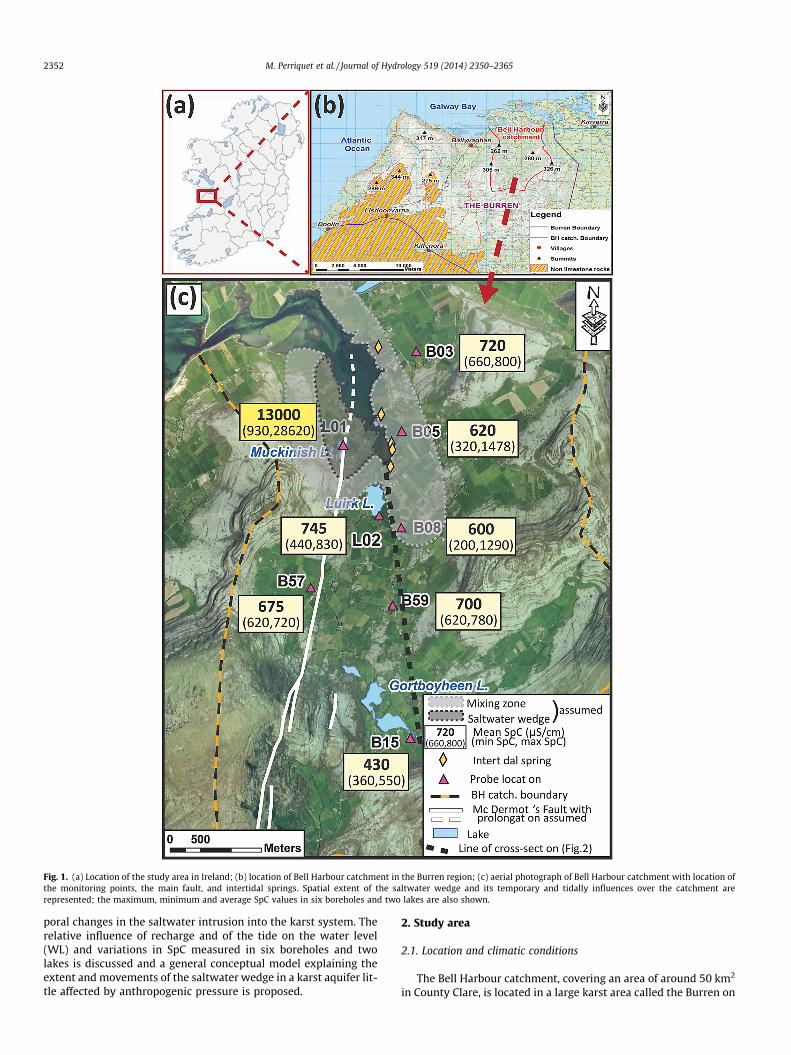
Fig. 1. (a) Location of the study area in Ireland; (b) location of Bell Harbour catchment in the Burren region; (c) aerial photograph of Bell Harbour catchment with location ofthe monitoring points, the main fault, and intertidal springs. Spatial extent of the saltwater wedge and its temporary and tidally influences over the catchment arerepresented; the maximum, minimum and average SpC values in six boreholes and two lakes are also shown.
2352 M. Perriquet et al. / Journal of Hydrology 519 (2014) 2350–2365
poral changes in the saltwater intrusion into the karst system. Therelative influence of recharge and of the tide on the water level(WL) and variations in SpC measured in six boreholes and twolakes is discussed and a general conceptual model explaining theextent and movements of the saltwater wedge in a karst aquifer lit-tle affected by anthropogenic pressure is proposed.
2. Study area
2.1. Location and climatic conditions
The Bell Harbour catchment, covering an area of around 50 km2
in County Clare, is located in a large karst area called the Burren on
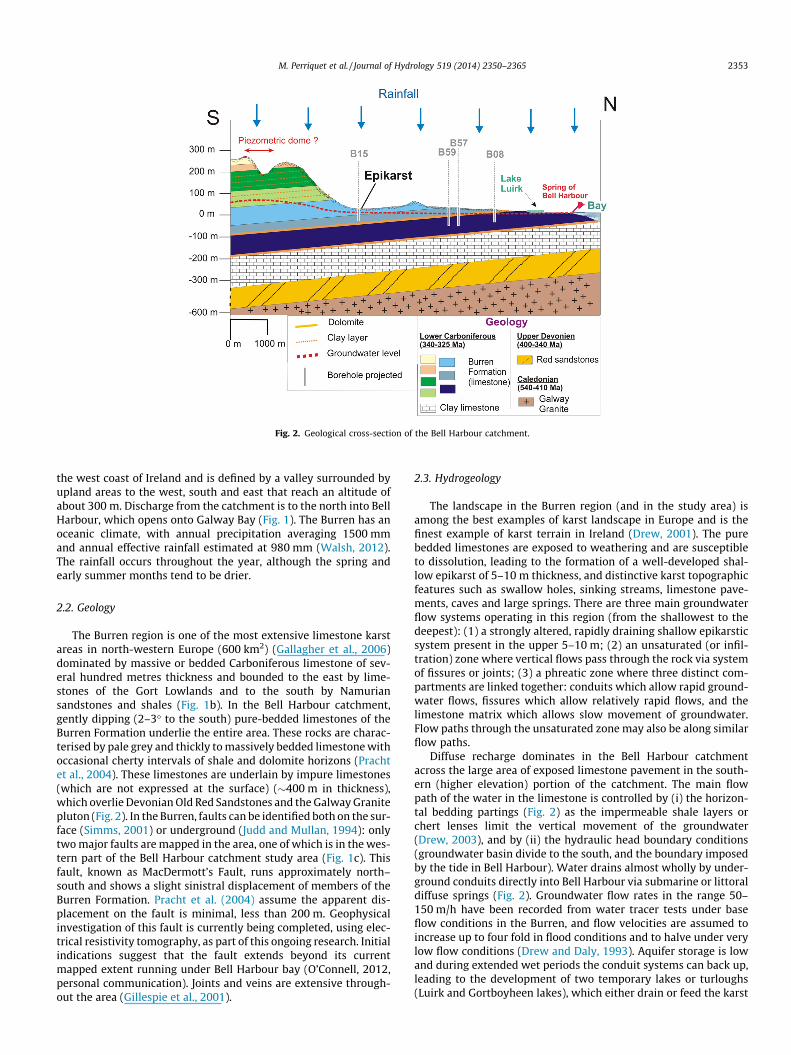
Fig. 2. Geological cross-section of the Bell Harbour catchment.
M. Perriquet et al. / Journal of Hydrology 519 (2014) 2350–2365 2353
the west coast of Ireland and is defined by a valley surrounded byupland areas to the west, south and east that reach an altitude ofabout 300 m. Discharge from the catchment is to the north into BellHarbour, which opens onto Galway Bay (Fig. 1). The Burren has anoceanic climate, with annual precipitation averaging 1500 mmand annual effective rainfall estimated at 980 mm (Walsh, 2012).The rainfall occurs throughout the year, although the spring andearly summer months tend to be drier.
2.2. Geology
The Burren region is one of the most extensive limestone karstareas in north-western Europe (600 km2) (Gallagher et al., 2006)dominated by massive or bedded Carboniferous limestone of sev-eral hundred metres thickness and bounded to the east by lime-stones of the Gort Lowlands and to the south by Namuriansandstones and shales (Fig. 1b). In the Bell Harbour catchment,gently dipping (2–3� to the south) pure-bedded limestones of theBurren Formation underlie the entire area. These rocks are charac-terised by pale grey and thickly to massively bedded limestone withoccasional cherty intervals of shale and dolomite horizons (Prachtet al., 2004). These limestones are underlain by impure limestones(which are not expressed at the surface) (�400 m in thickness),which overlie Devonian Old Red Sandstones and the Galway Granitepluton (Fig. 2). In the Burren, faults can be identified both on the sur-face (Simms, 2001) or underground (Judd and Mullan, 1994): onlytwo major faults are mapped in the area, one of which is in the wes-tern part of the Bell Harbour catchment study area (Fig. 1c). Thisfault, known as MacDermott’s Fault, runs approximately north–south and shows a slight sinistral displacement of members of theBurren Formation. Pracht et al. (2004) assume the apparent dis-placement on the fault is minimal, less than 200 m. Geophysicalinvestigation of this fault is currently being completed, using elec-trical resistivity tomography, as part of this ongoing research. Initialindications suggest that the fault extends beyond its currentmapped extent running under Bell Harbour bay (O’Connell, 2012,personal communication). Joints and veins are extensive through-out the area (Gillespie et al., 2001).
2.3. Hydrogeology
The landscape in the Burren region (and in the study area) isamong the best examples of karst landscape in Europe and is thefinest example of karst terrain in Ireland (Drew, 2001). The purebedded limestones are exposed to weathering and are susceptibleto dissolution, leading to the formation of a well-developed shal-low epikarst of 5–10 m thickness, and distinctive karst topographicfeatures such as swallow holes, sinking streams, limestone pave-ments, caves and large springs. There are three main groundwaterflow systems operating in this region (from the shallowest to thedeepest): (1) a strongly altered, rapidly draining shallow epikarsticsystem present in the upper 5–10 m; (2) an unsaturated (or infil-tration) zone where vertical flows pass through the rock via systemof fissures or joints; (3) a phreatic zone where three distinct com-partments are linked together: conduits which allow rapid ground-water flows, fissures which allow relatively rapid flows, and thelimestone matrix which allows slow movement of groundwater.Flow paths through the unsaturated zone may also be along similarflow paths.
Diffuse recharge dominates in the Bell Harbour catchmentacross the large area of exposed limestone pavement in the south-ern (higher elevation) portion of the catchment. The main flowpath of the water in the limestone is controlled by (i) the horizon-tal bedding partings (Fig. 2) as the impermeable shale layers orchert lenses limit the vertical movement of the groundwater(Drew, 2003), and by (ii) the hydraulic head boundary conditions(groundwater basin divide to the south, and the boundary imposedby the tide in Bell Harbour). Water drains almost wholly by under-ground conduits directly into Bell Harbour via submarine or littoraldiffuse springs (Fig. 2). Groundwater flow rates in the range 50–150 m/h have been recorded from water tracer tests under baseflow conditions in the Burren, and flow velocities are assumed toincrease up to four fold in flood conditions and to halve under verylow flow conditions (Drew and Daly, 1993). Aquifer storage is lowand during extended wet periods the conduit systems can back up,leading to the development of two temporary lakes or turloughs(Luirk and Gortboyheen lakes), which either drain or feed the karst
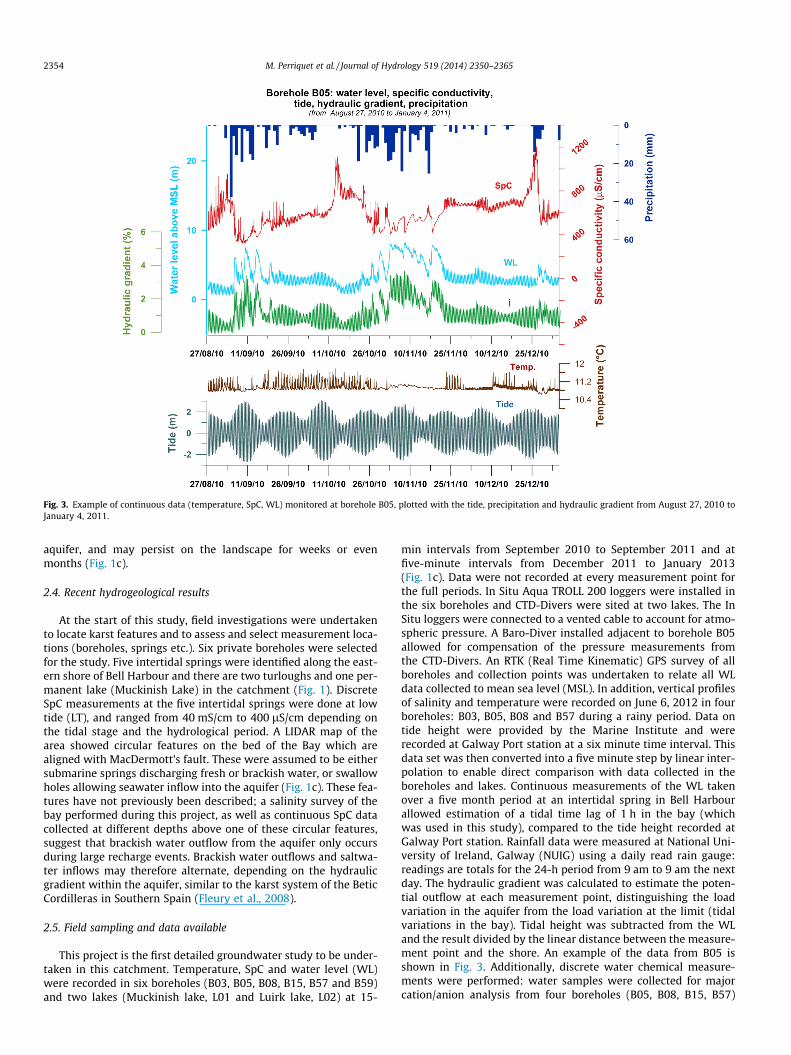
Fig. 3. Example of continuous data (temperature, SpC, WL) monitored at borehole B05, plotted with the tide, precipitation and hydraulic gradient from August 27, 2010 toJanuary 4, 2011.
2354 M. Perriquet et al. / Journal of Hydrology 519 (2014) 2350–2365
aquifer, and may persist on the landscape for weeks or evenmonths (Fig. 1c).
2.4. Recent hydrogeological results
At the start of this study, field investigations were undertakento locate karst features and to assess and select measurement loca-tions (boreholes, springs etc.). Six private boreholes were selectedfor the study. Five intertidal springs were identified along the east-ern shore of Bell Harbour and there are two turloughs and one per-manent lake (Muckinish Lake) in the catchment (Fig. 1). DiscreteSpC measurements at the five intertidal springs were done at lowtide (LT), and ranged from 40 mS/cm to 400 lS/cm depending onthe tidal stage and the hydrological period. A LIDAR map of thearea showed circular features on the bed of the Bay which arealigned with MacDermott’s fault. These were assumed to be eithersubmarine springs discharging fresh or brackish water, or swallowholes allowing seawater inflow into the aquifer (Fig. 1c). These fea-tures have not previously been described; a salinity survey of thebay performed during this project, as well as continuous SpC datacollected at different depths above one of these circular features,suggest that brackish water outflow from the aquifer only occursduring large recharge events. Brackish water outflows and saltwa-ter inflows may therefore alternate, depending on the hydraulicgradient within the aquifer, similar to the karst system of the BeticCordilleras in Southern Spain (Fleury et al., 2008).
2.5. Field sampling and data available
This project is the first detailed groundwater study to be under-taken in this catchment. Temperature, SpC and water level (WL)were recorded in six boreholes (B03, B05, B08, B15, B57 and B59)and two lakes (Muckinish lake, L01 and Luirk lake, L02) at 15-
min intervals from September 2010 to September 2011 and atfive-minute intervals from December 2011 to January 2013(Fig. 1c). Data were not recorded at every measurement point forthe full periods. In Situ Aqua TROLL 200 loggers were installed inthe six boreholes and CTD-Divers were sited at two lakes. The InSitu loggers were connected to a vented cable to account for atmo-spheric pressure. A Baro-Diver installed adjacent to borehole B05allowed for compensation of the pressure measurements fromthe CTD-Divers. An RTK (Real Time Kinematic) GPS survey of allboreholes and collection points was undertaken to relate all WLdata collected to mean sea level (MSL). In addition, vertical profilesof salinity and temperature were recorded on June 6, 2012 in fourboreholes: B03, B05, B08 and B57 during a rainy period. Data ontide height were provided by the Marine Institute and wererecorded at Galway Port station at a six minute time interval. Thisdata set was then converted into a five minute step by linear inter-polation to enable direct comparison with data collected in theboreholes and lakes. Continuous measurements of the WL takenover a five month period at an intertidal spring in Bell Harbourallowed estimation of a tidal time lag of 1 h in the bay (whichwas used in this study), compared to the tide height recorded atGalway Port station. Rainfall data were measured at National Uni-versity of Ireland, Galway (NUIG) using a daily read rain gauge:readings are totals for the 24-h period from 9 am to 9 am the nextday. The hydraulic gradient was calculated to estimate the poten-tial outflow at each measurement point, distinguishing the loadvariation in the aquifer from the load variation at the limit (tidalvariations in the bay). Tidal height was subtracted from the WLand the result divided by the linear distance between the measure-ment point and the shore. An example of the data from B05 isshown in Fig. 3. Additionally, discrete water chemical measure-ments were performed: water samples were collected for majorcation/anion analysis from four boreholes (B05, B08, B15, B57)
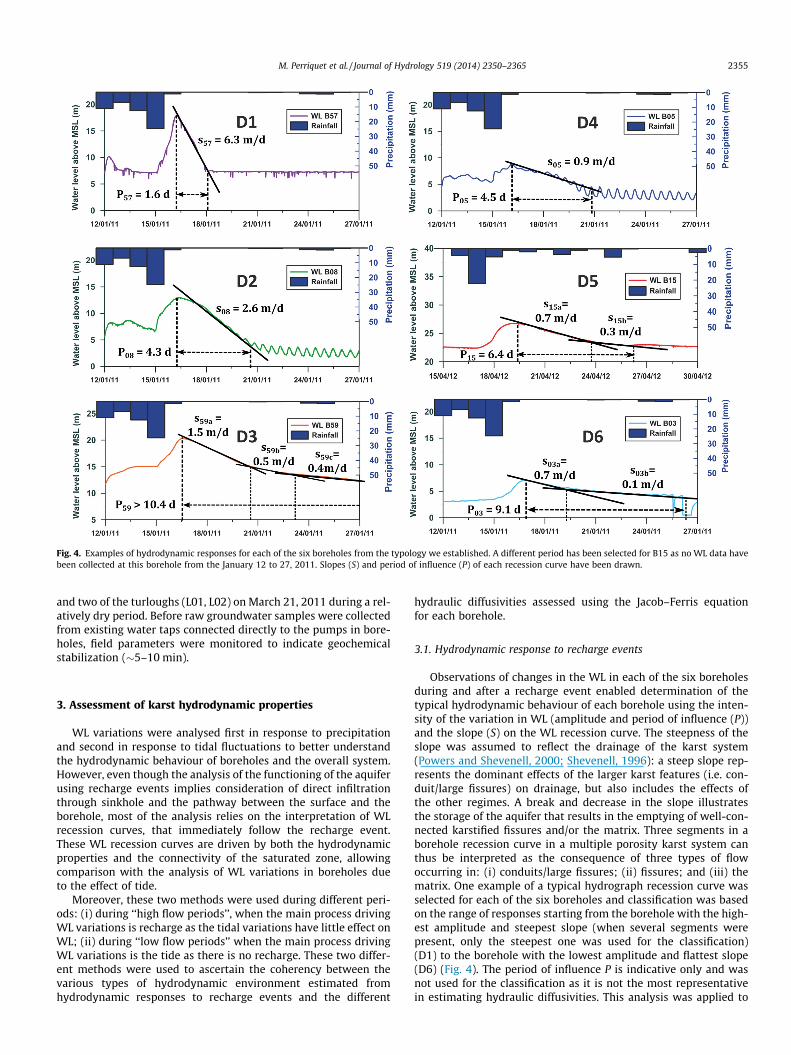
Fig. 4. Examples of hydrodynamic responses for each of the six boreholes from the typology we established. A different period has been selected for B15 as no WL data havebeen collected at this borehole from the January 12 to 27, 2011. Slopes (S) and period of influence (P) of each recession curve have been drawn.
M. Perriquet et al. / Journal of Hydrology 519 (2014) 2350–2365 2355
and two of the turloughs (L01, L02) on March 21, 2011 during a rel-atively dry period. Before raw groundwater samples were collectedfrom existing water taps connected directly to the pumps in bore-holes, field parameters were monitored to indicate geochemicalstabilization (�5–10 min).
3. Assessment of karst hydrodynamic properties
WL variations were analysed first in response to precipitationand second in response to tidal fluctuations to better understandthe hydrodynamic behaviour of boreholes and the overall system.However, even though the analysis of the functioning of the aquiferusing recharge events implies consideration of direct infiltrationthrough sinkhole and the pathway between the surface and theborehole, most of the analysis relies on the interpretation of WLrecession curves, that immediately follow the recharge event.These WL recession curves are driven by both the hydrodynamicproperties and the connectivity of the saturated zone, allowingcomparison with the analysis of WL variations in boreholes dueto the effect of tide.
Moreover, these two methods were used during different peri-ods: (i) during ‘‘high flow periods’’, when the main process drivingWL variations is recharge as the tidal variations have little effect onWL; (ii) during ‘‘low flow periods’’ when the main process drivingWL variations is the tide as there is no recharge. These two differ-ent methods were used to ascertain the coherency between thevarious types of hydrodynamic environment estimated fromhydrodynamic responses to recharge events and the different
hydraulic diffusivities assessed using the Jacob–Ferris equationfor each borehole.
3.1. Hydrodynamic response to recharge events
Observations of changes in the WL in each of the six boreholesduring and after a recharge event enabled determination of thetypical hydrodynamic behaviour of each borehole using the inten-sity of the variation in WL (amplitude and period of influence (P))and the slope (S) on the WL recession curve. The steepness of theslope was assumed to reflect the drainage of the karst system(Powers and Shevenell, 2000; Shevenell, 1996): a steep slope rep-resents the dominant effects of the larger karst features (i.e. con-duit/large fissures) on drainage, but also includes the effects ofthe other regimes. A break and decrease in the slope illustratesthe storage of the aquifer that results in the emptying of well-con-nected karstified fissures and/or the matrix. Three segments in aborehole recession curve in a multiple porosity karst system canthus be interpreted as the consequence of three types of flowoccurring in: (i) conduits/large fissures; (ii) fissures; and (iii) thematrix. One example of a typical hydrograph recession curve wasselected for each of the six boreholes and classification was basedon the range of responses starting from the borehole with the high-est amplitude and steepest slope (when several segments werepresent, only the steepest one was used for the classification)(D1) to the borehole with the lowest amplitude and flattest slope(D6) (Fig. 4). The period of influence P is indicative only and wasnot used for the classification as it is not the most representativein estimating hydraulic diffusivities. This analysis was applied to
2356 M. Perriquet et al. / Journal of Hydrology 519 (2014) 2350–2365
the boreholes but not to the lakes (L01, L02). (Changes in the WL ofthe lakes are strongly dampened by the capacity of the lake andconsequently cannot be compared to changes in WL in the bore-holes). For example, the hydrodynamic reaction of B57 exhibits ahigh amplitude peak (>10 m) and a steep recession curve(S57 = 6.3 m/d) (Fig. 4). Moreover, its period of influence was short(P57 = 1.6 days). This indicates a large value of hydraulic diffusivity(D1) and hence high connectivity of this borehole with the karstdrainage network, due to well-connected fissures.
3.2. Hydrodynamic response to tidal variations
The Jacob–Ferris method (Ferris and Branch, 1952; Jacob,1950) for tidal propagation through a coastal aquifer was usedto estimate hydraulic diffusivity (D) values, although a varietyof more sophisticated analytical solutions exist for one andtwo-dimensional systems (Li et al., 2000; Townley, 1995; Trefry,1999) and for vertical section systems (Guo et al., 2010; Li andJiao, 2002). The relatively simple Jacob–Ferris equation remainsuseful for estimating aquifer hydraulic properties from measuredgroundwater level variations (Rotzoll et al., 2013), even thoughproblems can arise from the application of this simple homoge-neous tidal propagation models. Differences in hydraulic diffusiv-ities calculated from either tidal efficiency values (Df: ratio ofamplitude between the tidal level in the bay and the WL data col-lected at the monitoring point) or delay values (Dd: time lagbetween the tidal level in the bay and the WL data collected atthe monitoring point) have been noted in numerous studies(Drogue et al., 1984; Erskine, 1991; Ferris and Branch, 1952;Smith, 1999). Normally, for a confined homogenous aquiferwhere head losses are isotropic, Df/Dd value should be 1 (Ferrisand Branch, 1952). These inconsistencies of observed hydraulicdiffusivities (tidal efficiency-delay inconsistencies) have onlybeen partially explained because of the various influences at play:vertical flows, phreatic influences (Jha et al., 2003), geometriceffects (e.g. variable aquifer thickness), non linearities associatedwith capillarity and density-driven flow and spatial heterogeneity(e.g. horizontal layering) (Trefry and Bekele, 2004). These tidalefficiency-delay inconsistencies were also identified in this studybut the assessed hydraulic diffusivities are in agreement with theheterogeneity of the aquifer; these biases have been used to sup-port the different types of proposed hydrodynamic environmentsand are discussed in detail below. In any case, this method givesa general idea of the hydraulic diffusivity between the shorelineand the monitoring point and thus allows identification of thespatial distribution of the hydraulic diffusivity field at the catch-ment scale.
The estimated values correspond to the hydraulic diffusivity ofan equivalent porous medium between the sea and the borehole,which may be representative of either one of these hydrodynamicenvironment (conduit, fracture and matrix), or more likely a com-bination of these environments. Use of the Jacob–Ferris equationgenerally assumes a confined aquifer with homogeneous hydrody-namic properties and considered the propagation along the aquifer
Table 1Type of hydrodynamic environment deduced from the hydrodynamic response of the bometres), period of influence ‘‘P’’ (in days) and slope of recession curve ‘‘S’’ (in metres/day) win metres.
Borehole x (m) Typology Amplitude (m) Period of influence P (d)
B57 2400 D1 10.4 1.6B08 1065 D2 6.25 4.3B59 2300 D3 5 >10.4B05 265 D4 3.3 4.5B15 4490 D5 4.4 6.4B03 560 D6 3.75 9.1
of sinusoidal oscillations of pressure in one-dimensional flow(implying neither vertical nor flow parallel to the shoreline). How-ever, we can assume that some karst features (especially conduits),where pressure variation propagates between the bay and theaquifer, are confined; for unconfined karst features the range ofvariation of the water table level (in response to the tidal ampli-tude) is small compared to the saturated thickness of the aquifer,which makes it possible to use the Jacob–Ferris equation to assessits hydrodynamic properties (Erskine, 1991), which corresponds toEq. (1):
h ¼ h0eð�xffiffiffiffiffiffiffiffiffiffiffiffipS=t0TÞp
sin 2p tt0� x
ffiffiffiffiffiffiffiffiffiffiffiffiffiffiffipS=t0T
p� �ð1Þ
where h is WL (m) above MSL; x is distance from the sea (m); t istime (d); t0 is the period of tidal oscillation (d) which for the westof Ireland is 0.52 days; h0 is the amplitude of tidal oscillation (m);T is the transmissivity of the aquifer (m2/d); and S is aquifer storage.
Tidal oscillations remain sinusoidal with a time lag (delay = d)and decrease exponentially in amplitude with distance from thesea (tidal efficiency factor = f). An analytical solution to Eq. (1) pro-vides expressions for d and f:
d ¼ x
ffiffiffiffiffiffiffiffiffiSt0
4pT
rð2aÞ
f ¼ e�xffiffiffiffipSTt0
pð2bÞ
These solutions can be rearranged into expressions for aquiferhydraulic diffusivity (D) in terms of the delay (Dd) and tidal effi-ciency (Df):
Dd ¼TS¼ ðxt0Þ=ð4pd2Þ ð3aÞ
Df ¼TS¼ xpðln f Þ2t0
ð3bÞ
The delay is the time lag between the tidal signal and WL signaland the tidal efficiency factor corresponds to the ratio of the tidalsignal with the amplitude of the WL. For each monitoring point,the delay and the tidal efficiency factor were calculated for sepa-rate 15-day periods without the influence of recharge and for dif-ferent tidal amplitudes during spring tide (ST) and neap tide(NT). The average hydraulic diffusivity was then deduced: Df fromthe tidal efficiency factor and Dd from the delay factor. This methodwas not used for B15 as no tidal influence was detected in thisborehole, probably due to its low hydraulic diffusivity and its dis-tance from the shore.
3.3. Results
The boreholes can be ranked on their hydraulic diffusivities(from highest to lowest) based on their hydrodynamic responseto recharge (Fig. 4 and Table 1):
rehole to recharge events. Borehole’s typology is illustrated in Fig. 4. Amplitude (inere estimated from recession curves. x (m) correspond to the distance from the shore
Slope of recession curve S (m/d) Type of hydrodynamic environment
6.3 Conduits2.6 Conduits/large fissuressa = 1.5/sb = 0.5/sc = 0.4 Fissures and matrix0.9 Small fissuressa = 0.7/sb = 0.3 Matrixsa = 0.7/sb = 0.1 Matrix
M. Perriquet et al. / Journal of Hydrology 519 (2014) 2350–2365 2357
� B57 is located in a zone of high hydraulic diffusivity (D1) (Sec-tion 3.1), representative of a conduit-dominated flowenvironment.� The amplitude (6.25 m) and the slope (S08 = 2.6 m/d) of the
recession curve at B08 were lower than B57 but the sloperemained relatively steep in comparison with those of otherboreholes. B08 is located in a zone of relatively high hydraulicdiffusivity (D2), representative of conduits or large fissures-dominated flow environment.� B59 showed three different slopes on its recession curve rep-
resentative of an environment with different hydraulic diffu-sivities. The steepest one (S59a = 1.5 m/d) was however lowerthan at B08 (S08 = 2.6 m/d) and the two others were particu-larly low and almost equal (S59b = 0.5 and S59c = 0.4 m/d) sug-gesting that borehole hydrodynamics are characteristic ofboth fissures and matrix-dominated flow environments (D3).These three successive slopes on its recession curve for whichtwo are representative of a poorly hydraulic diffusive zoneexplain the particularly long observed period of influence P(P59 > 10.4 d).� D4, D5 and D6 have been assigned to B05, B15 and B03 respec-
tively: despite lower amplitude observed at B05 than at B15 andB03, it has been assumed its hydraulic diffusivity is higher asthe slope of the recession curve (S05 = 0.9 m/d) was steeper thanthe ones at B15 (S15a = 0.7 and S15b = 0.3 m/d) and B03 (S03a = 0.7and S03b = 0.1 m/d), and its period of influence much shorter(similar to the one of B08). B05 is therefore considered to bemoderately connected with the karst drainage network (D4):B05 hydrodynamics would be considered as small fissures-dominated flow environment.� B15 and B03 both have smaller slopes on their recession curve
which are representative of an environment with differenthydraulic diffusivities. Their recession curves were howeververy flat and expanded (P15 = 6.4 and P03 = 9.1 d). B15 and B03are assumed to be poorly connected with the main drain karstsystem (D5 and D6) and representative of a matrix-dominatedflow environment.
The outputs from the Jacob–Ferris equations are given in Table 2.Boreholes and lakes are ranked from highest hydraulic diffusivities(B57) (only Dd has been taken account; the reasons are explainedin the discussion below) to lowest hydraulic diffusivities (B03).
Df and Dd decrease from B57 to B03 (except Df of L01 and L02)but the values are different: Df/Dd ratio of 0.3, 0.47 and 0.65 wasfound for boreholes B03, B05 and B59, respectively, and even lowerat L01 and L02 (0.15 and 0.14 respectively). When this ratio islower than 1, Df appears to be under-estimated in comparison withDd (Table 2).
Table 2Hydrodynamic response of the borehole to tidal variations. Hydraulic diffusivities (Df
and Dd in metres square/second) were calculated using tidal efficiency factor (f) anddelay factor (d, in hours).
Borehole x (m) f Df (m2/s) d (h) Dd (m2/s) Ratio Df/Dd
B57 2400 0.131 97.3 3h35 124 0.8B08 1065 0.4036 98.2 1h55 91.5 1.07B59 2300 0.0045 12.7 8h45 19.1 0.65L01 485 0.0637 2.8 2h20 18.2 0.15L02 900 0.0052 2 3h55 14.6 0.14B05 265 0.4 5.8 1h25 12.4 0.47B03 560 0.0407 2.1 3h30 7.1 0.3
Hydraulic diffusivity values in bold (Df) are assumed to be more reliable thanDd values. Values at L01 and L02 are in italics as they are not comparable withborehole values.
3.4. Discussion: Consequences in terms of intrinsic functioning of thekarst aquifer
The hydraulic diffusivities calculated using the efficiency factorand the delay factor are largely similar (Tables 1 and 2). However,as noted previously, important differences have been observedbetween the hydraulic diffusivity estimated on the basis of thetidal efficiency factor (Df) and hydraulic diffusivity calculated bythe delay equation (Dd) for B59, B15, B03, L01 and L02, showinga ratio Df/Dd decreasing with hydraulic diffusivity values (Table 2).From Eq. (1) it is assumed that head losses can affect the tidal effi-ciency factor (f) or the delay (d). For a confined homogenous aqui-fer where head losses are isotropic, Df/Dd value should be 1 (Ferrisand Branch, 1952): a difference between Dd and Df at the same dis-tance from the shore would indicate heterogeneity of the environ-ment. Head losses in the matrix are supposed to be higher than inthe conduits: at each tidal cycle, the tidal wave enters the aquiferpreferentially via the conduits that feed the matrix. Head lossesoccur in the conduits but additional head losses arise when thetidal signal propagates from the conduit through the matrix; inturn, this leads to a larger dampening of the sinusoidal wave anda higher delay of the tidal signal recorded in the matrix than inthe conduits. However, in the matrix environment, the dampeningof the tidal signal amplitude seems comparatively much moreimportant than the increase of the delay. As a consequence, in amatrix environment, the relative change of the tidal efficiency fac-tor (f) differs from the relative change of the delay (d). In this case,two boreholes located at the same distance from the shore, onedrilled in a matrix-dominated flow environment (e.g. B59 located2300 m from the shore), and the other in conduit-dominated flowenvironment (e.g. B57 located 2400 m from the shore), would havethe ratio fconduit/fmatrix > 1 and the ratio dconduit/dmatrix < 1: e.g., fB57/fB59 = 29 and dB57/dB59 = 0.4. There is a difference of two orders ofmagnitude between these two ratios. Nonetheless, the Jacob–Ferrisequation accounts for these differences in estimated hydraulic dif-fusivities by attenuating them: e.g. ratio DfB57/DfB59 = 7.7 andDdB57/DdB59 = 6.5 (Dfconduit/Dfmatrix > 1 and Ddconduit/Ddmatrix > 1).f and d are influenced by head losses but in a different way inmatrix-dominated flow environment than in conduit-dominatedflow environment. Also, given that Dfconduit/Dfmatrix > Ddconduit/Ddmatrix this confirms that the tidal efficiency factor (f) is moreaffected by head losses in matrix-dominated flow environmentthan the delay (d). Df thus appears to be more sensitive to the het-erogeneity of the aquifer than Dd. The latter may give a meanhydraulic diffusivity value of the area around the borehole andthe aquifer between the monitoring point and the shore by takinginto account all flow environments encountered (matrix, fissureand conduit); while Df may give a hydraulic diffusivity value morerepresentative of low flow dominated environment such matrix or/and fissure flow environments (if they are encountered). Thus,where Df is not affected by either matrix or fissure flow environ-ments, Df and Dd determined from the hydraulic signal in bore-holes with high hydraulic diffusivities (e.g., B57 and B08supposed to be located in conduit-dominated flow environment)are similar. The Dd value is considered as the hydraulic diffusivityreference, because it is more representative of the overall hydraulicdiffusivity of the aquifer between the monitoring point and theshore than Df.
Strong propagation biases have been also noticed in unconfinedaquifers (Jha et al., 2003) or layered aquifers when the lower layer ismore conductive than the upper layer (Trefry and Bekele, 2004) andboth concluded that Df is more reliable than Dd. The Bell Harbouraquifer may be compared to these aquifers as it is also a layeredaquifer; however, the presence of drainage system conduit/matrixmakes it confined through the saturated conduits and unconfinedin the surrounding matrix. Before it can reach a borehole located
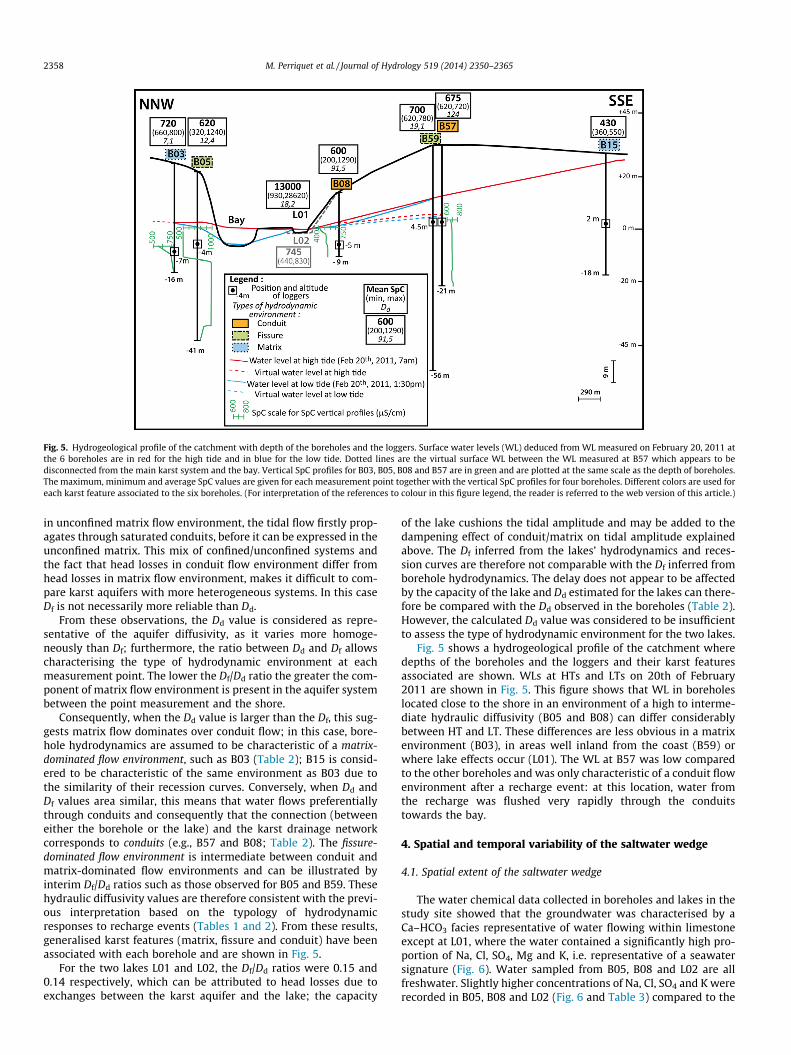
Fig. 5. Hydrogeological profile of the catchment with depth of the boreholes and the loggers. Surface water levels (WL) deduced from WL measured on February 20, 2011 atthe 6 boreholes are in red for the high tide and in blue for the low tide. Dotted lines are the virtual surface WL between the WL measured at B57 which appears to bedisconnected from the main karst system and the bay. Vertical SpC profiles for B03, B05, B08 and B57 are in green and are plotted at the same scale as the depth of boreholes.The maximum, minimum and average SpC values are given for each measurement point together with the vertical SpC profiles for four boreholes. Different colors are used foreach karst feature associated to the six boreholes. (For interpretation of the references to colour in this figure legend, the reader is referred to the web version of this article.)
2358 M. Perriquet et al. / Journal of Hydrology 519 (2014) 2350–2365
in unconfined matrix flow environment, the tidal flow firstly prop-agates through saturated conduits, before it can be expressed in theunconfined matrix. This mix of confined/unconfined systems andthe fact that head losses in conduit flow environment differ fromhead losses in matrix flow environment, makes it difficult to com-pare karst aquifers with more heterogeneous systems. In this caseDf is not necessarily more reliable than Dd.
From these observations, the Dd value is considered as repre-sentative of the aquifer diffusivity, as it varies more homoge-neously than Df; furthermore, the ratio between Dd and Df allowscharacterising the type of hydrodynamic environment at eachmeasurement point. The lower the Df/Dd ratio the greater the com-ponent of matrix flow environment is present in the aquifer systembetween the point measurement and the shore.
Consequently, when the Dd value is larger than the Df, this sug-gests matrix flow dominates over conduit flow; in this case, bore-hole hydrodynamics are assumed to be characteristic of a matrix-dominated flow environment, such as B03 (Table 2); B15 is consid-ered to be characteristic of the same environment as B03 due tothe similarity of their recession curves. Conversely, when Dd andDf values area similar, this means that water flows preferentiallythrough conduits and consequently that the connection (betweeneither the borehole or the lake) and the karst drainage networkcorresponds to conduits (e.g., B57 and B08; Table 2). The fissure-dominated flow environment is intermediate between conduit andmatrix-dominated flow environments and can be illustrated byinterim Df/Dd ratios such as those observed for B05 and B59. Thesehydraulic diffusivity values are therefore consistent with the previ-ous interpretation based on the typology of hydrodynamicresponses to recharge events (Tables 1 and 2). From these results,generalised karst features (matrix, fissure and conduit) have beenassociated with each borehole and are shown in Fig. 5.
For the two lakes L01 and L02, the Df/Dd ratios were 0.15 and0.14 respectively, which can be attributed to head losses due toexchanges between the karst aquifer and the lake; the capacity
of the lake cushions the tidal amplitude and may be added to thedampening effect of conduit/matrix on tidal amplitude explainedabove. The Df inferred from the lakes’ hydrodynamics and reces-sion curves are therefore not comparable with the Df inferred fromborehole hydrodynamics. The delay does not appear to be affectedby the capacity of the lake and Dd estimated for the lakes can there-fore be compared with the Dd observed in the boreholes (Table 2).However, the calculated Dd value was considered to be insufficientto assess the type of hydrodynamic environment for the two lakes.
Fig. 5 shows a hydrogeological profile of the catchment wheredepths of the boreholes and the loggers and their karst featuresassociated are shown. WLs at HTs and LTs on 20th of February2011 are shown in Fig. 5. This figure shows that WL in boreholeslocated close to the shore in an environment of a high to interme-diate hydraulic diffusivity (B05 and B08) can differ considerablybetween HT and LT. These differences are less obvious in a matrixenvironment (B03), in areas well inland from the coast (B59) orwhere lake effects occur (L01). The WL at B57 was low comparedto the other boreholes and was only characteristic of a conduit flowenvironment after a recharge event: at this location, water fromthe recharge was flushed very rapidly through the conduitstowards the bay.
4. Spatial and temporal variability of the saltwater wedge
4.1. Spatial extent of the saltwater wedge
The water chemical data collected in boreholes and lakes in thestudy site showed that the groundwater was characterised by aCa–HCO3 facies representative of water flowing within limestoneexcept at L01, where the water contained a significantly high pro-portion of Na, Cl, SO4, Mg and K, i.e. representative of a seawatersignature (Fig. 6). Water sampled from B05, B08 and L02 are allfreshwater. Slightly higher concentrations of Na, Cl, SO4 and K wererecorded in B05, B08 and L02 (Fig. 6 and Table 3) compared to the
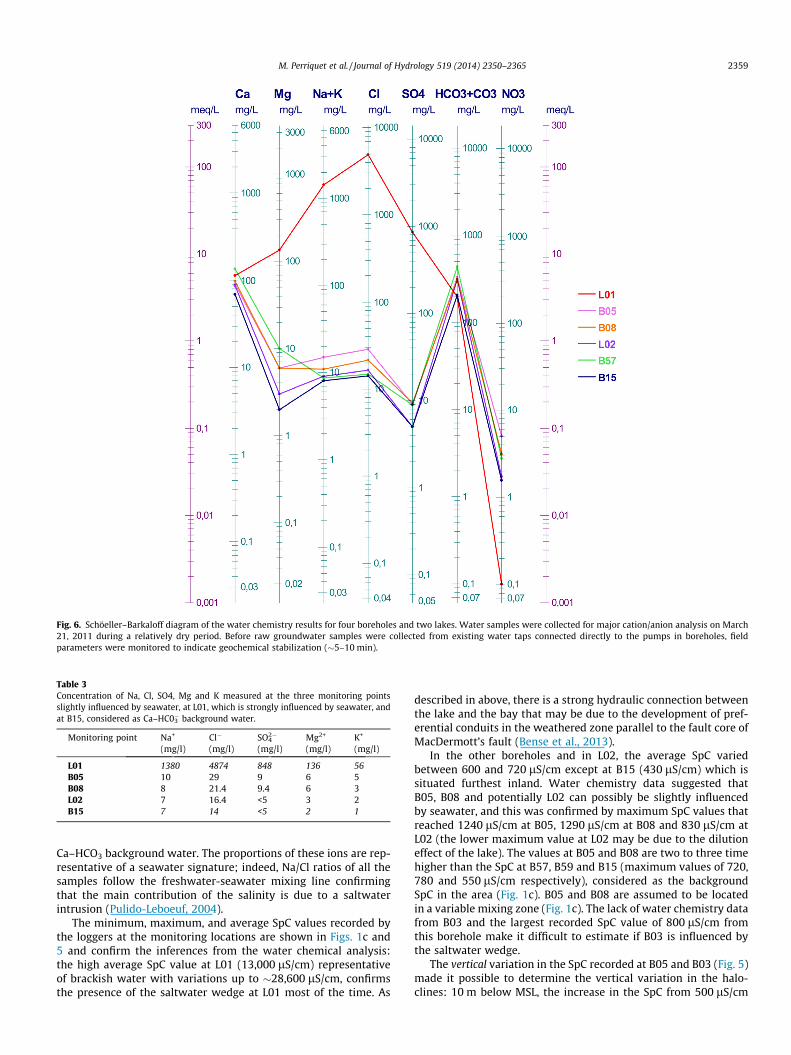
Fig. 6. Schöeller–Barkaloff diagram of the water chemistry results for four boreholes and two lakes. Water samples were collected for major cation/anion analysis on March21, 2011 during a relatively dry period. Before raw groundwater samples were collected from existing water taps connected directly to the pumps in boreholes, fieldparameters were monitored to indicate geochemical stabilization (�5–10 min).
Table 3Concentration of Na, Cl, SO4, Mg and K measured at the three monitoring pointsslightly influenced by seawater, at L01, which is strongly influenced by seawater, andat B15, considered as Ca–HC03
� background water.
Monitoring point Na+
(mg/l)Cl�
(mg/l)SO4
2�
(mg/l)Mg2+
(mg/l)K+
(mg/l)
L01 1380 4874 848 136 56B05 10 29 9 6 5B08 8 21.4 9.4 6 3L02 7 16.4 <5 3 2B15 7 14 <5 2 1
M. Perriquet et al. / Journal of Hydrology 519 (2014) 2350–2365 2359
Ca–HCO3 background water. The proportions of these ions are rep-resentative of a seawater signature; indeed, Na/Cl ratios of all thesamples follow the freshwater-seawater mixing line confirmingthat the main contribution of the salinity is due to a saltwaterintrusion (Pulido-Leboeuf, 2004).
The minimum, maximum, and average SpC values recorded bythe loggers at the monitoring locations are shown in Figs. 1c and5 and confirm the inferences from the water chemical analysis:the high average SpC value at L01 (13,000 lS/cm) representativeof brackish water with variations up to �28,600 lS/cm, confirmsthe presence of the saltwater wedge at L01 most of the time. As
described in above, there is a strong hydraulic connection betweenthe lake and the bay that may be due to the development of pref-erential conduits in the weathered zone parallel to the fault core ofMacDermott’s fault (Bense et al., 2013).
In the other boreholes and in L02, the average SpC variedbetween 600 and 720 lS/cm except at B15 (430 lS/cm) which issituated furthest inland. Water chemistry data suggested thatB05, B08 and potentially L02 can possibly be slightly influencedby seawater, and this was confirmed by maximum SpC values thatreached 1240 lS/cm at B05, 1290 lS/cm at B08 and 830 lS/cm atL02 (the lower maximum value at L02 may be due to the dilutioneffect of the lake). The values at B05 and B08 are two to three timehigher than the SpC at B57, B59 and B15 (maximum values of 720,780 and 550 lS/cm respectively), considered as the backgroundSpC in the area (Fig. 1c). B05 and B08 are assumed to be locatedin a variable mixing zone (Fig. 1c). The lack of water chemistry datafrom B03 and the largest recorded SpC value of 800 lS/cm fromthis borehole make it difficult to estimate if B03 is influenced bythe saltwater wedge.
The vertical variation in the SpC recorded at B05 and B03 (Fig. 5)made it possible to determine the vertical variation in the halo-clines: 10 m below MSL, the increase in the SpC from 500 lS/cm
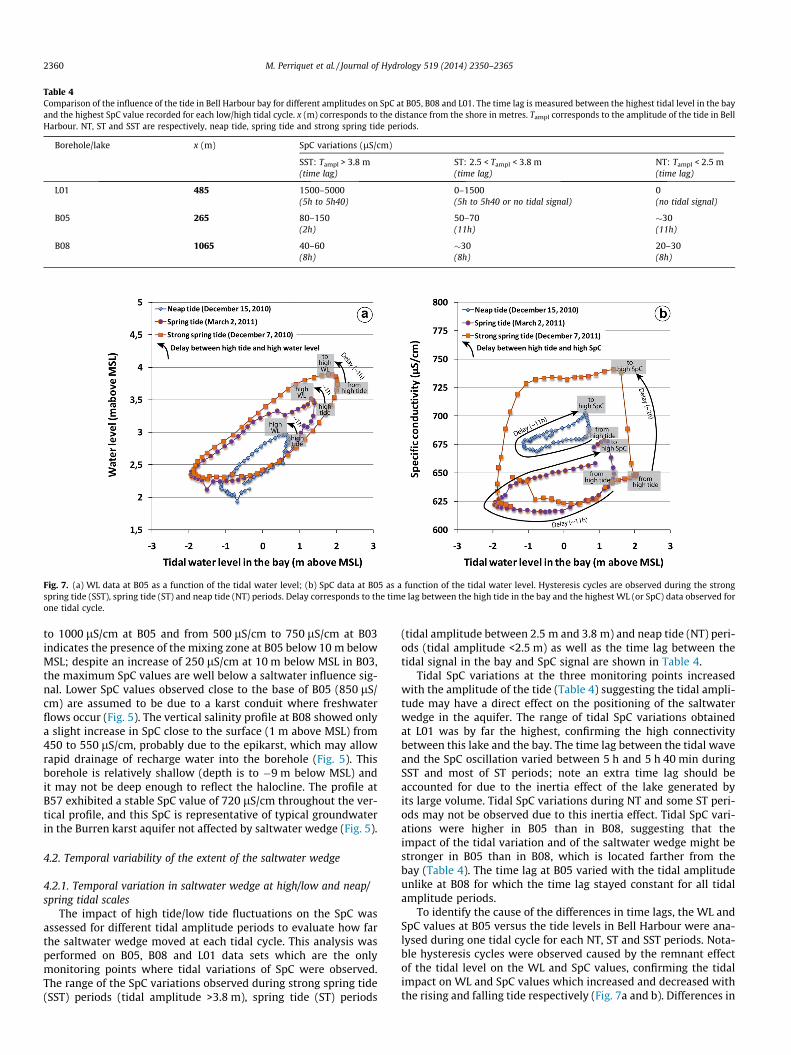
Table 4Comparison of the influence of the tide in Bell Harbour bay for different amplitudes on SpC at B05, B08 and L01. The time lag is measured between the highest tidal level in the bayand the highest SpC value recorded for each low/high tidal cycle. x (m) corresponds to the distance from the shore in metres. Tampl corresponds to the amplitude of the tide in BellHarbour. NT, ST and SST are respectively, neap tide, spring tide and strong spring tide periods.
Borehole/lake x (m) SpC variations (lS/cm)
SST: Tampl > 3.8 m ST: 2.5 < Tampl < 3.8 m NT: Tampl < 2.5 m(time lag) (time lag) (time lag)
L01 485 1500–5000 0–1500 0(5h to 5h40) (5h to 5h40 or no tidal signal) (no tidal signal)
B05 265 80–150 50–70 �30(2h) (11h) (11h)
B08 1065 40–60 �30 20–30(8h) (8h) (8h)
Fig. 7. (a) WL data at B05 as a function of the tidal water level; (b) SpC data at B05 as a function of the tidal water level. Hysteresis cycles are observed during the strongspring tide (SST), spring tide (ST) and neap tide (NT) periods. Delay corresponds to the time lag between the high tide in the bay and the highest WL (or SpC) data observed forone tidal cycle.
2360 M. Perriquet et al. / Journal of Hydrology 519 (2014) 2350–2365
to 1000 lS/cm at B05 and from 500 lS/cm to 750 lS/cm at B03indicates the presence of the mixing zone at B05 below 10 m belowMSL; despite an increase of 250 lS/cm at 10 m below MSL in B03,the maximum SpC values are well below a saltwater influence sig-nal. Lower SpC values observed close to the base of B05 (850 lS/cm) are assumed to be due to a karst conduit where freshwaterflows occur (Fig. 5). The vertical salinity profile at B08 showed onlya slight increase in SpC close to the surface (1 m above MSL) from450 to 550 lS/cm, probably due to the epikarst, which may allowrapid drainage of recharge water into the borehole (Fig. 5). Thisborehole is relatively shallow (depth is to �9 m below MSL) andit may not be deep enough to reflect the halocline. The profile atB57 exhibited a stable SpC value of 720 lS/cm throughout the ver-tical profile, and this SpC is representative of typical groundwaterin the Burren karst aquifer not affected by saltwater wedge (Fig. 5).
4.2. Temporal variability of the extent of the saltwater wedge
4.2.1. Temporal variation in saltwater wedge at high/low and neap/spring tidal scales
The impact of high tide/low tide fluctuations on the SpC wasassessed for different tidal amplitude periods to evaluate how farthe saltwater wedge moved at each tidal cycle. This analysis wasperformed on B05, B08 and L01 data sets which are the onlymonitoring points where tidal variations of SpC were observed.The range of the SpC variations observed during strong spring tide(SST) periods (tidal amplitude >3.8 m), spring tide (ST) periods
(tidal amplitude between 2.5 m and 3.8 m) and neap tide (NT) peri-ods (tidal amplitude <2.5 m) as well as the time lag between thetidal signal in the bay and SpC signal are shown in Table 4.
Tidal SpC variations at the three monitoring points increasedwith the amplitude of the tide (Table 4) suggesting the tidal ampli-tude may have a direct effect on the positioning of the saltwaterwedge in the aquifer. The range of tidal SpC variations obtainedat L01 was by far the highest, confirming the high connectivitybetween this lake and the bay. The time lag between the tidal waveand the SpC oscillation varied between 5 h and 5 h 40 min duringSST and most of ST periods; note an extra time lag should beaccounted for due to the inertia effect of the lake generated byits large volume. Tidal SpC variations during NT and some ST peri-ods may not be observed due to this inertia effect. Tidal SpC vari-ations were higher in B05 than in B08, suggesting that theimpact of the tidal variation and of the saltwater wedge might bestronger in B05 than in B08, which is located farther from thebay (Table 4). The time lag at B05 varied with the tidal amplitudeunlike at B08 for which the time lag stayed constant for all tidalamplitude periods.
To identify the cause of the differences in time lags, the WL andSpC values at B05 versus the tide levels in Bell Harbour were ana-lysed during one tidal cycle for each NT, ST and SST periods. Nota-ble hysteresis cycles were observed caused by the remnant effectof the tidal level on the WL and SpC values, confirming the tidalimpact on WL and SpC values which increased and decreased withthe rising and falling tide respectively (Fig. 7a and b). Differences in
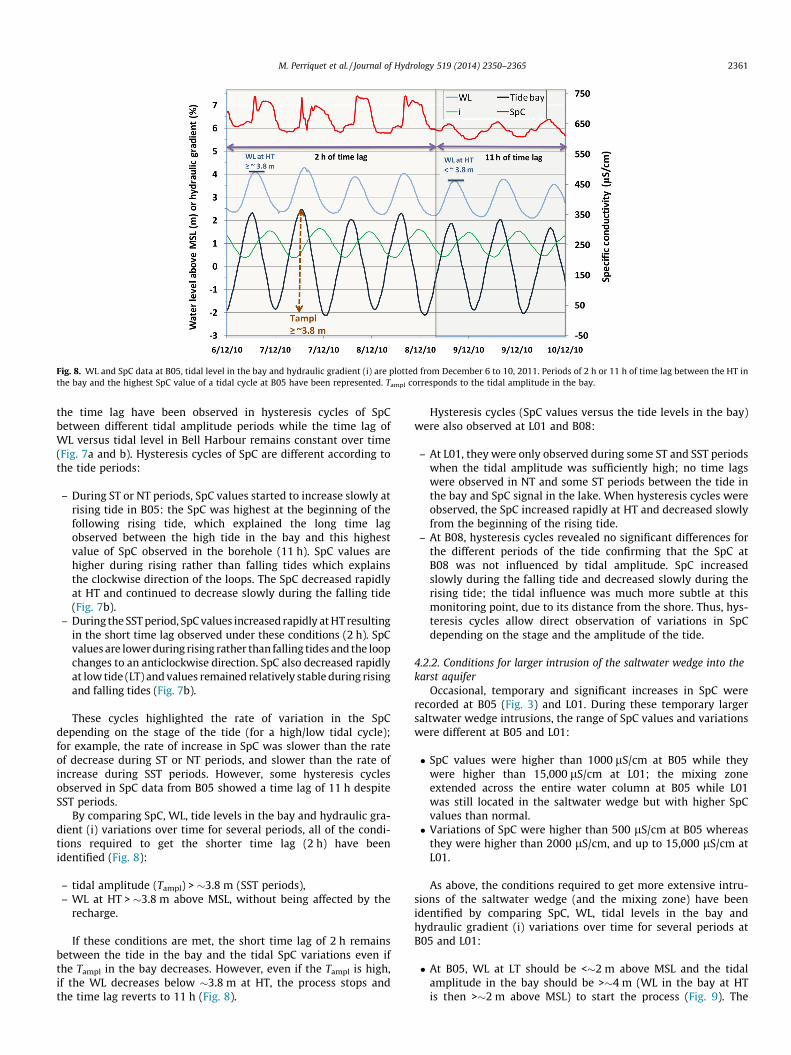
Fig. 8. WL and SpC data at B05, tidal level in the bay and hydraulic gradient (i) are plotted from December 6 to 10, 2011. Periods of 2 h or 11 h of time lag between the HT inthe bay and the highest SpC value of a tidal cycle at B05 have been represented. Tampl corresponds to the tidal amplitude in the bay.
M. Perriquet et al. / Journal of Hydrology 519 (2014) 2350–2365 2361
the time lag have been observed in hysteresis cycles of SpCbetween different tidal amplitude periods while the time lag ofWL versus tidal level in Bell Harbour remains constant over time(Fig. 7a and b). Hysteresis cycles of SpC are different according tothe tide periods:
– During ST or NT periods, SpC values started to increase slowly atrising tide in B05: the SpC was highest at the beginning of thefollowing rising tide, which explained the long time lagobserved between the high tide in the bay and this highestvalue of SpC observed in the borehole (11 h). SpC values arehigher during rising rather than falling tides which explainsthe clockwise direction of the loops. The SpC decreased rapidlyat HT and continued to decrease slowly during the falling tide(Fig. 7b).
– During the SST period, SpC values increased rapidly at HT resultingin the short time lag observed under these conditions (2 h). SpCvalues are lower during rising rather than falling tides and the loopchanges to an anticlockwise direction. SpC also decreased rapidlyat low tide (LT) and values remained relatively stable during risingand falling tides (Fig. 7b).
These cycles highlighted the rate of variation in the SpCdepending on the stage of the tide (for a high/low tidal cycle);for example, the rate of increase in SpC was slower than the rateof decrease during ST or NT periods, and slower than the rate ofincrease during SST periods. However, some hysteresis cyclesobserved in SpC data from B05 showed a time lag of 11 h despiteSST periods.
By comparing SpC, WL, tide levels in the bay and hydraulic gra-dient (i) variations over time for several periods, all of the condi-tions required to get the shorter time lag (2 h) have beenidentified (Fig. 8):
– tidal amplitude (Tampl) > �3.8 m (SST periods),– WL at HT > �3.8 m above MSL, without being affected by the
recharge.
If these conditions are met, the short time lag of 2 h remainsbetween the tide in the bay and the tidal SpC variations even ifthe Tampl in the bay decreases. However, even if the Tampl is high,if the WL decreases below �3.8 m at HT, the process stops andthe time lag reverts to 11 h (Fig. 8).
Hysteresis cycles (SpC values versus the tide levels in the bay)were also observed at L01 and B08:
– At L01, they were only observed during some ST and SST periodswhen the tidal amplitude was sufficiently high; no time lagswere observed in NT and some ST periods between the tide inthe bay and SpC signal in the lake. When hysteresis cycles wereobserved, the SpC increased rapidly at HT and decreased slowlyfrom the beginning of the rising tide.
– At B08, hysteresis cycles revealed no significant differences forthe different periods of the tide confirming that the SpC atB08 was not influenced by tidal amplitude. SpC increasedslowly during the falling tide and decreased slowly during therising tide; the tidal influence was much more subtle at thismonitoring point, due to its distance from the shore. Thus, hys-teresis cycles allow direct observation of variations in SpCdepending on the stage and the amplitude of the tide.
4.2.2. Conditions for larger intrusion of the saltwater wedge into thekarst aquifer
Occasional, temporary and significant increases in SpC wererecorded at B05 (Fig. 3) and L01. During these temporary largersaltwater wedge intrusions, the range of SpC values and variationswere different at B05 and L01:
� SpC values were higher than 1000 lS/cm at B05 while theywere higher than 15,000 lS/cm at L01; the mixing zoneextended across the entire water column at B05 while L01was still located in the saltwater wedge but with higher SpCvalues than normal.� Variations of SpC were higher than 500 lS/cm at B05 whereas
they were higher than 2000 lS/cm, and up to 15,000 lS/cm atL01.
As above, the conditions required to get more extensive intru-sions of the saltwater wedge (and the mixing zone) have beenidentified by comparing SpC, WL, tidal levels in the bay andhydraulic gradient (i) variations over time for several periods atB05 and L01:
� At B05, WL at LT should be <�2 m above MSL and the tidalamplitude in the bay should be >�4 m (WL in the bay at HTis then >�2 m above MSL) to start the process (Fig. 9). The
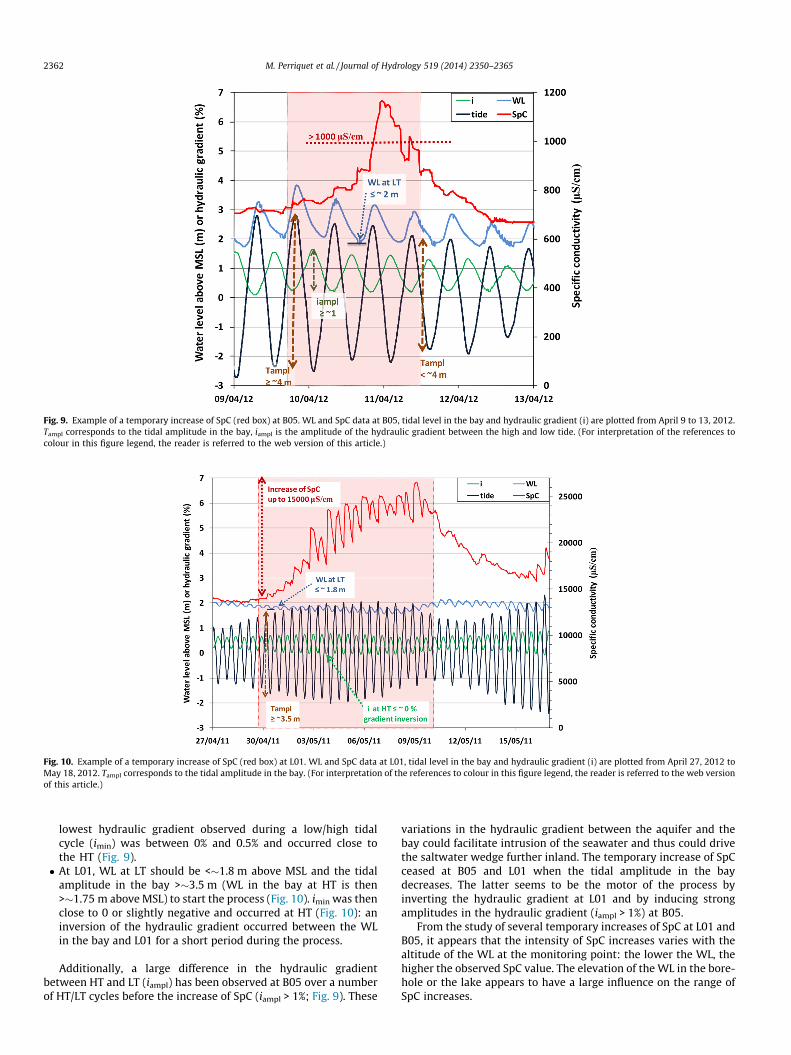
Fig. 9. Example of a temporary increase of SpC (red box) at B05. WL and SpC data at B05, tidal level in the bay and hydraulic gradient (i) are plotted from April 9 to 13, 2012.Tampl corresponds to the tidal amplitude in the bay, iampl is the amplitude of the hydraulic gradient between the high and low tide. (For interpretation of the references tocolour in this figure legend, the reader is referred to the web version of this article.)
Fig. 10. Example of a temporary increase of SpC (red box) at L01. WL and SpC data at L01, tidal level in the bay and hydraulic gradient (i) are plotted from April 27, 2012 toMay 18, 2012. Tampl corresponds to the tidal amplitude in the bay. (For interpretation of the references to colour in this figure legend, the reader is referred to the web versionof this article.)
2362 M. Perriquet et al. / Journal of Hydrology 519 (2014) 2350–2365
lowest hydraulic gradient observed during a low/high tidalcycle (imin) was between 0% and 0.5% and occurred close tothe HT (Fig. 9).� At L01, WL at LT should be <�1.8 m above MSL and the tidal
amplitude in the bay >�3.5 m (WL in the bay at HT is then>�1.75 m above MSL) to start the process (Fig. 10). imin was thenclose to 0 or slightly negative and occurred at HT (Fig. 10): aninversion of the hydraulic gradient occurred between the WLin the bay and L01 for a short period during the process.
Additionally, a large difference in the hydraulic gradientbetween HT and LT (iampl) has been observed at B05 over a numberof HT/LT cycles before the increase of SpC (iampl > 1%; Fig. 9). These
variations in the hydraulic gradient between the aquifer and thebay could facilitate intrusion of the seawater and thus could drivethe saltwater wedge further inland. The temporary increase of SpCceased at B05 and L01 when the tidal amplitude in the baydecreases. The latter seems to be the motor of the process byinverting the hydraulic gradient at L01 and by inducing strongamplitudes in the hydraulic gradient (iampl > 1%) at B05.
From the study of several temporary increases of SpC at L01 andB05, it appears that the intensity of SpC increases varies with thealtitude of the WL at the monitoring point: the lower the WL, thehigher the observed SpC value. The elevation of the WL in the bore-hole or the lake appears to have a large influence on the range ofSpC increases.
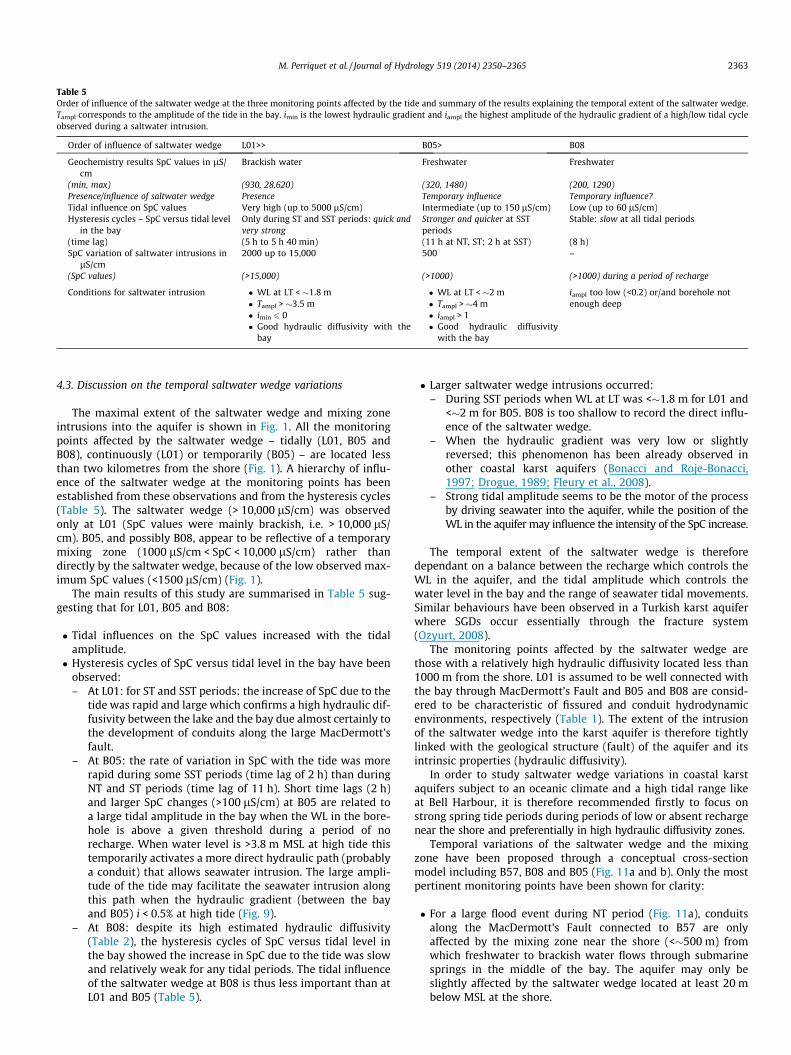
Table 5Order of influence of the saltwater wedge at the three monitoring points affected by the tide and summary of the results explaining the temporal extent of the saltwater wedge.Tampl corresponds to the amplitude of the tide in the bay. imin is the lowest hydraulic gradient and iampl the highest amplitude of the hydraulic gradient of a high/low tidal cycleobserved during a saltwater intrusion.
Order of influence of saltwater wedge L01>> B05> B08
Geochemistry results SpC values in lS/cm
Brackish water Freshwater Freshwater
(min, max) (930, 28,620) (320, 1480) (200, 1290)Presence/influence of saltwater wedge Presence Temporary influence Temporary influence?Tidal influence on SpC values Very high (up to 5000 lS/cm) Intermediate (up to 150 lS/cm) Low (up to 60 lS/cm)Hysteresis cycles – SpC versus tidal level
in the bayOnly during ST and SST periods: quick andvery strong
Stronger and quicker at SSTperiods
Stable: slow at all tidal periods
(time lag) (5 h to 5 h 40 min) (11 h at NT, ST; 2 h at SST) (8 h)SpC variation of saltwater intrusions in
lS/cm2000 up to 15,000 500 –
(SpC values) (>15,000) (>1000) (>1000) during a period of recharge
Conditions for saltwater intrusion � WL at LT < �1.8 m� Tampl > �3.5 m� imin 6 0� Good hydraulic diffusivity with the
bay
� WL at LT < �2 m� Tampl > �4 m� iampl > 1� Good hydraulic diffusivity
with the bay
iampl too low (<0.2) or/and borehole notenough deep
M. Perriquet et al. / Journal of Hydrology 519 (2014) 2350–2365 2363
4.3. Discussion on the temporal saltwater wedge variations
The maximal extent of the saltwater wedge and mixing zoneintrusions into the aquifer is shown in Fig. 1. All the monitoringpoints affected by the saltwater wedge – tidally (L01, B05 andB08), continuously (L01) or temporarily (B05) – are located lessthan two kilometres from the shore (Fig. 1). A hierarchy of influ-ence of the saltwater wedge at the monitoring points has beenestablished from these observations and from the hysteresis cycles(Table 5). The saltwater wedge (> 10,000 lS/cm) was observedonly at L01 (SpC values were mainly brackish, i.e. > 10,000 lS/cm). B05, and possibly B08, appear to be reflective of a temporarymixing zone (1000 lS/cm < SpC < 10,000 lS/cm) rather thandirectly by the saltwater wedge, because of the low observed max-imum SpC values (<1500 lS/cm) (Fig. 1).
The main results of this study are summarised in Table 5 sug-gesting that for L01, B05 and B08:
� Tidal influences on the SpC values increased with the tidalamplitude.� Hysteresis cycles of SpC versus tidal level in the bay have been
observed:– At L01: for ST and SST periods: the increase of SpC due to the
tide was rapid and large which confirms a high hydraulic dif-fusivity between the lake and the bay due almost certainly tothe development of conduits along the large MacDermott’sfault.
– At B05: the rate of variation in SpC with the tide was morerapid during some SST periods (time lag of 2 h) than duringNT and ST periods (time lag of 11 h). Short time lags (2 h)and larger SpC changes (>100 lS/cm) at B05 are related toa large tidal amplitude in the bay when the WL in the bore-hole is above a given threshold during a period of norecharge. When water level is >3.8 m MSL at high tide thistemporarily activates a more direct hydraulic path (probablya conduit) that allows seawater intrusion. The large ampli-tude of the tide may facilitate the seawater intrusion alongthis path when the hydraulic gradient (between the bayand B05) i < 0.5% at high tide (Fig. 9).
– At B08: despite its high estimated hydraulic diffusivity(Table 2), the hysteresis cycles of SpC versus tidal level inthe bay showed the increase in SpC due to the tide was slowand relatively weak for any tidal periods. The tidal influenceof the saltwater wedge at B08 is thus less important than atL01 and B05 (Table 5).
� Larger saltwater wedge intrusions occurred:– During SST periods when WL at LT was <�1.8 m for L01 and
<�2 m for B05. B08 is too shallow to record the direct influ-ence of the saltwater wedge.
– When the hydraulic gradient was very low or slightlyreversed; this phenomenon has been already observed inother coastal karst aquifers (Bonacci and Roje-Bonacci,1997; Drogue, 1989; Fleury et al., 2008).
– Strong tidal amplitude seems to be the motor of the processby driving seawater into the aquifer, while the position of theWL in the aquifer may influence the intensity of the SpC increase.
The temporal extent of the saltwater wedge is thereforedependant on a balance between the recharge which controls theWL in the aquifer, and the tidal amplitude which controls thewater level in the bay and the range of seawater tidal movements.Similar behaviours have been observed in a Turkish karst aquiferwhere SGDs occur essentially through the fracture system(Ozyurt, 2008).
The monitoring points affected by the saltwater wedge arethose with a relatively high hydraulic diffusivity located less than1000 m from the shore. L01 is assumed to be well connected withthe bay through MacDermott’s Fault and B05 and B08 are consid-ered to be characteristic of fissured and conduit hydrodynamicenvironments, respectively (Table 1). The extent of the intrusionof the saltwater wedge into the karst aquifer is therefore tightlylinked with the geological structure (fault) of the aquifer and itsintrinsic properties (hydraulic diffusivity).
In order to study saltwater wedge variations in coastal karstaquifers subject to an oceanic climate and a high tidal range likeat Bell Harbour, it is therefore recommended firstly to focus onstrong spring tide periods during periods of low or absent rechargenear the shore and preferentially in high hydraulic diffusivity zones.
Temporal variations of the saltwater wedge and the mixingzone have been proposed through a conceptual cross-sectionmodel including B57, B08 and B05 (Fig. 11a and b). Only the mostpertinent monitoring points have been shown for clarity:
� For a large flood event during NT period (Fig. 11a), conduitsalong the MacDermott’s Fault connected to B57 are onlyaffected by the mixing zone near the shore (<�500 m) fromwhich freshwater to brackish water flows through submarinesprings in the middle of the bay. The aquifer may only beslightly affected by the saltwater wedge located at least 20 mbelow MSL at the shore.
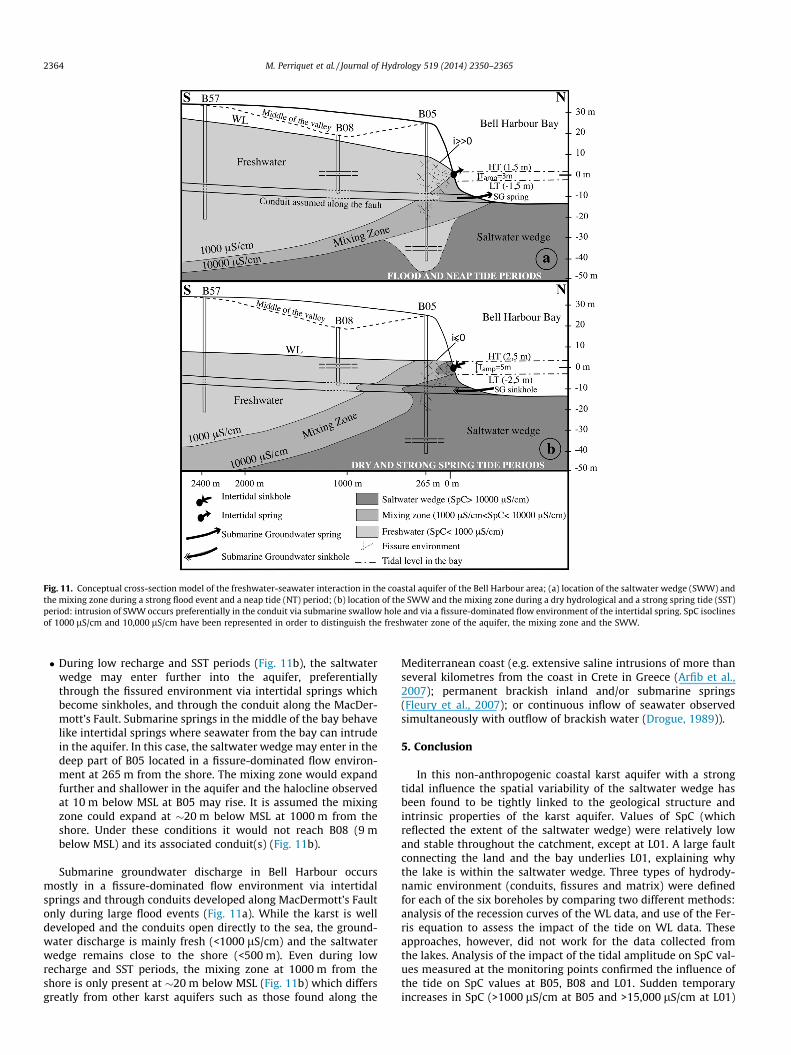
Fig. 11. Conceptual cross-section model of the freshwater-seawater interaction in the coastal aquifer of the Bell Harbour area; (a) location of the saltwater wedge (SWW) andthe mixing zone during a strong flood event and a neap tide (NT) period; (b) location of the SWW and the mixing zone during a dry hydrological and a strong spring tide (SST)period: intrusion of SWW occurs preferentially in the conduit via submarine swallow hole and via a fissure-dominated flow environment of the intertidal spring. SpC isoclinesof 1000 lS/cm and 10,000 lS/cm have been represented in order to distinguish the freshwater zone of the aquifer, the mixing zone and the SWW.
2364 M. Perriquet et al. / Journal of Hydrology 519 (2014) 2350–2365
� During low recharge and SST periods (Fig. 11b), the saltwaterwedge may enter further into the aquifer, preferentiallythrough the fissured environment via intertidal springs whichbecome sinkholes, and through the conduit along the MacDer-mott’s Fault. Submarine springs in the middle of the bay behavelike intertidal springs where seawater from the bay can intrudein the aquifer. In this case, the saltwater wedge may enter in thedeep part of B05 located in a fissure-dominated flow environ-ment at 265 m from the shore. The mixing zone would expandfurther and shallower in the aquifer and the halocline observedat 10 m below MSL at B05 may rise. It is assumed the mixingzone could expand at �20 m below MSL at 1000 m from theshore. Under these conditions it would not reach B08 (9 mbelow MSL) and its associated conduit(s) (Fig. 11b).
Submarine groundwater discharge in Bell Harbour occursmostly in a fissure-dominated flow environment via intertidalsprings and through conduits developed along MacDermott’s Faultonly during large flood events (Fig. 11a). While the karst is welldeveloped and the conduits open directly to the sea, the ground-water discharge is mainly fresh (<1000 lS/cm) and the saltwaterwedge remains close to the shore (<500 m). Even during lowrecharge and SST periods, the mixing zone at 1000 m from theshore is only present at �20 m below MSL (Fig. 11b) which differsgreatly from other karst aquifers such as those found along the
Mediterranean coast (e.g. extensive saline intrusions of more thanseveral kilometres from the coast in Crete in Greece (Arfib et al.,2007); permanent brackish inland and/or submarine springs(Fleury et al., 2007); or continuous inflow of seawater observedsimultaneously with outflow of brackish water (Drogue, 1989)).
5. Conclusion
In this non-anthropogenic coastal karst aquifer with a strongtidal influence the spatial variability of the saltwater wedge hasbeen found to be tightly linked to the geological structure andintrinsic properties of the karst aquifer. Values of SpC (whichreflected the extent of the saltwater wedge) were relatively lowand stable throughout the catchment, except at L01. A large faultconnecting the land and the bay underlies L01, explaining whythe lake is within the saltwater wedge. Three types of hydrody-namic environment (conduits, fissures and matrix) were definedfor each of the six boreholes by comparing two different methods:analysis of the recession curves of the WL data, and use of the Fer-ris equation to assess the impact of the tide on WL data. Theseapproaches, however, did not work for the data collected fromthe lakes. Analysis of the impact of the tidal amplitude on SpC val-ues measured at the monitoring points confirmed the influence ofthe tide on SpC values at B05, B08 and L01. Sudden temporaryincreases in SpC (>1000 lS/cm at B05 and >15,000 lS/cm at L01)
M. Perriquet et al. / Journal of Hydrology 519 (2014) 2350–2365 2365
in the aquifer during low recharge periods were observed at B05and L01. They occurred when (i) the tidal amplitude was large(>3.8–4 m), (ii) and the WL was low (<1.8–2 m). The temporal var-iability of the extent of the saltwater wedge was shown to dependon the balance between the influence of recharge and the influenceof the tide on the hydrodynamics of the aquifer. The WL in theaquifer seems to control the intensity of the SpC increase whilethe amplitude of the tide seems to be the motor of the process.The WL in the aquifer has been almost always higher (or brieflyequal at B05 or slighlty lower at L01) than the tidal level in thebay and the saltwater wedge has never been observed farther thanone kilometre inland. The constant and relatively large rechargetypical of this coastal zone maintains aquifer water levels highenough to protect it against extensive saltwater intrusions. Thepresence of the saltwater wedge at L01 is assumed to be due tothe direct connection to the bay via conduits developed along alarge fault. This work highlighted the nature of the balancebetween tidal levels and water levels in the aquifer and providesa starting point for assessing likely impacts in these coastal zonesin coming decades. Modest increases in recharge coupled with thepredicted rises in sea levels in coming decades may lead to increaseoccurrences of inland flooding under non-extreme conditions andmay lead to shifts in the type and extent of the saltwater wedge.Characterising coastal karst catchments and collection of sufficientand appropriate data from the terrestrial and the marine environ-ments will be critical to predicting and managing these dynamicenvironments.
Acknowledgments
Funding for this project was provided by the National Univer-sity of Ireland (NUI), Galway, Griffith Geoscience Award, whichwas based on research grant-aided by the Department of Commu-nications, Energy and Natural Resources under the National Geo-science Programme 2007–2013. We gratefully acknowledge thefield and logistical support provided by John Coyne, Colin Brown,Yvonne O’Connell and the research students and EOS staff of NUIG.Our thanks also go to the owners of the boreholes.
References
Arfib, B., De Marsily, G., Ganoulis, J., 2002. Les sources karstiques côtières enMéditerranée: étude des mécanismes de pollution saline de l’Almyrosd’Héraklion (Crète), observations et modélisation. Bull. Soc. géol. France, 245–253.
Arfib, B., De Marsily, G., Ganoulis, J., 2007. Locating the zone of saline intrusion in acoastal karst aquifer using springflow data. Ground Water 45 (1), 28–35.
Bakalowicz, M., 2005. Karst groundwater: a challenge for new resources. Hydrogeol.J. 13 (1), 148–160.
Bayari, C.S. et al., 2010. Submarine and coastal karstic groundwater dischargesalong the southwestern Mediterranean coast of Turkey. Hydrogeol. J., 1–16.
Beddows, P.A., Smart, P.L., Whitaker, F.F., Smith, S.L., 2007. Decoupled fresh-salinegroundwater circulation of a coastal carbonate aquifer: spatial patterns oftemperature and specific electrical conductivity. J. Hydrol. 346 (1–2), 18–32.
Bense, V., Gleeson, T., Loveless, S., Bour, O., Scibek, J., 2013. Fault zone hydrogeology.Earth Sci. Rev. 127, 171–192.
Blavoux, B., Gilli, E., Rousset, C., 2004. Alimentation et origine de la salinité de lasource sous-marine de Port-Miou (Marseille-Cassis). Principale émergence d’unréseau karstique hérité du Messinien. Comptes Rendus Geosci. 336 (6), 523–533.
Bonacci, O., Roje-Bonacci, T., 1997. Sea water intrusion in coastal karst springs:example of the BlaÅ3=4 Spring (Croatia). Hydrol. Sci. J. 42 (1), 89–100.
Cooper, H., 1959. A hypothesis concerning the dynamic balance of fresh water andsalt water in a coastal aquifer. J. Geophys. Res. 64 (4), 461–467.
Dörfliger, N., Willwer, C., 2005. Introduction, Hydraulics and hydrodynamics inGroundwater management of coastal karstic aquifers. European Cooperation inthe Field of Technical Research: Environment, EUR21366EN (Cost Action 621),EC, Brussels.
Drew, D., 2001. Classic landforms of the Burren karst. Geographical Association inConjunction With the British Geomorpological Research Group.
Drew, D., 2003. The hydrology of the Burren and of Clare and Galway lowlands.Caves of County Clare and South Galway. University of Bristol SpelaeologicalSociety, Bristol, United Kingdom, pp. 31–42.
Drew, D., Daly, D., 1993. Groundwater and karstification in mid-Galway, southMayo and north Clare. A joint Report: Department of Geography, Trinity CollegeDublin and Groundwater Section, Geological Survey of Ireland, Dublin, 86.Geological Survey of Ireland.
Drogue, C., 1989. Continuous inflow of seawater and outflow of brackish water inthe substratum of the karstic island of Cephalonia, Greece. J. Hydrol. 106 (1),147–153.
Drogue, C., Razack, M., Krivic, P., 1984. Survey of a coastal karstic aquifer by analysisof the effect of the sea-tide: Example of the Kras of Slovenia, Yugoslavia.Environ. Geol. 6 (2), 103–109.
Erskine, A., 1991. Effect of tidal fluctuation on a coastal aquifer in the UK. GroundWater 29 (4), 556–562.
Ferguson, G., Gleeson, T., 2012. Vulnerability of coastal aquifers to groundwater useand climate change. Nature Climate Change 2 (5), 342–345.
Ferris, J., Branch, G.S.G.W., 1952. Cyclic fluctuations of water level as a basis fordetermining aquifer transmissibility. US Dept. of the Interior, Geological Survey,Water Resources Division, Ground Water Branch.
Fleury, P., Bakalowicz, M., de Marsily, G., 2007. Submarine springs and coastal karstaquifers: a review. J. Hydrol. 339 (1–2), 79–92.
Fleury, P., Bakalowicz, M., Marsily, G., Cortes, J.M., 2008. Functioning of a coastalkarstic system with a submarine outlet, in southern Spain. Hydrogeol. J. 16 (1),75–85.
Gallagher, S.J., MacDermot, C.V., Somerville, I.D., Pracht, M., Sleeman, A.G., 2006.Biostratigraphy, microfacies and depositional environments of upper Viséanlimestones from the Burren region, County Clare, Ireland. Geol. J.41 (1), 61–91.
Gillespie, P., Walsh, J., Watterson, J., Bonson, C., Manzocchi, T., 2001. Scalingrelationships of joint and vein arrays from The Burren, Co., Clare, Ireland. J.Struct. Geol. 23 (2–3), 183–201.
Guo, H., Jiao, J.J., Li, H., 2010. Groundwater response to tidal fluctuation in a two-zone aquifer. J. Hydrol. 381 (3–4), 364–371.
Henry, H.R., 1959. Salt intrusion into fresh-water aquifers. J. Geophys. Res. 64 (11),1911–1919.
Herzberg, D., 1901. Die wasserversorgung einiger nordseebäder. J. Gasbeleucht.Verw. Beleuchtungsarten Wasserversorg. 44 (815–819), 842–844.
Hubbert, M.K., 1940. The theory of ground-water motion. J. Geol., 785–944.Jacob, C., 1950. Flow of groundwater. Chap, pp. 321.Jha, M.K., Kamii, Y., Chikamori, K., 2003. On the estimation of phreatic aquifer
parameters by the tidal response technique. Water Resour. Manage 17 (1), 69–88.
Judd, B., Mullan, G., 1994. Poll Na Gcéim, County Clare Ireland. In: Proc. Univ. BristolSpelacol. Sot.
Li, H., Jiao, J., 2002. Analytical solutions of tidal groundwater flow in coastal two-aquifer system. Adv. Water Resour. 25 (4), 417–426.
Li, L., Barry, D., Cunningham, C., Stagnitti, F., Parlange, J., 2000. A two-dimensionalanalytical solution of groundwater responses to tidal loading in an estuary andocean. Adv. Water Resour. 23 (8), 825–833.
Maramathas, A., Maroulis, Z., Marinos-Kouris, D., 2003. Brackish karstic springsmodel: application to almiros spring in crete. Ground Water 41 (5), 608–619.
Martin, J.B., Gulley, J., Spellman, P., 2012. Tidal pumping of water betweenBahamian blue holes, aquifers, and the ocean. J. Hydrol. 416–417, 28–38.
Moore, Y., Stoessell, R., Easley, D., 1992. Fresh-water/sea-water relationship withina ground-water flow system, northeastern coast of the Yucatan Peninsula.Ground Water, 30.
Ozyurt, N.N., 2008. Analysis of drivers governing temporal salinity and temperaturevariations in groundwater discharge from Altug Submarine Karst Cave (Kas-Turkey). Environ. Geol. 54 (4), 731–736.
Powers, J.G., Shevenell, L., 2000. Transmissivity estimates from well hydrographs inkarst and fractured aquifers. Ground Water 38 (3), 361–369.
Pracht, M. et al., 2004. Geology of Galway Bay. A geological description toaccompany the Bedrock Geology, 1(100,000).
Pulido-Leboeuf, P., 2004. Seawater intrusion and associated processes in a smallcoastal complex aquifer (Castell de Ferro, Spain). Appl. Geochem. 19 (10), 1517–1527.
Rotzoll, K., Gingerich, S.B., Jenson, J.W., El-Kadi, A.I., 2013. Estimating hydraulicproperties from tidal attenuation in the Northern Guam Lens Aquifer, territoryof Guam, USA. Hydrogeol. J., 1–12.
Shevenell, L., 1996. Analysis of well hydrographs in a karst aquifer: estimates ofspecific yields and continuum transmissivities. J. Hydrol. 174 (3–4), 331–355.
Simms, M., 2001. Exploring the limestone landscapes of the Burren and the Gortlowlands. Burrenkarst. com. Belfast.
Smith, A.J., 1999. Application of a Tidal Method for Estimating Aquifer Diffusivity:Swan River. CSIRO Land and Water, Western Australia.
Stringfield, V.T., LeGrand, H.E., 1971. Effects of karst features on circulation of waterin carbonate rocks in coastal areas. J. Hydrol. 14 (2), 139–157.
Townley, L.R., 1995. The response of aquifers to periodic forcing. Adv. Water Resour.18 (3), 125–146.
Trefry, M.G., 1999. Periodic forcing in composite aquifers. Adv. Water Resour. 22 (6),645–656.
Trefry, M., Bekele, E., 2004. Structural characterization of an island aquifer via tidalmethods. Water Resour. Res. 40 (1), W01505.
Tulipano, L., 2005. Groundwater management of coastal karstic aquifers. EuropeanCooperation in the Field of Technical Research: Environment, EUR21366EN(Cost Action 621), EC, Brussels.
Walsh, S., 2012. A Summary of Climate Averages for Ireland. Met Eireann, Dublin.
Related Documents