uTrade Analysis Series Salt Sector Pakistan 2020 Turn Potential into Profit! Small and Medium Enterprises Development Authority (SMEDA) Ministry of Industries and Production Government of Pakistan www.smeda.org.pk UAN: 111 111 456 Trade Analysis Series

Welcome message from author
This document is posted to help you gain knowledge. Please leave a comment to let me know what you think about it! Share it to your friends and learn new things together.
Transcript
uTrade Analysis Series
Salt Sector Pakistan
2020
Turn Potential into Profit!
Small and Medium Enterprises Development Authority (SMEDA) Ministry of Industries and Production
Government of Pakistan www.smeda.org.pk UAN: 111 111 456
Trade Analysis Series
[TRADE ANALYSIS - SALT SECTOR PAKISTAN] 1
Small and Medium Enterprises Development Authority (SMEDA)
Disclaimer
The purpose and scope of this information memorandum is to introduce the subject matter and provide
a general idea and information in this regard. All the material included in this document is based on data/
information gathered from various sources and is based on certain assumptions. Although, due care and
diligence has been taken to compile this document, the contained information may vary due to any
change in any of the factors concerned, and the actual results may differ substantially from the presented
information. SMEDA does not assume any liability for any financial or other loss resulting from this
memorandum in consequence of undertaking any activity. The prospective user of this memorandum is
encouraged to carry out additional diligence and gather any information he / she feels necessary for
making an informed decision
For more information on services offered by SMEDA, please contact our website: www.smeda.org.pk

[TRADE ANALYSIS - SALT SECTOR PAKISTAN] 2
Small and Medium Enterprises Development Authority (SMEDA)
1 Product Description
Salt is the commercial name of the naturally occurring mineral halite which has chemical composition as
sodium chloride. It is one of the most important members of the evaporate series of minerals. Pakistan is
one of the very few countries that have been bestowed with all types of available salt in the world. i.e.
Rock Salt, Sea Salt and Salt Lake. The total reserves of rock salt deposits in Pakistan are inexhaustible.
Geological survey has determined the existence of 10.54 billion tons of rock salt reserves at Bahadur Khel
in District Kohat. Similarly, Khewra Salt Mine is the second largest salt range of the world. It covers an area
of 110 sq. km), having over 40 kilometers of tunnels running some 730 meters.
The total global salt production during the year 2019 was estimated to be around 293 million metric tons
with China as largest Salt producing country followed by the United States of America1. The harmonized
Commodity Description and Coding System (referred as HS Codes) designated for trade of Salt products
is classified under the HS Code category 25. The brief description of sub-categories falling under Salt
products include the following:
Table 1: Salt Products Classification
Product Category
HS Code Product Description
250100 Salts including table salts, denaturized salts & pure sodium chloride
25010010 Table salt
25010020 Rock salt
25010090 Other forms of salt
Source: Trade Map
2 Global Trade of Salt Products
Salt products play an essential part in the global economy given it is an essential part of human needs
related to nutrition, preservation of food items as well as having various industrial applications. The total
market size of global trade in Salt Products was estimated to be around US $ 3 billion during 2019 – falling
by 9.6% in value compared to the previous year. During the last five years the global trade value of Salt
products has grown at a Compound Aggregate Growth Rate (CAGR) of 3.0%.
1 World Atlas & Statista
[TRADE ANALYSIS - SALT SECTOR PAKISTAN] 3
Small and Medium Enterprises Development Authority (SMEDA)
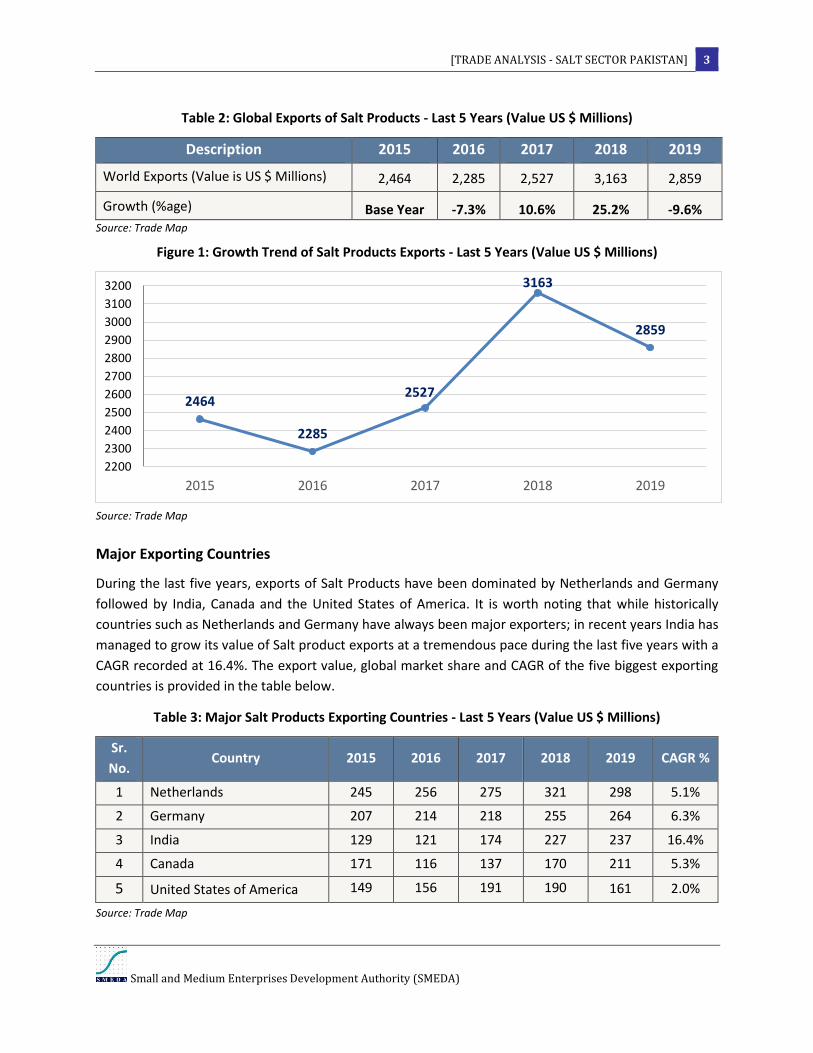
Table 2: Global Exports of Salt Products - Last 5 Years (Value US $ Millions)
Description 2015 2016 2017 2018 2019
World Exports (Value is US $ Millions) 2,464 2,285 2,527 3,163 2,859
Growth (%age) Base Year -7.3% 10.6% 25.2% -9.6% Source: Trade Map
Figure 1: Growth Trend of Salt Products Exports - Last 5 Years (Value US $ Millions)
Source: Trade Map
Major Exporting Countries
During the last five years, exports of Salt Products have been dominated by Netherlands and Germany
followed by India, Canada and the United States of America. It is worth noting that while historically
countries such as Netherlands and Germany have always been major exporters; in recent years India has
managed to grow its value of Salt product exports at a tremendous pace during the last five years with a
CAGR recorded at 16.4%. The export value, global market share and CAGR of the five biggest exporting
countries is provided in the table below.
Table 3: Major Salt Products Exporting Countries - Last 5 Years (Value US $ Millions)
Sr.
No. Country 2015 2016 2017 2018 2019 CAGR %
1 Netherlands 245 256 275 321 298 5.1%
2 Germany 207 214 218 255 264 6.3%
3 India 129 121 174 227 237 16.4%
4 Canada 171 116 137 170 211 5.3%
5 United States of America 149 156 191 190 161 2.0%
Source: Trade Map
2464
2285
2527
3163
2859
2200
2300
2400
2500
2600
2700
2800
2900
3000
3100
3200
2015 2016 2017 2018 2019

[TRADE ANALYSIS - SALT SECTOR PAKISTAN] 4
Small and Medium Enterprises Development Authority (SMEDA)
The market share of the world’s five largest exporters accounted for almost 42% of the world’s total supply
of Salt products in 2019 (see figure below). During the same period; Pakistan only managed to grab a mere
2% of the global market share in the global trade of Salt products.
Figure 2: World Export Countries Market Share - Salt Products 2019
Source: Trade Map
Major Importing Countries
During the last 5 years, import of Salt Products has been dominated by United States of America which
remained the single biggest import market in the world followed by Japan and China. It is worth noting
that out of all five major import markets of Salt products; Canada has seen the largest upsurge in demand
with its total imports of Salt products recording a CAGR growth of 21% in the last five years.
The import value, global market share and CAGR of the five biggest importing countries is provided in
table below. The market share of the world’s five largest importers accounted for almost 62% of the total
global trade of Salt products in 2019 (see figure below).
Table 4: Major Salt Products Importing Countries - Last 5 Years (Value US $ Millions)
Sr. No. Country 2015 2016 2017 2018 2019 CAGR %
1 United States of America 733 477 522 741 754 0.7%
2 Japan 405 419 300 282 325 -5.3%
3 China 244 289 316 360 299 5.3%
4 Canada 93 87 123.7 174 200 21.0%
5 Germany 155 170 192 229 188 4.9%
Source: Trade Map
Netherlands10%
Germany9%
India8%
Canada8%
United States of America
7%Pakistan
2%
All Others56%

[TRADE ANALYSIS - SALT SECTOR PAKISTAN] 5
Small and Medium Enterprises Development Authority (SMEDA)
Figure 3: World Import Countries Market Share - Salt Products 2019
Source: Trade Map
3 Pakistan’s Exports of Salt Products
Pakistan recorded its highest exports over the last decade in 2018 where total export value was recorded
at US $ 52.0 million. However; exports declined by 4.6% the following year and were estimated to be US
$ 50 million during 2019. It is; however, worth noting that the overall export value witnessed a robust
growth with Salt products export estimated to have grown at a CAGR of 18.1% over the last five-year
period.
Table 4: Pakistan’s Salt Products Export – Last 5 Years (Value in US $ Millions)
Description 2015 2016 2017 2018 2019
Pakistan’s Exports (Value is US $ Millions) 26 32 51 52 50
Growth (%age) Base Year 26.7% 57.0% 2.6% -4.6%
Source: Trade Map
United States of America
27%
Japan11%
China10%
Canada7%
Germany7%
All Others38%
[TRADE ANALYSIS - SALT SECTOR PAKISTAN] 6
Small and Medium Enterprises Development Authority (SMEDA)
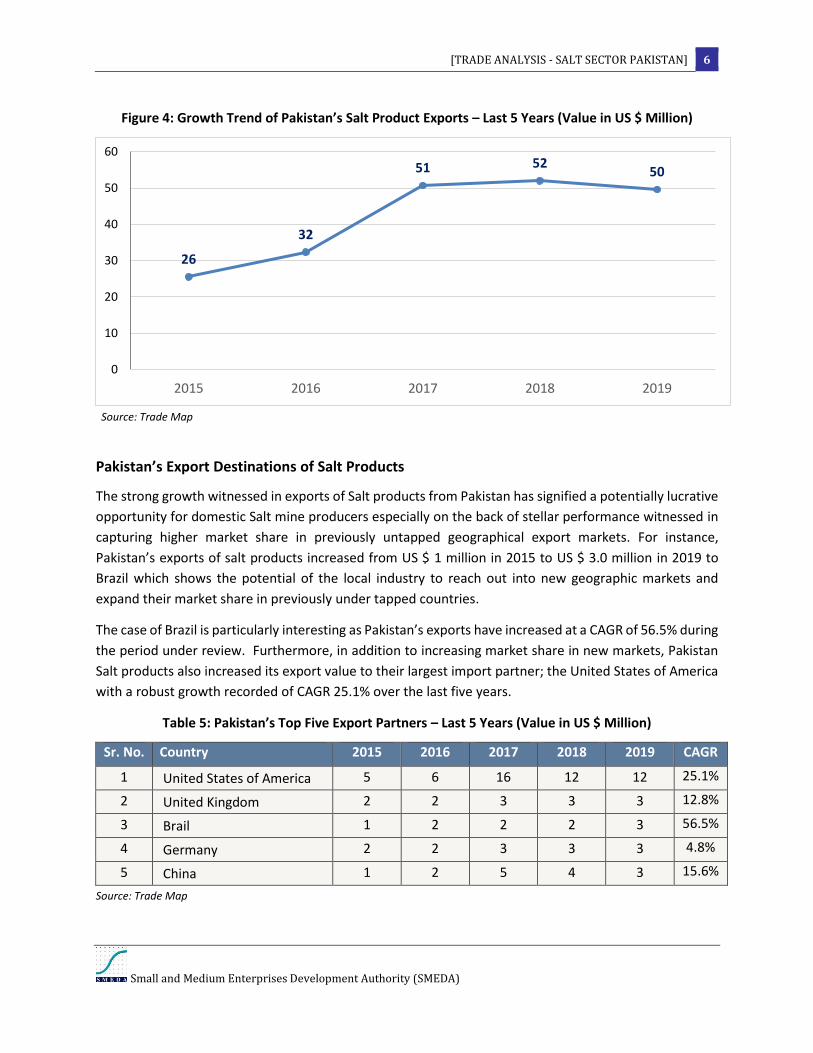
Figure 4: Growth Trend of Pakistan’s Salt Product Exports – Last 5 Years (Value in US $ Million)
Source: Trade Map
Pakistan’s Export Destinations of Salt Products
The strong growth witnessed in exports of Salt products from Pakistan has signified a potentially lucrative
opportunity for domestic Salt mine producers especially on the back of stellar performance witnessed in
capturing higher market share in previously untapped geographical export markets. For instance,
Pakistan’s exports of salt products increased from US $ 1 million in 2015 to US $ 3.0 million in 2019 to
Brazil which shows the potential of the local industry to reach out into new geographic markets and
expand their market share in previously under tapped countries.
The case of Brazil is particularly interesting as Pakistan’s exports have increased at a CAGR of 56.5% during
the period under review. Furthermore, in addition to increasing market share in new markets, Pakistan
Salt products also increased its export value to their largest import partner; the United States of America
with a robust growth recorded of CAGR 25.1% over the last five years.
Table 5: Pakistan’s Top Five Export Partners – Last 5 Years (Value in US $ Million)
Sr. No. Country 2015 2016 2017 2018 2019 CAGR
1 United States of America 5 6 16 12 12 25.1%
2 United Kingdom 2 2 3 3 3 12.8%
3 Brail 1 2 2 2 3 56.5%
4 Germany 2 2 3 3 3 4.8%
5 China 1 2 5 4 3 15.6%
Source: Trade Map
26
32
51 5250
0
10
20
30
40
50
60
2015 2016 2017 2018 2019

[TRADE ANALYSIS - SALT SECTOR PAKISTAN] 7
Small and Medium Enterprises Development Authority (SMEDA)
The cumulative market share of Pakistan’s top five import partners as percentage of its total Salt product
exports during 2019 was around 48% (see figure below).
Figure 5: Share of Pakistan Top Five Import Partners of Salt Products in 2019
Source: Trade Map
Pakistan’s Major Product Mix of Salt Products
Rock salt products constituted the most valuable commodity among all exports from Pakistan and
accounted for almost 59% of its product mix during 2019 followed by Other Forms of Salt and Table Salt
which contributed 36% and 5% respectively towards total Salt product exports in this product category
(see figure below).
Figure 6: Pakistan’s Product Mix – Salt Products 2019
Source: Trade Map
United States of America
24%
United Kingdom7%
Brazil6%
Germany6%China
5%
Others52%
Other Forms of Salt36%
Rock Salt59%
Table Salt5%

[TRADE ANALYSIS - SALT SECTOR PAKISTAN] 8
Small and Medium Enterprises Development Authority (SMEDA)
4 Price Comparisons
The following graph shows a comparison of the price charged by Pakistan in relation to the leading
exporting countries in the world for the product category of Salt products classified under HS Code
250100. Salt from Pakistan was traded at a significantly higher price vis-à-vis almost all the top exporting
nations in the global economy at US $ 162/ Ton; with the exception of United States of America.
Figure 7: Price Comparison for Salt Products (HS250100, US $ / Ton)
Source: Trade Map
5 Pakistan’s Trade Tariff
The following Customs Duties are applied by FBR on Salt Products in Pakistan:
Table 6: Customs Duty Set by FBR on trade of Salt Products
Product HS Code Product Description Customs Duty
25010010 Table salt 20%
25010020 Rock salt 20%
25010090 Other forms of salt 20%
Source: Federal Board of Revenue Pakistan
16
40
66 60 6170
162 162
0
20
40
60
80
100
120
140
160
180
India Canada China Spain Germany Netherlands Pakistan United Statesof America

[TRADE ANALYSIS - SALT SECTOR PAKISTAN] 9
Small and Medium Enterprises Development Authority (SMEDA)
6 Prominent International Trade Fairs Related with Salt Products
Name of Trade Show Location Frequency Web Links
Agro Food Kyiv,
Ukraine Annual www.agro-expo.com
Expo Food & Drinks Yerevan,
Armenia Annual www.gulfoodmanufacturing.com
Food Asia Karachi,
Pakistan Annual www.foodasia.net
Gulf Food Dubai, United
Arab Emirates Annual www.gulfoodmanufacturing.com
IFT Food Expo Chicago, United
States of America Annual www.iftevent.org
National Salt
Exhibition
Shanghai,
China Annual www.xssalt.com
PLMA Expo Amsterdam,
Netherlands Annual www.plmainternational.com
Sial China Shanghai,
China Annual www.sialchina.com
Sial InterFOOD Jakarta,
Indonesia Annual www.sialinterfood.com
Spring Fair Birmingham,
United Kingdom Annual www.springfair.com
Related Documents