An agency of the European Union Sales of veterinary antimicrobial agents in 26 EU/EEA countries in 2013 Fifth ESVAC report

Welcome message from author
This document is posted to help you gain knowledge. Please leave a comment to let me know what you think about it! Share it to your friends and learn new things together.
Transcript

An agency of the European Union
Sales of veterinary antimicrobial agents in 26 EU/EEA countries in 2013Fifth ESVAC report

Legal role
The European Medicines Agency is the European Union body responsible for coordinating the existing scientific resources put at its disposal by Member States for the evaluation, supervision and pharmacovigilance of medicinal products.
The Agency provides the Member States and the institu-tions of the European Union (EU) and the European Economic Area (EEA) countries the best-possible scientific advice on any question relating to the evaluation of the quality, safety and efficacy of medicinal products for human or veterinary use referred to it in accordance with the provisions of EU legislation relating to medicinal products.
The founding legislation of the Agency is Regulation (EC) No 726/2004.
Principal activities
Working with the Member States and the European Commission as partners in a European medicines network, the European Medicines Agency:
• provides independent, science-based recommenda-tions on the quality, safety and efficacy of medicines,and on more general issues relevant to public andanimal health that involve medicines;
• applies efficient and transparent evaluation proce-dures to help bring new medicines to the market bymeans of a single, EU-wide marketing authorisationgranted by the European Commission;
• implements measures for continuously supervisingthe quality, safety and efficacy of authorised medi-cines to ensure that their benefits outweigh theirrisks;
• provides scientific advice and incentives to stimulatethe development and improve the availability ofinnovative new medicines;
• recommends safe limits for residues of veterinarymedicines used in food-producing animals, for theestablishment of maximum residue limits by theEuropean Commission;
• involves representatives of patients, healthcareprofessionals and other stakeholders in its work, tofacilitate dialogue on issues of common interest;
• publishes impartial and comprehensible informationabout medicines and their use;
The mission of the European Medicines Agency is to foster scientific excellence in the evaluation and supervision of medicines, for the benefit of public and animal health.
• develops best practice for medicines evaluation andsupervision in Europe, and contributes alongsidethe Member States and the European Commissionto the harmonisation of regulatory standards at theinternational level.
Guiding principles
• We are strongly committed to public and animalhealth.
• We make independent recommendations based onscientific evidence, using state-of-the-art knowledgeand expertise in our field.
• We support research and innovation to stimulate thedevelopment of better medicines.
• We value the contribution of our partners and stake-holders to our work.
• We assure continual improvement of our processesand procedures, in accordance with recognised qualitystandards.
• We adhere to high standards of professional andpersonal integrity.
• We communicate in an open, transparent mannerwith all of our partners, stakeholders and colleagues.
• We promote the well-being, motivation and ongoingprofessional development of every member of theAgency.
Sales of veterinary antimicrobial agents in 26 EU/EEA countries in 2013Fifth ESVAC report
15 October 2015 EMA/387934/2015 Veterinary Medicines Division
Acknowledgements
The members and the observers of the ESVAC ad hoc expert group Suzanne Eckford, Christina Greko, Cristina Muñoz Madero, Gérard Moulin, Lucie Pokludová, Pierre-Alexandre Beloeil, Rosa Peran and Klaus Weist are acknowledged for providing valuable comments and scientific advice during the production of this report.
Furthermore, Klemens Fuchs, Bart Hoet, Minne Dries, Damyan Iliev, Antonio Radoev, Tsvetanka Valova, Lucie Pokludová, Marios Genakritis, Erik Jacobsen, Laura Mie Jensen, Katrin Kurvits, Marju Sammul, Katariina Kivilahti-Mäntylä, Gérard Moulin, Anne Chevance, Jürgen Wallmann, Inke Reimer, Edit Nagy, Katalin Mészárosné Árvai, Jóhann M. Lenharðsson, Jeremiah Gabriel Beechinor, Gavin Ryan, Alessandra Perrella, Gundega Mičule, Liena Miķe, Sigitas Siriukaitis, Marcel Bruch, Bart van den Assum, Inge van Geijlswijk, Dorota Prokopiak, Dorota Žaboklicka-Bodzioch, Maria Helena Ponte, Teresa Mafalda Flores, Anton Svetlin, Rinaldo Zidar, Judita Hederová, Cristina Muñoz Madero, Kinfe Girma, Christina Greko, Kitty Healey, Hannah Reeves and Katherine Grace are acknowledged for providing data and valuable comments for the report. Cedric Mϋntener is thankfully acknowledged for providing the data for Switzerland.
The European Medicines Agency staff members Kari Grave, Kristine Ignate, Jordi Torren-Edo, Arno Muller, Zoltan Kunsagi and David Mackay are gratefully acknowledged for the preparation of the report.
Citation
Suggested citation: European Medicines Agency, European Surveillance of Veterinary Antimicrobial Consumption, 2015. ‘Sales of veterinary antimicrobial agents in 26 EU/EEA countries in 2013’. (EMA/387934/2015).
Correspondence
Any correspondence relating to this report should be sent by e-mail to: [email protected]
DISCLAIMERThe views and positions expressed in this report do not necessarily represent in legal terms the official position of the European Medicines Agency. The European Medicines Agency assumes no responsibility or liability for any errors or inaccuracies that may appear in the report.

About the European Medicines AgencyThe European Medicines Agency (EMA) is a decentralised body of the European Union (EU), located in London. Its main responsibility is the protection and promotion of public and animal health, through the evaluation and supervision of medicines for human and veterinary use.
The Agency is responsible for the scientific evaluation of applications for European marketing authorisations for both human and veterinary medicines (centralised procedure). Under the centralised procedure, companies submit a single marketing authorisation application to the Agency. Once granted by the European Commission, a centralised marketing authorisation is valid in all EU Member States and, after implementation at national level, in the EEA-EFTA states (Iceland, Liechtenstein and Norway).
The Agency, with the help of its Committee for Medicinal Products for Veterinary Use (CVMP), and its Antimicrobials Working Party (AWP), has produced a strong body of scientific advice in relation to the use of antimicrobials and the risk of antimicrobial resistance, with the intention to promote the continued availability of effective antimicrobials for use in animals, while at the same time acting to minimise risks to animals or man arising from their use.
The European Surveillance of Veterinary Antimicrobial Consumption (ESVAC) project was launched by the Agency in September 2009, following a request from the European Commission to develop a harmonised approach to the collection and reporting of data on the use of antimicrobial agents in animals from the Member States.
About the reportThis fifth ESVAC report presents data on the sales of veterinary antimicrobial agents from 26 EU/EEA countries in 2013, provided at package level according to a standardised protocol and template1. In addition, it includes a chapter describing changes in consumption of veterinary antimicrobials for the years 2010–2013 (Chapter 2.8.). Explanations for the possible reasons for the changes have been provided by the ESVAC national contact points from each country.
Chapter 2.8.2. focuses on the changes across time in each country of certain classes of antimicrobials according to the categorisation recommended by the EMA Antimicrobial Advice ad hoc Expert Group (AMEG). The categorisation takes into account the WHO categorisation of antimicrobials, the hazard of zoonotic relevance, use of those antimicrobials in veterinary medicine and the risk of resistance transfer to humans, the classification can be found here: http://www.ema.europa.eu/docs/en_GB/document_library/Other/2014/07/WC500170253.pdf. (pages 29–31).
Category 2 of the AMEG categorisation includes those veterinary antimicrobials where the risk for public health is estimated to be higher; fluoroquinolones and 3rd- and 4th-generation cephalosporins are included in this category (but not, for example, macrolides). This report places special emphasis on food-producing animals.
Data from Switzerland are included in Annex 9 as, due to confidentiality issues, data from Switzerland could not be delivered in accordance with the ESVAC data-collection form.
It is generally agreed that it takes at least three to four years in order to establish a valid baseline for the data on sales of veterinary antimicrobial agents. Consequently, the data from countries that have collected such data for the first or even second time should be interpreted with due caution.
It should be emphasised that the data presented in this report should not be used alone as a basis for setting management priorities, but should always be considered together with data from other sources.
1 Available from the European Medicines Agency website (www.ema.europa.eu) via Home > Veterinary regulatory > Antimicrobial resistance.

Table of contents
Summary .................................................................................................................. 11
Introduction ............................................................................................................. 13Terms of reference from the European Commission ..........................................................................13About ESVAC ..............................................................................................................................13
1. Technical notes ................................................................................................... 151.1. Veterinary antimicrobial agents included in the data sets ..........................................................151.2. Variables reported for each antimicrobial veterinary medicinal product ........................................151.3. Population correction unit (PCU) ............................................................................................151.4. Calculation of PCU ...............................................................................................................161.5. Animal species and categories included; selection of data sources ..............................................161.6. Corrections of historical data .................................................................................................16
1.6.1. Sales data ...............................................................................................................161.6.2. PCU data ................................................................................................................17
1.7. Quality check and validation of the data .................................................................................171.8. Reporting of the data ...........................................................................................................171.9. Summary of included data sources/types, by country ...............................................................17
2. Results ............................................................................................................... 212.1. Population correction unit .....................................................................................................212.2. Overall sales of veterinary antimicrobial agents .......................................................................232.3. Population-corrected sales for food-producing animals, including horses, by pharmaceutical form ...252.4. Population-corrected sales for food-producing animals, including horses, by antimicrobial class ......27
2.4.1. Distribution of sales for the most-selling antimicrobial classes and the most important CIAs by pharmaceutical form, aggregated by the 26 EU/EEA countries ...................................32
2.5. Distribution of sales for food-producing animals, including horses, by antimicrobial class and pharmaceutical form ...........................................................................................................352.5.1. Distribution of sales of antimicrobials by class and forms by country ...............................35
2.6. Distribution of single- and multiple-ingredient products of veterinary antimicrobial agents .............502.7. Sales of tablets by veterinary antimicrobial class for companion animals .....................................542.8. Changes over time (2010–2013) ...........................................................................................55
2.8.1. All countries ............................................................................................................552.8.2. Changes by country .................................................................................................70
3. Discussion ........................................................................................................ 1183.1. Materials and methods ....................................................................................................... 1183.2. Results ............................................................................................................................ 119
4. Concluding remarks .......................................................................................... 120Annex 1. Tables ............................................................................................................................. 121Annex 2. Variables to be reported for each antimicrobial veterinary medicinal product; standardisation
of the data ....................................................................................................................... 127Annex 3. Population correction unit (PCU).......................................................................................... 130Annex 4. List of antimicrobial classes/active ingredients reported in ESVAC ............................................ 132Annex 5. Distribution of veterinary medicines; legal framework and data sources by country .................... 134Annex 6. References to national reports ............................................................................................ 145Annex 7. Country and affiliation of the ESVAC national contact points/alternates .................................... 146Annex 8. ESVAC ad hoc Expert Group members and observers ............................................................. 154Annex 9. Data from Switzerland ....................................................................................................... 156

List of figures
Figure 1. Organisation of the ESVAC project .........................................................................................14Figure 2. The denominator (PCU) and its distribution by the food-producing animal species, including horses,
(PCU = 1 kg), by country, for 2013 ......................................................................................22Figure 3. Distribution of PCU in weight by food-producing animal species, including horses, by country, for 2013 . 22Figure 4. Net export and net import, as a percentage of the total PCU, of animals for fattening or slaughter
in another Member State, for 2013 ........................................................................................23Figure 5. Distribution of sales, in tonnes of active ingredient, split into tablets (used almost solely in companion
animals) and all other pharmaceutical forms (used mainly in food-producing animals, including horses), by country, for 2013 ............................................................................................................24
Figure 6. Distribution of sales of veterinary antimicrobial agents for food-producing animals, including horses, in mg per population correction unit (mg/PCU), by pharmaceutical form, by country, for 2013 ......25
Figure 7. Oral solutions, oral powders and premixes as percentages of total sales, in mg per population correction unit (mg/PCU), of veterinary antimicrobial agents for food-producing animals, including horses, by country, for 2013 .................................................................................................25
Figure 8. Distribution of sales, in mg/PCU, of the various pharmaceutical forms of veterinary antimicrobial agents for food-producing animals, including horses, aggregated by the 26 EU/EEA countries for 2013 ............................................................................................................................26
Figure 9. Sales for food-producing species, including horses, in mg/PCU, of the various veterinary antimicrobial classes, for 26 countries, in 2013 ..........................................................................................29
Figure 10. Proportion of the total sales of the different veterinary antimicrobial classes, in mg/PCU, by country, for 2013 ..........................................................................................................29
Figure 11. Sales of antimicrobial agents by antimicrobial class as percentage of the total sales for food-producing species, including horses, in mg/PCU, aggregated by 26 countries, for 2013 .................30
Figure 12. Sales of tetracyclines, penicillins and sulfonamides as a percentage of the total sales for food-producing species, including horses, in mg/PCU, by country, for 2013 ........................................30
Figure 13. Distribution of the sales in mg/PCU of penicillins by subclass for food-producing species, including horses, by country, for 2013 .................................................................................................31
Figure 14. Proportion of the total sales of macrolides, fluoroquinolones and 3rd- and 4th-generation cephalosporins for food-producing species, including horses, in mg/PCU, for 26 countries, in 2013 ............................31
Figure 15. Distribution of sales of tetracyclines for food-producing animals, including horses, in mg/PCU, by the major pharmaceutical forms sold, aggregated by the 26 EU/EEA countries, for 2013 ....................32
Figure 16. Distribution of sales of penicillins for food-producing animals, including horses, in mg/PCU, by the major pharmaceutical forms sold, aggregated by the 26 EU/EEA countries, for 2013 ....................32
Figure 17. Distribution of sales of sulfonamides for food-producing animals, including horses, in mg/PCU, by the major pharmaceutical forms sold, aggregated by the 26 EU/EEA countries, for 2013 ....................33
Figure 18. Distribution of sales of 3rd- and 4th-generation cephalosporins for food-producing animals, including horses, in mg/PCU, by pharmaceutical form sold, aggregated by the 26 EU/EEA countries, for 2013 .. 33
Figure 19. Distribution of sales of macrolides for food-producing animals, including horses, in mg/PCU, by pharmaceutical form sold, aggregated by the 26 EU/EEA countries, for 2013 ..........................34
Figure 20. Distribution of sales of fluoroquinolones for food-producing animals, including horses, in mg/PCU, by the major pharmaceutical forms sold, aggregated by the 26 EU/EEA countries, for 2013 ..............34
Figure 21. Spatial distribution of overall sales of all antimicrobials for food-producing animals, in mg/PCU, for 26 countries, for 2013 ...................................................................................................35
Figure 22. Spatial distribution of sales of tetracyclines for food-producing animals, in mg/PCU, for 26 countries, for 2013 ............................................................................................................................36
Figure 23. Distribution of sales by pharmaceutical forms of tetracyclines, in mg/PCU, by country, for 2013 ....36Figure 24. Spatial distribution of sales of amphenicols, in mg/PCU, for 26 EU/EEA countries, for 2013 ...........37Figure 25. Distribution of sales by pharmaceutical form of amphenicols, in mg/PCU, by country, for 2013 ......37Figure 26. Spatial distribution of sales of penicillins for food-producing animals, in mg/PCU, for 26 EU/EEA
countries, for 2013 ..............................................................................................................38Figure 27. Distribution of sales by pharmaceutical form for penicillins, in mg/PCU, by country, for 2013 ........38Figure 28. Spatial distribution of sales of 1st- and 2nd-generation cephalosporins, in mg/PCU, in 26 EU/EEA
countries, for 2013 ..............................................................................................................39Figure 29. Distribution of sales by pharmaceutical form for 1st- and 2nd-generation cephalosporins, in mg/PCU,
by countries, for 2013 .........................................................................................................39
Figure 30. Spatial distribution of sales of 3rd- and 4th-generation cephalosporins, in mg/PCU, in 26 EU/EEA countries, for 2013 ..............................................................................................................40
Figure 31. Distribution of sales by pharmaceutical form for 3rd- and 4th-generation cephalosporins, in mg/PCU, by country, for 2013 ............................................................................................................40
Figure 32. Spatial distribution of sales of sulfonamides, in mg/PCU, in 26 EU/EEA countries, for 2013 ..........41Figure 33. Distribution of sales by pharmaceutical form for sulfonamides, in mg/PCU, by country, for 2013 ....41Figure 34. Spatial distribution of sales of trimethoprim, in mg/PCU, in 26 EU/EEA countries, for 2013 ...........42Figure 35. Distribution of sales by pharmaceutical form for trimethoprim, in mg/PCU, by country, for 2013 ....42Figure 36. Spatial distribution of sales of macrolides, in mg/PCU, in 26 EU/EEA countries, for 2013 ...............43Figure 37. Distribution of sales by pharmaceutical form for macrolides, in mg/PCU, by country, for 2013 .......43Figure 38. Spatial distribution of sales of lincosamides, in mg/PCU, in 26 EU/EEA countries, for 2013 ............44Figure 39. Distribution of sales by pharmaceutical form for lincosamides, in mg/PCU, by country, for 2013 ....44Figure 40. Spatial distribution of sales of fluoroquinolones, in mg/PCU, in 26 EU/EEA countries, for 2013 .......45Figure 41. Distribution of sales by pharmaceutical form for fluoroquinolones, in mg/PCU, by country, for 2013 45Figure 42. Spatial distribution of sales of other quinolones, in mg/PCU, in 26 EU/EEA countries, for 2013.......46Figure 43. Distribution of sales by pharmaceutical form for other quinolones, in mg/PCU, by country, for 2013 46Figure 44. Spatial distribution of sales of aminoglycosides, in mg/PCU, in 26 EU/EEA countries, for 2013 .......47Figure 45. Distribution of sales by pharmaceutical form for aminoglycosides, in mg/PCU, by country, for 2013 ...47Figure 46. Spatial distribution of sales of polymyxins, in mg/PCU, in 26 EU/EEA countries, for 2013 ..............48Figure 47. Distribution of sales by pharmaceutical form for polymyxins, in mg/PCU, by country, for 20131 .....48Figure 48. Spatial distribution of sales of pleuromutilins, in mg/PCU, in 26 EU/EEA countries, for 2013 ..........49Figure 49. Distribution of sales by pharmaceutical form for pleuromutilins, in mg/PCU, by country, for 2013 ..49Figure 50. Percentage of sales, in tonnes of active ingredient, of premixes, oral powders and oral solutions
containing 1, 2, and 3 antimicrobial agents in 2013 .................................................................53Figure 51. Distribution of sales of tablets, in tonnes of active ingredient, by antimicrobial class
(reported according to the ATCvet hierarchical system), by country, for 2013 ..............................54Figure 52. Distribution of sales of tablets containing penicillins by subclass (in weight of active ingredient),
by country, for 2013 ............................................................................................................55Figure 53. Population correction unit (PCU) for food-producing animals, including horses, in 1,000 tonnes, by
country, during 2010 to 2013 ..............................................................................................56Figure 54. Sales, in tonnes of active ingredients, of veterinary antimicrobials for food-producing animals,
including horses, during 2010 to 2013, for 26 EU/EEA countries ................................................57Figure 55. Total sales of veterinary antimicrobial agents for food-producing species, including horses, in mg/
PCU, during 2010 to 2013, for 26 EU/EEA countries .................................................................58Figure 56. Percentage changes in PCU, in tonnes sold and in sales of veterinary antimicrobial agents for food-
producing species, including horses, in mg/PCU, from 2011 to 2013, aggregated by 23 EU/EEA countries ...........................................................................................................................60
Figure 57. Changes in total sales and in sales of fluoroquinolones and 3rd- and 4th-generation cephalosporins, for 23 EU/EEA countries, from 2011 to 2013. Note the differences in the scales of the Y axes ........61
Figure 58. Sales of tetracyclines for food-producing species, including horses, in mg/PCU, by 26 EU/EEA countries, from 2010 to 2013 ...............................................................................................62
Figure 59. Sales of doxycycline for food-producing species, including horses, in mg/PCU, by 26 EU/EEA countries, from 2010 to 2013 ...............................................................................................63
Figure 60. Sales of penicillins for food-producing species, including horses, in mg/PCU, by 26 EU/EEA countries, from 2010 to 2013 ..............................................................................................................64
Figure 61. Sales of sulfonamides for food-producing species, including horses, in mg/PCU, by 26 EU/EEA countries, from 2010 to 2013 ...............................................................................................65
Figure 62. Sales of 3rd- and 4th-generation cephalosporins for food-producing species, including horses, in mg/PCU, by 26 EU/EEA countries, from 2010 to 2013 ....................................................................66
Figure 63. Sales of macrolides for food-producing species, including horses, in mg/PCU, by 26 EU/EEA countries, from 2010 to 2013 ...............................................................................................67
Figure 64. Sales of fluoroquinolones for food-producing species, including horses, in mg/PCU, by 26 EU/EEA countries, from 2010 to 2013 ...............................................................................................68
Figure 65. Sales of polymyxins for food-producing species, including horses, in mg/PCU, by 26 EU/EEA countries, from 2010 to 2013 ...............................................................................................69
Figure 66. Sales (mg/PCU) by antimicrobial class for food-producing species, including horses, in Austria, from 2010 to 2013 .....................................................................................................................70
Figure 67. Sales (mg/PCU) of 3rd- and 4th-generation cephalosporins and fluoroquinolones for food-producing species, including horses, in Austria, from 2010 to 2013 ..........................................................71
Figure 68. Sales (mg/PCU) by antimicrobial class for food-producing species, including horses, in Belgium, from 2010 to 2013 .....................................................................................................................72
Figure 69. Sales (mg/PCU) of 3rd- and 4th-generation cephalosporins and fluoroquinolones for food-producing species, including horses, in Belgium, from 2010 to 2013 .........................................................73
Figure 70. Sales (mg/PCU) by antimicrobial class for food-producing species, including horses, in Bulgaria, from 2011 to 2013 .....................................................................................................................74
Figure 71. Sales (mg/PCU) of 3rd- and 4th-generation cephalosporins and fluoroquinolones for food-producing species, including horses, in Bulgaria, from 2011 to 2013 .........................................................74
Figure 72. Sales (mg/PCU) by antimicrobial class for food-producing species, including horses, in Cyprus, from 2011 to 2013 .....................................................................................................................75
Figure 73. Sales (mg/PCU) of 3rd- and 4th-generation cephalosporins and fluoroquinolones for food-producing species, including horses, in Cyprus, from 2011 to 2013 ..........................................................76
Figure 74. Sales (mg/PCU) by antimicrobial class for food-producing species, including horses, in the Czech Republic, from 2010 to 2013 ................................................................................................77
Figure 75. Sales (mg/PCU) of 3rd- and 4th-generation cephalosporins and fluoroquinolones for food-producing species, including horses, in the Czech Republic, from 2010 to 2013 ..........................................78
Figure 76. Sales (mg/PCU) by antimicrobial class for food-producing species, including horses, in Denmark, from 2010 to 2013 ..............................................................................................................79
Figure 77. Sales (mg/PCU) of 3rd- and 4th-generation cephalosporins and fluoroquinolones for food-producing species, including horses, in Denmark, from 2010 to 2013 .......................................................80
Figure 78. Sales (mg/PCU) by antimicrobial class for food-producing species, including horses, in Estonia, from 2010 to 2013 .....................................................................................................................81
Figure 79. Sales (mg/PCU) of 3rd- and 4th-generation cephalosporins and fluoroquinolones for food-producing species, including horses, in Estonia, from 2010 to 2013 ..........................................................82
Figure 80. Sales (mg/PCU) by antimicrobial class for food-producing species, including horses, in Finland, from 2010 to 2013 .....................................................................................................................83
Figure 81. Sales (mg/PCU) of 3rd- and 4th-generation cephalosporins and fluoroquinolones for food-producing species, including horses, in Finland, from 2010 to 2013 ..........................................................84
Figure 82. Sales (mg/PCU) by antimicrobial class for food-producing species, including horses, in France, from 2010 to 2013 .....................................................................................................................85
Figure 83. Sales (mg/PCU) of 3rd- and 4th-generation cephalosporins and fluoroquinolones for food-producing species, including horses, in France, from 2010 to 2013 ...........................................................86
Figure 84. Sales (mg/PCU) by antimicrobial class for food-producing species, including horses, in Germany, from 2011 to 2013 ..............................................................................................................87
Figure 85. Sales (mg/PCU) of 3rd- and 4th-generation cephalosporins and fluoroquinolones for food-producing species, including horses, in Germany, from 2011 to 2013 ........................................................88
Figure 86. Sales (mg/PCU) by antimicrobial class for food-producing species, including horses, in Hungary, from 2010 to 2013 .....................................................................................................................89
Figure 87. Sales (mg/PCU) of 3rd- and 4th-generation cephalosporins and fluoroquinolones for food-producing species, including horses, in Hungary, from 2011 to 2013 .........................................................90
Figure 88. Sales (mg/PCU) by antimicrobial class for food-producing species, including horses, in Iceland, from 2010 to 2013 .....................................................................................................................91
Figure 89. Sales (mg/PCU) of 3rd- and 4th-generation cephalosporins and fluoroquinolones for food-producing species, including horses, in Iceland, from 2010 to 2013 ..........................................................91
Figure 90. Sales (mg/PCU) by antimicrobial class for food-producing species, including horses, in Ireland, from 2010 to 2013 .....................................................................................................................92
Figure 91. Sales (mg/PCU) of 3rd- and 4th-generation cephalosporins and fluoroquinolones for food-producing species, including horses, in Ireland, from 2010 to 2013 ..........................................................93
Figure 92. Sales (mg/PCU) by antimicrobial class for food-producing species, including horses, in Italy, from 2010 to 2013 .....................................................................................................................94
Figure 93. Sales (mg/PCU) of 3rd- and 4th-generation cephalosporins and fluoroquinolones for food-producing species, including horses, in Italy, from 2010 to 2013 ..............................................................95
Figure 94. Sales (mg/PCU) by antimicrobial class for food-producing species, including horses, in Latvia, from 2010 to 2013 .....................................................................................................................96
Figure 95. Sales (mg/PCU) of 3rd- and 4th-generation cephalosporins and fluoroquinolones for food-producing species, including horses, in Latvia, from 2010 to 2013 ............................................................97
Figure 96. Sales (mg/PCU) by antimicrobial class for food-producing species, including horses, in Lithuania, from 2010 to 2013 ..............................................................................................................98
Figure 97. Sales (mg/PCU) of 3rd- and 4th-generation cephalosporins and fluoroquinolones for food-producing species, including horses, in Lithuania, from 2010 to 2013 .......................................................99
Figure 98. Sales (mg/PCU) by antimicrobial class for food-producing species, including horses, in Luxembourg, from 2012 to 2013 ............................................................................................................ 100
Figure 99. Sales (mg/PCU) of 3rd- and 4th-generation cephalosporins and fluoroquinolones for food-producing species, including horses, in Luxembourg, from 2012 to 2013 ................................................. 100
Figure 100. Sales (mg/PCU) by antimicrobial class for food-producing species, including horses, in Netherlands, from 2010 to 2013 ............................................................................................................................. 101
Figure 101. Sales (mg/PCU) of 3rd- and 4th-generation cephalosporins and fluoroquinolones for food-producing species, including horses, in the Netherlands, from 2010 to 2013 .................................................... 102
Figure 102. Sales (mg/PCU) by antimicrobial class for food-producing species, including horses, in Norway, from 2010 to 2013 ..................................................................................................................................... 103
Figure 103. Sales (mg/PCU) of 3rd- and 4th-generation cephalosporins and fluoroquinolones for food-producing species, including horses, in Norway, from 2010 to 2013 ................................................................ 104
Figure 104. Sales (mg/PCU) by antimicrobial class for food-producing species, including horses, in Poland, from 2011 to 2013 ..................................................................................................................................... 105
Figure 105. Sales (mg/PCU) of 3rd- and 4th-generation cephalosporins and fluoroquinolones for food-producing species, including horses, in Poland, from 2011 to 2013 ................................................................. 105
Figure 106. Sales (mg/PCU) by antimicrobial class for food-producing species, including horses, in Portugal, from 2010 to 2013 ............................................................................................................................. 106
Figure 107. Sales (mg/PCU) of 3rd- and 4th-generation cephalosporins and fluoroquinolones for food-producing species, including horses, in Portugal, from 2010 to 2013 ............................................................... 107
Figure 108. Import data by wholesalers (2011 and 2012) and sales to end-users (2013) (mg/PCU) by antimicrobial class for food-producing species, including horses, in Slovakia ........................................................ 108
Figure 109. Import data by wholesalers (2011 and 2012) and sales to end-users (2013) (mg/PCU) of 3rd- and 4th-generation cephalosporins and fluoroquinolones for food-producing species, including horses, in Slovakia .................................................................................................................................... 109
Figure 110. Sales (mg/PCU) by antimicrobial class for food-producing species, including horses, in Slovenia, from 2010 to 2013 ................................................................................................................... 110
Figure 111. Sales (mg/PCU) of 3rd- and 4th-generation cephalosporins and fluoroquinolones for food-producing species, including horses, in Slovenia, from 2011 to 2013 ...................................................... 111
Figure 112. Sales (mg/PCU) by antimicrobial class for food-producing species, including horses, in Spain, from 2010 to 2013 ................................................................................................................... 112
Figure 113. Sales (mg/PCU) of 3rd- and 4th-generation cephalosporins and fluoroquinolones for food-producing species, including horses, in Spain, from 2011 to 2013 .......................................................... 113
Figure 114.Sales (mg/PCU) by antimicrobial class for food-producing species, including horses, in Sweden, from 2010 to 2013 ................................................................................................................... 114
Figure 115. Sales (mg/PCU) of 3rd- and 4th-generation cephalosporins and fluoroquinolones for food-producing species, including horses, in Sweden, from 2011 to 2013 ....................................................... 115
Figure 116. Sales (mg/PCU) by antimicrobial class for food-producing species, including horses, in the United Kingdom, from 2010 to 2013 .............................................................................................. 116
Figure 117. Sales (mg/PCU) of 3rd- and 4th-generation cephalosporins and fluoroquinolones for food-producing species, including horses, in the United Kingdom, from 2011 to 2013 ....................................... 117
List of tables
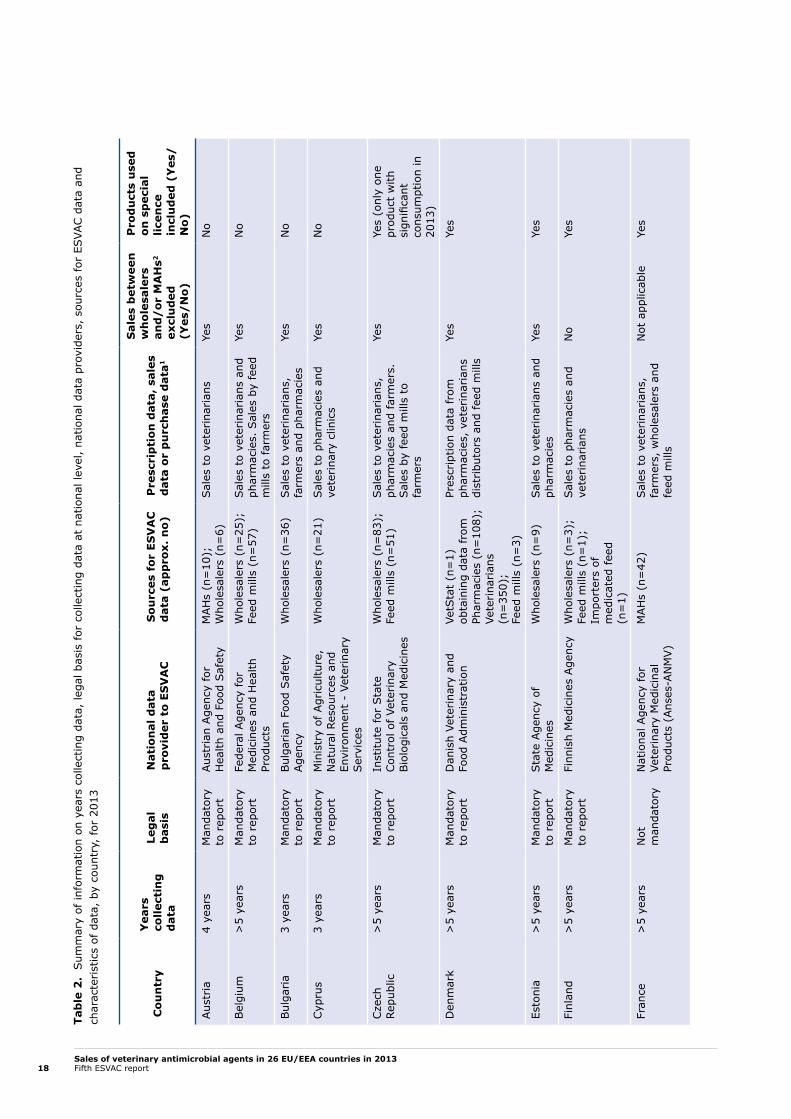
Table 1. Categories and ATCvet codes of antimicrobial veterinary medicinal products included in the data ...15Table 2. Summary of information on years collecting data, legal basis for collecting data at national level,
national data providers, sources for ESVAC data and characteristics of data, by country, for 2013 ..18Table 3. Estimated PCU (in 1,000 tonnes) of the population of food-producing species, including horses,
by country, for 2013 ............................................................................................................21Table 4. Distribution of overall sales, in tonnes of active ingredient, split into tablets (used in companion
animals) and all other pharmaceutical forms (used mainly in food-producing animals, including horses), by country, for 2013 ...............................................................................................23
Table 5. Sales, in tonnes of active ingredient, of veterinary antimicrobial agents marketed mainly for food-producing animals, including horses, population correction unit (PCU) and sales in mg/PCU, by country, for 2013 ............................................................................................................27
Table 6. Percentages of sales for food-producing animals, including horses, in mg per population correction unit (mg/PCU), of the various veterinary antimicrobial classes, by country, in 2013......................28
Table 7. Number of product presentations (product name, form, strength and pack size) containing 1, 2 and 3 antimicrobial agents sold, by country, for 2013 (tablets excluded from the data) ..........50
Table 8. Number of product presentations (product name, form, strength and pack size) of premixes, oral powders and oral solutions sold containing 1, 2 and 3 antimicrobial agents, by country, for 2013 ...51
Table 9. Sales, in tonnes of active ingredient, of antimicrobial agents sold as premixes, oral powders and oral solutions containing 1, 2 and 3 active ingredients, by country, for 2013 .........................52
Table 10. Sales of veterinary antimicrobial agents for food-producing species, including horses, in mg/PCU, for 26 EU/EEA countries, from 2010 to 2013 ...........................................................................59
Tables in the main text
Tables in Annexes 1-8
Table A1. Sales, in tonnes of active ingredient, of veterinary antimicrobial agents applicable mainly for food-producing animals, including horses, by antimicrobial class (presented according to the ATCvet hierarchical system) by country, for 2013 (tablets not included) .............................................. 121
Table A2. Distribution of sales, in mg/PCU, of veterinary antimicrobial agents applicable mainly for food-producing animals, including horses, by administration route/form and country, for 2013 ........... 122
Table A3. Percentage of sales, in mg/PCU, of premixes by veterinary antimicrobial class (according to ATCvet system) by country, for 2013 .............................................................................................. 123
Table A4. Percentages of sales, in mg/PCU, of oral powders by antimicrobial class (according to ATCvet system) by country, for 2013 .......................................................................................................... 124
Table A5. Percentage of sales, in mg/PCU, of oral solutions by antimicrobial class (according to ATCvet system) by country, for 2013 .......................................................................................................... 125
Table A6. Percentage of sales, in mg/PCU, of injection preparations by antimicrobial class (according to ATCvet system) by country, for 2013 .............................................................................................. 126
Table A7. Variables reported to ESVAC for each antimicrobial veterinary medicinal product for 2013 ........... 127Table A8. Conversion factors used to convert from international units (IU) to weight (mg) of active ingredient,
based on WHO standards ................................................................................................... 129Table A9. Conversion factors used to convert from prodrug content to content of active ingredient ............. 129Table A10. Animal categories included in the calculation of the population correction unit (PCU) and data types
to be reported .................................................................................................................. 130Table A11. Weights used to calculate the population correction unit ........................................................ 131Table A12. List of substances reported sold in ESVAC............................................................................ 132Table A13. List of ESVAC national contact points/alternates 2015 ........................................................... 146Table A14. List of ESVAC ad hoc Expert Group members from EU Member States ..................................... 154Table A15. List of ESVAC ad hoc Expert Group observers from the European Commission, ECDC and EFSA .. 155

Sales of veterinary antimicrobial agents in 26 EU/EEA countries in 2013Fifth ESVAC report 11
Summary
A total of 26 European Union (EU)/European Economic Area (EEA) countries submitted to the European Medicines Agency their 2013 data on sales, at package level, of antimicrobial veterinary medicinal products (VMPs), according to a standardised protocol and using a common template. The 26 countries included in the ESVAC 2013 data cover approximately 95 % of the food-producing animal population in the EU/EEA.
Sixteen of the countries obtained the data from wholesalers, six from marketing authorisation holders, two from both wholesalers and marketing authorisation holders, and two from pharmacies. In some countries, feed mills provided the data on sales of premixes used in medicated feed.
In 24 of the 26 countries, a legal basis existed for the national competent authority to request data on sales or prescription of veterinary antimicrobial agents from the distributors of such products, while in two countries (France and the Netherlands), data were provided to the national competent authority voluntarily.
All countries provided sales data or prescription data (Denmark and Sweden) for 2013. For Hungary for 2010 and for Slovakia for 2011 and 2012, purchase data (import by wholesalers) and for 2013, sales from wholesalers (import data and national manufactured VMPs) to end-users were provided. Sales data for Hungary for 2010 and for Slovakia for 2011 and 2012 are not fully comparable with data on sales from wholesalers to end-users or with those of the other countries.
In order to normalise the sales data for the animal population that can be subjected to treatment with antimicrobial agents, a population correction unit (PCU) was introduced as a proxy for the size of the animal population. Since statistics on numbers of dogs and cats were not available from all countries, these species were not included in the PCU, and therefore tablets, which are almost solely used in companion animals, were excluded from the further analysis of the sales data and the PCU data. Injectable veterinary antimicrobial agents are used in both food-producing and companion animals. Due to the relatively small proportion used in companion animals, in terms of weight of active ingredient, sales of injectable preparations are included in the statistics for food-producing animals.
The national sales data for antimicrobial agents (nominator) cover all food-producing species, including horses, thus the animal population ‘at risk’ of being treated with antimicrobial agents (denominator) includes all food-producing species. However, the use of antimicrobial agents in the various animal species varies considerably; for example, the use of antimicrobial agents in extensive production systems, e.g. sheep and goats, is generally relatively low. Therefore, the interpretation of the data should take into account the distribution of the PCU value between the species in the various countries. It should also be emphasised that the PCU only represents a technical unit of measurement and not a real value for the animal population that could potentially be treated with antimicrobial agents.
The main indicator used in the current report to express the sales is mg active ingredient sold per population correction unit — mg/PCU.
Aggregated by the 26 countries, the sales (mg/PCU) of premixes accounted for 38.2 % of the overall sales, while 33.7 % were oral powders, 19.6 % were oral solutions, 7.6 % were injectable preparations, 0.6 % were intramammaries and 0.3 % were oral pastes, bolus and intrauterine preparations.
The distribution of sales of the various antimicrobial classes and subclasses by pharmaceutical form varied considerably between the 26 countries. Concerning the sales (in mg/PCU) of 3rd- and 4th-generation cephalosporin preparations, none of the pharmaceutical forms were applicable for group treatment; 84 % were injectable preparations and 16 % were intramammary preparations. The proportion of fluoroquinolones sold as oral solution was 78.1 % and injections accounted for 21.9 % of the sales aggregated by the 26 countries. Premixes accounted for 36.6 % of the total sales of macrolides in the 26 countries, oral powders for 25.8 %, oral solutions for 31.2 % and injectable preparations for 6.4 %.
A large difference in the sales, expressed as mg/PCU, was observed between the most- and least selling countries (range 3.7–425.8 mg/PCU) for 2013. This is likely to be partially due to differences in the composition of the animal population in the various countries (e.g. more pigs than cattle, or a high proportion of veal calves within the cattle population). There may also be considerable variation in terms of daily dose used for the various antimicrobial agents, length of treatment period, or formulations used, which may also in part explain some of the differences between the countries. However, these factors can only partly explain the differences in the sales observed between the 26 countries; other factors also need to be considered. In addition, differences in the selection of data source may have an impact, although this is considered to be low.
Sales of veterinary antimicrobial agents in 26 EU/EEA countries in 2013Fifth ESVAC report12
Of the overall sales in the 26 countries in 2013, the largest proportions, expressed as mg/PCU, were accounted for by tetracyclines (36.7 %), penicillins (24.5 %) and sulfonamides (9.6 %). For the antimicrobial classes belonging to the World Health Organization (WHO) list of critically important antimicrobials (CIAs) with highest priority in human medicine, namely 3rd- and 4th-generation cephalosporins, fluoroquinolones and macrolides, the sales for food-producing animals, including horses, accounted for 0.17 %, 1.87 % and 7.37 %, respectively, of the total sales in the 26 countries in 2013.
The prescribing patterns of the various antimicrobial classes, expressed as mg/PCU, varied substantially between the countries. In 2013, notable variations between the countries in the proportion of 3rd- and 4th-generation cephalosporins, fluoroquinolones and macrolides sold were observed, with sales ranging from 0.01 % to 1.3 %, 0.02 % to 7.9 % and 0 % to 12.4 %, respectively.
Variations in prescribing patterns may be due to, for example, differences between countries in the veterinarians’ prescribing behaviour, the relative proportion of the various animal species, animal-production systems (e.g. veal as opposed to beef cattle on pasture), the availability of veterinary antimicrobial products on the market, prices, or the general situation with regard to infectious diseases. These factors only partly explain the differences in the sales patterns between the countries.
Of the total numbers of product presentations of antimicrobial VMPs applicable for food-producing animals (including horses) sold in 2013 — i.e. product name, pharmaceutical form, strength and pack size (tablets not included) — 81.2 % contained only one active ingredient, 16.8 % contained two active ingredients, 1.9 % contained three active ingredients and 0.2 % contained four active ingredients (these were intramammaries).
For all 26 countries, the proportion of the sales in 2013 (tonnes) of antimicrobial VMPs applicable for group treatment (oral powder, oral solution and premix) containing two or more active ingredients was relatively low. Of the total sales, 84.0 %, 15.5 % and 0.6 % of these pharmaceutical forms contained one, two and three active ingredients, respectively. However, as it is possible to mix more than one premix/oral powder and oral solution into feed or drinking water, respectively, these data do not provide a reliable estimate of treatment through feed or drinking water with two or more active ingredients.
Important variations were observed between the sales and sales patterns, expressed in tonnes, of veterinary antimicrobial agents used in companion animals (tablets). This is the case in particular for the sales of tablets with the combination of penicillins + beta-lactamase inhibitors (tonnes of clavulanic acid not included in the data), which varied between 15 % and 100 % (7 countries) of the total sales of penicillin tablets. Where sales of penicillin + clavulanic acid tablets accounted for 100 % of sales of penicillin tablets, it reflects that such combinations are the only penicillin tablets marketed in the country for companion animals. It must be noted that, in companion animals, human medicinal products containing antimicrobial agents and injectable veterinary medicinal products containing antimicrobial agents may also be used, and thus the data on sales of tablets should be interpreted with great care.
For Bulgaria and Slovakia, no conclusion can be made on whether there has been an increase or decrease in sales due to under-reporting for Bulgaria for 2011 and 2012, and for Slovakia there has been a change in the data collection system for the 2013 data. Luxembourg did not provide data for 2010 and 2011.
For the period 2011 to 2013, a decrease in the sales (mg/PCU) of more than 5 % (range: 5.6 %–51 %) is observed for 11 of the 23 countries (Table 10.).
An increase in the sales (mg/PCU) of more than 5 % (range: 5.4 %–21 %) for the period 2011–2013 is observed for 6 of the 23 countries.
Overall, for 23 countries reporting sales data to ESVAC for the years 2011-2013, a decrease in the sales (in mg/PCU) of 7.9 % is observed; the reduction of PCU was 2.8 % and the reduction in tonnes sold was 10.5 %. The sales (in mg/PCU) of fluoroquinolones and 3rd- and 4th-generation cephalosporins in these countries was, however, stable across the years 2011–2013 (Figure 57.).
For the 20 countries that have delivered sales data to ESVAC for four years (2010–2013) the current data analysis is indicating that the overall sales (in mg/PCU) for these countries continues to decline; the observed overall decrease in the sales (in mg/PCU) for these countries was 11.1 %.
Tentative explanations provided by the countries (see Chapter 2.8.2.) for the decline in sales are, among others, implementation of responsible-use campaigns, changes in animal demographics, restrictions of use, increased awareness of the threat of antimicrobial resistance, and/or the setting of targets. Additional detailed information on national programmes and campaigns on the responsible use of antimicrobial agents is needed before conclusions can be drawn on the efficacy of these campaigns in reducing the sales of antimicrobial agents. At the European level, this would provide data for interventions aimed at best practices for the use of antimicrobial agents in animals.

Sales of veterinary antimicrobial agents in 26 EU/EEA countries in 2013Fifth ESVAC report 13
IntroductionTerms of reference from the European CommissionIn 2008, the European Council, through the Council conclusions on antimicrobial resistance, called upon the Member States to strengthen surveillance systems and improve data quality on antimicrobial resistance and on consumption of antimicrobial agents within both the human and veterinary sectors. In response to the Council conclusions, the European Commission requested the European Medicines Agency to take the lead in the collection of data on sales of veterinary antimicrobial agents in the Member States. In order to guarantee an integrated approach, the Agency was requested to consult the European Centre for Disease Prevention and Control (ECDC), the European Food Safety Authority (EFSA) and the EU Reference Laboratory for Antimicrobial Resistance (EURL-AR).
The European Surveillance of Veterinary Antimicrobial Consumption (ESVAC) project was launched in September 2009, following a request to develop an approach for the harmonised collection and reporting of data on the use of antimicrobial agents in animals in the Member States (SANCO/E2/KDS/rz D(2008) 520915). Through the terms of reference from the Commission, the Agency was requested, among other activities:
• to identify the existing data/surveillance systems established for collection of sales and use of antibacterial drugs in the Member States;
• to develop a harmonised approach for the collection and reporting of data based on national sales figures, combined with estimations of usage in at least major groups of species (poultry, pigs, veal calves, other ruminants, pets and fish);
• to collect the data from Member States and manage the database;
• to draft and publish a summary annual report with the data from Member States.
With regard to the data collection:
• comparability with the sale/use of antimicrobials in humans should be ensured.
About ESVACCurrently, the ESVAC project is collecting sales data on veterinary antimicrobial agents at package level from the EU Member States and EEA countries. The collection of consumption data by species and the establishment of technical units of measurement are in preparation, with the assistance of two ad hoc working groups. A draft reflection paper was published for consultation on 18 December 2012.
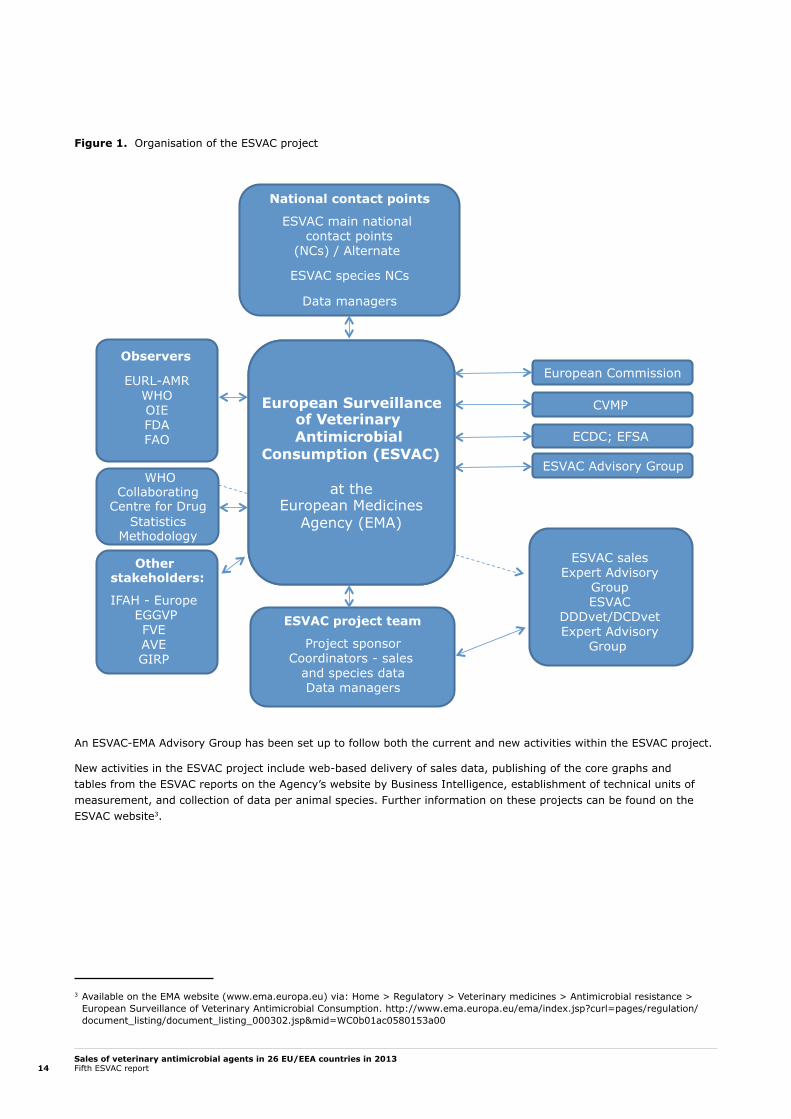
The organisation of the ESVAC project is illustrated in Figure 1.
The core of the ESVAC project on sales is the ESVAC network of main national contact points (NCs) and alternates, nominated by the national competent authorities in the participating EU and EEA countries. The country and affiliation of the ESVAC main NCs/alternates can be found in Annex 7 of this report. The tasks of the ESVAC main NCs are to provide data on sales at package level to the ESVAC team at the European Medicines Agency following annual data calls, to revise the data in terms of quality and validity following requests from the ESVAC team, to validate the data applied to calculate the population correction unit, and to provide comments on the annual ESVAC report.
The ESVAC project is supported by an Expert Advisory Group (previously ad hoc Expert Group) which comprises representatives of the ESVAC main NCs or alternate network. There are also observers from the European Commission, ECDC and EFSA. The task of the ESVAC EAG sales is to provide technical advice on surveillance of overall sales data of antimicrobial agents, including collection and analysis of data and preparation of the annual report. A list of the ESVAC EAG members and observers can be found in Annex 8 of this report.
2 http://www.ema.europa.eu/ema/index.jsp?curl=pages/regulation/document_listing/document_listing_000302.jsp&mid=WC0b01ac0580153a00
Sales of veterinary antimicrobial agents in 26 EU/EEA countries in 2013Fifth ESVAC report14
Figure 1. Organisation of the ESVAC project
An ESVAC-EMA Advisory Group has been set up to follow both the current and new activities within the ESVAC project.
New activities in the ESVAC project include web-based delivery of sales data, publishing of the core graphs and tables from the ESVAC reports on the Agency’s website by Business Intelligence, establishment of technical units of measurement, and collection of data per animal species. Further information on these projects can be found on the ESVAC website3.
ESVAC project team
Project sponsorCoordinators - sales
and species dataData managers
National contact points ESVAC main national
contact points(NCs) / Alternate ESVAC species NCs
Data managers
ESVAC salesExpert Advisory
GroupESVAC
DDDvet/DCDvetExpert Advisory
Group
European Surveillance of Veterinary Antimicrobial
Consumption (ESVAC)
at the European Medicines
Agency (EMA)
WHO Collaborating
Centre for Drug Statistics
Methodology
Other stakeholders:
IFAH - Europe EGGVP
FVEAVEGIRP
Observers
EURL-AMRWHOOIEFDAFAO
ESVAC Advisory Group
European Commission
CVMP
ECDC; EFSA
3 Available on the EMA website (www.ema.europa.eu) via: Home > Regulatory > Veterinary medicines > Antimicrobial resistance > European Surveillance of Veterinary Antimicrobial Consumption. http://www.ema.europa.eu/ema/index.jsp?curl=pages/regulation/document_listing/document_listing_000302.jsp&mid=WC0b01ac0580153a00

Sales of veterinary antimicrobial agents in 26 EU/EEA countries in 2013Fifth ESVAC report 15
1. Technical notes1.1. Veterinary antimicrobial agents included in the data setsTo harmonise the veterinary antimicrobial agents to be included in the data sets, the Anatomical Therapeutic Chemical classification system for veterinary medicinal products (ATCvet4) was applied (Table 1). This includes all pharmaceutical forms and medicated feed except dermatological preparations (ATCvet group QD) and preparations for sensory organs (ATCvet group QS). The contribution from these groups of antimicrobial agents, in tonnes of active ingredient, to the total amount is minimal, and therefore the effect of the deviation is negligible.
To harmonise with the presentation of data on sales of antimicrobial agents in human medicine, the data are presented according to the ATCvet hierarchical system and ATCvet names, usually WHO international non-proprietary names (INN), where available. If INNs are not assigned, the ATCvet system applies either USAN (United States Adopted Names) or BAN (British Approved Names).
Table 1. Categories and ATCvet codes5 of antimicrobial veterinary medicinal products included in the data
Categories of veterinary antimicrobial agents ATCvet codes
Antimicrobial agents for intestinal use QA07AA; QA07AB
Antimicrobial agents for intrauterine use QG01AA; QG01AE; QG01BA; QG01BE; QG51AA; QG51AG
Antimicrobial agents for systemic use QJ01
Antimicrobial agents for intramammary use QJ51
Antimicrobial agents used as antiparasitic agents QP51AG
1.2. Variables reported for each antimicrobial veterinary medicinal productDetailed information on the variables to be reported for each antimicrobial veterinary medicinal product is given in Annex 2 of this report, as well as in the ESVAC protocol and ESVAC data-collection form published on the Agency’s website3. In order to standardise the information, it has been agreed to apply one of the following categories of pharmaceutical form in ESVAC reporting: bolus, injection, intramammary, intramammary for dry cow treatment, intrauterine preparation, oral solution, oral paste, oral powder, premix or tablet (including capsules). Note that when in the name/label or SPC it reads e.g. “powder for solution” or “powder for administration in drinking water” this should be reported as oral solution.
This allows for a partial repartition of data into use in companion animals (tablets) and food-producing animals, including horses. In the current report, the term ‘group treatment’ is used for medication via feed or water.
1.3. Population correction unit (PCU)The amounts of veterinary antimicrobial agents sold in the different countries are, among others, linked to the animal demographics in each country. In this report, the annual sales figures in each country were divided by the estimated weight at treatment of livestock and of slaughtered animals in the corresponding year, taking into account the import and export of animals for fattening or slaughter in another Member State. The population correction unit (PCU) is used as the term for the estimated weight. The PCU is purely a technical unit of measurement, used only to estimate sales corrected by the animal population in individual countries and across countries. In this report, 1 PCU = 1 kg of different categories of livestock and slaughtered animals. The data sources used and the methodology for the calculation of PCU are comprehensively described in Appendix 2 of the Agency's report 'Trends in the sales of veterinary antimicrobial agents in nine European countries: 2005-2009' (EMA/238630/2011). Animal categories included in the calculation of the PCU and the weights used are described in Annex 3.
4 Available on the EMA website (www.ema.europa.eu) via: Home > Regulatory > Veterinary medicines > Antimicrobial resistance > European Surveillance of Veterinary Antimicrobial Consumption.
5 www.whocc.no/atcvet/

Sales of veterinary antimicrobial agents in 26 EU/EEA countries in 2013Fifth ESVAC report16
1.4. Calculation of PCUEssentially, the PCU for each animal category was calculated by multiplying numbers of livestock animals (dairy cows, sheep, sows and horses) and slaughtered animals (cattle, goat, pigs, sheep, poultry, rabbits and turkeys) by the theoretical weight at the time most likely for treatment. Note that due to limited availability of living goat data in Eurostat, when the PCU methodology was established for the 1st ESVAC report6, this category was not included. For countries with a relatively high number of goats compared to the other food-producing animals, this results in an underestimate of the PCU and an overestimate of the mg/PCU compared to countries with a low number of goats. For animals exported or imported for fattening or slaughter (cattle, goat, pigs, sheep and poultry), the PCU was calculated by multiplying the number of animals by a standardised weight.
For farmed fish, Eurostat data are given only as live-weight slaughtered not numbers slaughtered, and the PCU is taken as biomass live-weight slaughtered in each country. The PCU of the animals exported for fattening or slaughter in another Member State was added to the PCU of livestock and slaughter animals in the country of origin, because young animals are typically treated more frequently than other age classes. The PCU for animals imported for fattening or slaughter in another Member State was subtracted from the total PCU of livestock and slaughter animals, since it is included in the data on slaughter animals (Eurostat data) and to avoid double counting (counting both by the exporting and importing country).
PCU calculation by species, age class and production type
1. Number of animals slaughtered × estimated weight at treatment.
2. Number of livestock × estimated weight at treatment.
3. Number of animals transported (net export) to another country × estimated weight at treatment.
1.5. Animal species and categories included; selection of data sourcesEurostat, the Statistical Office of the European Union, covers data on numbers and biomass of food-producing animals slaughtered, as well as data on livestock food-producing animals. Therefore, Eurostat was selected as the source7 for data on this animal category. In cases where data were not available in Eurostat (e.g. for rabbits), national statistics were applied. For horses (food-producing species according to EU legislation), national statistics provided by the ESVAC NCs were used. As data on dogs and cats are not available in all participating countries, these species were not included in the PCU, in order to have comparable data. Therefore, antimicrobial VMPs approved for use in companion animals only, i.e. tablets, were excluded from the data sets prior to the normalisation of the sales by the PCU.
Animals exported for fattening or slaughter in another Member State are likely to have been treated with antimicrobial agents in the country of origin, and therefore it is important to correct for this for the major species (cattle, pigs, poultry and sheep). The Eurostat data on numbers of animals exported or imported for fattening or slaughter are not valid, as these are reported only when above a certain limit, which implies that the Eurostat data represent an underestimate of these for most species and countries. Such data were therefore obtained from TRACES (TRAde Control and Expert System run by DG SANCO, European Commission), as these are based on health certificates, which are obligatory for all animals crossing any border.
In cases where the deviation between the Eurostat data and/or TRACES data and national statistics was more than 5 %, several countries applied national statistics.
1.6. Corrections of historical data
1.6.1. Sales dataTesting of the web-based delivery of the sales data through Business Intelligence served as a validation of the output for previous years published under the current system.
6 Available on the EMA website (www.ema.europa.eu) via: Home > Veterinary regulatory > Antimicrobial resistance > European Surveillance of Veterinary Antimicrobial Consumption.
7 http://epp.eurostat.ec.europa.eu/portal/page/portal/statistics/themes
Sales of veterinary antimicrobial agents in 26 EU/EEA countries in 2013Fifth ESVAC report 17
Errors in the data were identified for three countries. For Belgium, errors were identified for the conversion factors for eight products for 2012. For Poland, errors for the conversion factor were identified for two products and in strength for one product for 2012, the error in the strength for that product was also identified for the 2011 data. For Spain, errors were identified in the number of packages sold for 2011 and 2012.
1.6.2. PCU dataFor Denmark, fish data have been revised for 2012, and for France, the fish data have been revised for 2010, 2011 and 2012. For Hungary, the PCU data for 2012 for rabbits have been revised; for Slovakia, data for fish and rabbits have been added (missing in ESVAC 2012 report).
1.7. Quality check and validation of the dataThe data sets provided were checked for errors in terms of standardisation (logical errors) by the ESVAC project team, using an in-house program developed applying the Java programming language as a standalone application with an Oracle database back-end, designed to manage data submitted in the ESVAC template format. Furthermore, data were checked manually in order to identify outliers mainly by checking against published data for previous years.
1.8. Reporting of the dataThe main indicator applied in this report to express the consumption of veterinary antimicrobials is mg active ingredient normalised by the population correction unit (mg/PCU):
Amount sold in tonnes × 109
PCU in kg
The data are presented according to the ATCvet hierarchical system, and for combination preparations, each active ingredient is allocated to the relevant ATCvet code for single substances (e.g. spectinomycin is included in ‘Other antibacterials’). The maps on spatial consumption of the various veterinary antimicrobial agents were created using Quantum Geographic Information System (QGIS) version 1.8.08.
Please note that data presented in this report are calculated using the exact figures on sales of each product and for each species (five decimals), but in tables and graphs the numbers are aggregated and rounded, therefore the totals in, for example, the tables may differ slightly from the aggregated data presented in the detailed figures.
All data presented in this report reflects the information available by 2 June 2015, any updates of the data made at a later stage are not included in the analysis of the data.
1.9. Summary of included data sources/types, by countryInformation on years of collecting data, legal basis for the collection of the data at national level, national data sources, systems for distribution of antimicrobial VMPs, sources from which the data were obtained, type of data and the data included by country are shown in Table 2.
8 Available from: http://www.qgis.org
Sales of veterinary antimicrobial agents in 26 EU/EEA countries in 2013Fifth ESVAC report18
Tab
le 2
. S
umm
ary
of in
form
atio
n on
yea
rs c
olle
ctin
g da
ta,
lega
l bas
is f
or c
olle
ctin
g da
ta a
t na
tiona
l lev
el,
natio
nal d
ata
prov
ider
s, s
ourc
es for
ESVA
C d
ata
and
char
acte
rist
ics
of d
ata,
by
coun
try,
for
201
3
Cou
ntr
yY
ears
co
llect
ing
d
ata
Leg
al
bas
isN
atio
nal
dat
a p
rovi
der
to
ESV
AC
Sou
rces
for
ES
VA
C
dat
a (a
pp
rox.
no)
Pre
scri
pti
on d
ata,
sal
es
dat
a or
pu
rch
ase
dat
a1
Sal
es b
etw
een
w
hol
esal
ers
and
/or
MA
Hs2
ex
clu
ded
(Y
es/
No)
Pro
du
cts
use
d
on s
pec
ial
licen
ce
incl
ud
ed (
Yes
/N
o)
Aus
tria
4 ye
ars
Man
dato
ry
to r
epor
tAus
tria
n Age
ncy
for
Hea
lth a
nd F
ood
Saf
ety
MAH
s (n
=10
);
Who
lesa
lers
(n=
6)Sal
es t
o ve
terina
rian
sYe
sN
o
Bel
gium
>5
year
sM
anda
tory
to
rep
ort
Fede
ral A
genc
y fo
r M
edic
ines
and
Hea
lth
Prod
ucts
Who
lesa
lers
(n=
25);
Fe
ed m
ills
(n=
57)
Sal
es t
o ve
terina
rian
s an
d ph
arm
acie
s. S
ales
by
feed
m
ills
to f
arm
ers
Yes
No
Bul
garia
3 ye
ars
Man
dato
ry
to r
epor
tBul
garian
Foo
d Saf
ety
Age
ncy
Who
lesa
lers
(n=
36)
Sal
es t
o ve
terina
rian
s,
farm
ers
and
phar
mac
ies
Yes
No
Cyp
rus
3 ye
ars
Man
dato
ry
to r
epor
t M
inis
try
of A
gric
ultu
re,
Nat
ural
Res
ourc
es a
nd
Envi
ronm
ent
- Ve
terina
ry
Ser
vice
s
Who
lesa
lers
(n=
21)
Sal
es t
o ph
arm
acie
s an
d ve
terina
ry c
linic
sYe
sN
o
Cze
ch
Repu
blic
>5
year
sM
anda
tory
to
rep
ort
Inst
itute
for
Sta
te
Con
trol
of
Vete
rina
ry
Bio
logi
cals
and
Med
icin
es
Who
lesa
lers
(n=
83);
Fe
ed m
ills
(n=
51)
Sal
es t
o ve
terina
rian
s,
phar
mac
ies
and
farm
ers.
Sal
es b
y fe
ed m
ills
to
farm
ers
Yes
Yes
(onl
y on
e pr
oduc
t w
ith
sign
ifica
nt
cons
umpt
ion
in
2013
)
Den
mar
k>
5 ye
ars
Man
dato
ry
to r
epor
tD
anis
h Ve
terina
ry a
nd
Food
Adm
inis
trat
ion
VetS
tat
(n=
1)
obta
inin
g da
ta f
rom
Ph
arm
acie
s (n
=10
8);
Vete
rina
rian
s (n
=35
0);
Fe
ed m
ills
(n=
3)
Pres
crip
tion
data
fro
m
phar
mac
ies,
vet
erin
aria
ns
dist
ribu
tors
and
fee
d m
ills
Yes
Yes
Esto
nia
>5
year
s M
anda
tory
to
rep
ort
Sta
te A
genc
y of
M
edic
ines
Who
lesa
lers
(n=
9)Sal
es t
o ve
terina
rian
s an
d ph
arm
acie
sYe
sYe
s
Finl
and
>5
year
sM
anda
tory
to
rep
ort
Finn
ish
Med
icin
es A
genc
yW
hole
sale
rs (
n=3)
;
Feed
mill
s (n
=1)
; Im
port
ers
of
med
icat
ed f
eed
(n=
1)
Sal
es t
o ph
arm
acie
s an
d ve
terina
rian
sN
oYe
s
Fran
ce>
5 ye
ars
Not
m
anda
tory
Nat
iona
l Age
ncy
for
Vete
rina
ry M
edic
inal
Pr
oduc
ts (
Ans
es-A
NM
V)
MAH
s (n
=42
)Sal
es t
o ve
terina
rian
s,
farm
ers,
who
lesa
lers
and
fe
ed m
ills
Not
app
licab
leYe
s

Sales of veterinary antimicrobial agents in 26 EU/EEA countries in 2013Fifth ESVAC report 19
Cou
ntr
yY
ears
co
llect
ing
d
ata
Leg
al
bas
isN
atio
nal
dat
a p
rovi
der
to
ESV
AC
Sou
rces
for
ES
VA
C
dat
a (a
pp
rox.
no)
Pre
scri
pti
on d
ata,
sal
es
dat
a or
pu
rch
ase
dat
a1
Sal
es b
etw
een
w
hol
esal
ers
and
/or
MA
Hs2
ex
clu
ded
(Y
es/
No)
Pro
du
cts
use
d
on s
pec
ial
licen
ce
incl
ud
ed (
Yes
/N
o)
Ger
man
y3
year
sM
anda
tory
to
rep
ort
Fede
ral O
ffice
of
Con
sum
er P
rote
ctio
n an
d Fo
od S
afet
y
MAH
s (n
=36
);
Who
lesa
lers
(n=
20);
PS
URs3
dat
a fo
r pr
emix
Sal
es t
o ve
terina
rian
sYe
sN
o
Hun
gary
>5
year
sN
ot
man
dato
ryN
atio
nal F
ood
Cha
in
Saf
ety
Offi
ce
Direc
tora
te o
f Ve
terina
ry
Med
icin
al P
rodu
cts
Who
lesa
lers
(n=
82);
W
hole
sale
rs o
ther
co
untr
ies
(n=
2)
Sal
es t
o ve
terina
rian
s,
feed
mill
s, far
mer
s an
d re
taile
rs
Yes
No
Icel
and
4 ye
ars
Man
dato
ry
to r
epor
tIc
elan
dic
Med
icin
es
Age
ncy
Who
lesa
lers
(n=
2)Sal
es b
y w
hole
sale
rs
to v
eter
inar
ians
and
ph
arm
acie
s
Yes
Yes
Irel
and
5 ye
ars
Man
dato
ry
to r
epor
tH
ealth
Pro
duct
s Re
gula
tory
Aut
hority
MAH
s (n
=66
)Sal
es t
o ph
arm
acie
s or
ve
terina
rian
sYe
sN
o
Ital
y4
year
sM
anda
tory
to
rep
ort
Ital
ian
Min
istr
y of
Hea
lthM
AH
s (n
=49
)Sal
es t
o w
hole
sale
rs,
phar
mac
ies,
fee
d m
ills,
an
d fa
rms
auth
oris
ed t
o pr
oduc
e m
edic
ated
fee
d fo
r se
lf-co
nsum
ptio
n
Yes
No
Latv
ia4
year
sM
anda
tory
to
rep
ort
Food
and
Vet
erin
ary
Ser
vice
Who
lesa
lers
(n=
24)
Sal
es t
o ph
arm
acie
s,
vete
rina
rian
s an
d fa
rmer
sYe
sN
o
Lith
uani
a4
year
sM
anda
tory
to
rep
ort
Sta
te F
ood
and
Vete
rina
ry S
ervi
ceW
hole
sale
rs (
n=33
)Sal
es t
o ph
arm
acie
s,
vete
rina
rian
s an
d fa
rmer
sYe
sN
o
Luxe
mbo
urg
2 ye
ars
Man
dato
ry
to r
epor
tM
inis
try
of H
ealth
Who
lesa
lers
(n=
3)Sal
es t
o ph
arm
acie
s,
vete
rina
rian
sYe
sYe
s
Net
herlan
ds>
5 ye
ars
Not
m
anda
tory
Fede
ratio
n of
the
D
utch
Vet
erin
ary
Phar
mac
eutic
al I
ndus
try
(FID
IN)
MAH
s (n
=18
)Sal
es t
o ve
terina
rian
s Ye
sN
o
Nor
way
>5
year
sM
anda
tory
to
rep
ort
Nor
weg
ian
Vete
rina
ry
Inst
itute
Who
lesa
lers
(n=
5)Sal
es t
o ph
arm
acie
s,
vete
rina
rian
s an
d fe
ed
mill
s
Yes
Yes
Pola
nd3
year
sM
anda
tory
to
rep
ort
Min
istr
y of
Agr
icul
ture
an
d Rur
al D
evel
opm
ent
Who
lesa
lers
(n=
128)
Sal
es t
o ve
terina
rian
sYe
sN
o
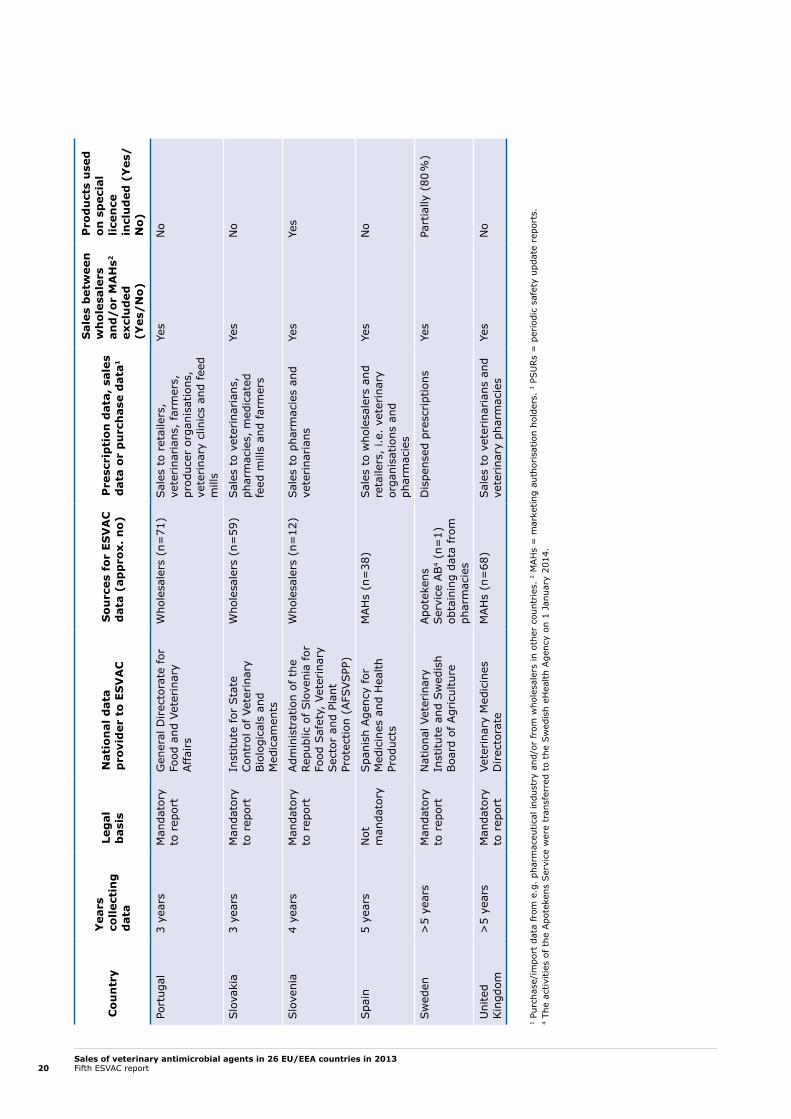
Sales of veterinary antimicrobial agents in 26 EU/EEA countries in 2013Fifth ESVAC report20
Cou
ntr
yY
ears
co
llect
ing
d
ata
Leg
al
bas
isN
atio
nal
dat
a p
rovi
der
to
ESV
AC
Sou
rces
for
ES
VA
C
dat
a (a
pp
rox.
no)
Pre
scri
pti
on d
ata,
sal
es
dat
a or
pu
rch
ase
dat
a1
Sal
es b
etw
een
w
hol
esal
ers
and
/or
MA
Hs2
ex
clu
ded
(Y
es/
No)
Pro
du
cts
use
d
on s
pec
ial
licen
ce
incl
ud
ed (
Yes
/N
o)
Port
ugal
3 ye
ars
Man
dato
ry
to r
epor
t G
ener
al D
irec
tora
te f
or
Food
and
Vet
erin
ary
Aff
airs
Who
lesa
lers
(n=
71)
Sal
es t
o re
taile
rs,
vete
rina
rian
s, far
mer
s,
prod
ucer
org
anis
atio
ns,
vete
rina
ry c
linic
s an
d fe
ed
mill
s
Yes
No
Slo
vaki
a3
year
sM
anda
tory
to
rep
ort
Inst
itute
for
Sta
te
Con
trol
of
Vete
rina
ry
Bio
logi
cals
and
M
edic
amen
ts
Who
lesa
lers
(n=
59)
Sal
es t
o ve
terina
rian
s,
phar
mac
ies,
med
icat
ed
feed
mill
s an
d fa
rmer
s
Yes
No
Slo
veni
a4
year
sM
anda
tory
to
rep
ort
Adm
inis
trat
ion
of t
he
Repu
blic
of
Slo
veni
a fo
r Fo
od S
afet
y, V
eter
inar
y Sec
tor
and
Plan
t Pr
otec
tion
(AFS
VSPP
)
Who
lesa
lers
(n=
12)
Sal
es t
o ph
arm
acie
s an
d ve
terina
rian
s Ye
sYe
s
Spa
in5
year
sN
ot
man
dato
rySpa
nish
Age
ncy
for
Med
icin
es a
nd H
ealth
Pr
oduc
ts
MAH
s (n
=38
)Sal
es t
o w
hole
sale
rs a
nd
reta
ilers
, i.e
. ve
terina
ry
orga
nisa
tions
and
ph
arm
acie
s
Yes
No
Swed
en>
5 ye
ars
Man
dato
ry
to r
epor
tN
atio
nal V
eter
inar
y In
stitu
te a
nd S
wed
ish
Boa
rd o
f Agr
icul
ture
Apo
teke
ns
Ser
vice
AB
4 (n
=1)
ob
tain
ing
data
fro
m
phar
mac
ies
Dis
pens
ed p
resc
ript
ions
Yes
Part
ially
(80
%)
Uni
ted
Kin
gdom
>5
year
sM
anda
tory
to
rep
ort
Vete
rina
ry M
edic
ines
D
irec
tora
teM
AH
s (n
=68
)Sal
es t
o ve
terina
rian
s an
d ve
terina
ry p
harm
acie
sYe
sN
o
1 Pu
rcha
se/i
mpo
rt d
ata
from
e.g
. ph
arm
aceu
tical
indu
stry
and
/or
from
who
lesa
lers
in o
ther
cou
ntries
. 2
MAH
s =
mar
ketin
g au
thor
isat
ion
hold
ers.
3 P
SU
Rs
= p
erio
dic
safe
ty u
pdat
e re
port
s.
4 Th
e ac
tiviti
es o
f th
e Apo
teke
ns S
ervi
ce w
ere
tran
sfer
red
to t
he S
wed
ish
eHea
lth A
genc
y on
1 J
anua
ry 2
014.
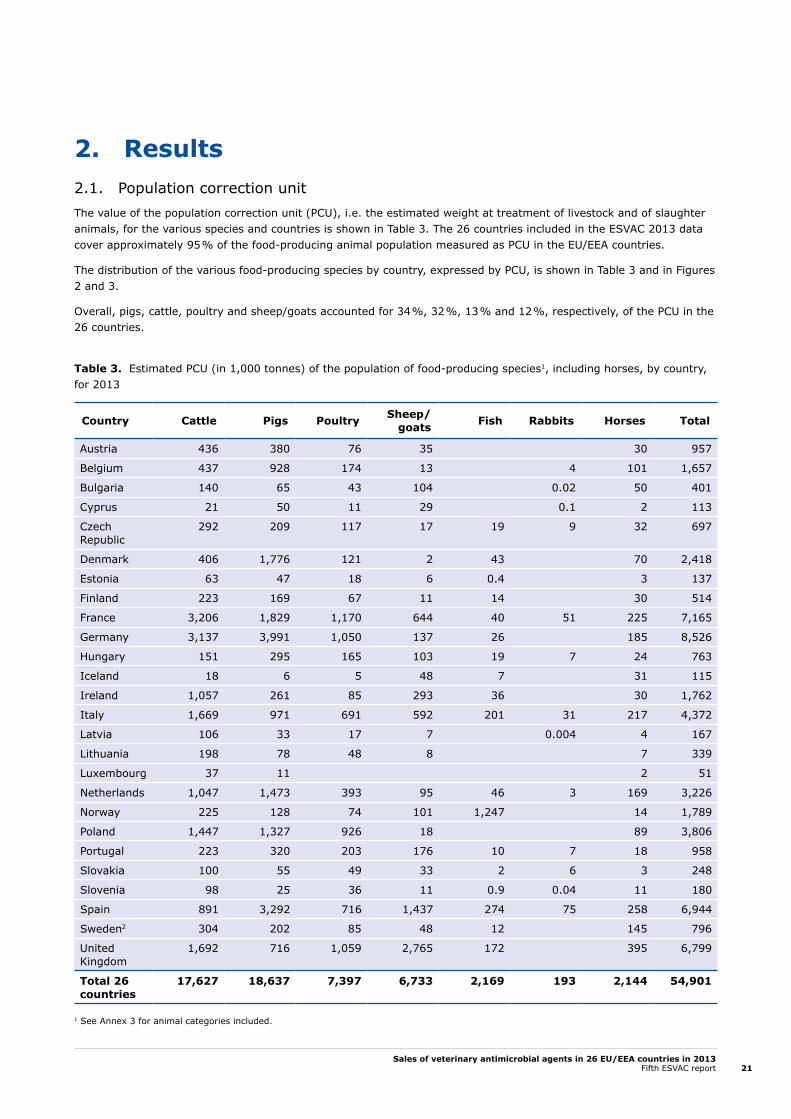
Sales of veterinary antimicrobial agents in 26 EU/EEA countries in 2013Fifth ESVAC report 21
2. Results2.1. Population correction unitThe value of the population correction unit (PCU), i.e. the estimated weight at treatment of livestock and of slaughter animals, for the various species and countries is shown in Table 3. The 26 countries included in the ESVAC 2013 data cover approximately 95 % of the food-producing animal population measured as PCU in the EU/EEA countries.
The distribution of the various food-producing species by country, expressed by PCU, is shown in Table 3 and in Figures 2 and 3.
Overall, pigs, cattle, poultry and sheep/goats accounted for 34 %, 32 %, 13 % and 12 %, respectively, of the PCU in the 26 countries.
Table 3. Estimated PCU (in 1,000 tonnes) of the population of food-producing species1, including horses, by country, for 2013
Country Cattle Pigs Poultry Sheep/ goats Fish Rabbits Horses Total
Austria 436 380 76 35 30 957
Belgium 437 928 174 13 4 101 1,657
Bulgaria 140 65 43 104 0.02 50 401
Cyprus 21 50 11 29 0.1 2 113
Czech Republic
292 209 117 17 19 9 32 697
Denmark 406 1,776 121 2 43 70 2,418
Estonia 63 47 18 6 0.4 3 137
Finland 223 169 67 11 14 30 514
France 3,206 1,829 1,170 644 40 51 225 7,165
Germany 3,137 3,991 1,050 137 26 185 8,526
Hungary 151 295 165 103 19 7 24 763
Iceland 18 6 5 48 7 31 115
Ireland 1,057 261 85 293 36 30 1,762
Italy 1,669 971 691 592 201 31 217 4,372
Latvia 106 33 17 7 0.004 4 167
Lithuania 198 78 48 8 7 339
Luxembourg 37 11 2 51
Netherlands 1,047 1,473 393 95 46 3 169 3,226
Norway 225 128 74 101 1,247 14 1,789
Poland 1,447 1,327 926 18 89 3,806
Portugal 223 320 203 176 10 7 18 958
Slovakia 100 55 49 33 2 6 3 248
Slovenia 98 25 36 11 0.9 0.04 11 180
Spain 891 3,292 716 1,437 274 75 258 6,944
Sweden2 304 202 85 48 12 145 796
United Kingdom
1,692 716 1,059 2,765 172 395 6,799
Total 26 countries
17,627 18,637 7,397 6,733 2,169 193 2,144 54,901
1 See Annex 3 for animal categories included.

Sales of veterinary antimicrobial agents in 26 EU/EEA countries in 2013Fifth ESVAC report22
Figure 2. The denominator (PCU) and its distribution by the food-producing animal species, including horses, (PCU = 1 kg), by country, for 2013
* For some countries, fish, horses and rabbits.
Figure 3. Distribution of PCU in weight by food-producing animal species, including horses, by country, for 2013
* For some countries, fish, horses and rabbits.
The percentage of the total PCU accounted for by the net export or import of animals for slaughter and/or fattening is shown in Figure 4. Of the 26 countries, 6 countries had a net export of animals for slaughter and/or fattening to other Member States that accounted for ≥ 5 % of the PCU. This is the same number of countries as for 2012 data but note that the proportion of PCU attributed for by import as well as for export of animals is typically higher for some countries compared to 2012.
0
1,000
2,000
3,000
4,000
5,000
6,000
7,000
8,000
9,000 Aus
tria
Bel
gium
Bul
garia
Cyp
rus
Cze
ch R
epub
lic
Den
mar
k
Esto
nia
Finl
and
Fran
ce
Ger
man
y
Hun
gary
Icel
and
Irel
and
Ital
y
Latv
ia
Lith
uani
a
Luxe
mbo
urg
Net
herlan
ds
Nor
way
Pola
nd
Port
ugal
Slo
vaki
a
Slo
veni
a
Spa
in
Swed
en
Uni
ted
Kin
gdom
PCU
(1,
000
tonn
es)
Cattle Pigs Poultry Sheep and goats Others*
0%
10%
20%
30%
40%
50%
60%
70%
80%
90%
100%
Aus
tria
Bel
gium
Bul
garia
Cyp
rus
Cze
ch R
epub
lic
Den
mar
k
Esto
nia
Finl
and
Fran
ce
Ger
man
y
Hun
gary
Icel
and
Irel
and
Ital
y
Latv
ia
Lith
uani
a
Luxe
mbo
urg
Net
herlan
ds
Nor
way
Pola
nd
Port
ugal
Slo
vaki
a
Slo
veni
a
Spa
in
Swed
en
Uni
ted
Kin
gdom
PCU
Cattle Pigs Poultry Sheep and goats Others*

Sales of veterinary antimicrobial agents in 26 EU/EEA countries in 2013Fifth ESVAC report 23
Figure 4. Net export and net import1, as a percentage of the total PCU, of animals for fattening or slaughter in another Member State, for 2013
1 Data represent the net balance between export and import, i.e. a negative percentage means a net import.
2.2. Overall sales of veterinary antimicrobial agentsThe overall national sales data cover sales of antimicrobial VMPs for use in food-producing animals, including horses (all pharmaceutical forms except tablets) and sales of tablets that are almost solely used in companion animals. Injectable veterinary antimicrobial agents are also used in companion animals, but due to minor use, in terms of weight of active ingredient, such sales are included in the statistics for food-producing animals. Except for Finland, Norway, Slovenia and Sweden, where tablets accounted for 13.3 %, 8.8 %, 8.4 % and 9.8 %, respectively, sales of tablets, and therefore use in companion animals, accounted for a minor proportion of the total sales of veterinary antimicrobial agents in 2013 (Table 4.; Figure 5.). Overall, in the 26 countries, the sales of tablets, in tonnes represented 0.8 % of the total sales.
Table 4. Distribution of overall sales, in tonnes of active ingredient, split into tablets (used in companion animals) and all other pharmaceutical forms (used mainly in food-producing animals, including horses), by country, for 2013
Tablets All other pharmaceutical forms Total
Country Tonnes % of overall sales Tonnes % of overall
sales Tonnes
Austria 0.3 0.5 54.7 99.5 55.0
Belgium 1.7 0.7 259.5 99.3 261.2
Bulgaria 0.1 0.2 46.5 99.8 46.7
Cyprus 0.05 0.1 47.9 99.9 48.0
Czech Republic 0.9 1.6 57.2 98.4 58.2
Denmark 1.1 1.0 108.5 99.0 109.6
Estonia 0.1 1.3 8.5 98.7 8.7
Finland 1.9 13.3 12.5 86.7 14.4
France 15.9 2.3 681.0 97.7 696.8
Germany 7.4 0.5 1,527.2 99.5 1,534.6
-10%
-5%
0%
5%
10%
15%
20%
Aus
tria
Bel
gium
Bul
garia
Cyp
rus
Cze
ch R
epub
lic
Den
mar
k
Esto
nia
Finl
and
Fran
ce
Ger
man
y
Hun
gary
Icel
and
Irel
and
Ital
y
Latv
ia
Lith
uani
a
Luxe
mbo
urg
Net
herlan
ds
Nor
way
Pola
nd
Port
ugal
Slo
vaki
a
Slo
veni
a
Spa
in
Swed
en
Uni
ted
Kin
gdom
Export
Import
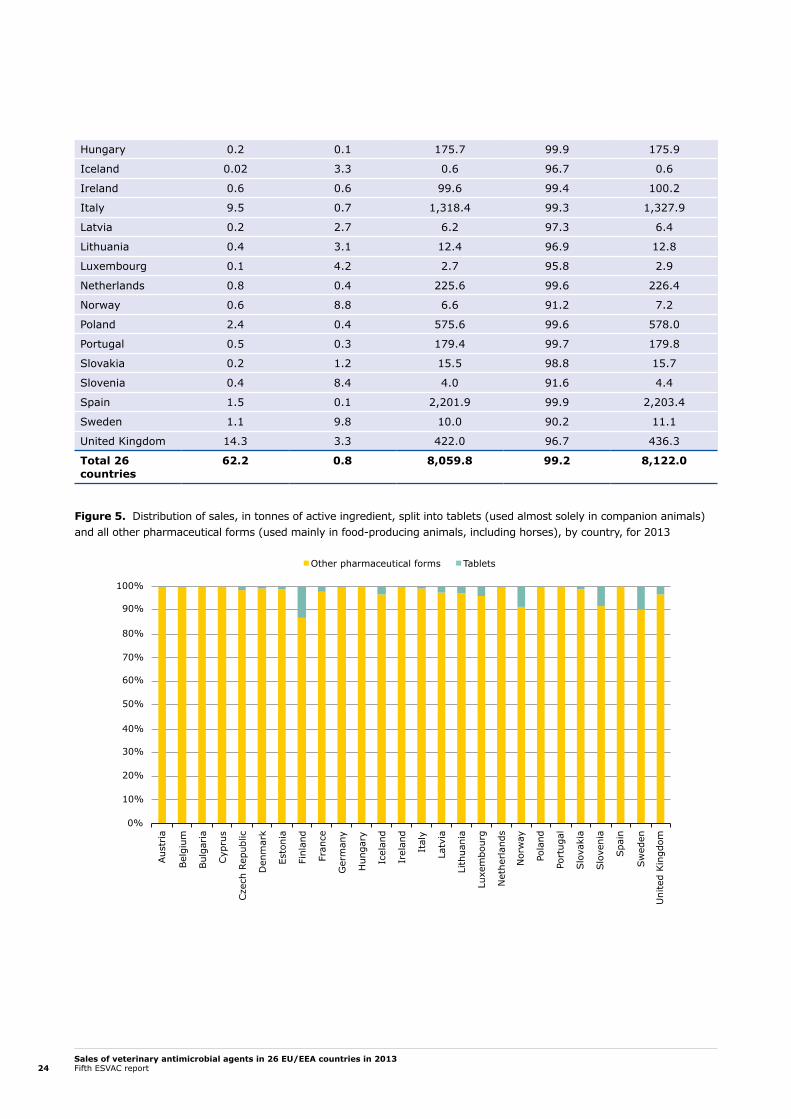
Sales of veterinary antimicrobial agents in 26 EU/EEA countries in 2013Fifth ESVAC report24
Hungary 0.2 0.1 175.7 99.9 175.9
Iceland 0.02 3.3 0.6 96.7 0.6
Ireland 0.6 0.6 99.6 99.4 100.2
Italy 9.5 0.7 1,318.4 99.3 1,327.9
Latvia 0.2 2.7 6.2 97.3 6.4
Lithuania 0.4 3.1 12.4 96.9 12.8
Luxembourg 0.1 4.2 2.7 95.8 2.9
Netherlands 0.8 0.4 225.6 99.6 226.4
Norway 0.6 8.8 6.6 91.2 7.2
Poland 2.4 0.4 575.6 99.6 578.0
Portugal 0.5 0.3 179.4 99.7 179.8
Slovakia 0.2 1.2 15.5 98.8 15.7
Slovenia 0.4 8.4 4.0 91.6 4.4
Spain 1.5 0.1 2,201.9 99.9 2,203.4
Sweden 1.1 9.8 10.0 90.2 11.1
United Kingdom 14.3 3.3 422.0 96.7 436.3
Total 26 countries
62.2 0.8 8,059.8 99.2 8,122.0
Figure 5. Distribution of sales, in tonnes of active ingredient, split into tablets (used almost solely in companion animals) and all other pharmaceutical forms (used mainly in food-producing animals, including horses), by country, for 2013
0%
10%
20%
30%
40%
50%
60%
70%
80%
90%
100%
Aus
tria
Bel
gium
Bul
garia
Cyp
rus
Cze
ch R
epub
lic
Den
mar
k
Esto
nia
Finl
and
Fran
ce
Ger
man
y
Hun
gary
Icel
and
Irel
and
Ital
y
Latv
ia
Lith
uani
a
Luxe
mbo
urg
Net
herlan
ds
Nor
way
Pola
nd
Port
ugal
Slo
vaki
a
Slo
veni
a
Spa
in
Swed
en
Uni
ted
Kin
gdom
Other pharmaceutical forms Tablets
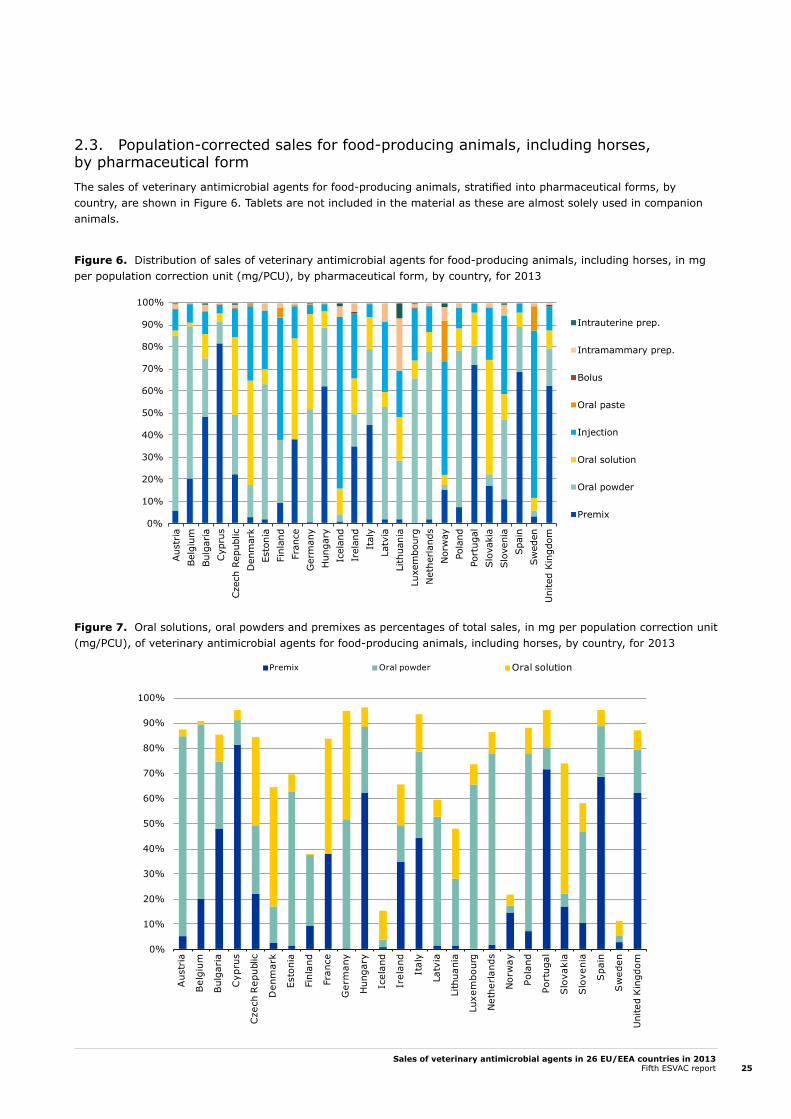
Sales of veterinary antimicrobial agents in 26 EU/EEA countries in 2013Fifth ESVAC report 25
2.3. Population-corrected sales for food-producing animals, including horses, by pharmaceutical formThe sales of veterinary antimicrobial agents for food-producing animals, stratified into pharmaceutical forms, by country, are shown in Figure 6. Tablets are not included in the material as these are almost solely used in companion animals.
Figure 6. Distribution of sales of veterinary antimicrobial agents for food-producing animals, including horses, in mg per population correction unit (mg/PCU), by pharmaceutical form, by country, for 2013
Figure 7. Oral solutions, oral powders and premixes as percentages of total sales, in mg per population correction unit (mg/PCU), of veterinary antimicrobial agents for food-producing animals, including horses, by country, for 2013
0%
10%
20%
30%
40%
50%
60%
70%
80%
90%
100%
Aus
tria
Bel
gium
Bul
garia
Cyp
rus
Cze
ch R
epub
lic
Den
mar
k Es
toni
a Fi
nlan
d Fr
ance
G
erm
any
Hun
gary
Ic
elan
d Ir
elan
d It
aly
Latv
ia
Lith
uani
a Lu
xem
bour
g N
ethe
rlan
ds
Nor
way
Po
land
Po
rtug
al
Slo
vaki
a Slo
veni
a Spa
in
Swed
en
Uni
ted
Kin
gdom
Intrauterine prep.
Intramammary prep.
Bolus
Oral paste
Injection
Oral solution
Oral powder
Premix
0%
10%
20%
30%
40%
50%
60%
70%
80%
90%
100%
Aus
tria
Bel
gium
Bul
gari
a
Cyp
rus
Cze
ch R
epub
lic
Den
mar
k
Esto
nia
Finl
and
Fran
ce
Ger
man
y
Hun
gary
Icel
and
Irel
and
Ital
y
Latv
ia
Lith
uani
a
Luxe
mbo
urg
Net
herl
ands
Nor
way
Pola
nd
Port
ugal
Slo
vaki
a
Slo
veni
a
Spa
in
Sw
eden
Uni
ted
Kin
gdom
Premix Oral powder Oral solution
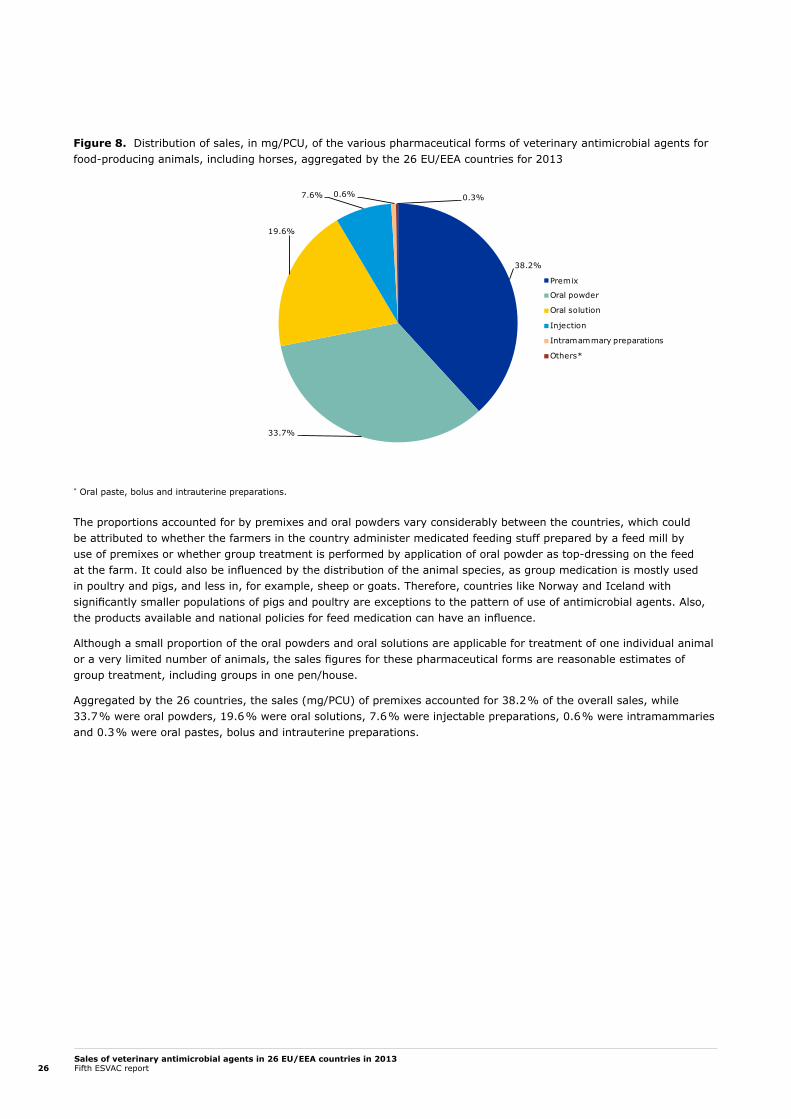
Sales of veterinary antimicrobial agents in 26 EU/EEA countries in 2013Fifth ESVAC report26
Figure 8. Distribution of sales, in mg/PCU, of the various pharmaceutical forms of veterinary antimicrobial agents for food-producing animals, including horses, aggregated by the 26 EU/EEA countries for 2013
* Oral paste, bolus and intrauterine preparations.
The proportions accounted for by premixes and oral powders vary considerably between the countries, which could be attributed to whether the farmers in the country administer medicated feeding stuff prepared by a feed mill by use of premixes or whether group treatment is performed by application of oral powder as top-dressing on the feed at the farm. It could also be influenced by the distribution of the animal species, as group medication is mostly used in poultry and pigs, and less in, for example, sheep or goats. Therefore, countries like Norway and Iceland with significantly smaller populations of pigs and poultry are exceptions to the pattern of use of antimicrobial agents. Also, the products available and national policies for feed medication can have an influence.
Although a small proportion of the oral powders and oral solutions are applicable for treatment of one individual animal or a very limited number of animals, the sales figures for these pharmaceutical forms are reasonable estimates of group treatment, including groups in one pen/house.
Aggregated by the 26 countries, the sales (mg/PCU) of premixes accounted for 38.2 % of the overall sales, while 33.7 % were oral powders, 19.6 % were oral solutions, 7.6 % were injectable preparations, 0.6 % were intramammaries and 0.3 % were oral pastes, bolus and intrauterine preparations.
38.2%
33.7%
19.6%
7.6% 0.6% 0.3%
Premix
Oral powder
Oral solution
Injection
Intramammary preparations
Others*

Sales of veterinary antimicrobial agents in 26 EU/EEA countries in 2013Fifth ESVAC report 27
2.4. Population-corrected sales for food-producing animals, including horses, by antimicrobial classThe sales of veterinary antimicrobial agents, expressed as mg sold per population correction unit (PCU), varied from 3.7 mg/PCU to 425.8 mg/PCU among the 26 countries. Also, the sales patterns of the antimicrobial classes varied substantially between the countries (Table 6., Figure 9.).
Table 5. Sales, in tonnes of active ingredient, of veterinary antimicrobial agents marketed mainly for food-producing animals1, including horses, population correction unit (PCU) and sales in mg/PCU, by country, for 2013
Country Sales (tonnes) for food-producing animals PCU (1,000 tonnes) mg/PCU
Austria 54.7 957.0 57.2
Belgium 259.5 1,657.5 156.6
Bulgaria 46.5 400.9 116.1
Cyprus 47.9 112.5 425.8
Czech Republic 57.2 696.8 82.1
Denmark 108.5 2,418.4 44.9
Estonia 8.5 137.2 62.2
Finland 12.5 514.4 24.3
France 681.0 7,165.4 95.0
Germany 1,527.2 8,525.6 179.1
Hungary 175.7 763.1 230.2
Iceland 0.6 115.2 5.3
Ireland 99.6 1,761.6 56.5
Italy 1,318.4 4,371.9 301.6
Latvia 6.2 167.1 37.0
Lithuania 12.4 339.5 36.6
Luxembourg 2.7 51.0 53.6
Netherlands 225.6 3,226.3 69.9
Norway 6.6 1,788.6 3.7
Poland 575.6 3,806.2 151.2
Portugal 179.4 958.2 187.2
Slovakia 15.5 247.8 62.5
Slovenia 4.0 180.2 22.4
Spain 2,201.9 6,943.6 317.1
Sweden 10.0 795.6 12.6
United Kingdom 422.0 6,799.1 62.1
1 Tablets excluded as almost solely used in companion animals; injectable antimicrobial VMPs can also be used in companion animals; a few other products may solely be used in companion animals, but as the proportional use is minor, these are included in the sales for food-producing animals.

Sales of veterinary antimicrobial agents in 26 EU/EEA countries in 2013Fifth ESVAC report28
Tab
le 6
. P
erce
ntag
es o
f sa
les
for
food
-pro
duci
ng a
nim
als,
incl
udin
g ho
rses
, in
mg
per
popu
latio
n co
rrec
tion
unit
(mg/
PCU
), o
f th
e va
riou
s ve
terina
ry a
ntim
icro
bial
cl
asse
s, b
y co
untr
y, in
201
3
Cou
ntr
y
Tetracyclines
Amphenicols
Penicillins
1st- and 2nd-gen. cephalosporins
3rd- and 4th-gen. cephalosporins
Sulfonamides
Trimethoprim
Macrolides
Lincosamides
Fluoroquinolones
Other quinolones
Aminoglycosides
Polymyxins
Pleuromutilins
Others*
Total mg/PCU
Aus
tria
56.2
0.6
15.7
0.1
0.6
9.9
1.3
8.5
0.7
1.0
02.
31.
60.
70.
857
.2
Bel
gium
24.0
0.6
31.7
0.04
0.3
23.9
4.8
5.0
1.7
0.7
0.6
0.5
3.0
0.6
2.7
156.
6
Bul
garia
50.0
2.0
13.1
0.1
0.1
5.7
0.6
11.7
2.2
5.8
0.1
3.3
2.3
2.3
0.6
116.
1
Cyp
rus
35.9
0.2
11.4
0.01
0.1
15.4
3.0
2.9
19.1
0.2
0.1
1.2
2.0
8.1
0.5
425.
8
Cze
ch R
epub
lic36
.10.
524
.30.
40.
517
.01.
74.
90.
32.
10.
14.
21.
35.
80.
782
.1
Den
mar
k31
.10.
925
.70.
10.
110
.01.
711
.32.
20.
020.
93.
10.
510
.22.
244
.9
Esto
nia
19.7
0.5
40.7
0.6
0.9
2.8
0.6
5.4
2.4
2.3
05.
88.
36.
03.
962
.2
Finl
and
19.1
1.0
49.9
0.3
0.1
20.0
4.0
3.7
0.8
0.7
00.
20
0.3
024
.3
Fran
ce39
.90.
711
.90.
20.
319
.53.
07.
50.
60.
60.
77.
66.
20.
80.
495
.0
Ger
man
y31
.60.
334
.80.
030.
210
.01.
28.
31.
10.
80
1.9
8.2
1.2
0.4
179.
1
Hun
gary
51.6
1.1
19.9
0.1
0.1
2.8
0.6
2.7
3.8
4.0
0.1
1.1
4.3
6.9
0.8
230.
2
Icel
and
5.7
053
.50
0.1
5.8
0.9
00
0.1
0.7
33.3
00
05.
3
Irel
and
37.1
1.9
21.0
0.7
0.2
21.9
1.9
6.3
0.4
0.9
07.
10.
10.
010.
656
.5
Ital
y31
.21.
425
.10.
10.
110
.41.
27.
45.
80.
71.
61.
49.
12.
42.
030
1.6
Latv
ia28
.00.
332
.00.
61.
14.
60.
64.
10.
35.
80.
0112
.34.
25.
50.
737
.0
Lith
uani
a11
.81.
230
.50.
90.
68.
92.
012
.31.
72.
11.
313
.70.
38.
73.
936
.6
Luxe
mbo
urg
37.8
2.1
18.4
0.2
1.3
15.7
3.0
4.0
1.6
1.5
1.35
2.8
5.8
1.1
3.4
53.6
Net
herlan
ds38
.71.
621
.00.
10.
0118
.93.
511
.10.
30.
21.
11.
60.
90.
60.
569
.9
Nor
way
2.18
4.9
45.9
00.
0122
.44.
20.
050
0.2
10.2
8.5
01.
30
3.7
Pola
nd40
.21.
125
.60.
20.
17.
60.
75.
30.
75.
80.
15.
72.
93.
40.
515
1.2
Port
ugal
39.2
0.7
16.9
0.4
0.2
2.8
0.6
12.4
2.8
4.4
0.1
1.3
10.1
6.5
1.5
187.
2
Slo
vaki
a31
.11.
015
.30.
70.
610
.71.
08.
90.
54.
50.
25.
11.
814
.93.
662
.5
Slo
veni
a14
.12.
939
.10.
50.
512
.92.
02.
72.
87.
90.
0710
.40.
21.
12.
822
.4
Spa
in39
.90.
722
.60.
020.
13.
30.
66.
65.
22.
90.
25.
56.
84.
31.
331
7.1
Swed
en9.
00.
661
.30
0.04
17.0
3.2
4.0
00.
30.
082.
50.
81.
30
12.6
Uni
ted
Kin
gdom
45.8
0.6
19.2
0.2
0.3
11.7
2.3
9.6
1.3
0.6
03.
50.
22.
72.
162
.1
* Bac
itrac
in,
paro
mom
ycin
and
spe
ctin
omyc
in (
clas
sifie
d as
‘Oth
er a
ntib
acte
rial
s’ in
the
ATC
vet
syst
em).

Sales of veterinary antimicrobial agents in 26 EU/EEA countries in 2013Fifth ESVAC report 29
Figure 9. Sales for food-producing species, including horses, in mg/PCU, of the various veterinary antimicrobial classes, for 26 countries, in 20131
* Amphenicols, cephalosporins, other quinolones and other antibacterials (classified as such in the ATCvet system). 1 Differences between countries can partly be explained by differences in animal demographics, in the selection of antimicrobial agents, in dosage
regimes and in type of data sources, among other factors.
Figure 10. Proportion of the total sales of the different veterinary antimicrobial classes, in mg/PCU, by country, for 2013
* Amphenicols, cephalosporins, other quinolones and other antibacterials (classified as such in the ATCvet system).
0
50
100
150
200
250
300
350
400
450Au
stria
Belg
ium
Bulg
aria
Cypr
usCz
ech
Repu
blic
Den
mar
kEs
toni
aFi
nlan
dFr
ance
Ger
man
yH
unga
ryIc
elan
dIr
elan
dIt
aly
Latv
iaLi
thua
nia
Luxe
mbo
urg
Net
herla
nds
Nor
way
Pola
ndPo
rtug
alSl
ovak
iaSl
oven
iaSp
ain
Swed
enU
nite
d Ki
ngdo
m
Others*
Pleuromutilins
Polymyxins
Aminoglycosides
Fluoroquinolones
Lincosamides
Macrolides
Trimethoprim
Sulfonamides
Penicillins
Tetracyclines
mg/
PCU
0%
10%
20%
30%
40%
50%
60%
70%
80%
90%
100%
Aus
tria
Bel
gium
Bul
gari
aC
ypru
sC
zech
Rep
ublic
Den
mar
kEs
toni
aFi
nlan
dFr
ance
Ger
man
yH
unga
ryIc
elan
dIr
elan
dIt
aly
Latv
iaLi
thua
nia
Luxe
mbo
urg
Net
herl
ands
Nor
way
Pola
ndPo
rtug
alS
lova
kia
Slo
veni
aS
pain
Sw
eden
Uni
ted
Kin
gdom
Others*
Pleuromutilins
Polymyxins
Aminoglycosides
Fluoroquinolones
Lincosamides
Macrolides
Trimethoprim
Sulfanomides
Penicillins
Tetracyclines
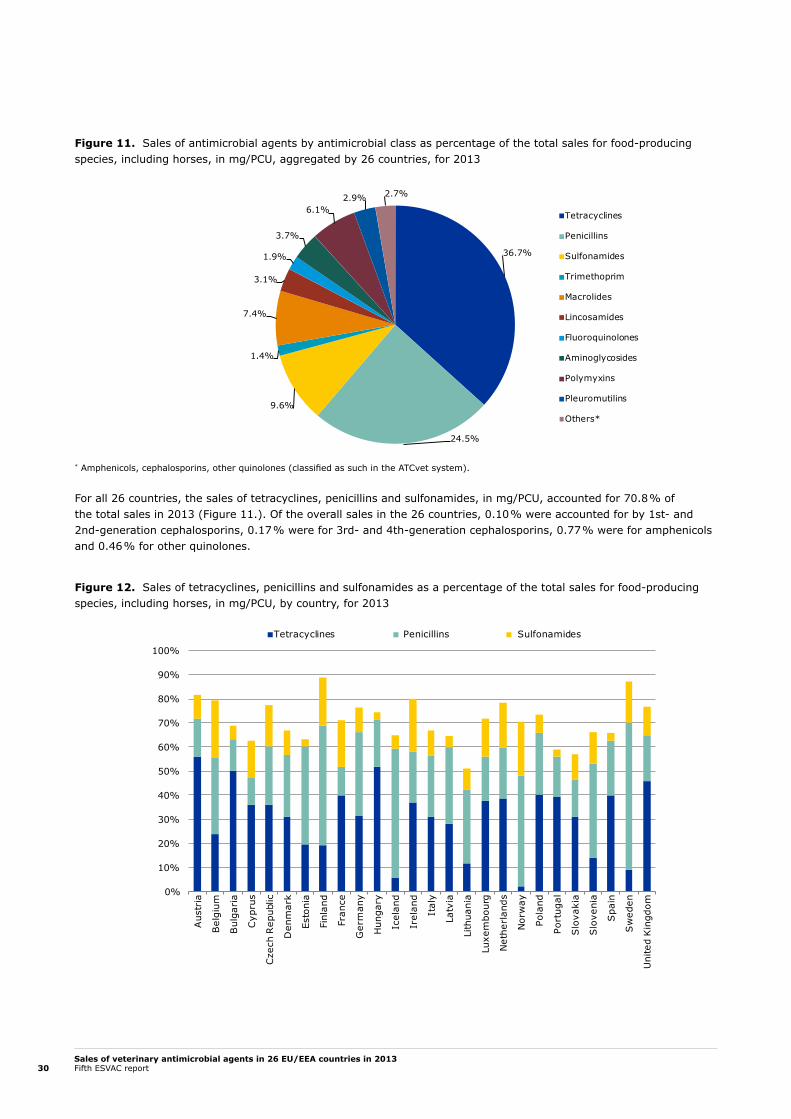
Sales of veterinary antimicrobial agents in 26 EU/EEA countries in 2013Fifth ESVAC report30
Figure 11. Sales of antimicrobial agents by antimicrobial class as percentage of the total sales for food-producing species, including horses, in mg/PCU, aggregated by 26 countries, for 2013
* Amphenicols, cephalosporins, other quinolones (classified as such in the ATCvet system).
For all 26 countries, the sales of tetracyclines, penicillins and sulfonamides, in mg/PCU, accounted for 70.8 % of the total sales in 2013 (Figure 11.). Of the overall sales in the 26 countries, 0.10 % were accounted for by 1st- and 2nd-generation cephalosporins, 0.17 % were for 3rd- and 4th-generation cephalosporins, 0.77 % were for amphenicols and 0.46 % for other quinolones.
Figure 12. Sales of tetracyclines, penicillins and sulfonamides as a percentage of the total sales for food-producing species, including horses, in mg/PCU, by country, for 2013
Tetracyclines
Penicillins
Sulfonamides
Trimethoprim
Macrolides
Lincosamides
Fluoroquinolones
Aminoglycosides
Polymyxins
Pleuromutilins
Others*
36.7%
24.5%
9.6%
1.4%
7.4%
3.1%
1.9%
3.7%
6.1%2.9% 2.7%
Penicillins Sulfonamides
0%
10%
20%
30%
40%
50%
60%
70%
80%
90%
100%
Aus
tria
Bel
gium
Bul
gari
a
Cyp
rus
Cze
ch R
epub
lic
Den
mar
k
Esto
nia
Finl
and
Fran
ce
Ger
man
y
Hun
gary
Icel
and
Irel
and
Ital
y
Latv
ia
Lith
uani
a
Luxe
mbo
urg
Net
herl
ands
Nor
way
Pola
nd
Port
ugal
Slo
vaki
a
Slo
veni
a
Spa
in
Sw
eden
Uni
ted
Kin
gdom
Tetracyclines

Sales of veterinary antimicrobial agents in 26 EU/EEA countries in 2013Fifth ESVAC report 31
The percentage of sales of penicillins attributed to the various subclasses differed substantially between the 26 countries (Figure 13.). In the Nordic countries, the proportion of beta-lactamase-sensitive penicillins9 accounted for the majority of penicillins sold, while for other countries, it was penicillins with extended spectrum that accounted for the major proportion of the sales of penicillins.
Figure 13. Distribution of the sales in mg/PCU of penicillins by subclass for food-producing species, including horses, by country, for 2013
The proportion of the critically important antimicrobials (CIAs) sold with the highest priority in human medicine, according to the WHO — 3rd- and 4th-generation cephalosporins, fluoroquinolones and macrolides — in the different countries in 2013 varied substantially between the 26 countries, ranging from 0.01 % to 1.3 %, 0.02 % to 8 %, and 0 % to 12 %, respectively (Figure 14.). The total sales, in mg/PCU, of these classes/subclasses in the 26 EU/EEA countries are shown in Figures 62–64.
Overall, in the 26 countries, the sales (mg/PCU) of these CIAs accounted for 0.17 %, 1.87 % and 7.37%, respectively, of the total sales of antimicrobial VMPs in 2013.
Figure 14. Proportion of the total sales of macrolides, fluoroquinolones and 3rd- and 4th-generation cephalosporins for food-producing species, including horses, in mg/PCU, for 26 countries, in 2013
0%
10%
20%
30%
40%
50%
60%
70%
80%
90%
100%
Aus
tria
Bel
gium
Bul
gari
a
Cyp
rus
Cze
ch R
epub
lic
Den
mar
k
Esto
nia
Finl
and
Fran
ce
Ger
man
y
Hun
gary
Icel
and
Irel
and
Ital
y
Latv
ia
Lith
uani
a
Luxe
mbo
urg
Net
herl
ands
Nor
way
Pola
nd
Port
ugal
Slo
vaki
a
Slo
veni
a
Spa
in
Sw
eden
Uni
ted
Kin
gdom
Beta-lactamase-sensitive penicillins Beta-lactamase-resistant penicillinsPenicillins with extended spectrum Penicillins + beta-lactamase inhib.
0%
4%
8%
12%
16%
20%
Aus
tria
Bel
gium
Bul
gari
a
Cyp
rus
Cze
ch R
epub
lic
Den
mar
k
Esto
nia
Finl
and
Fran
ce
Ger
man
y
Hun
gary
Icel
and
Irel
and
Ital
y
Latv
ia
Lith
uani
a
Luxe
mbo
urg
Net
herl
ands
Nor
way
Pola
nd
Port
ugal
Slo
vaki
a
Slo
veni
a
Spa
in
Sw
eden
Uni
ted
Kin
gdom
Macrolides Fluoroquinolones 3rd- and 4th-gen. cephalosporins
9 Beta-lactamase-sensitive penicillins come under ATCvet code QJ01CE. Procaine benzylpenicillin, penethamate hydriodide and phenoxymethylpenicillin accounted for the majority of the sales of these penicillins.
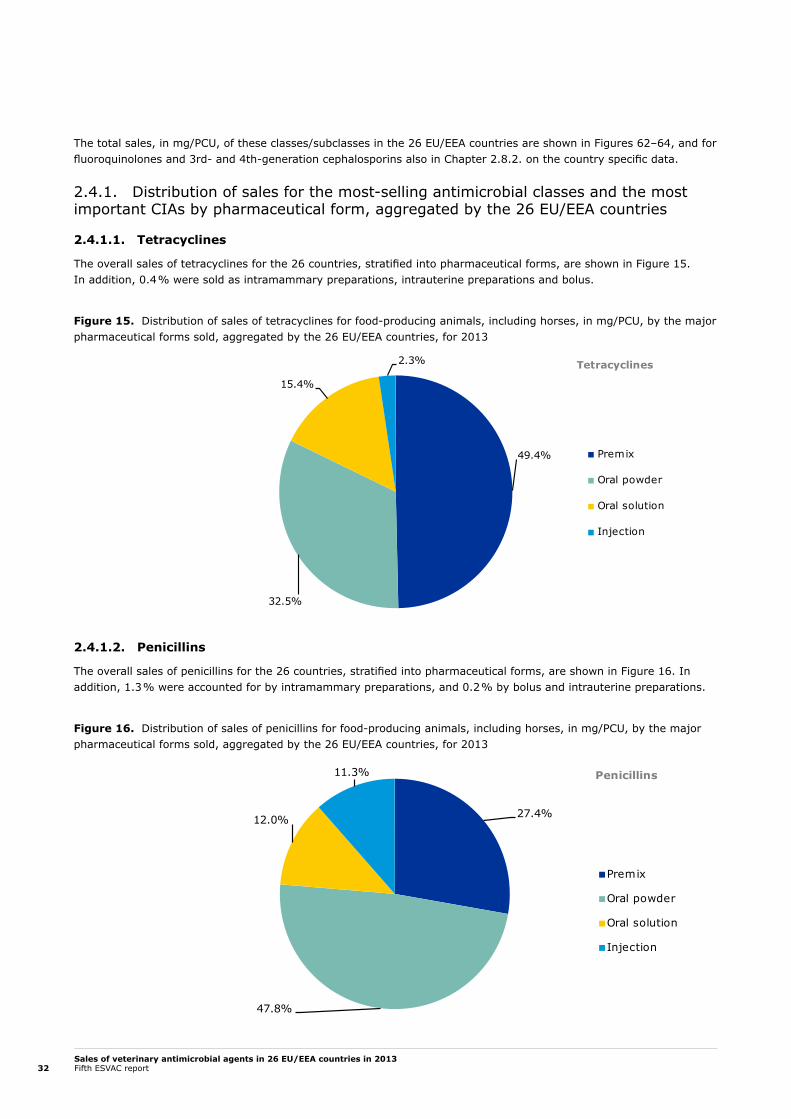
Sales of veterinary antimicrobial agents in 26 EU/EEA countries in 2013Fifth ESVAC report32
The total sales, in mg/PCU, of these classes/subclasses in the 26 EU/EEA countries are shown in Figures 62–64, and for fluoroquinolones and 3rd- and 4th-generation cephalosporins also in Chapter 2.8.2. on the country specific data.
2.4.1. Distribution of sales for the most-selling antimicrobial classes and the most important CIAs by pharmaceutical form, aggregated by the 26 EU/EEA countries
2.4.1.1. Tetracyclines
The overall sales of tetracyclines for the 26 countries, stratified into pharmaceutical forms, are shown in Figure 15. In addition, 0.4 % were sold as intramammary preparations, intrauterine preparations and bolus.
Figure 15. Distribution of sales of tetracyclines for food-producing animals, including horses, in mg/PCU, by the major pharmaceutical forms sold, aggregated by the 26 EU/EEA countries, for 2013
2.4.1.2. Penicillins
The overall sales of penicillins for the 26 countries, stratified into pharmaceutical forms, are shown in Figure 16. In addition, 1.3 % were accounted for by intramammary preparations, and 0.2 % by bolus and intrauterine preparations.
Figure 16. Distribution of sales of penicillins for food-producing animals, including horses, in mg/PCU, by the major pharmaceutical forms sold, aggregated by the 26 EU/EEA countries, for 2013
49.4%
32.5%
15.4%
2.3% Tetracyclines
Premix
Oral powder
Oral solution
Injection
27.4%
47.8%
12.0%
11.3% Penicillins
Premix
Oral powder
Oral solution
Injection
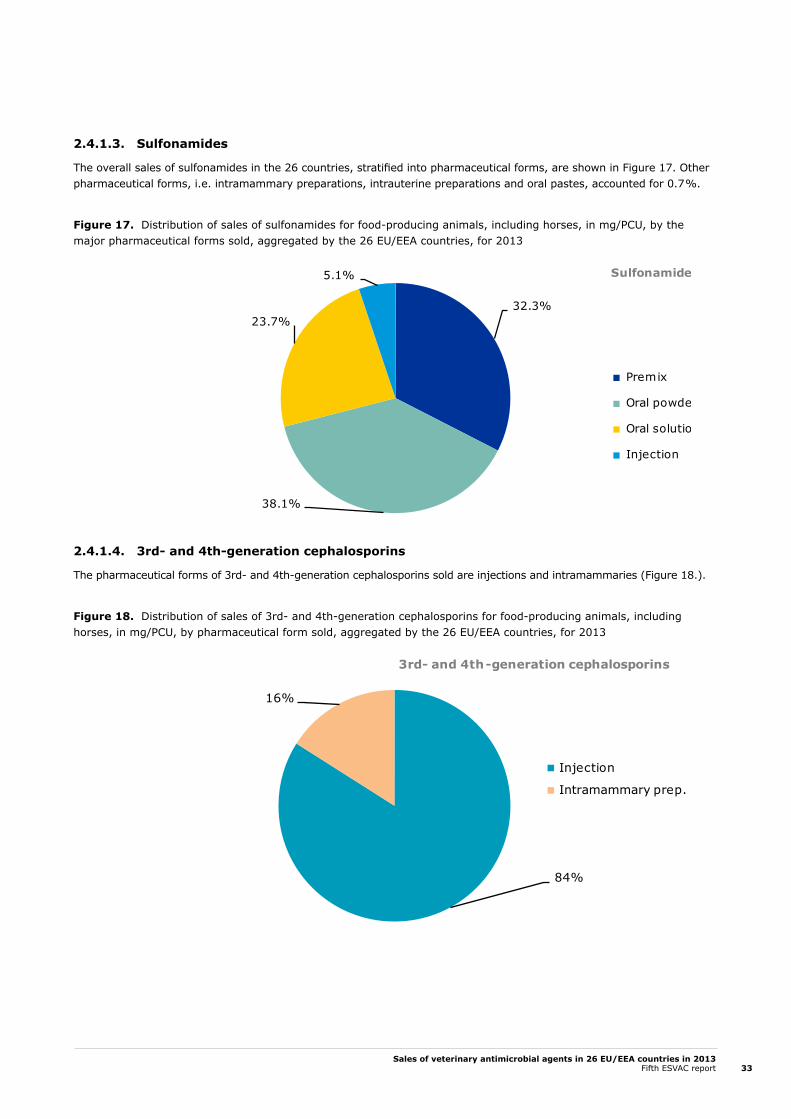
Sales of veterinary antimicrobial agents in 26 EU/EEA countries in 2013Fifth ESVAC report 33
2.4.1.3. Sulfonamides
The overall sales of sulfonamides in the 26 countries, stratified into pharmaceutical forms, are shown in Figure 17. Other pharmaceutical forms, i.e. intramammary preparations, intrauterine preparations and oral pastes, accounted for 0.7 %.
Figure 17. Distribution of sales of sulfonamides for food-producing animals, including horses, in mg/PCU, by the major pharmaceutical forms sold, aggregated by the 26 EU/EEA countries, for 2013
2.4.1.4. 3rd- and 4th-generation cephalosporins
The pharmaceutical forms of 3rd- and 4th-generation cephalosporins sold are injections and intramammaries (Figure 18.).
Figure 18. Distribution of sales of 3rd- and 4th-generation cephalosporins for food-producing animals, including horses, in mg/PCU, by pharmaceutical form sold, aggregated by the 26 EU/EEA countries, for 2013
32.3%
38.1%
23.7%
5.1% Sulfonamides
Premix
Oral powder
Oral solution
Injection
84%
16%
3rd- and 4th-generation cephalosporins
Injection
Intramammary prep.
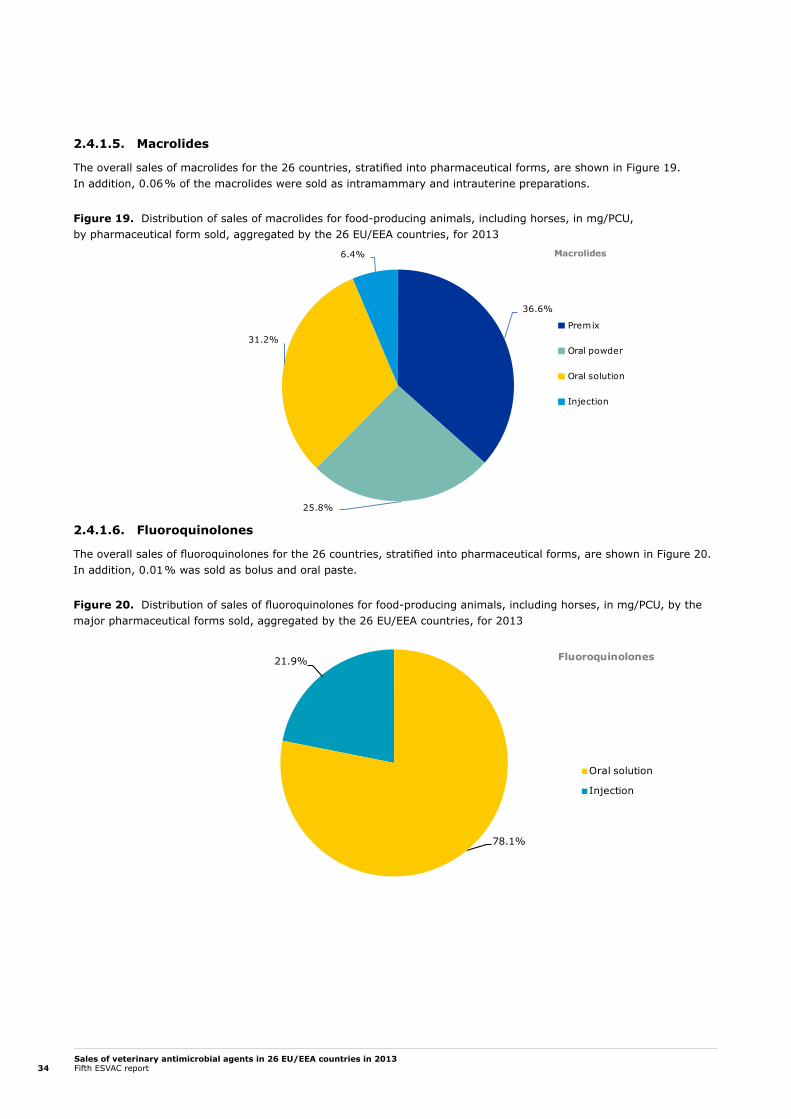
Sales of veterinary antimicrobial agents in 26 EU/EEA countries in 2013Fifth ESVAC report34
2.4.1.5. Macrolides
The overall sales of macrolides for the 26 countries, stratified into pharmaceutical forms, are shown in Figure 19. In addition, 0.06 % of the macrolides were sold as intramammary and intrauterine preparations.
Figure 19. Distribution of sales of macrolides for food-producing animals, including horses, in mg/PCU, by pharmaceutical form sold, aggregated by the 26 EU/EEA countries, for 2013
2.4.1.6. Fluoroquinolones
The overall sales of fluoroquinolones for the 26 countries, stratified into pharmaceutical forms, are shown in Figure 20. In addition, 0.01 % was sold as bolus and oral paste.
Figure 20. Distribution of sales of fluoroquinolones for food-producing animals, including horses, in mg/PCU, by the major pharmaceutical forms sold, aggregated by the 26 EU/EEA countries, for 2013
36.6%
25.8%
31.2%
6.4% Macrolides
Premix
Oral powder
Oral solution
Injection
Fluoroquinolones
Oral solution
Injection
78.1%
21.9%

Sales of veterinary antimicrobial agents in 26 EU/EEA countries in 2013Fifth ESVAC report 35
2.5. Distribution of sales for food-producing animals, including horses, by antimicrobial class and pharmaceutical formThe distribution of sales, in mg/PCU, of the various antimicrobial classes by pharmaceutical form varied considerably for the various classes of antimicrobial agents, both aggregated by 26 EU/EEA countries and between countries.
2.5.1. Distribution of sales of antimicrobials by class and forms by countrySee the following pages for the distribution per country.
Figure 21. Spatial distribution of overall sales of all antimicrobials for food-producing animals, in mg/PCU, for 26 countries, for 2013
Russia
R u s s i a
Bosniaand
Herz.
Andorra
Lebanon
Israel
T u r k e y
Croatia
Serbia
Montenegro
Albania
Macedonia
Moldova
U k r a i n e
B e l a r u s
N o r w a y
I c e l a n d
SwitzerlandLiech.
P o l a n d
G e r m a n y
S w e d e n
F i n l a n d
U n i t e d K i n g d o m
Ireland
D e n mark
Netherlands
Luxembourg
Belgium
F r a n c e
S p a i n
Po r t u g a l
I t a l y
M a l t a
C y p r u s
Greece
A u s t r i a
Slovenia
H u n g a r y
C z e c hR e p u b l i c
Lithuania
Latvia
Estonia
Slovakia
B u l g a r i a
R o m a n i a
mg/PCU≥ 3.67
≤ 425.80
No data

Sales of veterinary antimicrobial agents in 26 EU/EEA countries in 2013Fifth ESVAC report36
2.5.1.1. Tetracyclines
Figure 22. Spatial distribution of sales of tetracyclines for food-producing animals, in mg/PCU, for 26 countries, for 2013
Figure 23. Distribution of sales by pharmaceutical forms of tetracyclines, in mg/PCU, by country, for 20131
1 In addition, negligible amounts were sold as bolus, intramammary preparations and/or oral paste in some countries.
Russia
R u s s i a
Bosniaand
Herz.
Andorra
Lebanon
Israel
T u r k e y
Croatia
Serbia
Montenegro
Albania
Macedonia
Moldova
U k r a i n e
B e l a r u s
N o r w a y
I c e l a n d
SwitzerlandLiech.
P o l a n d
G e r m a n y
S w e d e n
F i n l a n d
U n i t e d K i n g d o m
Ireland
D e n mark
Netherlands
Luxembourg
Belgium
F r a n c e
S p a i n
Po r t u g a l
I t a l y
M a l t a
C y p r u s
Greece
A u s t r i a
Slovenia
H u n g a r y
C z e c hR e p u b l i c
Lithuania
Latvia
Estonia
Slovakia
B u l g a r i a
R o m a n i a
mg/PCU≥ 0.08
≤ 153.04
No data
0%
10%
20%
30%
40%
50%
60%
70%
80%
90%
100%
Aus
tria
Bel
gium
Bul
gari
a
Cyp
rus
Cze
ch R
epub
lic
Den
mar
k
Esto
nia
Finl
and
Fran
ce
Ger
man
y
Hun
gary
Icel
and
Irel
and
Ital
y
Latv
ia
Lith
uani
a
Luxe
mbo
urg
Net
herl
ands
Nor
way
Pola
nd
Port
ugal
Slo
vaki
a
Slo
veni
a
Spa
in
Sw
eden
Uni
ted
Kin
gdom
Premix Oral powder Oral solution Injection Intrauterine prep.

Sales of veterinary antimicrobial agents in 26 EU/EEA countries in 2013Fifth ESVAC report 37
2.5.1.2. Amphenicols
Figure 24. Spatial distribution of sales of amphenicols, in mg/PCU, for 26 EU/EEA countries, for 20131
1 No sales in Iceland.
Figure 25. Distribution of sales by pharmaceutical form of amphenicols, in mg/PCU, by country, for 20131
1 No sales in Iceland.
Russia
R u s s i a
Bosniaand
Herz.
Andorra
Lebanon
Israel
T u r k e y
Croatia
Serbia
Montenegro
Albania
Macedonia
Moldova
U k r a i n e
B e l a r u s
N o r w a y
I c e l a n d
SwitzerlandLiech.
P o l a n d
G e r m a n y
S w e d e n
F i n l a n d
U n i t e d K i n g d o m
Ireland
D e n mark
Netherlands
Luxembourg
Belgium
F r a n c e
S p a i n
Po r t u g a l
I t a l y
M a l t a
C y p r u s
Greece
A u s t r i a
Slovenia
H u n g a r y
C z e c hR e p u b l i c
Lithuania
Latvia
Estonia
Slovakia
B u l g a r i a
R o m a n i a
mg/PCU≥ 0.00
≤ 4.11
No data
0%
10%
20%
30%
40%
50%
60%
70%
80%
90%
100%
Aust
ria
Bel
gium
Bul
gari
a
Cyp
rus
Cze
ch R
epub
lic
Den
mar
k
Esto
nia
Finl
and
Fran
ce
Ger
man
y
Hun
gary
Irel
and
Ital
y
Latv
ia
Lith
uani
a
Luxe
mbo
urg
Net
herl
ands
Nor
way
Pola
nd
Port
ugal
Slo
vaki
a
Slo
veni
a
Spa
in
Sw
eden
Uni
ted
Kin
gdom
Premix Oral powder Oral solution Injection
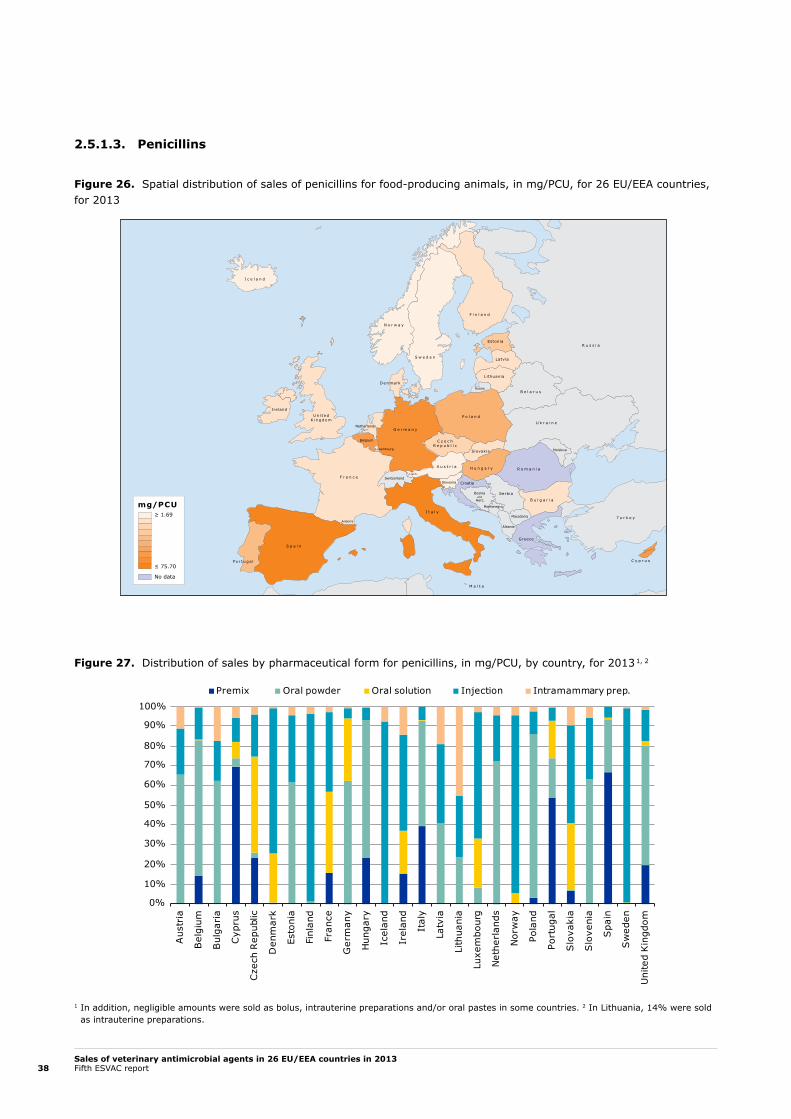
Sales of veterinary antimicrobial agents in 26 EU/EEA countries in 2013Fifth ESVAC report38
2.5.1.3. Penicillins
Figure 26. Spatial distribution of sales of penicillins for food-producing animals, in mg/PCU, for 26 EU/EEA countries, for 2013
Figure 27. Distribution of sales by pharmaceutical form for penicillins, in mg/PCU, by country, for 2013 1, 2
1 In addition, negligible amounts were sold as bolus, intrauterine preparations and/or oral pastes in some countries. 2 In Lithuania, 14% were sold as intrauterine preparations.
Russia
R u s s i a
Bosniaand
Herz.
Andorra
Lebanon
Israel
T u r k e y
Croatia
Serbia
Montenegro
Albania
Macedonia
Moldova
U k r a i n e
B e l a r u s
N o r w a y
I c e l a n d
SwitzerlandLiech.
P o l a n d
G e r m a n y
S w e d e n
F i n l a n d
U n i t e d K i n g d o m
Ireland
D e n mark
Netherlands
Luxembourg
Belgium
F r a n c e
S p a i n
Po r t u g a l
I t a l y
M a l t a
C y p r u s
Greece
A u s t r i a
Slovenia
H u n g a r y
C z e c hR e p u b l i c
Lithuania
Latvia
Estonia
Slovakia
B u l g a r i a
R o m a n i a
mg/PCU≥ 1.69
≤ 75.70
No data
Aus
tria
Bel
gium
Bul
gari
a
Cyp
rus
Cze
ch R
epub
lic
Den
mar
k
Esto
nia
Finl
and
Fran
ce
Ger
man
y
Hun
gary
Icel
and
Irel
and
Ital
y
Latv
ia
Lith
uani
a
Luxe
mbo
urg
Net
herl
ands
Nor
way
Pola
nd
Port
ugal
Slo
vaki
a
Slo
veni
a
Spa
in
Sw
eden
Uni
ted
Kin
gdom
Premix Oral powder Oral solution Injection Intramammary prep.
0%
10%
20%
30%
40%
50%
60%
70%
80%
90%
100%
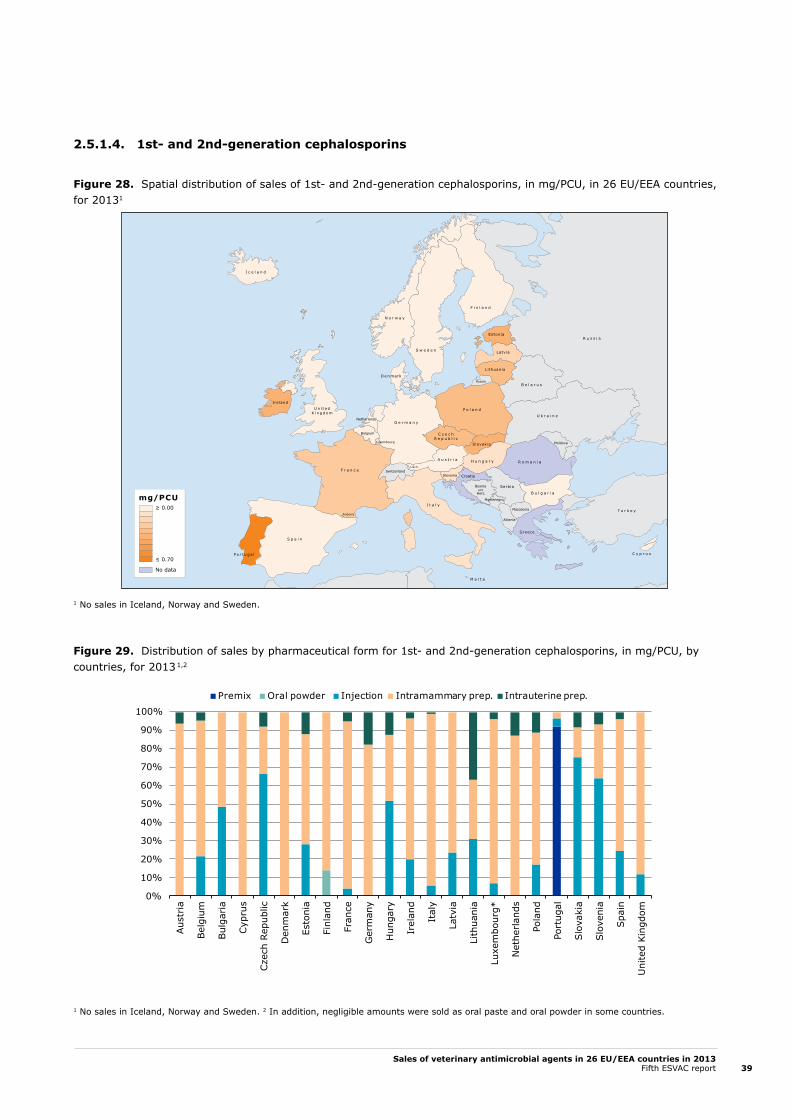
Sales of veterinary antimicrobial agents in 26 EU/EEA countries in 2013Fifth ESVAC report 39
2.5.1.4. 1st- and 2nd-generation cephalosporins
Figure 28. Spatial distribution of sales of 1st- and 2nd-generation cephalosporins, in mg/PCU, in 26 EU/EEA countries, for 20131
1 No sales in Iceland, Norway and Sweden.
Figure 29. Distribution of sales by pharmaceutical form for 1st- and 2nd-generation cephalosporins, in mg/PCU, by countries, for 2013 1,2
1 No sales in Iceland, Norway and Sweden. 2 In addition, negligible amounts were sold as oral paste and oral powder in some countries.
Russia
R u s s i a
Bosniaand
Herz.
Andorra
Lebanon
Israel
T u r k e y
Croatia
Serbia
Montenegro
Albania
Macedonia
Moldova
U k r a i n e
B e l a r u s
N o r w a y
I c e l a n d
SwitzerlandLiech.
P o l a n d
G e r m a n y
S w e d e n
F i n l a n d
U n i t e d K i n g d o m
Ireland
D e n mark
Netherlands
Luxembourg
Belgium
F r a n c e
S p a i n
Po r t u g a l
I t a l y
M a l t a
C y p r u s
Greece
A u s t r i a
Slovenia
H u n g a r y
C z e c hR e p u b l i c
Lithuania
Latvia
Estonia
Slovakia
B u l g a r i a
R o m a n i a
mg/PCU≥ 0.00
≤ 0.70
No data
Premix Oral powder Injection Intramammary prep. Intrauterine prep.
0%
10%
20%
30%
40%
50%
60%
70%
80%
90%
100%
Aus
tria
Bel
gium
Bul
garia
Cyp
rus
Cze
ch R
epub
lic
Den
mar
k
Esto
nia
Finl
and
Fran
ce
Ger
man
y
Hun
gary
Irel
and
Ital
y
Latv
ia
Lith
uani
a
Lux e
mbo
urg*
Net
herlan
ds
Pola
nd
Port
ugal
Slo
vaki
a
Slo
veni
a
Spa
in
Uni
ted
Kin
gdom
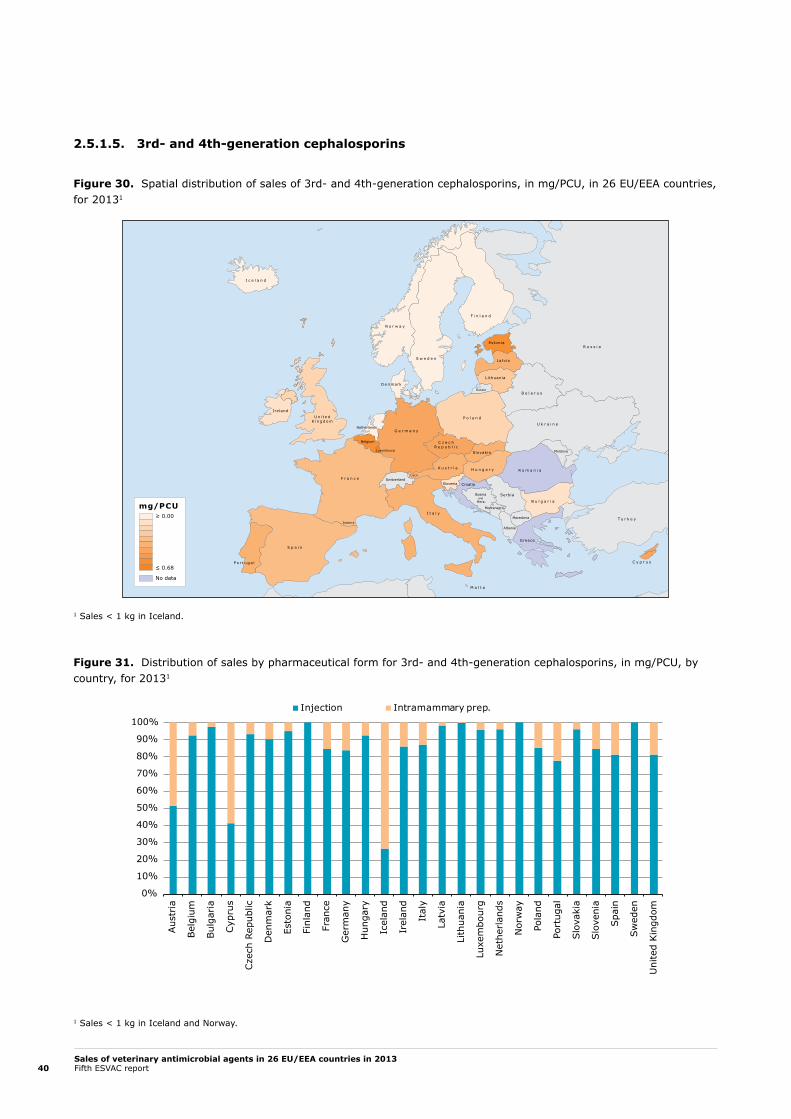
Sales of veterinary antimicrobial agents in 26 EU/EEA countries in 2013Fifth ESVAC report40
2.5.1.5. 3rd- and 4th-generation cephalosporins
Figure 30. Spatial distribution of sales of 3rd- and 4th-generation cephalosporins, in mg/PCU, in 26 EU/EEA countries, for 20131
1 Sales < 1 kg in Iceland.
Figure 31. Distribution of sales by pharmaceutical form for 3rd- and 4th-generation cephalosporins, in mg/PCU, by country, for 20131
1 Sales < 1 kg in Iceland and Norway.
Russia
R u s s i a
Bosniaand
Herz.
Andorra
Lebanon
Israel
T u r k e y
Croatia
Serbia
Montenegro
Albania
Macedonia
Moldova
U k r a i n e
B e l a r u s
N o r w a y
I c e l a n d
SwitzerlandLiech.
P o l a n d
G e r m a n y
S w e d e n
F i n l a n d
U n i t e d K i n g d o m
Ireland
D e n mark
Netherlands
Luxembourg
Belgium
F r a n c e
S p a i n
Po r t u g a l
I t a l y
M a l t a
C y p r u s
Greece
A u s t r i a
Slovenia
H u n g a r y
C z e c hR e p u b l i c
Lithuania
Latvia
Estonia
Slovakia
B u l g a r i a
R o m a n i a
mg/PCU≥ 0.00
≤ 0.68
No data
Injection Intramammary prep.
0%
10%
20%
30%
40%
50%
60%
70%
80%
90%
100%
Aus
tria
Bel
gium
Bul
garia
Cyp
rus
Cze
ch R
epub
lic
Den
mar
k
Esto
nia
Finl
and
Fran
ce
Ger
man
y
Hun
gary
Icel
and
Irel
and
Ital
y
Latv
ia
Lith
uani
a
Luxe
mbo
urg
Net
herlan
ds
Nor
way
Pola
nd
Port
ugal
Slo
vaki
a
Slo
veni
a
Spa
in
Swed
en
Uni
ted
Kin
gdom

Sales of veterinary antimicrobial agents in 26 EU/EEA countries in 2013Fifth ESVAC report 41
2.5.1.6. Sulfonamides
Figure 32. Spatial distribution of sales of sulfonamides, in mg/PCU, in 26 EU/EEA countries, for 2013
Figure 33. Distribution of sales by pharmaceutical form for sulfonamides, in mg/PCU, by country, for 20131
1 In addition, negligible amounts were sold as bolus, intramammary and/or intrauterine preparations in some countries.
Russia
R u s s i a
Bosniaand
Herz.
Andorra
Lebanon
Israel
T u r k e y
Croatia
Serbia
Montenegro
Albania
Macedonia
Moldova
U k r a i n e
B e l a r u s
N o r w a y
I c e l a n d
SwitzerlandLiech.
P o l a n d
G e r m a n y
S w e d e n
F i n l a n d
U n i t e d K i n g d o m
Ireland
D e n mark
Netherlands
Luxembourg
Belgium
F r a n c e
S p a i n
Po r t u g a l
I t a l y
M a l t a
C y p r u s
Greece
A u s t r i a
Slovenia
H u n g a r y
C z e c hR e p u b l i c
Lithuania
Latvia
Estonia
Slovakia
B u l g a r i a
R o m a n i a
mg/PCU≥ 0.31
≤ 65.66
No data
Premix Oral powder Oral solution Injection Oral paste
0%
10%
20%
30%
40%
50%
60%
70%
80%
90%
100%
Aus
tria
Bel
gium
Bul
garia
Cyp
rus
Cze
ch R
epub
lic
Den
mar
k
Esto
nia
Finl
and
Fran
ce
Ger
man
y
Hun
gary
Icel
and
Irel
and
Ital
y
Latv
ia
Lith
uani
a
Luxe
mbo
urg
Net
herlan
ds
Nor
way
Pola
nd
Port
ugal
Slo
vaki
a
Slo
veni
a
Spa
in
Swed
en
Uni
ted
Kin
gdom
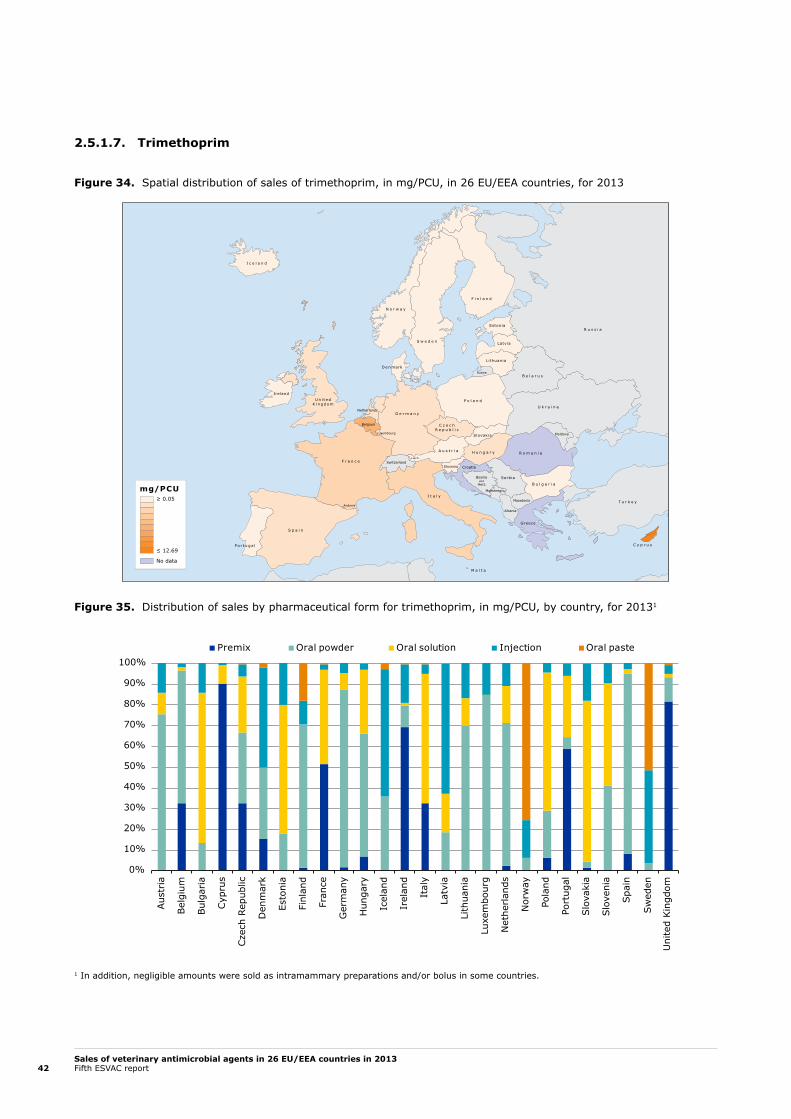
Sales of veterinary antimicrobial agents in 26 EU/EEA countries in 2013Fifth ESVAC report42
2.5.1.7. Trimethoprim
Figure 34. Spatial distribution of sales of trimethoprim, in mg/PCU, in 26 EU/EEA countries, for 2013
Figure 35. Distribution of sales by pharmaceutical form for trimethoprim, in mg/PCU, by country, for 20131
1 In addition, negligible amounts were sold as intramammary preparations and/or bolus in some countries.
Russia
R u s s i a
Bosniaand
Herz.
Andorra
Lebanon
Israel
T u r k e y
Croatia
Serbia
Montenegro
Albania
Macedonia
Moldova
U k r a i n e
B e l a r u s
N o r w a y
I c e l a n d
SwitzerlandLiech.
P o l a n d
G e r m a n y
S w e d e n
F i n l a n d
U n i t e d K i n g d o m
Ireland
D e n mark
Netherlands
Luxembourg
Belgium
F r a n c e
S p a i n
Po r t u g a l
I t a l y
M a l t a
C y p r u s
Greece
A u s t r i a
Slovenia
H u n g a r y
C z e c hR e p u b l i c
Lithuania
Latvia
Estonia
Slovakia
B u l g a r i a
R o m a n i a
mg/PCU≥ 0.05
≤ 12.69
No data
Premix Oral powder Oral solution Injection Oral paste
0%
10%
20%
30%
40%
50%
60%
70%
80%
90%
100%
Aus
tria
Bel
gium
Bul
garia
Cyp
rus
Cze
ch R
epub
lic
Den
mar
k
Esto
nia
Finl
and
Fran
ce
Ger
man
y
Hun
gary
Icel
and
Irel
and
Ital
y
Latv
ia
Lith
uani
a
Luxe
mbo
urg
Net
herlan
ds
Nor
way
Pola
nd
Port
ugal
Slo
vaki
a
Slo
veni
a
Spa
in
Swed
en
Uni
ted
Kin
gdom
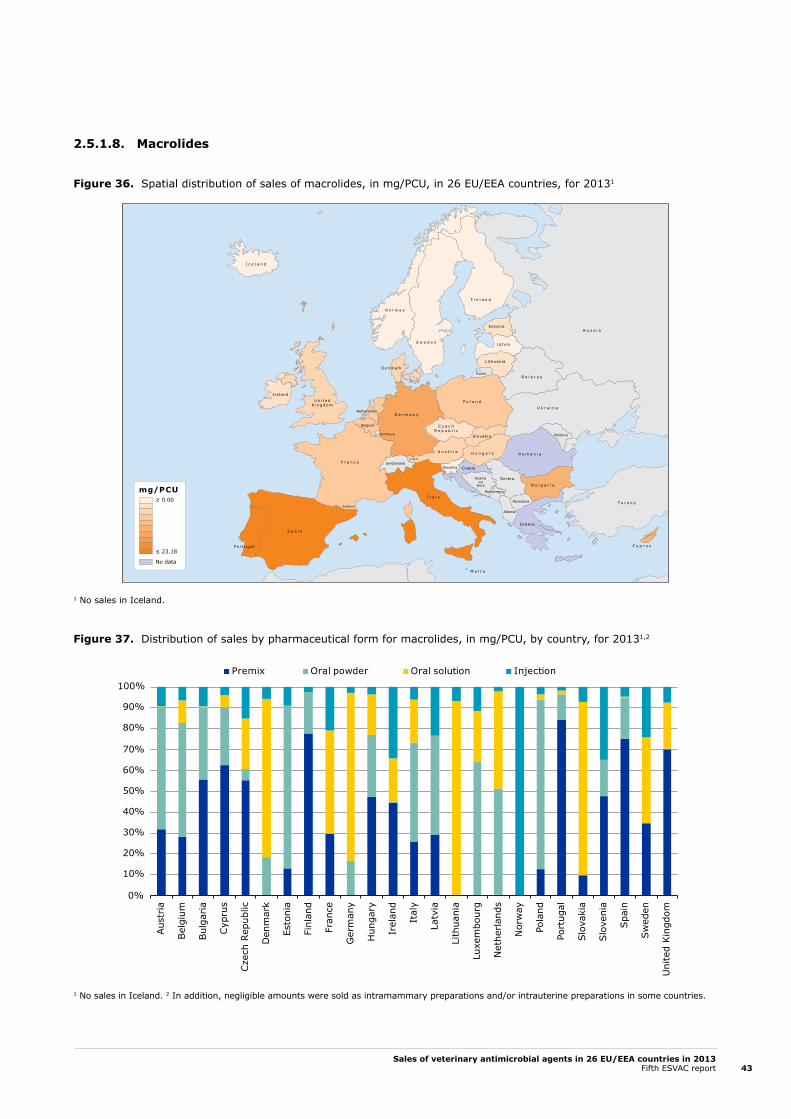
Sales of veterinary antimicrobial agents in 26 EU/EEA countries in 2013Fifth ESVAC report 43
2.5.1.8. Macrolides
Figure 36. Spatial distribution of sales of macrolides, in mg/PCU, in 26 EU/EEA countries, for 20131
1 No sales in Iceland.
Figure 37. Distribution of sales by pharmaceutical form for macrolides, in mg/PCU, by country, for 20131,2
1 No sales in Iceland. 2 In addition, negligible amounts were sold as intramammary preparations and/or intrauterine preparations in some countries.
Russia
R u s s i a
Bosniaand
Herz.
Andorra
Lebanon
Israel
T u r k e y
Croatia
Serbia
Montenegro
Albania
Macedonia
Moldova
U k r a i n e
B e l a r u s
N o r w a y
I c e l a n d
SwitzerlandLiech.
P o l a n d
G e r m a n y
S w e d e n
F i n l a n d
U n i t e d K i n g d o m
Ireland
D e n mark
Netherlands
Luxembourg
Belgium
F r a n c e
S p a i n
Po r t u g a l
I t a l y
M a l t a
C y p r u s
Greece
A u s t r i a
Slovenia
H u n g a r y
C z e c hR e p u b l i c
Lithuania
Latvia
Estonia
Slovakia
B u l g a r i a
R o m a n i a
mg/PCU≥ 0.00
≤ 23.18
No data
Premix Oral powder Oral solution Injection
0%
10%
20%
30%
40%
50%
60%
70%
80%
90%
100%
Aus
tria
Bel
gium
Bul
garia
Cyp
rus
Cze
ch R
epub
lic
Den
mar
k
Esto
nia
Finl
and
Fran
ce
Ger
man
y
Hun
gary
Irel
and
Ital
y
Latv
ia
Lith
uani
a
Luxe
mbo
urg
Net
herlan
ds
Nor
way
Pola
nd
Port
ugal
Slo
vaki
a
Slo
veni
a
Spa
in
Swed
en
Uni
ted
Kin
gdom
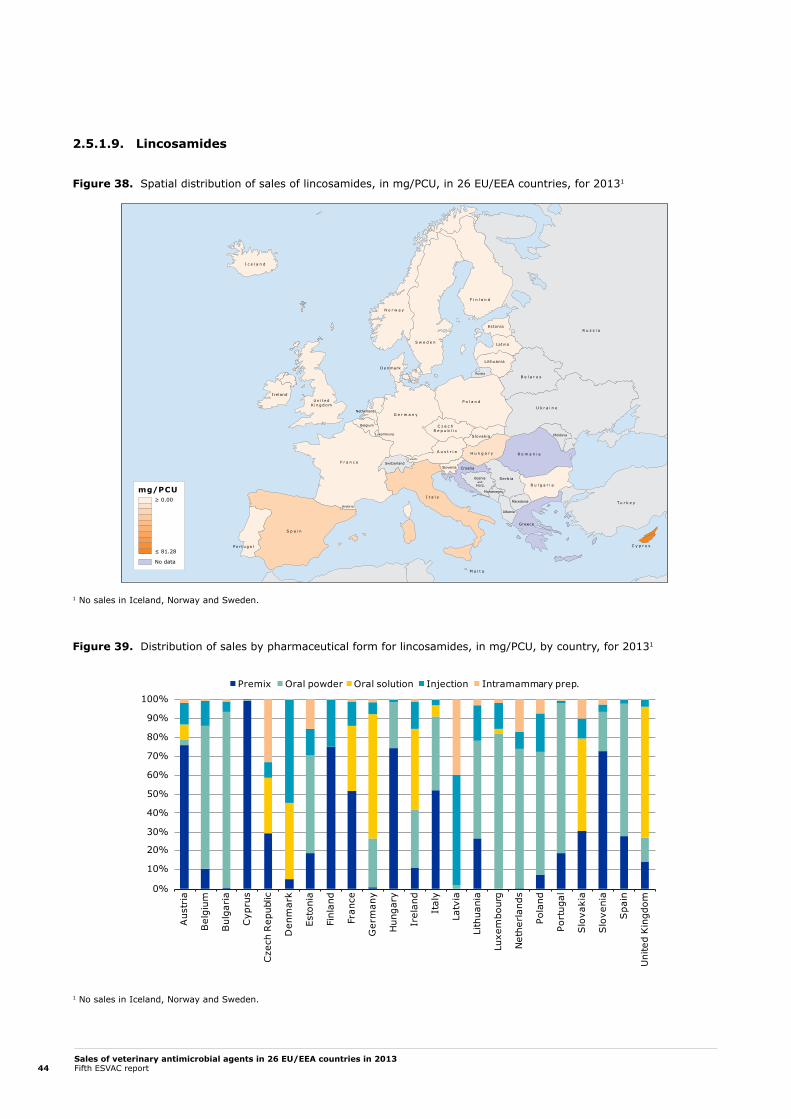
Sales of veterinary antimicrobial agents in 26 EU/EEA countries in 2013Fifth ESVAC report44
2.5.1.9. Lincosamides
Figure 38. Spatial distribution of sales of lincosamides, in mg/PCU, in 26 EU/EEA countries, for 20131
1 No sales in Iceland, Norway and Sweden.
Figure 39. Distribution of sales by pharmaceutical form for lincosamides, in mg/PCU, by country, for 20131
1 No sales in Iceland, Norway and Sweden.
Russia
R u s s i a
Bosniaand
Herz.
Andorra
Lebanon
Israel
T u r k e y
Croatia
Serbia
Montenegro
Albania
Macedonia
Moldova
U k r a i n e
B e l a r u s
N o r w a y
I c e l a n d
SwitzerlandLiech.
P o l a n d
G e r m a n y
S w e d e n
F i n l a n d
U n i t e d K i n g d o m
Ireland
D e n mark
Netherlands
Luxembourg
Belgium
F r a n c e
S p a i n
Po r t u g a l
I t a l y
M a l t a
C y p r u s
Greece
A u s t r i a
Slovenia
H u n g a r y
C z e c hR e p u b l i c
Lithuania
Latvia
Estonia
Slovakia
B u l g a r i a
R o m a n i a
mg/PCU≥ 0.00
≤ 81.28
No data
Premix Oral powder Oral solution Injection Intramammary prep.
0%
10%
20%
30%
40%
50%
60%
70%
80%
90%
100%
Aus
tria
Bel
gium
Bul
gari
a
Cyp
rus
Cze
ch R
epub
lic
Den
mar
k
Esto
nia
Finl
and
Fran
ce
Ger
man
y
Hun
gary
Irel
and
Ital
y
Latv
ia
Lith
uani
a
Luxe
mbo
urg
Net
herl
ands
Pola
nd
Port
ugal
Slo
vaki
a
Slo
veni
a
Spa
in
Uni
ted
Kin
gdom

Sales of veterinary antimicrobial agents in 26 EU/EEA countries in 2013Fifth ESVAC report 45
2.5.1.10. Fluoroquinolones
Figure 40. Spatial distribution of sales of fluoroquinolones, in mg/PCU, in 26 EU/EEA countries, for 2013
Figure 41. Distribution of sales by pharmaceutical form for fluoroquinolones, in mg/PCU, by country, for 20131,2
1 In addition, negligible amounts were sold as bolus, oral powder, oral pastes and/or premix in some countries. 2 Sales < 1 kg in Iceland.
Russia
R u s s i a
Bosniaand
Herz.
Andorra
Lebanon
Israel
T u r k e y
Croatia
Serbia
Montenegro
Albania
Macedonia
Moldova
U k r a i n e
B e l a r u s
N o r w a y
I c e l a n d
SwitzerlandLiech.
P o l a n d
G e r m a n y
S w e d e n
F i n l a n d
U n i t e d K i n g d o m
Ireland
D e n mark
Netherlands
Luxembourg
Belgium
F r a n c e
S p a i n
Po r t u g a l
I t a l y
M a l t a
C y p r u s
Greece
A u s t r i a
Slovenia
H u n g a r y
C z e c hR e p u b l i c
Lithuania
Latvia
Estonia
Slovakia
B u l g a r i a
R o m a n i a
mg/PCU≥ 0.00
≤ 9.30
No data
0%
10%
20%
30%
40%
50%
60%
70%
80%
90%
100%
Aus
tria
Bel
gium
Bul
garia
Cyp
rus
Cze
ch R
epub
lic
Den
mar
k
Esto
nia
Finl
and
Fran
ce
Ger
man
y
Hun
gary
Icel
and
Irel
and
Ital
y
Latv
ia
Lith
uani
a
Luxe
mbo
urg
Net
herlan
ds
Nor
way
Pola
nd
Port
ugal
Slo
vaki
a
Slo
veni
a
Spa
in
Swed
en
Oral solution InjectionU
nite
d Kin
gdom
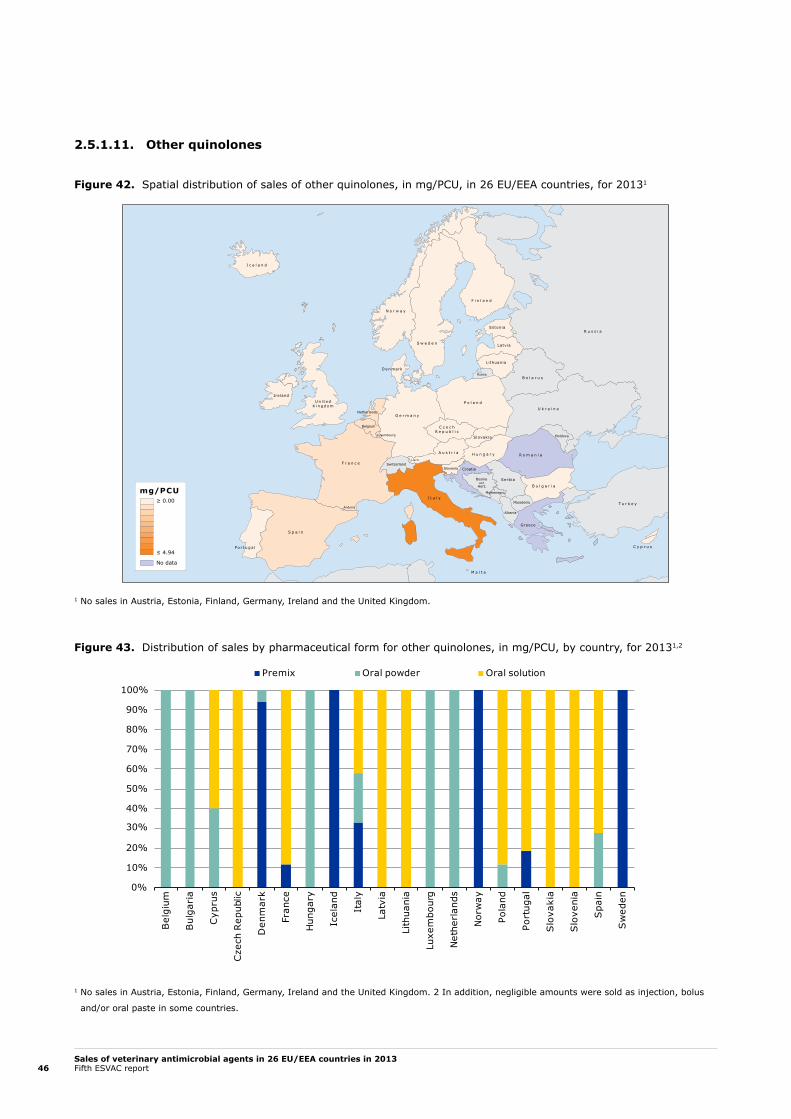
Sales of veterinary antimicrobial agents in 26 EU/EEA countries in 2013Fifth ESVAC report46
2.5.1.11. Other quinolones
Figure 42. Spatial distribution of sales of other quinolones, in mg/PCU, in 26 EU/EEA countries, for 20131
1 No sales in Austria, Estonia, Finland, Germany, Ireland and the United Kingdom.
Figure 43. Distribution of sales by pharmaceutical form for other quinolones, in mg/PCU, by country, for 20131,2
1 No sales in Austria, Estonia, Finland, Germany, Ireland and the United Kingdom. 2 In addition, negligible amounts were sold as injection, bolus
and/or oral paste in some countries.
Russia
R u s s i a
Bosniaand
Herz.
Andorra
Lebanon
Israel
T u r k e y
Croatia
Serbia
Montenegro
Albania
Macedonia
Moldova
U k r a i n e
B e l a r u s
N o r w a y
I c e l a n d
SwitzerlandLiech.
P o l a n d
G e r m a n y
S w e d e n
F i n l a n d
U n i t e d K i n g d o m
Ireland
D e n mark
Netherlands
Luxembourg
Belgium
F r a n c e
S p a i n
Po r t u g a l
I t a l y
M a l t a
C y p r u s
Greece
A u s t r i a
Slovenia
H u n g a r y
C z e c hR e p u b l i c
Lithuania
Latvia
Estonia
Slovakia
B u l g a r i a
R o m a n i a
mg/PCU≥ 0.00
≤ 4.94
No data
0%
10%
20%
30%
40%
50%
60%
70%
80%
90%
100%
Bel
gium
Bul
gari
a
Cyp
rus
Cze
ch R
epub
lic
Den
mar
k
Fran
ce
Hun
gary
Icel
and
Ital
y
Latv
ia
Lith
uani
a
Luxe
mbo
urg
Net
herl
ands
Nor
way
Pola
nd
Port
ugal
Slo
vaki
a
Slo
veni
a
Spa
in
Sw
eden
Premix Oral powder Oral solution
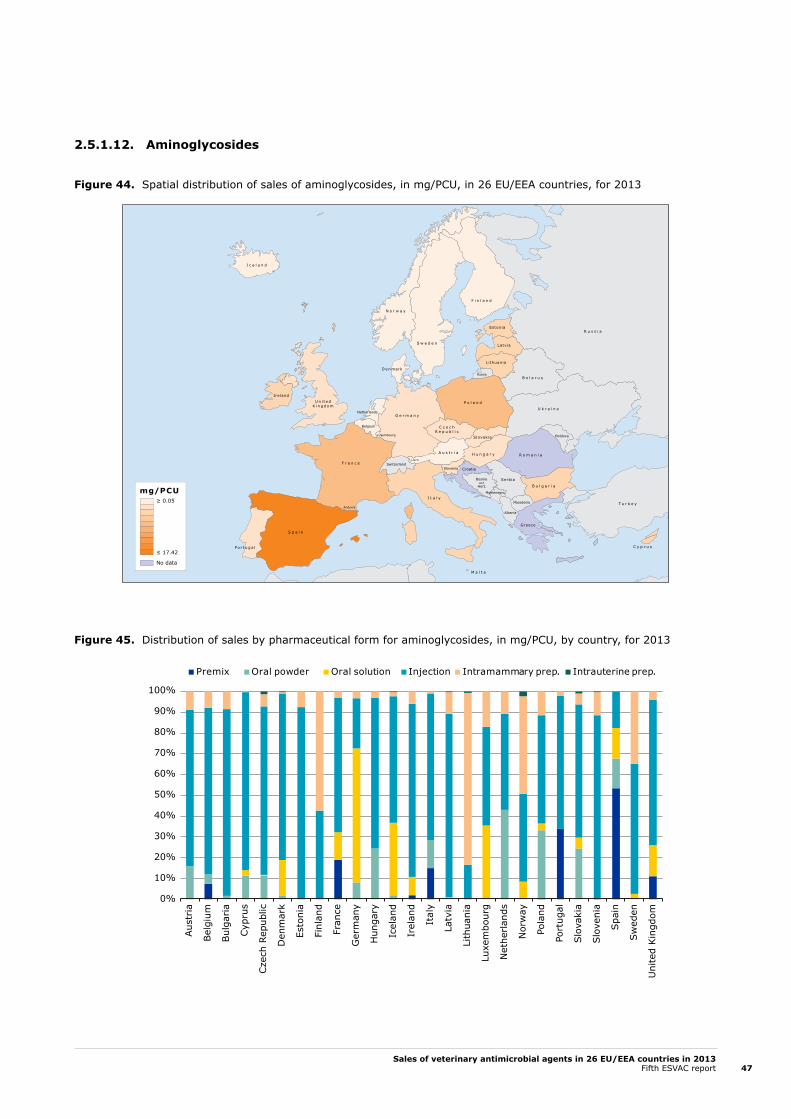
Sales of veterinary antimicrobial agents in 26 EU/EEA countries in 2013Fifth ESVAC report 47
2.5.1.12. Aminoglycosides
Figure 44. Spatial distribution of sales of aminoglycosides, in mg/PCU, in 26 EU/EEA countries, for 2013
Figure 45. Distribution of sales by pharmaceutical form for aminoglycosides, in mg/PCU, by country, for 2013
Russia
R u s s i a
Bosniaand
Herz.
Andorra
Lebanon
Israel
T u r k e y
Croatia
Serbia
Montenegro
Albania
Macedonia
Moldova
U k r a i n e
B e l a r u s
N o r w a y
I c e l a n d
SwitzerlandLiech.
P o l a n d
G e r m a n y
S w e d e n
F i n l a n d
U n i t e d K i n g d o m
Ireland
D e n mark
Netherlands
Luxembourg
Belgium
F r a n c e
S p a i n
Po r t u g a l
I t a l y
M a l t a
C y p r u s
Greece
A u s t r i a
Slovenia
H u n g a r y
C z e c hR e p u b l i c
Lithuania
Latvia
Estonia
Slovakia
B u l g a r i a
R o m a n i a
mg/PCU≥ 0.05
≤ 17.42
No data
0%
10%
20%
30%
40%
50%
60%
70%
80%
90%
100%
Aus
tria
Bel
gium
Bul
garia
Cyp
rus
Cze
ch R
epub
lic
Den
mar
k
Esto
nia
Finl
and
Fran
ce
Ger
man
y
Hun
gary
Icel
and
Irel
and
Ital
y
Latv
ia
Lith
uani
a
Luxe
mbo
urg
Net
herlan
ds
Nor
way
Pola
nd
Port
ugal
Slo
vaki
a
Slo
veni
a
Spa
in
Swed
en
Uni
ted
Kin
gdom
Premix Oral powder Oral solution Injection Intramammary prep. Intrauterine prep.

Sales of veterinary antimicrobial agents in 26 EU/EEA countries in 2013Fifth ESVAC report48
2.5.1.13. Polymyxins
Figure 46. Spatial distribution of sales of polymyxins, in mg/PCU, in 26 EU/EEA countries, for 20131
1 No sales in Finland, Iceland and Norway.
Figure 47. Distribution of sales by pharmaceutical form for polymyxins, in mg/PCU, by country, for 201311,2
1 No sales in Finland, Iceland and Norway. 2 In addition, negligible amounts were sold as bolus, oral paste, intramammary and/or intrauterine preparations in some countries.
Russia
R u s s i a
Bosniaand
Herz.
Andorra
Lebanon
Israel
T u r k e y
Croatia
Serbia
Montenegro
Albania
Macedonia
Moldova
U k r a i n e
B e l a r u s
N o r w a y
I c e l a n d
SwitzerlandLiech.
P o l a n d
G e r m a n y
S w e d e n
F i n l a n d
U n i t e d K i n g d o m
Ireland
D e n mark
Netherlands
Luxembourg
Belgium
F r a n c e
S p a i n
Po r t u g a l
I t a l y
M a l t a
C y p r u s
Greece
A u s t r i a
Slovenia
H u n g a r y
C z e c hR e p u b l i c
Lithuania
Latvia
Estonia
Slovakia
B u l g a r i a
R o m a n i a
mg/PCU≥ 0.00
≤ 27.58
No data
0%
10%
20%
30%
40%
50%
60%
70%
80%
90%
100%
Premix Oral powder Oral solution Injection
Aus
tria
Bel
gium
Bul
gari
a
Cyp
rus
Cze
ch R
epub
lic
Den
mar
k
Esto
nia
Fran
ce
Ger
man
y
Hun
gary
Irel
and
Ital
y
Latv
ia
Lith
uani
a
Luxe
mbo
urg
Net
herl
ands
Pola
nd
Port
ugal
Slo
vaki
a
Slo
veni
a
Spa
in
Sw
eden
Uni
ted
Kin
gdom

Sales of veterinary antimicrobial agents in 26 EU/EEA countries in 2013Fifth ESVAC report 49
2.5.1.14. Pleuromutilins
Figure 48. Spatial distribution of sales of pleuromutilins, in mg/PCU, in 26 EU/EEA countries, for 20131
1 No sales in Iceland.
Figure 49. Distribution of sales by pharmaceutical form for pleuromutilins, in mg/PCU, by country, for 20131
1 No sales in Iceland.
Russia
R u s s i a
Bosniaand
Herz.
Andorra
Lebanon
Israel
T u r k e y
Croatia
Serbia
Montenegro
Albania
Macedonia
Moldova
U k r a i n e
B e l a r u s
N o r w a y
I c e l a n d
SwitzerlandLiech.
P o l a n d
G e r m a n y
S w e d e n
F i n l a n d
U n i t e d K i n g d o m
Ireland
D e n mark
Netherlands
Luxembourg
Belgium
F r a n c e
S p a i n
Po r t u g a l
I t a l y
M a l t a
C y p r u s
Greece
A u s t r i a
Slovenia
H u n g a r y
C z e c hR e p u b l i c
Lithuania
Latvia
Estonia
Slovakia
B u l g a r i a
R o m a n i a
mg/PCU≥ 0.00
≤ 34.42
No data
0%
10%
20%
30%
40%
50%
60%
70%
80%
90%
100%
Premix Oral powder Oral solution Injection
Aus
tria
Bel
gium
Bul
gari
a
Cyp
rus
Cze
ch R
epub
lic
Den
mar
k
Esto
nia
Finl
and
Fran
ce
Ger
man
y
Hun
gary
Irel
and
Ital
y
Latv
ia
Lith
uani
a
Luxe
mbo
urg
Net
herl
ands
Nor
way
Pola
nd
Port
ugal
Slo
vaki
a
Slo
veni
a
Spa
in
Sw
eden
Uni
ted
Kin
gdom

Sales of veterinary antimicrobial agents in 26 EU/EEA countries in 2013Fifth ESVAC report50
2.6. Distribution of single- and multiple-ingredient products of veterinary antimicrobial agentsOf the 8,432 product presentations for which sales were reported — i.e. product name, form, strength and pack size (tablets excluded) — 81.2 % contained only one active ingredient, 16.8 % contained two active ingredients and 1.9 % contained three active ingredients (Table 7.). In addition, 0.2 % (n=15) of the product presentations contained four active ingredients. Sales of products with three active ingredients were almost solely accounted for by products for individual treatment (intramammary and intrauterine preparations), and sales of products containing four ingredients were only accounted for by intramammary preparations.
Table 7. Number of product presentations (product name, form, strength and pack size) containing 1, 2 and 3 antimicrobial agents1 sold, by country, for 2013 (tablets excluded from the data)
Country 1 ingredient 2 ingredients 3 ingredients Total number1
Austria 218 44 6 268
Belgium 328 47 4 379
Bulgaria 177 50 2 229
Cyprus 110 35 2 147
Czech Republic 397 71 8 476
Denmark 220 54 6 280
Estonia 115 28 9 152
Finland 69 16 1 86
France 565 171 4 740
Germany 578 54 8 640
Hungary 297 51 7 355
Iceland 23 8 2 33
Ireland 240 47 6 293
Italy 579 139 12 730
Latvia 158 44 16 218
Lithuania 106 33 6 145
Luxembourg 194 56 5 255
Netherlands 212 62 5 279
Norway 63 20 2 85
Poland 502 92 10 604
Portugal 372 66 13 451
Slovakia 375 57 9 441
Slovenia 94 29 2 125
Spain 459 75 6 540
Sweden 93 23 1 117
United Kingdom 301 44 4 349
Total 26 countries 6,845 1,416 156 8,417
1 In addition, 15 intramammary preparations contained 4 active ingredients, accounting for 0.2 % of the product presentations in the 26 countries.

Sales of veterinary antimicrobial agents in 26 EU/EEA countries in 2013Fifth ESVAC report 51
Table 8. Number of product presentations (product name, form, strength and pack size) of premixes, oral powders and oral solutions sold containing 1, 2 and 3 antimicrobial agents, by country, for 2013
Country 1 ingredient 2 ingredients 3 ingredients
Total number of product
presentations for premixes, oral
powder and oral solution
Austria 83 20 3 106
Belgium 125 23 0 148
Bulgaria 95 16 0 111
Cyprus 46 19 0 65
Czech Republic 220 42 2 264
Denmark 84 10 1 95
Estonia 25 5 0 30
Finland 21 3 0 24
France 303 88 0 391
Germany 261 30 0 291
Hungary 167 22 0 189
Iceland 7 1 0 8
Ireland 62 13 0 75
Italy 309 73 6 388
Latvia 39 7 0 46
Lithuania 32 8 0 40
Luxembourg 64 23 0 87
Netherlands 88 24 0 112
Norway 25 3 0 28
Poland 271 38 0 309
Portugal 149 24 5 178
Slovakia 167 27 4 198
Slovenia 31 14 0 45
Spain 249 15 0 264
Sweden 27 2 0 29
United Kingdom 112 14 0 126
Total 26 countries 3,062 564 21 3,647
For all 26 countries, 84 % of the product presentations of pharmaceutical forms of antimicrobial VMPs applicable for group treatment — premixes, oral powders and oral solutions — were for products with one active ingredient.
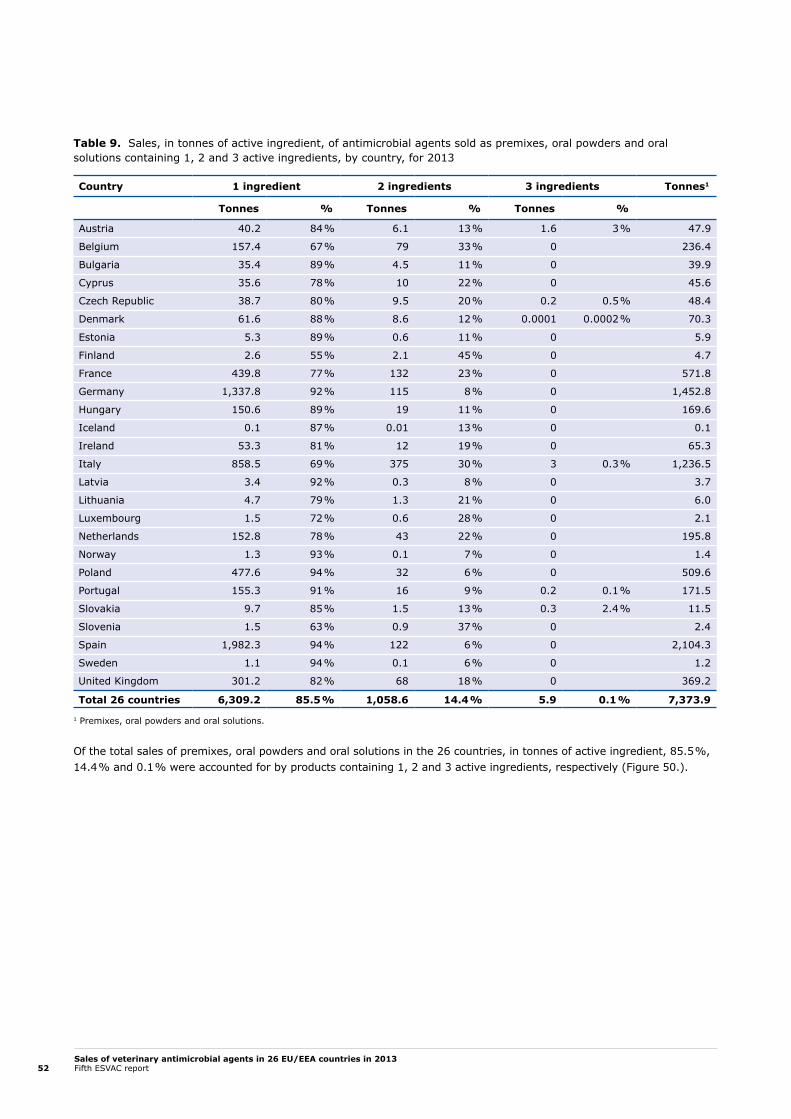
Sales of veterinary antimicrobial agents in 26 EU/EEA countries in 2013Fifth ESVAC report52
Table 9. Sales, in tonnes of active ingredient, of antimicrobial agents sold as premixes, oral powders and oral solutions containing 1, 2 and 3 active ingredients, by country, for 2013
Country 1 ingredient 2 ingredients 3 ingredients Tonnes1
Tonnes % Tonnes % Tonnes %
Austria 40.2 84 % 6.1 13 % 1.6 3 % 47.9
Belgium 157.4 67 % 79 33 % 0 236.4
Bulgaria 35.4 89 % 4.5 11 % 0 39.9
Cyprus 35.6 78 % 10 22 % 0 45.6
Czech Republic 38.7 80 % 9.5 20 % 0.2 0.5 % 48.4
Denmark 61.6 88 % 8.6 12 % 0.0001 0.0002 % 70.3
Estonia 5.3 89 % 0.6 11 % 0 5.9
Finland 2.6 55 % 2.1 45 % 0 4.7
France 439.8 77 % 132 23 % 0 571.8
Germany 1,337.8 92 % 115 8 % 0 1,452.8
Hungary 150.6 89 % 19 11 % 0 169.6
Iceland 0.1 87 % 0.01 13 % 0 0.1
Ireland 53.3 81 % 12 19 % 0 65.3
Italy 858.5 69 % 375 30 % 3 0.3 % 1,236.5
Latvia 3.4 92 % 0.3 8 % 0 3.7
Lithuania 4.7 79 % 1.3 21 % 0 6.0
Luxembourg 1.5 72 % 0.6 28 % 0 2.1
Netherlands 152.8 78 % 43 22 % 0 195.8
Norway 1.3 93 % 0.1 7 % 0 1.4
Poland 477.6 94 % 32 6 % 0 509.6
Portugal 155.3 91 % 16 9 % 0.2 0.1 % 171.5
Slovakia 9.7 85 % 1.5 13 % 0.3 2.4 % 11.5
Slovenia 1.5 63 % 0.9 37 % 0 2.4
Spain 1,982.3 94 % 122 6 % 0 2,104.3
Sweden 1.1 94 % 0.1 6 % 0 1.2
United Kingdom 301.2 82 % 68 18 % 0 369.2
Total 26 countries 6,309.2 85.5 % 1,058.6 14.4 % 5.9 0.1 % 7,373.9
1 Premixes, oral powders and oral solutions.
Of the total sales of premixes, oral powders and oral solutions in the 26 countries, in tonnes of active ingredient, 85.5 %, 14.4 % and 0.1 % were accounted for by products containing 1, 2 and 3 active ingredients, respectively (Figure 50.).
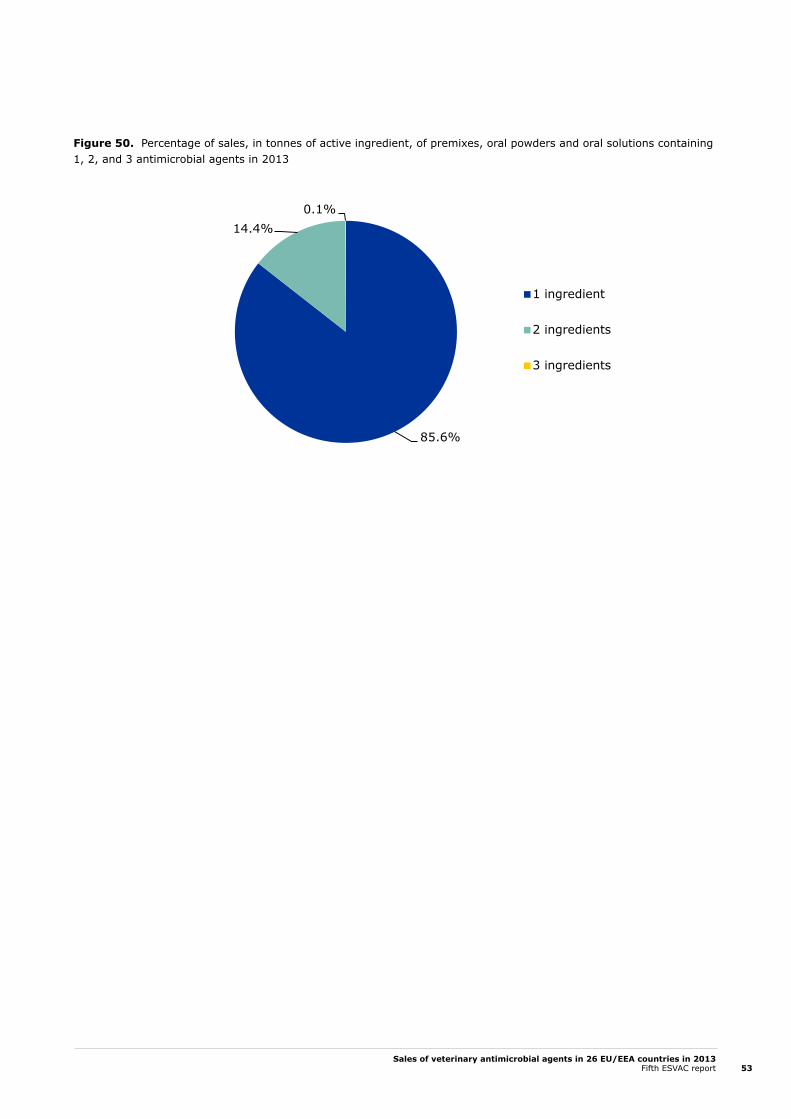
Sales of veterinary antimicrobial agents in 26 EU/EEA countries in 2013Fifth ESVAC report 53
Figure 50. Percentage of sales, in tonnes of active ingredient, of premixes, oral powders and oral solutions containing 1, 2, and 3 antimicrobial agents in 2013
85.6%
14.4%0.1%
1 ingredient
2 ingredients
3 ingredients

Sales of veterinary antimicrobial agents in 26 EU/EEA countries in 2013Fifth ESVAC report54
2.7. Sales of tablets by veterinary antimicrobial class for companion animalsFigure 51 shows the distribution of sales of tablets, in tonnes of active ingredient, by antimicrobial class and country for 2013. For the majority of countries, penicillins (mainly in combination with beta-lactamase inhibitor, see Figure 52.) were the most-sold veterinary antimicrobial agent in tablet form; the sales patterns varied substantially between the countries.
Since the tablets included in the data sets are almost solely used for companion animals, the sales figures presented are thought to be a good estimate for sales of tablets of veterinary antimicrobial agents for companion animals. Antimicrobial products marketed for human use can also be used in companion animals, in application of Article 10 of Directive 2001/82/EC, as amended, of the European Parliament and of the Council. Such sales are included in the sales data for human antimicrobial agents (ESAC-net data) if they are based, for instance, on the sales of pharmacies, and not on the reimbursement of physicians’ prescriptions as provided by insurance companies. In the current report, all injectable veterinary antimicrobial products are included in the sales for food-producing animals, but some of these products are also used in companion animals. Consequently, the data presented in Figure 51 do not give a complete picture of the sales patterns of antimicrobial agents in companion animals for 2013.
Figure 51. Distribution of sales of tablets, in tonnes of active ingredient, by antimicrobial class (reported according to the ATCvet hierarchical system), by country, for 20131
1 Small amounts of aminoglycosides, amphenicols, polymyxins and other antibacterials (classified as such in the ATCvet system) were sold, but are not included in this figure. No sales of other quinolones were reported for tablets.
Aggregated by 26 countries, penicillins (38 %), 1st- and 2nd-generation cephalosporins (27 %), sulfonamides (13 %) and macrolides (7 %) were the most-sold antimicrobial classes of tablets.
The distribution of penicillins by subclasses varied significantly between the 26 countries for the veterinary penicillins available as tablets (Figure 52.). The sales of tablets with the combination of a penicillin + beta-lactamase inhibitors (tonnes of clavulanic-acid inhibitors not included in the data) accounted for between 15 % and 100 % (7 countries) of the total sales of penicillin tablets.
0%
10%
20%
30%
40%
50%
60%
70%
80%
90%
100%
Aus
tria
Bel
gium
Bul
garia
Cyp
rus
Cze
ch R
epub
lic
Den
mar
k
Esto
nia
Finl
and
Fran
ce
Ger
man
y
Hun
gary
Icel
and
Irel
and
Ital
y
Latv
ia
Lith
uani
a
Luxe
mbo
urg
Net
herlan
ds
Nor
way
Pola
nd
Port
ugal
Slo
vaki
a
Slo
veni
a
Spa
in
Sw
eden
Uni
ted
Kin
gdom
Fluoroquinolones
Lincosamides
Macrolides
Trimethoprim
Sulfonamides
1st- and 2nd-gen.cephalosporins
Penicillins
Tetracyclines

Sales of veterinary antimicrobial agents in 26 EU/EEA countries in 2013Fifth ESVAC report 55
Figure 52. Distribution of sales of tablets containing penicillins by subclass (in weight of active ingredient), by country, for 2013
2.8. Changes over time (2010–2013)This chapter describes the overall changes observed between 2010 and 2013 and focuses on the most- selling classes and the CIAs with the highest priorities for human medicine. Chapter 2.8.2. emphasises the categorisation made by the EMA Antimicrobial Advice ad hoc Expert Group (AMEG) for antimicrobial agents, in terms of public health importance10. Category 2 of the AMEG’s categorisation includes those veterinary antimicrobials where the risk to public health is estimated to be higher; fluoroquinolones and 3rd- and 4th-generation cephalosporins are included in this category (but not, for example, macrolides). Aminoglycosides and certain penicillins have been included provisionally under category 2, but no risk profiling has been done yet by the EMA/CVMP.
2.8.1. All countries
2.8.1.1. Changes by PCU
The PCU (estimated weight at treatment of livestock and slaughtered animals) was relatively stable for most of the countries (Figure 53.).
For Estonia, an increase in the PCU is seen for 2012 and 2013 compared to previous years; this increase is due to change in the data source for slaughter pigs and poultry for 2012 and 2013 and thus the data are not directly comparable. For Norway, the increase (6 %) in the PCU is almost entirely due to the increased production of farmed fish.
0%
10%
20%
30%
40%
50%
60%
70%
80%
90%
100%Aus
tria
Bel
gium
Bul
garia
Cyp
rus
Cze
ch R
epub
lic
Den
mar
k
Esto
nia
Finl
and
Fran
ce
Ger
man
y
Hun
gary
Icel
and
Irel
and
Ital
y
Latv
ia
Lith
uani
a
Luxe
mbo
urg
Net
herlan
ds
Nor
way
Pola
nd
Port
ugal
Slo
vaki
a
Slo
veni
a
Spa
in
Sw
eden
Uni
ted
Kin
gdom
Penicillins with extended spectrum Penicillins + beta-lactamase inhib.
10 Available on the EMA website (http://www.ema.europa.eu/docs/en_GB/document_library/Other/2014/07/WC500170253.pdf) via Home > Veterinary regulatory > Antimicrobial resistance > Use of antibiotics in animals
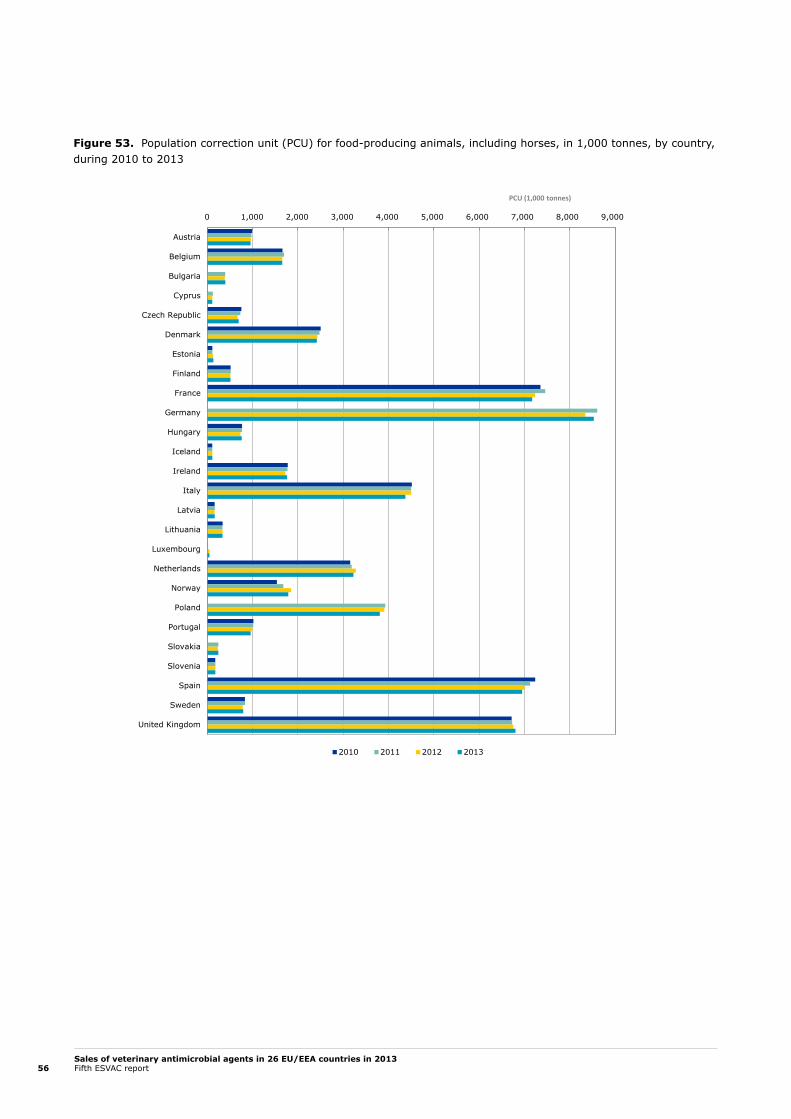
Sales of veterinary antimicrobial agents in 26 EU/EEA countries in 2013Fifth ESVAC report56
Figure 53. Population correction unit (PCU) for food-producing animals, including horses, in 1,000 tonnes, by country, during 2010 to 2013
0 1,000 2,000 3,000 4,000 5,000 6,000 7,000 8,000 9,000
Austria
Belgium
Bulgaria
Cyprus
Czech Republic
Denmark
Estonia
Finland
France
Germany
Hungary
Iceland
Ireland
Italy
Latvia
Lithuania
Luxembourg
Netherlands
Norway
Poland
Portugal
Slovakia
Slovenia
Spain
Sweden
United Kingdom
2010 2011 2012 2013
PCU (1,000 tonnes)

Sales of veterinary antimicrobial agents in 26 EU/EEA countries in 2013Fifth ESVAC report 57
2.8.1.2. Changes in sales of tonnes of active ingredients
Figure 54. Sales, in tonnes of active ingredients, of veterinary antimicrobials for food-producing animals, including horses, during 2010 to 2013, for 26 EU/EEA countries1-6
1 Correction of sales data published in ESVAC 2012 report is described in chapter 1.6. 2 Under-reported for Bulgaria for 2011 and 2012 as several wholesalers failed to report data. 3 Strength reported as base for most VMPs for 2010 –2012 for the Czech Republic; for 2013, strength reported as in the names of the VMPs. 4 Strength reported as base for some VMPs for 2010–2012 for the Netherlands; for 2013, strength reported as in the names of the VMPs. 5 For Slovakia, for 2011 and 2012 the data represents only imported antimicrobial VMPs by wholesalers; for 2013, data represents all sales from wholesalers to end-users (veterinarians, pharmacies, producers of medicated feeding stuffs and farmers, obtained by import and from national manufacturers. 6 For Spain, under-reporting for 2010 as one MAH failed to report data; for 2011 and 2012, the number of packages sold were corrected for some products. For more details see chapter 2.8.2.
0 250 500 750 1,000 1,250 1,500 1,750 2,000 2,250 2,500
Austria
Belgium
Bulgaria
Cyprus
Czech Republic
Denmark
Estonia
Finland
France
Germany
Hungary
Iceland
Ireland
Italy
Latvia
Lithuania
Luxembourg
Netherlands
Norway
Poland
Portugal
Slovakia
Slovenia
Spain
Sweden
United Kingdom
2010 2011 2012 2013
Tonnes
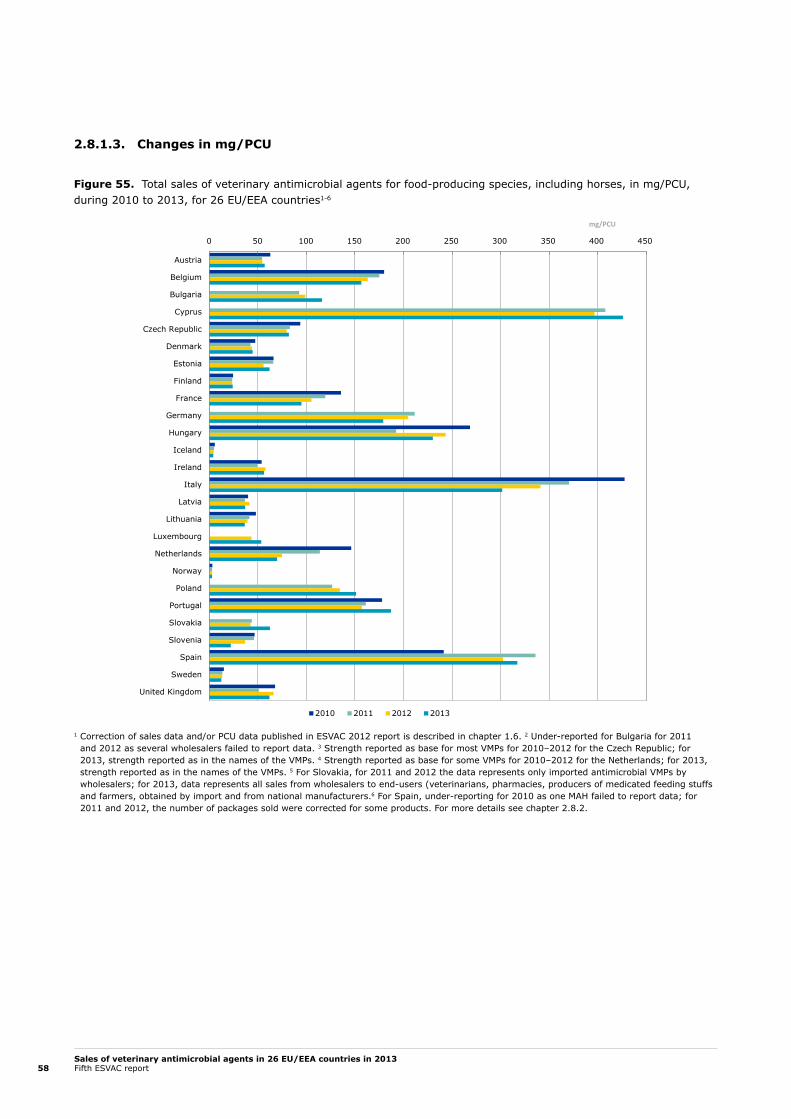
Sales of veterinary antimicrobial agents in 26 EU/EEA countries in 2013Fifth ESVAC report58
2.8.1.3. Changes in mg/PCU
Figure 55. Total sales of veterinary antimicrobial agents for food-producing species, including horses, in mg/PCU, during 2010 to 2013, for 26 EU/EEA countries1-6
1 Correction of sales data and/or PCU data published in ESVAC 2012 report is described in chapter 1.6. 2 Under-reported for Bulgaria for 2011 and 2012 as several wholesalers failed to report data. 3 Strength reported as base for most VMPs for 2010–2012 for the Czech Republic; for 2013, strength reported as in the names of the VMPs. 4 Strength reported as base for some VMPs for 2010–2012 for the Netherlands; for 2013, strength reported as in the names of the VMPs. 5 For Slovakia, for 2011 and 2012 the data represents only imported antimicrobial VMPs by wholesalers; for 2013, data represents all sales from wholesalers to end-users (veterinarians, pharmacies, producers of medicated feeding stuffs and farmers, obtained by import and from national manufacturers.6 For Spain, under-reporting for 2010 as one MAH failed to report data; for 2011 and 2012, the number of packages sold were corrected for some products. For more details see chapter 2.8.2.
0 50 100 150 200 250 300 350 400 450
Austria
Belgium
Bulgaria
Cyprus
Czech Republic
Denmark
Estonia
Finland
France
Germany
Hungary
Iceland
Ireland
Italy
Latvia
Lithuania
Luxembourg
Netherlands
Norway
Poland
Portugal
Slovakia
Slovenia
Spain
Sweden
United Kingdom
2010 2011 2012 2013
mg/PCU

Sales of veterinary antimicrobial agents in 26 EU/EEA countries in 2013Fifth ESVAC report 59
Table 10. Sales of veterinary antimicrobial agents for food-producing species, including horses, in mg/PCU, for 26 EU/EEA countries1, from 2010 to 2013
Country 2010 2011 2012 2013
Austria 63 54 55 57
Belgium 180 175 163 157
Bulgaria 93 99 116
Cyprus 408 396 426
Czech Republic 94 83 80 82
Denmark 47 43 44 45
Estonia 66 66 56 62
Finland 25 24 24 24
France 136 119 105 95
Germany 211 205 179
Hungary 268 192 243 230
Iceland 7.2 6.3 5.9 5.3
Ireland 54 49 58 57
Italy 427 370 341 302
Latvia1 40 37 41 37
Lithuania 48 42 39 37
Luxembourg 44 54
Netherlands 146 114 75 70
Norway 4.1 3.7 3.8 3.7
Poland 127 135 151
Portugal 178 161 157 187
Slovakia 44 43 63
Slovenia2 47 46 37 22
Spain3 241 336 302 317
Sweden 15 14 13.5 13
United Kingdom 68 51 66 62
1 Correction of sales data and/or PCU data published in ESVAC 2012 report is described in chapter 1.6. 2 Under-reported for Bulgaria for 2011 and 2012 as several wholesalers failed to report data. 3 Strength reported as base for most VMPs for 2010–2012 for the Czech Republic; for 2013, strength reported as in the names of the VMPs. 4 Strength reported as base for some VMPs for 2010–2012 for the Netherlands; for 2013, strength reported as in the names of the VMPs. 5 For Slovakia, the data for 2011 and 2012 represents only imported antimicrobial VMPs by wholesalers; for 2013, data represent all sales from wholesalers to end-users (veterinarians, pharmacies, producers of medicated feeding stuffs producers and farmers, obtained by import and from national manufacturers. 6 For Spain, under-reporting for 2010 as one MAH failed to report data; for 2011 and 2012, the number of packages sold were corrected for some products. For more details see chapter 2.8.2.
No conclusion can be drawn for Bulgaria and Slovakia as to whether there has been an increase or decrease due to under-reporting for 2011 and 2012, since there has been a change in the data collection system in those two countries. Luxembourg did not provide data for 2010 and 2011 (Table 10.).

Sales of veterinary antimicrobial agents in 26 EU/EEA countries in 2013Fifth ESVAC report60
Figure 56. Percentage changes in PCU, in tonnes sold and in sales of veterinary antimicrobial agents for food-producing species, including horses, in mg/PCU, from 2011 to 2013, aggregated by 23 EU/EEA countries1
1 Austria, Belgium, Cyprus, Czech Republic, Denmark, Estonia, Finland, France, Germany, Hungary, Iceland, Italy, Ireland, Latvia, Lithuania, Netherlands, Norway, Portugal, Poland, Slovenia, Spain, Sweden and the United Kingdom.
For the period 2011 to 2013, a decrease in the sales (in mg/PCU) of more than 5 % (range: 5.6 %–51 %) is observed for 11 of the 23 countries (Table 10.).
An increase in the sales (in mg/PCU) of more than 5 % (range: 5.4 %–21 %) for the period 2011–2013 is observed for 6 of the 23 countries.
Overall, for 23 countries reporting sales data to ESVAC for the years 2011–2013, a decrease in the sales (mg/PCU) of 7.9 % is observed; the reduction of PCU was 2.8 % and the reduction in tonnes sold was 10.5 %.
Note that the sales figures for 2011 and 2012 reported in the ESVAC 2012 report11 were under-reported for some countries (see chapter 1.6.1.). The updated data for the 20 countries show a decrease in sales in mg/PCU for the period 2010–2012 of 8.1 % (in the ESVAC 2012 report these figures were 14.9 %) and for the period 2010–2013, 11.1 %, indicating that the overall sales for these 20 countries continues to decline.
-2.8% -10.5% -7.9%
-15%
-10%
-5%
0%
5%
10%
PCU Tonnes sold mg/PCU
Changes by 23 EU/EEA countries, 2011 -2013
11 Available on the EMA website (www.ema.europa.eu) via > Home > Veterinary regulatory > Antimicrobial resistance > European Surveillance of Veterinary Antimicrobial Consumption.
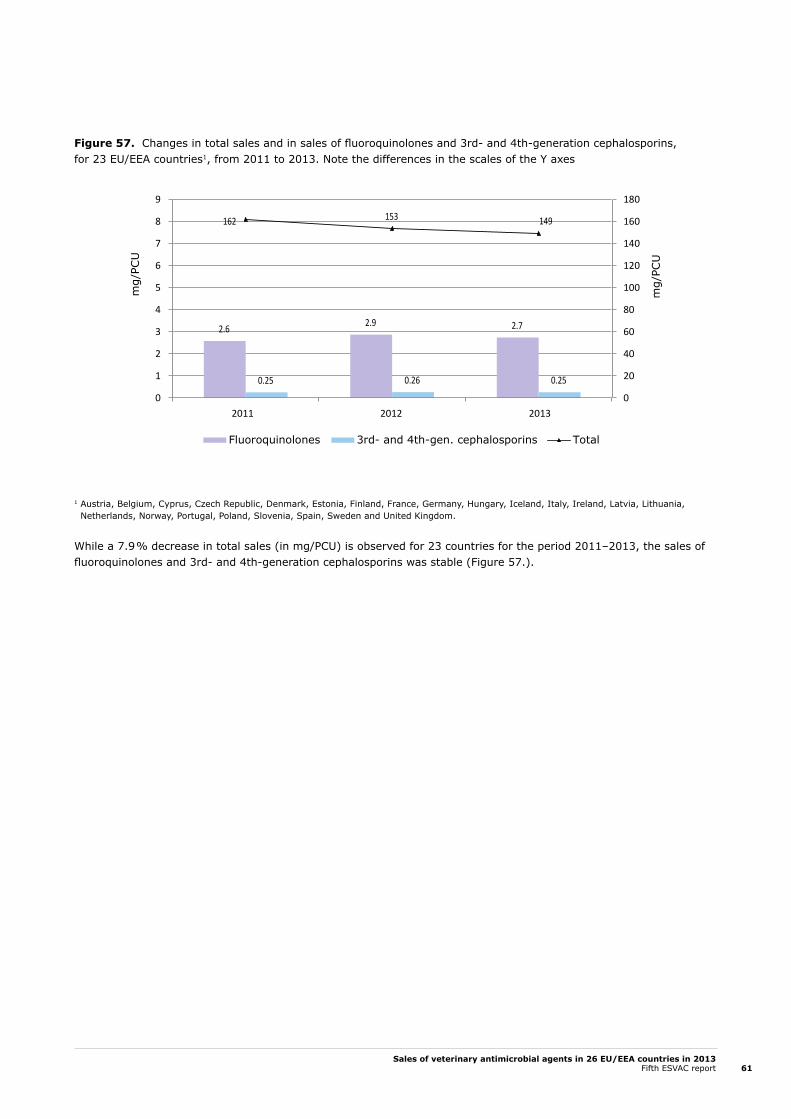
Sales of veterinary antimicrobial agents in 26 EU/EEA countries in 2013Fifth ESVAC report 61
Figure 57. Changes in total sales and in sales of fluoroquinolones and 3rd- and 4th-generation cephalosporins, for 23 EU/EEA countries1, from 2011 to 2013. Note the differences in the scales of the Y axes
1 Austria, Belgium, Cyprus, Czech Republic, Denmark, Estonia, Finland, France, Germany, Hungary, Iceland, Italy, Ireland, Latvia, Lithuania, Netherlands, Norway, Portugal, Poland, Slovenia, Spain, Sweden and United Kingdom.
While a 7.9 % decrease in total sales (in mg/PCU) is observed for 23 countries for the period 2011–2013, the sales of fluoroquinolones and 3rd- and 4th-generation cephalosporins was stable (Figure 57.).
2.6 2.9 2.7
0.25 0.26 0.25
162 153 149
0
20
40
60
80
100
120
140
160
180
0
1
2
3
4
5
6
7
8
9
2011 2012 2013
Fluoroquinolones 3rd- and 4th-gen. cephalosporins Total
mg/
PCU
mg/
PCU

Sales of veterinary antimicrobial agents in 26 EU/EEA countries in 2013Fifth ESVAC report62
2.8.1.4. Changes in sales by antimicrobial class in mg/PCU
Sales of tetracyclines are shown in Figure 58. Due to the high volume of sales of tetracyclines and the fact that doxycyclines require a lower dose than other tetracyclines for treating animals, doxycycline sales are also presented separately (Figure 59.). For countries where there is a shift in the proportion of sales of doxycycline of the total sales of tetracyclines, this may be a potential explanation for an increase or decrease in sales of tetracyclines.
Figure 58. Sales of tetracyclines for food-producing species, including horses, in mg/PCU, by 26 EU/EEA countries, from 2010 to 2013
0 20 40 60 80 100 120 140 160
Austria
Belgium
Bulgaria
Cyprus
Czech Republic
Denmark
Estonia
Finland
France
Germany
Hungary
Iceland
Ireland
Italy
Latvia
Lithuania
Luxembourg
Netherlands
Norway
Poland
Portugal
Slovakia
Slovenia
Spain
Sweden
United Kingdom
2010 2011 2012 2013
Tetracyclines mg/PCU

Sales of veterinary antimicrobial agents in 26 EU/EEA countries in 2013Fifth ESVAC report 63
Figure 59. Sales of doxycycline for food-producing species, including horses, in mg/PCU, by 26 EU/EEA countries, from 2010 to 20131
1 No sales in Iceland and Norway; sales in Ireland and Sweden were < 0.2 mg/PCU. In 2013, sales were reported in Finland (< 0.001 mg/PCU) and in Slovenia (< 0.5 mg/PCU), but not in 2010-2012.
It can be seen that in some countries the overall sales of tetracyclines have decreased while the sales of doxycycline have either increased or are stable.
0 5 10 15 20 25 30 35 40 45 50 55
Austria
Belgium
Bulgaria
Cyprus
Czech Republic
Denmark
Estonia
France
Germany
Hungary
Italy
Latvia
Lithuania
Luxembourg
Netherlands
Poland
Portugal
Slovakia
Spain
United Kingdom
2010 2011 2012 2013
mg/PCUDoxycycline

Sales of veterinary antimicrobial agents in 26 EU/EEA countries in 2013Fifth ESVAC report64
Figure 60. Sales of penicillins for food-producing species, including horses, in mg/PCU, by 26 EU/EEA countries, from 2010 to 2013
0 5 10 15 20 25 30 35 40 45 50 55 60 65 70 75 80 85
Austria
Belgium
Bulgaria
Cyprus
Czech Republic
Denmark
Estonia
Finland
France
Germany
Hungary
Iceland
Ireland
Italy
Latvia
Lithuania
Luxembourg
Netherlands
Norway
Poland
Portugal
Slovakia
Slovenia
Spain
Sweden
United Kingdom
2010 2011 2012 2013
Penicillinsmg/PCU
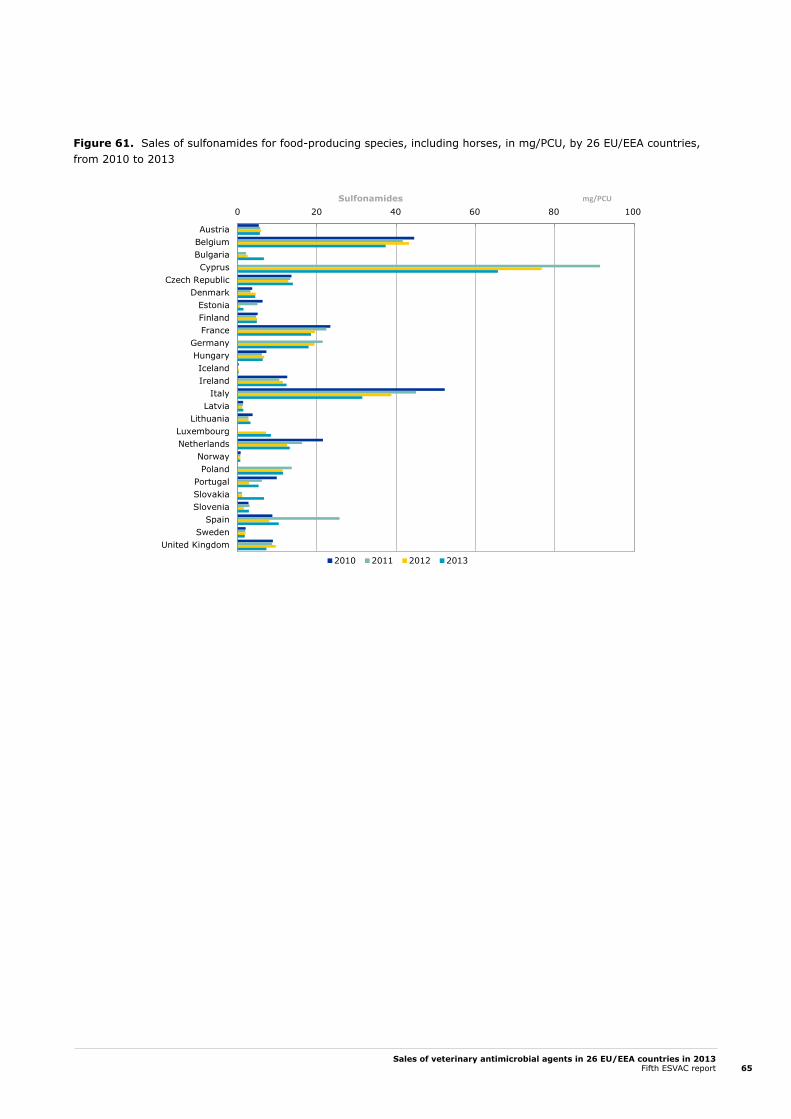
Sales of veterinary antimicrobial agents in 26 EU/EEA countries in 2013Fifth ESVAC report 65
Figure 61. Sales of sulfonamides for food-producing species, including horses, in mg/PCU, by 26 EU/EEA countries, from 2010 to 2013
0 20 40 60 80 100
AustriaBelgiumBulgariaCyprus
Czech RepublicDenmark
EstoniaFinlandFrance
GermanyHungaryIcelandIreland
ItalyLatvia
LithuaniaLuxembourgNetherlands
NorwayPoland
PortugalSlovakiaSlovenia
SpainSweden
United Kingdom
2010 2011 2012 2013
Sulfonamides mg/PCU
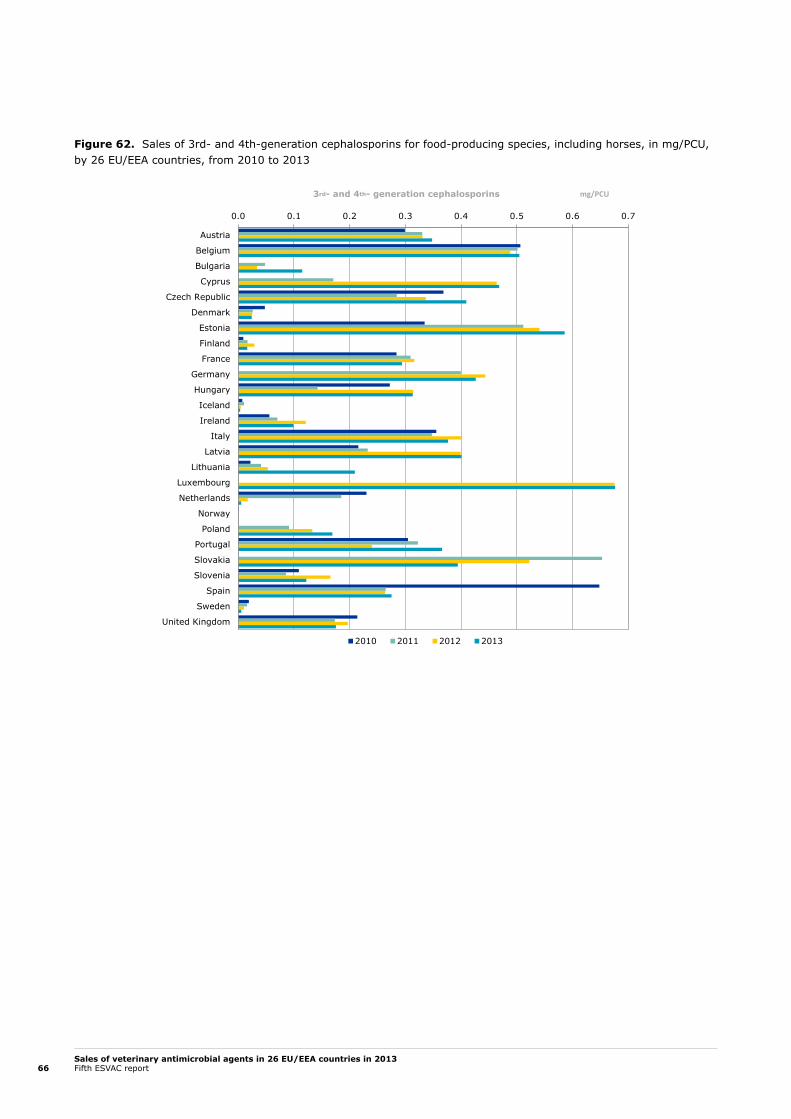
Sales of veterinary antimicrobial agents in 26 EU/EEA countries in 2013Fifth ESVAC report66
Figure 62. Sales of 3rd- and 4th-generation cephalosporins for food-producing species, including horses, in mg/PCU, by 26 EU/EEA countries, from 2010 to 2013
0.0 0.1 0.2 0.3 0.4 0.5 0.6 0.7
Austria
Belgium
Bulgaria
Cyprus
Czech Republic
Denmark
Estonia
Finland
France
Germany
Hungary
Iceland
Ireland
Italy
Latvia
Lithuania
Luxembourg
Netherlands
Norway
Poland
Portugal
Slovakia
Slovenia
Spain
Sweden
United Kingdom
2010 2011 2012 2013
3rd- and 4th- generation cephalosporins mg/PCU
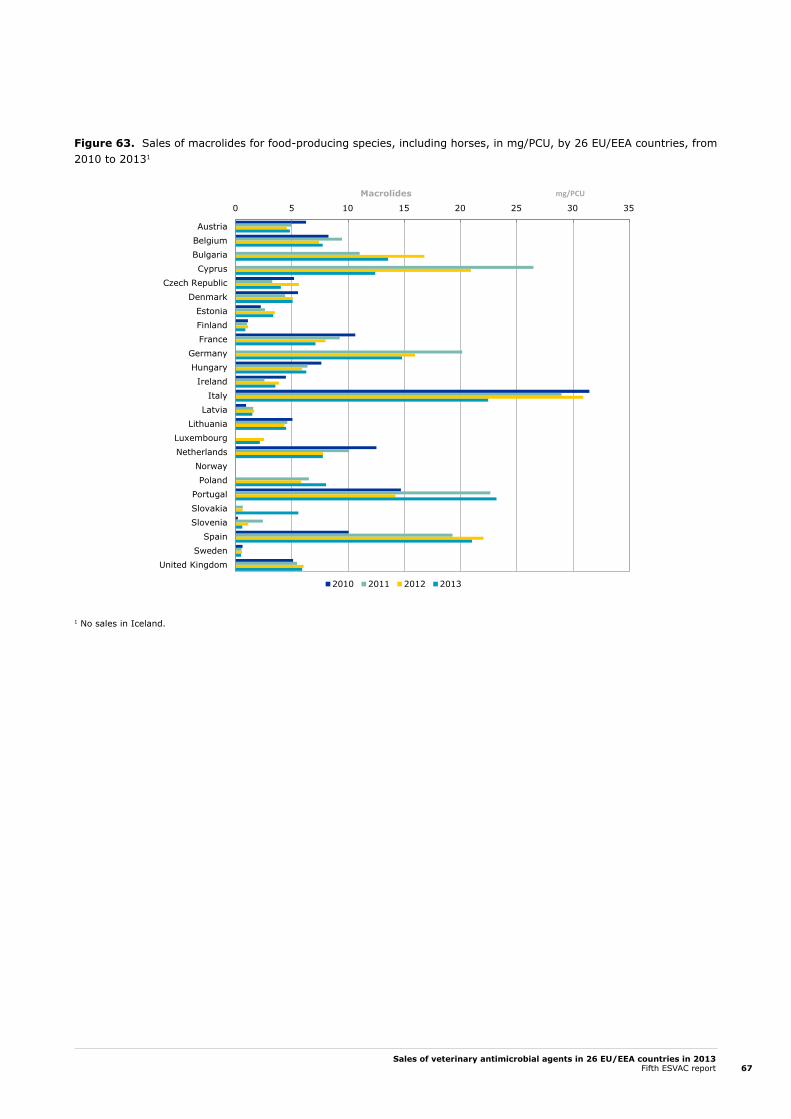
Sales of veterinary antimicrobial agents in 26 EU/EEA countries in 2013Fifth ESVAC report 67
Figure 63. Sales of macrolides for food-producing species, including horses, in mg/PCU, by 26 EU/EEA countries, from 2010 to 20131
1 No sales in Iceland.
0 5 10 15 20 25 30 35
AustriaBelgiumBulgariaCyprus
Czech RepublicDenmark
EstoniaFinlandFrance
GermanyHungaryIreland
ItalyLatvia
LithuaniaLuxembourgNetherlands
NorwayPoland
PortugalSlovakiaSlovenia
SpainSweden
United Kingdom
2010 2011 2012 2013
Macrolides mg/PCU
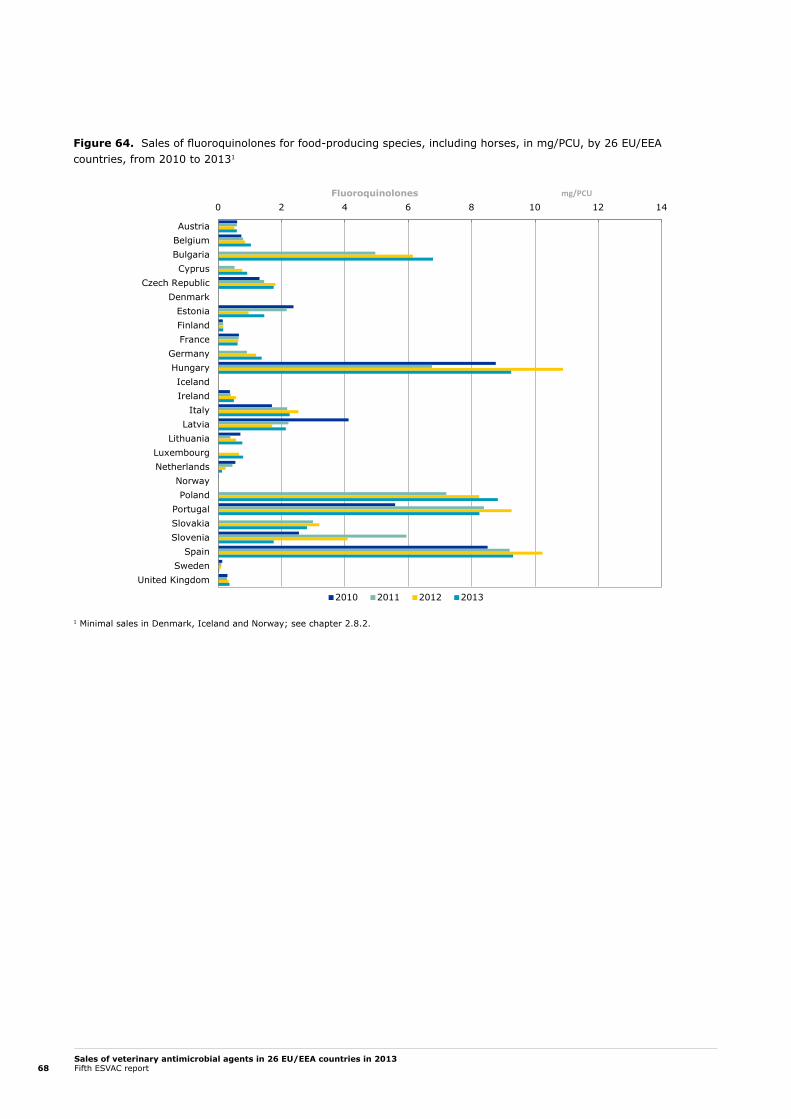
Sales of veterinary antimicrobial agents in 26 EU/EEA countries in 2013Fifth ESVAC report68
Figure 64. Sales of fluoroquinolones for food-producing species, including horses, in mg/PCU, by 26 EU/EEA countries, from 2010 to 20131
1 Minimal sales in Denmark, Iceland and Norway; see chapter 2.8.2.
0 2 4 6 8 10 12 14
AustriaBelgiumBulgariaCyprus
Czech RepublicDenmark
EstoniaFinlandFrance
GermanyHungaryIcelandIreland
ItalyLatvia
LithuaniaLuxembourgNetherlands
NorwayPoland
PortugalSlovakiaSlovenia
SpainSweden
United Kingdom
2010 2011 2012 2013
Fluoroquinolones mg/PCU
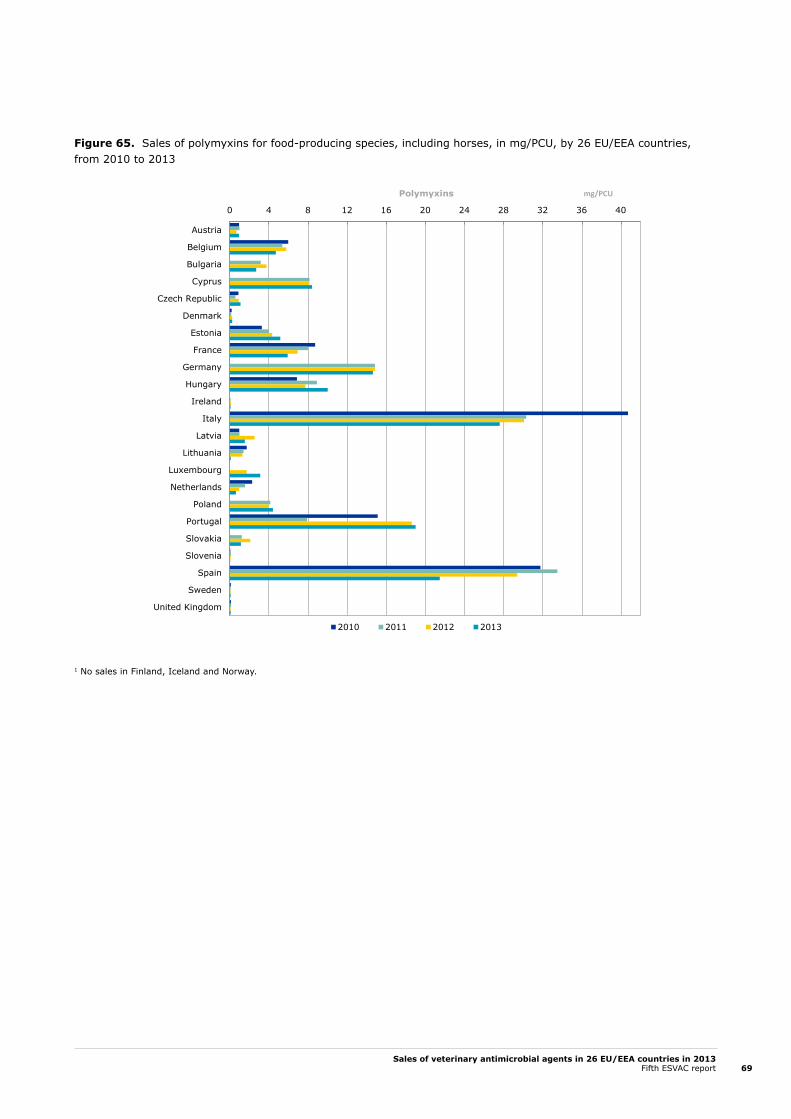
Sales of veterinary antimicrobial agents in 26 EU/EEA countries in 2013Fifth ESVAC report 69
Figure 65. Sales of polymyxins for food-producing species, including horses, in mg/PCU, by 26 EU/EEA countries, from 2010 to 2013
1 No sales in Finland, Iceland and Norway.
0 4 8 12 16 20 24 28 32 36 40
Austria
Belgium
Bulgaria
Cyprus
Czech Republic
Denmark
Estonia
France
Germany
Hungary
Ireland
Italy
Latvia
Lithuania
Luxembourg
Netherlands
Poland
Portugal
Slovakia
Slovenia
Spain
Sweden
United Kingdom
2010 2011 2012 2013
Polymyxins mg/PCU
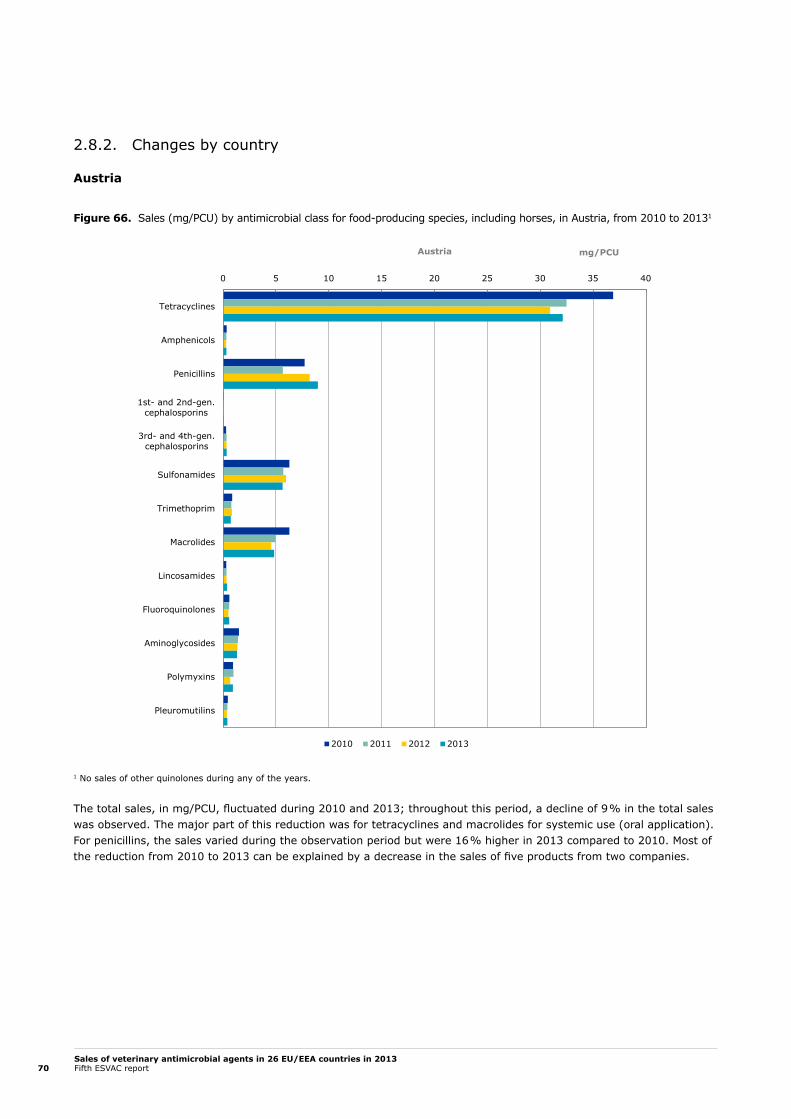
Sales of veterinary antimicrobial agents in 26 EU/EEA countries in 2013Fifth ESVAC report70
2.8.2. Changes by country
Austria
Figure 66. Sales (mg/PCU) by antimicrobial class for food-producing species, including horses, in Austria, from 2010 to 20131
1 No sales of other quinolones during any of the years.
The total sales, in mg/PCU, fluctuated during 2010 and 2013; throughout this period, a decline of 9 % in the total sales was observed. The major part of this reduction was for tetracyclines and macrolides for systemic use (oral application). For penicillins, the sales varied during the observation period but were 16 % higher in 2013 compared to 2010. Most of the reduction from 2010 to 2013 can be explained by a decrease in the sales of five products from two companies.
0 5 10 15 20 25 30 35 40
Tetracyclines
Amphenicols
Penicillins
1st- and 2nd-gen.cephalosporins
3rd- and 4th-gen.cephalosporins
Sulfonamides
Trimethoprim
Macrolides
Lincosamides
Fluoroquinolones
Aminoglycosides
Polymyxins
Pleuromutilins
2010 2011 2012 2013
Austria mg/PCU
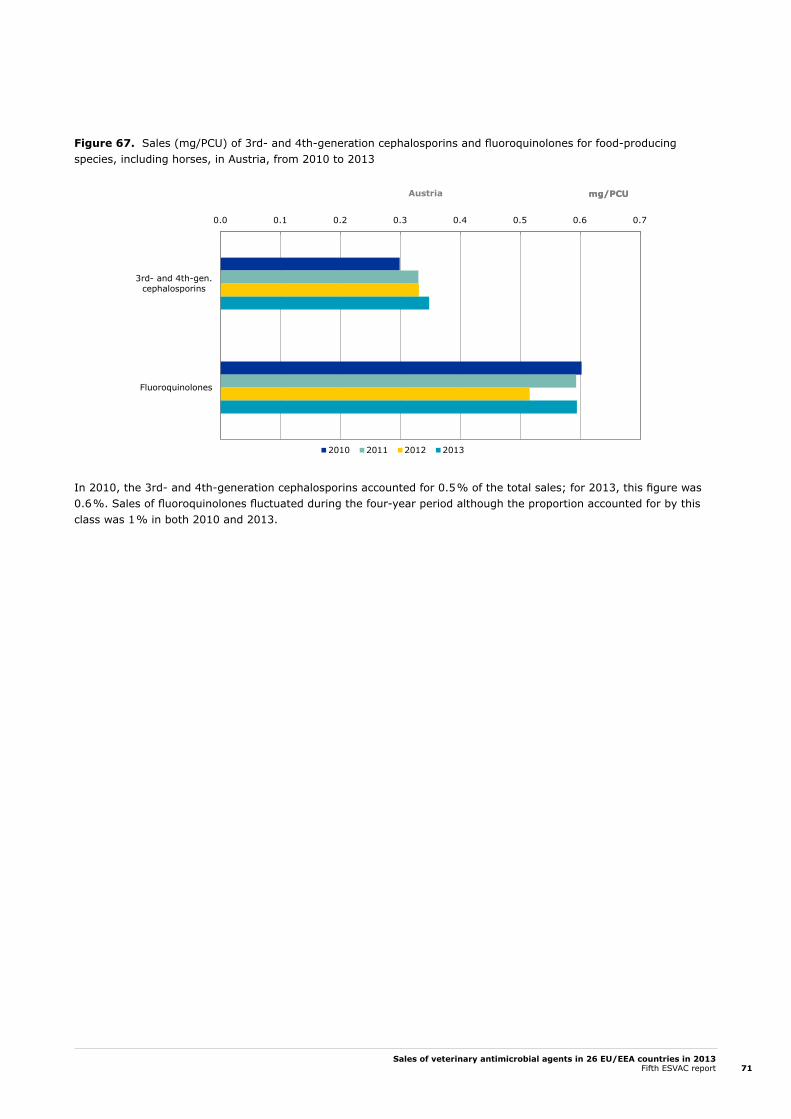
Sales of veterinary antimicrobial agents in 26 EU/EEA countries in 2013Fifth ESVAC report 71
Figure 67. Sales (mg/PCU) of 3rd- and 4th-generation cephalosporins and fluoroquinolones for food-producing species, including horses, in Austria, from 2010 to 2013
In 2010, the 3rd- and 4th-generation cephalosporins accounted for 0.5 % of the total sales; for 2013, this figure was 0.6 %. Sales of fluoroquinolones fluctuated during the four-year period although the proportion accounted for by this class was 1 % in both 2010 and 2013.
0.0 0.1 0.2 0.3 0.4 0.5 0.6 0.7
3rd- and 4th-gen.cephalosporins
Fluoroquinolones
2010 2011 2012 2013
Austria mg/PCUmg/PCU
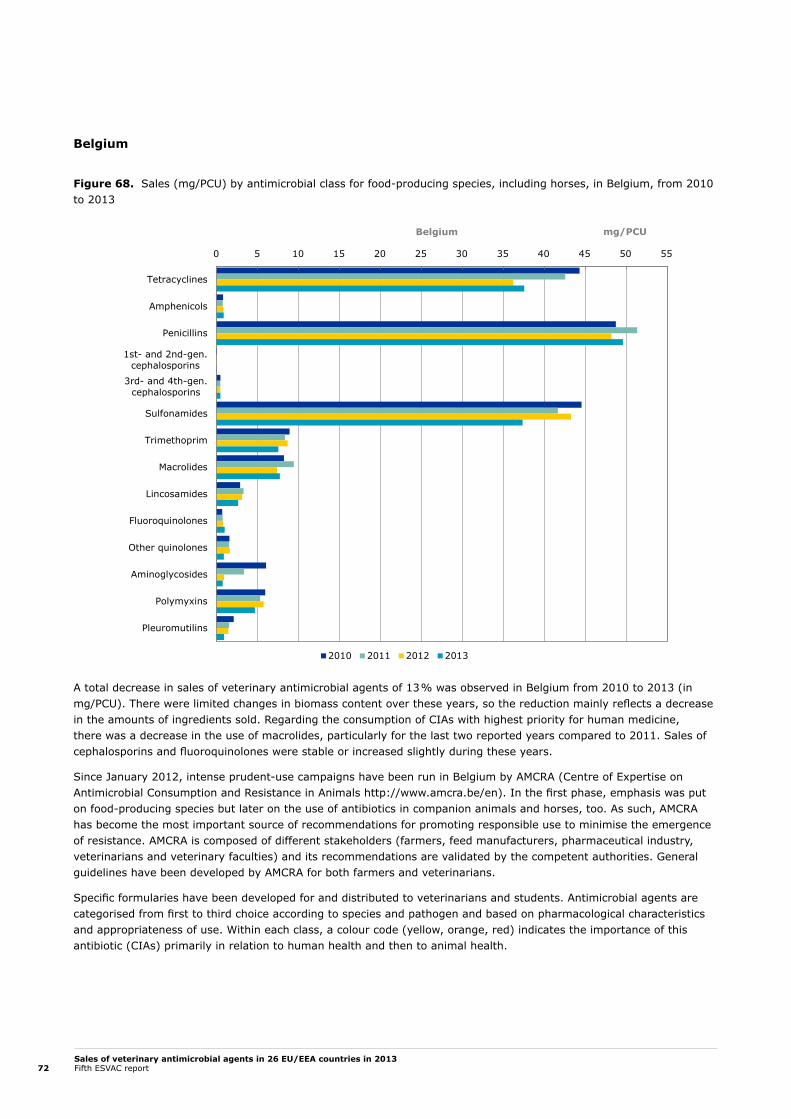
Sales of veterinary antimicrobial agents in 26 EU/EEA countries in 2013Fifth ESVAC report72
Belgium
Figure 68. Sales (mg/PCU) by antimicrobial class for food-producing species, including horses, in Belgium, from 2010 to 2013
A total decrease in sales of veterinary antimicrobial agents of 13 % was observed in Belgium from 2010 to 2013 (in mg/PCU). There were limited changes in biomass content over these years, so the reduction mainly reflects a decrease in the amounts of ingredients sold. Regarding the consumption of CIAs with highest priority for human medicine, there was a decrease in the use of macrolides, particularly for the last two reported years compared to 2011. Sales of cephalosporins and fluoroquinolones were stable or increased slightly during these years.
Since January 2012, intense prudent-use campaigns have been run in Belgium by AMCRA (Centre of Expertise on Antimicrobial Consumption and Resistance in Animals http://www.amcra.be/en). In the first phase, emphasis was put on food-producing species but later on the use of antibiotics in companion animals and horses, too. As such, AMCRA has become the most important source of recommendations for promoting responsible use to minimise the emergence of resistance. AMCRA is composed of different stakeholders (farmers, feed manufacturers, pharmaceutical industry, veterinarians and veterinary faculties) and its recommendations are validated by the competent authorities. General guidelines have been developed by AMCRA for both farmers and veterinarians.
Specific formularies have been developed for and distributed to veterinarians and students. Antimicrobial agents are categorised from first to third choice according to species and pathogen and based on pharmacological characteristics and appropriateness of use. Within each class, a colour code (yellow, orange, red) indicates the importance of this antibiotic (CIAs) primarily in relation to human health and then to animal health.
0 5 10 15 20 25 30 35 40 45 50 55
Tetracyclines
Amphenicols
Penicillins
1st- and 2nd-gen.cephalosporins
3rd- and 4th-gen.cephalosporins
Sulfonamides
Trimethoprim
Macrolides
Lincosamides
Fluoroquinolones
Other quinolones
Aminoglycosides
Polymyxins
Pleuromutilins
2010 2011 2012 2013
Belgium mg/PCU

Sales of veterinary antimicrobial agents in 26 EU/EEA countries in 2013Fifth ESVAC report 73
Formularies have been published for pigs, poultry, bovines, companion animals and horses, and are used on a voluntary basis (http://www.amcra.be/nl/formularia/formularia).
AMCRA’s prudent-use campaigns and the continuing political and media attention on the risks related to resistance emergence are thought to have contributed to the decrease in sales of veterinary antimicrobials from 2011 to 2013, at 6.8 % and 3.7 % (in mg/PCU), respectively.
Sensitisation and awareness campaigns on antibiotic use and resistance are also strongly based on the annual national monitoring programme ‘BelVet-SAC’. The Federal Agency for Medicines and Health Products (FAMHP) collaborates with the Faculty of Veterinary Medicine in Ghent to collect and analyse these data (http://www.belvetsac.ugent.be/pages/home/BelvetSAC_report_2013 %20finaal.pdf).
Figure 69. Sales (mg/PCU) of 3rd- and 4th-generation cephalosporins and fluoroquinolones for food-producing species, including horses, in Belgium, from 2010 to 2013
Sales of cephalosporins and fluoroquinolones ranged from stable to a slight increase during these years.
In 2010, the 3rd- and 4th-generation cephalosporins accounted for 0.05 % of the total sales; for 2013, this figure was 0.04 %. The corresponding figures for fluoroquinolones were 0.4 % and 0.7 %, respectively.
0.0 0.1 0.2 0.3 0.4 0.5 0.6 0.7 0.8 0.9 1.0 1.1
3rd- and 4th-gen.cephalosporins
Fluoroquinolones
2010 2011 2012 2013
Belgium mg/PCUmg/PCU
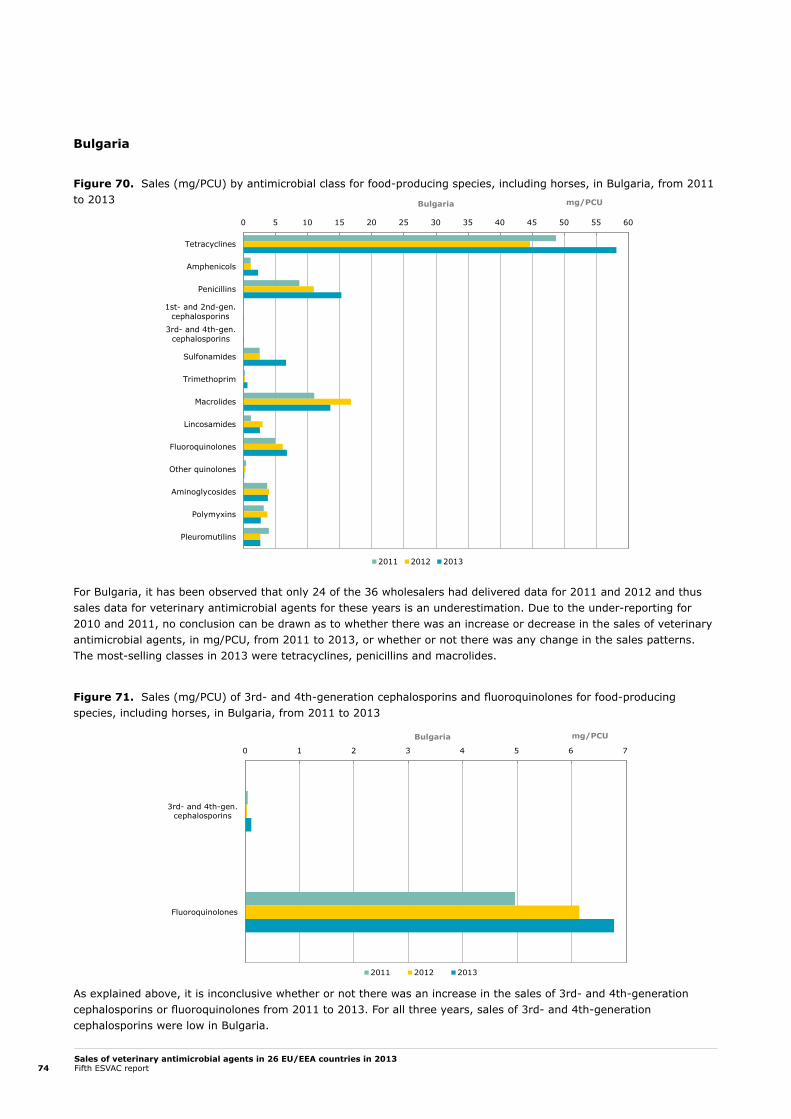
Sales of veterinary antimicrobial agents in 26 EU/EEA countries in 2013Fifth ESVAC report74
Bulgaria
Figure 70. Sales (mg/PCU) by antimicrobial class for food-producing species, including horses, in Bulgaria, from 2011 to 2013
For Bulgaria, it has been observed that only 24 of the 36 wholesalers had delivered data for 2011 and 2012 and thus sales data for veterinary antimicrobial agents for these years is an underestimation. Due to the under-reporting for 2010 and 2011, no conclusion can be drawn as to whether there was an increase or decrease in the sales of veterinary antimicrobial agents, in mg/PCU, from 2011 to 2013, or whether or not there was any change in the sales patterns. The most-selling classes in 2013 were tetracyclines, penicillins and macrolides.
Figure 71. Sales (mg/PCU) of 3rd- and 4th-generation cephalosporins and fluoroquinolones for food-producing species, including horses, in Bulgaria, from 2011 to 2013
As explained above, it is inconclusive whether or not there was an increase in the sales of 3rd- and 4th-generation cephalosporins or fluoroquinolones from 2011 to 2013. For all three years, sales of 3rd- and 4th-generation cephalosporins were low in Bulgaria.
0 5 10 15 20 25 30 35 40 45 50 55 60
Tetracyclines
Amphenicols
Penicillins
1st- and 2nd-gen.cephalosporins
3rd- and 4th-gen.cephalosporins
Sulfonamides
Trimethoprim
Macrolides
Lincosamides
Fluoroquinolones
Other quinolones
Aminoglycosides
Polymyxins
Pleuromutilins
2011 2012 2013
Bulgaria mg/PCU
0 1 2 3 4 5 6 7
3rd- and 4th-gen.cephalosporins
Fluoroquinolones
2011 2012 2013
Bulgaria mg/PCU
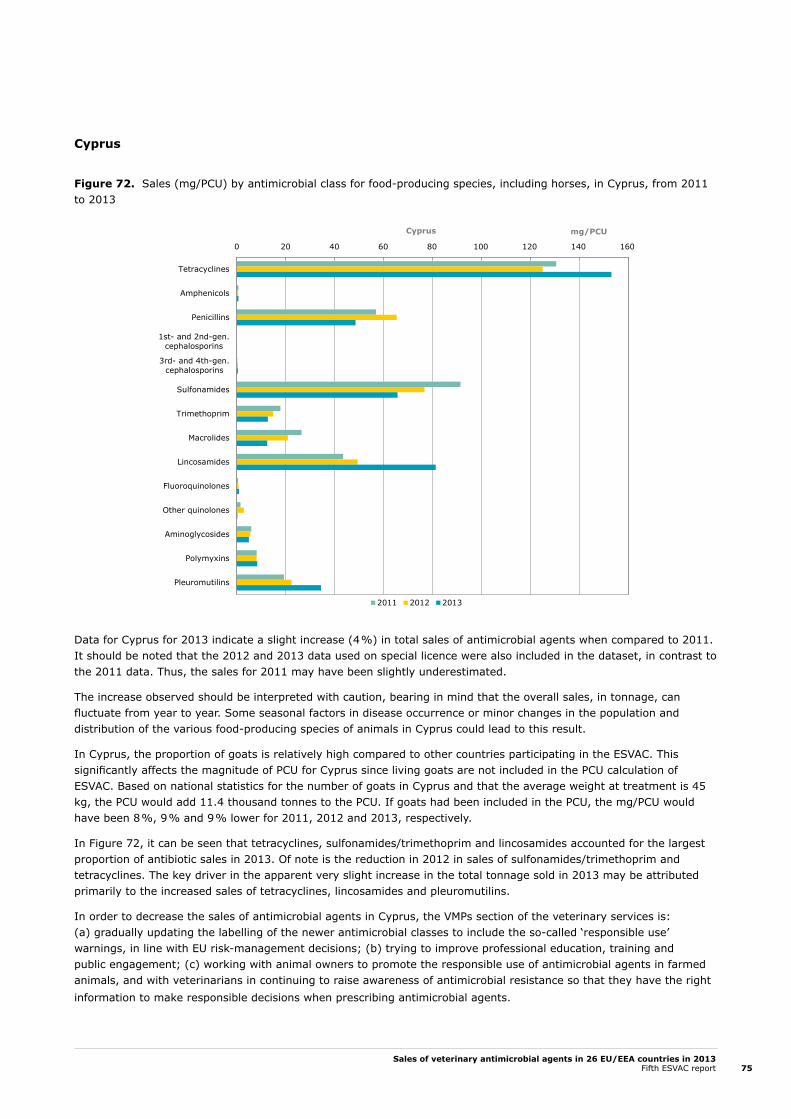
Sales of veterinary antimicrobial agents in 26 EU/EEA countries in 2013Fifth ESVAC report 75
Cyprus
Figure 72. Sales (mg/PCU) by antimicrobial class for food-producing species, including horses, in Cyprus, from 2011 to 2013
Data for Cyprus for 2013 indicate a slight increase (4 %) in total sales of antimicrobial agents when compared to 2011. It should be noted that the 2012 and 2013 data used on special licence were also included in the dataset, in contrast to the 2011 data. Thus, the sales for 2011 may have been slightly underestimated.
The increase observed should be interpreted with caution, bearing in mind that the overall sales, in tonnage, can fluctuate from year to year. Some seasonal factors in disease occurrence or minor changes in the population and distribution of the various food-producing species of animals in Cyprus could lead to this result.
In Cyprus, the proportion of goats is relatively high compared to other countries participating in the ESVAC. This significantly affects the magnitude of PCU for Cyprus since living goats are not included in the PCU calculation of ESVAC. Based on national statistics for the number of goats in Cyprus and that the average weight at treatment is 45 kg, the PCU would add 11.4 thousand tonnes to the PCU. If goats had been included in the PCU, the mg/PCU would have been 8 %, 9 % and 9 % lower for 2011, 2012 and 2013, respectively.
In Figure 72, it can be seen that tetracyclines, sulfonamides/trimethoprim and lincosamides accounted for the largest proportion of antibiotic sales in 2013. Of note is the reduction in 2012 in sales of sulfonamides/trimethoprim and tetracyclines. The key driver in the apparent very slight increase in the total tonnage sold in 2013 may be attributed primarily to the increased sales of tetracyclines, lincosamides and pleuromutilins.
In order to decrease the sales of antimicrobial agents in Cyprus, the VMPs section of the veterinary services is: (a) gradually updating the labelling of the newer antimicrobial classes to include the so-called ‘responsible use’ warnings, in line with EU risk-management decisions; (b) trying to improve professional education, training and public engagement; (c) working with animal owners to promote the responsible use of antimicrobial agents in farmed animals, and with veterinarians in continuing to raise awareness of antimicrobial resistance so that they have the right information to make responsible decisions when prescribing antimicrobial agents.
0 20 40 60 80 100 120 140 160
Tetracyclines
Amphenicols
Penicillins
1st- and 2nd-gen.cephalosporins
3rd- and 4th-gen.cephalosporins
Sulfonamides
Trimethoprim
Macrolides
Lincosamides
Fluoroquinolones
Other quinolones
Aminoglycosides
Polymyxins
Pleuromutilins
2011 2012 2013
Cyprus mg/PCU
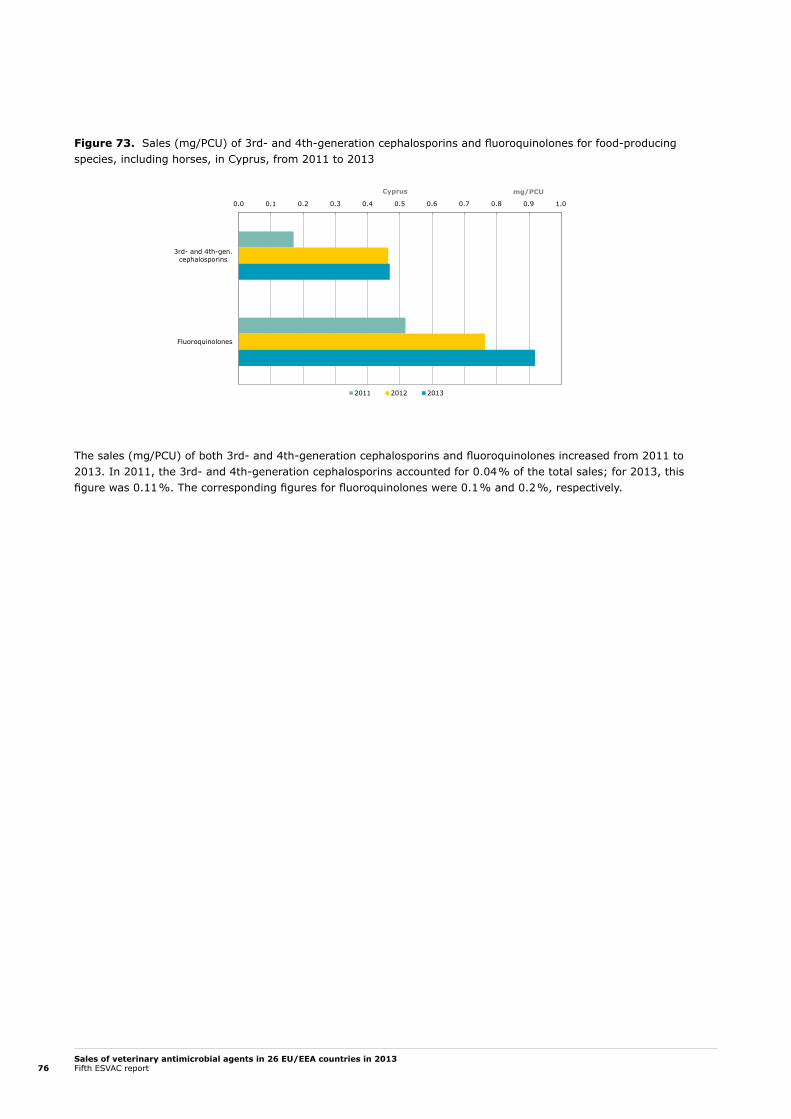
Sales of veterinary antimicrobial agents in 26 EU/EEA countries in 2013Fifth ESVAC report76
Figure 73. Sales (mg/PCU) of 3rd- and 4th-generation cephalosporins and fluoroquinolones for food-producing species, including horses, in Cyprus, from 2011 to 2013
The sales (mg/PCU) of both 3rd- and 4th-generation cephalosporins and fluoroquinolones increased from 2011 to 2013. In 2011, the 3rd- and 4th-generation cephalosporins accounted for 0.04 % of the total sales; for 2013, this figure was 0.11 %. The corresponding figures for fluoroquinolones were 0.1 % and 0.2 %, respectively.
0.0 0.1 0.2 0.3 0.4 0.5 0.6 0.7 0.8 0.9 1.0
3rd- and 4th-gen.cephalosporins
Fluoroquinolones
2011 2012 2013
Cyprus mg/PCU
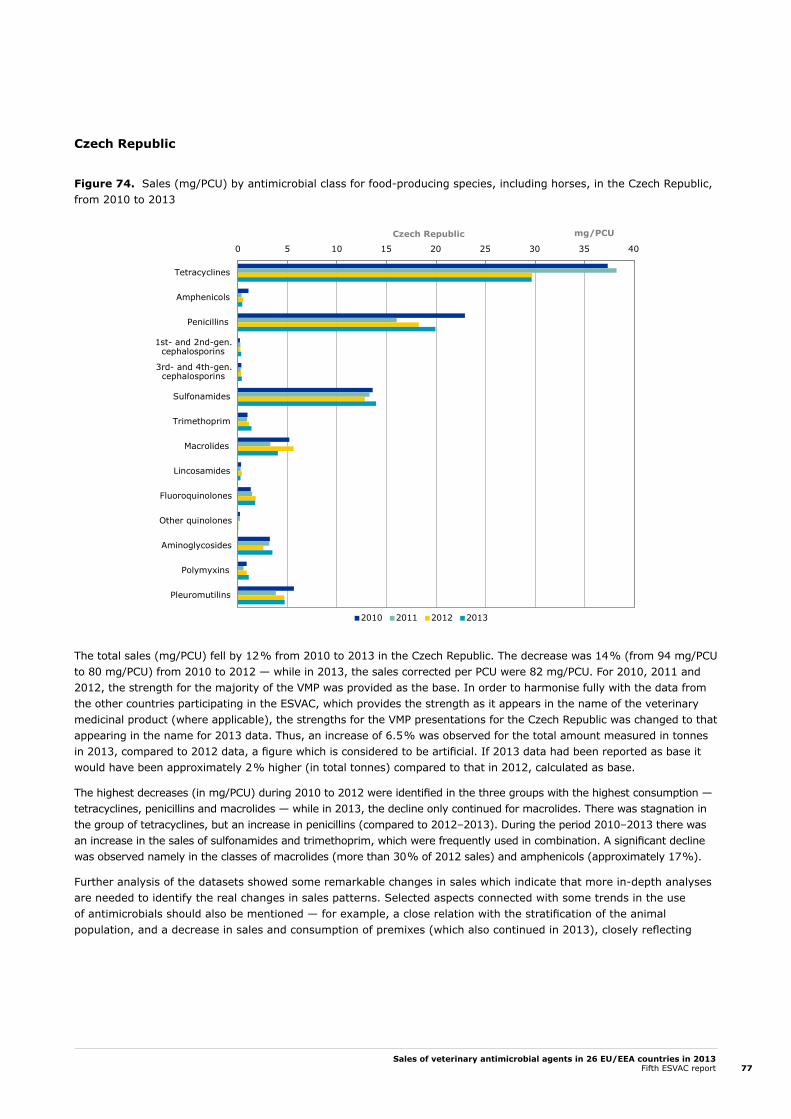
Sales of veterinary antimicrobial agents in 26 EU/EEA countries in 2013Fifth ESVAC report 77
Czech Republic
Figure 74. Sales (mg/PCU) by antimicrobial class for food-producing species, including horses, in the Czech Republic, from 2010 to 2013
The total sales (mg/PCU) fell by 12 % from 2010 to 2013 in the Czech Republic. The decrease was 14 % (from 94 mg/PCU to 80 mg/PCU) from 2010 to 2012 — while in 2013, the sales corrected per PCU were 82 mg/PCU. For 2010, 2011 and 2012, the strength for the majority of the VMP was provided as the base. In order to harmonise fully with the data from the other countries participating in the ESVAC, which provides the strength as it appears in the name of the veterinary medicinal product (where applicable), the strengths for the VMP presentations for the Czech Republic was changed to that appearing in the name for 2013 data. Thus, an increase of 6.5 % was observed for the total amount measured in tonnes in 2013, compared to 2012 data, a figure which is considered to be artificial. If 2013 data had been reported as base it would have been approximately 2 % higher (in total tonnes) compared to that in 2012, calculated as base.
The highest decreases (in mg/PCU) during 2010 to 2012 were identified in the three groups with the highest consumption — tetracyclines, penicillins and macrolides — while in 2013, the decline only continued for macrolides. There was stagnation in the group of tetracyclines, but an increase in penicillins (compared to 2012–2013). During the period 2010–2013 there was an increase in the sales of sulfonamides and trimethoprim, which were frequently used in combination. A significant decline was observed namely in the classes of macrolides (more than 30 % of 2012 sales) and amphenicols (approximately 17 %).
Further analysis of the datasets showed some remarkable changes in sales which indicate that more in-depth analyses are needed to identify the real changes in sales patterns. Selected aspects connected with some trends in the use of antimicrobials should also be mentioned — for example, a close relation with the stratification of the animal population, and a decrease in sales and consumption of premixes (which also continued in 2013), closely reflecting
0 5 10 15 20 25 30 35 40
Tetracyclines
Amphenicols
Penicillins
1st- and 2nd-gen.cephalosporins
3rd- and 4th-gen.cephalosporins
Sulfonamides
Trimethoprim
Macrolides
Lincosamides
Fluoroquinolones
Other quinolones
Aminoglycosides
Polymyxins
Pleuromutilins
2010 2011 2012 2013
Czech Republic mg/PCU
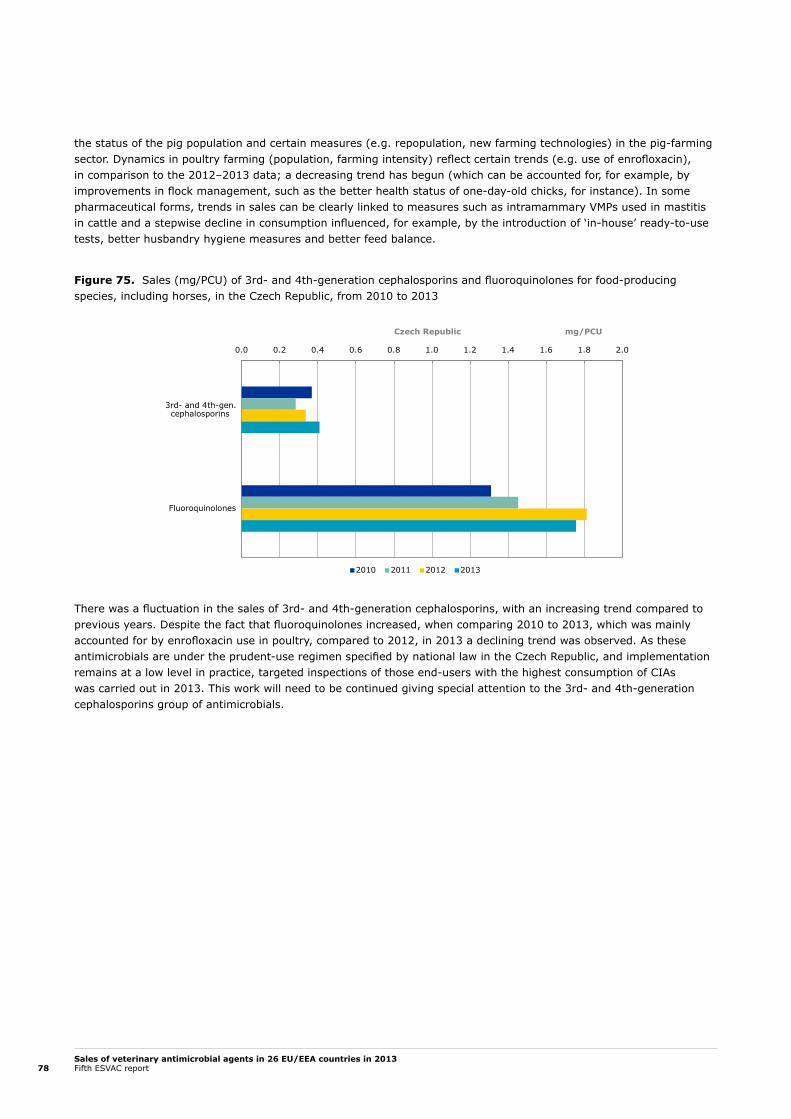
Sales of veterinary antimicrobial agents in 26 EU/EEA countries in 2013Fifth ESVAC report78
the status of the pig population and certain measures (e.g. repopulation, new farming technologies) in the pig-farming sector. Dynamics in poultry farming (population, farming intensity) reflect certain trends (e.g. use of enrofloxacin), in comparison to the 2012–2013 data; a decreasing trend has begun (which can be accounted for, for example, by improvements in flock management, such as the better health status of one-day-old chicks, for instance). In some pharmaceutical forms, trends in sales can be clearly linked to measures such as intramammary VMPs used in mastitis in cattle and a stepwise decline in consumption influenced, for example, by the introduction of ‘in-house’ ready-to-use tests, better husbandry hygiene measures and better feed balance.
Figure 75. Sales (mg/PCU) of 3rd- and 4th-generation cephalosporins and fluoroquinolones for food-producing species, including horses, in the Czech Republic, from 2010 to 2013
There was a fluctuation in the sales of 3rd- and 4th-generation cephalosporins, with an increasing trend compared to previous years. Despite the fact that fluoroquinolones increased, when comparing 2010 to 2013, which was mainly accounted for by enrofloxacin use in poultry, compared to 2012, in 2013 a declining trend was observed. As these antimicrobials are under the prudent-use regimen specified by national law in the Czech Republic, and implementation remains at a low level in practice, targeted inspections of those end-users with the highest consumption of CIAs was carried out in 2013. This work will need to be continued giving special attention to the 3rd- and 4th-generation cephalosporins group of antimicrobials.
0.0 0.2 0.4 0.6 0.8 1.0 1.2 1.4 1.6 1.8 2.0
3rd- and 4th-gen.cephalosporins
Fluoroquinolones
2010 2011 2012 2013
Czech Republic mg/PCU
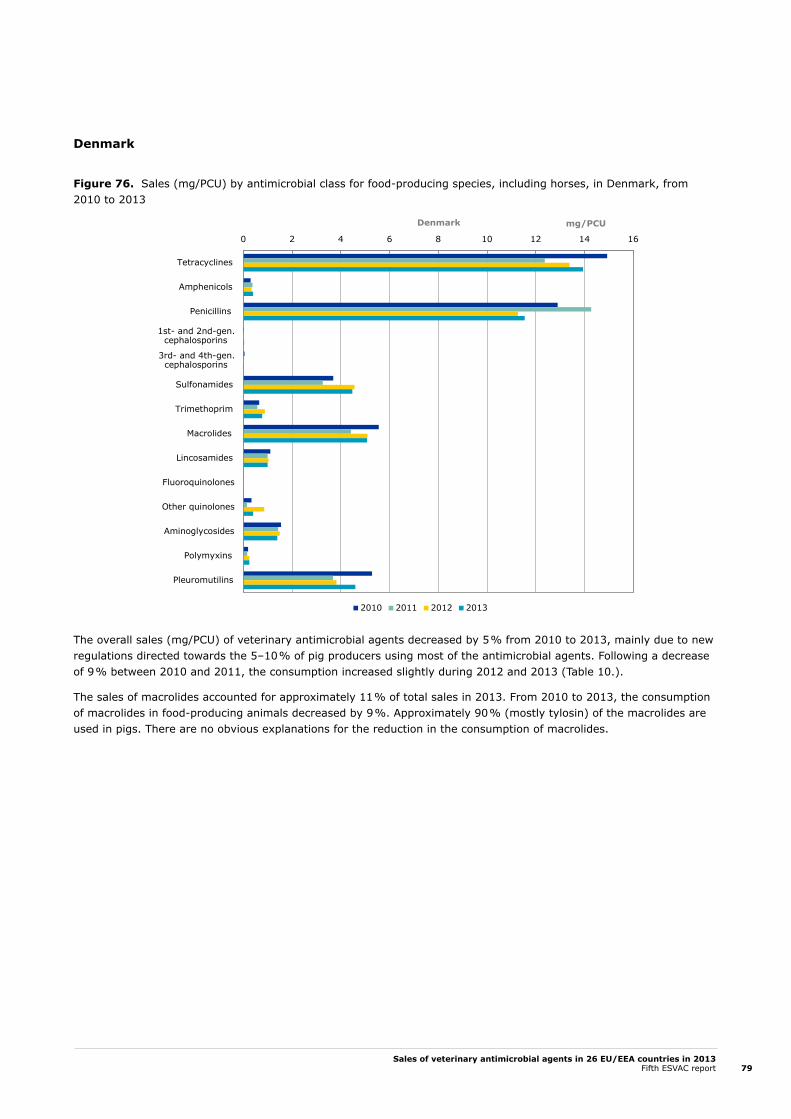
Sales of veterinary antimicrobial agents in 26 EU/EEA countries in 2013Fifth ESVAC report 79
Denmark
Figure 76. Sales (mg/PCU) by antimicrobial class for food-producing species, including horses, in Denmark, from 2010 to 2013
The overall sales (mg/PCU) of veterinary antimicrobial agents decreased by 5 % from 2010 to 2013, mainly due to new regulations directed towards the 5–10 % of pig producers using most of the antimicrobial agents. Following a decrease of 9 % between 2010 and 2011, the consumption increased slightly during 2012 and 2013 (Table 10.).
The sales of macrolides accounted for approximately 11 % of total sales in 2013. From 2010 to 2013, the consumption of macrolides in food-producing animals decreased by 9 %. Approximately 90 % (mostly tylosin) of the macrolides are used in pigs. There are no obvious explanations for the reduction in the consumption of macrolides.
0 2 4 6 8 10 12 14 16
Tetracyclines
Amphenicols
Penicillins
1st- and 2nd-gen.cephalosporins
3rd- and 4th-gen.cephalosporins
Sulfonamides
Trimethoprim
Macrolides
Lincosamides
Fluoroquinolones
Other quinolones
Aminoglycosides
Polymyxins
Pleuromutilins
2010 2011 2012 2013
Denmark mg/PCU
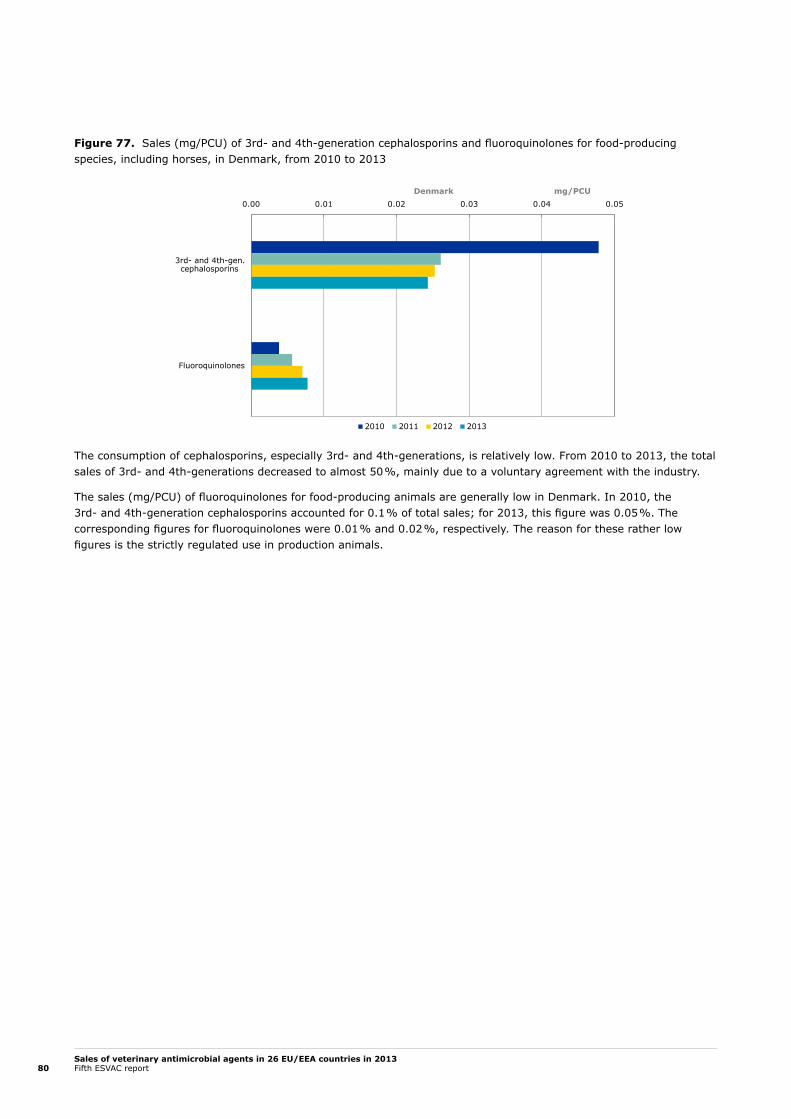
Sales of veterinary antimicrobial agents in 26 EU/EEA countries in 2013Fifth ESVAC report80
Figure 77. Sales (mg/PCU) of 3rd- and 4th-generation cephalosporins and fluoroquinolones for food-producing species, including horses, in Denmark, from 2010 to 2013
The consumption of cephalosporins, especially 3rd- and 4th-generations, is relatively low. From 2010 to 2013, the total sales of 3rd- and 4th-generations decreased to almost 50 %, mainly due to a voluntary agreement with the industry.
The sales (mg/PCU) of fluoroquinolones for food-producing animals are generally low in Denmark. In 2010, the 3rd- and 4th-generation cephalosporins accounted for 0.1 % of total sales; for 2013, this figure was 0.05 %. The corresponding figures for fluoroquinolones were 0.01 % and 0.02 %, respectively. The reason for these rather low figures is the strictly regulated use in production animals.
0.00 0.01 0.02 0.03 0.04 0.05
3rd- and 4th-gen.cephalosporins
Fluoroquinolones
2010 2011 2012 2013
Denmark mg/PCU
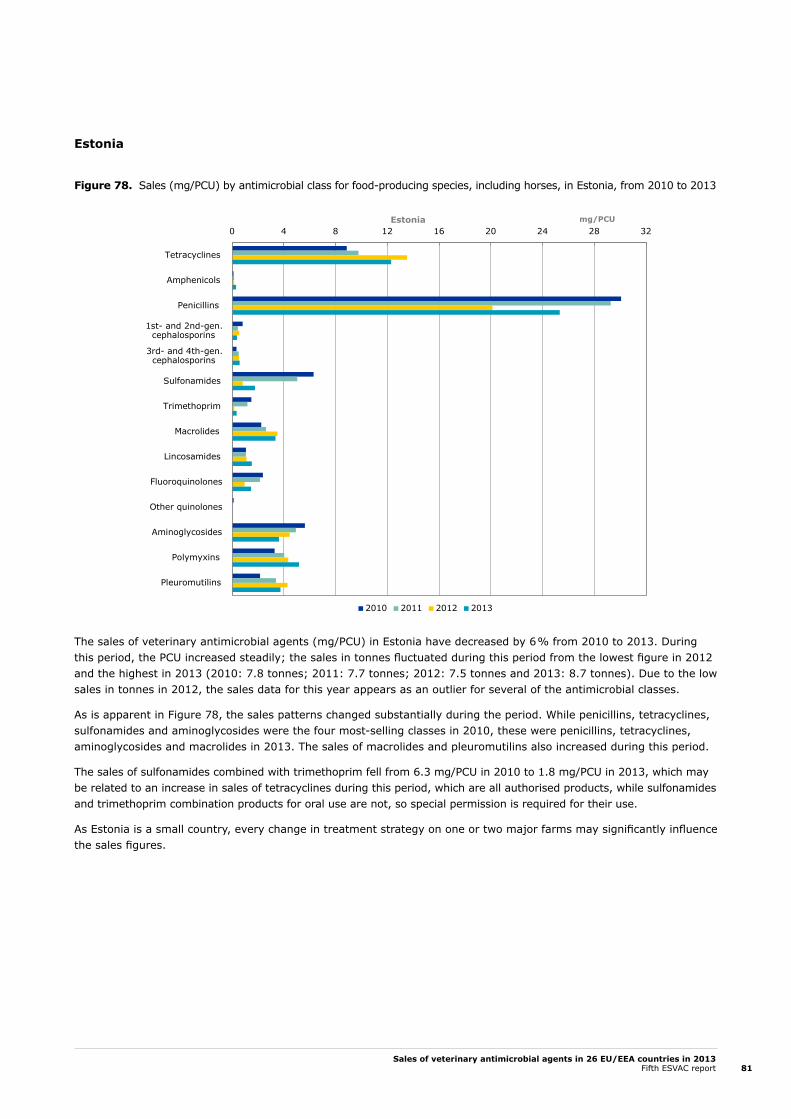
Sales of veterinary antimicrobial agents in 26 EU/EEA countries in 2013Fifth ESVAC report 81
Estonia
Figure 78. Sales (mg/PCU) by antimicrobial class for food-producing species, including horses, in Estonia, from 2010 to 2013
The sales of veterinary antimicrobial agents (mg/PCU) in Estonia have decreased by 6 % from 2010 to 2013. During this period, the PCU increased steadily; the sales in tonnes fluctuated during this period from the lowest figure in 2012 and the highest in 2013 (2010: 7.8 tonnes; 2011: 7.7 tonnes; 2012: 7.5 tonnes and 2013: 8.7 tonnes). Due to the low sales in tonnes in 2012, the sales data for this year appears as an outlier for several of the antimicrobial classes.
As is apparent in Figure 78, the sales patterns changed substantially during the period. While penicillins, tetracyclines, sulfonamides and aminoglycosides were the four most-selling classes in 2010, these were penicillins, tetracyclines, aminoglycosides and macrolides in 2013. The sales of macrolides and pleuromutilins also increased during this period.
The sales of sulfonamides combined with trimethoprim fell from 6.3 mg/PCU in 2010 to 1.8 mg/PCU in 2013, which may be related to an increase in sales of tetracyclines during this period, which are all authorised products, while sulfonamides and trimethoprim combination products for oral use are not, so special permission is required for their use.
As Estonia is a small country, every change in treatment strategy on one or two major farms may significantly influence the sales figures.
0 4 8 12 16 20 24 28 32
Tetracyclines
Amphenicols
Penicillins
1st- and 2nd-gen.cephalosporins
3rd- and 4th-gen.cephalosporins
Sulfonamides
Trimethoprim
Macrolides
Lincosamides
Fluoroquinolones
Other quinolones
Aminoglycosides
Polymyxins
Pleuromutilins
2010 2011 2012 2013
Estonia mg/PCU
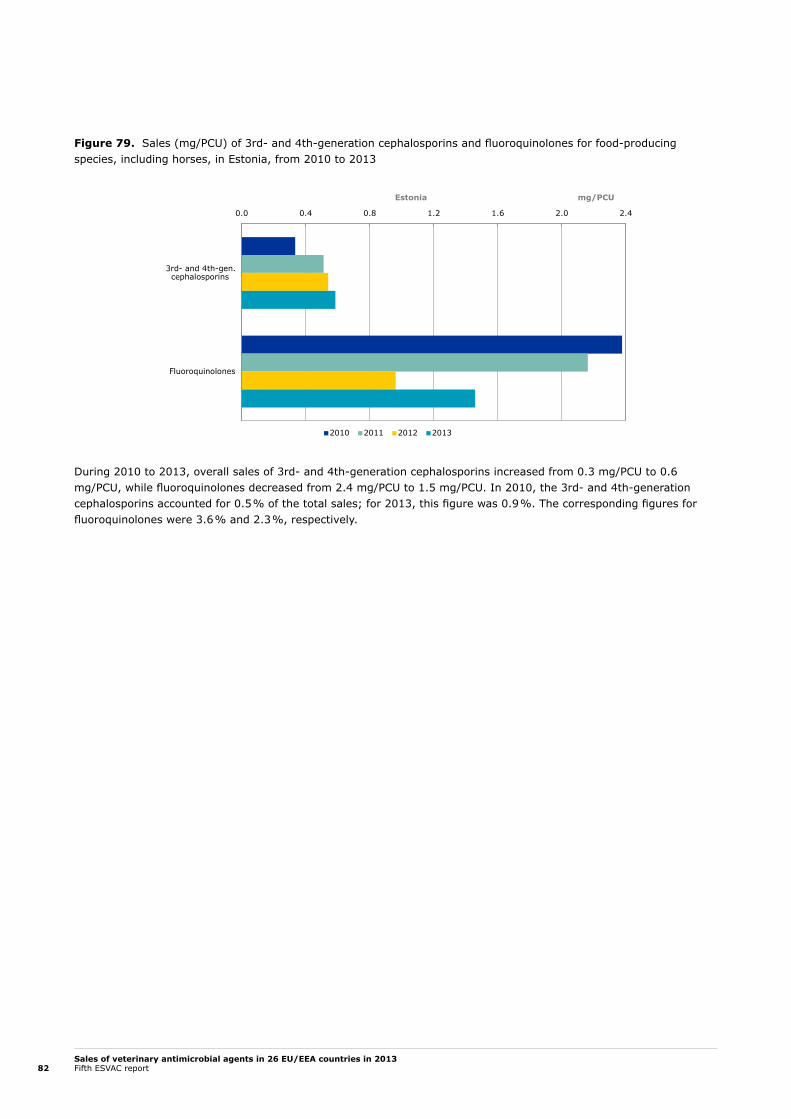
Sales of veterinary antimicrobial agents in 26 EU/EEA countries in 2013Fifth ESVAC report82
Figure 79. Sales (mg/PCU) of 3rd- and 4th-generation cephalosporins and fluoroquinolones for food-producing species, including horses, in Estonia, from 2010 to 2013
During 2010 to 2013, overall sales of 3rd- and 4th-generation cephalosporins increased from 0.3 mg/PCU to 0.6 mg/PCU, while fluoroquinolones decreased from 2.4 mg/PCU to 1.5 mg/PCU. In 2010, the 3rd- and 4th-generation cephalosporins accounted for 0.5 % of the total sales; for 2013, this figure was 0.9 %. The corresponding figures for fluoroquinolones were 3.6 % and 2.3 %, respectively.
0.0 0.4 0.8 1.2 1.6 2.0 2.4
3rd- and 4th-gen.cephalosporins
Fluoroquinolones
2010 2011 2012 2013
mg/PCUEstonia

Sales of veterinary antimicrobial agents in 26 EU/EEA countries in 2013Fifth ESVAC report 83
Finland
Figure 80. Sales (mg/PCU) by antimicrobial class for food-producing species, including horses, in Finland, from 2010 to 20131
1 No sales of other quinolones and polymyxins in any of the years.
From 2010 to 2013, the total in sales of antimicrobials for food-producing animals remained stable (25–24 mg/PCU). The proportion accounted for by the various antimicrobial classes also remained quite stable, despite notable changes in sales of the two major antimicrobial classes. Sales of penicillins decreased by 1.2 mg/PCU from 2010 to 2013 (corresponding to -9 %) and sales of tetracyclines increased by 1.3 mg/PCU from 2012 to 2013 (corresponding to +35 %). No explanation for the changes has yet been identified. It is known that relatively large fluctuations between years are possible for tetracyclines, thus a follow-up is essential.
Penicillins were the most sold antimicrobials for food-producing species (49 % of total sales in 2013) followed by sulfonamides (20 %) and tetracyclines (19 %). In 2013, the proportion of beta-lactamase-sensitive penicillins was over 90 % of the sales of all penicillins (Figure 13.) and 95 % of penicillins sold were injectables (Figure 27.).
The total population of production animals (measured as PCU) remained stable although there were notable changes for some species. A significant fall in the number of sows (-17 %) was observed from 2010 to 2013. However, the decline in the number of slaughtered pigs was only 5 % during the same period. The number of slaughtered broilers has increased by 16 % since 2010.
0 2 4 6 8 10 12 14
Tetracyclines
Amphenicols
Penicillins
1st- and 2nd-gen.cephalosporins
3rd- and 4th-gen.cephalosporins
Sulfonamides
Trimethoprim
Macrolides
Lincosamides
Fluoroquinolones
Aminoglycosides
Pleuromutilins
2010 2011 2012 2013
Finland mg/PCU

Sales of veterinary antimicrobial agents in 26 EU/EEA countries in 2013Fifth ESVAC report84
Figure 81. Sales (mg/PCU) of 3rd- and 4th-generation cephalosporins and fluoroquinolones for food-producing species, including horses, in Finland, from 2010 to 2013
Sales of 3rd- and 4th-generation cephalosporins and fluoroquinolones were low. For both classes, sales were lowest in 2010 and highest in 2012 (3rd- and 4th-generation cephalosporins 0.009–0.029 mg/PCU, fluoroquinolones 0.151–0.164 mg/PCU). During the observation period, both classes were only available as injectable (for food-producing animals).
Since 2010, 3rd- and 4th-generation cephalosporins have been authorised for food-producing animals, and in the national legislation their use is restricted to the target species and indications approved in the summary of product characteristics (i.e. cascade use is not allowed). In 2012, supervision was targeted at products in this class and consequently their sales dropped significantly.
Prudent-use guidelines have been available in Finland since 1996 (updated in 2003 and 2009 http://www.evira.fi/portal/en/about+evira/publications/?a=view&productId=135&lang=fi) and they still apply. No new large-scale national campaigns to guide the use of antimicrobials in animals have been implemented during the observation period. Specific guidance on possible outbreaks is given, for example, by the Association for Animal Disease Prevention (e.g. Mycoplasma bovis, first isolated in Finland in 2011).
0.00 0.03 0.06 0.09 0.12 0.15 0.18
3rd- and 4th-gen.cephalosporins
Fluoroquinolones
2010 2011 2012 2013
Finland mg/PCU

Sales of veterinary antimicrobial agents in 26 EU/EEA countries in 2013Fifth ESVAC report 85
France
Figure 82. Sales (mg/PCU) by antimicrobial class for food-producing species, including horses, in France, from 2010 to 2013
In France, the total sales of antimicrobial agents, in mg/PCU, fell by 30 % from 2010 to 2013.
Reporting sales by ALEA, an indicator based on animal course dose which takes into account the differences in dosing between the various antimicrobials, forms and species, show that on average exposure fell by 16.3 % for all animal species for the period 2010-2013. The decrease was 27 % for rabbits, 21.7 % for pigs, 9.5 % for dogs, 13.7 % for poultry and 10.3 % for cattle.
The animal sectors where voluntary actions have been initiated show a greater fall in the consumption of antimicrobial agents.
The overall decrease in the sales of antimicrobial agents can be linked to the French national action plan, initiated in 2011, to reduce the risks of antimicrobial resistance in veterinary medicine. This plan includes a target for reducing the use of all antimicrobial agents by 25 % in five years. After two years, the decrease in use measured by the ALFA is 12.7 %.
Over the same period, the fall in sales is 21.5 % (2013 compared to 2011).
For the first time, the level of exposure to antimicrobials was lower than that observed in 1999 when the French survey was launched.
0 5 10 15 20 25 30 35 40 45 50 55 60 65
Tetracyclines
Amphenicols
Penicillins
1st- and 2nd-gen.cephalosporins
3rd- and 4th-gen.cephalosporins
Sulfonamides
Trimethoprim
Macrolides
Lincosamides
Fluoroquinolones
Other quinolones
Aminoglycosides
Polymyxins
Pleuromutilins
2010 2011 2012 2013
France mg/PCU
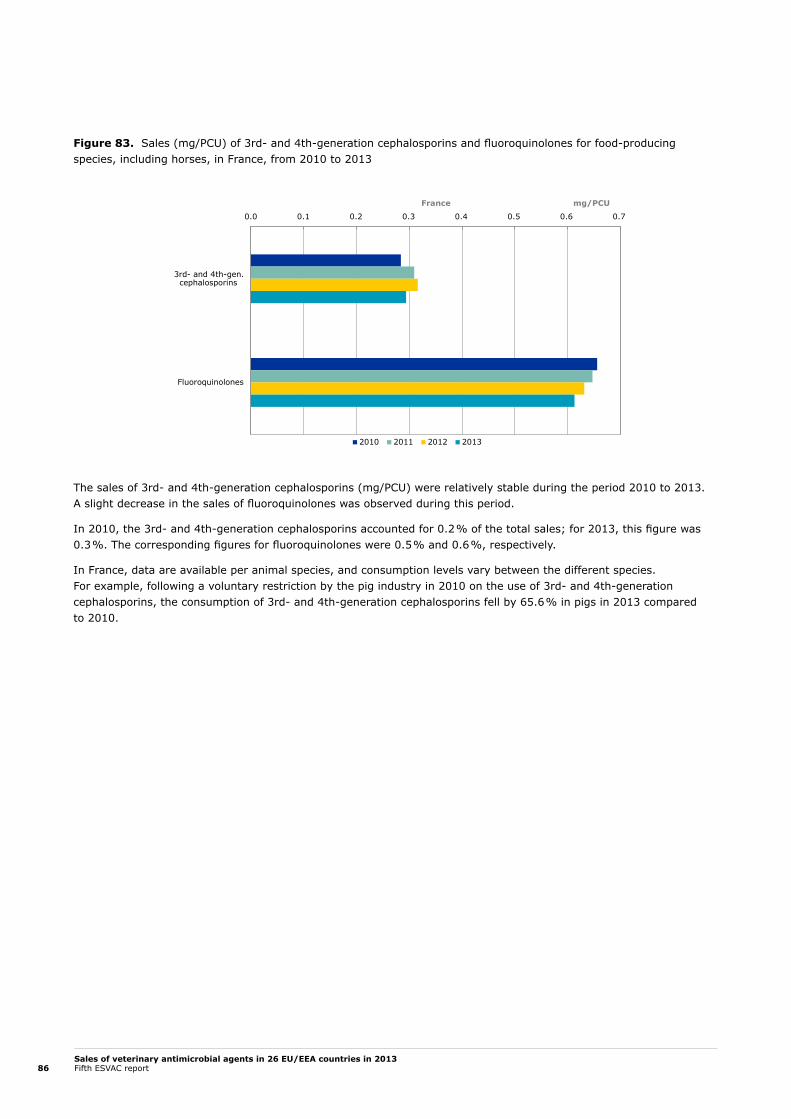
Sales of veterinary antimicrobial agents in 26 EU/EEA countries in 2013Fifth ESVAC report86
Figure 83. Sales (mg/PCU) of 3rd- and 4th-generation cephalosporins and fluoroquinolones for food-producing species, including horses, in France, from 2010 to 2013
The sales of 3rd- and 4th-generation cephalosporins (mg/PCU) were relatively stable during the period 2010 to 2013. A slight decrease in the sales of fluoroquinolones was observed during this period.
In 2010, the 3rd- and 4th-generation cephalosporins accounted for 0.2 % of the total sales; for 2013, this figure was 0.3 %. The corresponding figures for fluoroquinolones were 0.5 % and 0.6 %, respectively.
In France, data are available per animal species, and consumption levels vary between the different species. For example, following a voluntary restriction by the pig industry in 2010 on the use of 3rd- and 4th-generation cephalosporins, the consumption of 3rd- and 4th-generation cephalosporins fell by 65.6 % in pigs in 2013 compared to 2010.
0.0 0.1 0.2 0.3 0.4 0.5 0.6 0.7
3rd- and 4th-gen.cephalosporins
Fluoroquinolones
2010 2011 2012 2013
France mg/PCU
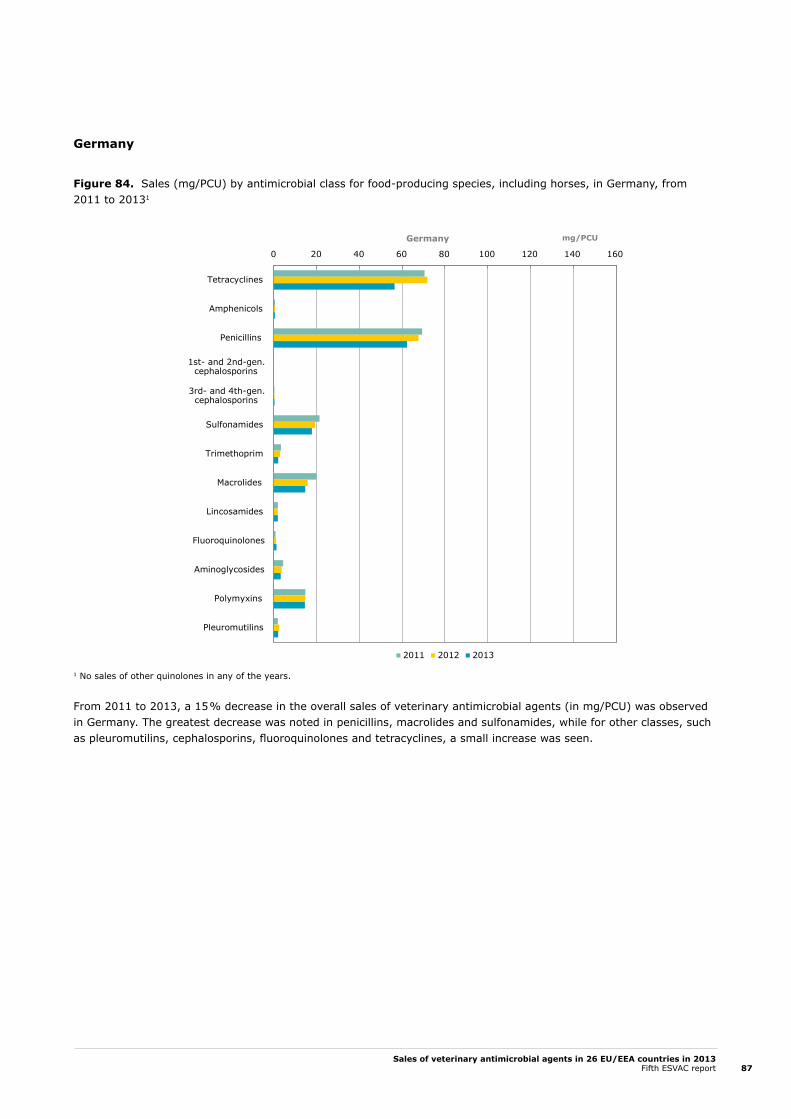
Sales of veterinary antimicrobial agents in 26 EU/EEA countries in 2013Fifth ESVAC report 87
Germany
Figure 84. Sales (mg/PCU) by antimicrobial class for food-producing species, including horses, in Germany, from 2011 to 20131
1 No sales of other quinolones in any of the years.
From 2011 to 2013, a 15 % decrease in the overall sales of veterinary antimicrobial agents (in mg/PCU) was observed in Germany. The greatest decrease was noted in penicillins, macrolides and sulfonamides, while for other classes, such as pleuromutilins, cephalosporins, fluoroquinolones and tetracyclines, a small increase was seen.
0 20 40 60 80 100 120 140 160
Tetracyclines
Amphenicols
Penicillins
1st- and 2nd-gen.cephalosporins
3rd- and 4th-gen.cephalosporins
Sulfonamides
Trimethoprim
Macrolides
Lincosamides
Fluoroquinolones
Aminoglycosides
Polymyxins
Pleuromutilins
2011 2012 2013
Germany mg/PCU

Sales of veterinary antimicrobial agents in 26 EU/EEA countries in 2013Fifth ESVAC report88
Figure 85. Sales (mg/PCU) of 3rd- and 4th-generation cephalosporins and fluoroquinolones for food-producing species, including horses, in Germany, from 2011 to 2013
The sales, in mg/PCU, of 3rd- and 4th-generation cephalosporins were stable during the period 2011 to 2013. For fluoroquinolones, sales rose by 34 % from 2011 to 2013, mainly due to an increase in sales of enrofloxacin. In 2011, the 3rd- and 4th-generation cephalosporins accounted for 0.19 % of the total sales; for 2013, this figure was 0.23 %. The corresponding figures for fluoroquinolones were 0.4 % and 0.8 %, respectively.
0.0 0.2 0.4 0.6 0.8 1.0 1.2 1.4
3rd- and 4th-gen.cephalosporins
Fluoroquinolones
2011 2012 2013
Germany mg/PCU

Sales of veterinary antimicrobial agents in 26 EU/EEA countries in 2013Fifth ESVAC report 89
Hungary
Figure 86. Sales (mg/PCU) by antimicrobial class for food-producing species, including horses, in Hungary, from 2010 to 2013
A 14 % decrease in sales, in mg/PCU, (Table 10.) was observed from 2010 to 2013, which was mainly accounted for by a decline in the sales of tetracyclines and penicillins.
Sales data for 2010 were based on import/purchase data collected from wholesalers, while 2011 to 2013 data represent sales from wholesalers to end-users. Since wholesalers may not sell all the veterinary antimicrobial products during the same year as they are imported, sales data for Hungary for 2010 cannot be directly compared with the 2011, 2012 and 2013 data. The figures should therefore be interpreted with great care.
There were no changes regarding methodology from 2011 to 2013. Animal production showed a minor decrease between 2010 and 2013 (computed PCU decreased by 1 %).
0 20 40 60 80 100 120 140 160
Tetracyclines
Amphenicols
Penicillins
1st- and 2nd-gen.cephalosporins
3rd- and 4th-gen.cephalosporins
Sulfonamides
Trimethoprim
Macrolides
Lincosamides
Fluoroquinolones
Other quinolones
Aminoglycosides
Polymyxins
Pleuromutilins
2010 2011 2012 2013
Hungary mg/PCU
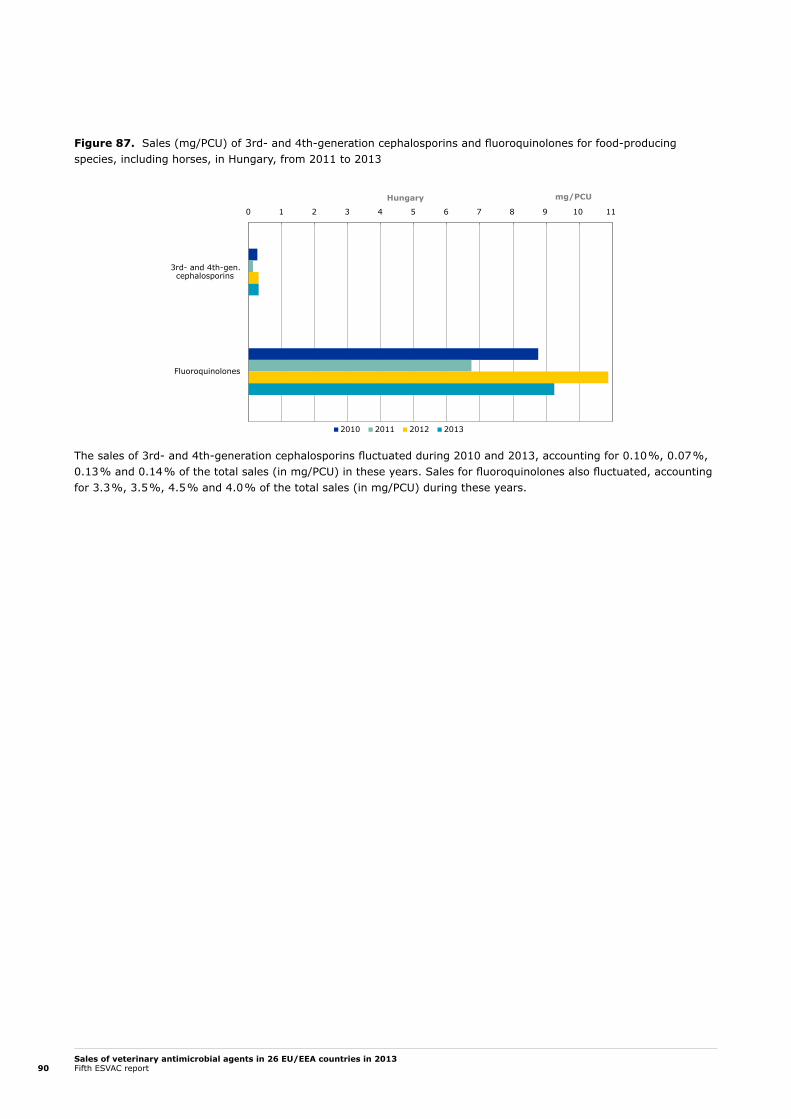
Sales of veterinary antimicrobial agents in 26 EU/EEA countries in 2013Fifth ESVAC report90
Figure 87. Sales (mg/PCU) of 3rd- and 4th-generation cephalosporins and fluoroquinolones for food-producing species, including horses, in Hungary, from 2011 to 2013
The sales of 3rd- and 4th-generation cephalosporins fluctuated during 2010 and 2013, accounting for 0.10 %, 0.07 %, 0.13 % and 0.14 % of the total sales (in mg/PCU) in these years. Sales for fluoroquinolones also fluctuated, accounting for 3.3 %, 3.5 %, 4.5 % and 4.0 % of the total sales (in mg/PCU) during these years.
0 1 2 3 4 5 6 7 8 9 10 11
3rd- and 4th-gen.cephalosporins
Fluoroquinolones
2010 2011 2012 2013
Hungary mg/PCU
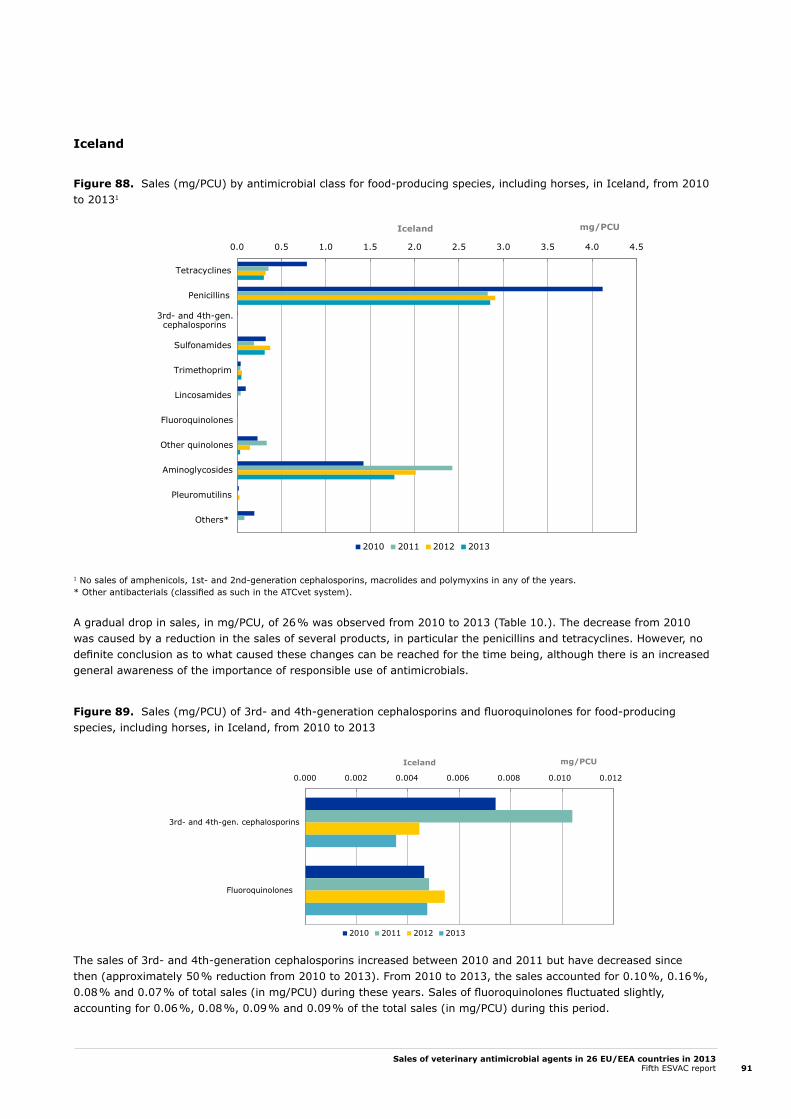
Sales of veterinary antimicrobial agents in 26 EU/EEA countries in 2013Fifth ESVAC report 91
Iceland
Figure 88. Sales (mg/PCU) by antimicrobial class for food-producing species, including horses, in Iceland, from 2010 to 20131
1 No sales of amphenicols, 1st- and 2nd-generation cephalosporins, macrolides and polymyxins in any of the years. * Other antibacterials (classified as such in the ATCvet system).
A gradual drop in sales, in mg/PCU, of 26 % was observed from 2010 to 2013 (Table 10.). The decrease from 2010 was caused by a reduction in the sales of several products, in particular the penicillins and tetracyclines. However, no definite conclusion as to what caused these changes can be reached for the time being, although there is an increased general awareness of the importance of responsible use of antimicrobials.
Figure 89. Sales (mg/PCU) of 3rd- and 4th-generation cephalosporins and fluoroquinolones for food-producing species, including horses, in Iceland, from 2010 to 2013
The sales of 3rd- and 4th-generation cephalosporins increased between 2010 and 2011 but have decreased since then (approximately 50 % reduction from 2010 to 2013). From 2010 to 2013, the sales accounted for 0.10 %, 0.16 %, 0.08 % and 0.07 % of total sales (in mg/PCU) during these years. Sales of fluoroquinolones fluctuated slightly, accounting for 0.06 %, 0.08 %, 0.09 % and 0.09 % of the total sales (in mg/PCU) during this period.
0.0 0.5 1.0 1.5 2.0 2.5 3.0 3.5 4.0 4.5
Tetracyclines
Penicillins
3rd- and 4th-gen.cephalosporins
Sulfonamides
Trimethoprim
Lincosamides
Fluoroquinolones
Other quinolones
Aminoglycosides
Pleuromutilins
Others*
2010 2011 2012 2013
Iceland mg/PCU
0.000 0.002 0.004 0.006 0.008 0.010 0.012
3rd- and 4th-gen. cephalosporins
Fluoroquinolones
2010 2011 2012 2013
mg/PCUIceland
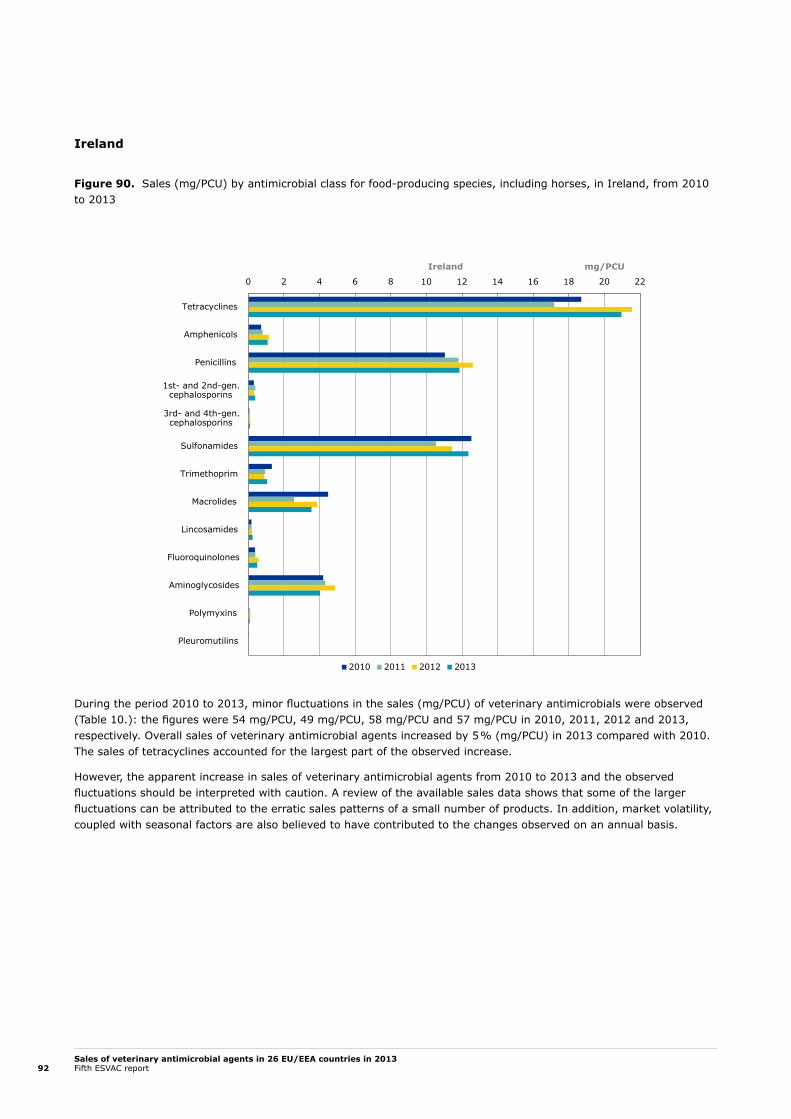
Sales of veterinary antimicrobial agents in 26 EU/EEA countries in 2013Fifth ESVAC report92
Ireland
Figure 90. Sales (mg/PCU) by antimicrobial class for food-producing species, including horses, in Ireland, from 2010 to 2013
During the period 2010 to 2013, minor fluctuations in the sales (mg/PCU) of veterinary antimicrobials were observed (Table 10.): the figures were 54 mg/PCU, 49 mg/PCU, 58 mg/PCU and 57 mg/PCU in 2010, 2011, 2012 and 2013, respectively. Overall sales of veterinary antimicrobial agents increased by 5 % (mg/PCU) in 2013 compared with 2010. The sales of tetracyclines accounted for the largest part of the observed increase.
However, the apparent increase in sales of veterinary antimicrobial agents from 2010 to 2013 and the observed fluctuations should be interpreted with caution. A review of the available sales data shows that some of the larger fluctuations can be attributed to the erratic sales patterns of a small number of products. In addition, market volatility, coupled with seasonal factors are also believed to have contributed to the changes observed on an annual basis.
0 2 4 6 8 10 12 14 16 18 20 22
Tetracyclines
Amphenicols
Penicillins
1st- and 2nd-gen.cephalosporins
3rd- and 4th-gen.cephalosporins
Sulfonamides
Trimethoprim
Macrolides
Lincosamides
Fluoroquinolones
Aminoglycosides
Polymyxins
Pleuromutilins
2010 2011 2012 2013
Ireland mg/PCU

Sales of veterinary antimicrobial agents in 26 EU/EEA countries in 2013Fifth ESVAC report 93
Figure 91. Sales (mg/PCU) of 3rd- and 4th-generation cephalosporins and fluoroquinolones for food-producing species, including horses, in Ireland, from 2010 to 2013
A modest increase in sales of 3rd- and 4th-generation cephalosporins and fluoroquinolones was observed during 2010 to 2012, while from 2012 to 2013 a modest decrease was seen. The decrease in 3rd- and 4th-generation cephalosporins and fluoroquinolones sales (tonnes) was 16.4 % and 10.7 %, respectively, when compared to 2012. Despite this apparent reduction, sales still remained higher than in 2010 and 2011. In 2010, the 3rd- and 4th-generation cephalosporins accounted for 0.1 % of the total sales; for 2013, this figure was 0.2 %. The corresponding figures for fluoroquinolones were 0.7 % and 0.9 %, respectively.
0.0 0.1 0.2 0.3 0.4 0.5 0.6
3rd- and 4th-gen.cephalosporins
Fluoroquinolones
2010 2011 2012 2013
Ireland mg/PCU

Sales of veterinary antimicrobial agents in 26 EU/EEA countries in 2013Fifth ESVAC report94
Italy
Figure 92. Sales (mg/PCU) by antimicrobial class for food-producing species, including horses, in Italy, from 2010 to 2013
Overall, there was a 29 % drop in sales, expressed as mg/PCU, in the period 2010 to 2013. This decrease would appear to be correlated mainly with a progressive decline in sales of tetracyclines and sulfonamides but also of macrolides and polymyxins. The reduced sales are likely to have been caused by the following factors:
• In 2009, the Ministry of Health launched awareness campaigns12 against the prophylactic use of antimicrobial agents in breeding farms. Furthermore, an online training course on veterinary medicines surveillance and pharmacovigilance was published13.
• In 2010, an information system was implemented in order to estimate the number of prescriptions of veterinary antimicrobials issued throughout each Italian region. These data allow the local competent authorities to identify the most problematic sectors where antimicrobial resistance has to be tackled in the following year. Furthermore, training courses were held in collaboration with the National Reference Laboratory for Antimicrobial Resistance in Rome, in 2010 and 2011. At the same time, in accordance with Regulation (EC) No 852/2004, the Ministry of Health validated and published species-specific good husbandry practices manuals in which basic principles for medicines management in farms are addressed.
• In February 2012, a ‘Manual for prudent use of antimicrobials in poultry, pig and rabbit production’, addressed to farmers and veterinarians, was developed by the Italian authorities14. Also, a ministerial ‘Guideline for official controls on distribution and use of veterinary medicines’ for local official veterinary services was published in January 2012.
0 20 40 60 80 100 120 140 160
Tetracyclines
Amphenicols
Penicillins
1st- and 2nd-gen.cephalosporins
3rd- and 4th-gen.cephalosporins
Sulfonamides
Trimethoprim
Macrolides
Lincosamides
Fluoroquinolones
Other quinolones
Aminoglycosides
Polymyxins
Pleuromutilins
2010 2011 2012 2013
Italy mg/PCU
12 http://www.salute.gov.it/portale/temi/p2_5.jsp?lingua=italiano&area=veterinari&menu=antibiotici (in Italian). Figure 93. Sales (mg/PCU) of 3rd- and 4th-generation cephalosporins and fluoroquinolones for food-producing species, including horses, in Italy, from 2010 to 2013.
13 http://www.trentagiorni.it/numeroDettaglio.php?numeriId=3 (in Italian). 14 http://www.salute.gov.it/farmaciVeterinari/newsFarmaciVeterinari.jsp?id=1917&menu=inevidenza&lingua=italiano (in Italian).
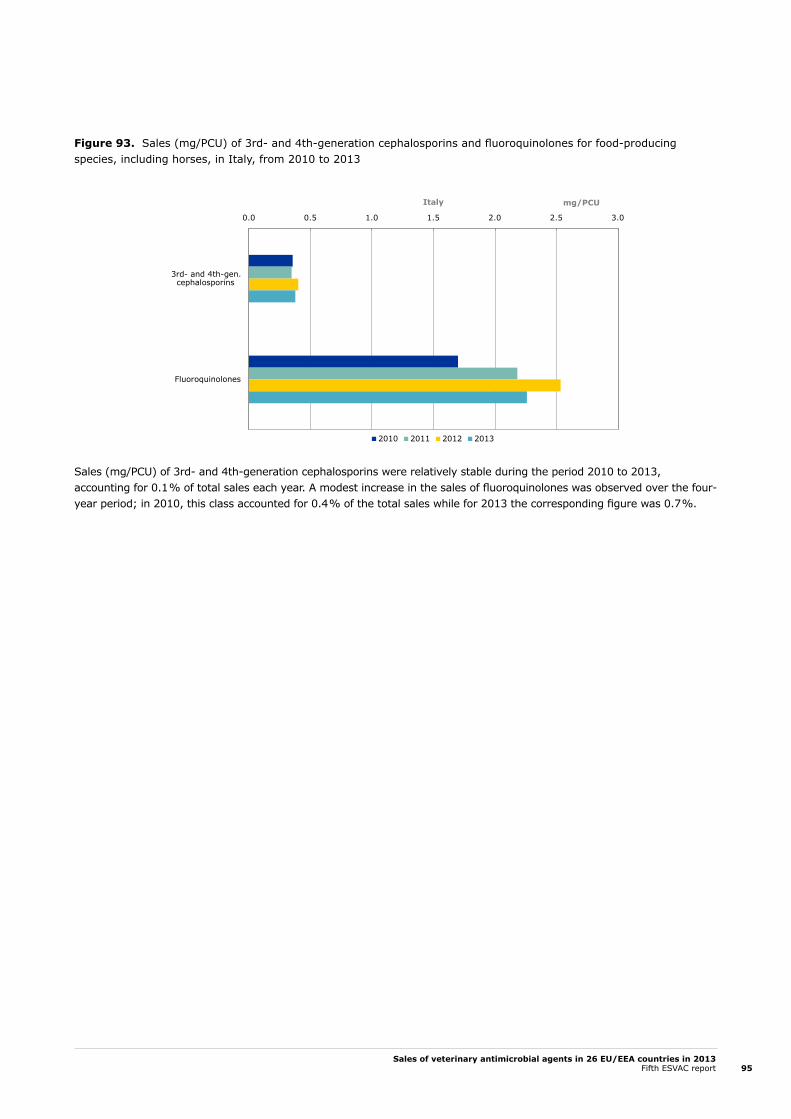
Sales of veterinary antimicrobial agents in 26 EU/EEA countries in 2013Fifth ESVAC report 95
Figure 93. Sales (mg/PCU) of 3rd- and 4th-generation cephalosporins and fluoroquinolones for food-producing species, including horses, in Italy, from 2010 to 2013
Sales (mg/PCU) of 3rd- and 4th-generation cephalosporins were relatively stable during the period 2010 to 2013, accounting for 0.1 % of total sales each year. A modest increase in the sales of fluoroquinolones was observed over the four-year period; in 2010, this class accounted for 0.4 % of the total sales while for 2013 the corresponding figure was 0.7 %.
0.0 0.5 1.0 1.5 2.0 2.5 3.0
3rd- and 4th-gen.cephalosporins
Fluoroquinolones
2010 2011 2012 2013
mg/PCUItaly

Sales of veterinary antimicrobial agents in 26 EU/EEA countries in 2013Fifth ESVAC report96
Latvia
Figure 94. Sales (mg/PCU) by antimicrobial class for food-producing species, including horses, in Latvia, from 2010 to 2013
The sales, in mg/PCU, fluctuated during the period 2010 to 2013, with an overall 7 % fall observed (Figure 10.).
The decrease from 2012 to 2013 is mainly accounted for by lower sales of both tetracyclines and pleuromutilins. At the moment, there are no precise data available to explain the change in sales patterns.
In order to improve the situation regarding the consumption of veterinary antimicrobial agents in Latvia, a number of activities have been carried out to inform farmers and animal owners, and to give additional information to veterinarians about the prudent use of antimicrobial agents in animals. For example, in 2013, employees of the Food and Veterinary Service and Veterinary Medicine Faculty in Latvia participated as speakers at the ‘Responsible Use of Veterinary Medicines’ conference organised by the Latvian Association of Veterinarians, and at the ‘One World, One Health’ conference organised jointly by the Association of Doctors and the Association of Veterinarians. In 2013, the Food and Veterinary Service published an informative brochure called ‘Responsible use of Veterinary Medicines’. At the moment, a list of first- and second-choice antimicrobial agents is being drawn up. During 2013 and 2014, several training courses were organised for inspectors carrying out inspections of the distribution and use of veterinary medicines, and for veterinary practitioners.
0 2 4 6 8 10 12 14 16
Tetracyclines
Amphenicols
Penicillins
1st- and 2nd-gen.cephalosporins
3rd- and 4th-gen.cephalosporins
Sulfonamides
Trimethoprim
Macrolides
Lincosamides
Fluoroquinolones
Other quinolones
Aminoglycosides
Polymyxins
Pleuromutilins
2010 2011 2012 2013
Latvia mg/PCU

Sales of veterinary antimicrobial agents in 26 EU/EEA countries in 2013Fifth ESVAC report 97
Figure 95. Sales (mg/PCU) of 3rd- and 4th-generation cephalosporins and fluoroquinolones for food-producing species, including horses, in Latvia, from 2010 to 2013
The sales of 3rd- and 4th-generation cephalosporins rose from 0.22 mg/PCU in 2010 to 0.4 mg/PCU in 2012 and 2013; in 2010, they accounted for 0.5 % of total sales, while for 2013 this figure was 1.1 %. Sales of fluoroquinolones declined from 4.1 mg/PCU to 2.1 mg/PCU from 2010 to 2013, accounting for 10.3 % of total sales in 2010 and 5.8 % in 2013.
0.0 0.5 1.0 1.5 2.0 2.5 3.0 3.5 4.0 4.5 5.0 5.5
3rd- and 4th-gen.cephalosporins
Fluoroquinolones
2010 2011 2012 2013
Latvia mg/PCU
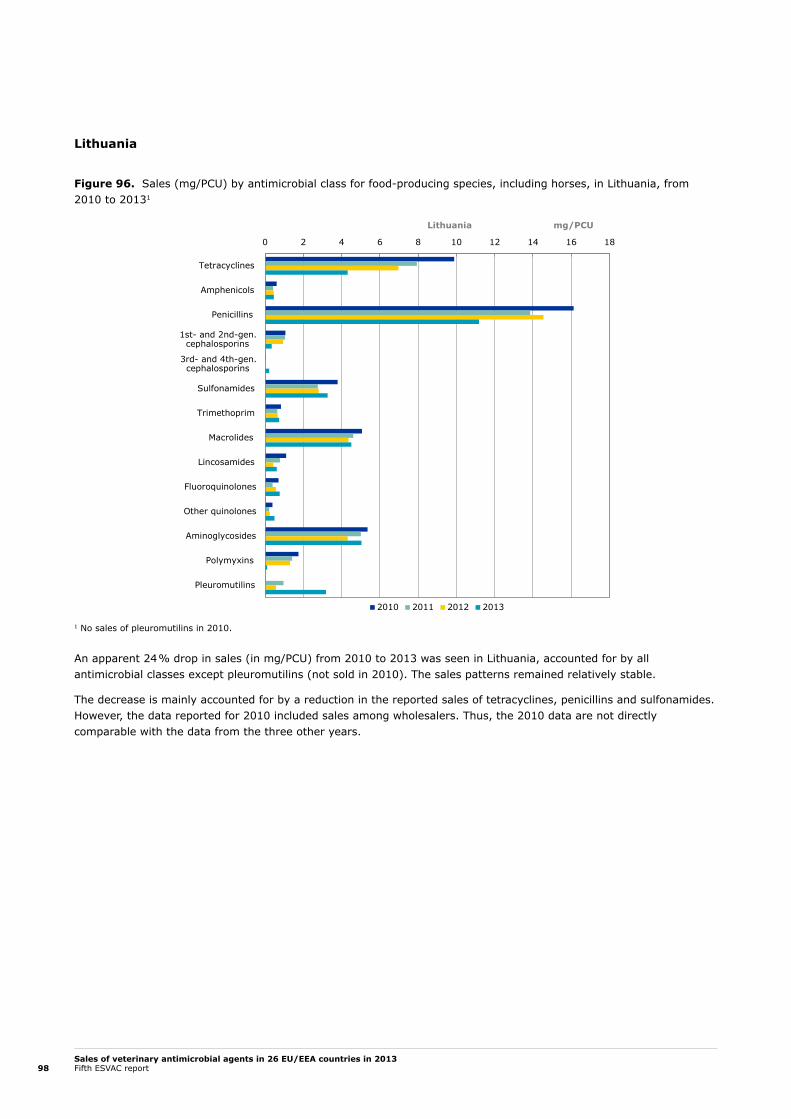
Sales of veterinary antimicrobial agents in 26 EU/EEA countries in 2013Fifth ESVAC report98
Lithuania
Figure 96. Sales (mg/PCU) by antimicrobial class for food-producing species, including horses, in Lithuania, from 2010 to 20131
1 No sales of pleuromutilins in 2010.
An apparent 24 % drop in sales (in mg/PCU) from 2010 to 2013 was seen in Lithuania, accounted for by all antimicrobial classes except pleuromutilins (not sold in 2010). The sales patterns remained relatively stable.
The decrease is mainly accounted for by a reduction in the reported sales of tetracyclines, penicillins and sulfonamides. However, the data reported for 2010 included sales among wholesalers. Thus, the 2010 data are not directly comparable with the data from the three other years.
0 2 4 6 8 10 12 14 16 18
Tetracyclines
Amphenicols
Penicillins
1st- and 2nd-gen.cephalosporins
3rd- and 4th-gen.cephalosporins
Sulfonamides
Trimethoprim
Macrolides
Lincosamides
Fluoroquinolones
Other quinolones
Aminoglycosides
Polymyxins
Pleuromutilins
2010 2011 2012 2013
Lithuania mg/PCU

Sales of veterinary antimicrobial agents in 26 EU/EEA countries in 2013Fifth ESVAC report 99
Figure 97. Sales (mg/PCU) of 3rd- and 4th-generation cephalosporins and fluoroquinolones for food-producing species, including horses, in Lithuania, from 2010 to 2013
The sales (mg/PCU) of 3rd- and 4th-generation cephalosporins increased from 2010 to 2013; in 2010, this class accounted for 0.05 % of total sales while for 2013 this figure was 0.6 %. The corresponding figures for fluoroquinolones were 1.5 % and 2.1 %, respectively, sales of which fluctuated considerably during the period 2010 to 2013.
0.0 0.1 0.2 0.3 0.4 0.5 0.6 0.7 0.8
3rd- and 4th-gen.cephalosporins
Fluoroquinolones
2010 2011 2012 2013
Lithuania mg/PCU
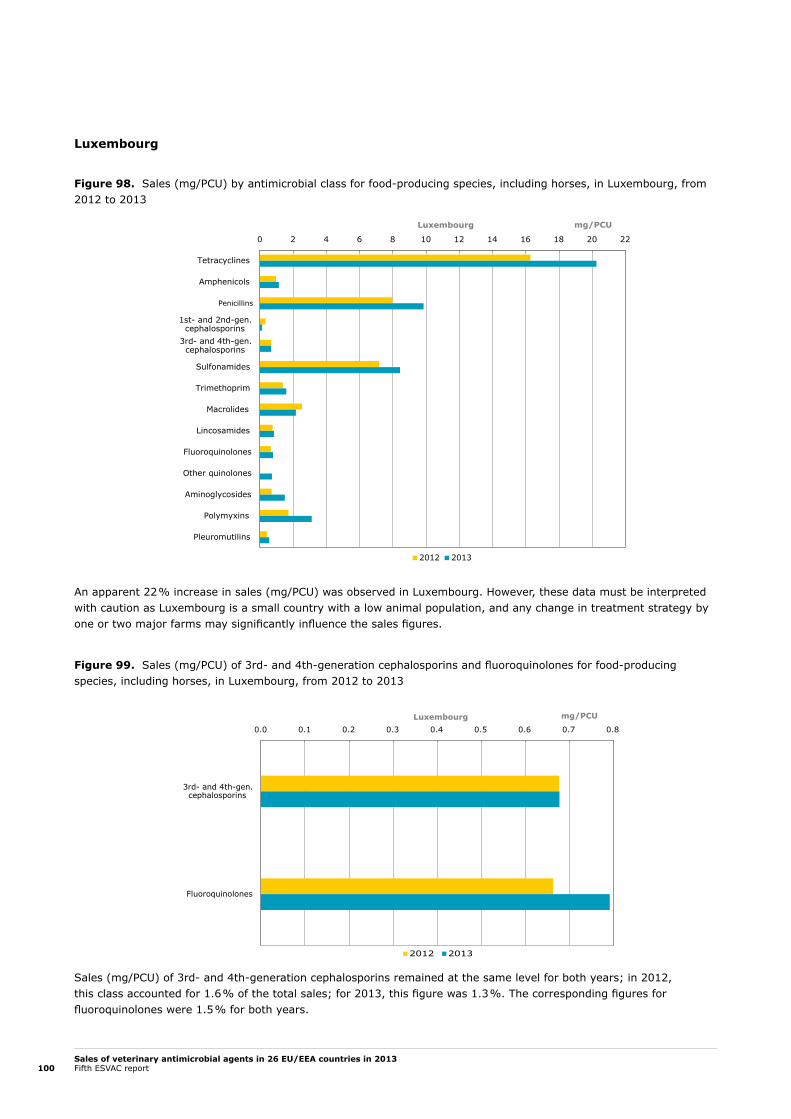
Sales of veterinary antimicrobial agents in 26 EU/EEA countries in 2013Fifth ESVAC report100
Luxembourg
Figure 98. Sales (mg/PCU) by antimicrobial class for food-producing species, including horses, in Luxembourg, from 2012 to 2013
An apparent 22 % increase in sales (mg/PCU) was observed in Luxembourg. However, these data must be interpreted with caution as Luxembourg is a small country with a low animal population, and any change in treatment strategy by one or two major farms may significantly influence the sales figures.
Figure 99. Sales (mg/PCU) of 3rd- and 4th-generation cephalosporins and fluoroquinolones for food-producing species, including horses, in Luxembourg, from 2012 to 2013
Sales (mg/PCU) of 3rd- and 4th-generation cephalosporins remained at the same level for both years; in 2012, this class accounted for 1.6 % of the total sales; for 2013, this figure was 1.3 %. The corresponding figures for fluoroquinolones were 1.5 % for both years.
0 2 4 6 8 10 12 14 16 18 20 22
Tetracyclines
Amphenicols
Penicillins
1st- and 2nd-gen.cephalosporins
3rd- and 4th-gen.cephalosporins
Sulfonamides
Trimethoprim
Macrolides
Lincosamides
Fluoroquinolones
Other quinolones
Aminoglycosides
Polymyxins
Pleuromutilins
2012 2013
Luxembourg mg/PCU
0.0 0.1 0.2 0.3 0.4 0.5 0.6 0.7 0.8
3rd- and 4th-gen.cephalosporins
Fluoroquinolones
2012 2013
mg/PCULuxembourg
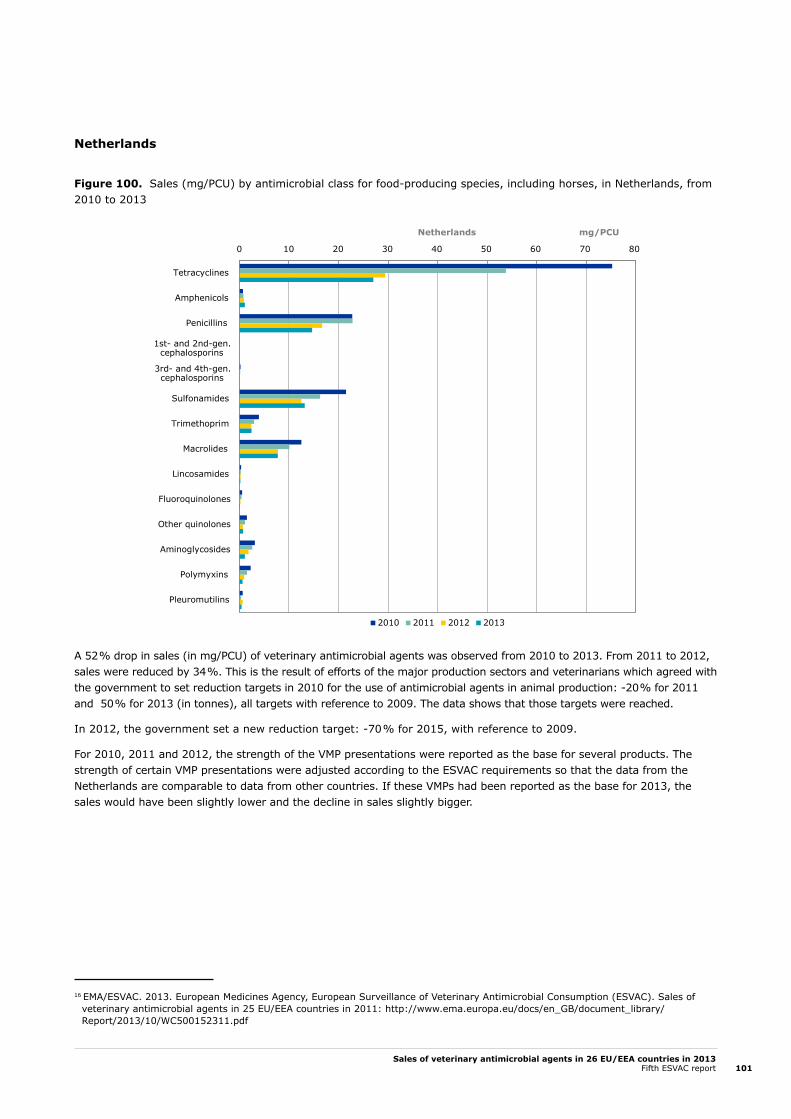
Sales of veterinary antimicrobial agents in 26 EU/EEA countries in 2013Fifth ESVAC report 101
Netherlands
Figure 100. Sales (mg/PCU) by antimicrobial class for food-producing species, including horses, in Netherlands, from 2010 to 2013
A 52 % drop in sales (in mg/PCU) of veterinary antimicrobial agents was observed from 2010 to 2013. From 2011 to 2012, sales were reduced by 34 %. This is the result of efforts of the major production sectors and veterinarians which agreed with the government to set reduction targets in 2010 for the use of antimicrobial agents in animal production: -20 % for 2011 and 50 % for 2013 (in tonnes), all targets with reference to 2009. The data shows that those targets were reached.
In 2012, the government set a new reduction target: -70 % for 2015, with reference to 2009.
For 2010, 2011 and 2012, the strength of the VMP presentations were reported as the base for several products. The strength of certain VMP presentations were adjusted according to the ESVAC requirements so that the data from the Netherlands are comparable to data from other countries. If these VMPs had been reported as the base for 2013, the sales would have been slightly lower and the decline in sales slightly bigger.
0 10 20 30 40 50 60 70 80
Tetracyclines
Amphenicols
Penicillins
1st- and 2nd-gen.cephalosporins
3rd- and 4th-gen.cephalosporins
Sulfonamides
Trimethoprim
Macrolides
Lincosamides
Fluoroquinolones
Other quinolones
Aminoglycosides
Polymyxins
Pleuromutilins
2010 2011 2012 2013
Netherlands mg/PCU
16 EMA/ESVAC. 2013. European Medicines Agency, European Surveillance of Veterinary Antimicrobial Consumption (ESVAC). Sales of veterinary antimicrobial agents in 25 EU/EEA countries in 2011: http://www.ema.europa.eu/docs/en_GB/document_library/Report/2013/10/WC500152311.pdf
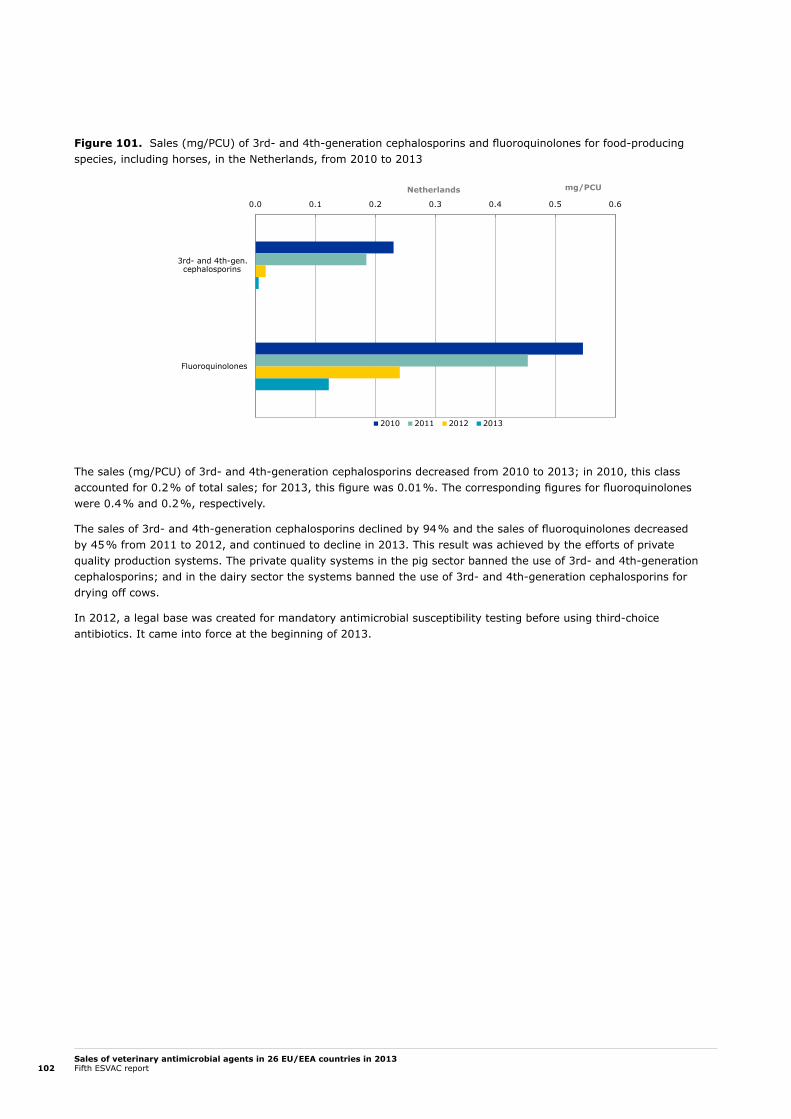
Sales of veterinary antimicrobial agents in 26 EU/EEA countries in 2013Fifth ESVAC report102
Figure 101. Sales (mg/PCU) of 3rd- and 4th-generation cephalosporins and fluoroquinolones for food-producing species, including horses, in the Netherlands, from 2010 to 2013
The sales (mg/PCU) of 3rd- and 4th-generation cephalosporins decreased from 2010 to 2013; in 2010, this class accounted for 0.2 % of total sales; for 2013, this figure was 0.01 %. The corresponding figures for fluoroquinolones were 0.4 % and 0.2 %, respectively.
The sales of 3rd- and 4th-generation cephalosporins declined by 94 % and the sales of fluoroquinolones decreased by 45 % from 2011 to 2012, and continued to decline in 2013. This result was achieved by the efforts of private quality production systems. The private quality systems in the pig sector banned the use of 3rd- and 4th-generation cephalosporins; and in the dairy sector the systems banned the use of 3rd- and 4th-generation cephalosporins for drying off cows.
In 2012, a legal base was created for mandatory antimicrobial susceptibility testing before using third-choice antibiotics. It came into force at the beginning of 2013.
0.0 0.1 0.2 0.3 0.4 0.5 0.6
3rd- and 4th-gen.cephalosporins
Fluoroquinolones
2010 2011 2012 2013
mg/PCUNetherlands

Sales of veterinary antimicrobial agents in 26 EU/EEA countries in 2013Fifth ESVAC report 103
Norway
Figure 102. Sales (mg/PCU) by antimicrobial class for food-producing species, including horses, in Norway, from 2010 to 20131
1 No sales of 1st- and 2nd-generation cephalosporins or polymyxins in any of the years; minor amounts of macrolides sold in 2011, 2012 and 2013 (< 0.002 mg/PCU); minor amounts of lincosamides sold in 2010 (0.01 mg/PCU).
From 2010 to 2013, an 11 % fall, in mg/PCU, was observed in the total sales of antimicrobial agents for food-producing animals. This was mainly accounted for by lower sales of penicillins, aminoglycosides and sulfonamides for terrestrial animals. Sale of other quinolones increased but fluctuated during the period 2010 to 2013; this subclass is only used in farmed fish.
Recently, Norway has not set any targets for reducing the consumption of veterinary antimicrobial agents. However, in 1996, the Norwegian Husbandry Organisations (NHO) set a target for reducing the consumption of antimicrobial agents in terrestrial food-producing animals by 25 % over five years, with 1995 as the reference year. In parallel, the NHO initiated a responsible-use campaign, among other initiatives, by implementing the therapeutic guidelines it had published in connection with the campaign. More comprehensive therapeutic guidelines were published by the Norwegian Medicines Authority in the late 1990s, and have recently been revised.
From 1995 to 1999, a 40 % reduction in the sale of antimicrobials for terrestrial animals was achieved. Since then, the sales of antimicrobial agents for use in terrestrial food-producing animals have been relatively stable, showing only minor fluctuations (http://www.vetinst.no/eng/Publications/NORM-NORM-VET-Report). It should be noted that the sales of antimicrobials for use in farmed fish has declined by 97 % since 1981, while during the same period the production of farmed fish increased more than 100 fold.
0.0 0.4 0.8 1.2 1.6 2.0
Tetracyclines
Amphenicols
Penicillins
3rd- and 4th-gen.cephalosporins
Sulfonamides
Trimethoprim
Fluoroquinolones
Other quinolones
Aminoglycosides
Pleuromutilins
2010 2011 2012 2013
Norway mg/PCU

Sales of veterinary antimicrobial agents in 26 EU/EEA countries in 2013Fifth ESVAC report104
Figure 103. Sales (mg/PCU) of 3rd- and 4th-generation cephalosporins and fluoroquinolones for food-producing species, including horses, in Norway, from 2010 to 2013
The sales (mg/PCU) of 3rd- and 4th-generation cephalosporins decreased from 2010 to 2013; in 2010, this subclass accounted for 0.2 % of the total sales; for 2013, this figure was 0.01 %. The corresponding figures for fluoroquinolones were 0.3 % and 0.2 %, respectively.
0.000 0.005 0.010 0.015
3rd- and 4th-gen. cephalosporins
Fluoroquinolones
2010 2011 2012 2013
Norway mg/PCU
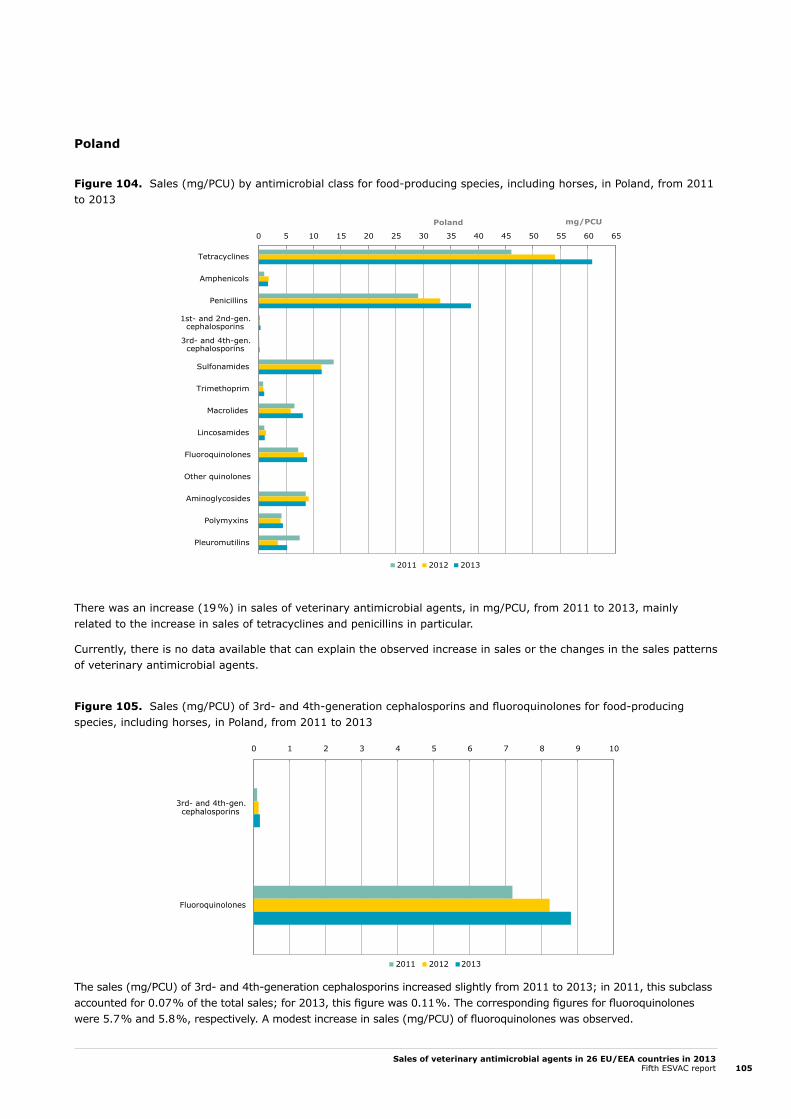
Sales of veterinary antimicrobial agents in 26 EU/EEA countries in 2013Fifth ESVAC report 105
Poland
Figure 104. Sales (mg/PCU) by antimicrobial class for food-producing species, including horses, in Poland, from 2011 to 2013
There was an increase (19 %) in sales of veterinary antimicrobial agents, in mg/PCU, from 2011 to 2013, mainly related to the increase in sales of tetracyclines and penicillins in particular.
Currently, there is no data available that can explain the observed increase in sales or the changes in the sales patterns of veterinary antimicrobial agents.
Figure 105. Sales (mg/PCU) of 3rd- and 4th-generation cephalosporins and fluoroquinolones for food-producing species, including horses, in Poland, from 2011 to 2013
The sales (mg/PCU) of 3rd- and 4th-generation cephalosporins increased slightly from 2011 to 2013; in 2011, this subclass accounted for 0.07 % of the total sales; for 2013, this figure was 0.11 %. The corresponding figures for fluoroquinolones were 5.7 % and 5.8 %, respectively. A modest increase in sales (mg/PCU) of fluoroquinolones was observed.
0 5 10 15 20 25 30 35 40 45 50 55 60 65
Tetracyclines
Amphenicols
Penicillins
1st- and 2nd-gen.cephalosporins
3rd- and 4th-gen.cephalosporins
Sulfonamides
Trimethoprim
Macrolides
Lincosamides
Fluoroquinolones
Other quinolones
Aminoglycosides
Polymyxins
Pleuromutilins
2011 2012 2013
Poland mg/PCU
0 1 2 3 4 5 6 7 8 9 10
3rd- and 4th-gen.cephalosporins
Fluoroquinolones
2011 2012 2013
Poland mg/PCU
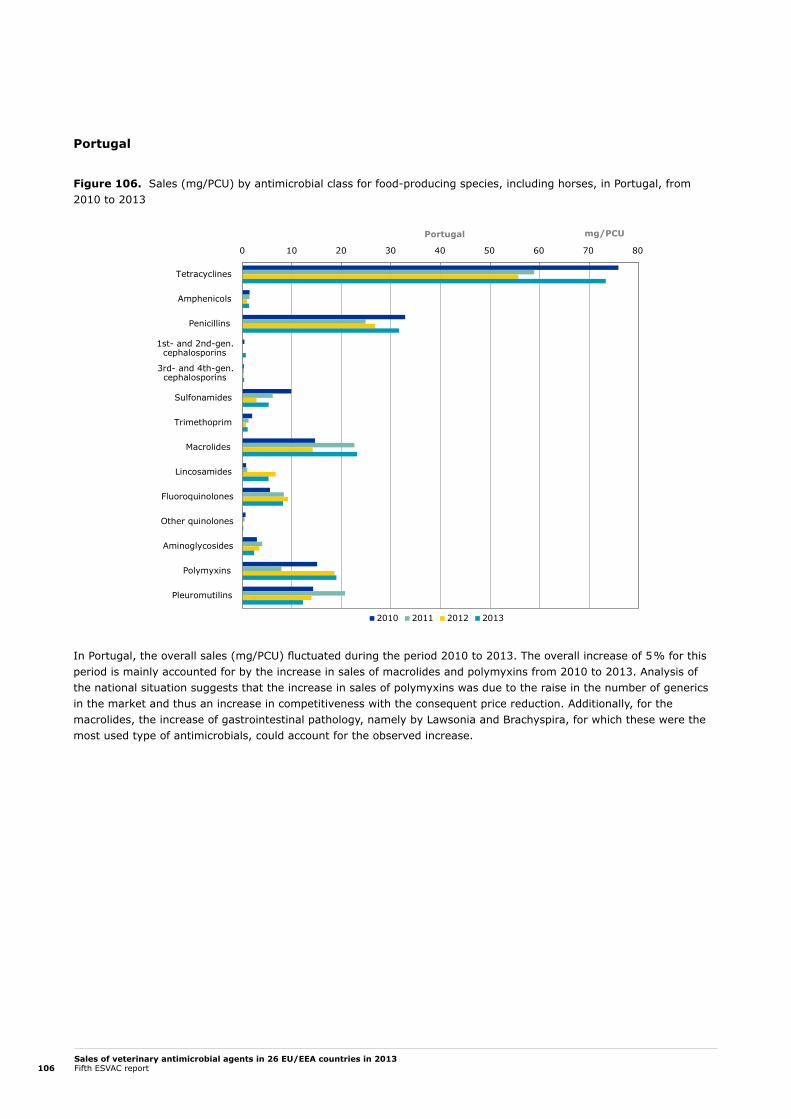
Sales of veterinary antimicrobial agents in 26 EU/EEA countries in 2013Fifth ESVAC report106
Portugal
Figure 106. Sales (mg/PCU) by antimicrobial class for food-producing species, including horses, in Portugal, from 2010 to 2013
In Portugal, the overall sales (mg/PCU) fluctuated during the period 2010 to 2013. The overall increase of 5 % for this period is mainly accounted for by the increase in sales of macrolides and polymyxins from 2010 to 2013. Analysis of the national situation suggests that the increase in sales of polymyxins was due to the raise in the number of generics in the market and thus an increase in competitiveness with the consequent price reduction. Additionally, for the macrolides, the increase of gastrointestinal pathology, namely by Lawsonia and Brachyspira, for which these were the most used type of antimicrobials, could account for the observed increase.
0 10 20 30 40 50 60 70 80
Tetracyclines
Amphenicols
Penicillins
1st- and 2nd-gen.cephalosporins
3rd- and 4th-gen.cephalosporins
Sulfonamides
Trimethoprim
Macrolides
Lincosamides
Fluoroquinolones
Other quinolones
Aminoglycosides
Polymyxins
Pleuromutilins
2010 2011 2012 2013
Portugal mg/PCU
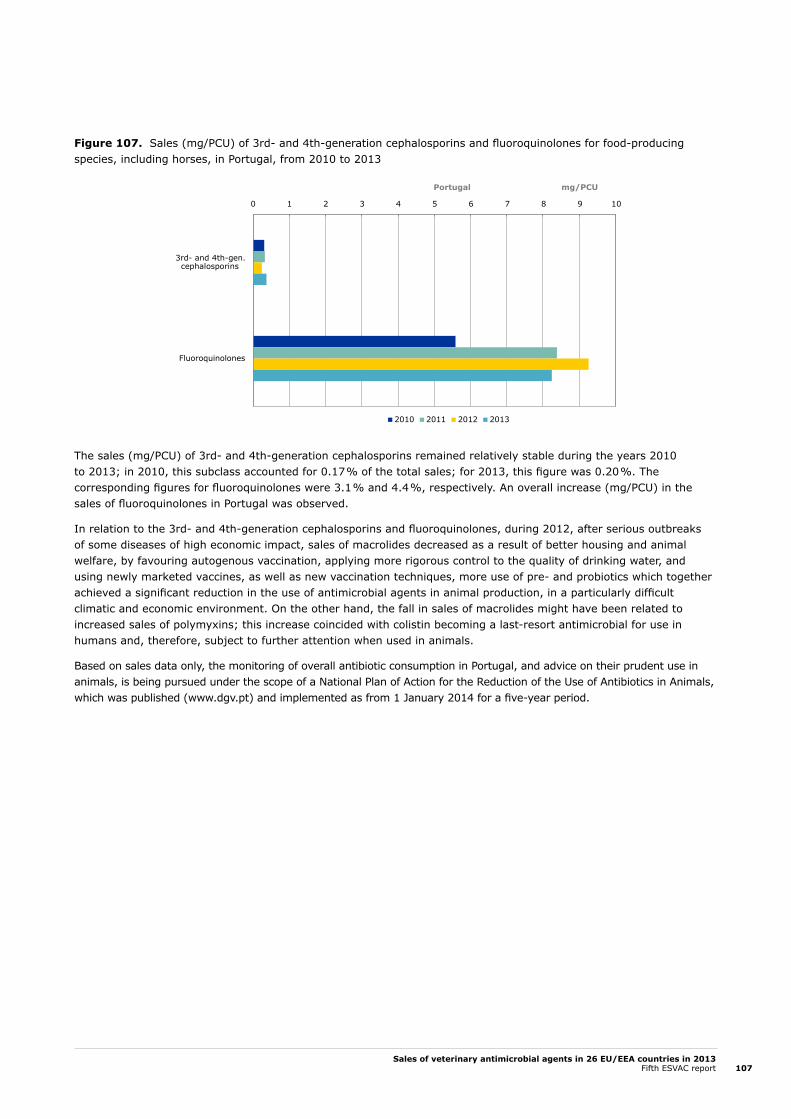
Sales of veterinary antimicrobial agents in 26 EU/EEA countries in 2013Fifth ESVAC report 107
Figure 107. Sales (mg/PCU) of 3rd- and 4th-generation cephalosporins and fluoroquinolones for food-producing species, including horses, in Portugal, from 2010 to 2013
The sales (mg/PCU) of 3rd- and 4th-generation cephalosporins remained relatively stable during the years 2010 to 2013; in 2010, this subclass accounted for 0.17 % of the total sales; for 2013, this figure was 0.20 %. The corresponding figures for fluoroquinolones were 3.1 % and 4.4 %, respectively. An overall increase (mg/PCU) in the sales of fluoroquinolones in Portugal was observed.
In relation to the 3rd- and 4th-generation cephalosporins and fluoroquinolones, during 2012, after serious outbreaks of some diseases of high economic impact, sales of macrolides decreased as a result of better housing and animal welfare, by favouring autogenous vaccination, applying more rigorous control to the quality of drinking water, and using newly marketed vaccines, as well as new vaccination techniques, more use of pre- and probiotics which together achieved a significant reduction in the use of antimicrobial agents in animal production, in a particularly difficult climatic and economic environment. On the other hand, the fall in sales of macrolides might have been related to increased sales of polymyxins; this increase coincided with colistin becoming a last-resort antimicrobial for use in humans and, therefore, subject to further attention when used in animals.
Based on sales data only, the monitoring of overall antibiotic consumption in Portugal, and advice on their prudent use in animals, is being pursued under the scope of a National Plan of Action for the Reduction of the Use of Antibiotics in Animals, which was published (www.dgv.pt) and implemented as from 1 January 2014 for a five-year period.
0 1 2 3 4 5 6 7 8 9 10
3rd- and 4th-gen.cephalosporins
Fluoroquinolones
2010 2011 2012 2013
Portugal mg/PCU

Sales of veterinary antimicrobial agents in 26 EU/EEA countries in 2013Fifth ESVAC report108
Slovakia
Figure 108. Import data by wholesalers (2011 and 2012) and sales to end-users (2013) (mg/PCU) by antimicrobial class for food-producing species, including horses, in Slovakia
The total sales, expressed as mg/PCU, of veterinary antimicrobial agents in Slovakia remained relatively stable during 2011 and 2012, with a slight decrease of 3 % observed. For 2013, an increase of 47 % was noted. The PCU for Slovakia was stable during the period 2011 to 2013.
For 2011 and 2012, data representing the import of antimicrobial VMPs by wholesalers only — i.e. sales of antimicrobial VMPs obtained from national manufacturers — were not included. For 2013, data representing all sales from wholesalers to end-users (veterinarians, pharmacies, producers of medicated feeding stuffs and farmers) — covering the antimicrobial VMPs obtained both from imports and from national manufacturers. This is thought to be the leading explanation for differences between the years 2011 and 2012 and the year 2013. This implies that the data reported for 2011 and 2012 are underestimates compared to 2013 data, meaning that the increase observed is therefore artificial. The Slovak manufacturers of veterinary medicinal products mainly produce products with tetracyclines, pleuromutilins, macrolides and sulfonamides and it is the sale of these veterinary medicinal products which represent
0 2 4 6 8 10 12 14 16 18 20
Tetracyclines
Amphenicols
Penicillins
1st- and 2nd-gen.cephalosporins
3rd- and 4th-gen.cephalosporins
Sulfonamides
Trimethoprim
Macrolides
Lincosamides
Fluoroquinolones
Other quinolones
Aminoglycosides
Polymyxins
Pleuromutilins
2011 2012 2013
mg/PCUSlovakia
0.0 0.5 1.0 1.5 2.0 2.5 3.0 3.5
3rd- and 4th-gen.cephalosporins
Fluoroquinolones
2011 2012 2013
Slovakia mg/PCU

Sales of veterinary antimicrobial agents in 26 EU/EEA countries in 2013Fifth ESVAC report 109
Slovakia
Figure 108. Import data by wholesalers (2011 and 2012) and sales to end-users (2013) (mg/PCU) by antimicrobial class for food-producing species, including horses, in Slovakia
The total sales, expressed as mg/PCU, of veterinary antimicrobial agents in Slovakia remained relatively stable during 2011 and 2012, with a slight decrease of 3 % observed. For 2013, an increase of 47 % was noted. The PCU for Slovakia was stable during the period 2011 to 2013.
For 2011 and 2012, data representing the import of antimicrobial VMPs by wholesalers only — i.e. sales of antimicrobial VMPs obtained from national manufacturers — were not included. For 2013, data representing all sales from wholesalers to end-users (veterinarians, pharmacies, producers of medicated feeding stuffs and farmers) — covering the antimicrobial VMPs obtained both from imports and from national manufacturers. This is thought to be the leading explanation for differences between the years 2011 and 2012 and the year 2013. This implies that the data reported for 2011 and 2012 are underestimates compared to 2013 data, meaning that the increase observed is therefore artificial. The Slovak manufacturers of veterinary medicinal products mainly produce products with tetracyclines, pleuromutilins, macrolides and sulfonamides and it is the sale of these veterinary medicinal products which represent
0 2 4 6 8 10 12 14 16 18 20
Tetracyclines
Amphenicols
Penicillins
1st- and 2nd-gen.cephalosporins
3rd- and 4th-gen.cephalosporins
Sulfonamides
Trimethoprim
Macrolides
Lincosamides
Fluoroquinolones
Other quinolones
Aminoglycosides
Polymyxins
Pleuromutilins
2011 2012 2013
mg/PCUSlovakia
0.0 0.5 1.0 1.5 2.0 2.5 3.0 3.5
3rd- and 4th-gen.cephalosporins
Fluoroquinolones
2011 2012 2013
Slovakia mg/PCU
this biggest difference in consumption data in 2013, when compared to previous years. As explained above, since the data for 2011 and 2012 are not comparable with that for 2013, the changes observed in the sales patterns are artificial.
Figure 109. Import data by wholesalers (2011 and 2012) and sales to end-users (2013) (mg/PCU) of 3rd- and 4th-generation cephalosporins and fluoroquinolones for food-producing species, including horses, in Slovakia
Sales (import) (mg/PCU) of 3rd- and 4th-generation cephalosporins declined slightly during the years 2011 to 2013; in 2011, this subclass accounted for 1.5 % of the total sales; for 2013, this figure was 0.6 %. The corresponding figures for fluoroquinolones were 6.8 % and 4.5 %, respectively. An overall drop in sales (mg/PCU) of fluoroquinolones in Slovakia was observed. Since sales of these classes might have been under-reported for 2011 and 2012 the decline might have been slightly underestimated.
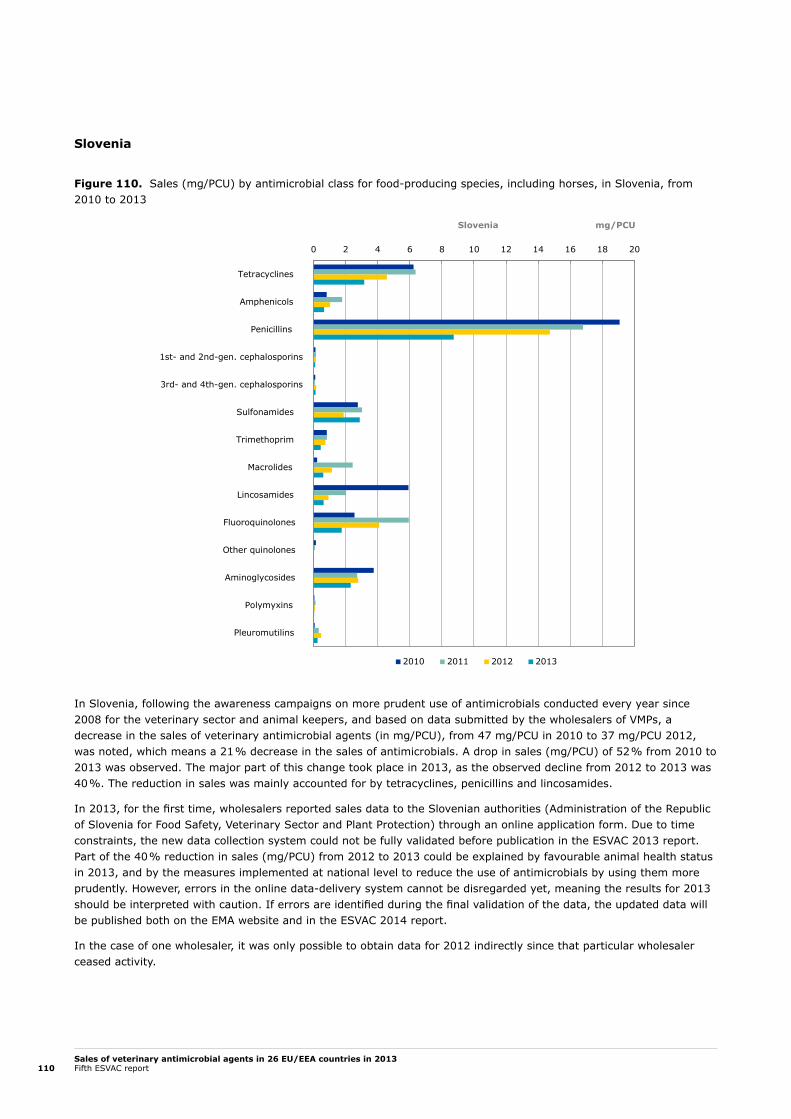
Sales of veterinary antimicrobial agents in 26 EU/EEA countries in 2013Fifth ESVAC report110
Slovenia
Figure 110. Sales (mg/PCU) by antimicrobial class for food-producing species, including horses, in Slovenia, from 2010 to 2013
In Slovenia, following the awareness campaigns on more prudent use of antimicrobials conducted every year since 2008 for the veterinary sector and animal keepers, and based on data submitted by the wholesalers of VMPs, a decrease in the sales of veterinary antimicrobial agents (in mg/PCU), from 47 mg/PCU in 2010 to 37 mg/PCU 2012, was noted, which means a 21 % decrease in the sales of antimicrobials. A drop in sales (mg/PCU) of 52 % from 2010 to 2013 was observed. The major part of this change took place in 2013, as the observed decline from 2012 to 2013 was 40 %. The reduction in sales was mainly accounted for by tetracyclines, penicillins and lincosamides.
In 2013, for the first time, wholesalers reported sales data to the Slovenian authorities (Administration of the Republic of Slovenia for Food Safety, Veterinary Sector and Plant Protection) through an online application form. Due to time constraints, the new data collection system could not be fully validated before publication in the ESVAC 2013 report. Part of the 40 % reduction in sales (mg/PCU) from 2012 to 2013 could be explained by favourable animal health status in 2013, and by the measures implemented at national level to reduce the use of antimicrobials by using them more prudently. However, errors in the online data-delivery system cannot be disregarded yet, meaning the results for 2013 should be interpreted with caution. If errors are identified during the final validation of the data, the updated data will be published both on the EMA website and in the ESVAC 2014 report.
In the case of one wholesaler, it was only possible to obtain data for 2012 indirectly since that particular wholesaler ceased activity.
0 2 4 6 8 10 12 14 16 18 20
Tetracyclines
Amphenicols
Penicillins
1st- and 2nd-gen. cephalosporins
3rd- and 4th-gen. cephalosporins
Sulfonamides
Trimethoprim
Macrolides
Lincosamides
Fluoroquinolones
Other quinolones
Aminoglycosides
Polymyxins
Pleuromutilins
2010 2011 2012 2013
Slovenia mg/PCU
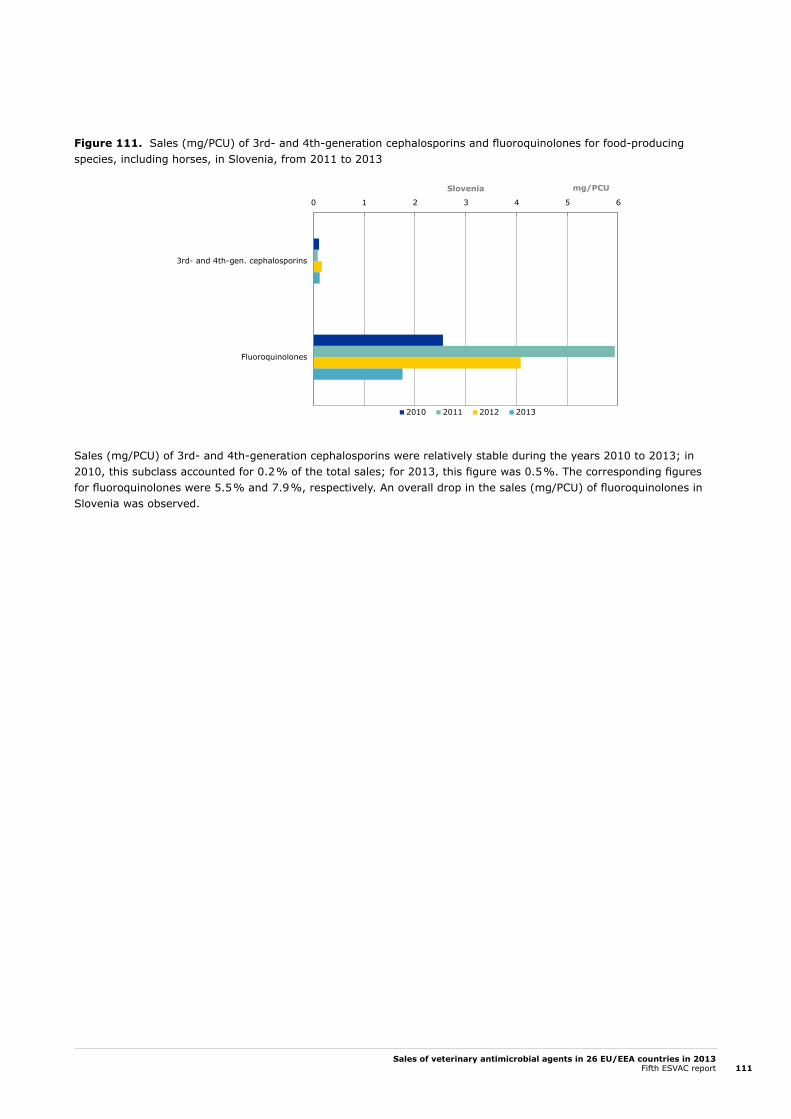
Sales of veterinary antimicrobial agents in 26 EU/EEA countries in 2013Fifth ESVAC report 111
Figure 111. Sales (mg/PCU) of 3rd- and 4th-generation cephalosporins and fluoroquinolones for food-producing species, including horses, in Slovenia, from 2011 to 2013
Sales (mg/PCU) of 3rd- and 4th-generation cephalosporins were relatively stable during the years 2010 to 2013; in 2010, this subclass accounted for 0.2 % of the total sales; for 2013, this figure was 0.5 %. The corresponding figures for fluoroquinolones were 5.5 % and 7.9 %, respectively. An overall drop in the sales (mg/PCU) of fluoroquinolones in Slovenia was observed.
0 1 2 3 4 5 6
3rd- and 4th-gen. cephalosporins
Fluoroquinolones
2010 2011 2012 2013
mg/PCUSlovenia

Sales of veterinary antimicrobial agents in 26 EU/EEA countries in 2013Fifth ESVAC report112
Spain
Figure 112. Sales (mg/PCU) by antimicrobial class for food-producing species, including horses, in Spain, from 2010 to 20131
1 Sales of 1st- and 2nd-generation were low in each year (< 0.05 % of total sales).
One marketing authorisation holder in Spain failed to report the sales data in 2010; for this company, the reported sales accounted for 21 % of total sales in 2011, which indicates a huge under-reporting for the 2010 sales data. Therefore, the sales data for 2010 is not comparable with that for 2011, 2012 and 2013 (see the latest ESVAC reports15).
For the period 2011 to 2013, sales (mg/PCU) and sales patterns varied. An overall decline of 6 % in sales was observed for this period. The major drop in sales was accounted for by sulfonamides (-60 %) and polymyxins (-36 %).
Tetracyclines had the highest sales during the period 2011 to 2013, while sales of penicillins and macrolides increased slightly. Tetracyclines and macrolides were the most commonly used antimicrobial classes in pig production, which is the largest food-animal production sector in Spain.
A relatively high increase in sales of aminoglycosides and pleuromutilins was observed from 2011 to 2013 (27 % and 18 %, respectively). There is no clear explanation for this as identification of the factors behind the variations and changes observed in the sales of antimicrobial agents remains difficult in the absence of data by species.
Spain has adopted a national five-year plan to combat antimicrobial resistance. Six strategies are included in this common plan for the veterinary and human areas, aimed at promoting appropriate use, ensuring effective surveillance systems, promoting research and innovation, and the development of a communication and education plan. Nevertheless, more time is needed before conclusions can be drawn on the efficacy of this plan in reducing the sales of antimicrobial agents (http://www.aemps.gob.es/publicaciones/publica/home.htm).
0 20 40 60 80 100 120 140
Tetracyclines
Amphenicols
Penicillins
1st- and 2nd-gen.cephalosporins
3rd- and 4th-gen.cephalosporins
Sulfonamides
Trimethoprim
Macrolides
Lincosamides
Fluoroquinolones
Other quinolones
Aminoglycosides
Polymyxins
Pleuromutilins
2010 2011 2012 2013
Spain mg/PCU
15 Available on the EMA website (www.ema.europa.eu) via: Home > > Veterinary regulatory > Antimicrobial resistance > European Surveillance of Veterinary Antimicrobial Consumption. http://www.ema.europa.eu/ema/index.jsp?curl=pages/regulation/document_listing/document_listing_000302.jsp&mid=WC0b01ac0580153a00
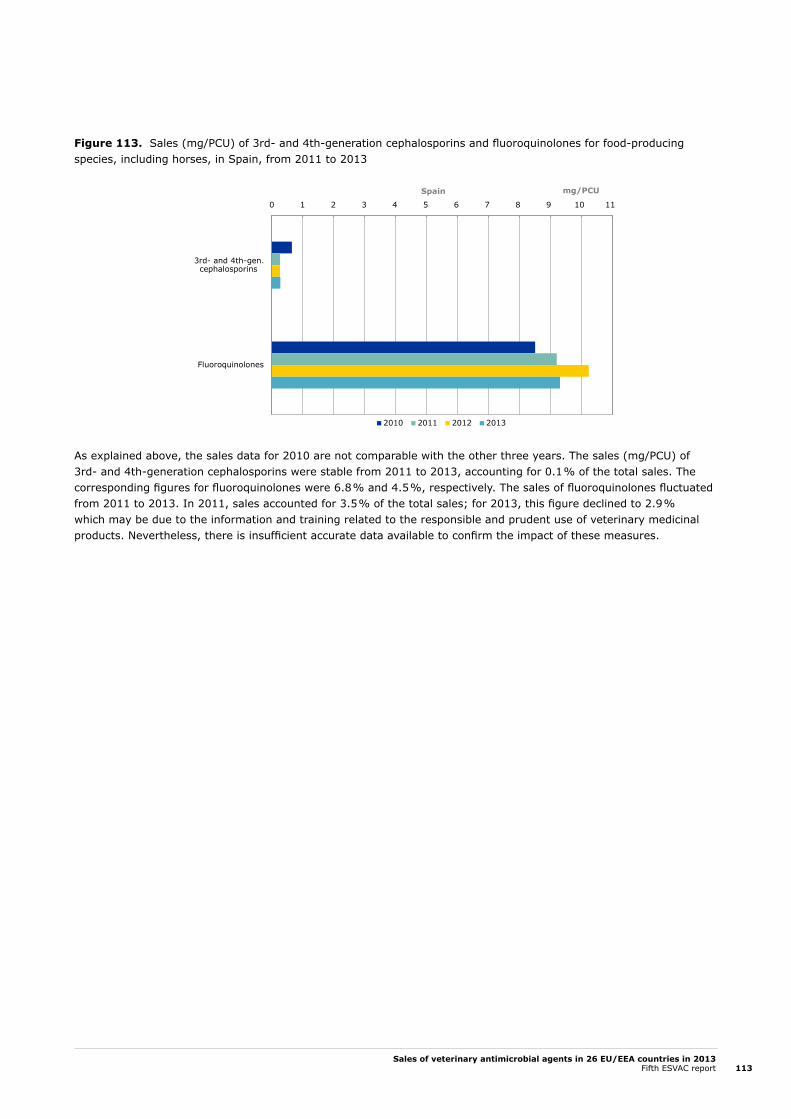
Sales of veterinary antimicrobial agents in 26 EU/EEA countries in 2013Fifth ESVAC report 113
Figure 113. Sales (mg/PCU) of 3rd- and 4th-generation cephalosporins and fluoroquinolones for food-producing species, including horses, in Spain, from 2011 to 2013
As explained above, the sales data for 2010 are not comparable with the other three years. The sales (mg/PCU) of 3rd- and 4th-generation cephalosporins were stable from 2011 to 2013, accounting for 0.1 % of the total sales. The corresponding figures for fluoroquinolones were 6.8 % and 4.5 %, respectively. The sales of fluoroquinolones fluctuated from 2011 to 2013. In 2011, sales accounted for 3.5 % of the total sales; for 2013, this figure declined to 2.9 % which may be due to the information and training related to the responsible and prudent use of veterinary medicinal products. Nevertheless, there is insufficient accurate data available to confirm the impact of these measures.
0 1 2 3 4 5 6 7 8 9 10 11
3rd- and 4th-gen.cephalosporins
Fluoroquinolones
2010 2011 2012 2013
Spain mg/PCU
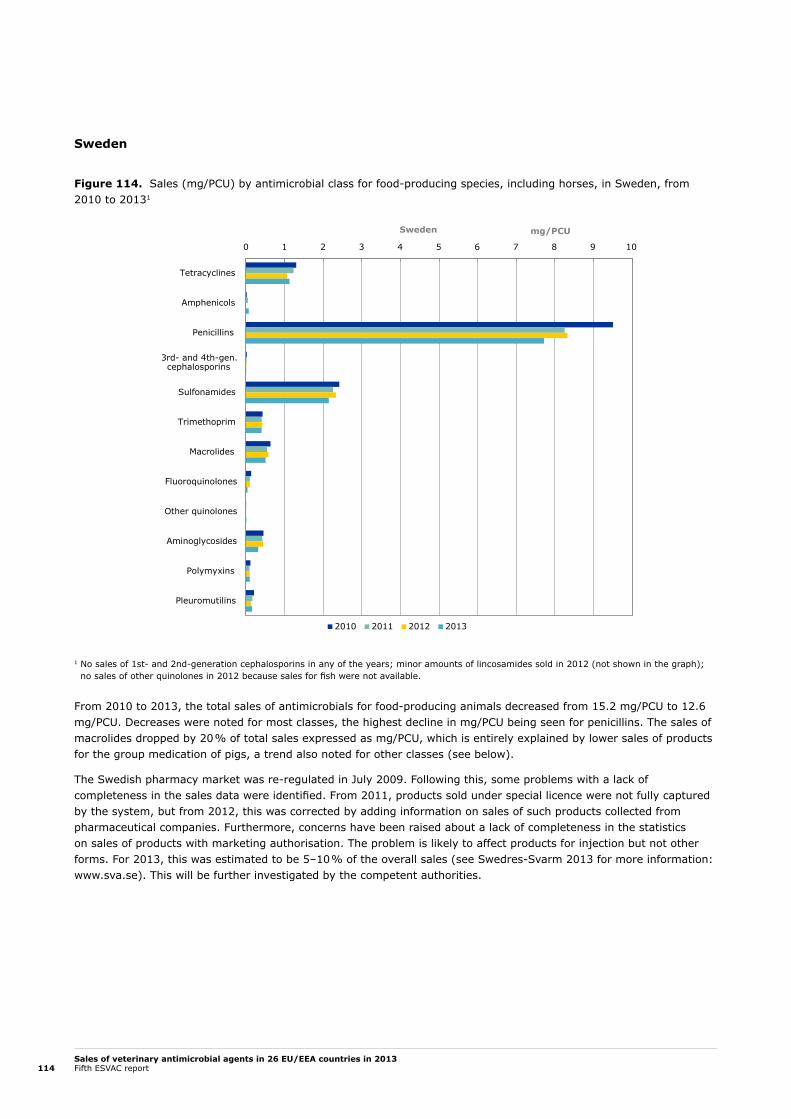
Sales of veterinary antimicrobial agents in 26 EU/EEA countries in 2013Fifth ESVAC report114
Sweden
Figure 114. Sales (mg/PCU) by antimicrobial class for food-producing species, including horses, in Sweden, from 2010 to 20131
1 No sales of 1st- and 2nd-generation cephalosporins in any of the years; minor amounts of lincosamides sold in 2012 (not shown in the graph); no sales of other quinolones in 2012 because sales for fish were not available.
From 2010 to 2013, the total sales of antimicrobials for food-producing animals decreased from 15.2 mg/PCU to 12.6 mg/PCU. Decreases were noted for most classes, the highest decline in mg/PCU being seen for penicillins. The sales of macrolides dropped by 20 % of total sales expressed as mg/PCU, which is entirely explained by lower sales of products for the group medication of pigs, a trend also noted for other classes (see below).
The Swedish pharmacy market was re-regulated in July 2009. Following this, some problems with a lack of completeness in the sales data were identified. From 2011, products sold under special licence were not fully captured by the system, but from 2012, this was corrected by adding information on sales of such products collected from pharmaceutical companies. Furthermore, concerns have been raised about a lack of completeness in the statistics on sales of products with marketing authorisation. The problem is likely to affect products for injection but not other forms. For 2013, this was estimated to be 5–10 % of the overall sales (see Swedres-Svarm 2013 for more information: www.sva.se). This will be further investigated by the competent authorities.
0 1 2 3 4 5 6 7 8 9 10
Tetracyclines
Amphenicols
Penicillins
3rd- and 4th-gen.cephalosporins
Sulfonamides
Trimethoprim
Macrolides
Fluoroquinolones
Other quinolones
Aminoglycosides
Polymyxins
Pleuromutilins
2010 2011 2012 2013
Sweden mg/PCU
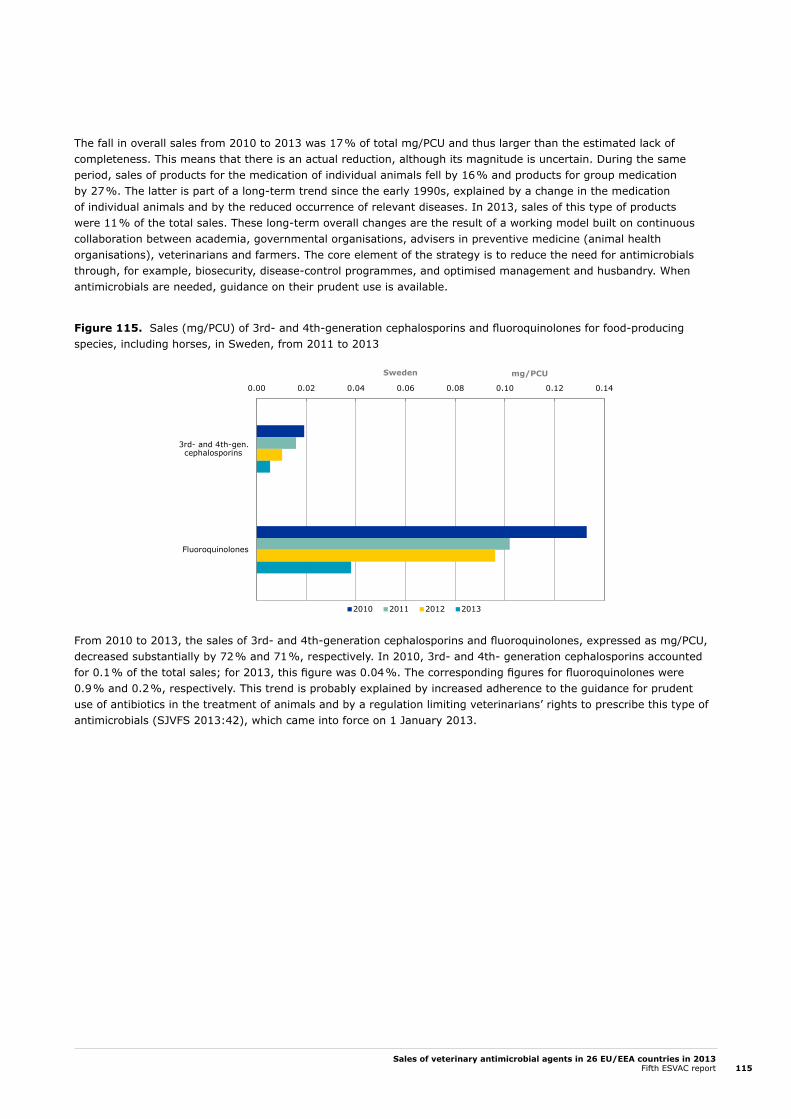
Sales of veterinary antimicrobial agents in 26 EU/EEA countries in 2013Fifth ESVAC report 115
The fall in overall sales from 2010 to 2013 was 17 % of total mg/PCU and thus larger than the estimated lack of completeness. This means that there is an actual reduction, although its magnitude is uncertain. During the same period, sales of products for the medication of individual animals fell by 16 % and products for group medication by 27 %. The latter is part of a long-term trend since the early 1990s, explained by a change in the medication of individual animals and by the reduced occurrence of relevant diseases. In 2013, sales of this type of products were 11 % of the total sales. These long-term overall changes are the result of a working model built on continuous collaboration between academia, governmental organisations, advisers in preventive medicine (animal health organisations), veterinarians and farmers. The core element of the strategy is to reduce the need for antimicrobials through, for example, biosecurity, disease-control programmes, and optimised management and husbandry. When antimicrobials are needed, guidance on their prudent use is available.
Figure 115. Sales (mg/PCU) of 3rd- and 4th-generation cephalosporins and fluoroquinolones for food-producing species, including horses, in Sweden, from 2011 to 2013
From 2010 to 2013, the sales of 3rd- and 4th-generation cephalosporins and fluoroquinolones, expressed as mg/PCU, decreased substantially by 72 % and 71 %, respectively. In 2010, 3rd- and 4th- generation cephalosporins accounted for 0.1 % of the total sales; for 2013, this figure was 0.04 %. The corresponding figures for fluoroquinolones were 0.9 % and 0.2 %, respectively. This trend is probably explained by increased adherence to the guidance for prudent use of antibiotics in the treatment of animals and by a regulation limiting veterinarians’ rights to prescribe this type of antimicrobials (SJVFS 2013:42), which came into force on 1 January 2013.
0.00 0.02 0.04 0.06 0.08 0.10 0.12 0.14
3rd- and 4th-gen.cephalosporins
Fluoroquinolones
2010 2011 2012 2013
mg/PCUSweden
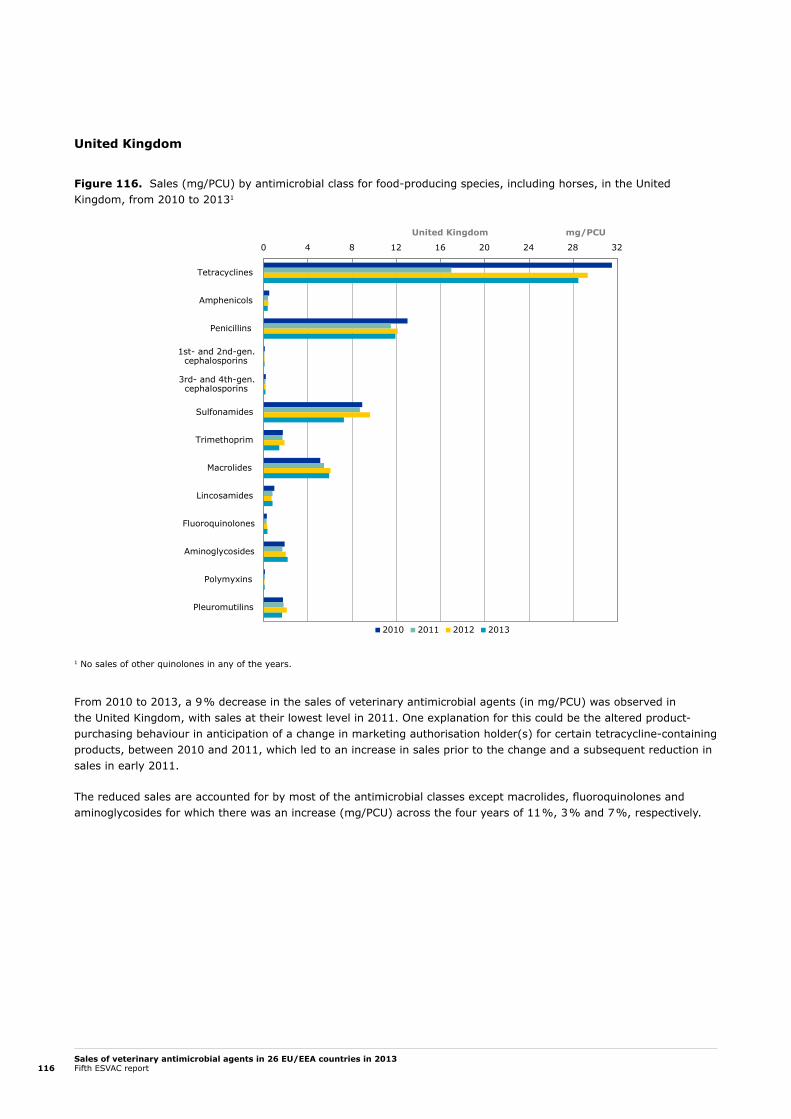
Sales of veterinary antimicrobial agents in 26 EU/EEA countries in 2013Fifth ESVAC report116
United Kingdom
Figure 116. Sales (mg/PCU) by antimicrobial class for food-producing species, including horses, in the United Kingdom, from 2010 to 20131
1 No sales of other quinolones in any of the years.
From 2010 to 2013, a 9 % decrease in the sales of veterinary antimicrobial agents (in mg/PCU) was observed in the United Kingdom, with sales at their lowest level in 2011. One explanation for this could be the altered product-purchasing behaviour in anticipation of a change in marketing authorisation holder(s) for certain tetracycline-containing products, between 2010 and 2011, which led to an increase in sales prior to the change and a subsequent reduction in sales in early 2011.
The reduced sales are accounted for by most of the antimicrobial classes except macrolides, fluoroquinolones and aminoglycosides for which there was an increase (mg/PCU) across the four years of 11 %, 3 % and 7 %, respectively.
0 4 8 12 16 20 24 28 32
Tetracyclines
Amphenicols
Penicillins
1st- and 2nd-gen.cephalosporins
3rd- and 4th-gen.cephalosporins
Sulfonamides
Trimethoprim
Macrolides
Lincosamides
Fluoroquinolones
Aminoglycosides
Polymyxins
Pleuromutilins
2010 2011 2012 2013
United Kingdom mg/PCU
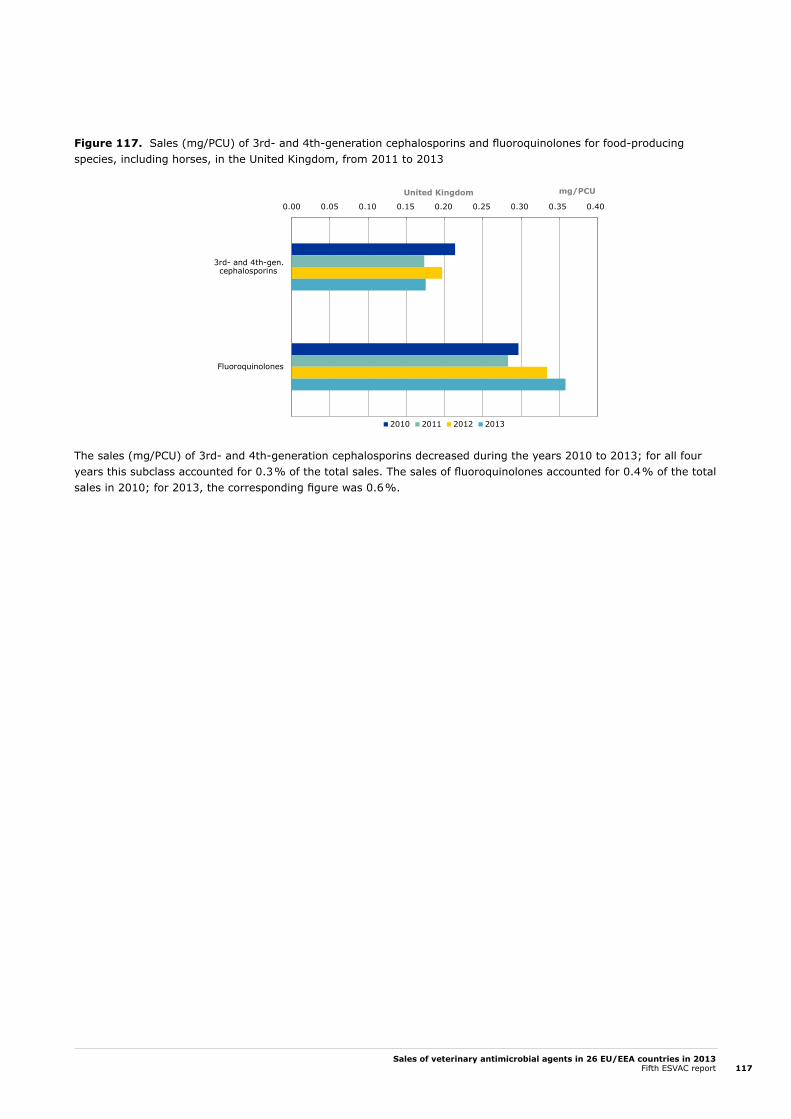
Sales of veterinary antimicrobial agents in 26 EU/EEA countries in 2013Fifth ESVAC report 117
Figure 117. Sales (mg/PCU) of 3rd- and 4th-generation cephalosporins and fluoroquinolones for food-producing species, including horses, in the United Kingdom, from 2011 to 2013
The sales (mg/PCU) of 3rd- and 4th-generation cephalosporins decreased during the years 2010 to 2013; for all four years this subclass accounted for 0.3 % of the total sales. The sales of fluoroquinolones accounted for 0.4 % of the total sales in 2010; for 2013, the corresponding figure was 0.6 %.
0.00 0.05 0.10 0.15 0.20 0.25 0.30 0.35 0.40
3rd- and 4th-gen.cephalosporins
Fluoroquinolones
2010 2011 2012 2013
United Kingdom mg/PCU

Sales of veterinary antimicrobial agents in 26 EU/EEA countries in 2013Fifth ESVAC report118
3. Discussion
3.1. Materials and methodsIt is important to note that the results presented in this report may differ slightly from those presented in national reports, because, for example, of differences in inclusion criteria for veterinary antimicrobial agents, and in the reporting of data in the national surveillance systems, e.g. reporting of the data as the base, while for the ESVAC the strength is reported as given on the label of the VMP (see references to national reports in Annex 6).
As all antimicrobial growth promoters had been phased out in the European Union by 1 January 2006, the data sets provided for the ESVAC represent exclusively sales of antimicrobial agents sold as veterinary medicinal products.
Dermatological preparations (ATCvet group QD) and preparations for sensory organs (ATCvet group QS) were not included in the data sets. Since these pharmaceutical forms represent, for example, only 0.13 % in Denmark, (E. Jacobsen, unpublished data), 0.2 % in the Czech Republic (Lucie Pokludová, unpublished data), 0.35 % in France (G. Moulin, unpublished data), 0.002 % in Norway (www.vetinst.no/eng/Publications/Norm-Norm-Vet-Report) and 0.49 % in the UK (Hannah Reeves, unpublished data) of the total tonnes sold, the contribution from these groups of antimicrobial agents in 2011, in tonnes of active ingredients, to the total amounts is thought to be minimal, and therefore the effect of the deviation is negligible.
Injectable antimicrobial agents are used both in food-producing and in companion animals. With the exception of some long-acting products, injection of antimicrobial agents in companion animals is generally limited to hospitalised animals or perioperative (one injection) treatments. In Denmark and France, approximately 0.1 % and 1.2 %, respectively of the injectable antimicrobial VMPs were used for dogs and cats in 2011 (E. Jacobsen and G. Moulin, unpublished data). Therefore, the assumption that all injectable antimicrobials are used in food-producing species has minimal impact on the accuracy of the data for injectable preparations.
Nine countries (Table 2) included veterinary antimicrobial agents obtained on special licence (use on exemption from marketing authorisation, i.e. obtained from another Member State) in the data sets. For five of these countries — Denmark, Norway, Finland, Estonia and Sweden — the proportion of sales of antimicrobial veterinary medicinal products (VMPs) on special licence is reported by the ESVAC NCs/alternates in 2011 to be approximately 0.01 %, 1 %, 3 %, 9 % and 10 % of the total sales, respectively16. These are all countries with a comparatively low number of antimicrobial VMPs on the market (Table 7). As the proportion of antimicrobial products used on special licence (obtained from another Member State) is likely to be negligible in countries with a relatively high number of antimicrobial VMPs on the market, the impact caused by deviations in the included data sets is considered relatively low, and does not significantly influence the general results.
Depending on the source of the data, countries had requested data on sales to end-users, or had asked the national data providers to exclude sales between data sources, for example, between wholesalers, and consequently, it is assumed that double reporting has been avoided.
All countries provided sales data or prescription data (Denmark and Sweden) for 2013.
Regarding the material and methods, it should be noted that in all the participating countries, antimicrobial agents have a ‘prescription only’ status. According to Directive 2001/82/EC, as amended, of the European Parliament, all veterinary medicinal products, including veterinary antimicrobial agents, have to be sold through distributors authorised by the competent authority in each country. This allowed the 26 countries to identify all distributors of antimicrobial VMPs in their country, and consequently 100 % data-source coverage could be obtained. However, some data providers may fail to deliver the data, as happened in Spain for 2010, when one provider did not provide such data, or data providers may deliver incomplete data. For those countries (20) that delivered data to the ESVAC for more than one year, the raw data were checked manually in order to identify outliers, as described in Section 1.7: Quality check and validation of the data. It is therefore reasonable to assume that the data presented in this report provide a good picture of the total sales of antimicrobial agents in the 26 countries.
16 EMA/ESVAC 2013. European Medicines Agency, European Surveillance of Veterinary Antimicrobial Consumption (ESVAC). Sales of veterinary antimicrobial agents in 25 EU/EEA countries in 2011: http://www.ema.europa.eu/docs/en_GB/document_library/Report/2013/10/WC500152311.pdf

Sales of veterinary antimicrobial agents in 26 EU/EEA countries in 2013Fifth ESVAC report 119
In the current report, data presented on sales of veterinary antimicrobial agents for companion animals are based solely on the sales of tablets. For countries with a relatively low number of dogs and cats, the market for antimicrobial VMPs as tablets is typically low, and thus the proportion of human antimicrobial agents that are used according to the cascade could account for a higher proportion than in those countries with a high number of dogs and cats. Furthermore, injectable antimicrobial VMPs are used in both food-producing animals, including horses, and companion animals. Therefore, the data on sales of veterinary antimicrobial agents for companion animals presented in this report are likely to be underestimated, while the data on sales for food-producing animals are slightly overestimated. The national sales data (nominator) cover all food-producing species, including horses, which are considered as food-producing species according to EU legislation. Thus, the animal population ‘at risk’ of being treated with antimicrobial agents (denominator) includes all food species. However, the use of antimicrobial agents in the various animal species varies considerably; for example, the use in sheep is relatively low, due to the generally extensive production system. Therefore, interpretation of the data should take into account the distribution of the PCU value between the species in the various countries. It should also be emphasised that the PCU only represents a technical unit of measurement and not a real value for the animal population that could potentially be treated with antimicrobial agents.
Dosing of the various antimicrobial agents between and within classes, as well as between animal species, varies substantially. For example, the dose for a whole treatment with a fluoroquinolone may be 2–5 mg/kg (for terrestrial animals), while with a tetracycline this may be 140 mg/kg, i.e. up to 70 times higher. This implies that a given weight of active ingredient of fluoroquinolone sold can be used to treat 70 times as many animals as the same weight of active ingredient of tetracycline. Furthermore, within an antimicrobial class there may be different dosages for different substances; for example, the dosage of doxycycline is about one quarter of the dosage of oxytetracycline. Another consideration is that the treatment dosage may differ significantly according to species; for fish, a typical tetracycline dosage for the whole treatment is 800 mg/kg, or some six times higher than that for terrestrial animals. The data in this report cover all food-producing animals together, and therefore it was not possible to take into account differences in dosing when reporting the data. Since the sales patterns and the animal demographics vary substantially between countries, comparison of the sales data across the countries should be done with great care.
The ESVAC template differentiates between preparations applicable for individual and group treatment for oral solutions and powder forms. However, during the analysis of the data, it was identified that the categorisation of oral solutions and oral powders into individual or group treatment differed substantially between the countries. Thus, the data have been aggregated to express oral solutions and oral powders. Because the proportion of sales of small packages of oral powders and oral solutions sufficient for treatment of only a single or a few animals is very low compared to those applicable for group treatment, the data presented in this report are thought to be a reasonable estimate of sales of antimicrobial agents for group treatment.
Product information requested in the ESVAC template includes the marketing authorisation number. However, not all countries provided these numbers, thus the numbers of different antimicrobial products reported by country are reported as product presentations (product name, form, strength and pack size), which overestimates the number of antimicrobial VMPs available to treat animals.
3.2. ResultsFor Bulgaria and Slovakia, no conclusions can be drawn on whether there has been an increase or decrease, due to under-reporting for 2011 and 2012. In these countries, the data collection system has changed. Luxembourg did not provide data for 2010 and 2011.
For the period 2011 to 2013 a decrease in the sales (mg/PCU) of more than 5 % (range: 5.6 %–51 %) was observed for 11 of the 23 countries (Table 10.).
An increase in the sales (mg/PCU) of more than 5 % (range: 5.4 %–21 %) for the period 2011-2013 was observed for 6 of the 23 countries.
Overall, for 23 of the countries reporting sales data to the ESVAC for the years 2011-2013, a 7.9 % decrease in the sales (mg/PCU) was observed; the reduction in PCU was 2.8 % and the decline in tonnes sold was 10.5 %. However, the sale (mg/PCU) of fluoroquinolones and 3rd- and 4th-generation cephalosporins in these countries remained stable during this period (Figure 57.).
For the 20 countries that delivered sales data to ESVAC for four years (2010-2013) the current data analysis indicates that the overall sales (mg/PCU) for these countries continues to decline; for this period, the overall reduction was 11.1 %.

Sales of veterinary antimicrobial agents in 26 EU/EEA countries in 2013Fifth ESVAC report120
Tentative explanations provided by some of the countries (see Chapter 2.8.2) for the decline in sales include, among others, the implementation of responsible-use campaigns, changes in animal demographics, restrictions on use, increased awareness of the threat of antimicrobial resistance, and/or the setting of targets. Additional detailed information on national programmes and campaigns on the responsible use of antimicrobial agents is needed before conclusions can be drawn on the efficacy of these campaigns to reduce the sales of antimicrobial agents. At the European level, this would provide data for interventions aimed at best practices for the use of antimicrobial agents in animals.
A large difference in the sales, expressed as the indicator mg/PCU, was observed between the most- and least-selling countries. This is likely to be partly due to differences in the composition of the animal population (e.g. more pigs than cattle, or a high proportion of veal calves within the cattle population) in the various countries. There is also considerable variation in terms of daily dosage and length of treatment between the various antimicrobial agents and formulations used, and other factors must also be considered. Furthermore, differences in the selection of data source — i.e. prescriptions, sales data or purchase data — may have an impact, although this is considered to be low.
In 2013, the prescribing patterns for the various veterinary antimicrobial classes, expressed as mg/PCU, varied substantially between the countries. Notable variations were observed between the different countries in the proportion accounted for by the CIAs with highest priority in human medicine — 3rd- and 4th-generation cephalosporins, fluoroquinolones and macrolides, with proportions ranging from 0.0005 % to 0.7 %, 0.005 % to 8 %, and 0 % to 23 %, respectively. Since the major proportion of the sales of these classes/subclasses was accounted for by macrolides, the variations observed between the countries are likely, in part, to reflect differences between them in the relative proportion of the various animal species and, in particular, differences in pig production (use of macrolides).
Part of the variations in both the sales patterns and the magnitudes of sales may be due to differences between the countries in the relative proportion of the various animal species, the availability of veterinary antimicrobial products on the market, prices, animal-production systems (e.g. veal as opposed to beef cattle on pasture) and the general situation with regard to infectious diseases. However, these factors cannot fully explain the differences. Other influences, such as the focus on disease prevention by management, or vaccines, or implementation of responsible-use campaigns in some countries have also impacted on the sales patterns. In addition, important variations were observed between the sales, expressed in tonnes, of veterinary antimicrobial agents used almost solely in food-producing animals and of those used in companion animals (tablets). However, it must be noted that human medicinal products containing antimicrobial agents and injectable veterinary medicinal products containing antimicrobial agents may also be used in companion animals, and thus the data on sales of tablets should be interpreted with due care.
Another important finding was that the total sales, both in tonnes and in mg/PCU, of veterinary antimicrobial agents in the 26 EU/EEA countries were mainly accounted for by pharmaceutical forms applicable for mass treatment (premixes) or group treatment (oral powder and oral solution); however, this varies significantly between the countries.
Of the total numbers of product presentations of antimicrobial VMPs applicable for food-producing animals (including horses) sold in 2013 — i.e. product name, pharmaceutical form, strength and pack size (tablets not included) — 82.2 % contained only one active ingredient, 15.9 % contained two active ingredients, 1.8 % contained three active ingredients and 0.2 % contained four active ingredients (these were all intramammaries).
In all 26 countries, in 2013, the proportion of sales (tonnes) of antimicrobial VMPs applicable for group treatment containing two or more active ingredients was relatively low. Of the total sales, 85 %, 14.4 % and 0.6 % of these pharmaceutical forms contained one, two and three active ingredients, respectively. However, as it is possible to mix more than one premix/oral powder and oral solution into feed or drinking water, respectively, these data do not provide a reliable estimate of treatment through feed or drinking water with two or more active ingredients.
4. Concluding remarksIn the current report, the sales of veterinary antimicrobial classes and some subclasses, as well as pharmaceutical forms, are documented for 26 of the 30 EU/EEA countries in 2013. This covers approximately 95 % of the food-producing animal population in the EU/EEA area. Identification of the determining factors reasons behind the variations and changes observed in the consumption of different classes or subclasses of antimicrobial agents remains difficult without data by species, and without taking into account differences in daily dose and length of treatment.

Sales of veterinary antimicrobial agents in 26 EU/EEA countries in 2013Fifth ESVAC report 121
An
nex
1.
Tab
les
Tab
le A
1.
Sal
es,
in t
onne
s of
act
ive
ingr
edie
nt,
of v
eter
inar
y an
timic
robi
al a
gent
s ap
plic
able
mai
nly
for
food
-pro
duci
ng a
nim
als,
incl
udin
g ho
rses
, by
ant
imic
robi
al
clas
s (p
rese
nted
acc
ordi
ng t
o th
e AT
Cve
t hi
erar
chic
al s
yste
m)
by c
ount
ry,
for
2013
(ta
blet
s no
t in
clud
ed)
Cou
ntr
yTetracyclines
Amphenicols
Penicillins
1-2 gen. cephalosporins
3-4 gen. cephalosporins
Sulfonamides
Trimethoprim
Macrolides
Lincosamides
Fluoroquinolones
Other quinolones
Aminoglycosides
Polymyxins
Pleuromutilins
Others1
Total tonnes
Aus
tria
30.7
0.3
8.6
0.1
0.3
5.4
0.7
4.6
0.4
0.6
01.
30.
90.
40.
554
.8
Bel
gium
62.3
1.5
82.2
0.1
0.8
61.9
12.6
12.9
4.4
1.7
1.5
1.3
7.8
1.6
6.9
259.
5
Bul
garia
23.3
0.9
6.1
0.03
0.0
2.7
0.3
5.4
1.0
2.7
0.1
1.5
1.1
1.1
0.3
47.5
Cyp
rus
17.2
0.1
5.5
0.00
40.
17.
41.
41.
49.
10.
10.
030.
60.
93.
90.
247
.9
Cze
ch R
epub
lic20
.70.
313
.90.
20.
39.
71.
02.
80.
21.
20.
032.
40.
83.
30.
457
.2
Den
mar
k33
.71.
027
.90.
10.
110
.81.
912
.32.
40.
021.
03.
40.
611
.12.
410
8.7
Esto
nia
1.7
0.04
3.5
0.1
0.1
0.2
0.05
0.5
0.2
0.2
00.
50.
70.
50.
38.
5
Finl
and
2.4
0.1
6.2
0.03
0.01
2.5
0.5
0.5
0.1
0.1
00.
030
0.04
012
.5
Fran
ce27
1.8
4.7
81.0
1.7
2.1
132.
620
.251
.04.
34.
44.
751
.942
.45.
62.
568
0.9
Ger
man
y48
2.0
5.1
531.
60.
53.
615
2.8
18.8
126.
117
.311
.70
28.6
124.
718
.85.
51,
527.
1
Hun
gary
90.7
1.8
35.0
0.1
0.2
4.9
1.1
4.8
6.6
7.1
0.1
1.9
7.6
12.2
1.4
175.
5
Icel
and
0.03
00.
30
<0.
001
0.04
0.01
00
<0.
001
0.00
40.
20
00
0.6
Irel
and
36.9
1.9
20.9
0.7
0.2
21.8
1.9
6.3
0.4
0.9
07.
10.
10.
010.
699
.7
Ital
y41
1.5
18.0
330.
90.
71.
613
7.5
16.2
98.1
76.1
9.9
21.6
17.9
120.
632
.225
.81,
318.
6
Latv
ia1.
70.
022.
00.
040.
10.
30.
040.
30.
020.
4<
0.00
10.
80.
30.
30.
046.
2
Lith
uani
a1.
50.
23.
80.
10.
11.
10.
21.
50.
20.
30.
21.
70.
041.
10.
512
.5
Luxe
mbo
urg
1.0
0.1
0.5
0.01
0.03
0.4
0.08
0.1
0.04
0.04
0.04
0.1
0.2
0.03
0.1
2.7
Net
herlan
ds87
.23.
647
.40.
20.
0242
.57.
925
.00.
70.
42.
43.
62.
01.
41.
122
5.4
Nor
way
0.1
0.3
3.0
00.
001
1.5
0.3
0.00
30
0.01
0.7
0.6
00.
10
6.6
Pola
nd23
1.4
6.5
147.
41.
20.
643
.73.
830
.64.
233
.60.
332
.616
.819
.83.
057
5.5
Port
ugal
70.3
1.3
30.3
0.7
0.4
5.1
1.0
22.2
5.1
7.9
0.2
2.3
18.2
11.7
2.6
179.
3
Slo
vaki
a4.
80.
22.
40.
10.
11.
70.
21.
40.
10.
70.
030.
80.
32.
30.
615
.7
Slo
veni
a0.
60.
11.
60.
020.
020.
50.
10.
10.
10.
30.
003
0.4
0.01
0.05
0.1
4.0
Spa
in87
9.6
14.3
498.
60.
51.
972
.213
.214
5.9
113.
564
.64.
112
1.0
149.
095
.628
.02,
202
Swed
en0.
90.
16.
10
0.00
41.
70.
30.
40
0.03
0.01
0.3
0.1
0.1
010
.0
Uni
ted
Kin
gdom
219
3.3
81
.00.
61.
249
.49.
740
.35.
62.
40
14.8
11
.412
.242
1.9
Tota
l 26
cou
ntr
ies
2,9
57
62
1,9
78
81
47
70
11
35
94
25
21
51
37
29
74
95
23
59
58
,06
0
1 Bac
itrac
in,
paro
myc
in a
nd s
pect
inom
ycin
(cl
assi
fied
as 'O
ther
ant
ibac
terial
s' in
the
ATC
vet
syst
em).
2 P
olym
yxin
s an
d am
phen
icol
s ar
e ag
greg
ated
with
'Oth
ers'
for
con
fiden
tialit
y re
ason
s.

Sales of veterinary antimicrobial agents in 26 EU/EEA countries in 2013Fifth ESVAC report122
Tab
le A
2.
Dis
trib
utio
n of
sal
es,
in m
g/PC
U,
of v
eter
inar
y an
timic
robi
al a
gent
s ap
plic
able
mai
nly
for
food
-pro
duci
ng a
nim
als,
incl
udin
g ho
rses
1 , b
y ad
min
istr
atio
n ro
ute/
form
and
cou
ntry
, fo
r 20
13
Cou
ntr
y
Premix
Oral powder
Oral solution
Injection
Oral paste
Bolus
Intramammary prep.
Intrauterine prep.
Total mg/PCU
Aus
tria
3.0
45.6
1.4
5.5
00
1.3
0.3
57.1
Bel
gium
31.3
108.
92.
213
.30.
030
0.5
0.2
156.
4
Bul
garia
55.9
31.0
12.7
12.2
00
3.5
0.8
116.
1
Cyp
rus
347.
642
.216
.216
.30.
060.
23.
30.
0642
5.9
Cze
ch R
epub
lic18
.222
.029
.210
.70.
040.
002
1.3
0.6
82.0
Den
mar
k1.
26.
521
.415
.10.
40.
007
0.2
0.1
44.9
Esto
nia
1.0
38.2
4.3
16.6
00
1.9
0.2
62.2
Finl
and
2.2
6.9
0.02
13.6
1.1
00.
50
24.3
Fran
ce36
.00
43.8
13.9
0.1
0.00
30.
90.
294
.9
Ger
man
y0.
492
.377
.87.
20.
090
0.9
0.6
179.
2
Hun
gary
143.
261
.217
.67.
40.
008
00.
40.
323
0.1
Icel
and
0.03
0.2
0.6
4.2
0.01
00.
30.
15.
4
Irel
and
19.7
8.2
9.3
16.6
0.04
0.4
2.3
0.01
56.5
Ital
y13
3.9
104.
145
.017
.70.
20.
0002
0.5
0.2
301.
6
Latv
ia0.
519
.02.
511
.80.
005
03.
10.
137
.0
Lith
uani
a0.
69.
77.
37.
80
08.
62.
636
.6
Luxe
mbo
urg
035
.14.
412
.70.
001
0.2
0.9
0.2
53.5
Net
herlan
ds1.
253
.26.
28.
20
0.04
0.9
0.2
69.9
Nor
way
0.5
0.1
0.2
1.9
0.7
00.
20.
13.
7
Pola
nd10
.810
7.7
15.3
14.2
00
3.0
0.3
151.
3
Port
ugal
134.
616
.227
.98.
10.
007
00.
40.
0318
7.2
Slo
vaki
a10
.63.
232
.514
.90.
010
1.2
0.1
62.5
Slo
veni
a2.
48.
12.
68.
10
01.
00.
222
.4
Spa
in21
7.9
65.0
20.2
13.7
0.02
00.
20.
0431
7.1
Swed
en0.
30.
40.
79.
61.
40
0.2
0.00
212
.6
Uni
ted
Kin
gdom
38.7
10.6
4.9
6.9
0.1
0.4
0.4
0.01
62.0
1 In
ject
able
ant
imic
robi
al V
MPs
incl
uded
are
als
o us
ed in
com
pani
on a
nim
als.
Tab
lets
not
incl
uded
.

Sales of veterinary antimicrobial agents in 26 EU/EEA countries in 2013Fifth ESVAC report 123
Tab
le A
3.
Per
cent
age
of s
ales
, in
mg/
PCU
, of
pre
mix
es b
y ve
terina
ry a
ntim
icro
bial
cla
ss (
acco
rdin
g to
ATC
vet
syst
em)
by c
ount
ry,
for
2013
1
Cou
ntr
y
Tetracyclines
Amphenicols
Penicillins
Sulfonamides
Trimethoprim
Macrolides
Lincosamides
Other quinolones
Aminoglycosides
Polymyxins
Pleuromutilins
Others2
Total mg/PCU premixes
Aus
tria
26.4
0.03
00
050
.99.
90
00.
62.
39.
93.
0
Bel
gium
16.7
0.00
122
.339
.57.
97.
00.
90
0.2
3.8
1.1
0.6
31.3
Bul
garia
78.2
2.3
04.
00
13.2
0.01
00
0.8
1.4
055
.9
Cyp
rus
33.3
09.
716
.33.
32.
223
.20
02.
39.
50.
234
7.6
Cze
ch R
epub
lic32
.80.
325
.215
.22.
512
.20.
40
02.
47.
61.
418
.2
Den
mar
k0
02.
049
.49.
90.
014.
131
.30
00.
13.
11.
2
Esto
nia
00
00
043
.728
.20
00
028
.21.
0
Finl
and
49.8
8.4
03.
40.
731
.26.
60
00
00
2.2
Fran
ce48
.80
4.9
24.0
4.0
5.8
0.9
0.2
3.8
6.4
1.0
0.2
36.0
Ger
man
y25
.50
3.0
55.3
11.1
0.6
4.5
00
0.1
0.00
80
0.4
Hun
gary
71.1
0.3
7.4
0.3
0.07
2.1
4.5
00
4.5
8.6
1.0
143.
2
Icel
and
00
00
00
010
00
00
00.
03
Irel
and
60.6
0.06
9.0
18.0
3.6
8.0
0.1
00.
40
00.
119
.7
Ital
y38
.40.
822
.211
.60.
94.
36.
81.
20.
59.
33.
80.
313
3.9
Latv
ia14
.90
00
085
.10
00
00
00.
5
Lith
uani
a0
4.0
00
00
28.2
00
067
.80
0.6
Luxe
mbo
urg
00
00
00
00
00
00
0N
ethe
rlan
ds65
.90
0.5
23.6
4.7
2.5
0.02
00
02.
60.
01.
2
Nor
way
030
.90
00
00
69.1
00
00
0.5
Pola
nd14
.00.
210
.760
.20.
69.
60.
70
0.1
2.2
1.7
0.04
10.8
Port
ugal
44.5
0.5
12.6
2.3
0.5
14.5
0.7
0.03
0.6
13.8
8.3
1.2
134.
6
Slo
vaki
a75
.90.
26.
11.
70.
085.
30.
90
01.
48.
10.
410
.6
Slo
veni
a20
.77.
00
12.4
012
.219
.40
00
8.8
19.4
2.4
Spa
in48
.80.
321
.90.
80.
077.
22.
10
4.3
7.5
6.0
1.0
217.
9
Swed
en2.
919
.50
00
51.4
02.
90
023
.20
0.3
Uni
ted
Kin
gdom
61.0
0.2
6.0
14.9
3.0
10.7
0.3
00.
60
3.2
0.2
38.7
1 N
eglig
ible
am
ount
of ce
phal
ospo
rins
and
fluo
roqu
inol
ones
sol
d no
t in
clud
ed in
the
tab
le.
2 Bac
itrac
in a
nd s
pect
inom
ycin
(cl
assi
fied
as ‘O
ther
ant
ibac
terial
s’ in
the
ATC
vet
syst
em).
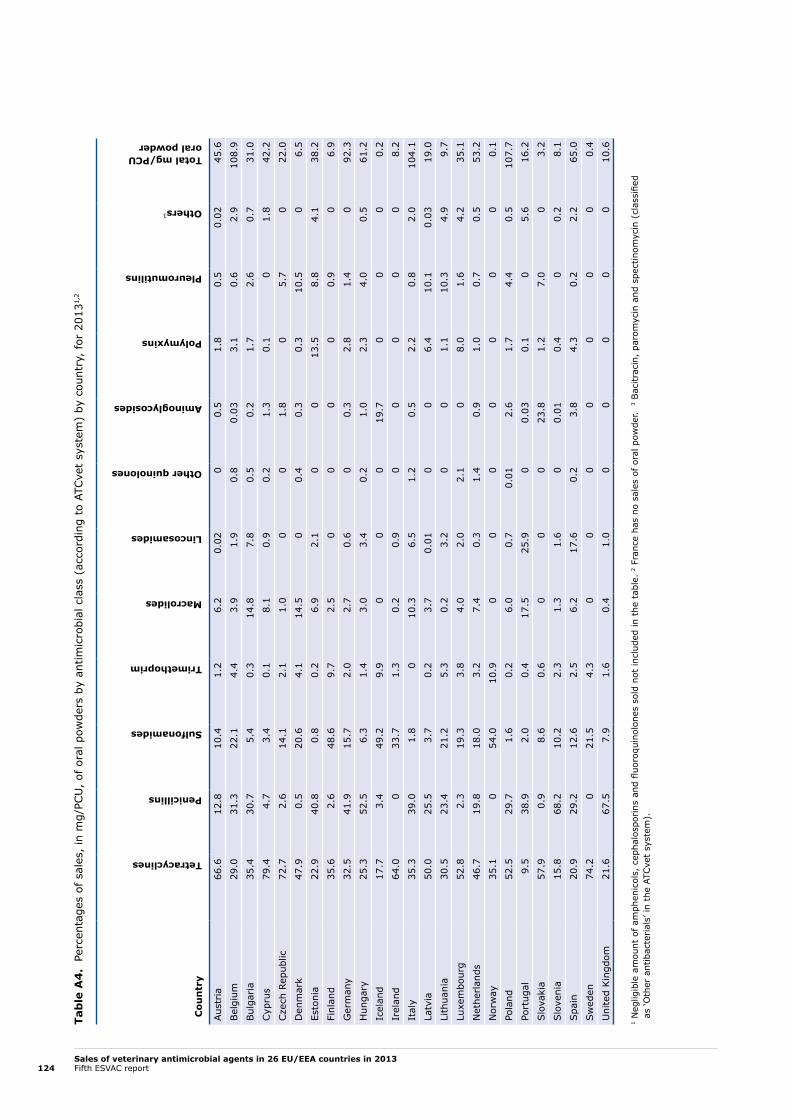
Sales of veterinary antimicrobial agents in 26 EU/EEA countries in 2013Fifth ESVAC report124
Tab
le A
4.
Per
cent
ages
of sa
les,
in m
g/PC
U,
of o
ral p
owde
rs b
y an
timic
robi
al c
lass
(ac
cord
ing
to A
TCve
t sy
stem
) by
cou
ntry
, fo
r 20
131,
2
Cou
ntr
y
Tetracyclines
Penicillins
Sulfonamides
Trimethoprim
Macrolides
Lincosamides
Other quinolones
Aminoglycosides
Polymyxins
Pleuromutilins
Others3
Total mg/PCU oral powder
Aus
tria
66.6
12.8
10.4
1.2
6.2
0.02
00.
51.
80.
50.
0245
.6
Bel
gium
29.0
31.3
22.1
4.4
3.9
1.9
0.8
0.03
3.1
0.6
2.9
108.
9
Bul
garia
35.4
30.7
5.4
0.3
14.8
7.8
0.5
0.2
1.7
2.6
0.7
31.0
Cyp
rus
79.4
4.7
3.4
0.1
8.1
0.9
0.2
1.3
0.1
01.
842
.2
Cze
ch R
epub
lic72
.72.
614
.12.
11.
00
01.
80
5.7
022
.0
Den
mar
k47
.90.
520
.64.
114
.50
0.4
0.3
0.3
10.5
06.
5
Esto
nia
22.9
40.8
0.8
0.2
6.9
2.1
00
13.5
8.8
4.1
38.2
Finl
and
35.6
2.6
48.6
9.7
2.5
00
00
0.9
06.
9
Ger
man
y32
.541
.915
.72.
02.
70.
60
0.3
2.8
1.4
092
.3
Hun
gary
25.3
52.5
6.3
1.4
3.0
3.4
0.2
1.0
2.3
4.0
0.5
61.2
Icel
and
17.7
3.4
49.2
9.9
00
019
.70
00
0.2
Irel
and
64.0
033
.71.
30.
20.
90
00
00
8.2
Ital
y35
.339
.01.
80
10.3
6.5
1.2
0.5
2.2
0.8
2.0
104.
1
Latv
ia50
.025
.53.
70.
23.
70.
010
06.
410
.10.
0319
.0
Lith
uani
a30
.523
.421
.25.
30.
23.
20
01.
110
.34.
99.
7
Luxe
mbo
urg
52.8
2.3
19.3
3.8
4.0
2.0
2.1
08.
01.
64.
235
.1
Net
herlan
ds46
.719
.818
.03.
27.
40.
31.
40.
91.
00.
70.
553
.2
Nor
way
35.1
054
.010
.90
00
00
00
0.1
Pola
nd52
.529
.71.
60.
26.
00.
70.
012.
61.
74.
40.
510
7.7
Port
ugal
9.5
38.9
2.0
0.4
17.5
25.9
00.
030.
10
5.6
16.2
Slo
vaki
a57
.90.
98.
60.
60
00
23.8
1.2
7.0
03.
2
Slo
veni
a15
.868
.210
.22.
31.
31.
60
0.01
0.4
00.
28.
1
Spa
in20
.929
.212
.62.
56.
217
.60.
23.
84.
30.
22.
265
.0
Swed
en74
.20
21.5
4.3
00
00
00
00.
4
Uni
ted
Kin
gdom
21.6
67.5
7.9
1.6
0.4
1.0
00
00
010
.6
1 N
eglig
ible
am
ount
of am
phen
icol
s, c
epha
losp
orin
s an
d flu
oroq
uino
lone
s so
ld n
ot in
clud
ed in
the
tab
le.
2 Fr
ance
has
no
sale
s of
ora
l pow
der.
3 B
acitr
acin
, pa
rom
ycin
and
spe
ctin
omyc
in (
clas
sifie
d
as ‘O
ther
ant
ibac
terial
s’ in
the
ATC
vet
syst
em).
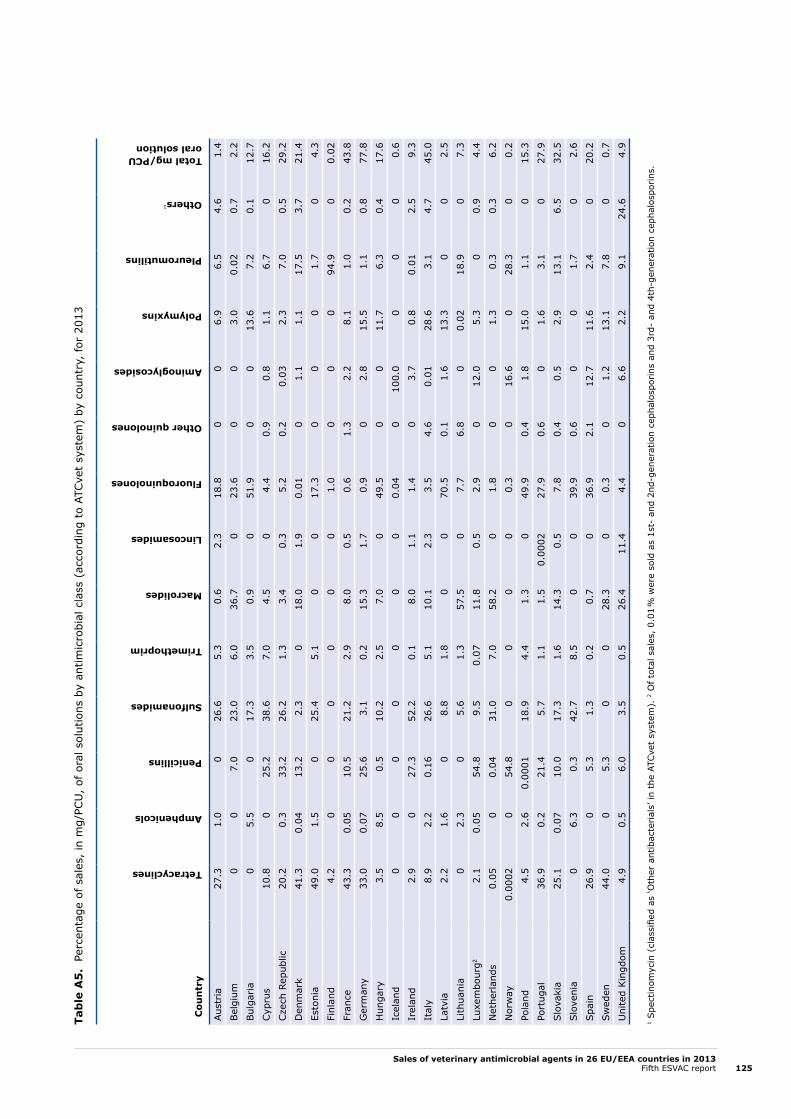
Sales of veterinary antimicrobial agents in 26 EU/EEA countries in 2013Fifth ESVAC report 125
Tab
le A
5.
Per
cent
age
of s
ales
, in
mg/
PCU
, of
ora
l sol
utio
ns b
y an
timic
robi
al c
lass
(ac
cord
ing
to A
TCve
t sy
stem
) by
cou
ntry
, fo
r 20
13
Cou
ntr
y
Tetracyclines
Amphenicols
Penicillins
Sulfonamides
Trimethoprim
Macrolides
Lincosamides
Fluoroquinolones
Other quinolones
Aminoglycosides
Polymyxins
Pleuromutilins
Others1
Total mg/PCU oral solution
Aus
tria
27.3
1.0
026
.65.
30.
62.
318
.80
06.
96.
54.
61.
4
Bel
gium
00
7.0
23.0
6.0
36.7
023
.60
03.
00.
020.
72.
2
Bul
garia
05.
50
17.3
3.5
0.9
051
.90
013
.67.
20.
112
.7
Cyp
rus
10.8
025
.238
.67.
04.
50
4.4
0.9
0.8
1.1
6.7
016
.2
Cze
ch R
epub
lic20
.20.
333
.226
.21.
33.
40.
35.
20.
20.
032.
37.
00.
529
.2
Den
mar
k41
.30.
0413
.22.
30
18.0
1.9
0.01
01.
11.
117
.53.
721
.4
Esto
nia
49.0
1.5
025
.45.
10
017
.30
00
1.7
04.
3
Finl
and
4.2
00
00
00
1.0
00
094
.90
0.02
Fran
ce43
.30.
0510
.521
.22.
98.
00.
50.
61.
32.
28.
11.
00.
243
.8
Ger
man
y33
.00.
0725
.63.
10.
215
.31.
70.
90
2.8
15.5
1.1
0.8
77.8
Hun
gary
3.5
8.5
0.5
10.2
2.5
7.0
049
.50
011
.76.
30.
417
.6
Icel
and
00
00
00
00.
040
100.
00
00
0.6
Irel
and
2.9
027
.352
.20.
18.
01.
11.
40
3.7
0.8
0.01
2.5
9.3
Ital
y8.
92.
20.
1626
.65.
110
.12.
33.
54.
60.
0128
.63.
14.
745
.0
Latv
ia2.
21.
60
8.8
1.8
00
70.5
0.1
1.6
13.3
00
2.5
Lith
uani
a0
2.3
05.
61.
357
.50
7.7
6.8
00.
0218
.90
7.3
Luxe
mbo
urg2
2.1
0.05
54.8
9.5
0.07
11.8
0.5
2.9
012
.05.
30
0.9
4.4
Net
herlan
ds0.
050
0.04
31.0
7.0
58.2
01.
80
01.
30.
30.
36.
2
Nor
way
0.00
020
54.8
00
00
0.3
016
.60
28.3
00.
2
Pola
nd4.
52.
60.
0001
18.9
4.4
1.3
049
.90.
41.
815
.01.
10
15.3
Port
ugal
36.9
0.2
21.4
5.7
1.1
1.5
0.00
0227
.90.
60
1.6
3.1
027
.9
Slo
vaki
a25
.10.
0710
.017
.31.
614
.30.
57.
80.
40.
52.
913
.16.
532
.5
Slo
veni
a0
6.3
0.3
42.7
8.5
00
39.9
0.6
00
1.7
02.
6
Spa
in26
.90
5.3
1.3
0.2
0.7
036
.92.
112
.711
.62.
40
20.2
Swed
en44
.00
5.3
00
28.3
00.
30
1.2
13.1
7.8
00.
7
Uni
ted
Kin
gdom
4.9
0.5
6.0
3.5
0.5
26.4
11.4
4.4
06.
62.
29.
124
.64.
9
1 Spe
ctin
omyc
in (
clas
sifie
d as
‘Oth
er a
ntib
acte
rial
s’ in
the
ATC
vet
syst
em).
2 O
f to
tal s
ales
, 0.
01 %
wer
e so
ld a
s 1s
t- a
nd 2
nd-g
ener
atio
n ce
phal
ospo
rins
and
3rd
- an
d 4t
h-ge
nera
tion
ceph
alos
porins
.
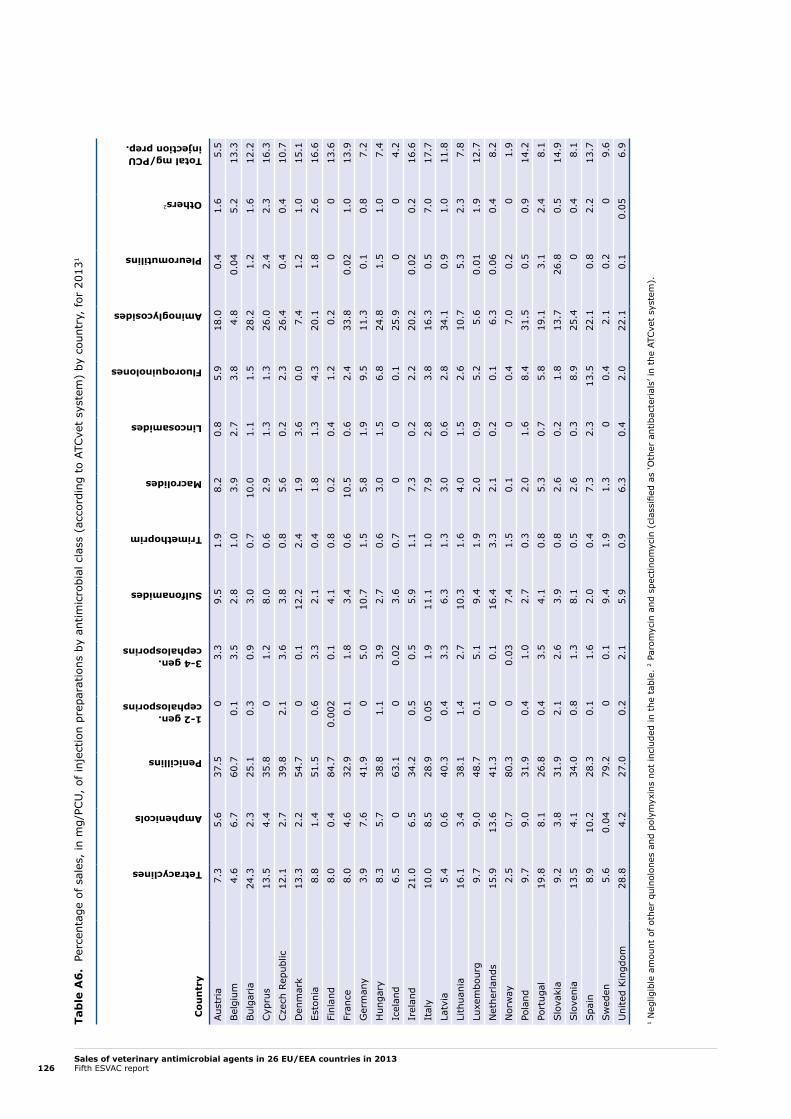
Sales of veterinary antimicrobial agents in 26 EU/EEA countries in 2013Fifth ESVAC report126
Tab
le A
6.
Per
cent
age
of s
ales
, in
mg/
PCU
, of
inje
ctio
n pr
epar
atio
ns b
y an
timic
robi
al c
lass
(ac
cord
ing
to A
TCve
t sy
stem
) by
cou
ntry
, fo
r 20
131
Cou
ntr
y
Tetracyclines
Amphenicols
Penicillins
1-2 gen. cephalosporins
3-4 gen. cephalosporins
Sulfonamides
Trimethoprim
Macrolides
Lincosamides
Fluoroquinolones
Aminoglycosides
Pleuromutilins
Others2
Total mg/PCU injection prep.
Aus
tria
7.3
5.6
37.5
03.
39.
51.
98.
20.
85.
918
.00.
41.
65.
5
Bel
gium
4.6
6.7
60.7
0.1
3.5
2.8
1.0
3.9
2.7
3.8
4.8
0.04
5.2
13.3
Bul
garia
24.3
2.3
25.1
0.3
0.9
3.0
0.7
10.0
1.1
1.5
28.2
1.2
1.6
12.2
Cyp
rus
13.5
4.4
35.8
01.
28.
00.
62.
91.
31.
326
.02.
42.
316
.3
Cze
ch R
epub
lic12
.12.
739
.82.
13.
63.
80.
85.
60.
22.
326
.40.
40.
410
.7
Den
mar
k13
.32.
254
.70
0.1
12.2
2.4
1.9
3.6
0.0
7.4
1.2
1.0
15.1
Esto
nia
8.8
1.4
51.5
0.6
3.3
2.1
0.4
1.8
1.3
4.3
20.1
1.8
2.6
16.6
Finl
and
8.0
0.4
84.7
0.00
20.
14.
10.
80.
20.
41.
20.
20
013
.6
Fran
ce8.
04.
632
.90.
11.
83.
40.
610
.50.
62.
433
.80.
021.
013
.9
Ger
man
y3.
97.
641
.90
5.0
10.7
1.5
5.8
1.9
9.5
11.3
0.1
0.8
7.2
Hun
gary
8.3
5.7
38.8
1.1
3.9
2.7
0.6
3.0
1.5
6.8
24.8
1.5
1.0
7.4
Icel
and
6.5
063
.10
0.02
3.6
0.7
00
0.1
25.9
00
4.2
Irel
and
21.0
6.5
34.2
0.5
0.5
5.9
1.1
7.3
0.2
2.2
20.2
0.02
0.2
16.6
Ital
y10
.08.
528
.90.
051.
911
.11.
07.
92.
83.
816
.30.
57.
017
.7
Latv
ia5.
40.
640
.30.
43.
36.
31.
33.
00.
62.
834
.10.
91.
011
.8
Lith
uani
a16
.13.
438
.11.
42.
710
.31.
64.
01.
52.
610
.75.
32.
37.
8
Luxe
mbo
urg
9.7
9.0
48.7
0.1
5.1
9.4
1.9
2.0
0.9
5.2
5.6
0.01
1.9
12.7
Net
herlan
ds15
.913
.641
.30
0.1
16.4
3.3
2.1
0.2
0.1
6.3
0.06
0.4
8.2
Nor
way
2.5
0.7
80.3
00.
037.
41.
50.
10
0.4
7.0
0.2
01.
9
Pola
nd9.
79.
031
.90.
41.
02.
70.
32.
01.
68.
431
.50.
50.
914
.2
Port
ugal
19.8
8.1
26.8
0.4
3.5
4.1
0.8
5.3
0.7
5.8
19.1
3.1
2.4
8.1
Slo
vaki
a9.
23.
831
.92.
12.
63.
90.
82.
60.
21.
813
.726
.80.
514
.9
Slo
veni
a13
.54.
134
.00.
81.
38.
10.
52.
60.
38.
925
.40
0.4
8.1
Spa
in8.
910
.228
.30.
11.
62.
00.
47.
32.
313
.522
.10.
82.
213
.7
Swed
en5.
60.
0479
.20
0.1
9.4
1.9
1.3
00.
42.
10.
20
9.6
Uni
ted
Kin
gdom
28.8
4.2
27.0
0.2
2.1
5.9
0.9
6.3
0.4
2.0
22.1
0.1
0.05
6.9
1 N
eglig
ible
am
ount
of ot
her
quin
olon
es a
nd p
olym
yxin
s no
t in
clud
ed in
the
tab
le.
2 Pa
rom
ycin
and
spe
ctin
omyc
in (
clas
sifie
d as
‘Oth
er a
ntib
acte
rial
s’ in
the
ATC
vet
syst
em).

Sales of veterinary antimicrobial agents in 26 EU/EEA countries in 2013Fifth ESVAC report 127
Annex 2. Variables to be reported for each antimicrobial veterinary medicinal product; standardisation of the data
Table A7. Variables reported to ESVAC for each antimicrobial veterinary medicinal product for 2013
Variable Description of variable Justification
COUNTRY ISO code (http://www.iso.org/iso/country_codes) To identify place of collected sales data.
YEAR To identify time period for collected sales data.
PR
OD
UC
T IN
FOR
MA
TIO
N
MA Marketing-authorisation number To allow a unique identification of the veterinary medicinal product (VMP) and enable link with other databases.
To allow for market analysis if all the products are available.
ID Medicinal product package code value
Digit code being a unique identifier for each package size, strength and formulation of the VMP. Because it is a key variable in many databases it has to be stable over time, i.e. so that VMPs no longer available on the market or that are no longer registered can still be identified to allow for analysis of historical data.
To allow for analysis of historical data.
To allow for identification of duplicate reporting of sales.
NAME Medicinal product name (in national language)
e.g. Harmony vet tablets 2 × 30; Harmony vet long-acting injection 10 ml.
For validation purposes.
To allow, for example, for analysis of use of, for example, long-acting preparations and antimicrobial resistance.
FORM Pharmaceutical form
Bolus (BOLUS), Injection (INJ), Intramammary (INTRAMAM), Intramammary dry cow treatment (INTRAMAM-DC), Oral solution (ORAL SOLU), Oral paste (ORAL PASTE), Oral powder (ORAL POWD), Premix (PREMIX), Capsules and Tablets, etc. (TABL), Intrauterine preparation (INTRAUT).
Important to avoid misinterpretation of pharmaceutical form if given in a language other than English.
Allows for reporting of data as individual or group treatment.
PACKSIZE Content quantity in package: pack size (numerical only)
e.g. 100 for 100 tablets or 100 intramammaries; 10 for 10 ml injection; Package of 2 kg premix: 2; Box of 10 blisters of 30 tablets: 300; Box of 12 injectors: 12.
To allow for calculation of the amount of active ingredient in each package/product.
PACKSIZE Content unit of measurement
e.g. ML, L, G, KG, PIECE (for example, for tablets, capsules, bolus and intramammaries).
To allow for calculation of amount active ingredient in each package/product.
ATCvet - 5th LEVEL
ATCvet: Anatomical Therapeutic Chemical (Classification) Veterinary
WHO ATCvet code last version to be used.
Generally, a classification system is necessary to have common language when reporting use and analysing data with data on AMR, e.g. for 3rd- and 4th-generation cephalosporins.
To have a common language for defining confidentiality of the data (can be converted into ATCvet 3rd level).
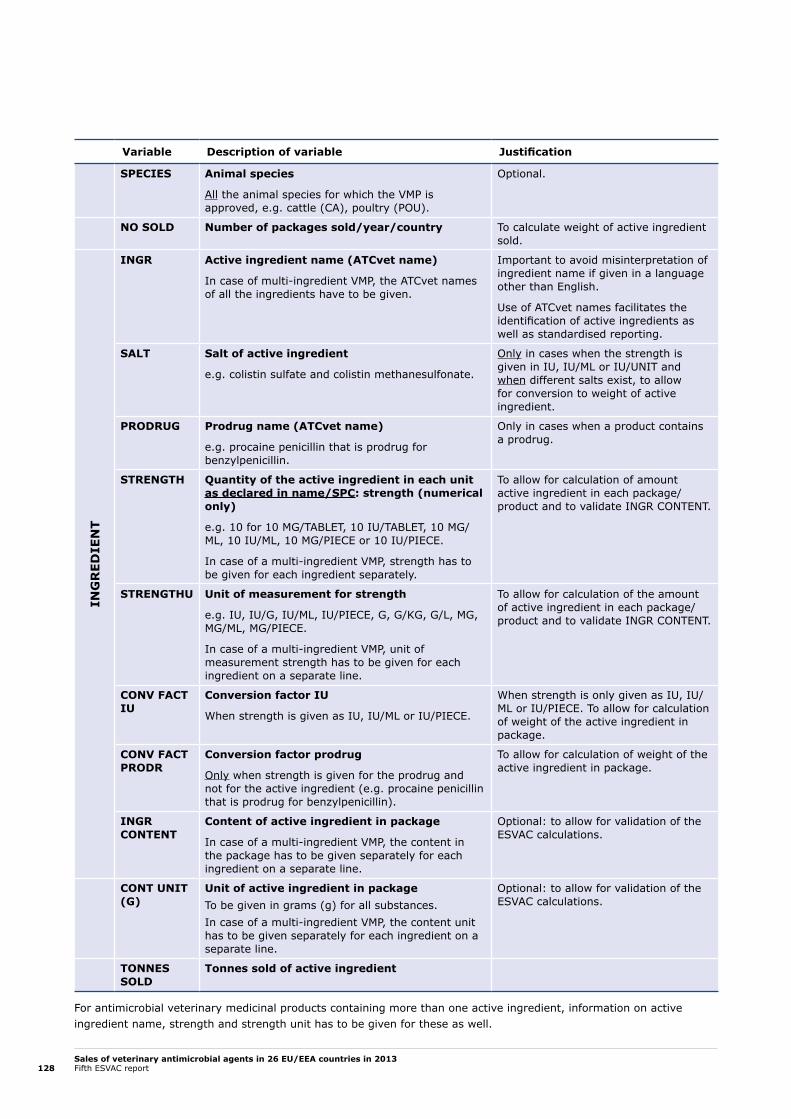
Sales of veterinary antimicrobial agents in 26 EU/EEA countries in 2013Fifth ESVAC report128
Variable Description of variable Justification
SPECIES Animal species
All the animal species for which the VMP is approved, e.g. cattle (CA), poultry (POU).
Optional.
NO SOLD Number of packages sold/year/country To calculate weight of active ingredient sold.
ING
RED
IEN
T
INGR Active ingredient name (ATCvet name)
In case of multi-ingredient VMP, the ATCvet names of all the ingredients have to be given.
Important to avoid misinterpretation of ingredient name if given in a language other than English.
Use of ATCvet names facilitates the identification of active ingredients as well as standardised reporting.
SALT Salt of active ingredient
e.g. colistin sulfate and colistin methanesulfonate.
Only in cases when the strength is given in IU, IU/ML or IU/UNIT and when different salts exist, to allow for conversion to weight of active ingredient.
PRODRUG Prodrug name (ATCvet name)
e.g. procaine penicillin that is prodrug for benzylpenicillin.
Only in cases when a product contains a prodrug.
STRENGTH Quantity of the active ingredient in each unit as declared in name/SPC: strength (numerical only)
e.g. 10 for 10 MG/TABLET, 10 IU/TABLET, 10 MG/ML, 10 IU/ML, 10 MG/PIECE or 10 IU/PIECE.
In case of a multi-ingredient VMP, strength has to be given for each ingredient separately.
To allow for calculation of amount active ingredient in each package/product and to validate INGR CONTENT.
STRENGTHU Unit of measurement for strength
e.g. IU, IU/G, IU/ML, IU/PIECE, G, G/KG, G/L, MG, MG/ML, MG/PIECE.
In case of a multi-ingredient VMP, unit of measurement strength has to be given for each ingredient on a separate line.
To allow for calculation of the amount of active ingredient in each package/product and to validate INGR CONTENT.
CONV FACT IU
Conversion factor IU
When strength is given as IU, IU/ML or IU/PIECE.
When strength is only given as IU, IU/ML or IU/PIECE. To allow for calculation of weight of the active ingredient in package.
CONV FACT PRODR
Conversion factor prodrug
Only when strength is given for the prodrug and not for the active ingredient (e.g. procaine penicillin that is prodrug for benzylpenicillin).
To allow for calculation of weight of the active ingredient in package.
INGR CONTENT
Content of active ingredient in package
In case of a multi-ingredient VMP, the content in the package has to be given separately for each ingredient on a separate line.
Optional: to allow for validation of the ESVAC calculations.
CONT UNIT (G)
Unit of active ingredient in packageTo be given in grams (g) for all substances. In case of a multi-ingredient VMP, the content unit has to be given separately for each ingredient on a separate line.
Optional: to allow for validation of the ESVAC calculations.
TONNES SOLD
Tonnes sold of active ingredient
For antimicrobial veterinary medicinal products containing more than one active ingredient, information on active ingredient name, strength and strength unit has to be given for these as well.

Sales of veterinary antimicrobial agents in 26 EU/EEA countries in 2013Fifth ESVAC report 129
Table A8. Conversion factors used to convert from international units (IU) to weight (mg) of active ingredient, based on WHO standards11
Active ingredient IU/mg Conversion factor (mg/IU)
Bacitracin 74 0.01351
Benzylpenicillin (and prodrugs to benzylpenicillin)4 1,667 0.00060
Chlortetracycline2 900 0.00111
Colistin sulphate 20,500 0.00005
Colistin methane sulphonate3 12,700 0.00008
Dihydrostreptomycin 820 0.00122
Erythromycin 920 0.00109
Gentamicin 620 0.00161
Kanamycin 796 0.00126
Neomycin 755 0.00133
Framycetin 670 0.00149
Oxytetracycline 870 0.00115
Paromomycin2 675 0.00148
Polymyxin B 8,403 0.00012
Spiramycin 3,200 0.00031
Streptomycin 785 0.00127
Tetracycline 982 0.00102
Tobramycin 875 0.00114
Tylosin 1,000 0.001001 WHO standards (http://crs.pheur.org/db/4DCGI/search?vSelectName=4&vContains=1&vtUserName=ISA&OK=Search). 2 WHO Pharmacopoeia (http://apps.who.int/phint/en/p/docf/). 3 WHO International Biological Reference Preparations (http://www.who.int/bloodproducts/catalogue/AntiJan10.pdf). 4 Martindale (http://www.medicinescomplete.com/mc/martindale/current/141-b.htm?q=procain %20penicillin&t= search&ss=text&p=2#_hit).
Table A9. Conversion factors used to convert from prodrug content to content of active ingredient1
Prodrug Conversion factor Active ingredient
Benethamine benzylpenicillin 0.65 Benzylpenicillin
Benzathine benzylpenicillin 0.39 Benzylpenicillin
Cefapirin benzathine 0.41 Cefapirin
Cefalexin benzathine 0.36 Cefalexin
Cloxacillin benzathine 0.43 Cloxacillin
Oxacillin benzathine 0.69 Oxacilline
Penethamate hydriodide 0.63 Benzylpenicillin
Procaine penicillin 0.61 Benzylpenicillin
Procaine benzylpenicillin 0.61 Benzyl penicillin
1 Martindale (http://www.medicinescomplete.com/mc/martindale/current/141-b.htm?q=procain %20penicillin&t= search&ss=text&p=2#_hit).

Sales of veterinary antimicrobial agents in 26 EU/EEA countries in 2013Fifth ESVAC report130
Annex 3. Population correction unit (PCU)
Table A10. Animal categories included in the calculation of the population correction unit (PCU) and data types to be reported
Animal category Numbers/tonnes
Cattle (heads)
Slaughtered cows
Slaughtered heifers
Slaughtered bullocks and bulls
Slaughtered calves and young cattle
Import slaughter
Export slaughter
Import fatteners
Export fatteners
Living dairy cows
Pigs (heads)
Slaughtered pigs
Import slaughter
Export slaughter
Import fatteners
Export fatteners
Living sows
Poultry (heads)
Slaughtered broilers
Slaughtered turkeys
Import slaughter
Export slaughter
Caprinae (heads)
Slaughtered sheep and goats
Import sheep slaughter
Export sheep slaughter
Import sheep fatteners
Export sheep fatteners
Living sheep
Import goats slaughter
Export goats slaughter
Import goats fatteners
Export goats fatteners
Equidae (heads)
Living horses
Rabbits (heads)
Slaughtered rabbits
Fish (tonnes)
Biomass slaughter weight

Sales of veterinary antimicrobial agents in 26 EU/EEA countries in 2013Fifth ESVAC report 131
Table A11. Weights used to calculate the population correction unit
Animal category Weight in kg
Slaughtered or livestock (Eurostat)
Slaughtered cow 425
Slaughtered heifer 200
Slaughtered bullocks and bulls 425
Slaughtered calves and young cattle 140
Dairy cow 425
Slaughtered pig 65
Living sow 240
Broiler 1
Turkey 6.5
Slaughtered sheep and goats 20
Living sheep 75
Horse 400
Rabbit 1.4
Imported/exported for fattening or slaughter (TRACES data)
Slaughtered bovine 425
Fattening bovine 140
Slaughtered pig 65
Fattening pig 25
Slaughtered poultry 1
Slaughtered sheep 20
Fattening sheep 20
Slaughtered goat 20
Fattening goat 20

Sales of veterinary antimicrobial agents in 26 EU/EEA countries in 2013Fifth ESVAC report132
Annex 4. List of antimicrobial classes/active ingredients reported in ESVAC
Table A12 includes all the substances for which sales have been reported, divided by class or subclass.
Pharmacologically active substances that may be used in food-producing animals have to be listed in Table 1 of the Annex to Commission Regulation (EU) No 37/2010. The table details, among others, the food-producing animal species for which those substances are allowed to be used. Table 2 of that annex contains substances that are prohibited from being used in any food-producing species; some of these substances are included in Table A12 below, because they are used in companion animals for which no maximum residue limits (MRLs) are required.
Table A12. List of substances reported sold in ESVAC
Class/subclass Substances
Tetracyclines
Chlortetracycline Doxycycline Oxytetracycline
Tetracycline
Amphenicols
Chloramphenicol1 Florfenicol Thiamphenicol
Penicillins
Beta-lactamase-sensitive penicillins
Benzathine benzylpenicillin Benzathine phenoxymethylpenicillin
Benzylpenicillin
Penethamate hydriodide Phenoxymethylpenicillin Procaine benzylpenicillin
Beta-lactamase-resistant penicillins
Cloxacillin Dicloxacillin Nafcillin
Oxacillin
Penicillins with extended spectrum
Amoxicillin Ampicillin Metampicillin2
Cephalosporins3
First-generation cephalosporins
Cefacetrile Cefadroxil2 Cefalexin
Cefalonium Cefapirin Cefazolin
Third-generation cephalosporins
Cefoperazone Cefovecin2 Ceftiofur
Fourth-generation cephalosporins
Cefquinome
Sulfonamides and trimethoprim
Sulfonamides
Formosulfathiazole Phthalylsulfathiazole Sulfacetamide
Sulfachlorpyridazine Sulfaclozine Sulfadiazine
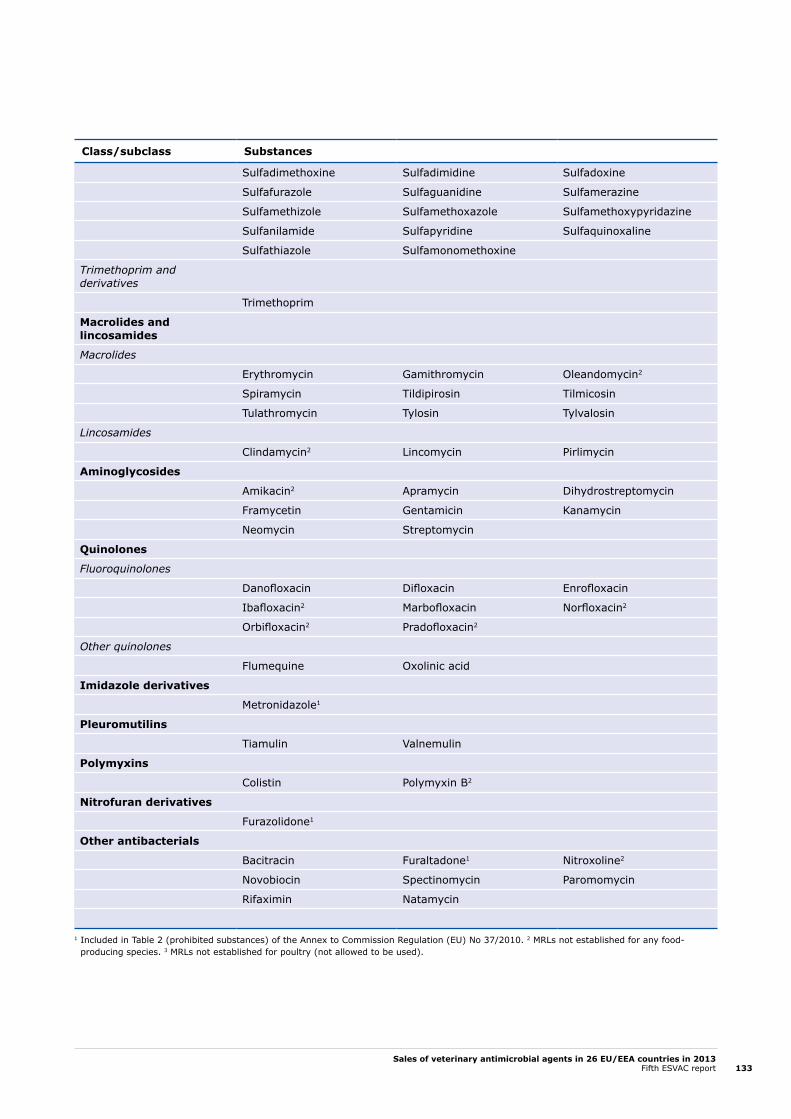
Sales of veterinary antimicrobial agents in 26 EU/EEA countries in 2013Fifth ESVAC report 133
Class/subclass Substances
Sulfadimethoxine Sulfadimidine Sulfadoxine
Sulfafurazole Sulfaguanidine Sulfamerazine
Sulfamethizole Sulfamethoxazole Sulfamethoxypyridazine
Sulfanilamide Sulfapyridine Sulfaquinoxaline
Sulfathiazole Sulfamonomethoxine
Trimethoprim and derivatives
Trimethoprim
Macrolides and lincosamides
Macrolides
Erythromycin Gamithromycin Oleandomycin2
Spiramycin Tildipirosin Tilmicosin
Tulathromycin Tylosin Tylvalosin
Lincosamides
Clindamycin2 Lincomycin Pirlimycin
Aminoglycosides
Amikacin2 Apramycin Dihydrostreptomycin
Framycetin Gentamicin Kanamycin
Neomycin Streptomycin
Quinolones
Fluoroquinolones
Danofloxacin Difloxacin Enrofloxacin
Ibafloxacin2 Marbofloxacin Norfloxacin2
Orbifloxacin2 Pradofloxacin2
Other quinolones
Flumequine Oxolinic acid
Imidazole derivatives
Metronidazole1
Pleuromutilins
Tiamulin Valnemulin
Polymyxins
Colistin Polymyxin B2
Nitrofuran derivatives
Furazolidone1
Other antibacterials
Bacitracin Furaltadone1 Nitroxoline2
Novobiocin Spectinomycin Paromomycin
Rifaximin Natamycin
1 Included in Table 2 (prohibited substances) of the Annex to Commission Regulation (EU) No 37/2010. 2 MRLs not established for any food-producing species. 3 MRLs not established for poultry (not allowed to be used).

Annex 5. Distribution of veterinary medicines; legal framework and data sources by country
Austria
Distribution of veterinary medicines
In Austria, all veterinary medicinal products (VMPs) are prescription-only medicines. VMPs are dispensed by pharmaceutical companies or wholesalers to veterinarians. Only veterinarians are allowed to sell VMPs to farmers. Veterinarians have to confirm the distribution of veterinary drugs to owners of food-producing animals and horses if used for food production. Distribution of VMPs to farmers is restricted to VMPs registered for topical or oral use. Distribution of VMPs for intramammary use or for systemic use (injection) and premixes is restricted to farms that are members of the Austrian Animal Health Service. Sales of VMPs by public pharmacies must be prescribed by a veterinarian; such sales account for a negligible amount of sales for farm animals.
Legal basis for the monitoring of sales
The collection of sales data by pharmaceutical companies and wholesalers is based on the national law on animal drug control, CELEX-Nr.: 390L0167 (Tierarzneimittelkontrollgesetz).
Data sources
Sales data are collected from pharmaceutical companies either producing or importing VMPs and from wholesalers that are assigned by the industry to distribute a product.
Belgium
Distribution of veterinary medicines
In Belgium, all VMPs containing antimicrobial agents are prescription-only medicines. This includes medicated premixes containing pharmaceutically active substances, like antimicrobial agents.
VMPs (pharmaceutical formulation) are distributed through wholesaler-distributors to veterinarians and pharmacists; the wholesaler-distributor obtains the VMPs from a wholesaler or the authorised producer. Antimicrobial VMPs are only available to animal owners by delivery from a pharmacy, on veterinary prescription, or directly from the veterinarian.
Premixes are distributed through wholesalers or wholesaler-distributors directly to feed mills. Only farmers are receivers from feed mills. Medicated feed is always on veterinary prescription.
Note: since 1 June 2014, the Federal Agency of Medicines and Health Products (FAHMP) imposes a fee per package, according to the active ingredient content, for all veterinary antibiotics on the Belgian market on behalf of the Marketing Authorisation Holders. A higher fee is imposed if it concerns critically important antibiotics as 3rd- or 4th-generation cephalosporins, quinolones or macrolides.
Legal basis for the monitoring of sales
The collection of sales data is based on the national law on medicines of 25 March 1964 (Art. 12) and on the Royal Decree of 14 December 2006 on medicines for human and veterinary use (Arts. 221 and 228). Wholesaler-distributors and feed mills are obliged to keep records of all sales, and to deliver these records to the FAHMP on a yearly basis.
Data sources
To avoid double counting, all wholesaler-distributors were asked to provide sales data for the antimicrobial VMPs delivered to pharmacies and veterinarians, while sales data for antimicrobial premixes were provided by the Belgian feed mills licensed to produce medicated feed and to deliver it to Belgian farmers.
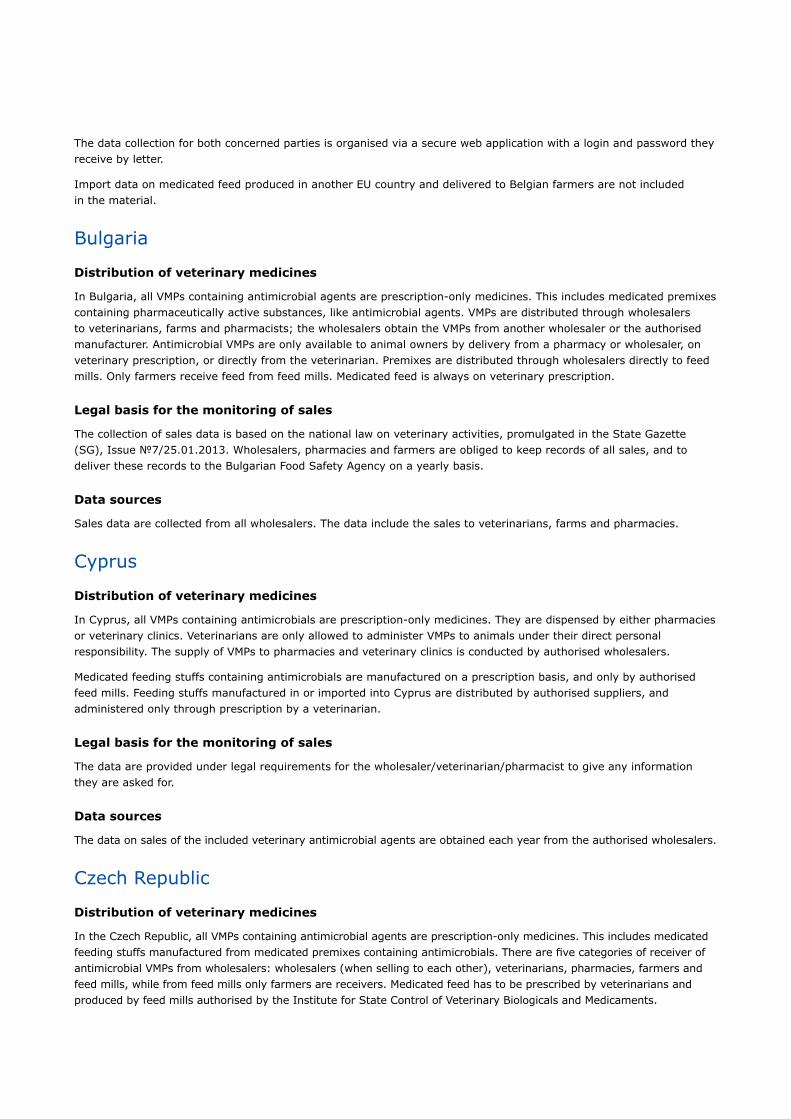
The data collection for both concerned parties is organised via a secure web application with a login and password they receive by letter.
Import data on medicated feed produced in another EU country and delivered to Belgian farmers are not included in the material.
Bulgaria
Distribution of veterinary medicines
In Bulgaria, all VMPs containing antimicrobial agents are prescription-only medicines. This includes medicated premixes containing pharmaceutically active substances, like antimicrobial agents. VMPs are distributed through wholesalers to veterinarians, farms and pharmacists; the wholesalers obtain the VMPs from another wholesaler or the authorised manufacturer. Antimicrobial VMPs are only available to animal owners by delivery from a pharmacy or wholesaler, on veterinary prescription, or directly from the veterinarian. Premixes are distributed through wholesalers directly to feed mills. Only farmers receive feed from feed mills. Medicated feed is always on veterinary prescription.
Legal basis for the monitoring of sales
The collection of sales data is based on the national law on veterinary activities, promulgated in the State Gazette (SG), Issue №7/25.01.2013. Wholesalers, pharmacies and farmers are obliged to keep records of all sales, and to deliver these records to the Bulgarian Food Safety Agency on a yearly basis.
Data sources
Sales data are collected from all wholesalers. The data include the sales to veterinarians, farms and pharmacies.
Cyprus
Distribution of veterinary medicines
In Cyprus, all VMPs containing antimicrobials are prescription-only medicines. They are dispensed by either pharmacies or veterinary clinics. Veterinarians are only allowed to administer VMPs to animals under their direct personal responsibility. The supply of VMPs to pharmacies and veterinary clinics is conducted by authorised wholesalers.
Medicated feeding stuffs containing antimicrobials are manufactured on a prescription basis, and only by authorised feed mills. Feeding stuffs manufactured in or imported into Cyprus are distributed by authorised suppliers, and administered only through prescription by a veterinarian.
Legal basis for the monitoring of sales
The data are provided under legal requirements for the wholesaler/veterinarian/pharmacist to give any information they are asked for.
Data sources
The data on sales of the included veterinary antimicrobial agents are obtained each year from the authorised wholesalers.
Czech Republic
Distribution of veterinary medicines
In the Czech Republic, all VMPs containing antimicrobial agents are prescription-only medicines. This includes medicated feeding stuffs manufactured from medicated premixes containing antimicrobials. There are five categories of receiver of antimicrobial VMPs from wholesalers: wholesalers (when selling to each other), veterinarians, pharmacies, farmers and feed mills, while from feed mills only farmers are receivers. Medicated feed has to be prescribed by veterinarians and produced by feed mills authorised by the Institute for State Control of Veterinary Biologicals and Medicaments.

Sales of veterinary antimicrobial agents in 26 EU/EEA countries in 2013Fifth ESVAC report136
Legal basis for the monitoring of sales
The collection of sales data is based on a national law on pharmaceuticals, Act No. 378/2007 Coll.
Data sources
Sales data were collected from all wholesalers and feed mills licensed in the Czech Republic.
Brief description of data collection
Manufacturers/wholesalers fill in the template with their quarterly sales data, divided into five categories (no data about customers); only sales for veterinarians, pharmacies and farmers are used to calculate consumption.
In the case of medicated premixes, the data reported by manufacturers of medicated feeding-stuffs are used for calculation. Sales to wholesalers and manufacturers of medicated feeding-stuffs are used for verification of VMPs’ sales.
Denmark
Distribution of veterinary medicines
In Denmark, all VMPs are prescription-only medicines, and can only be dispensed either through pharmacies or through a small number of dispensing companies approved by the Danish Medicines Agency to dispense VMPs on legal terms equal to those to which the pharmacies are subject. Both pharmacies and dispensing companies are supplied by pharmaceutical companies and wholesalers. An exemption from the pharmacy/dispensing-company monopoly has been granted for medicated feeds, i.e. feeds into which VMPs formulated as premix are mixed prior to sale. Medicated feed has to be prescribed by veterinarians and produced by feed mills authorised by the Danish Medicines Agency.
Legal basis for the monitoring of sales
All sales of prescription medicines by pharmacies, dispensing companies and feed mills are mandated to be reported to the VetStat database, owned by the Ministry of Food, Agriculture and Fisheries. The pharmacy/dispensing-company sales records include sales of all prescription medicines to animal owners, as well as medicines purchased by veterinary practitioners for use in their practice. Furthermore, it is mandatory for the veterinarians to report to the VetStat medicines used in their own practices.
Data sources
Data on sales of all prescription medicines at package level from pharmacies, dispensing companies, veterinarians and feed mills were retrieved from the VetStat database.
Estonia
Distribution of veterinary medicines
In Estonia, antimicrobial VMPs are prescription-only medicines. VMPs have to be dispensed through pharmacies (general and veterinary) and veterinarians, who are supplied by wholesalers.
Legal basis for the monitoring of sales
Wholesalers are obliged to report the sales of VMPs to the State Agency of Medicines according to the Medicinal Products Act of 2005.
Data source
The State Agency of Medicines collects sales data at package level from wholesalers. Only sales to pharmacies (general and veterinary) and veterinarians are accounted for, to avoid double reporting by including sales to other wholesalers.
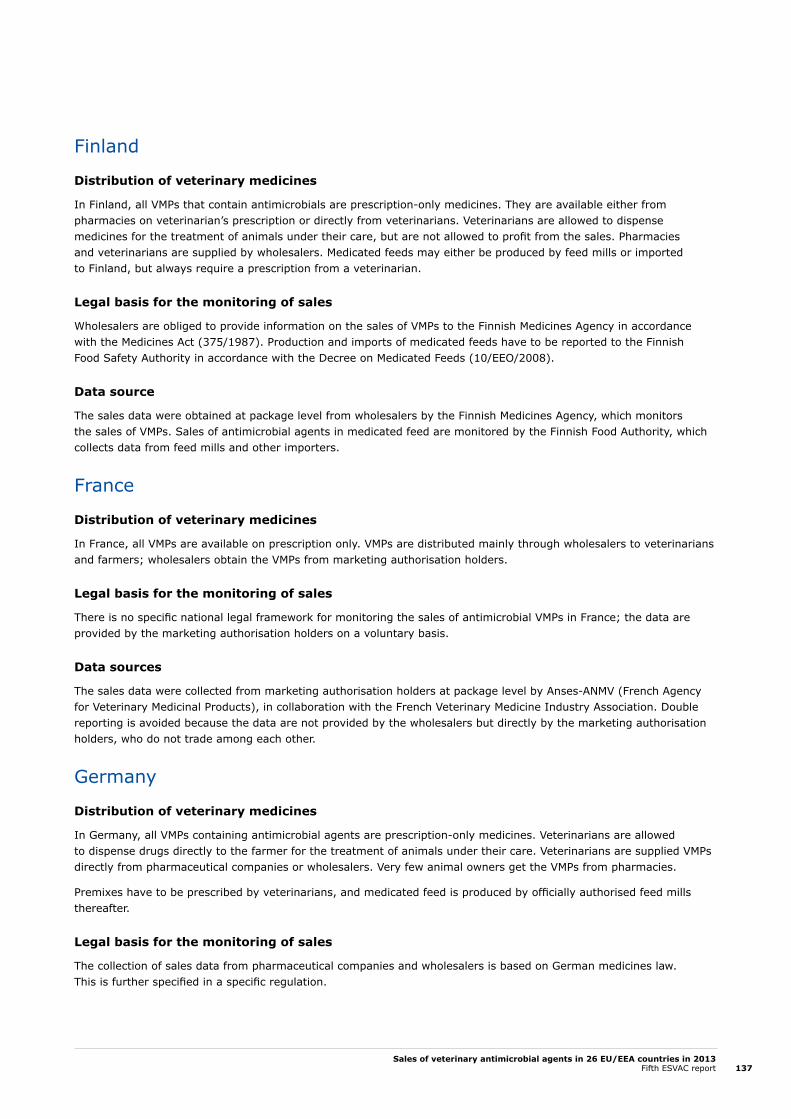
Sales of veterinary antimicrobial agents in 26 EU/EEA countries in 2013Fifth ESVAC report 137
Finland
Distribution of veterinary medicines
In Finland, all VMPs that contain antimicrobials are prescription-only medicines. They are available either from pharmacies on veterinarian’s prescription or directly from veterinarians. Veterinarians are allowed to dispense medicines for the treatment of animals under their care, but are not allowed to profit from the sales. Pharmacies and veterinarians are supplied by wholesalers. Medicated feeds may either be produced by feed mills or imported to Finland, but always require a prescription from a veterinarian.
Legal basis for the monitoring of sales
Wholesalers are obliged to provide information on the sales of VMPs to the Finnish Medicines Agency in accordance with the Medicines Act (375/1987). Production and imports of medicated feeds have to be reported to the Finnish Food Safety Authority in accordance with the Decree on Medicated Feeds (10/EEO/2008).
Data source
The sales data were obtained at package level from wholesalers by the Finnish Medicines Agency, which monitors the sales of VMPs. Sales of antimicrobial agents in medicated feed are monitored by the Finnish Food Authority, which collects data from feed mills and other importers.
France
Distribution of veterinary medicines
In France, all VMPs are available on prescription only. VMPs are distributed mainly through wholesalers to veterinarians and farmers; wholesalers obtain the VMPs from marketing authorisation holders.
Legal basis for the monitoring of sales
There is no specific national legal framework for monitoring the sales of antimicrobial VMPs in France; the data are provided by the marketing authorisation holders on a voluntary basis.
Data sources
The sales data were collected from marketing authorisation holders at package level by Anses-ANMV (French Agency for Veterinary Medicinal Products), in collaboration with the French Veterinary Medicine Industry Association. Double reporting is avoided because the data are not provided by the wholesalers but directly by the marketing authorisation holders, who do not trade among each other.
Germany
Distribution of veterinary medicines
In Germany, all VMPs containing antimicrobial agents are prescription-only medicines. Veterinarians are allowed to dispense drugs directly to the farmer for the treatment of animals under their care. Veterinarians are supplied VMPs directly from pharmaceutical companies or wholesalers. Very few animal owners get the VMPs from pharmacies.
Premixes have to be prescribed by veterinarians, and medicated feed is produced by officially authorised feed mills thereafter.
Legal basis for the monitoring of sales
The collection of sales data from pharmaceutical companies and wholesalers is based on German medicines law. This is further specified in a specific regulation.
Sales of veterinary antimicrobial agents in 26 EU/EEA countries in 2013Fifth ESVAC report138
Data sources
Data on sales to veterinarians were collected by pharmaceutical companies and wholesalers who dispense antimicrobial agents to veterinarians located in Germany. In the case of premixes, sales data were taken from periodic safety update reports (PSURs), because premixes are provided to feed mills on prescription and are thus not included in the data on sales to veterinarians.
Hungary
Distribution of veterinary medicines
In Hungary, all VMPs that contain antimicrobials are prescription-only medicines. All VMPs have to be dispensed through authorised retailers, which are only supplied by authorised wholesalers. Wholesalers are authorised by the National Food Chain Safety Office, and the retailers are authorised by the local government office.
Antimicrobial VMPs can be bought from a wholesaler by other wholesalers, retailers, veterinarians, farmers or feed mills. The route of VMPs must be documented as it must be possible to control the route of each batch from the manufacturer to the farmer.
According to EU rules, medicated feeds are classified as feed and not as VMPs. They have to be prescribed by veterinarians, and produced by feed mills authorised by the government office. Medicated feeds may be imported to Hungary, but require a prescription by a veterinarian, like other medicated feeds. Importation of medicated feeds is supervised by the office which authorises importers and distributors.
Legal basis for the monitoring of sales
The collection of sales data is based on a national law (Decree of the Minister of Agriculture and Rural Development on VMPs).
Data sources
Data were collected from marketing authorisation holders, wholesalers in Hungary, wholesalers from other Member States which deliver VMPs directly to final Hungarian wholesalers, and retailers that import directly from other Member States. These companies only submit data for those products that they themselves put into circulation (there is no double reporting).
Iceland
Distribution of veterinary medicines
In Iceland, all antimicrobial VMPs and almost all other VMPs are prescription-only medicines. They have to be dispensed to animal owners by veterinarians (or used by the veterinarians in their practices), or pharmacies, i.e. veterinarians are allowed to dispense VMPs in the same way as pharmacies. Veterinarians and pharmacies can only purchase VMPs from licensed wholesalers. No medicated feeds for livestock are produced in Iceland.
Legal basis for the monitoring of sales
Wholesalers in Iceland are mandated to provide sales statistics for both human and veterinary medicinal products, as well as for medicated feeding stuffs, to the Icelandic Medicines Agency.
Data sources
The data on sales of the included veterinary antimicrobial agents at package level were provided by wholesalers in Iceland, of which there are only two.

Sales of veterinary antimicrobial agents in 26 EU/EEA countries in 2013Fifth ESVAC report 139
Ireland
Distribution of veterinary medicines
In Ireland, antimicrobial veterinary medicinal products may only be supplied on prescription. The products are supplied to the trade by wholesalers authorised by the Department of Agriculture, Food and the Marine. In accordance with the prescription of the prescribing veterinarian, the prescribed products can be dispensed either by the veterinarian or by a pharmacist. By way of exception to this rule, intramammary antimicrobial substances can also be dispensed by licensed agricultural merchants. Medicated feeds containing antimicrobials are prepared from authorised premixes, again under veterinary prescription. They are incorporated into the feed under a special authorisation granted by the Department of Agriculture, Food and the Marine. The licences for incorporation are granted either to feed mills or to farms that have the appropriate facilities for inclusion. It should be noted that the sale, supply, or possession of any unauthorised veterinary medicine in Ireland is a criminal offence.
Legal basis for the monitoring of sales
There is currently no legal basis requiring wholesalers to supply data relating to the volume of sales of authorised veterinary medicinal products. However, marketing authorisation holders are obliged to report sales data.
Data sources
Each year, the Health Products Regulatory Authority (HPRA), formerly the Irish Medicines Board, collects data from veterinary pharmaceutical manufacturers that hold current Irish marketing authorisations. These holders are requested by the HPRA to only report sales in Ireland. The HPRA checks the information provided against data collected for previous years. Fluctuations in the data from year to year are followed up with the individual company to guard against data errors. The importation of medicated feed is permitted. However, in practice, given the logistics involved, this is not seen as a major route of supply into the country.
Italy
Distribution of veterinary medicines
In Italy, antimicrobial agents for use in animals are prescription-only medicines. Therefore, their sale to the end-user can take place only upon presentation of a veterinary prescription. The sale of veterinary medicines (including antimicrobial agents) on the Italian territory may occur in the manner listed below.
Wholesale of veterinary medicines
This type of sale includes all forms of business transaction except sales to the end-user. It can only be done on storage premises authorised for the purpose by the local competent authority.
Wholesale of veterinary medicinal products includes transactions between:
• marketing authorisation holders or their representatives and wholesalers;
• marketing authorisation holders or their representatives and pharmacies;
• wholesalers;
• wholesalers and pharmacies;
• wholesalers and feed mills authorised to produce medicated feeds (premixes for medicated feed).
Direct sale of veterinary medicinal products
Holders of authorised wholesale veterinary medicines storage premises may, as a result of further authorisation by the local competent authority, also make direct sales of such products to breeders, pet owners, veterinarians and veterinary care facilities. This type of transaction also includes the sale of premixes for medicated feed by wholesalers, pharmacies and manufacturers to farms authorised to produce medicated feed for self-consumption. This sale may take place only in the presence of a pharmacist and, in the case of antimicrobial agents, only under veterinary prescription.

Sales of veterinary antimicrobial agents in 26 EU/EEA countries in 2013Fifth ESVAC report140
Retail veterinary medicinal products
The retail sale of veterinary medicinal products containing antibiotics can occur only at pharmacies and only under veterinary prescription, and can only be carried out in the presence of a pharmacist.
Farmers, veterinarians and breeding and healthcare facilities may, under request, be authorised by the local competent authority to hold stocks of veterinary medicinal products. Stocks of veterinary drugs, including antibiotics, can only be purchased under veterinary prescription. Farms cannot hold stocks of antibiotics in the form of medicated feed or veterinary drugs administered in feed, water or liquid feed. Only small quantities not exceeding a treatment period of seven days are allowed to be held.
Veterinarians cannot sell veterinary drugs (including antibiotics). Veterinarians, when it is required by professional intervention, are allowed to deliver open packages of veterinary medicines from their stocks to the breeder or the animal owner to start the therapy. For companion animals, the veterinarian may also deliver unopened packages.
Legal basis for the monitoring of sales
The collection of sales data by pharmaceutical companies is based on the national law 193/2006 (art. 32(3)) transposing EC Directive 2004/28.
Data sources
Sales data are collected from pharmaceutical companies producing or importing VMPs.
Latvia
Distribution of veterinary medicines
In Latvia, all VMPs containing antimicrobial agents are prescription-only medicines. This includes medicated feed manufactured from medicated premixes containing antimicrobial agents. VMPs are distributed through wholesalers to pharmacies, veterinarians and animal owners.
Legal basis for the monitoring of sales
Sales data are collected by the Food and Veterinary Service. This task is mandated by the Law of Pharmacy and related Regulation of the Cabinet of Ministers.
Data sources
Sales data were collected from all wholesalers in Latvia at package level by the Food and Veterinary Service. The wholesalers are asked to report in detail what medicines are sold, to determine real consumption of VMPs and avoid double reporting or export of VMPs.
Lithuania
Distribution of veterinary medicines
In Lithuania, all VMPs that contain antimicrobial agents are prescription-only medicines. All VMPs have to be dispensed to veterinarians or farmers through wholesalers or pharmacies. Medicated feed is also subject to prescription by a veterinarian.
Legal basis for the monitoring of sales
Wholesalers are obliged to provide information on sales of VMPs to the State Food and Veterinary Service of the Republic of Lithuania, in accordance with national law.
Sales of veterinary antimicrobial agents in 26 EU/EEA countries in 2013Fifth ESVAC report 141
Data sources
Data on sales of antimicrobial VMPs at package level were obtained from wholesalers by the State Food and Veterinary Service of the Republic of Lithuania.
Luxembourg
Distribution of veterinary medicines
In Luxembourg, all veterinary medicinal products (VMPs) containing antimicrobial agents are prescription-only medicines. This includes medicated premixes containing pharmaceutical agents.
VMPs containing antimicrobial agents are distributed through wholesalers to pharmacies or to veterinarians (via pharmacies’ records). Veterinarians are allowed to keep VMPs in stock and to dispense them to the farmer for the treatment of animals under their care.
Legal basis for the monitoring
Wholesalers, pharmacies, veterinarians and farmers are legally obliged to keep records of all sales. They are legally bound to provide any data or information they are asked for.
Data sources
The data on sales of veterinary antimicrobial agents at package level are obtained from the authorised wholesalers on a yearly basis.
Netherlands
Distribution of veterinary medicines
In the Netherlands, antimicrobial VMPs are available on prescription only. Veterinarians purchase approximately 40 % of their VMPs directly from the manufacturers and approximately 60 % through wholesalers. About 98 % of the total volume of antimicrobial VMPs are dispensed by marketing authorisation holders who are either direct members of the Dutch federation of the veterinary pharmaceutical industry (FIDIN) or represented by members of FIDIN. An estimated 2 % are sold by authorisation holders not associated with FIDIN. Veterinarians sell the products directly to animal owners. Pharmacies dispense only minor quantities of VMPs.
Legal basis for the monitoring of sales
Currently, there is no legal basis for mandatory reporting of sales data; monitoring of sales takes place voluntarily.
Data sources
The sales data are obtained at package level from the marketing authorisation holders who are (represented by) members of FIDIN. Since sales data are obtained from marketing authorisation holders only, including both their sales to wholesalers and their direct sales to veterinarians, there is no double reporting of wholesalers’ sales.
Norway
Distribution of veterinary medicines
In Norway, all VMPs are prescription-only medicines, and have to be dispensed through pharmacies, which are supplied by drug wholesalers only. Veterinarians are not allowed to dispense VMPs except in emergency situations in the field, in which case they have to be sold at cost price. Medicated feeds for livestock (terrestrial animals) are not produced in feed mills, due to the small size of livestock herds compared to those in most other European countries. However, group/flock treatment of livestock with antimicrobial agents is possible, again subject to veterinary prescription, through drinking water or as top-dressing on feed.

Sales of veterinary antimicrobial agents in 26 EU/EEA countries in 2013Fifth ESVAC report142
Legal basis for the monitoring of sales
Wholesalers and feed mills in Norway are mandated to provide sales statistics for both human and veterinary medicinal products, as well as for medicated feedstuffs, to the Norwegian Institute of Public Health (NIPH).
Data sources
Data on the sales of the included veterinary antimicrobial agents at package level are obtained from the NIPH, which collects its data from authorised wholesalers. To avoid double reporting by including sales among the wholesalers, the wholesalers are asked by the NIPH to only report sales to pharmacies and animal owners in Norway.
Poland
Distribution of veterinary medicines
Most VMPs, including antimicrobial VMPs, are prescription-only medicines. VMPs are distributed by wholesaler to veterinarians. Antimicrobial VMPs are available to animal owners only if the veterinarian delivers them. Veterinarians and medicated-feed producers are allowed to buy medicated premixes from wholesalers; however, before purchase, medicated-feed producers need to obtain the district veterinary officer's confirmation.
Legal basis for the monitoring of sales
In accordance with national pharmaceutical law, wholesalers are obligated to provide data on sales of VMPs.
Data sources
Sales data were collected from wholesalers who deliver VMPs directly to veterinarians. Wholesalers fill in the template with their quarterly sales data.
Portugal
Distribution of veterinary medicines
In Portugal, all VMPs containing antimicrobial agents are prescription-only medicines. This includes medicated premixes containing pharmaceutically active substances, like antimicrobial agents. VMPs containing antimicrobial agents are provided by wholesaler-distributors to retailers of veterinary medicinal products (both human and animal pharmacies), farmers, veterinarians, producers’ organisations, veterinary clinics and hospitals, and feed mills.
Wholesaler-distributors obtain the VMPs from a wholesaler or from the marketing authorisation holder/manufacturer. Antimicrobial VMPs are only available to animal owners/farmers by means of an official veterinary prescription. Veterinarians do not sell VMPs, and they may only charge for those they use. Premixes are distributed through wholesalers or wholesaler-distributors directly to feed mills. Only farmers are receivers from feed mills. Medicated feed always requires an official veterinary prescription.
Legal basis for the monitoring of sales
The collection of sales data is based on the national law n.º 148/2008, dated 29 July (Art. 120), amended and reprinted by national law n.º 314/2009, dated 28 October.
Data sources
Data were provided by wholesalers who are authorised to sell veterinary medicinal products containing antibiotics.
18 ARCH-VET report (extensive version in German only): http://www.blv.admin.ch/dokumentation/04506/04518/index.html?lang=de
Sales of veterinary antimicrobial agents in 26 EU/EEA countries in 2013Fifth ESVAC report 143
Slovakia
Distribution of veterinary medicines
In Slovakia, all VMPs containing antimicrobial agents are prescription-only medicines. This includes medicated feeding stuffs manufactured from medicated premixes containing antimicrobial agents. There are four categories of receiver of antimicrobial VMPs from wholesalers to wholesalers (when selling to each other), veterinarians, pharmacies and feed mills, while from feed mills, farmers and wholesalers (very seldom) are receivers. Medicated feed has to be prescribed by veterinarians and produced by feed mills authorised by the Institute for State Control of Veterinary Biologicals and Medicaments.
Legal basis for the monitoring of sales
The collection of import data is based on a national law on pharmaceuticals, Act No. 362/2011 Coll.
Data sources
For 2011 and 2012, import data were collected from all wholesalers licensed in the Slovak Republic; for 2013, data represent sales from wholesalers to end-users.
Brief description of data collection
Wholesalers send their quarterly import data (number of packs, name of the product, batch number, etc.) and manufacturers send their monthly production data to the Institute for State Control of Veterinary Biologicals and Medicaments.
Slovenia
Distribution of veterinary medicines
In accordance with applicable legislation, antimicrobial VMPs are dispensed in the Republic of Slovenia on the basis of a veterinary prescription only. Wholesalers deliver antimicrobial VMPs to retailers, i.e. pharmacies and veterinary organisations, and to approved medicated-feed mills.
Legal basis for the monitoring of sales
Wholesalers are required by law to report to the competent authority on the turnover (sales) of all medicinal products.
Data sources
Data on sales of veterinary antimicrobial agents at package level were obtained from the wholesalers, and from veterinary prescriptions for medicated feeds manufactured in other EU Member States and intended for use in the Republic of Slovenia.
Spain
Distribution of veterinary medicines
In Spain, all VMPs that contain antimicrobials are prescription-only medicines, so they can only be dispensed under veterinary prescription. All suppliers to final users of VMPs (wholesalers, retailers, pharmacies and farmers’ co-operatives) are authorised according to national law and have a mandatory pharmacist control service. Dispensing is most frequently done by retailers. Veterinarians in Spain are allowed to use VMPs in their daily practice, but they cannot sell VMPs to animal owners.

Sales of veterinary antimicrobial agents in 26 EU/EEA countries in 2013Fifth ESVAC report144
Medicated feeds containing antimicrobial premixes also have to be prescribed by a veterinarian, and can only be manufactured by feed mills authorised by regional competent authorities according to the specific legislation and to the feed hygiene regulation (Hazard Analysis and Critical Control Point principles).
Legal basis for the monitoring of sales
There is a legal basis for mandatory reporting of sales data from the distributiors of such products, while monitoring of sales from the MAHs takes place voluntarily.
Data sources
The sales data were collected from marketing authorisation holders at package level by the Spanish Agency for Veterinary Medicinal Products (AEMPS), in collaboration with the Spanish veterinary medicine industry association (Veterindustria) and the Spanish business association of additives and premixes for animal health and nutrition (Adiprem).
Sweden
Distribution of veterinary medicines
In Sweden, antimicrobial VMPs may only be sold on prescription. VMPs have to be dispensed through pharmacies, which are supplied by drug wholesalers or marketing authorisation holders. Feed mills may only mix antimicrobial VMPs in feed if they are controlled and authorised by the Swedish Board of Agriculture. Sales of medicated feed to farmers are only allowed on prescription (i.e. the farmer presents the prescription to the feed mill). Mixing of antimicrobials in feed may also take place on farms, provided that the Swedish Board of Agriculture has controlled and authorised the establishment for this purpose. In such cases, the premix is purchased on prescription and dispensed by a pharmacy.
Legal basis for the monitoring of sales
All pharmacies in Sweden are required to provide sales statistics on a daily basis to a central database. Until and including 2013, this was an infrastructure company owned by the state, Apotekens Service AB. From 1 January 2014, the activities of that company have been transferred to the Swedish eHealth Agency. All feed mills and farms authorised to mix medicated feed are requested to report their purchases and sales on a yearly basis to the Board of Agriculture.
Data sources
Data on sales at package level were obtained from Apotekens Service AB/the Swedish eHealth Agency.
United Kingdom
Distribution of veterinary medicines
In the United Kingdom, antimicrobial veterinary medicinal products may only be supplied on prescription. The products can be dispensed either by the veterinarian or by a veterinary pharmacist and, in turn, can only be supplied by a wholesale dealer authorised by the UK Veterinary Medicines Directorate. Medicated feeds have to be prescribed by veterinarians, and manufactured either by authorised feed mills or by authorised farms. Medicated feeds are used primarily for pig and poultry production.
Legal basis for the monitoring of sales
Manufacturers are legally required to supply data relating to the volume of sales of authorised veterinary medicinal products at the request of the Veterinary Medicines Directorate.
Data sources
The UK Veterinary Medicines Directorate collects data from those veterinary pharmaceutical manufacturers that hold current UK marketing authorisations.

Sales of veterinary antimicrobial agents in 26 EU/EEA countries in 2013Fifth ESVAC report 145
Annex 6. References to national reports
Austria. European Surveillance of Veterinary Antimicrobial Consumption (ESVAC) — the Austrian Results. Resistenzbericht Österreich — AURES 2013 (http://www.ages.at/fileadmin/AGES2015/Themen/Arzneimittel_Medizinprodukte_Dateien/AURES/Aures_2013.pdf, pp.332–338; in German).
Czech Republic. Spotřeba antibiotik ve veterinární medicíně v ČR: Trendy ve spotřebách premixů 2007–2013 detailní srovnání spotřeb antimikrobik 2010–2013 (www.uskvbl.cz/cs/informace/tiskove-centrum/tiskprohl; in Czech).
Belgium. Belgian Veterinary Surveillance of Antimicrobial Consumption. National Consumption Report 2013 (http://www.fagg-afmps.be/fr/binaries/belvetsac %20rapport %202013 %20finaal_tcm291-250555.pdf).
Cyprus. Sales of veterinary antimicrobial products in Cyprus 2013 (http://www.moa.gov.cy/moa/vs/vs.nsf/All/8147E53AB05CC1F4C2257EAD00273CFD?OpenDocument)
Denmark. DANMAP 2013. Use of antimicrobial agents and occurrence of antimicrobial resistance in bacteria from food animals, food and humans in Denmark. ISSN 1600-2032 (www.danmap.org).
Finland. FINRES-Vet 2010-2012. Finnish Veterinary Antimicrobial Resistance Monitoring and Consumption of Antimicrobial Agents, Evira publications 2/2015 (http://www.evira.fi/portal/en/about+evira/publications/?a=view&productId=412).
France. Moulin, G., Chevance, A., 2014. Sales Survey of Veterinary Medicinal Products Containing Antimicrobials in France — 2013, October 2014, Anses-ANMV, Fougères (https://www.anses.fr/fr/system/files/ANMV-Ra-Antibiotiques2013EN.pdf).
Germany. Wallmann, J., Bender, A., Hauck, R., Reimer, I., Heberer, T., Abgabemengenerfassung antimikrobiell wirksamer Stoffe in Deutschland 2013 (Sales data of antimicrobial substances in Germany in 2013), Deutsches Tierärzteblatt September 2014 (http://www.bundestieraerztekammer.de/index_dtbl_presse_details_gs.php?X=20140930135458).
Iceland. Sýklalyfjanotkun og sýklalyfjanæmi baktería í mönnum og dýrum á Íslandi 2013. (http://www.landlaeknir.is/servlet/file/store93/item24148/Syklalyfjanotkun_og_syklalyfjanaemi_2013.pdf).
Ireland. Health Products Regulatory Authority, 2014. Report on consumption of veterinary antibiotics in Ireland during 2013 (http://www.hpra.ie/homepage/veterinary/safety-information/safety-notices/item?t=/report-on-consumption- of-veterinary-antibiotics-in-ireland-during-2013&id=eb970226-9782-6eee-9b55-ff00008c97d0).
Netherlands. Monitoring of Antimicrobial Resistance and Antibiotic Usage in Animals in the Netherlands in 2014, NETHMAP-MARAN 2015 (http://www.wageningenur.nl/nl/Expertises-Dienstverlening/Onderzoeksinstituten/Central-Veterinary-Institute/Publicaties-CVI/MARAN-Rapporten.htm).
SDa, Veterinary Medicines Authority, Usage of antibiotics in agricultural livestock in the Netherlands in 2013 (http://www.autoriteitdiergeneesmiddelen.nl/en/publications).
Norway. NORM/NORM-VET, 2013. Usage of Antimicrobial Agents and Occurrence of Antimicrobial Resistance in Norway. ISSN 1502-2307 (http://www.vetinst.no/eng/Publications/NORM-NORM-VET-Report/NORM-NORM-VET-2013).
Poland. Chief Veterinary Inspectorate. Dane dotyczące sprzedaży produktów leczniczych weterynaryjnych przeciwbakteryjnych w Polsce (http://www.wetgiw.gov.pl/produkty-lecznicze-weterynaryjne; in Polish).
Spain. News of veterinary medicines (http://www.aemps.gob.es/informa/notasInformativas/medicamentosVeterinarios/home.htm).
Sweden. SWEDRES-SVARM 2013. Use of antimicrobials and occurrence of antimicrobial resistance in Sweden. Solna/Uppsala ISSN 1650-6332 (www.sva.se/en/Antibiotika/SVARM-reports/).
United Kingdom. VMD 2014. UK Veterinary Antibiotic Resistance and Sales Surveillance (UK-VARSS) 2013 (https://www.gov.uk/government/uploads/system/uploads/attachment_data/file/440744/VARSS.pdf).

Sales of veterinary antimicrobial agents in 26 EU/EEA countries in 2013Fifth ESVAC report146
Annex 7. Country and affiliation of the ESVAC national contact points/alternates
Table A13. List of ESVAC national contact points/alternates 2015
Country Name and affiliation
Austria Klemens FuchsAustrian Agency for Health and Food SafetyBetriebsstätte GrazZinzendorfgasse 27/18010 GrazAUSTRIAE-mail: [email protected]
Reinhard Fuchs (Alternate)Austrian Agency for Health and Food SafetyBetriebsstätte GrazZinzendorfgasse 27/18010 GrazAUSTRIAE-mail: [email protected]
Belgium Bart HoetFederaal Agentschap voor Geneesmiddelen en Gezondheidsproducten - Agence Fédérale des Médicaments et des Produits de SantéBâtiment Eurostation, bloc 2place Victor Horta, 40 / 40B-1060 Brussel - BruxellesBELGIUME-mail: [email protected]
Dries Minne (Alternate)Federaal Agentschap voor Geneesmiddelen en Gezondheidsproducten - Agence Fédérale des Médicaments et des Produits de SantéEurostation gebouw, blok 2Victor Hortaplein 40 / 40B-1060 Brussel - BruxellesBELGIUME-mail: [email protected]

Sales of veterinary antimicrobial agents in 26 EU/EEA countries in 2013Fifth ESVAC report 147
Country Name and affiliation
Bulgaria Damyan IlievBulgarian Food Safety AgencyБългарска агенция по безопасност на хранитебул. "Пенчо Славейков" № 15А15a, Pencho Slaveykov Blvd.1606 София - SofiaBULGARIAE-mail: [email protected]
Antonio Radoev (Alternate) – until March 2015Bulgarian Food Safety AgencyБългарска агенция по безопасност на хранитебул. "Пенчо Славейков" № 15А15a, Pencho Slaveykov Blvd.1606 София - SofiaBULGARIAE-mail: [email protected]
Tsvetanka Valova (Alternate)Bulgarian Food Safety AgencyБългарска агенция по безопасност на хранитеShose Bankya 7 1331 SofiaBULGARIAE-mail: [email protected]
Cyprus Marios GenakritisVeterinary Services1417 AthalassaNicosiaCYPRUSE-mail: [email protected]
Czech Republic Lucie PokludováÚstav pro státní kontrolu veterinárních biopreparátů a léčivHudcova 56a621 00 Brno - MedlánkyCZECH REPUBLICE-mail: [email protected]
Jana Wojtylová (Alternate)Ústav pro státní kontrolu veterinárních biopreparátů a léčivHudcova 56a621 00 Brno – MedlánkyCZECH REPUBLICE-mail: [email protected]
Sales of veterinary antimicrobial agents in 26 EU/EEA countries in 2013Fifth ESVAC report148
Country Name and affiliation
Denmark Erik JacobsenDanish Veterinary and Food AdministrationStationsparken 31-332600 GlostrupDENMARKE-mail: [email protected]
Laura Mie Jensen (Alternate)Danish Veterinary and Food AdministrationStationsparken 31-332600 GlostrupDENMARKE-mail: [email protected]
Estonia Marju SammulState Agency of Medicines1, Nooruse Street50411 TartuESTONIAE-mail: [email protected]
Katrin Kurvits (Alternate) – until December 2014State Agency of Medicines1, Nooruse Street50411 TartuESTONIAE-mail: [email protected]
Finland Katariina Kivilahti-MäntyläFinnish Medicines AgencyMannerheimintie 103B00280 HelsinkiFINLANDE-mail: [email protected]
France Gérard MoulinAgence Nationale du Médicament Vétérinaire – Agence Nationale de Sécurité Sanitaire de l’alimentation, de l’environnement et du travail8 rue Claude Bourgelat, Parc d’activité de la Grande MarcheCS 70611 Javené, F-35306 Fougères CedexFRANCEE-mail: [email protected]
Claire Chauvin (Alternate)Agence Nationale du Médicament Vétérinaire – Agence Nationale de Sécurité Sanitaire de l’alimentation, de l’environnement et du travailLa Haute MarcheBP 90203 Javené, F-35302 Fougères CedexFRANCEE-mail: [email protected]

Sales of veterinary antimicrobial agents in 26 EU/EEA countries in 2013Fifth ESVAC report 149
Country Name and affiliation
Germany Jürgen WallmannBundesamt für Verbraucherschutz und LebensmittelsicherheitMauerstraße 39-4210117 BerlinGERMANYE-mail: [email protected]
Inke Reimer (Alternate)Bundesamt für Verbraucherschutz und LebensmittelsicherheitMauerstraße 39-4210117 BerlinGERMANYE-mail: [email protected]
Hungary Edit NagyNemzeti Élelmiszerlánc-biztonsági Hivatal Állatgyógyászati Termékek IgazgatóságaSzállás utca 81107 BudapestHUNGARYE-mail: [email protected]
Ernő Horváth (Alternate)Nemzeti Élelmiszerlánc-biztonsági Hivatal Állatgyógyászati Termékek IgazgatóságaSzállás utca 81107 BudapestHUNGARYE-mail: [email protected]
Iceland Jóhann M. LenharðssonLyfjastofnunVínlandsleið 14IS-113 ReykjavíkICELANDE-mail: [email protected]
Ireland Jeremiah Gabriel BeechinorAn tÚdarás Rialála Táirgí SláinteKevin O’Malley HouseThe Earlsfort CentreEarlsfort TerraceDublin 2IRELANDE-mail: [email protected]
Gavin Ryan (Alternate)An tÚdarás Rialála Táirgí SláinteKevin O’Malley HouseThe Earlsfort CentreEarlsfort TerraceDublin 2IRELANDE-mail: [email protected]

Sales of veterinary antimicrobial agents in 26 EU/EEA countries in 2013Fifth ESVAC report150
Country Name and affiliation
Italy Alessandra Perrella – until February 2015Ministero della SaluteVia Giorgio Ribotta, 5(ufficio IV - DGSA)00144 RomaITALYE-mail: [email protected]
Loredana CandelaMinistero della SaluteDei Farmaci VeterinariViale Giorgio Ribotta, 500144 RomaITALYE-mail:[email protected]
Latvia Gundega Mičule - until July 2015Assessment and Registration DepartmentPārtikas un Veterinārais DienestsPeldu iela 30LV-1050 RigaLATVIAE-mail: [email protected]
Dace ŠantareAssessment and Registration DepartmentPārtikas un Veterinārais DienestsPeldu iela 30LV-1050 RigaLATVIAE-mail: [email protected]
Lithuania Sigitas SiriukaitisAnimal Health and Welfare DepartmentValstybinė maisto ir veterinarijos tarnybaSiesiku str. 19LT-07170 VilniusLITHUANIAE-mail: [email protected]
Luxembourg Marcel BruchMinistère de la Santé - Direction de la SantéAllée MarconiL-2120LUXEMBOURGE-mail: [email protected]
Sales of veterinary antimicrobial agents in 26 EU/EEA countries in 2013Fifth ESVAC report 151
Country Name and affiliation
Netherlands Bart van den AssumMinistry of Economic AffairsDirectorate-General for Agro and NaturePostbus 204012500 EK Den HaagTHE NETHERLANDSE-mail: [email protected]
Inge van Geijlswijk (Alternate)On behalf of the Netherlands Veterinary Medicines Authority (SDa),Faculty of Veterinary Medicine, Utrecht UniversityPO Box 801553508 TD UtrechtThe NetherlandsE-mail: [email protected]
Norway Kari GraveNorwegian Veterinary InstituteP.O. Box 750, 0106 OsloNORWAYE-mail: [email protected]
Poland Dorota ProkopiakMinisterstwo Rolnictwa i Rozwoju Wsiul. Wspólna 3000-930 WarsawPOLANDE-mail: [email protected]
Dorota Krasucka (Alternate)Państwowy Instytut Weterynaryjnyal. Partyzantow 5724-100 PulawyPOLANDE-mail: [email protected]
Portugal Maria Helena Ponte - until August 2015Direção de Serviços de Meios de Defesa SanitáriaDireção-Geral de Alimentação e VeterináriaLargo da Academia Nacional de Belas Artes, 21249-105 LisboaPORTUGALE-mail: [email protected]
Teresa Mafalda Flores RibeiroDivisão de Gestão e Autorização de Medicamentos VeterináriosDireção-Geral de Alimentação e VeterináriaCampo Grande, n.º 501700-093 LisboaPORTUGALE-mail: [email protected]
Sales of veterinary antimicrobial agents in 26 EU/EEA countries in 2013Fifth ESVAC report152
Country Name and affiliation
Slovakia Judita HederováInstitute for State Control of Veterinary Biologicals and MedicamentsÚstav štátnej kontroly veterinárnych biopreparátov a liečivBiovetská 34949 01 NitraSLOVAKIAE-mail: [email protected]
Martina Ihnátová (Alternate)Institute for State Control of Veterinary Biologicals and MedicamentsŠtátna veterinárna a potravinová správa Slovenskej republikyBotanick 17842 13 BratislavaSLOVAKIAE-mail: [email protected]
Slovenia Anton SvetlinUprava Republike Slovenije za varno hrano, veterinarstvo in varstvo rastlinAdministration of the Republic of Slovenia for Food Safety, Veterinary Sector and Plant Protection (AFSVSPP)Dunajska 22SI-1000 LjubljanaSLOVENIAE-mail: [email protected]
Spain Cristina Muñoz MaderoSpanish Agency of Medicines and Medical DevicesVeterinary DepartmentParque Empresarial Las MercedesEdificio 8C/Campezo 128022 MadridSPAINE-mail: [email protected]
Sweden Kinfe GirmaDepartment for Animal Welfare and Health Division for Feed and HealthSwedish Board of AgricultureSE-551 82 JönköpingSWEDENE-mail: [email protected]
Christina Greko (Alternate)Department of Animal Health and Antimicrobial Strategies, Strama VLStatens Veterinärmedicinska AnstaltSE-751 89 UppsalaSWEDENE-mail: [email protected]
Sales of veterinary antimicrobial agents in 26 EU/EEA countries in 2013Fifth ESVAC report 153
Country Name and affiliation
United Kingdom Kitty HealeyVeterinary Medicines DirectorateWoodham LaneNew Haw, AddlestoneKT15 3LS SurreyUNITED KINGDOME-mail: [email protected]
Katherine Grace (Alternate) – until July 2015Veterinary Medicines DirectorateWoodham LaneNew Haw, AddlestoneKT15 3LS SurreyUNITED KINGDOME-mail: [email protected]
Hannah Reeves (Alternate)Veterinary Medicines DirectorateWoodham LaneNew Haw, AddlestoneKT15 3LS SurreyUNITED KINGDOME-mail: [email protected]
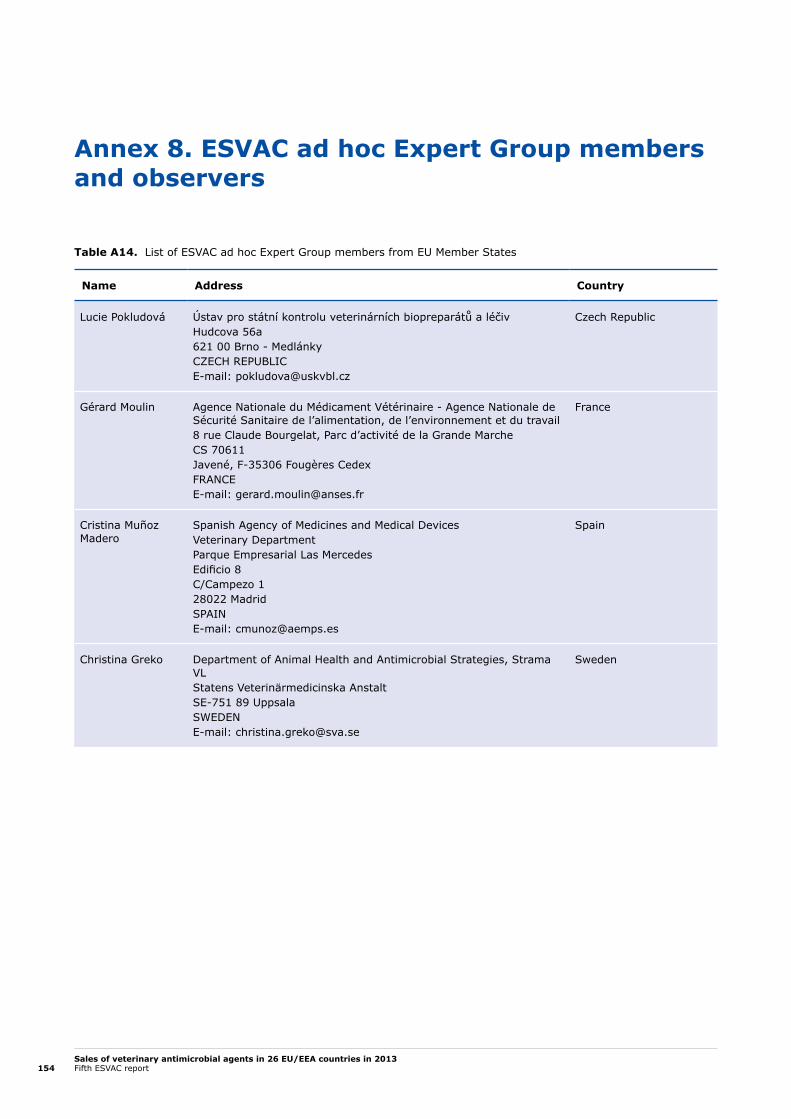
Sales of veterinary antimicrobial agents in 26 EU/EEA countries in 2013Fifth ESVAC report154
Annex 8. ESVAC ad hoc Expert Group members and observers
Table A14. List of ESVAC ad hoc Expert Group members from EU Member States
Name Address Country
Lucie Pokludová Ústav pro státní kontrolu veterinárních biopreparátů a léčivHudcova 56a621 00 Brno - MedlánkyCZECH REPUBLICE-mail: [email protected]
Czech Republic
Gérard Moulin Agence Nationale du Médicament Vétérinaire - Agence Nationale de Sécurité Sanitaire de l’alimentation, de l’environnement et du travail8 rue Claude Bourgelat, Parc d’activité de la Grande MarcheCS 70611Javené, F-35306 Fougères CedexFRANCEE-mail: [email protected]
France
Cristina Muñoz Madero
Spanish Agency of Medicines and Medical DevicesVeterinary DepartmentParque Empresarial Las MercedesEdificio 8C/Campezo 128022 MadridSPAINE-mail: [email protected]
Spain
Christina Greko Department of Animal Health and Antimicrobial Strategies, Strama VLStatens Veterinärmedicinska AnstaltSE-751 89 Uppsala SWEDENE-mail: [email protected]
Sweden

Sales of veterinary antimicrobial agents in 26 EU/EEA countries in 2013Fifth ESVAC report 155
Table A15. List of ESVAC ad hoc Expert Group observers from the European Commission, ECDC and EFSA
Name Address Representing institution
Rosa Peran
Dean Bosnjak
European Commission – until July 2015Directorate-General for Health and Food Safety Directorate G - Veterinary and International affairsRue Breydel 4 BE-1040 BrusselsBELGIUME-mail: [email protected]
DG SANTE D6 – Medicinal Products – quality, safety and efficacyRue de Mot 241040 BrusselsBELGIUME-mail: [email protected]
European Commission
Klaus Weist European Centre for Disease Prevention and ControlTomtebodavägen 11 A171 83 StockholmSWEDENE-mail: [email protected]
European Centre for Disease Prevention and Control (ECDC)
Pierre-Alexandre Beloeil
European Food Safety AuthorityLargo N. Palli 5/AI-43121 ParmaITALYE-mail:[email protected]
European Food Safety Authority (EFSA)

Sales of veterinary antimicrobial agents in 26 EU/EEA countries in 2013Fifth ESVAC report156
Annex 9. Data from Switzerland
As Switzerland is outside the framework of the European Union, it was not possible to obtain detailed data at package level, due to confidentiality issues. For this reason, it was not possible to include the Swiss data in the ESVAC database and to integrate those data in the analysis of the ESVAC data. Furthermore, the Swiss data were not subjected to the quality check in terms of standardisation by the ESVAC data program.
Table A16. Information on years collecting data, legal basis for collecting data, national data providers of ESVAC data, data sources for ESVAC data, and assumed data coverage
Country Years collecting data Legal basis Data sources
(approx. no) Data coverage
Switzerland >6 years Mandatory to report Marketing-authorisation holders (n=20)
Assumed to be 100 %
Table A17. Estimated population correction unit (PCU) (in 1,000 tonnes) of the animal population, for 2013
Country Cattle Pigs Poultry Sheep/ goats Fish Rabbits Horses Total
Switzerland 483 205 60 36 0 1 24 809
Table A18. Sales, in tonnes of active ingredient, split into sales of veterinary antimicrobial agents marketed for food-producing animals (terrestrial animals), marketed for companion animals only (i.e. tablets) and total sales, for 2013
Tablets All other pharmaceutical forms Total
Tonnes % of total Tonnes % of total Tonnes
Switzerland 0.9 2 52.2 98 53.1
Table A19. Sales, in tonnes of active ingredient, of veterinary antimicrobial agents marketed for food-producing animals, including horses, population correction unit (PCU), and mg active ingredients of veterinary antimicrobial agents sold per PCU, for 2013
Country Sales (tonnes) for food-producing animals PCU (1,000 tonnes) mg/PCU
Switzerland 52.2 809 64.6
Table A20. Sales, in tonnes of active ingredient, of veterinary antimicrobial agents for food-producing animals, including horses, split into administration route/form, for 2013
Country
Pre
mix
Ora
l pow
der
Ora
l sol
uti
on
Inje
ctio
n
Intr
amam
mar
y p
rep
.
Intr
aute
rin
e p
rep
.
Ora
l pas
te
Bol
us
Tota
l
Switzerland 33.41 4.4 –1 9.1 4.5 0.8 –1 0.12 52.2
1 Oral pastes and oral solutions aggregated with premixes for confidentiality reasons. 2 Includes all tablets/bolus authorised for food-producing animals only.
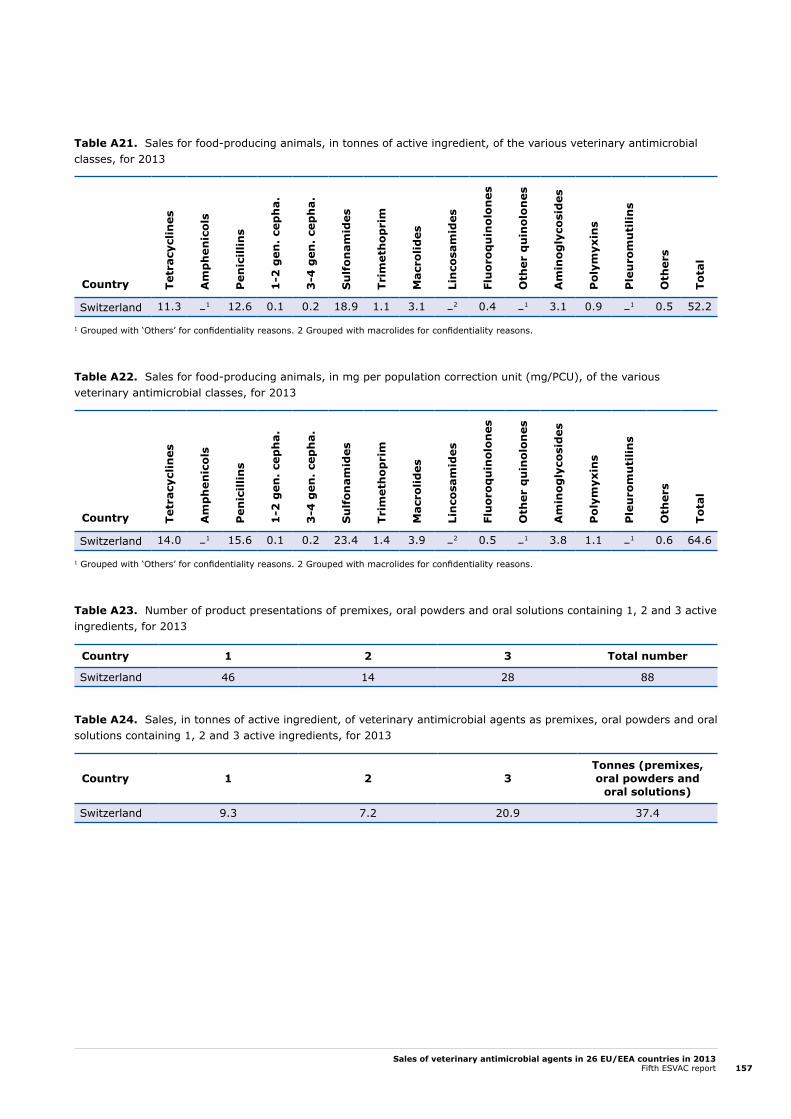
Sales of veterinary antimicrobial agents in 26 EU/EEA countries in 2013Fifth ESVAC report 157
Table A21. Sales for food-producing animals, in tonnes of active ingredient, of the various veterinary antimicrobial classes, for 2013
Country Tetr
acyc
lines
Am
ph
enic
ols
Pen
icill
ins
1-2
gen
. ce
ph
a.
3-4
gen
. ce
ph
a.
Su
lfon
amid
es
Trim
eth
opri
m
Mac
rolid
es
Lin
cosa
mid
es
Flu
oroq
uin
olon
es
Oth
er q
uin
olon
es
Am
inog
lyco
sid
es
Pol
ymyx
ins
Ple
uro
mu
tilin
s
Oth
ers
Tota
l
Switzerland 11.3 –1 12.6 0.1 0.2 18.9 1.1 3.1 –2 0.4 –1 3.1 0.9 –1 0.5 52.2
1 Grouped with ‘Others’ for confidentiality reasons. 2 Grouped with macrolides for confidentiality reasons.
Table A22. Sales for food-producing animals, in mg per population correction unit (mg/PCU), of the various veterinary antimicrobial classes, for 2013
Country Tetr
acyc
lines
Am
ph
enic
ols
Pen
icill
ins
1-2
gen
. ce
ph
a.
3-4
gen
. ce
ph
a.
Su
lfon
amid
es
Trim
eth
opri
m
Mac
rolid
es
Lin
cosa
mid
es
Flu
oroq
uin
olon
es
Oth
er q
uin
olon
es
Am
inog
lyco
sid
es
Pol
ymyx
ins
Ple
uro
mu
tilin
s
Oth
ers
Tota
l
Switzerland 14.0 –1 15.6 0.1 0.2 23.4 1.4 3.9 –2 0.5 –1 3.8 1.1 –1 0.6 64.6
1 Grouped with ‘Others’ for confidentiality reasons. 2 Grouped with macrolides for confidentiality reasons.
Table A23. Number of product presentations of premixes, oral powders and oral solutions containing 1, 2 and 3 active ingredients, for 2013
Country 1 2 3 Total number
Switzerland 46 14 28 88
Table A24. Sales, in tonnes of active ingredient, of veterinary antimicrobial agents as premixes, oral powders and oral solutions containing 1, 2 and 3 active ingredients, for 2013
Country 1 2 3Tonnes (premixes, oral powders and
oral solutions)
Switzerland 9.3 7.2 20.9 37.4
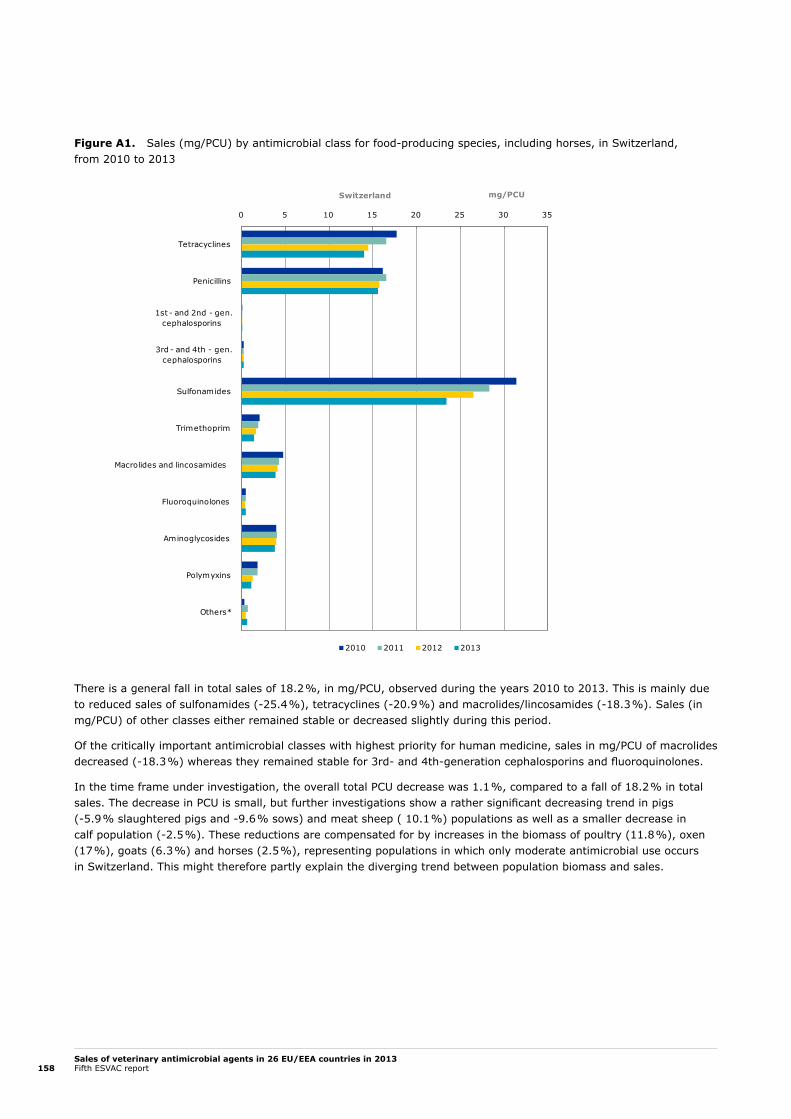
Sales of veterinary antimicrobial agents in 26 EU/EEA countries in 2013Fifth ESVAC report158
Figure A1. Sales (mg/PCU) by antimicrobial class for food-producing species, including horses, in Switzerland, from 2010 to 2013
There is a general fall in total sales of 18.2 %, in mg/PCU, observed during the years 2010 to 2013. This is mainly due to reduced sales of sulfonamides (-25.4 %), tetracyclines (-20.9 %) and macrolides/lincosamides (-18.3 %). Sales (in mg/PCU) of other classes either remained stable or decreased slightly during this period.
Of the critically important antimicrobial classes with highest priority for human medicine, sales in mg/PCU of macrolides decreased (-18.3 %) whereas they remained stable for 3rd- and 4th-generation cephalosporins and fluoroquinolones.
In the time frame under investigation, the overall total PCU decrease was 1.1 %, compared to a fall of 18.2 % in total sales. The decrease in PCU is small, but further investigations show a rather significant decreasing trend in pigs (-5.9 % slaughtered pigs and -9.6 % sows) and meat sheep ( 10.1 %) populations as well as a smaller decrease in calf population (-2.5 %). These reductions are compensated for by increases in the biomass of poultry (11.8 %), oxen (17 %), goats (6.3 %) and horses (2.5 %), representing populations in which only moderate antimicrobial use occurs in Switzerland. This might therefore partly explain the diverging trend between population biomass and sales.
0 5 10 15 20 25 30 35
Tetracyclines
Penicillins
1st - and 2nd - gen. cephalosporins
3rd - and 4th - gen. cephalosporins
Sulfonamides
Trimethoprim
Macrolides and lincosamides
Fluoroquinolones
Aminoglycosides
Polymyxins
Others*
2010 2011 2012 2013
Switzerland mg/PCU
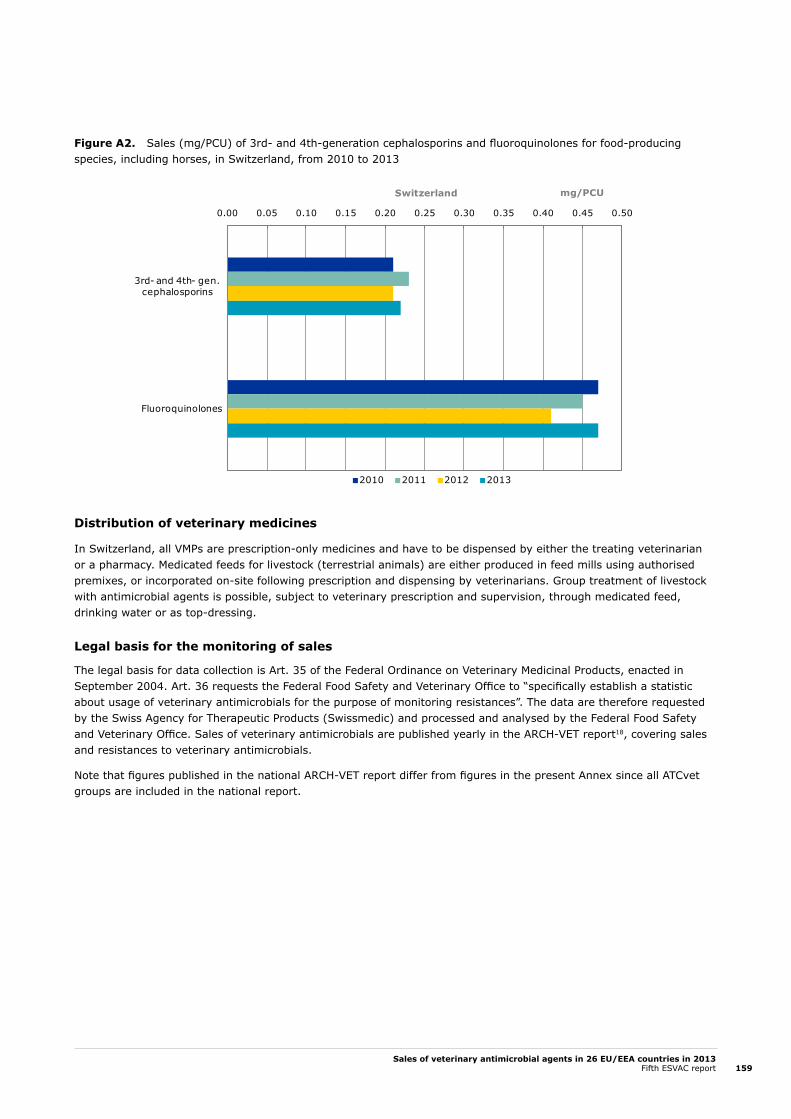
Sales of veterinary antimicrobial agents in 26 EU/EEA countries in 2013Fifth ESVAC report 159
Figure A2. Sales (mg/PCU) of 3rd- and 4th-generation cephalosporins and fluoroquinolones for food-producing species, including horses, in Switzerland, from 2010 to 2013
Distribution of veterinary medicines
In Switzerland, all VMPs are prescription-only medicines and have to be dispensed by either the treating veterinarian or a pharmacy. Medicated feeds for livestock (terrestrial animals) are either produced in feed mills using authorised premixes, or incorporated on-site following prescription and dispensing by veterinarians. Group treatment of livestock with antimicrobial agents is possible, subject to veterinary prescription and supervision, through medicated feed, drinking water or as top-dressing.
Legal basis for the monitoring of sales
The legal basis for data collection is Art. 35 of the Federal Ordinance on Veterinary Medicinal Products, enacted in September 2004. Art. 36 requests the Federal Food Safety and Veterinary Office to “specifically establish a statistic about usage of veterinary antimicrobials for the purpose of monitoring resistances”. The data are therefore requested by the Swiss Agency for Therapeutic Products (Swissmedic) and processed and analysed by the Federal Food Safety and Veterinary Office. Sales of veterinary antimicrobials are published yearly in the ARCH-VET report18, covering sales and resistances to veterinary antimicrobials.
Note that figures published in the national ARCH-VET report differ from figures in the present Annex since all ATCvet groups are included in the national report.
0.00 0.05 0.10 0.15 0.20 0.25 0.30 0.35 0.40 0.45 0.50
3rd- and 4th- gen. cephalosporins
Fluoroquinolones
2010 2011 2012 2013
Switzerland mg/PCU

Sales of veterinary antimicrobial agents in 26 EU/EEA countries in 2013Fifth ESVAC report160
Data sources
Data are obtained at package level from the marketing authorisation holders. Due to confidentiality reasons and Switzerland not being an EU Member State, data were analysed and processed at national level before transmission. Aggregation was done when necessary to keep sales figures confidential.
Data coverage
Coverage is assumed to be nearly 100 % for the sales of authorised antimicrobial agents. No prescription figures are currently available at national level, meaning that sales figures cannot be further validated. Veterinarians may import VMPs for companion and food-producing animals, including products containing antimicrobial agents, based on a single authorisation delivered by Swissmedic. As these products are not sold by marketing authorisation holders or wholesalers in Switzerland, and since these single authorisations are not delivered for a defined quantity, these products cannot be monitored and are therefore not included in the statistics.
Data provider
Country Name and affiliation
Switzerland Cedric Müntener
Institut für Veterinärpharmakologie und Toxikologie Winterthurerstrasse 260 8057 Zürich SWITZERLAND E-mail: [email protected]
On behalf of the Federal Office of Food Safety and Veterinary Affairs, Berne

Sales of veterinary antimicrobial agents in 26 EU/EEA countries in 2013Fifth ESVAC reportEMA/387934/2015
TC-AE-15-001-EN-C / TC-AE-15-001-EN-NISBN 978-92-9155-054-8 (print) / 978-92-9155-053-1 (PDF)ISSN 2315-1447 (print) / 2315-1455 (PDF)doi 10.2809/680944 (print) / 10.2809/140479 (PDF)
© European Medicines Agency, 2015. Reproduction is authorised provided the source is acknowledged.
European Medicines Agency
30 Churchill Place Canary Wharf London E14 5EU United Kingdom
Telephone +44 (0)20 3660 6000 Facsimile +44 (0)20 3660 5555 Send a question www.ema.europa.eu/contact
www.ema.europa.eu
Related Documents