Lauren Mullenholz Insights Leader LinkedIn The Science of Social Selling: Measuring adoption and results with LinkedIn Alexander Low Head of Client Development Office Agency JLL #salesconnect

Welcome message from author
This document is posted to help you gain knowledge. Please leave a comment to let me know what you think about it! Share it to your friends and learn new things together.
Transcript
Are you presenting at a breakout session?
Make sure your title slide is the right color.
To swap the slide master...
On the View tab, click Normal.
In Normal View, in the thumbnail pane on the left, click the slide that you want to apply a layout to.
On the Home tab, click Layout, and then select the layout that you want.
Keynotes & general sessions
The Future of Sales and Marketing breakout track
Habits of High Performing Reps breakout track
How to Build a Social Selling Organization breakout track
title title title title
Lauren Mullenholz
Insights Leader LinkedIn
The Science of Social Selling: Measuring adoption and results with LinkedIn
Alexander Low
Head of Client Development Office Agency JLL
#salesconnect

How have others seized the opportunity?
Measurement Education Exec Alignment
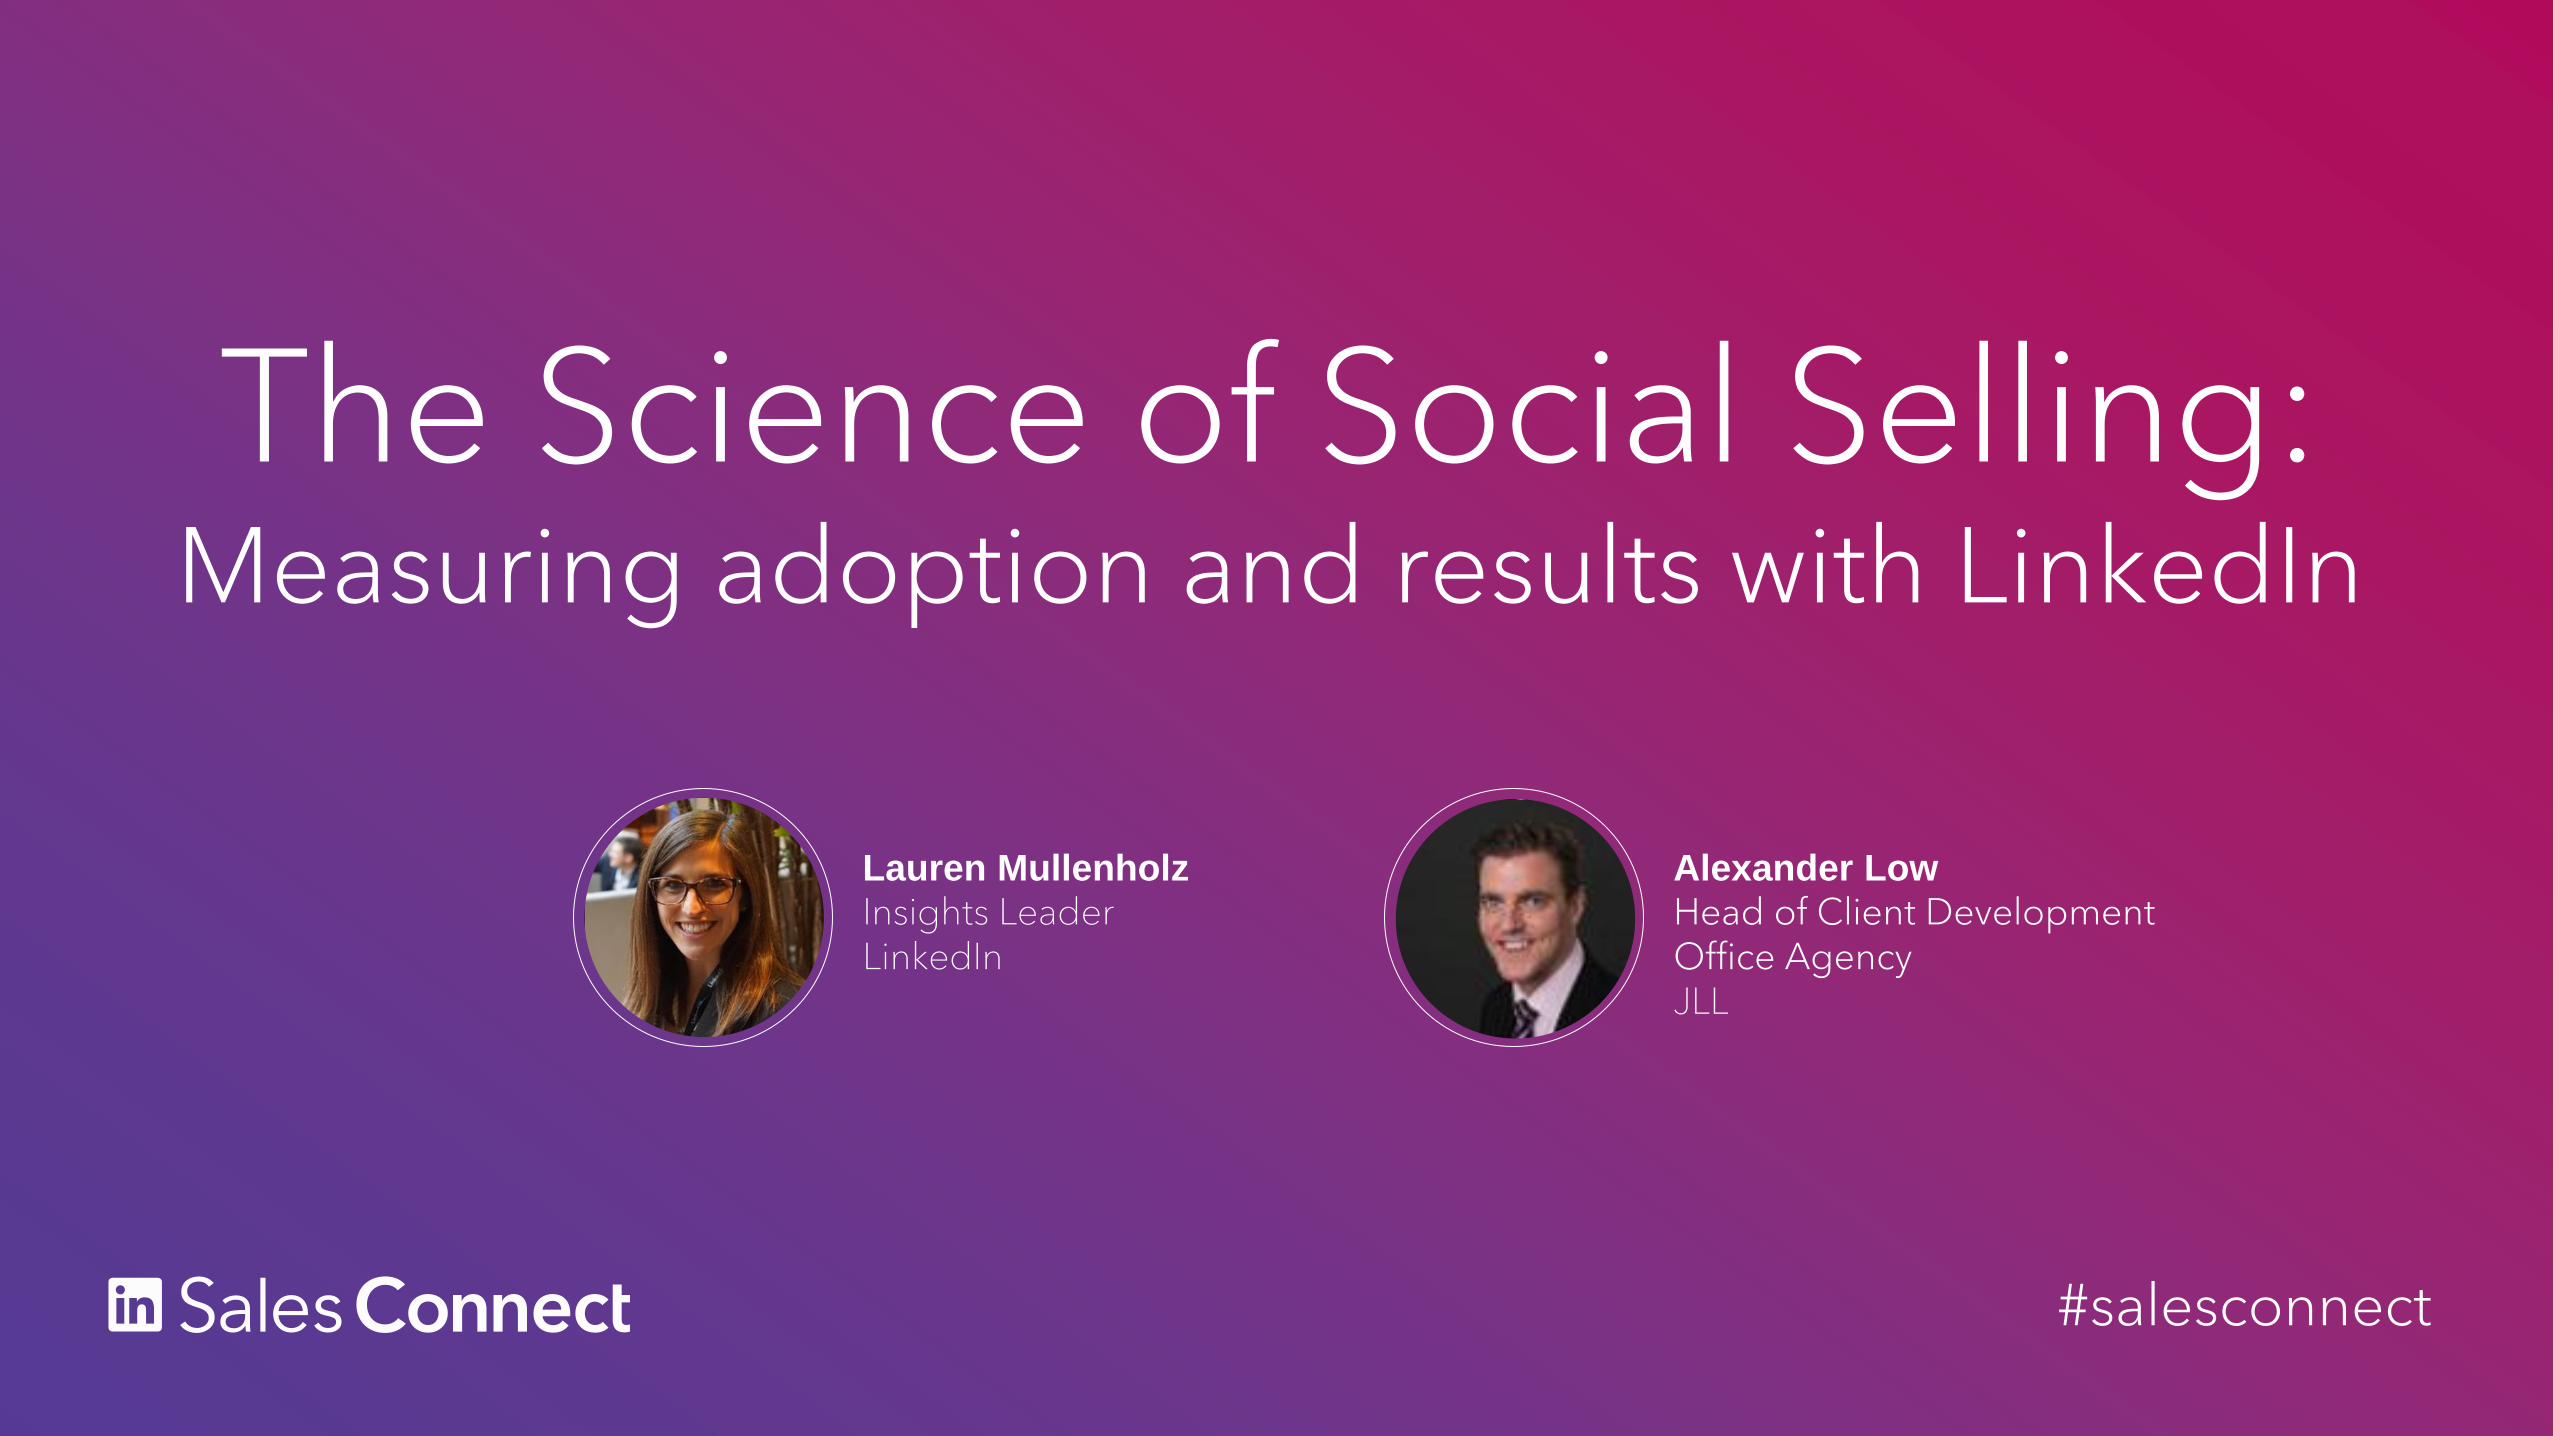
SOCIAL
Success Stories Social SelIing Index (SSI)
ADOPTION
Pipeline & Revenue
ROI


Are you presenting at a breakout session?
Make sure your segue slides are the right color.
To swap the slide master...
On the View tab, click Normal.
In Normal View, in the thumbnail pane on the left, click the slide that you want to apply a layout to.
On the Home tab, click Layout, and then select the layout that you want.
Keynotes & general sessions
The Future of Sales and Marketing breakout track
Habits of High Performing Reps breakout track
How to Build a Social Selling Organization breakout track
title title title title
SSI Defined

Social selling index
0
25
50
75
100
Laggards Leaders
Your Score
82
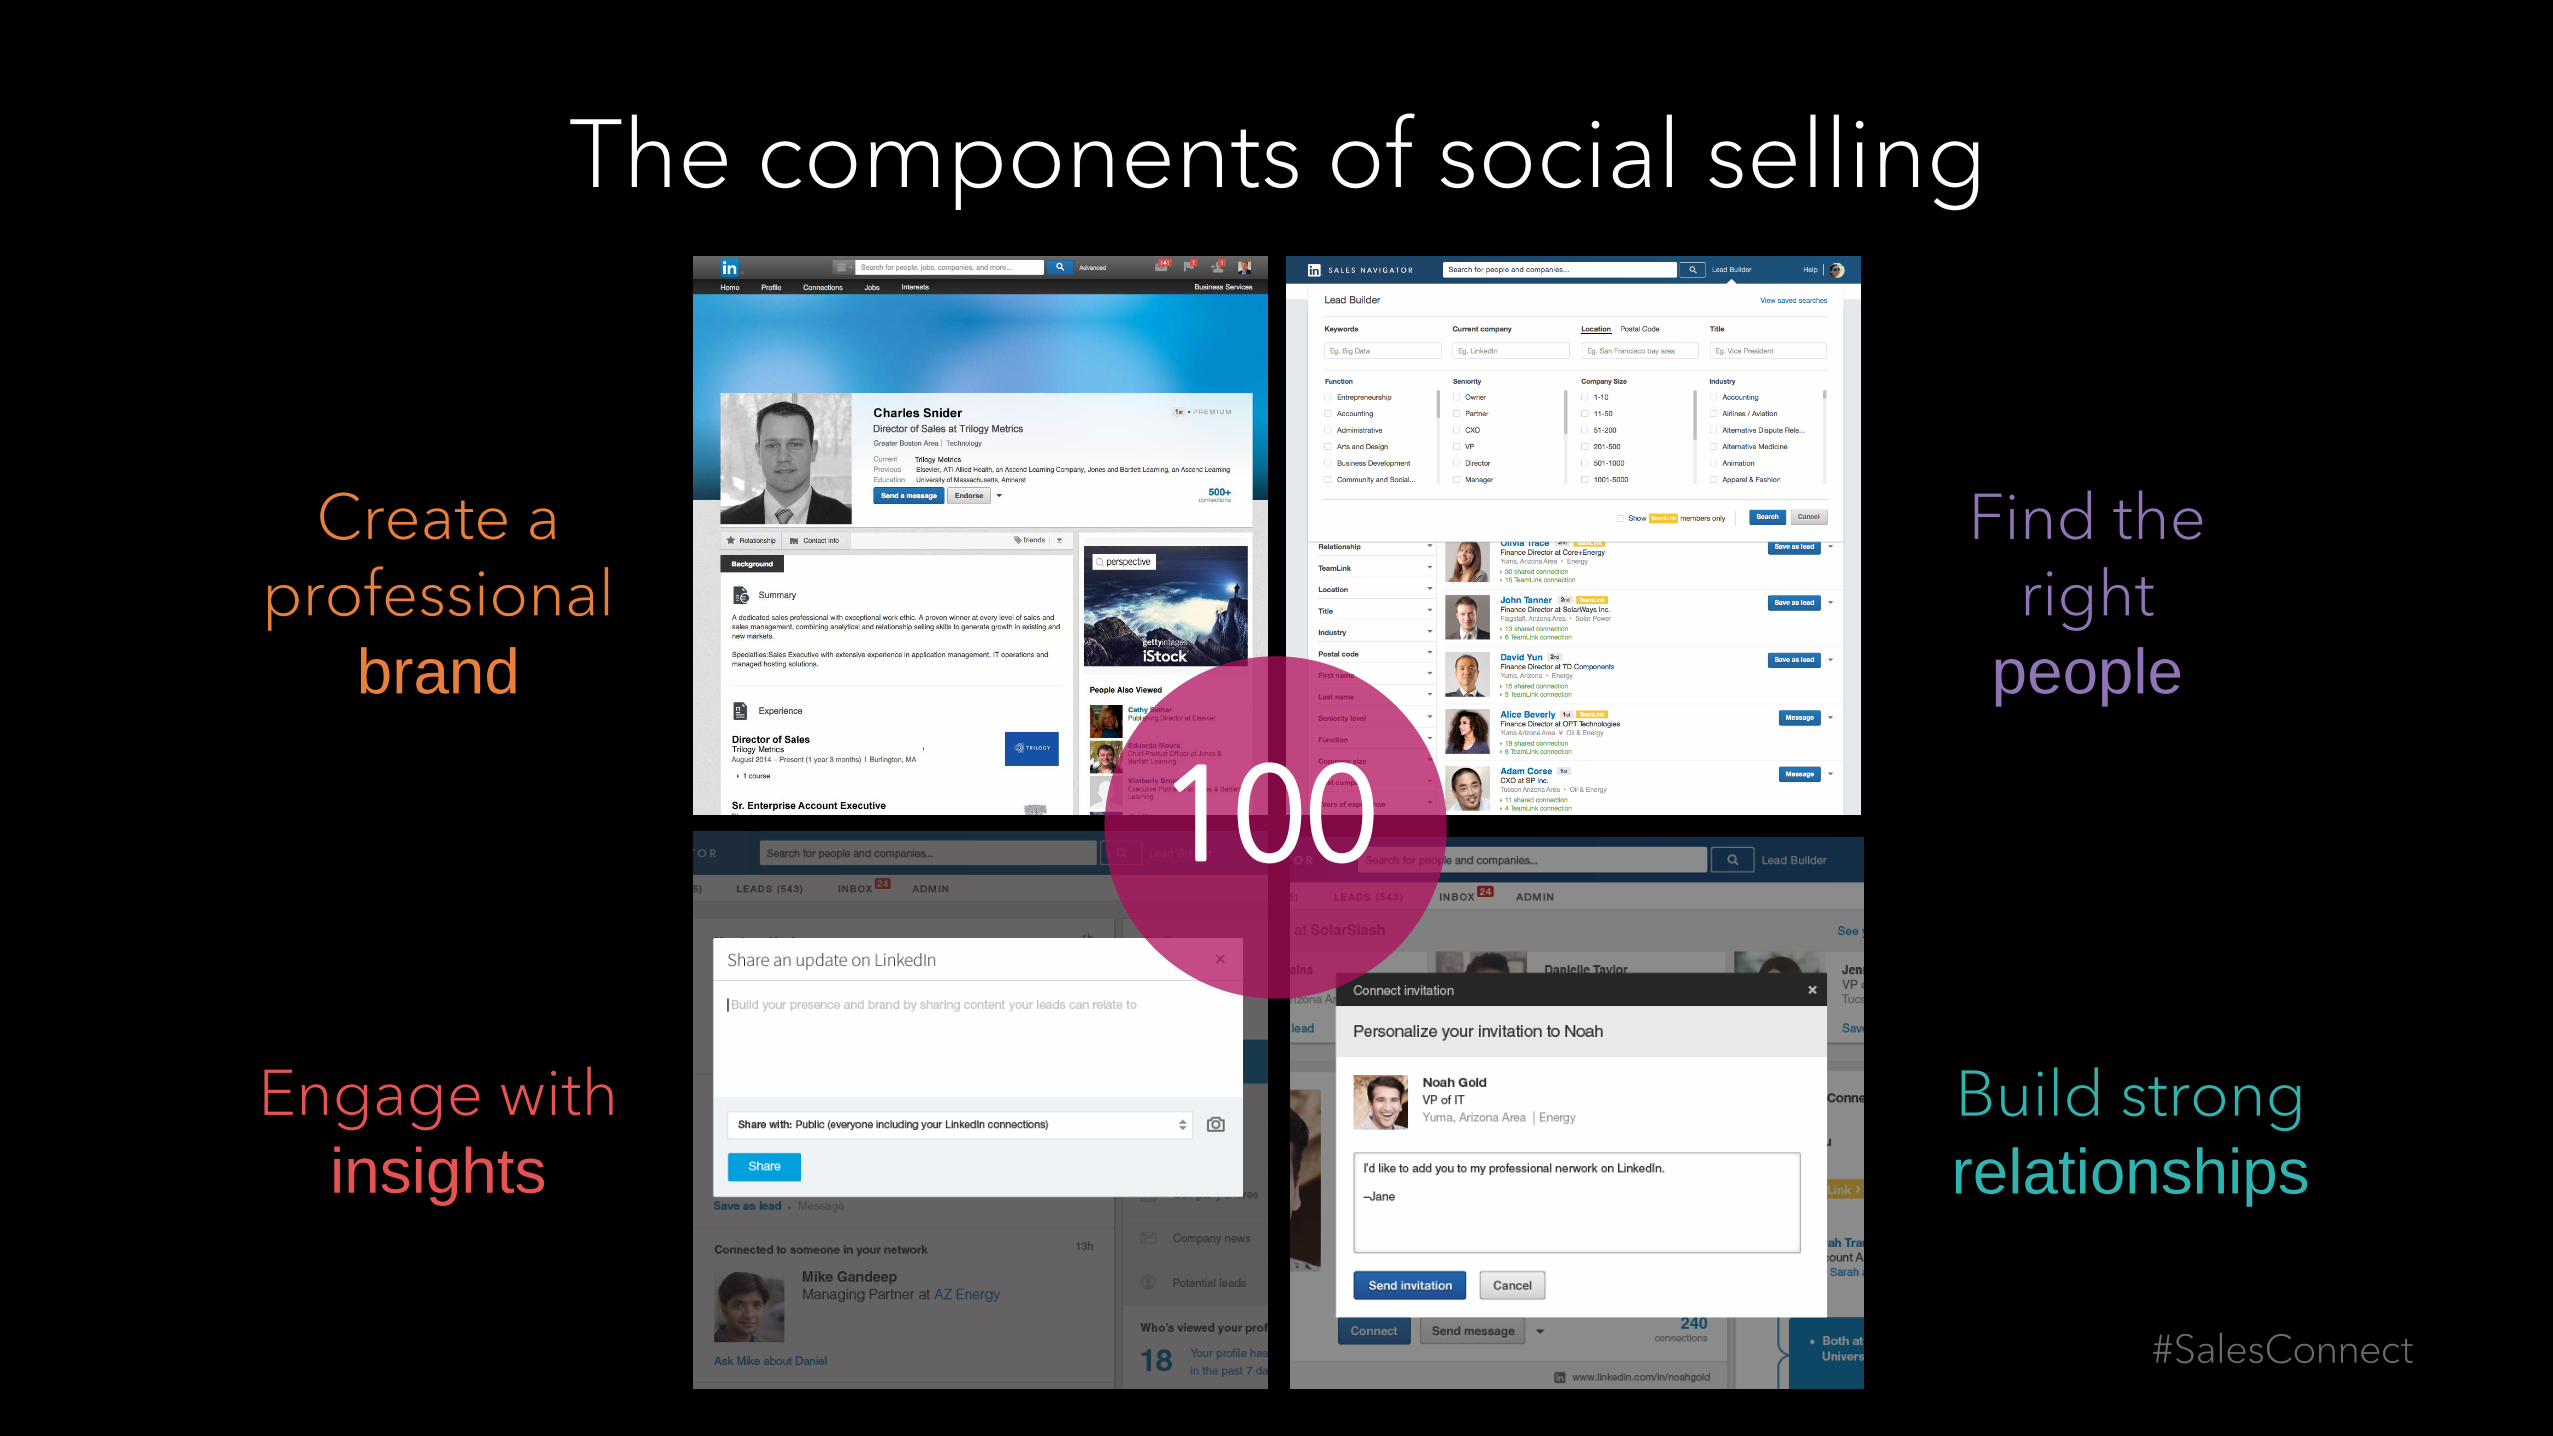
The components of social selling
Create a professional
brand
Find the right
people
Engage with insights
Build strong relationships
100

The impact of SSI
New clients
Meetings secured
Opportunities generated
Source:
LinkedIn Social Selling & Sales Performance Study, October 2014 . Compares high SSI sales professionals defined as SSI above 70 to low SSI sales professionals below 30. Only
based on the subset who attribute generating an opportunity via LinkedIn.

Are you presenting at a breakout session?
Make sure your segue slides are the right color.
To swap the slide master...
On the View tab, click Normal.
In Normal View, in the thumbnail pane on the left, click the slide that you want to apply a layout to.
On the Home tab, click Layout, and then select the layout that you want.
Keynotes & general sessions
The Future of Sales and Marketing breakout track
Habits of High Performing Reps breakout track
How to Build a Social Selling Organization breakout track
title title title title
How do we really look?


It’s lonely at the top
46.7%
51.9%
0-20 21-69 70+
SSI distribution for all sales professionals
1.4%
Sources:
Aug 2015 SSI average, All Sales Professionals according to LinkedIn.

Social sellers are trending up globally
Aug 2014 Aug 2015
21.2
28.2
+33%
Sources:
Aug 2014 to Aug 2015 SSI average, All Sales Professionals, Cohort – Aug 2014.
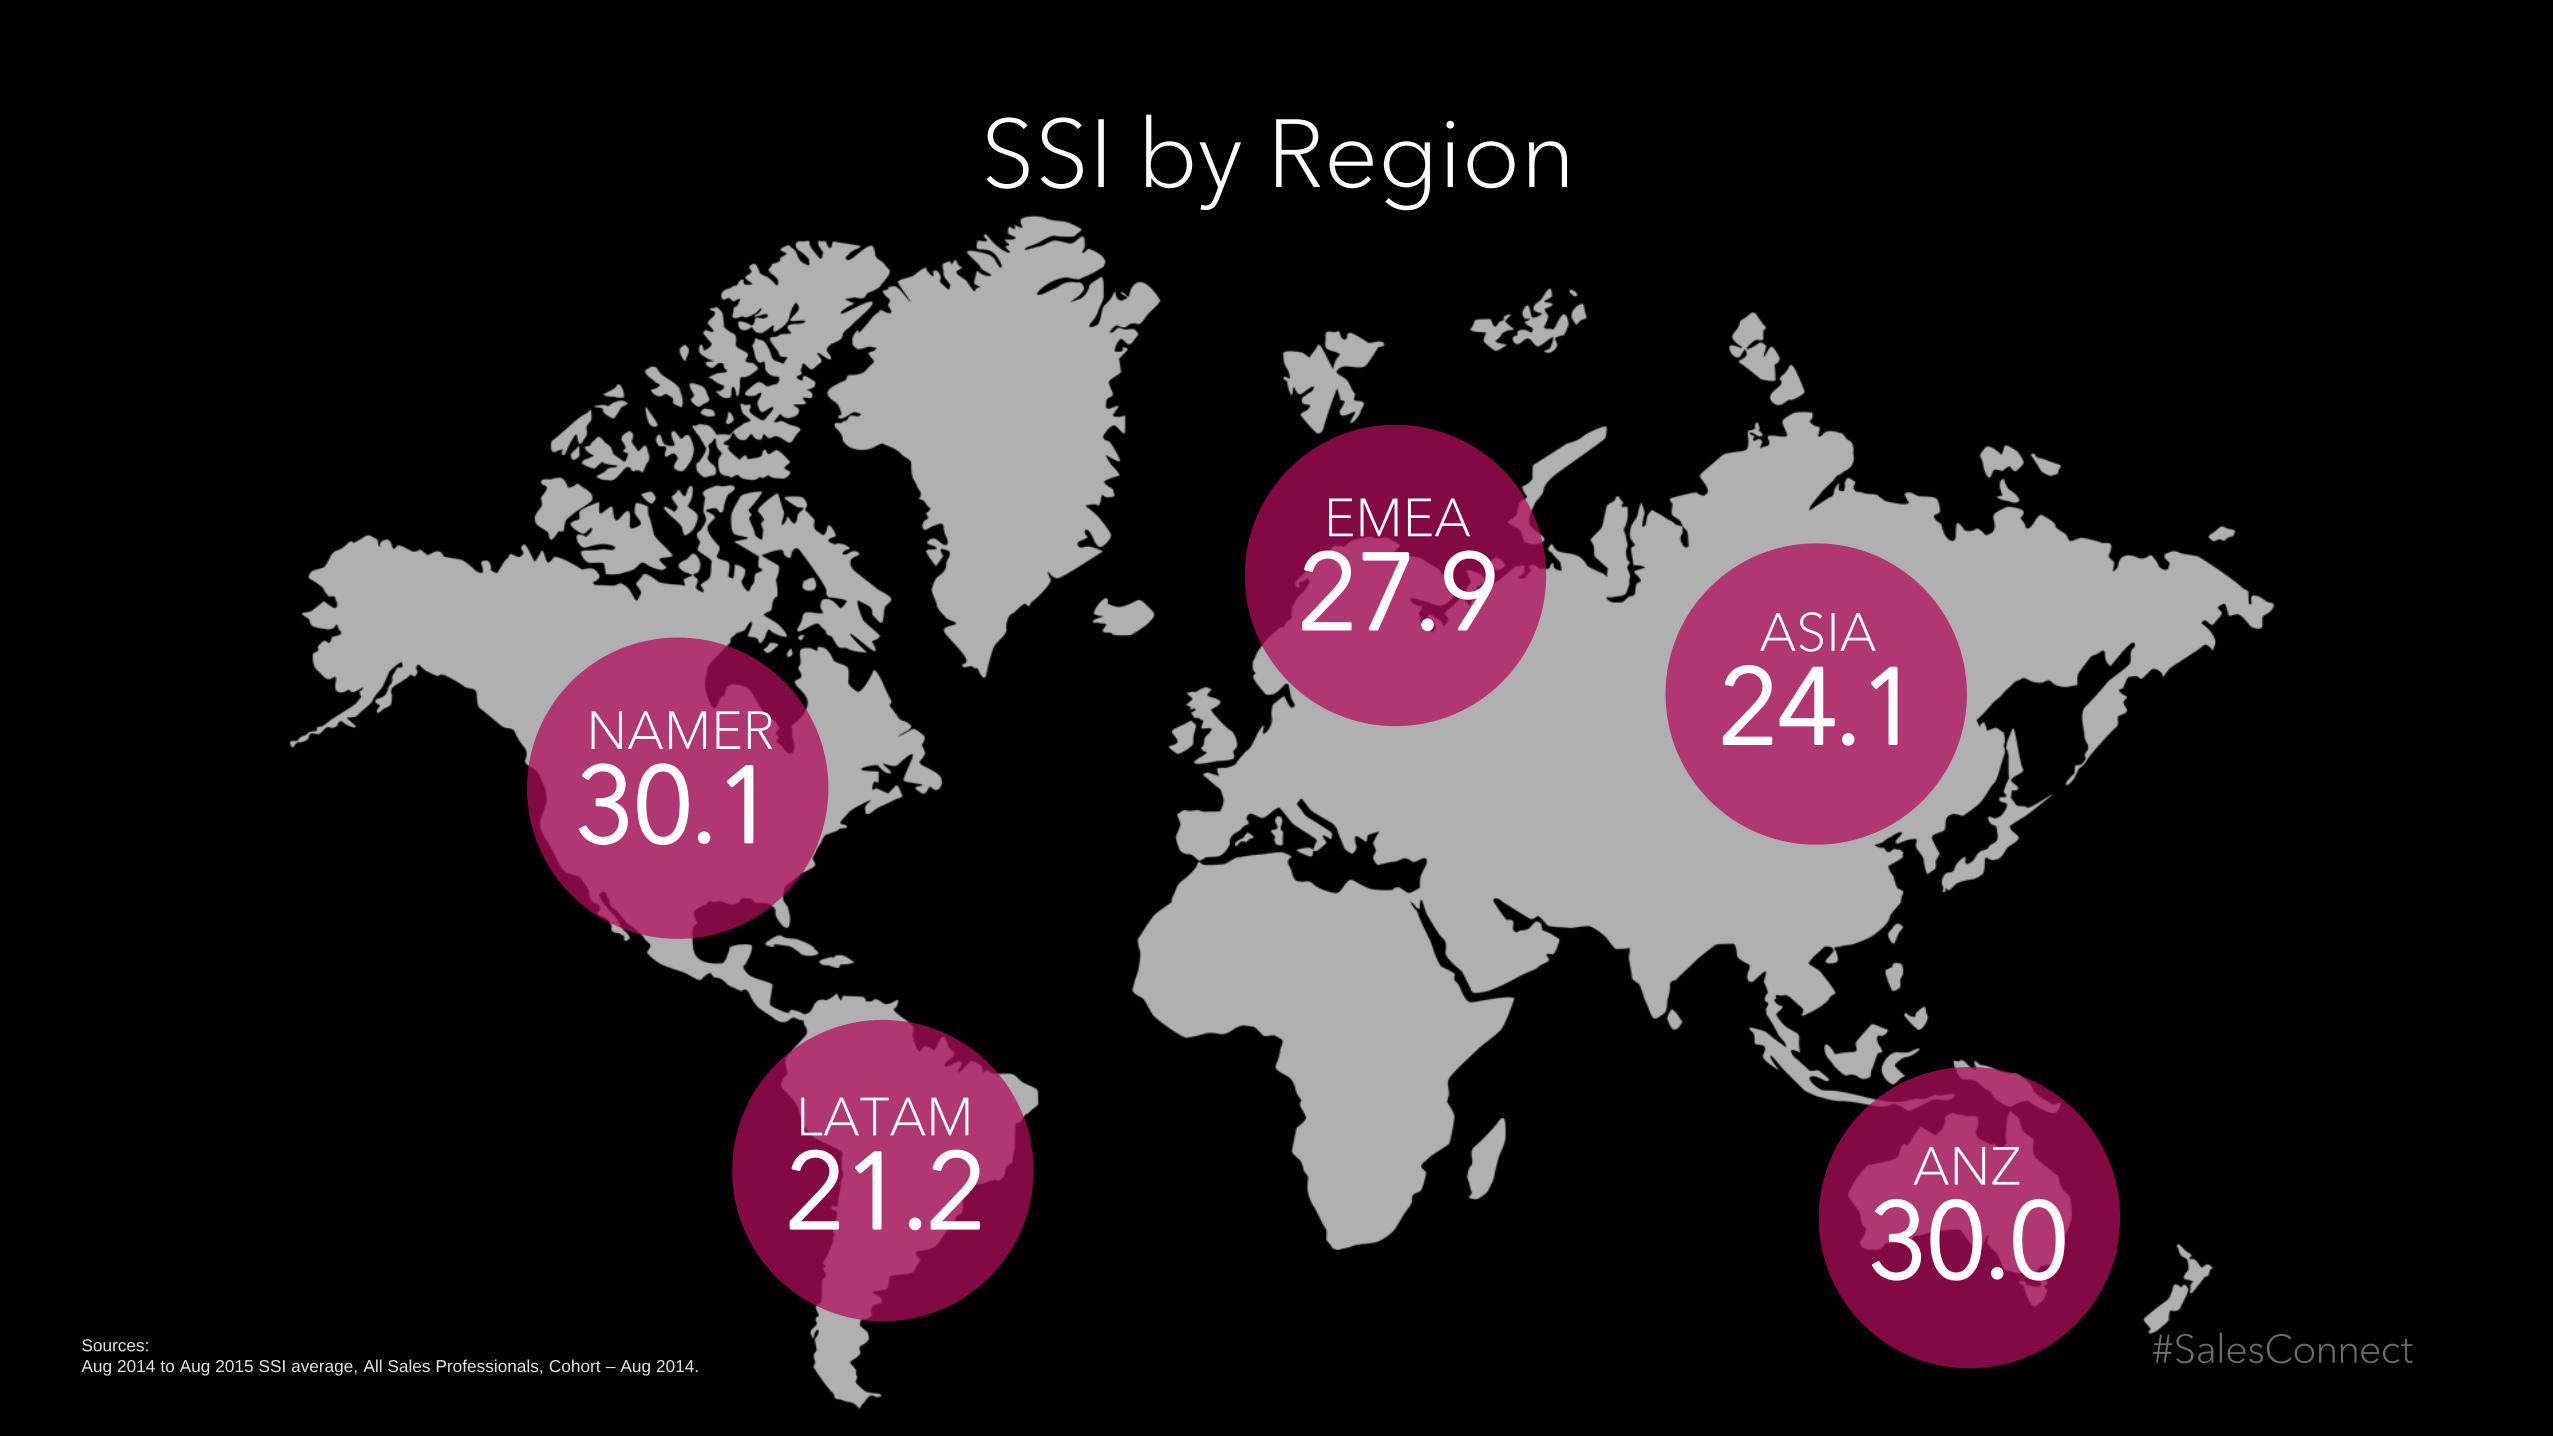
ANZ
30.0
ASIA
24.1
EMEA
27.9
LATAM
21.2
NAMER
30.1
SSI by Region
Sources:
Aug 2014 to Aug 2015 SSI average, All Sales Professionals, Cohort – Aug 2014.

ANZ
+33%
ASIA
+36%
EMEA
+34%
LATAM
+46%
NAMER
+29%
SSI by Region
Sources:
Aug 2014 to Aug 2015 SSI average, All Sales Professionals, Cohort – Aug 2014.

United Kingdom
30.7
France
23.0
The Netherlands
31.8
SSI by Country
Sources:
Aug 2014 to Aug 2015 SSI average, All Sales Professionals, Cohort – Aug 2014 .

United Kingdom
+27%
France
+33%
The Netherlands
+29%
SSI by Country
Sources:
Aug 2014 to Aug 2015 SSI average, All Sales Professionals, Cohort – Aug 2014.

Tech and professional services lead
0 5 10 15 20 25 30 35 40
Retail & Consumer Products
Manufacturing/Industrial
Aero/Auto/Engineering
Government/Education/Non-profit
Healthcare & Pharmaceutical
Financial Services & Insurance
Oil & Energy
Professional Services
Tech, Telecom, & Media
Aug 15 Aug 14Sources:
Aug 2014 to Aug 2015 SSI average, All Sales Professionals, Cohort – Aug 2014.
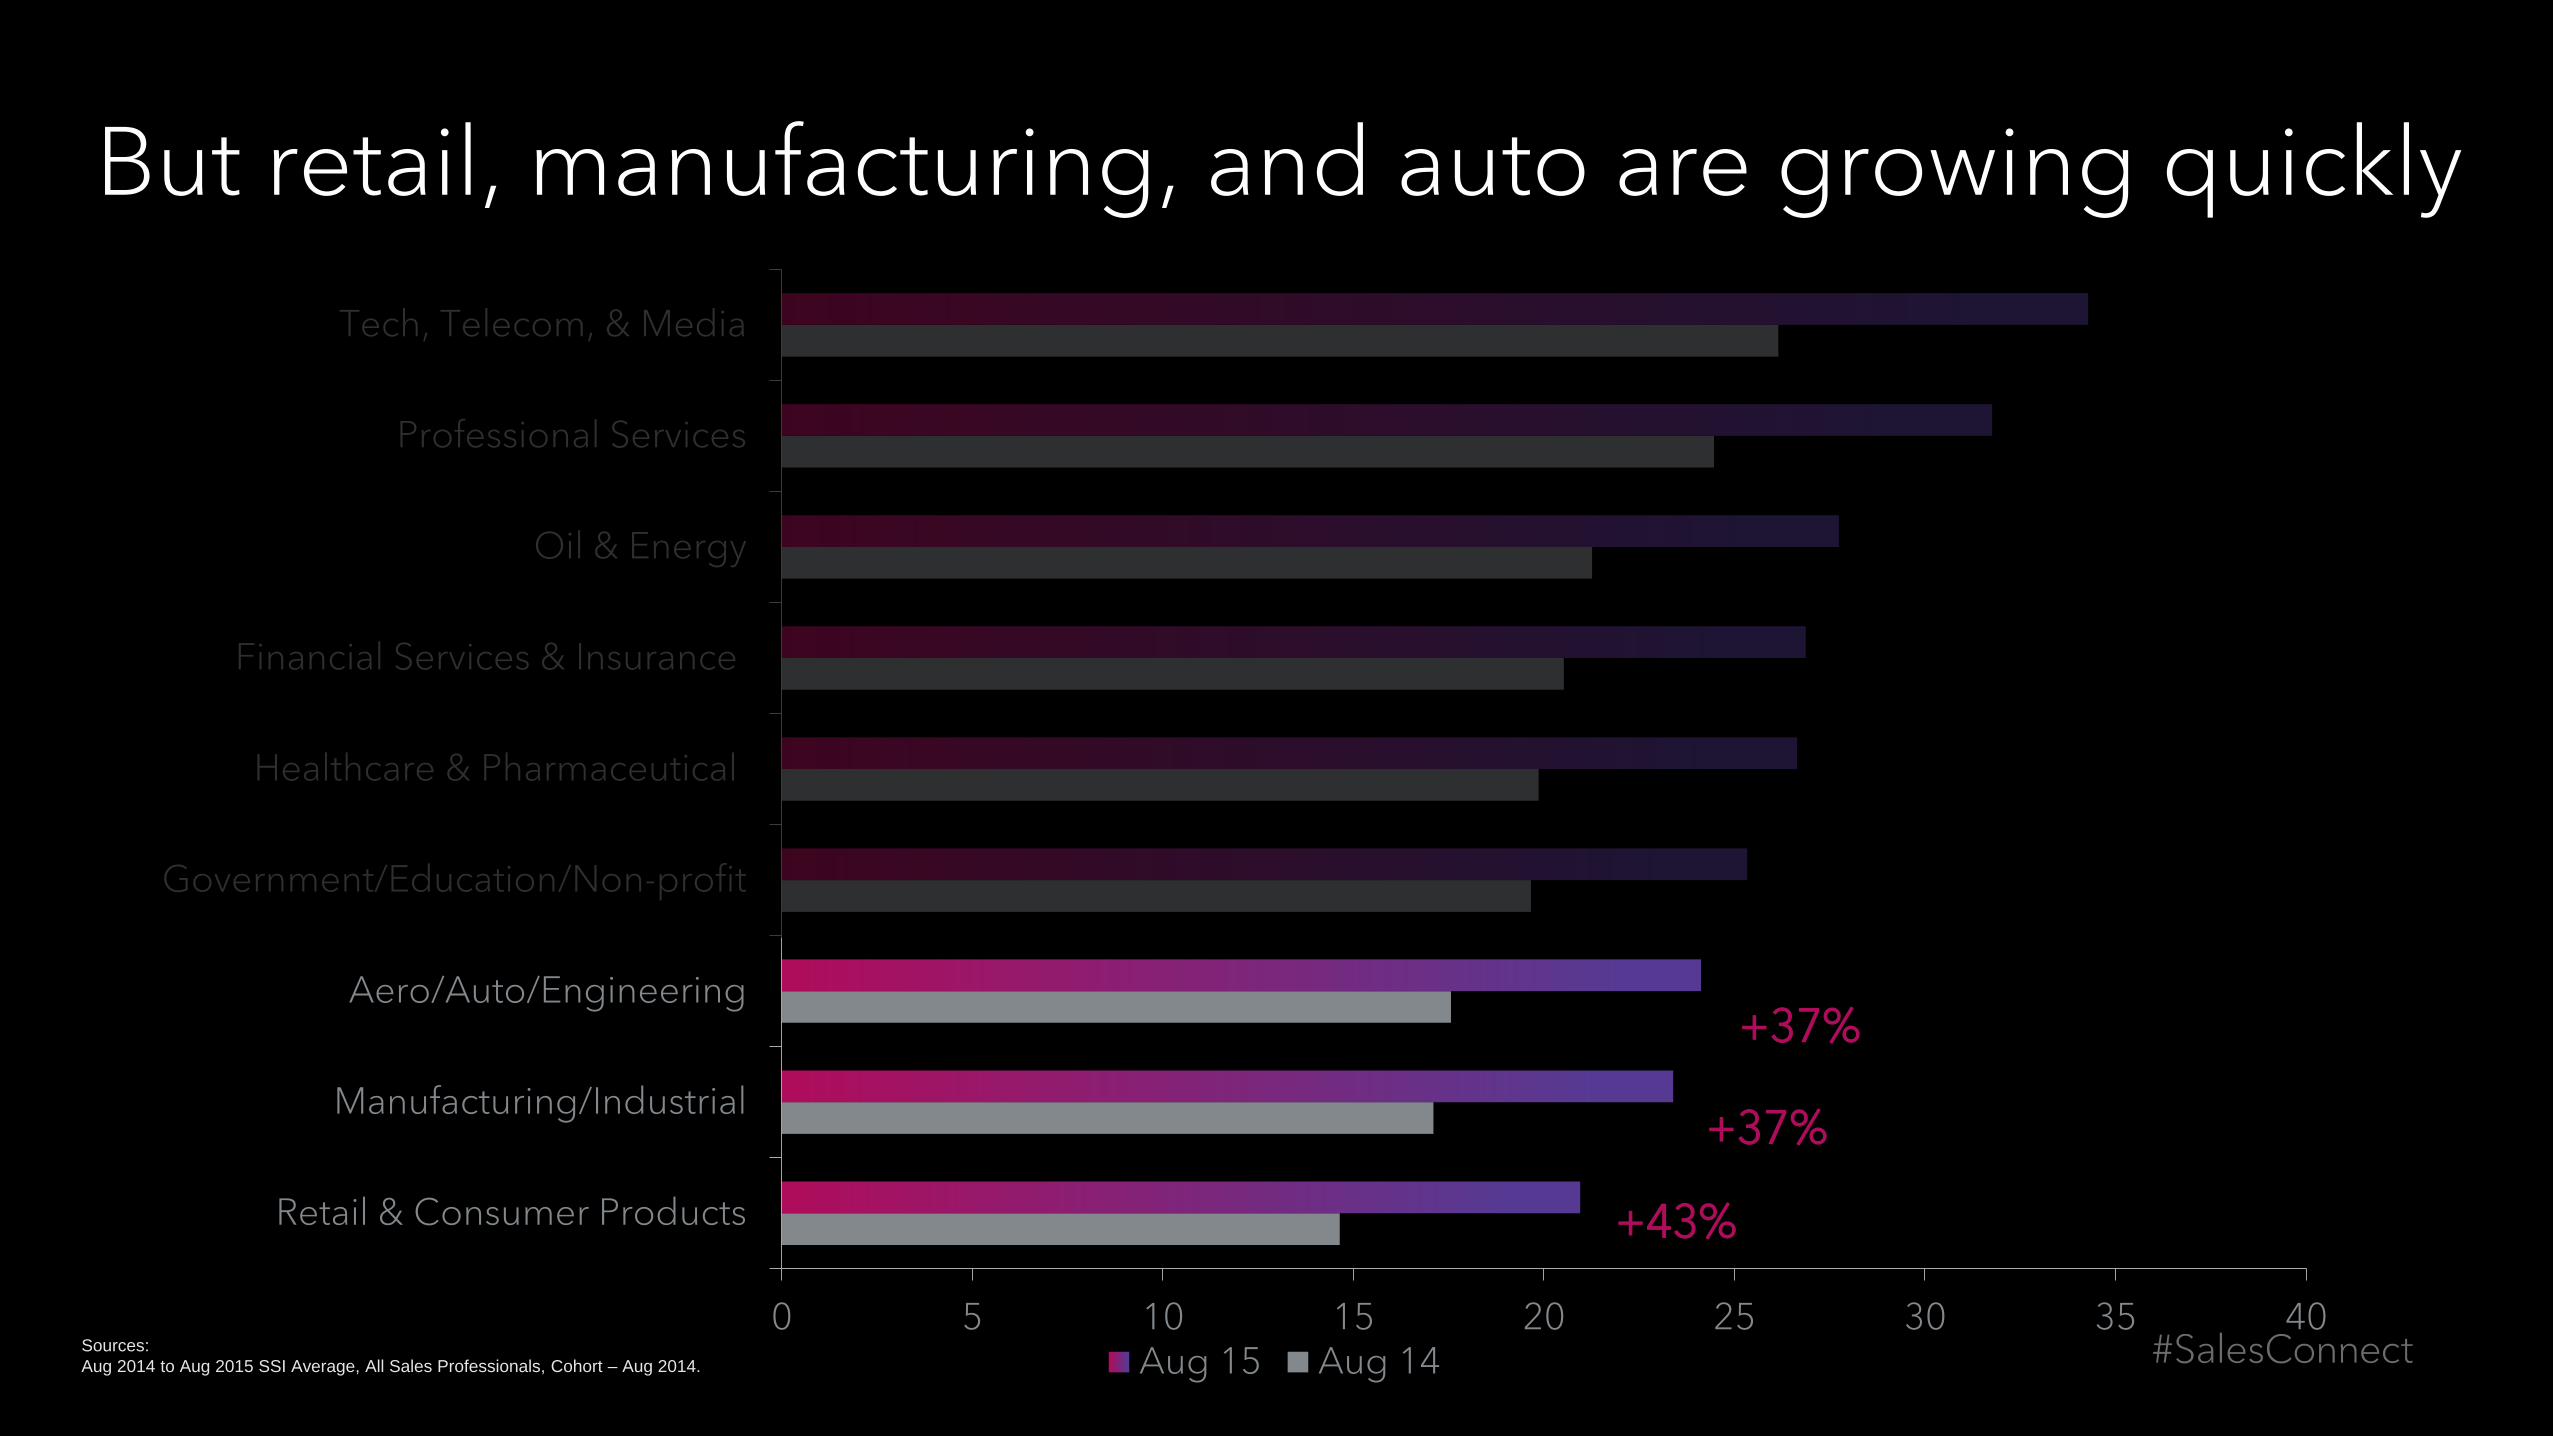
But retail, manufacturing, and auto are growing quickly
0 5 10 15 20 25 30 35 40
Retail & Consumer Products
Manufacturing/Industrial
Aero/Auto/Engineering
Government/Education/Non-profit
Healthcare & Pharmaceutical
Financial Services & Insurance
Oil & Energy
Professional Services
Tech, Telecom, & Media
Aug 15 Aug 14
+37%
+37%
+43%
Sources:
Aug 2014 to Aug 2015 SSI Average, All Sales Professionals, Cohort – Aug 2014.
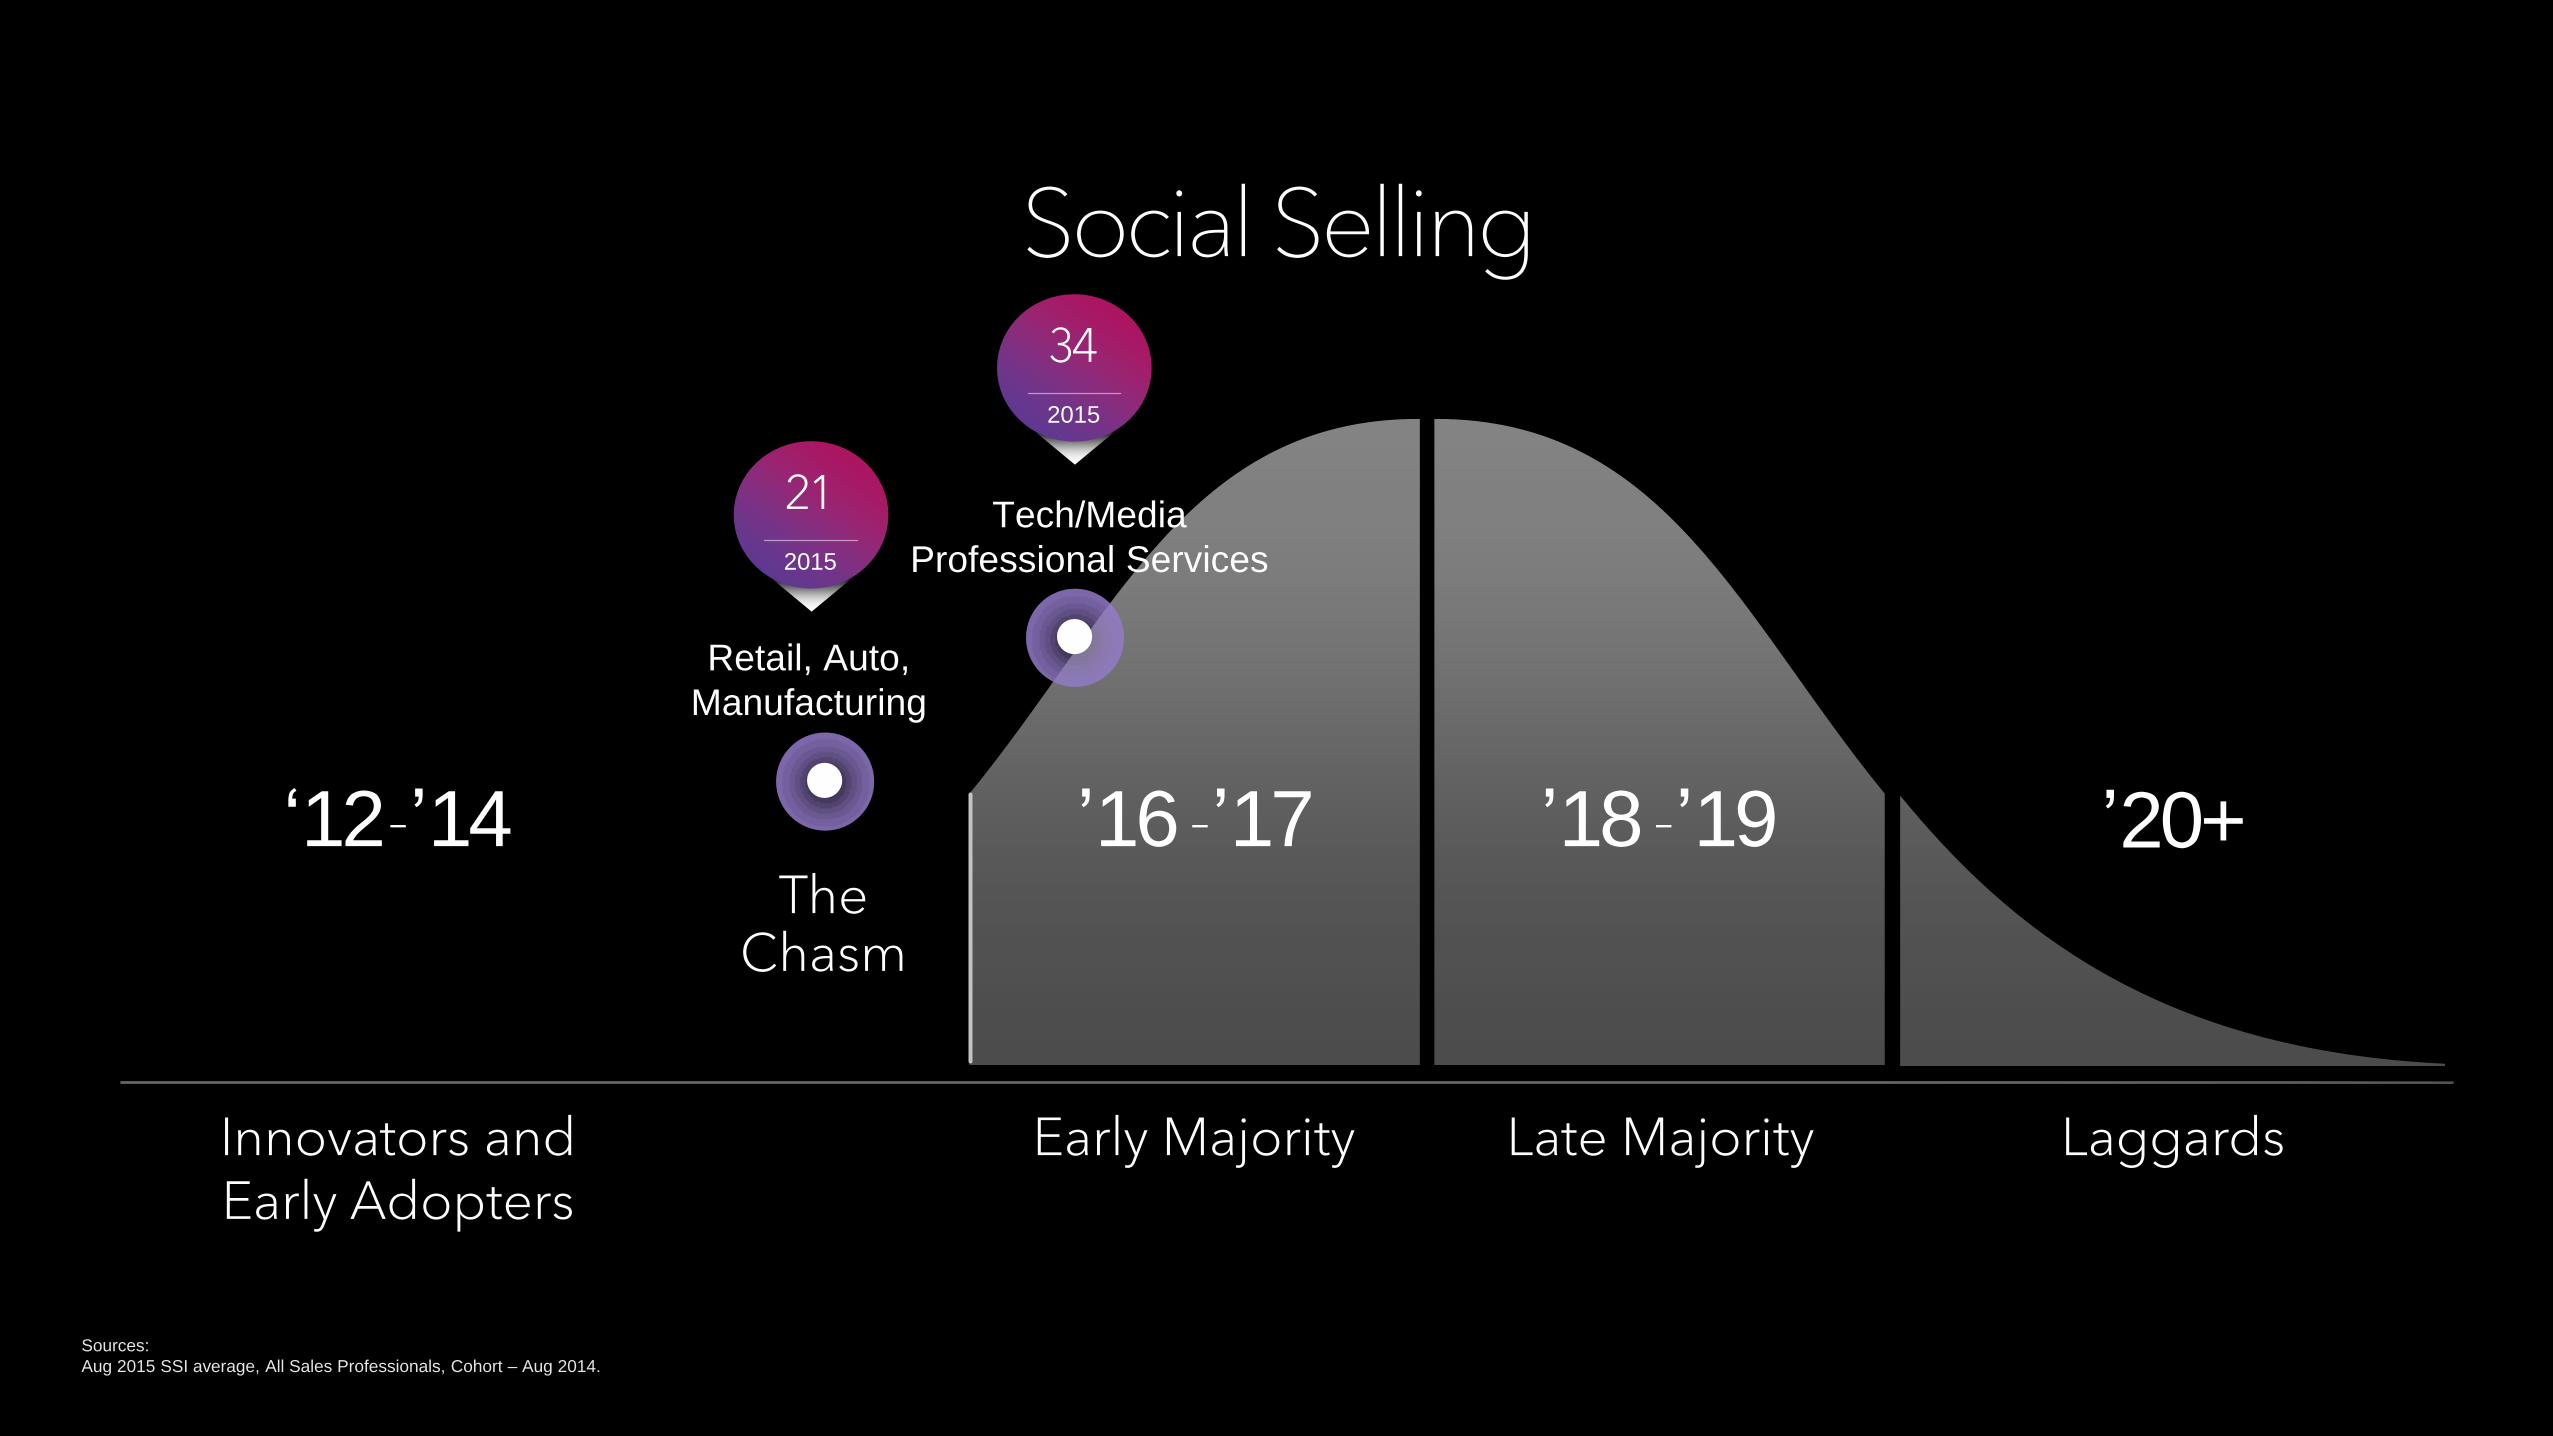
The Chasm
Early Majority Late Majority Laggards Innovators and Early Adopters
Social Selling
‘12-’14 ’18 -’19 ’20+ ’16 -’17
Tech/Media
Professional Services
Retail, Auto,
Manufacturing
34
2015
21
2015
Sources:
Aug 2015 SSI average, All Sales Professionals, Cohort – Aug 2014.
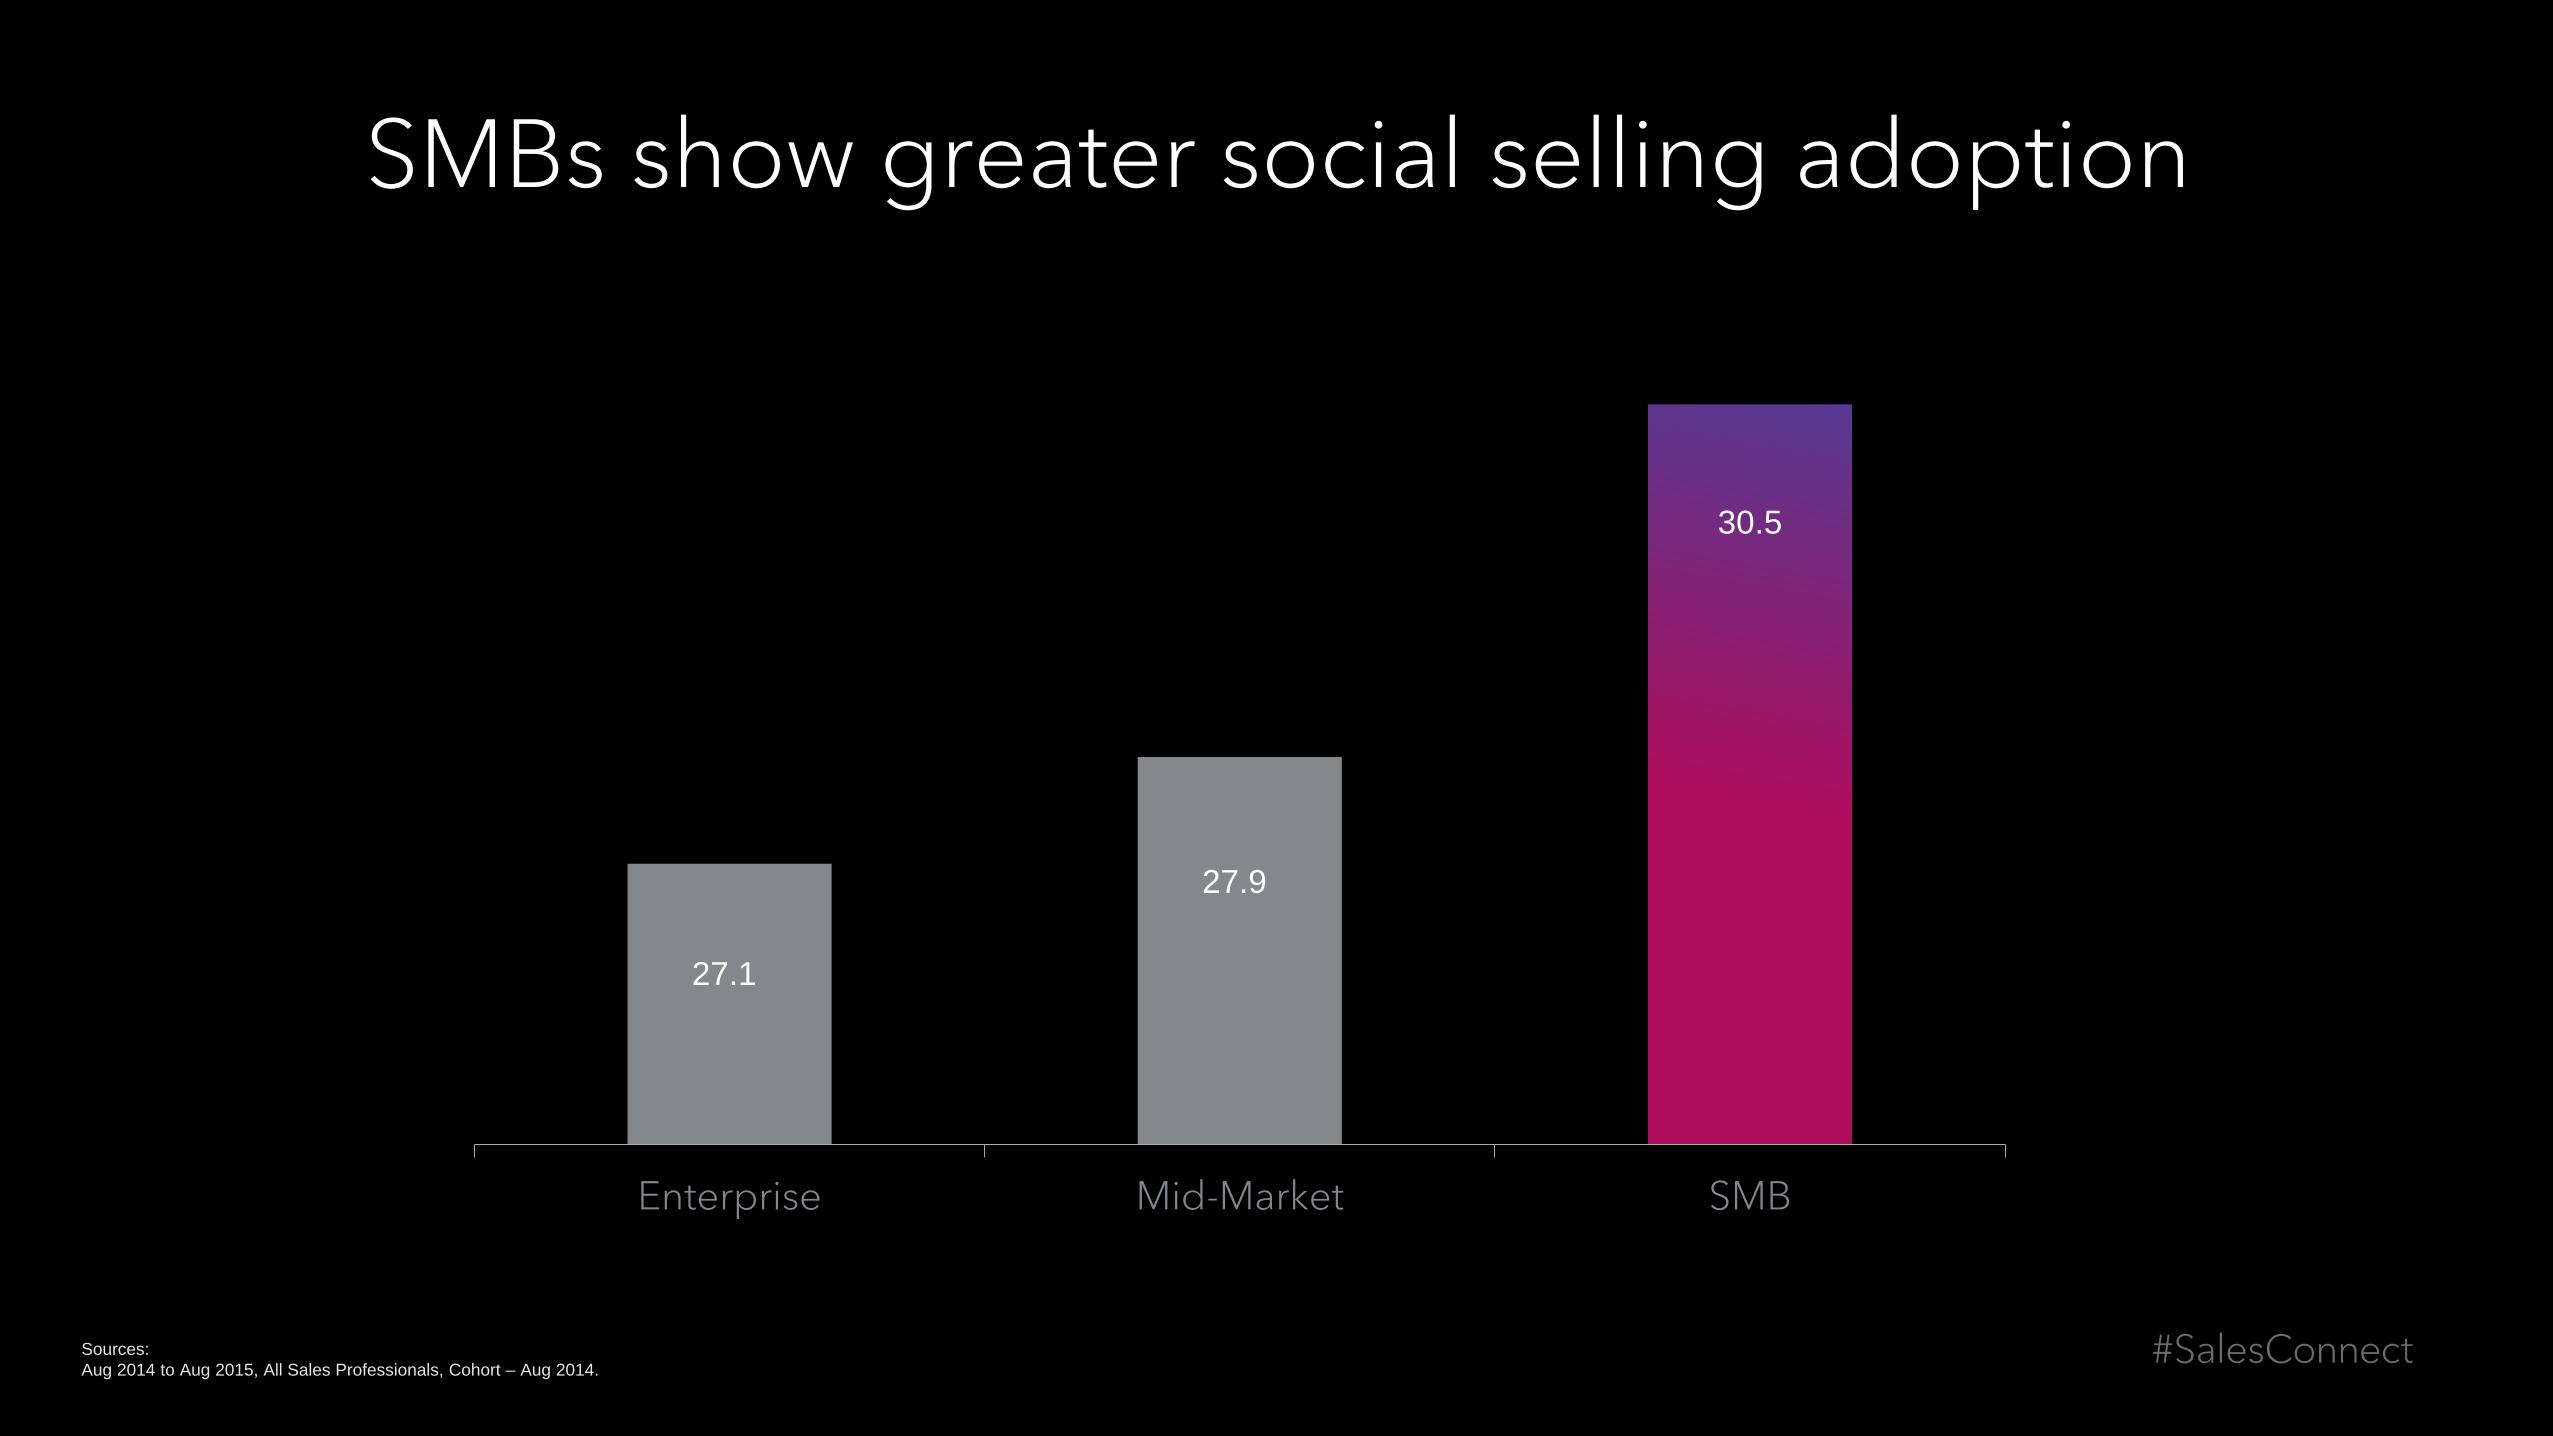
SMBs show greater social selling adoption
27.1
27.9
30.5
Enterprise Mid-Market SMB
Sources:
Aug 2014 to Aug 2015, All Sales Professionals, Cohort – Aug 2014.

27.1
27.9
30.5
Enterprise Mid-Market SMB
SMBs show greater social selling adoption
+32% +32%
+34%
Sources:
Aug 2014 to Aug 2015, All Sales Professionals, Cohort – Aug 2014.

The Chasm
Early Majority Late Majority Laggards Innovators and Early Adopters
Social Selling
‘12-’14 ’18 -’19 ’20+ ’16 -’17
SMB
ENT, Mid Market
31
2015
27
2015
Sources:
Aug 2015 SSI average, All Sales Professionals, Cohort – Aug 2014.

Globally there’s room on the adoption curve
All Sales Professionals
Median: 22 SC Attendees
Median: 63
0 100
Sources:
Aug 2015, All Sales Professionals according to LinkedIn compared to Sales Connect London attendees. SSI score as of October 6, 2015.

Leaderboard
1 93
2 92.8
3 92.7
4 92.5
5 92.1
6 91.7
7 91.5
8 91.4
9 90.3
10 89.9
Richard van der Blom
Alan Crean
Xavier Monty Wendy van Gilst
Oliver S. Bauer
Ben Savage
Marcus Leathwood
Jordi Gili
Craig Evans
Paul Lewis
Sources:
SSI score as of October 6, 2015.

19.2
23.1 24.3 24.3
Competitor 1 Competitor 2 Competitor 3 Competitor 4 JLL (all non HREmployees)
JLL UK SocialSellers
50.6
24.8
from belief to adoption
JLL’s SSI compared to competitors:
Sources:
Benchmark is composed of SSI of global non HR employees in Cushman & Wakefield (incl DTZ), Lambert Smith Hampton, Colliers International, CBRE
Aug 2015 SSI average, JLL Sales Navigator users vs JLL Competitor Sales Professionals (global non HR employees) Vs Competitor Competitor Sales Professionals (global non HR employees).
SS
I

44% 46%
10%
0% 1%
33%
62%
5%
0-20 21-45 46-69 70+
JLL’s journey: creating a competitive advantage
5X Over
Sources:
Aug 2015 SSI average, JLL Sales Navigator users vs Competitor Competitor Sales Professionals (global non HR employees).

Focus shifts to more sophisticated techniques as SSI scores increase
0% 10% 20% 30% 40% 50% 60% 70% 80% 90% 100%
1-20
21-69
70+
SS
I Bu
cke
ts
Professional Brand
Professional Brand
Professional Brand Right People
Right People
Right People
Insights
Insights
Insights
Relationships
Relationships
Relationships
Sources:
Aug 2015 SSI distribution by component scores, JLL Sales Navigator users.

Ahead of the competition in all SSI components
1.3x Establish a
professional brand
1.9x Finding the right
people
2.3x Engaging with
insights
3.4x Establishing relationships
Sources:
Aug 2015 SSI average, JLL Sales Navigator Users vs Competitor Sales Professionals (global non HR employees).

From SSI to outcomes
2.5x 3.2x Profile views from decision makers
Business decision maker connections
JLL vs. competitors…
Sources:
Aug 2014 to Aug 2015, JLL Sales Navigator Users vs Competitor Competitor Sales Professionals (global non HR employees), no cohort.
Decision maker is defined as an professional with a Director+ seniority.
Are you presenting at a breakout session?
Make sure your segue slides are the right color.
To swap the slide master...
On the View tab, click Normal.
In Normal View, in the thumbnail pane on the left, click the slide that you want to apply a layout to.
On the Home tab, click Layout, and then select the layout that you want.
Keynotes & general sessions
The Future of Sales and Marketing breakout track
Habits of High Performing Reps breakout track
How to Build a Social Selling Organization breakout track
title title title title
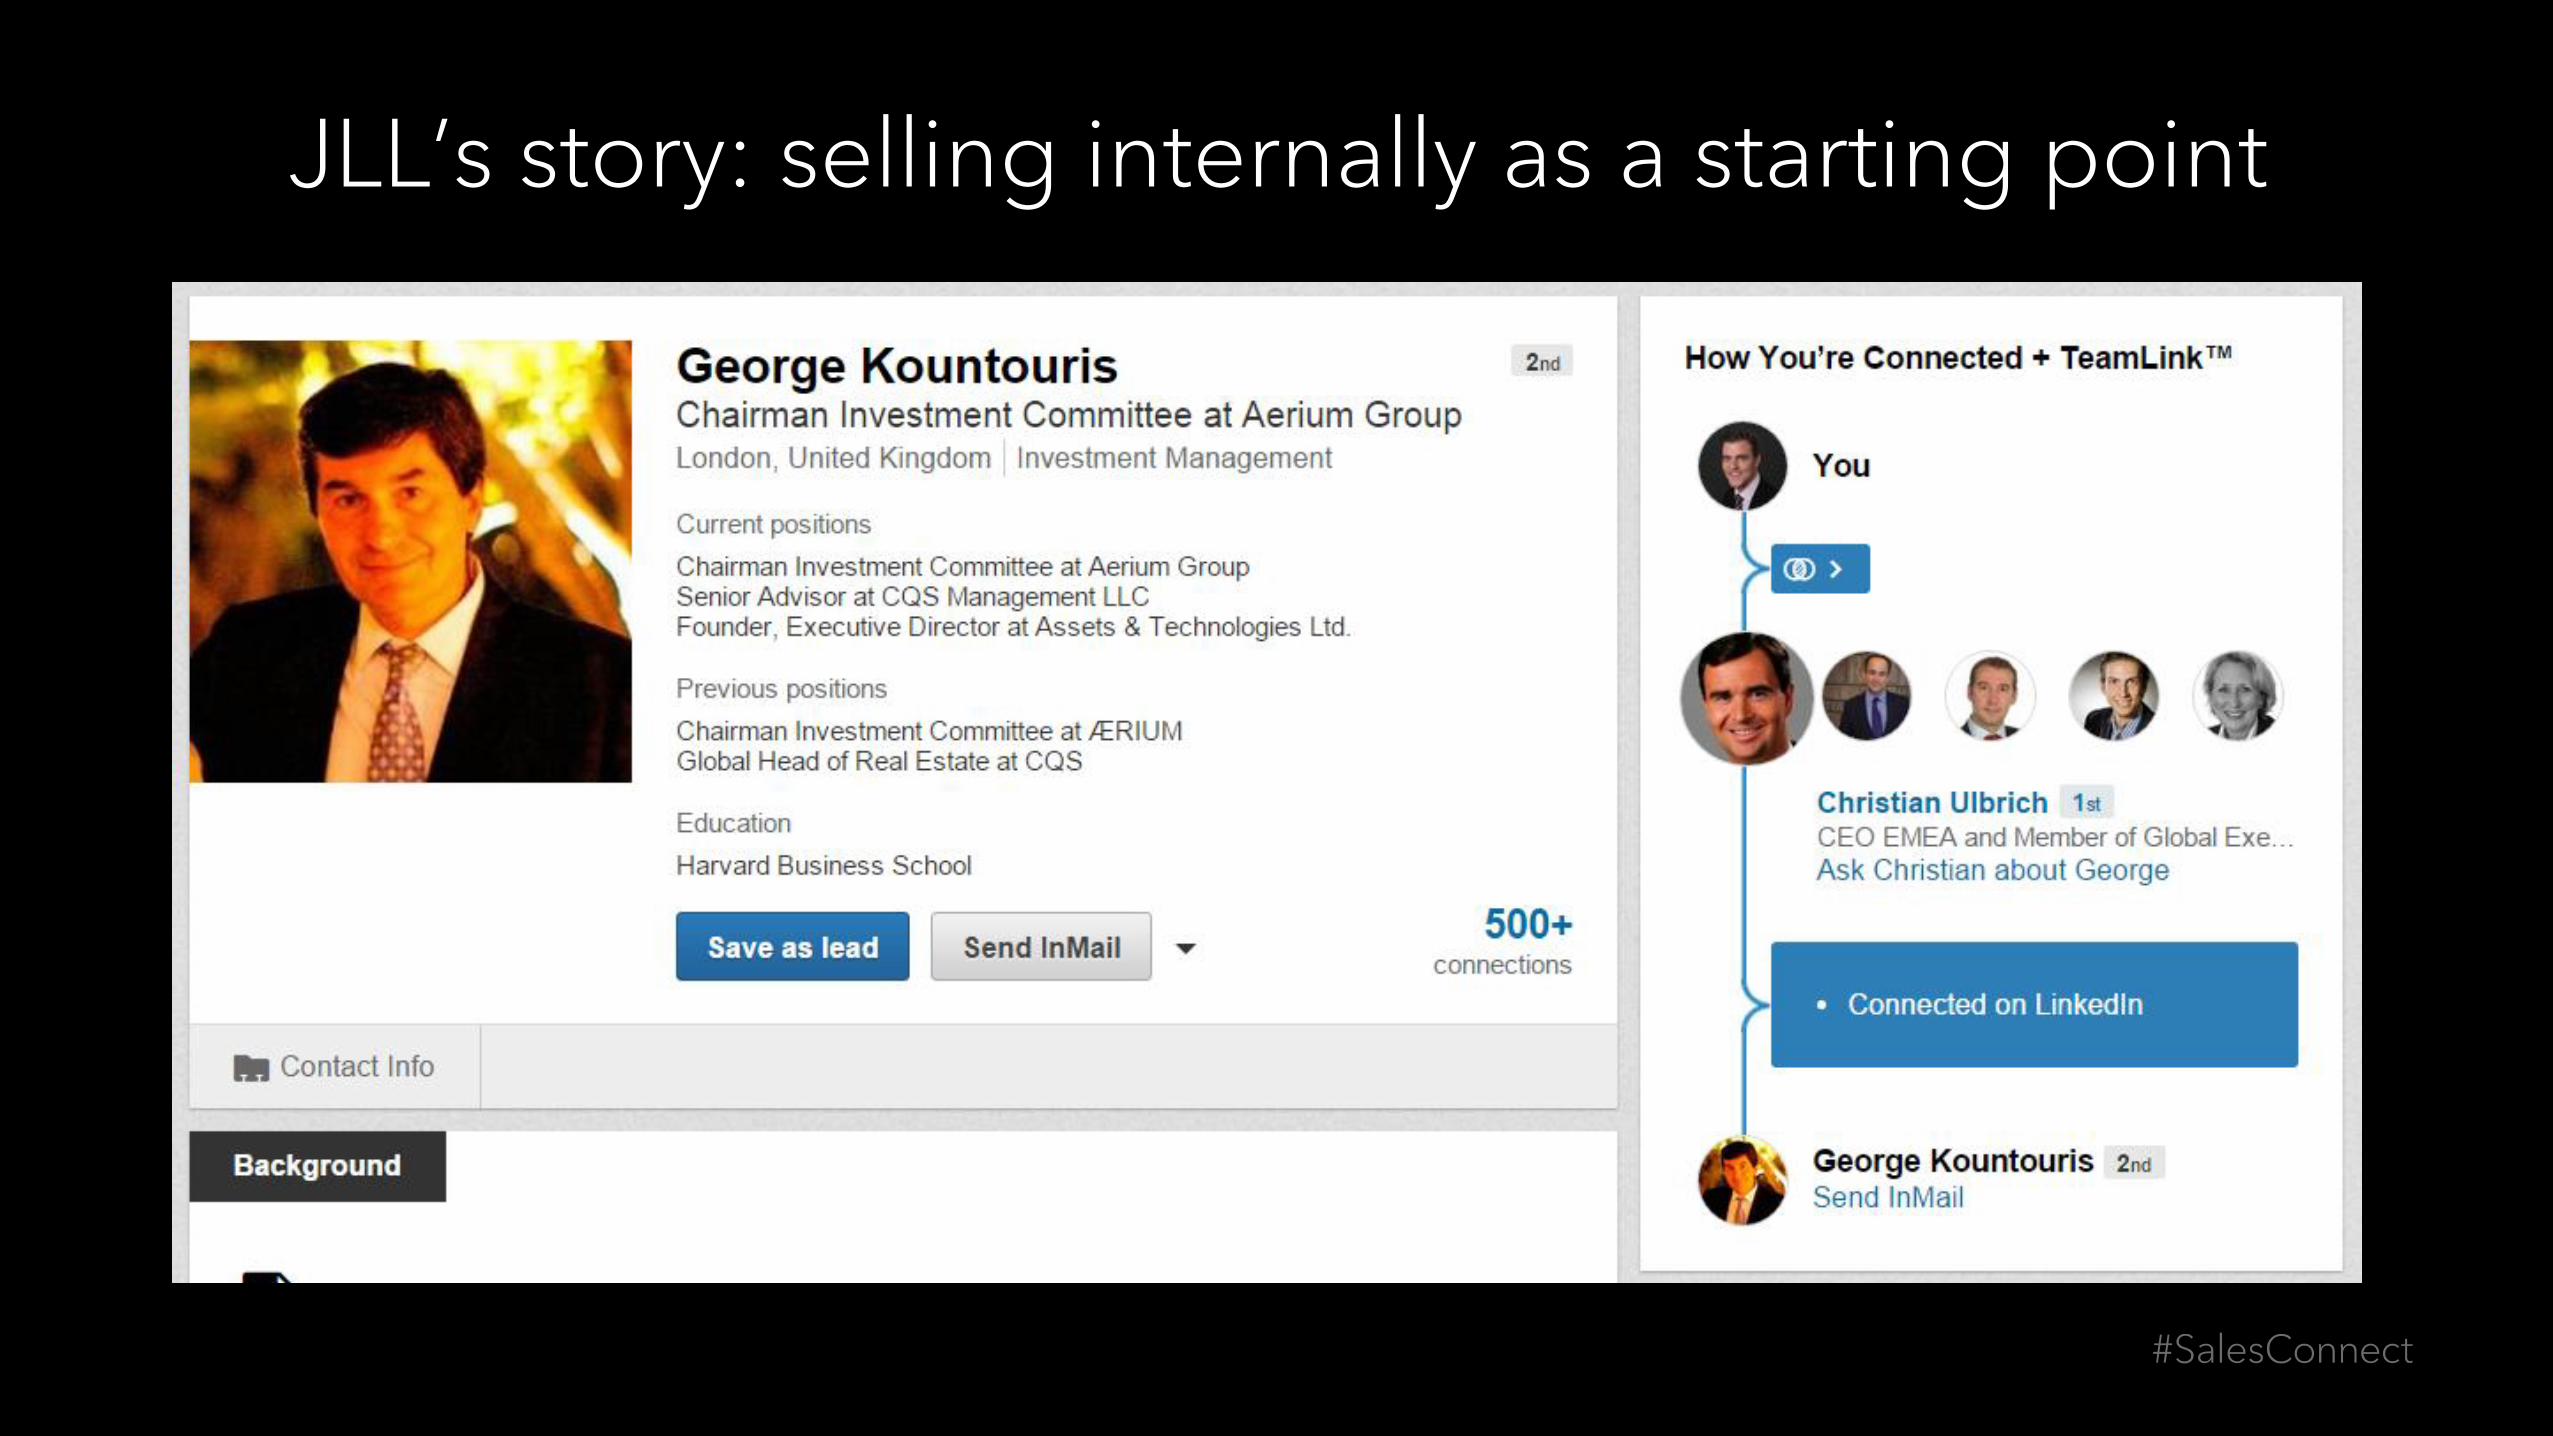
JLL’s story: selling internally as a starting point
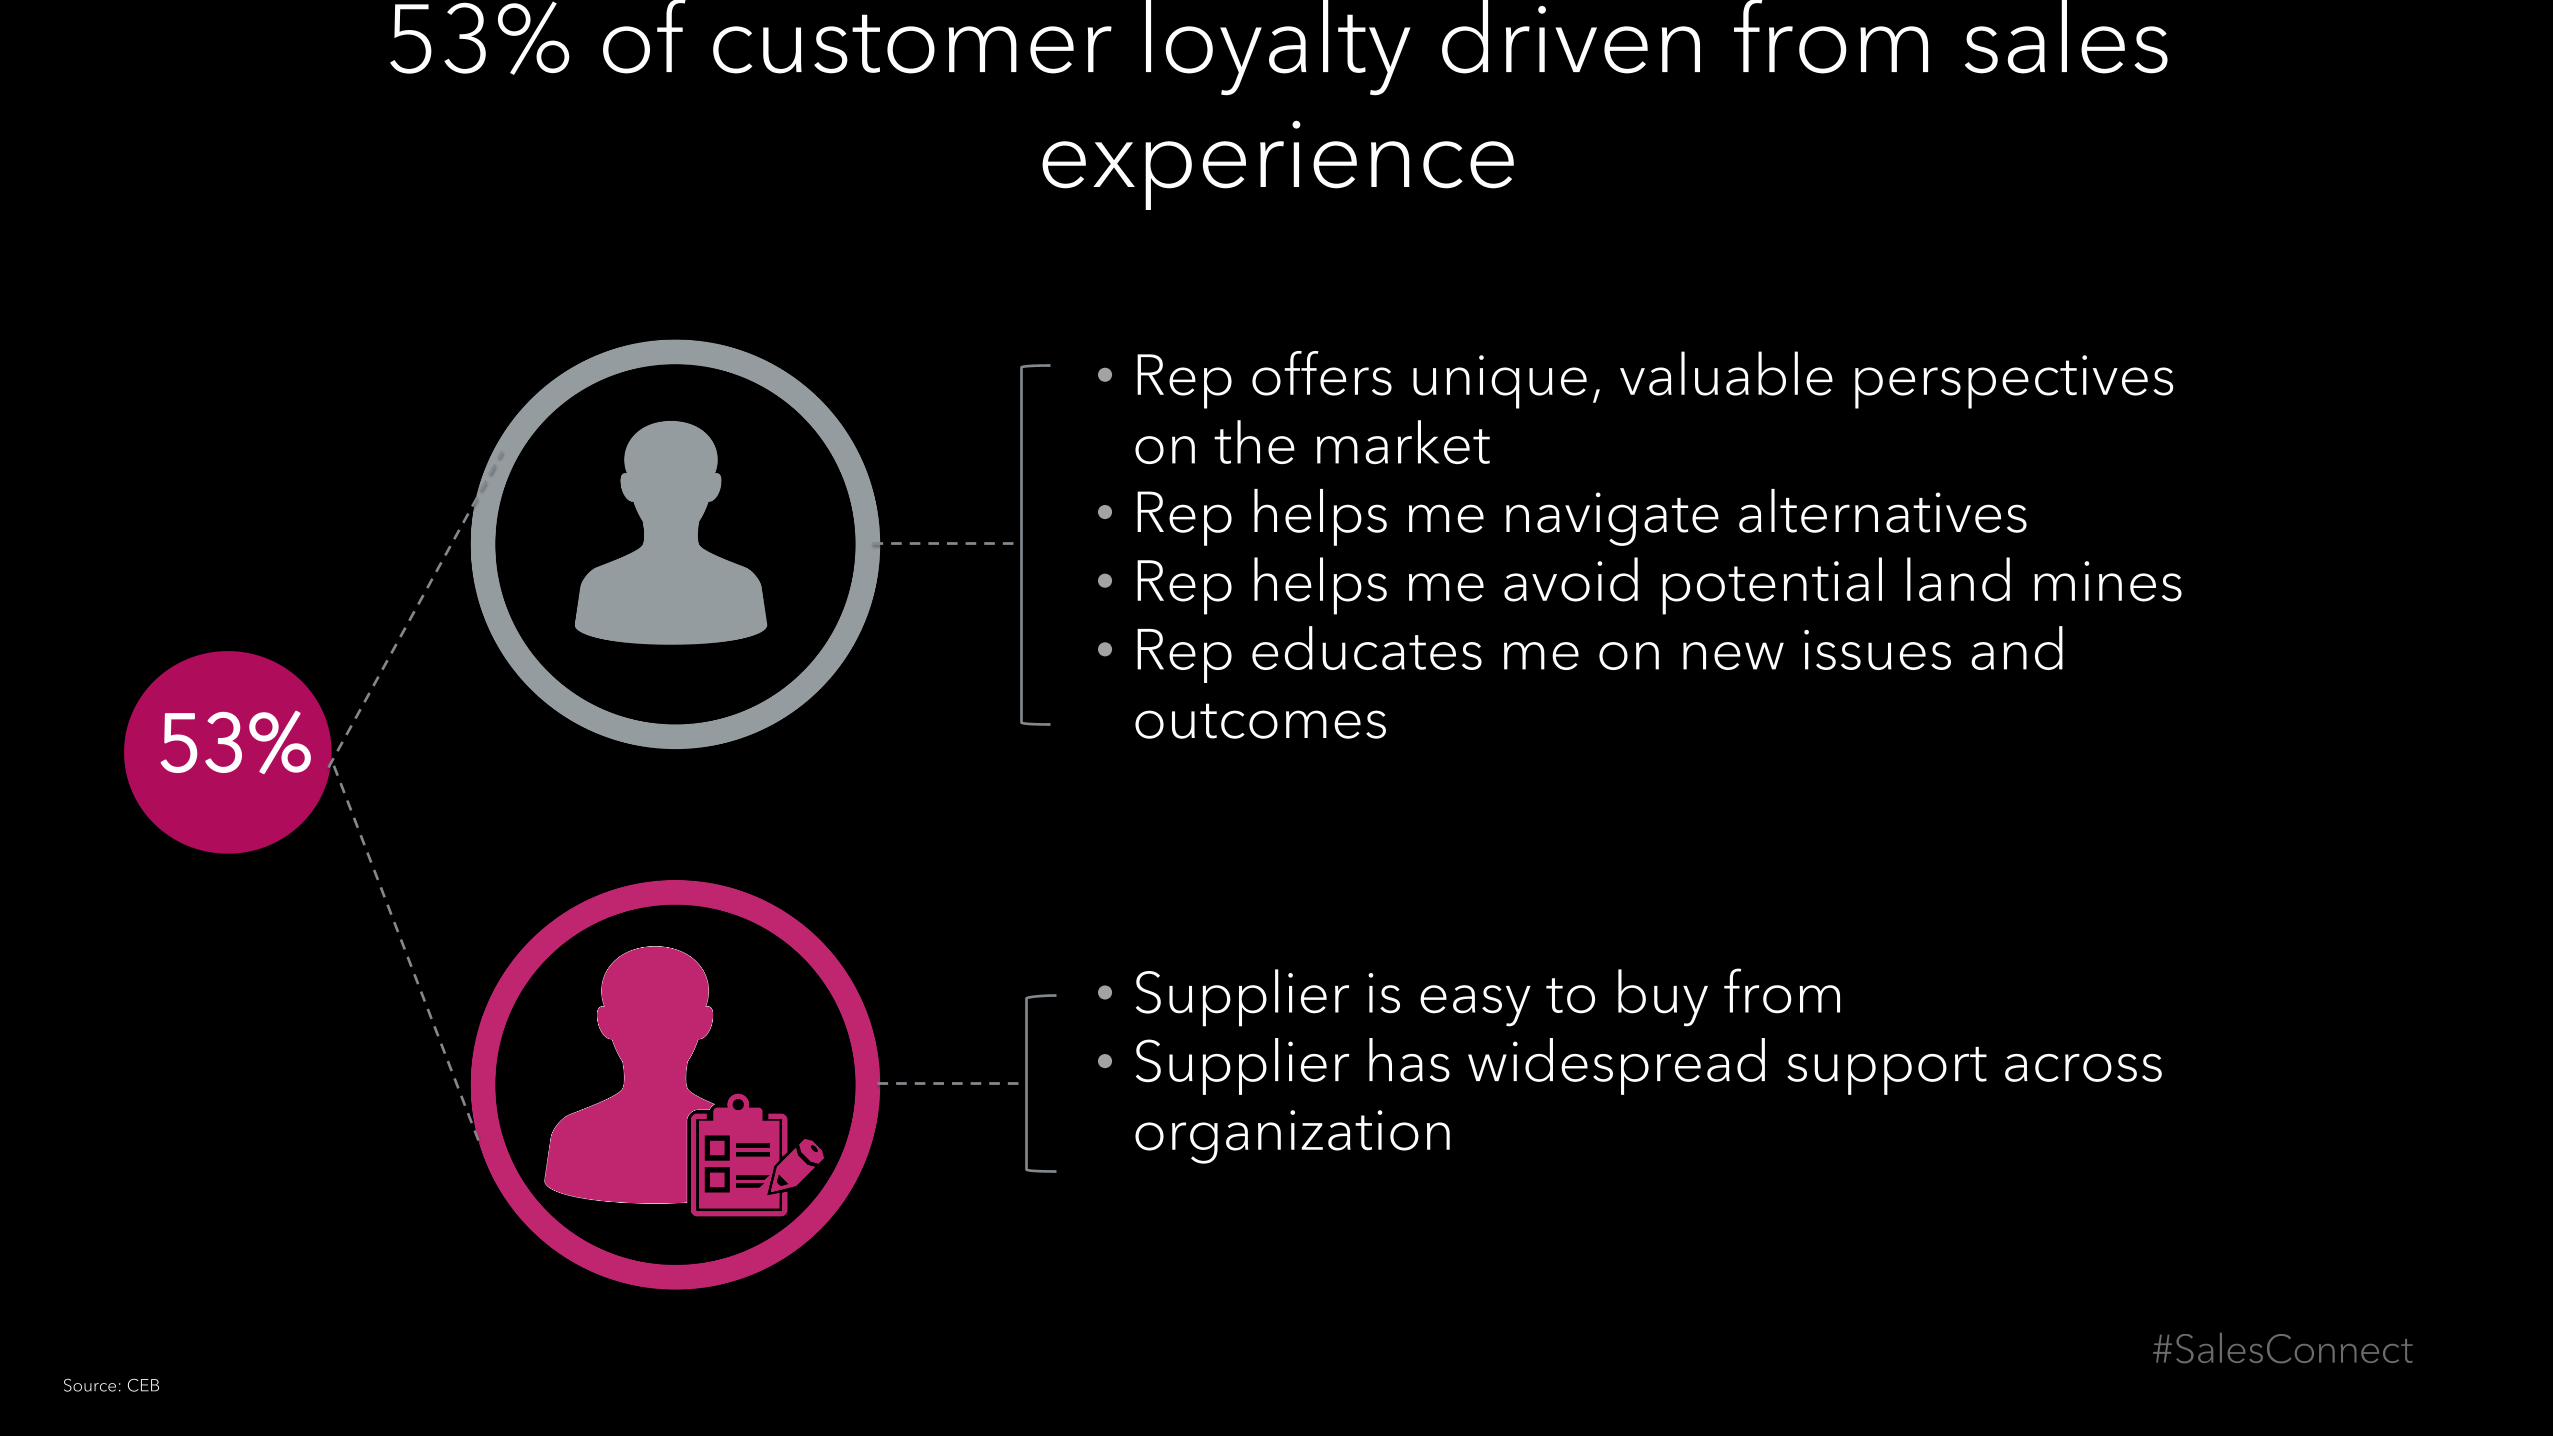
53% of customer loyalty driven from sales experience
• Rep offers unique, valuable perspectives on the market
• Rep helps me navigate alternatives • Rep helps me avoid potential land mines • Rep educates me on new issues and
outcomes
• Supplier is easy to buy from • Supplier has widespread support across
organization
53%
Source: CEB

Buying decision making process
57%
Learn Define Needs
Assess Options
Make Decision
Result
Source: CEB

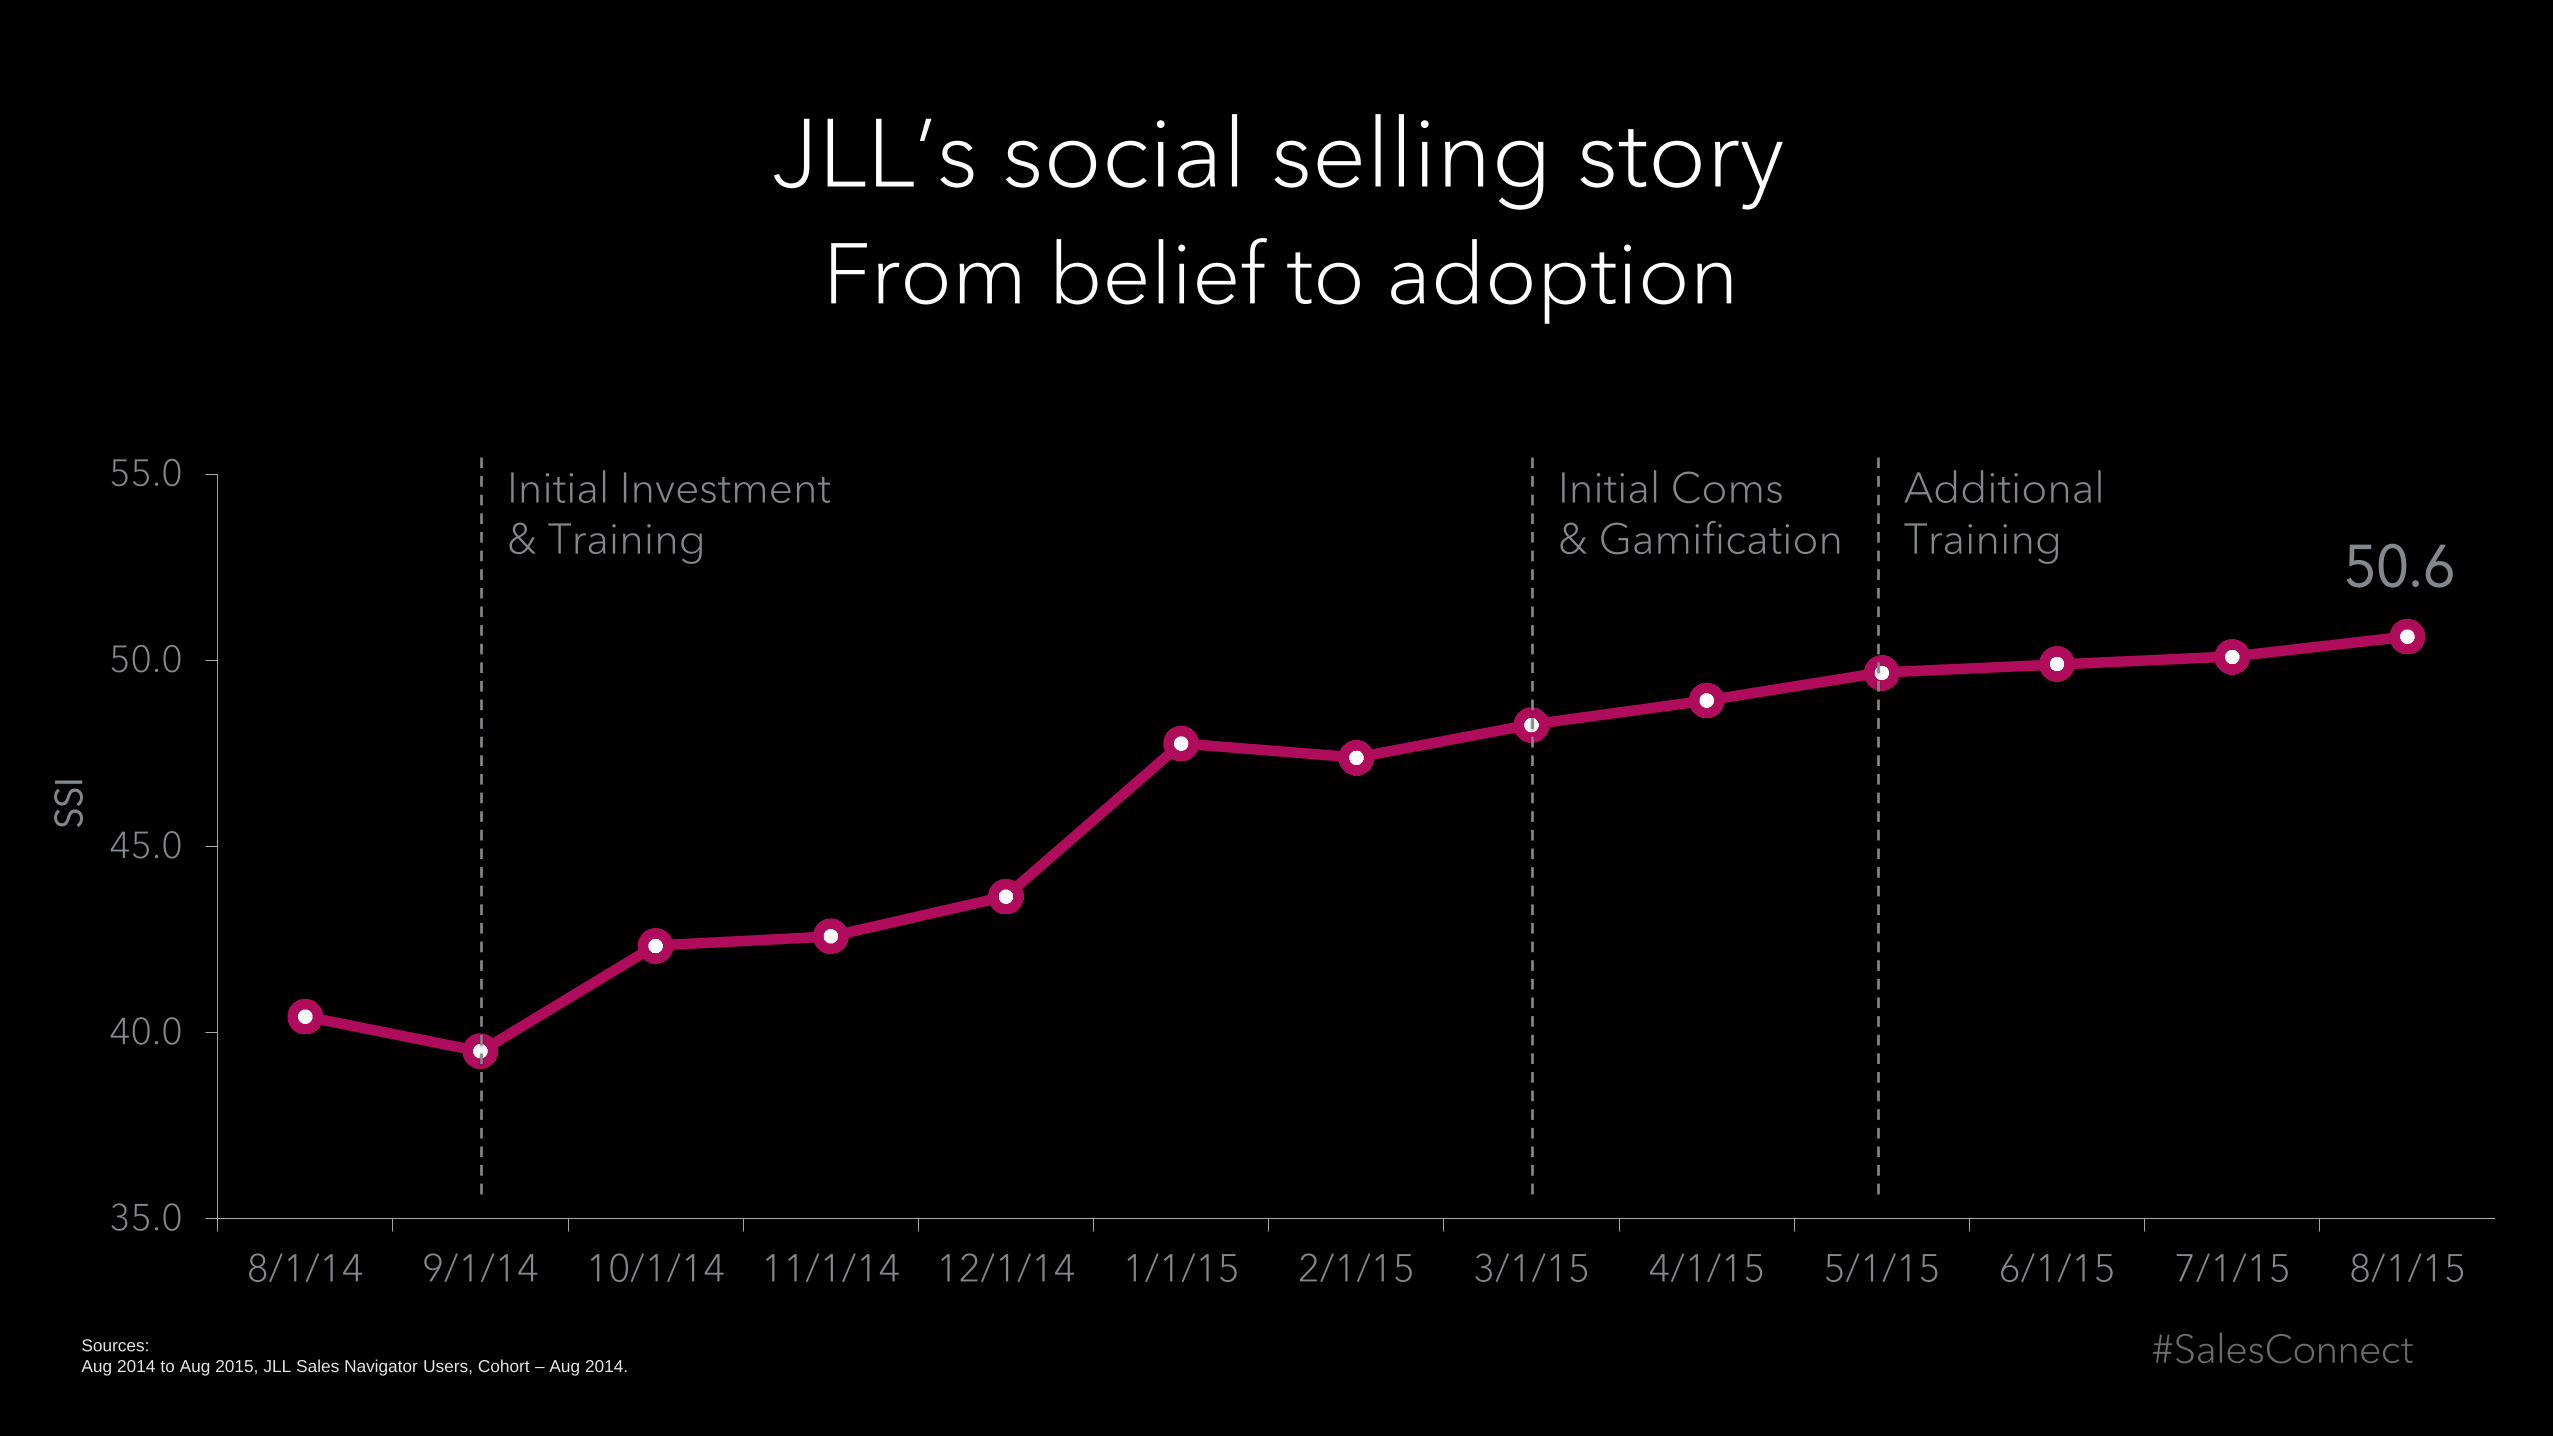
35.0
40.0
45.0
50.0
55.0
8/1/14 9/1/14 10/1/14 11/1/14 12/1/14 1/1/15 2/1/15 3/1/15 4/1/15 5/1/15 6/1/15 7/1/15 8/1/15
SS
I
From belief to adoption
JLL’s social selling story
Initial Investment & Training
Initial Coms & Gamification
Additional Training
50.6
Sources:
Aug 2014 to Aug 2015, JLL Sales Navigator Users, Cohort – Aug 2014.

0
1
2
3
4
5
6
7
8
9
10
1 11 21 31 41 51 61 71 81 91 101
Pre Sales Navigator
August 2015
JLL’s social selling story From belief to adoption
Nu
mb
er
of
Sa
les
Na
vig
ato
r U
sers
Median 50.8 SSI
Median 36.4 SSI
Sources:
Aug 2015, JLL Sales Navigator Customers, Pre SSI is the score prior to onboarding with Sales Navigator, while Aug 2015 is the SSI score as of Aug 2015 for all JLL Sales Navigator users.

User success stories
34.7
78.3
125% Increase in SSI
since becoming a SN user
When I first joined, we tended to do quite a lot of cold calling. We don't do as much of
that anymore. We’ve got many more avenues where you can get warmer leads
and warmer introductions.
Dan Brown, Business Development
Sources:
Aug 2015 SSI, Pre SSI is the score prior to onboarding with Sales Navigator.

Dashboards are used to consistently measure behavior and leaderboards drive adoption

The SSI free dashboard is generating organic interest

Pre-Sales Navigator vs. August 2015
JLL has implemented SSI and seen impressive results
14% Increase in
establising a professional
brand
18% Increase in finding the right people
54% Increase in
engaging with insights
64% Increase in
establishing relationships
33% Increase
in SSI
Sources:
Aug 2015, JLL Sales Navigator Customers, Pre SSI is the score prior to onboarding with Sales Navigator, while Aug 2015 is the SSI score as of Aug 2015 for all JLL Sales Navigator users.

JLL employees establish themselves as thought leaders
Measuring soft ROI: employee engagement
Social engagement
Sharing content
Behavior around CRM
Breaking down silos

ROI at JLL
£0
£50,000
£100,000
£150,000
£200,000
£250,000
£300,000
David and Dan
Re
ven
ue
in P
ou
nd
s
£1M+ in pipeline
£250,000 Closed

Unlock your company network

This is the new talent solutions – any sales organization that doesn’t have this is behind the
competition
Competitive advantage concept
Tool + sales skills
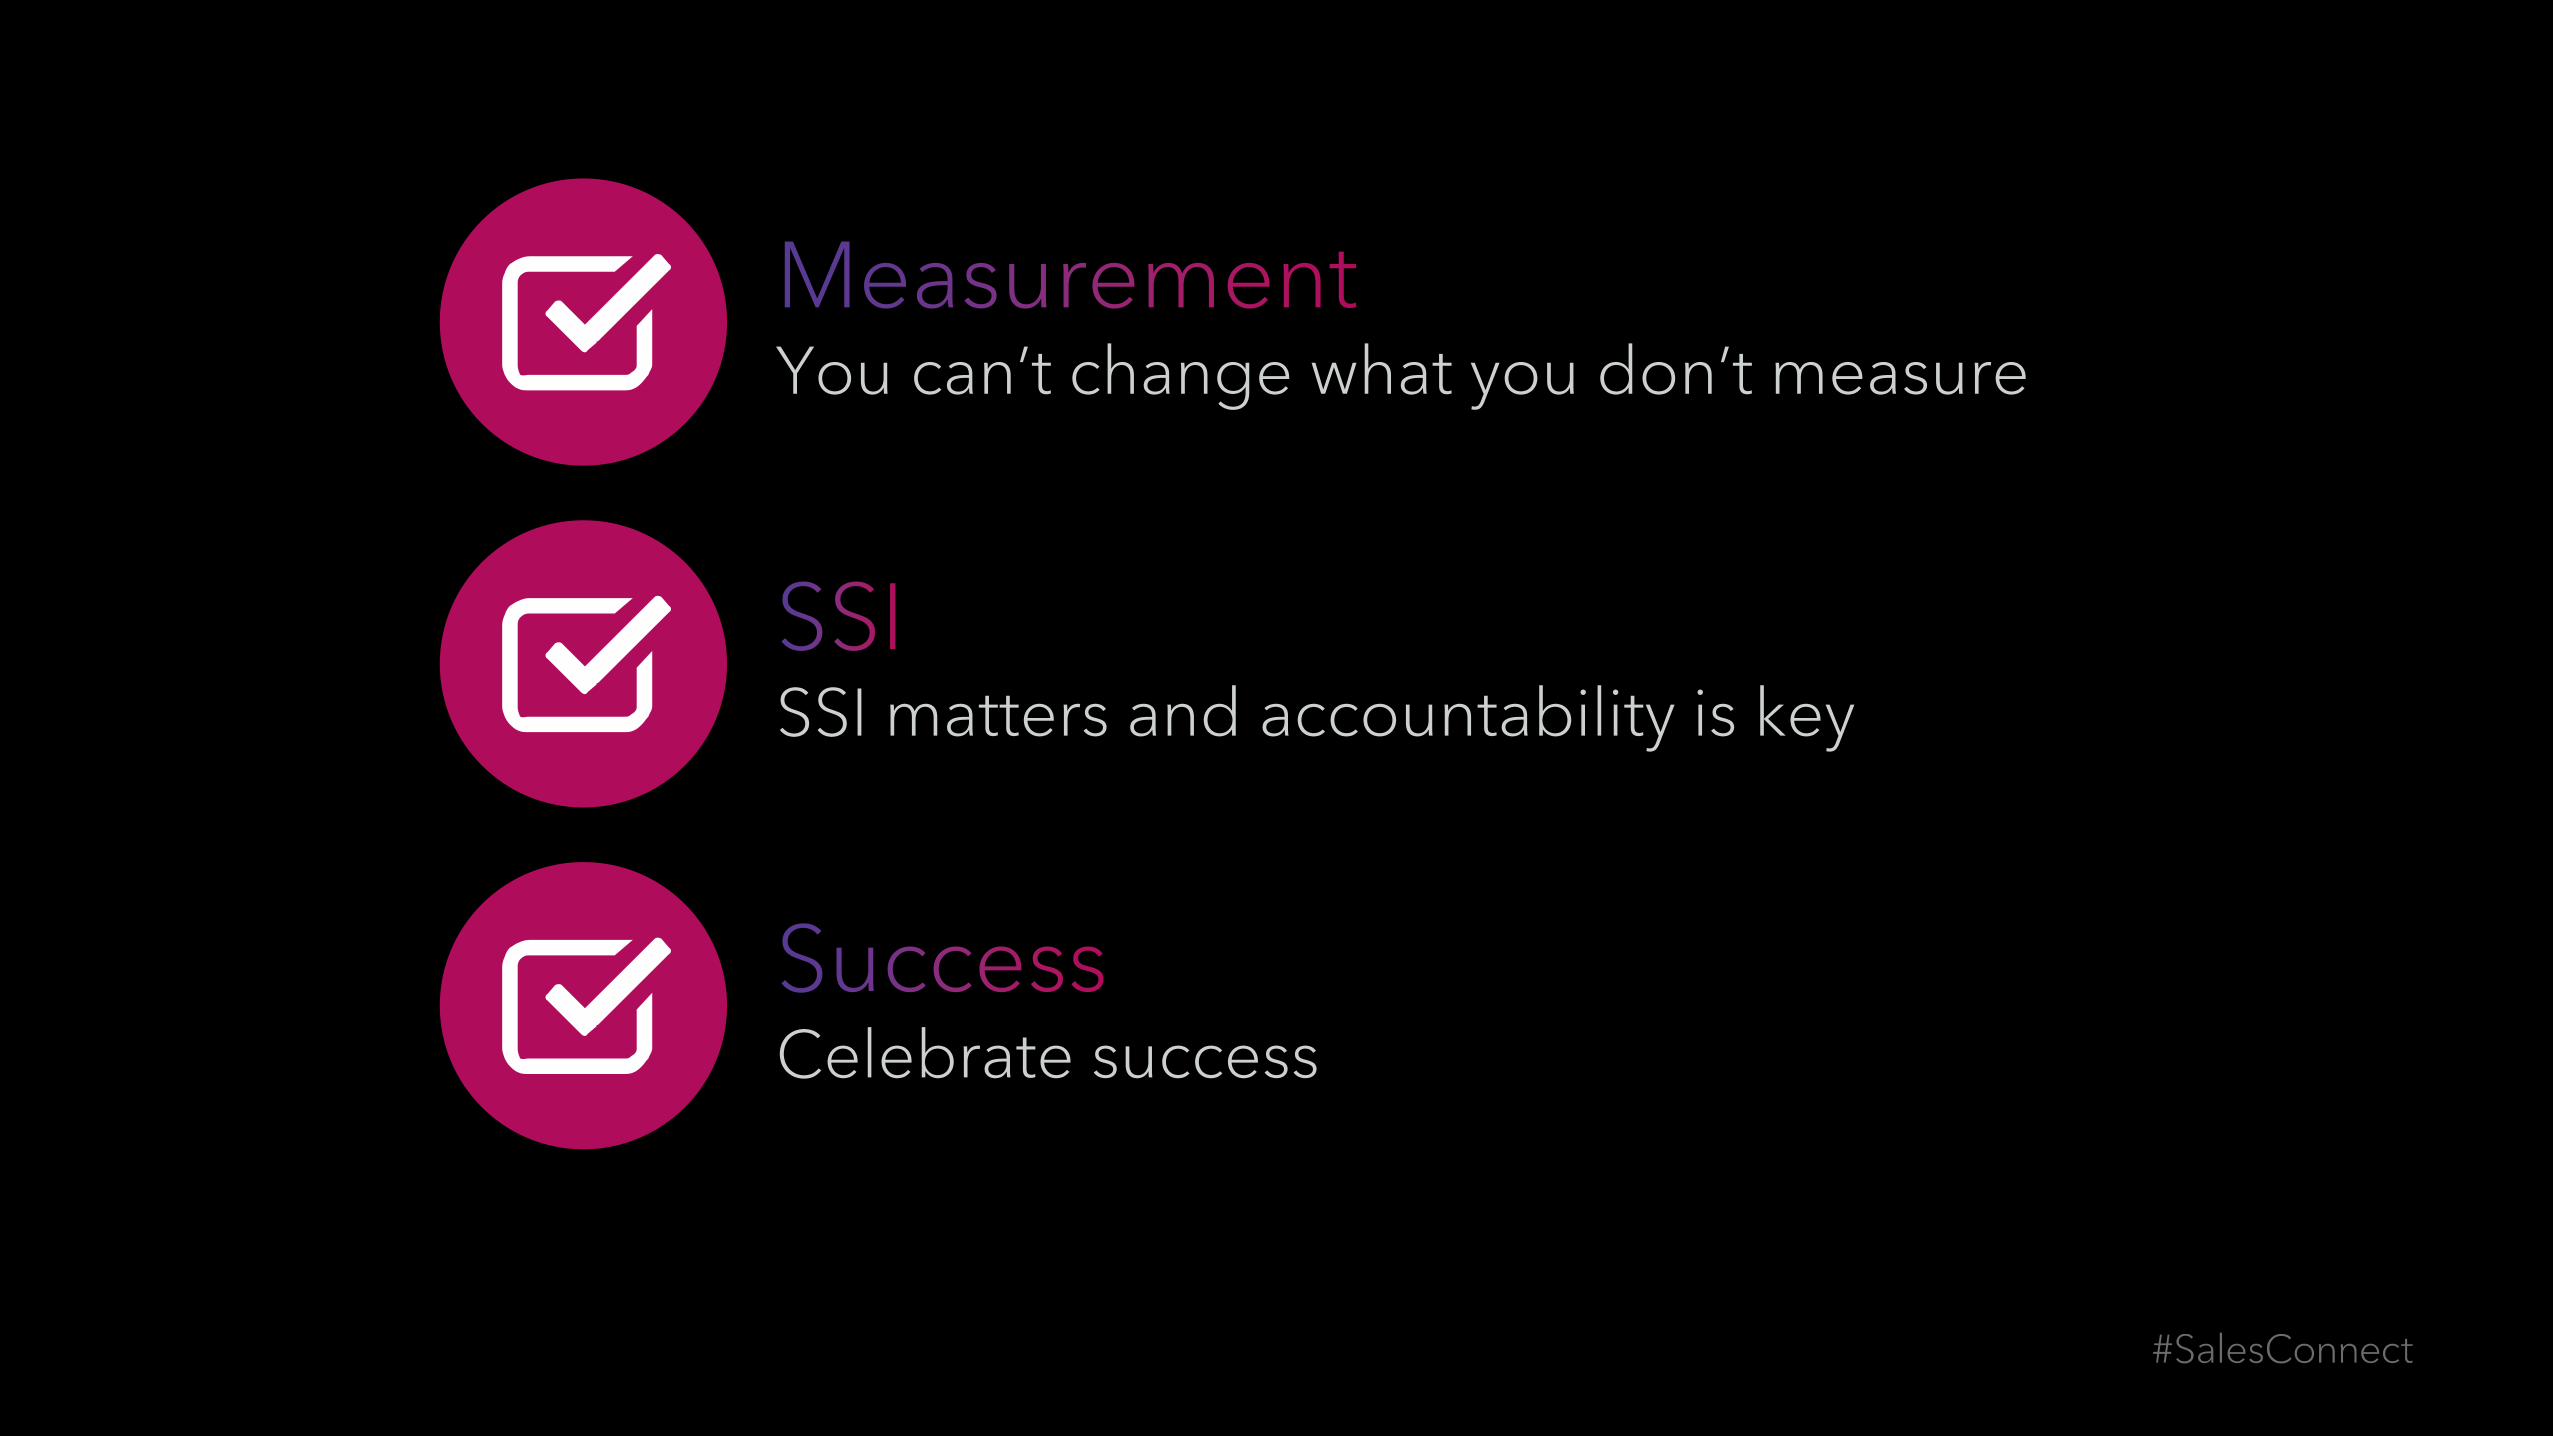
You can’t change what you don’t measure
SSI matters and accountability is key
Celebrate success
©2015 LinkedIn Corporation. All Rights Reserved.
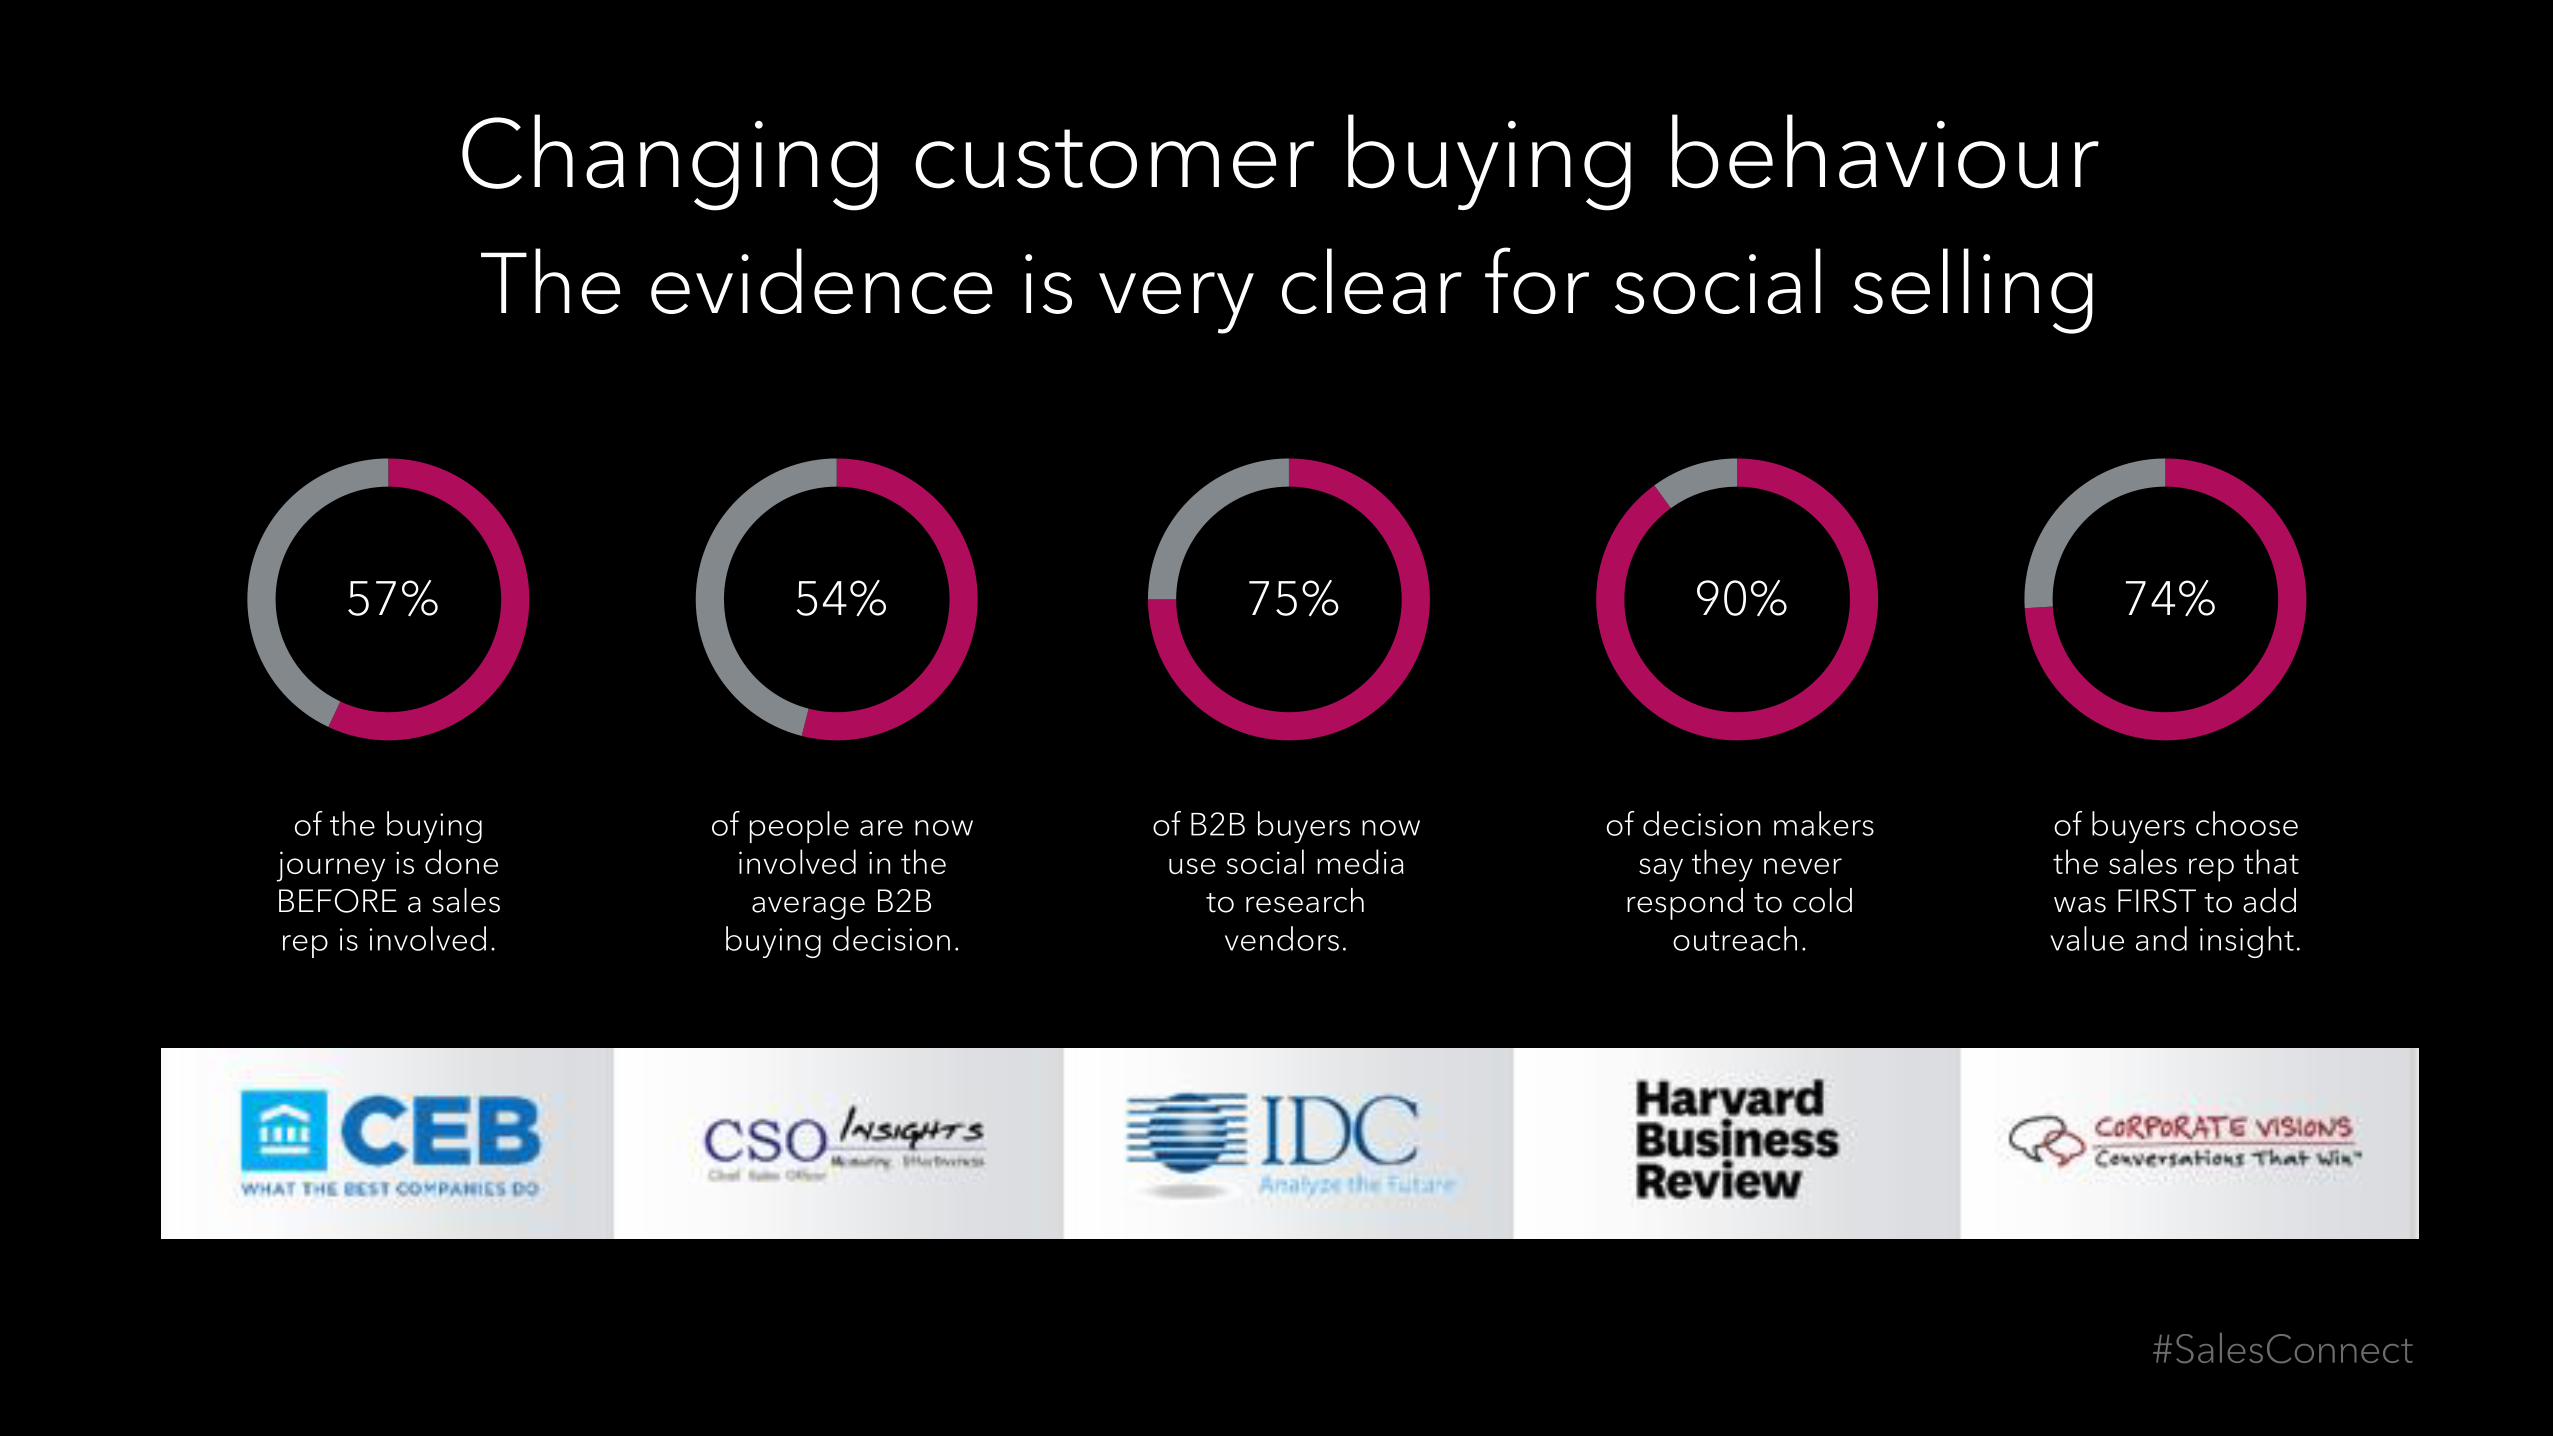
The evidence is very clear for social selling
Changing customer buying behaviour
57%
of the buying journey is done BEFORE a sales rep is involved.
54%
of people are now involved in the average B2B
buying decision.
75%
of B2B buyers now use social media
to research vendors.
90%
of decision makers say they never
respond to cold outreach.
74%
of buyers choose the sales rep that was FIRST to add value and insight.
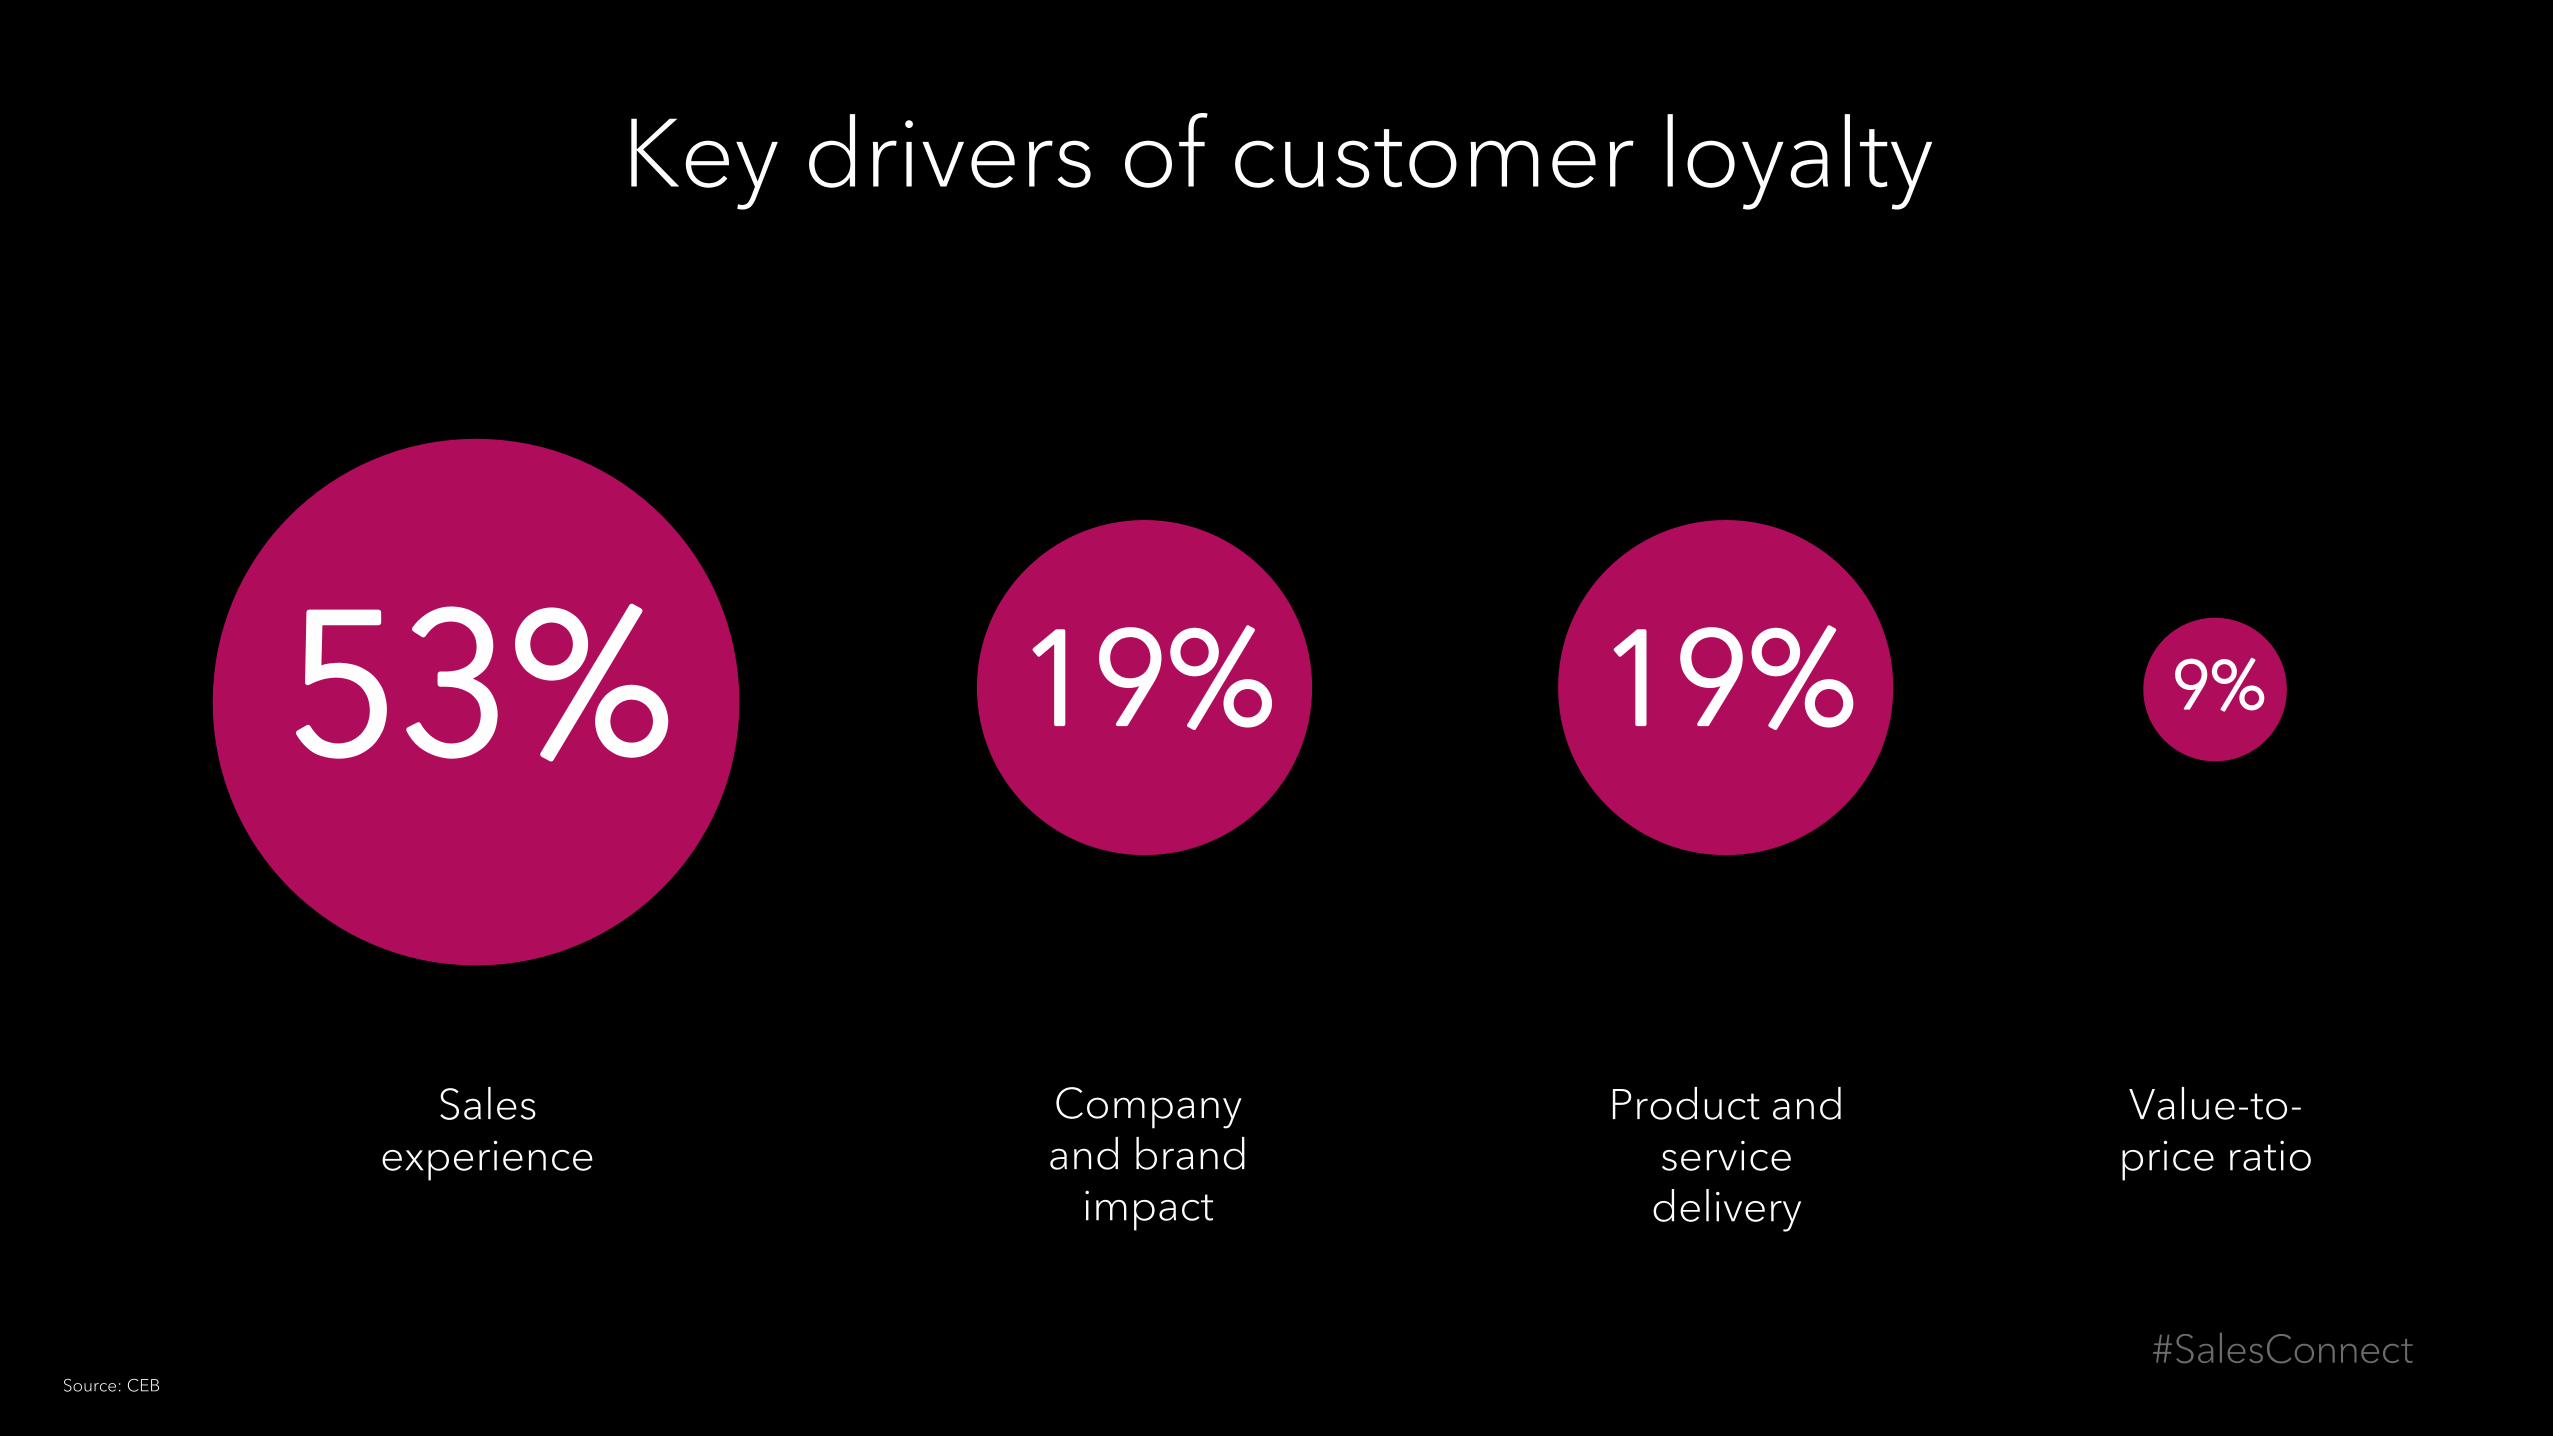
Key drivers of customer loyalty
Source: CEB
53% 19% 9% 19%
Sales experience
Company and brand
impact
Product and service delivery
Value-to-price ratio
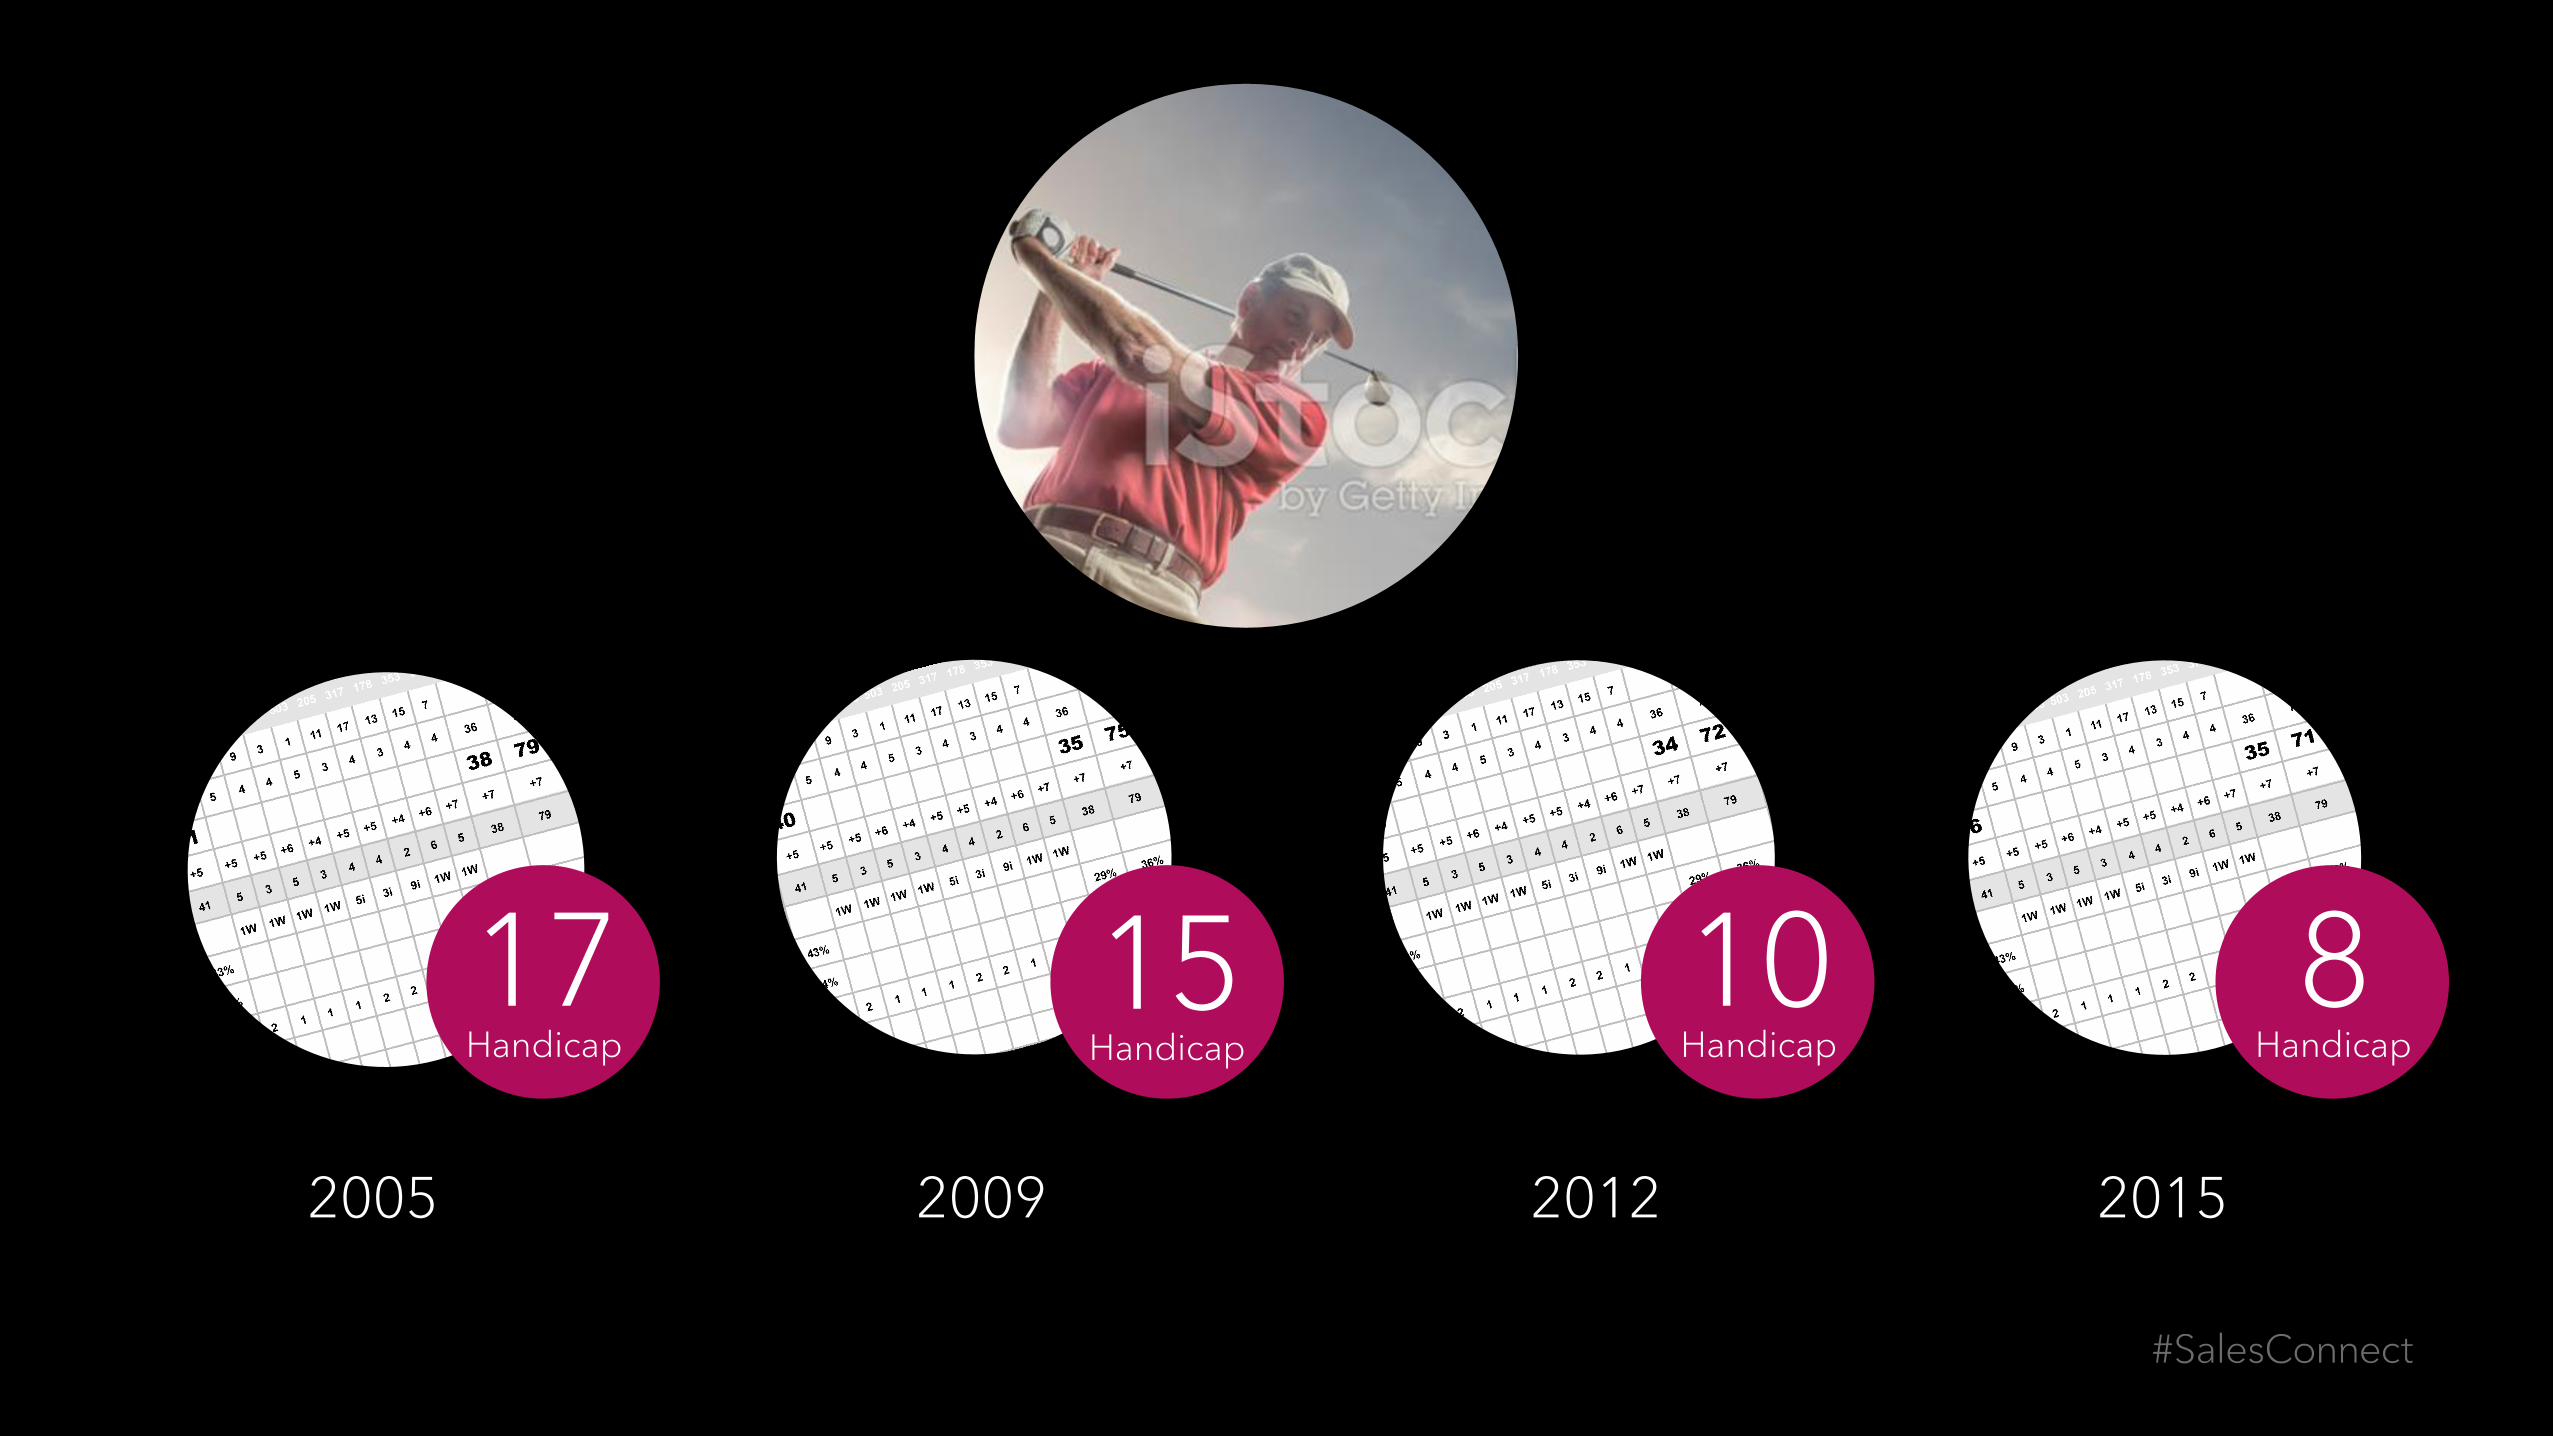
2005 2009 2012 2015
15 Handicap
10 Handicap
8 Handicap
17 Handicap

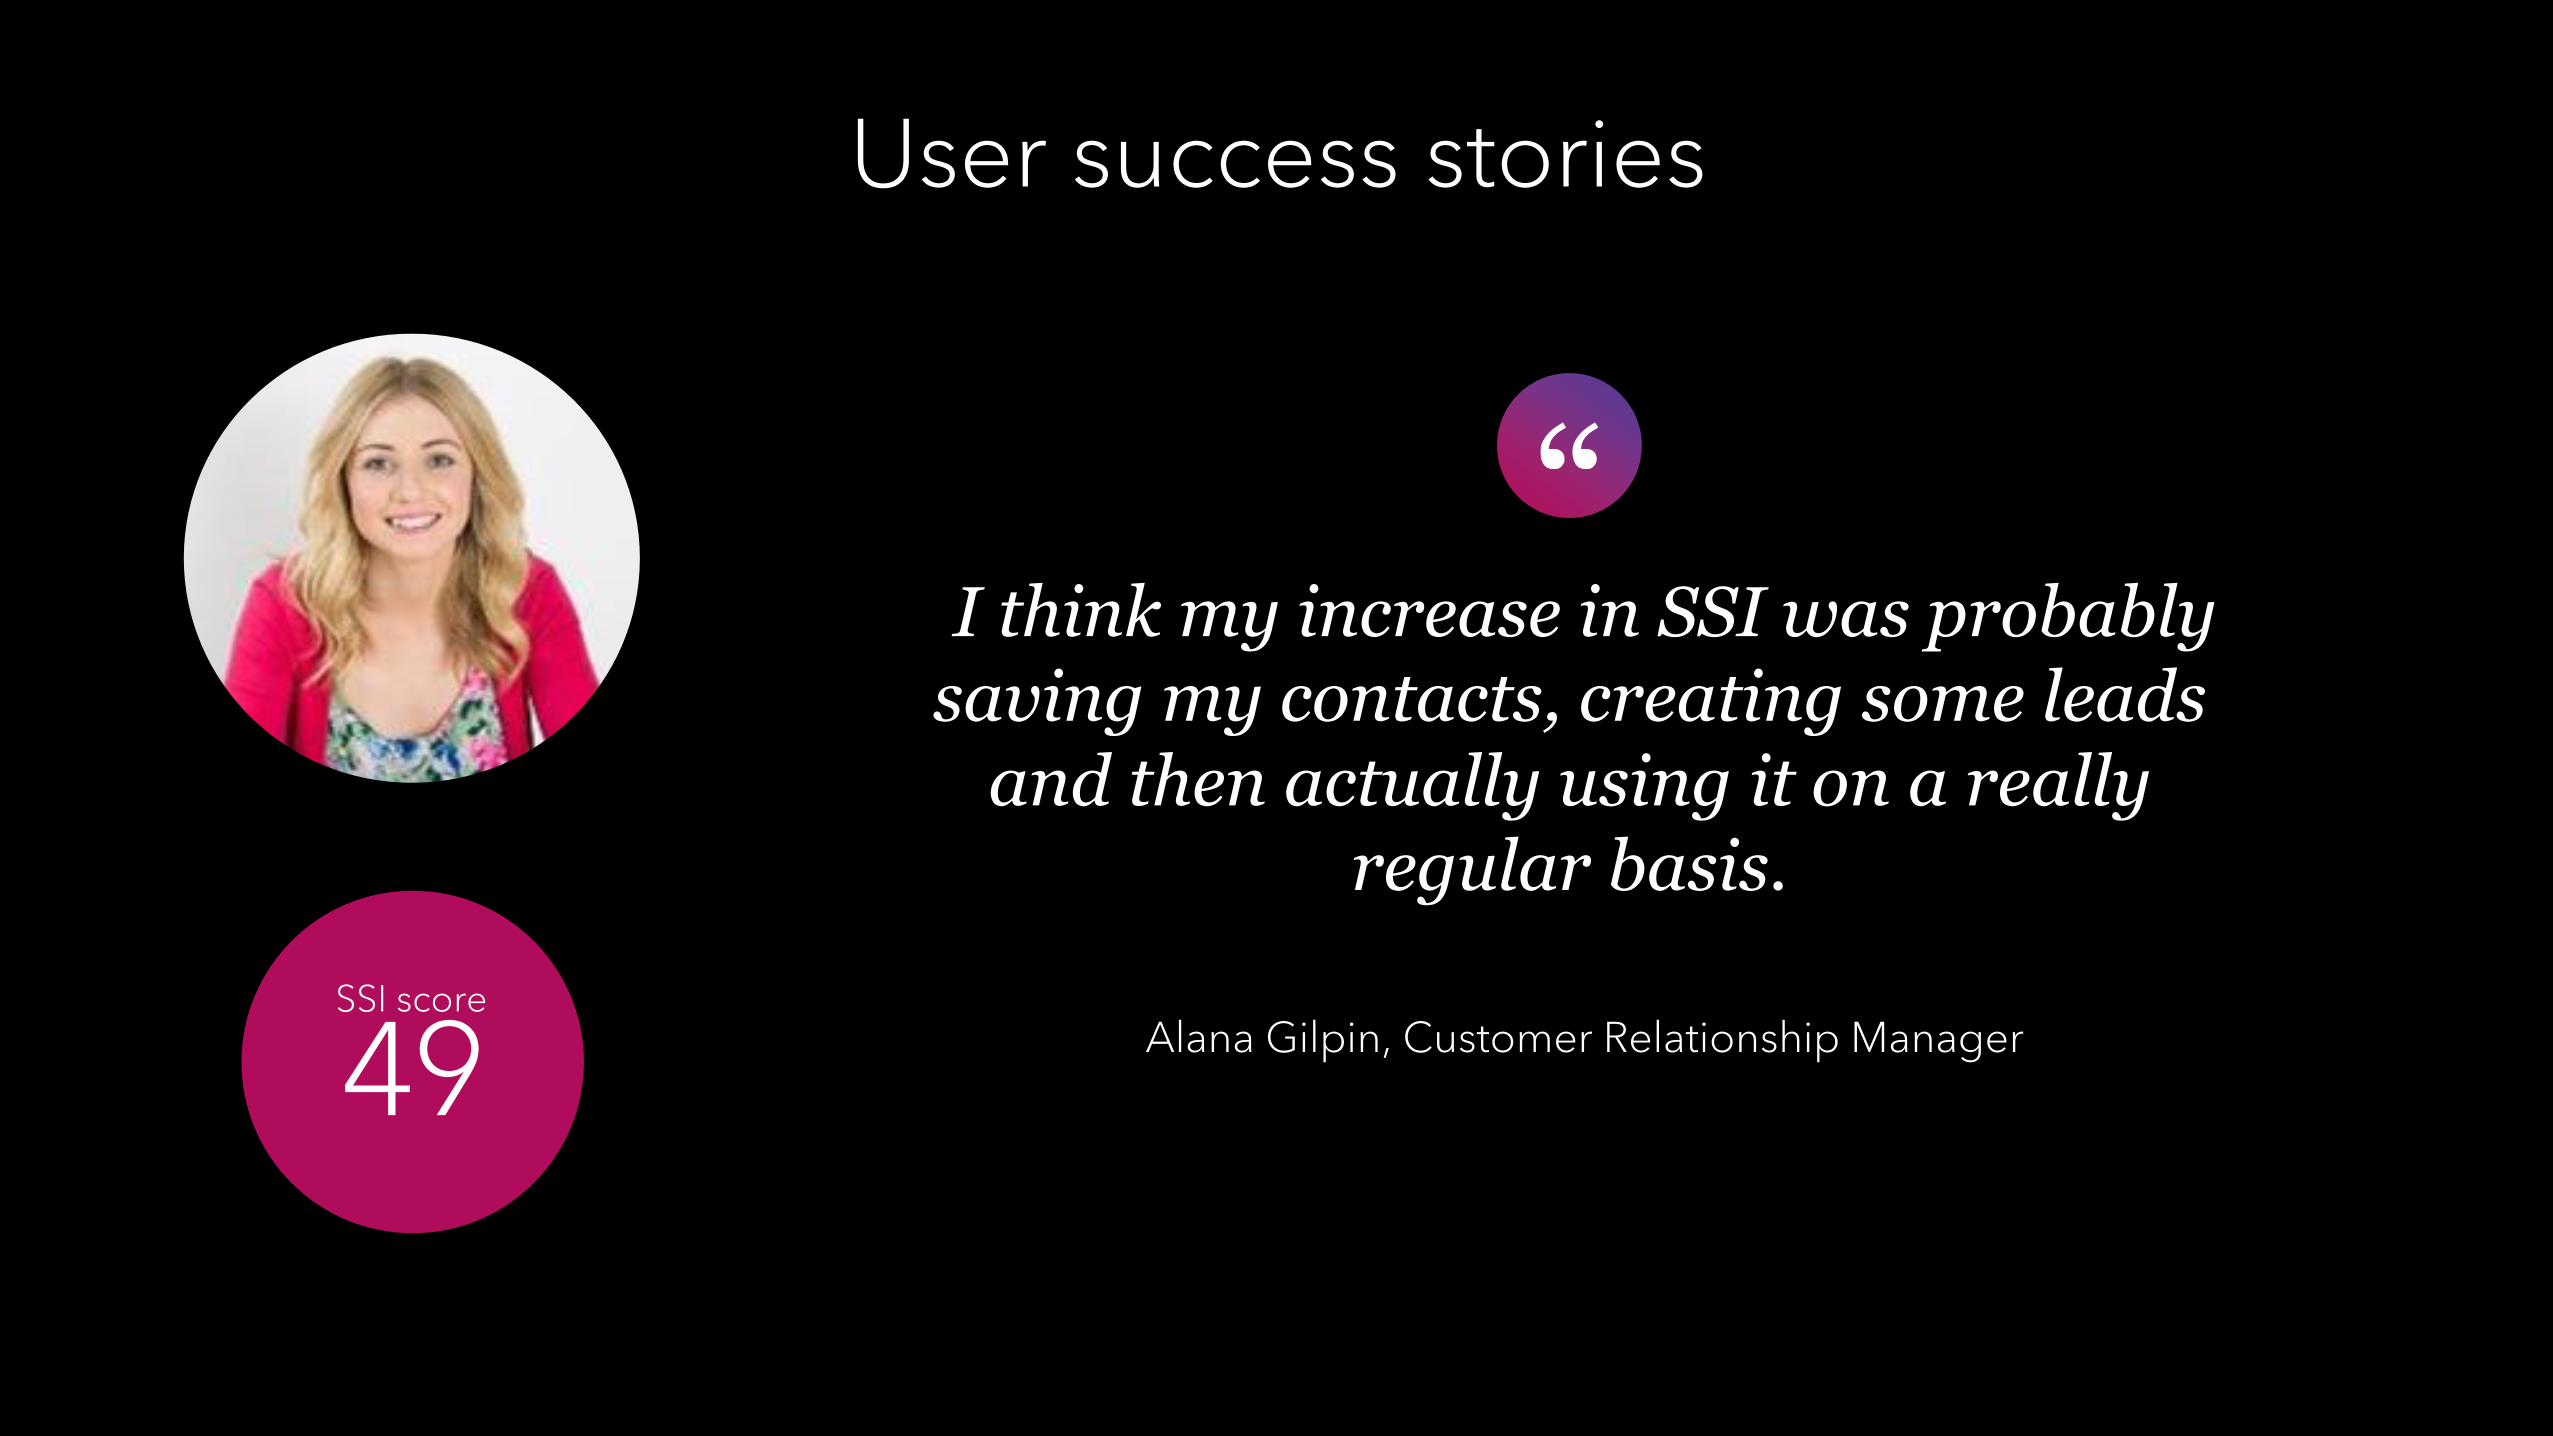
User success stories
I think my increase in SSI was probably saving my contacts, creating some leads
and then actually using it on a really regular basis.
Alana Gilpin, Customer Relationship Manager
SSI score
49
Related Documents