A report by WorldatWork October 2010 Sales Compensation Programs and Practices research

Welcome message from author
This document is posted to help you gain knowledge. Please leave a comment to let me know what you think about it! Share it to your friends and learn new things together.
Transcript
A report by WorldatWork
October 2010
Sales Compensation Programs and Practicesre
sear
ch
Contact:
WorldatWork Customer Relations
14040 N. Northsight Blvd.
Scottsdale, Arizona USA
85260-3601
Toll free: 877-951-9191
Fax: 480-483-8352
WorldatWorkSales Compensation Programs and Practices Survey 2010
1
Introduction & Methodology
This report summarizes the results of a July 2010 survey of WorldatWork members to gather information about current trends in sales compensation programs and practices. This survey focuses on the prevalence of base and variable pay programs as well as common practices used to administer and communicate these programs in today’s workplace. A similar sales compensation survey was conducted by WorldatWork in 2009. Where possible, historical comparisons from data gathered in previous WorldatWork Sales Compensation Practices surveys are shown.
On July 12, 2010, the sales compensation programs and practices survey opened through an announcement in the WorldatWork Sales Compensation Focus newsletter. Text in the newsletter provided a brief overview of the survey and a link to the survey was also included. A follow-up reminder was e-mailed on July 21 and 28, 2010, to all participants from the 2010-2011 WorldatWork Salary Budget Survey and randomly selected members who had designated compensation in their title. The survey closed on August 6, 2010, with 682 responses. The final dataset was cleaned, resulting in a final dataset of 516 responses.
In order to provide the most accurate data possible, data was cleaned and analyzed using statistical software. Any duplicate records were removed. Data comparisons with any relevant, statistically significant differences are noted within this report.
The demographics of the survey sample and the respondents are similar to the WorldatWork membership as a whole. The typical WorldatWork member works at the managerial level or higher in the headquarters of a large company in North America.
The frequencies or response distributions listed in the report show the number of times or percentage of times a value appears in a data set. Due to rounding, frequencies of data responses provided in this survey may not total exactly 100%.
WorldatWorkSales Compensation Programs and Practices Survey 2010
2
Table of Figures
Primary Sales Roles and Pay Mix Figure 1: Sales Roles ………………………………………………………………………………….. 5 Figure 2: Average Pay Mix …………………………………………………………………………… 5 Figure 3: Number of Performance Measures …………………………....………………………… 6 Figure 4: Performance Measures for Sales Roles…………….………..…………………………. 6 Figure 5: Number of Performance Measures by sales role type……………………………….. 7 Figure 6: Performance Measures, individual, team and both…………………..…….………… 7 2010 and 2011 Plan Figure 7: Meaningful Changes to Sales Compensation Plans in 2010……...………………… 8 Figure 8: Changes to the Sales Compensation Plans a 5-year overview…………………….. 8 Figure 9: Reason for the Change (2010)…………………………………………..……………….. 9 Figure 10: Reasons for the change (current plan), a 3-year review………………………...…. 10 Figure 11: Meaningful Changes to Sales Compensation Plans in 2011…………………...….. 10 Figure 12: Reason for the Change (2011)……………………………………….………………….. 11 Figure 13: Select reasons for a change (upcoming plan), a 3-year overview………….…….. 11 Sales Compensation Policy and Practice Figure 14: Plan philosophy and documentation ……………………………………………….…. 12 Figure 15: Environmental Affect on the Sales Compensation Plan……..…………………….. 12 Figure 16: Board of Director’s involvement in the Sales Compensation Plan……..……….. 13 Figure 17: Board of Director’s Change in the Sales Compensation Plan……..……………… 13 Figure 18: Stakeholders with Ultimate Approval to Change the Sales Compensation Plan. 14 Figure 19: Factors Contributing to the Success/Failure of the Recent Sales Plan Launch. 14 Select Comparisons Figure 20: Participants with a documented sales philosophy and plan changes……...…… 15 Figure 21: Number of performance measures in a sales plan and sales philosophy ….….. 16 Figure 22: Revisions to the current sales compensation plan by leading industries……… 16 Figure 23: Revisions to the 2011 sales compensation plan by leading industries…………. 17 Figure 24: Number of performance measures by organization size……………………….….. 17 Figure 24: Documented sales compensation philosophy by organizations size ………….. 18 Figure 25: Changes to the sales compensation plan by organization size…………..………. 18 Demographics Figure 26: Organization status……………………………………….………………………………. 19 Figure 27: Participants Role or Level …………………………….………………………………… 19 Figure 28: Supervisor’s Role or Level………………………………………………………………. 20 Figure 29: Number of Employees Worldwide ..…………………………………………………… 20 Figure 30: Industry……………………………………………………………...………………………. 21 Figure 31: Sales Size……………………………………………………...……………………………. 22 Figure 32: Sales Revenue and Target Revenue for the Most Recent Fiscal Year…………… 22
WorldatWorkSales Compensation Programs and Practices Survey 2010
3
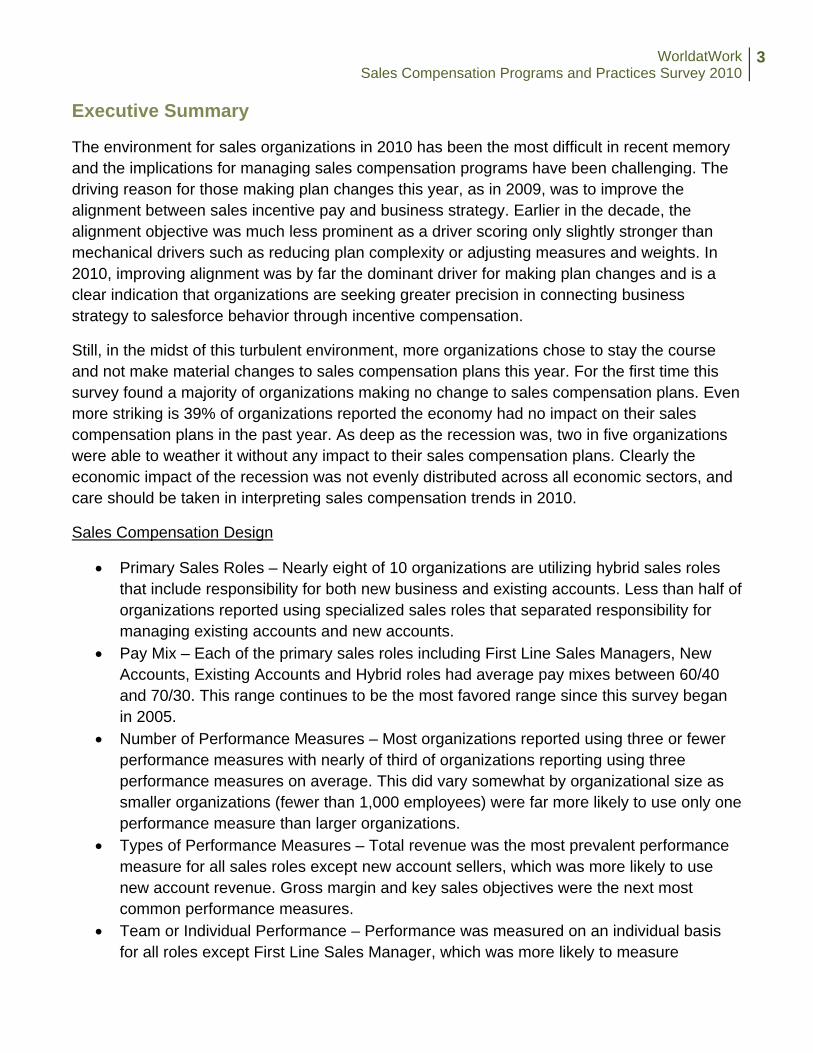
Executive Summary
The environment for sales organizations in 2010 has been the most difficult in recent memory and the implications for managing sales compensation programs have been challenging. The driving reason for those making plan changes this year, as in 2009, was to improve the alignment between sales incentive pay and business strategy. Earlier in the decade, the alignment objective was much less prominent as a driver scoring only slightly stronger than mechanical drivers such as reducing plan complexity or adjusting measures and weights. In 2010, improving alignment was by far the dominant driver for making plan changes and is a clear indication that organizations are seeking greater precision in connecting business strategy to salesforce behavior through incentive compensation.
Still, in the midst of this turbulent environment, more organizations chose to stay the course and not make material changes to sales compensation plans this year. For the first time this survey found a majority of organizations making no change to sales compensation plans. Even more striking is 39% of organizations reported the economy had no impact on their sales compensation plans in the past year. As deep as the recession was, two in five organizations were able to weather it without any impact to their sales compensation plans. Clearly the economic impact of the recession was not evenly distributed across all economic sectors, and care should be taken in interpreting sales compensation trends in 2010.
Sales Compensation Design
• Primary Sales Roles – Nearly eight of 10 organizations are utilizing hybrid sales roles that include responsibility for both new business and existing accounts. Less than half of organizations reported using specialized sales roles that separated responsibility for managing existing accounts and new accounts.
• Pay Mix – Each of the primary sales roles including First Line Sales Managers, New Accounts, Existing Accounts and Hybrid roles had average pay mixes between 60/40 and 70/30. This range continues to be the most favored range since this survey began in 2005.
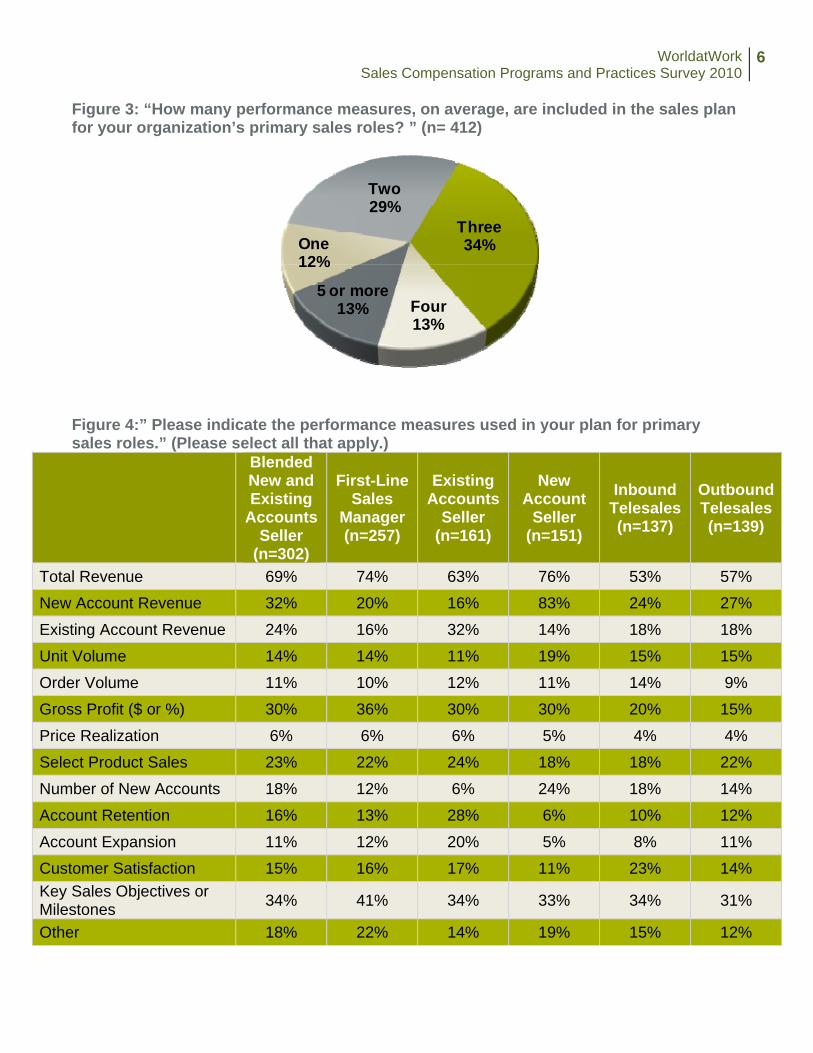
• Number of Performance Measures – Most organizations reported using three or fewer performance measures with nearly of third of organizations reporting using three performance measures on average. This did vary somewhat by organizational size as smaller organizations (fewer than 1,000 employees) were far more likely to use only one performance measure than larger organizations.
• Types of Performance Measures – Total revenue was the most prevalent performance measure for all sales roles except new account sellers, which was more likely to use new account revenue. Gross margin and key sales objectives were the next most common performance measures.
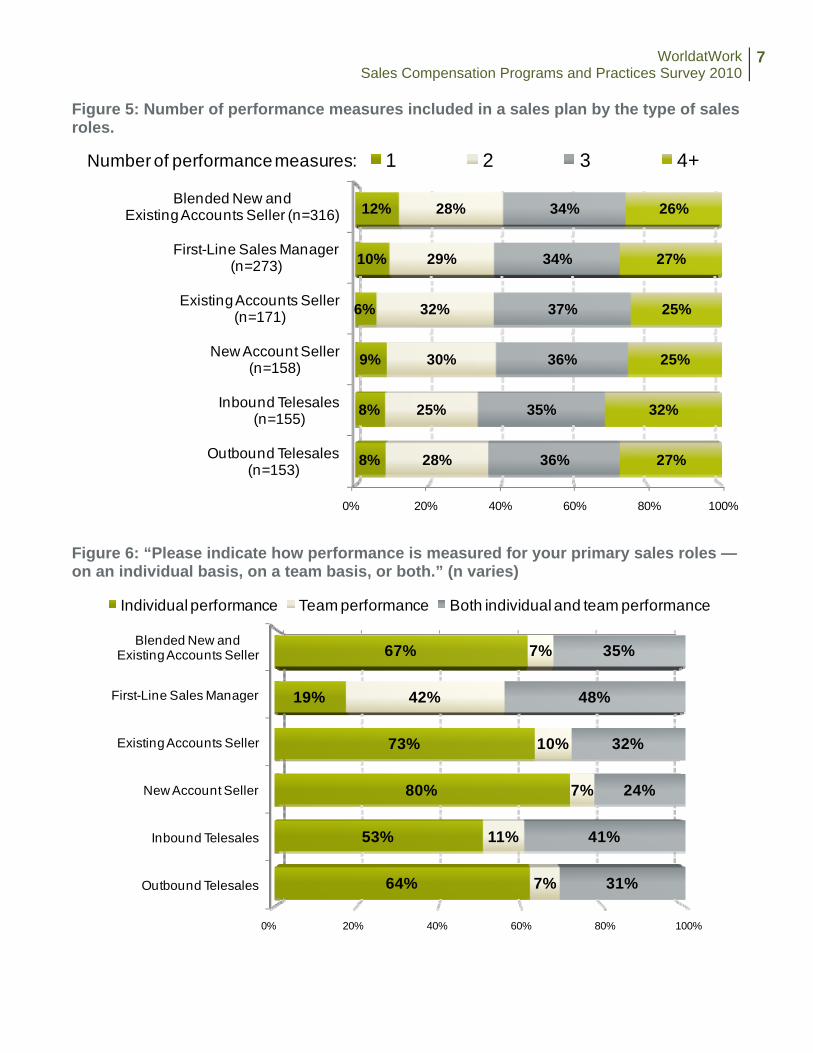
• Team or Individual Performance – Performance was measured on an individual basis for all roles except First Line Sales Manager, which was more likely to measure
WorldatWorkSales Compensation Programs and Practices Survey 2010
4
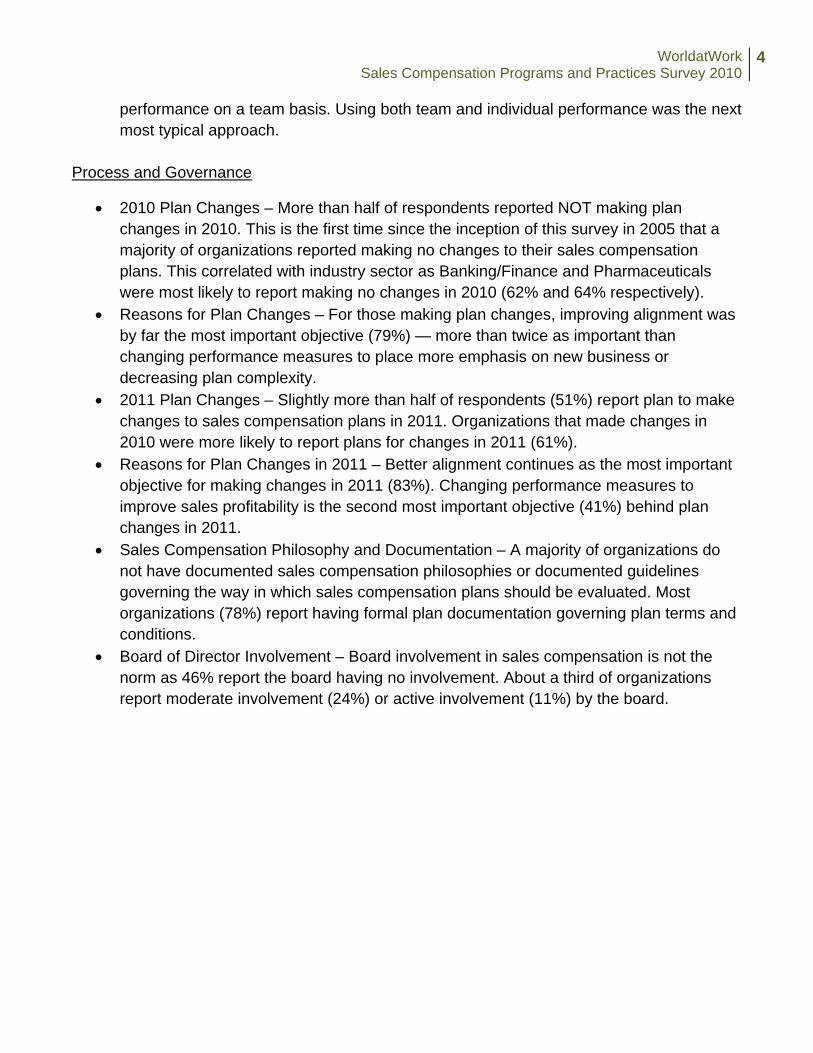
performance on a team basis. Using both team and individual performance was the next most typical approach.
Process and Governance
• 2010 Plan Changes – More than half of respondents reported NOT making plan changes in 2010. This is the first time since the inception of this survey in 2005 that a majority of organizations reported making no changes to their sales compensation plans. This correlated with industry sector as Banking/Finance and Pharmaceuticals were most likely to report making no changes in 2010 (62% and 64% respectively).
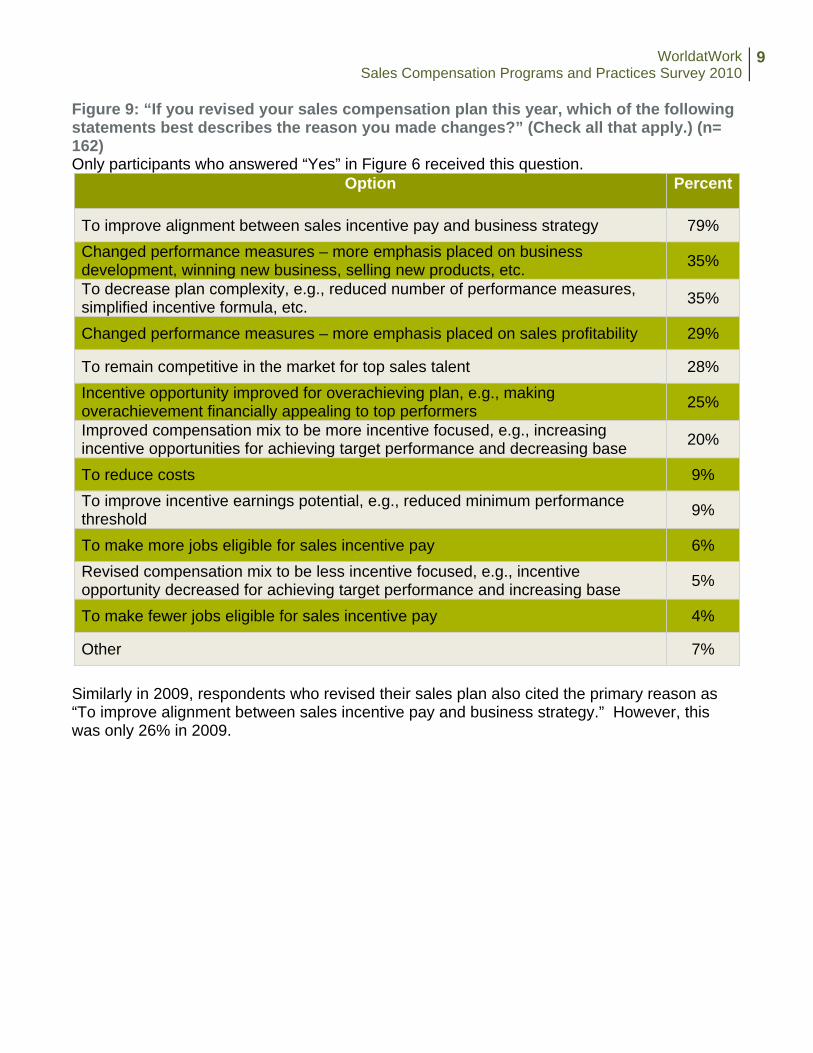
• Reasons for Plan Changes – For those making plan changes, improving alignment was by far the most important objective (79%) — more than twice as important than changing performance measures to place more emphasis on new business or decreasing plan complexity.
• 2011 Plan Changes – Slightly more than half of respondents (51%) report plan to make changes to sales compensation plans in 2011. Organizations that made changes in 2010 were more likely to report plans for changes in 2011 (61%).
• Reasons for Plan Changes in 2011 – Better alignment continues as the most important objective for making changes in 2011 (83%). Changing performance measures to improve sales profitability is the second most important objective (41%) behind plan changes in 2011.
• Sales Compensation Philosophy and Documentation – A majority of organizations do not have documented sales compensation philosophies or documented guidelines governing the way in which sales compensation plans should be evaluated. Most organizations (78%) report having formal plan documentation governing plan terms and conditions.
• Board of Director Involvement – Board involvement in sales compensation is not the norm as 46% report the board having no involvement. About a third of organizations report moderate involvement (24%) or active involvement (11%) by the board.
WorldatWorkSales Compensation Programs and Practices Survey 2010
5
Results and Analysis
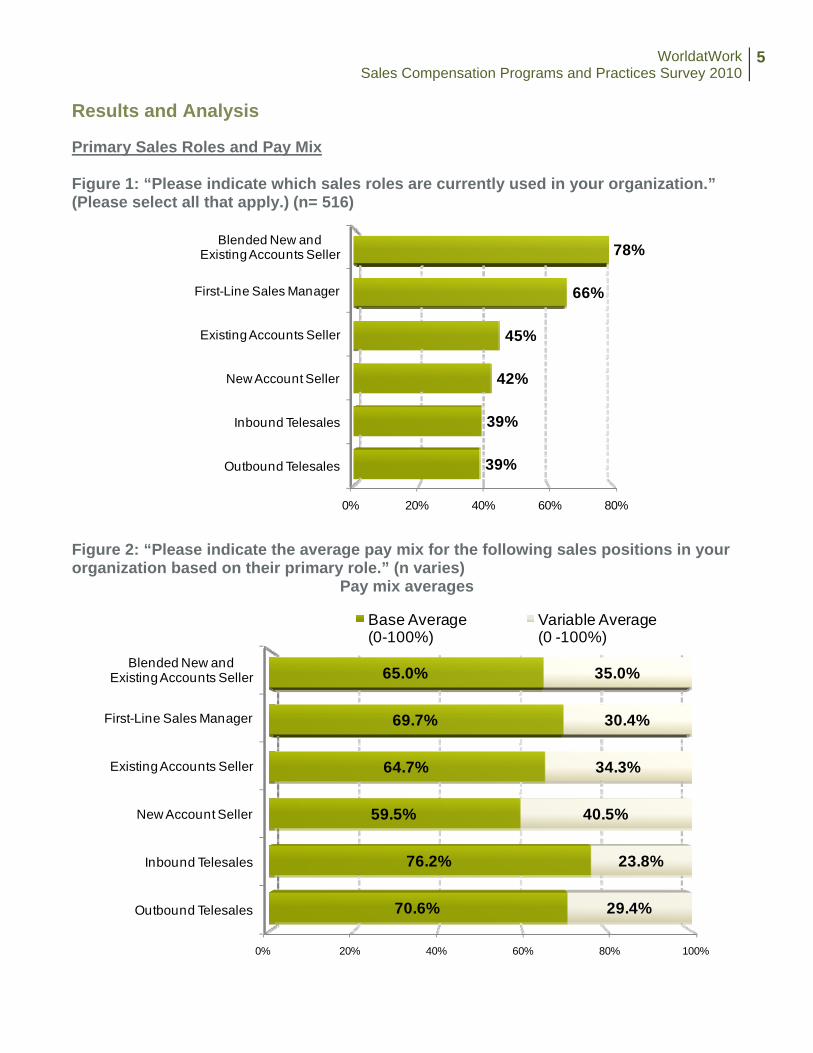
Primary Sales Roles and Pay Mix Figure 1: “Please indicate which sales roles are currently used in your organization.” (Please select all that apply.) (n= 516)
0% 20% 40% 60% 80%
Outbound Telesales
Inbound Telesales
New Account Seller
Existing Accounts Seller
First-Line Sales Manager
Blended New and Existing Accounts Seller
39%
39%
42%
45%
66%
78%
Figure 2: “Please indicate the average pay mix for the following sales positions in your organization based on their primary role.” (n varies)
Pay mix averages
0% 20% 40% 60% 80% 100%
Outbound Telesales
Inbound Telesales
New Account Seller
Existing Accounts Seller
First-Line Sales Manager
Blended New and Existing Accounts Seller
70.6%
76.2%
59.5%
64.7%
69.7%
65.0%
29.4%
23.8%
40.5%
34.3%
30.4%
35.0%
Base Average(0-100%)
Variable Average(0 -100%)
WorldatWorkSales Compensation Programs and Practices Survey 2010
6
Figure 3: “How many performance measures, on average, are included in the sales plan for your organization’s primary sales roles? ” (n= 412)
One12%
Two29%
Three34%
Four13%
5 or more 13%
Figure 4:” Please indicate the performance measures used in your plan for primary sales roles.” (Please select all that apply.)
Blended New and Existing
Accounts Seller
(n=302)
First-Line Sales
Manager (n=257)
Existing Accounts
Seller (n=161)
New Account
Seller (n=151)
Inbound Telesales (n=137)
Outbound Telesales (n=139)
Total Revenue 69% 74% 63% 76% 53% 57% New Account Revenue 32% 20% 16% 83% 24% 27%
Existing Account Revenue 24% 16% 32% 14% 18% 18% Unit Volume 14% 14% 11% 19% 15% 15%
Order Volume 11% 10% 12% 11% 14% 9% Gross Profit ($ or %) 30% 36% 30% 30% 20% 15%
Price Realization 6% 6% 6% 5% 4% 4% Select Product Sales 23% 22% 24% 18% 18% 22%
Number of New Accounts 18% 12% 6% 24% 18% 14% Account Retention 16% 13% 28% 6% 10% 12%
Account Expansion 11% 12% 20% 5% 8% 11% Customer Satisfaction 15% 16% 17% 11% 23% 14% Key Sales Objectives or Milestones 34% 41% 34% 33% 34% 31%
Other 18% 22% 14% 19% 15% 12%
WorldatWorkSales Compensation Programs and Practices Survey 2010
7
Figure 5: Number of performance measures included in a sales plan by the type of sales roles.
0% 20% 40% 60% 80% 100%
Outbound Telesales (n=153)
Inbound Telesales(n=155)
New Account Seller(n=158)
Existing Accounts Seller(n=171)
First-Line Sales Manager(n=273)
Blended New and Existing Accounts Seller (n=316)
8%
8%
9%
6%
10%
12%
28%
25%
30%
32%
29%
28%
36%
35%
36%
37%
34%
34%
27%
32%
25%
25%
27%
26%
1 2 3 4+Number of performance measures:
Figure 6: “Please indicate how performance is measured for your primary sales roles — on an individual basis, on a team basis, or both.” (n varies)
0% 20% 40% 60% 80% 100%
Outbound Telesales
Inbound Telesales
New Account Seller
Existing Accounts Seller
First-Line Sales Manager
Blended New and Existing Accounts Seller
64%
53%
80%
73%
19%
67%
7%
11%
7%
10%
42%
7%
31%
41%
24%
32%
48%
35%
Individual performance Team performance Both individual and team performance
WorldatWorkSales Compensation Programs and Practices Survey 2010
8
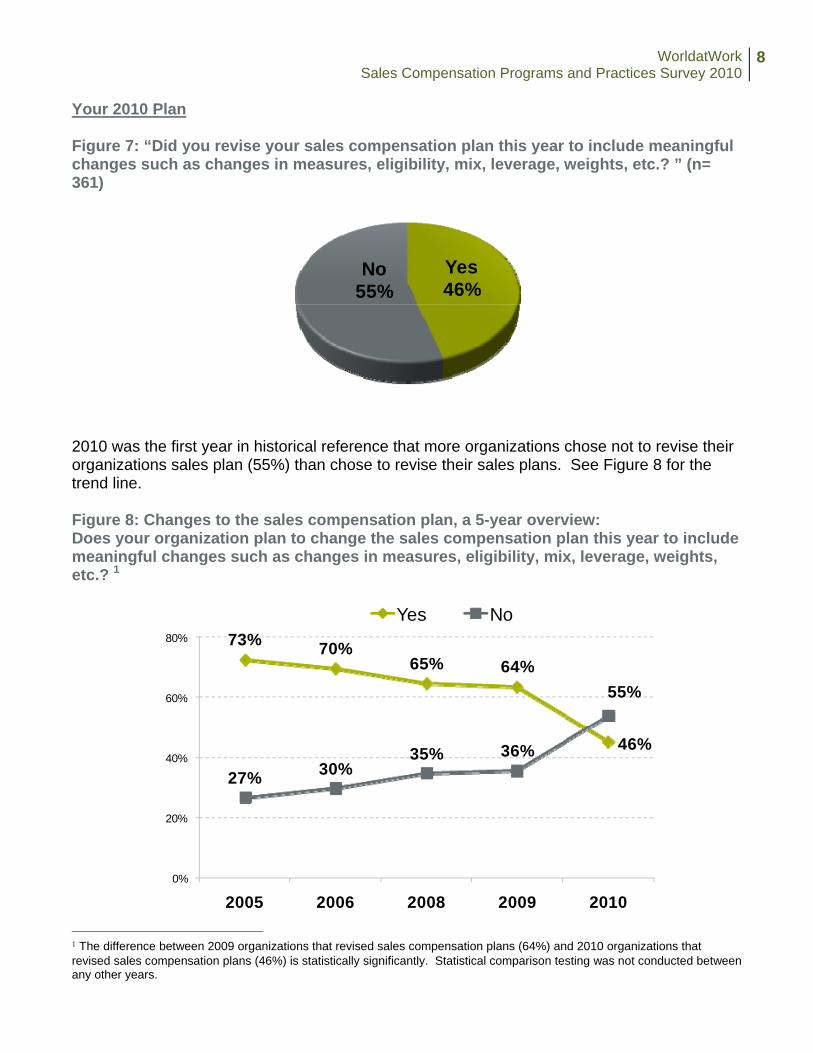
Your 2010 Plan Figure 7: “Did you revise your sales compensation plan this year to include meaningful changes such as changes in measures, eligibility, mix, leverage, weights, etc.? ” (n= 361)
Yes46%
No55%
2010 was the first year in historical reference that more organizations chose not to revise their organizations sales plan (55%) than chose to revise their sales plans. See Figure 8 for the trend line. Figure 8: Changes to the sales compensation plan, a 5-year overview: Does your organization plan to change the sales compensation plan this year to include meaningful changes such as changes in measures, eligibility, mix, leverage, weights, etc.? 1
1 The difference between 2009 organizations that revised sales compensation plans (64%) and 2010 organizations that revised sales compensation plans (46%) is statistically significantly. Statistical comparison testing was not conducted between any other years.
73% 70%65% 64%
46%
27% 30%35% 36%
55%
0%
20%
40%
60%
80%
2005 2006 2008 2009 2010
Yes No
WorldatWorkSales Compensation Programs and Practices Survey 2010
9
Figure 9: “If you revised your sales compensation plan this year, which of the following statements best describes the reason you made changes?” (Check all that apply.) (n= 162) Only participants who answered “Yes” in Figure 6 received this question.
Option Percent
To improve alignment between sales incentive pay and business strategy 79% Changed performance measures – more emphasis placed on business development, winning new business, selling new products, etc. 35%
To decrease plan complexity, e.g., reduced number of performance measures, simplified incentive formula, etc. 35%
Changed performance measures – more emphasis placed on sales profitability 29%
To remain competitive in the market for top sales talent 28% Incentive opportunity improved for overachieving plan, e.g., making overachievement financially appealing to top performers 25%
Improved compensation mix to be more incentive focused, e.g., increasing incentive opportunities for achieving target performance and decreasing base 20%
To reduce costs 9% To improve incentive earnings potential, e.g., reduced minimum performance threshold 9%
To make more jobs eligible for sales incentive pay 6% Revised compensation mix to be less incentive focused, e.g., incentive opportunity decreased for achieving target performance and increasing base 5%
To make fewer jobs eligible for sales incentive pay 4%
Other 7% Similarly in 2009, respondents who revised their sales plan also cited the primary reason as “To improve alignment between sales incentive pay and business strategy.” However, this was only 26% in 2009.
WorldatWorkSales Compensation Programs and Practices Survey 2010
10
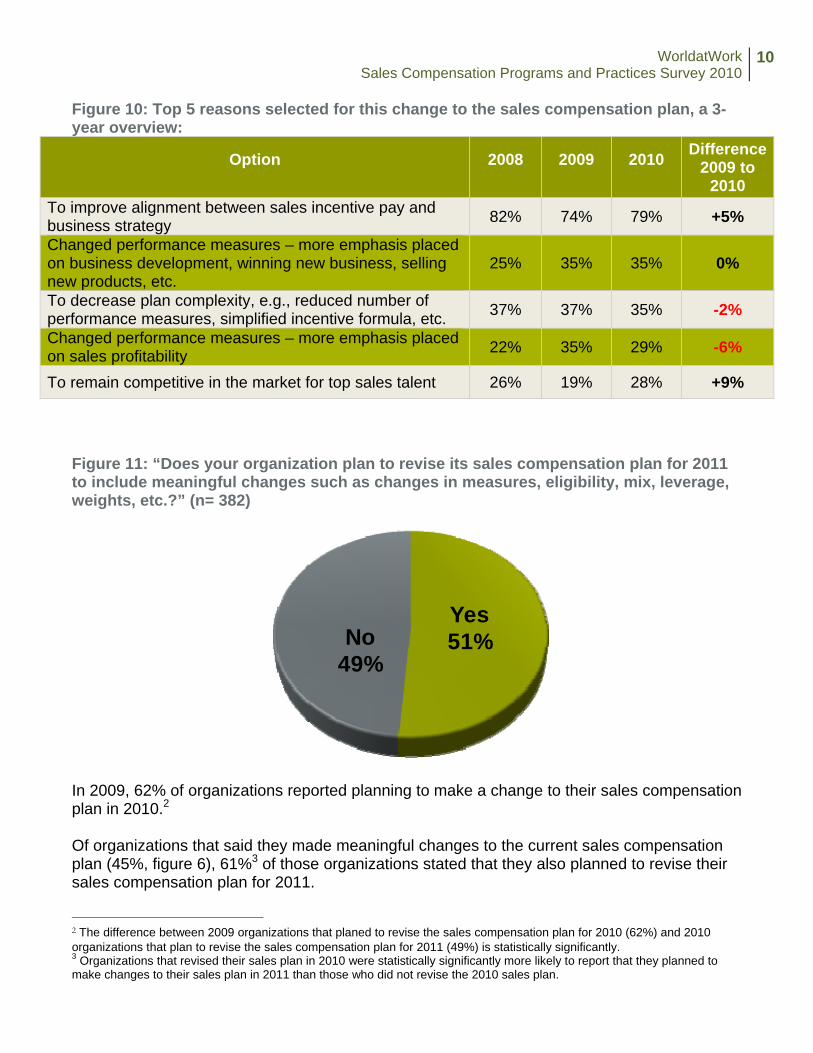
Figure 10: Top 5 reasons selected for this change to the sales compensation plan, a 3-year overview:
Option 2008 2009 2010 Difference 2009 to
2010 To improve alignment between sales incentive pay and business strategy 82% 74% 79% +5%
Changed performance measures – more emphasis placed on business development, winning new business, selling new products, etc.
25% 35% 35% 0%
To decrease plan complexity, e.g., reduced number of performance measures, simplified incentive formula, etc. 37% 37% 35% -2%
Changed performance measures – more emphasis placed on sales profitability 22% 35% 29% -6%
To remain competitive in the market for top sales talent 26% 19% 28% +9% Figure 11: “Does your organization plan to revise its sales compensation plan for 2011 to include meaningful changes such as changes in measures, eligibility, mix, leverage, weights, etc.?” (n= 382)
Yes51%No
49%
In 2009, 62% of organizations reported planning to make a change to their sales compensation plan in 2010.2 Of organizations that said they made meaningful changes to the current sales compensation plan (45%, figure 6), 61%3 of those organizations stated that they also planned to revise their sales compensation plan for 2011.
2 The difference between 2009 organizations that planed to revise the sales compensation plan for 2010 (62%) and 2010 organizations that plan to revise the sales compensation plan for 2011 (49%) is statistically significantly. 3 Organizations that revised their sales plan in 2010 were statistically significantly more likely to report that they planned to make changes to their sales plan in 2011 than those who did not revise the 2010 sales plan.
WorldatWorkSales Compensation Programs and Practices Survey 2010
11
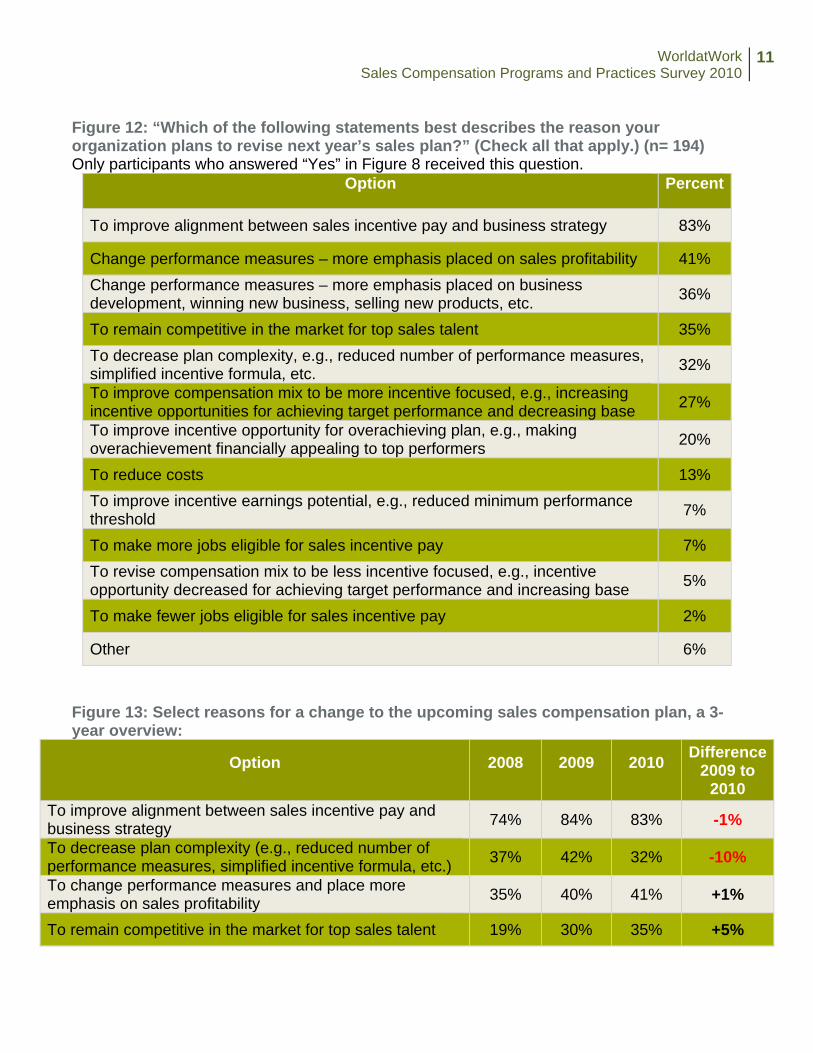
Figure 12: “Which of the following statements best describes the reason your organization plans to revise next year’s sales plan?” (Check all that apply.) (n= 194) Only participants who answered “Yes” in Figure 8 received this question.
Option Percent
To improve alignment between sales incentive pay and business strategy 83%
Change performance measures – more emphasis placed on sales profitability 41% Change performance measures – more emphasis placed on business development, winning new business, selling new products, etc. 36%
To remain competitive in the market for top sales talent 35% To decrease plan complexity, e.g., reduced number of performance measures, simplified incentive formula, etc. 32%
To improve compensation mix to be more incentive focused, e.g., increasing incentive opportunities for achieving target performance and decreasing base 27%
To improve incentive opportunity for overachieving plan, e.g., making overachievement financially appealing to top performers 20%
To reduce costs 13% To improve incentive earnings potential, e.g., reduced minimum performance threshold 7%
To make more jobs eligible for sales incentive pay 7% To revise compensation mix to be less incentive focused, e.g., incentive opportunity decreased for achieving target performance and increasing base 5%
To make fewer jobs eligible for sales incentive pay 2%
Other 6% Figure 13: Select reasons for a change to the upcoming sales compensation plan, a 3-year overview:
Option 2008 2009 2010 Difference 2009 to
2010 To improve alignment between sales incentive pay and business strategy 74% 84% 83% -1%
To decrease plan complexity (e.g., reduced number of performance measures, simplified incentive formula, etc.) 37% 42% 32% -10%
To change performance measures and place more emphasis on sales profitability 35% 40% 41% +1%
To remain competitive in the market for top sales talent 19% 30% 35% +5%
WorldatWorkSales Compensation Programs and Practices Survey 2010
12
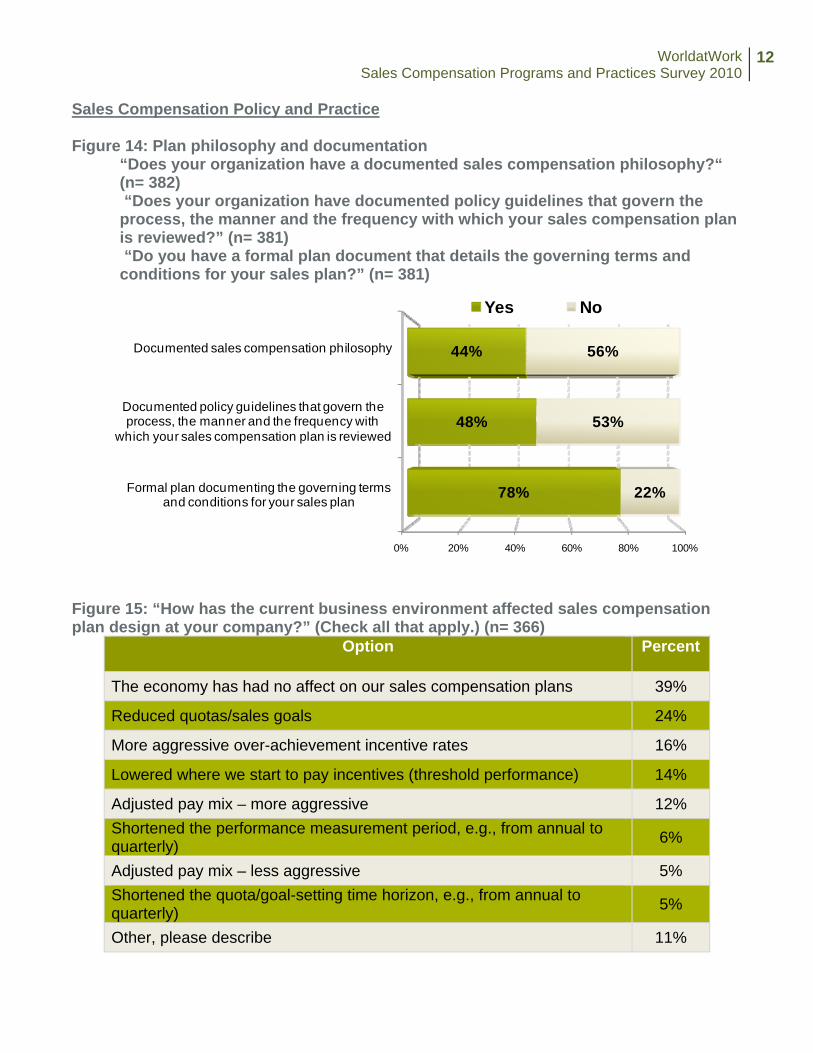
Sales Compensation Policy and Practice Figure 14: Plan philosophy and documentation
“Does your organization have a documented sales compensation philosophy?“ (n= 382) “Does your organization have documented policy guidelines that govern the process, the manner and the frequency with which your sales compensation plan is reviewed?” (n= 381) “Do you have a formal plan document that details the governing terms and conditions for your sales plan?” (n= 381)
0% 20% 40% 60% 80% 100%
Documented sales compensation philosophy
Documented policy guidelines that govern the process, the manner and the frequency with
which your sales compensation plan is reviewed
Formal plan documenting the governing terms and conditions for your sales plan
44%
48%
78%
56%
53%
22%
Yes No
Figure 15: “How has the current business environment affected sales compensation plan design at your company?” (Check all that apply.) (n= 366)
Option Percent
The economy has had no affect on our sales compensation plans 39%
Reduced quotas/sales goals 24%
More aggressive over-achievement incentive rates 16%
Lowered where we start to pay incentives (threshold performance) 14%
Adjusted pay mix – more aggressive 12% Shortened the performance measurement period, e.g., from annual to quarterly) 6%
Adjusted pay mix – less aggressive 5% Shortened the quota/goal-setting time horizon, e.g., from annual to quarterly) 5%
Other, please describe 11%
WorldatWorkSales Compensation Programs and Practices Survey 2010
13
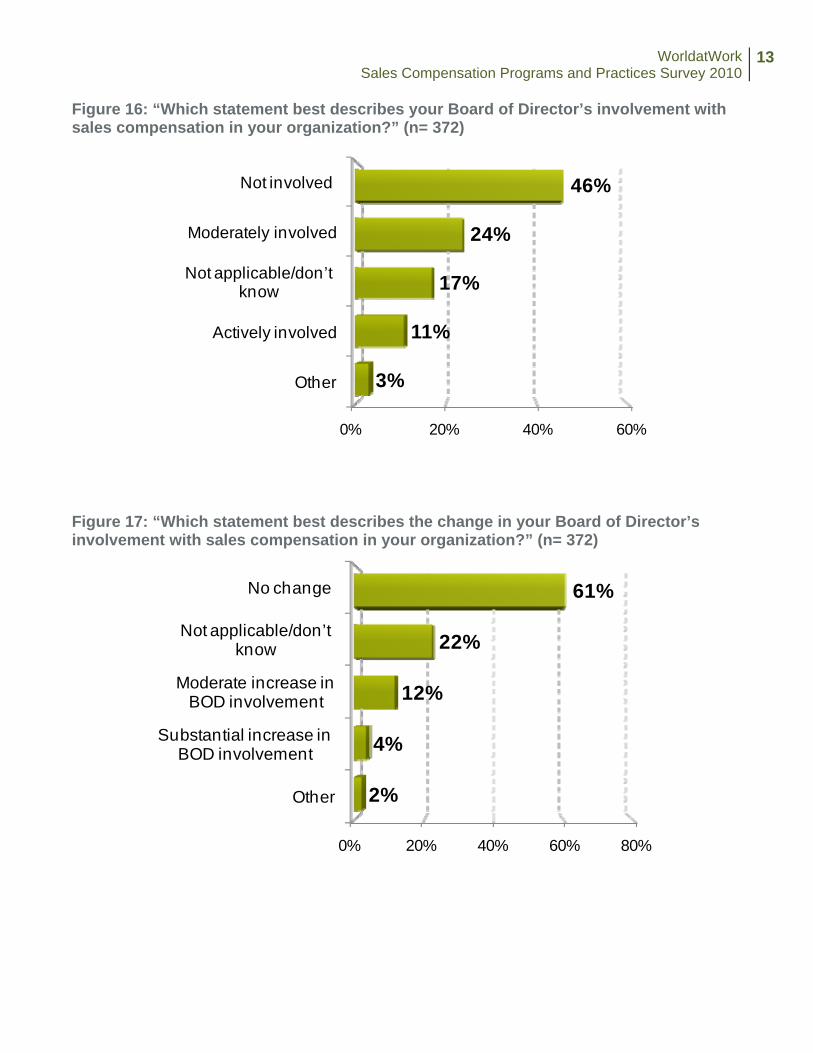
Figure 16: “Which statement best describes your Board of Director’s involvement with sales compensation in your organization?” (n= 372)
0% 20% 40% 60%
Other
Actively involved
Not applicable/don’t know
Moderately involved
Not involved
3%
11%
17%
24%
46%
Figure 17: “Which statement best describes the change in your Board of Director’s involvement with sales compensation in your organization?” (n= 372)
0% 20% 40% 60% 80%
Other
Substantial increase in BOD involvement
Moderate increase in BOD involvement
Not applicable/don’t know
No change
2%
4%
12%
22%
61%
WorldatWorkSales Compensation Programs and Practices Survey 2010
14
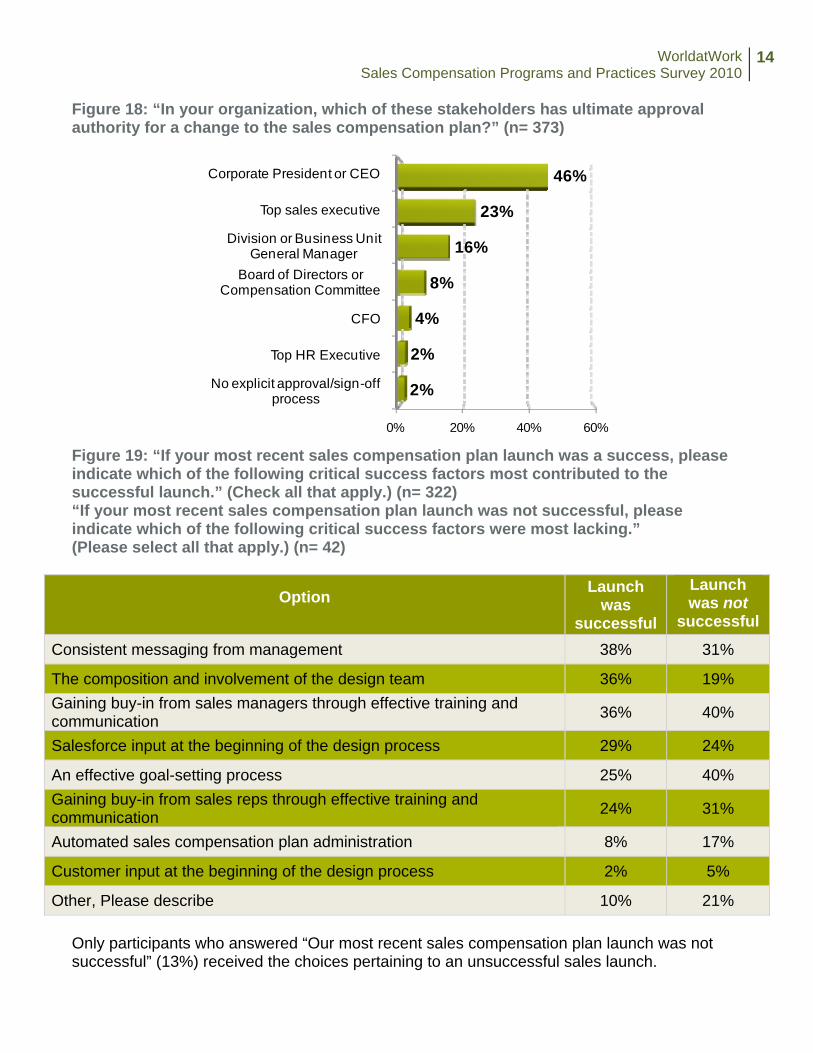
Figure 18: “In your organization, which of these stakeholders has ultimate approval authority for a change to the sales compensation plan?” (n= 373)
0% 20% 40% 60%
No explicit approval/sign-off process
Top HR Executive
CFO
Board of Directors or Compensation Committee
Division or Business Unit General Manager
Top sales executive
Corporate President or CEO
2%
2%
4%
8%
16%
23%
46%
Figure 19: “If your most recent sales compensation plan launch was a success, please indicate which of the following critical success factors most contributed to the successful launch.” (Check all that apply.) (n= 322) “If your most recent sales compensation plan launch was not successful, please indicate which of the following critical success factors were most lacking.” (Please select all that apply.) (n= 42)
Option Launch was
successful
Launch was not
successful
Consistent messaging from management 38% 31%
The composition and involvement of the design team 36% 19% Gaining buy-in from sales managers through effective training and communication 36% 40%
Salesforce input at the beginning of the design process 29% 24%
An effective goal-setting process 25% 40% Gaining buy-in from sales reps through effective training and communication 24% 31%
Automated sales compensation plan administration 8% 17%
Customer input at the beginning of the design process 2% 5%
Other, Please describe 10% 21% Only participants who answered “Our most recent sales compensation plan launch was not successful” (13%) received the choices pertaining to an unsuccessful sales launch.
WorldatWorkSales Compensation Programs and Practices Survey 2010
15
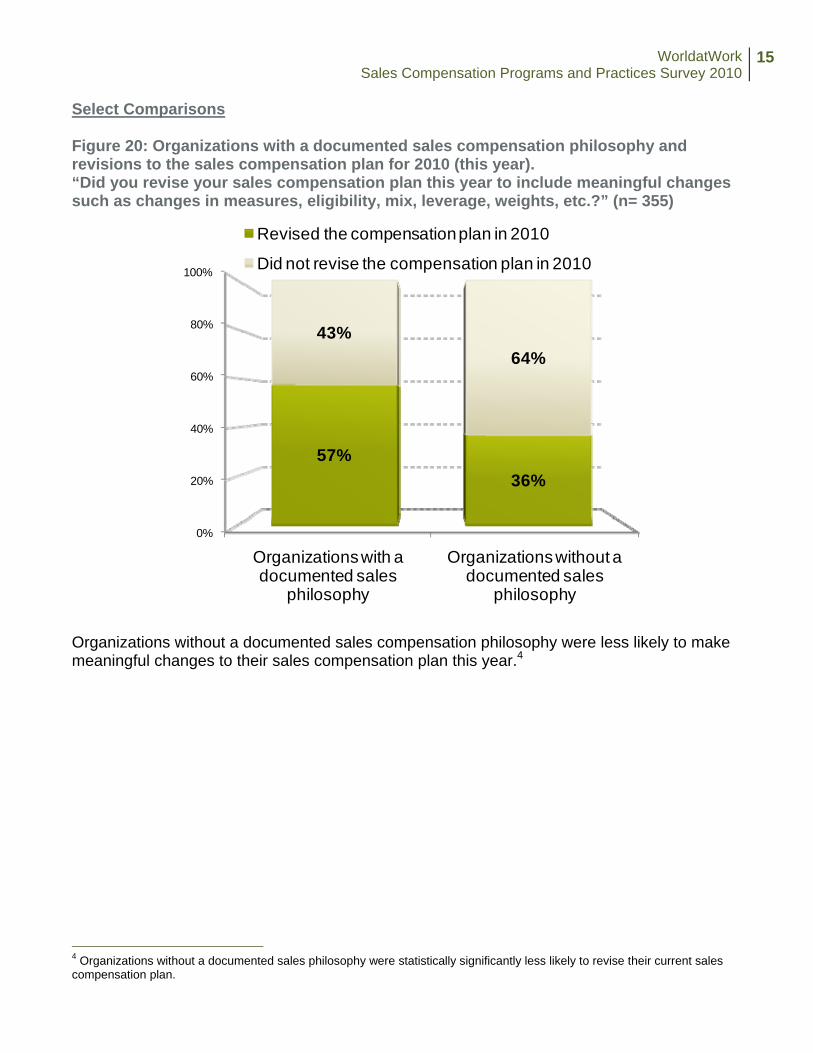
Select Comparisons Figure 20: Organizations with a documented sales compensation philosophy and revisions to the sales compensation plan for 2010 (this year). “Did you revise your sales compensation plan this year to include meaningful changes such as changes in measures, eligibility, mix, leverage, weights, etc.?” (n= 355)
0%
20%
40%
60%
80%
100%
Organizations without a documented sales
philosophy
Organizations with a documented sales
philosophy
36%57%
64%43%
Revised the compensation plan in 2010
Did not revise the compensation plan in 2010
Organizations without a documented sales compensation philosophy were less likely to make meaningful changes to their sales compensation plan this year.4 4 Organizations without a documented sales philosophy were statistically significantly less likely to revise their current sales compensation plan.
WorldatWorkSales Compensation Programs and Practices Survey 2010
16
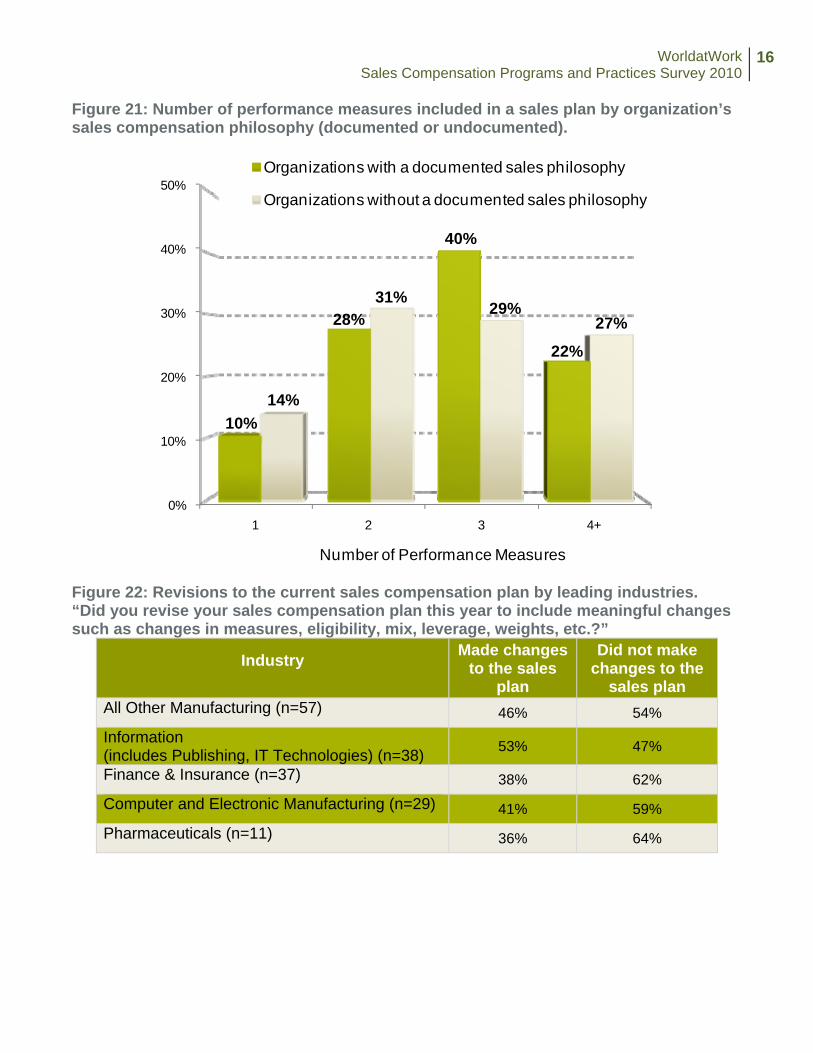
Figure 21: Number of performance measures included in a sales plan by organization’s sales compensation philosophy (documented or undocumented).
0%
10%
20%
30%
40%
50%
1 2 3 4+
10%
28%
40%
22%
14%
31%29%
27%
Number of Performance Measures
Organizations with a documented sales philosophy
Organizations without a documented sales philosophy
Figure 22: Revisions to the current sales compensation plan by leading industries. “Did you revise your sales compensation plan this year to include meaningful changes such as changes in measures, eligibility, mix, leverage, weights, etc.?”
Industry Made changes to the sales
plan
Did not make changes to the
sales plan All Other Manufacturing (n=57) 46% 54%
Information (includes Publishing, IT Technologies) (n=38) 53% 47%
Finance & Insurance (n=37) 38% 62%
Computer and Electronic Manufacturing (n=29) 41% 59%
Pharmaceuticals (n=11) 36% 64%
WorldatWorkSales Compensation Programs and Practices Survey 2010
17
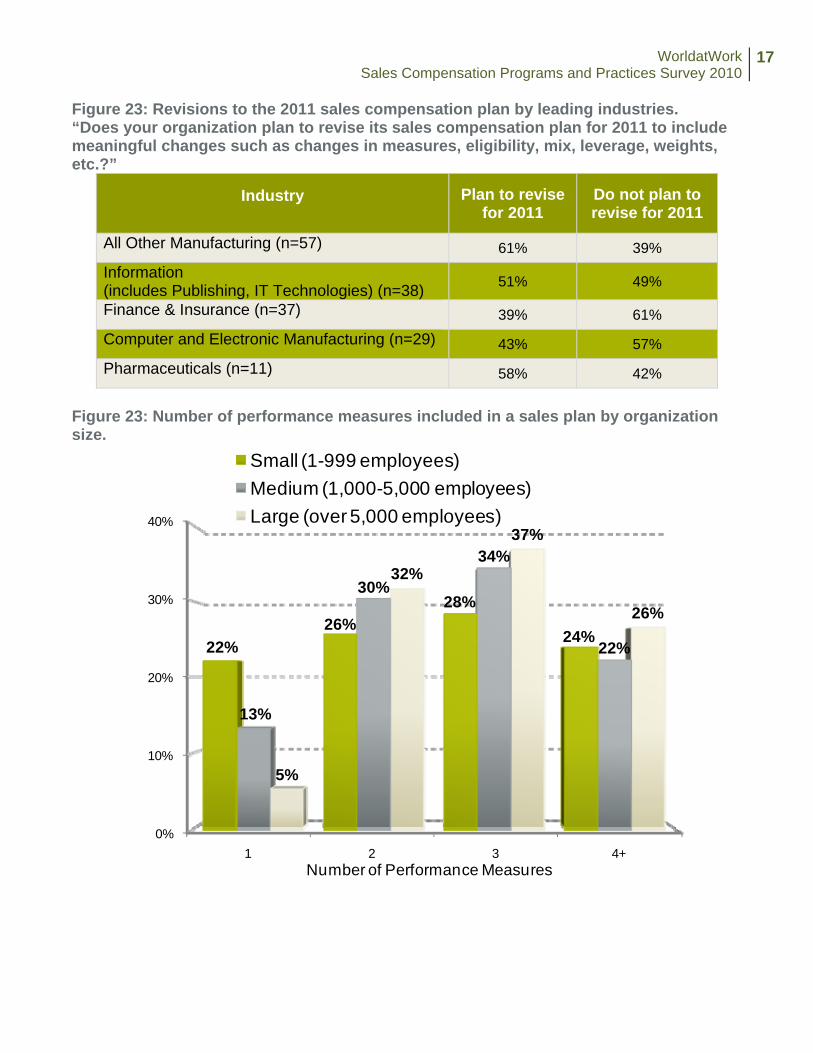
Figure 23: Revisions to the 2011 sales compensation plan by leading industries. “Does your organization plan to revise its sales compensation plan for 2011 to include meaningful changes such as changes in measures, eligibility, mix, leverage, weights, etc.?”
Industry Plan to revise for 2011
Do not plan to revise for 2011
All Other Manufacturing (n=57) 61% 39%
Information (includes Publishing, IT Technologies) (n=38) 51% 49%
Finance & Insurance (n=37) 39% 61%
Computer and Electronic Manufacturing (n=29) 43% 57%
Pharmaceuticals (n=11) 58% 42%
Figure 23: Number of performance measures included in a sales plan by organization size.
0%
10%
20%
30%
40%
1 2 3 4+
22%26%
28%
24%
13%
30%
34%
22%
5%
32%
37%
26%
Number of Performance Measures
Small (1-999 employees)Medium (1,000-5,000 employees)Large (over 5,000 employees)
WorldatWorkSales Compensation Programs and Practices Survey 2010
18
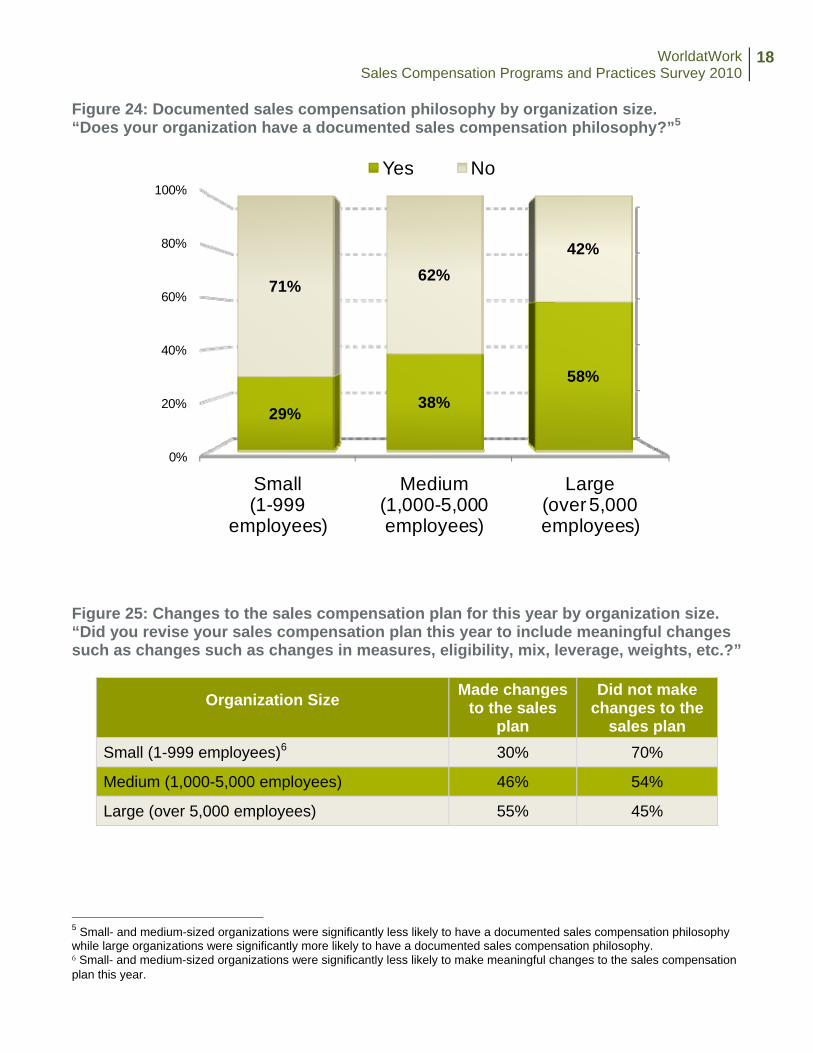
Figure 24: Documented sales compensation philosophy by organization size. “Does your organization have a documented sales compensation philosophy?”5
0%
20%
40%
60%
80%
100%
Large(over 5,000 employees)
Medium(1,000-5,000 employees)
Small(1-999
employees)
58%38%
29%
42%62%
71%
Yes No
Figure 25: Changes to the sales compensation plan for this year by organization size. “Did you revise your sales compensation plan this year to include meaningful changes such as changes such as changes in measures, eligibility, mix, leverage, weights, etc.?”
Organization Size Made changes to the sales
plan
Did not make changes to the
sales plan Small (1-999 employees)6 30% 70%
Medium (1,000-5,000 employees) 46% 54%
Large (over 5,000 employees) 55% 45%
5 Small- and medium-sized organizations were significantly less likely to have a documented sales compensation philosophy while large organizations were significantly more likely to have a documented sales compensation philosophy. 6 Small- and medium-sized organizations were significantly less likely to make meaningful changes to the sales compensation plan this year.
WorldatWorkSales Compensation Programs and Practices Survey 2010
19
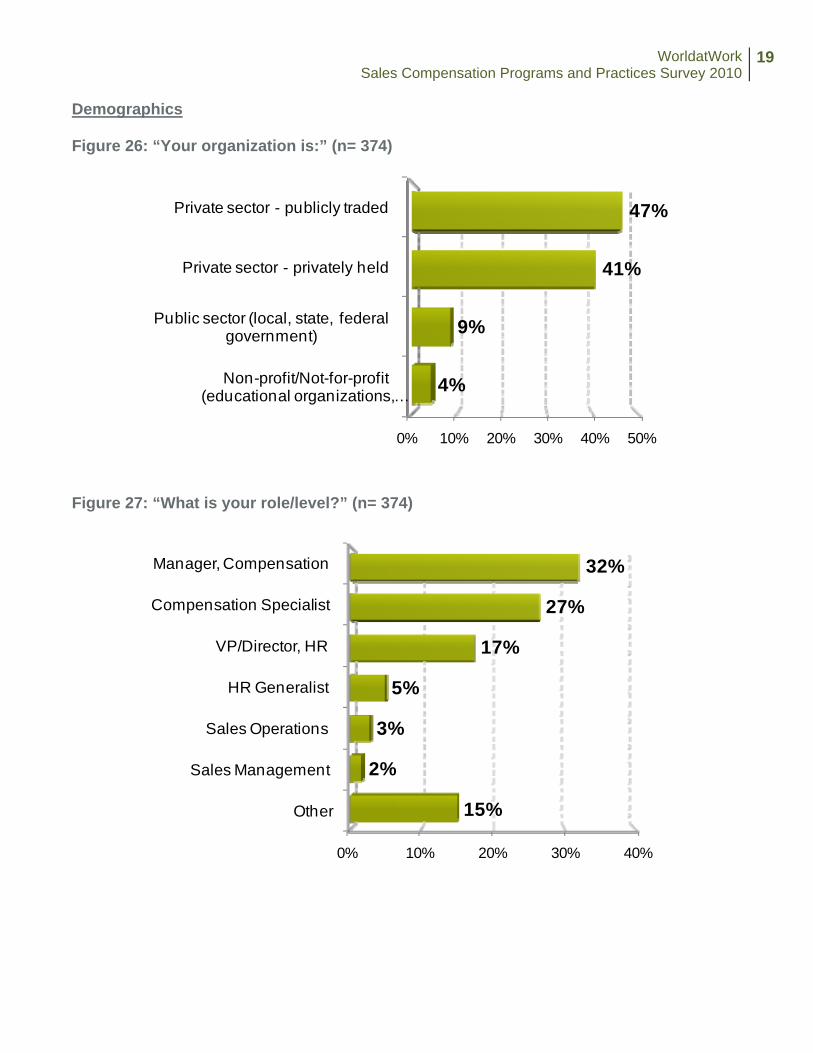
Demographics Figure 26: “Your organization is:” (n= 374)
0% 10% 20% 30% 40% 50%
Non-profit/Not-for-profit (educational organizations, …
Public sector (local, state, federal government)
Private sector - privately held
Private sector - publicly traded
4%
9%
41%
47%
Figure 27: “What is your role/level?” (n= 374)
0% 10% 20% 30% 40%
Other
Sales Management
Sales Operations
HR Generalist
VP/Director, HR
Compensation Specialist
Manager, Compensation
15%
2%
3%
5%
17%
27%
32%
WorldatWorkSales Compensation Programs and Practices Survey 2010
20
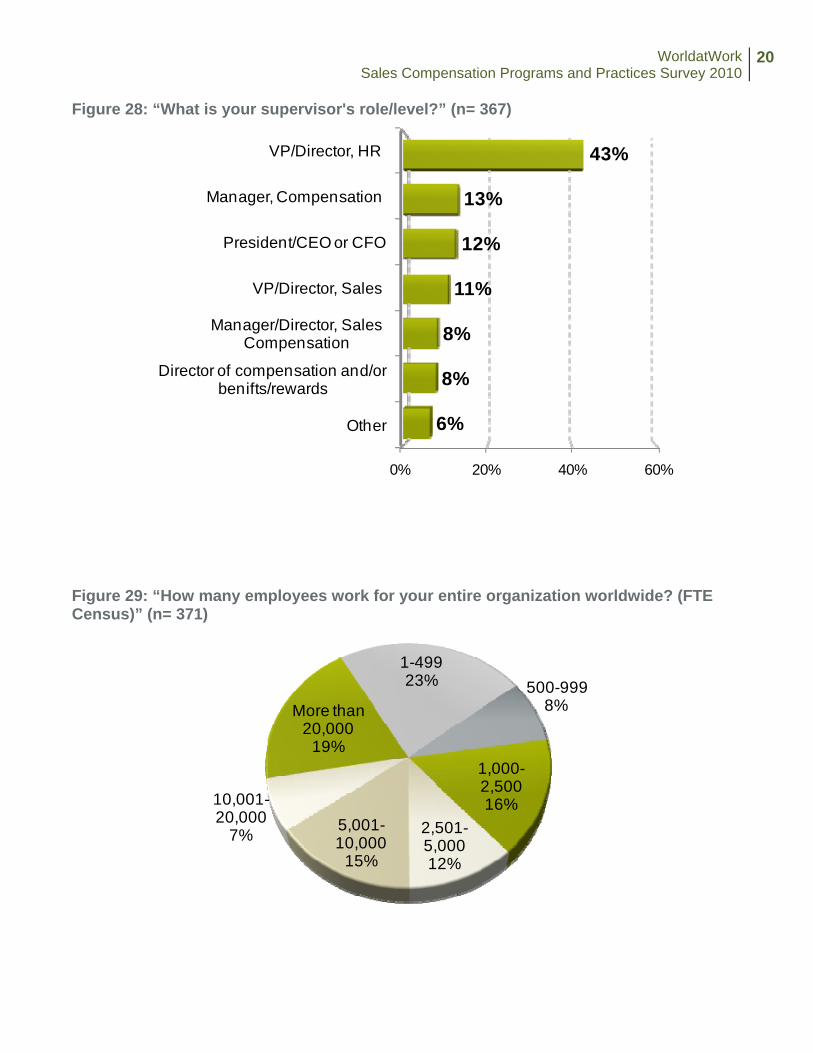
Figure 28: “What is your supervisor's role/level?” (n= 367)
0% 20% 40% 60%
Other
Director of compensation and/or benifts/rewards
Manager/Director, Sales Compensation
VP/Director, Sales
President/CEO or CFO
Manager, Compensation
VP/Director, HR
6%
8%
8%
11%
12%
13%
43%
Figure 29: “How many employees work for your entire organization worldwide? (FTE Census)” (n= 371)
1-499 23% 500-999
8%
1,000-2,500 16%
2,501-5,000 12%
5,001-10,000
15%
10,001-20,000
7%
More than 20,000
19%
WorldatWorkSales Compensation Programs and Practices Survey 2010
21
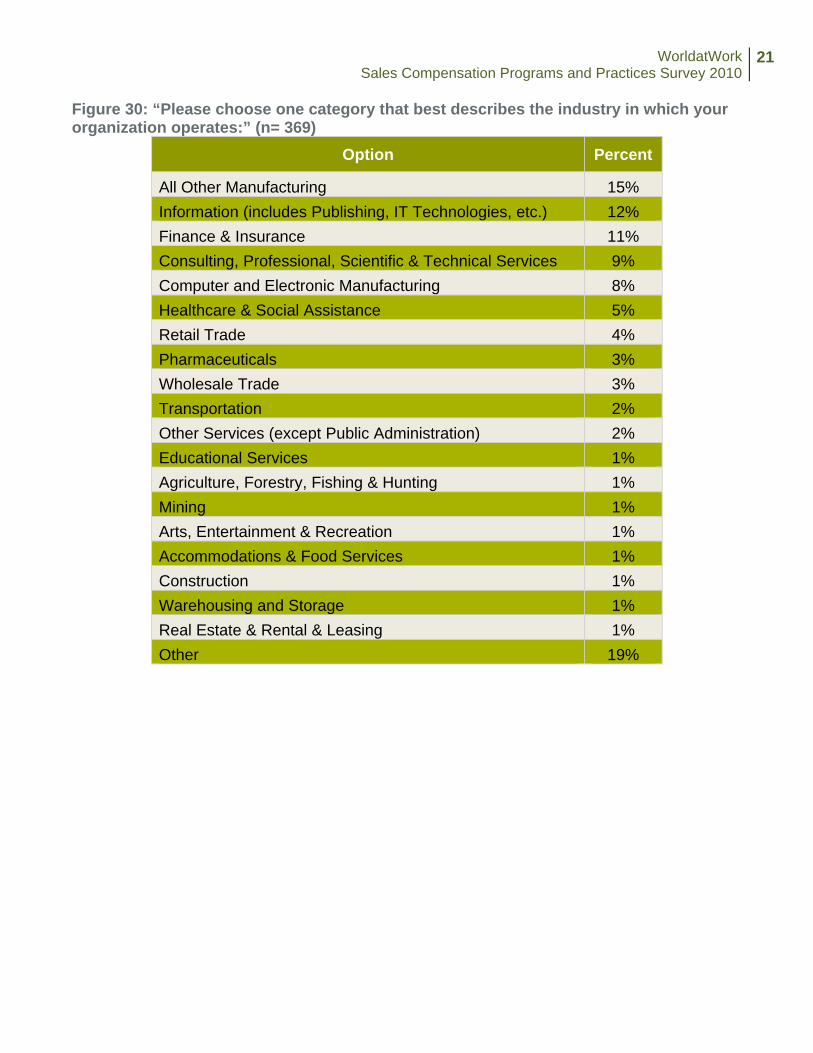
Figure 30: “Please choose one category that best describes the industry in which your organization operates:” (n= 369)
Option Percent
All Other Manufacturing 15% Information (includes Publishing, IT Technologies, etc.) 12% Finance & Insurance 11% Consulting, Professional, Scientific & Technical Services 9% Computer and Electronic Manufacturing 8% Healthcare & Social Assistance 5% Retail Trade 4% Pharmaceuticals 3% Wholesale Trade 3% Transportation 2% Other Services (except Public Administration) 2% Educational Services 1% Agriculture, Forestry, Fishing & Hunting 1% Mining 1% Arts, Entertainment & Recreation 1% Accommodations & Food Services 1% Construction 1% Warehousing and Storage 1% Real Estate & Rental & Leasing 1% Other 19%
WorldatWorkSales Compensation Programs and Practices Survey 2010
22
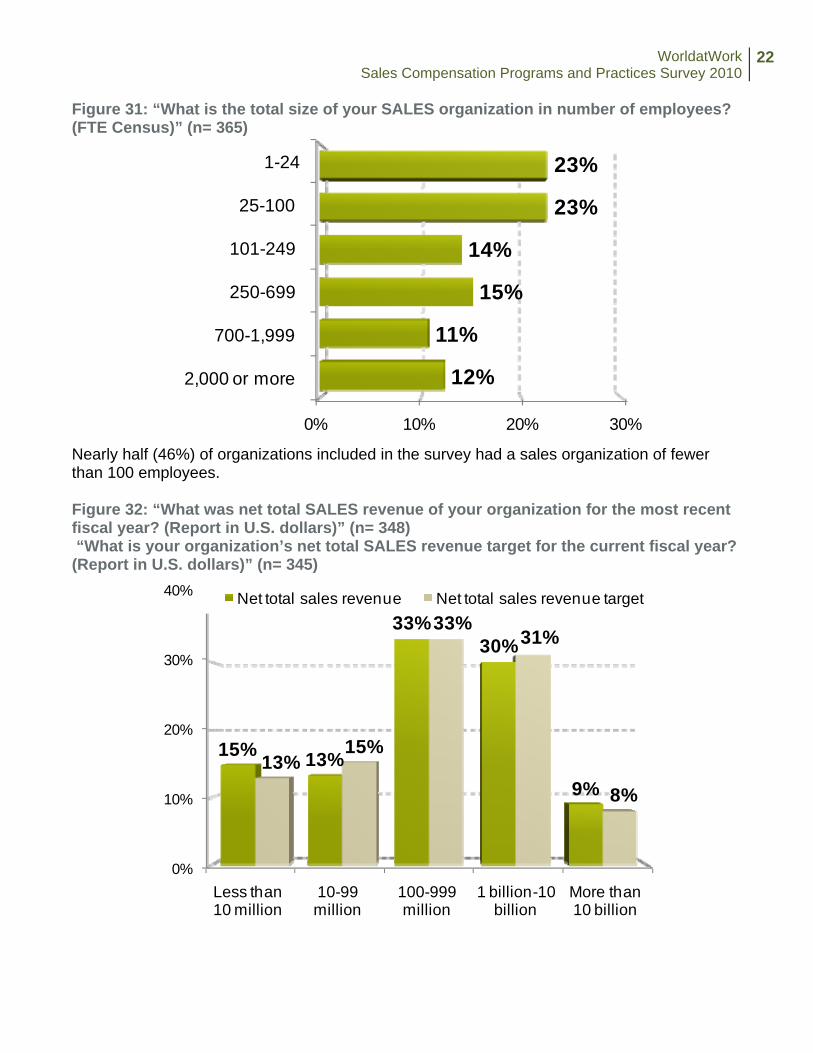
Figure 31: “What is the total size of your SALES organization in number of employees? (FTE Census)” (n= 365)
0% 10% 20% 30%
2,000 or more
700-1,999
250-699
101-249
25-100
1-24
12%
11%
15%
14%
23%
23%
Nearly half (46%) of organizations included in the survey had a sales organization of fewer than 100 employees. Figure 32: “What was net total SALES revenue of your organization for the most recent fiscal year? (Report in U.S. dollars)” (n= 348) “What is your organization’s net total SALES revenue target for the current fiscal year? (Report in U.S. dollars)” (n= 345)
0%
10%
20%
30%
40%
Less than 10 million
10-99 million
100-999 million
1 billion-10 billion
More than 10 billion
15% 13%
33%30%
9%13%
15%
33%31%
8%
Net total sales revenue Net total sales revenue target
Related Documents