Sale s Activated Hub Activated Average Activated Min. degree Time The network structure affects the shape of the sales curve Heterogeneous example

Welcome message from author
This document is posted to help you gain knowledge. Please leave a comment to let me know what you think about it! Share it to your friends and learn new things together.
Transcript

Sales
Activated Hub
Activated AverageActivated Min. degree
Time
The network structure affects the shape of the sales curve Heterogeneous example

Activated Hub
Activated AverageActivated Min. degree
Time
The degree distribution affects the shape of the diffusion curve Homogenous example
Sales

Nu
m. of
nod
es
The degree distribution affects the shape of the diffusion curve
Power Law Degree Dist.
Degree
Normal Degree Dist.
TimeTime
Log
( A
dop
tion
)
Degree
Adoption curve (scale free dist.)
Adoption curve (normal dist.)

network-degree space
Estimating the network activation patterns from diffusion data
Degree distribution estimation example (social-media group membership adoptions over time )
45% of the activation patterns do not include hubs
sales-temporal space
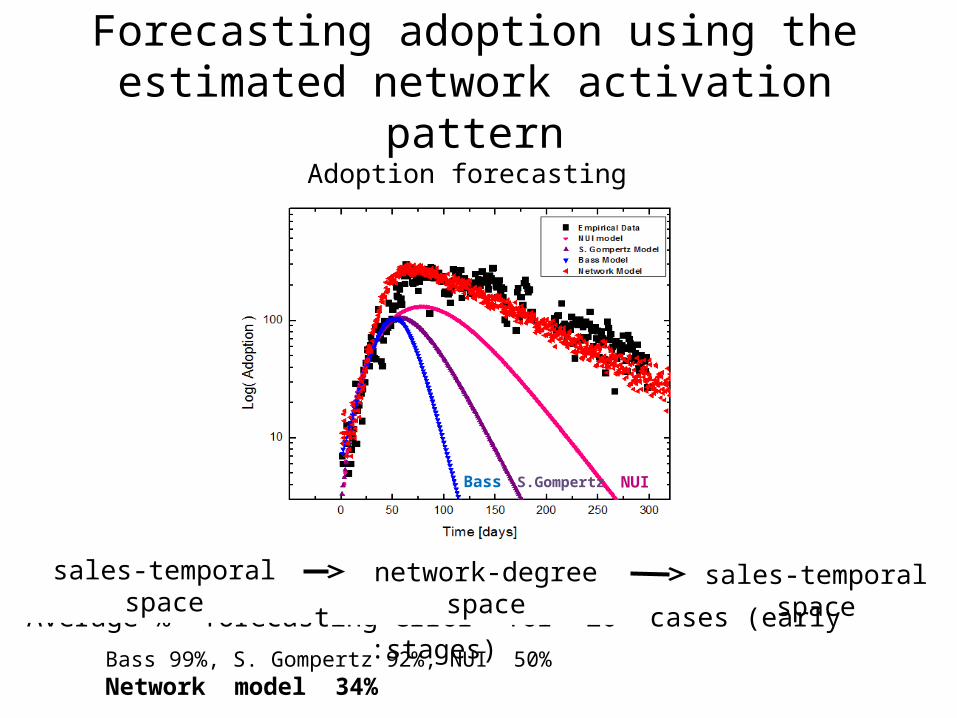
sales-temporal spaceAverage % forecasting error for 20 cases (early stages):
Bass 99%, S. Gompertz 92%, NUI 50%Network model 34%
Forecasting adoption using the estimated network activation pattern
Adoption forecasting
Bass
S.Gompertz
NUI
network-degree space
sales-temporal space
Related Documents