Proceedings World Geothermal Congress 2015 Melbourne, Australia, 19-25 April 2015 1 Geologic Modeling Workflow for Volcanic Hosted Geothermal Reservoirs: Case Study from Salak Geothermal Field Nur Vita Aprilina 1 , Drestanta Yudha Satya 1 , Sri Rejeki 1 , Glenn Golla 1 and Michael Waite 2 1 Chevron Geothermal Indonesia, Sentral Senayan II, Jalan Asia Afrika 8 Jakarta, Indonesia 2 Chevron Energy Technology Company, 1500 Louisiana Street, Houston, Texas, USA [email protected], [email protected], [email protected], [email protected], [email protected] Keywords: Salak, geothermal, reservoir, geologic model ABSTRACT The 3D Geologic Model is a tool for better understanding the subsurface geology and is an essential component of numerical reservoir modeling. The first Salak 3D Earth Model was built in 2005. Since then, one of the main uses of the 3D Geologic Model has been in planning and designing make-up wells. A major update of the Salak 3D Geologic Model was started in 2012 with the main objective of incorporating results of the wells drilled during the 2008-2009 and 2012-2013 drilling campaigns and about seven years of additional reservoir monitoring. One of the challenges of geothermal reservoir modeling is the description in three dimensions of the geologic characteristics of the complex fractured systems. Volcanic geothermal reservoirs are characterized by extreme heterogeneity in lithology both laterally and vertically. Lava flows and pyroclastics are usually not deposited as widespread as sediments. Even more, in the reservoir section, lithologies can be difficult to identify from cuttings since mud and rock cuttings are often not circulated up to the surface to be sampled and examined. Due to the limited spatial distribution of deep well data, it is not an easy task to accurately estimate the distribution of reservoir and rock properties between wells. Furthermore, these subsurface heterogeneities and uncertainties influence reservoir assessment and production. This paper documents the philosophical approach and workflows that were used to update the Salak 3D Geologic Model. Quite different from approaches taken in past geologic modeling exercises, where the limits of the “commercial” reservoir are defined in each well and then extrapolated beyond well control to build a 3D representation of the reservoir container, the Salak 3D Geologic Modeling Team emphasized the 3D description of the overall geothermal system first, thus providing a means of modeling uncertainty of the commercial limits of the reservoir directly from the 3D geocellular model. The very first step in building the Salak 3D geologic model was to create a well–organized database of core measurements, cuttings description and wireline logs. For the rock-type modeling, lithology types described from the analysis of rock cuttings were grouped on the basis of depositional style and mineral composition to simplify the description of the heterogeneity to a level that can be justified with reasonable confidence. A stratigraphic/structural framework was created based on well correlation and surface geology outcrop description. Rock-type proportions on each stratigraphic unit were assigned based on statistics derived from the database. Another key step in modeling the Salak geothermal system was to build a detailed 3D description of pre-production (equilibrium conditions) reservoir temperatures. Hard data used to constrain the temperature model were measured well temperatures and locations of the surface thermal manifestations. Microseismicity data were used, along with temperature data, to posit the zone of thermal upwelling. Recorded occurrence of high-temperature epidote, the first permeable entry locations in the wells, integrated with resistivity from magnetotelluric survey data and interpretations help to establish the depth of the clay-altered cap, which is a key parameter for defining limits of commerciality. Porosity and permeability were assigned on the basis of formation, rock-type and depth. The next step in the development of the Salak 3D Earth Model is define probabilistic low (P10), mid (P50) and high (P90) reservoir containers based on a number of criteria defining commerciality. Upscaling can then be performed on the gridded geologic model to produce coarser reservoir models suitable for numerical simulation. 1. INTRODUCTION The Gunung Salak area was explored and developed for commercial power production by Union Oil of California (Unocal Geothermal Indonesia; UGI), and has been managed by Chevron Geothermal Salak since August 2005 when Chevron acquired Unocal. In February 1982, UGI entered into a Joint Operation Contract with the Indonesian National Oil Company (Pertamina) for exploration and development of the geothermal resources of the Gunung Salak Contract Area, and an Energy Sales Contract with Pertamina and the Indonesian National Power Company (PLN) for sale of steam to PLN. The contracts allowed UGI to supply steam for up to 495 MWe of electric power generation (Stimac et al., 1997). Commercial power generation at Salak began in 1994 with a 110 MWe plant consisting of 2 x 55 MWe Units 1 and 2 operated by PLN (Murray et al., 1995). Production was expanded to 330 MWe in 1998 when 55 MWe Unit 3 (also operated by PLN) was installed adjacent to Units 1 and 2, and 3 x 55 MWe Units 4, 5 and 6 were constructed at a new location adjacent to the Awi 1 Pad (Soeparjadi et al., 1998). In 2002, generation was increased to 377 MWe as part of a new pricing agreement with the government. As part of the reservoir management and to maintain full steam supply, make-up drilling campaigns were conducted in 2002, 2004, 2006-2007, 2008-2009 and 2012-2013. As of 2013, 107 wells had been drilled, with 82 wells being used for production and 25

Welcome message from author
This document is posted to help you gain knowledge. Please leave a comment to let me know what you think about it! Share it to your friends and learn new things together.
Transcript

Proceedings World Geothermal Congress 2015
Melbourne, Australia, 19-25 April 2015
1
Geologic Modeling Workflow for Volcanic Hosted Geothermal Reservoirs: Case Study from
Salak Geothermal Field
Nur Vita Aprilina1, Drestanta Yudha Satya
1, Sri Rejeki
1, Glenn Golla
1 and Michael Waite
2
1 Chevron Geothermal Indonesia, Sentral Senayan II, Jalan Asia Afrika 8 Jakarta, Indonesia
2 Chevron Energy Technology Company, 1500 Louisiana Street, Houston, Texas, USA
[email protected], [email protected], [email protected], [email protected], [email protected]
Keywords: Salak, geothermal, reservoir, geologic model
ABSTRACT
The 3D Geologic Model is a tool for better understanding the subsurface geology and is an essential component of numerical
reservoir modeling. The first Salak 3D Earth Model was built in 2005. Since then, one of the main uses of the 3D Geologic Model
has been in planning and designing make-up wells. A major update of the Salak 3D Geologic Model was started in 2012 with the
main objective of incorporating results of the wells drilled during the 2008-2009 and 2012-2013 drilling campaigns and about seven
years of additional reservoir monitoring.
One of the challenges of geothermal reservoir modeling is the description in three dimensions of the geologic characteristics of the
complex fractured systems. Volcanic geothermal reservoirs are characterized by extreme heterogeneity in lithology both laterally
and vertically. Lava flows and pyroclastics are usually not deposited as widespread as sediments. Even more, in the reservoir
section, lithologies can be difficult to identify from cuttings since mud and rock cuttings are often not circulated up to the surface to
be sampled and examined. Due to the limited spatial distribution of deep well data, it is not an easy task to accurately estimate the
distribution of reservoir and rock properties between wells. Furthermore, these subsurface heterogeneities and uncertainties
influence reservoir assessment and production.
This paper documents the philosophical approach and workflows that were used to update the Salak 3D Geologic Model. Quite
different from approaches taken in past geologic modeling exercises, where the limits of the “commercial” reservoir are defined in
each well and then extrapolated beyond well control to build a 3D representation of the reservoir container, the Salak 3D Geologic
Modeling Team emphasized the 3D description of the overall geothermal system first, thus providing a means of modeling
uncertainty of the commercial limits of the reservoir directly from the 3D geocellular model.
The very first step in building the Salak 3D geologic model was to create a well–organized database of core measurements, cuttings
description and wireline logs. For the rock-type modeling, lithology types described from the analysis of rock cuttings were
grouped on the basis of depositional style and mineral composition to simplify the description of the heterogeneity to a level that
can be justified with reasonable confidence. A stratigraphic/structural framework was created based on well correlation and surface
geology outcrop description. Rock-type proportions on each stratigraphic unit were assigned based on statistics derived from the
database. Another key step in modeling the Salak geothermal system was to build a detailed 3D description of pre-production
(equilibrium conditions) reservoir temperatures. Hard data used to constrain the temperature model were measured well
temperatures and locations of the surface thermal manifestations. Microseismicity data were used, along with temperature data, to
posit the zone of thermal upwelling. Recorded occurrence of high-temperature epidote, the first permeable entry locations in the
wells, integrated with resistivity from magnetotelluric survey data and interpretations help to establish the depth of the clay-altered
cap, which is a key parameter for defining limits of commerciality. Porosity and permeability were assigned on the basis of
formation, rock-type and depth.
The next step in the development of the Salak 3D Earth Model is define probabilistic low (P10), mid (P50) and high (P90) reservoir
containers based on a number of criteria defining commerciality. Upscaling can then be performed on the gridded geologic model
to produce coarser reservoir models suitable for numerical simulation.
1. INTRODUCTION
The Gunung Salak area was explored and developed for commercial power production by Union Oil of California (Unocal
Geothermal Indonesia; UGI), and has been managed by Chevron Geothermal Salak since August 2005 when Chevron acquired
Unocal. In February 1982, UGI entered into a Joint Operation Contract with the Indonesian National Oil Company (Pertamina) for
exploration and development of the geothermal resources of the Gunung Salak Contract Area, and an Energy Sales Contract with
Pertamina and the Indonesian National Power Company (PLN) for sale of steam to PLN. The contracts allowed UGI to supply
steam for up to 495 MWe of electric power generation (Stimac et al., 1997).
Commercial power generation at Salak began in 1994 with a 110 MWe plant consisting of 2 x 55 MWe Units 1 and 2 operated by
PLN (Murray et al., 1995). Production was expanded to 330 MWe in 1998 when 55 MWe Unit 3 (also operated by PLN) was
installed adjacent to Units 1 and 2, and 3 x 55 MWe Units 4, 5 and 6 were constructed at a new location adjacent to the Awi 1 Pad
(Soeparjadi et al., 1998). In 2002, generation was increased to 377 MWe as part of a new pricing agreement with the government.
As part of the reservoir management and to maintain full steam supply, make-up drilling campaigns were conducted in 2002, 2004,
2006-2007, 2008-2009 and 2012-2013. As of 2013, 107 wells had been drilled, with 82 wells being used for production and 25
Aprilina et al.
2
wells for injection. The static (aka geologic) model was updated with new information derived from the latest drilled wells, most
recent geoscientific interpretations and field performance data.
2. GEOLOGICAL FRAMEWORK
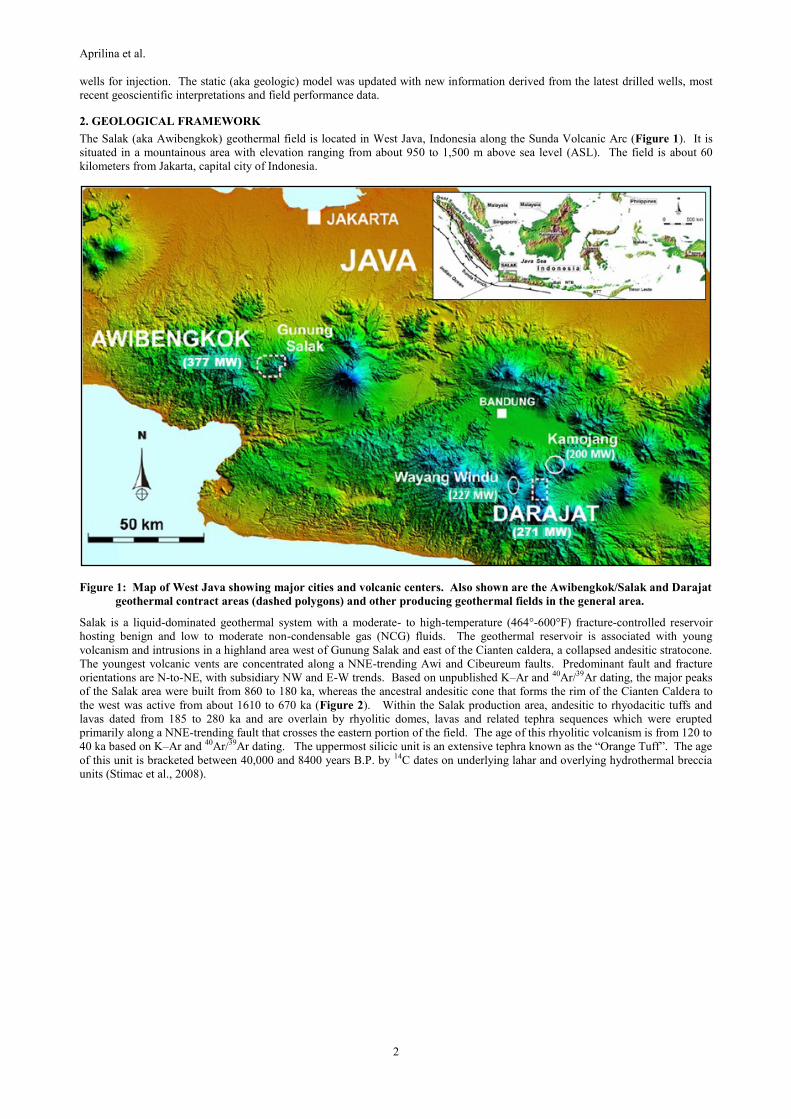
The Salak (aka Awibengkok) geothermal field is located in West Java, Indonesia along the Sunda Volcanic Arc (Figure 1). It is
situated in a mountainous area with elevation ranging from about 950 to 1,500 m above sea level (ASL). The field is about 60
kilometers from Jakarta, capital city of Indonesia.
Figure 1: Map of West Java showing major cities and volcanic centers. Also shown are the Awibengkok/Salak and Darajat
geothermal contract areas (dashed polygons) and other producing geothermal fields in the general area.
Salak is a liquid-dominated geothermal system with a moderate- to high-temperature (464°-600°F) fracture-controlled reservoir
hosting benign and low to moderate non-condensable gas (NCG) fluids. The geothermal reservoir is associated with young
volcanism and intrusions in a highland area west of Gunung Salak and east of the Cianten caldera, a collapsed andesitic stratocone.
The youngest volcanic vents are concentrated along a NNE-trending Awi and Cibeureum faults. Predominant fault and fracture
orientations are N-to-NE, with subsidiary NW and E-W trends. Based on unpublished K–Ar and 40Ar/39Ar dating, the major peaks
of the Salak area were built from 860 to 180 ka, whereas the ancestral andesitic cone that forms the rim of the Cianten Caldera to
the west was active from about 1610 to 670 ka (Figure 2). Within the Salak production area, andesitic to rhyodacitic tuffs and
lavas dated from 185 to 280 ka and are overlain by rhyolitic domes, lavas and related tephra sequences which were erupted
primarily along a NNE-trending fault that crosses the eastern portion of the field. The age of this rhyolitic volcanism is from 120 to
40 ka based on K–Ar and 40Ar/39Ar dating. The uppermost silicic unit is an extensive tephra known as the “Orange Tuff”. The age
of this unit is bracketed between 40,000 and 8400 years B.P. by 14C dates on underlying lahar and overlying hydrothermal breccia
units (Stimac et al., 2008).
Aprilina et al.
3
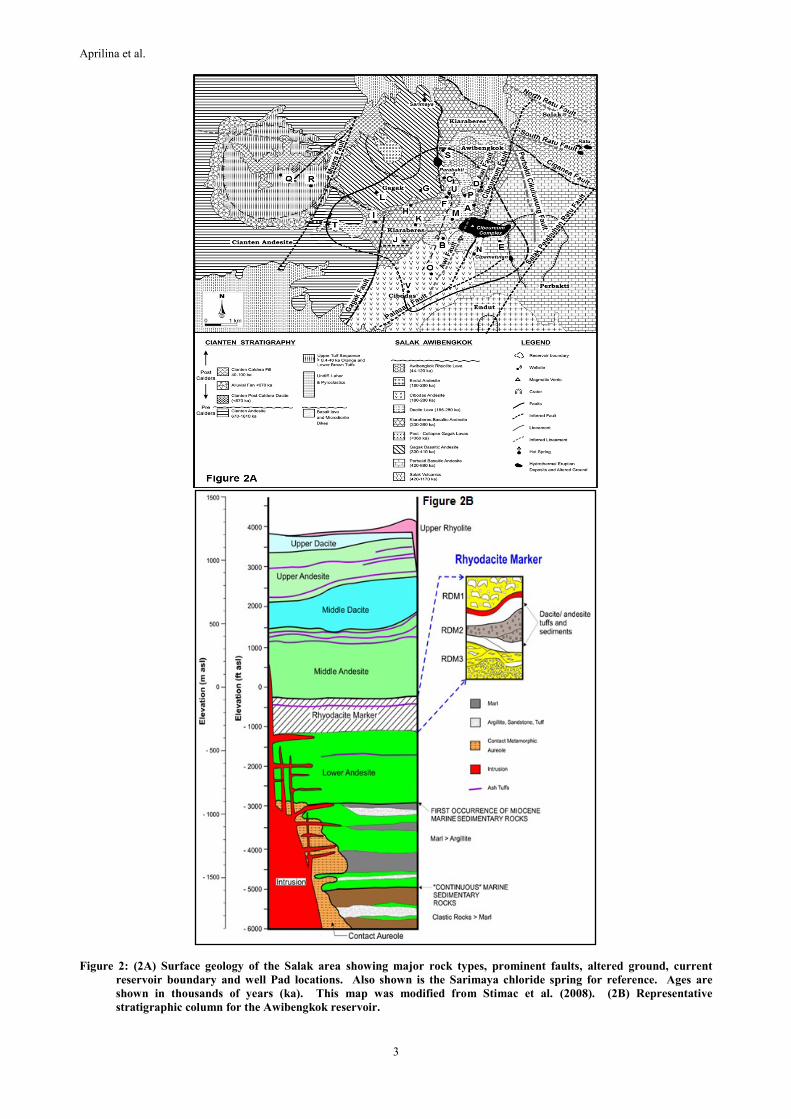
Figure 2: (2A) Surface geology of the Salak area showing major rock types, prominent faults, altered ground, current
reservoir boundary and well Pad locations. Also shown is the Sarimaya chloride spring for reference. Ages are
shown in thousands of years (ka). This map was modified from Stimac et al. (2008). (2B) Representative
stratigraphic column for the Awibengkok reservoir.

Aprilina et al.
4
The reservoir is contained primarily within a sequence of volcanic rocks of andesitic to rhyodacitic composition with a basement of
Miocene marine sedimentary rocks. Both volcanic and sedimentary rocks are cut by igneous intrusions (Stimac et al., 2008). The
stratigraphic section can be divided into four major formations thought to represent discrete episodes in the evolution of the western
Java segment of the Sunda Volcanic Arc. These are: (1) Shallow-Marine Carbonates and Epiclastic Sediments (mudstones and
sandstones containing abundant volcanic ash and lithic debris); (2) Lower Volcanic Formation, consists of andesitic to basaltic
volcanic rocks, overlies and is interbedded with the upper Miocene sedimentary section; (3) Middle Volcanic Formation, which is
another sequence of andesitic-to-dacitic lavas, tuffs, lahars, and debris flows that represents construction, collapse and erosion of
stratovolcanoes and lava dome complexes. In this formation, there is widespread rock that represents an episode of silicic
volcanism and caldera formation that followed the first major episode of andesitic stratovolcano construction in the area, namely
Rhyodacite Marker; and (4) Upper Volcanic Formation consists of another andesitic sequence overlain by dacitic to rhyolitic rocks
that includes the surface deposits described above. Each major volcanic formation is further subdivided into a lower andesitic
section and an overlying rhyolitic or dacitic section. These formations are inferred to represent distinct or partially overlapping
volcanic episodes that each evolved to become more silicic with time (Figure 2).
3. 3D GEOLOGIC MODEL
The Salak 3D geologic models have been constructed for various purposes including: (1) a tool to integrate all available geological,
petrophysical, geophysical, geochemical and reservoir engineering information to better understand the geothermal system; (2)
providing geologically sound input for numerical modeling; (3) for well planning; and (4) for development of reservoir
characterization and modeling proficiency within the organization. Earth modeling is an iterative process and is focused towards
developing efficient and re-usable workflows and generally away from the resulting “pile” of geocells. For the Salak 3D Earth
modeling work, an evergreen static modeling workflow was built in Chevron’s in-house 3D modeling software. This workflow
allows the modelers to easily update the static model whenever new input data is acquired.
Copious subsurface data was acquired during the series of make-up drilling campaigns in Salak. Thirteen new wells were drilled in
various locations around the field in the recent 2012-2013 drilling campaign. Various types of data (reservoir geology,
geochemistry, geophysics, drilling, reservoir engineering, and field performance) had been accumulated since 2008 which
encouraged the Salak 3D modeling team to update the previous earth model. A robust geothermal system earth model comes from
the integration of both subsurface and surface data.
3.1 Geologic Structures
The Salak 3D earth modeling team identified several lineaments and structures that control fluid flow, distribution of permeable
entries, offsets in lithologies and other reservoir characteristics (e.g., pressure differences between reservoir cells, tracer flow
pathways, alignment of micro-earthquakes (MEQs), etc.). Table 1 shows the categorization of the mapped lineaments and faults in
Salak based on their impact to the geothermal reservoir and level of confidence (regarding their physical presence). Figure 3
shows the mapped faults and lineaments identified at Salak with the different colors representing the levels of impact to geothermal
system and confidence on their physical evidence.
Table 1. Summary of mapped faults and lineaments in Salak
Offset
Lithology
(RDM)
Geophysics
(MEQ)Image Log
Surface
Expression
Level of
Confidence
Large Scale
fluid flow
impact
Alignment
of Entries
Reservoir
Eng. Data
Level of
Impact to
Geothermal
System
East Cisaketi √ None √ √ High √ √ None High
Awibengkok √ √ √ √ High √ √ None High
Cibereum √ None √ √ High √ √ √ High
MEQ1 √ √ √ √ High √ √ None High
MEQ2 √ √ √ √ High √ √ None High
NW-I8 None None √ √ High √ √ None High
Cibodas √ None None √ Medium √ √ None High
NW-D1 None √ None √ Medium √ None None High
Muara √ √ √ √ High √ None None Medium
Palasari √ √ √ None High √ None None Medium
Gagak NW None None √ √ Medium None √ √ Medium
Gagak NE None None √ √ Medium √ None None Medium
Gagak √ None N/A √ Medium √ None None Medium
Sarimaya None √ √ √ Medium √ None None Medium
SPR √ None N/A None Medium √ None None Medium
Parabakti √ None N/A √ Medium √ None None Medium
Gareok √ √ √ √ High None None None Low
Caldera Ring √ √ None √ High None None None Low
West Cisaketi None √ N/A √ Medium None None None Low
Cianten √ None N/A √ Medium None None None Low
Pangguyangan √ None N/A √ Medium None None None Low
Ciasmara None None N/A √ Low None None None Low
Ratu North None None N/A √ Low None None None Low
Ciganea None None N/A √ Low None None None Low
Ratu South None None N/A √ Low None None None Low
Fault/
Lineament
Impact To Geothermal SystemPhysical Evidence

Aprilina et al.
5
Figure 3: Map showing the mapped faults and lineaments in Salak. Each color represents the degree of confidence (of the
structure’s presence) and impact of the particular structure to the Salak geothermal system.
3.2. Lithology
The reservoir rocks at Salak are composed mainly of andesitic and lesser basaltic lava flows, breccia, tuff and lahar that comprise
several long-lived volcanic centers underlying the southwestern margin of Gunung Salak (Hulen et al., 2000; Stimac and Sugiaman,
2000). Thick rhyodacitic to dacitic ash-flow tuffs and associated domes, breccias and lahars are interspersed with the more
voluminous andesitic to basaltic sequences that date back to Miocene times (Stimac et al., 2008).
The subsurface lithology modeling was inferred from descriptions of drill cuttings and supplemented by spot cores from 16 wells
and 1,067 meters of continuous core from one production well in east Salak. Borehole resistivity images and gamma-ray logs also
provided constraints on major rock types and compositions, respectively, and are the only means of obtaining lithologic] data in the
reservoir hole sections of wells which were drilled without mud returns. This data was used as basis for the 3D representation of
the subsurface litholigies and intrusive bodies in the static model (Figure 4).
Figure 4: Screenshot showing the distribution of subsurface lithology in the Salak 3D Earth Model. The red blocks
represent the intrusive bodies as encountered with the drilling and their possible distribution beneath the drilled
depths.

Aprilina et al.
6
3.3. Hydrothermal Alteration
The distribution of hydrothermal alteration play important role in determining the reservoir extent and petrophysical properties
distribution. Hydrothermal alteration zones in Salak were identified mainly from rock cuttings and core. Magneto-Telluric (MT)
resistivity data was used as a constraint for the distribution of clay alteration at the periphery of and outside the reservoir area. In
general, hydrothermal alteration in Salak can be categorized into three main zones, namely, argillic, transitional argillic-propylitic,
and propylitic. Phyllic alteration was also identified in some wells but its distribution is not extensive; our current interpretation is
that phyllic alteration in Salak is highly correlated with the presence of silicic rocks. Furthermore, the petrophysical measurements
(i.e., matrix porosity, matrix permeability) acquired from the propylitic and phyllic zones do not show significant differences.
Therefore, in the current Salak 3D earth model surfaces that define the boundaries of argillic, transitional argillic-propylitic, and
propylitic alteration are represented as continuous and widespread, while phyllic alteration is localized in small pockets.
Argillic alteration is dominated by smectite clay, with accessory pyrite, hematite, calcite, anhydrite and zeolites that formed at
temperatures less than about 180°C. The rocks within this alteration zone typically have resistivity below about 10 ohm-m and a
conductive temperature profile indicating very low fracture permeability. The argillic alteration has been successfully mapped with
methylene blue (especially during drilling) and X-ray diffraction analyses of cuttings in selected wells. The transitional argillic-
propylitic zone can span up to 300 m in thickness, and is dominated by mixed layered smectite–illite clay with chlorite, calcite,
pyrite, titanite and quartz. The propylitic alteration zone is dominated by chlorite, epidote, illite and quartz, but also contains albite,
adularia, calcite, wairakite, pyrite, anhydrite and titanite. This alteration assemblage corresponds to measured reservoir
temperatures between about 220 and 270 °C.
Figure 5 shows a cross-section of the hydrothermal alteration at Salak in the 3D earth model. The argillic and transitional argillic-
propylitic zones extend to the west of Salak reservoir (Cianten caldera), as do the low resistivities measured by MT. However, the
temperatures beneath the clay cap in Cianten are significantly lower compared to Salak indicating cooling has taken place
(Nordquist, 2007). It is believed that there was once an active geothermal system within the Cianten caldera that has since
collapsed. We have taken the top of the propylitic alteration assemblage to be the “most likely” top of reservoir.
Figure 5: Screenshot showing the hydrothermal alteration at Salak in the 3D Earth Model. Although the argillic alteration
extends to the west, this alteration assemblage is believed to have been associated with the earlier active geothermal
system under the Cianten caldera.
3.4. Temperature Distribution
As a key parameter in reservoir characterization, the initial or pre-exploitation temperature was integrated into the 3D earth model.
The main objective in building a 3D representation of initial temperatures is to enable querying of commercial reservoir volume for
uncertainty analysis and development of a workflow that will allow use of simple parameters to easily update the 3D model
whenever new data is acquired.
The temperature profile of a typical Salak well has three main regions - conductive, transition from conductive to convective and
isothermal (Figure 6). Three regions were constrained using six variables, namely, Z0, T0, Z1, T1, Z2 and T2. Z0 and T0 represent
the elevation of the well and temperature at surface, respectively. The elevation and temperature of the top of the transition from
conductive to convective region are denoted by Z1 and T1, while Z2 and T2 indicate top of isothermal zone elevation and
temperature.

Aprilina et al.
7
Figure 6: Schematic showing the temperature profile parameterization of a typical Salak well.
The above six variables from each well temperature profile were interpolated into the “surfaces” in the 3D model. The interpolated
values were vertically projected into the grid using linear vertical interpolation (Figure 7). A regional temperature profile was
applied outside of the reservoir and used as a lower limit within the reservoir area.
Figure 7: Schematic showing the temperature modeling workflow.
Figure 8 is a cross-section showing the temperature profile from SW to NE, as derived from the 3D earth model. The initial
temperature distribution characterizes both permeability and heat flow in the geothermal system. The upflow of the Salak
geothermal system is located in the western portion of the field (Pad I area) where the highest temperatures have been measured.
The hot fluid ascends buoyantly from the deep upflow and moves in two preferential directions, to the northeast towards Pad C and
Parabakti fumarole, and also to the southeast towards Pad O, possibly to the south of Pad N, or below the Cipamatutan fumarole.
Thermal discontinuities allow the field to be subdivided into distinct sectors or “cells” that are likely bounded by faults, which are
shown as an abrupt temperature change in Figure 9. The most common cause for such discontinuities in thermal regimes is a sharp
change in permeability.

Aprilina et al.
8
Figure 8: Cross-section from the 3D Salak Earth Model showing the temperature (in °F) profile from SW to NE.
3.5. Reservoir Top and Base
Table 2 summarizes the criteria used to define the top and base of the Salak geothermal reservoir. In this work, the parameters
used to define the top of reservoir are similar with what was used in the previous model in the mid-2000; hence the top of reservoir
did not change significantly with the addition of the new data. The base of the geothermal reservoir was defined as the maximum
depth at which the fracture permeability of the rock is high enough to sustain commercial flow. Aprilina and Golla (2012) defined
this to correspond more or less to a fracture permeability of around 1 – 5 mD. In the current 3D model, the deepest well entries
were used as basis for our estimate of the shallowest (P10) base of reservoir. The most likely (P50) and deepest (P90) base of
reservoir estimates were made based on qualitative and interpretative mapping of MEQ densities below drilled reservoir depths.
The P50 and P90 bases of reservoir estimates used MEQ density criteria of 0.5 and 0.1 hypocenters per 250 x 250 x 250 m block),
respectively. These MEQ density surfaces were liberally smoothed due to lack of MEQs in certain areas of the reservoir.
Based on the results of the 2012-2013 drilled wells, the deepest reservoir bottom is located in the southwestern portion of the Salak
field where the upflow is located. The deepest entry at -6,286’ elevation (-1,916 m) was encountered by a recently drilled well
during the 2012-2013 Salak drilling campaign. MEQ hypocenters indicate that permeability could extend as deep as -13,000’ (-
3,963 m) elevation in this part of the field. There are geothermal reservoirs where substantial reserves have been found below a
previously interpreted reservoir bottom (e.g. Larderello, Italy; Mak-Ban, Philippines) hence a “very” deep well may be drilled to
reduce the uncertainty in this regard.
Table 2. Criteria used to define the top and base of the Salak reservoir

Aprilina et al.
9
3.6. Rock Properties
For the purpose of earth model construction, the reservoir rocks in Salak are grouped into six petrophysical groups (PG). The
petrophysical grouping was aimed at simplifying the different lithologic units to a level that can be justified with reasonable
confidence by considering the contrast mainly in the petrophysical properties, depositional styles and hydrothermal alteration. This
grouping was done to reduce complexity or optimize computing time as less model components mean faster computing time. From
about nine different lithologies identified, six rock groups were determined, namely, PG1 (metamorphic rocks or skarn; lowest
matrix porosity), PG2 (sedimentary rocks, i.e., argillite, mudstone and limestone), PG3 (crystalline intrusives such as dacite,
granodiorites and diorite/microdiorite), PG4 (andesitic-dacitic lava flows), PG5 (fine-grained tuff and lithic tuff) and PG6 (coarse-
grained pyroclastic like breccias, ash-flow tuff and lahar). Table 3 shows the global facies proportion of these PGs in each
stratigraphic unit (formation) which were used in the PG populating.
Table 3. Global facies proportion of six PG in each stratigraphic unit (formation)
The six PG facies were populated in the 3D earth model using Indicator Kriging and Sequential Indicator Simulation. The
populated probabilities and realizations honor the local facies at the well, and global facies proportions calculated within each
stratigraphic unit. Figure 9 shows the PG facies population in new Salak 3D earth model.
Figure 9: Screenshots showing the PG facies distribution in the 3D Earth Model. The six PGs were distributed using
Indicator Kriging (a) and Sequential Indicator Simulation (b).
3.6.1. Matrix Porosity
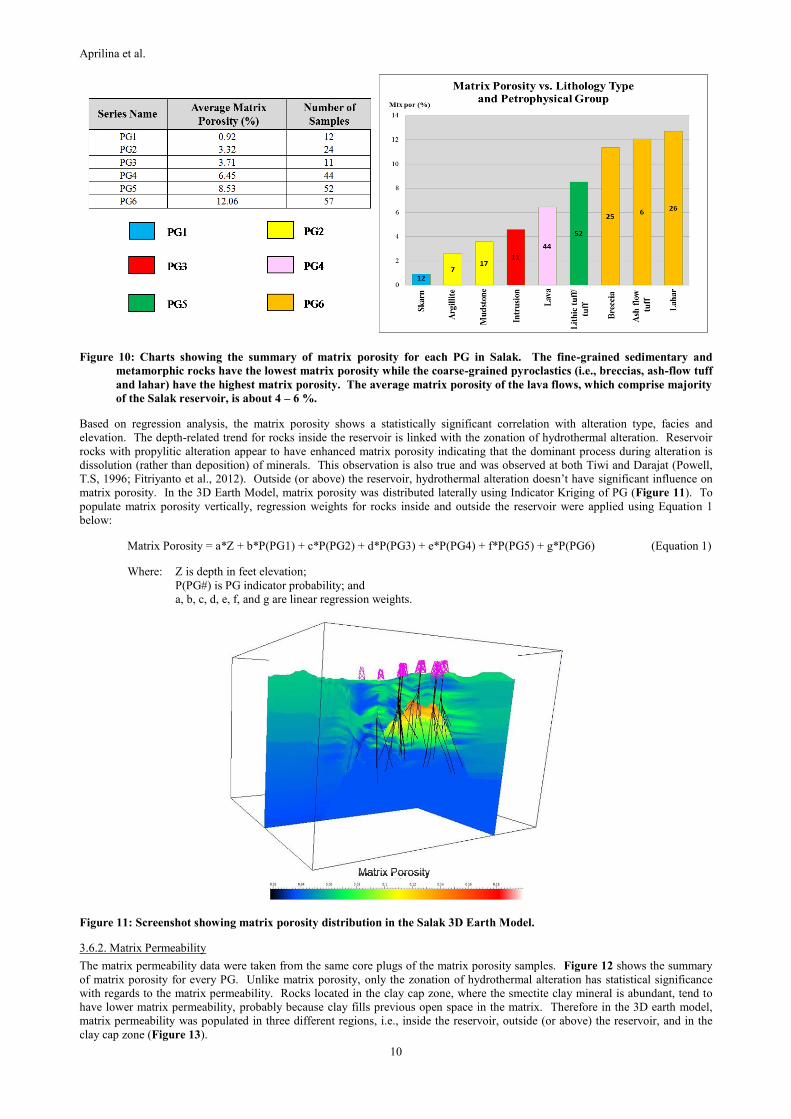
The matrix porosity data were taken from both conventional and sidewall core plugs with helium porosity measurements. Figure
10 shows the summary of matrix porosity for each PG.
Aprilina et al.
10
Figure 10: Charts showing the summary of matrix porosity for each PG in Salak. The fine-grained sedimentary and
metamorphic rocks have the lowest matrix porosity while the coarse-grained pyroclastics (i.e., breccias, ash-flow tuff
and lahar) have the highest matrix porosity. The average matrix porosity of the lava flows, which comprise majority
of the Salak reservoir, is about 4 – 6 %.
Based on regression analysis, the matrix porosity shows a statistically significant correlation with alteration type, facies and
elevation. The depth-related trend for rocks inside the reservoir is linked with the zonation of hydrothermal alteration. Reservoir
rocks with propylitic alteration appear to have enhanced matrix porosity indicating that the dominant process during alteration is
dissolution (rather than deposition) of minerals. This observation is also true and was observed at both Tiwi and Darajat (Powell,
T.S, 1996; Fitriyanto et al., 2012). Outside (or above) the reservoir, hydrothermal alteration doesn’t have significant influence on
matrix porosity. In the 3D Earth Model, matrix porosity was distributed laterally using Indicator Kriging of PG (Figure 11). To
populate matrix porosity vertically, regression weights for rocks inside and outside the reservoir were applied using Equation 1
below:
Matrix Porosity = a*Z + b*P(PG1) + c*P(PG2) + d*P(PG3) + e*P(PG4) + f*P(PG5) + g*P(PG6) (Equation 1)
Where: Z is depth in feet elevation;
P(PG#) is PG indicator probability; and
a, b, c, d, e, f, and g are linear regression weights.
Figure 11: Screenshot showing matrix porosity distribution in the Salak 3D Earth Model.
3.6.2. Matrix Permeability
The matrix permeability data were taken from the same core plugs of the matrix porosity samples. Figure 12 shows the summary
of matrix porosity for every PG. Unlike matrix porosity, only the zonation of hydrothermal alteration has statistical significance
with regards to the matrix permeability. Rocks located in the clay cap zone, where the smectite clay mineral is abundant, tend to
have lower matrix permeability, probably because clay fills previous open space in the matrix. Therefore in the 3D earth model,
matrix permeability was populated in three different regions, i.e., inside the reservoir, outside (or above) the reservoir, and in the
clay cap zone (Figure 13).

Aprilina et al.
11
Figure 12: Charts showing the distribution of matrix permeability for each PG and inside, outside and within the clay cap
of the Salak reservoir.
Matrix permeability was distributed based on PG rock type probabilities (Indicator Kriging) using the mean of PGs for each region
with below equation:
Matrix Permeability = a*P(PG1)+b*P(PG2)+c*P(PG3)+d*P(PG4)+e*P(PG5)+f*P(PG6) (Equation 2)
Where: P(PG#) is PG indicator probability; and
a, b, c, d, e, f, and g are linear regression weights.
Figure 13: Screenshot showing matrix permeability distribution in the 3D Earth Model.
3.7. Commercial Reservoir Volume
As the geological and geophysical constraints do not uniquely prove any single geologic model for the field, low (P10), mid (P50)
and high (P90) exploitable resource extent are defined. In a conventional 3D model, the top, bottom, and lateral extent of the
commercial reservoir are usually described as a non-discrete surface. A new approach in defining the commercial reservoir volume
is being applied in the current Salak 3D model. Model properties are queried using criteria to define different volume realizations.
The workflow used in the volume realizations allows automated modification in particular realization (not only restricted to

Aprilina et al.
12
low/P10, mid/P50, and high/P90) by modifying the queried criteria. Figure 14 shows three probabilistic reservoir volume
realizations using the low (P10), mid (P50) and high (P90) tops and bases of reservoir.
Figure 14: Screenshot showing the three probabilistic volume realizations using the P10, P50 and P90 tops and bases of
reservoir.
4. SUMMARY
An iterative multidisciplinary (geology, geophysics, geochemistry and reservoir engineering) approach can better represent the
conceptual model of a geothermal system into a 3D earth model. The process of reconciling and integrating such a diverse set of
inputs helps in building common team understanding and alignment. The earth model is an evergreen tool that can be updated
periodically with data from recently drilled wells and new reservoir performance data, hence the importance of documenting
modeling steps or approaches and workflows.
The conceptual model of the Salak geothermal system has been realized in a 3D digital model by applying a geostatistical modeling
approach to provide a better representation of reservoir properties. Eventually, this 3D earth model will be used as basis for a
numerical simulation model which will aim to predict reservoir performance and support field management decisions such as
injection management and make-up well targeting.
During the 2012-2013 drilling campaign, this 3D earth model was used for well trajectory planning and design. The model
provided a better representation of drilling targets such as fractures and specific formations. It was also very useful in viewing real
time trajectories as the wells were being drilled, avoiding potential collisions and production interference with offset wells.
5. ACKNOWLEDGEMENT
The authors would like to acknowledge the contribution of all Salak Asset Management Team and Chevron Geothermal Indonesia,
Ltd. colleagues in this 3D modeling work and Chevron IndoAsia Business Unit management for the permission to publish this
paper.
REFERENCES
Aprilina, N.V. and Golla, G.: Salak Interim 3D Static Model Update, Chevron Geothermal Indonesia Internal Report (2012).
Baroek, M.C., Aprilina, N.V., Sunio, E., Nelson, C., Peter: North Awibengkok Subsurface Evaluation, Chevron Geothermal
Indonesia Internal Report, 46 pp, Mar 4, 2011.
Day, P.I.: Log Analysis of Awibengkok 1-2 and Awibengkok 1-2ST, Unocal Geothermal Indonesia Internal Report (1996).
Fitriyanto, Agus, Intani, R., Mahagyo, P., Golla, G. and Waite, M.: The 2012 Darajat 3D Static Model: General Workflows and
Steps to Build a 3D Static Model, Chevron Geothermal Indonesia Internal Report, 40 pp, June 7, 2012.
Nordquist, G.: Re-interpretation of Cianten Caldera Geophysical data using constraints from Awi 17 and 18, Chevron Geothermal
Indonesia Internal Report (2007).
Powell, T.S.: Matrix Porosity and Permeability of the Matalibong-25 Core, Unocal Geothermal Philippines Internal Report (1996).
Powell, T.S.: Matalibong-25 Porosity Studies Update, Unocal Geothermal Philippines Internal Report (1997).
Rohrs, D.: AWI1-2 Core: Lithology and Porosity Distributions, Unocal Geothermal Philippines Internal Report (1996).
Rohrs, D., Gunderson, R., Melosh, G., Suminar, A., Nordquist, G., Molling, P., Sirad-Azwar, L. and Acuna, J.: Awibengkok 2005
Conceptual Model Update, Chevron Geothermal Indonesia Internal Report (2005).
Stimac, J., Astra, D., Molling, P., Acuna, J., Prabowo, H. and Sugiaman, F.: Awibengkok 1997 Conceptual Model Summary,
Chevron Geothermal Indonesia Internal Report (1997).
Stimac, J., Nordquist, G., Suminar, A. and Sirad-Azwar, L.: An Overview of the Awibengkok Geothermal System, Indonesia,
Geothermics, 37 (2008), pp 300-331.
Stimac, J., Baroek M.C.: AWI1-2 Core Analysis Report, Chevron Geothermal Indonesia Internal Report (2010).
Soeparjadi, R., Horton, G.D., Bradley, E., Wendt, P.E.: A review of the Gunung Salak Geothermal Expansion Project, Proceedings,
20th New Zealand Geothermal Workshop, Auckland (1998), pp. 153–158.
Related Documents