Saizeriya Co., Ltd. Financial Results Briefing Session for the Fiscal Year Ended August 31, 2017 (45th term: from September 1, 2016 to August 31, 2017) Code No. 7581 Thursday, October 12, 2017

Welcome message from author
This document is posted to help you gain knowledge. Please leave a comment to let me know what you think about it! Share it to your friends and learn new things together.
Transcript

Saizeriya Co., Ltd.
Financial Results Briefing Session
for the Fiscal Year Ended August 31, 2017 (45th term: from September 1, 2016 to August 31, 2017)
Code No. 7581
Thursday, October 12, 2017
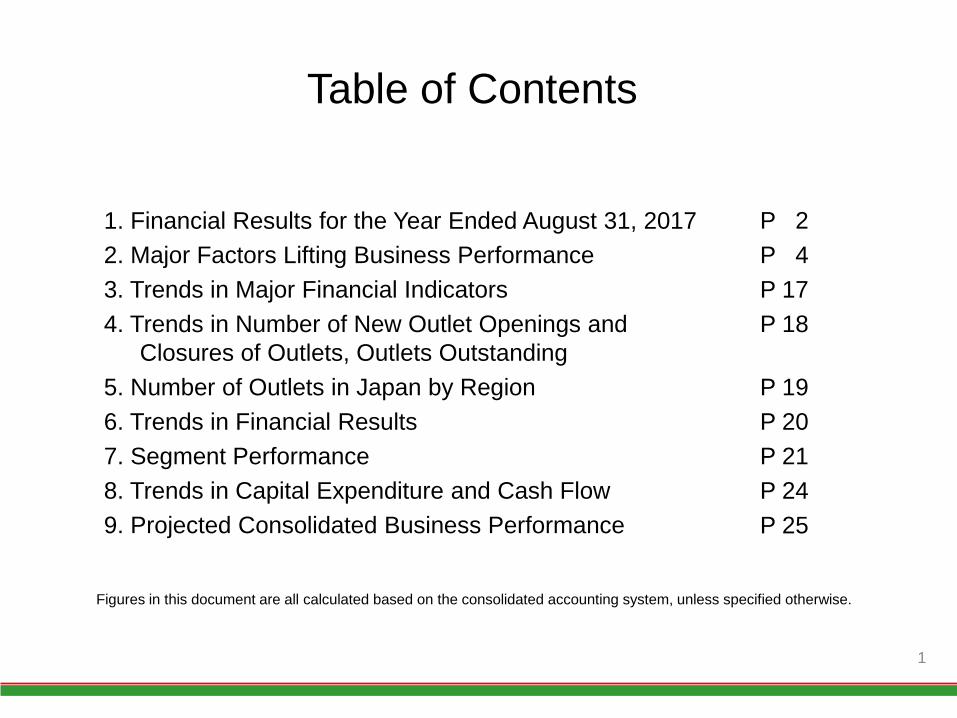
Table of Contents
1. Financial Results for the Year Ended August 31, 2017
2. Major Factors Lifting Business Performance
3. Trends in Major Financial Indicators
4. Trends in Number of New Outlet Openings and
Closures of Outlets, Outlets Outstanding
5. Number of Outlets in Japan by Region
6. Trends in Financial Results
7. Segment Performance
8. Trends in Capital Expenditure and Cash Flow
9. Projected Consolidated Business Performance
Figures in this document are all calculated based on the consolidated accounting system, unless specified otherwise.
P 2
P 4
P 17
P 18
P 19
P 20
P 21
P 24
P 25
1
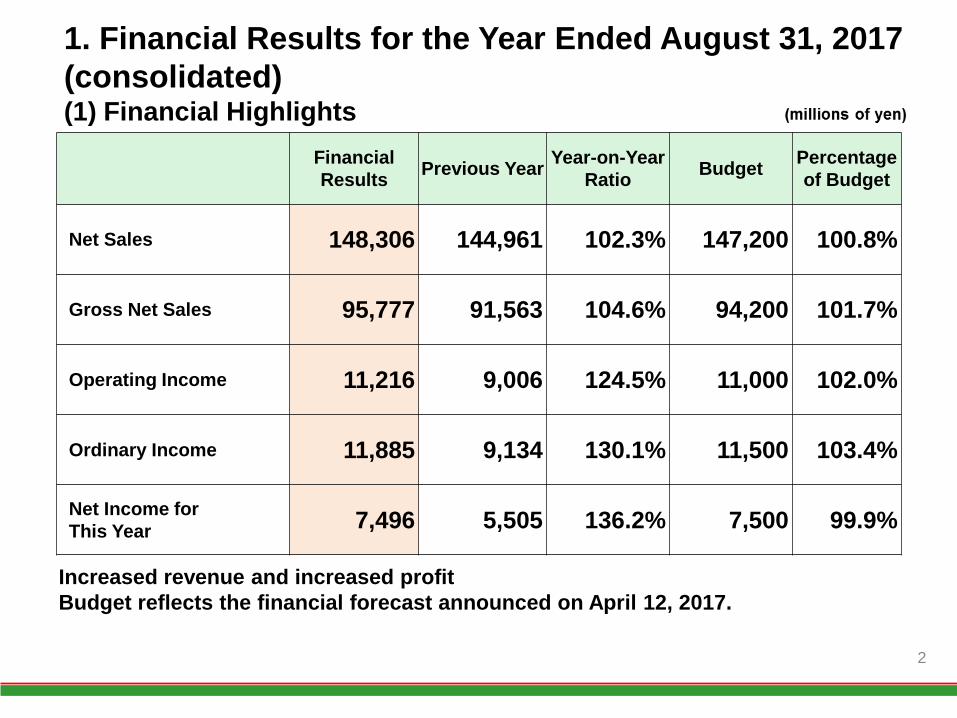
1. Financial Results for the Year Ended August 31, 2017
(consolidated) (1) Financial Highlights
Increased revenue and increased profit
Budget reflects the financial forecast announced on April 12, 2017.
2
Financial
Results Previous Year
Year-on-Year
Ratio Budget
Percentage
of Budget
Net Sales 148,306 144,961 102.3% 147,200 100.8%
Gross Net Sales 95,777 91,563 104.6% 94,200 101.7%
Operating Income 11,216 9,006 124.5% 11,000 102.0%
Ordinary Income 11,885 9,134 130.1% 11,500 103.4%
Net Income for
This Year 7,496 5,505 136.2% 7,500 99.9%
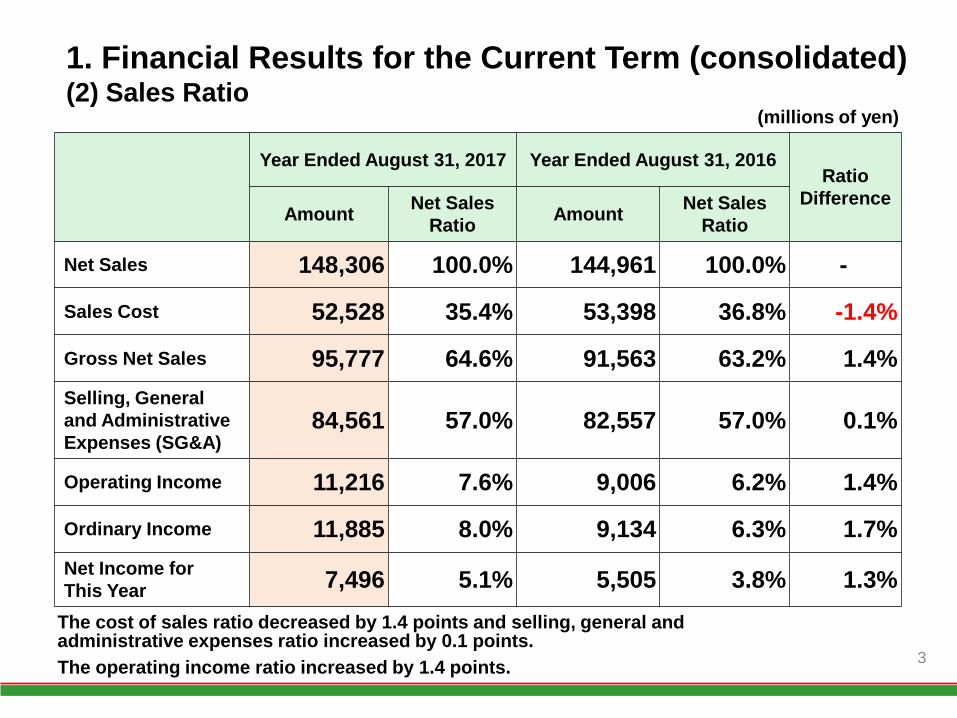
1. Financial Results for the Current Term (consolidated) (2) Sales Ratio
(millions of yen)
Year Ended August 31, 2017 Year Ended August 31, 2016 Ratio
Difference Amount
Net Sales
Ratio Amount
Net Sales
Ratio
Net Sales 148,306 100.0% 144,961 100.0% -
Sales Cost 52,528 35.4% 53,398 36.8% -1.4%
Gross Net Sales 95,777 64.6% 91,563 63.2% 1.4%
Selling, General
and Administrative
Expenses (SG&A) 84,561 57.0% 82,557 57.0% 0.1%
Operating Income 11,216 7.6% 9,006 6.2% 1.4%
Ordinary Income 11,885 8.0% 9,134 6.3% 1.7%
Net Income for
This Year 7,496 5.1% 5,505 3.8% 1.3%
The cost of sales ratio decreased by 1.4 points and selling, general and administrative expenses ratio increased by 0.1 points.
The operating income ratio increased by 1.4 points. 3
1,373
1,424 48
41
△19
△19
1,250
1,300
1,350
1,400
1,450
F.Y. Ending August 2016
New Outlet Openings in Japan
Closure of Outlets
in Japan
New Outlet Openings Overseas
Closure of Outlets
Overseas
F.Y. Ending August 2017
(Outlets)
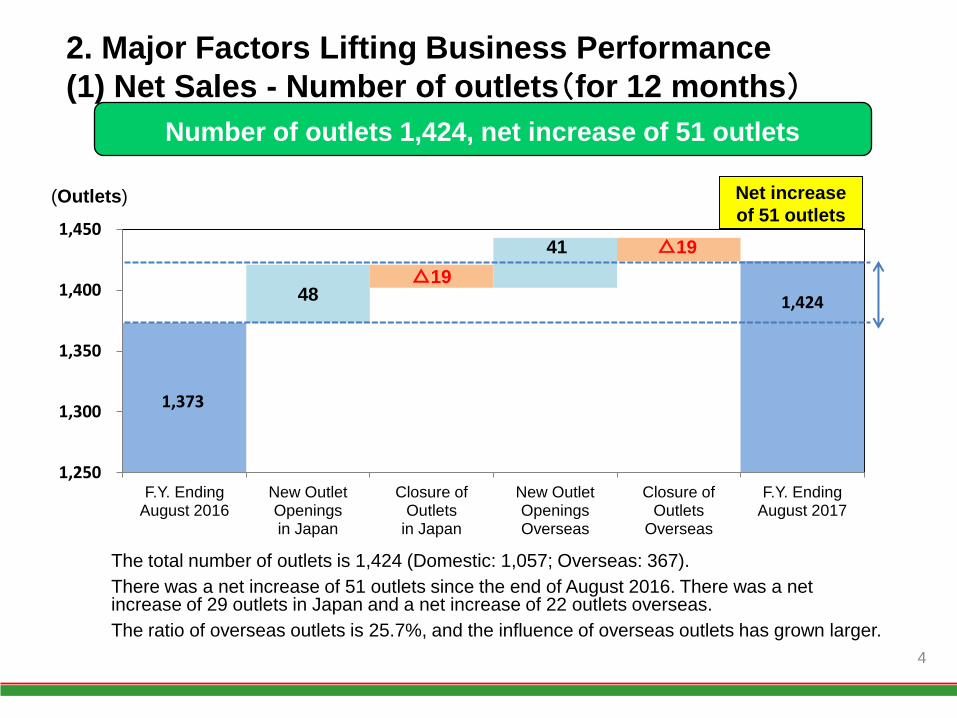
2. Major Factors Lifting Business Performance
(1) Net Sales - Number of outlets(for 12 months)
4
Number of outlets 1,424, net increase of 51 outlets
The total number of outlets is 1,424 (Domestic: 1,057; Overseas: 367).
There was a net increase of 51 outlets since the end of August 2016. There was a net increase of 29 outlets in Japan and a net increase of 22 outlets overseas.
The ratio of overseas outlets is 25.7%, and the influence of overseas outlets has grown larger.
Net increase
of 51 outlets
2. Major Factors Lifting Business Performance
(1) Net Sales - Number of outlets
1. Number of outlets
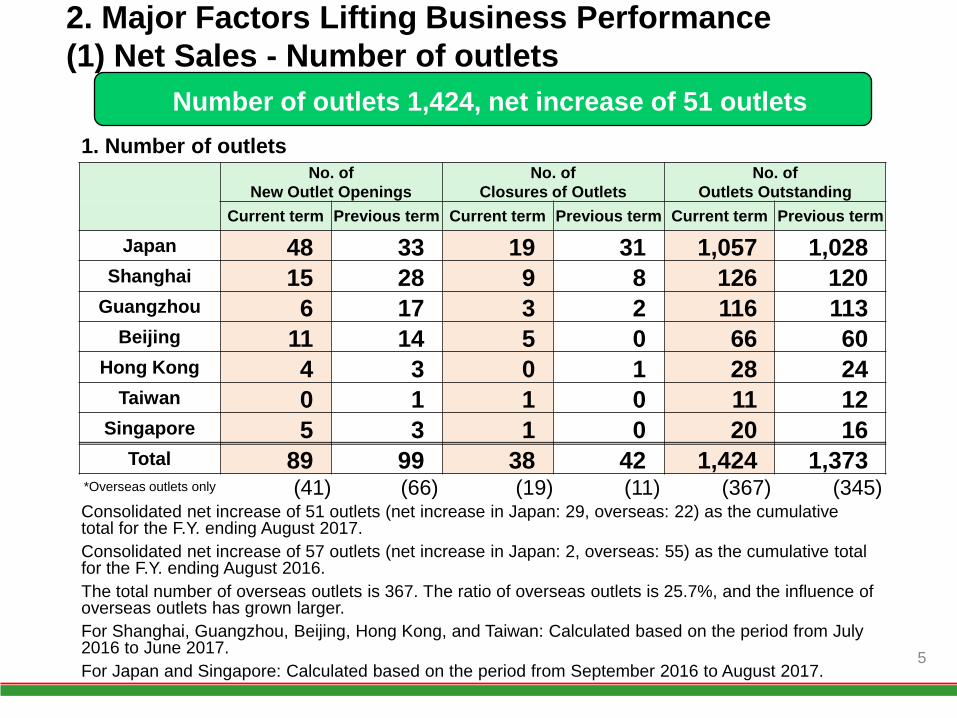
Number of outlets 1,424, net increase of 51 outlets
Consolidated net increase of 51 outlets (net increase in Japan: 29, overseas: 22) as the cumulative total for the F.Y. ending August 2017.
Consolidated net increase of 57 outlets (net increase in Japan: 2, overseas: 55) as the cumulative total for the F.Y. ending August 2016.
The total number of overseas outlets is 367. The ratio of overseas outlets is 25.7%, and the influence of overseas outlets has grown larger.
For Shanghai, Guangzhou, Beijing, Hong Kong, and Taiwan: Calculated based on the period from July 2016 to June 2017.
For Japan and Singapore: Calculated based on the period from September 2016 to August 2017. 5
No. of
New Outlet Openings
No. of
Closures of Outlets
No. of
Outlets Outstanding
Current term Previous term Current term Previous term Current term Previous term
Japan 48 33 19 31 1,057 1,028 Shanghai 15 28 9 8 126 120
Guangzhou 6 17 3 2 116 113 Beijing 11 14 5 0 66 60
Hong Kong 4 3 0 1 28 24 Taiwan 0 1 1 0 11 12
Singapore 5 3 1 0 20 16 Total 89 99 38 42 1,424 1,373
*Overseas outlets only (41) (66) (19) (11) (367) (345)
144.96
148.3 4.0
2.86 3.7
△2.47 △3.4
△1.38
140.0
145.0
150.0
155.0
F.Y. Ending August 2016
New Outlet Openings in Japan
Existing Outlets
in Japan
Closure of Outlets
in Japan
New Outlet Openings Overseas
Existing Outlets
Overseas
Closure of Outlets
Overseas
F.Y. Ending August 2017
(billions of yen)
+3.34 billion yen
2. Major Factors Lifting Business Performance
(1) Net Sales
6
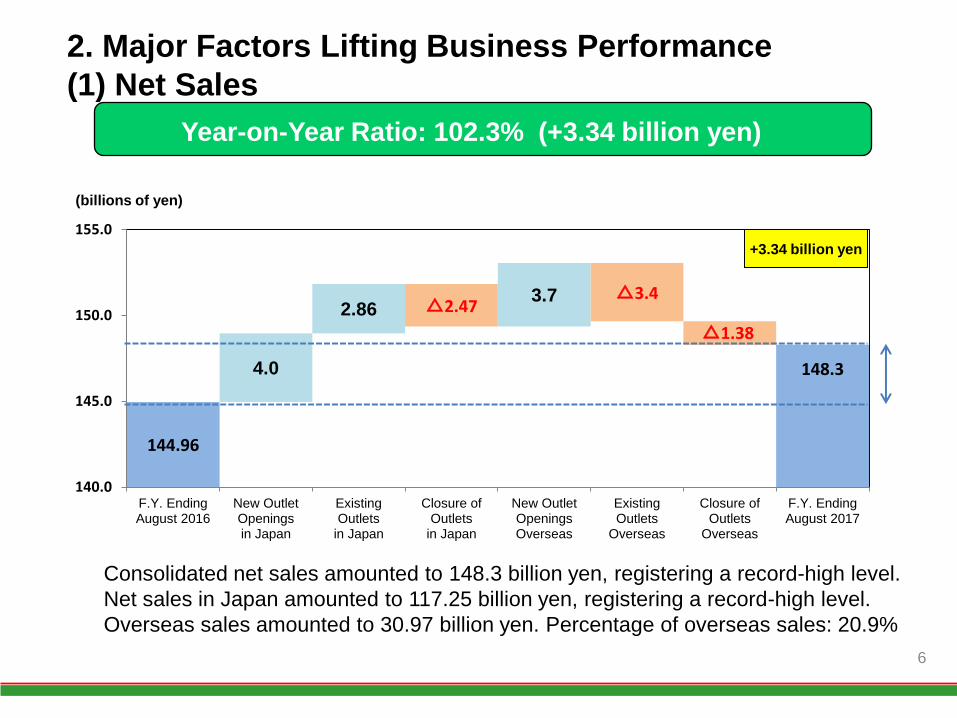
Year-on-Year Ratio: 102.3% (+3.34 billion yen)
Consolidated net sales amounted to 148.3 billion yen, registering a record-high level.
Net sales in Japan amounted to 117.25 billion yen, registering a record-high level.
Overseas sales amounted to 30.97 billion yen. Percentage of overseas sales: 20.9%
2. Major Factors Lifting Business Performance
(1) Net Sales
7
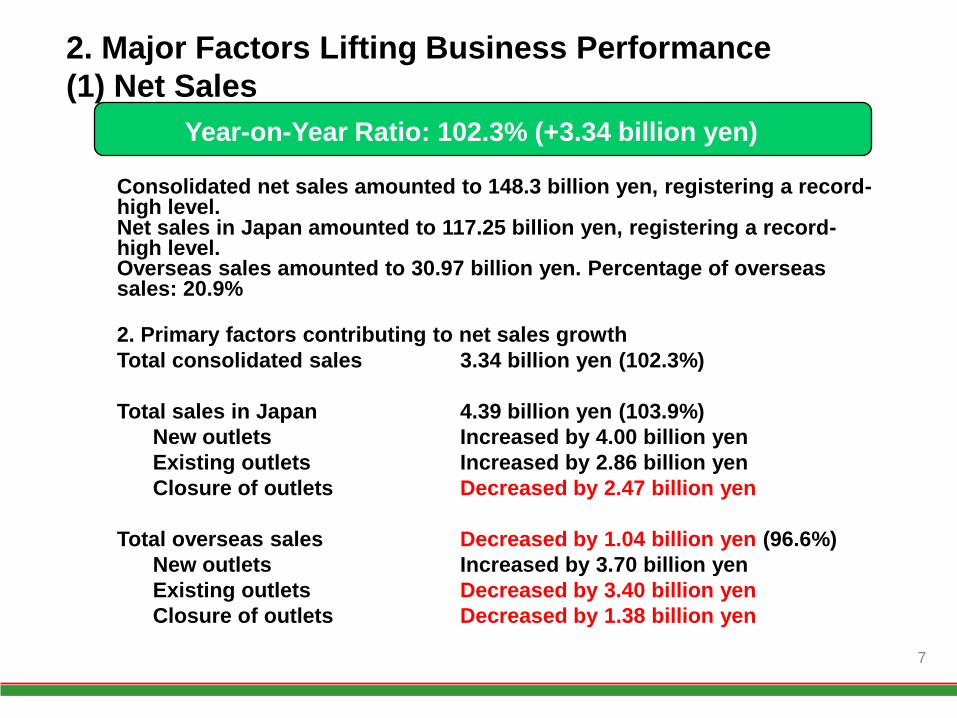
Year-on-Year Ratio: 102.3% (+3.34 billion yen)
Consolidated net sales amounted to 148.3 billion yen, registering a record-high level. Net sales in Japan amounted to 117.25 billion yen, registering a record-high level. Overseas sales amounted to 30.97 billion yen. Percentage of overseas sales: 20.9%
2. Primary factors contributing to net sales growth
Total consolidated sales 3.34 billion yen (102.3%)
Total sales in Japan 4.39 billion yen (103.9%)
New outlets Increased by 4.00 billion yen
Existing outlets Increased by 2.86 billion yen
Closure of outlets Decreased by 2.47 billion yen
Total overseas sales Decreased by 1.04 billion yen (96.6%)
New outlets Increased by 3.70 billion yen
Existing outlets Decreased by 3.40 billion yen
Closure of outlets Decreased by 1.38 billion yen

32.06 30.97
3.39 △3.3
△1.18
20.00
30.00
40.00
F.Y. Ending August 2016
Loss by Strong Yen
Sales Increase Effects of Tax Revision
F.Y. Ending August 2017
(billions of yen)
Breakdown of Sales Result Fluctuation in
Overseas Outlets
8
Decreased by 1.09 billion yen
90%
95%
100%
105%
110%
Net Sales No. of Customers Average Customer Spending
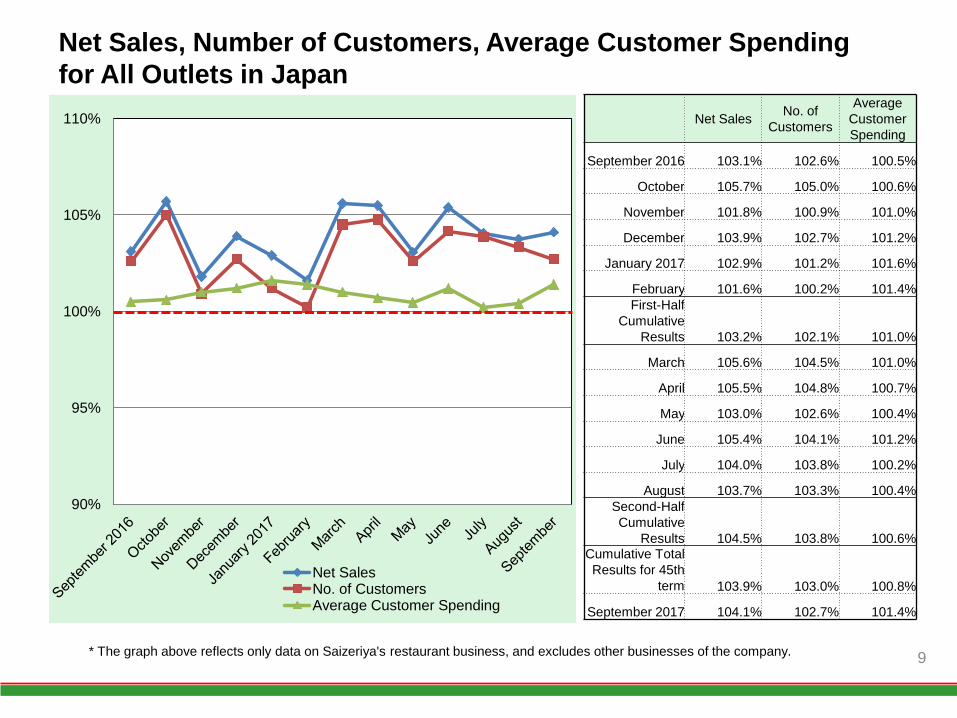
Net Sales, Number of Customers, Average Customer Spending
for All Outlets in Japan
* The graph above reflects only data on Saizeriya's restaurant business, and excludes other businesses of the company. 9
Net Sales No. of
Customers
Average
Customer
Spending
September 2016 103.1% 102.6% 100.5%
October 105.7% 105.0% 100.6%
November 101.8% 100.9% 101.0%
December 103.9% 102.7% 101.2%
January 2017 102.9% 101.2% 101.6%
February 101.6% 100.2% 101.4%
First-Half
Cumulative
Results 103.2% 102.1% 101.0%
March 105.6% 104.5% 101.0%
April 105.5% 104.8% 100.7%
May 103.0% 102.6% 100.4%
June 105.4% 104.1% 101.2%
July 104.0% 103.8% 100.2%
August 103.7% 103.3% 100.4%
Second-Half
Cumulative
Results 104.5% 103.8% 100.6% Cumulative Total
Results for 45th
term 103.9% 103.0% 100.8%
September 2017 104.1% 102.7% 101.4%
90%
95%
100%
105%
110%
Net Sales No. of Customers Average Customer Spending
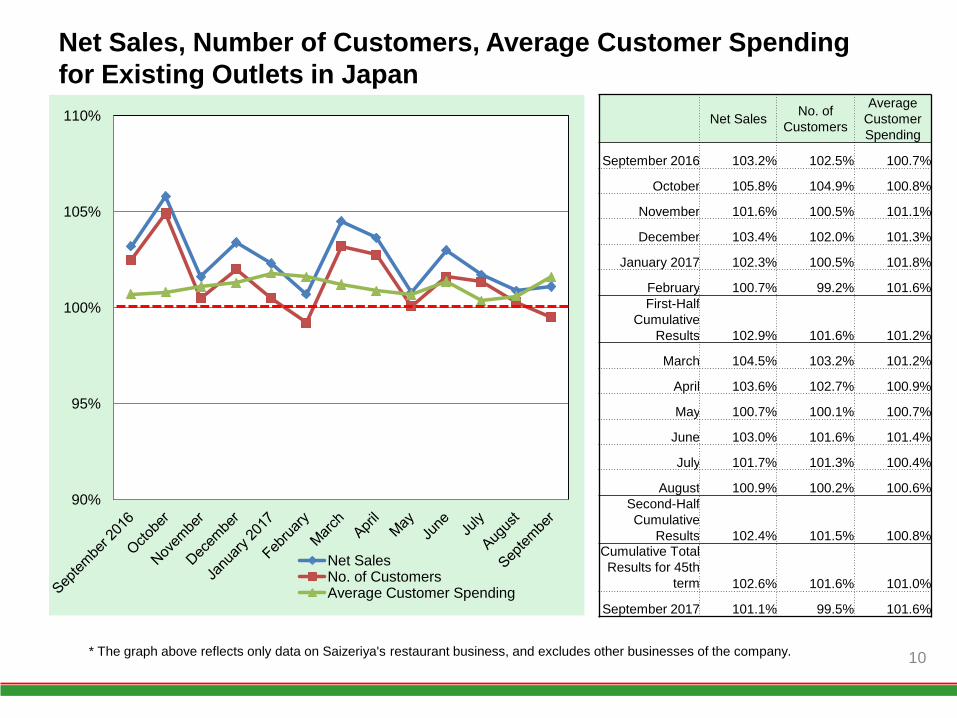
Net Sales, Number of Customers, Average Customer Spending
for Existing Outlets in Japan
* The graph above reflects only data on Saizeriya's restaurant business, and excludes other businesses of the company. 10
Net Sales No. of
Customers
Average
Customer
Spending
September 2016 103.2% 102.5% 100.7%
October 105.8% 104.9% 100.8%
November 101.6% 100.5% 101.1%
December 103.4% 102.0% 101.3%
January 2017 102.3% 100.5% 101.8%
February 100.7% 99.2% 101.6%
First-Half
Cumulative
Results 102.9% 101.6% 101.2%
March 104.5% 103.2% 101.2%
April 103.6% 102.7% 100.9%
May 100.7% 100.1% 100.7%
June 103.0% 101.6% 101.4%
July 101.7% 101.3% 100.4%
August 100.9% 100.2% 100.6%
Second-Half
Cumulative
Results 102.4% 101.5% 100.8% Cumulative Total
Results for 45th
term 102.6% 101.6% 101.0%
September 2017 101.1% 99.5% 101.6%
210.6
220.1 5.8
2.4 6.6
0.3
△3.4
△2.3
200.0
205.0
210.0
215.0
220.0
225.0
Number of Customers
for F.Y. Ending August 2016
New Outlet Openings in Japan
Existing Outlets
in Japan
Closure of Outlets
in Japan
New Outlet Openings Overseas
Existing Outlets
Overseas
Closure of Outlets
Overseas
Number of Customers for F.Y. Ending August 2017
(millions of people)
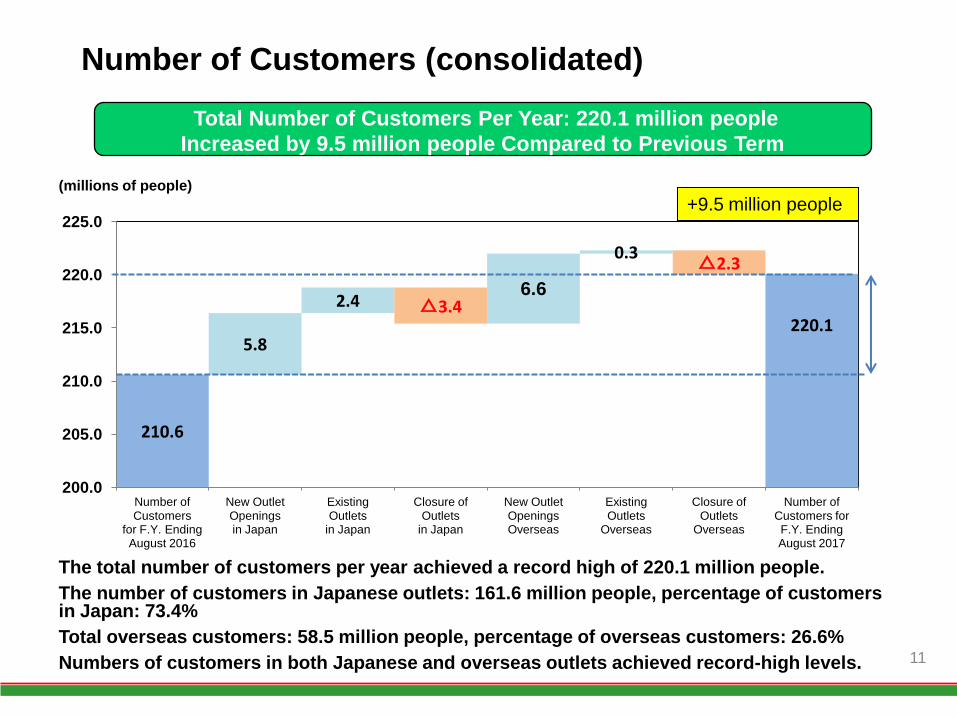
Number of Customers (consolidated)
11
Total Number of Customers Per Year: 220.1 million people
Increased by 9.5 million people Compared to Previous Term
The total number of customers per year achieved a record high of 220.1 million people.
The number of customers in Japanese outlets: 161.6 million people, percentage of customers in Japan: 73.4%
Total overseas customers: 58.5 million people, percentage of overseas customers: 26.6%
Numbers of customers in both Japanese and overseas outlets achieved record-high levels.
+9.5 million people
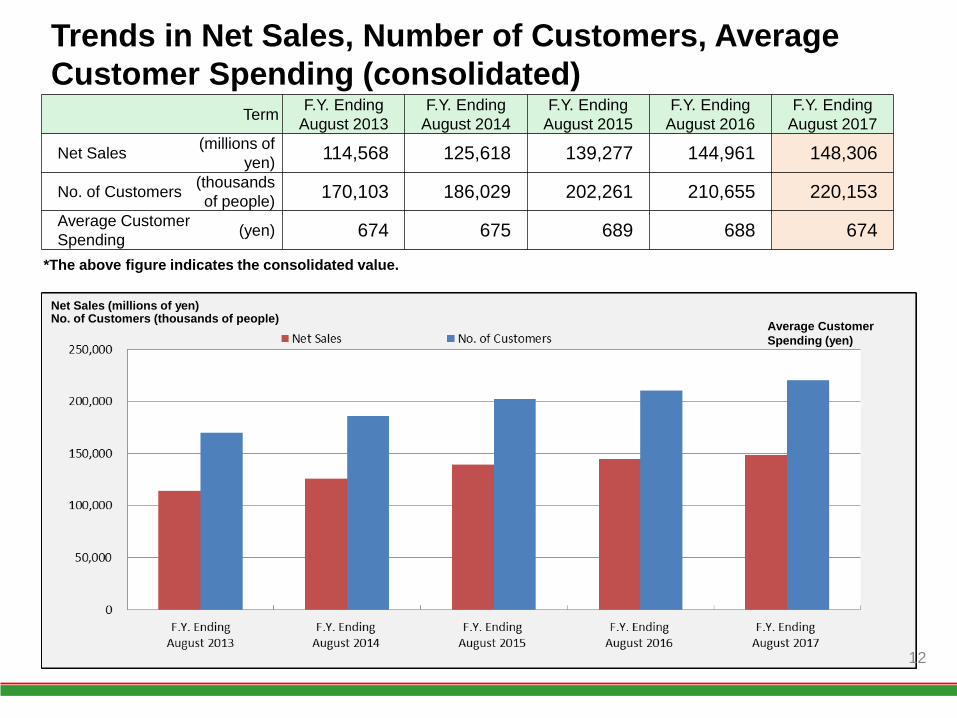
Trends in Net Sales, Number of Customers, Average
Customer Spending (consolidated)
*The above figure indicates the consolidated value.
12
Term F.Y. Ending
August 2013
F.Y. Ending
August 2014
F.Y. Ending
August 2015
F.Y. Ending
August 2016
F.Y. Ending
August 2017
Net Sales (millions of
yen) 114,568 125,618 139,277 144,961 148,306
No. of Customers (thousands
of people) 170,103 186,029 202,261 210,655 220,153
Average Customer
Spending (yen) 674 675 689 688 674
Net Sales (millions of yen)
No. of Customers (thousands of people)
Average Customer
Spending (yen)
700
705
710
715
720
725
730
0
50,000
100,000
150,000
200,000
F.Y. Ending August 2013 F.Y. Ending August 2014 F.Y. Ending August 2015 F.Y. Ending August 2016 F.Y. Ending August 2017
Net Sales No. of Customers Average Cusomer Spending
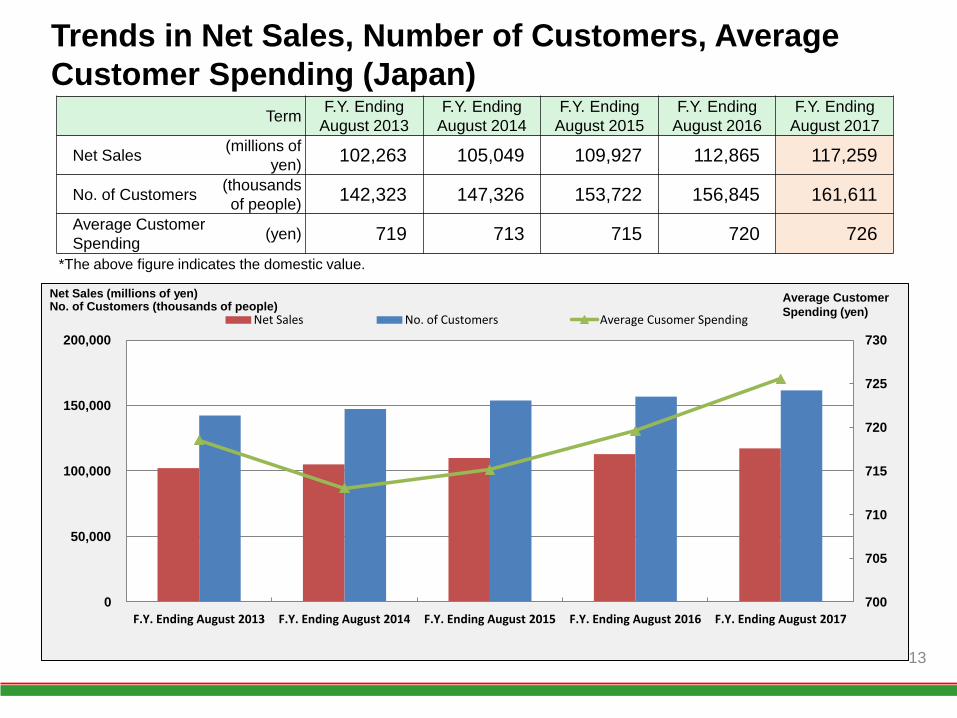
Trends in Net Sales, Number of Customers, Average
Customer Spending (Japan)
*The above figure indicates the domestic value.
13
Term F.Y. Ending
August 2013
F.Y. Ending
August 2014
F.Y. Ending
August 2015
F.Y. Ending
August 2016
F.Y. Ending
August 2017
Net Sales (millions of
yen) 102,263 105,049 109,927 112,865 117,259
No. of Customers (thousands
of people) 142,323 147,326 153,722 156,845 161,611
Average Customer
Spending (yen) 719 713 715 720 726
Net Sales (millions of yen) No. of Customers (thousands of people)
Average Customer
Spending (yen)
9.0
11.21 △0.82 0.28 0.49
△0.07 0.04
1.66
0.71 △0.08
7.00
8.00
9.00
10.00
11.00
12.00
Operating Income for F.Y. Ending August 2016
Costs in Japan
SG&A inJapan
Sales Growth in Japan
Overseas Costs
Overseas SG&A
Overseas Sales Growth
Australia Consolidation Adjustment
Operationg Income for F.Y Ending Autust 2017
(billions of yen)
2. Major Factors Lifting Business Performance
(2) Operating Income
14
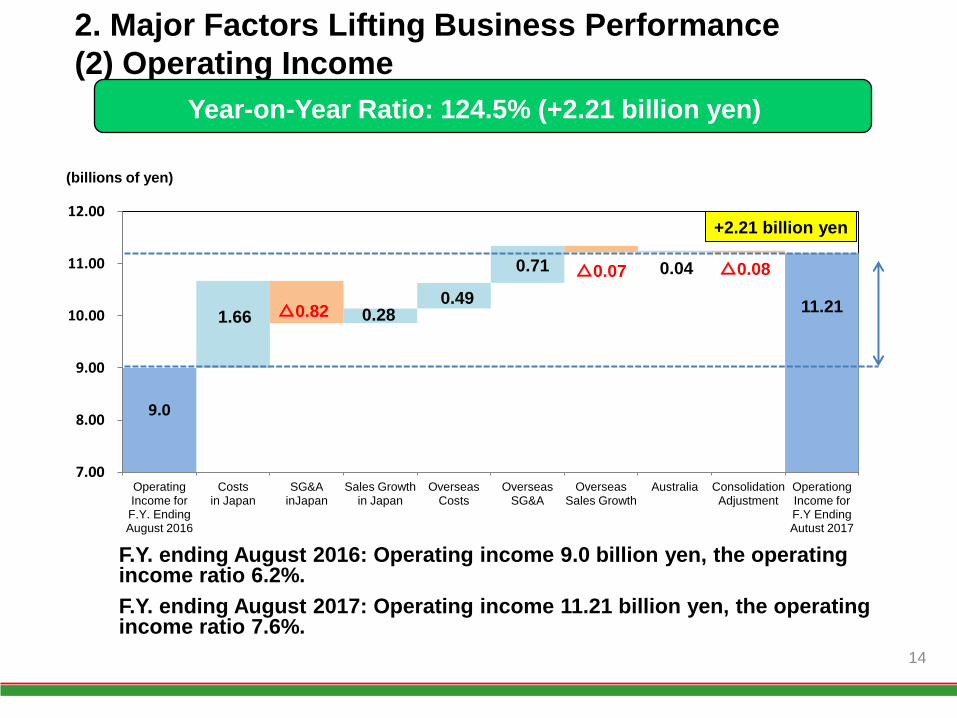
Year-on-Year Ratio: 124.5% (+2.21 billion yen)
F.Y. ending August 2016: Operating income 9.0 billion yen, the operating income ratio 6.2%.
F.Y. ending August 2017: Operating income 11.21 billion yen, the operating income ratio 7.6%.
+2.21 billion yen
15
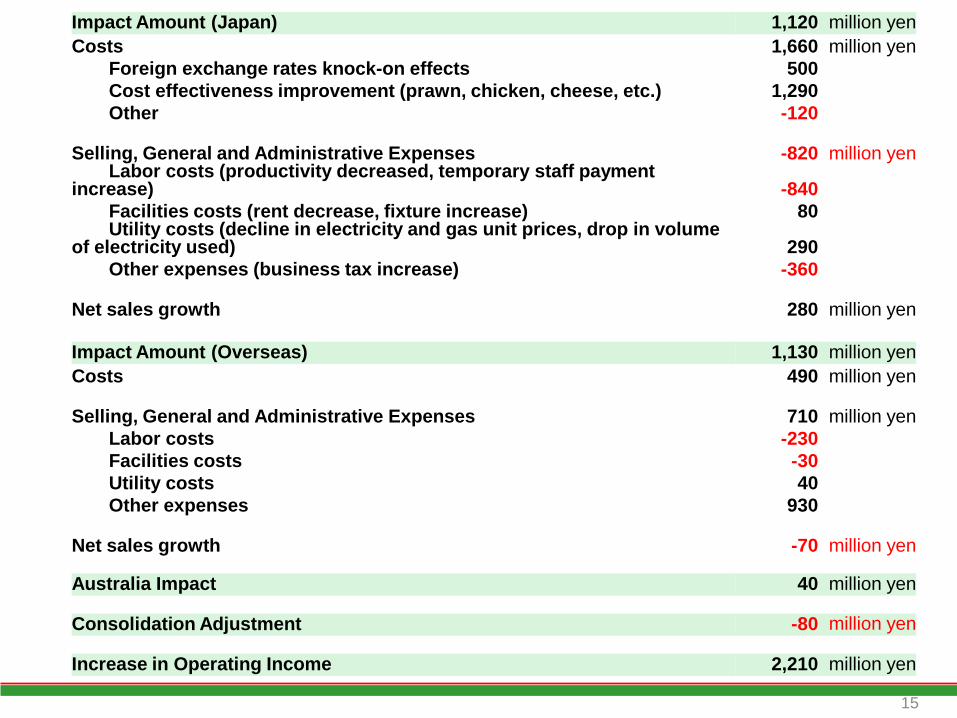
Impact Amount (Japan) 1,120 million yen
Costs 1,660 million yen
Foreign exchange rates knock-on effects 500
Cost effectiveness improvement (prawn, chicken, cheese, etc.) 1,290
Other -120
Selling, General and Administrative Expenses -820 million yen Labor costs (productivity decreased, temporary staff payment increase) -840
Facilities costs (rent decrease, fixture increase) 80 Utility costs (decline in electricity and gas unit prices, drop in volume of electricity used) 290
Other expenses (business tax increase) -360
Net sales growth 280 million yen
Impact Amount (Overseas) 1,130 million yen
Costs 490 million yen
Selling, General and Administrative Expenses 710 million yen
Labor costs -230
Facilities costs -30
Utility costs 40
Other expenses 930
Net sales growth -70 million yen
Australia Impact 40 million yen
Consolidation Adjustment -80 million yen
Increase in Operating Income 2,210 million yen
2.18
3.31
+[値]
+[値]
△[値]
1.00
1.50
2.00
2.50
3.00
3.50
4.00
F.Y. Ending August 2016
Loss by Strong Yen Sales Increase Effects of Tax Revision F.Y. Ending August 2017
(billions of yen)
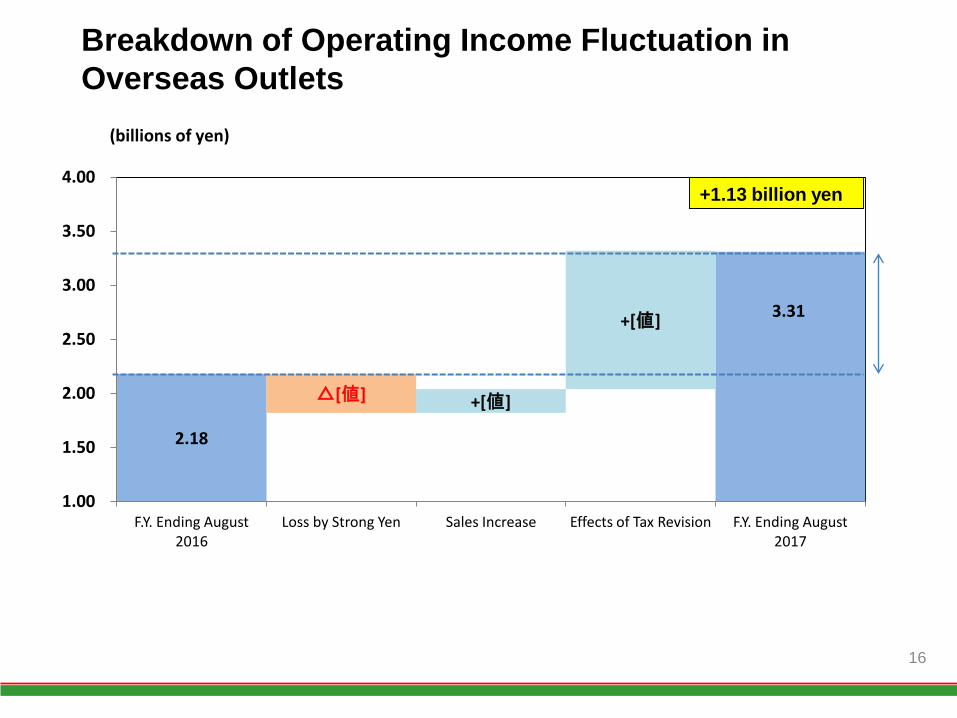
Breakdown of Operating Income Fluctuation in
Overseas Outlets
16
+1.13 billion yen
3. Trends in Major Financial Indicators (consolidated)
17
(円)
Classification F.Y. Ending
August 2013
F.Y. Ending
August 2014
F.Y. Ending
August 2015
F.Y. Ending
August 2016
F.Y. Ending
August 2017
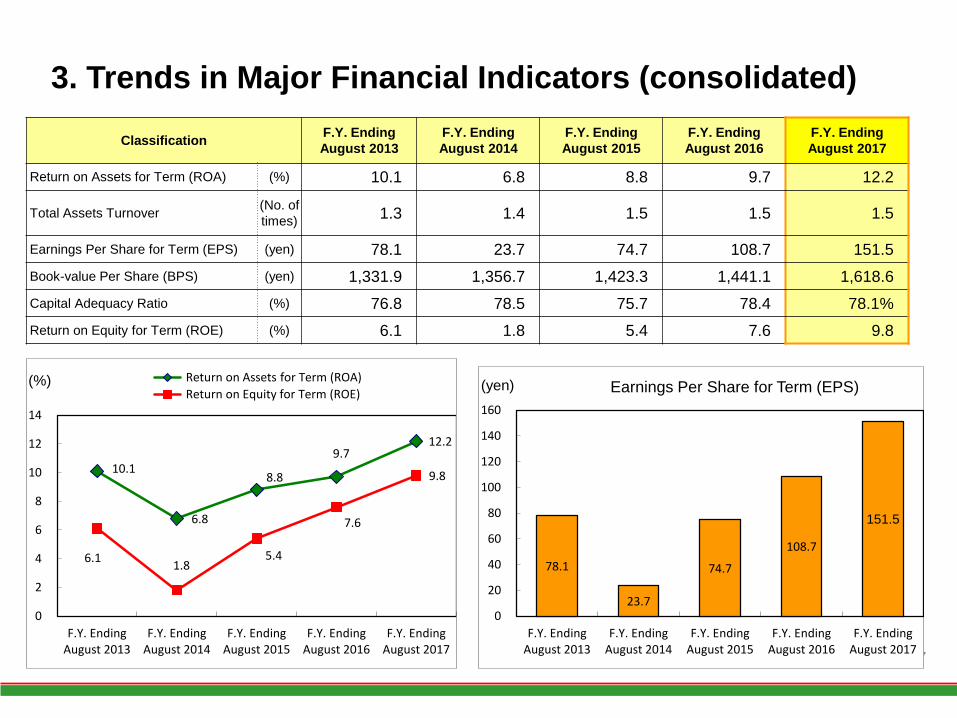
Return on Assets for Term (ROA) (%) 10.1 6.8 8.8 9.7 12.2
Total Assets Turnover (No. of
times) 1.3 1.4 1.5 1.5 1.5
Earnings Per Share for Term (EPS) (yen) 78.1 23.7 74.7 108.7 151.5
Book-value Per Share (BPS) (yen) 1,331.9 1,356.7 1,423.3 1,441.1 1,618.6
Capital Adequacy Ratio (%) 76.8 78.5 75.7 78.4 78.1%
Return on Equity for Term (ROE) (%) 6.1 1.8 5.4 7.6 9.8
10.1
6.8
8.8
9.7 12.2
6.1 1.8
5.4
7.6
9.8
0
2
4
6
8
10
12
14
F.Y. Ending August 2013
F.Y. Ending August 2014
F.Y. Ending August 2015
F.Y. Ending August 2016
F.Y. Ending August 2017
Return on Assets for Term (ROA)
Return on Equity for Term (ROE)
78.1
23.7
74.7
108.7
151.5
0
20
40
60
80
100
120
140
160
F.Y. Ending August 2013
F.Y. Ending August 2014
F.Y. Ending August 2015
F.Y. Ending August 2016
F.Y. Ending August 2017
Earnings Per Share for Term (EPS) (yen) (%)
0
10
20
30
40
50
60
70
80
90
900
950
1,000
1,050
1,100
F.Y. Ending August 2013
F.Y. Ending August 2014
F.Y. Ending August 2015
F.Y. Ending August 2016
F.Y. Ending August 2017
F.Y. Ending August 2018 (Projected)
No. of New Openings/Closures of Outlets and Outlets Outstanding
No. of Outlets Outstanding No. of New Outlet Openings No. of Closures of Outlets
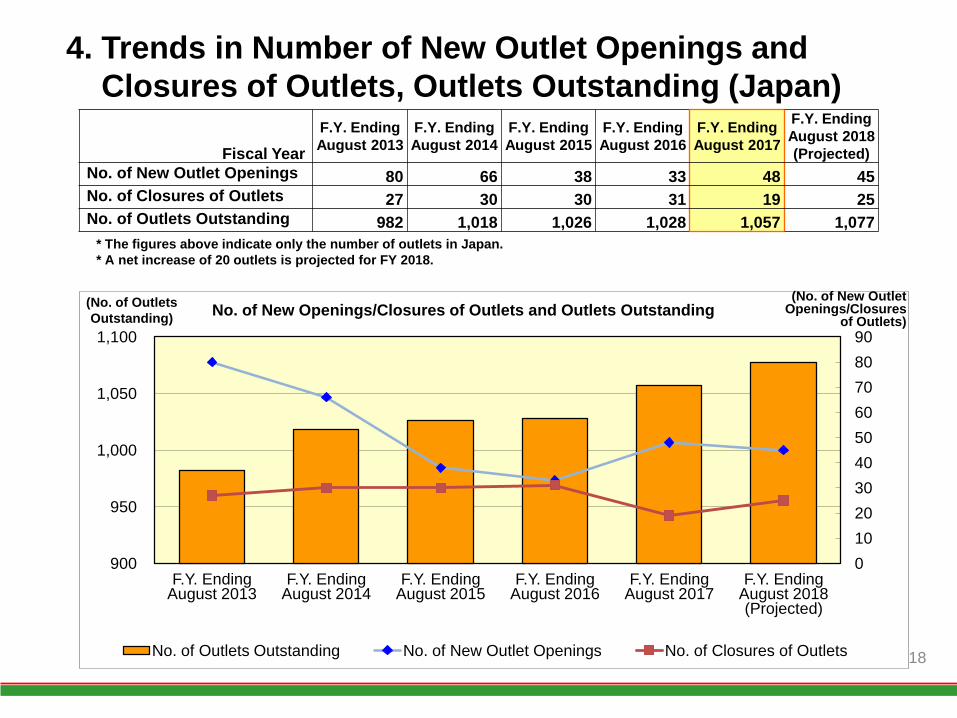
4. Trends in Number of New Outlet Openings and
Closures of Outlets, Outlets Outstanding (Japan)
* The figures above indicate only the number of outlets in Japan.
* A net increase of 20 outlets is projected for FY 2018.
Fiscal Year
F.Y. Ending
August 2013
F.Y. Ending
August 2014
F.Y. Ending
August 2015
F.Y. Ending
August 2016
F.Y. Ending
August 2017
F.Y. Ending
August 2018
(Projected)
No. of New Outlet Openings 80 66 38 33 48 45
No. of Closures of Outlets 27 30 30 31 19 25
No. of Outlets Outstanding 982 1,018 1,026 1,028 1,057 1,077
18
(No. of Outlets
Outstanding)
(No. of New Outlet Openings/Closures
of Outlets)
19
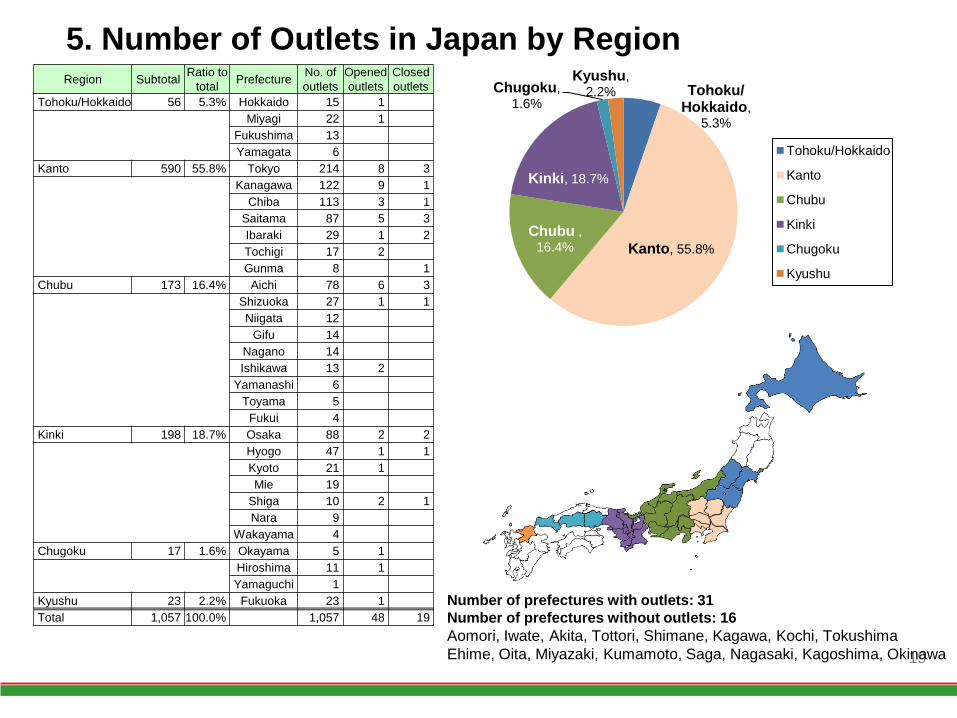
5. Number of Outlets in Japan by Region
Number of prefectures with outlets: 31
Number of prefectures without outlets: 16
Aomori, Iwate, Akita, Tottori, Shimane, Kagawa, Kochi, Tokushima
Ehime, Oita, Miyazaki, Kumamoto, Saga, Nagasaki, Kagoshima, Okinawa
Region Subtotal Ratio to
total Prefecture
No. of
outlets
Opened
outlets
Closed
outlets
Tohoku/Hokkaido 56 5.3% Hokkaido 15 1
Miyagi 22 1
Fukushima 13
Yamagata 6
Kanto 590 55.8% Tokyo 214 8 3
Kanagawa 122 9 1
Chiba 113 3 1
Saitama 87 5 3
Ibaraki 29 1 2
Tochigi 17 2
Gunma 8 1
Chubu 173 16.4% Aichi 78 6 3
Shizuoka 27 1 1
Niigata 12
Gifu 14
Nagano 14
Ishikawa 13 2
Yamanashi 6
Toyama 5
Fukui 4
Kinki 198 18.7% Osaka 88 2 2
Hyogo 47 1 1
Kyoto 21 1
Mie 19
Shiga 10 2 1
Nara 9
Wakayama 4
Chugoku 17 1.6% Okayama 5 1
Hiroshima 11 1
Yamaguchi 1
Kyushu 23 2.2% Fukuoka 23 1
Total 1,057 100.0% 1,057 48 19
Tohoku/ Hokkaido,
5.3%
Kanto, 55.8%
Chubu ,
16.4%
Kinki, 18.7%
Chugoku,
1.6%
Kyushu,
2.2%
Tohoku/Hokkaido
Kanto
Chubu
Kinki
Chugoku
Kyushu
0
20,000
40,000
60,000
80,000
100,000
120,000
F.Y. Ending
August 2013
F.Y. Ending
August 2014
F.Y. Ending
August 2015
F.Y. Ending
August 2016
F.Y. Ending
August 2017
F.Y. Ending
August 2018
(Projected)
Total Assets Amount Net Assets Amount
0
2,000
4,000
6,000
8,000
10,000
12,000
14,000
F.Y. Ending August 2013
F.Y. Ending August 2014
F.Y. Ending August 2015
F.Y. Ending August 2016
F.Y. Ending August 2017
F.Y. Ending August 2018 (Projected)
Operating Income Ordinary Income Net Income for This Year
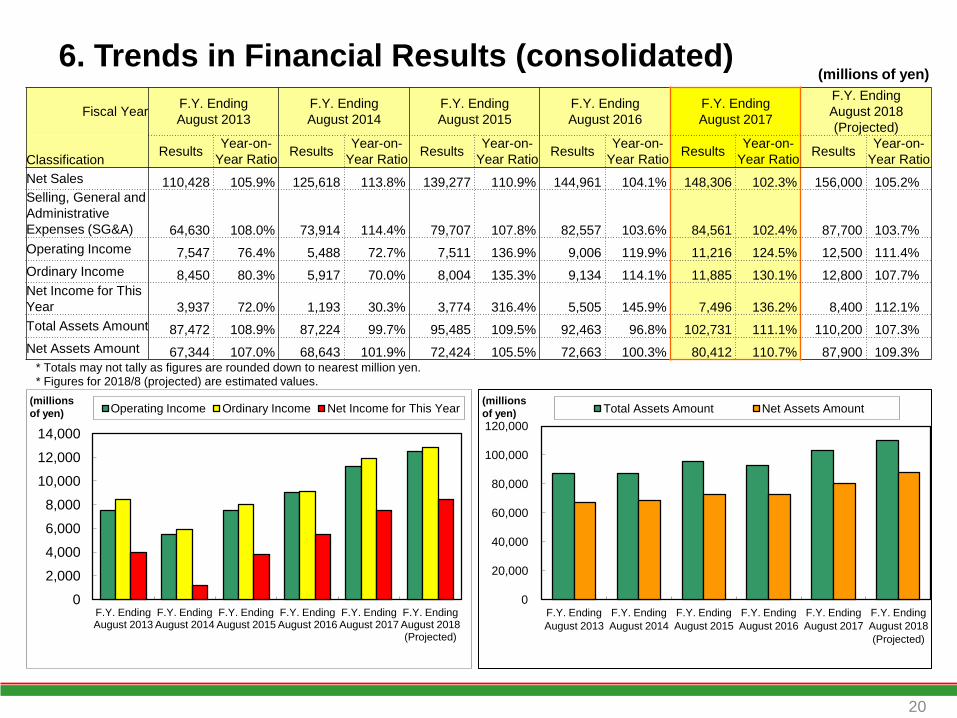
6. Trends in Financial Results (consolidated)
* Totals may not tally as figures are rounded down to nearest million yen. * Figures for 2018/8 (projected) are estimated values.
(millions of yen)
20
(millions
of yen)
(millions
of yen)
Fiscal Year F.Y. Ending
August 2013
F.Y. Ending
August 2014
F.Y. Ending
August 2015
F.Y. Ending
August 2016
F.Y. Ending
August 2017
F.Y. Ending
August 2018
(Projected)
Classification Results
Year-on-
Year Ratio Results
Year-on-
Year Ratio Results
Year-on-
Year Ratio Results
Year-on-
Year Ratio Results
Year-on-
Year Ratio Results
Year-on-
Year Ratio
Net Sales 110,428 105.9% 125,618 113.8% 139,277 110.9% 144,961 104.1% 148,306 102.3% 156,000 105.2% Selling, General and
Administrative
Expenses (SG&A) 64,630 108.0% 73,914 114.4% 79,707 107.8% 82,557 103.6% 84,561 102.4% 87,700 103.7%
Operating Income 7,547 76.4% 5,488 72.7% 7,511 136.9% 9,006 119.9% 11,216 124.5% 12,500 111.4%
Ordinary Income 8,450 80.3% 5,917 70.0% 8,004 135.3% 9,134 114.1% 11,885 130.1% 12,800 107.7% Net Income for This
Year 3,937 72.0% 1,193 30.3% 3,774 316.4% 5,505 145.9% 7,496 136.2% 8,400 112.1%
Total Assets Amount 87,472 108.9% 87,224 99.7% 95,485 109.5% 92,463 96.8% 102,731 111.1% 110,200 107.3%
Net Assets Amount 67,344 107.0% 68,643 101.9% 72,424 105.5% 72,663 100.3% 80,412 110.7% 87,900 109.3%
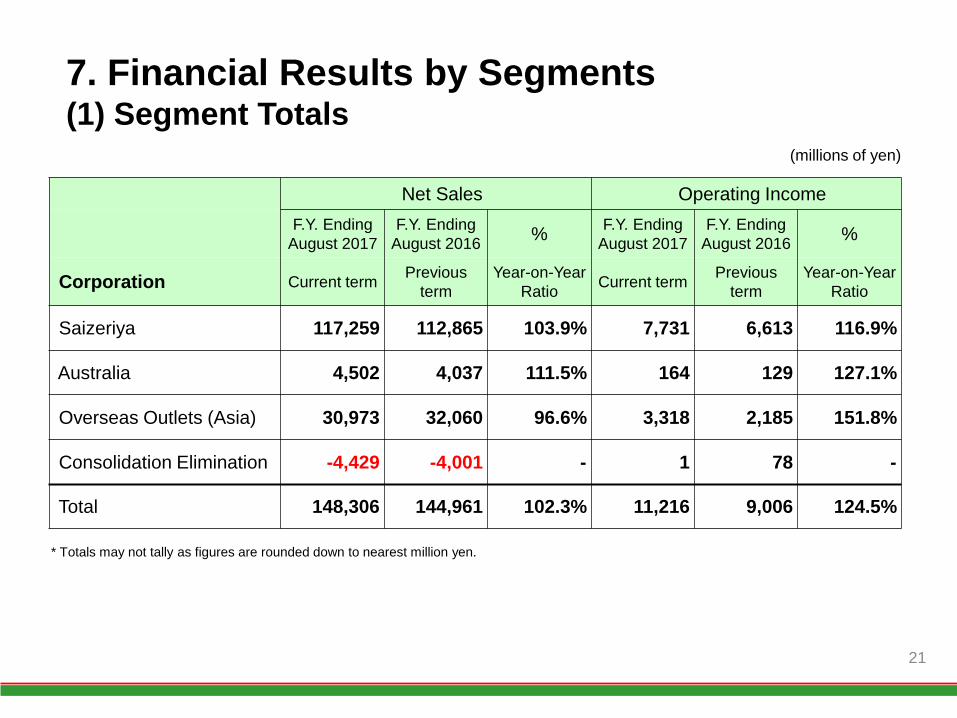
7. Financial Results by Segments (1) Segment Totals
(millions of yen)
* Totals may not tally as figures are rounded down to nearest million yen.
21
Net Sales Operating Income
F.Y. Ending
August 2017
F.Y. Ending
August 2016 %
F.Y. Ending
August 2017
F.Y. Ending
August 2016 %
Corporation Current term Previous
term
Year-on-Year
Ratio Current term
Previous
term
Year-on-Year
Ratio
Saizeriya 117,259 112,865 103.9% 7,731 6,613 116.9%
Australia 4,502 4,037 111.5% 164 129 127.1%
Overseas Outlets (Asia) 30,973 32,060 96.6% 3,318 2,185 151.8%
Consolidation Elimination -4,429 -4,001 - 1 78 -
Total 148,306 144,961 102.3% 11,216 9,006 124.5%
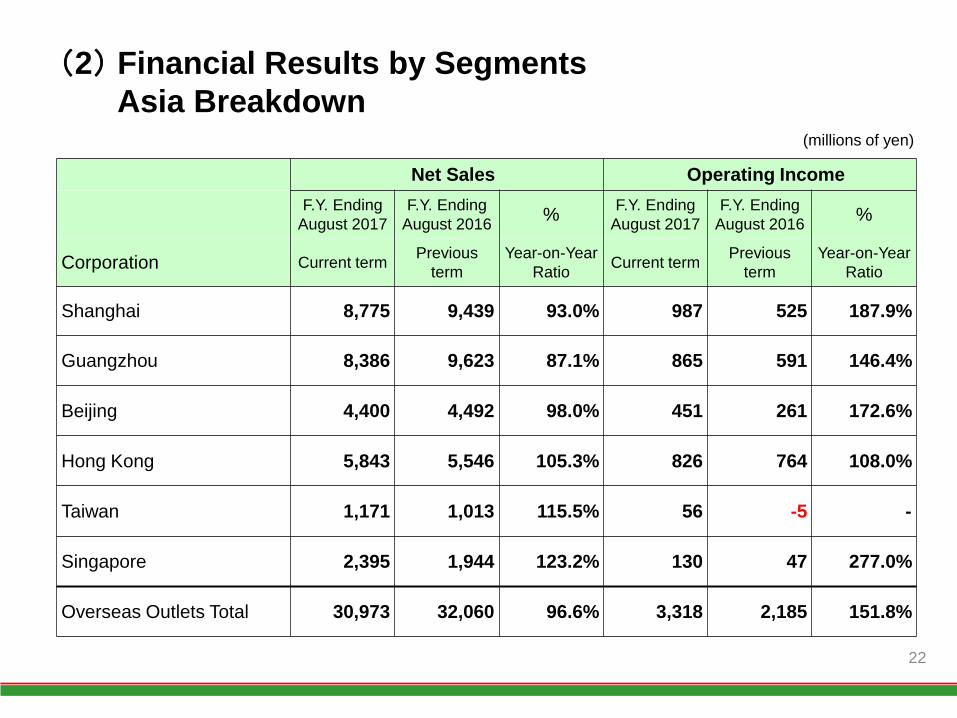
(2) Financial Results by Segments
(1)Asia Breakdown (millions of yen)
22
Net Sales Operating Income
F.Y. Ending
August 2017
F.Y. Ending
August 2016 %
F.Y. Ending
August 2017
F.Y. Ending
August 2016 %
Corporation Current term Previous
term
Year-on-Year
Ratio Current term
Previous
term
Year-on-Year
Ratio
Shanghai 8,775 9,439 93.0% 987 525 187.9%
Guangzhou 8,386 9,623 87.1% 865 591 146.4%
Beijing 4,400 4,492 98.0% 451 261 172.6%
Hong Kong 5,843 5,546 105.3% 826 764 108.0%
Taiwan 1,171 1,013 115.5% 56 -5 -
Singapore 2,395 1,944 123.2% 130 47 277.0%
Overseas Outlets Total 30,973 32,060 96.6% 3,318 2,185 151.8%
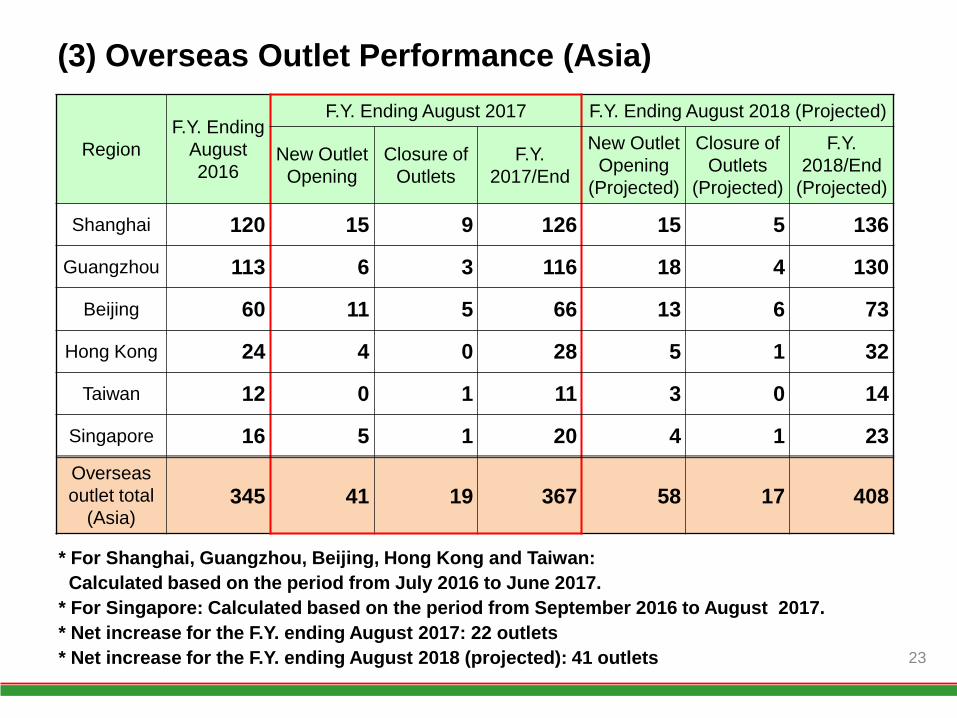
(3) Overseas Outlet Performance (Asia)
* For Shanghai, Guangzhou, Beijing, Hong Kong and Taiwan:
Calculated based on the period from July 2016 to June 2017.
* For Singapore: Calculated based on the period from September 2016 to August 2017.
* Net increase for the F.Y. ending August 2017: 22 outlets
* Net increase for the F.Y. ending August 2018 (projected): 41 outlets 23
Region
F.Y. Ending
August
2016
F.Y. Ending August 2017 F.Y. Ending August 2018 (Projected)
New Outlet
Opening
Closure of
Outlets
F.Y.
2017/End
New Outlet
Opening
(Projected)
Closure of
Outlets
(Projected)
F.Y.
2018/End
(Projected)
Shanghai 120 15 9 126 15 5 136
Guangzhou 113 6 3 116 18 4 130
Beijing 60 11 5 66 13 6 73
Hong Kong 24 4 0 28 5 1 32
Taiwan 12 0 1 11 3 0 14
Singapore 16 5 1 20 4 1 23
Overseas
outlet total
(Asia) 345 41 19 367 58 17 408
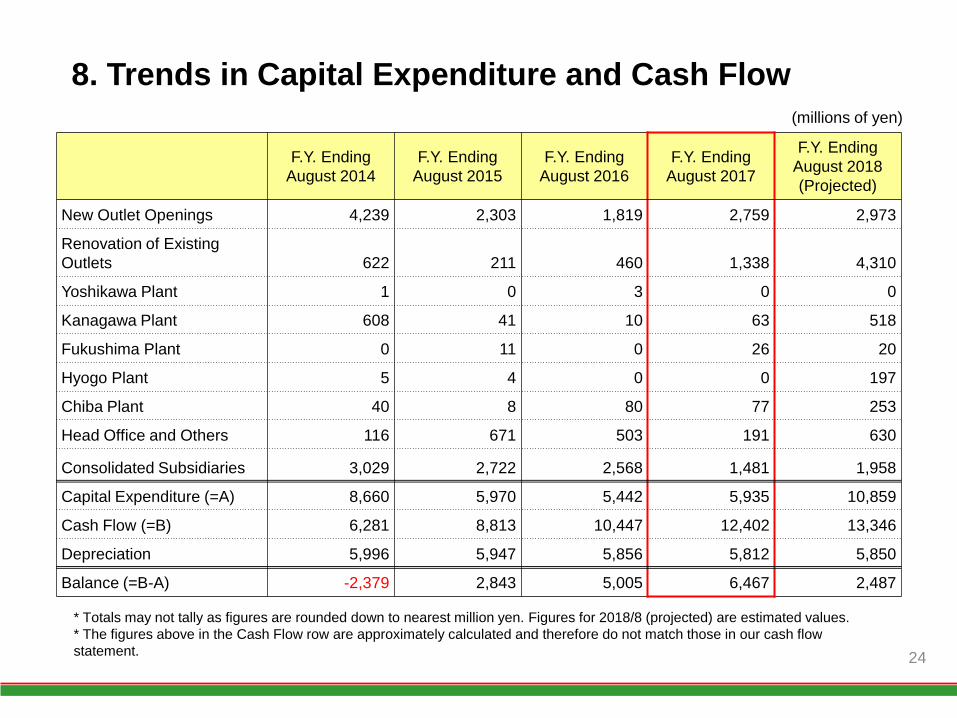
8. Trends in Capital Expenditure and Cash Flow
* Totals may not tally as figures are rounded down to nearest million yen. Figures for 2018/8 (projected) are estimated values.
* The figures above in the Cash Flow row are approximately calculated and therefore do not match those in our cash flow
statement.
(millions of yen)
24
F.Y. Ending
August 2014
F.Y. Ending
August 2015
F.Y. Ending
August 2016
F.Y. Ending
August 2017
F.Y. Ending
August 2018
(Projected)
New Outlet Openings 4,239 2,303 1,819 2,759 2,973
Renovation of Existing
Outlets 622 211 460 1,338 4,310
Yoshikawa Plant 1 0 3 0 0
Kanagawa Plant 608 41 10 63 518
Fukushima Plant 0 11 0 26 20
Hyogo Plant 5 4 0 0 197
Chiba Plant 40 8 80 77 253
Head Office and Others 116 671 503 191 630
Consolidated Subsidiaries 3,029 2,722 2,568 1,481 1,958
Capital Expenditure (=A) 8,660 5,970 5,442 5,935 10,859
Cash Flow (=B) 6,281 8,813 10,447 12,402 13,346
Depreciation 5,996 5,947 5,856 5,812 5,850
Balance (=B-A) -2,379 2,843 5,005 6,467 2,487
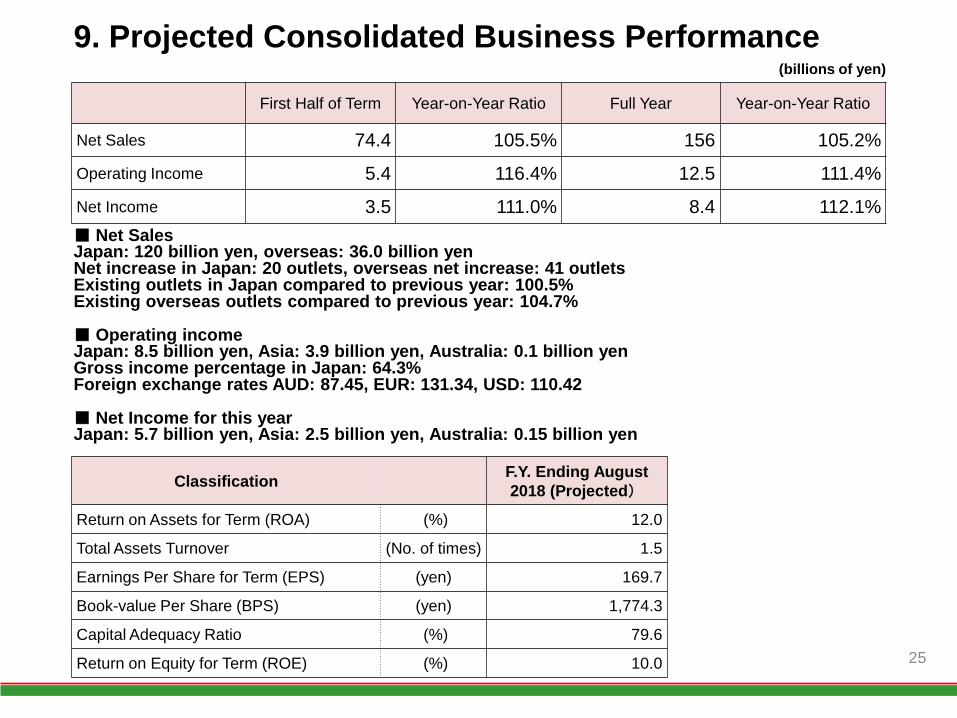
9. Projected Consolidated Business Performance
25
■ Net Sales Japan: 120 billion yen, overseas: 36.0 billion yen Net increase in Japan: 20 outlets, overseas net increase: 41 outlets Existing outlets in Japan compared to previous year: 100.5% Existing overseas outlets compared to previous year: 104.7% ■ Operating income Japan: 8.5 billion yen, Asia: 3.9 billion yen, Australia: 0.1 billion yen Gross income percentage in Japan: 64.3% Foreign exchange rates AUD: 87.45, EUR: 131.34, USD: 110.42 ■ Net Income for this year Japan: 5.7 billion yen, Asia: 2.5 billion yen, Australia: 0.15 billion yen
First Half of Term Year-on-Year Ratio Full Year Year-on-Year Ratio
Net Sales 74.4 105.5% 156 105.2%
Operating Income 5.4 116.4% 12.5 111.4%
Net Income 3.5 111.0% 8.4 112.1%
Classification F.Y. Ending August
2018 (Projected)
Return on Assets for Term (ROA) (%) 12.0
Total Assets Turnover (No. of times) 1.5
Earnings Per Share for Term (EPS) (yen) 169.7
Book-value Per Share (BPS) (yen) 1,774.3
Capital Adequacy Ratio (%) 79.6
Return on Equity for Term (ROE) (%) 10.0
(billions of yen)
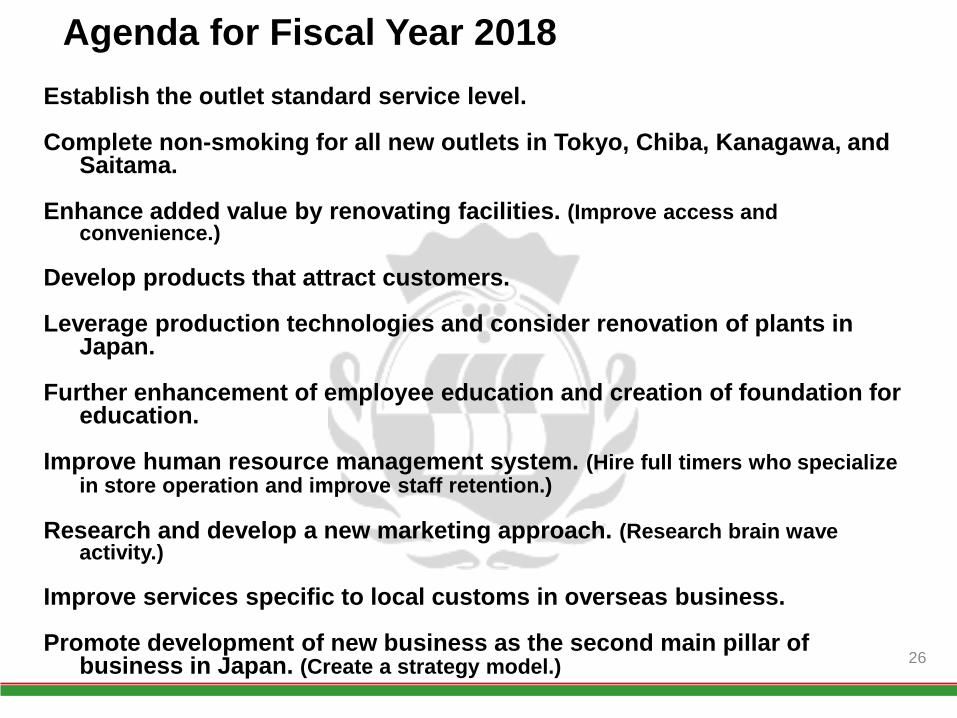
Agenda for Fiscal Year 2018
Establish the outlet standard service level. Complete non-smoking for all new outlets in Tokyo, Chiba, Kanagawa, and
Saitama. Enhance added value by renovating facilities. (Improve access and
convenience.) Develop products that attract customers. Leverage production technologies and consider renovation of plants in
Japan. Further enhancement of employee education and creation of foundation for
education. Improve human resource management system. (Hire full timers who specialize
in store operation and improve staff retention.) Research and develop a new marketing approach. (Research brain wave
activity.) Improve services specific to local customs in overseas business. Promote development of new business as the second main pillar of
business in Japan. (Create a strategy model.)
26

27
Thank you.
Related Documents


