1 Saint Louis Football Club Millennial Research Study Prepared for: Jeremy Alumbaugh General Manager Saint Louis FC Prepared by: Kristofer M. Klette SIUE Master of Marketing Research MKTG 550 August 8 th , 2014

Saint Louis Football Club - Millennial Research Study (SIUE MMR Program Capstone Project, August 2014)
Aug 09, 2015
Welcome message from author
This document is posted to help you gain knowledge. Please leave a comment to let me know what you think about it! Share it to your friends and learn new things together.
Transcript

1
Saint Louis Football Club Millennial Research Study
Prepared for:
Jeremy Alumbaugh General ManagerSaint Louis FC
Prepared by:
Kristofer M. KletteSIUE Master of Marketing ResearchMKTG 550August 8th, 2014

2
TABLE OF CONTENTS
TABLE OF CONTENTS
Executive Summary 3
Industry & Client Background 5
Management Decision Problem & Market Research Problem 7
Research Questions & Objectives 9
Methodology & Research Design 16
Recommendations 21
Key Findings 24
RQ 1. How do Millennials participate in live professional sporting events? 29
RQ 2. What do Millennials value when they attend a live professional soccer match? 37
RQ 3. What are the key determinant that affect whether Millennials will attend a Saint Louis FC match?
50
RQ 4. Are there distinct groups within the Millennial category and between other age categories? 66
RQ 5. What are Millennials’ views about companies supporting their favorite sports teams? 69
RQ 6. What sources of information do Millennials use to stay informed about their favorite sports teams?
72
Limitations 78
Appendix 80

3
EXECUTIVE SUMMARY

4
Executive Summary
• There is a very large interest among both Millennials and Non-Millennials in attending a live professional soccer match.
• While the majority of Millennials have seen a professional soccer game in the past 12 months, there is an even higher percentage of Millennials expressing a future intention to attend.
• Millennials are significantly more likely to attend a live professional sporting event with friends, compared to Non-Millennials.
• A larger percentage of Non-Millennials report attending with their family, compared to Millennials.
• Functional, “expected” components of the game-day experience are important to both Millennials and Non-Millennials compared to “complementary” components.
• Millennials express a greater interest in these complementary components to “enhance” the typical game-day experience.
• Millennials express a greater interest in public transportation to and from the game compared with Non-Millennials.
• Millennials and Non-Millennials are very similar regarding their preferences of proposed initiatives.
• A greater percentage of Millennials express an interest in the proposed “Pub-to-Pitch” initiative compared to Non-Millennials.
• The upgrade to chair back seating is a positive improvement: both age groups cited this as the most preferred proposed initiative.
• Both Millennials and Non-Millennials express actively follow sports on social media.
• The majority of both age categories report attending as many soccer games as possible.
• Those who are interested in attending a Saint Louis FC game do not necessarily play soccer on a regular basis themselves.
• A majority of Millennials and Non-Millennials express a positive sentiment toward and purchase intention for the products and services of companies sponsoring professional sports teams.
• These individuals expect the sponsoring companies to support the team in visible ways, as well as the local community itself.
• The vast majority of respondents regularly search for information about their favorite professionals sports teams at least 2-3 times a week; many respondents indicated that they search daily.
• Social media and dedicated online sports news websites constitute the most prominent sources of information about professional sports teams.

5
INDUSTRY & CLIENT BACKGROUND

6
Background
St. Louis, Missouri is currently home to three professional sports teams: the Cardinals (baseball), Rams (football) and Blues (hockey). Beginning in summer 2015, St. Louis will add a fourth professional sports team to its portfolio: Saint Louis Football Club (soccer).
Saint Louis Football Club (Saint Louis FC) will become the newest franchise member of the United Soccer Leagues Professional Division (USL Pro). USL Pro officially began in 2011 after the merger of the USL First Division and the USL Second Division, and currently operates as the Division III men’s professional soccer league within the United States’ official governing body, the United States Soccer Federation (USSF). USL Pro operates below Major League Soccer (MLS – Division I) and the North American Soccer League (NASL – Division II).
Saint Louis FC will be one of five teams added to the existing 14 teams operating in USL Pro. Saint Louis FC will operate under the management of Saint Louis Scott Gallagher (SLSG), a premier youth soccer training academy in the Saint Louis region. SLSG acquired a USL Pro franchise expansion, with the acquisition announced on May 5th, 2014.
Saint Louis FC will play its home games at SLSG’s own St. Louis Soccer Park located in Fenton, Missouri. The stadium currently has a capacity of about 5,000 seats. The team unveiled its official logo (selected via an online fan poll launched on the St. Louis FC website) on Monday, June 9th. Saint Louis FC also operates two social media channels on Twitter and on Facebook.
Industry Background Client Background

7
MANAGEMENT DECISION PROBLEM & MARKET RESEARCH PROBLEM

8
Management Decision Problem & Market Research Problem
How can Saint Louis FC increase general admittance ticket sales and season ticket sales to Millennials in the St. Louis region for the purpose of creating a solid fan base?
Saint Louis FC begins its inaugural season in summer 2015. Management wants to ensure that its inaugural season is a great success, especially in terms of maximizing game-day attendance. In order to optimize the return-on-investment for all marketing, communications, and investment strategies, Saint Louis FC management is especially interested in learning more about Millennials in the St. Louis region. Management believes that Millennials are integral to developing a stable fan base to support Saint Louis FC, both in terms of ticket sales for the inaugural season as well as for subsequent seasons in the long-term.
How can Saint Louis FC better understand Millennials in the St. Louis region who may be interested in attending Saint Louis FC games?
Learning about and assessing the characteristics, features, and preferences of Millennials in the St. Louis region will assist Saint Louis FC management in developing marketing and communications strategies prior to and during the team’s inaugural season in 2015. Additionally, the results of the research will help Saint Louis FC determine which investments in infrastructure developments and game-day accommodations (such as concessions selection, seating arrangements, entertainment and atmosphere, etc.) will be most appealing to their target market. Essential information also includes Millennials’ expectations and preferences related to the experience of a live professional sporting event. Answering this research question will provide Saint Louis FC management with a solid knowledge foundation for attracting and retaining Millennials with the intention of creating active, committed fans of the club.
Management Decision Problem Market Research Problem

9
RESEARCH QUESTIONS & OBJECTIVES

10
Research Questions & Objectives (RQ1)
Research Question 1 (RQ1) Research Objectives
How do Millennials participate in live professional sporting events?
It is important to assess St. Louis Millennials’ behaviors and habits regarding their attendance at professional sporting events to help provide a context as to whether they are likely to attend a Saint Louis FC match. By understanding whether Millennials in the St. Louis area are experienced with attending live professional sports events, Saint Louis FC management may be more informed about the expected number of Millennials that will attend matches, compared to other generational groups. By determining whether Millennials as a whole are low or high frequency sporting event attendees, Saint Louis FC will better understand how much of their marketing efforts should be allocated to reaching the St. Louis Millennial market. An overall assessment of past behavior, combined with future interest in attending a live professional soccer match, will provide a solid foundation to inform management of the potential role that St. Louis Millennials will play in Saint Louis FC’s fan base.
RO 1.1. Assess Millennials’ degree of interest in live professional sporting events.
RO 1.2. Assess the number of live professional sporting events Millennials have attended in the last 12 months.
RO 1.3. Determine Millennials’ degree of interest in attending a live professional soccer match.

11
Research Questions & Objectives (RQ2)
Research Question 2 (RQ2) Research Objectives
What do Millennials value when they attend live professional sporting events?
In order to develop an attractive atmosphere and an enjoyable experience, Saint Louis FC management must understand the importance of various features and characteristics relating to attending live professional sporting events. Expectations regarding pre-game events, game-time atmosphere, and post-game initiatives are important to understand for the purpose of developing an enjoyable game-day experience from beginning to end.
RO 2.1. Assess the relative importance of characteristics of live professional sporting events.
RO 2.2. Determine the type of atmosphere that Millennials expect from live professional sporting events.
RO 2.3. Determine the type of pre- and post- game initiatives Millennials want regarding live professional sporting events.RO 2.4. Determine Millennials’ expectations regarding their attendance during live professional sporting events.
12
Research Questions & Objectives (RQ3)
Research Question 3 (RQ3) Research Objectives
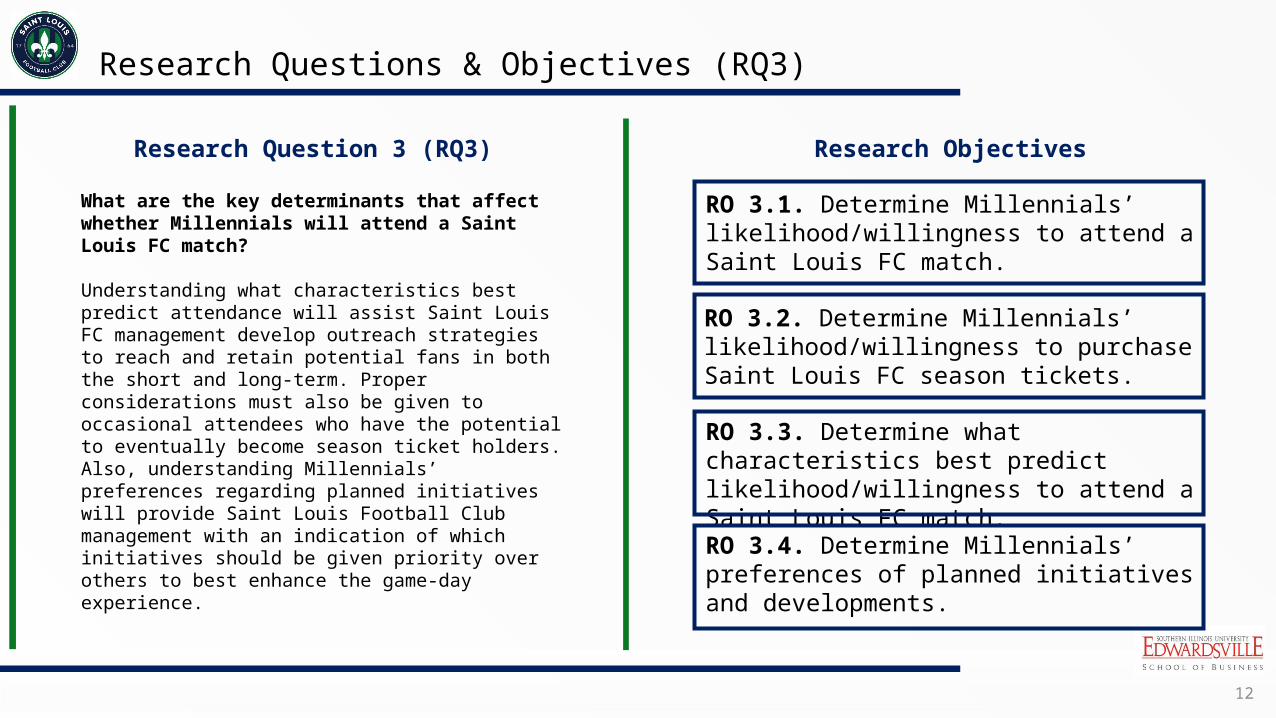
What are the key determinants that affect whether Millennials will attend a Saint Louis FC match?
Understanding what characteristics best predict attendance will assist Saint Louis FC management develop outreach strategies to reach and retain potential fans in both the short and long-term. Proper considerations must also be given to occasional attendees who have the potential to eventually become season ticket holders. Also, understanding Millennials’ preferences regarding planned initiatives will provide Saint Louis Football Club management with an indication of which initiatives should be given priority over others to best enhance the game-day experience.
RO 3.1. Determine Millennials’ likelihood/willingness to attend a Saint Louis FC match.
RO 3.2. Determine Millennials’ likelihood/willingness to purchase Saint Louis FC season tickets.
RO 3.3. Determine what characteristics best predict likelihood/willingness to attend a Saint Louis FC match.RO 3.4. Determine Millennials’ preferences of planned initiatives and developments.

13
Research Questions & Objectives (RQ4)
Research Question 4 (RQ4) Research Objectives
Are there distinct differences between the Millennial category and other age categories?
Assessing significant differences between the Millennial category and other, older age categories will help Saint Louis FC understand how best to cater specifically toward Millennials regarding the game-day experience, fan engagement initiatives, and other elements of its marketing strategy.
RO 4.1. Determine whether there are significant differences between the overall Millennial category and other age categories.

14
Research Questions & Objectives (RQ5)
Research Question 5 (RQ5) Research Objectives
What are Millennials’ views about companies supporting their favorite sports teams?
Corporate sponsors are important sources of revenue for any professional sports team: the financial support that sponsors provide is crucial for the current and future status of the team. In order to attract sponsors, Saint Louis FC management wants to gauge St. Louis Millennials’ purchasing behaviors related to and thoughts about sponsoring companies. Results about Millennials’ views, perspectives, and attitudes toward company sponsors may play a key role in attracting potential corporate sponsors to support Saint Louis FC.
RO 5.1. Determine Millennials’ willingness to purchase the products & services of sponsoring companies.
RO 5.2. Assess reasons why Millennials may be more or less willing to purchase the products & services of sponsoring companies.

15
Research Questions & Objectives (RQ6)
Research Question 6 (RQ6) Research Objectives
What sources of information do Millennials use to stay informed about their favorite sports teams?
Saint Louis FC must determine the most popular and effective communication channels by which to reach St. Louis Millennials who may be interested in attending a live professional soccer match. With this knowledge in hand, management can appropriately allocate marketing budget and time to developing informative content for channels (such as social media, online sports websites, etc.) that Millennials will actively seek out and use. Maintaining a consistent stream of useful information in relevant channels is crucial for appropriately reaching this target market and developing a strong fan base.
RO 6.1. Determine the most prevalent sources and channels that Millennials use to find information about their favorite sports teams
RO 6.2. Determine the frequency of which Millennials seek information about their favorite sports teams.
RO 6.3. Determine Millennials’ preferences of sources of information.

16
METHODOLOGY & RESEARCH DESIGN
17
Research Design
Exploratory Research Descriptive Research
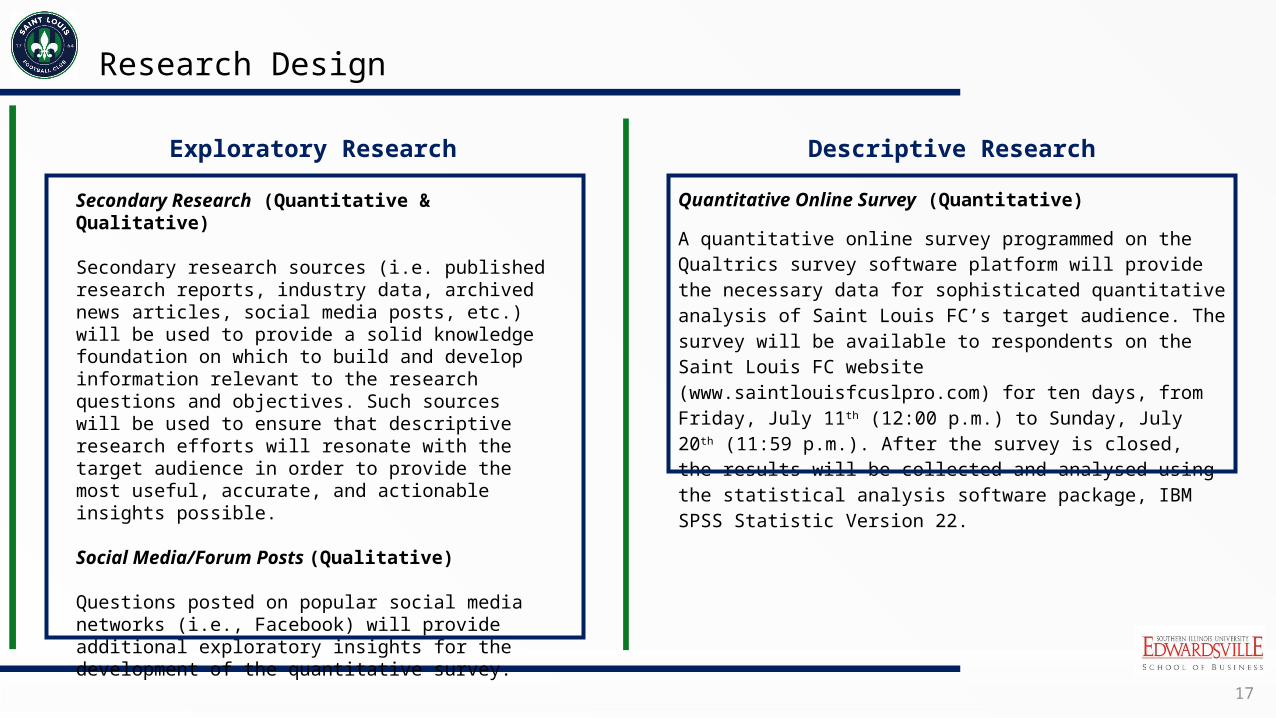
Secondary Research (Quantitative & Qualitative)
Secondary research sources (i.e. published research reports, industry data, archived news articles, social media posts, etc.) will be used to provide a solid knowledge foundation on which to build and develop information relevant to the research questions and objectives. Such sources will be used to ensure that descriptive research efforts will resonate with the target audience in order to provide the most useful, accurate, and actionable insights possible.
Social Media/Forum Posts (Qualitative)
Questions posted on popular social media networks (i.e., Facebook) will provide additional exploratory insights for the development of the quantitative survey.
Quantitative Online Survey (Quantitative)
A quantitative online survey programmed on the Qualtrics survey software platform will provide the necessary data for sophisticated quantitative analysis of Saint Louis FC’s target audience. The survey will be available to respondents on the Saint Louis FC website (www.saintlouisfcuslpro.com) for ten days, from Friday, July 11th (12:00 p.m.) to Sunday, July 20th (11:59 p.m.). After the survey is closed, the results will be collected and analysed using the statistical analysis software package, IBM SPSS Statistic Version 22.
18
Sampling
Sampling Design Sampling Frame
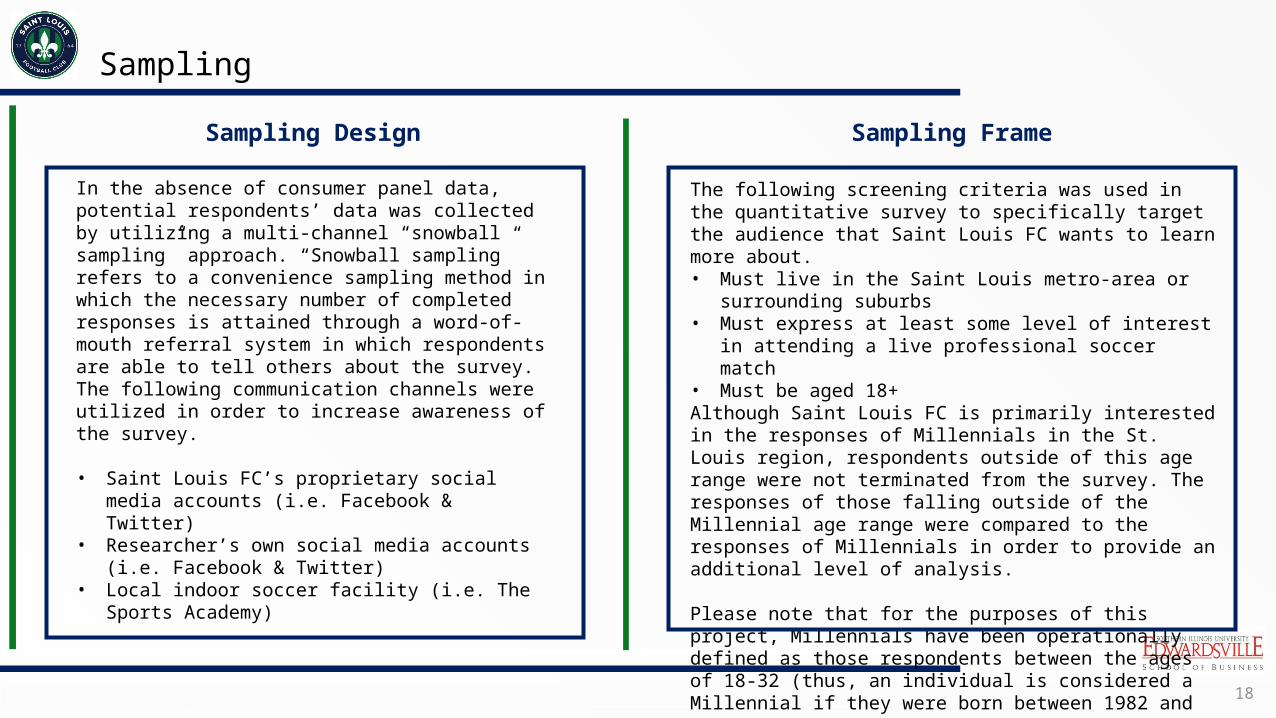
In the absence of consumer panel data, potential respondents’ data was collected by utilizing a multi-channel “snowball sampling” approach. “Snowball sampling” refers to a convenience sampling method in which the necessary number of completed responses is attained through a word-of-mouth referral system in which respondents are able to tell others about the survey. The following communication channels were utilized in order to increase awareness of the survey.
• Saint Louis FC’s proprietary social media accounts (i.e. Facebook & Twitter)
• Researcher’s own social media accounts (i.e. Facebook & Twitter)
• Local indoor soccer facility (i.e. The Sports Academy)
The following screening criteria was used in the quantitative survey to specifically target the audience that Saint Louis FC wants to learn more about.• Must live in the Saint Louis metro-area or
surrounding suburbs• Must express at least some level of interest in
attending a live professional soccer match• Must be aged 18+Although Saint Louis FC is primarily interested in the responses of Millennials in the St. Louis region, respondents outside of this age range were not terminated from the survey. The responses of those falling outside of the Millennial age range were compared to the responses of Millennials in order to provide an additional level of analysis.
Please note that for the purposes of this project, Millennials have been operationally defined as those respondents between the ages of 18-32 (thus, an individual is considered a Millennial if they were born between 1982 and 1996).

19
Sampling (Cont.)
Sampling Design (Cont.)
• In order to increase awareness of the survey to drive the number of survey responses, Saint Louis FC utilized its proprietary social media accounts.
• One particular Tweet was re-tweeted by the official Twitter account for USL PRO, which currently has over 11K followers.
Facebook Twitter USL PRO Re-tweet

20
Analysis
• The statistical analysis software IBM SPSS Statistics Version 22 was used to analyze the survey data. The following statistical tests and techniques were used to provide insights about survey results.
Independent Samples T-test: Used to compare and assess statistically significant differences between Millennials and Non-Millennials on various survey questions.
Cross tabulations: Used to compare and assess statistically significant differences between Millennials and Non-Millennials on various survey questions.
Multi-Dimensional Scaling (MDS): Used to graphically represent preference rankings on various Saint Louis FC-proposed initiatives and developments for both Millennials and Non-Millennials.
Factor Analysis: Used to compile and aggregate selected importance ratings for Pre-game, In-game, and Post-game characteristics into discernable groups.
Frequencies & Descriptive Statistics: Used to translate survey results into percentage incidences for Millennials and Non-Millennials on various survey questions.

21
RECOMMENDATIONS
22
Recommendations
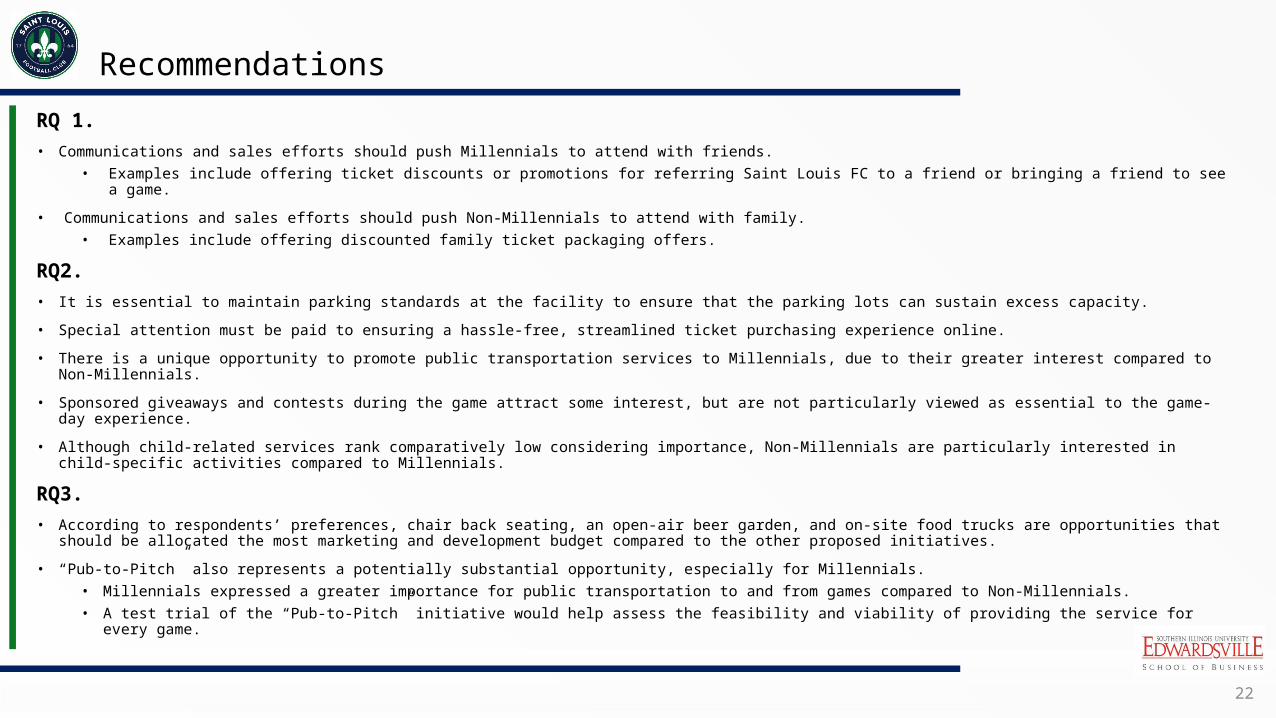
RQ 1.• Communications and sales efforts should push Millennials to attend with friends.
• Examples include offering ticket discounts or promotions for referring Saint Louis FC to a friend or bringing a friend to see a game.
• Communications and sales efforts should push Non-Millennials to attend with family.
• Examples include offering discounted family ticket packaging offers.
RQ2.• It is essential to maintain parking standards at the facility to ensure that the parking lots can sustain excess capacity.
• Special attention must be paid to ensuring a hassle-free, streamlined ticket purchasing experience online.
• There is a unique opportunity to promote public transportation services to Millennials, due to their greater interest compared to Non-Millennials.
• Sponsored giveaways and contests during the game attract some interest, but are not particularly viewed as essential to the game-day experience.
• Although child-related services rank comparatively low considering importance, Non-Millennials are particularly interested in child-specific activities compared to Millennials.
RQ3. • According to respondents’ preferences, chair back seating, an open-air beer garden, and on-site food trucks are opportunities that should be
allocated the most marketing and development budget compared to the other proposed initiatives.
• “Pub-to-Pitch” also represents a potentially substantial opportunity, especially for Millennials.
• Millennials expressed a greater importance for public transportation to and from games compared to Non-Millennials.
• A test trial of the “Pub-to-Pitch” initiative would help assess the feasibility and viability of providing the service for every game.

23
Recommendations (Cont.)
RQ4. • Communications and sales promotions must look outside of only soccer-related facilities in the St. Louis region, based on the fact that a
substantial amount of individuals who are interested in seeing a live professional soccer game do not play soccer on a regular basis.
• Youth soccer programs may represent a lucrative sales opportunity, due to the data that supports that Non-Millennials are likely to attend professional sports events with their family.
• Maintaining an active social media presence is critical to keeping Saint Louis FC top-of-mind among other professional sports teams, particularly in the St. Louis region.
RQ5.• Although respondents were generally positive toward sponsoring companies, these sponsors must demonstrate the results of their
sponsorship.
• This may include emphasizing their financial outcomes from the team’s perspective or clearly displaying their logo on team equipment.
• Sponsoring companies should show how they are supporting the local community (including the local community soccer) as well as the team itself.
RQ6.• Communications efforts, including social media, must leverage the fact that both Millennials and Non-Millennials actively seek information
about their favorite teams on a near-daily basis.
• While Saint Louis FC has established social media accounts, it must continue to deliver timely content to keep fans informed on a near-daily basis.
• Saint Louis FC may want to establish media contacts with local soccer journalists and bloggers to supplement the information distributed via proprietary social media outlets and the team website.

24
KEY FINDINGS

25
Respondent & Scale/Table Definitions
• The following information provides a guide for interpreting the survey results.
Millennial vs. Non-Millennial Categories• A “Millennial” is defined as an individual
between the ages of 18 and 32.• A “Non-Millennial” is defined as an individual
aged 33+.
3-Way Millennial Categories• A “Younger Millennial” is defined as an individual
between the ages of 18 and 25.• An “Older Millennial” is defined as an individual
between the ages of 26 and 32.• A “Non-Millennial” is defined as an individual
aged 33+.
Respondent Definitions Scale/Table Definitions
Tables with “Average Score”• Respondents were asked to rate their likelihood,
agreement, interest, or importance on a 7-point scale.
• The “Average Score” is the mean value of selected survey respondents using the 7-point scale, with “1” as the minimum value and “7” as the maximum value.
Top-2 Box Scores• Tables that report a Top-2 Box Score indicate the
percentage of selected respondents who answered a question with a “6” or “7” on a 7-point scale.

26
RESPONDENT DEMOGRAPHICS

27
Respondent Demographics
Male88.4%
Female11.6%
Millennial(n=189)
GenderMarital Status
Employment StatusRace/Ethnicity
Male80.1%
Female19.9%
Non-Millennial(n=166)
• The Non-Millennial group had a significantly (p<0.05) greater percentage of female respondents compared to the Millennial group.
0.0%40.0%80.0% 63.0%
37.0%0.0%7.2%
81.3%
11.4%
A) Millennial (n=189) B) Non-Millennial (n=166)
• The Millennial group had a significantly (p<0.05) greater percentage of single respondents compared to the Non-Millennial group.
A red letter denotes that a given percentage is significantly less than another given percentage. A green letter denotes that a given percentage is significantly greater than another given percentage. A capital letter denotes a significant difference at p<0.05. A lowercase letter denotes a significant difference at p<0.10.
A
B
B
A
AB
Caucasian/White88.9%
Other11.1%
Millennial(n=189)
Caucasian/White96.4%
Other3.6%
Non-Millennial(n=166)
• The Non-Millennial group had a significantly (p<0.05) greater percentage of respondents who identified as Caucasian/White compared to the Millennial group.
0.0%40.0%80.0% 70.4%
19.6% 10.1%
84.3%
4.8% 10.8%
A) Millennial (n=189) B) Non-Millennial (n=166)
AB
AB
• Nearly all (at least 89%) of both the Millennial and Non-Millennial groups reported being employed at least part-time.
Q25. What is your gender?Q26. What is your current marital status?
Q28. What is your current employment status?Q30. Which of the following best represents your race or ethnic background?

28
Respondent Demographics (Cont.)
Household Income
Education
Under $25,000 $25,000-$34,999
$35,000-$44,999
$45,000-$59,999
$60,000-$74,999
$75,000-$99,999
$100,000 or more
0.0%10.0%20.0%30.0%40.0%50.0%
21.2%
10.6% 14.3% 16.4%9.5% 13.2% 14.8%
3.0% 3.6% 7.2%12.7% 12.7%
18.1%
42.8%
A) Millennial (n=189) B) Non-Millennial (n=166)
• The Non-Millennial group overall reported a higher household income compared to the Millennial group.
A red letter denotes that a given percentage is significantly less than another given percentage. A green letter denotes that a given percentage is significantly greater than another given percentage. A capital letter denotes a significant difference at p<0.05. A lowercase letter denotes a significant difference at p<0.10.
B
BA
A
B
A
• Education levels between the two groups were overall very similar.
• There was a significantly (p<0.05) greater percentage of the Non-Millennial group reporting having earned a Professional or Doctorate degree.
High school diploma
Some college Associate degree Bachelor's degree
Master's degree Professional or Doctorate degree
0.0%10.0%20.0%30.0%40.0%50.0%
3.7%
20.1%10.1%
46.0%
16.4%
3.7%3.6%
18.1%12.0%
44.6%
12.0% 9.6%
A) Millennial (n=189) B) Non-Millennial (n=166)
AA
B B
Q29. What is your approximate annual household income?Q31. What is the last year of schooling you completed?

29
RQ1. How do Millennials participate in live professional sporting events?

30
RO 1.1: Degree of Interest in Live Professional Sporting Events
• Both Millennials and Non-Millennials frequently attend sporting events with at least one other person.• Millennials are significantly more likely to attend live professional sports events with friends compared to Non-Millennials.• Non-Millennials are significantly more likely to attend such an event with a group or organizations. This may have implications for
recruiting Millennials into any supporter groups for Saint Louis FC, including the Saint Louligans.• Nearly one-third (30.7%) of Millennials report attending sporting events with co-workers or colleagues.
Q5. When you attend a live professional sports event, which of the following groups of people do you usually attend the event with?
Friends Family members Co-workers/colleagues By yourself Groups/organizations Other0.0%
10.0%20.0%30.0%40.0%50.0%60.0%70.0%80.0%90.0%
100.0% 91.5%82.0%
30.7%
12.2% 9.0%0.5%
74.7%
86.7%
27.1%
13.9% 15.7%
0.0%
Who do you usually attend a live professional sports event with?Millennials Vs. Non-Millennials
A) Millennials (n=189) B) Non-Millennials (n=166)
A
A red letter denotes that a given percentage is significantly less than another given percentage. A green letter denotes that a given percentage is significantly greater than another given percentage. A capital letter denotes a significant difference at p<0.05. A lowercase letter denotes a significant difference at p<0.10.
a
B
b

31
RO 1.1: Degree of Interest in Live Professional Sporting Events
• Across all age categories, friends and family represent the people that respondents most often attend live professional sporting events with.• Overall, attendance at such an event may be considered a social function, with less than one-fourth of any age category
indicating that they usually attend sports events alone.• Younger and Older Millennials are more likely to attend live professional sports events with friends, compared to Non-Millennials.
• Non-Millennials are significantly less likely than Younger Millennials to attend with friends.
Q5. When you attend a live professional sports event, which of the following groups of people do you usually attend the event with?
Friends Family members Co-workers/colleagues By yourself Groups/organizations Other0.0%
10.0%20.0%30.0%40.0%50.0%60.0%70.0%80.0%90.0%
100.0% 94.1%
78.8%
22.4%
10.6% 7.1%1.2%
89.4%84.6%
37.5%
13.5% 10.6%
0.0%
74.7%
86.7%
27.1%
13.9% 15.7%
0.0%
Who do you usually attend a live professional sports event with?3-Way Age Categories
A) Younger Millennials (n=85) B) Older Millennials (n=104) C) Non-Millennials (n=166)
A
A red letter denotes that a given percentage is significantly less than another given percentage. A green letter denotes that a given percentage is significantly greater than another given percentage. A capital letter denotes a significant difference at p<0.05. A lowercase letter denotes a significant difference at p<0.10.
bc
ac
C

32
RO 1.1: Degree of Interest in Live Professional Sporting Events
• Both Millennial and Non-Millennial interest in attending a live professional soccer game is higher compared to other sports offered in St. Louis.
• Nearly all (at least 92.6%) of survey respondents expressed a high interest in attending a live professional soccer game.• Although the average interest in attending a live professional soccer game is very high compared to the other sports, there is no
significant difference between the scores reported for Millennials and Non-Millennials.
Soccer Hockey Baseball Football0
1
2
3
4
5
6
7 6.74
5.765.14
4.44
6.77
5.08 5.01
3.96
Interest in Attending Live Professional Sports Event (Average Score)
Millennials Vs. Non-Millennials
A) Millennials (n=189) B) Non-Millennials (n=166)
A
A red letter denotes that a given percentage/score is significantly less than another given percentage/score. A green letter denotes that a given percentage/score is significantly greater than another given percentage/score. A capital letter denotes a significant difference at p<0.05. A lowercase letter denotes a significant difference at p<0.10.
B
Q6. How interested are you in attending a live professional sporting event for each of the following sports?
BA
Top 2-Box ScoresA) Millennials
(n=189)B) Non-
Millennials (n=166)
Soccer 92.6% 95.2%
Hockey 65.6%B 50.0%A
Baseball 38.6%B 23.5%A
Football 48.1% 48.2%

33
Soccer Hockey Baseball Football1
2
3
4
5
6
76.88
5.85
5.084.47
6.62
5.685.18
4.42
6.77
5.08 5.01
3.96
Interest in Attending Live Professional Sports Events(Average Score)
3-Way Age Categories
A) Younger Millennials (n=85) B) Older Millennials (n=104) C) Non-Millennials (n=166)
RO 1.1: Degree of Interest in Live Professional Sporting Events
• Respondents expressed the greatest interest in attending a live professional soccer game, compared to the three other professional sports offered in St. Louis.
• Although the average interest in attending live professional sporting events was very similar throughout the three groups, Younger Millennials expressed significantly greater interest compared to Older Millennials (at p<0.05) and to Non-Millennials (at p<0.10).
A
A red letter denotes that a given score is significantly less than another given score. A green letter denotes that a given score is significantly greater than another given score. A capital letter denotes a significant difference at p<0.05. A lowercase letter denotes a significant difference at p<0.10.
c
Bc
Q6. How interested are you in attending a live professional sporting event for each of the following sports?
CA
ca
C
ab
b
C
c

34
RO 1.2: Number of Live Professional Sporting Events (Last 12 Months)
• Millennials and non-Millennials have attended about the same number of live professional sporting events in the last 12 months.
• There are no significant differences between Younger Millennials (18-25), Older Millennials (26-32), and Non-Millennials (33+) regarding past attendance at live professional sporting events in the last 12 months.
• The overall average attendance is less than one professional sporting event per month.
Number of Events0
2
4
6
8
10
129.85 9.19 9.33
Number of Live Professional Sporting Events Attended in Past 12 Months
3-Way Age Categories
Younger Millennials (n=85) Older Millennials (n=104)Non-Millennials (n=166)
Number of Events0
2
4
6
8
10
12
9.49 9.33
Number of Live Professional Sporting Events Attended in Past 12 Months
Millennials Vs. Non-Millennials
Millennial (n=189) Non-Millennial (n=166)
Q4. How many live professional sports events have you attended in the past 12 months?
A red letter denotes that a given score is significantly less than another given score. A green letter denotes that a given score is significantly greater than another given score. A capital letter denotes a significant difference at p<0.05. A lowercase letter denotes a significant difference at p<0.10.

35
RO 1.2: Number of Live Professional Sporting Events (Last 12 Months)
• Nearly two-thirds of every age category has attended a live professional soccer game in the past 12 months.• A slightly greater percentage of Non-Millennials reported attending a game in the past 12 months compared with Millennials.• There were no significant differences between the likelihood for attending a live professional soccer game in the past 12 months
between Millennials and Non-Millennials.
A red letter denotes that a given percentage is significantly less than another given percentage. A green letter denotes that a given percentage is significantly greater than another given percentage. A capital letter denotes a significant difference at p<0.05. A lowercase letter denotes a significant difference at p<0.10.
Q7. Have you attended a live professional soccer game in the past 12 months?
Percentage Attendance0.0%
10.0%20.0%30.0%40.0%50.0%60.0%70.0%80.0%90.0%
100.0%
68.2%62.5%
68.7%
Have you attended a live professional soccer game in the past 12 months?
3-Way Age Categories
Younger Millennials (n=85) Older Millennials (n=104)Non-Millennials (n=166)
Percentage Attendance0.0%
10.0%20.0%30.0%40.0%50.0%60.0%70.0%80.0%90.0%
100.0%
65.1% 68.7%
Have you attended a live professional soccer in the past 12 months
Millennials Vs. Non-Millennials
Millennial (n=189) Non-Millennial (n=166)

36
RO 1.3: Degree of Interest in Live Professional Soccer Match
• There is a very high intention to attend a live professional soccer game in the next 12 months across all age categories.
• Over four-fifths (83.1%) of each age category reported very high intentions to attend a professional soccer game in the next 12 months.
A red letter denotes that a given percentage/score is significantly less than another given percentage/score. A green letter denotes that a given percentage/score is significantly greater than another given percentage/score. A capital letter denotes a significant difference at p<0.05. A lowercase letter denotes a significant difference at p<0.10.Q8. Please indicate how likely you are to attend a live professional soccer game in the next 12 months.
Likelihood to Attend1
2
3
4
5
6
7 6.44 6.41
Likelihood to attend a live professional soccer game in next 12 months
(Average Score)Millennials Vs. Non-Millennials
Millennial (n=189) Non-Millennial (n=166)
Top 2-Box ScoresA) Millennials
(n=189)B) Non-Millennials
(n=166)
Likelihood to Attend
84.1% 83.1%

37
RQ2. What do Millennials value when they attend live professional sporting events?

38
RO 2.3. Determine the type of pre- and post- game initiatives Millennials want regarding live professional sporting events.
Pre-game live music/entertainment
Pre-game televised professional sporting events on-site
Availability of public transportation to the game
Availability of group ticket purchasing discounts
Availability of tailgating opportunities
Variety of sources to purchase tickets
Ability to purchase tickets on-site
Availability of parking
Ability of purchase tickets online
1 2 3 4 5 6 7
3.81
3.97
4.19
4.29
4.84
4.94
5.07
5.93
6.29
Pre-Game Attributes: Importance (Average Score)All Respondents (n=355)
Q9. PRE-GAME ATTRIBUTES: Please indicate how important each of the following attributes are prior to attending a live professional sporting event.
• Overall, functional components regarding preparation prior to the game (including ticket purchasing and parking availability) are more important compared to pre-game activities on-site.
• Pre-game activities not essential to attending the game itself (such as ticketing or parking) were rated as not very important compared to these functional aspects of game attendance.
• The most important pre-game attribute is the ability to purchase tickets online, followed by the availability of parking.
A red letter denotes that a given score is significantly less than another given score. A green letter denotes that a given score is significantly greater than another given score. A capital letter denotes a significant difference at p<0.05. A lowercase letter denotes a significant difference at p<0.10.
Functional, Essential Components
Unessential, Complementary Components

39Q9. PRE-GAME ATTRIBUTES: Please indicate how important each of the following attributes are prior to attending a live professional sporting event.
• Millennials and Non-Millennials share very similar sentiment regarding the importance of pre-game attributes, primarily based on the distinction between functional and complementary aspects of the pre-game experience.
• Respondents are more interested in the functional elements of preparing for a game – factors that facilitate having a hassle-free experience right from the beginning.
• Non-Millennials are significantly (p<0.05) more likely to value parking compared to Millennials, while Millennials report a higher average importance score for public transportation to the game.
Pre-game live music/entertainment
Pre-game televised professional sporting events on-site
Availability of public transportation to the game
Availability of group ticket purchasing discounts
Availability of tailgating opportunities
Variety of sources to purchase tickets
Ability to purchase tickets on-site
Availability of parking
Ability to purchase tickets online
1 2 3 4 5 6 7
3.75
3.8
3.98
4.3
4.72
5.01
5.15
6.03
6.26
3.86
4.12
4.37
4.29
4.94
4.88
4.99
5.84
6.32
Pre-Game Attributes: Importance (Average Score)Millennials Vs. Non-Millennials
A) Millennials (n=189) B) Non-Millennials (n=166)
A red letter denotes that a given score is significantly less than another given score. A green letter denotes that a given score is significantly greater than another given score. A capital letter denotes a significant difference at p<0.05. A lowercase letter denotes a significant difference at p<0.10.
A
RO 2.3. Determine the type of pre- and post- game initiatives Millennials want regarding live professional sporting events.
B

40Q9. PRE-GAME ATTRIBUTES: Please indicate how important each of the following attributes are prior to attending a live professional sporting event.
A red letter denotes that a given percentage is significantly less than another given percentage. A green letter denotes that a given percentage is significantly greater than another given percentage. A capital letter denotes a significant difference at p<0.05. A lowercase letter denotes a significant difference at p<0.10.
RO 2.3. Determine the type of pre- and post- game initiatives Millennials want regarding live professional sporting events.
PRE-GAME ATTRIBUTES: Top 2-Box Scores
Type of Component Pre-Game Attribute A) Millennials (n=189)
B) Non-Millennials
(n=166)
Functional/Essential Ability of purchase tickets online 84.7% 81.3%Functional/Essential Availability of parking 68.3% 72.9%Functional/Essential Ability of purchase tickets on-site 41.8% 45.8%Functional/Essential Variety of sources to purchase tickets 35.4% 36.1%Complementary/Non-Essential Availability of tailgating opportunities 40.7% 34.9%Complementary/Non-Essential Availability of group ticket purchasing discounts 29.1% 30.7%Complementary/Non-Essential Availability of public transportation to the game 33.9%B 21.7%AComplementary/Non-Essential Pre-game televised professional sporting events on-
site19.0% 13.3%
Complementary/Non-Essential Pre-game live music/entertainment 16.9% 12.0%
• While Millennials and Non-Millennials share similar views about the functional components of the pre-game experience, there are several noticeable differences regarding the complementary experiences.
• About one-third (33.9%) of Millennials expressed a high interest in public transportation to the game, compared to only one-fifth (21.7%) of Non-Millennials.
• Millennials are also more interested in tailgating opportunities, with nearly half (40.7%) indicating a high interest.
41
RO 2.1. Assess the relative importance of characteristics of live professional sporting events.
On-site child supervision services
Availability of child-friendly activities (i.e. games, etc.)
Halftime/break time entertainment
Contests/games
Sponsored giveaways
Availability of an open-air bar/beer garden
Comfortable seats
Access to the team merchandise store
Variety of foods and beverages available for purchase
Clean restrooms
1 2 3 4 5 6 7
2.52
3.74
3.79
3.81
4.5
5.25
5.53
5.59
5.73
6.07
In-Game Attributes: Importance (Average Score)All Respondents (n=355)**
Q10. IN-GAME ATTRIBUTES: Please indicate how important each of the following attributes are while attending a live professional sporting event.
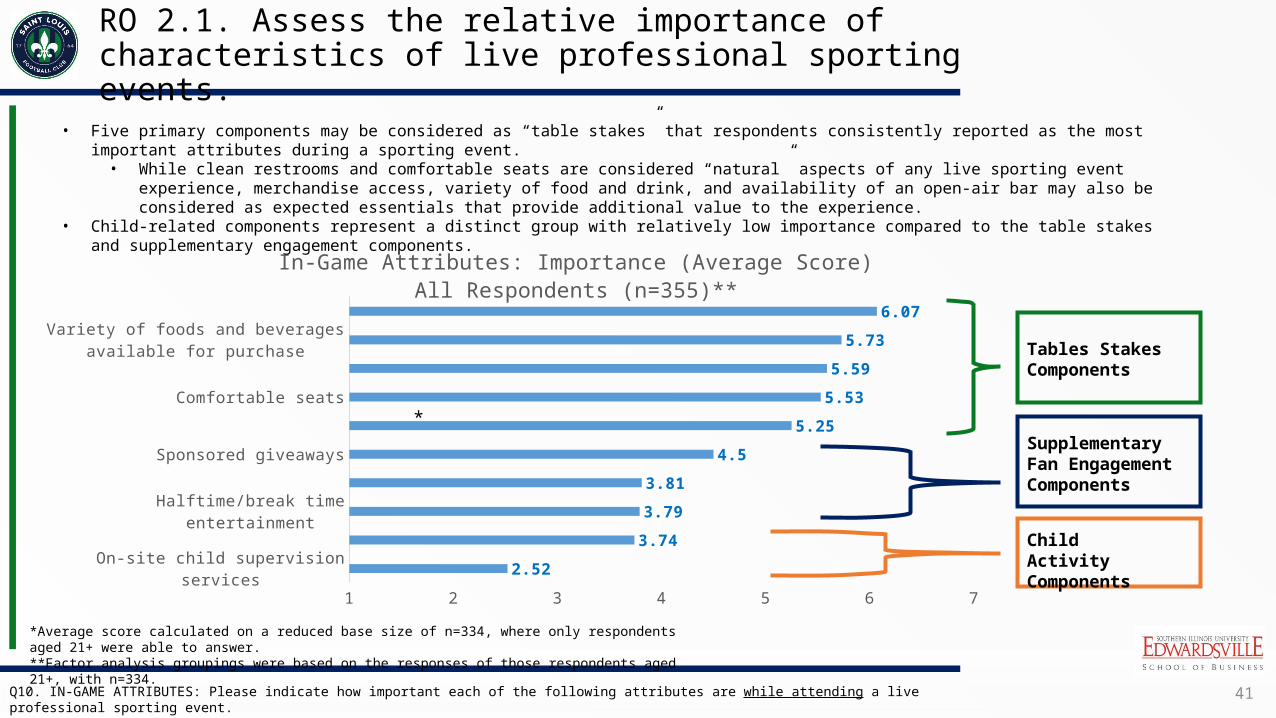
• Five primary components may be considered as “table stakes” that respondents consistently reported as the most important attributes during a sporting event.• While clean restrooms and comfortable seats are considered “natural” aspects of any live sporting event experience,
merchandise access, variety of food and drink, and availability of an open-air bar may also be considered as expected essentials that provide additional value to the experience.
• Child-related components represent a distinct group with relatively low importance compared to the table stakes and supplementary engagement components.
*Average score calculated on a reduced base size of n=334, where only respondents aged 21+ were able to answer.**Factor analysis groupings were based on the responses of those respondents aged 21+, with n=334.
*
Tables Stakes Components
Supplementary Fan Engagement Components
Child Activity Components
42
RO 2.4. Determine Millennials’ expectations regarding their attendance during live professional sporting events
On-site child supervision services
Availability of child-friendly activities (i.e. games, etc.)
Halftime/break time entertainment
Contests/games
Sponsored giveaways
Availability of an open-air bar/beer garden
Comfortable seats
Access to the team merchandise store
Variety of foods and beverages available for purchase
Clean restrooms
1 2 3 4 5 6 7
2.67
4.27
3.68
3.7
4.46
5.19
5.68
5.65
5.83
6.22
2.39
3.28
3.89
3.91
4.53
5.32
5.4
5.54
5.65
5.95
In-Game Attributes: Importance (Average Score)
A) Millennials (n=189)
Q10. IN-GAME ATTRIBUTES: Please indicate how important each of the following attributes are while attending a live professional sporting event.
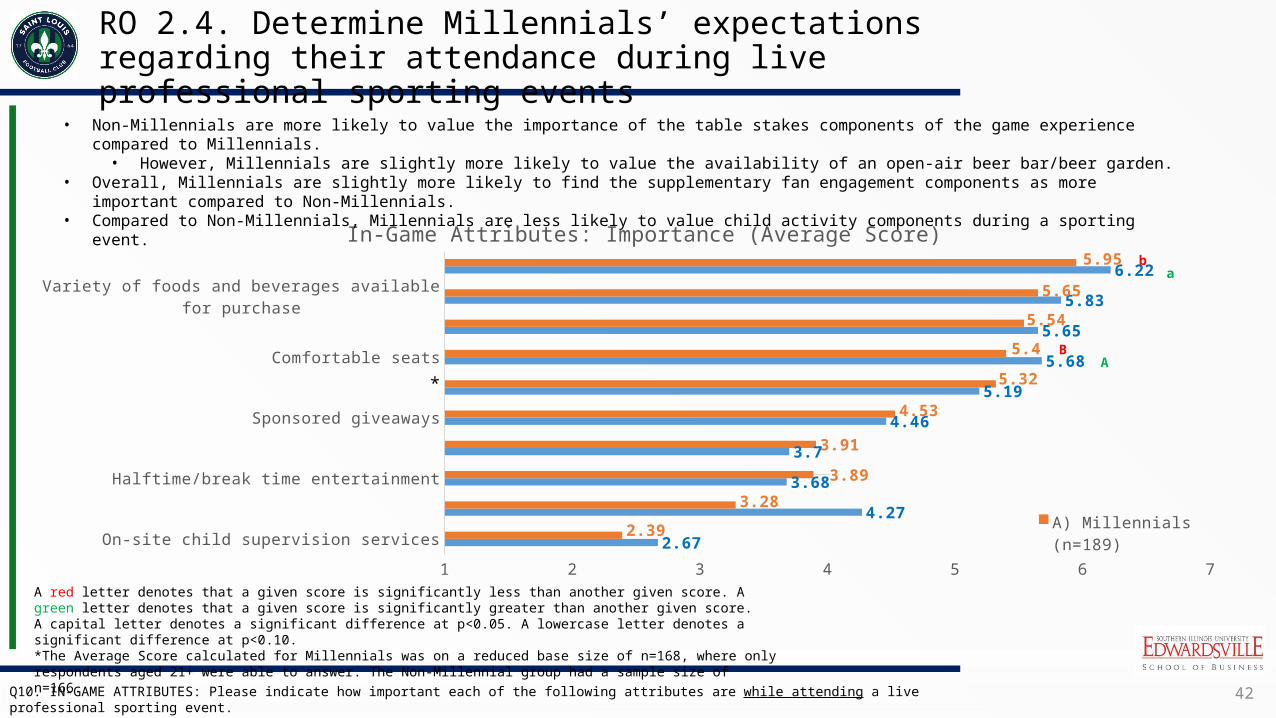
• Non-Millennials are more likely to value the importance of the table stakes components of the game experience compared to Millennials.• However, Millennials are slightly more likely to value the availability of an open-air beer bar/beer garden.
• Overall, Millennials are slightly more likely to find the supplementary fan engagement components as more important compared to Non-Millennials.
• Compared to Non-Millennials, Millennials are less likely to value child activity components during a sporting event.
*
A red letter denotes that a given score is significantly less than another given score. A green letter denotes that a given score is significantly greater than another given score. A capital letter denotes a significant difference at p<0.05. A lowercase letter denotes a significant difference at p<0.10.*The Average Score calculated for Millennials was on a reduced base size of n=168, where only respondents aged 21+ were able to answer. The Non-Millennial group had a sample size of n=166.
ab
BA

43
RO 2.4. Determine Millennials’ expectations regarding their attendance during live professional sporting events
Q10. IN-GAME ATTRIBUTES: Please indicate how important each of the following attributes are while attending a live professional sporting event.
A red letter denotes that a given percentage is significantly less than another given percentage. A green letter denotes that a given percentage is significantly greater than another given percentage. A capital letter denotes a significant difference at p<0.05. A lowercase letter denotes a significant difference at p<0.10.*The Millennials percentage was on a reduced base size of n=168, where only respondents aged 21+ were able to answer.
IN-GAME ATTRIBUTES: Top 2-Box Scores
Type of Components In-Game Attribute A) Millennials (n=189)
B) Non-Millennials (n=166)
Table Stakes Clean restrooms 72.5%B 81.9%A
Table Stakes/Additional Value Variety of foods and beverage available for purchase
60.3% 66.3%
Table Stakes/Additional Value Access to the team merchandise store 57.7% 59.0%
Table Stakes Comfortable seats 50.8%B 63.3%A
Table Stakes/Additional Value Availability of an open-air bar/beer garden* 54.2% 52.4%
Supplementary Fan Engagement Sponsored giveaways 31.7% 25.9%
Supplementary Fan Engagement Contests/games 19.0% 15.1%
Supplementary Fan Engagement Halftime/break time entertainment 14.3% 11.4%
Child Activity Availability of child-friendly activities (i.e. games, etc.)
10.6%B 28.3%A
Child Activity On-site child supervision services 3.7% 6.6%
• Non-Millennials are more likely to value the importance of the table stakes components of the game experience compared to Non-Millennials.• A slightly higher percentage of Millennials express a high importance for the availability of an open-air bar/beer garden.
• A significantly greater percentage of Non-Millennials expressed a high importance for the availability of child-friendly activities.

44
Post-game music/entertainment
Post-game fireworks display
Availability of public transportation from the game
Post-game player meet-and-greet/autograph opportunity
Access to fan club memberships
1 2 3 4 5 6 7
3.58
3.63
4.36
4.53
5.16
Post-Game Attributes: Importance (Average Score)All Respondents (n=355)
Q11. POST-GAME ATTRIBUTES: Please indicate how important each of the following attributes are after attending a live professional sporting event.
• Regarding post-game attributes, access to fan club memberships was rated comparatively high.
• Post-game fireworks and post-game music rated relatively low, with the Average Score near the midpoint.
RO 2.3. Determine the type of pre- and post- game initiatives Millennials want regarding live professional sporting events
A red letter denotes that a given score is significantly less than another given score. A green letter denotes that a given score is significantly greater than another given score. A capital letter denotes a significant difference at p<0.05. A lowercase letter denotes a significant difference at p<0.10.

45
Post-game music/entertainment
Post-game fireworks display
Availability of public transportation from the game
Post-game player meet-and-greet/autograph opportunity
Access to fan club memberships
1 2 3 4 5 6 7
3.51
3.46
4.05
4.52
5.08
3.64
3.78
4.62
4.53
5.23
Post-Game Attributes: Importance (Average Score)Millennials Vs. Non-Millennials
A) Millennials (n=189) B) Non-Millennials (n=166)
• Although Millennials and Non-Millennial have similar views regarding the importance of various post-game attributes, Millennials valued the availability of public transportation from the game compared to Non-Millennials.
• Fireworks and post-game entertainment scored relatively low for both Millennials and Non-Millennials.
A red letter denotes that a given score is significantly less than another given score. A green letter denotes that a given score is significantly greater than another given score. A capital letter denotes a significant difference at p<0.05. A lowercase letter denotes a significant difference at p<0.10.
Q11. POST-GAME ATTRIBUTES: Please indicate how important each of the following attributes are after attending a live professional sporting event.
RO 2.3. Determine the type of pre- and post- game initiatives Millennials want regarding live professional sporting events

46
A red letter denotes that a given percentage is significantly less than another given percentage. A green letter denotes that a given percentage is significantly greater than another given percentage. A capital letter denotes a significant difference at p<0.05. A lowercase letter denotes a significant difference at p<0.10.
Q11. POST-GAME ATTRIBUTES: Please indicate how important each of the following attributes are after attending a live professional sporting event.
RO 2.3. Determine the type of pre- and post- game initiatives Millennials want regarding live professional sporting events
POST-GAME ATTRIBUTES: Top 2-Box Scores
A) Millennials(n=189)
B) Non-Millennials(n=166)
Access to fan club memberships 49.2% 47.0%
Post-game player meet-and-greet/autograph opportunity
28.0% 30.7%
Availability of public transportation from the game 37.0%B 26.5%A
Post-game fireworks display 16.9% 9.6%
Post-game music/entertainment 14.3% 9.6%
• About half of both age categories rated access to fan club memberships as a very important component of the post-game experience.
• Over one-third (37.0%) of Millennials expressed a high importance for the availability of public transportation from the game, a significantly greater percentage compared to Non-Millennials.
47
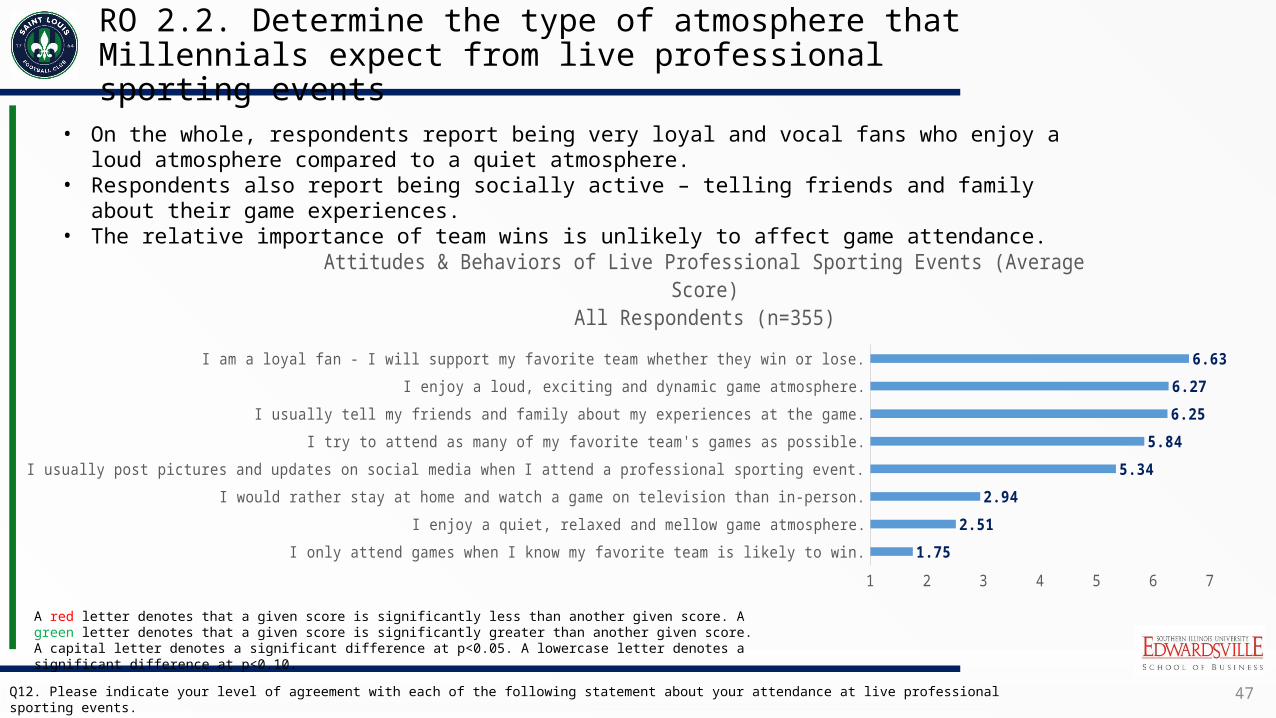
• On the whole, respondents report being very loyal and vocal fans who enjoy a loud atmosphere compared to a quiet atmosphere.
• Respondents also report being socially active – telling friends and family about their game experiences.
• The relative importance of team wins is unlikely to affect game attendance.
Q12. Please indicate your level of agreement with each of the following statement about your attendance at live professional sporting events.
RO 2.2. Determine the type of atmosphere that Millennials expect from live professional sporting events
I only attend games when I know my favorite team is likely to win.
I enjoy a quiet, relaxed and mellow game atmosphere.
I would rather stay at home and watch a game on television than in-person.
I usually post pictures and updates on social media when I attend a professional sporting event.
I try to attend as many of my favorite team's games as possible.
I usually tell my friends and family about my experiences at the game.
I enjoy a loud, exciting and dynamic game atmosphere.
I am a loyal fan - I will support my favorite team whether they win or lose.
1 2 3 4 5 6 7
1.75
2.51
2.94
5.34
5.84
6.25
6.27
6.63
Attitudes & Behaviors of Live Professional Sporting Events (Average Score)All Respondents (n=355)
A red letter denotes that a given score is significantly less than another given score. A green letter denotes that a given score is significantly greater than another given score. A capital letter denotes a significant difference at p<0.05. A lowercase letter denotes a significant difference at p<0.10.

48
I only attend games when I know my favorite team is likely to win.
I enjoy a quiet, relaxed and mellow game atmosphere.
I would rather stay at home and watch a game on television than in-person.
I usually post pictures and updates on social media when I attend a professional sporting event.
I try to attend as many of my favorite team's games as possible.
I usually tell my friends and family about my experiences at the game.
I enjoy a loud, exciting and dynamic game atmosphere.
I am a loyal fan - I will support my favorite team whether they win or lose.
1 2 3 4 5 6 7
1.8
2.58
3.17
5.3
5.6
6.12
6.05
6.55
1.72
2.45
2.74
5.38
6.05
6.35
6.47
6.7
Attitudes & Behaviors of Live Professional Sporting Events (Average Score)Millennials VS. Non-Millennials
A) Millennials (n=189) B) Non-Millennials (n=166)
• Millennials are significantly (p<0.05) more likely to report the following compared to Non-Millennials:• Being loyal fans• Enjoying a loud, exciting atmosphere.• Attending as many games as possible.
A red letter denotes that a given score is significantly less than another given score. A green letter denotes that a given score is significantly greater than another given score. A capital letter denotes a significant difference at p<0.05. A lowercase letter denotes a significant difference at p<0.10.
B
Q12. Please indicate your level of agreement with each of the following statement about your attendance at live professional sporting events.
RO 2.2. Determine the type of atmosphere that Millennials expect from live professional sporting events
A
BA
BA

49
A red letter denotes that a given percentage is significantly less than another given percentage. A green letter denotes that a given percentage is significantly greater than another given percentage. A capital letter denotes a significant difference at p<0.05. A lowercase letter denotes a significant difference at p<0.10.
Q12. Please indicate your level of agreement with each of the following statement about your attendance at live professional sporting events.
RO 2.2. Determine the type of atmosphere that Millennials expect from live professional sporting events
FAN ATTITUDES & BEHAVIORS: Top 2-Box Scores
A) Millennials(n=189)
B) Non-Millennials (n=166)
I am a loyal fan – I will support my favorite team whether they win or lose.
93.7% 91.0%
I enjoy a loud, exciting and dynamic game atmosphere. 88.9%B 72.3%A
I usually tell my friends and family about my experiences at the game.
82.5% 72.3%
I try to attend as many of my favorite team’s games as possible. 70.4%B 54.8%A
I usually post pictures and updates on social media when I attend a professional sporting event.
56.6% 57.2%
I would rather stay at home and watch a game on television than in-person.
1.1%B 6.0%A
I enjoy a quiet, relaxed, and mellow game atmosphere. 5.8% 4.2%
I only attend games when I know my favorite team is likely to win.
1.1% 3.0%
• While the vast majority of both age groups (at least 91.0%) agree that they are loyal supporters of their favorite team, a significantly greater percentage of Millennials express the actual attendance intentions regarding their favorite sports teams compared to Non-Millennials.
• More than half (at least 56.6%) of both age groups indicate that they are active on social media while attending a professional sporting event.• Overall, both Millennials and Non-Millennials report being active advocates of their experiences at professional sporting events on both social
media and in-person.

50
RQ3. What are the key determinants that affect whether Millennials will attend a Saint Louis FC match?

51
RO 3.1. Determine Millennials’ likelihood/willingness to attend a Saint Louis FC match
Q20. Which of the following professional soccer organizations are you aware of? Please select all that apply.Q21. Prior to participating in this survey, were you aware that Saint Louis would be home to a professional soccer team beginning in 2015?
Aware of Saint Louis FC0.0%
10.0%20.0%30.0%40.0%50.0%60.0%70.0%80.0%90.0%
100.0% 95.2% 98.2%
Awareness of Saint Louis FCMillennials Vs. Non-Millen-
nials
A) Millennials (n=189)B) Non-Millennials (n=166)
• Nearly all (at least 95%) of Millennial and Non-Millennial respondents are aware of Saint Louis FC.• This high percentage of awareness is likely due to the composition of the sampling design, due to a high
response rate from followers of the Saint Louis FC Facebook page and Twitter account.• While awareness of the USL Pro league is not as high as Major League Soccer (MLS), the majority of
Millennials and Non-Millennials are aware of the USL Pro league, more so than the international soccer leagues La Liga (Spain) and Bundesliga (Germany).
Major League Soccer (MLS)
English Premier Leauge (EPL)
USL Pro La Liga Bundesliga0.0%
20.0%
40.0%
60.0%
80.0%
100.0%98.9% 96.3%
84.7%79.9% 75.7%
98.8% 98.2%
81.9% 77.1%71.7%
Awareness of Soccer OrganizationsMillennials Vs. Non-Millennials
A) Millennials (n=189) B) Non-Millennials (n=166)A red letter denotes that a given percentage is significantly less than another given percentage. A green letter denotes that a given percentage is significantly greater than another given percentage. A capital letter denotes a significant difference at p<0.05. A lowercase letter denotes a significant difference at p<0.10.
52
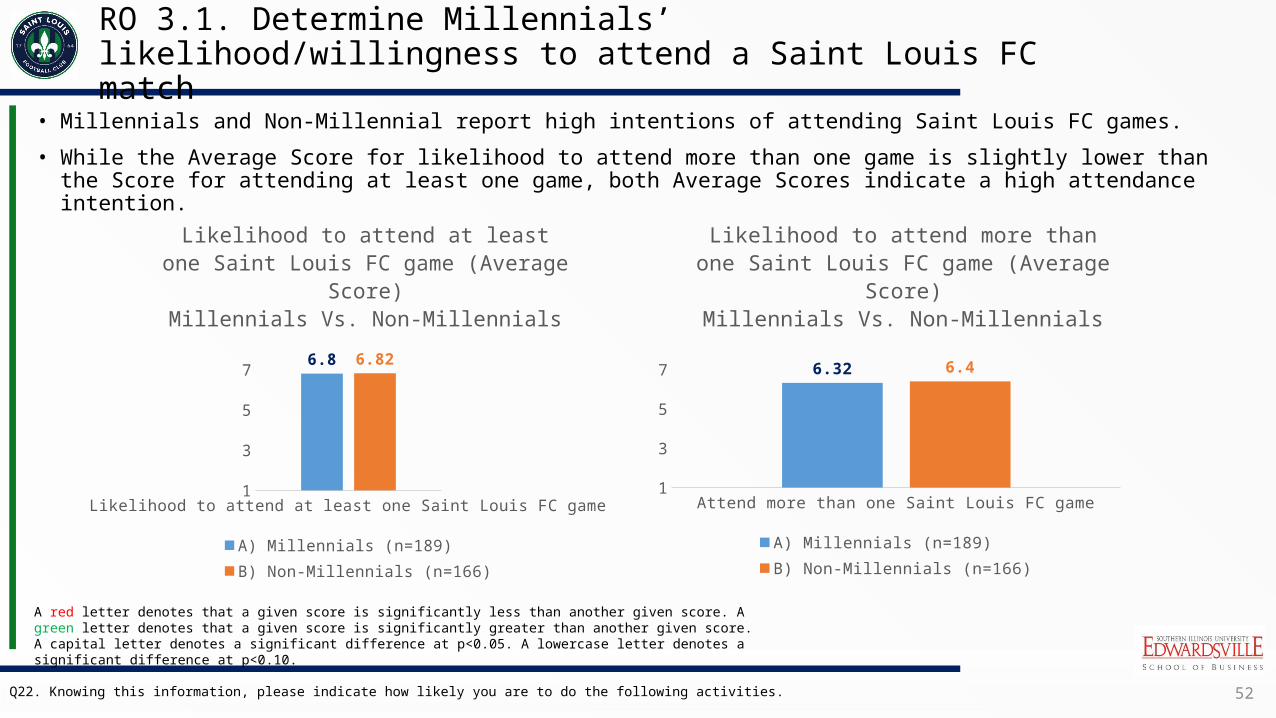
• Millennials and Non-Millennial report high intentions of attending Saint Louis FC games.
• While the Average Score for likelihood to attend more than one game is slightly lower than the Score for attending at least one game, both Average Scores indicate a high attendance intention.
RO 3.1. Determine Millennials’ likelihood/willingness to attend a Saint Louis FC match
Q22. Knowing this information, please indicate how likely you are to do the following activities.
Likelihood to attend at least one Saint Louis FC game1
2
3
4
5
6
7 6.8 6.82
Likelihood to attend at least one Saint Louis FC game (Average Score)Millennials Vs. Non-Millennials
A) Millennials (n=189) B) Non-Millennials (n=166)
Attend more than one Saint Louis FC game1
2
3
4
5
6
7 6.32 6.4
Likelihood to attend more than one Saint Louis FC game (Average Score)
Millennials Vs. Non-Millennials
A) Millennials (n=189) B) Non-Millennials (n=166)
A red letter denotes that a given score is significantly less than another given score. A green letter denotes that a given score is significantly greater than another given score. A capital letter denotes a significant difference at p<0.05. A lowercase letter denotes a significant difference at p<0.10.

53
• Both Millennials and Non-Millennials report high intentions of attending at least one Saint Louis FC game.
• Millennials report being slightly more likely to follow Saint Louis FC on social media outlets, as well as to join a Saint Louis FC supporters club.
• Although the Average Score for season ticket purchase intention ranked the lowest compared to the other listed Saint Louis FC-related activities, both age groups expressed an average likelihood that was slightly above the scale’s midpoint.
RO 3.2. Determine Millennials’ likelihood/willingness to purchase Saint Louis FC season tickets
Q22. Knowing this information, please indicate how likely you are to do the following activities.
Purchase a 2015 Saint Louis FC season ticket
Join a Saint Louis FC supporters club
Purchase Saint Louis FC merchandise
Attend more than one Saint Louis FC game
Follow Saint Louis FC on social media (i.e. Twitter, Facebook)
Tell a friend or family member about Saint Louis FC
Attend at least one Saint Louis FC game
1 2 3 4 5 6 7
4.57
5.15
6.29
6.4
6.54
6.57
6.82
4.4
5.3
6.22
6.32
6.62
6.61
6.8
Likelihood to participate in Saint Louis FC-related activities (Average Score)Millennials Vs. Non-Millennials
A) Millennials (n=189) B) Non-Millennials (n=166)
A red letter denotes that a given score is significantly less than another given score. A green letter denotes that a given score is significantly greater than another given score. A capital letter denotes a significant difference at p<0.05. A lowercase letter denotes a significant difference at p<0.10.

54
• Both Millennials and Non-Millennials report high intentions of attending at least one Saint Louis FC game.
• The overwhelming majority (at least 89.2%) of both groups report a high intention to tell a friend or family member about Saint Louis FC.
• Both groups report a high intention to follow Saint Louis FC on social media.
• Although season ticket purchase intentions were the lowest out of the behavioral set, at least one-third (33.%) of each group expresses a high likelihood of purchasing a season ticket.
RO 3.2. Determine Millennials’ likelihood/willingness to purchase Saint Louis FC season tickets
Q22. Knowing this information, please indicate how likely you are to do the following activities.
Saint Louis FC Purchase Intentions & Behaviors: Top 2-Box ScoresSaint Louis FC Purchase Intentions & Behaviors A) Millennials
(n=189)B) Non-Millennials
(n=166)
Attend at least one Saint Louis FC game 94.7% 95.8%
Tell a friend or family member about Saint Louis FC 91.0% 89.2%
Follow Saint Louis FC on social media (i.e. Twitter, Facebook)
89.4% 89.8%
Attend more than one Saint Louis FC game 79.9% 83.1%
Purchase Saint Louis FC merchandise 78.3% 79.5%
Join a Saint Louis FC supporters club 49.2% 47.0%
Purchase a 2015 Saint Louis FC season ticket 33.3% 39.2%
A red letter denotes that a given percentage is significantly less than another given percentage. A green letter denotes that a given percentage is significantly greater than another given percentage. A capital letter denotes a significant difference at p<0.05. A lowercase letter denotes a significant difference at p<0.10.

55
• Millennials indicate the greatest preference for an open-air beer garden, followed by chair-back seats and on-site food trucks.
• Millennials are significantly (p<0.05) more likely to prefer the proposed “Pub-to-Pitch” public transportation plan compared to Non-Millennials.
• Both groups indicate a lack of preference for fireworks, halftime entertainment, and post-player meet-and-greets.
RO 3.4. Determine Millennials’ preferences of planned initiatives and developments
0.0%
10.0%
20.0%
30.0%
40.0%
50.0%
60.0%
70.0%
80.0%
90.0%
100.0%
58.9%63.7%
47.0%43.5% 44.6%
20.8%
11.3%5.4% 4.8%
67.5%
60.2%
45.2%
34.3% 33.1%
24.1%
18.1%
9.6% 7.8%
Preference of planned initiatives and developments(Top-3 most preferred)
Millennials Vs. Non-Millennials
A) Millennials (n=168)
B) Non-Millennials (n=166)
A red letter denotes that a given percentage is significantly less than another given percentage. A green letter denotes that a given percentage is significantly greater than another given percentage. A capital letter denotes a significant difference at p<0.05. A lowercase letter denotes a significant difference at p<0.10.
A
B
Q24. For the following list of initiatives and activities, please rank the following list in order of your personal preference, with ‘1’ being “Most preferred” and ‘8’ being “Least preferred.”

56
• For both Millennials and Non-Millennials, there is a high preference for chair-back seats.
• Nearly half (42.2%) of Non-Millennials indicated their first-choice preference for chair-back seats.
• Nearly one-third (32.1%) of Millennials expressed their first-choice preference for chair-back seats.
RO 3.4. Determine Millennials’ preferences of planned initiatives and developments
1st 2nd 3rd 4th 5th 6th 7th 8th 9th0.0%
5.0%
10.0%
15.0%
20.0%
25.0%
30.0%
35.0%
40.0%
45.0%
50.0%
32.1%
18.5%
8.3%11.3%
4.8%6.5% 7.7%
4.8% 6.0%
42.2%
18.7%
6.6%
1.2%
7.8%9.6%
4.8%3.0%
6.0%
Ranked preference of planned initiatives and developments: Chair-back seats
Millennials Vs. Non-Millennials
A) Millennials (n=168) B) Non-Millennials (n=166)A red letter denotes that a given percentage is significantly less than another given percentage. A green letter denotes that a given percentage is significantly greater than another given percentage. A capital letter denotes a significant difference at p<0.05. A lowercase letter denotes a significant difference at p<0.10.
A
Q24. For the following list of initiatives and activities, please rank the following list in order of your personal preference, with ‘1’ being “Most preferred” and ‘8’ being “Least preferred.”
B

57
• Preference for a proposed open-air beer garden was high for both age groups.
• Nearly two-thirds (63.7%) of Millennials indicated a top-3 choice preference for the initiative.
• Nearly one-fifth (15.6%) of Non-Millennials indicated a lack of preference (8th or 9th place rank) for an open-air beer garden.
RO 3.4. Determine Millennials’ preferences of planned initiatives and developments
1st 2nd 3rd 4th 5th 6th 7th 8th 9th0.0%
5.0%
10.0%
15.0%
20.0%
25.0%
30.0%
35.0%
40.0%
45.0%
50.0%
17.3%
25.6%
20.8%
14.9%
6.0%3.6% 4.2%
2.4%5.4%
16.9%
27.7%
15.7%
10.8%
4.8% 5.4%3.0%
8.4% 7.2%
Ranked Preference of planned initiatives and developments: Open-Air Beer Garden
Millennials Vs. Non-Millennials
A) Millennials (n=168) B) Non-Millennials (n=166)A red letter denotes that a given percentage is significantly less than another given percentage. A green letter denotes that a given percentage is significantly greater than another given percentage. A capital letter denotes a significant difference at p<0.05. A lowercase letter denotes a significant difference at p<0.10.
Q24. For the following list of initiatives and activities, please rank the following list in order of your personal preference, with ‘1’ being “Most preferred” and ‘8’ being “Least preferred.”
B
A

58
• Nearly half (44.7%) of the Millennial group rated the proposed “Pub-to-Pitch” public transportation program in the top-3 ranking of preference.
• Overall, the Millennial group expressed a greater interest in and preference for public transportation to and from the game.
• The Non-Millennial group was significantly more likely to rank the program in the least favorability category (9th) compared to the Millennial group.
RO 3.4. Determine Millennials’ preferences of planned initiatives and developments
1st 2nd 3rd 4th 5th 6th 7th 8th 9th0.0%
5.0%
10.0%
15.0%
20.0%
25.0%
30.0%
35.0%
40.0%
45.0%
50.0%
16.7% 17.3%
10.7%13.7%
10.1% 11.3%
6.5%6.0%
7.7%10.8%
9.6%
12.7% 11.4%8.4%
6.6%6.0%
11.4%
22.9%
Ranked Preference of planned initiatives and developments: “Pub-to-Pitch” Public Transportation
Millennials Vs. Non-Millennials
A) Millennials (n=168) B) Non-Millennials (n=166)A red letter denotes that a given percentage is significantly less than another given percentage. A green letter denotes that a given percentage is significantly greater than another given percentage. A capital letter denotes a significant difference at p<0.05. A lowercase letter denotes a significant difference at p<0.10.
Q24. For the following list of initiatives and activities, please rank the following list in order of your personal preference, with ‘1’ being “Most preferred” and ‘8’ being “Least preferred.”
B
B
A
A

59
• There is substantial interest from both the Millennial and Non-Millennial group for on-site food trucks.
• Nearly half of both the Millennial (47.0%) and the Non-Millennial (45.2%) groups rated on-site food trucks in the top-3 preference rankings.
RO 3.4. Determine Millennials’ preferences of planned initiatives and developments
1st 2nd 3rd 4th 5th 6th 7th 8th 9th0.0%
5.0%
10.0%
15.0%
20.0%
25.0%
30.0%
35.0%
40.0%
45.0%
50.0%
6.5%
12.5%
28.0%
17.3% 16.1%11.3%
4.2%2.4% 1.8%
5.4%
18.1%
21.7%19.3%
12.0%9.6% 10.2%
3.0%
0.6%
Ranked Preference of planned initiatives and developments: On-site Food Trucks
Millennials Vs. Non-Millennials
A) Millennials (n=168) B) Non-Millennials (n=166)A red letter denotes that a given percentage is significantly less than another given percentage. A green letter denotes that a given percentage is significantly greater than another given percentage. A capital letter denotes a significant difference at p<0.05. A lowercase letter denotes a significant difference at p<0.10.
Q24. For the following list of initiatives and activities, please rank the following list in order of your personal preference, with ‘1’ being “Most preferred” and ‘8’ being “Least preferred.”
B
A

60
• Post-game fireworks ranked comparatively worse for both age groups in regards to preference.
• The majority of both groups ranked the proposed initiative in the bottom-3 preference rankings.
• Millennial: 58.4%• Non-Millennial: 56.7%
• Less than 10% of each group rated the proposed initiative in the top-3 ranking category.
• Nearly one-third (29.2%) of the Millennial group and one-fourth (24.7%) of the Non-Millennial group ranked the initiative in the least preferred category (9th).
RO 3.4. Determine Millennials’ preferences of planned initiatives and developments
1st 2nd 3rd 4th 5th 6th 7th 8th 9th0.0%
5.0%
10.0%
15.0%
20.0%
25.0%
30.0%
35.0%
40.0%
45.0%
50.0%
0.0% 1.2%4.2%
8.9%
14.3% 13.1% 14.3% 14.9%
29.2%
0.6%3.6% 5.4%
13.3%10.2% 10.2%
12.7%
19.3%
24.7%
Ranked Preference of planned initiatives and developments:Post-Game Fireworks
Millennials Vs. Non-Millennials
A) Millennials (n=168) B) Non-Millennials (n=166)A red letter denotes that a given percentage is significantly less than another given percentage. A green letter denotes that a given percentage is significantly greater than another given percentage. A capital letter denotes a significant difference at p<0.05. A lowercase letter denotes a significant difference at p<0.10.
Q24. For the following list of initiatives and activities, please rank the following list in order of your personal preference, with ‘1’ being “Most preferred” and ‘8’ being “Least preferred.”

61
• There was a distinct lack of preference for halftime music/entertainment for both age categories.
• Over half of the respondents in the Millennial group (58.9%) and the Non-Millennial group (51.9%) ranked the proposed initiative in the bottom-3 preference category.
RO 3.4. Determine Millennials’ preferences of planned initiatives and developments
1st 2nd 3rd 4th 5th 6th 7th 8th 9th0.0%
5.0%
10.0%
15.0%
20.0%
25.0%
30.0%
35.0%
40.0%
45.0%
50.0%
0.6% 0.6%3.6%
9.5%11.9%
14.9%
19.6%
25.0%
14.3%
0.0%1.8%
6.0%7.8%
15.1%17.5% 18.7% 19.3%
13.9%
Ranked Preference of planned initiatives and developments: Halftime Music/EntertainmentMillennials Vs. Non-Millennials
A) Millennials (n=168) B) Non-Millennials (n=166)A red letter denotes that a given percentage is significantly less than another given percentage. A green letter denotes that a given percentage is significantly greater than another given percentage. A capital letter denotes a significant difference at p<0.05. A lowercase letter denotes a significant difference at p<0.10.
Q24. For the following list of initiatives and activities, please rank the following list in order of your personal preference, with ‘1’ being “Most preferred” and ‘8’ being “Least preferred.”

62
• Preference rankings for sponsored contests/giveaways was mixed.
• A slightly greater percentage of the Non-Millennial category ranked the proposed initiative as more preferable compared to the Millennial category.
• Non-Millennial Top-3 Ranking Category: 24.1%
• Millennial Top-3 Ranking Category: 20.8%
RO 3.4. Determine Millennials’ preferences of planned initiatives and developments
1st 2nd 3rd 4th 5th 6th 7th 8th 9th0.0%
5.0%
10.0%
15.0%
20.0%
25.0%
30.0%
35.0%
40.0%
45.0%
50.0%
4.2%
7.7% 8.9% 10.1%
16.7%14.9%
17.9%
11.9%
7.7%3.0%
7.2%13.9% 14.5%
16.9%
12.7%
22.3%
6.0%3.6%
Ranked Preference of planned initiatives and developments: Sponsored Contests/GiveawaysMillennials Vs. Non-Millennials
A) Millennials (n=168) B) Non-Millennials (n=166)A red letter denotes that a given percentage is significantly less than another given percentage. A green letter denotes that a given percentage is significantly greater than another given percentage. A capital letter denotes a significant difference at p<0.05. A lowercase letter denotes a significant difference at p<0.10.
Q24. For the following list of initiatives and activities, please rank the following list in order of your personal preference, with ‘1’ being “Most preferred” and ‘8’ being “Least preferred.”

63
• Preference for a post-game player meet-and-greet was comparatively low for both age categories.
• Over one-half (52.9%) of the Millennial category ranked the proposed initiative in the bottom-3 category or preference, with over one-third (39.2%) of the Non-Millennial category expressing the same level of preference.
RO 3.4. Determine Millennials’ preferences of planned initiatives and developments
1st 2nd 3rd 4th 5th 6th 7th 8th 9th0.0%
5.0%
10.0%
15.0%
20.0%
25.0%
30.0%
35.0%
40.0%
45.0%
50.0%
1.8%3.6%
6.0%7.7%
10.1%
17.9% 19.0%
23.2%
10.7%
6.6% 5.4%6.0%
12.7% 13.9%16.3%
13.3%16.3%
9.6%
Ranked Preference of planned initiatives and developments: Post-Match Player Meet-and-Greet/Autograph Opportunity
Millennials Vs. Non-Millennials
A) Millennials (n=168) B) Non-Millennials (n=166)A red letter denotes that a given percentage is significantly less than another given percentage. A green letter denotes that a given percentage is significantly greater than another given percentage. A capital letter denotes a significant difference at p<0.05. A lowercase letter denotes a significant difference at p<0.10.
Q24. For the following list of initiatives and activities, please rank the following list in order of your personal preference, with ‘1’ being “Most preferred” and ‘8’ being “Least preferred.”

64
• Preference for membership to a Saint Louis FC Supporters Club was mixed throughout both age categories.
• Overall, Millennials expressed a greater preference for membership compared to Non-Millennials.
• Millennials:• Top-3 Ranking: 43.3%
• Bottom-3 Ranking:33.3%
• Non-Millennials:• Top-3 Ranking: 34.3%
• Bottom-3 Ranking: 33.7%
RO 3.4. Determine Millennials’ preferences of planned initiatives and developments
1st 2nd 3rd 4th 5th 6th 7th 8th 9th0.0%
5.0%
10.0%
15.0%
20.0%
25.0%
30.0%
35.0%
40.0%
45.0%
50.0%
20.8%
13.1%
9.5%6.5%
10.1%
6.5% 6.5%9.5%
17.3%14.5%
7.8%
12.0%9.0%
10.8% 12.0%9.0%
13.3%11.4%
Ranked Preference of planned initiatives and developments: Membership to a Saint Louis FC Supporters Club
Millennials Vs. Non-Millennials
A) Millennials (n=168) B) Non-Millennials (n=166)A red letter denotes that a given percentage is significantly less than another given percentage. A green letter denotes that a given percentage is significantly greater than another given percentage. A capital letter denotes a significant difference at p<0.05. A lowercase letter denotes a significant difference at p<0.10.
Q24. For the following list of initiatives and activities, please rank the following list in order of your personal preference, with ‘1’ being “Most preferred” and ‘8’ being “Least preferred.”

65
• The graph to the right represents an approximate graphical visualization of both Millennials’ and Non-Millennials’ preferences for proposed Saint Louis FC initiatives.
• A shorter distance between the Millennial and Non-Millennial ideal preference point (i.e. “M” and “NM,” respectively) to each proposed initiative represents a greater preference for that particular initiative.
RO 3.4. Determine Millennials’ preferences of planned initiatives and developments
Halftime Music/Entertainment
Post Game Fireworks
Post Match Player Meet-And Greet
Supporters Club MembershipPub-to-Pitch Public TransportationSponsored Contests & Giveaways
Open-Air Beer GardenOn-Site Food Trucks
Chair Back Seats
M
NM
Distance Mapping of Preferences
Q24. For the following list of initiatives and activities, please rank the following list in order of your personal preference, with ‘1’ being “Most preferred” and ‘8’ being “Least preferred.”

66
RQ4. Are there distinct groups within the Millennial category and between other age categories?

67
• Respondents in both age categories reported being active followers of professional sports and soccer teams on social media.
• Millennials were significantly (p<0.05) more likely to report following their favorite professional sports teams on social media.
• Millennial were significantly (p<0.05) more likely to report playing soccer in an organized league at least once per week.
• Despite being avid soccer fans, respondents reported not necessarily being soccer players themselves.
RO 4.1. Determine whether there are significant differences between the overall Millennial category and other age categories
Prefer to stay at home
I play soccer in an organized league at least once per week.
Someone in my family plays soccer in an organized league at least once per week.
I attend professional soccer games as much as possible.
Soccer is my favorite sport.
I watch professional soccer games on television as much as possible.
I follow the United States Men's National Team (USMNT) on social media.
I follow my favorite professional teams on social media.
1 2 3 4 5 6 7
2.75
2.27
4.39
5.34
5.84
6.16
6.05
6.03
2.14
3.27
3.19
5.43
5.68
5.91
6.25
6.34
Lifestyle Attributes (Average Score)Millennials Vs. Non-Millennials
A) Millennials (n=189) B) Non-Millennials (n=166)
A red letter denotes that a given score is significantly less than another given score. A green letter denotes that a given score is significantly greater than another given score. A capital letter denotes a significant difference at p<0.05. A lowercase letter denotes a significant difference at p<0.10.
Q32. Please indicate your level of agreement with the following statements.
BA
AB
B
A
A
ab
B
AB

68
RO 4.1. Determine whether there are significant differences between the overall Millennial category and other age categories
A red letter denotes that a given percentage is significantly less than another given percentage. A green letter denotes that a given percentage is significantly greater than another given percentage. A capital letter denotes a significant difference at p<0.05. A lowercase letter denotes a significant difference at p<0.10.
Q32. Please indicate your level of agreement with the following statements.
Saint Louis FC Purchase Intentions & Behaviors: Top 2-Box Scores
Saint Louis FC Purchase Intentions & Behaviors A) Millennials (n=189)
B) Non-Millennials(n=166)
I follow my favorite professional teams on social media. 83.1% 76.5%
I follow the United States Men’s National Team (USMNT) on social media.
82.5% 75.9%
I watch professional soccer games on television as much as possible. 69.8% 74.7%
Soccer is my favorite sport. 70.4% 67.5%
I attend professional soccer games as much as possible 56.1% 53.6%
Someone in my family plays soccer in an organized league at least once per week.
27.0%B 51.8%A
I play soccer in an organized league at least once per week. 29.6%B 15.1%A
I would rather stay at home and watch a professional soccer game on television than in-person.
2.6%B 7.2%A
• Millennials are more likely than Non-Millennials to follow their favorite sports teams on social media, including the USMNT.• The majority of both age categories (at least 53.6%) indicate that they are active attendees of professional soccer games when
they are available. • Nearly one-third (29.6%) of Millennials are active soccer players, a significantly greater percentage compared to Non-
Millennials.• Less than one in ten respondents included that they would rather stay at home and watch a professional soccer game on
television rather than in-person.

69
RQ5. What are Millennials’ views about companies supporting their favorite sports teams?
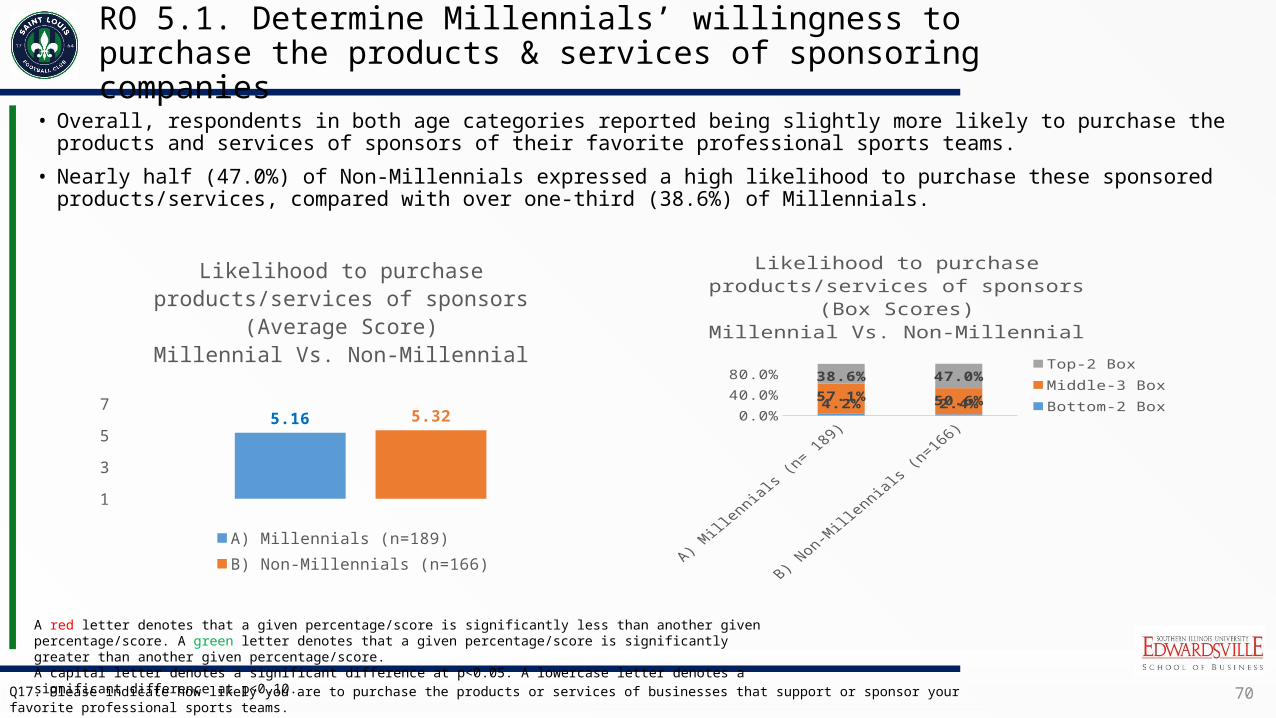
70
• Overall, respondents in both age categories reported being slightly more likely to purchase the products and services of sponsors of their favorite professional sports teams.
• Nearly half (47.0%) of Non-Millennials expressed a high likelihood to purchase these sponsored products/services, compared with over one-third (38.6%) of Millennials.
RO 5.1. Determine Millennials’ willingness to purchase the products & services of sponsoring companies
Q17. Please indicate how likely you are to purchase the products or services of businesses that support or sponsor your favorite professional sports teams.
1
2
3
4
5
6
7
5.16 5.32
Likelihood to purchase products/services of sponsors (Average
Score)Millennial Vs. Non-Millennial
A) Millennials (n=189) B) Non-Millennials (n=166)
0.0%30.0%60.0%90.0%
4.2% 2.4%57.1% 50.6%
38.6% 47.0%
Likelihood to purchase products/services of sponsors (Box Scores)
Millennial Vs. Non-Millennial
Top-2 BoxMiddle-3 BoxBottom-2 Box
A red letter denotes that a given percentage/score is significantly less than another given percentage/score. A green letter denotes that a given percentage/score is significantly greater than another given percentage/score. A capital letter denotes a significant difference at p<0.05. A lowercase letter denotes a significant difference at p<0.10.

71
RO 5.2. Assess reasons why Millennials may be more or less willing to purchase the products & services of sponsoring companies
Q18. For what reason did you indicate you are less likely to purchase the products or services of businesses that support or sponsor your favorite professional sports teams?Q19. For what reason did you indicate you are more likely to purchase the products or services of businesses that support or sponsor your favorite professional sports teams?
Less Likely*(Bottom-3 Box Score)
More Likely*(Top-3 Box Score)
Millennials5.8%(n=189)
Non-Millennials5.4%(n=166)
Millennials70.4%(n=189)
Non-Millennials72.3%(n=166)
“They often are of little practical use to me.”“That usually doesn't influence my decision. I go to the games to watch my team play, not make decisions on what goods to buy.”“I do not really care about sponsors. I shop based on value/quality.”“It makes no difference to me who sponsors the team. If I like a team, then I will support them no mater what. I will acknowledge the sponsor, "yeah, cool, so and so sponsors this team".”
“I buy stuff I want/need for my personal satisfaction reasons. Not whether there is a tie in to "my" team. However, if there were two identical items, and one had ties to my team, I could see being loyal to that. But I don't go out of my way for goods/services just because that company has paid for advertising with my team.”“I didn't mean to indicate less likely, just that it really doesn't affect my purchasing habits.”“Not less likely than if they weren't sponsors, but generally I suspect I'm not likely to be swayed by their sponsorship if they weren't already products we would consider in the first place.”
“Often times there are specials on the back of ticket stubs.”“If I know money is going to the team.”“I'll notice them more outside the event.”“They support and are a part of the team just like me.”“I am a business owner, and I know that often sponsorships can be expensive. This shows me that the businesses care about and support local soccer. This is big for me, and I will go out of my way to support those businesses.”“I like businesses that support the community and things that bring the community together.”“If I see their business branded at sporting events I'm more likely to keep them in mind.”“Especially with smaller clubs, it makes me feel like they care about the community.”
“Sponsorship dollars help my team put better products out on the field. Particularly for smaller leagues where massive television and revenue sharing isn't an option, I like to support the sponsors to ensure their money keeps flowing to my team.”“Kit sponsor would get my buying attention because of interest in supporting local soccer.”“Know more about them and they support the community.”“When you support the companies that support your team, in a sense you are supporting your team by supporting those companies.”“I appreciate when companies support a team I follow. I try to repay that support.”“I like to support the businesses that do their part to support the things I love.”
The percentages found in the “Less Likely” category are composed of those respondents who answered with a 1-3 response on a 7-point scale in each respective age category.The percentages found in the “More Likely” category are composed of those respondents who answered with a 5-7 response on a 7-point scale in each respective age category.
• Respondents who indicated they were less likely to purchase a sponsoring company’s products/services indicated a perceived disconnect between the professional team and the products/services being sold, or not generally having an effect on purchasing decisions.
• Respondents who indicated they were more likely to purchase a sponsoring company’s products/services mention providing/showing support for the sponsored team, a penchant for team merchandise, and supporting the community and local soccer.
• Many respondents indicated that purchasing the products/services of sponsors allows them to support the team in addition to attending games.

72
RQ6. What sources of information do Millennials use to stay informed about their favorite sports teams?
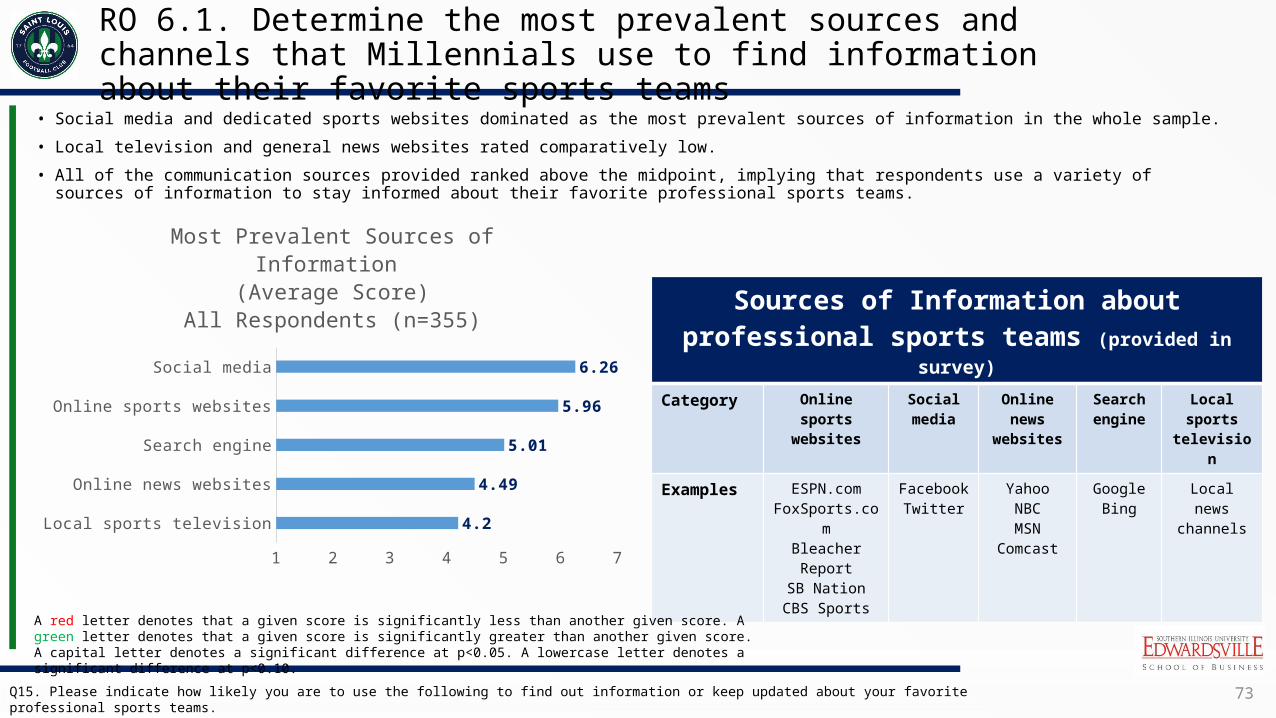
73
• Social media and dedicated sports websites dominated as the most prevalent sources of information in the whole sample.
• Local television and general news websites rated comparatively low.
• All of the communication sources provided ranked above the midpoint, implying that respondents use a variety of sources of information to stay informed about their favorite professional sports teams.
RO 6.1. Determine the most prevalent sources and channels that Millennials use to find information about their favorite sports teams
Local sports television
Online news websites
Search engine
Online sports websites
Social media
1 2 3 4 5 6 7
4.2
4.49
5.01
5.96
6.26
Most Prevalent Sources of Information (Average Score)
All Respondents (n=355)Sources of Information about
professional sports teams (provided in survey)
Category Online sports
websites
Social media
Online news
websites
Search engine
Local sports
television
Examples ESPN.comFoxSports.co
mBleacher Report
SB NationCBS Sports
YahooNBCMSN
Comcast
GoogleBing
Local news
channels
Q15. Please indicate how likely you are to use the following to find out information or keep updated about your favorite professional sports teams.
A red letter denotes that a given score is significantly less than another given score. A green letter denotes that a given score is significantly greater than another given score. A capital letter denotes a significant difference at p<0.05. A lowercase letter denotes a significant difference at p<0.10.

74
• Although both age categories expressed similar ratings for information sources, Millennials were significantly (p<0.05) more likely to use social media to follow their favorite sports teams.
• While social media represented the most frequently used source of information, online sports websites were also prominent for both age categories.
Local sports television
Online news websites
Search engine
Online sports websites
Social media
1 2 3 4 5 6 7
4.25
4.65
4.9
5.91
6.08
4.16
4.35
5.1
6.01
6.41
Most Prevalent Sources of Information (Average Score)
Millennials Vs. Non-Millennials
A) Millennials (n=189) B) Non-Millennials (n=166)
A red letter denotes that a given percentage/score e is significantly less than another given percentage/score. A green letter denotes that a given percentage/score e is significantly greater than another given percentage/score. A capital letter denotes a significant difference at p<0.05. A lowercase letter denotes a significant difference at p<0.10.
AB
ba
Q15. Please indicate how likely you are to use the following to find out information or keep updated about your favorite professional sports teams.
RO 6.1. Determine the most prevalent sources and channels that Millennials use to find information about their favorite sports teams
Most Prevalent Sources of InformationTop 2-Box Scores
Prevalent Sources of Information
A) Millennials
(n=189)
B) Non-Millennials (n=166)
Social media 83.6% 77.1%
Online sports websites 73.5% 71.7%
Search engine 49.7% 44.0%
Online news websites 33.3% 33.7%
Local sports television 30.7% 28.9%

75
• Both Millennials and Non-Millennials use multiple sources of information to keep updated about their favorite sports teams, including social media.
• Nearly three-fourths (at least 65.7%) of both age groups search for this information as a natural part of their daily internet activities.
• Although both groups expressed a high level of agreement with following their favorite professional teams on social media, Millennials were significantly (p<0.05) more likely to do so compared to Non-Millennials.
RO 6.1. Determine the most prevalent sources and channels that Millennials use to find information about their favorite sports teams
Q13. Please indicate your level of agreement with the following statements about your favorite professional sports teams.
1
3
5
7 6.5 6.485.87
6.4 6.25.74
Internet Sports Activity (Average Score)
Millennials Vs. Non-Millennials
A) Millennials (n=189) B) Non-Millennials (n=166)
AB
A red letter denotes that a given percentage/score e is significantly less than another given percentage/score. A green letter denotes that a given percentage/score is significantly greater than another given percentage/score. A capital letter denotes a significant difference at p<0.05. A lowercase letter denotes a significant difference at p<0.10.
Internet Sports ActivitiesTop 2-Box Scores
Internet Sports
Activities
A) Millennials
(n=189)
B) Non-Millennials
(n=166)
Use multiple sources
87.3% 87.3%
Follow on social media
85.7% 80.1%
Part of daily activities
67.7% 65.7%

76
• Millennials reported being extremely active in their search for information about their favorite sports teams, with the vast majority (85.7%) searching at least 2-3 times a week.
• 85.7% of Millennials and 80.1% of Non-Millennials indicate searching for information at least 2-3 times a week.
A red letter denotes that a given percentage is significantly less than another given percentage. A green letter denotes that a given percentage is significantly greater than another given percentage. A capital letter denotes a significant difference at p<0.05. A lowercase letter denotes a significant difference at p<0.10.
Q14. About how often do you search for information about your favorite professional sports teams? Would you say that you search for information…?
Never
Less than once a month
Once a month
2-3 times a month
Once a week
2-3 times a week
Daily
0.0% 10.0% 20.0% 30.0% 40.0% 50.0% 60.0% 70.0% 80.0% 90.0% 100.0%
1.2%
3.6%
0.6%
1.8%
12.7%
27.1%
53.0%
0.5%
0.5%
0.5%
4.2%
8.5%
25.4%
60.3%
Information search frequencyMillennials Vs. Non-Millennials
A) Millennials (n=189) B) Non-Millennials (n=166)
AB
RO 6.2. Determine the frequency of which Millennials seek information about their favorite sports teams

77
• Both age categories frequently mentioned Twitter and Facebook because it:• Provides immediate, real-time access (expediency)• Is part of a daily routine• Is convenient• Is customizable & controlled• Provides multiple perspectives
RO 6.3. Determine Millennials’ preferences of sources of information
Millennials Non-Millennials
Q16. What is your most preferred channel/source to find out information or keep updated about your favorite professional sports teams?

78
LIMITATIONS

79
Limitations
• Although the results of this research may help guide marketing efforts for Saint Louis FC, there are a few considerations that must be accounted for in order to understand the data in its fullest context.
• “Snowball” Sampling: Due to budgetary constraints, a “snowball” sampling method was used to collect survey responses. “Snowball” sampling is a form or convenience sampling whereby respondents may refer the survey to other potential respondents. Due to the convenient nature of sampling, the results are primarily directional in nature, and may not necessarily be generalizable to the total population of interest.
• Screener Requirements: Eligible respondents to the survey were restricted to those aged 18+ who expressed an interest in attending a live professional soccer match (dichotomous yes/no question) and who lived within 50 miles of the St. Louis region. The results of this survey do not capture the thoughts and opinions of those individuals under age 18, those who do not have an expressed interest in attending a live professional soccer match, and those who do not live within 50 miles of the St. Louis region.
• Response Rate: Out of a total of 553 individuals who attempted to take the survey, there were 355 respondents who fully completed the survey. The total complete response rate for the survey was 64.2%.• 14 (2.5%)respondents abandoned the survey prior to the screening requirements.• 98 (17.7%) respondents were screened out or failed to complete the screeners.• 86 (15.6%) respondents completed the screeners, but failed to complete the survey.
• Missing Data: Forced validation was utilized for the majority of the survey questions to ensure that missing data was kept to a minimum. In spite of these efforts, four respondents chose not to report their annual household income. The average response for the entire sample for this particular question was used as the imputation method to fulfill the four missing cases.• The responses of the 86 respondents who completed the screening requirements, but failed to complete the survey in its
entirety were deleted from the final analysis and are not reflected in the final sample count of 355 respondents. These respondents failed to complete at least half of the survey: thus, imputation methods would have negatively impacted the survey analysis and threatened the validity of the data and its results.
• Sampling/Recruitment Bias: Awareness for the survey was primarily generated from social media posts via the Saint Louis FC Twitter and Facebook social media accounts. As a result, the survey may be biased by reflecting the thoughts and opinions of those who already followed the social media accounts of Saint Louis FC. This bias is most likely a primary reason why awareness of the Saint Louis FC was very high.

80
APPENDIX

81
Frequencies of Column Variables
• The following tables indicate the counts and percentages of each column variable used in the analysis throughout the deck.
Millennial Vs. Non-Millennial Categories• A “Millennial” is defined as an individual
between the ages of 18 and 32.• A “Non-Millennial” is defined as an individual
aged 33+.
3-Way Millennial Categories• A “Younger Millennial” is defined as an individual
between the ages of 18 and 25.• An “Older Millennial” is defined as an individual
between the ages of 26 and 32.• A “Non-Millennial” is defined as an individual
aged 33+.
Q1. What is your current age? Please enter your current age in the space provided.

82
Respondent Demographics
Q25. What is your gender?
Cross tabulations: Millennials Vs. Non-Millennials

83
Respondent Demographics
Q26. What is your current marital status?
Cross tabulations: Millennials Vs. Non-Millennials

84
Respondent Demographics
Q28. What is your current employment status?
Cross tabulations: Millennials Vs. Non-Millennials

85
Respondent Demographics
Q29. What is your approximate annual household income?
Cross tabulations: Millennials Vs. Non-Millennials
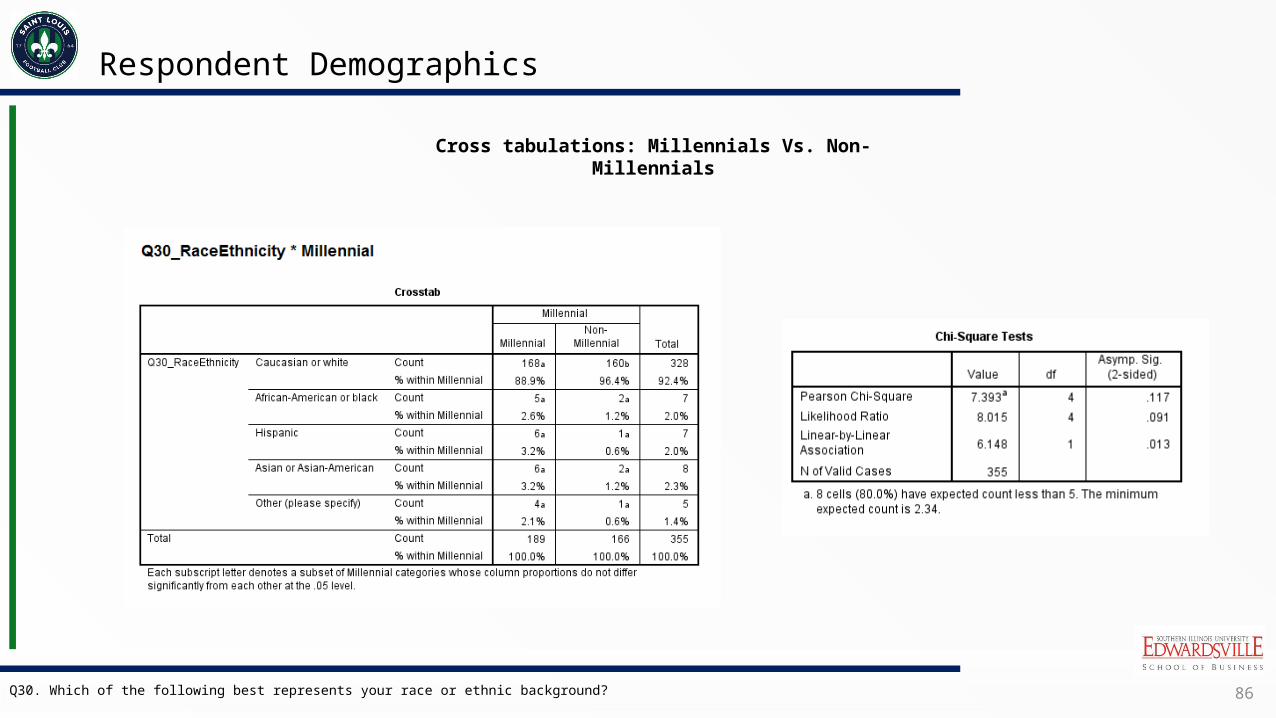
86
Respondent Demographics
Q30. Which of the following best represents your race or ethnic background?
Cross tabulations: Millennials Vs. Non-Millennials

87
Respondent Demographics
Q31. What is the last year of schooling you completed?
Cross tabulations: Millennials Vs. Non-Millennials

88
RO 1.1: Degree of Interest in Live Profession Sporting Events
Q4. How many live professional sports events have you attended in the past 12 months?
ANOVA: 3-Way Millennial Groups Independent Samples T-Test: Millennials Vs. Non-Millennials

89
RO 1.1: Degree of Interest in Live Profession Sporting Events
Q5. When you attend a live professional sports event, which of the following groups of people do you usually attend the event with?
Cross tabulations: 3-Way Millennial Groups Cross tabulations: 3-Way Millennial Groups
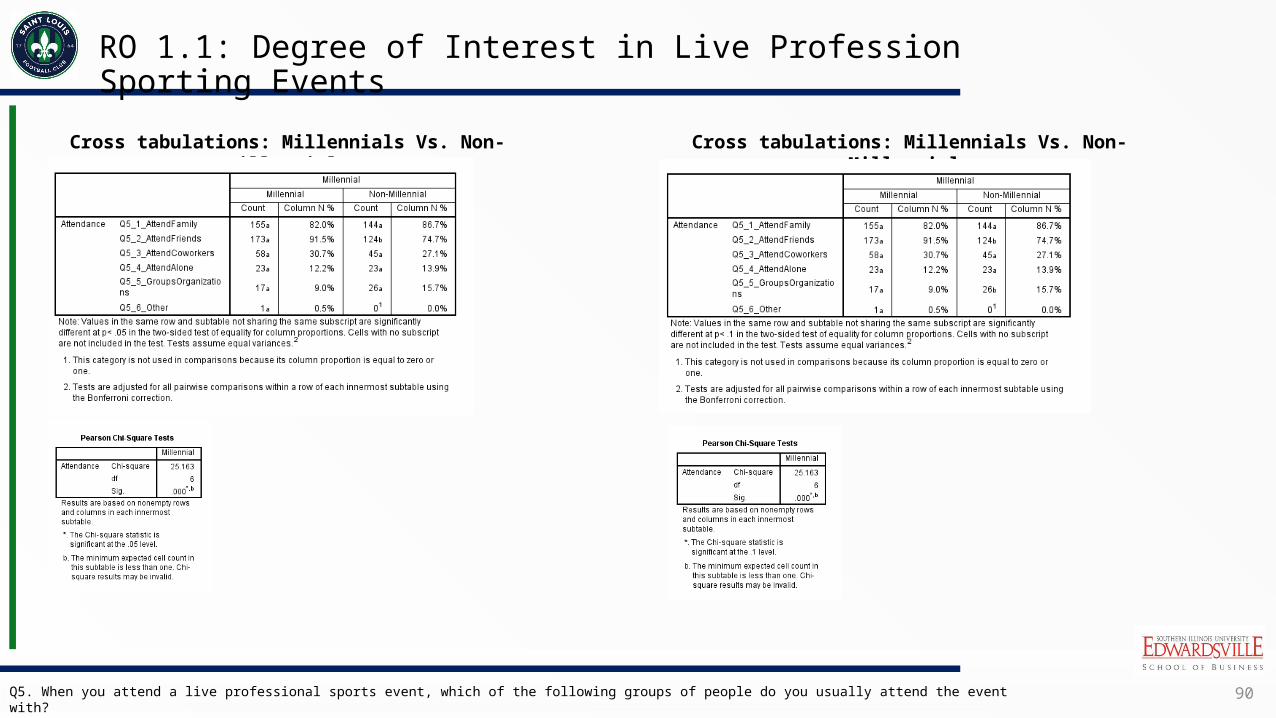
90
RO 1.1: Degree of Interest in Live Profession Sporting Events
Q5. When you attend a live professional sports event, which of the following groups of people do you usually attend the event with?
Cross tabulations: Millennials Vs. Non-Millennials
Cross tabulations: Millennials Vs. Non-Millennials

91
RO 1.1: Degree of Interest in Live Profession Sporting Events
Q6. How interested are you in attending a live professional sporting event for each of the following sports?
ANOVA: 3-Way Millennial Groups Independent Samples T-Test: Millennials Vs. Non-Millennials
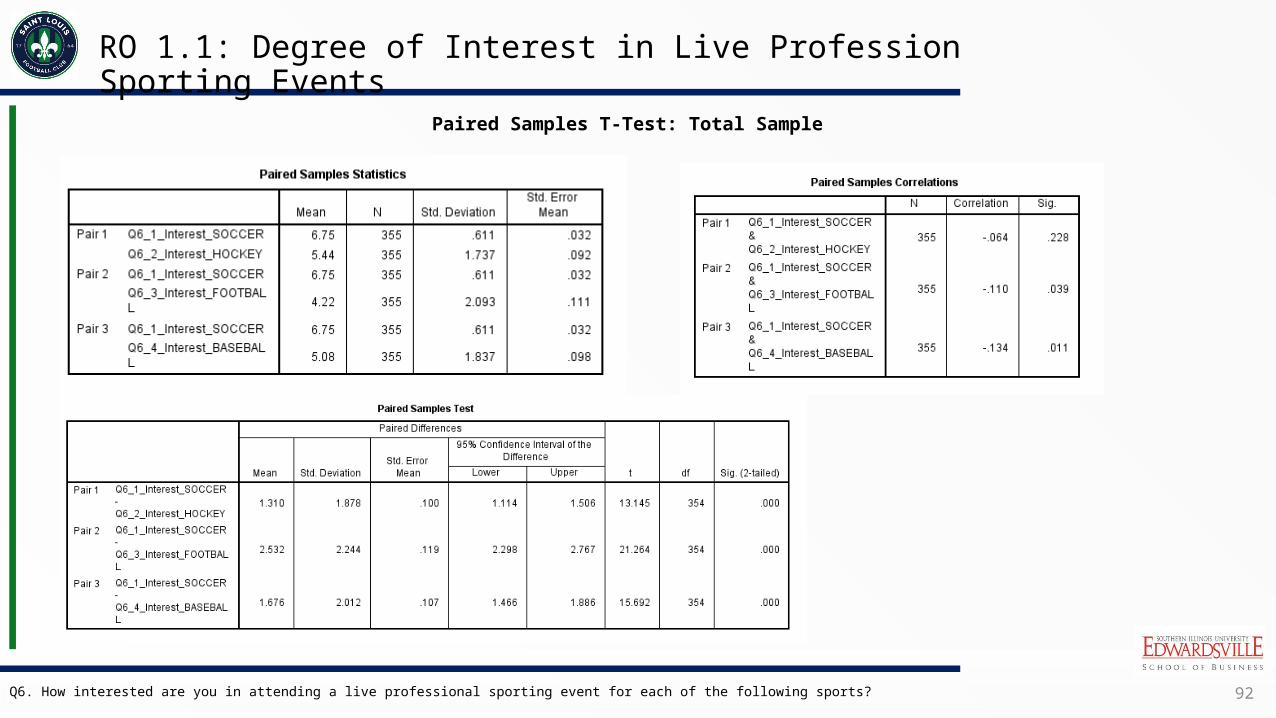
92
RO 1.1: Degree of Interest in Live Profession Sporting Events
Q6. How interested are you in attending a live professional sporting event for each of the following sports?
Paired Samples T-Test: Total Sample

93
RO 1.1: Degree of Interest in Live Profession Sporting Events
Q6. How interested are you in attending a live professional sporting event for each of the following sports?
Cross tabulations: Millennials Vs. Non-Millennials(Box Scores)
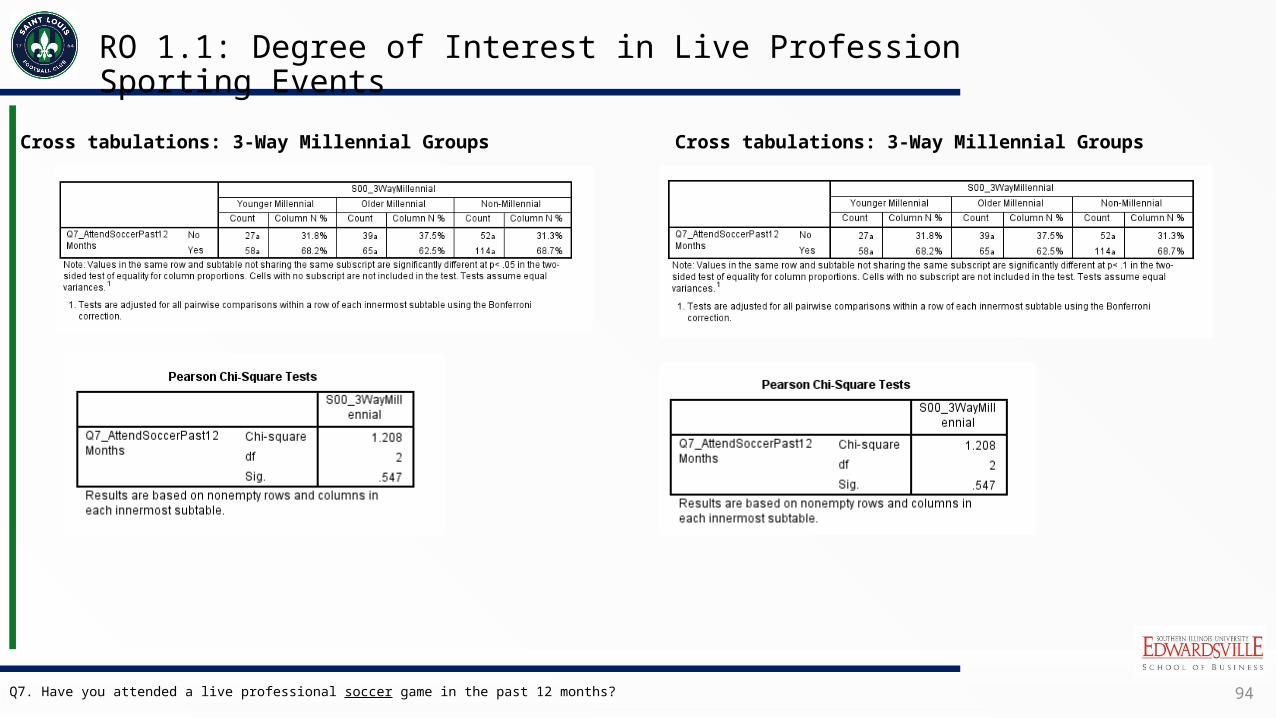
94
RO 1.1: Degree of Interest in Live Profession Sporting Events
Q7. Have you attended a live professional soccer game in the past 12 months?
Cross tabulations: 3-Way Millennial Groups Cross tabulations: 3-Way Millennial Groups

95
RO 1.1: Degree of Interest in Live Profession Sporting Events
Cross tabulations: Millennials Vs. Non-Millennials
Cross tabulations: Millennials Vs. Non-Millennials
Q7. Have you attended a live professional soccer game in the past 12 months?

96
RO 1.1: Degree of Interest in Live Profession Sporting Events
Q8. Please indicate how likely you are to attend a live professional soccer game in the next 12 months.
ANOVA: 3-Way Millennial Groups Independent Samples T-Test: Millennials Vs. Non-Millennials

97
RO 1.1: Degree of Interest in Live Profession Sporting Events
Q8. Please indicate how likely you are to attend a live professional soccer game in the next 12 months.
Cross tabulations: Millennials Vs. Non-Millennials(Box Scores)

98
RO 2.1. Assess the relative importance of characteristics of live professional sporting events
Descriptive Statistics: All Sample
Q9. PRE-GAME ATTRIBUTES: Please indicate how important each of the following attributes are prior to attending a live professional sporting event.
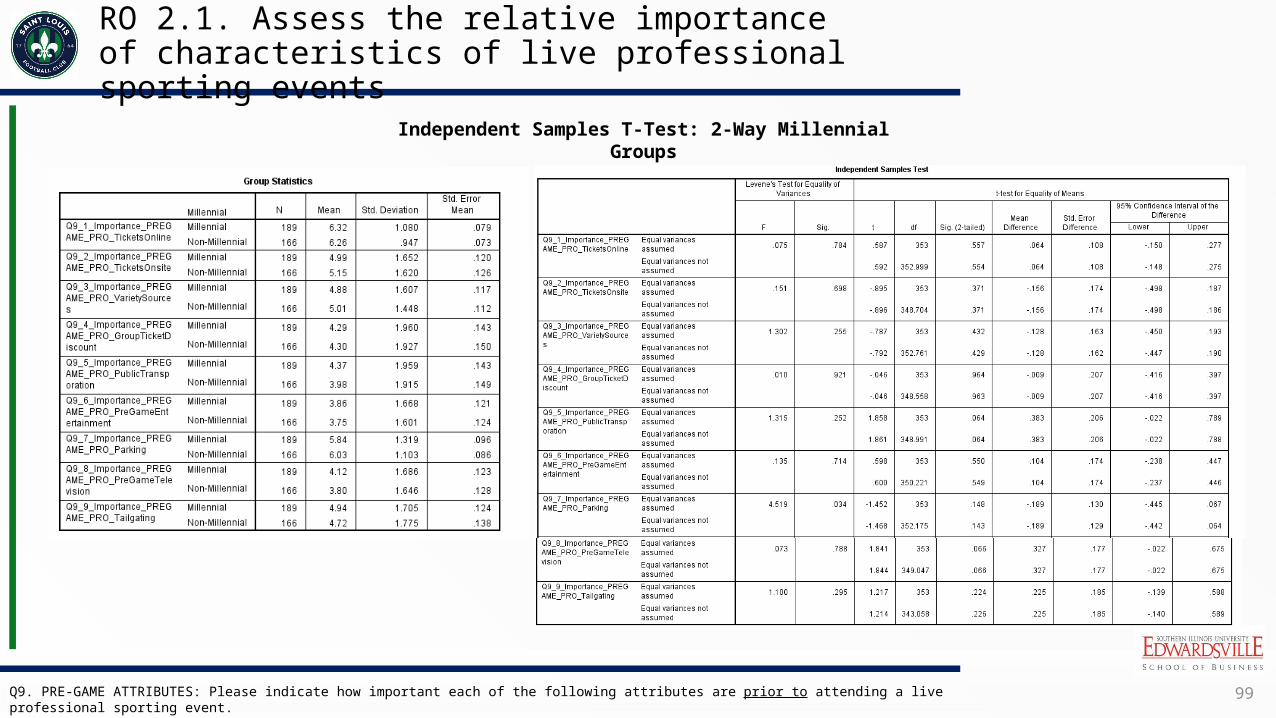
99
RO 2.1. Assess the relative importance of characteristics of live professional sporting events
Independent Samples T-Test: 2-Way Millennial Groups
Q9. PRE-GAME ATTRIBUTES: Please indicate how important each of the following attributes are prior to attending a live professional sporting event.

100
RO 2.1. Assess the relative importance of characteristics of live professional sporting events
Cross tabulations: Millennials Vs. Non-Millennials(Box Scores)
Q9. PRE-GAME ATTRIBUTES: Please indicate how important each of the following attributes are prior to attending a live professional sporting event.

101
RO 2.1. Assess the relative importance of characteristics of live professional sporting events
Cross tabulations: Millennials Vs. Non-Millennials(Box Scores)
Q9. PRE-GAME ATTRIBUTES: Please indicate how important each of the following attributes are prior to attending a live professional sporting event.

102
RO 2.1. Assess the relative importance of characteristics of live professional sporting events
Cross tabulations: Millennials Vs. Non-Millennials(Box Scores)
Q9. PRE-GAME ATTRIBUTES: Please indicate how important each of the following attributes are prior to attending a live professional sporting event.
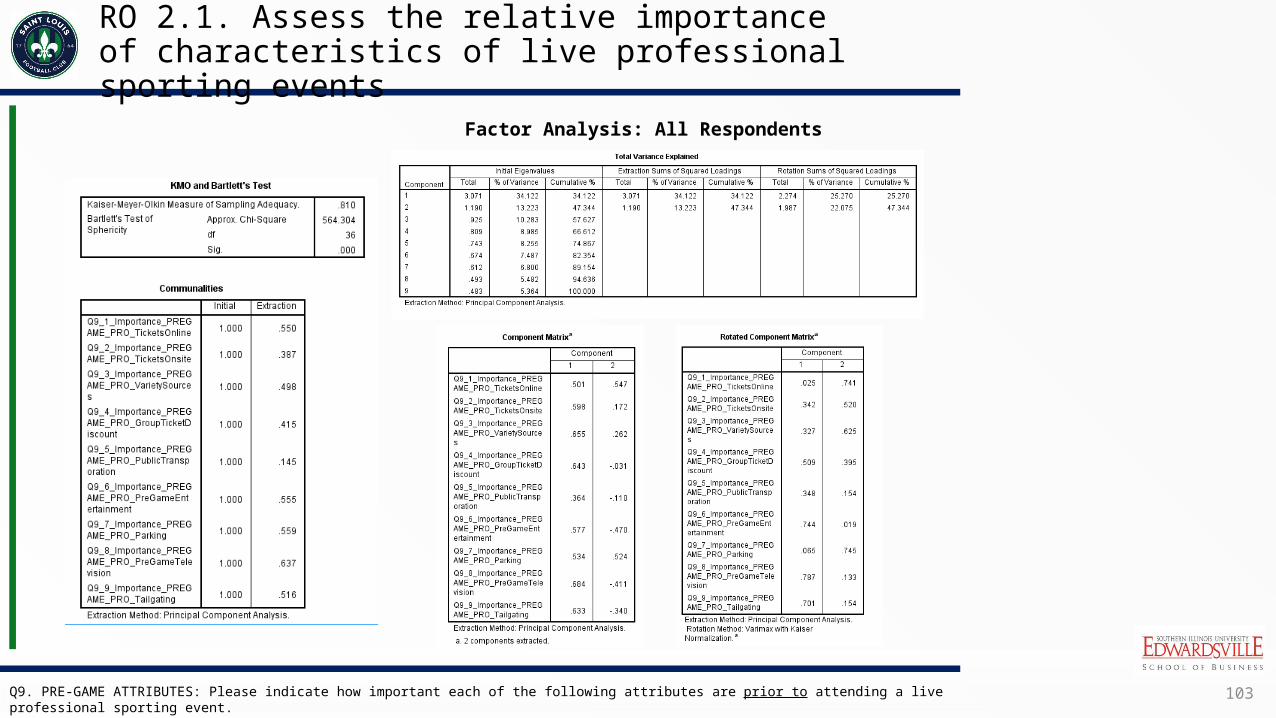
103
RO 2.1. Assess the relative importance of characteristics of live professional sporting events
Factor Analysis: All Respondents
Q9. PRE-GAME ATTRIBUTES: Please indicate how important each of the following attributes are prior to attending a live professional sporting event.

104
RO 2.1. Assess the relative importance of characteristics of live professional sporting events
Descriptive Statistics: All Sample
Q10. IN-GAME ATTRIBUTES: Please indicate how important each of the following attributes are while attending a live professional sporting event.

105
RO 2.1. Assess the relative importance of characteristics of live professional sporting events
Independent Samples T-Test: 2-Way Millennial Groups
Q10. IN-GAME ATTRIBUTES: Please indicate how important each of the following attributes are while attending a live professional sporting event.

106
RO 2.1. Assess the relative importance of characteristics of live professional sporting events
Q10. IN-GAME ATTRIBUTES: Please indicate how important each of the following attributes are while attending a live professional sporting event.
Cross tabulations: Millennials Vs. Non-Millennials(Box Scores)

107
RO 2.1. Assess the relative importance of characteristics of live professional sporting events
Q10. IN-GAME ATTRIBUTES: Please indicate how important each of the following attributes are while attending a live professional sporting event.
Cross tabulations: Millennials Vs. Non-Millennials(Box Scores)

108
RO 2.1. Assess the relative importance of characteristics of live professional sporting events
Q10. IN-GAME ATTRIBUTES: Please indicate how important each of the following attributes are while attending a live professional sporting event.
Cross tabulations: Millennials Vs. Non-Millennials(Box Scores)

109
RO 2.1. Assess the relative importance of characteristics of live professional sporting events
Q10. IN-GAME ATTRIBUTES: Please indicate how important each of the following attributes are while attending a live professional sporting event.
Cross tabulations: Millennials Vs. Non-Millennials(Box Scores)

110
RO 2.1. Assess the relative importance of characteristics of live professional sporting events
Q10. IN-GAME ATTRIBUTES: Please indicate how important each of the following attributes are while attending a live professional sporting event.
Factor Analysis (3-Factors Extracted): All Respondents

111
RO 2.1. Assess the relative importance of characteristics of live professional sporting events
Q10. IN-GAME ATTRIBUTES: Please indicate how important each of the following attributes are while attending a live professional sporting event.
Factor Analysis (4-Factors Extracted - Natural): All Respondents

112
RO 2.1. Assess the relative importance of characteristics of live professional sporting events
Descriptive Statistics: All Sample
Q11. POST-GAME ATTRIBUTES: Please indicate how important each of the following attributes are after attending a live professional sporting event.

113
RO 2.1. Assess the relative importance of characteristics of live professional sporting events
Independent Samples T-Test: 2-Way Millennial Groups
Q11. POST-GAME ATTRIBUTES: Please indicate how important each of the following attributes are after attending a live professional sporting event.

114
RO 2.1. Assess the relative importance of characteristics of live professional sporting events
Q11. POST-GAME ATTRIBUTES: Please indicate how important each of the following attributes are after attending a live professional sporting event.
Cross tabulations: Millennials Vs. Non-Millennials(Box Scores)
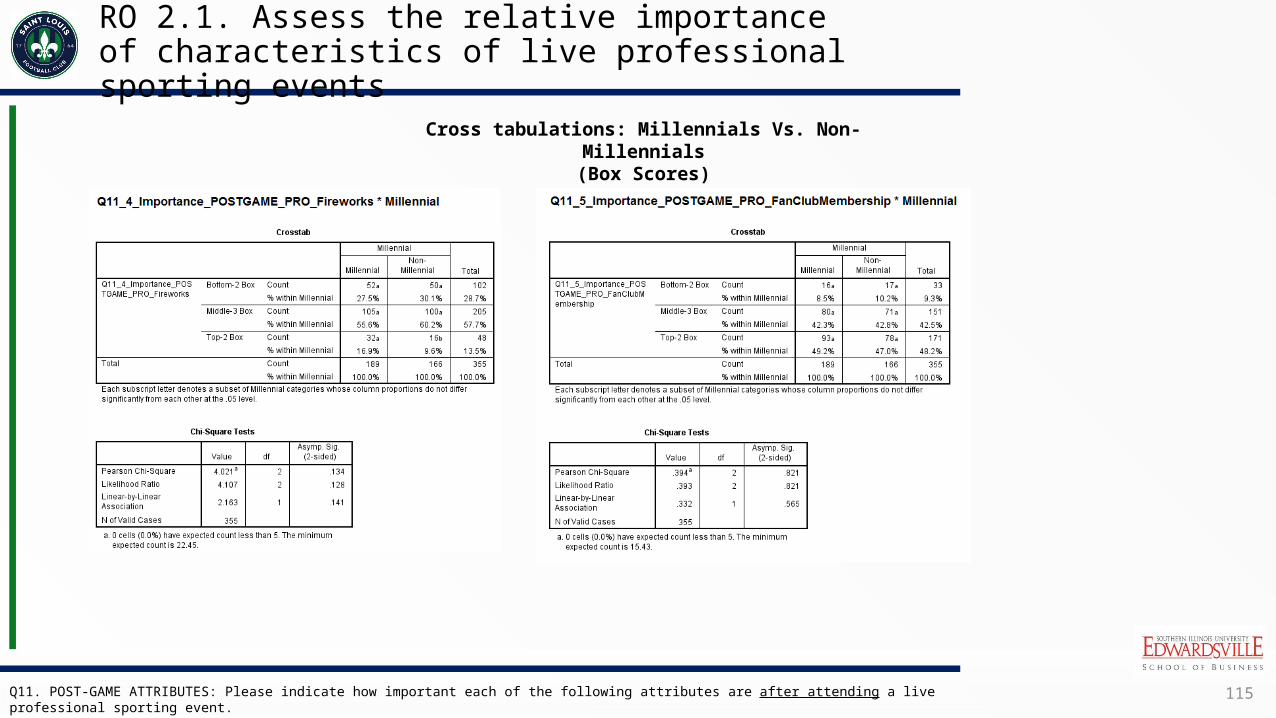
115
RO 2.1. Assess the relative importance of characteristics of live professional sporting events
Q11. POST-GAME ATTRIBUTES: Please indicate how important each of the following attributes are after attending a live professional sporting event.
Cross tabulations: Millennials Vs. Non-Millennials(Box Scores)

116
RO 2.2. Determine the type of atmosphere that Millennials expect from live professional sporting events
Descriptive Statistics: All Sample
Q12. Please indicate your level of agreement with each of the following statement about your attendance at live professional sporting events.
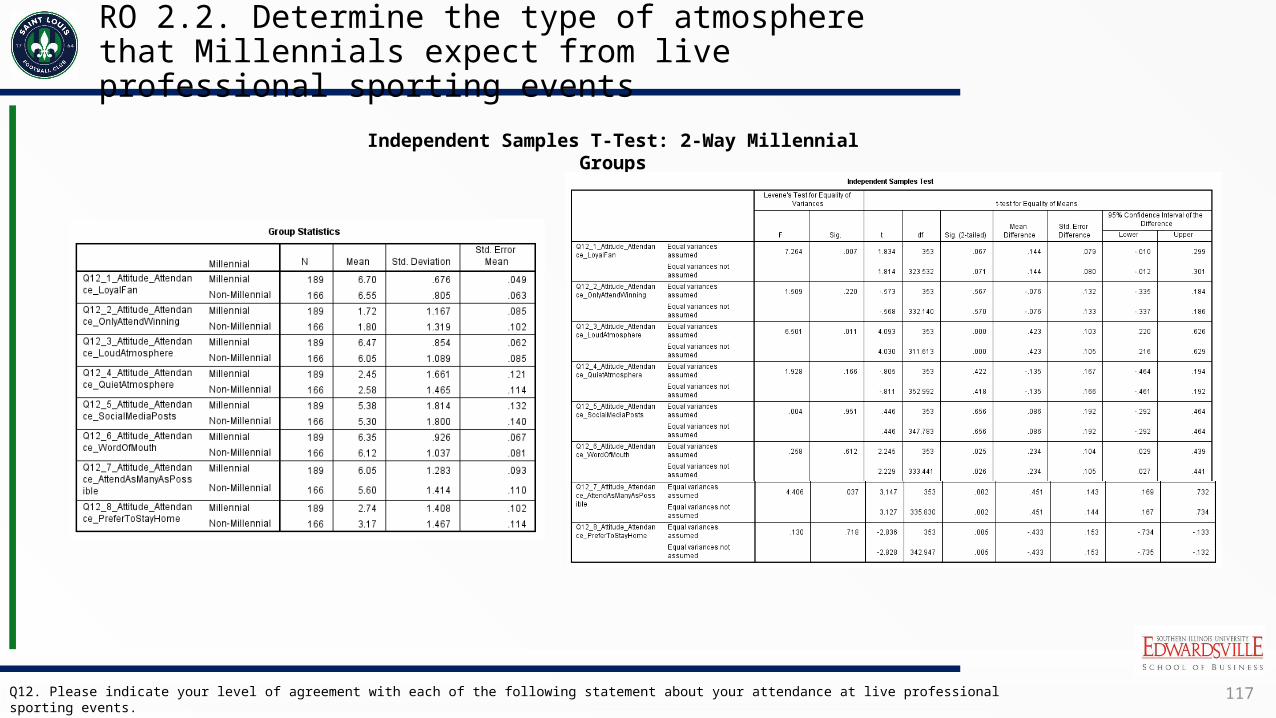
117
RO 2.2. Determine the type of atmosphere that Millennials expect from live professional sporting events
Q12. Please indicate your level of agreement with each of the following statement about your attendance at live professional sporting events.
Independent Samples T-Test: 2-Way Millennial Groups

118
RO 2.2. Determine the type of atmosphere that Millennials expect from live professional sporting events
Q12. Please indicate your level of agreement with each of the following statement about your attendance at live professional sporting events.
Cross tabulations: Millennials Vs. Non-Millennials(Box Scores)

119
RO 2.2. Determine the type of atmosphere that Millennials expect from live professional sporting events
Q12. Please indicate your level of agreement with each of the following statement about your attendance at live professional sporting events.
Cross tabulations: Millennials Vs. Non-Millennials(Box Scores)

120
RO 2.2. Determine the type of atmosphere that Millennials expect from live professional sporting events
Q12. Please indicate your level of agreement with each of the following statement about your attendance at live professional sporting events.
Cross tabulations: Millennials Vs. Non-Millennials(Box Scores)
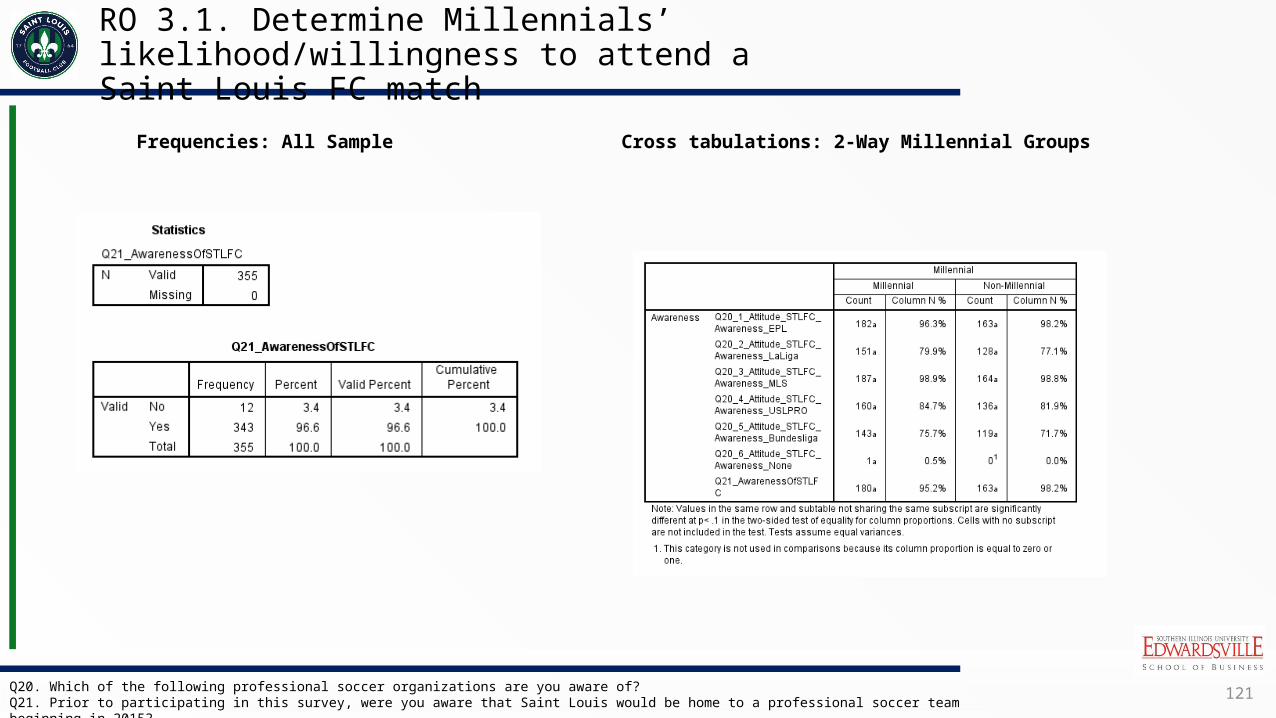
121
RO 3.1. Determine Millennials’ likelihood/willingness to attend a Saint Louis FC match
Frequencies: All Sample Cross tabulations: 2-Way Millennial Groups
Q20. Which of the following professional soccer organizations are you aware of?Q21. Prior to participating in this survey, were you aware that Saint Louis would be home to a professional soccer team beginning in 2015?

122
RO 3.2. Determine Millennials’ likelihood/willingness to purchase Saint Louis FC season tickets
Cross tabulations: 2-Way Millennial Groups
Q22. Knowing this information, please indicate how likely you are to do the following activities.

123
RO 3.2. Determine Millennials’ likelihood/willingness to purchase Saint Louis FC season tickets
Cross tabulations: Millennials Vs. Non-Millennials(Box Scores)
Q22. Knowing this information, please indicate how likely you are to do the following activities.

124
RO 3.2. Determine Millennials’ likelihood/willingness to purchase Saint Louis FC season tickets
Cross tabulations: Millennials Vs. Non-Millennials(Box Scores)
Q22. Knowing this information, please indicate how likely you are to do the following activities.
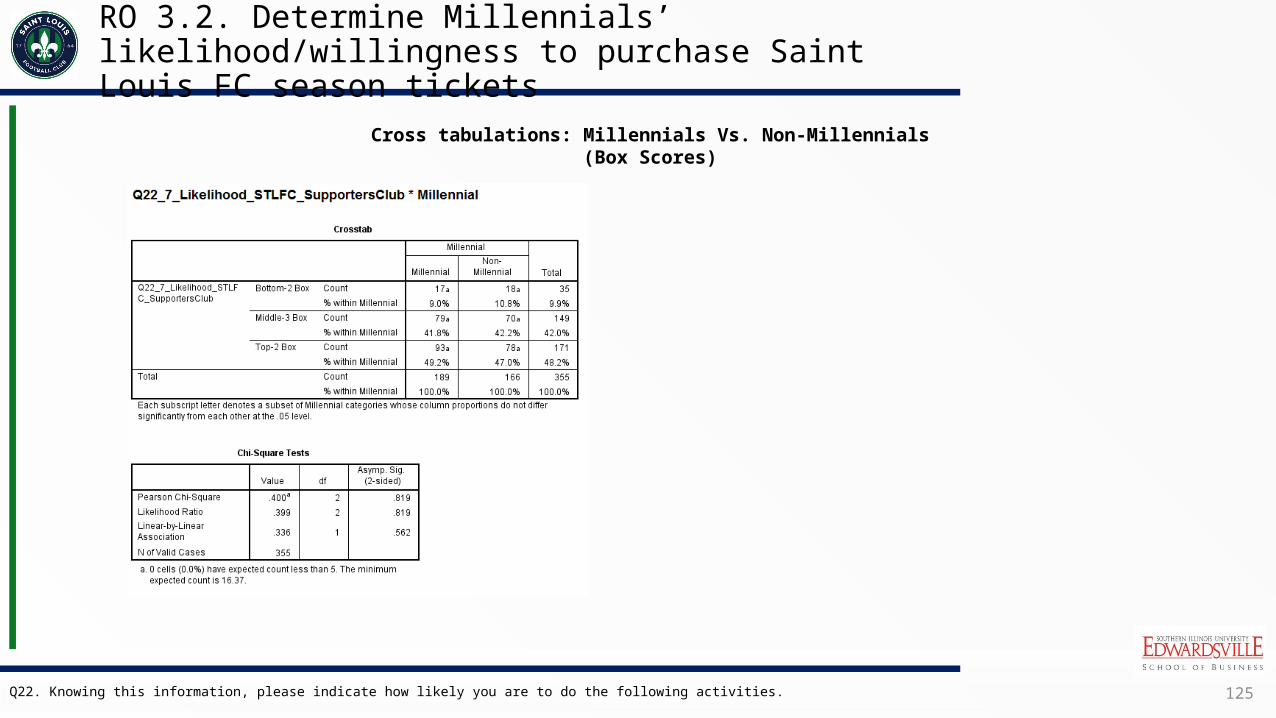
125
RO 3.2. Determine Millennials’ likelihood/willingness to purchase Saint Louis FC season tickets
Cross tabulations: Millennials Vs. Non-Millennials(Box Scores)
Q22. Knowing this information, please indicate how likely you are to do the following activities.

126
RO 5.1. Determine Millennials’ willingness to purchase the products & services of sponsoring companies
Q17. Please indicate how likely you are to purchase the products or services of businesses that support or sponsor your favorite professional sports teams.
Cross tabulations: 2-Way Millennial Groups Cross tabulations: Millennial Vs. Non-Millennial (Box Scores)

127
RO 3.4. Determine Millennials’ preferences of planned initiatives and developments
Q24. For the following list of initiatives and activities, please rank the following list in order of your personal preference, with ‘1’ being “Most preferred” and ‘8’ being “Least preferred.”
Aggregate Analysis Prior to Multidimensional Scaling (Millennials) n=168*
*Reduced base size for respondents aged 21+ only

128
RO 3.4. Determine Millennials’ preferences of planned initiatives and developments
Aggregate Analysis Prior to Multidimensional Scaling (Non-Millennials) n=166
Q24. For the following list of initiatives and activities, please rank the following list in order of your personal preference, with ‘1’ being “Most preferred” and ‘8’ being “Least preferred.”

129
RO 3.4. Determine Millennials’ preferences of planned initiatives and developments
Aggregate Analysis Prior to Multidimensional Scaling (Millennials) n=169*
(Non-Millennials) n=166
*Reduced base size for respondents aged 21+ only
Q24. For the following list of initiatives and activities, please rank the following list in order of your personal preference, with ‘1’ being “Most preferred” and ‘8’ being “Least preferred.”

130
RO 3.4. Determine Millennials’ preferences of planned initiatives and developments
Cross tabulations: Millennials Vs. Non-Millennials (Top-3 Box Preference Rankings)
Q24. For the following list of initiatives and activities, please rank the following list in order of your personal preference, with ‘1’ being “Most preferred” and ‘8’ being “Least preferred.”

131
RO 3.4. Determine Millennials’ preferences of planned initiatives and developments
Cross tabulations: Millennials Vs. Non-Millennials (Top-3 Box Preference Rankings)
Q24. For the following list of initiatives and activities, please rank the following list in order of your personal preference, with ‘1’ being “Most preferred” and ‘8’ being “Least preferred.”

132
RO 3.4. Determine Millennials’ preferences of planned initiatives and developments
Cross tabulations: Millennials Vs. Non-Millennials (Top-3 Box Preference Rankings)
Q24. For the following list of initiatives and activities, please rank the following list in order of your personal preference, with ‘1’ being “Most preferred” and ‘8’ being “Least preferred.”

133
RO 3.4. Determine Millennials’ preferences of planned initiatives and developments
Cross tabulations: Millennials Vs. Non-Millennials (Top-3 Box Preference Rankings)
Q24. For the following list of initiatives and activities, please rank the following list in order of your personal preference, with ‘1’ being “Most preferred” and ‘8’ being “Least preferred.”

134
RO 3.4. Determine Millennials’ preferences of planned initiatives and developments
Cross tabulations: Millennials Vs. Non-Millennials (Top-3 Box Preference Rankings)
Q24. For the following list of initiatives and activities, please rank the following list in order of your personal preference, with ‘1’ being “Most preferred” and ‘8’ being “Least preferred.”

135
RO 3.4. Determine Millennials’ preferences of planned initiatives and developments
Cross tabulations: Millennials Vs. Non-Millennials
Q24. For the following list of initiatives and activities, please rank the following list in order of your personal preference, with ‘1’ being “Most preferred” and ‘8’ being “Least preferred.”
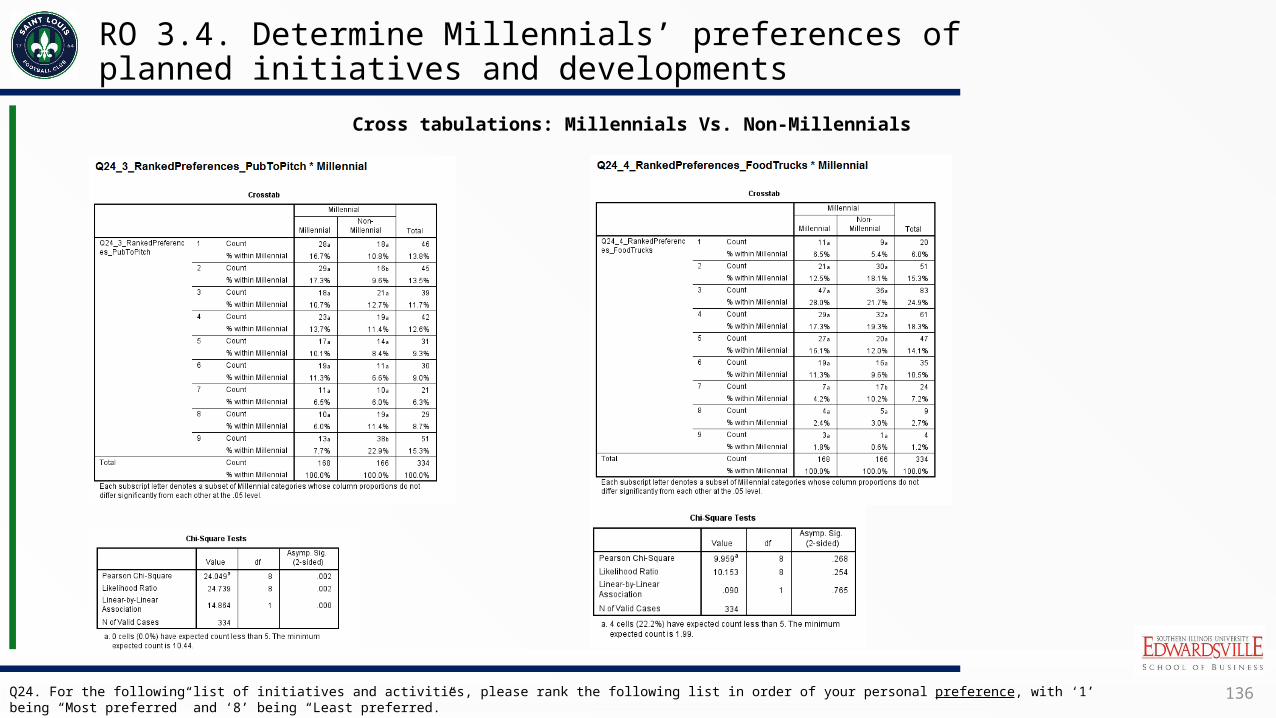
136
RO 3.4. Determine Millennials’ preferences of planned initiatives and developments
Cross tabulations: Millennials Vs. Non-Millennials
Q24. For the following list of initiatives and activities, please rank the following list in order of your personal preference, with ‘1’ being “Most preferred” and ‘8’ being “Least preferred.”
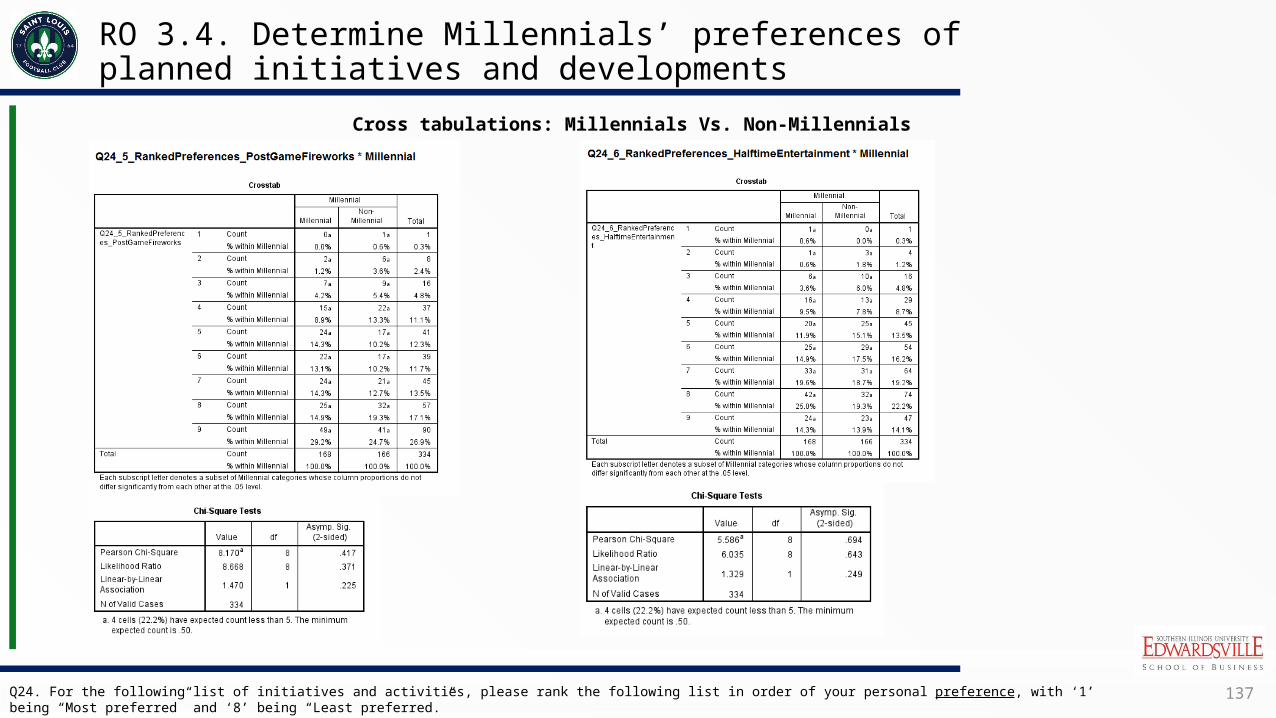
137
RO 3.4. Determine Millennials’ preferences of planned initiatives and developments
Cross tabulations: Millennials Vs. Non-Millennials
Q24. For the following list of initiatives and activities, please rank the following list in order of your personal preference, with ‘1’ being “Most preferred” and ‘8’ being “Least preferred.”

138
RO 3.4. Determine Millennials’ preferences of planned initiatives and developments
Cross tabulations: Millennials Vs. Non-Millennials
Q24. For the following list of initiatives and activities, please rank the following list in order of your personal preference, with ‘1’ being “Most preferred” and ‘8’ being “Least preferred.”

139
RO 3.4. Determine Millennials’ preferences of planned initiatives and developments
Cross tabulations: Millennials Vs. Non-Millennials
Q24. For the following list of initiatives and activities, please rank the following list in order of your personal preference, with ‘1’ being “Most preferred” and ‘8’ being “Least preferred.”

140
RO 4.1. Determine whether there are significant differences between the overall Millennial category and other age categories
Independent Samples T-test: Millennials Vs. Non-Millennials
Q32. On a scale of 1-7, with ‘1’ being “Not at all agree” and ‘7’ being “Completely agree,” please indicate your level of agreement with the following statements.

141
RO 4.1. Determine whether there are significant differences between the overall Millennial category and other age categories
Cross tabulations: Millennials Vs. Non-Millennials (Box Scores)
Q32. On a scale of 1-7, with ‘1’ being “Not at all agree” and ‘7’ being “Completely agree,” please indicate your level of agreement with the following statements.
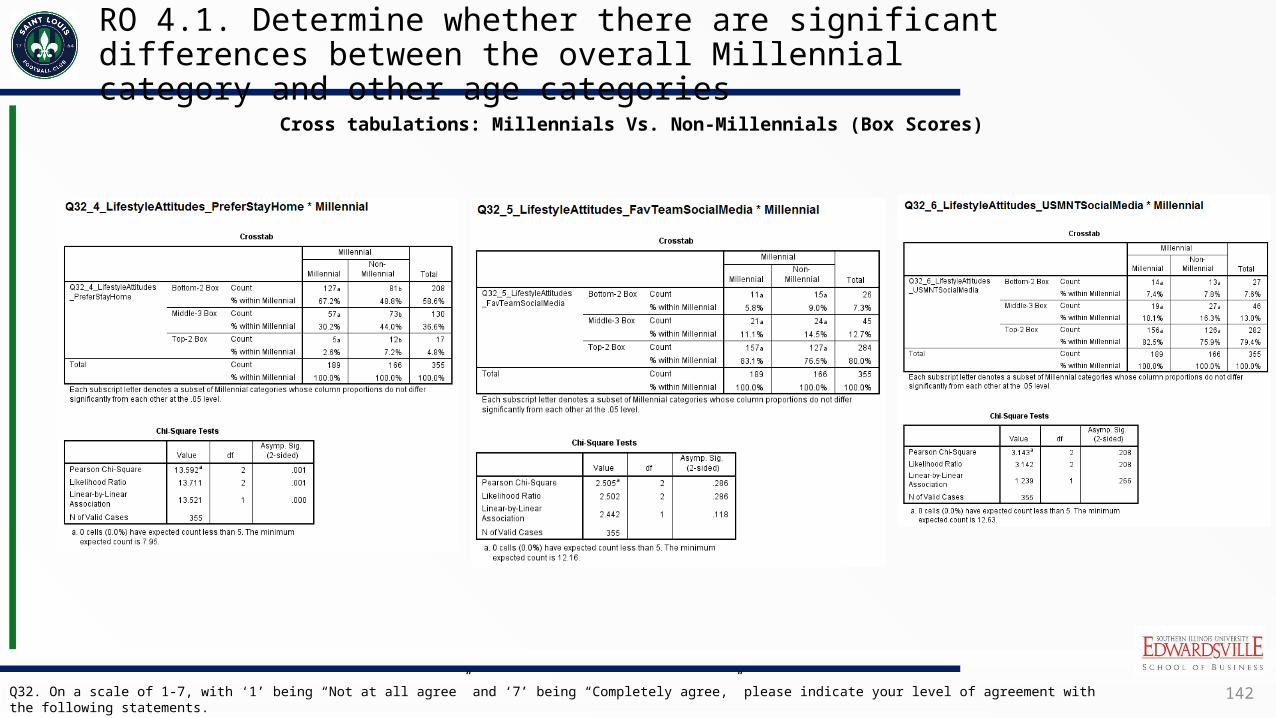
142
RO 4.1. Determine whether there are significant differences between the overall Millennial category and other age categories
Cross tabulations: Millennials Vs. Non-Millennials (Box Scores)
Q32. On a scale of 1-7, with ‘1’ being “Not at all agree” and ‘7’ being “Completely agree,” please indicate your level of agreement with the following statements.

143
RO 4.1. Determine whether there are significant differences between the overall Millennial category and other age categories
Cross tabulations: Millennials Vs. Non-Millennials (Box Scores)
Q32. On a scale of 1-7, with ‘1’ being “Not at all agree” and ‘7’ being “Completely agree,” please indicate your level of agreement with the following statements.

144
RO 5.1. Determine Millennials’ willingness to purchase the products & services of sponsoring companies
Q17. Please indicate how likely you are to purchase the products or services of businesses that support or sponsor your favorite professional sports teams.
Cross tabulations: Millennial Vs. Non-Millennial (Box Scores)

145
RO 6.1. Determine the most prevalent sources and channels that Millennials use to find information about their favorite sports teams
Independent Samples T-test: Millennial Vs. Non-Millennial
Q13. Please indicate your level of agreement with the following statements about your favorite professional sports teams.

146
RO 6.1. Determine the most prevalent sources and channels that Millennials use to find information about their favorite sports teams
Q13. Please indicate your level of agreement with the following statements about your favorite professional sports teams.
Cross tabulations: Millennial Vs. Non-Millennial (Box Scores)

147
RO 6.1. Determine the most prevalent sources and channels that Millennials use to find information about their favorite sports teams
Q15. Please indicate how likely you are to use the following to find out information or keep updated about your favorite professional sports teams.
Independent Samples T-test: Millennial Vs. Non-Millennial

148
RO 6.1. Determine the most prevalent sources and channels that Millennials use to find information about their favorite sports teams
Q15. Please indicate how likely you are to use the following to find out information or keep updated about your favorite professional sports teams.
Cross tabulations: Millennial Vs. Non-Millennial (Box Scores)

149
RO 6.1. Determine the most prevalent sources and channels that Millennials use to find information about their favorite sports teams
Q15. Please indicate how likely you are to use the following to find out information or keep updated about your favorite professional sports teams.
Cross tabulations: Millennial Vs. Non-Millennial (Box Scores)
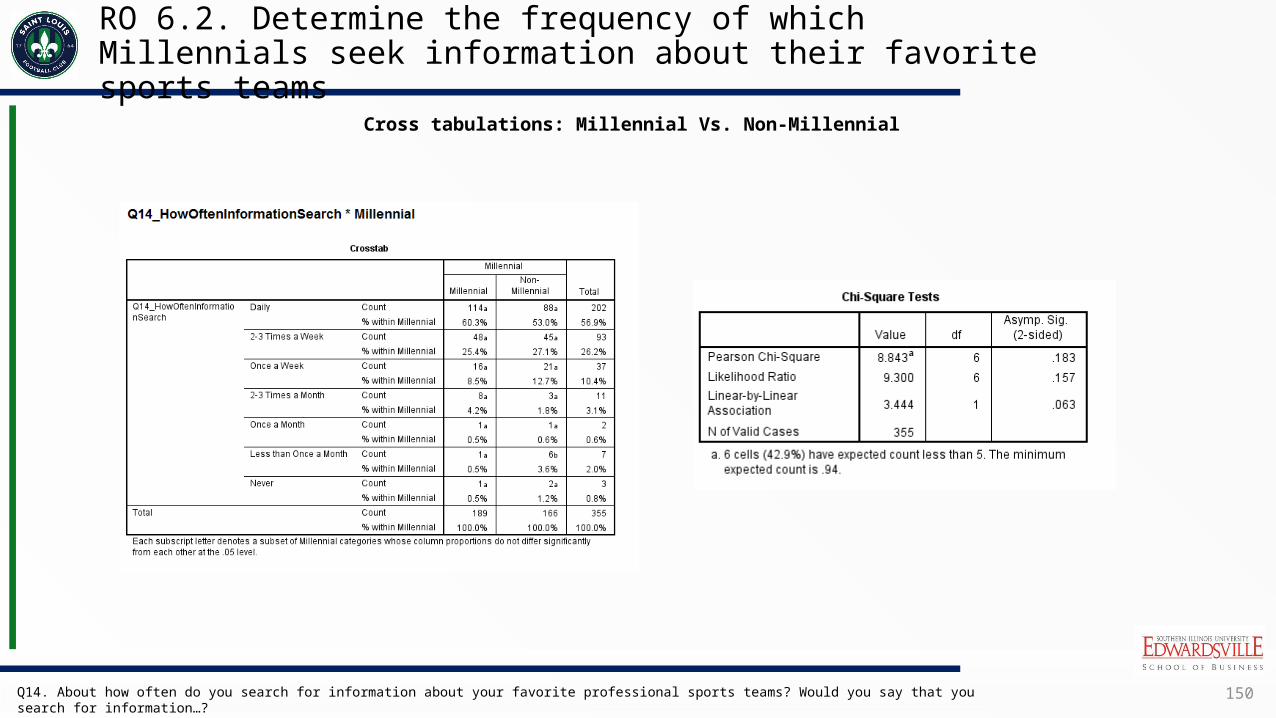
150
RO 6.2. Determine the frequency of which Millennials seek information about their favorite sports teams
Cross tabulations: Millennial Vs. Non-Millennial
Q14. About how often do you search for information about your favorite professional sports teams? Would you say that you search for information…?

151
Online Survey

152
Online Survey

153
Online Survey

154
Online Survey
155
Online Survey

156
Online Survey

157
Online Survey

158
Online Survey
159
Online Survey

160
Online Survey

161
Online Survey

162
Online Survey

163
Online Survey

164
Online Survey
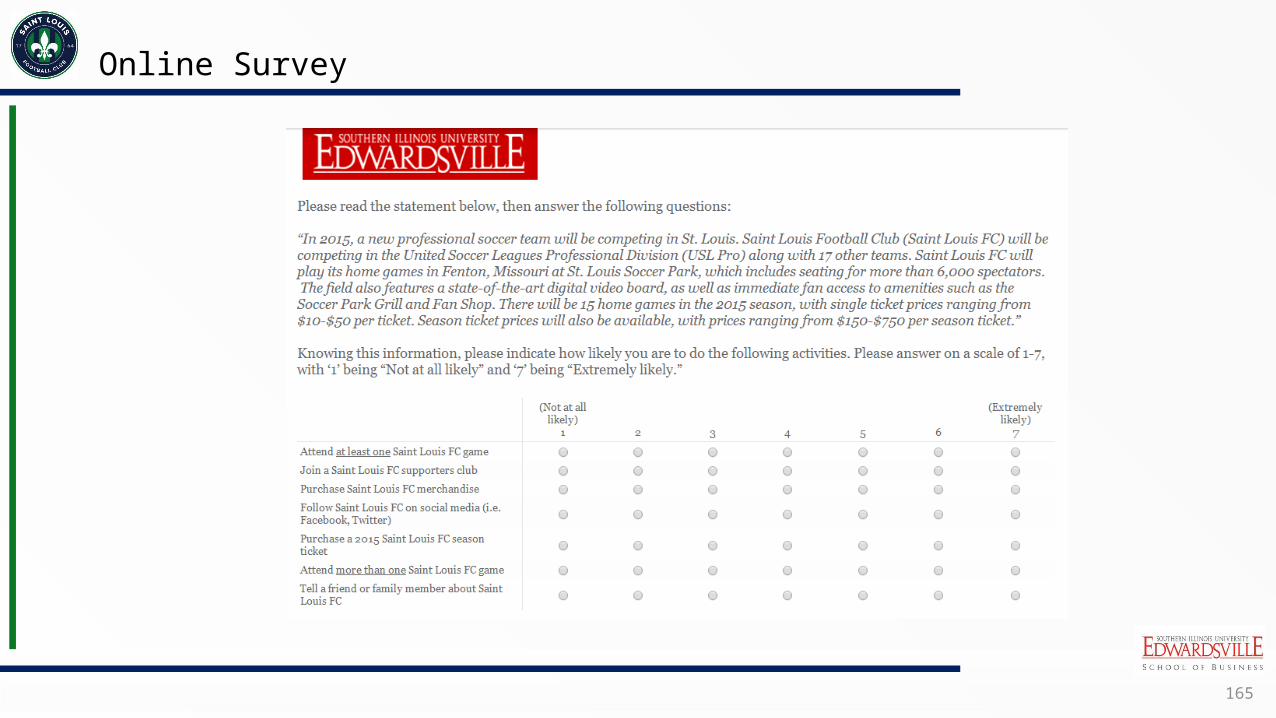
165
Online Survey

166
Online Survey
167
Online Survey

168
Online Survey
169
Online Survey

170
Online Survey
Related Documents