A Forrester Total Economic Impact™ Study Commissioned By Sage Project Director: Bob Cormier Vice President And Principal Consultant January 2016 The Total Economic Impact™ Of Sage X3 Cost Savings And Business Benefits Attributed To Sage X3

Welcome message from author
This document is posted to help you gain knowledge. Please leave a comment to let me know what you think about it! Share it to your friends and learn new things together.
Transcript

A Forrester Total Economic
Impact™ Study
Commissioned By Sage
Project Director:
Bob Cormier
Vice President And
Principal Consultant
January 2016
The Total Economic Impact™ Of Sage X3 Cost Savings And Business Benefits Attributed To Sage X3
Table Of Contents
Executive Summary .................................................................................... 3
Disclosures .................................................................................................. 5
TEI Framework And Methodology ............................................................ 6
Analysis ........................................................................................................ 7
Financial Summary ................................................................................... 18
Appendix A: About The Sage X3 Solution ............................................. 19
Appendix B: Total Economic Impact™ Overview ................................. 21
Appendix C: Glossary ............................................................................... 22
ABOUT FORRESTER CONSULTING
Forrester Consulting provides independent and objective research-based
consulting to help leaders succeed in their organizations. Ranging in scope from a
short strategy session to custom projects, Forrester’s Consulting services connect
you directly with research analysts who apply expert insight to your specific
business challenges. For more information, visit forrester.com/consulting.
© 2016, Forrester Research, Inc. All rights reserved. Unauthorized reproduction is strictly prohibited.
Information is based on best available resources. Opinions reflect judgment at the time and are subject to
change. Forrester®, Technographics®, Forrester Wave, RoleView, TechRadar, and Total Economic Impact are trademarks of Forrester Research, Inc. All other trademarks are the property of their respective companies. For additional information, go to www.forrester.com.
3
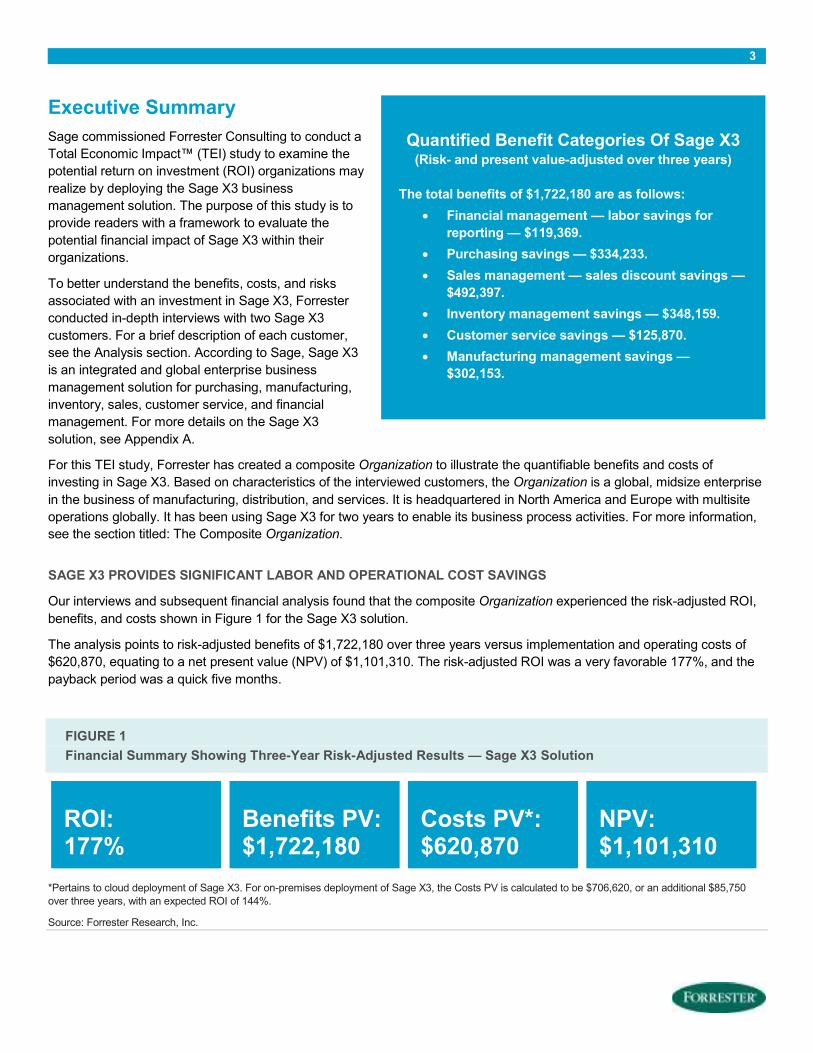
Executive Summary
Sage commissioned Forrester Consulting to conduct a
Total Economic Impact™ (TEI) study to examine the
potential return on investment (ROI) organizations may
realize by deploying the Sage X3 business
management solution. The purpose of this study is to
provide readers with a framework to evaluate the
potential financial impact of Sage X3 within their
organizations.
To better understand the benefits, costs, and risks
associated with an investment in Sage X3, Forrester
conducted in-depth interviews with two Sage X3
customers. For a brief description of each customer,
see the Analysis section. According to Sage, Sage X3
is an integrated and global enterprise business
management solution for purchasing, manufacturing,
inventory, sales, customer service, and financial
management. For more details on the Sage X3
solution, see Appendix A.
For this TEI study, Forrester has created a composite Organization to illustrate the quantifiable benefits and costs of
investing in Sage X3. Based on characteristics of the interviewed customers, the Organization is a global, midsize enterprise
in the business of manufacturing, distribution, and services. It is headquartered in North America and Europe with multisite
operations globally. It has been using Sage X3 for two years to enable its business process activities. For more information,
see the section titled: The Composite Organization.
SAGE X3 PROVIDES SIGNIFICANT LABOR AND OPERATIONAL COST SAVINGS
Our interviews and subsequent financial analysis found that the composite Organization experienced the risk-adjusted ROI,
benefits, and costs shown in Figure 1 for the Sage X3 solution.
The analysis points to risk-adjusted benefits of $1,722,180 over three years versus implementation and operating costs of
$620,870, equating to a net present value (NPV) of $1,101,310. The risk-adjusted ROI was a very favorable 177%, and the
payback period was a quick five months.
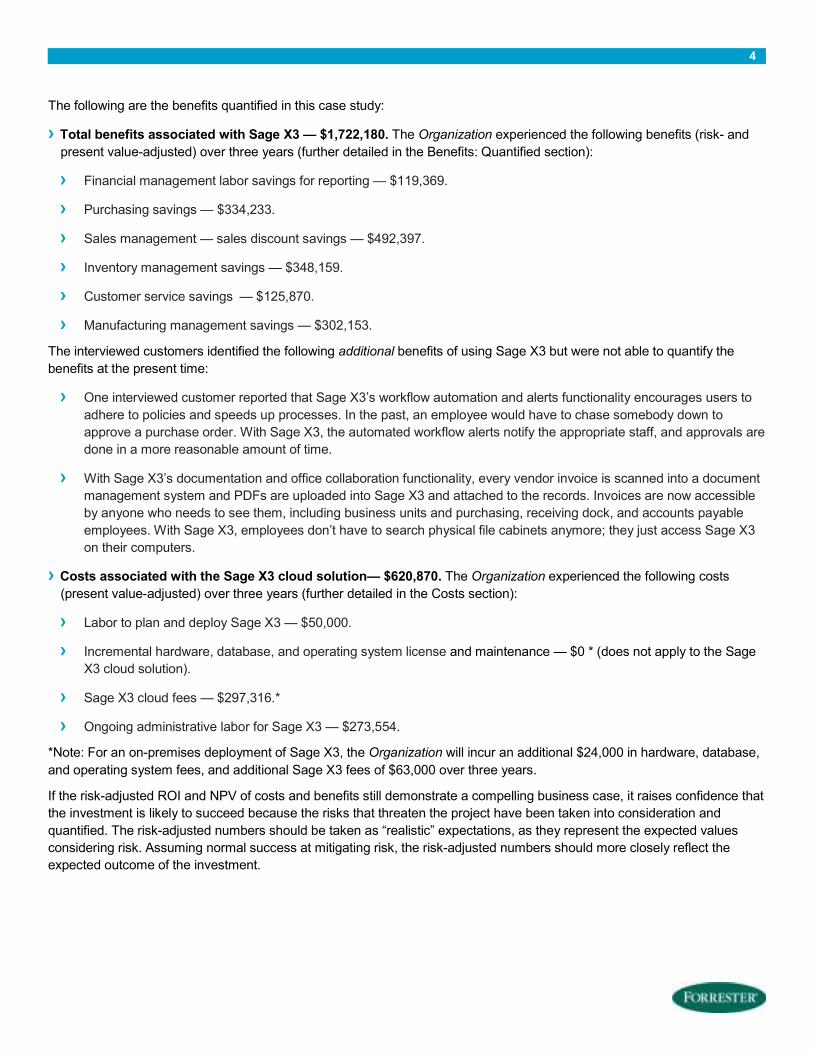
FIGURE 1
Financial Summary Showing Three-Year Risk-Adjusted Results — Sage X3 Solution
ROI: 177%
Benefits PV: $1,722,180
Costs PV*: $620,870
NPV: $1,101,310
*Pertains to cloud deployment of Sage X3. For on-premises deployment of Sage X3, the Costs PV is calculated to be $706,620, or an additional $85,750 over three years, with an expected ROI of 144%.
Source: Forrester Research, Inc.
Quantified Benefit Categories Of Sage X3 (Risk- and present value-adjusted over three years)
The total benefits of $1,722,180 are as follows:
• Financial management — labor savings for
reporting — $119,369.
• Purchasing savings — $334,233.
• Sales management — sales discount savings —
$492,397.
• Inventory management savings — $348,159.
• Customer service savings — $125,870.
• Manufacturing management savings —
$302,153.
4
The following are the benefits quantified in this case study:
› Total benefits associated with Sage X3 — $1,722,180. The Organization experienced the following benefits (risk- and present value-adjusted) over three years (further detailed in the Benefits: Quantified section):
› Financial management labor savings for reporting — $119,369.
› Purchasing savings — $334,233.
› Sales management — sales discount savings — $492,397.
› Inventory management savings — $348,159.
› Customer service savings — $125,870.
› Manufacturing management savings — $302,153.
The interviewed customers identified the following additional benefits of using Sage X3 but were not able to quantify the
benefits at the present time:
› One interviewed customer reported that Sage X3’s workflow automation and alerts functionality encourages users to
adhere to policies and speeds up processes. In the past, an employee would have to chase somebody down to
approve a purchase order. With Sage X3, the automated workflow alerts notify the appropriate staff, and approvals are
done in a more reasonable amount of time.
› With Sage X3’s documentation and office collaboration functionality, every vendor invoice is scanned into a document
management system and PDFs are uploaded into Sage X3 and attached to the records. Invoices are now accessible
by anyone who needs to see them, including business units and purchasing, receiving dock, and accounts payable
employees. With Sage X3, employees don’t have to search physical file cabinets anymore; they just access Sage X3
on their computers.
› Costs associated with the Sage X3 cloud solution— $620,870. The Organization experienced the following costs
(present value-adjusted) over three years (further detailed in the Costs section):
› Labor to plan and deploy Sage X3 — $50,000.
› Incremental hardware, database, and operating system license and maintenance — $0 * (does not apply to the Sage
X3 cloud solution).
› Sage X3 cloud fees — $297,316.*
› Ongoing administrative labor for Sage X3 — $273,554.
*Note: For an on-premises deployment of Sage X3, the Organization will incur an additional $24,000 in hardware, database,
and operating system fees, and additional Sage X3 fees of $63,000 over three years.
If the risk-adjusted ROI and NPV of costs and benefits still demonstrate a compelling business case, it raises confidence that
the investment is likely to succeed because the risks that threaten the project have been taken into consideration and
quantified. The risk-adjusted numbers should be taken as “realistic” expectations, as they represent the expected values
considering risk. Assuming normal success at mitigating risk, the risk-adjusted numbers should more closely reflect the
expected outcome of the investment.
5
Disclosures
The reader should be aware of the following:
› The study is commissioned by Sage and delivered by Forrester Consulting. It is not meant to be used as a competitive analysis.
› Forrester makes no assumptions as to the potential return on investment that other organizations will receive. Forrester strongly advises that readers use their own estimates within the framework provided in the study to determine the
appropriateness of an investment in Sage X3.
› Sage reviewed and provided feedback to Forrester, but Forrester maintained editorial control over the study and its findings and did not accept changes to the study that contradict Forrester’s findings or obscure the meaning of the study.
› The interviewed customers’ names were provided by Sage, and they were users of the Sage X3 on-premises solution. Sage did not participate in the interviews.

6
TEI Framework And Methodology
INTRODUCTION
From the information provided in the interviews, Forrester has constructed a Total Economic Impact (TEI) framework for
those organizations considering investing in Sage X3. The objective of the framework is to identify the benefits, costs,
flexibility, and risk factors that affect the investment decision.
APPROACH AND METHODOLOGY
Forrester employed four fundamental elements of TEI in modeling Sage X3: benefits, costs, flexibility, and risks.
Forrester took a multistep approach to evaluate the impact that Sage X3 can have on the composite Organization (see
Figure 2). Specifically, we:
› Interviewed Sage marketing, sales, and product management personnel to better understand the value proposition for Sage X3.
› Conducted in-depth interviews with each of the two customers to obtain data with respect to costs, benefits, flexibility, and risks.
› Designed a composite Organization based on characteristics of the interviewed customers.
› Constructed a financial model representative of the interviews using the TEI methodology. The financial model is populated with the cost and benefit data obtained from the interviews.
› Risk-adjusted the financial model based on minor issues and concerns the customers raised in the interviews. Risk adjustment is a key part of the TEI methodology. While the interviewed customers provided cost and benefit estimates,
some categories included future projections or a broad range of responses, or had a number of internal or external forces
that might have raised or lowered costs and benefits. For that reason, each benefit has been risk-adjusted and is detailed
in the Benefits: Quantified section.
Given the increasing sophistication that enterprises have regarding ROI analyses related to technology investments,
Forrester’s TEI methodology serves to provide a complete picture of the total economic impact of purchase decisions.
Please see Appendix B for additional information on the TEI methodology.
FIGURE 2
TEI Approach
Source: Forrester Research, Inc.
Perform due diligence
Conduct customer interviews
Design composite organization
Construct financial
model using TEI framework
Write case study
7
Analysis
INTERVIEWED CUSTOMERS
Forrester derived its conclusions in large part from information received in a series of in-depth interviews we conducted with
personnel at two Sage X3 customers, each of which had been using Sage X3 for at least 30 months. The following is a brief
description of the interviewed customers, each of which was promised anonymity:
› A European-based process manufacturing company that engineers, designs, and manufactures a variety of specialty products. It has 800 employees with additional operations in the US and APAC. It has been using all Sage X3 on-premises
modules for 30 months. Forrester interviewed the company’s group manager for enterprise systems.
› A US-based manufacturer of custom molded products. It has 140 employees, 55 of whom are regular Sage X3 users. It has been using all Sage X3 on-premises modules (except document and office collaboration) for over three years.
Forrester interviewed the vice president and chief information officer (CIO).
THE COMPOSITE ORGANIZATION
For this TEI study, Forrester created a composite Organization to illustrate the quantifiable benefits and costs of investing in Sage X3. The composite Organization is a global, midsize enterprise in the business of manufacturing, distribution, and providing services. It is headquartered in North America and Europe with multisite operations globally. It has been using Sage X3 for two years to integrate its business process activities and currently has 50 active users of Sage X3. After an extensive review process evaluating several vendors, the Organization selected Sage X3 as it believed it could satisfy the following business goals and objectives:
› Consolidate disparate business systems into one enterprisewide ERP solution.
› Achieve process and product consistency across its varied operations.
› Gain real-time visibility and insights across the global supply chain.
› Accommodate future merger and acquisition activity.
› Have a more lean and agile organization.
› Have web access support for its mobile salesforce.
The Organization was hoping an investment in Sage X3 could mitigate the following challenges and pain points:
› The Organization was outgrowing the capacity of existing business management software.
› Inefficiencies of its legacy business management systems were undermining growth potential.
› It was losing insight into operations because of organizational growth and loosely integrated management tools.
› It had a need to stay competitive within a limited budget.
› It had a need for more agility and flexibility in an ERP solution.
The Organization has invested in and is using the following Sage X3 modules in production:
› Financial/accounting management.
8
› Purchasing.
› Sales management.
› Inventory management.
› Customer service.
› Manufacturing management.
› Reporting and business analytics.
› Workflow automation and alerts.
› Document and office collaboration.
BENEFITS: QUANTIFIED
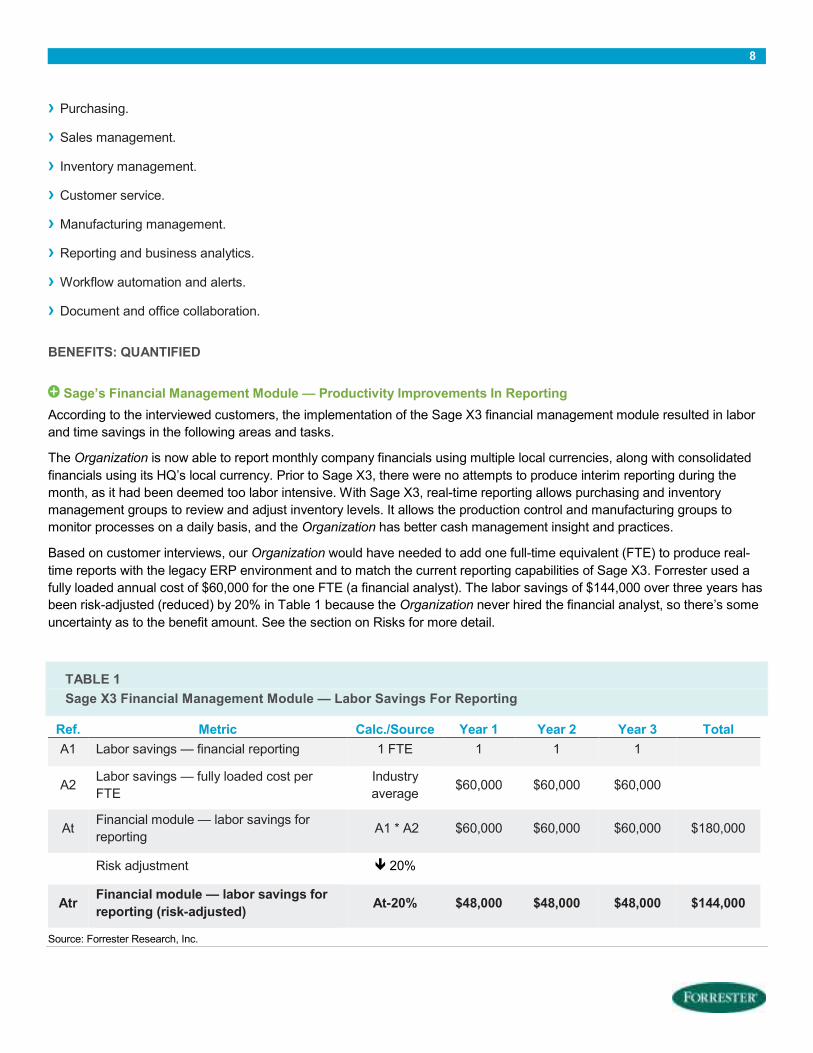
Sage’s Financial Management Module — Productivity Improvements In Reporting
According to the interviewed customers, the implementation of the Sage X3 financial management module resulted in labor
and time savings in the following areas and tasks.
The Organization is now able to report monthly company financials using multiple local currencies, along with consolidated
financials using its HQ’s local currency. Prior to Sage X3, there were no attempts to produce interim reporting during the
month, as it had been deemed too labor intensive. With Sage X3, real-time reporting allows purchasing and inventory
management groups to review and adjust inventory levels. It allows the production control and manufacturing groups to
monitor processes on a daily basis, and the Organization has better cash management insight and practices.
Based on customer interviews, our Organization would have needed to add one full-time equivalent (FTE) to produce real-
time reports with the legacy ERP environment and to match the current reporting capabilities of Sage X3. Forrester used a
fully loaded annual cost of $60,000 for the one FTE (a financial analyst). The labor savings of $144,000 over three years has
been risk-adjusted (reduced) by 20% in Table 1 because the Organization never hired the financial analyst, so there’s some
uncertainty as to the benefit amount. See the section on Risks for more detail.
TABLE 1
Sage X3 Financial Management Module — Labor Savings For Reporting
Ref. Metric Calc./Source Year 1 Year 2 Year 3 Total
A1 Labor savings — financial reporting 1 FTE 1 1 1
A2 Labor savings — fully loaded cost per
FTE
Industry
average $60,000 $60,000 $60,000
At Financial module — labor savings for
reporting A1 * A2 $60,000 $60,000 $60,000 $180,000
Risk adjustment � 20%
Atr Financial module — labor savings for
reporting (risk-adjusted) At-20% $48,000 $48,000 $48,000 $144,000
Source: Forrester Research, Inc.
9
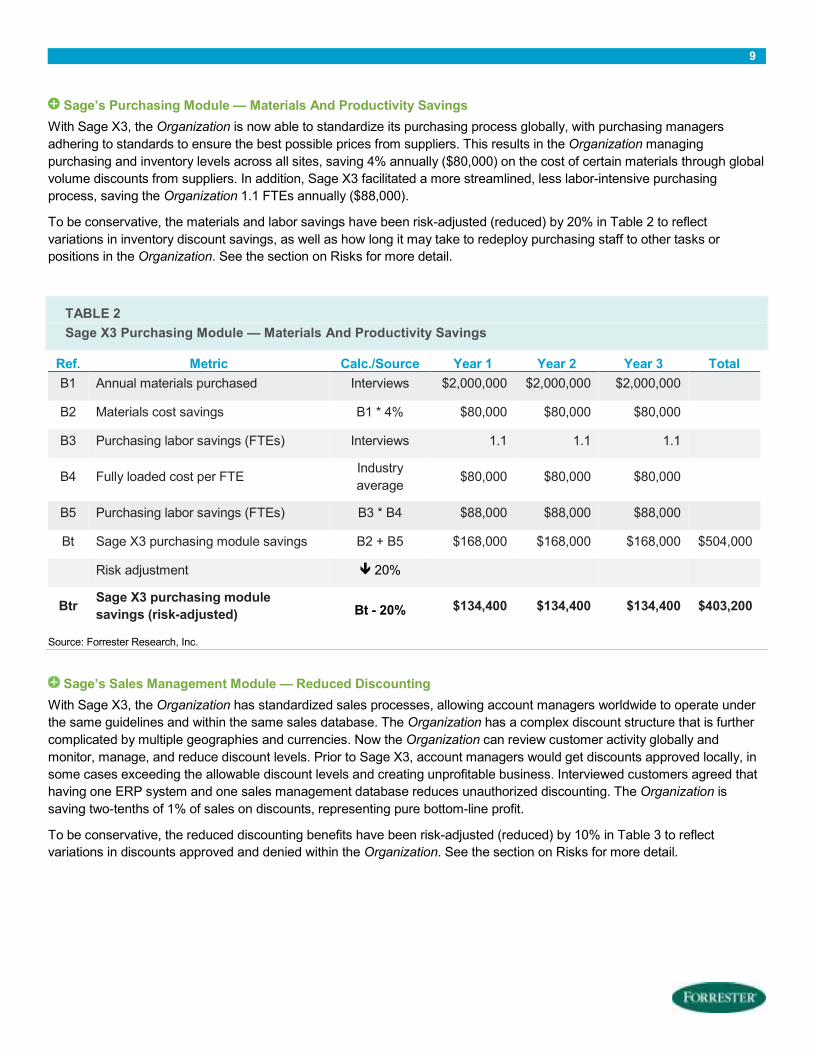
Sage’s Purchasing Module — Materials And Productivity Savings
With Sage X3, the Organization is now able to standardize its purchasing process globally, with purchasing managers
adhering to standards to ensure the best possible prices from suppliers. This results in the Organization managing
purchasing and inventory levels across all sites, saving 4% annually ($80,000) on the cost of certain materials through global
volume discounts from suppliers. In addition, Sage X3 facilitated a more streamlined, less labor-intensive purchasing
process, saving the Organization 1.1 FTEs annually ($88,000).
To be conservative, the materials and labor savings have been risk-adjusted (reduced) by 20% in Table 2 to reflect
variations in inventory discount savings, as well as how long it may take to redeploy purchasing staff to other tasks or
positions in the Organization. See the section on Risks for more detail.
TABLE 2
Sage X3 Purchasing Module — Materials And Productivity Savings
Ref. Metric Calc./Source Year 1 Year 2 Year 3 Total
B1 Annual materials purchased Interviews $2,000,000 $2,000,000 $2,000,000
B2 Materials cost savings B1 * 4% $80,000 $80,000 $80,000
B3 Purchasing labor savings (FTEs) Interviews 1.1 1.1 1.1
B4 Fully loaded cost per FTE Industry
average $80,000 $80,000 $80,000
B5 Purchasing labor savings (FTEs) B3 * B4 $88,000 $88,000 $88,000
Bt Sage X3 purchasing module savings B2 + B5 $168,000 $168,000 $168,000 $504,000
Risk adjustment � 20%
Btr Sage X3 purchasing module
savings (risk-adjusted) Bt - 20% $134,400 $134,400 $134,400 $403,200
Source: Forrester Research, Inc.
Sage’s Sales Management Module — Reduced Discounting
With Sage X3, the Organization has standardized sales processes, allowing account managers worldwide to operate under
the same guidelines and within the same sales database. The Organization has a complex discount structure that is further
complicated by multiple geographies and currencies. Now the Organization can review customer activity globally and
monitor, manage, and reduce discount levels. Prior to Sage X3, account managers would get discounts approved locally, in
some cases exceeding the allowable discount levels and creating unprofitable business. Interviewed customers agreed that
having one ERP system and one sales management database reduces unauthorized discounting. The Organization is
saving two-tenths of 1% of sales on discounts, representing pure bottom-line profit.
To be conservative, the reduced discounting benefits have been risk-adjusted (reduced) by 10% in Table 3 to reflect
variations in discounts approved and denied within the Organization. See the section on Risks for more detail.
10
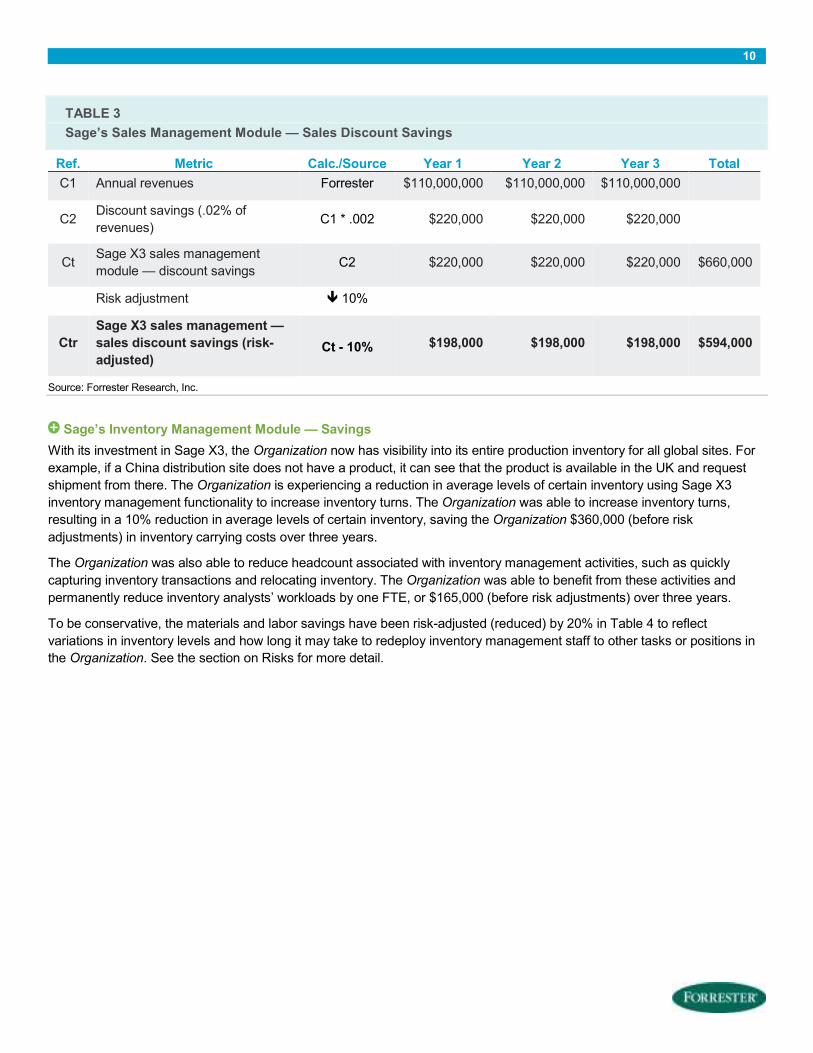
TABLE 3
Sage’s Sales Management Module — Sales Discount Savings
Ref. Metric Calc./Source Year 1 Year 2 Year 3 Total
C1 Annual revenues Forrester $110,000,000 $110,000,000 $110,000,000
C2 Discount savings (.02% of
revenues) C1 * .002 $220,000 $220,000 $220,000
Ct Sage X3 sales management
module — discount savings C2 $220,000 $220,000 $220,000 $660,000
Risk adjustment � 10%
Ctr
Sage X3 sales management —
sales discount savings (risk-
adjusted) Ct - 10% $198,000 $198,000 $198,000 $594,000
Source: Forrester Research, Inc.
Sage’s Inventory Management Module — Savings
With its investment in Sage X3, the Organization now has visibility into its entire production inventory for all global sites. For
example, if a China distribution site does not have a product, it can see that the product is available in the UK and request
shipment from there. The Organization is experiencing a reduction in average levels of certain inventory using Sage X3
inventory management functionality to increase inventory turns. The Organization was able to increase inventory turns,
resulting in a 10% reduction in average levels of certain inventory, saving the Organization $360,000 (before risk
adjustments) in inventory carrying costs over three years.
The Organization was also able to reduce headcount associated with inventory management activities, such as quickly
capturing inventory transactions and relocating inventory. The Organization was able to benefit from these activities and
permanently reduce inventory analysts’ workloads by one FTE, or $165,000 (before risk adjustments) over three years.
To be conservative, the materials and labor savings have been risk-adjusted (reduced) by 20% in Table 4 to reflect
variations in inventory levels and how long it may take to redeploy inventory management staff to other tasks or positions in
the Organization. See the section on Risks for more detail.
11
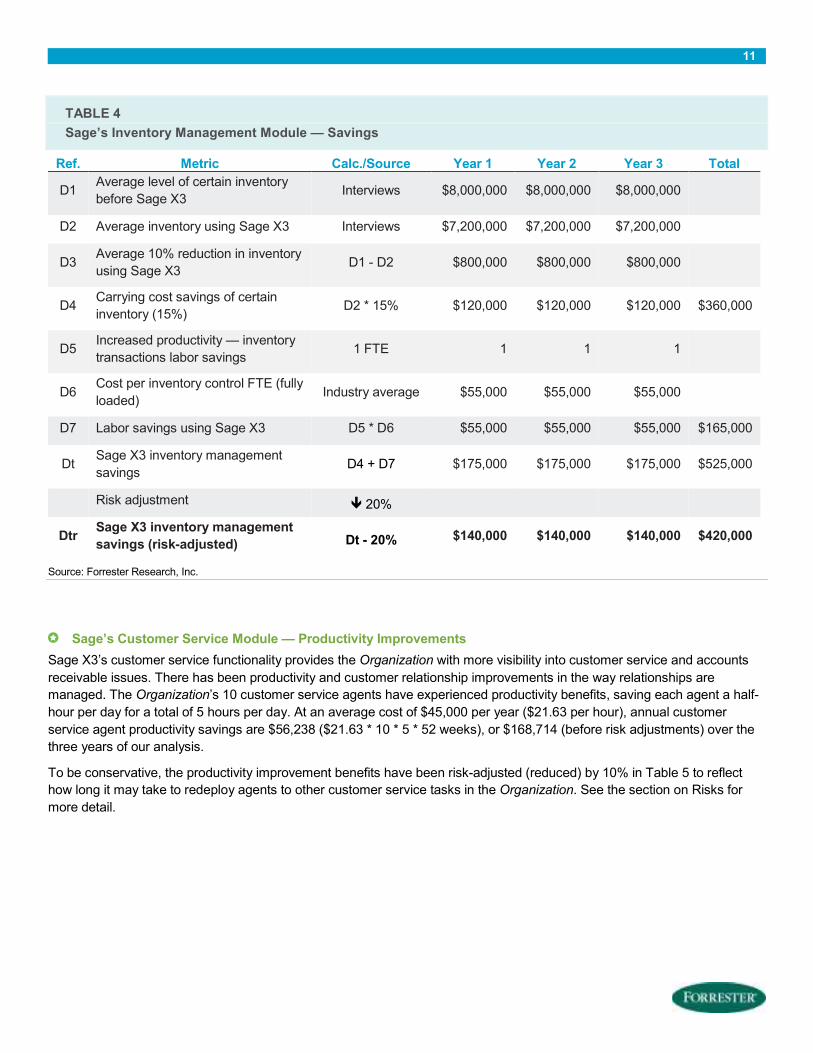
TABLE 4
Sage’s Inventory Management Module — Savings
Ref. Metric Calc./Source Year 1 Year 2 Year 3 Total
D1 Average level of certain inventory
before Sage X3 Interviews $8,000,000 $8,000,000 $8,000,000
D2 Average inventory using Sage X3 Interviews $7,200,000 $7,200,000 $7,200,000
D3 Average 10% reduction in inventory
using Sage X3 D1 - D2 $800,000 $800,000 $800,000
D4 Carrying cost savings of certain
inventory (15%) D2 * 15% $120,000 $120,000 $120,000 $360,000
D5 Increased productivity — inventory
transactions labor savings 1 FTE 1 1 1
D6 Cost per inventory control FTE (fully
loaded) Industry average $55,000 $55,000 $55,000
D7 Labor savings using Sage X3 D5 * D6 $55,000 $55,000 $55,000 $165,000
Dt Sage X3 inventory management
savings D4 + D7 $175,000 $175,000 $175,000 $525,000
Risk adjustment � 20%
Dtr Sage X3 inventory management
savings (risk-adjusted) Dt - 20% $140,000 $140,000 $140,000 $420,000
Source: Forrester Research, Inc.
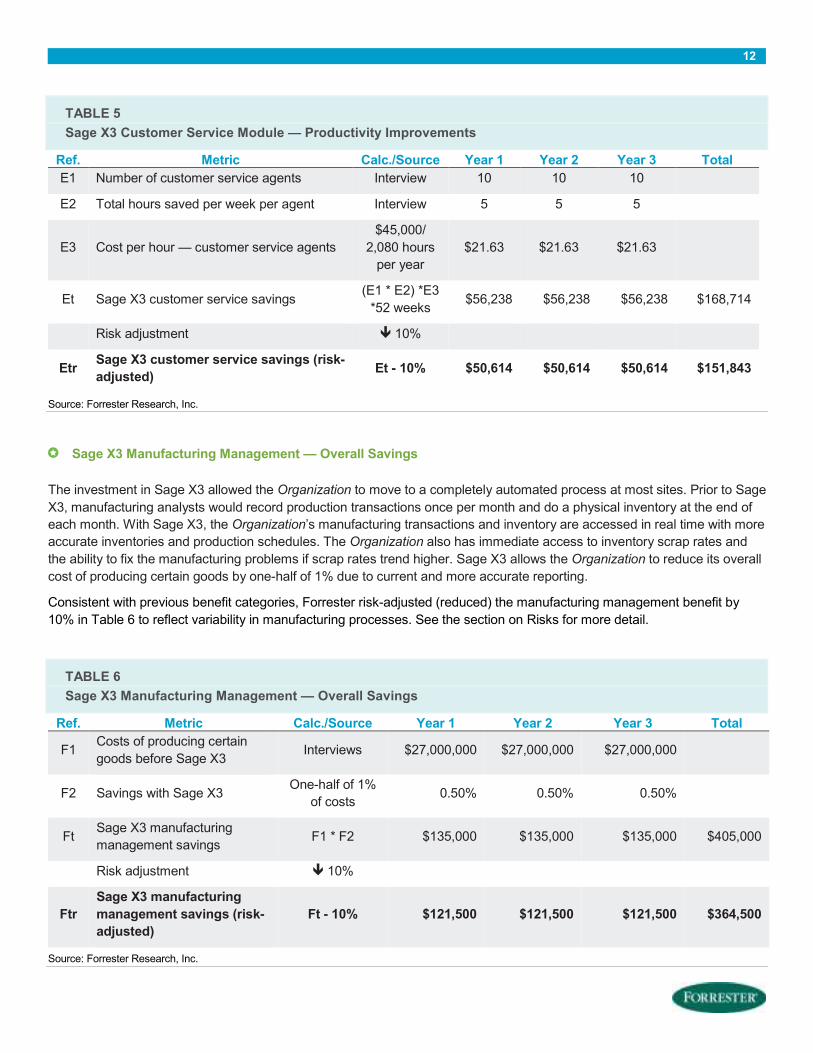
Sage’s Customer Service Module — Productivity Improvements
Sage X3’s customer service functionality provides the Organization with more visibility into customer service and accounts
receivable issues. There has been productivity and customer relationship improvements in the way relationships are
managed. The Organization’s 10 customer service agents have experienced productivity benefits, saving each agent a half-
hour per day for a total of 5 hours per day. At an average cost of $45,000 per year ($21.63 per hour), annual customer
service agent productivity savings are $56,238 ($21.63 * 10 * 5 * 52 weeks), or $168,714 (before risk adjustments) over the
three years of our analysis.
To be conservative, the productivity improvement benefits have been risk-adjusted (reduced) by 10% in Table 5 to reflect
how long it may take to redeploy agents to other customer service tasks in the Organization. See the section on Risks for
more detail.
12
TABLE 5
Sage X3 Customer Service Module — Productivity Improvements
Ref. Metric Calc./Source Year 1 Year 2 Year 3 Total
E1 Number of customer service agents Interview 10 10 10
E2 Total hours saved per week per agent Interview 5 5 5
E3 Cost per hour — customer service agents
$45,000/
2,080 hours
per year
$21.63 $21.63 $21.63
Et Sage X3 customer service savings (E1 * E2) *E3
*52 weeks $56,238 $56,238 $56,238 $168,714
Risk adjustment � 10%
Etr Sage X3 customer service savings (risk-
adjusted) Et - 10% $50,614 $50,614 $50,614 $151,843
Source: Forrester Research, Inc.
Sage X3 Manufacturing Management — Overall Savings
The investment in Sage X3 allowed the Organization to move to a completely automated process at most sites. Prior to Sage
X3, manufacturing analysts would record production transactions once per month and do a physical inventory at the end of
each month. With Sage X3, the Organization’s manufacturing transactions and inventory are accessed in real time with more
accurate inventories and production schedules. The Organization also has immediate access to inventory scrap rates and
the ability to fix the manufacturing problems if scrap rates trend higher. Sage X3 allows the Organization to reduce its overall
cost of producing certain goods by one-half of 1% due to current and more accurate reporting.
Consistent with previous benefit categories, Forrester risk-adjusted (reduced) the manufacturing management benefit by
10% in Table 6 to reflect variability in manufacturing processes. See the section on Risks for more detail.
TABLE 6
Sage X3 Manufacturing Management — Overall Savings
Ref. Metric Calc./Source Year 1 Year 2 Year 3 Total
F1 Costs of producing certain
goods before Sage X3 Interviews $27,000,000 $27,000,000 $27,000,000
F2 Savings with Sage X3 One-half of 1%
of costs 0.50% 0.50% 0.50%
Ft Sage X3 manufacturing
management savings F1 * F2 $135,000 $135,000 $135,000 $405,000
Risk adjustment � 10%
Ftr
Sage X3 manufacturing
management savings (risk-
adjusted)
Ft - 10% $121,500 $121,500 $121,500 $364,500
Source: Forrester Research, Inc.
13
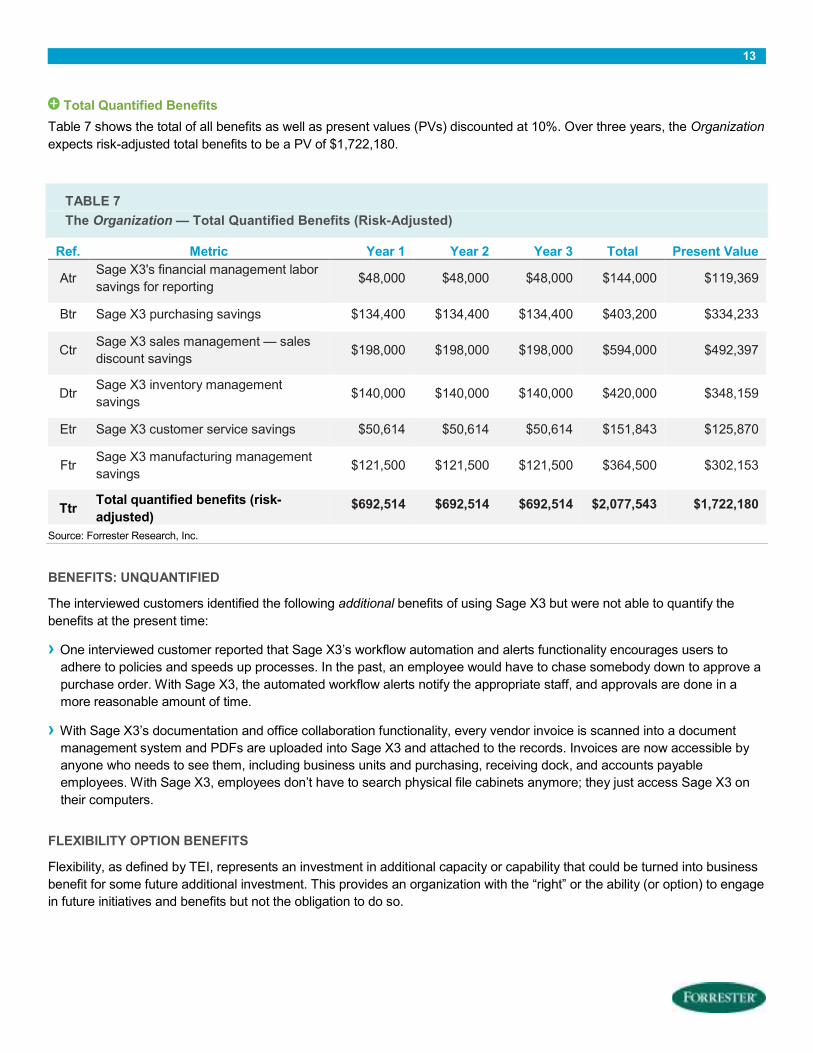
Total Quantified Benefits
Table 7 shows the total of all benefits as well as present values (PVs) discounted at 10%. Over three years, the Organization
expects risk-adjusted total benefits to be a PV of $1,722,180.
TABLE 7
The Organization — Total Quantified Benefits (Risk-Adjusted)
Ref. Metric Year 1 Year 2 Year 3 Total Present Value
Atr Sage X3's financial management labor
savings for reporting $48,000 $48,000 $48,000 $144,000 $119,369
Btr Sage X3 purchasing savings $134,400 $134,400 $134,400 $403,200 $334,233
Ctr Sage X3 sales management — sales
discount savings $198,000 $198,000 $198,000 $594,000 $492,397
Dtr Sage X3 inventory management
savings $140,000 $140,000 $140,000 $420,000 $348,159
Etr Sage X3 customer service savings $50,614 $50,614 $50,614 $151,843 $125,870
Ftr Sage X3 manufacturing management
savings $121,500 $121,500 $121,500 $364,500 $302,153
Ttr Total quantified benefits (risk-
adjusted) $692,514 $692,514 $692,514 $2,077,543 $1,722,180
Source: Forrester Research, Inc.
BENEFITS: UNQUANTIFIED
The interviewed customers identified the following additional benefits of using Sage X3 but were not able to quantify the
benefits at the present time:
› One interviewed customer reported that Sage X3’s workflow automation and alerts functionality encourages users to adhere to policies and speeds up processes. In the past, an employee would have to chase somebody down to approve a
purchase order. With Sage X3, the automated workflow alerts notify the appropriate staff, and approvals are done in a
more reasonable amount of time.
› With Sage X3’s documentation and office collaboration functionality, every vendor invoice is scanned into a document management system and PDFs are uploaded into Sage X3 and attached to the records. Invoices are now accessible by
anyone who needs to see them, including business units and purchasing, receiving dock, and accounts payable
employees. With Sage X3, employees don’t have to search physical file cabinets anymore; they just access Sage X3 on
their computers.
FLEXIBILITY OPTION BENEFITS
Flexibility, as defined by TEI, represents an investment in additional capacity or capability that could be turned into business
benefit for some future additional investment. This provides an organization with the “right” or the ability (or option) to engage
in future initiatives and benefits but not the obligation to do so.
14
Forrester asked each interviewed customer the following question: “Now that you have invested in Sage X3, what other
features or functionality can your organization take advantage of?” The following represents the future options available to
the Organization, or any Sage X3 customer:
› Mobile. Sage X3 can be used on any familiar web browser or mobile device.
› Mergers and acquisitions. According to one of the interviewed customers, having Sage X3 allowed it to acquire
companies and move them onto the company ERP model much faster and easier. The interviewed customer
commented: “We just had an acquisition two months ago, and they’re already assimilated into the Sage X3 system.
We couldn’t have done that before with our previous system. With Sage X3, we have policies and procedures so
acquired companies get turned on and up and running very quickly. From a flexibility standpoint, we can acquire a
business and assimilate it much faster than we could before.”
› Web stores and eCommerce. According to Sage, its Symphony eCommerce enables wholesale and distribution
businesses to increase growth by providing cloud-based eCommerce capabilities that display and sell their products
and services online, integrated with Sage X3 in real time.
The value of flexibility is clearly unique to each customer, and the measure of its value varies from organization to
organization. For the purpose of this analysis, we have assumed that the Organization sees future value in being able to take
future advantage of the above Sage X3 features and functionality. The value of the flexibility option is based on the Black-
Scholes Option Pricing model. (For information regarding the flexibility calculation, please see Appendix B.)

15
FIGURE 3
Quantified Benefits By Category (Risk- And Present Value-Adjusted)
Source: Forrester Research, Inc.
COSTS
Costs Associated With The Sage X3 Cloud Solution
The Organization incurred costs in the following categories associated with a cloud deployment of Sage X3:
› Labor to plan and deploy Sage X3 — $50,000. The internal labor associated with planning and deploying Sage X3
equated to one FTE across three staff members over six months. Preplanning and deployment tasks included:
• Sharing documentation with Sage or Sage partners.
• Working with Sage or Sage partner professional services on requirements, configuration setups, data conversion,
analysis and modeling, and training.
• Training employees to use Sage X3.
Financial Management —Labor Savings For Reporting, $119,369
Purchasing Savings, $334,233
Sales Management — Sales Discount Savings, $492,397
Inventory Management
Savings, $348,159
Customer Service savings, $125,870
Manufacturing Management
Savings, $302,153
Sage X3 Benefits by Category (risk-adjusted)
Financial Management — Labor Savings For Reporting
Purchasing Savings
Sales Management — Sales Discount Savings
Inventory Management Savings
Customer Service savings
Manufacturing ManagementSavings
16
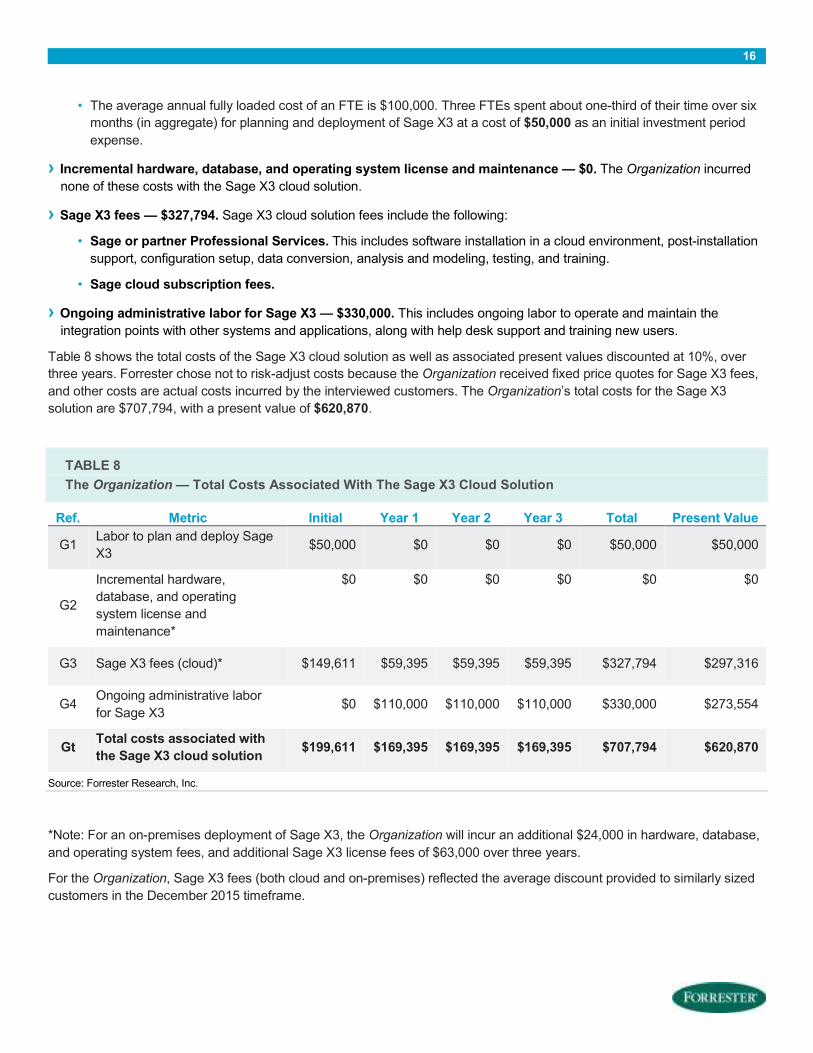
• The average annual fully loaded cost of an FTE is $100,000. Three FTEs spent about one-third of their time over six
months (in aggregate) for planning and deployment of Sage X3 at a cost of $50,000 as an initial investment period
expense.
› Incremental hardware, database, and operating system license and maintenance — $0. The Organization incurred none of these costs with the Sage X3 cloud solution.
› Sage X3 fees — $327,794. Sage X3 cloud solution fees include the following:
• Sage or partner Professional Services. This includes software installation in a cloud environment, post-installation
support, configuration setup, data conversion, analysis and modeling, testing, and training.
• Sage cloud subscription fees.
› Ongoing administrative labor for Sage X3 — $330,000. This includes ongoing labor to operate and maintain the
integration points with other systems and applications, along with help desk support and training new users.
Table 8 shows the total costs of the Sage X3 cloud solution as well as associated present values discounted at 10%, over
three years. Forrester chose not to risk-adjust costs because the Organization received fixed price quotes for Sage X3 fees,
and other costs are actual costs incurred by the interviewed customers. The Organization’s total costs for the Sage X3
solution are $707,794, with a present value of $620,870.
TABLE 8
The Organization — Total Costs Associated With The Sage X3 Cloud Solution
Ref. Metric Initial Year 1 Year 2 Year 3 Total Present Value
G1 Labor to plan and deploy Sage
X3 $50,000 $0 $0 $0 $50,000 $50,000
G2
Incremental hardware,
database, and operating
system license and
maintenance*
$0 $0 $0 $0 $0 $0
G3 Sage X3 fees (cloud)* $149,611 $59,395 $59,395 $59,395 $327,794 $297,316
G4 Ongoing administrative labor
for Sage X3 $0 $110,000 $110,000 $110,000 $330,000 $273,554
Gt Total costs associated with
the Sage X3 cloud solution $199,611 $169,395 $169,395 $169,395 $707,794 $620,870
Source: Forrester Research, Inc.
*Note: For an on-premises deployment of Sage X3, the Organization will incur an additional $24,000 in hardware, database,
and operating system fees, and additional Sage X3 license fees of $63,000 over three years.
For the Organization, Sage X3 fees (both cloud and on-premises) reflected the average discount provided to similarly sized
customers in the December 2015 timeframe.
17
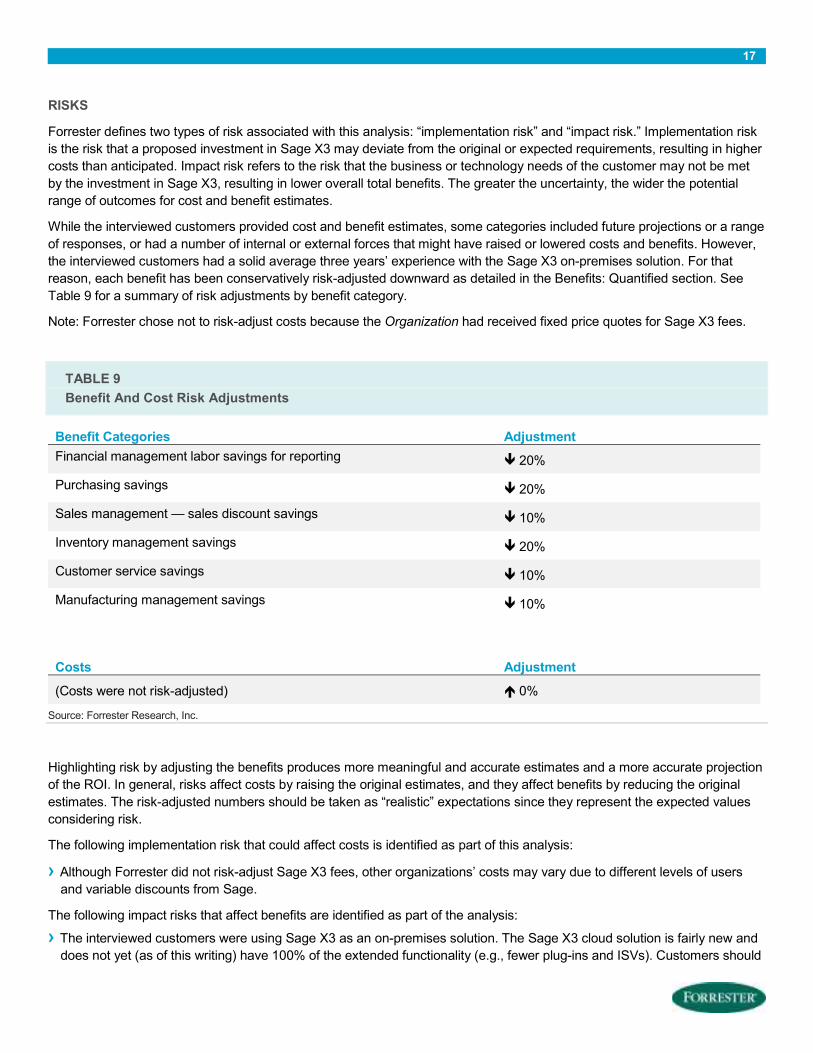
RISKS
Forrester defines two types of risk associated with this analysis: “implementation risk” and “impact risk.” Implementation risk
is the risk that a proposed investment in Sage X3 may deviate from the original or expected requirements, resulting in higher
costs than anticipated. Impact risk refers to the risk that the business or technology needs of the customer may not be met
by the investment in Sage X3, resulting in lower overall total benefits. The greater the uncertainty, the wider the potential
range of outcomes for cost and benefit estimates.
While the interviewed customers provided cost and benefit estimates, some categories included future projections or a range
of responses, or had a number of internal or external forces that might have raised or lowered costs and benefits. However,
the interviewed customers had a solid average three years’ experience with the Sage X3 on-premises solution. For that
reason, each benefit has been conservatively risk-adjusted downward as detailed in the Benefits: Quantified section. See
Table 9 for a summary of risk adjustments by benefit category.
Note: Forrester chose not to risk-adjust costs because the Organization had received fixed price quotes for Sage X3 fees.
TABLE 9
Benefit And Cost Risk Adjustments
Benefit Categories Adjustment
Financial management labor savings for reporting � 20%
Purchasing savings � 20%
Sales management — sales discount savings � 10%
Inventory management savings � 20%
Customer service savings � 10%
Manufacturing management savings � 10%
Costs Adjustment
(Costs were not risk-adjusted) � 0%
Source: Forrester Research, Inc.
Highlighting risk by adjusting the benefits produces more meaningful and accurate estimates and a more accurate projection
of the ROI. In general, risks affect costs by raising the original estimates, and they affect benefits by reducing the original
estimates. The risk-adjusted numbers should be taken as “realistic” expectations since they represent the expected values
considering risk.
The following implementation risk that could affect costs is identified as part of this analysis:
› Although Forrester did not risk-adjust Sage X3 fees, other organizations’ costs may vary due to different levels of users and variable discounts from Sage.
The following impact risks that affect benefits are identified as part of the analysis:
› The interviewed customers were using Sage X3 as an on-premises solution. The Sage X3 cloud solution is fairly new and does not yet (as of this writing) have 100% of the extended functionality (e.g., fewer plug-ins and ISVs). Customers should

18
diligently evaluate their requirements before deciding which implementation (cloud or on-premises) works best for their
environment.
Table 9 shows the values used to adjust for risk and uncertainty in the cost and benefit estimates. The TEI model uses a
triangular distribution method to calculate risk-adjusted values. To construct the distribution, it is necessary to first estimate
the low, most likely, and high values that could occur within the current environment. The risk-adjusted value is the mean of
the distribution of those points. Readers are urged to apply their own risk ranges based on their own degree of confidence in
the cost and benefit estimates.
Financial Summary
The financial results calculated in the Benefits and Costs sections can be used to determine the ROI, NPV, and payback
period for the Organization’s investment in Sage X3.
Table 10 shows the risk-adjusted ROI, NPV, and payback period values for the Sage X3 solution. The cost and benefit
values are from summary Tables 7 and 8.
TABLE 10
Cash Flow — The Sage X3 Solution (Risk-Adjusted)
Initial Year 1 Year 2 Year 3 Total Present Value
Total costs* ($199,611) ($169,395) ($169,395) ($169,395) ($707,794) ($620,870)
Total benefits $0 $692,514 $692,514 $692,514 $2,077,543 $1,722,180
Net benefits ($199,611) $523,120 $523,120 $523,120 $1,369,748 $1,101,310
ROI 177%
Payback period Five months
*Pertains to cloud deployment of Sage X3. For on-premises deployment of Sage X3, the total costs PV is calculated to be $706,620, or an additional $85,750 over three years, with an expected ROI of 144%.
Source: Forrester Research, Inc.
The ROI for the Sage X3 solution was a very favorable 177%, and the payback period was a quick five months.
If risk-adjusted costs, benefits, and ROI still demonstrate a compelling business case, it raises confidence that the
investment is likely to succeed because the risks that threaten the project have been taken into consideration and quantified.
The risk-adjusted numbers should be taken as “realistic” expectations, as they represent the expected values considering
risk. Assuming normal success at mitigating risk, the risk-adjusted numbers should more closely reflect the expected
outcome of the investment.
19
Appendix A: About The Sage X3 Solution
The following information is provided by Sage. Forrester has not validated any claims and does not endorse Sage or its
offerings.
ADOPT A FAST, SIMPLE, FLEXIBLE BUSINESS MANAGEMENT SOLUTION
Sage X3 is the next generation of business management solutions for enterprises to grow faster and stay agile. Sage X3
takes the complexity out of running a business. It simplifies every part of operations, leaving the business lean and ready for
whatever comes next. With Sage X3, you are choosing the next-generation business management solution for your
enterprise to grow faster and run an agile organization.
FAST
Sage X3 runs businesses fast, with a cohesive, enterprise-class solution to manage all core business processes — from
purchasing to manufacturing, inventory management, sales, customer service, and financials — locally and internationally. It
also accelerates collaboration and reporting and delivers real-time insight into all costs and operational performance.
FLEXIBLE
Sage X3 is ready for various industries. Built-in functionality for process manufacturing, other manufacturing, distribution, and
services tasks adjusts to accommodate a company’s unique rules and processes. It’s also easily scalable — never running
out of capacity again — and quickly adapts to changing needs, growing with the business as it expands to new markets or
geographies, and makes it simple to manage a global business.
SIMPLE
Sage X3 is easy to use in a familiar web browser and on mobile devices, providing the freedom to work where it’s needed. It
is also simple to manage and highly configurable to adapt to unique processes, roles, and preferences. Sage X3 is a
versatile solution — use it as a service in the cloud and reduce demand on in-house teams to maintain the system, or deploy
the solution on a choice of infrastructures.
Sage X3 offers rich and integrated functionality to support all core business processes with minimal IT investment and
resources. Below are brief descriptions of the Sage X3 modules.
FINANCES
Control the bottom line. Sage X3 covers financial, personnel, cost and budget accounting, commitments, and fixed assets. In
addition, it easily handles transfers from one country to another and between subsidiaries and headquarters. The flexible
accounting structure (multiledger and multichart of accounts) promotes a real-time global vision while accommodating local
operational requirements.
REPORTING AND ANALYTICS
Provide the entire team with the information they need to make faster and more strategic decisions. Real-time analytics,
alerts, and notifications empower each role in the organization to respond quickly to changing business conditions.

20
MANUFACTURING
Get to market quickly by managing all manufacturing processes with one complete system. Sage X3 supports planning,
scheduling, and production control activities for both process and discrete manufacturing. It is also flexible enough to adapt
to unique or mixed manufacturing modes.
INVENTORY
Keep up with demand and ensure optimal efficiency through real-time monitoring of inventory status. Inventory control is
configurable by site with the application of the multisite, multiwarehouse, and multilocation management. Incorporate
powerful quality control functions, including total traceability of inventory quantities and lot and serial numbers in real time,
both upstream and downstream, through material flow management.
PURCHASING
Seamlessly manage the purchasing process from beginning to end, starting with management of requests for quotes
(RFQs), input and follow-up of replies, and integration into the price list database. Sage X3 helps to buy smarter by tracking
purchase requests, orders created, deliveries, subcontract orders, and buyer workloads, and by managing the approval
process from order through receipt and invoicing.
SALES
Provide the best experience possible for customers while improving the topline performance. Sage X3 provides quick and
easy access to information concerning products, price lists, discounts, and carriers. Issue customer quotations and book
orders, transmit order acknowledgements, manage contracts, view and allocate goods from stock, and manage the dispatch
and loan of goods prior to invoicing.
CUSTOMER SERVICE
Delight customers with exceptional service. Full integration with sales, inventory, purchasing, finance, and manufacturing
provides a 360-degree understanding of customer activity — all within a single business management system.

21
Appendix B: Total Economic Impact™ Overview
Total Economic Impact is a methodology developed by Forrester Research that enhances a company’s technology decision-
making processes and assists vendors in communicating the value proposition of their products and services to clients. The
TEI methodology helps companies demonstrate, justify, and realize the tangible value of technology initiatives to both senior
management and other key business stakeholders.
The TEI methodology consists of four components to evaluate investment value: benefits, costs, flexibility, and risks.
BENEFITS
Benefits represent the value delivered to the user organization — IT and/or business units — by the proposed product or
project. Often, product or project justification exercises focus just on IT cost and cost reduction, leaving little room to analyze
the effect of the technology on the entire organization. The TEI methodology and the resulting financial model place equal
weight on the measure of benefits and the measure of costs, allowing for a full examination of the effect of the technology on
the entire organization. Calculation of benefit estimates involves a clear dialogue with the user organization to understand
the specific value that is created. In addition, Forrester also requires that there be a clear line of accountability established
between the measurement and justification of benefit estimates after the project has been completed. This ensures that
benefit estimates tie back directly to the bottom line.
COSTS
Costs represent the investment necessary to capture the value, or benefits, of the proposed project. IT or the business units
may incur costs in the form of fully burdened labor, subcontractors, or materials. Costs consider all the investments and
expenses necessary to deliver the proposed value. In addition, the cost category within TEI captures any incremental costs
over the existing environment for ongoing costs associated with the solution. All costs must be tied to the benefits that are
created.
FLEXIBILITY
Within the TEI methodology, direct benefits represent one part of the investment value. While direct benefits can typically be
the primary way to justify a project, Forrester believes that organizations should be able to measure the strategic value of an
investment. Flexibility represents the value that can be obtained for some future additional investment building on top of the
initial investment already made. For instance, an investment in an enterprisewide upgrade of an office productivity suite can
potentially increase standardization (to increase efficiency) and reduce licensing costs. However, an embedded collaboration
feature may translate to greater worker productivity if activated. The collaboration can only be used with additional
investment in training at some future point. However, having the ability to capture that benefit has a PV that can be
estimated. The flexibility component of TEI captures that value.
RISKS
Risks measure the uncertainty of benefit and cost estimates contained within the investment. Uncertainty is measured in two
ways: 1) the likelihood that the cost and benefit estimates will meet the original projections and 2) the likelihood that the
estimates will be measured and tracked over time. TEI applies a probability density function known as “triangular distribution”
to the values entered. At a minimum, three values are calculated to estimate the underlying range around each cost and
benefit.

22
Appendix C: Glossary
Discount rate: The interest rate used in cash flow analysis to take into account the time value of money. Companies set
their own discount rate based on their business and investment environment. Forrester assumes a yearly discount rate of
10% for this analysis. Organizations typically use discount rates between 8% and 16% based on their current environment.
Readers are urged to consult their respective organizations to determine the most appropriate discount rate to use in their
own environment.
Net present value (NPV): The present or current value of (discounted) future net cash flows given an interest rate (the
discount rate). A positive project NPV normally indicates that the investment should be made, unless other projects have
higher NPVs.
Present value (PV): The present or current value of (discounted) cost and benefit estimates given at an interest rate (the
discount rate). The PV of costs and benefits feed into the total NPV of cash flows.
Payback period: The breakeven point for an investment. This is the point in time at which net benefits (benefits minus costs)
equal initial investment or cost.
Return on investment (ROI): A measure of a project’s expected return in percentage terms. ROI is calculated by dividing
net benefits (benefits minus costs) by costs.
A NOTE ON CASH FLOW TABLES
The following is a note on the cash flow tables used in this study (see the example table below). The initial investment
column contains costs incurred at “time 0” or at the beginning of Year 1. Those costs are not discounted. All other cash flows
in years 1 through 3 are discounted using the discount rate of 10% at the end of the year. PV calculations are calculated for
each total cost and benefit estimate. NPV calculations are not calculated until the summary tables are the sum of the initial
investment and the discounted cash flows in each year.
TABLE [EXAMPLE]
Example Table
Ref. Metric Calc./Source Year 1 Year 2 Year 3
Source: Forrester Research, Inc.
Related Documents