+ SAFTINet: Scalable Architecture for Federated Translational Inquiries Network October 2011

Safti net overview ahrq stakeholders mtg oct 2011
Aug 15, 2015
Welcome message from author
This document is posted to help you gain knowledge. Please leave a comment to let me know what you think about it! Share it to your friends and learn new things together.
Transcript
+
SAFTINet: Scalable Architecture for Federated Translational Inquiries Network
October 2011

+
Outline Overview
CER Objectives
+SAFTINet Overview and Aims
Funding Mechanism: AHRQ ARRA OS: Recovery Act 2009: Scalable Distributed Research Networks for Comparative Effectiveness Research (R01)
To build the infrastructure for a distributed data network that supports comparative effectiveness research
Intended components of the network
EHR and Medicaid claims data harmonized to a common data model (modifications to OMOP)
Made available for distributed query using TRIAD grid technology
Supplemented with PROs and practice-level survey data
+
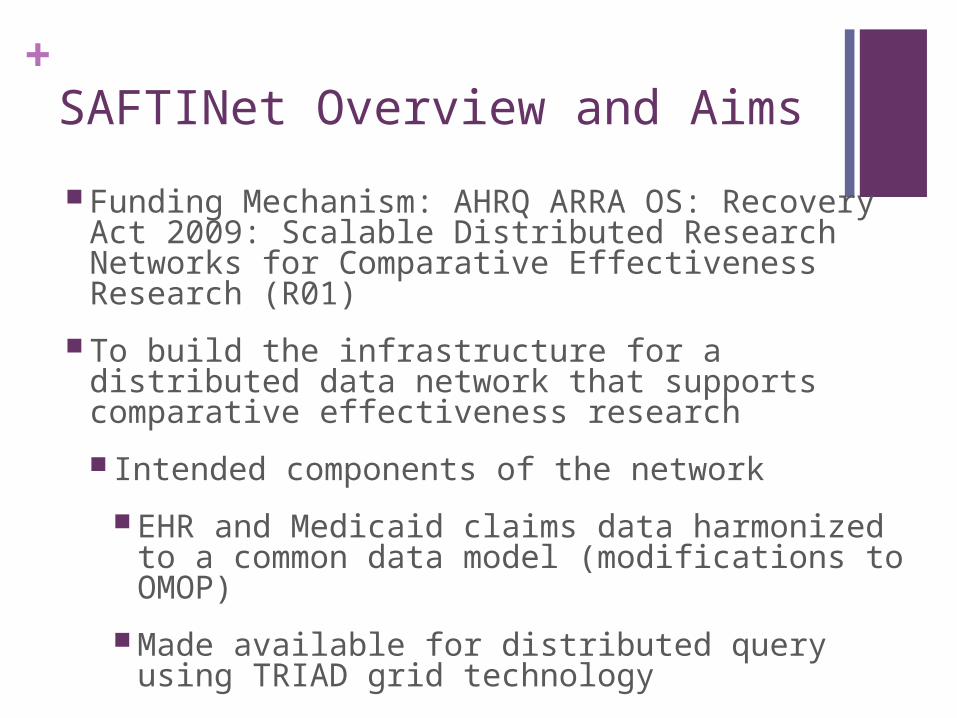
SAFTINet Research Objectives
Develop four cohorts of patients with asthma (childhood and adult)hypertensionhypercholesterolemia
Conduct comparative effectiveness research on healthcare delivery system factors as they relate to health outcomes in these cohorts
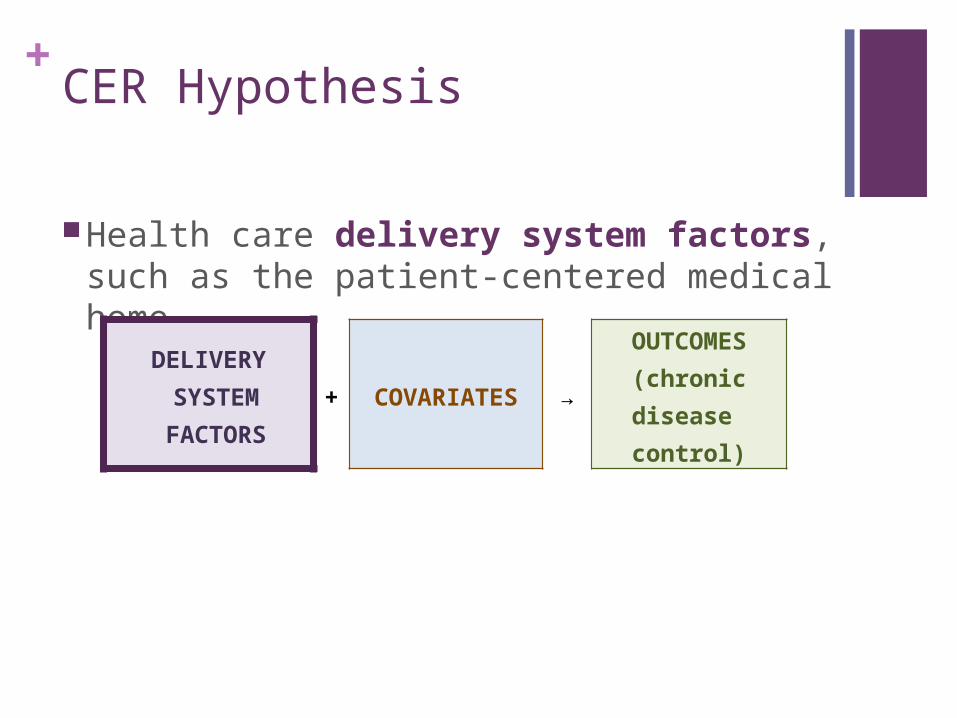
+CER Hypothesis
Health care delivery system factors, such as the patient-centered medical home…
DELIVERY SYSTEM FACTORS + COVARIATES →
OUTCOMES(chronic disease
control)
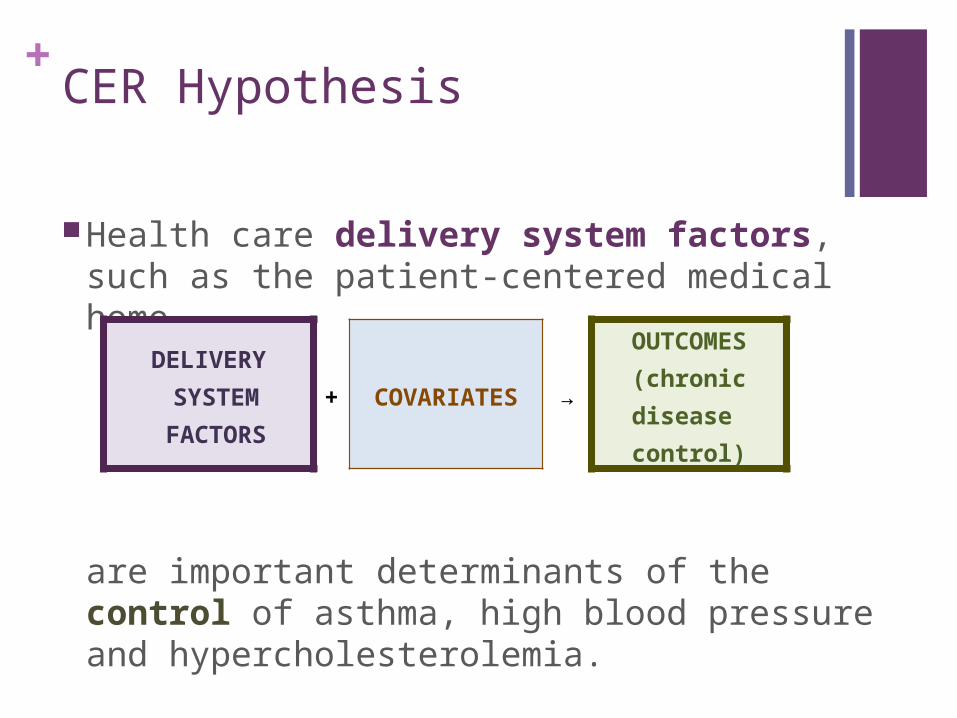
+CER Hypothesis
Health care delivery system factors, such as the patient-centered medical home…
are important determinants of the control of asthma, high blood pressure and hypercholesterolemia.
DELIVERY SYSTEM FACTORS + COVARIATES →
OUTCOMES(chronic disease
control)
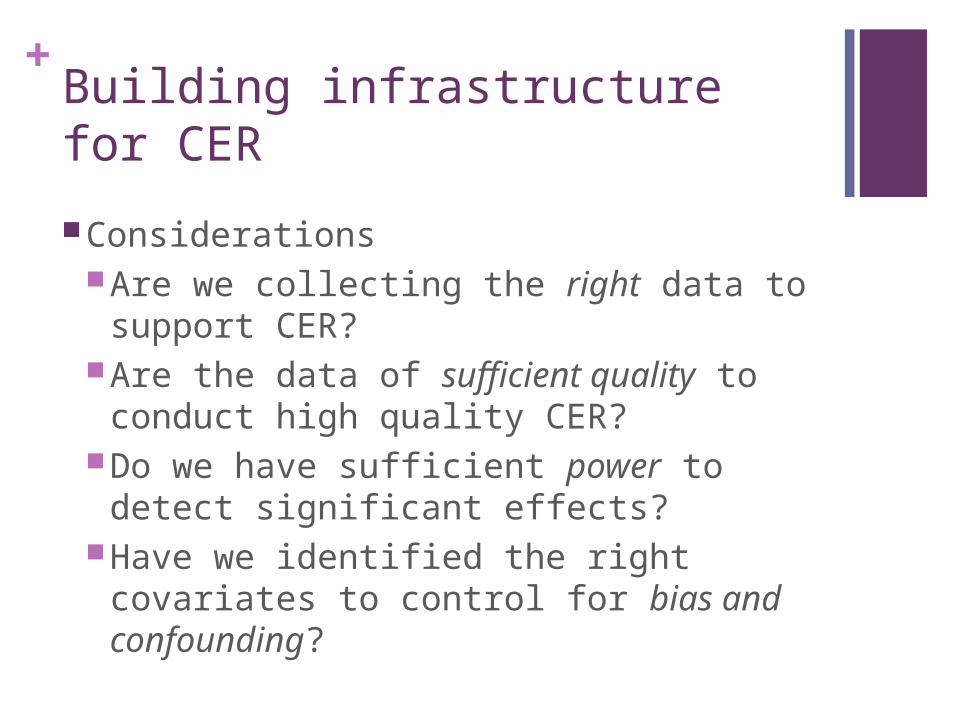
+Building infrastructure for CER
ConsiderationsAre we collecting the right data to support CER?Are the data of sufficient quality to conduct high
quality CER?Do we have sufficient power to detect significant
effects?Have we identified the right covariates to control
for bias and confounding?
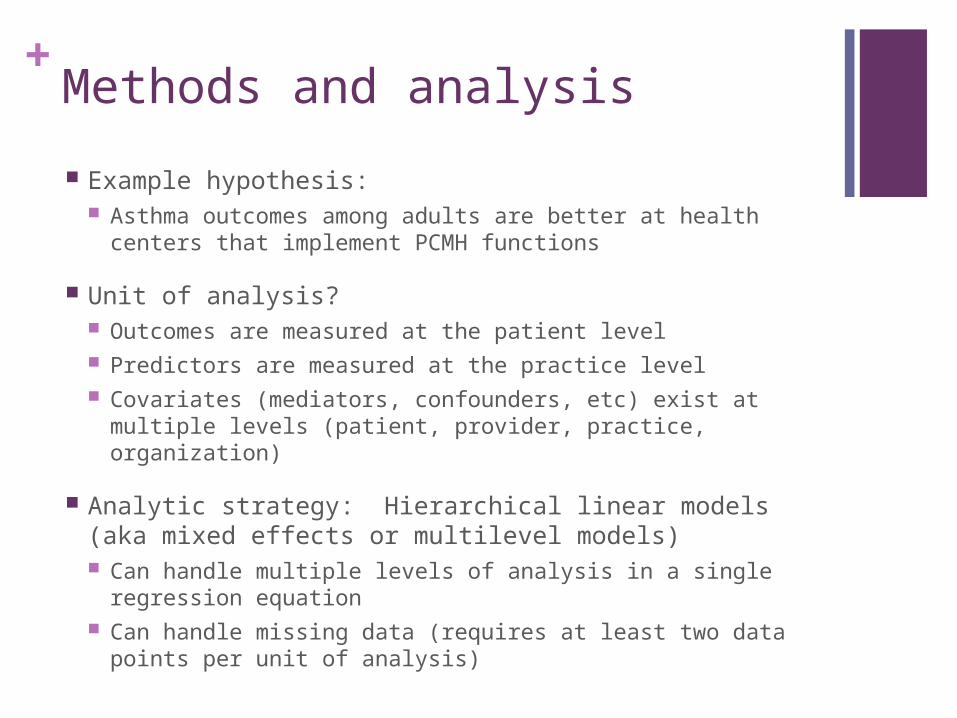
+Methods and analysis
Example hypothesis: Asthma outcomes among adults are better at health
centers that implement PCMH functions
Unit of analysis? Outcomes are measured at the patient level Predictors are measured at the practice level Covariates (mediators, confounders, etc) exist at multiple
levels (patient, provider, practice, organization)
Analytic strategy: Hierarchical linear models (aka mixed effects or multilevel models) Can handle multiple levels of analysis in a single regression
equation Can handle missing data (requires at least two data points
per unit of analysis)
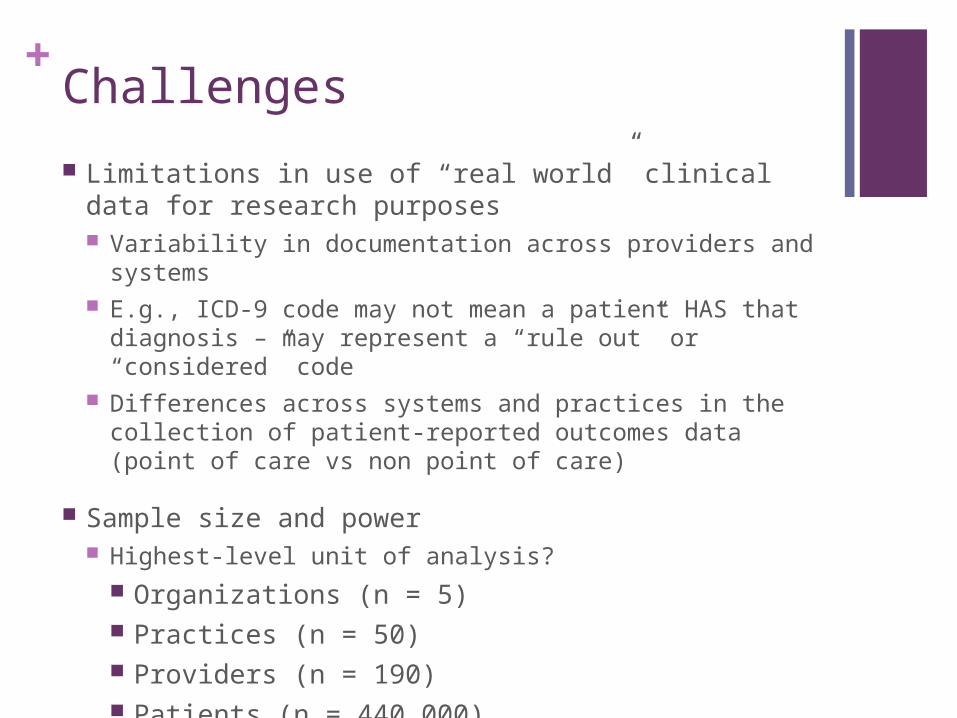
+Challenges
Limitations in use of “real world” clinical data for research purposes Variability in documentation across providers and systems E.g., ICD-9 code may not mean a patient HAS that diagnosis
– may represent a “rule out” or “considered” code Differences across systems and practices in the collection
of patient-reported outcomes data (point of care vs non point of care)
Sample size and power Highest-level unit of analysis?
Organizations (n = 5) Practices (n = 50) Providers (n = 190) Patients (n = 440,000)
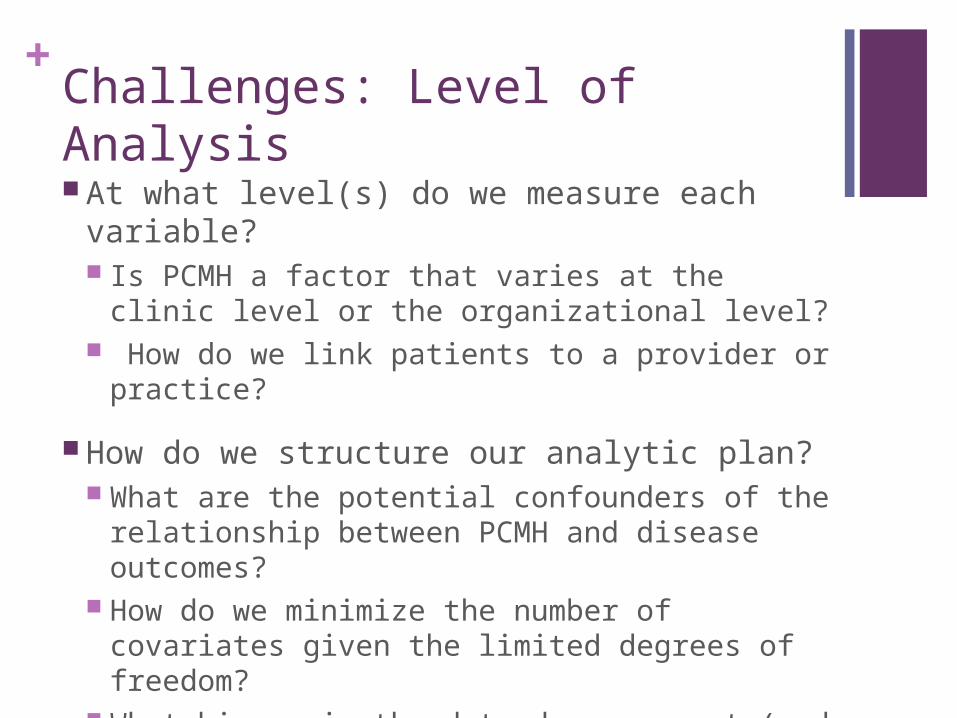
+Challenges: Level of Analysis
At what level(s) do we measure each variable? Is PCMH a factor that varies at the clinic level or
the organizational level? How do we link patients to a provider or
practice?
How do we structure our analytic plan? What are the potential confounders of the
relationship between PCMH and disease outcomes?
How do we minimize the number of covariates given the limited degrees of freedom?
What biases in the data do we expect (and at what level of analysis)?
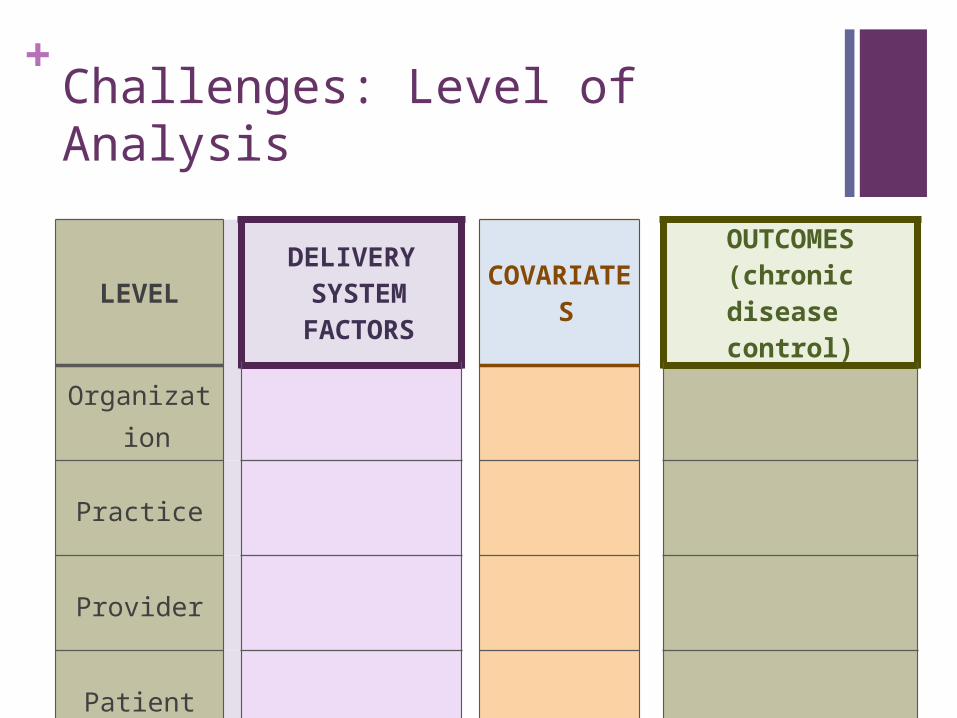
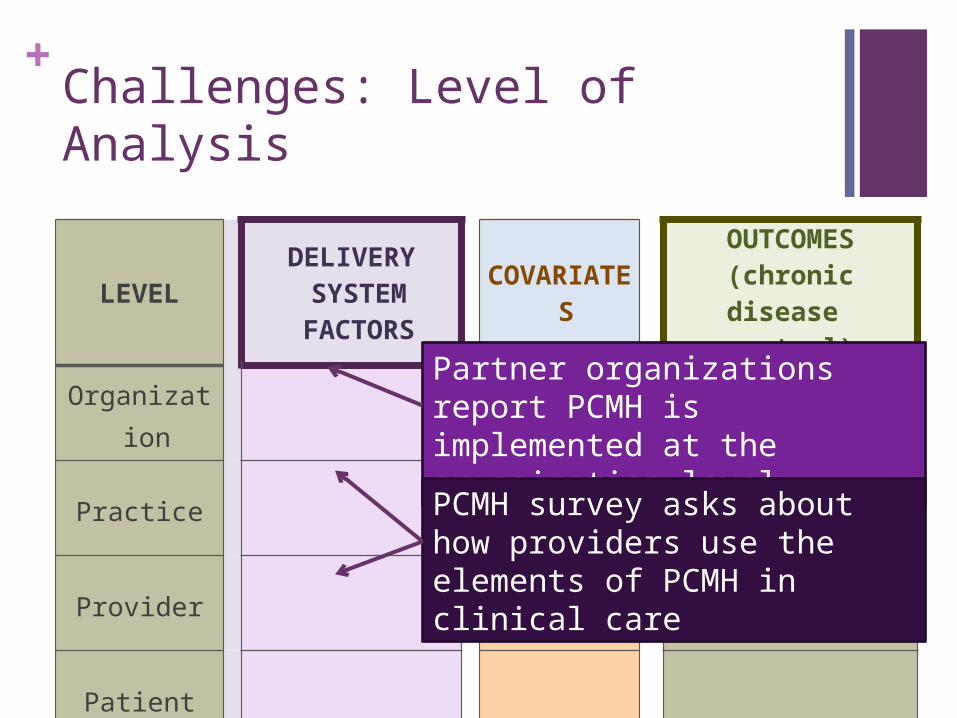
+Challenges: Level of Analysis
LEVEL DELIVERY SYSTEM FACTORS COVARIATES
OUTCOMES(chronic disease
control)
Organization
Practice
Provider
Patient
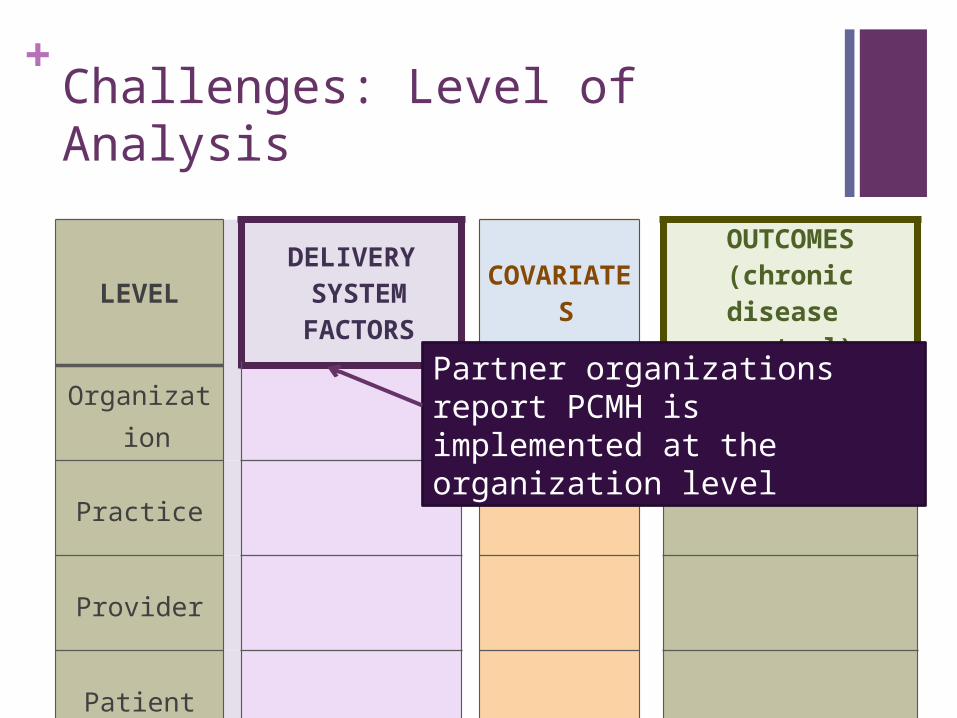
+Challenges: Level of Analysis
LEVEL DELIVERY SYSTEM FACTORS COVARIATES
OUTCOMES(chronic disease
control)
Organization
Practice
Provider
Patient
Partner organizations report PCMH is implemented at the organization level
+Challenges: Level of Analysis
LEVEL DELIVERY SYSTEM FACTORS COVARIATES
OUTCOMES(chronic disease
control)
Organization
Practice
Provider
Patient
Partner organizations report PCMH is implemented at the organization level
PCMH survey asks about how providers use the elements of PCMH in clinical care
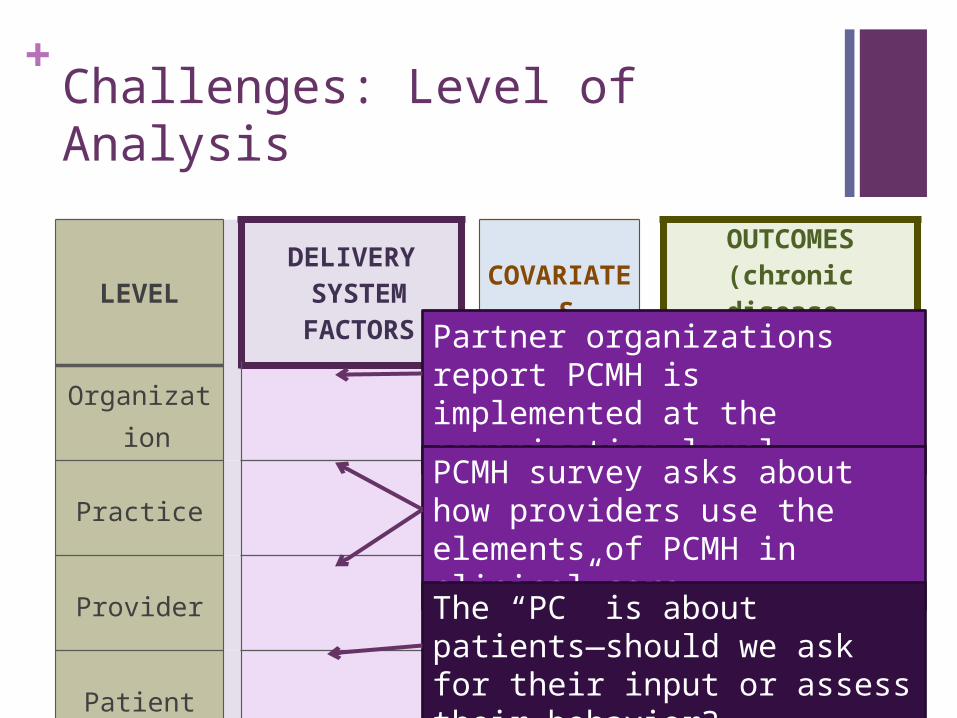
+Challenges: Level of Analysis
LEVEL DELIVERY SYSTEM FACTORS COVARIATES
OUTCOMES(chronic disease
control)
Organization
Practice
Provider
Patient
Partner organizations report PCMH is implemented at the organization level
PCMH survey asks about how providers use the elements of PCMH in clinical care
The “PC” is about patients—should we ask for their input or assess their behavior?
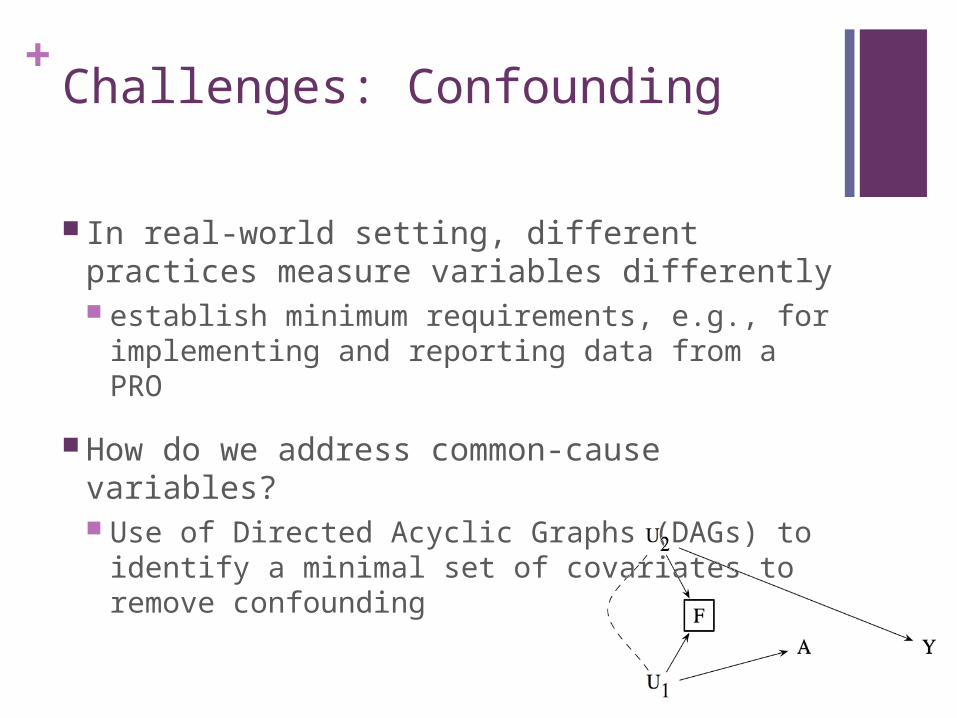
+Challenges: Confounding
In real-world setting, different practices measure variables differently establish minimum requirements, e.g., for
implementing and reporting data from a PRO
How do we address common-cause variables? Use of Directed Acyclic Graphs (DAGs) to identify
a minimal set of covariates to remove confounding
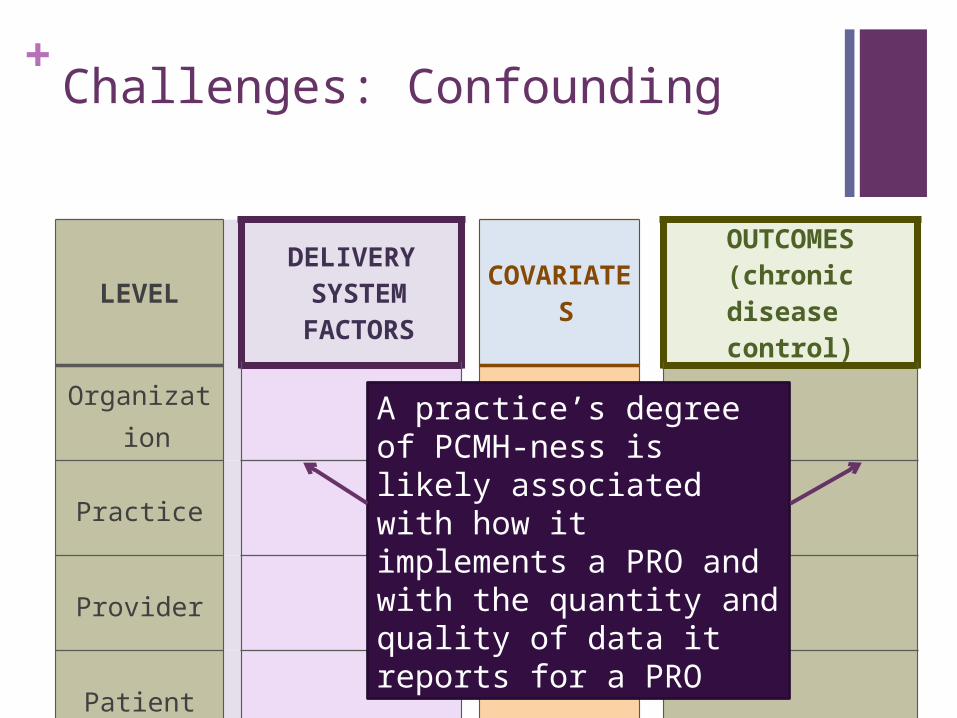
+Challenges: Confounding
LEVEL DELIVERY SYSTEM FACTORS COVARIATES
OUTCOMES(chronic disease
control)
Organization
Practice
Provider
Patient
A practice’s degree of PCMH-ness is likely associated with how it implements a PRO and with the quantity and quality of data it reports for a PRO

+Questions/Comments/Input
“Knowing is not enough; we must apply. Willing is not enough; we must do.” —Goethe
Related Documents