6 Public Safety

Welcome message from author
This document is posted to help you gain knowledge. Please leave a comment to let me know what you think about it! Share it to your friends and learn new things together.
Transcript

162Chapter 6
Delhi human Development RepoRt 2013public Safety
6 Public Safety
Delhi human Development RepoRt 2013public Safety
163Chapter 6
“Cities have the capability of providing something for everybody, only because, and only when, they are created by everybody.”
—Jane Jacobs (1916–2006)
6.1. Introduction
The Human Development Report, 1994 cites freedom from fear as an essential component of human security (UNDP, 1994). The issue of safety and security and the meanings associated with these terms have traversed from physical safety to emotional well-being and human dignity. The protection of all, particularly vulnerable communities from hunger, illness, violence and discrimination has become increasingly important in the human development discourse. The World Development Report (World Bank, 2011) sheds light on the crucial relationship between security and development. It stresses that countries and areas characterised by insecurity, poverty, and social and political violence, are faring badly in terms of achievement of both the Millennium Development Goals (MDGs) as well as economic growth. To feel safe and to be safe are essential pre-requisites of a good quality of life for any individual. Safety is thus an important aspect of human development. A city that is completely free of crime, and provides a safe and secure environment for its residents, is perhaps a utopia. Crime is an everyday reality that affects urban centres across the world, and Delhi is no different.
This chapter first presents a background to crime and safety in an urban context, and the particular vulnerabilities faced by women and children, while concentrating on the unique case of Delhi. Using data from the National Crime Records Bureau (NCRB), the state of crimes in Delhi and their rate and composition are studied, in a comparative perspective with other major cities in the country. The results of the Perceptions Survey, 2013, are then presented and some interesting findings emerge. Current policy initiatives and strategies for the future are also discussed. An attempt has also been made to understand the implications of urban growth and planning on the safety of vulnerable populations like the poor, women and children. The subjective dimension of safety as experienced by different socio-economic groups as well as reported by the media, and the objective reality of safety as reflected by official data, are also presented and discussed. The policy and legal landscape following the brutal gang rape of a medical student in the city on 16 December 2012 has also been analysed along with the numerous efforts made by State and non-State institutions to
address crucial issues regarding the safety of women in Delhi have also been highlighted.
6.2 Crime and Safety in an Urban Context
Urbanisation and urban growth are occurring at a rapid pace and according to the UNHABITAT (2012), more people in the developing regions would soon be living in urban areas as compared to rural areas. This global phenomenon creates enormous challenges in terms of the planning and distribution of resources for expanding urban populations, which could deepen existing disparities and differences based on economic, social and cultural grounds, thereby creating conflict and contestations (UNHABITAT, 2008). In the Indian context, urban centres are increasingly being associated with rising poverty and inequalities, which are attributed to many factors, one of which is exclusionary planning. Viswanath and Mehrotra (2007) and UNHABITAT (2008) point out that the ‘Master Plan approach’ to city planning has been criticised for being exclusionary. It is seen, that different socio-economic groups use and negotiate urban spaces and services differently such that all population groups do not have an ‘equal right to the city’. For instance, private transport like cars and spaces such as malls, clubs and residential complexes are mostly used by the upper class. The poorer sections, on the other hand, use public transport and public spaces like buses, footpaths and roads, not just to commute, but also to earn their livelihoods (as in the case of hawkers, garbage collectors, fruit and vegetable vendors) (Viswanath and Mehrotra, 2007), owing to which they are more vulnerable to harassment, violence and abuse. Thus, the direction of urban planning, as it stands, is towards the creation not of equitable cities, but rather of divided ones, and Delhi is no exception.
Some of the glaring issues that need to be taken cognisance of and addressed are detailed below.
• Theuseofurbanspacesisgendered,afactthat is often ignored in urban planning, resulting in the eclipsing of the specific needs of women and girls (UNHABITAT, 2013). According to Jagori (2011), the Delhi Master Plan, 2021, prepared by the Delhi Development Authority (DDA) does not use disaggregated data to understand the ways in which women make use of urban spaces and public services, which would allow for the inclusion of gender-sensitive features in planning. The City Development Plan (2006),
Delhi human Development RepoRt 2013public Safety
164Chapter 6
Delhi human Development RepoRt 2013public Safety
too, does not seem to reflect any needs and concerns specific to women and girls (ibid). This is reflected in the lack of sufficient and well functioning public services such as street lights and safe public toilets in Delhi, which contributes to fear of violence in public spaces, and is likely to affect women and girls more severely. People, in general, and women and children, in particular, feel unsafe without street lighting and many either take alternate routes, or avoid dark areas altogether. According to a survey conducted by the Delhi Police in 2011, there were 650 unlit stretches in the city (Pandey and Haidar, 2013). In August 2012, a survey conducted by the Delhi Police revealed over 1500 areas in the city including areas near colleges, schools, residential areas and metro stations that were unlit and perceived as being unsafe (Anand, 2012).
• Thelackofproperlyfunctioning,cleanandsafe public toilets poses serious health and safety concerns for women and girls who are vulnerable to urinary and reproductive tract infections, sexual harassment and even violence, as highlighted by a report by Sheikh (2008) on slums and resettlement colonies in Delhi. Again, while the better-off sections can easily access clean ‘public’ toilets in malls and restaurants, the poor are left with no options, as a result of which many reportedly resort to using open spaces, usually early in the morning or after dark to avoid being seen, all of which heighten their risks of being subjected to harassment and violence. The design of community toilet complexes, which have open roofs, allow men and boys to peep in and harass women and girls using the toilets, a concern brought out in the focus group discussions (FGDs) and Perceptions Survey, 2013. Incidents of men harassing women, and using the toilets meant for women, and the toilets being shut due to lack of water supply have also been reported (ibid.). Catarina de Albuquerque describes sanitation as more than a basic service, one which is deeply connected to the concept of human dignity, self-respect as well as safety from the threat of assault or harassment (UNHABITAT, 2013). A joint study conducted by Jagori, International Development Research Centre, and Women in Cities International in two Jhuggi Jhopdi
(JJ) relocation colonies in North-west and North-east Delhi (2009-11), brings out the ‘gender service gap’, in terms of inequitable access to basic services like water and toilets for women. The findings also reveal how private interests had usurped the Municipal Corporation of Delhi (MCD) toilets and were charging residents for their use. Residents reported that they had to pay for these services or had to travel long distances to be able to access them. Incidents of violence and harassment have also been reported when women queue up to fill water or use toilets. The findings from the Perceptions Survey, 2013 and FGDs also reveal these concerns, particularly the fear of sexual harassment. Furthermore, the lack of sanitation could lead to conflict and possible violence. A study by Rodgers and Satija (2012) in selected slum settlements in Patna reveals that verbal and physical fights over makeshift toilets and water pumps are common.
• Anotherinfrastructure-relatedissueinDelhi is the problem of boundary walls and setbacks around residential spaces, which have experienced a rise in anti-social activities like urinating in public spaces, and harassment. These contribute to a feeling of being unsafe, particularly by women (UTTIPEC, 2010). The high walls also block visibility and isolate pedestrians. Coupled with the lack of street lighting this results in people avoiding these ‘public’ spaces. The Perceptions Survey, 2013, brings out this issue quite strongly, with the women respondents revealing that they feel more unsafe as they move further away from their localities and into public spaces. This has resulted in women perceiving public spaces as negative, thus curtailing their mobility, which, in turn, impacts their participation in the life and the various employment and other opportunities that Delhi has to offer.
• AstudybyJagori(2010a)findsthattwooutofthree women report having faced incidents of sexual harassment more than once during the year under study. Spaces like the roadside and public transport were reported as unsafe. Over 80 per cent of the women respondents reported harassment in public transport or during transit and over 60 per cent reported facing verbal or physical harassment on
Delhi human Development RepoRt 2013public Safety
Delhi human Development RepoRt 2013public Safety
165Chapter 6
the roadside. Findings from the Perceptions Survey reported in the earlier DHDR of 2006 also reveal public safety as a serious concern amongst the residents, with less than 20 per cent of the people feeling that the city was safe and half of them finding the city particularly unsafe for women.
• Accordingtotheresearchfindingsofanotherstudy by Jagori (2010b), the most vulnerable groups identified were young women below the age of 25 years, poor women (particularly homeless women), single women and Muslim women. Some of the factors giving rise to female insecurity included the lack of visible policing, the presence of men dealing with or consuming alcohol or drugs, crowded public transport and bus stops, poor lighting and societal attitudes. Less than 1 per cent of the women reported approaching the police in case of an incident of sexual harassment, which reflects the lack of trust for the police among the people (ibid.), a finding which also emerges in the Perceptions Survey, 2013.
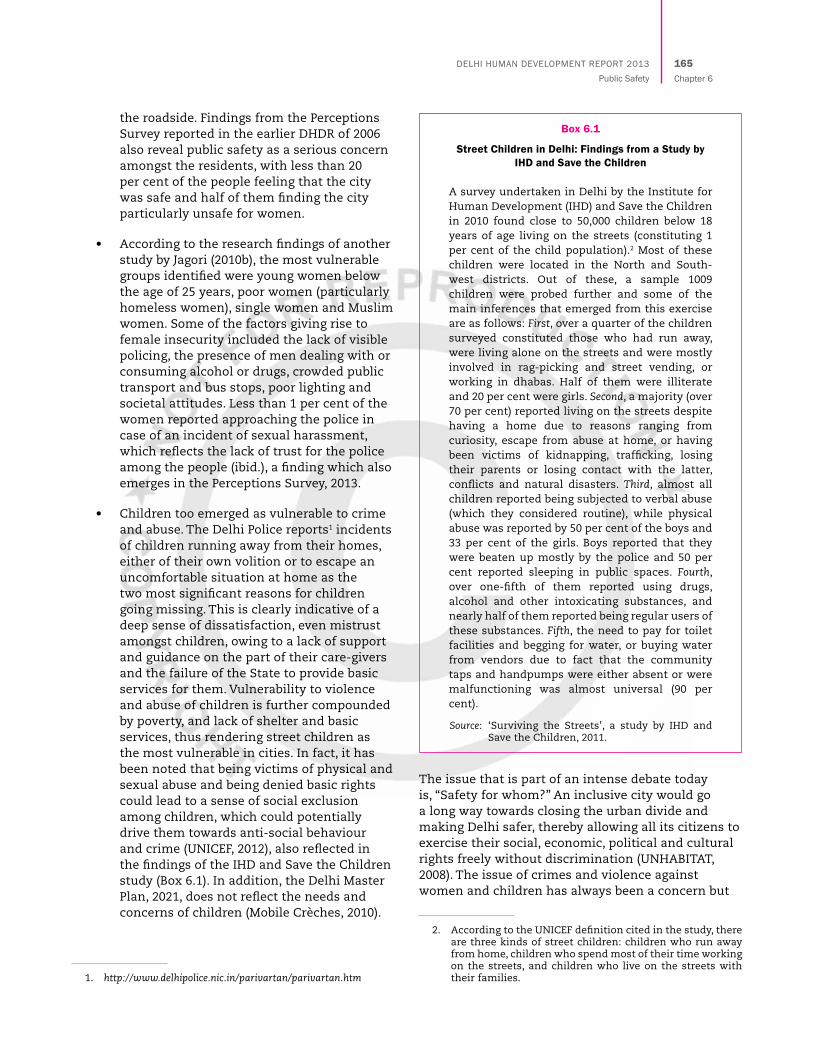
• Childrentooemergedasvulnerabletocrimeand abuse. The Delhi Police reports1 incidents of children running away from their homes, either of their own volition or to escape an uncomfortable situation at home as the two most significant reasons for children going missing. This is clearly indicative of a deep sense of dissatisfaction, even mistrust amongst children, owing to a lack of support and guidance on the part of their care-givers and the failure of the State to provide basic services for them. Vulnerability to violence and abuse of children is further compounded by poverty, and lack of shelter and basic services, thus rendering street children as the most vulnerable in cities. In fact, it has been noted that being victims of physical and sexual abuse and being denied basic rights could lead to a sense of social exclusion among children, which could potentially drive them towards anti-social behaviour and crime (UNICEF, 2012), also reflected in the findings of the IHD and Save the Children study (Box 6.1). In addition, the Delhi Master Plan, 2021, does not reflect the needs and concerns of children (Mobile Crèches, 2010).
1. http://www.delhipolice.nic.in/parivartan/parivartan.htm
Box 6.1
Street Children in Delhi: Findings from a Study by IHD and Save the Children
A survey undertaken in Delhi by the Institute for Human Development (IHD) and Save the Children in 2010 found close to 50,000 children below 18 years of age living on the streets (constituting 1 per cent of the child population).2 Most of these children were located in the North and South-west districts. Out of these, a sample 1009 children were probed further and some of the main inferences that emerged from this exercise are as follows: First, over a quarter of the children surveyed constituted those who had run away, were living alone on the streets and were mostly involved in rag-picking and street vending, or working in dhabas. Half of them were illiterate and 20 per cent were girls. Second, a majority (over 70 per cent) reported living on the streets despite having a home due to reasons ranging from curiosity, escape from abuse at home, or having been victims of kidnapping, trafficking, losing their parents or losing contact with the latter, conflicts and natural disasters. Third, almost all children reported being subjected to verbal abuse (which they considered routine), while physical abuse was reported by 50 per cent of the boys and 33 per cent of the girls. Boys reported that they were beaten up mostly by the police and 50 per cent reported sleeping in public spaces. Fourth, over one-fifth of them reported using drugs, alcohol and other intoxicating substances, and nearly half of them reported being regular users of these substances. Fifth, the need to pay for toilet facilities and begging for water, or buying water from vendors due to fact that the community taps and handpumps were either absent or were malfunctioning was almost universal (90 per cent).
Source: ‘Surviving the Streets’, a study by IHD and Save the Children, 2011.
The issue that is part of an intense debate today is, “Safety for whom?” An inclusive city would go a long way towards closing the urban divide and making Delhi safer, thereby allowing all its citizens to exercise their social, economic, political and cultural rights freely without discrimination (UNHABITAT, 2008). The issue of crimes and violence against women and children has always been a concern but
2. According to the UNICEF definition cited in the study, there are three kinds of street children: children who run away from home, children who spend most of their time working on the streets, and children who live on the streets with their families.
Delhi human Development RepoRt 2013public Safety
166Chapter 6
Delhi human Development RepoRt 2013public Safety
it has now come into sharp focus, especially in the context of a series of brutal events that have occurred in the recent past, including the horrific gang rape of a 23-year old girl in December 2012, and that of a 5-year old girl in April 2013, to count a few. The incident of 16 December is being increasingly seen as a ‘tipping point’3 in the social, legal as well as policy landscape, as it invited massive social protests, thus making crimes against women ‘everybody’s business’.4 The major initiatives undertaken in the formulation of laws and policies are reflected in the recommendations of the Justice Verma Committee (constituted in December 2012), many of which have been also incorporated in the new the Criminal Law [Amendment] Act (2013). The media and civil society organisations were also instrumental in facilitating massive protests and meetings, spreading awareness in the process, and demanding fundamental changes within institutions such as the police and the judiciary. Although there is still a long way to go, the silence and apathy on the issue of crimes and violence against women has been broken. What is needed is a change not just in policing and laws, but also in societal attitudes, planning processes, and redressal mechanisms by promoting sensitisation and awareness among the public. These issues have been touched upon in the final section of this chapter.
6.3. State of Crime
6.3.1 The Total Crime Rate
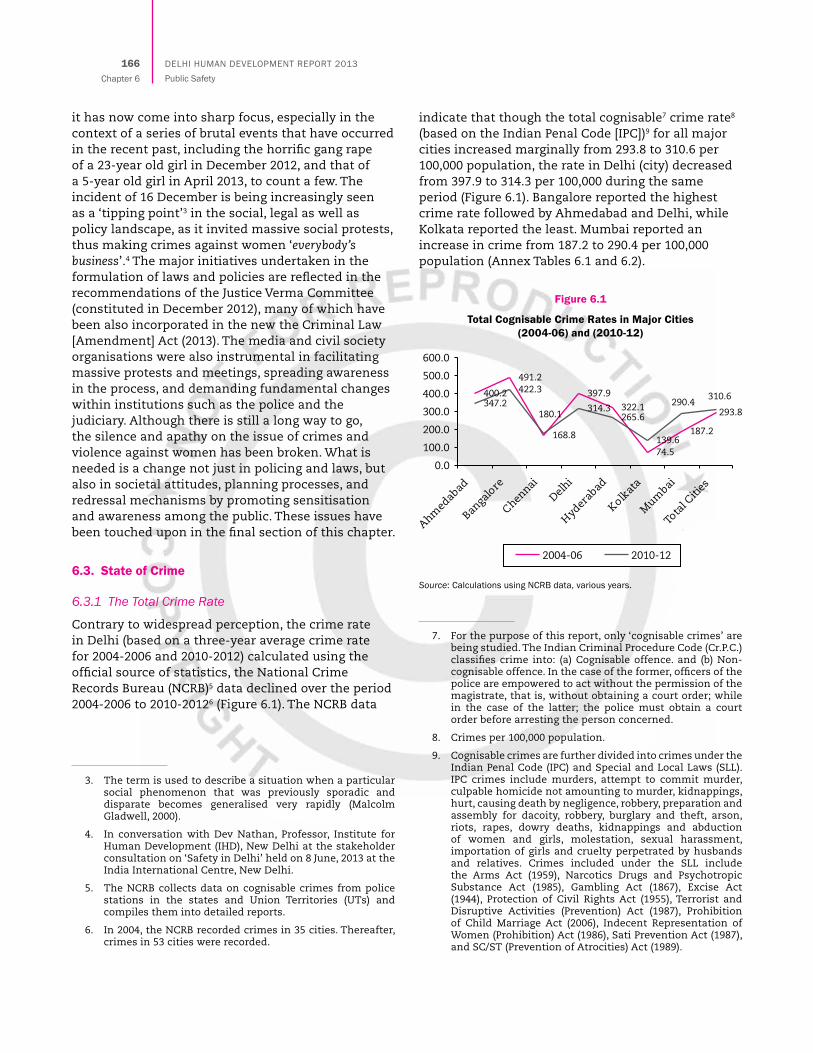
Contrary to widespread perception, the crime rate in Delhi (based on a three-year average crime rate for 2004-2006 and 2010-2012) calculated using the official source of statistics, the National Crime Records Bureau (NCRB)5 data declined over the period 2004-2006 to 2010-20126 (Figure 6.1). The NCRB data
3. The term is used to describe a situation when a particular social phenomenon that was previously sporadic and disparate becomes generalised very rapidly (Malcolm Gladwell, 2000).
4. In conversation with Dev Nathan, Professor, Institute for Human Development (IHD), New Delhi at the stakeholder consultation on ‘Safety in Delhi’ held on 8 June, 2013 at the India International Centre, New Delhi.
5. The NCRB collects data on cognisable crimes from police stations in the states and Union Territories (UTs) and compiles them into detailed reports.
6. In 2004, the NCRB recorded crimes in 35 cities. Thereafter, crimes in 53 cities were recorded.
indicate that though the total cognisable7 crime rate8 (based on the Indian Penal Code [IPC])9 for all major cities increased marginally from 293.8 to 310.6 per 100,000 population, the rate in Delhi (city) decreased from 397.9 to 314.3 per 100,000 during the same period (Figure 6.1). Bangalore reported the highest crime rate followed by Ahmedabad and Delhi, while Kolkata reported the least. Mumbai reported an increase in crime from 187.2 to 290.4 per 100,000 population (Annex Tables 6.1 and 6.2).
Figure 6.1
Total Cognisable Crime Rates in Major Cities (2004-06) and (2010-12)
Source: Calculations using NCRB data, various years.
7. For the purpose of this report, only ‘cognisable crimes’ are being studied. The Indian Criminal Procedure Code (Cr.P.C.) classifies crime into: (a) Cognisable offence. and (b) Non-cognisable offence. In the case of the former, officers of the police are empowered to act without the permission of the magistrate, that is, without obtaining a court order; while in the case of the latter; the police must obtain a court order before arresting the person concerned.
8. Crimes per 100,000 population.
9. Cognisable crimes are further divided into crimes under the Indian Penal Code (IPC) and Special and Local Laws (SLL). IPC crimes include murders, attempt to commit murder, culpable homicide not amounting to murder, kidnappings, hurt, causing death by negligence, robbery, preparation and assembly for dacoity, robbery, burglary and theft, arson, riots, rapes, dowry deaths, kidnappings and abduction of women and girls, molestation, sexual harassment, importation of girls and cruelty perpetrated by husbands and relatives. Crimes included under the SLL include the Arms Act (1959), Narcotics Drugs and Psychotropic Substance Act (1985), Gambling Act (1867), Excise Act (1944), Protection of Civil Rights Act (1955), Terrorist and Disruptive Activities (Prevention) Act (1987), Prohibition of Child Marriage Act (2006), Indecent Representation of Women (Prohibition) Act (1986), Sati Prevention Act (1987), and SC/ST (Prevention of Atrocities) Act (1989).

Delhi human Development RepoRt 2013public Safety
Delhi human Development RepoRt 2013public Safety
167Chapter 6
The NCRB ranking, which is based on the total cognisable crime rate in the country, shows that Delhi ranks 31st among 53 cities in 2012. Thus, contrary to public perception and media reportage which projects Delhi as the most unsafe city in the India, it is pertinent to note that official data reveals a different story.
6.3.2 Types of Crimes
Delhi displays higher rates of violent crimes,10 such as murder and kidnapping, as compared to other cities, which is an important cause for concern. However, an analysis of the percentage share of the types of crimes in Delhi between 2004-06 and 2010-12 makes it clear that the share of crimes against property were the highest during both time points, and have increased over time, while body crimes and crimes against women also recorded an increase from 6.8 to 9.9 per cent, and 6.7 to 9.5 per cent, respectively, over the same period (Figure 6.2).
Figure 6.2
Delhi: Composition of Crimes (per cent) (2004-06 and 2010-12)
Source: Calculations using NCRB data, various years.
10. IPC crimes include violent crimes, viz., crimes against the body like murders, attempt to commit murder, culpable homicide not amounting to murder, kidnappings, hurt, causing death by negligence; crimes against property like robbery, preparation and assembly for dacoity, burglary and theft; crimes against public order like riots and arson; crimes against women include rapes, dowry deaths, kidnappings and abduction of women and girls, molestation, sexual harassment, importation of girls and perpetration of cruelty by husbands and relatives; crimes against children include rape, infanticide, kidnapping and abduction of children, foeticide, procurement of minor girls, buying and selling of girls for prostitution, abetment to suicide, exposure and abandonment; crimes against Scheduled Castes (SCs) and Scheduled Tribes (STs) like murder, rapes, robbery, burglary, arson, and, crimes under the Prevention of Atrocities against SCs/STs Act; economic crimes like criminal breach of trust, cheating, counterfeiting; and other IPC crimes.
The percentage share of crimes against women in all the cities to the total IPC crimes have increased from 5.7 to 6.7 per cent over the period under consideration. Hyderabad recorded the highest percentage share for the same for both time points, followed by Delhi (Annex Tables 6.3 and 6.4).
6.3.3 Crimes against Women
Delhi does not feature amongst the top ten cities in terms of the rankings based on the total rate of cognisable crimes against women. It is ranked 16th amongst the 53 cities in 2012 (NCRB, 2012). The rank was 21st in the previous year. The overall rates of crimes against women11 increased from 16.8 to 20.7 per 100,000 between 2004-06 and 2010-12, and there is considerable variability in these crime rates across cities (Figure 6.3). In the case of Delhi, the rate increased from 26.8 to 29.7 per 100,000 between the two time periods under study. In terms of the percentage share, Hyderabad recorded the highest share of crimes against women at both points of time (close to 10 per cent), followed by Delhi which showed an increase (from 6.7 per cent to 9.5 per cent) during the same period. (Annex Tables 6.3 and 6.4).
Figure 6.3
Crime Rates against Women in the Major Cities (2005-06 and 2010-12)
Source: Calculations using NCRB data, various years.
The most important point to be noted is that in terms of the rates of different kinds of crimes against
11. (i) Rape (Section 376, IPC), (ii) Kidnapping and abduction for specified purposes (Sections 363–373, IPC), (iii) Homicide for dowry, Dowry deaths or their attempts (Section 302/304-B, IPC), (iv) Torture—Both mental and physical (Section 498-A, IPC), (v) Molestation (Section 354, IPC), (vi) Sexual harassment (Eve-teasing) (Section 509, IPC), (vii) Importation of girls (up to 21 years of age) (Section 366-B, IPC).
Delhi human Development RepoRt 2013public Safety
168Chapter 6
Delhi human Development RepoRt 2013public Safety
women, Delhi reported the highest rate of rapes (4.0 per 100,000 and 3.2 per 100,000, respectively, for the time points considered), despite showing a decline in the occurrence of the same. Delhi’s position vis-à-vis other cities in terms of the rates of rapes is a cause for concern and highlights the need for intensive policy interventions. The rate of kidnappings and abductions was also the highest in Delhi and increased from 5.2 to 10.8 per 100,000. However, the perpetration of cruelty by husbands and relatives decreased slightly from 10.9 to 10.2 per 100,000 (Annex Tables 6.5 and 6.6).
If the rates of crimes against women are calculated as a proportion of the urban female population rather than of the total population, then the crime rate is found to decrease significantly from 58.2 to 49.8, between the years 2005-06 and 2008-09. However, between 2011 and 2012, the crime rate witnessed an increase to 63.6 per 100,000, thereby exceeding the 2005-06 level (Table 6.1).
Table 6.1
Crime Rates against Women in Delhi*12
Crime Category 2005-06 2008-09 2011-12
Rape 8.3 5.6 6.9
Kidnapping and Abduction 14.0 16.3 22.9
Dowry Deaths 1.6 1.5 1.4
Cruelty by Husband and Relatives 22.2 17.5 22.3
Molestation 9.7 7.3 7.9
Eve-teasing 2.5 1.7 2.2
Importation of girls 0.0 0.0 0.0
Total 58.2 49.8 63.6
Note: * Based on an average of the years 2005-06, 2008-09 and 2011-12.
Source: Calculated as a proportion of the urban female population on the basis of Census of India, 2001, from the NCRB, various years.
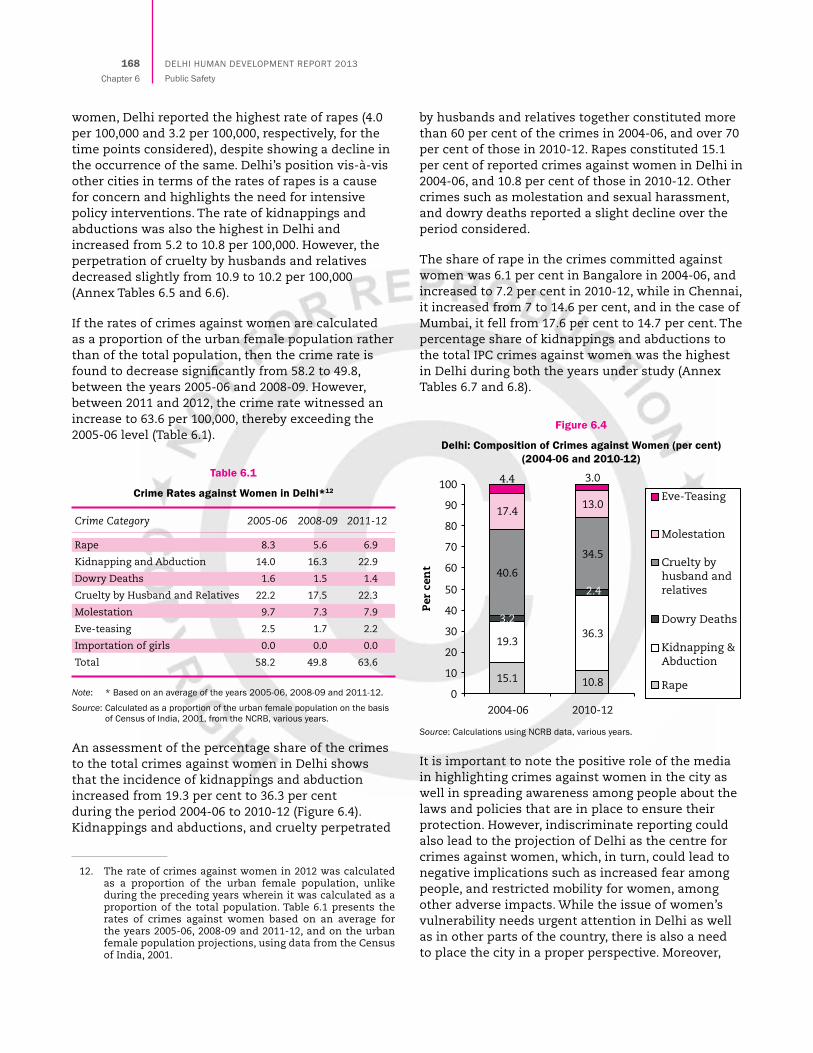
An assessment of the percentage share of the crimes to the total crimes against women in Delhi shows that the incidence of kidnappings and abduction increased from 19.3 per cent to 36.3 per cent during the period 2004-06 to 2010-12 (Figure 6.4). Kidnappings and abductions, and cruelty perpetrated
12. The rate of crimes against women in 2012 was calculated as a proportion of the urban female population, unlike during the preceding years wherein it was calculated as a proportion of the total population. Table 6.1 presents the rates of crimes against women based on an average for the years 2005-06, 2008-09 and 2011-12, and on the urban female population projections, using data from the Census of India, 2001.
by husbands and relatives together constituted more than 60 per cent of the crimes in 2004-06, and over 70 per cent of those in 2010-12. Rapes constituted 15.1 per cent of reported crimes against women in Delhi in 2004-06, and 10.8 per cent of those in 2010-12. Other crimes such as molestation and sexual harassment, and dowry deaths reported a slight decline over the period considered.
The share of rape in the crimes committed against women was 6.1 per cent in Bangalore in 2004-06, and increased to 7.2 per cent in 2010-12, while in Chennai, it increased from 7 to 14.6 per cent, and in the case of Mumbai, it fell from 17.6 per cent to 14.7 per cent. The percentage share of kidnappings and abductions to the total IPC crimes against women was the highest in Delhi during both the years under study (Annex Tables 6.7 and 6.8).
Figure 6.4
Delhi: Composition of Crimes against Women (per cent) (2004-06 and 2010-12)
Source: Calculations using NCRB data, various years.
It is important to note the positive role of the media in highlighting crimes against women in the city as well in spreading awareness among people about the laws and policies that are in place to ensure their protection. However, indiscriminate reporting could also lead to the projection of Delhi as the centre for crimes against women, which, in turn, could lead to negative implications such as increased fear among people, and restricted mobility for women, among other adverse impacts. While the issue of women’s vulnerability needs urgent attention in Delhi as well as in other parts of the country, there is also a need to place the city in a proper perspective. Moreover,
Delhi human Development RepoRt 2013public Safety
Delhi human Development RepoRt 2013public Safety
169Chapter 6
as the preceding discussion has shown, two parallel situations emerge, that is, one, the subjective perception of feeling (un)safe, and two, the objective reality in terms of recorded crimes. However, it may also be noted that while the reporting of crime has increased over time, there is still considerable under-reporting of crimes due to various reasons such as reluctance by the police to register cases, and hesitation among the people to report certain crimes due to the social stigma attached to them, among other reasons.
6.3.4 Crimes against Children
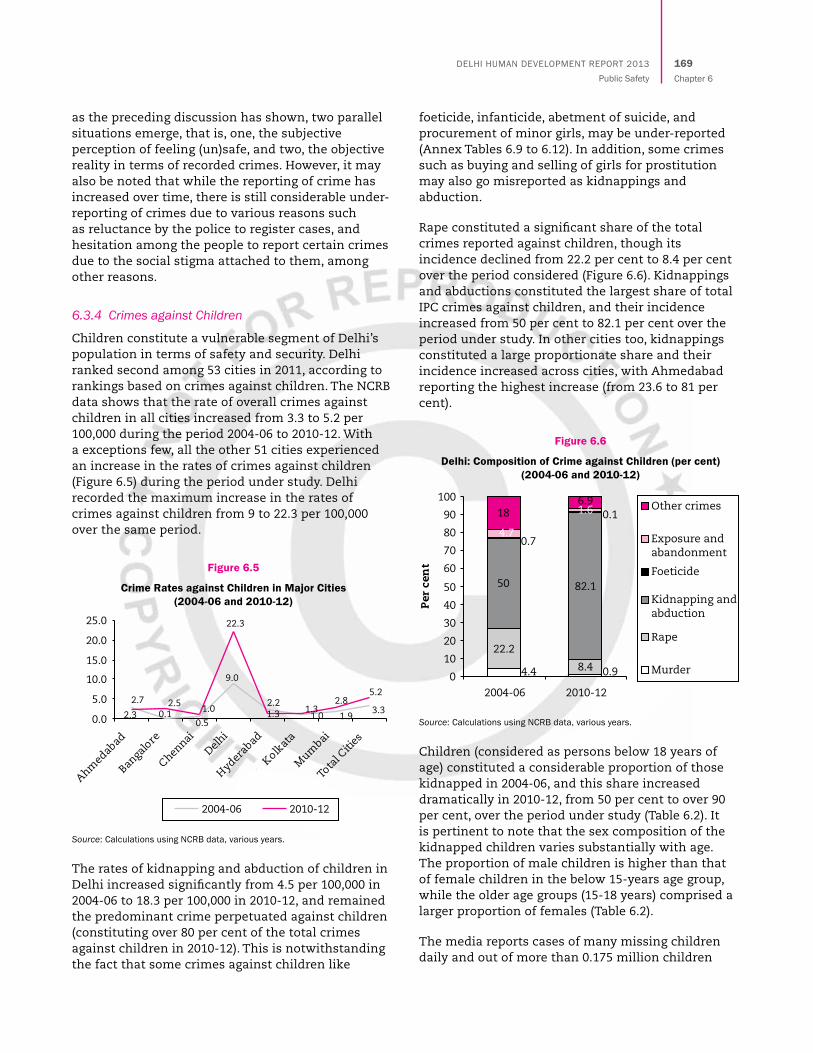
Children constitute a vulnerable segment of Delhi’s population in terms of safety and security. Delhi ranked second among 53 cities in 2011, according to rankings based on crimes against children. The NCRB data shows that the rate of overall crimes against children in all cities increased from 3.3 to 5.2 per 100,000 during the period 2004-06 to 2010-12. With a exceptions few, all the other 51 cities experienced an increase in the rates of crimes against children (Figure 6.5) during the period under study. Delhi recorded the maximum increase in the rates of crimes against children from 9 to 22.3 per 100,000 over the same period.
Figure 6.5
Crime Rates against Children in Major Cities (2004-06 and 2010-12)
Source: Calculations using NCRB data, various years.
The rates of kidnapping and abduction of children in Delhi increased significantly from 4.5 per 100,000 in 2004-06 to 18.3 per 100,000 in 2010-12, and remained the predominant crime perpetuated against children (constituting over 80 per cent of the total crimes against children in 2010-12). This is notwithstanding the fact that some crimes against children like
foeticide, infanticide, abetment of suicide, and procurement of minor girls, may be under-reported (Annex Tables 6.9 to 6.12). In addition, some crimes such as buying and selling of girls for prostitution may also go misreported as kidnappings and abduction.
Rape constituted a significant share of the total crimes reported against children, though its incidence declined from 22.2 per cent to 8.4 per cent over the period considered (Figure 6.6). Kidnappings and abductions constituted the largest share of total IPC crimes against children, and their incidence increased from 50 per cent to 82.1 per cent over the period under study. In other cities too, kidnappings constituted a large proportionate share and their incidence increased across cities, with Ahmedabad reporting the highest increase (from 23.6 to 81 per cent).
Figure 6.6
Delhi: Composition of Crime against Children (per cent) (2004-06 and 2010-12)
Source: Calculations using NCRB data, various years.
Children (considered as persons below 18 years of age) constituted a considerable proportion of those kidnapped in 2004-06, and this share increased dramatically in 2010-12, from 50 per cent to over 90 per cent, over the period under study (Table 6.2). It is pertinent to note that the sex composition of the kidnapped children varies substantially with age. The proportion of male children is higher than that of female children in the below 15-years age group, while the older age groups (15-18 years) comprised a larger proportion of females (Table 6.2).
The media reports cases of many missing children daily and out of more than 0.175 million children
Delhi human Development RepoRt 2013public Safety
170Chapter 6
Delhi human Development RepoRt 2013public Safety
reported missing in India between 2009 and 2011, a majority were reported to be missing from Maharashtra, Delhi and Madhya Pradesh (Hindustan Times, 2013). In Delhi, on an average, 14 children are reported missing daily, according to the Crime in Delhi Report (Delhi Police, 2012). Given the gravity of the situation, a recent directive of the Supreme Court ordered that the cases of missing children be taken more seriously and recorded as criminal cases, which require immediate investigation. According to a study by Navsrishti (2011), the maximum cases of missing children were reported in the North-east, East and South-east districts in Delhi. Three-fourths of those registered as missing were found by the police and others, while the rest remained missing. There were glaring gaps in the standard operating procedures (SOPs) and the police were known to ignore cases of those missing children who belonged to the socio-economically weaker sections (ibid.).
Thus, it is clear from official data that the crime rates against children in Delhi are among the highest, with rape and kidnappings constituting the main crimes, which is an issue of crucial concern for both the government and the police. The protection of children in the city needs to be accorded top priority and critical attention needs to be paid in terms of improving the formulation as well as implementation of laws and social policy. While the media has been quite active in raising awareness and spreading information about the issue, urgent steps still need to be taken for ensuring better policing and implementation of laws, and most importantly, for spreading awareness to guarantee the safety of children. More studies are needed to understand the ways in which crimes against children are reported, in order to attain a better understanding of the crime profile, as well as for instituting more effective
policies to facilitate the improved protection of children.
6.3.5 Charge-sheets and Convictions
In terms of police investigations, the pendency rate increased from 43.7 per cent to 51.9 per cent from 2005 to 2007, and then decreased to 45 per cent in 2011, while the charge-sheeting rate has remained more or less the same, though it decreased a little in 2007 (Table 6.3). In 2011, the pendency rate was reported to be 45 per cent and the charge-sheet rate was 55 per cent. In 2012, the charge-sheet rate increased significantly to 70.4 per cent, which was a positive development, while the pendency rate decreased slightly to 42.1 per cent. At the level of the courts, the conviction rate has been decreasing since 2005, while the pendency rate remains high (and was
Table 6.2
Age- and Sex-wise Composition of Victims of Kidnappings and Abductions (%)
Year Delhi/ Total Number of Up to 10 10-15 Years 15-18 Years Above 18 Total (%) All-India Cases Reported Years (%) (%) (%) Years (%)
Male Female Male Female Male Female Male Female Total Total Male Female
2004-06 Delhi 1414 8.0 5.9 6.1 11.5 3.5 18.0 15.5 31.4 30.7 66.9
All-India 23,383 1.2 0.9 1.2 3.8 1.3 10.2 27.3 54.1 31.0 69.0
2010-12 Delhi 3648 9.9 4.8 23.2 18.0 11.3 26.0 2.9 4.0 47.2 52.8
All-India 43,565 1.6 1.1 2.9 6.5 2.1 21.7 15.2 48.9 21.8 78.2
Source: Calculations using NCRB data, various years.
Table 6.3
Delhi: Status of Police and Court Cases Dealing with General IPC Crimes (2005 to 2012) (per cent)
Years Police Cases (%) Court Cases (%)
Charge-sheet Pendency Conviction Acquittal Pendency
2005 56.3 43.7 8.9 5.5 85.6
2006 53.7 46.3 9.6 5.1 85.3
2007 48.1 51.9 9.7 5.3 85.0
2008 55.2 44.8 5.8 3.1 91.1
2009 52.6 47.4 5.4 3.9 90.7
2010 50.0 50.0 4.6 4.3 91.1
2011 55.0 45.0 5.3 5.7 88.9
2012 70.4 42.1 7.1 6.2 86.7
Source: Calculations using NCRB data.

Delhi human Development RepoRt 2013public Safety
Delhi human Development RepoRt 2013public Safety
171Chapter 6
almost 90 per cent in 2011). Between 2011 and 2012, the conviction rate increased from 5.3 per cent to 7.1 per cent, the rate of acquittal increased slightly from 5.7 to 6.2 per cent, while the pendency rates declined from 88.9 per cent to 86.7 per cent.
Table 6.4
Delhi: Status of Police and Court Cases Dealing with Rape from 2005 to 2012 in Delhi (per cent)
Years Police Cases (%) Court Cases (%)
Charge-sheet Pendency Conviction Acquittal Pendency
2005 68.7 31.3 7.2 38.3 54.5
2006 91.8 8.2 8.2 24.5 67.3
2007 84.2 15.8 9.1 23.8 67.1
2008 87.6 12.4 6.8 15.5 77.6
2009 87.7 12.3 10.2 11.4 78.4
2010 86.0 14.0 7.8 14.6 77.6
2011 77.2 22.8 9.9 13.9 76.3
2012 69.8 30.2 14.8 15.2 70.0
Source: Calculations using NCRB data.
As regards the cases of rape, at the level of the police, the pendency rate has been seen to be increasing since 2006. The rate of cases charge-sheeted has also seen to be increasing, however, with a slight decrease in 2011 and a significant decrease in 2012 (Table 6.4). One can see that in 2012, the rate of charge-sheeting by the police fell to 69.8 per cent, while the pendency rate increased to 30.2 per cent from the previous year. At the level of the court, the conviction rate has increased since 2005, and remains higher than that of general crimes. The pendency rate of court cases has also been seen to be increasing, while the acquittal rate has been decreasing (which can be attributed to the larger number of pending cases). The rate of acquittal in rape cases is still much higher than that of general IPC crimes. However, at the level of the court, the conviction rate has increased significantly from 9.9 to 14.8 per cent from 2011 to 2012, while the acquittal rate has increased to 15.2 per cent and the pendency rate has fallen from 76.3 to 70 per cent in the same period. Overall, the picture of the police and court cases dealing with rape is slightly better than that of the total IPC crimes shown in Table 6.3.
6.4. Findings from the Perceptions Survey, 2013
The Perceptions Survey, 2013, collected information relating to various aspects of crime and safety of the
population, in general, and women, in particular. The broad areas of inquiry included: (i) rating Delhi in terms of personal safety, (ii) how safe/secure people felt living in their localities, (iii) rating the security of women and girls in the city in three spaces apart from their homes, viz. the localities in which they resided, public transport and at the workplace, (iv) whether crime has increased, decreased, or stayed the same during the last three years, (v) whether the respondents have experienced crime, and the nature of these crimes, (vi) level of satisfaction with the police, in terms of their prompt response to a problem and their being easily approachable and easy to talk to, and (vii) the steps that can be taken to improve people’s safety/ security in Delhi.13
In addition to the Survey, Focus Group Discussions (FGDs) were carried out in six localities. In particular, the FGDs were conducted only with women in various locations across the city to understand the issues that specifically concern women’s safety. In addition, interviews were also conducted with the police personnel in police stations at various locations in the city to better understand their perspective. In the FGDs, the key points of discussions included identification of the areas considered most unsafe; the people who were the most unsafe; threats and incidents of crime, perceptions about the police; coping mechanisms; gender-based violence; perceptions about the increase or decline in crime; the response of the State on the issue of crime; and, recommendations on how to make Delhi safe(r).14 Some of the main findings based on the responses to the Survey questionnaire are delineated below.
6.4.1 How Do People Rate Delhi in Terms of Personal Safety?
Delhi was rated as ‘below average’ in terms of personal safety by nearly 38 per cent of the respondents, (a combination of poor: 30.7 per cent or very poor: 7.2 per cent ratings; see Figure 6.7). However, nearly 30 per cent of the respondents reported that the levels of personal safety in the city were ‘above average’.
13. It needs to be noted that the Perception Survey, 2013, mainly addressed public safety issues. In relation to women, the Survey was confined to probing about women’s safety in public spaces. Women’s security within their homes was beyond the scope of this survey.
14. It may be noted that the Perceptions Survey, 2013, was carried out soon after the incident of 16 December 2012, which is likely to have influenced the responses.

Delhi human Development RepoRt 2013public Safety
172Chapter 6
Delhi human Development RepoRt 2013public Safety
Interestingly, variations in the perception of safety by the district and type of locality were reported. A majority of the respondents in New Delhi surprisingly rated personal safety in the city-state as poor and very poor (56.3 per cent). This was followed by the districts of South Delhi (49.7 per cent), North-west Delhi (41.2 per cent), Central Delhi (39.4 per cent), and West Delhi (38.6 per cent), where the respondents rated levels of personal safety as lower than the all-Delhi average (Figure 6.8).
Figure 6.7
People’s Rating of Personal Safety in Delhi (%)
Source: Perceptions Survey, 2013.
Figure 6.8
District-wise Rating of Personal Safety (%)
Source: Perceptions Survey, 2013.
When the data is disaggregated by the type of locality, it is interesting to note that again the residents of posh localities rated personal safety in Delhi as most unfavourable (with 46.2 per cent of the respondents rating it as poor or very poor). This was followed by respondents in the Walled City (41.9 per cent), Jhuggi
Jhopdi (JJ) clusters (40 per cent), authorised colonies (39.9 per cent), JJ resettlement colonies (36.9 per cent), urban villages (34.9 per cent) and unauthorised colonies (31.0 per cent).
There were also substantial differences between the perceptions of men and those of women. As compared to men (31.8 per cent), far fewer women (26.8 per cent) thought that the level of personal safety was good or very good in the metropolis, showing a gender difference in perceptions of approximately 5 percentage points.
When the data is disaggregated by caste, there was not much difference between the general, Scheduled Castes (SCs) and Other Backward Castes (OBCs) (the percentages that reported personal safety as good or very good were 30.1, 29.7 and 29.6 per cent, respectively). However, Scheduled Tribes (STs) reported higher insecurity, although their population in rather insignificant in the city. It is also interesting to note that migrants across all caste groups rated Delhi much higher on the parameter of personal safety than the non-migrants.
6.4.2 How Safe Do People Feel in Their Localities?
In response to the question as to how safe they felt while living in their localities, a majority of the respondents (51.4 per cent) reported feeling secure or very secure (3.6%) (Figure 6.9). Another 26.5 per cent felt secure sometimes, and overall, less that 20 per cent of the population felt insecure, or very insecure.
Figure 6.9
How Safe Do People Feel in Their Localities? (%)
Source: Perceptions Survey, 2013.
Across the districts, New Delhi emerged as the safest locality with 71.6 per cent of respondents from this district saying that they felt secure or very secure. This is quite paradoxical, and needs to be read in tandem with the results of the earlier question,
Delhi human Development RepoRt 2013public Safety
Delhi human Development RepoRt 2013public Safety
173Chapter 6
wherein residents of New Delhi (disproportionately) felt that Delhi, on the whole, was more unsafe, while at the same time, they felt the safest in their own localities. As regards the other districts, the corresponding figures were Central Delhi, 61.8 per cent, North-east Delhi, 70.0 per cent, and North Delhi, 62.7 per cent, respectively.
When disaggregated by colony type, the responses on safety showed the respondents from unauthorised colonies feeling the most secure in their localities (with 63.9 per cent reporting that they felt secure and 2.5 per cent reporting that they felt very secure). A possible explanation for this could be the sense of familiarity and comfort that the poor and vulnerable populations who live in these settlements feel within their immediate neighbourhoods. This was followed by respondents from the Walled City (62.4 per cent), authorised colonies (57.2 per cent), urban villages (52.5 per cent), posh localities (49.5 per cent), JJ resettlement colonies (49.4 per cent) and JJ clusters (40.8 per cent), in that order. In general, it can be seen that people felt safe in their own localities, and there was not much difference by gender for this perception (56.1 per cent for men and 53.5 per cent for women). When disaggregated in terms of age, there was little variation in the data on feeling secure in one’s locality until the 60-plus age group. Senior citizens reported feeling relatively less secure (52 per cent) in comparison to the aggregate (55.2 per cent).
6.4.3 How Do People Rate Women’s Safety— At Their Workplace, in Public Transport and in Their Own Localities?
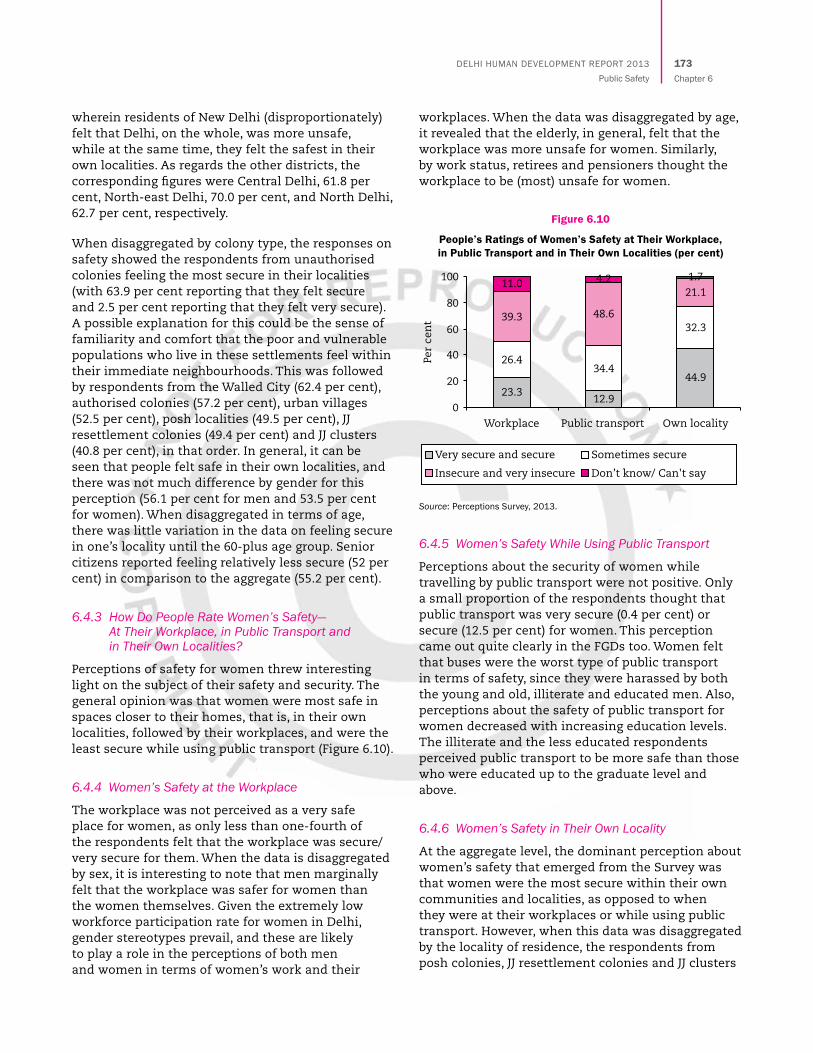
Perceptions of safety for women threw interesting light on the subject of their safety and security. The general opinion was that women were most safe in spaces closer to their homes, that is, in their own localities, followed by their workplaces, and were the least secure while using public transport (Figure 6.10).
6.4.4 Women’s Safety at the Workplace
The workplace was not perceived as a very safe place for women, as only less than one-fourth of the respondents felt that the workplace was secure/very secure for them. When the data is disaggregated by sex, it is interesting to note that men marginally felt that the workplace was safer for women than the women themselves. Given the extremely low workforce participation rate for women in Delhi, gender stereotypes prevail, and these are likely to play a role in the perceptions of both men and women in terms of women’s work and their
workplaces. When the data was disaggregated by age, it revealed that the elderly, in general, felt that the workplace was more unsafe for women. Similarly, by work status, retirees and pensioners thought the workplace to be (most) unsafe for women.
Figure 6.10
People’s Ratings of Women’s Safety at Their Workplace, in Public Transport and in Their Own Localities (per cent)
Source: Perceptions Survey, 2013.
6.4.5 Women’s Safety While Using Public Transport
Perceptions about the security of women while travelling by public transport were not positive. Only a small proportion of the respondents thought that public transport was very secure (0.4 per cent) or secure (12.5 per cent) for women. This perception came out quite clearly in the FGDs too. Women felt that buses were the worst type of public transport in terms of safety, since they were harassed by both the young and old, illiterate and educated men. Also, perceptions about the safety of public transport for women decreased with increasing education levels. The illiterate and the less educated respondents perceived public transport to be more safe than those who were educated up to the graduate level and above.
6.4.6 Women’s Safety in Their Own Locality
At the aggregate level, the dominant perception about women’s safety that emerged from the Survey was that women were the most secure within their own communities and localities, as opposed to when they were at their workplaces or while using public transport. However, when this data was disaggregated by the locality of residence, the respondents from posh colonies, JJ resettlement colonies and JJ clusters
Delhi human Development RepoRt 2013public Safety
174Chapter 6
Delhi human Development RepoRt 2013public Safety
felt women to be least secure within their own localities. In other words, the ‘rich’ and the ‘poor’ localities were considered to be the most unsafe for women. On the other hand, urban villages, unauthorised colonies and the Walled City were rated as most secure by their residents.
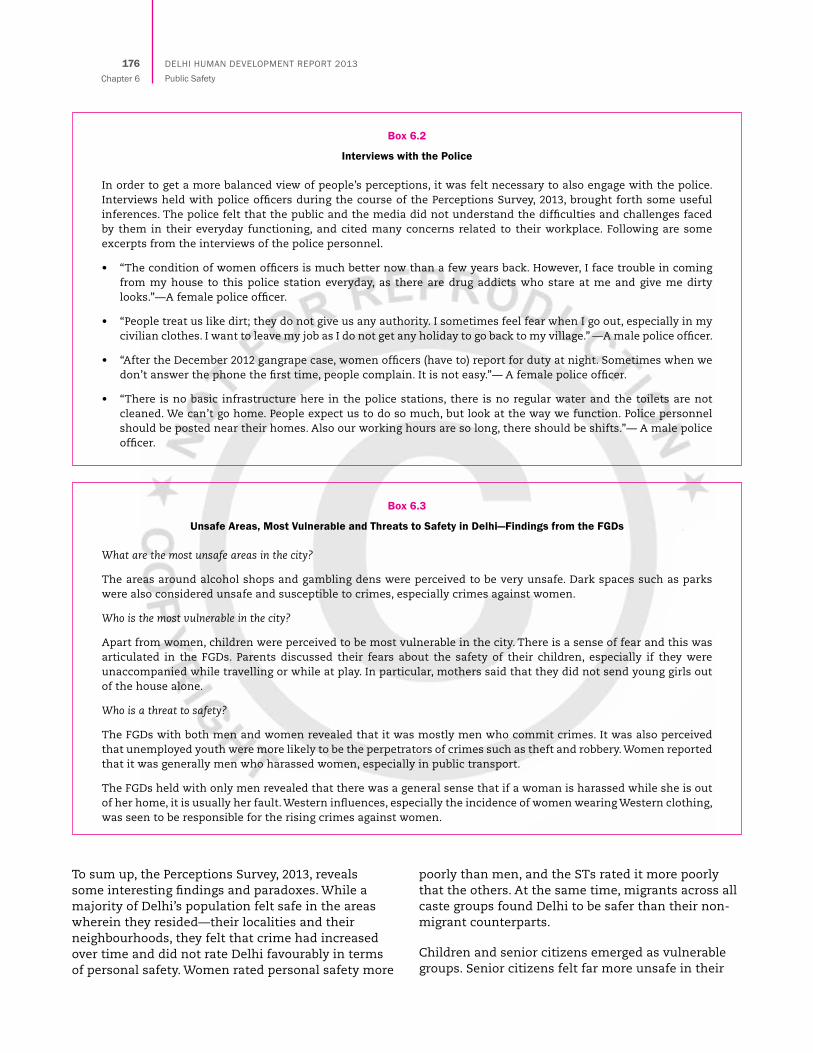
The FGDs provided useful indications about spaces within the localities which were considered to be unsafe by women. Public toilets, in particular, were considered very unsafe, and women expressed reluctance to visit them alone. Unlit roads and parks were also considered to be unsafe (Box 6.3). Incidents of chain snatching and sexual harassment were reportedly common near alcohol shops and parks. As a group of women from Satyawati Colony, Ashok Vihar, stated, “Parks in the vicinity are unsafe as groups of men can be seen gambling. Stray incidents of chain snatching, especially by boys on motor bikes are common.” The respondents from Sultanpuri said, “The railway fatak (barrier) area is very dangerous. That is where the boys hang out. Girls have to cross that area to reach their school and these boys harass them. A teenaged girl reported facing sexual harassment by local boys even when they were walking on the road. Another girl said, “When we go to the toilets, they harass us by teasing us and throwing stones at us.” Lack of street lighting and dark areas were perceived as unsafe. The need for more police presence and patrolling at night was highlighted.
6.4.7 People’s Perceptions about the Incidence of Crime over Time
The results of the Perceptions Survey indicate that Delhi’s residents share a near universal perception that crime has increased over time. There is a general perception that all kinds of crime have increased during the last three years with almost 95 per cent of the respondents reporting that both big and small crimes had increased. This emerged very clearly in the FGDs too. Groups of both men and women articulated that over time, Delhi has become an unsafe city and that crime has increased. The FGD respondents felt that small crimes (such as sexual harassment and stealing) had increased. The incidence of ‘chhura maarna’ (knifing) was reported widely during the discussions.
However, marked variations in perceptions about the incidence of crime were evident when the data was disaggregated by districts. While 81.4 per cent of the respondents in New Delhi felt that big crimes had increased, and 15.0 per cent felt that crime
had actually declined, the corresponding figures for North-west Delhi were 97.7 per cent and 0.7 per cent, respectively. In the case of small crimes, the trend was similar, but the variation between districts was less. The relatively positive outlook on the overall crime scenario in the former case may be attributed to better policing and other infrastructure in the ‘most important’ district of Delhi—the heart of the city, which is home to most of its political class and bureaucracy. Interestingly, as has been seen earlier, it is pertinent to note that while residents of New Delhi felt most safe in their localities, at the same time, they also felt most strongly that Delhi on the whole was unsafe!
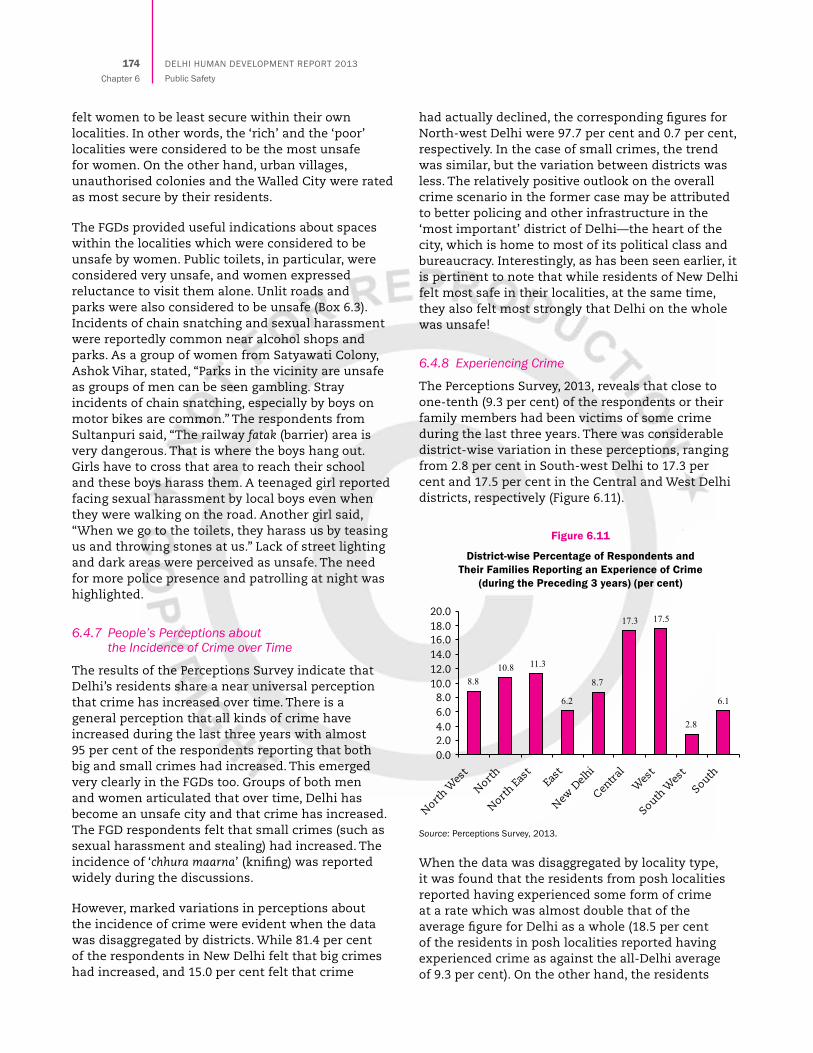
6.4.8 Experiencing Crime
The Perceptions Survey, 2013, reveals that close to one-tenth (9.3 per cent) of the respondents or their family members had been victims of some crime during the last three years. There was considerable district-wise variation in these perceptions, ranging from 2.8 per cent in South-west Delhi to 17.3 per cent and 17.5 per cent in the Central and West Delhi districts, respectively (Figure 6.11).
Figure 6.11
District-wise Percentage of Respondents and Their Families Reporting an Experience of Crime
(during the Preceding 3 years) (per cent)
Source: Perceptions Survey, 2013.
When the data was disaggregated by locality type, it was found that the residents from posh localities reported having experienced some form of crime at a rate which was almost double that of the average figure for Delhi as a whole (18.5 per cent of the residents in posh localities reported having experienced crime as against the all-Delhi average of 9.3 per cent). On the other hand, the residents
Delhi human Development RepoRt 2013public Safety
Delhi human Development RepoRt 2013public Safety
175Chapter 6
Figure 6.12
People’s Rating of Promptness Displayed by the Police (%)
Source: Perceptions Survey, 2013.
of authorised colonies, JJ clusters and the Walled city reported experiencing crime rates less than the average for Delhi.
6.4.9 Nature of Crime
The Perceptions Survey also tried to assess the kinds of crime that were experienced by the respondents. The most common crimes reported by the respondents or their families were thefts (69.2 per cent); robberies (16.7 per cent); crimes against women, which included sexual harassment (6.0 per cent), family violence (2.4 per cent), and sexual assault (0.7 per cent); and other crimes (fraud 2.9 per cent, vandalism, 1.6 per cent, and others, 0.6 per cent). With regard to the composition of criminal offences by income categories, it was found that thefts had more likely been experienced by those belonging to the lower income groups, robberies by those in the higher income groups, and, not surprisingly, the reporting of sexual harassment was also higher amongst the higher income groups.
6.4.10 Satisfaction with the Police—Promptness, Approachability and What Needs to be Done
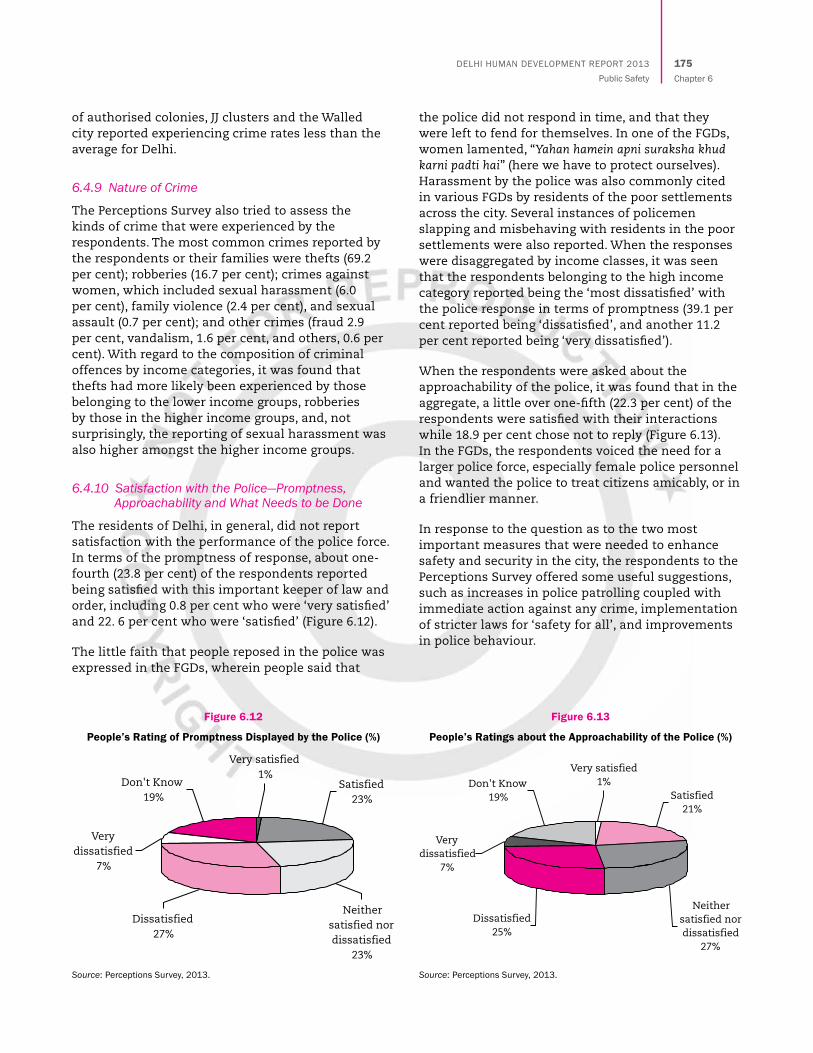
The residents of Delhi, in general, did not report satisfaction with the performance of the police force. In terms of the promptness of response, about one-fourth (23.8 per cent) of the respondents reported being satisfied with this important keeper of law and order, including 0.8 per cent who were ‘very satisfied’ and 22. 6 per cent who were ‘satisfied’ (Figure 6.12).
The little faith that people reposed in the police was expressed in the FGDs, wherein people said that
the police did not respond in time, and that they were left to fend for themselves. In one of the FGDs, women lamented, “Yahan hamein apni suraksha khud karni padti hai” (here we have to protect ourselves). Harassment by the police was also commonly cited in various FGDs by residents of the poor settlements across the city. Several instances of policemen slapping and misbehaving with residents in the poor settlements were also reported. When the responses were disaggregated by income classes, it was seen that the respondents belonging to the high income category reported being the ‘most dissatisfied’ with the police response in terms of promptness (39.1 per cent reported being ‘dissatisfied’, and another 11.2 per cent reported being ‘very dissatisfied’).
When the respondents were asked about the approachability of the police, it was found that in the aggregate, a little over one-fifth (22.3 per cent) of the respondents were satisfied with their interactions while 18.9 per cent chose not to reply (Figure 6.13). In the FGDs, the respondents voiced the need for a larger police force, especially female police personnel and wanted the police to treat citizens amicably, or in a friendlier manner.
In response to the question as to the two most important measures that were needed to enhance safety and security in the city, the respondents to the Perceptions Survey offered some useful suggestions, such as increases in police patrolling coupled with immediate action against any crime, implementation of stricter laws for ‘safety for all’, and improvements in police behaviour.
Figure 6.13
People’s Ratings about the Approachability of the Police (%)
Source: Perceptions Survey, 2013.
Delhi human Development RepoRt 2013public Safety
176Chapter 6
Delhi human Development RepoRt 2013public Safety
Box 6.2
Interviews with the Police
In order to get a more balanced view of people’s perceptions, it was felt necessary to also engage with the police. Interviews held with police officers during the course of the Perceptions Survey, 2013, brought forth some useful inferences. The police felt that the public and the media did not understand the difficulties and challenges faced by them in their everyday functioning, and cited many concerns related to their workplace. Following are some excerpts from the interviews of the police personnel.
• “Theconditionofwomenofficersismuchbetternowthanafewyearsback.However,Ifacetroubleincomingfrom my house to this police station everyday, as there are drug addicts who stare at me and give me dirty looks.”—A female police officer.
• “Peopletreatuslikedirt;theydonotgiveusanyauthority.IsometimesfeelfearwhenIgoout,especiallyinmycivilian clothes. I want to leave my job as I do not get any holiday to go back to my village.” —A male police officer.
• “AftertheDecember2012gangrapecase,womenofficers(haveto)reportfordutyatnight.Sometimeswhenwedon’t answer the phone the first time, people complain. It is not easy.”— A female police officer.
• “There isnobasic infrastructurehere in thepolicestations, there isnoregularwaterandthetoiletsarenotcleaned. We can’t go home. People expect us to do so much, but look at the way we function. Police personnel should be posted near their homes. Also our working hours are so long, there should be shifts.”— A male police officer.
Box 6.3
Unsafe Areas, Most Vulnerable and Threats to Safety in Delhi—Findings from the FGDs
What are the most unsafe areas in the city?
The areas around alcohol shops and gambling dens were perceived to be very unsafe. Dark spaces such as parks were also considered unsafe and susceptible to crimes, especially crimes against women.
Who is the most vulnerable in the city?
Apart from women, children were perceived to be most vulnerable in the city. There is a sense of fear and this was articulated in the FGDs. Parents discussed their fears about the safety of their children, especially if they were unaccompanied while travelling or while at play. In particular, mothers said that they did not send young girls out of the house alone.
Who is a threat to safety?
The FGDs with both men and women revealed that it was mostly men who commit crimes. It was also perceived that unemployed youth were more likely to be the perpetrators of crimes such as theft and robbery. Women reported that it was generally men who harassed women, especially in public transport.
The FGDs held with only men revealed that there was a general sense that if a woman is harassed while she is out of her home, it is usually her fault. Western influences, especially the incidence of women wearing Western clothing, was seen to be responsible for the rising crimes against women.
To sum up, the Perceptions Survey, 2013, reveals some interesting findings and paradoxes. While a majority of Delhi’s population felt safe in the areas wherein they resided—their localities and their neighbourhoods, they felt that crime had increased over time and did not rate Delhi favourably in terms of personal safety. Women rated personal safety more
poorly than men, and the STs rated it more poorly that the others. At the same time, migrants across all caste groups found Delhi to be safer than their non-migrant counterparts.
Children and senior citizens emerged as vulnerable groups. Senior citizens felt far more unsafe in their

Delhi human Development RepoRt 2013public Safety
Delhi human Development RepoRt 2013public Safety
177Chapter 6
own localities, and also had less positive perceptions about women’s safety, in general. In the FGDs, almost all the female respondents expressed fear for their children’s safety and cited fearsome events that had occurred within their localities.
People’s perceptions about the lack of women’s safety in the city were significant. The survey revealed that most women did not feel safe in public spaces, with the workplaces and public transport emerging as spaces perceived to be the least safe for women.
People’s perceptions about the police were not very positive. There was a general sense of fear as well as dissatisfaction in dealing with the police, which points towards the need for more police, including policewomen, and a more responsive police.
6.5 Recent Initiatives and Strategies for the Future
In this broad landscape of crime and safety in Delhi, most of 2012 and the first quarter of 2013 saw an increase in the reporting of both overall crime, and crime against women. While there is a tendency for such statistics, especially if fuelled by media reports, to cause alarm, it may be argued that an increase in the reporting of crime is a positive development in the case of Delhi, where the incidence of reported crime is much lower than in other parts of the world.
The brutal gang rape that occurred on 16 December 2012 brought to light the inadequacies in planning and policing, as also the appalling civic apathy on the part of the people, many of whom just neglected the victims as they lay helpless on the road. All this could be attributed not just to the failure of the State, but also to the failure of the people. Thus, besides the need for systemic changes within the policing and planning processes, what is also required is a change in societal attitudes and a positive consciousness amongst the citizens. Some of this change was observed in the massive social protests wherein the participants included both men and women, and civil society organisations, who were fighting for immediate action and justice for the victim. The change was that crimes against women were now perceived as ‘everyone’s problem’ rather than as women’s problems alone, also indicated by the responses to the questions posed to the police, the State, and the public. The responses also revealed that crime against women is a structural problem, and in need of strong long-term solutions at the levels of the law, policy and society. They also highlighted the role of the social media in not just raising awareness, but also mobilising people for
collective action, thereby bringing forth its potential as a tool that could be constructively utilised for crime prevention and reduction.
What also emerged is the need to gain a perspective on the socio-economic and psychological factors that lead to crime and violence in the society. These factors need to be analysed against a society that is marked by sharp inequalities (also indicated in the other chapters in this DHDR). These inequalities need to be examined in an urban landscape characterised by inequitable access to resources and opportunities as well as discrimination in various areas. It is also a common perception, for instance, that the police often ill-treat the poor and the homeless, and do not consider them at par with the affluent sections. In the Perceptions Survey, 2013, as well as in the FGDs, people across the income groups highlighted the lack of appropriate response from the police. There is a general mistrust and lack of faith in the police, particularly amongst the socio-economically weaker sections, whose members also cite facing police harassment. There is thus a critical need to make some changes within the police force through sensitisation, training and even collaborative exercises with the people in order to create an atmosphere of trust and cooperation by making the police more accessible and responsive to their needs.
6.5.1 An Overview of Existing Schemes and Initiatives
6.5.1.1 Schemes and Initiatives for Women and Girls
There have been some positive policy developments aimed at ensuring the protection of women and girls in the private and public spheres. The Report of the Working Group on Women’s Agency and Empowerment under the Twelfth Five Year Plan proposes two such programmes, viz., Ujjawala, a scheme meant for the prevention of trafficking for commercial sexual exploitation of girls/women through the rescue, rehabilitation and re-integration of victims of trafficking; and the setting up of ‘One Stop Crisis Centres’ for cities with a population of more than 2.5 million with the aim of provisioning shelters, police desks, legal, medical and counselling services, and 24*7 helplines, amongst other measures.
In addition, laws that seek to address the safety of women include: the Supreme Court Vishakha Judgement (1997), a landmark in the protection of women from sexual harassment (including even verbal harassment) at the workplace resulting in the formation of the Committee on the Sexual Harassment of Women at the Workplace (Prevention,
Delhi human Development RepoRt 2013public Safety
178Chapter 6
Delhi human Development RepoRt 2013public Safety
Prohibition and Redressal) Act, 2013. Under this Act, the case has to be registered under Section 509 of the Indian Penal Code (word, gesture or act intended to insult the modesty of a woman). In terms of violent crimes against women, the Justice Verma Committee, which was constituted on 23 December 2012, proved to be a landmark in the policy and legal landscape, and made some crucial suggestions on the definitions and laws related to rape, sexual assault, child sexual abuse, medical examination of victims, legal procedures to deal with such crimes as well as reforms pertaining to education and electoral procedures (PRS Legislative Research, 2013). The Committee stressed the need to review the existing laws on violence such as acid attacks, offences against women in the conflict areas, and the trafficking of women and children. A major achievement of the Justice Verma Committee has been its move to make a case for offences such as stalking and ‘eve teasing’, which are often considered ‘minor’, to be considered serious offences instead. Another major element in the new law is that it penalises police officers for not registering an FIR in cases under certain IPC sections.
Amongst the various government initiatives, the Stree Shakti, a collaborative capacity building project, was initiated by the Government in 2002, with the aim of focusing on issues pertaining to the health, well-being and empowerment of the socio-economically weaker women. As part of this initiative, Gender Resource Centres have been established to offer training in life skills, literacy, health, education and the awareness of legal rights so as to empower women and girls. Other government initiatives include the publication of an information booklet by the National Commission for Women (NCW) for college students and young women, providing details on women’s rights and emergency helpline numbers. The Delhi Government has also started a helpline for women under the number 181.
In terms of planning, the enhancement of street lighting, and establishment of ‘Multi-Utility Zones’ (MUZs) are being carried out, and as part of these initiatives, the Delhi Development Authority (DDA) established a Unified Traffic and Transportation Infrastructure Planning and Engineering Centre (UTTIPEC), in 2008, whereby it seeks to develop guidelines on pedestrian safety, designing of infrastructure like roads, and street lights, to support women, informal workers and others (Jagori, 2011) .
The Delhi Police too have taken numerous steps in order to ensure the safety of women and to make the process of lodging complaints easier (Delhi Police, 2012). One of these measures is the establishment of the Crime against Women Cell (now renamed as the ‘Special Police Unit for Women and Girls’) in all the districts of Delhi. Complaints regarding stalking and obscene calls can be made on the helpline number 1096 of the Anti-Stalking Cell and Anti-Obscene Calls Cell. Help desks for women and the helpline number 1091 have also been established. As part of the Parivartan scheme launched in 2005 in North-west Delhi, women beat officers have been stationed in different areas in the city to interact with women and to understand their problems and concerns as part of a general awareness programme to prevent violence against women in both the public and private spheres as well as to prevent child sexual abuse. The programme is a collaborative effort of the police, civil society organisations, and professionals, in order to strengthen the capacity of the police as well as the community to protect women and children from violence. In addition, women police in civilian clothes have been deployed at various places. Crisis intervention centres to support victims of sexual assault have also been established.
Although the launch of these initiatives is a positive move, it is equally essential to ensure that that they are implemented in their true spirit and are subjected to regular monitoring and review. However, the challenges that continue to prevail include the persistence of the patriarchal norm and mindsets in society, which can only be changed through education and awareness. Norms of respect and gender equity need to be mainstreamed into school and college curricula and sensitisation programmes need to be launched in schools and colleges and incorporated into everyday conversations to promote long-term and sustained change in society.
6.5.1.2 Schemes and Initiatives for Children
A number of laws meant to protect children are in place, but the implementation process is marked by serious flaws. For instance, the Juvenile Justice Act 2000 (JJ Act) was enacted to strengthen laws to protect children in conflict with the law and children in need of care and protection through measures that were sensitive to the child’s development needs and facilitated his/her rehabilitation through institutions covered under this Act. However, with the duration of
Delhi human Development RepoRt 2013public Safety
Delhi human Development RepoRt 2013public Safety
179Chapter 6
stay of children in these institutions limited to three years, there is a lack of continuity in interventions, which could, in turn, hamper the child’s future.15
The issue of child sexual abuse and the need to implement the Protection of Children from Sexual Offences Act, 2012 (POCSO), is another area that needs attention. A new initiative of the Delhi Commission for the Protection of the Child (DCPDR) proposes measures to ensure the protection of children in schools through interventions such as banning the hiring of people with a criminal record of sexual or physical violence, the appointment of one female guard in school buses, locking of the school buses and vans in school when they are not deployed on duty, amongst others (Rahman, 2013). However, the actual implementation of these policies needs concerted efforts and attention.
Given that a large number of children are reported missing every year, the Delhi Police has taken many steps towards the protection of children, particularly for improving reporting and coordination of missing children (Delhi Police, 2012). These include: the use of the Zonal Integrated Police Net (ZIPNET) for recording information about missing children; the registration of all cases of missing children as kidnappings; and launch of a scheme called Pehchaan in 2011 to maintain photographic records in order to protect children from the socio-economically weaker sections and residing in slums and resettlement colonies. Initiated in the areas which have reported the maximum number of missing children, more than 64,000 children have been given photographs under this scheme. Units such as the District Missing Persons Unit (DMPU) at the district level and the Missing Persons Squad at the city level, the Anti-Human Trafficking Unit (AHTU) in each district, and a special investigative unit which takes on unresolved cases of missing children, have also been established. Delhi Police is also teaming up with NGOs to carry out rescue operations. With Delhi being regarded as the hub for child trafficking, the Delhi Government has announced a high level committee headed by the DCPCR with the aim of curbing the trafficking of children.
In the sphere of improving life skills, a special community policing programme called Yuva was launched in order to offer life skills, literacy and
15. As pointed out by Mr. Shubhra Sanyal, Professor, National Institute of Criminology and Forensic Science (NICFS), New Delhi at the stakeholder consultation on ‘Safety in Delhi’ held on 8 June 2013 at the India International Centre, New Delhi.
vocational skills to young underprivileged adults. An initiative called Bacchon ki Phulwari, aimed at providing a healthy and safe environment for children of working mothers, was also undertaken. However, despite all these policy efforts and existing laws such as POCSO, Child Labour (Prohibition and Regulation) Act, 1986, JJ Act, 2000, and Commission for the Protection of Child Rights Act, 2005, amongst others, numerous children still go missing daily in Delhi, are forced to work in hazardous jobs, land up on the streets and are exposed to violence, abuse and exploitation, and experience the denial of their basic rights to health, safety and education. These incidences expose the serious policy gaps that exist with devastating impacts on the future lives of the affected children. The State is responsible not just for each child’s current well-being, but also for his/her future ‘well becoming’ (Roelen and Sabates-Wheeler, 2011), and a strong political will is required to ensure the implementation of policies.
6.5.2 Emerging Policies and Strategies
It is clear that crime in Delhi is a cause for concern, with women and children often emerging as the particularly vulnerable groups. What is also evident is the positive role of the public and the media in bringing about change and bringing people closer to policy formulations. The process of policy formation needs to be more participatory than ever before. Institutions need to be more responsive, approachable and accountable, and trust needs to be fostered between the public and the police. While designing policy, categories matter. Within the policy space, women and children are often clubbed together, especially in relation to crime and safety. It is imperative to understand and engage separately with crimes against children per se and to develop child-specific policies to protect them. In the post-16 December 2012 landscape, efforts are being made to bring in reforms in the criminal justice system by facilitating the speedy trials of cases of crime against women. Similar efforts should also be made for cases dealing with crime against children. Apart from this, the profile of the perpetrators also needs closer analysis. Official data shows that the profile of the perpetrators of crime in Delhi has seen a change with criminal activities disproportionately concentrated among the youth vis-à-vis other sections of the population, which needs crucial policy attention. It must also be understood that safety is not merely an issue of policing; in fact, it needs to be placed within the wider socio-economic and political framework of the planning and provisioning of basic
Delhi human Development RepoRt 2013public Safety
180Chapter 6
Delhi human Development RepoRt 2013public Safety
services. Inclusive planning must aim at maintaining continuity in different kinds of urban spaces used by different people and allow for the development of more public and shared spaces so that people from varying socio-economic groups are able to interact with each other and avail of the advantage of living in an urban set-up on an equal footing. The Draft Strategic Framework for Women’s Safety in Delhi, 2010 outlines seven areas of intervention to make Delhi safe, viz., urban planning and design of public spaces; provision and management of public infrastructure and services; public transport; policing; legislation, justice and support to victims; education; and civic awareness and participation. In addition, serious changes need to be promoted in societal attitudes towards the vulnerable groups, along with sensitisation, civic sense and respect for the law, beginning with homes and schools, without which policies would not have the desired impact (Jagori, 2011).
Some policy suggestions have thus been made to this end and focus on five main areas that need to be addressed (Box 6.4).
6.5.2.1 Reforms in the Criminal Justice System
Strengthening the Law Enforcement Machinery
• Lawenforcementservicesshouldbebroughtunder the Delhi Government in order to make police functions efficient and accountable.
• Thepoliceforceshouldbefreedofdutiesthat do not require law enforcement such
as security provision, orderly and summon duties, and should be allowed to focus on law enforcement and the protection of citizens.16
• Thereisaneedtostrengthenthetransport,excise and other enforcement departments of the Delhi Government in order to lessen the burden on the police. Similarly, municipal bodies like the MCD, NDMC, and Delhi Cantonment Board should have their own enforcement force to lessen the burden on the police. 17
• Thenumberoffemalepolicestaff18 should be increased and their needs and concerns including with regard to safety should be met.
16. There is a severe shortage of police staff in India for the safety of its citizens, with one police officer per 761 common citizens, in contrast with the large number of police staff deployed for VIP security (three police officers for one person). Delhi has 448 police officers per 1,00,000 persons. The highest police–citizens ratio was reported in the Andaman and Nicobar Islands (1064) while Bihar recorded the worst (65), according to Mohan (2012). There were reportedly 180 police stations in Delhi in 2011 as compared to 129 in 2005, and the total police strength in 2011 was 48,959 as compared to 30,314 in 2005, according to the Statistical Abstract of Delhi, Government of NCT of Delhi (2012).
17. Suggested by Mr. Kamlendra Prasad, Director of the National Institute for Criminology and Forensic Sciences, New Delhi, at the Consultation on the “Second Delhi Human Development Report—2013” on 8 July 2013 at the India International Centre, New Delhi.
18. Delhi Police has announced that it would increase the strength of female police officers (over 2500 police officers) at all police stations in the capital, (Mohan, 2013).
Box 6.4
Key Policy Suggestions
• Reformsinthecriminaljusticesystemlikethepolice,judiciary,andrehabilitationandinterventionmechanisms,which include capacity building and better coordination among various departments to ensure efficiency and accountability and facilitate the building of trust among citizens.
• Inclusiveurbanplanningandservicestoensuresafetyandequitableaccessforallcitizens.
• TheuseofInformationandCommunicationTechnologies(ICTs)incrimereductionandprevention.
• The innovative and constructive use of media, including new media, as a tool to bring about social andattitudinal changes, building on citizens’ spirits, dealing with civic apathy as well as sensitisation and spreading of awareness about important issues.
• Encouragingmoreresearchinthesensitiveareasofcrime,safetyandsocialprotection,soastobetterinformtheformulation and implementation of social policy.
Delhi human Development RepoRt 2013public Safety
Delhi human Development RepoRt 2013public Safety
181Chapter 6
• Financialandotherincentiveslikebetterranks should be offered to the police to instil pride in them and to boost their morale.19
• Thereisalsoaneedforproperreporting20 of all crimes,21 even ‘small crimes’22, especially against women and children.
• Aboardelaboratingcasesconcernedwithcrimes against women and children should be displayed at all police stations.
• Thepolicepersonnelshouldbesensitised,particularly in dealing with crimes against
19. The present system of performance evaluation of police officers focuses on crime reduction and control, with often negative implications such as under-reporting of crimes and preventive action, which, in turn, leads to many arrests and encounters. This highlights the need to design a more holistic evaluation system. This is as per the Prakash Singh judgement in 2006 on police reforms. Although some of the mechanisms to initiate this have been set up in Delhi, they are yet to be operationalised (Kotwal, 2013).
20. Police offiials are known for refusing to register FIRs both small and big crimes despite being legally obliged to do so, in accordance with the provisions of Section 154, Cr. PC (National Legal Research Desk, ‘Delhi Police : Standard Operating Procedure (SoP) for Investigation of Rape Cases’)and under the 166 Cr. PC wherein a public servant disobeys the law, with intent to cause injury to any person. There is increasing under-reporting and criminals are not being brought to book. This is despite every FIR register bearing the label, ‘Burking or writing an incorrect report is an offence punishable under section 218 IPC (Bureau of Police Research and Development, 2013).
21. The increase in the incidence of crimes may be reflective, to an extent, of better reporting and should be encouraged so as to facilitate easy approachability and trust.
22. Among crime prevention measures, the ‘broken windows theory’ has emerged to be quite influential, according to which tackling petty crimes like littering, vandalism and broken windows could lead to the prevention of more serious and violent crimes (Herbert, 2013). If applied to crimes against women, it would suggest taking crimes considered to be minor such as sexual harassment very seriously and having a zero tolerance policy towards minor crimes, which, in turn, could lead to reductions in serious violent crimes against women. The new law based on the Justice Verma Committee does take a positive step in this direction.
women,23,24 children,25 and the socio-economically weaker sections.26
• Resourcesshouldbededicatedtotheimplementation of social programmes such as Yuva and Parivartan, organised by the police, and regular monitoring and evaluation should be conducted on the basis of detailed feedback from the residents in order to measure progress of these programmes on the ground.
• ThepossibilityofextensionoftheBhagidari system to policing could be explored, and the institutionalisation of community policing and neighbourhood watch schemes (on the lines of Police Mitras) should be encouraged, thus giving citizens a stake27 in their safety and well-being, as well as building trust between the people and the police. 28
23. Protocols need to be adhered to while registering FIRs and questioning the victims of rape. Rape cases are referred to as ‘Special Report Cases’, which need to be monitored by the District Commissioner of Police of the district. The case has to be investigated by a female investigating officer and the victim has to be examined by a female doctor only upon obtaining the victims consent if she is above the age of 12 and that of her guardian in case she is younger. Every effort has to be made to ensure that the woman’s identity remains secret. Evidence has to be collected carefully and handled with care. These are among the many other protocols that need to be adhered to National Legal Research Desk (n.d.).
24 Mr. Uday Sahay, Chairman and Managing Director of SAUV Communications Private Limited and former Indian Police Service (IPS) Officer, New Delhi, also suggested that government hospitals should be equipped to deal with rape victims and the police should come to the hospital to take the victim’s statement and register the case.
25. As per POCSO (2013), while dealing with child victims, a female police officer not lower than the rank of sub-inspector has to come to the residence of the child to record his or her statement, no child is to be detained in the police station at night, police officers visiting the child have to be in plain clothes, the medical examination of a female child is to be conducted by a female doctor in the presence of the child’s parent or guardian, among other stipulations.
26. The police is generally known to have a pro- rich bias as pointed out by Buncombe, (A (2013).
27. In conversation with Dr. T.N. Mishra, former Director, National Police Academy and former Director, CBI, who feels that this could potentially help people’s self esteem and confidence and give them a stake in the process
28. In the words of Prime Minister, Dr. Manmohan Singh at the Conference of Directors General of Police in 2005, cited in the Ministry of Home Affairs document on Community Policing (p. 3), “The basis of police authority cannot be mere law; it has to be trust of the community as well.” Refer to Draft Project Proposal/Business Case on Police–Community Partnership (PCP), Prepared by Micro Mission 2 (Community Policing) of the Prime Minister’s National Police Mission, 2008-11.

Delhi human Development RepoRt 2013public Safety
182Chapter 6
Delhi human Development RepoRt 2013public Safety
• Theneedforchangewithinthepoliceforce as per public demands also needs to be analysed and understood. The police should not be viewed as merely a coercive instrument of the executive, but also as a facilitator, a provider of services to the public. In this context, the setting up of a Public Relations Committee for the police that would comprise people from all fields and facilitate public interaction may be considered, thus creating a positive image of the police vis-à-vis the public.29
Reforms within the Judiciary
• Specialfast-trackcourtsshouldbeinstitutionalised to address the perpetration of violent crimes against women and children in order to expedite these cases and ensure conviction.
• ProperimplementationofPOCSOandreviewing of the IPC Acts regarding rape and sexual abuse should be ensured.30
• TheStateshouldassuremonetarycompensation, counselling and all possible medical treatment to rape victims. 31
• Strongerpunishmentsareneededforcrimes considered to be ‘minor’, such as sexual harassment, stalking, etc. in order to prevent more serious crimes in the long run.
• Specialprotectionandencouragementshouldbe given to witnesses of violent crimes.
Rehabilitation and Intervention Mechanisms
• Reformsmustbeinitiatedinthejuvenilejustice laws to bring them in line with UNICEF recommendations, that is, moving away from judicial proceedings
29. In conversation with Dr. T.N. Mishra.
30. Since these do not appropriately apply to the special case of child sexual abuse (which should be recorded as a separate offence) and do not offer protection to children who have been subjected to sexual abuse, specialised counselling mechanisms need to be put into place to deal with these children, according to excerpts from Dr. Asha Bajpai’s chapter on “Child Sexual Abuse and Law”, (Bajpai, n.d.)
31. As per the recommendations made by the National Commission for Women, cited in the Legal India website.
and custodial sentencing to social and community solutions, counselling, probation, community service and other alternatives.32
• Continuityofchildcareinterventionsmust be ensured from rehabilitation to re-integration (including the provision of education, vocational training, skill development, recreation and employment) for children in need of care and protection as well as children in conflict with the law, by involving experts as well as relevant stakeholders.
• EnsureproperandsensitisedtrainingofPersonnel dealing with children (both those in care of need and protection as well as in conflict with the law), whether at shelter homes, or during the investigation processes.
• Thereisneedforlinkagesbetweenvariouslegislations and departments dealing with children to ensure that the main principles of international law focusing on the protection of child rights are upheld.
6.5.2.2 Urban Planning and Services
Participatory and Inclusive Urban Planning
• Involvementofwomenandchildren,elderlyas well as minority groups, in planning processes through scientific safety audits and regular feedback.
• Inclusivecity-wideplanningbybuildingcommunity centres.
• Installingofsufficientstreetlightingwithinand outside localities.
• Wideningofpavementsandpedestrianamenities, and reduction of setbacks in order to create visibility of the streets and mixed space use in these areas.
• Creationofmorestopsandslowdownsinhighways.
• ReviewingoftheMasterPlan,2021,toensurethat children’s needs and concerns such as
32. Based on UNICEF, 2010; Dasgupta, 2010.
Delhi human Development RepoRt 2013public Safety
Delhi human Development RepoRt 2013public Safety
183Chapter 6
safety, well-being, and ‘well-becoming’ are met.33
Transport
• InstallationofGeographicalInformationSystems (GIS) in public transport as well as autos and taxis.
• Prominentdisplayofhelplinenumbersanddriver and cab/bus/auto information inside these modes of transport.34
• Regulationofallformsoftransportandconducting of regular checks.
• Avoidingoverloadingofbusesandprovisioning of more frequent buses.
• Checkingofallformsoftransport,especiallyduring the night.
• Implementationofprohibitionoftintedwindows in all forms of transport with resultant penalties for violations.
• Presenceofpoliceinbusesandmetros,especially at night.
Municipal Services
• Buildingmorecommunitytoiletsinslumsand resettlement colonies as well as free public toilets in public spaces for women, while maintaining enough distance between the men’s and women’s toilets; ensuring regular monitoring and upkeep of these facilities (including security provisioning) to prevent misuse and to ensure the safety of users.
• Buildingofwell-maintainedroadsforaccessto schools, clean and usable toilets (separate for girls and boys), and better security around schools to be provided by school authorities.
33. Mobile Crèches Citizen Report (2002-2007) reiterates that street children, beggars, children of sex workers, child sex workers, children of migrant sex workers and children with disabilities are the most vulnerable, and shelter, sanitation infrastructure, education infrastructure, crèches and day centres and other amenities need to be ensured for them, which are currently either absent or in a deplorable condition (Mobile Crèches, 2011).
34. Suggested by Dr. Kalpana Viswanath, Senior Advisor, ‘Safe Delhi Initiative’, Jagori, Consultant, UN Women, Project Director, Gender-inclusive Cities Project, Women in Cities International/Femmes et Villes International, during an internal consultation at IHD, New Delhi.
• Ensuringthatsocialwelfareschemescaterto all and are available in all areas without discrimination.
Security Provision by Service Providers
• Theonusofprovidingsecurityshouldbewiththe concerned service providers. Thus, apart from providing services like public toilets, monuments, parks, buses, schools, etc., the owners of these services should also be responsible for providing safety to the users of these services.35 A successful example of this is the Delhi Metro, which provides security at all the stations and is perceived to be relatively safe as per the findings of the Perceptions Survey, 2013, and this could be extended to the above-mentioned public services.36
• Thiswouldmaketheserviceprovidersaccountable for the safety of their users as well as ensure that no anti-social or criminal activities take place in these public spaces.
6.5.2.3 Use of Technology to Track and Curb Criminal Activity and Map Unsafe Locations
The Delhi Police has been working towards the installation of technical systems to enhance the reporting and tracking of criminals and victims via web-based integration of information systems, information exchange programmes, ZIPNET, enhanced databases, and digital crime mapping in collaboration with other departments and NGOs. However, there is still a level of mistrust where the police are concerned, which could be tackled through the implementation of a range of positive measures and more interactions with the public such as the Jan Sampark initiative.
The following are some suggestions whereby technology could be used to address crimes as well as spread awareness:
• ElectronicregistrationofFIRsandothercomplaints across local police stations, which could then automatically enter the central database.
35. Suggested by Mr. Kamlendra Prasad, Director of the National Institute for Criminology and Forensic Sciences, New Delhi, during a personal interview on 30 June 2013.
36. Suggested by Mr. Uday Sahay.
Delhi human Development RepoRt 2013public Safety
184Chapter 6
Delhi human Development RepoRt 2013public Safety
• Awebportalshouldbemaintainedforthe city wherein the citizens’ experiences regarding crime and safety could be shared. This portal could also be used to share new policies, laws and events on the issues of crime and safety. A provision to receive important alerts on the phone or sending SOS messages could be explored (for example, ‘VithU’, an emergency application available for smart phones).37, 38
• Mappingofthesedifferentkindsofcrimescould be done on the basis of the above information.
6.5.2.4 Innovative and Constructive Role of the Social Media and Other Media Like TV, Films, Plays
• Buildingandpromotingnorms,whichinculcate a respect for the law, starting at the school level, by integrating them into the curricula.
• Buildingandpromotingnormsofmutualrespect and responsibility amongst the citizens (particularly towards women and girls), which could also be integrated into the school curricula.
• Tacklingpublicapathythroughawarenessand sensitisation regarding the safety and well-being of women, children, youth and the elderly within localities and public spaces; affording encouragement to citizens to help
37. A research study conducted across six countries (Canada, Germany, the Netherlands, Spain, the United Kingdom, and the United States) reported that over 80 per cent of the respondents felt that there was a communication gap between the police and the citizens, reflected in the lack of knowledge on the part of the citizens about local police activities. They felt that the police needed to communicate with the people through digital channels of communication. Almost 50 per cent felt that social media could be used to prevent crime. Many suggested that a citizens’ portal should be maintained so that information about crime and safety could be shared on an anonymous basis (Accenture, 2012). Such information could be used to map local crimes, as has been done in Brazil, Venezuela, Panama, Argentina and Chile via Wiki Crimes (Al Jazeera, 2011).
38. VithU, is an emergency App, that, at the click of the power button of a smart phone, twice consecutively begins sending out alert messages every two minutes to contacts that are fed into the App by the user, as the designated receivers or guardians. The message says, “I am in danger. I need help. Please follow my location.”
The receiver will receive a link to the person’s location every two minutes and get the person’s updated location. Also, the user will get updates on the ‘Crime Scene in India’ and a ‘Tips Feed’ option, exclusively giving her safety tips in an emergency situation.
victims of accidents as well as assaults, and assuring them protection from police harassment.
• Spreadingawarenessabouttherightsofthe people, laws and government schemes, amongst the vulnerable sections, particularly children and youth.
• Facilitatingtheformationofneighbourhoodand community watch groups, both in posh colonies and slum settlements.
• Spreadingawarenessaboutcrimesagainstchildren and laws therein, in schools as well as residential areas for creating awareness not only amongst parents, guardians and teachers, but also amongst the children themselves.
• Needforsocialmediatoscreentheirown content and ensure that images and messages which condone violence against anyone in any way are immediately reported and removed.39
6.5.2.5 Promotion of Research in the Area of Crime, Violence and Safety
• Conductin-depthlongitudinalresearchstudies to understand how urbanisation in the country is panning out and how it impacts planning, governance and safety and security.
• Collectionofdisaggregateddataonhowdifferent groups use and experience public spaces (over a period of time).
• Carryingoutin-depthresearchtounderstandhow men, women, girls and boys, the differently-abled, the elderly, transgendered persons, and the poor, experience violence and crimes in order to inform more specific policies for their empowerment and protection. Conduct more evaluation studies on the existing programmes to understand how they are operating on the ground.
39. Recently, Facebook came under serious criticism from various women’s groups for not dealing with the images and messages promoting gender-based violence, as a result of which the company has committed to review its guidelines and crack down on such offensive content (Bruns, 2013). This was also pointed out by Ms. Nandita Bhatla, Senior Technical Specialist at the International Centre for Research on Women (ICRW), New Delhi.

Delhi human Development RepoRt 2013public Safety
Delhi human Development RepoRt 2013public Safety
185Chapter 6
• Reviewstatebudgetstounderstandtheextent to which the needs and concerns of women and children are being captured.40
• ImproveunderstandingoftheNCRBdata,how data on crime are collected, how IPC crimes are categorised, and what challenges come in the way of the recording of crimes.41
• Undertakingofdetailedresearchtounderstand how different socio-economic groups view crime and what they expect from the police; tools such as safety audits and accessibility audits can be used to include vulnerable sections in the planning processes.42
All the above measures will certainly go a long way in improving public safety in Delhi. However, as we
40. According to the latest report by HAQ and CRY (2013), the Delhi State Budget (2013-2014) allocation for children is 18 per cent, signifying a negligible increase of 0.07 per cent over the previous year, with many programmes pertaining to health and social protection experiencing a decline in allocations (HAQ and CRY, 2013).
41. In discussion with Ms. Vrinda Grover, Senior Advocate and Ex-Executive Director, MARG, Human Rights Lawyer and Advocate for Women’s Rights, at the Consultation on the “Second Delhi Human Development Report, 2013, on 8 July 2013, at the India International Centre, New Delhi.
42. Based on Politzer, 2012.
have seen in the beginning of the chapter, crime and violence are manifestations of multiple factors. Crime needs to be located in the wider context of societal attitudes and norms, which also influence the functioning of diverse state institutions such as the planning authorities and the criminal justice system. As such, legal reform and (mere) policing, although important, will not have the desired impact on crime. Civic norms and mindsets appropriate for a progressive city are yet to develop fully, not just in Delhi, but the country as a whole. This is evident from the occurrence of heinous crimes against women in spite of the recent enactment of harsher laws. Given that the issue of public safety has come to the centre of public discourse, it is now an opportune time for building trust and mutual respect among the citizens, as well as the citizens and the state, and for concerted and relentless efforts by all stakeholders towards a safe(r) Delhi.
Annexure
Annex Table 6.1
Three Year Average of Category-wise IPC Crime Rates in Major Cities during 2004-06
Types of Crimes Ahmedabad Bangalore Chennai Delhi Hyderabad Kolkata Mumbai Total Cities
Body Crimes 41.9 69.1 35.9 27.2 97.6 13.1 30.1 43.1
Crimes against Women 23.3 10.2 5.2 26.8 31.5 4.2 6.4 16.8
Crimes Related to Property 145.3 191.5 38.7 151.9 115.7 24.5 92.9 103.1
Economic Crimes 13.3 31.6 4.8 20.8 37.1 8.9 13.7 17.8
Crimes against Public Order 3.4 8.3 0.6 0.7 2.8 1.4 1.6 4.6
Other IPC Crimes 172.9 180.5 98.6 170.45 37.4 22.4 42.5 108.5
Total IPC Crimes 400.2 491.2 168.8 397.9 322.1 74.5 187.2 293.9
Source: Calculations using NCRB data.

Delhi human Development RepoRt 2013public Safety
186Chapter 6
Delhi human Development RepoRt 2013public Safety
Annex Table 6.2
Three-Year Average of Category-wise IPC Crime Rates in Major Cities during 2010-12
Types of Crimes Ahmedabad Bangalore Chennai Delhi Hyderabad Kolkata Mumbai Total Cities
Body Crimes 29.3 58.2 28.9 31.2 68.0 23.5 48.1 43.3
Crimes against Women 27.9 15.4 5.2 29.7 28.2 9.7 12.3 20.7
Crimes Related to Property 92.5 174.5 29.6 153.0 84.6 28.9 142.6 99.3
Economic Crimes 9.1 45.3 8.3 16.2 33.9 15.0 23.5 20.8
Crimes against Public Order 2.8 5.8 1.2 0.7 7.0 2.4 3.7 5.2
Other IPC Crimes 185.5 123.2 107.0 83.6 44.0 59.9 60.1 121.3
Total IPC Crimes 347.2 422.3 180.1 314.3 265.6 139.6 290.4 310.6
Source: Calculations using NCRB data.
Annex Table 6.3
Composition of IPC Crimes within Major Cities Based on a Three-year Average during 2004-06 (per cent)
Types of Crimes Ahmedabad Bangalore Chennai Delhi Hyderabad Kolkata Mumbai Total Cities
Body Crimes 10.5 14.1 14.2 6.8 30.3 17.6 16.1 14.7
Crimes against Women 5.8 2.1 3.0 6.7 9.8 5.6 3.4 5.7
Crimes Related to Property 36.3 39.0 21.5 38.2 35.9 32.9 49.6 35.1
Economic Crimes 3.3 6.4 3.1 5.2 11.5 11.9 7.3 6.0
Crimes against Public Order 0.8 1.7 0.5 0.2 0.9 2.0 0.9 1.6
Other IPC Crimes 43.2 36.8 57.8 42.8 11.6 30.0 22.7 36.9
Total IPC Crimes 100.0 100.0 100.0 100.0 100.0 100.0 100.0 100.0
Source: Calculations using NCRB data.
Annex Table 6.4
Composition of IPC Crimes within Major Cities Based on a Three-year Average during 2010-12 (per cent)
Types of Crimes Ahmedabad Bangalore Chennai Delhi Hyderabad Kolkata Mumbai Total Cities
Body Crimes 8.5 13.8 16.0 9.9 25.8 16.9 16.5 13.9
Crimes against Women 8.1 3.8 2.9 9.5 10.7 7.0 4.5 6.7
Crimes Related to Property 26.5 41.5 16.6 48.5 31.4 20.7 49.0 31.7
Economic Crimes 2.6 10.8 4.7 5.2 12.9 10.8 8.0 6.7
Crimes against Public Order 0.8 1.4 0.6 0.2 2.5 1.7 1.3 1.7
Other IPC Crimes 53.5 28.7 59.2 26.6 16.6 42.9 20.6 39.2
Total IPC Crimes 100.0 100.0 100.0 100.0 100.0 100.0 100.0 100.0
Source: Calculations using NCRB data.

Delhi human Development RepoRt 2013public Safety
Delhi human Development RepoRt 2013public Safety
187Chapter 6
Annex Table 6.5
Three-year Average of Category-wise IPC Crime Rates against Women in Major Cities during 2004-06
Crime Category Ahmedabad Bangalore Chennai Delhi Hyderabad Kolkata Mumbai Total Cities
Rape 0.9 0.6 0.5 4.0 1.3 0.2 1.1 1.5
Kidnapping and Abduction 2.2 0.7 0.4 5.2 1.2 0.5 0.6 1.8
Dowry Deaths 0.1 0.8 0.4 0.8 0.5 0.1 0.1 0.5
Cruelty by Husband and Relatives 18.2 4.7 3.1 10.9 21.8 1.9 1.9 8.2
Molestation 1.4 2.7 1.2 4.7 2.7 1.2 2.2 2.7
Eve-teasing 0.5 0.4 2.0 1.2 4.0 0.3 0.6 2.0
Importation of Girls 0.0 0.0 0.0 0.0 0.0 0.0 0.0 0.0
Total 23.3 9.9 7.6 26.8 31.5 4.1 6.4 16.8
Source: Calculations using NCRB data.
Annex Table 6.6
Three-year Average of Category-wise IPC Crime Rates against Women in Major Cities during 2010-12
Crime Category Ahmedabad Bangalore Chennai Delhi Hyderabad Kolkata Mumbai Total Cities
Rape 1.0 1.1 0.9 3.2 0.8 0.3 1.2 1.7
Kidnapping and Abduction 3.2 2.7 0.6 10.8 0.5 1.0 0.9 3.4
Dowry Deaths 0.2 0.7 0.2 0.7 0.5 0.1 0.1 0.5
Cruelty by Husband and Relatives 24.0 6.2 2.4 10.2 20.1 4.4 2.0 10.3
Molestation 1.4 4.0 0.9 3.9 2.3 2.3 3.1 3.4
Eve-teasing 0.2 0.6 1.1 0.9 1.4 1.6 1.0 1.4
Importation of Girls 0.0 0.0 0.0 0.0 0.0 0.0 0.0 0.0
Total 30.0 15.4 6.1 29.7 25.8 9.7 8.3 20.7
Source: Calculations using NCRB data.
Annex Table 6.7
Composition of IPC Crime against Women within Major Cities Based on a Three-year Average during 2004-06 (per cent)
Crime Category Ahmedabad Bangalore Chennai Delhi Hyderabad Kolkata Mumbai Total Cities
Rape 3.8 6.1 7.0 15.1 4.1 4.7 17.6 8.8
Kidnapping and Abduction 9.3 6.8 4.7 19.3 3.8 10.9 9.4 13.3
Dowry Deaths 0.5 7.9 5.8 3.2 1.6 1.2 1.2 3.0
Cruelty by Husband and Relatives 78.2 47.5 41.2 40.6 69.1 46.5 29.0 47.6
Molestation 6.0 27.2 15.3 17.4 8.6 30.1 33.8 15.6
Eve-teasing 2.2 4.5 25.9 4.4 12.7 6.4 8.9 11.7
Importation of Girls 0.0 0.0 0.0 0.0 0.0 0.1 0.0 0.0
Total 100.0 100.0 100.0 100.0 100.0 100.0 100.0 100
Source: Calculations using NCRB data.

Delhi human Development RepoRt 2013public Safety
188Chapter 6
Delhi human Development RepoRt 2013public Safety
Annex Table 6.8
Composition of IPC Crime against Women within Major Cities Based on a Three-year Average during 2010-12 (per cent)
Crime Category Ahmedabad Bangalore Chennai Delhi Kolkata Hyderabad Mumbai Total Cities
Rape 3.4 7.2 14.6 10.8 3.6 3.4 14.7 8.3
Kidnapping and Abduction 10.7 19.2 9.2 36.3 10.3 2.1 10.3 16.5
Dowry Deaths 0.8 4.5 3.2 2.4 1.0 2.0 1.0 2.6
Cruelty by Husband and Relatives 79.9 39.7 39.8 34.5 44.9 78.0 24.8 49.5
Molestation 4.6 25.3 14.0 13.0 23.8 9.0 37.2 16.5
Eve-Teasing 0.6 4.1 19.2 3.0 16.1 5.6 12.1 6.6
Importation of Girls 0.0 0.0 0.0 0.0 0.3 0.0 0.0 0.0
Total 100 100 100 100.0 100 100 100 100
Source: Calculations using NCRB data.
Annex Table 6.9
Three-year Average of Category-wise IPC Crime Rates against Children in Major Cities during 2004-06
Crime Category Ahmedabad Bangalore Chennai Delhi Hyderabad Kolkata Mumbai Total Cities
Murder 0.1 0.0 0.1 0.3 0.1 0.0 0.1 0.1
Infanticide 0.0 0.0 0.0 0.0 0.0 0.0 0.0 0.0
Other Murder 0.0 0.0 0.0 0.0 0.0 0.0 0.0 0.0
Rape 0.2 0.1 0.2 1.9 0.5 0.1 0.5 0.6
Kidnapping and Abduction 0.3 0.1 0.1 4.5 0.5 0.3 0.2 1.1
Foeticide 0.0 0.0 0.0 0.0 0.0 0.0 0.0 0.0
Abetment of Suicide 0.0 0.0 0.0 0.0 0.0 0.0 0.0 0.0
Exposure and Abandonment 0.5 0.0 0.0 0.3 0.9 0.0 0.0 0.2
Procurement of minor girls 0.0 0.0 0.0 0.0 0.1 0.1 0.0 0.0
Buying of girls for prostitution 0.0 0.0 0.0 0.0 0.0 0.0 0.0 0.0
Selling of girls for prostitution 0.0 0.0 0.0 0.0 0.0 0.0 0.0 0.0
Other crimes 1.6 0.0 0.0 1.9 0.0 0.4 1.0 1.2
Total 2.7 0.1 0.5 9.0 2.2 1.0 1.9 3.3
Source: Calculations using NCRB data.
Annex Table 6.10
Three-year Average of Category-wise IPC Crime Rates against Children in Major Cities during 2010-12
Crime Category Ahmedabad Bangalore Chennai Delhi Hyderabad Kolkata Mumbai Total Cities
Murder 0.0 0.1 0.1 0.2 0.0 0.0 0.1 0.1
Infanticide 0.0 0.0 0.0 0.0 0.0 0.0 0.0 0.0
Other Murders 0.0 0.0 0.0 0.0 0.0 0.0 0.0 0.0
Rape 0.1 0.2 0.5 1.9 0.3 0.2 0.8 0.5
Kidnapping and Abduction 1.9 1.6 0.5 18.3 0.4 0.6 0.7 3.1
Foeticide 0.0 0.0 0.0 0.0 0.0 0.0 0.0 0.0
Abetment of Suicide 0.0 0.0 0.0 0.0 0.0 0.0 0.0 0.0
Exposure and Abandonment 0.3 0.1 0.0 0.4 0.1 0.0 0.1 0.1
Procurement of Minor Girls 0.0 0.2 0.0 0.0 0.0 0.1 0.0 0.0
Buying of Girls for Prostitution 0.0 0.0 0.0 0.0 0.0 0.0 0.0 0.0
Selling of Girls for Prostitution 0.0 0.0 0.0 0.0 0.0 0.1 0.0 0.0
Other Crimes 0.0 0.3 0.0 1.5 0.4 0.3 1.1 1.3
Total 2.3 2.5 1.0 22.3 1.3 1.3 2.8 5.2
Source: Calculations using NCRB data.
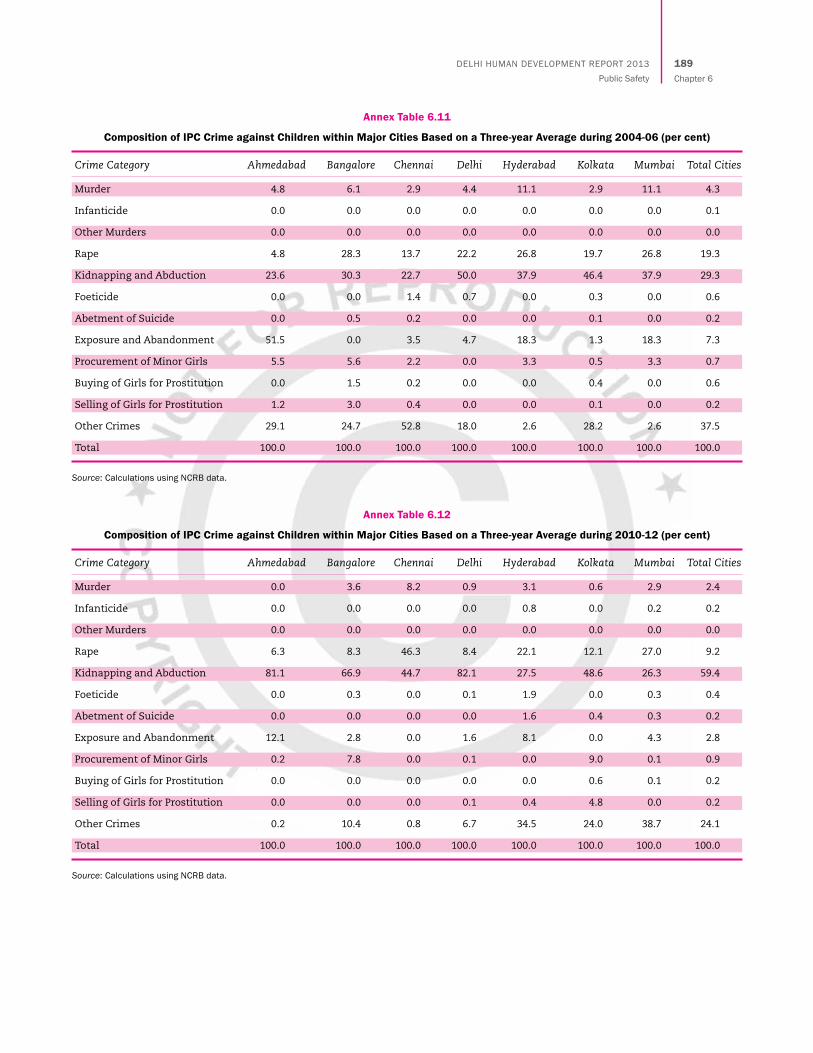
Delhi human Development RepoRt 2013public Safety
Delhi human Development RepoRt 2013public Safety
189Chapter 6
Annex Table 6.11
Composition of IPC Crime against Children within Major Cities Based on a Three-year Average during 2004-06 (per cent)
Crime Category Ahmedabad Bangalore Chennai Delhi Hyderabad Kolkata Mumbai Total Cities
Murder 4.8 6.1 2.9 4.4 11.1 2.9 11.1 4.3
Infanticide 0.0 0.0 0.0 0.0 0.0 0.0 0.0 0.1
Other Murders 0.0 0.0 0.0 0.0 0.0 0.0 0.0 0.0
Rape 4.8 28.3 13.7 22.2 26.8 19.7 26.8 19.3
Kidnapping and Abduction 23.6 30.3 22.7 50.0 37.9 46.4 37.9 29.3
Foeticide 0.0 0.0 1.4 0.7 0.0 0.3 0.0 0.6
Abetment of Suicide 0.0 0.5 0.2 0.0 0.0 0.1 0.0 0.2
Exposure and Abandonment 51.5 0.0 3.5 4.7 18.3 1.3 18.3 7.3
Procurement of Minor Girls 5.5 5.6 2.2 0.0 3.3 0.5 3.3 0.7
Buying of Girls for Prostitution 0.0 1.5 0.2 0.0 0.0 0.4 0.0 0.6
Selling of Girls for Prostitution 1.2 3.0 0.4 0.0 0.0 0.1 0.0 0.2
Other Crimes 29.1 24.7 52.8 18.0 2.6 28.2 2.6 37.5
Total 100.0 100.0 100.0 100.0 100.0 100.0 100.0 100.0
Source: Calculations using NCRB data.
Annex Table 6.12
Composition of IPC Crime against Children within Major Cities Based on a Three-year Average during 2010-12 (per cent)
Crime Category Ahmedabad Bangalore Chennai Delhi Hyderabad Kolkata Mumbai Total Cities
Murder 0.0 3.6 8.2 0.9 3.1 0.6 2.9 2.4
Infanticide 0.0 0.0 0.0 0.0 0.8 0.0 0.2 0.2
Other Murders 0.0 0.0 0.0 0.0 0.0 0.0 0.0 0.0
Rape 6.3 8.3 46.3 8.4 22.1 12.1 27.0 9.2
Kidnapping and Abduction 81.1 66.9 44.7 82.1 27.5 48.6 26.3 59.4
Foeticide 0.0 0.3 0.0 0.1 1.9 0.0 0.3 0.4
Abetment of Suicide 0.0 0.0 0.0 0.0 1.6 0.4 0.3 0.2
Exposure and Abandonment 12.1 2.8 0.0 1.6 8.1 0.0 4.3 2.8
Procurement of Minor Girls 0.2 7.8 0.0 0.1 0.0 9.0 0.1 0.9
Buying of Girls for Prostitution 0.0 0.0 0.0 0.0 0.0 0.6 0.1 0.2
Selling of Girls for Prostitution 0.0 0.0 0.0 0.1 0.4 4.8 0.0 0.2
Other Crimes 0.2 10.4 0.8 6.7 34.5 24.0 38.7 24.1
Total 100.0 100.0 100.0 100.0 100.0 100.0 100.0 100.0
Source: Calculations using NCRB data.
Related Documents


