S7B P102 PIANC 2002, 30 th INTERNATIONAL NAVIGATION CONGRESS S7B P102 SYDNEY-SEPTEMBER 2002 Page 1 of 14 SAFETY AND CAPACITY WET INFRASTRUCTURE PUERTO AMÉRICA, VENEZUELA Ir. R. GROENVELD Delft University of Technology Ir. I. ONASSIS Alkyon Hydraulic Consultancy & Research bv Ing. H.J. VAN WIJHE Alkyon Hydraulic Consultancy & Research bv, The Netherlands Abstract Lake Maracaibo is the largest brackish lake of South America. Presently Lake Maracaibo suffers from an increased salinity, eutrophication and pollution from oil exploitation. The dredged navigation channel used to access the various harbours on the lake causes increased salinity from the Gulf of Venezuela. To reduce salt intrusion the closure of the dredged channel is considered. As a result however, these harbours will become inaccessible for deep draughted vessels. For this reason a new port has been designed, called Puerto América, at the entrance from the Gulf of Venezuela on the peninsula San Bernardo and the Island of Zapara. The purpose of Puerto América is to tranship oil, petrochemicals, coal, containers, grain and general cargo. Especially with respect to nautical safety, influencing the capacity of the wet infra structure of this port, a manoeuvring simulation model and a traffic flow simulation model were developed. Based on safety criteria the output of the manoeuvring simulation model results in traffic rules and manoeuvring strategies, which in turn are used as input for the traffic flow simulation model to determine the capacity of the wet infrastructure. After a brief summary of the environmental conditions, commodity throughput and expected vessel types, the paper gives a description of the manoeuvring and the traffic flow simulation models. The combination of the two models proved to be highly valuable tool to optimise the harbour systems. Overall dimensions of dredging works, breakwaters and the number of berths were optimised using these models. ___________________________________________________________________________ 1.0 Introduction In order to export the oil produced in Lake Maracaibo, a channel was dredged through the outer bar near the island of Zapara in the early fifties to provide access for tankers to the various port facilities along the borders of Lake Maracaibo, Venezuela. Due to ingress of seawater via this man-made channel the water in the lake gradually changed from fresh to brackish water. Sustained by the dominant trade winds the water inside the lake developed a vertical stratification, which collects in its deeper layers pollutants from various sources.

Welcome message from author
This document is posted to help you gain knowledge. Please leave a comment to let me know what you think about it! Share it to your friends and learn new things together.
Transcript

S7B P102
PIANC 2002, 30th INTERNATIONAL NAVIGATION CONGRESS S7B P102SYDNEY-SEPTEMBER 2002 Page 1 of 14
SAFETY AND CAPACITY WET INFRASTRUCTURE PUERTO AMÉRICA,VENEZUELA
Ir. R. GROENVELDDelft University of Technology
Ir. I. ONASSISAlkyon Hydraulic Consultancy & Research bv
Ing. H.J. VAN WIJHEAlkyon Hydraulic Consultancy & Research bv, The Netherlands
Abstract
Lake Maracaibo is the largest brackish lake of South America. Presently Lake Maracaibosuffers from an increased salinity, eutrophication and pollution from oil exploitation.The dredged navigation channel used to access the various harbours on the lake causesincreased salinity from the Gulf of Venezuela. To reduce salt intrusion the closure of thedredged channel is considered. As a result however, these harbours will become inaccessiblefor deep draughted vessels.For this reason a new port has been designed, called Puerto América, at the entrance from theGulf of Venezuela on the peninsula San Bernardo and the Island of Zapara.The purpose of Puerto América is to tranship oil, petrochemicals, coal, containers, grain andgeneral cargo.Especially with respect to nautical safety, influencing the capacity of the wet infra structure ofthis port, a manoeuvring simulation model and a traffic flow simulation model weredeveloped. Based on safety criteria the output of the manoeuvring simulation model results intraffic rules and manoeuvring strategies, which in turn are used as input for the traffic flowsimulation model to determine the capacity of the wet infrastructure.
After a brief summary of the environmental conditions, commodity throughput and expectedvessel types, the paper gives a description of the manoeuvring and the traffic flow simulationmodels. The combination of the two models proved to be highly valuable tool to optimise theharbour systems. Overall dimensions of dredging works, breakwaters and the number ofberths were optimised using these models.
___________________________________________________________________________
1.0 Introduction
In order to export the oil produced in Lake Maracaibo, a channel was dredged through theouter bar near the island of Zapara in the early fifties to provide access for tankers to thevarious port facilities along the borders of Lake Maracaibo, Venezuela.
Due to ingress of seawater via this man-made channel the water in the lake gradually changedfrom fresh to brackish water. Sustained by the dominant trade winds the water inside the lakedeveloped a vertical stratification, which collects in its deeper layers pollutants from varioussources.

PIANC 2002, 30th INTERNATIONAL NAVIGATION CONGRESS S7B P102SYDNEY-SEPTEMBER 2002 Page 2 of 14
In order to improve this situation, the realisation of anew deep sea port, called Puerto América is considered.The projected location is outside Lake Maracaibo at theentrance from the Gulf of Venezuela to Tablazo Bay,which is the name of the northern part of the lake.
From a nautical point of view the location of the entrance to Tablazo Bay is characterised bycomplex current patterns and is furthermore exposed to waves and wind.
Because the port is intended to handle a large variety and quantity of solid as well as liquidproducts in a relatively small area, there are important requirements for optimising thecapacity of the wet infrastructure while also maintaining the nautical safety.
To accomplish these requirements it was decided to apply, right from early stages of theproject, sophisticated mathematical manoeuvring and traffic simulation models as an integralpart of the design process.
2.0 Description Of Models
2.1 Manoeuvring Simulation Model
The new deep sea port of Puerto América is to be situated around the entrance from the Gulfof Venezuela to Lake Maracaibo. From a nautical point of view this location is characterisedby complex current patterns, and moderate wind and waves.Given the complexity of the environmental conditions and the potentially pollutant type ofcargoes to be handled, like crude oil and liquid petroleum products including refrigeratedliquefied gasses it was important to support the design decisions withrealistic nautical constraints.Therefore ship manoeuvring simulations were carried out to directly (from a safety point ofview) and indirectly (as a constraints generator for traffic flow simulations) support thedimensioning of the wet infrastructure.
Gulf of Venezuela
Tablazo Bay
projectlocation
Figure 1 Project Location
San Bernardo
Zapara

PIANC 2002, 30th INTERNATIONAL NAVIGATION CONGRESS S7B P102SYDNEY-SEPTEMBER 2002 Page 3 of 14
The simulation model used was Alkyon’s real-time manoeuvring simulator SHIP-NAVIGATOR.This model is capable of simulating ship manoeuvres in real-time as well as faster than real-time. Control is exercised either manually or through a track-following autopilot. With thesepossibilities the model allows for both a fast analysis of a large number of design alternativesas well as for a detailed analysis of berthing and de-berthing procedures. The simulator is adedicated design tool, i.e. it is programmed such that design modifications can be modelledand tested quickly and cost-efficiently. It does this by application of quick-interface tools tothe most sophisticated flow and wave simulation models like DELFT-3D and SWAN.
2.2 Simulator Application
SHIP-NAVIGATOR models a large variety of nautical and physical aspects. In the case of PuertoAmérica the following aspects were incorporated in the model:
Table 1 Simulator aspects modelled for Puerto América
Aspect Nautical demands Model implementationCurrent Effect of quickly varying current
patterns on manoeuvreSmall spatial grid spatial andtime variation
Bathymetryand tide
Accessibility and effect onmanoeuvrability of reduced UKC
Spatial and time (tide)variation
Wind Forces on vessel Gust effects includedWaves Forces on vessel Spatial variation of Hs, Tp
and direction. Directionalspreading applied.
Tugs Correct abilities for different typesof tugs w.r.t. towing, pushing andbehaviour in waves
Various tug models with ownresistance, utilisation of waveshielding in lee side of vessel
(De)berthingin current
Use of mooring lines as part of themanoeuvre
Ship winch model
Manoeuvringstrategy
Carry out realistic manoeuvreswith proper use of engine, rudderand tugs, also in close-quarters.
Real-time manoeuvring.

PIANC 2002, 30th INTERNATIONAL NAVIGATION CONGRESS S7B P102SYDNEY-SEPTEMBER 2002 Page 4 of 14
2.3 Modelled area
Figure 2 shows the four main wet infrastructuralsections of Puerto América which wereincorporated in the manoeuvring simulation model:(1) the main access channel, (2) the manoeuvringarea at the deep water port, (3) the access andbasins of the common user port, (4) the bargeharbour and (5) the navigation channels to thehinterland.
Especially the choice and location of the variousaccess and navigation channels were items ofinvestigation, because with the disuse of the deepchannel to the various terminals in LakeMaracaibo, also the bathymetry and current flowpatterns in the area are bound to change.
To evaluate the different alternatives extensiveflow model computations were carried out. Figure3 shows a snapshot from an animation of the Gulfof Venezuela – Lake Maracaibo model.The figure shows the computational grid with thewater level in Lake Maracaibo fairly constant, andwith the level of the gulf near Tablazo Bay being
considerably higher and fluctuating with the tide. This difference between the constant levelin the lake and the oscillating gulf creates a strong current in the entrance to Tablazo Bay,where Puerto América is situated.
2.4 Type of Vessels
Due to the nature of Puerto América, a large hub for a variety of goods, transport isaccomplished by large ocean going vessels on the sea-side and largely by inland vessels at thelake-side.
Figure 2. Main harbour sections
1
3
4 2
5
Figure 3. Tide simulation of Gulf of Venezuela and Lake Maracaibo
Lake Maracaibo
Gulf of Venezuela
CaribbeanSea

PIANC 2002, 30th INTERNATIONAL NAVIGATION CONGRESS S7B P102SYDNEY-SEPTEMBER 2002 Page 5 of 14
For instance refrigerated liquids, hot and viscous crude oils, asphalt, fuel oils andpetrochemicals, but also various sections of the containerised cargo are intended to betransported by barge.
This meant that arrival and departure of both large vessels like a 150,000 dwt crude carriers aswell as small vessels like 2,500 t barges needed to be simulated on the manoeuvringsimulator.
2.5 Type of Conditions
For spring tideconditions, between thebreakwaters the depthaveraged current mayreach values up to 2.5knots. These strongcurrents show largevariations in magnitudeand direction. As anexample Figure 4 showsthe varying patternsduring a 1.5 hour periodbefore HW.
The wind conditions atthe project site aredominated by tradewinds, which generallyblow from directionsbetween north-east and south-east. Tropical storms may occasionally pass over the Bay ofVenezuela to the north of the site. A wind speed of 11 m/s is exceeded 8 % of the time.
The waves in the Gulf of Venezuela are directly related to the governing wind conditions. Themain wave directions are from the north east direction sector. In the access channel asignificant wave height of 1.75 m is exceeded 6% of the time.
2.6 Traffic Flow Simulation Model
As for many ports in the world a lot of parameters controlling the ship traffic to and fromPuerto América are stochastic of nature. This necessitates the development of probabilistictraffic flow simulation models for estimation of capacities of port systems. In this casePROSIM software was used as simulation language. PROSIM is an advanced softwaresystem for combined discrete and continuous simulation using the so-called ‘processdescription method’. The process description method describes all relevant components in therespective modules of the model and the interactions between the components.The model was used to support the optimisation of the required number of berths in relation tothe approach channel dimensions and transhipment capacities.The configuration of the traffic flow simulation model, called Harboursim, used to simulatePuerto América, is presented in Fig. 5. The main components of this model are listed in Table2.
HW-3h HW-2.5h HW-2h HW-1.5h
Figure 4. Current variation in deep water port

PIANC 2002, 30th INTERNATIONAL NAVIGATION CONGRESS S7B P102SYDNEY-SEPTEMBER 2002 Page 6 of 14
Table 2 Components of the model
Component SpecificationMain Single
componentThe component Main initialises the model and reads the inputdata from the files
Fleet generators(10)
Class ofcomponents
Generates the vessels of the specified fleets according tostatistical inter arrival time distributions and assigns values ofattributes
Ship Class ofcomponents
Follows the process of the ship according to the vessel type anddestination
Traffic controlof incomingvessels
Singlecomponent
Controls incoming traffic with respect to tidal conditions, trafficsituation and berth occupancy
Traffic controlof departingvessels
Singlecomponent
Controls departing traffic with respect to tidal conditions andtraffic situation.
Terminalmasters
Class ofcomponent
Controls the occupation of the berths of the terminal and setsand registers the service times of the vessels.Handles requests for entering and leaving the port system
Tidal conditions Singlecomponent
Generates and registers the tidal conditions in the model (currentvelocities and water levels)
Waveconditions
Singlecomponent
Generates wave conditions in front of the quays
Figure 5: Main components in the model

PIANC 2002, 30th INTERNATIONAL NAVIGATION CONGRESS S7B P102SYDNEY-SEPTEMBER 2002 Page 7 of 14
2.7 Generation of the Different Vessel Types
A total of 10 generators are used to generate or to create the ship traffic from and to the port,viz. 6 generators for the oil carriers, 2 generators for the coal carriers and 2 for thepetrochemical vessels. The generated number and type of vessels depend on the year and therealised port facilities as for instance the depth of the approach channel.
Table 3 Generators of Vessels
Generator type Attributes of the vesselscapacity Terminal
numberDraughtIncoming/leaving
Arrivalpattern
Transhm.rate [t/h]
Oil carrier type 1 5000 - 35000 2 6 7 - 8 N.E.D 490Oil carrier type 2 35000-84000 2 7 9 N.E.D 954Oil carrier type 3 65000-97500 2 9 12.85 N.E.D 1215Oil carrier type 4 97500-138750 2 9 14.4 N.E.D 1177Oil carrier type 5 125000-168750 2 9 15.6 N.E.D 1402Oil carrier type 6 145000-198750 2 9 16.6 N.E.D 1598Coal carrier type 1 5000-35000 3 6.3 8 – 9 N.E.D 402Coal carrier type 1 212500-185625 3 9 16.4 N.E.D 2348Petrochemical type 1 5000-30000 1 3.5 6.3 N.E.D 450Petrochemical type 2 30000-50000 1 8 9 N.E.D 720
Table 3 gives a specification of the generators used in phase 2 (2015) and the attributesassigned in the generation process.Based on experience a rather irregular inter arrival time distribution has been chosen to modelarrivals of vessels viz.: the negative exponential distribution (N.E.D.)
tetF .1)( λ−−= , where:F(t) = cumulative distribution function8 = number of arrivals per time unitt = inter arrival time
Process of the ship
The process of the ship is presented in Figure 6.After generation, the ship entersthe Anchorage, activates theTerminal Master,and the component TrafficControl for permission to enter theport system. Permission will begranted if tidal conditions (waterlevels and current velocities) andtraffic situation (occupation of thevarious channel sections) do notcause any conflicts with othervessels. In addition the availabilityof a berth is checked.If all conditions are fulfilled theship enters the port system.
Enter Anchorage
Activate Terminal andQuay Master
Activate IncomingTraffic Control
Passivate
PROCESS OF THECOMPONENT SHIP
Permission granted byTerminal/Quay master and
Traffic Control
Enter Channel
yes
Work sail time to berth
Leave ChannelWork loading and orunloading time Activate Terminal
Operator
Activate Traffic Controlleaving vessels
Permission granted byTraffic Control outEnter Channel
Work sailtime toAnchorage
Leave Channel
Terminate vessel
Leave Anchorage
Fig. 6: Process of the ship

PIANC 2002, 30th INTERNATIONAL NAVIGATION CONGRESS S7B P102SYDNEY-SEPTEMBER 2002 Page 8 of 14
In the next step the ship continues to the berth. The service time includes the loading and orunloading time and the additional time for berthing and deberthing. Based on the parcel sizeof the ship and the associated transhipment rate, the time required for loading or unloading isestimated.The additional service times for oil vessels larger than 100,000 DWT are for exampleestimated at:Manoeuvring 1.5 hourConnecting to manifold 0.5 hourOther 1 hourDisconnecting manifold 0.5 hourDeberthing/manoeuvring 1.5 hourAfter unloading and/or loading and possibly ballasting of the vessel permission is requested toleave the port system. Again the traffic situation and the tidal conditions are checked; if noconflicts exist the ship will depart, enters again the channel and follows her route to the end ofthe approach area. Finally all relevant data of this particular ship will be registered andsubsequently the ship leaves the port system and the simulation of this ship is terminated.
2.8 Vessel Traffic Control Incoming and Departing Vessels
Two components one for the incoming and one for the leaving traffic check the tidalconditions (water levels and current velocities), the status of the traffic and the availability ofa berth when a vessel requests permission to enter the system. Figure 7 shows the water depthin the channel when simulating a 54-ft channel.
Figure 7: Water levels for a 54-ft channel
PIANC 2002, 30th INTERNATIONAL NAVIGATION CONGRESS S7B P102SYDNEY-SEPTEMBER 2002 Page 9 of 14
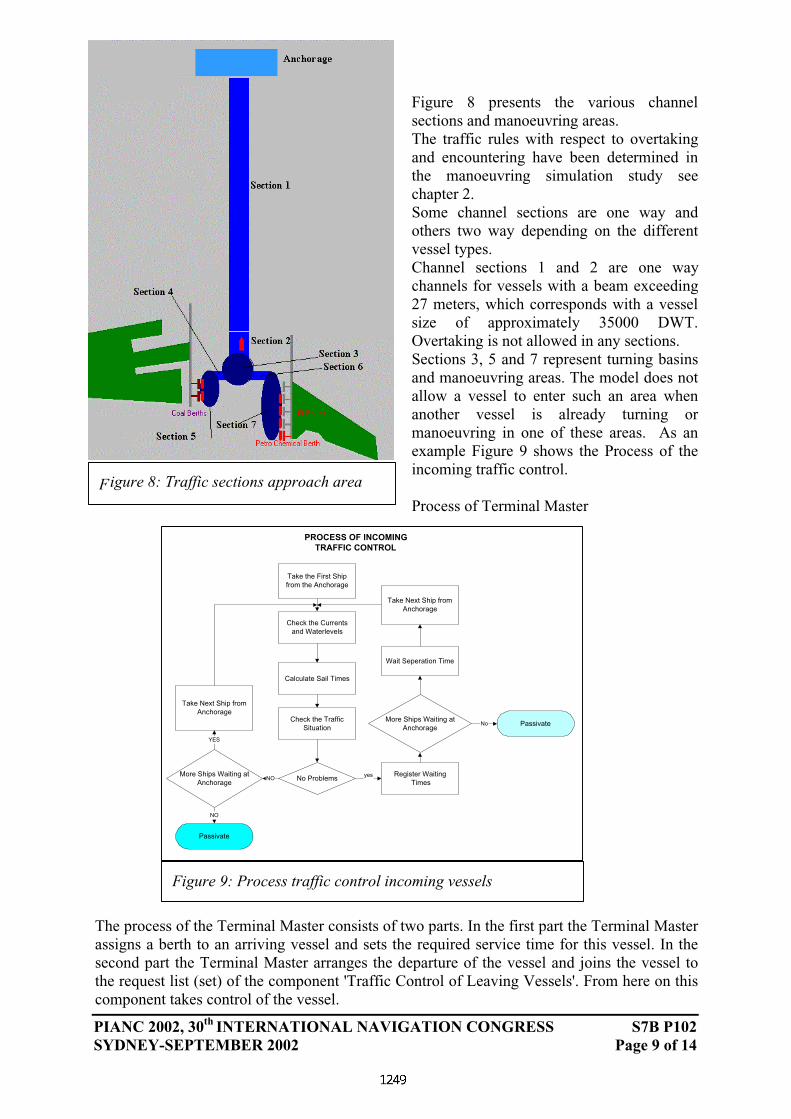
Figure 8: Traffic sections approach area
Figure 8 presents the various channelsections and manoeuvring areas.The traffic rules with respect to overtakingand encountering have been determined inthe manoeuvring simulation study seechapter 2.Some channel sections are one way andothers two way depending on the differentvessel types.Channel sections 1 and 2 are one waychannels for vessels with a beam exceeding27 meters, which corresponds with a vesselsize of approximately 35000 DWT.Overtaking is not allowed in any sections.Sections 3, 5 and 7 represent turning basinsand manoeuvring areas. The model does notallow a vessel to enter such an area whenanother vessel is already turning ormanoeuvring in one of these areas. As anexample Figure 9 shows the Process of theincoming traffic control.
Process of Terminal Master
The process of the Terminal Master consists of two parts. In the first part the Terminal Masterassigns a berth to an arriving vessel and sets the required service time for this vessel. In thesecond part the Terminal Master arranges the departure of the vessel and joins the vessel tothe request list (set) of the component 'Traffic Control of Leaving Vessels'. From here on thiscomponent takes control of the vessel.
Figure 9: Process traffic control incoming vessels
Take the First Shipfrom the Anchorage
Check the Currentsand Waterlevels
Calculate Sail Times
Check the TrafficSituation
No ProblemsRegister Waiting
Times
More Ships Waiting atAnchorage
Passivate
Wait Seperation Time
Take Next Ship fromAnchorage
More Ships Waiting atAnchorage
Passivate
Take Next Ship fromAnchorage
PROCESS OF INCOMINGTRAFFIC CONTROL
No
yesNO
NO
YES
PIANC 2002, 30th INTERNATIONAL NAVIGATION CONGRESS S7B P102SYDNEY-SEPTEMBER 2002 Page 10 of 14
2.9 Output of the Model
Many data are registered during the simulation runs. The main output data concern the berthoccupancy rates of the various terminals and the waiting times of each individual vessel uponarrival at the approach area and prior to departure from the berth.The waiting time prior to departure is important because during this period the vesseloccupies the berth, which raises the berths occupancy rates.Waiting times are not only registered in hours but also in units of the average service time, ascritical waiting times are mostly expressed in units of the average service time.
3.0 Application Of Models
3.1 Results of Manoeuvring Simulation Model
3.1.1 Access Channel and Deep Water Port
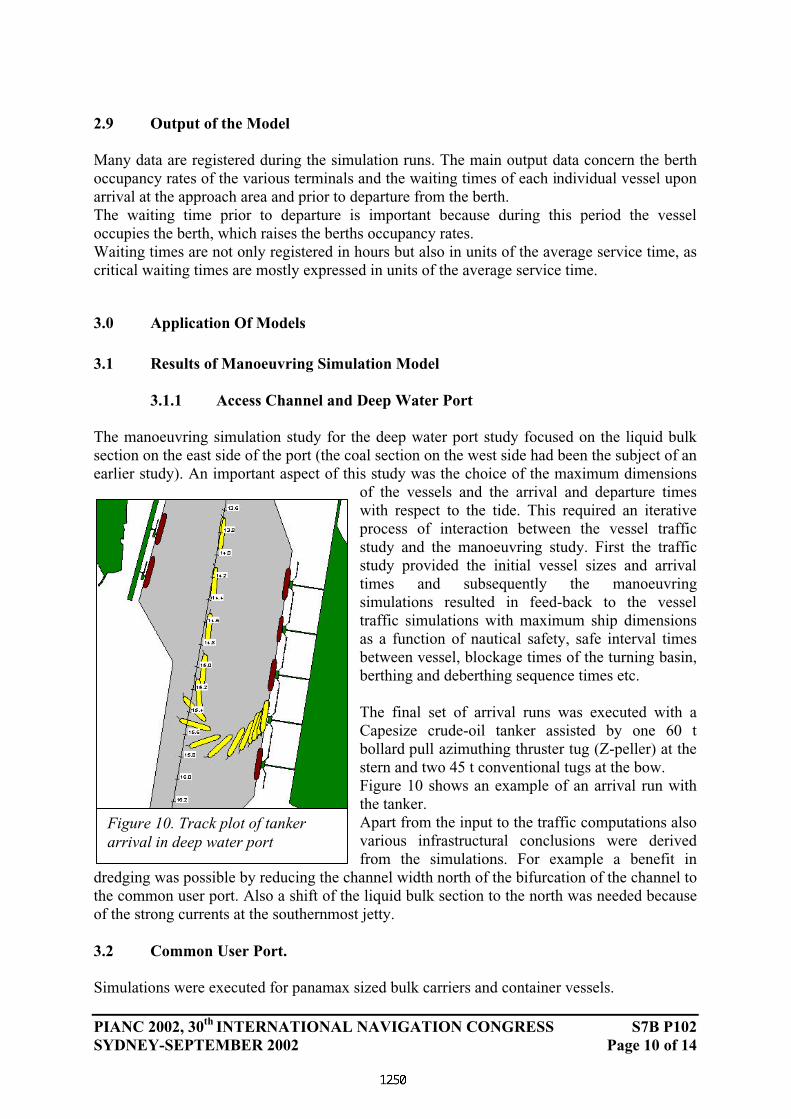
The manoeuvring simulation study for the deep water port study focused on the liquid bulksection on the east side of the port (the coal section on the west side had been the subject of anearlier study). An important aspect of this study was the choice of the maximum dimensions
of the vessels and the arrival and departure timeswith respect to the tide. This required an iterativeprocess of interaction between the vessel trafficstudy and the manoeuvring study. First the trafficstudy provided the initial vessel sizes and arrivaltimes and subsequently the manoeuvringsimulations resulted in feed-back to the vesseltraffic simulations with maximum ship dimensionsas a function of nautical safety, safe interval timesbetween vessel, blockage times of the turning basin,berthing and deberthing sequence times etc.
The final set of arrival runs was executed with aCapesize crude-oil tanker assisted by one 60 tbollard pull azimuthing thruster tug (Z-peller) at thestern and two 45 t conventional tugs at the bow.Figure 10 shows an example of an arrival run withthe tanker.Apart from the input to the traffic computations alsovarious infrastructural conclusions were derivedfrom the simulations. For example a benefit in
dredging was possible by reducing the channel width north of the bifurcation of the channel tothe common user port. Also a shift of the liquid bulk section to the north was needed becauseof the strong currents at the southernmost jetty.
3.2 Common User Port.
Simulations were executed for panamax sized bulk carriers and container vessels.
Figure 10. Track plot of tankerarrival in deep water port

PIANC 2002, 30th INTERNATIONAL NAVIGATION CONGRESS S7B P102SYDNEY-SEPTEMBER 2002 Page 11 of 14
Figure 12. Track plot oftowed container barge.
Again several cost-benefits to the design could beidentified, like a considerable shortening of thebreakwater “a” shown in Figure 11. Obviously alsothe tranquillity at the berths was investigatedbefore actually deciding for a re-dimensioning ofthe breakwater.
Inland harbour and navigation channels
The transport to the hinterland of refrigerated liquefied gases and very viscous products, suchas asphalt and Boscan crude needs to be carried by barge over Lake Tablazo and LakeMaracaibo. But also for other bulk cargoes and containers, inland vessel transport is often acost-beneficial method.
To investigate the possibilities for these transports simulations were carries out for both towedbarges (tug towing single barge) and pushed barges (pusher with two barges), carrying eitherbulk cargo or containers.
The general conclusion from the simulations is that a push-combination is much better tocontrol and would be a recommended way oftransporting the barges, especially when thevolume of traffic increases. The currents inTablazo bay, in combination with the strongwinds and still considerable wave action at thedeep water port meant that especially the towedbarges (see track plot of towed barge simulationin Figure 12) required wider navigation channelsthan originally anticipated.
Figure 11. Container vesselarrival in common user port
“a”

PIANC 2002, 30th INTERNATIONAL NAVIGATION CONGRESS S7B P102SYDNEY-SEPTEMBER 2002 Page 12 of 14
42 ft channel series
0
100
200
300
400
500
600
coal 1 coal 2 petro 1 pertro 2
wai
tin
g t
imes
[m
inu
tes]
2007, 2 coal 1 petro berhs;coal bor 26% , petro bor 28%
2007, 2 coal, 2 petro berths;coal bor 26% , petro bor 14
2007, 2 coal, 1 petro berths;coal bor 31% , petro bor 28%
2007, 1 coal, 1 petro berths;coal bor 52% , petro bor 28%
2015, 2 coal, 1 petro berths;coal bor 38% , petro bor 28%
2015, 2 coal, 2 petro berths;coal bor 38% , petro bor 14%
Figure 15. Simulation runs 51-ft channel, coal carriersand petrochemical vessels
It was concluded that a number of areasneed to be kept at a sufficient depth orneed widening (depending on thevolume of traffic) for barges and tugs(dashed areas shown in Figure 13). Alsoseveral operational recommendationswere derived regarding the operationsnear the barge harbour.
3.3Results Traffic flow simulationmodel
The main objective of the simulationruns is to estimate the required numberof berths for each commodity duringeach phase of the project. Moreover thesimulation runs were performed toacquire knowledge of the influence ofthe depth of the approach channel onthe required number of berths and the
effect of the loading rates. Twophases were considered viz. thetraffic conditions for the year2007 and 2015 in combinationwith four channel depths namely:42 ft, 47 ft, 51 ft and 54 ft. Intotal 16 runs were carried out. Inthis paper only the model resultsfor channel depths of 42 ft and 51ft are presented in detail.
Figure 14 shows the results of the 42-ft channel runs for the oil carriers. Decreasing thenumber of berths from 4 to 3 a steep in crease of the waiting times is observed. Also theinfluence of the berth occupancy ranging from 45% to 50% is quite clear.
Starting from a maximum waiting of 30 % of the service time 3 berths would be acceptable inthe first phase (2007) but to cope with unforeseen irregularities 4 berth are advised.
Figure 15 shows thesimulation results for thecoal carriers andpetrochemical vessels. Tosatisfy the designrequirements it is quite clearthat 2 coal berth arerequired. Only one berthwould give an unacceptablerise of the waiting times. Forthe petrochemical vessels 1berth will be sufficient.
42 feet series
0
100
200
300
400
500
600
700
OIL1 OIL2 O IL3
wai
tin
g t
ime
[m
inu
tes}
2007, 4 berths, occ. 45%
2007, 3 berths, occ. 63%
2015, 4 berths, occ. 50%
Figure 14. Simulation runs 42 ft channel, oil carriers
Figure 13. Inland navigation channel widening
oil bargeharbour
1st phasecoal barges
general bargeharbour

PIANC 2002, 30th INTERNATIONAL NAVIGATION CONGRESS S7B P102SYDNEY-SEPTEMBER 2002 Page 13 of 14
series 51 ft.
0
100
200
300
400
500
600
coal 1 coal 2 petro 1 pertro 2
wai
tin
g t
imes
[m
inu
tes
2007, 2 coal 1 petro berhs;coal bor 24%, petro bor 28%
2015, 2 coal, 1 petro berths;coal bor 31%, petro bor 28%
2015, 2 coal, 1 petro berths;coal bor 34%, petro bor 28%
2015, 2 coal, 1 petro berths;coal bor 35%, petro bor 28%
2015, 2 coal, 1 petro berths;coal bor 41%, petro bor 28%
Figure 17. Simulation runs 51-ft channel, coal carriersand petrochemical vessels
51 f t channe l se rie s
050
100150200250300350400450
O IL1 O IL2 O IL3 O IL 4 O IL 5
wai
tin
g t
imes
[m
inu
tes]
2007, 4 ber ths , occ . 37%
2015, 4 ber ths , occ . 40%
2015, 3 ber ths , occ . 55%
2015, 3 ber ths , occ . 54%
2015, 3 ber ths , occ . 52%
Figure 16. Simulation runs 51-ft channel, oil carriers
As the 51-ft channel generatesmore traffic Figure 16 showsthat 4 oil berths are necessary.Reduction of the berthoccupancy rate from 55% to52 %, by increasing thetranshipment rate, causessome reduction of the waitingtimes but not enough to satisfy
the design requirements whendealing with only 3 berths.
Figure 17 gives results for thecoal carriers and petrochemicalvessels. The influence of thecoal berth occupancy (rangingfrom 24% to 41 %) on thewaiting times (going up fromabout 110 to 380 minutes) issignificant. Should theoccupancy increase to more than35% an additional coal berth isrequired.With respect to the waiting timesof the petrochemical berth is
remarked that with an occupancy of 28% the influence of the other ship traffic is notsignificant. The waiting time, expressed in units of the average service time, stays at a level ofabout 45% of the service time and is considered to be acceptable.
An overview of the required number of berths is given in table 3.
Table 2: Required number of berths versus channel depth and traffic year
Traffic year Maximum draft channel42 ft 47 ft 51 ft 54 ft
oil coal petr oil coal petr oil coal petr oil coal petr
2007 3 2 1 4 2 1 4 2 1 4 2 1
2015 4 2 1 4 2 1 4 2 1 4 2 1
4.0 Conclusions and Recommendations
1. To restore the original environmental conditions of Lake Maracaibo the development of anew port called Puerto América is considered, compensating the port facilities presentlylocated along the borders of this lake.
2. When dealing with complicated port systems, such as Puerto América, the relationshipbetween safety and port capacity needs to be estimated by application of manoeuvring andtraffic flow simulation models in an interactive way.

PIANC 2002, 30th INTERNATIONAL NAVIGATION CONGRESS S7B P102SYDNEY-SEPTEMBER 2002 Page 14 of 14
• optimum vessel dimensions, related to wet infra structure alternatives,• the most suitable locations for the terminals, especially for the oil terminal,• lengths of breakwaters, especially the west breakwater along the main channel,• the required channel dimensions of the inland vessels.
4. To estimate the capacity of this port system, the manoeuvring simulation study providedship traffic rules and the dwell times of vessels in the various channel sections whichserved as input for the traffic flow simulation model.
5. The traffic flow simulation study showed that predominantly waiting times were causedby berth occupancies and only for a minor degree by water level restrictions andoccupation of turning and manoeuvring basins.
5.0 References
1. R. Groenveld, H. van Hees and T. Visscher ( 2001). Simulation study of a high capacitycontainer terminal using the warehouse concept. Proc. Inaugural International Conferenceon Port and Maritime R&D and Technology, Singapore.
2. R. Groenveld and C.V.A. Hoek (2000). A Simulation Tool to asses nautical Safety in portapproaches. International Workshop on Harbour, Maritime & Multimodal LogisticsModelling and Simulation, Portofino, Italy
3. K. van den Berg, S. Veldman and F.C. Vis (2001). Development of a Masterplan forPuerto América. Proc. Inaugural International Conference on Port and Maritime R&D andTechnology, Singapore.
Keywords: Port development, Manoeuvring Simulation, Ship traffic Simulation.
3. Starting from a basic layout for Puerto América the manoeuvring simulation modelfacilitated checking nautical safety levels dealing with tidal, wind and wave conditions. Inthis way estimations were obtained of:
Related Documents